As Filed with the Securities and Exchange Commission on March 17, 2005
Securities Act File No. 333-122253
SECURITIES AND EXCHANGE COMMISSION
Washington, D.C. 20549
FORM N-14
REGISTRATION STATEMENT
UNDER
THE SECURITIES ACT OF 1933 x
Pre-Effective Amendment No. 1 x
Post-Effective Amendment No. ___ ¨
SCUDDER VARIABLE SERIES II
(Exact Name of Registrant as Specified in Charter)
222 South Riverside Plaza
Chicago, IL 60606
(Address of Principal Executive Offices) (Zip Code)
312-537-7000
(Registrant’s Area Code and Telephone Number)
John Millette, Secretary
Scudder Variable Series II
222 South Riverside Plaza
Chicago, Illinois 60606
(Name and Address of Agent for Service)
With copies to:
| | |
Cathy G. O’Kelly, Esq. David A. Sturms, Esq. Vedder, Price, Kaufman & Kammholz, P.C. 222 North LaSalle Street Chicago, Illinois 60601 | | John W. Gerstmayr, Esq. Ropes & Gray LLP One International Place Boston, Massachusetts 02110-2624 |
TITLE OF SECURITIES BEING REGISTERED:
Shares of the Scudder Total Return Portfolio Series of the Registrant
Approximate date of proposed public offering: As soon as practicable after the effective date of this Registration Statement.
No filing fee is required because an indefinite number of shares have previously been registered pursuant to Rule 24f-2 under
the Investment Company Act of 1940.
The Registrant hereby amends this Registration Statement on such date or dates as may be necessary to delay its effective date until the Registrant shall file a further amendment that specifically states that this Registration Statement shall thereafter become effective in accordance with Section 8(a) of the Securities Act of 1933 or until the Registration Statement shall become effective on such date as the Commission, acting pursuant to said Section 8(a), may determine.

Questions & Answers
Balanced Portfolio
Scudder Variable Series I
Q&A
Q What is happening?
A Deutsche Asset Management (“DeAM”), the investment manager for the Scudder funds, has initiated a program to reorganize and merge selected funds within the Scudder fund family.
Q What issue am I being asked to vote on?
A You are being asked to vote on a proposal to merge Balanced Portfolio into Scudder Total Return Portfolio. Both funds are managed by the same portfolio management team and seek to achieve similar investment objectives through similar types of investments.
After carefully reviewing the proposal, your fund’s Board has determined that this action is in the best interests of the fund. The Board unanimously recommends that you vote for this proposal.
Q I am the owner of a variable life insurance policy or a variable annuity contract offered by my insurance company. I am not a shareholder of Balanced Portfolio. Why am I being asked to vote on a proposal for Balanced Portfolio shareholders?
A You have previously directed your insurance company to invest certain proceeds relating to your variable life insurance policy and/or variable annuity contract (each a “Contract”) in Balanced Portfolio. Although you receive the gains, losses and income

Q&A continued
from this investment, your insurance company holds on your behalf any shares corresponding to your investment in Balanced Portfolio. Thus, you are not the “shareholder” of Balanced Portfolio; rather, your insurance company is the shareholder. However, you have the right to instruct your insurance company on how to vote the Balanced Portfolio shares corresponding to your investment through your Contract. It is your insurance company, as the shareholder, that will actually vote the shares corresponding to your investment (likely by executing a proxy card) once it receives instructions from its Contract owners.
The attached Prospectus/Proxy Statement is, therefore, used to solicit voting instructions from you and other owners of Contracts. All persons entitled to direct the voting of shares of Balanced Portfolio, whether or not they are shareholders, are described as voting for purposes of the Prospectus/Proxy Statement. Please see page 1 of the attached Prospectus/Proxy Statement for more details.
Q Why has this proposal been made for my fund?
A The combined fund is expected to pay a lower management fee than Balanced Portfolio. In addition, merging the two funds means that the costs of operating the combined fund are anticipated to be spread across a larger asset base. Finally, DeAM has agreed to cap the expenses of the combined fund at levels lower than the expense ratio currently paid by Balanced Portfolio for approximately three years following the merger. Consequently, the combined fund is expected to have lower total operating expense ratios than Balanced Portfolio.
Q Will I have to pay taxes as a result of the merger?
A The merger is expected to be a tax-free transaction for federal income tax purposes and will not take place unless special tax counsel provides an opinion to that effect. However, if you choose to redeem or exchange your investment by surrendering your Contract or initiating a partial withdrawal, you may be subject to taxes and tax penalties.
Q Upon merger, how will the value of my investment change?
A The aggregate value of your investment will not change as a result of the merger. It is likely, however, that the number of shares owned by your insurance company on your
Q&A continued
behalf will change as a result of the merger because your insurance company’s shares will be exchanged at the net asset value per share of Scudder Total Return Portfolio, which will probably be different from the net asset value per share of Balanced Portfolio.
Q Will any fund pay for the solicitation of voting instructions and legal costs associated with this solicitation?
A No. DeAM will bear these costs.
Q When would the merger take place?
A If approved, the merger would occur on or about May 2, 2005 or as soon as reasonably practicable after shareholder approval is obtained. Shortly after completion of the merger, shareholders whose accounts are affected by the merger (i.e., your insurance company) will receive a confirmation statement reflecting their new account number and the number of shares of Scudder Total Return Portfolio they are receiving. Subsequently, you will be notified of changes to your account information by your insurance company.
Q How can I vote?
A You can vote in any one of three ways:
| n | | Through the Internet, by going to the website listed on your voting instruction form; |
| n | | By telephone, with a toll-free call to the number listed on your voting instruction form; or |
| n | | By mail, by sending the enclosed voting instruction form, signed and dated, in the enclosed envelope. |
We encourage you to vote over the Internet or by telephone, following the instructions that appear on your voting instruction form. Whichever method you choose, please take the time to read the full text of the Prospectus/Proxy Statement before you vote.
Q&A continued
Q If I send in my voting instructions now as requested, can I change my vote later?
A Shareholders may revoke proxies, including proxies given by telephone or over the Internet, at any time before they are voted at the special meeting either (i) by sending a written revocation to the Secretary of Balanced Portfolio as explained in the Prospectus/Proxy Statement; (ii) by properly executing a later-dated proxy that is received by the fund at or prior to the special meeting; or (iii) by attending the special meeting and voting in person. Only a shareholder may execute or revoke a proxy. You should consult your insurance company regarding your ability to revoke voting instructions after you have provided them to your insurance company.
Q Whom should I call for additional information about this Prospectus/Proxy Statement?
A Please call Computershare Fund Services, your fund’s proxy solicitor, at 1-877-288-6285.
BALANCED PORTFOLIO
A Message from the Fund’s Chief Executive Officer
[mailing date], 2005
Dear Investor:
I am writing to you to ask you to instruct your insurance company as to how to vote on an important matter that affects your investment in Balanced Portfolio. You may vote by filling out and signing the enclosed voting instruction form, or by voting by telephone or through the Internet.
We are asking for your vote on the following matter:
| | |
| Proposal: | | Approval of a proposed merger of Balanced Portfolio into Scudder Total Return Portfolio (“Total Return Portfolio”). In this merger, your investment in Balanced Portfolio would, in effect, be exchanged, on a tax-free basis for federal income tax purposes, for an investment in Total Return Portfolio with an equal aggregate net asset value. |
The proposed merger is part of a program initiated by Deutsche Asset Management (“DeAM”), the investment manager for the Scudder funds. This program is intended to provide a more streamlined selection of investment options that is consistent with the changing needs of investors. If approved by fund boards and fund shareholders, this program will enable DeAM to:
| | • | | Eliminate redundancies within the Scudder fund family by reorganizing and combining certain funds; and |
| | • | | Focus its investment resources on a core set of mutual funds that best meets investor needs. |
The Trustees of Balanced Portfolio recommend approval of the merger because they believe it offers fund shareholders the following benefits, among others:
| | • | | A similar investment opportunity in a larger fund with a lower management fee; and |
The investment objective and policies of Balanced Portfolio are similar to those of Total Return Portfolio. If the merger is approved, the Board expects that the proposed changes will take effect during the second calendar quarter of 2005.
Included in this booklet is information about the upcoming shareholders’ meeting:
| | • | | A Notice of a Special Meeting of Shareholders, which summarizes the issue for which you are being asked to provide voting instructions; and |
| | • | | A Prospectus/Proxy Statement, which provides detailed information on Total Return Portfolio, the specific proposal being considered at the shareholders’ meeting, and why the proposal is being made. |
We need your voting instructions and urge you to review the enclosed materials thoroughly. Once you’ve determined how you would like your interests to be represented, please promptly complete, sign, date and return the enclosed voting instruction form or vote by telephone or through the Internet. A postage-paid envelope is enclosed for mailing, and telephone and Internet voting instructions are listed at the top of your voting instruction form. You may receive more than one voting instruction form. If so, please vote each one.
I’m sure that you, like most people, lead a busy life and are tempted to put this Prospectus/Proxy Statement aside for another day. Please don’t. Your prompt return of the enclosed voting instruction form (or voting by telephone or through the Internet) may save the necessity and expense of further solicitations.
Your vote is important to us. We appreciate the time and consideration I am sure you will give to this important matter. If you have questions about the proposal, please call Computershare Fund Services, Balanced Portfolio’s proxy solicitor, at 1-877-288-6285, or contact your insurance company. Thank you for your continued support of Scudder Investments.
Sincerely yours,

Julian F. Sluyters
Chief Executive Officer
Balanced Portfolio
BALANCED PORTFOLIO
NOTICE OF A SPECIAL MEETING OF SHAREHOLDERS
This is the formal agenda for Balanced Portfolio’s shareholder special meeting. It tells you what matter will be voted on and the time and place of the special meeting.
To the Shareholders of Balanced Portfolio:
A Special Meeting of Shareholders of Balanced Portfolio will be held April 15, 2005 at 9:00 a.m. Eastern time, at the offices of Deutsche Investment Management Americas Inc., 345 Park Avenue, 27th Floor, New York, New York 10154 (the “Meeting”), to consider the following:
| | |
| Proposal: | | Approving an Agreement and Plan of Reorganization and the transactions it contemplates, including the transfer of all of the assets of Balanced Portfolio to Scudder Total Return Portfolio (“Total Return Portfolio”), in exchange for shares of Total Return Portfolio and the assumption by Total Return Portfolio of all liabilities of Balanced Portfolio, and the distribution of such shares, on a tax-free basis for federal income tax purposes, to the shareholders of Balanced Portfolio in complete liquidation of Balanced Portfolio. |
The persons named as proxies will vote in their discretion on any other business that may properly come before the Meeting or any adjournments or postponements thereof.
Holders of record of shares of Balanced Portfolio at the close of business on February 9, 2005 are entitled to vote at the Meeting and at any adjournments or postponements thereof.
In the event that the necessary quorum to transact business or the vote required to approve the merger is not obtained at the Meeting, the persons named as proxies may propose one or more adjournments of the Meeting in accordance with applicable law to permit such further solicitation of proxies as may be deemed necessary or advisable. Any adjournment will require the affirmative vote of a majority of the votes cast on the question in person or by proxy at the session of the Meeting to be adjourned. The persons named as proxies will vote FOR any such adjournment those proxies which they are entitled to vote in favor of the proposal and will vote AGAINST any such adjournment those proxies to be voted against the proposal.
By order of the Trustees

Dawn-Marie Driscoll (Chair)
Henry P. Becton, Jr.
Keith R. Fox
Louis E. Levy
Jean Gleason Stromberg
Jean C. Tempel
Carl W. Vogt
[mailing date], 2005
WE URGE YOU TO MARK, SIGN, DATE AND MAIL THE ENCLOSED PROXY CARD OR VOTING INSTRUCTION FORM IN THE POSTAGE-PAID ENVELOPE PROVIDED OR RECORD YOUR VOTING INSTRUCTIONS BY TELEPHONE OR THROUGH THE INTERNET SO THAT YOU WILL BE REPRESENTED AT THE MEETING.
INSTRUCTIONS FOR SIGNING PROXY CARDS
AND VOTING INSTRUCTION FORMS
The following general rules for signing proxy cards and voting instruction forms may be of assistance to you and avoid the time and expense involved in validating your vote if you fail to sign your proxy card or voting instruction form properly.
1. Individual Accounts: Sign your name exactly as it appears in the registration on the proxy card or voting instruction form.
2. Joint Accounts: Either party may sign, but the name of the party signing should conform exactly to the name shown in the registration on the proxy card or voting instruction form.
3. All Other Accounts: The capacity of the individual signing the proxy card or voting instruction form should be indicated unless it is reflected in the form of registration. For example:
| | |
Registration
| | Valid Signature
|
Corporate Accounts | | |
(1) ABC Corp. | | ABC Corp.,
John Doe, Treasurer |
(2) ABC Corp. | | John Doe, Treasurer |
(3) ABC Corp. c/o John Doe, Treasurer | | John Doe |
(4) ABC Corp. Profit Sharing Plan | | John Doe, Trustee |
| |
Partnership Accounts | | |
(1) The XYZ Partnership | | Jane B. Smith, Partner |
(2) Smith and Jones, Limited Partnership | | Jane B. Smith, General Partner |
| |
Trust Accounts | | |
(1) ABC Trust Account | | Jane B. Doe, Trustee |
(2) Jane B. Doe, Trustee u/t/d 12/28/78 | | Jane B. Doe |
| |
Custodial or Estate Accounts | | |
(1) John B. Smith, Cust. f/b/o John B. Smith Jr.
UGMA/UTMA | | John B. Smith |
(2) Estate of John B. Smith | | John B. Smith, Jr., Executor |
IMPORTANT INFORMATION
FOR OWNERS OF VARIABLE ANNUITY
OR LIFE INSURANCE CONTRACTS INVESTED IN
BALANCED PORTFOLIO
This document contains a Prospectus/Proxy Statement and a voting instruction form. You can use your voting instruction form to tell your insurance company how to vote on your behalf on an important issue relating to your investment in Balanced Portfolio. If you complete and sign the voting instruction form (or tell your insurance company by telephone or through the Internet how you want it to vote), your insurance company will vote the shares corresponding to your insurance contract exactly as you indicate. If you simply sign the voting instruction form, your insurance company will vote the shares corresponding to your insurance contract in accordance with the Trustees’ recommendation on page 25. If you do not return your voting instruction form or record your voting instructions by telephone or through the Internet, your insurance company will vote your shares in the same proportion as shares for which instructions have been received.
We urge you to review the Prospectus/Proxy Statement carefully and either fill out your voting instruction form and return it by mail or record your voting instructions by telephone or through the Internet. You may receive more than one voting instruction form since several shareholder special meetings are being held as part of the broader restructuring program of the Scudder fund family. If so, please return each one. Your prompt return of the enclosed voting instruction form (or your providing voting instructions by telephone or through the Internet) may save the necessity and expense of further solicitations.
We want to know how you would like your interests to be represented and welcome your comments. Please take a few minutes to read these materials and return your voting instruction form.
If you have any questions, please call Computershare Fund Services, Balanced Portfolio’s proxy solicitor, at the special toll-free number we have set up for you (1-877-288-6285) or contact your insurance company.
PROSPECTUS/PROXY STATEMENT
[effective date], 2005
| | |
Acquisition of the assets of:
| | By and in exchange for shares of:
|
| |
Balanced Portfolio a series of Scudder Variable Series I | | Scudder Total Return Portfolio a series of Scudder Variable Series II |
| |
Two International Place Boston, MA 02110 (617) 295-2572 | | 222 South Riverside Plaza Chicago, IL 60606 (617) 295-2572 |
This Prospectus/Proxy Statement is being furnished in connection with the proposed merger of Balanced Portfolio into Scudder Total Return Portfolio (“Total Return Portfolio”). Total Return Portfolio and Balanced Portfolio are referred to herein collectively as the “Funds,” and each is referred to herein individually as a “Fund.” As a result of the proposed merger, each shareholder of Balanced Portfolio will receive a number of full and fractional shares of the corresponding class of Total Return Portfolio equal in value as of the Valuation Time (as defined below on page [ ]) to the total value of such shareholder’s Balanced Portfolio shares.
Shares of Balanced Portfolio are available exclusively as a pooled funding vehicle for variable life insurance policies and variable annuity contracts (each a “Contract”) offered by the separate accounts, or sub-accounts thereof, of certain life insurance companies (“Participating Insurance Companies”). The Participating Insurance Companies own shares of Balanced Portfolio as depositors for the owners of their respective Contracts (each a “Contract Owner”). Thus, individual Contract Owners are not the “shareholders” of Balanced Portfolio. Rather, the Participating Insurance Companies and their separate accounts are the shareholders. To the extent required to be consistent with the interpretations of voting requirements by the staff of the Securities and Exchange Commission (“SEC”), each Participating Insurance Company will offer to Contract Owners the opportunity to instruct it as to how it should vote shares held by it and the separate accounts on the proposed merger. This Prospectus/Proxy Statement is, therefore, furnished to Contract Owners entitled to give voting instructions with regard to Balanced Portfolio. All persons entitled to direct the voting of shares of Balanced Portfolio, whether or not they are shareholders, are described as voting for purposes of this Prospectus/Proxy Statement. This Prospectus/Proxy Statement, along with the Notice of Special Meeting and the proxy card or voting instruction form, is being mailed to shareholders and Contract Owners on or about [mailing date], 2005. It explains concisely what you should know before voting on the matter described in this Prospectus/Proxy Statement or investing in Total Return Portfolio, a diversified series of an open-end, registered management investment company. Please read it carefully and keep it for future reference.
The securities offered by this Prospectus/Proxy Statement have not been approved or disapproved by the SEC, nor has the SEC passed upon the accuracy or adequacy of this Prospectus/Proxy Statement. Any representation to the contrary is a criminal offense.
1
The following documents have been filed with the SEC and are incorporated into this Prospectus/Proxy Statement by reference:
| | (i) | | the prospectus of Total Return Portfolio, dated May 1, 2004, as supplemented from time to time, relating to Class A shares, a copy of which, if applicable, is included with this Prospectus/Proxy Statement; |
| | (ii) | | the prospectus of Balanced Portfolio, dated May 1, 2004, as supplemented from time to time, relating to Class A shares; |
| | (iii) | | the statement of additional information of Balanced Portfolio, dated May 1, 2004, as supplemented from time to time, relating to Class A shares (no other part of the combined statement of additional information is incorporated by reference); |
| | (iv) | | the statement of additional information relating to the proposed merger, dated [effective date], 2005 (the “Merger SAI”); and |
| | (v) | | the financial statements and related report of the independent registered public accounting firm included in Balanced Portfolio’s Annual Report to Shareholders for the fiscal year ended December 31, 2004. |
The updated financial highlights for Total Return Portfolio contained in the Annual Report to Shareholders for the fiscal year ended December 31, 2004 are attached to this Prospectus/Proxy Statement as Exhibit B.
You may receive free copies of the Funds’ annual reports, semiannual reports, prospectuses, statements of additional information or the Merger SAI, request other information about a Fund or make inquiries by contacting your insurance company or by calling the corresponding Fund at 1-800-621-1048.
Like shares of Balanced Portfolio, shares of Total Return Portfolio are not deposits or obligations of, or guaranteed or endorsed by, any financial institution, are not insured by the Federal Deposit Insurance Corporation, the Federal Reserve Board or any other agency, and involve risk, including the possible loss of the principal amount invested.
This document is designed to give you the information you need to vote on the proposal. Much of the information is required disclosure under rules of the SEC; some of it is technical. If there is anything you don’t understand, please contact Computershare Fund Services, Balanced Portfolio’s proxy solicitor, at 1-877-288-6285, or contact your insurance company.
Total Return Portfolio is subject to the informational requirements of the Securities Exchange Act of 1934, as amended, and in accordance therewith files reports and other information with the SEC. You may review and copy information about the Funds, including the prospectuses and the statements of additional information, at the SEC’s public reference room at 450 Fifth Street, NW, Washington, D.C. You may call the SEC at 1-202-942-8090 for information about the operation of the public reference room. You may obtain copies of this information, with payment of a duplication fee, by electronic request at the following e-mail address: publicinfo@sec.gov, or by writing the SEC’s Public Reference Branch, Office of Consumer Affairs and Information Services, Securities and Exchange Commission, Washington, D.C. 20549-0102. You may also access reports and other information about the Funds on the EDGAR database on the SEC’s Internet site at http://www.sec.gov.
2
I. SYNOPSIS
The responses to the questions that follow provide an overview of key points typically of concern to shareholders considering a proposed merger between mutual funds. These responses are qualified in their entirety by the remainder of this Prospectus/Proxy Statement, which you should read carefully because it contains additional information and further details regarding the proposed merger.
| 1. | | What is being proposed? |
The Trustees of Scudder Variable Series I (the “Trust”), of which Balanced Portfolio is a series, are recommending that shareholders approve the transactions contemplated by the Agreement and Plan of Reorganization (as described below in Part IV and the form of which is attached hereto as Exhibit A), which we refer to as a merger of Balanced Portfolio into Total Return Portfolio. If approved by shareholders, all of the assets of Balanced Portfolio will be transferred to Total Return Portfolio solely in exchange for the issuance and delivery to Balanced Portfolio of Class A shares of Total Return Portfolio (“Merger Shares”) with a value equal to the value of Balanced Portfolio’s assets net of liabilities, and for the assumption by Total Return Portfolio of all liabilities of Balanced Portfolio. Immediately following the transfer, the Merger Shares received by Balanced Portfolio will be distributed pro-rata, on a tax-free basis for federal income tax purposes, to each of its shareholders of record.
| 2. | | What will happen to my investment in Balanced Portfolio as a result of the merger? |
Your investment in Balanced Portfolio will, in effect, be exchanged for an investment in the same share class of Total Return Portfolio with an equal aggregate net asset value as of the Valuation Time (as defined below on page [ ]).
| 3. | | Why have the Trustees of the Trust recommended that shareholders approve the merger? |
The Trustees believe that the merger may provide shareholders of Balanced Portfolio with the following benefits:
| | • | | Lower Expense Ratio. If the merger is approved, Balanced Portfolio shareholders are expected to benefit from a lower total fund operating expense ratio. |
| | • | | Compatible Investment Opportunity. The merger offers shareholders of Balanced Portfolio the opportunity to invest in a substantially larger combined fund with similar investment policies. Deutsche Investment Management Americas Inc. (“DeIM” or the “Advisor”), the investment advisor for the Funds, has advised the Trustees that Balanced Portfolio and Total Return Portfolio have compatible investment objectives and policies. In addition, the Advisor has advised the Trustees that both Funds have the same portfolio management team and follow similar investment processes. |
The Trustees of the Trust have concluded that: (1) the merger is in the best interests of Balanced Portfolio, and (2) the interests of the existing shareholders of Balanced
3
Portfolio will not be diluted as a result of the merger. Accordingly, the Trustees of the Trust recommend approval of the Agreement and Plan of Reorganization (as defined below) effecting the merger.
| 4. | | How do the investment goals, policies and restrictions of the two Funds compare? |
While not identical, the investment objectives, policies and restrictions of the Funds are similar. Balanced Portfolio seeks a balance of growth and income from a diversified portfolio of equity and fixed income securities. Total Return Portfolio seeks high total return, a combination of income and capital appreciation. Both Funds normally invest approximately 60% of their net assets in common stocks and other equity securities and approximately 40% of their net assets in fixed income securities, including lower-quality debt securities. Balanced Portfolio may, however, invest up to 75% of its net assets in equity securities and up to 50% in fixed income securities, based on the portfolio managers’ evaluation of the relative attractiveness of equity securities as compared to fixed income securities. At all times, Balanced Portfolio invests at least 25% of net assets in fixed income senior securities. Both Funds may invest in foreign securities (for Total Return Portfolio, up to 25% of total assets). Total Return Portfolio follows a flexible investment program, investing in a mix of growth and value stocks of large and small capitalization companies and bonds. Total Return Portfolio can buy many types of securities, among them common stocks, convertible securities, corporate bonds, U.S. government bonds and mortgage- and asset-backed securities. Each Fund’s bond investments normally consist of investment-grade bonds (those in the top four grades of credit quality). However, Total Return Portfolio could invest up to 35% of its total assets in junk bonds (i.e., grade BB/Ba and below), while Balanced Portfolio could put up to 20% of its total assets in junk bonds.
Both Funds are permitted, but not required, to use various types of derivatives (contracts whose value is based on, for example, indices, currencies or securities). Each Fund may use derivatives in circumstances where the managers believe they offer an economical means of gaining exposure to a particular asset class or to keep cash on hand to meet shareholder redemptions or other needs while maintaining exposure to the market.
Each Fund has elected to be classified as a diversified series of an open-end management investment company. With certain exceptions, a diversified fund may not, with respect to 75% of total assets, invest more than 5% of total assets in the securities of a single issuer or invest in more than 10% of the outstanding voting securities of such issuer. Please also see Part II—Investment Strategies and Risk Factors—below for a more detailed comparison of the Funds’ investment policies and restrictions.
The following table sets forth a summary of the composition of the investment portfolio of each Fund as of December 31, 2004, and of Total Return Portfolio on a pro forma combined basis, giving effect to the proposed merger as of that date:
4
Portfolio Composition (as a % of Fund)
| | | | | | | | | |
Category
| | Balanced
Portfolio
| | | Total
Return
Portfolio
| | | Total
Return Portfolio—
Pro Forma
Combined(1)
| |
Common Stocks | | 60 | % | | 60 | % | | 60 | % |
Fixed Income Holdings | | 37 | % | | 37 | % | | 37 | % |
Cash & Cash Equivalents | | 3 | % | | 3 | % | | 3 | % |
| | |
|
| |
|
| |
|
|
| | | 100 | % | | 100 | % | | 100 | % |
| (1) | | Reflects the blended characteristics of Balanced Portfolio and Total Return Portfolio as of December 31, 2004. The portfolio composition and characteristics of the combined fund will change consistent with its stated investment objective and policies. |
| 5. | | How do the management fee ratios and expense ratios of the two Funds compare, and what are they estimated to be following the merger? |
The following tables summarize the fees and expenses you may bear directly or indirectly as an investor in the Funds, the expenses that each of the Funds incurred for the year ended December 31, 2004, and the pro forma estimated expense ratios of Total Return Portfolio assuming consummation of the merger as of that date. The information shown below does not reflect charges and fees associated with the separate accounts that invest in the Funds or any Contract for which the Funds are investment options. These charges and fees will increase expenses.
The table immediately below compares the annual management fee schedules of the Funds, expressed as a percentage of net assets. The management fee schedules for Total Return Portfolio reflect the current management fee schedule, as well as reductions that will be effective upon the consummation of the merger. As of December 31, 2004, Total Return Portfolio and Balanced Portfolio had net assets of $654,550,230 and $130,377,260, respectively.
| | | | | | | | | | |
Balanced Portfolio
| | Total Return Portfolio
(pre-merger)
| | Total Return Portfolio (post-merger)
|
Average
Daily Net Assets
| | Management Fee
| | Average
Daily Net
Assets
| | Management Fee
| | Average
Daily Net Assets
| | Management Fee
|
All Levels | | 0.475% | | All Levels | | 0.550% | | $0-$250 million
| | 0.470% |
| | | | | | | | | $250 million-
$1 billion | | 0.445% |
| | | | | | | | | Over $1 billion | | 0.410% |
5
As shown below, the merger is expected to result in a lower management fee ratio and total expense ratio for shareholders of Balanced Portfolio. However, there can be no assurance that the merger will result in expense savings.
Annual Fund Operating Expenses
(expenses that are deducted from fund assets)
(as a % of average net assets)
| | | | | | | | | | | | |
| | | Management
Fee
| | Distribution/
Service
(12b-1)
Fee
| | Other
Expenses
| | Total
Annual
Fund
Operating
Expenses
| | Less Expense
Waiver/
Reimbursements
| | Net
Annual
Fund
Operating
Expenses
(after
waiver)
|
Balanced
Portfolio | | | | | | | | | | | | |
Class A | | 0.48% | | None | | 0.12% | | 0.60% | | —(1) | | 0.60% |
Total Return
Portfolio | | | | | | | | | | | | |
Class A | | 0.55% | | None | | 0.04% | | 0.59% | | — | | 0.59% |
Total Return
Portfolio | | | | | | | | | | | | |
(Pro forma
combined) Class A | | 0.45%(2) | | None | | 0.06%(3) | | 0.51% | | —(4) | | 0.51% |
| (1) | | Through April 30, 2006, DeIM has contractually agreed to waive all or a portion of its management fee and/or reimburse expenses to the extent necessary to maintain the Class A shares total operating expenses at 1.00%, excluding certain expenses such as extraordinary expenses, taxes, brokerage and interest. |
| (2) | | Restated to reflect the management fee schedule for Total Return Portfolio that will be effective upon consummation of the merger. |
| (3) | | Other expenses are estimated, accounting for the effect of the merger. |
| (4) | | Through April 30, 2008, DeIM has contractually agreed to waive all or a portion of its management fee and/or reimburse or pay operating expenses to the extent necessary to maintain the fund’s total operating expenses at 0.51% for Class A shares, excluding certain expenses such as extraordinary expenses, taxes, brokerage and interest. |
The tables are provided to help you understand the expenses of investing in the Funds and your share of the operating expenses that each Fund incurs and that DeAM expects the combined fund to incur in the first year following the merger.
6
Examples
The following examples translate the expenses shown in the preceding table into dollar amounts. By doing this, you can more easily compare the costs of investing in the Funds. The examples make certain assumptions. They assume that you invest $10,000 in a Fund for the time periods shown and reinvest all dividends and distributions. They also assume a 5% return on your investment each year and that a Fund’s operating expenses remain the same. The examples are hypothetical; your actual costs may be higher or lower.
| | | | | | | | | | | | |
| | | 1 Year
| | 3 Years
| | 5 Years
| | 10 Years
|
Balanced Portfolio | | | | | | | | | | | | |
Class A | | $ | 61 | | $ | 192 | | $ | 335 | | $ | 750 |
Total Return Portfolio | | | | | | | | | | | | |
Class A | | $ | 60 | | $ | 189 | | $ | 329 | | $ | 738 |
Total Return Portfolio | | | | | | | | | | | | |
(Pro forma combined) | | | | | | | | | | | | |
Class A | | $ | 52 | | $ | 164 | | $ | 285 | | $ | 640 |
| 6. | | What are the federal income tax consequences of the proposed merger? |
For federal income tax purposes, no gain or loss is expected to be recognized by Balanced Portfolio or its shareholders as a direct result of the merger. As described above, shares of Balanced Portfolio are available to investors purchasing Contracts funded through the separate accounts of Participating Insurance Companies. As long as these Contracts qualify as annuity contracts under Section 72 of the Internal Revenue Code of 1986, as amended (the “Code”), and Treasury Regulations thereunder, the merger, whether treated as a tax-free transaction or not, will not create any tax liability for Contract Owners. For more information, please see “Information about the Proposed Merger—Federal Income Tax Consequences,” below.
| 7. | | Will my dividends be affected by the merger? |
The merger will not result in a change in dividend policy.
| 8. | | Do the procedures for purchasing, redeeming and exchanging shares of the two Funds differ? |
No. The procedures for purchasing and redeeming shares of each Fund, and for exchanging shares of each Fund for shares of other Scudder funds, are identical. The separate accounts of the Participating Insurance Companies place orders to purchase and redeem shares of the Funds based on, among other things, the amount of premium payments to be invested and surrender and transfer requests to be effected on that day pursuant to its Contracts. The shares of each Fund are purchased and redeemed at the net asset value of the Fund’s shares next determined after an order in proper form is received. No fee is charged to shareholders when they purchase or redeem shares of the
7
Funds, nor will a fee be charged to shareholders when they purchase or redeem shares of the combined fund. Please see the Funds’ prospectuses for additional information.
| 9. | | How will I be notified of the outcome of the merger? |
If the proposed merger is approved by shareholders, shareholders whose accounts are affected by the merger will receive a confirmation statement reflecting their new account number and the number of shares of Total Return Portfolio they are receiving after the merger is completed. Subsequently, affected Contract Owners will be notified of changes to their account information by their respective Participating Insurance Companies. If the proposed merger is not approved, this result will be noted in the next shareholder report of Balanced Portfolio.
| 10. | | Will the value of my investment change? |
The number of shares owned by each Participating Insurance Company will most likely change. However, the total value of your investment in Total Return Portfolio will equal the total value of your investment in Balanced Portfolio at the time of the merger. Even though the net asset value per share of each Fund is likely to be different, the total value of your holdings will not change as a result of the merger.
| 11. | | What percentage of shareholders’ votes is required to approve the merger? |
Approval of the merger will require the affirmative vote of (A) 67% or more of the shares of Balanced Portfolio present at the meeting, if the holders of more than 50% of the outstanding shares are present in person or by proxy or (B) more than 50% of the outstanding shares of Balanced Portfolio, whichever is less.
The Trustees of the Trust believe that the proposed merger is in the best interest of Balanced Portfolio. Accordingly, the Trustees recommend that shareholders vote FOR approval of the proposed merger.
II. INVESTMENT STRATEGIES AND RISK FACTORS
What are the main investment strategies and related risks of Total Return Portfolio and how do they compare with those of Balanced Portfolio?
Investment Objectives and Strategies. As noted above, the Funds have similar investment objectives and are managed by the same portfolio management team.
Total Return Portfolio. Total Return Portfolio seeks high total return, a combination of income and capital appreciation.
Total Return Portfolio follows a flexible investment program, investing in a mix of growth and value stocks of large and small capitalization companies and bonds. The Advisor employs a team approach to allocate Total Return Portfolio’s assets among the various asset classes.
8
Total Return Portfolio can buy many types of securities, among them common stocks, convertible securities, corporate bonds, U.S. government bonds and mortgage- and asset-backed securities. Total Return Portfolio normally invests approximately 60% of its net assets in common stocks and other equity securities and approximately 40% of its net assets in fixed income securities, including lower-quality debt securities. Generally, most securities are from U.S. issuers, but Total Return Portfolio may invest up to 25% of total assets in foreign securities.
The Advisor regularly reviews Total Return Portfolio’s investment allocations and will vary them to favor asset classes that, in their judgment, provide the most favorable return outlook consistent with Total Return Portfolio’s investment objective. In deciding how to allocate the Total Return Portfolio’s assets, the Advisor will evaluate projections of risk, market and economic conditions, volatility, yields and expected returns.
The Advisor follows specific strategies in selecting equity and fixed securities for Total Return Portfolio.
Equity securities in Total Return Portfolio generally include “growth” stocks as well as “value” stocks and normally include stocks of both small and large companies.
Growth Stock. In choosing these securities, the Advisor primarily invests in U.S. companies that it believes offer the potential for sustainable growth of revenue or earnings and whose market values appear reasonable in light of their business prospects. The Advisor focuses on high quality growth companies that are leaders or potential leaders in their respective industries. The Advisor conducts in-depth company research, examining, among other factors, relative growth rates, innovation, regional and global exposure and management.
Value Stocks. When selecting value stocks, the Advisor begins by screening for stocks whose price-to-earnings ratios are below the average for the S&P 500 Index. The Advisor then compares a company’s stock price to its book value, cash flow and yield, and analyzes individual companies to identify those that are financially sound and appear to have strong potential for long-term growth, but are out of favor with the market.
Small Company Stocks. In selecting stocks of small companies, a quantitative stock valuation model compares each company’s stock price to the company’s earnings, book value, sales and other measures of performance potential. The Advisor also looks for factors that may signal a rebound for a company, whether through a recovery in its markets, a change in business strategy or other factors.
The Advisor believes that by combining techniques used by fundamental value investors with extensive growth and earnings analysis they can minimize investment style bias and ultimately produce a “pure” stock selection process that seeks to add value in any market environment. The Advisor also incorporates technical analysis to capture short-term price changes and evaluate the market’s responsiveness to new information.
Fixed income securities in the portfolio include both investment grade and lower-quality debt securities, and may include securities of both U.S. and non-U.S. (including emerging market) issuers.
9
U.S. Investment Grade Securities. In selecting these securities for investment, the Advisor typically:
| | • | | assigns a relative value to each bond, based on creditworthiness, cash flow and price; |
| | • | | determines the value of each issue by examining the issuer’s credit quality, debt structure, option value and liquidity risks. The Advisor looks to take advantage of any inefficiencies between this value and market trading price; |
| | • | | uses credit analysis to determine the issuer’s ability to fulfill its contracts; and |
| | • | | uses a bottom-up approach which subordinates sector weightings to individual bonds that the Advisor believes may add above-market value. |
The Advisor generally sells these securities when they reach their target price or when there is a negative change in their outlook relative to the other securities held by Total Return Portfolio. Bonds may also be sold to facilitate the purchase of an issue with more attractive risk/return characteristics.
Foreign Debt Securities. In selecting these securities for investment, the Advisor follows a bottom-up, relative value strategy. The Advisor looks to purchase foreign securities that offer incremental value over U.S. Treasuries. The Advisor invests in a focused fashion, so that it is not simply investing in a basket of all non-U.S. fixed income markets, but instead only those markets that its relative value process has identified as being the most attractive. The Advisor sells securities or exchange currencies when they meet their target price objectives or when the Advisor revises price objectives downward. In selecting emerging market securities, the Advisor also considers short-term factors such as market sentiment, capital flows, and new issue programs.
High Yield Securities. In selecting these securities for investment, the Advisor:
| | • | | analyzes economic conditions for improving or undervalued sectors and industries; |
| | • | | uses independent credit research and on-site management visits to evaluate individual issuers’ debt service, growth rate, and both downgrade and upgrade potential; |
| | • | | assesses new issues versus secondary market opportunities; and |
| | • | | seeks issues within attractive industry sectors and with strong long-term fundamentals and improving credits. |
The portfolio may lend its investment securities up to 33% of its total assets to approved institutional borrowers who need to borrow securities in order to complete certain transactions.
Although major changes tend to be infrequent, the Board of Trustees could change the portfolio’s investment objective without seeking shareholder approval.
10
Other Investments. Normally, Total Return Portfolio’s bond component consists mainly of investment-grade bonds (those in the top four grades of credit quality). However, Total Return Portfolio could invest up to 35% of its total assets in junk bonds (i.e., grade BB/Ba and below). Compared to investment-grade bonds, junk bonds may pay higher yields and typically will have higher volatility and risk of default.
Although not one of its principal investment strategies, Total Return Portfolio is permitted, but not required, to use various types of derivatives (contracts whose value is based on, for example, indices, currencies or securities). In particular, Total Return Portfolio may use futures, currency options and forward currency transactions. Total Return Portfolio may use derivatives in circumstances where the managers believe they offer an economical means of gaining exposure to a particular asset class or to keep cash on hand to meet shareholder redemptions or other needs while maintaining exposure to the market.
As a temporary defensive measure, Total Return Portfolio could shift up to 100% of assets into investments such as money market securities. This measure could prevent losses, but, while engaged in a temporary defensive position, Total Return Portfolio will not be pursuing its investment objective. However, the Advisor may choose not to use these strategies for various reasons, even in very volatile market conditions.
Total Return Portfolio has elected to be classified as a diversified series of an open-end management investment company. With certain exceptions, a diversified fund may not, with respect to 75% of total assets, invest more than 5% of total assets in the securities of a single issuer or invest in more than 10% of the outstanding voting securities of such issuer.
Balanced Portfolio. Balanced Portfolio seeks a balance of growth and income from a diversified portfolio of equity and fixed income securities.
Balanced Portfolio normally invests approximately 60% of its net assets in common stocks and other equity securities and approximately 40% of its net assets in fixed income securities, including lower-quality debt securities. Balanced Portfolio may, however, invest up to 75% of its net assets in equity securities and up to 50% in fixed income securities, based on the portfolio managers’ evaluation of the relative attractiveness of equity securities as compared to fixed income securities. At all times, Balanced Portfolio invests at least 25% of net assets in fixed income senior securities. Balanced Portfolio may invest in foreign securities as well as securities of U.S. issuers.
The Advisor regularly reviews Balanced Portfolio’s investment allocations and will vary them to favor asset classes that, in its judgment, provide the most favorable return outlook consistent with the Balanced Portfolio’s investment objective. In deciding how to allocate Balanced Portfolio’s assets, the Advisor will evaluate projections of risk, market and economic conditions, volatility, yields and expected returns.
The Advisor follows specific strategies in selecting equity and fixed income securities for Balanced Portfolio.
Equity securities in the portfolio generally include “growth” stocks as well as “value” stocks and normally include stocks of both small and large companies.
11
Growth Stocks. In choosing these securities, the managers primarily invest in U.S. companies that they believe offer the potential for sustainable growth of revenue or earnings and whose market values appear reasonable in light of their business prospects. The managers focus on high quality growth companies that are leaders or potential leaders in their respective industries. The managers conduct in-depth company research, examining, among other factors, relative growth rates, innovation, regional and global exposure and management.
Value Stocks. When selecting value stocks, these portfolio managers begin by screening for stocks whose price-to-earnings ratios are below the average for the S&P 500 Index. The managers then compare a company’s stock price to its book value, cash flow and yield, and analyze individual companies to identify those that are financially sound and appear to have strong potential for long-term growth.
Small Company Stocks. In selecting stocks of small companies, a quantitative stock valuation model compares each company’s stock price to the company’s earnings, book value, sales and other measures of performance potential. The managers also look for factors that may signal a rebound for a company, whether through a recovery in its markets, a change in business strategy or other factors.
The managers believe that by combining techniques used by fundamental value investors with extensive growth and earnings analysis they can minimize investment style bias and ultimately produce a “pure” stock selection process that seeks to add value in any market environment. The team also incorporates technical analysis to capture short-term price changes and evaluate the market’s responsiveness to new information.
Fixed income securities in the portfolio include both investment grade and lower-quality debt securities, and may include securities of both U.S. and non-U.S. (including emerging market) issuers.
U.S. Investment Grade Securities. In selecting these securities for investment, the Advisor typically:
| | • | | assigns a relative value to each bond, based on creditworthiness, cash flow and price; |
| | • | | determines the value of each issue by examining the issuer’s credit quality, debt structure, option value and liquidity risks. The portfolio managers look to take advantage of any inefficiencies between this value and market trading price; |
| | • | | uses credit analysis to determine the issuer’s ability to fulfill its contracts; and |
| | • | | uses a bottom-up approach which subordinates sector weightings to individual bonds that the advisor believes may add above-market value. |
The Advisor generally sells these securities when they reach their target price or when there is a negative change in their outlook relative to the other securities held by the portfolio. Bonds may also be sold to facilitate the purchase of an issue with more attractive risk/return characteristics.
12
Foreign Debt Securities. In selecting these securities for investment, the Advisor follows a bottom-up, relative value strategy. The Advisor looks to purchase foreign securities that offer incremental value over U.S. Treasuries. The Advisor invests in a focused fashion, so that it is not simply investing in a basket of all non-U.S. fixed income markets, but instead only those markets that its relative value process has identified as being the most attractive. The Advisor sells securities or exchanges currencies when they meet their target price objectives or when the Advisor revises price objectives downward. In selecting emerging market securities, the Advisor also considers short-term factors such as market sentiment, capital flows, and new issue programs.
High Yield Securities. In selecting these securities for investment, the Advisor:
| | • | | analyzes economic conditions for improving or undervalued sectors and industries; |
| | • | | uses independent credit research and on-site management visits to evaluate individual issuers’ debt service, growth rate, and both downgrade and upgrade potential; |
| | • | | assesses new issues versus secondary market opportunities; and |
| | • | | seeks issues within attractive industry sectors and with strong long-term fundamentals and improving credits. |
Balanced Portfolio may lend its investment securities up to 33% of its total assets to approved institutional borrowers who need to borrow securities in order to complete certain transactions.
Although major changes tend to be infrequent, the Board of Trustees could change Balanced Portfolio’s investment objective without seeking shareholder approval.
Other Investments. Balanced Portfolio’s bond investments are primarily in the top four grades of credit quality. Balanced Portfolio could put up to 20% of total assets in junk bonds (i.e., grade BB/Ba and below). Compared to investment-grade bonds, junk bonds may pay higher yields and typically will have higher volatility and risk of default. Balanced Portfolio may also invest in foreign securities. Balanced Portfolio may also invest up to 15% of its total assets to buy or sell protection on credit exposure.
Balanced Portfolio is permitted, but not required, to use various types of derivatives (contracts whose value is based on, for example, indices, currencies or securities). Balanced Portfolio may use derivatives in circumstances where the managers believe they offer an economical means of gaining exposure to a particular asset class or to keep cash on hand to meet shareholder redemptions or other needs while maintaining exposure to the market.
As a temporary defensive measure, Balanced Portfolio could shift up to 100% of assets into investments such as money market securities. This measure could prevent losses, but, while engaged in a temporary defensive position, Balanced Portfolio will not be pursuing its investment objective. However, the portfolio managers may choose not to use these strategies for various reasons, even in very volatile market conditions.
13
Balanced Portfolio has elected to be classified as a diversified series of an open-end management investment company. With certain exceptions, a diversified fund may not, with respect to 75% of total assets, invest more than 5% of total assets in the securities of a single issuer or invest in more than 10% of the outstanding voting securities of such issuer.
The portfolio turnover rate for Total Return Portfolio, i.e., the ratio of the lesser of annual sales or purchases to the monthly average value of the portfolio (excluding from both the numerator and the denominator securities with maturities at the time of acquisition of one year or less), for the fiscal year ended December 31, 2004 was 131%. The portfolio turnover rate for Balanced Portfolio for the fiscal year ended December 31, 2004 was 138%. While these figures do not reflect a significant difference between the Funds, a higher portfolio turnover rate involves greater brokerage and transaction expenses to a fund.
For a more detailed description of the investment techniques used by Total Return Portfolio and Balanced Portfolio, please see the applicable Fund’s prospectus and statement of additional information.
Primary Risks. As with any mutual fund, you may lose money by investing in Total Return Portfolio. Certain risks associated with an investment in Total Return Portfolio are summarized below. The risks of an investment in Total Return Portfolio are similar to the risks of an investment in Balanced Portfolio. More detailed descriptions of the risks associated with an investment in Total Return Portfolio can be found in the current prospectus and statement of additional information for Total Return Portfolio.
The value of your investment in Total Return Portfolio will change with changes in the values of the investments held by Total Return Portfolio. A wide array of factors can affect those values. In this summary, we describe the principal risks that may affect Total Return Portfolio’s investments as a whole. Total Return Portfolio could be subject to additional principal risks because the types of investments it makes can change over time.
There are several risk factors that could hurt the performance of Total Return Portfolio, cause you to lose money or cause the performance of Total Return Portfolio to trail that of other investments.
Stock Market Risk. As with most stock portfolios, an important factor with Total Return Portfolio is how stock markets perform. When stock prices fall, you should expect the value of your investment to fall as well. Because a stock represents ownership in its issuer, stock prices can be hurt by poor management, shrinking product demand and other business risks. These may affect single companies as well as groups of companies. In addition, movements in financial markets may adversely affect a stock’s price, regardless of how well the company performs. The market as a whole may not favor the types of investments Total Return Portfolio makes and Total Return Portfolio may not be able to get attractive prices for them. An investment in Balanced Portfolio is also subject to this risk.
Industry Risk. While Total Return Portfolio does not concentrate in any industry, to the extent that Total Return Portfolio has exposure to a given industry or sector, any factors affecting that industry or sector could affect the value of Total Return Portfolio’s
14
securities. For example, manufacturers of consumer goods could be hurt by a rise in unemployment, or technology companies could be hurt by such factors as market saturation, price competition and rapid obsolescence. An investment in Balanced Portfolio is also subject to this risk.
Credit Risk. A portfolio purchasing bonds faces the risk that the creditworthiness of the issuer may decline, causing the value of its bonds to decline. In addition, an issuer may be unable or unwilling to make timely payments on the interest and principal on the bonds it has issued. Because the issuers of junk bonds (rated below the fourth highest category) may be in uncertain financial health, the prices of their bonds can be more vulnerable to bad economic news or even the expectation of bad news, than investment-grade bonds. In some cases, bonds may decline in credit quality or go into default. Because Total Return Portfolio may invest in securities not paying current interest or in securities already in default, these risks may be more pronounced. An investment in Balanced Portfolio is also subject to this risk.
Interest Rate Risk. Generally, fixed income securities will decrease in value when interest rates rise. The longer the effective maturity of Total Return Portfolio’s securities, the more sensitive it will be to interest rate changes. (As a general rule, a 1% rise in interest rates means a 1% fall in value for every year of duration.) As interest rates decline, the issuers of securities held by Total Return Portfolio may prepay principal earlier than scheduled, forcing Total Return Portfolio to reinvest in lower yielding securities. This prepayment may reduce Total Return Portfolio’s income. As interest rates increase, slower than expected principal payments may extend the average life of fixed income securities. This will have the effect of locking in a below-market interest rate, increasing Total Return Portfolio’s duration and reducing the value of such a security. Because Total Return Portfolio may invest in mortgage-related securities, it is more vulnerable to both of these risks. An investment in Balanced Portfolio is also subject to this risk.
Derivatives Risk. Risks associated with derivatives include: the risk that the derivative is not well correlated with the security, index or currency to which it relates; the risk that derivatives used for risk management may not have the intended effects and may result in losses or missed opportunities; the risk that Total Return Portfolio will be unable to sell the derivative because of an illiquid secondary market; the risk that a counterparty is unwilling or unable to meet its obligation; the risk of interest rate movements; and the risk that the derivatives transaction could expose Total Return Portfolio to the effects of leverage, which could increase Total Return Portfolio’s exposure to the market and magnify potential losses. There is no guarantee that derivatives activities will be employed or that they will work, and their use could cause lower returns or even losses to Total Return Portfolio. An investment in Balanced Portfolio is also subject to this risk.
Securities Lending Risk. Any loss in the market price of securities loaned by Total Return Portfolio that occurs during the term of the loan would be borne by Total Return Portfolio and would adversely affect Total Return Portfolio’s performance. Also, there may be delays in recovery of securities loaned or even a loss of rights in the collateral should the borrower of the securities fail financially while the loan is outstanding. However, loans will be made only to borrowers selected by Total Return Portfolio’s delegate after a review of relevant facts and circumstances, including the creditworthiness of the borrower. An investment in Balanced Portfolio is also subject to this risk.
15
Pricing Risk. At times, market conditions might make it hard to value some investments. For example, if Total Return Portfolio has valued its securities too highly, you may end up paying too much for portfolio shares when you buy into Total Return Portfolio. If Total Return Portfolio underestimates their price, you may not receive the full market value for your Total Return Portfolio shares when you sell. An investment in Balanced Portfolio is also subject to this risk.
Value Investing Risk. As with any investment strategy, the “value” strategy used in managing Total Return Portfolio will, at times, perform better than or worse than other investment styles and the overall market. If the Advisor overestimates the value or return potential of one or more common stocks, Total Return Portfolio may underperform the general equity market. Value stocks may also be out of favor for certain periods in relation to growth stocks. An investment in Balanced Portfolio is also subject to this risk.
Small Company Capitalization Risk. Small company stocks tend to experience steeper price fluctuations—down as well as up—than the stocks of larger companies. A shortage of reliable information—the same information gap that creates opportunity—can also pose added risk. Industry-wide reversals may have a greater impact on small companies, since they lack a large company’s financial resources. Small company stocks are typically less liquid than large company stocks: when things are going poorly, it is harder to find a buyer for a small company’s shares. An investment in Balanced Portfolio is also subject to this risk.
Foreign Investment Risk. To the extent that Total Return Portfolio holds the securities of companies based outside the U.S., it faces the risks inherent in foreign investing. Adverse political, economic or social developments could undermine the value of Total Return Portfolio’s investments or prevent Total Return Portfolio from realizing their full value. Financial reporting standards for companies based in foreign markets differ from those in the U.S. Additionally, foreign securities markets generally are smaller and less liquid than the U.S. markets. These risks tend to be greater in emerging markets, so to the extent Total Return Portfolio invests in emerging markets, it takes on greater risks. Finally, the currency of the country in which Total Return Portfolio has invested could decline relative to the value of the U.S. dollar, which would decrease the value of the investment to U.S. investors. An investment in Balanced Portfolio is also subject to this risk.
Other factors that could affect performance include:
| | • | | the managers could be incorrect in their analysis of industries, companies, economic trends, the relative attractiveness of different securities or other matters (an investment in Balanced Portfolio is also subject to this other risk factor); and |
| | • | | the Advisor measures credit quality at the time it buys securities, using independent rating agencies or, for unrated securities, judged by the Advisor to be of equivalent quality. In addition, the Advisor applies its own credit quality standards to evaluate securities. If a security’s credit quality declines, the Advisor will decide what to do with the security, based on the circumstances and its assessment of what would benefit shareholders most. |
Performance Information. The following information provides some indication of the risks of investing in the Funds. The information shown below does not reflect charges and fees associated with the separate accounts that invest in the Funds or any
16
Contract for which the Funds are investment options. If it did, performance would be less than that shown. The bar charts show year-to-year changes in the performance of each Fund’s Class A shares. The table following the charts shows how the performance of each Fund compares to that of three broad-based market indices (which, unlike the Funds, do not have any fees or expenses). The performance of the Funds and the indices varies over time. Of course, a Fund’s past performance is not necessarily an indication of future performance.
Calendar Year Total Returns (%)
Total Return Portfolio
| | |
Annual Total Returns (%) as of 12/31 each year | | Class A |
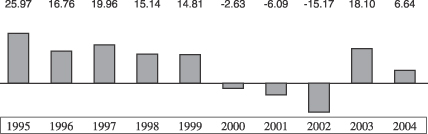
For the periods included in the bar chart:
Best Quarter: 13.32%, Q2, 1997 Worst Quarter: -9.91%, Q2, 2002
Balanced Portfolio
| | |
Annual Total Returns (%) as of 12/31 each year | | Class A |

For the periods included in the bar chart:
Best Quarter: 15.51%, Q4, 1998 Worst Quarter: -9.71%, Q2, 2002
17
Average Annual Total Returns (%) as of 12/31/04
| | | | | | | | | |
| | | Past
1 year
| | | Past
5 years
| | | Past
10 years
| |
Total Return Portfolio | | | | | | | | | |
Class A | | 6.64 | % | | -0.47 | % | | 8.58 | % |
Index 1 (Reflects no deductions for fees or expenses) | | 10.88 | % | | -2.30 | % | | 12.07 | % |
Index 2 (Reflects no deductions for fees or expenses) | | 6.30 | % | | -9.29 | % | | 9.59 | % |
Index 3 (Reflects no deductions for fees or expenses) | | 4.34 | % | | 7.71 | % | | 7.72 | % |
| | | |
Balanced Portfolio | | | | | | | | | |
Class A | | 6.48 | % | | -0.37 | % | | 9.40 | % |
Index 1 (Reflects no deductions for fees or expenses) | | 10.88 | % | | -2.30 | % | | 12.07 | % |
Index 2 (Reflects no deductions for fees or expenses) | | 6.30 | % | | -9.29 | % | | 9.59 | % |
Index 3 (Reflects no deductions for fees or expenses) | | 4.34 | % | | 7.71 | % | | 7.72 | % |
Index 1: The Standard & Poor’s 500 Index (S&P 500) is a capitalization-weighted index of 500 stocks, designed to measure performance of the broad domestic economy through changes in the aggregate market value of 500 stocks representing all major industries.
Index 2: The Russell 1000 Growth Index is an unmanaged capitalization-weighted index containing those securities in the Russell 1000 Index with higher price-to-book ratios and higher forecasted-growth values.
Index 3: The Lehman Brothers Aggregate Bond Index is an index comprised of approximately 6,000 publicly traded bonds including U.S. Government, mortgage-backed, corporate and yankee bonds with an approximate average maturity of 10 years.
Current performance may be higher or lower than the performance data quoted above. For more recent performance information, call your insurance company or (800) 621-1048 or visit the Scudder website at www.scudder.com.
III. OTHER COMPARISONS BETWEEN THE FUNDS
Advisor, Subadvisor and Portfolio Managers. DeIM is the investment advisor for each Fund. Under the supervision of the Board of Trustees of each Trust, DeIM, with headquarters at 345 Park Avenue, New York, New York, 10154, makes each Fund’s investment decisions, buys and sells securities for each Fund and conducts research that leads to these purchase and sale decisions. DeIM also is responsible for selecting brokers and dealers and for negotiating brokerage commissions and dealer charges. DeIM is a part of DeAM and is an indirect wholly-owned subsidiary of Deutsche Bank AG. Deutsche Asset Management is the marketing name in the United States for the asset management activities of, among others, Deutsche Bank AG, DeIM, Deutsche Asset Management Inc., Deutsche Asset Management Investment Services Limited, Deutsche Bank Trust Company Americas and Scudder Trust Company. Deutsche Bank AG is a major global banking institution that is engaged in a wide range of financial services, including investment management, mutual fund, retail, private and commercial banking, investment banking and insurance.
18
Total Return Portfolio’s Board has approved a subadvisory agreement, and Balanced Portfolio’s Board has approved a research and subadvisory agreement, between DeIM and Deutsche Asset Management Investment Services Ltd. (“DeAMIS”). DeAMIS, One Appold Street, London, England, an affiliate of the Advisor, is the subadvisor to each Fund. DeAMIS renders investment advisory and management services including services related to foreign securities, foreign currency transactions and related investments with regard to the portion of each Fund’s portfolio that is allocated to it by DeIM from time-to-time for management. DeAMIS provides a full range of international investment advisory services to institutional and retail clients. DeAMIS is an indirect, wholly-owned subsidiary of Deutsche Bank AG. DeIM compensates DeAMIS out of the management fee it receives from each Fund.
Each Fund is managed by a team of investment professionals who share responsibility for each Fund’s investment management decisions.
Julie M. Van Cleave, CFA, Managing Director of DeAM, is a Portfolio Manager of each Fund. Ms. Van Cleave joined DeAM and became a Portfolio Manager of the Funds in 2002. Ms. Van Cleave has 18 years of investment industry experience at Mason Street Advisors, as Managing Director and team leader for the large cap management team and holds an MBA from the University of Wisconsin-Madison.
Thomas F. Sassi, Managing Director of DeAM, is a Portfolio Manager of each Fund. Mr. Sassi joined DeAM in 1996 and became a Portfolio Manager of the Funds in 2004. Mr. Sassi has over 32 years of investment industry experience and holds an MBA from Hofstra University.
J. Christopher Gagnier, Managing Director of DeAM, is a Portfolio Manager of each Fund. Mr. Gagnier joined DeAM in 1997 and became a Portfolio Manager of the Funds in 2002. Mr. Gagnier began his investment career in 1979, served as portfolio manager at Paine Webber from 1984 to 1997 and holds an MBA from the University of Chicago.
Andrew P. Cestone, Managing Director of DeAM, is a Portfolio Manager of each Fund. Mr. Cestone is currently Head of Core Plus Fixed Income. Mr. Cestone joined DeAM in 1998 and became a Portfolio Manager of the Funds in 2002. Mr. Cestone began his investment career in 1995, serving as a credit officer at Fleet Bank, from 1995 to 1997. Mr. Cestone also served as an investment analyst at Phoenix Investment Partners from 1997 to 1998.
Arnim S. Holzer, Director of DeAM, is a Portfolio Manager of each Fund. Mr. Holzer joined DeAM in 1999 and became a Portfolio Manager of each Fund in 2004. Mr. Holzer has 18 years of investment industry experience including 3 years managing Emerging Markets Fixed Income, Emerging Markets Equity and Emerging Markets balanced accounts at Deltec Asset Management Corporation and holds an MBA from Fordham University.
Brett Diment, Managing Director of DeAM, is a Portfolio Manager of each Fund. Mr. Diment joined DeAM in 1991, the Total Return Portfolio in 2003 and the Balanced Portfolio in 2004. Mr. Diment began his investment career in 1991, served as Head of Emerging Market Debt for London Fixed Income and was responsible for coordinating research into Continental European markets and managing global fixed income, balanced and cash-based portfolios: London.
19
Distribution and Service Fees. Pursuant to a separate Underwriting Agreement for Balanced Portfolio and an Underwriting and Distribution Services Agreement for Total Return Portfolio, Scudder Distributors, Inc. (“SDI”), 222 South Riverside Plaza, Chicago, Illinois 60606, an affiliate of DeIM, is the principal underwriter and distributor for the Class A Shares of both Balanced Portfolio and Total Return Portfolio. SDI acts as agent of each Fund in the continuous offering of shares to the separate accounts of Participating Insurance Companies in all states in which the Funds or their respective trusts may from time to time be registered or where permitted by applicable law. Rule 12b-1 plans have not been adopted for Class A shares of either Fund.
Trustees and Officers. The Trustees of Scudder Variable Series II (of which Total Return Portfolio is a series) are different from those of the Trust (of which Balanced Portfolio is a series). As more fully described in the statement of additional information for Total Return Portfolio, which is available upon request, the following individuals comprise the Board of Trustees of Scudder Variable Series II: John W. Ballantine, Lewis A. Burnham, Donald L. Dunaway, James R. Edgar, Paul K. Freeman, Robert B. Hoffman, William McClayton, Shirley D. Peterson (Chair), William N. Shiebler, Robert H. Wadsworth and John G. Weithers. In addition, the officers of the Trust are the same as those of Scudder Variable Series II, except that Philip J. Collora, Vice President and Assistant Secretary of Scudder Variable Series II, is not an officer of the Trust, and John Millette, Secretary of Scudder Variable Series II, is Vice President and Secretary of the Trust.
Independent Registered Public Accounting Firms (“Auditors”). PricewaterhouseCoopers LLP serves as Auditor for Balanced Portfolio. Ernst & Young LLP serves as Auditor for Total Return Portfolio.
Charter Documents. Balanced Portfolio is a series of the Trust, a Massachusetts business trust governed by Massachusetts law. Total Return Portfolio is a series of Scudder Variable Series II, a Massachusetts business trust governed by Massachusetts law. Balanced Portfolio is governed by an Amended and Restated Agreement and Declaration of Trust dated October 24, 1997, as amended from time to time. Total Return Portfolio is governed by an Amended and Restated Declaration of Trust dated January 22, 1987, as amended from time to time. Each charter document is referred to herein as a Declaration of Trust. These charter documents are similar but not identical to one another, and therefore shareholders of the Funds may have different rights. Additional information about each Fund’s Declaration of Trust is provided below.
Shareholders of Balanced Portfolio and Total Return Portfolio have a number of rights in common. Shares of each Fund entitle their holders to one vote per share, with fractional shares voting proportionally; however, a separate vote will be taken by the applicable Fund or class of shares on matters affecting that particular Fund or class, as determined by its Trustees. For example, a change in a fundamental investment policy for a particular Fund would be voted upon only by shareholders of that Fund, and adoption of a distribution plan relating to a particular class and requiring shareholder approval would be voted upon only by shareholders of that class. Shares of each Fund have noncumulative voting rights with respect to the election of Trustees.
Neither Fund is required to hold annual meetings of its shareholders, but meetings of the shareholders shall be called for the purpose of electing Trustees, when required by the applicable Declaration of Trust or to comply with the 1940 Act. The shareholders
20
of Scudder Variable Series II may call a shareholder meeting if the Trustees and the President of the trust fail to call a meeting for thirty days after written application by the holders of at least 25% (or at least 10%, if the purpose of the meeting is to vote to remove a Trustee) of the outstanding shares entitled to vote at such meeting. The President and Secretary (or the Trustees, if for the purpose of removing a Trustee) of the Trust are required to call a meeting of shareholders at the written request of the holders of at least 10% of the outstanding shares entitled to vote at such meeting.
Neither Fund’s shares have conversion, exchange, preemption or appraisal rights. Shares of each Fund are entitled to dividends (if any) as declared by the Trustees, and if a Fund were liquidated, each class of shares of that Fund would receive the net assets of the Fund attributable to said class. Both Funds have the right to redeem, at the then current net asset value, the shares of any shareholder whose account does not exceed a minimum balance designated from time to time by the Trustees. Sale, conveyance, or transfer of the assets of Total Return Portfolio requires the affirmative vote of the shareholders entitled to vote more than 50% of the votes entitled to be cast on the matter. The Trustees of the Trust may merge or consolidate Balanced Portfolio with any other organization, or may sell, lease or exchange all or substantially all of the trust property, without shareholder approval.
Under Massachusetts law, shareholders of a Massachusetts business trust could, under certain circumstances, be held personally liable for the acts or obligations of a fund. The Declarations of Trust governing both Total Return Portfolio and Balanced Portfolio, however, disclaim shareholder liability in connection with the applicable Fund’s property or the acts and obligations of the applicable Fund and require (or, in the case of Balanced Portfolio, permit) notice of such disclaimer to be given in each agreement, obligation or instrument entered into or executed by the Fund or its Trustees. Moreover, each Declaration of Trust provides for indemnification out of the property of the applicable Fund for all loss and expense of any shareholder held personally liable by reason of being a shareholder of said Fund, and provides that the Fund may be covered by insurance that the Trustees consider necessary or appropriate.
All consideration received by the applicable trust for the issue or sale of shares of the applicable Fund, together with all assets in which such consideration is invested or reinvested, and all income, earnings, profits and proceeds, including proceeds from sale, exchange or liquidation of assets, are held and accounted for separately from the other assets of said trust and belong irrevocably to said Fund for all purposes, subject only to the rights of creditors.
Scudder Variable Series I (or any series thereof) may be terminated by a written instrument signed by a majority of its Trustees, or by the affirmative vote of the holders of a majority of the shares of the Trust or series outstanding and entitled to vote. Scudder Variable Series II (or any series or class thereof) may be terminated by its Trustees without shareholder consent by written notice to shareholders, or by vote of the holders of more than 50% of the votes of the trust or series or class entitled to vote on the matter. The Declaration of Trust governing Balanced Portfolio may be amended by the vote of the holders of a majority of the shares outstanding and entitled to vote. The Declaration of Trust governing Balanced Portfolio may also be amended by the Trustees without shareholder consent if the Trustees deem it necessary to conform the Declaration of Trust to the requirements of applicable federal or state laws or regulations or the requirements of the Code, or if they determine that such a change
21
does not materially adversely affect the rights of shareholders. The Declaration of Trust governing Total Return Portfolio may be amended by the Trustees when authorized by a vote of the shareholders holding more than 50% of the shares of each series entitled to vote or, where the Trustees determine that the amendment will affect the holders of only certain series or classes, a vote of the holders of more than 50% of the shares entitled to vote of each affected series or class. The Declaration of Trust governing Total Return Portfolio may also be amended by the Trustees without shareholder consent if the purpose of the amendment is to change the name of the Trust or to supply any omission, cure any ambiguity, or cure, correct or supplement any provision which is defective or inconsistent with the 1940 Act or the requirements of the Code.
The voting powers of shareholders of each Fund are substantially similar. However, only the Declaration of Trust governing Balanced Portfolio provides expressly that shareholders have the power to vote to the same extent as the stockholders of a Massachusetts business corporation as to whether a court action, proceeding, or claim should be brought or maintained derivatively or as a class action on behalf of the trust or any series or class thereof or the shareholders. In addition, only the Declaration of Trust governing Total Return Portfolio expressly provides that a majority of the outstanding securities of a series of the Trust, as defined in the 1940 Act, has the power to vote on whether the Trustees may enter into a contract with an investment advisor or manager for that series (although this is currently required by the 1940 Act for all mutual funds). Trustees of Scudder Variable Series I, except for those appointed by the standing Trustees to fill existing vacancies, are to be elected by the shareholders of the trust holding a plurality of the shares voting at a meeting of shareholders. In the event that less than a majority of the Trustees holding office have been elected by shareholders, the Trustees then in office are required to call a shareholders’ meeting for the election of Trustees. Any Trustee of Scudder Variable Series I may be removed at a meeting of shareholders by vote of two-thirds of the outstanding shares of the trust. Except as required by the 1940 Act or as described above, the Trustees of Scudder Variable Series II need not call meetings of the shareholders for the election or reelection of Trustees, or fill vacancies that do not cause the total number of Trustees to fall below three. Such vacancies may be filled by a majority of the standing Trustees or, if deemed appropriate by the Trustees, by a plurality of the shares voted on the matter at a meeting called for such purpose. Any Trustee of Scudder Variable Series II may be removed for cause by a written instrument signed by a majority of the Trustees, or with or without cause by vote of the shareholders entitled to vote more than 50% of the votes entitled to be cast on the matter or by a written consent filed with the custodian of the trust’s portfolio securities and executed by the shareholders entitled to vote more than 50% of the votes entitled to be cast on the matter.
Quorum for a shareholder meeting of Scudder Variable Series I is the presence in person or by proxy of one-third of the shares entitled to vote. Quorum for a shareholder meeting of Scudder Variable Series II is the presence in person or by proxy of at least 30% of all the votes entitled to be cast of each series or class entitled to vote, or, where the vote is in the aggregate and not by series or class, at least 30% of all votes entitled to be cast at the meeting, irrespective of series or class.
The foregoing is a very general summary of certain provisions of the Declarations of Trust governing Balanced Portfolio and Total Return Portfolio. It is qualified in its entirety by reference to the charter documents themselves.
22
IV. INFORMATION ABOUT THE PROPOSED MERGER
General. The shareholders of Balanced Portfolio are being asked to approve a merger between Balanced Portfolio and Total Return Portfolio pursuant to an Agreement and Plan of Reorganization between the Funds (the “Agreement”), the form of which is attached to this Prospectus/Proxy Statement as Exhibit A.
The merger is structured as a transfer of all of the assets of Balanced Portfolio to Total Return Portfolio in exchange for the assumption by Total Return Portfolio of all of the liabilities of Balanced Portfolio and for the issuance and delivery to Balanced Portfolio of Merger Shares equal in aggregate value to the net value of the assets transferred to Total Return Portfolio.
After receipt of the Merger Shares, Balanced Portfolio will distribute the Merger Shares to its shareholders, in proportion to their existing shareholdings, in complete liquidation of Balanced Portfolio, and the legal existence of Balanced Portfolio as a series of the Trust will be terminated. Each shareholder of Balanced Portfolio will receive a number of full and fractional Merger Shares equal in value as of the Valuation Time (as defined below on page [ ]) to, the aggregate value of the shareholder’s Balanced Portfolio shares. Such shares will be held in an account with Total Return Portfolio identical in all material respects to the account currently maintained by Balanced Portfolio. Each Participating Insurance Company will then allocate its Merger Shares on a pro-rata basis among the Contract Owners in its Balanced Portfolio separate account (or in sub-accounts thereof). Unless a Contract Owner instructs his or her Participating Insurance Company otherwise, amounts that would have been allocated to Balanced Portfolio under an existing Contract will, following the merger, be allocated to Total Return Portfolio.
Prior to the date of the merger, Balanced Portfolio will sell any investments that are not consistent with the current investment objective, policies and restrictions of Total Return Portfolio, and declare a taxable distribution that, together with all previous distributions, will have the effect of distributing to shareholders all of its net investment income and net realized capital gains, if any, through the date of the merger. Contract Owners who invest in Balanced Portfolio through a variable annuity contract or variable life insurance policy will not be affected by such distributions as long as the Contracts qualify as annuity contracts under Section 72 of the Code and Treasury Regulations thereunder. DeIM has represented that as of March 4, 2005, Balanced Portfolio did not have any investments that were not consistent with the current investment objective, policies and restrictions of Total Return Portfolio.
The Trustees of the Trust have voted to approve the Agreement and the proposed merger and to recommend that shareholders of Balanced Portfolio also approve the merger. The actions contemplated by the Agreement and the related matters described therein will be consummated only if approved by the affirmative vote of the holders of a majority of the shares of Balanced Portfolio.
In the event that the merger does not receive the required shareholder approval, each Fund will continue to be managed as a separate fund in accordance with its current investment objectives and policies, and the Trustees of the Trust and of Scudder Variable Series II may consider such alternatives as may be in the best interests of each Fund’s respective shareholders.
23
Background and Trustees’ Considerations Relating to the Proposed Merger. DeAM first proposed the merger to the Trustees of Balanced Portfolio in November 2004. The merger was presented to the Trustees and considered by them as part of a broader program initiated by DeAM to consolidate its mutual fund lineup. DeAM advised the Trustees that this initiative was intended to:
| | • | | Eliminate redundancies within the Scudder fund family by reorganizing and merging certain funds; and |
| | • | | Focus DeAM’s investment resources on a core set of mutual funds that best meet investor needs. |
The Trustees of Balanced Portfolio conducted a thorough review of the potential implications of the merger on Balanced Portfolio’s shareholders. They were assisted in this review by their independent legal counsel. The Trustees met on several occasions to review and discuss the merger, both among themselves and with representatives of DeAM. In the course of their review, the Trustees requested and received substantial additional information.
On March 14, 2005, the Trustees of Balanced Portfolio, including all Trustees who are not “interested persons” of Balanced Portfolio (as defined by the 1940 Act) (“Disinterested Trustees”), approved the terms of the merger. The Trustees have also agreed to recommend that the merger be approved by the Fund’s shareholders.
In determining to recommend that the shareholders of Balanced Portfolio approve the merger, the Trustees considered, among others, the factors described below:
| | • | | The fees and expense ratios of the Funds, including comparisons between the expense ratio of Balanced Portfolio and the estimated operating expense ratio of the combined fund, and between the estimated operating expense ratios of the combined fund and other mutual funds with similar investment objectives. The Trustees noted that the estimated operating expense ratio of Class A of the combined fund is lower than Class A of Balanced Portfolio. The Trustees also considered DeAM’s commitment to cap the combined fund’s operating expenses for approximately a three year period at levels below Balanced Portfolio’s current operating expense ratio. The Trustees also gave extensive consideration to possible economies of scale that might be realized by DeAM in connection with the merger, as well as the other fund combinations included in DeAM’s restructuring proposal. The Trustees concluded that these economies were appropriately reflected in the fee and expense arrangements of Total Return Portfolio, as proposed to be revised upon completion of the merger. The Trustees also concluded that fees and expenses were fair and reasonable based on the anticipated quality of the services to be provided, the current expense ratios of Balanced Portfolio and the operating expense ratios of other mutual funds with similar investment objectives. |
| | • | | The terms and conditions of the merger. The Trustees concluded that the merger would not result in the dilution of shareholder interests and that the terms and conditions were fair and reasonable and consistent with industry practice. |
| | • | | The compatibility of Balanced Portfolio’s and Total Return Portfolio’s investment objectives, policies, restrictions and portfolios. Based on information provided by DeAM, the Trustees concluded that the investment objectives, policies and |
24
| | restrictions of Balanced Portfolio and Total Return Portfolio were similar and that the securities in Balanced Portfolio’s portfolio were compatible with the securities in Total Return Portfolio’s portfolio. The Trustees also considered that the merger would permit the shareholders of Balanced Portfolio to pursue similar investment goals in a larger fund. |
| | • | | The service features available to shareholders of Total Return Portfolio. The Trustees concluded that the services available to shareholders of Total Return Portfolio were substantially similar to those available to shareholders of Balanced Portfolio. |
| | • | | The costs to be borne by Balanced Portfolio, Total Return Portfolio and DeAM as a result of the merger. Based on representations by DeAM and the terms of the Agreement and Plan of Reorganization, the Trustees noted that DeAM would bear all expenses associated with the merger, including transaction costs associated with any related repositioning of the Fund’s portfolio. |
| | • | | Prospects for the combined fund to attract additional assets. Based on, among other factors, the size of the combined fund and the estimated expense ratio of the combined fund, the Trustees concluded that the combined fund would be more likely to attract additional assets than Balanced Portfolio and enjoy any related economies of scale. |
| | • | | The investment performance of Balanced Portfolio and Total Return Portfolio. The Trustees noted that both Funds had similar returns over the one, three and five year periods and that Balanced Portfolio had superior returns over the ten year period. |
| | • | | That DeIM has agreed to indemnify Total Return Portfolio against certain liabilities Total Return Portfolio may incur in connection with any litigation or regulatory action related to possible improper market timing or possible improper marketing and sales activity in Total Return Portfolio (see Section VI) so that the likelihood that the combined fund would suffer any loss is considered by Fund management to be remote. |
Based on all of the foregoing, the Trustees concluded that Balanced Portfolio’s participation in the merger would be in the best interests of Balanced Portfolio and would not dilute the interests of Balanced Portfolio’s existing shareholders. The Trustees of Balanced Portfolio, including the Disinterested Trustees, unanimously recommend that shareholders of the Fund approve the merger.
Agreement and Plan of Reorganization. The proposed merger will be governed by the Agreement, the form of which is attached as Exhibit A. The Agreement provides that Total Return Portfolio will acquire all of the assets of Balanced Portfolio solely in exchange for the assumption by Total Return Portfolio of all liabilities of Balanced Portfolio and for the issuance of Merger Shares equal in value to the value of the transferred assets net of assumed liabilities. The Merger Shares will be issued on the next full business day (the “Exchange Date”) following the time as of which the Funds’ shares are valued for determining net asset value for the merger (4:00 p.m. Eastern time on April 29, 2005, or such other date and time as may be agreed upon by the parties (the “Valuation Time”)). The following discussion of the Agreement is qualified in its entirety by the full text of the Agreement.
25
Balanced Portfolio will transfer all of its assets to Total Return Portfolio, and in exchange, Total Return Portfolio will assume all liabilities of Balanced Portfolio and deliver to Balanced Portfolio a number of full and fractional Merger Shares having an aggregate net asset value equal to the value of the assets of Balanced Portfolio, less the value of the liabilities of Balanced Portfolio assumed by Total Return Portfolio. Immediately following the transfer of assets on the Exchange Date, Balanced Portfolio will distribute pro rata to its shareholders of record as of the Valuation Time the full and fractional Merger Shares received by Balanced Portfolio, with Merger Shares being distributed to holders of shares of Balanced Portfolio. As a result of the proposed merger, each shareholder of Balanced Portfolio will receive a number of Merger Shares equal in aggregate value at the Valuation Time to the value of the Balanced Portfolio shares surrendered by the shareholder. This distribution will be accomplished by the establishment of accounts on the share records of Total Return Portfolio in the name of such Balanced Portfolio shareholders, each account representing the respective number of full and fractional Merger Shares due to the respective shareholder. New certificates for Merger Shares will not be issued.
The Trustees of the Trust and the Trustees of Scudder Variable Series II have determined that the proposed merger is in the best interests of their respective Fund and that the interests of their respective Fund’s shareholders will not be diluted as a result of the transactions contemplated by the Agreement.
The consummation of the merger is subject to the conditions set forth in the Agreement. The Agreement may be terminated and the merger abandoned (i) by mutual consent of Total Return Portfolio and Balanced Portfolio, (ii) by either party if the merger shall not be consummated by July 1, 2005 or (iii) if any condition set forth in the Agreement has not been fulfilled and has not been waived by the party entitled to its benefits, by such party.
If shareholders of Balanced Portfolio approve the merger, both Funds agree to coordinate their respective portfolios from the date of the Agreement up to and including the Exchange Date in order that, when the assets of Balanced Portfolio are added to the portfolio of Total Return Portfolio, the resulting portfolio will meet the investment objective, policies and restrictions of Total Return Portfolio.
Except for the trading costs associated with the coordination described above, the fees and expenses for the merger and related transactions are estimated to be $260,756. All fees and expenses, including legal and accounting expenses, portfolio transfer taxes (if any), the trading costs described above and any other expenses incurred in connection with the consummation of the merger and related transactions contemplated by the Agreement, will be borne by DeAM.
Description of the Merger Shares. Merger Shares will be issued to Balanced Portfolio’s shareholders in accordance with the Agreement as described above. Merger Shares will be Class A shares of Total Return Portfolio. Merger Shares have the same characteristics as Class A shares of Balanced Portfolio. Merger Shares will be treated as having been purchased on the same date and for the same price as the Balanced Portfolio shares for which they were exchanged. For more information on the characteristics of Merger Shares, please see the Total Return Portfolio prospectus, a copy of which is included with this Prospectus/Proxy Statement.
26
Under Massachusetts law, shareholders of Total Return Portfolio could, under certain circumstances, be held personally liable for the obligations of Total Return Portfolio. However, Total Return Portfolio’s Declaration of Trust disclaims shareholder liability for the acts or obligations of Total Return Portfolio and provides for indemnification for all losses and expenses of any shareholder held liable for the obligations of Total Return Portfolio. The indemnification and reimbursement discussed in the preceding sentence is to be made only out of the assets of Total Return Portfolio.
Federal Income Tax Consequences. As a condition to each Fund’s obligation to consummate the merger, each Fund will receive a tax opinion from Willkie Farr & Gallagher LLP (which opinion would be based on certain factual representations and certain customary assumptions), to the effect that, on the basis of the existing provisions of the U.S. Internal Revenue Code of 1986, as amended (the “Code”), current administrative rules and court decisions, for federal income tax purposes:
| | (i) | | the acquisition by Total Return Portfolio of all of the assets of Balanced Portfolio solely in exchange for Merger Shares and the assumption by Total Return Portfolio of all of Balanced Portfolio’s liabilities, followed by the distribution by Balanced Portfolio to its shareholders of Merger Shares in complete liquidation of Balanced Portfolio, all pursuant to the Agreement, constitutes a reorganization within the meaning of Section 368(a) of the Code, and Balanced Portfolio and Total Return Portfolio will each be a “party to a reorganization” within the meaning of Section 368(b) of the Code; |
| | (ii) | | under Section 361 of the Code, no gain or loss will be recognized by Balanced Portfolio upon the transfer of Balanced Portfolio’s assets to Total Return Portfolio in exchange for Merger Shares and the assumption of the Balanced Portfolio liabilities by Total Return Portfolio, or upon the distribution of the Merger Shares to Balanced Portfolio’s shareholders in liquidation of Balanced Portfolio; |
| | (iii) | | under Section 354 of the Code, no gain or loss will be recognized by shareholders of Balanced Portfolio on the receipt of Merger Shares solely in exchange for shares of Balanced Portfolio; |
| | (iv) | | under Section 358 of the Code, the aggregate basis of the Merger Shares received by each Balanced Portfolio shareholder will be the same as the aggregate basis of Balanced Portfolio shares exchanged therefor; |
| | (v) | | under Section 1223(1) of the Code, the holding periods of the Merger Shares received by each shareholder of Balanced Portfolio will include the holding periods of Balanced Portfolio shares exchanged therefor, provided that at the time of the reorganization Balanced Portfolio shares are held by such shareholders as a capital asset; |
| | (vi) | | under Section 1032 of the Code, Total Return Portfolio will not recognize gain or loss upon the receipt of assets of Balanced Portfolio in exchange for Merger Shares and the assumption by Total Return Portfolio of all of the liabilities of Balanced Portfolio; |
| | (vii) | | under Section 362(b) of the Code, the basis of the assets of Balanced Portfolio transferred to Total Return Portfolio in the reorganization will be the same in the hands of Total Return Portfolio as the basis of such assets in the hands of Balanced Portfolio immediately prior to the transfer; and |
27
| | (viii) | | under Section 1223(2) of the Code, the holding periods in the hands of Total Return Portfolio of the assets of Balanced Portfolio transferred to Total Return Portfolio will include the periods during which such assets were held by Balanced Portfolio. |
As long as the Contracts qualify as annuity contracts under Section 72 of the Code, and Treasury Regulations thereunder, the merger, whether or not treated as a tax-free reorganization, will not create any tax liability for Contract Owners. Contract Owners who choose to redeem or exchange their investments by surrendering their Contracts or initiating a partial withdrawal, however, may be subject to taxes and a 10% tax penalty. In addition, although it is not expected to affect Contract Owners, as a result of the merger each Fund may lose the benefit of certain tax losses that could have been used to offset or defer future gains of the combined fund.
Total Return Portfolio intends to distribute to Participating Insurance Companies its investment company taxable income and any net realized capital gains. Additional distributions may be made if necessary. All distributions, including dividends and capital gains distributions, will be reinvested in additional shares of Total Return Portfolio. If the Agreement is approved by Balanced Portfolio’s shareholders, Balanced Portfolio will pay its shareholders a distribution of all undistributed net investment income and undistributed realized net capital gains (after reduction by any capital loss carryforwards) prior to the Closing (as defined in the Agreement).
This description of the federal income tax consequences of the merger is made without regard to the particular facts and circumstances of any shareholder or Contract Owner. Shareholders and Contract Owners are urged to consult their own tax advisors as to the specific consequences to them of the merger, including the applicability and effect of state, local, non-U.S. and other tax laws.
28
Capitalization. The following table sets forth the unaudited capitalization of each Fund as of December 31, 2004 and of Total Return Portfolio on a pro forma combined basis, giving effect to the proposed acquisition of assets at net asset value as of that date:(1)
| | | | | | | | | | | | | |
| | | Total Return
Portfolio
| | Balanced
Portfolio
| | Pro Forma
Adjustments
| | | Total Return
Portfolio Pro Forma
Combined
|
Net Assets | | | | | | | | | | | | | |
Class A Shares | | $ | 621,557,263 | | $ | 130,377,260 | | $ | — | | | $ | 751,934,523 |
Class B Shares | | $ | 32,992,967 | | $ | — | | $ | — | | | $ | 32,992,967 |
| | |
|
| |
|
| |
|
|
| |
|
|
Total Net Assets | | $ | 654,550,230 | | $ | 130,377,260 | | $ | — | | | $ | 784,927,490 |
| | |
|
| |
|
| |
|
|
| |
|
|
Shares Outstanding | | | | | | | | | | | | | |
Class A Shares | | | 27,789,320 | | | 11,143,673 | | | (5,315,454 | ) | | | 33,617,539 |
Class B Shares | | | 1,477,597 | | | — | | | — | | | | 1,477,597 |
Net Asset Value Per Share | | | | | | | | | | | | | |
Class A Shares | | $ | 22.37 | | $ | 11.70 | | $ | — | | | $ | 22.37 |
Class B Shares | | $ | 22.33 | | $ | — | | $ | — | | | $ | 22.33 |
| 1) | | Assumes the merger had been consummated on December 31, 2004, and is for information purposes only. No assurance can be given as to how many shares of Total Return Portfolio will be received by the shareholders of Balanced Portfolio on the date the merger takes place, and the foregoing should not be relied upon to reflect the number of shares of Total Return Portfolio that actually will be received on or after such date. |
Unaudited pro forma combined financial statements of the Funds as of December 31, 2004 and for the twelve-month period then ended, are included in the Merger SAI. Because the Agreement provides that Total Return Portfolio will be the surviving fund following the merger, and because Total Return Portfolio’s investment objective and policies will remain unchanged, the pro forma combined financial statements reflect the transfer of the assets and liabilities of Balanced Portfolio to Total Return Portfolio as contemplated by the Agreement.
The Trustees of the Trust, including the Disinterested Trustees, unanimously recommend approval of the merger.
29
V. INFORMATION ABOUT VOTING AND THE SPECIAL SHAREHOLDER MEETING
General. This Prospectus/Proxy Statement is furnished in connection with the proposed merger of Balanced Portfolio into Total Return Portfolio and the solicitation of proxies by and on behalf of the Trustees of the Trust for use at the Special Meeting of Balanced Portfolio shareholders (the “Meeting”). The Meeting is to be held on April 15, 2005 at 9:00 a.m. Eastern time, at the offices of DeIM, 345 Park Avenue, 27th Floor, New York, New York 10154, or at such later time as is made necessary by adjournment. The Notice of the Special Meeting, the combined Prospectus/Proxy Statement and the enclosed form of proxy or voting instruction form are being mailed to investors on or about [mailing date].
As of February 9, 2005, Balanced Portfolio had the following shares outstanding:
| | |
Share Class
| | Number of Shares
|
Class A | | 10,961,757.515 |
Only shareholders of record on February 9, 2005 will be entitled to notice of and to vote at the Meeting. Each share is entitled to one vote, with fractional shares voting proportionally.
The Trustees of the Trust know of no matters other than those set forth herein to be brought before the Meeting. If, however, any other matters properly come before the Meeting, it is the Trustees’ intention that proxies will be voted on such matters in accordance with the judgment of the persons named in the form of proxy.
Required Vote. Proxies are being solicited from Balanced Portfolio’s shareholders by the Trust’s Trustees for the Meeting. Unless revoked, all valid proxies will be voted in accordance with the specification thereon or, in the absence of specification, FOR approval of the Agreement. The transactions contemplated by the Agreement will be consummated only if approved by the affirmative vote of (A) 67% or more of the shares of Balanced Portfolio present at the meeting, if the holders of more than 50% of the outstanding shares are present in person or by proxy or (B) more than 50% of the outstanding shares of Balanced Portfolio, whichever is less.
Record Date, Quorum and Method of Tabulation. Shareholders of record of Balanced Portfolio at the close of business on February 9, 2005 (the “Record Date”) will be entitled to vote at the Meeting or any adjournment thereof. The holders of at least one-third of the shares of Balanced Portfolio outstanding at the close of business on the Record Date present in person or represented by proxy will constitute a quorum for the transaction of business at the Meeting.
Votes cast by proxy or in person at the Meeting will be counted by persons appointed by Balanced Portfolio as tellers for the Meeting. The tellers will count the total number of votes cast “for” approval of the proposal for purposes of determining whether sufficient affirmative votes have been cast. The tellers will count shares represented by proxies that reflect abstentions as shares that are present and entitled to vote on the matter for purposes of determining the presence of a quorum, but will have the effect of a negative vote on the proposal. Shares attributable to amounts retained by each Participating Insurance Company will be voted in the same proportion as voting instructions received from Contract Owners. Accordingly, there are not expected to be any “broker non-votes.”
30
Share Ownership. As of February 9, 2005, the officers of and Trustees governing each Fund as a group beneficially owned less than 1% of the outstanding shares of such Fund. To the best of the knowledge of Balanced Portfolio, the following shareholders owned of record or beneficially 5% or more of the outstanding shares of Balanced Portfolio as of such date:
| | | | | |
Class
| | Shareholder Name and Address
| | Percentage Owned
| |
| A | | Allmerica Life Ins Co 440 Lincoln St Worcester, MA 01653-0002 | | 33.65 | % |
| | |
| A | | Lincoln Benefit Life Annuity-270 Attn: Accting Financial Control Team 544 Lakeview Pkwy Vernon Hills, IL 60061-1826 | | 14.99 | % |
| | |
| A | | Safeco-130 Mutual Fund Controllers Separate Accounts Accounting 4854 154th Pl NE Redmond, WA 98052-9664 | | 40.46 | % |
To the best of the knowledge of Total Return Portfolio, the following shareholders owned of record or beneficially 5% or more of the outstanding shares of any class of Total Return Portfolio as of February 9, 2005:
| | | | | |
| Class | | Shareholder Name and Address
| | Percentage Owned
| |
| A | | Allmerica Life SVSII 440 Lincoln St Worcester, MA 01653-0002 | | 31.83 | % |
| | |
| A | | Kemper Investors Life Windy Point II 1600 McConnor Pkwy Schaumburg, IL 60196-6800 | | 47.96 | % |
| | |
| A | | Zurich Destinations Farmers SVSII C/O Kilico Attn: Investment Accounting LL-2W PO Box 19097 Greenville, SC 29602-9097 | | 19.42 | % |
| | |
| B | | The Manufactures Life Ins Co (USA) 500 Boylston St Ste 400 Boston, MA 02116-3739 | | 80.19 | % |
| | |
| B | | Travelers Life & Annuity Company 1 Cityplace Hartford, CT 06103 | | 10.88 | % |
| | |
| B | | Travelers Insurance Company Attn: Shareholder Accounting Unit PO Box 990027 Hartford, CT 06199-0027 | | 8.48 | % |
31
Solicitation of Proxies. As discussed above, shares of Balanced Portfolio are offered only to Participating Insurance Companies to fund benefits under their Contracts. Therefore, all shares of Balanced Portfolio are held by separate accounts, or sub-accounts thereof, of various Participating Insurance Companies. These shares are owned by the Participating Insurance Companies as depositors for their respective Contracts issued to individual Contract Owners or to a group (e.g., a defined benefit plan) in which Contract Owners participate. Contract Owners have the right to instruct the Participating Insurance Companies on how to vote the shares related to their interests through their Contracts (i.e., pass-through voting). A Participating Insurance Company must vote the shares of Balanced Portfolio held in its name as directed. In the absence of voting directions on any voting instruction form that is signed and returned, the Participating Insurance Company will vote the interest represented thereby in favor of the proposal. If a Participating Insurance Company does not receive voting instructions for all of the shares of Balanced Portfolio held under the Contracts, it will vote all of the shares in the relevant separate accounts with respect to the proposal, for, against, or abstaining, in the same proportion as the shares of Balanced Portfolio for which it has received instructions from Contract Owners (i.e., echo voting). This Prospectus/Proxy Statement is used to solicit voting instructions from Contract Owners, as well as to solicit proxies from the Participating Insurance Companies and the actual shareholders of Balanced Portfolio. All persons entitled to direct the voting of shares, whether or not they are shareholders, are described as voting for purposes of this Prospectus/Proxy Statement.
In addition to soliciting proxies by mail, certain officers and representatives of Balanced Portfolio, officers and employees of DeAM and certain financial services firms and their representatives, who will receive no extra compensation for their services, may solicit proxies by telephone, by telegram or personally.
All properly executed proxies received in time for the Meeting will be voted as specified in the proxy or, if no specification is made, in favor of the proposal.
Computershare Fund Services (“Computershare”) has been engaged to assist in the solicitation of proxies, at an estimated cost of $3,500. As the Meeting date approaches, certain shareholders of Balanced Portfolio may receive a telephone call from a representative of Computershare if their votes have not yet been received. Authorization to permit Computershare to execute proxies may be obtained by telephonically or electronically transmitted instructions from shareholders of Balanced Portfolio. Proxies that are obtained telephonically or through the Internet will be recorded in accordance with the procedures described below. The Trustees believe that these procedures are reasonably designed to ensure that both the identity of the shareholder casting the vote and the voting instructions of the shareholder are accurately determined.
In all cases where a telephonic proxy is solicited, the Computershare representative is required to ask for each shareholder’s full name and address, or zip code, or both, and to confirm that the shareholder has received the proxy materials in the mail. If the shareholder is a corporation or other entity, the Computershare representative is required to ask for the person’s title and confirmation that the person is authorized to direct the voting of the shares. If the information solicited agrees with the information provided to Computershare, then the Computershare representative has the
32
responsibility to explain the process, read the proposal on the proxy card, and ask for the shareholder’s instructions on the proposal. Although the Computershare representative is permitted to answer questions about the process, he or she is not permitted to recommend to the shareholder how to vote, other than to read any recommendation set forth in this Prospectus/Proxy Statement. Computershare will record the shareholder’s instructions on the card. Within 72 hours, the shareholder will be sent a letter or mailgram to confirm his or her vote and asking the shareholder to call Computershare immediately if his or her instructions are not correctly reflected in the confirmation.
Please see the instructions on your proxy card for telephone touch-tone voting and Internet voting. Shareholders will have an opportunity to review their voting instructions and make any necessary changes before submitting their voting instructions and terminating their telephone call or Internet link. Shareholders who vote through the Internet, in addition to confirming their voting instructions prior to submission, will also receive an e-mail confirming their instructions upon request.
If a shareholder wishes to participate in the Meeting, but does not wish to give a proxy by telephone or electronically, the shareholder may still submit the proxy card originally sent with the Prospectus/Proxy Statement or attend in person. Should shareholders require additional information regarding the proxy or replacement proxy card, they may contact Computershare toll-free at 1-877-288-6285. Any proxy given by a shareholder is revocable until voted at the Meeting.
Persons holding shares as nominees will, upon request, be reimbursed for their reasonable expenses in soliciting instructions from their principals. The cost of preparing, printing and mailing the enclosed proxy card and/or voting instruction form and Prospectus/Proxy Statement, and all other costs incurred in connection with the solicitation of proxies for Balanced Portfolio, including any additional solicitation made by letter, telephone or telegraph, will be paid by DeAM.
Revocation of Voting Instructions. Proxies, including proxies given by telephone or over the Internet, may be revoked at any time before they are voted either (i) by a written revocation received by the Secretary of the Trust at Two International Place, Boston, MA 02110, (ii) by properly executing a later-dated proxy that is received by the Fund at or prior to the Meeting or (iii) by attending the Meeting and voting in person. Merely attending the Meeting without voting, however, will not revoke a previously submitted proxy. Only a shareholder may execute or revoke a proxy. Contract Owners should consult their Participating Insurance Company regarding their ability to revoke voting instructions after such instructions have been provided to the Participating Insurance Company.
Adjournment. If sufficient votes in favor of the proposal set forth in the Notice of the Special Meeting are not received by the time scheduled for the Meeting, the persons named as proxies may propose adjournments of the Meeting for a reasonable time after the date set for the original meeting to permit further solicitation of proxies. Any adjournment will require the affirmative vote of a majority of the votes cast on the question in person or by proxy at the session of the Meeting to be adjourned. The persons named as proxies will vote in favor of such adjournment those proxies which they are entitled to vote in favor of the proposal. They will vote against any such adjournment those proxies required to be voted against the proposal.
33
VI. REGULATORY AND LITIGATION MATTERS
Since at least July 2003, federal, state and industry regulators have been conducting ongoing inquiries and investigations (“inquiries”) into the mutual fund industry, and have requested information from numerous mutual fund companies, including Scudder Investments. It is not possible to determine what the outcome of these inquiries will be or what the effect, if any, would be on the funds or their advisors. Publicity about mutual fund practices arising from these industry-wide inquiries serves as the general basis of a number of private lawsuits against the Scudder funds. These lawsuits, which previously have been reported in the press, involve purported class action and derivative lawsuits, making various allegations and naming as defendants various persons, including certain Scudder funds, the funds’ investment advisors and their affiliates, certain individuals, including in some cases fund Trustees/Directors, officers, and other parties. Each Scudder fund’s investment advisor has agreed to indemnify the applicable Scudder funds in connection with these lawsuits, or other lawsuits or regulatory actions that may be filed making allegations similar to these lawsuits regarding market timing, revenue sharing, fund valuation or other subjects arising from or related to the pending inquiries. Based on currently available information, the funds’ investment advisors believe the likelihood that the pending lawsuits will have a material adverse financial impact on a Scudder fund is remote and such actions are not likely to materially affect their ability to perform under their investment management agreements with the Scudder funds.
34
EXHIBIT A
FORM OF AGREEMENT AND PLAN OF REORGANIZATION
THIS AGREEMENT AND PLAN OF REORGANIZATION (the “Agreement”) is made as of this [ ] day of [ ], 2005, by and among Scudder Variable Series II (the “Acquiring Trust”), a Massachusetts business trust, on behalf of Scudder Total Return Portfolio (the “Acquiring Fund”), a separate series of the Acquiring Trust; Scudder Variable Series I (the “Acquired Trust” and, together with the Acquiring Trust, each a “Trust” and collectively the “Trusts”), a Massachusetts business trust, on behalf of Balanced Portfolio (the “Acquired Fund” and, together with the Acquiring Fund, each a “Fund” and collectively the “Funds”); and Deutsche Investment Management Americas Inc. (“DeIM”), investment adviser for the Funds (for purposes of section 10.2 of the Agreement only). The principal place of business of the Acquiring Trust is 222 South Riverside Plaza, Chicago, Illinois 60606. The principal place of business of the Acquired Trust is Two International Place, Boston, Massachusetts 02110.
This Agreement is intended to be and is adopted as a plan of reorganization and liquidation within the meaning of Section 368(a) of the Internal Revenue Code of 1986, as amended (the “Code”). The reorganization (the “Reorganization”) will consist of the transfer of all of the assets of the Acquired Fund to the Acquiring Fund in exchange solely for Class A voting shares of beneficial interest (no par value) of the Acquiring Fund (the “Acquiring Fund Shares”), the assumption by the Acquiring Fund of all of the liabilities of the Acquired Fund and the distribution of the Acquiring Fund Shares to the Class A shareholders of the Acquired Fund in complete liquidation of the Acquired Fund as provided herein, all upon the terms and conditions hereinafter set forth in this Agreement.
NOW, THEREFORE, in consideration of the premises and of the covenants and agreements hereinafter set forth, the parties hereto covenant and agree as follows:
| 1. | | Transfer of Assets of the Acquired Fund to the Acquiring Fund in Consideration For Acquiring Fund Shares, the Assumption of All Acquired Fund Liabilities and the Liquidation of the Acquired Fund |
1.1 Subject to the terms and conditions herein set forth and on the basis of the representations and warranties contained herein, the Acquired Fund agrees to transfer to the Acquiring Fund all of the Acquired Fund’s assets as set forth in section 1.2, and the Acquiring Fund agrees in consideration therefor (i) to deliver to the Acquired Fund that number of full and fractional Class A Acquiring Fund Shares determined by dividing the value of the Acquired Fund’s assets net of any liabilities of the Acquired Fund with respect to the Class A shares of the Acquired Fund, computed in the manner and as of the time and date set forth in section 2.1, by the net asset value of one Acquiring Fund Share of the corresponding class, computed in the manner and as of the time and date set forth in section 2.2; and (ii) to assume all of the liabilities of the Acquired Fund, including, but not limited to, any deferred compensation to the Acquired Trust Board members. All Acquiring Fund Shares delivered to the Acquired Fund shall be delivered at net asset value without a sales load, commission or other similar fee being imposed. Such transactions shall take place at the closing provided for in section 3.1 (the “Closing”).
A-1
1.2 The assets of the Acquired Fund to be acquired by the Acquiring Fund (the “Assets”) shall consist of all assets, including, without limitation, all cash, cash equivalents, securities, commodities and futures interests and dividends or interest or other receivables that are owned by the Acquired Fund and any deferred or prepaid expenses shown on the unaudited statement of assets and liabilities of the Acquired Fund prepared as of the effective time of the Closing in accordance with accounting principles generally accepted in the United States of America (“GAAP”) applied consistently with those of the Acquired Fund’s most recent audited statement of assets and liabilities. The Assets shall constitute at least 90% of the fair market value of the net assets, and at least 70% of the fair market value of the gross assets, held by the Acquired Fund immediately before the Closing (excluding for these purposes assets used to pay the dividends and other distributions paid pursuant to section 1.4).
1.3 The Acquired Fund will endeavor, to the extent practicable, to discharge all of its liabilities and obligations that are accrued prior to the Closing Date as defined in section 3.1.
1.4 On or as soon as practicable prior to the Closing Date as defined in section 3.1, the Acquired Fund will declare and pay to its shareholders of record one or more dividends and/or other distributions so that it will have distributed substantially all of its investment company taxable income (computed without regard to any deduction for dividends paid) and realized net capital gain, if any, for the current taxable year through the Closing Date.
1.5 Immediately after the transfer of Assets provided for in section 1.1, the Acquired Fund will distribute to the Acquired Fund’s shareholders of record (the “Acquired Fund Shareholders”), determined as of the Valuation Time (as defined in section 2.1), on a pro rata basis, the Acquiring Fund Shares received by the Acquired Fund pursuant to section 1.1 and will completely liquidate. Such distribution and liquidation will be accomplished by the transfer of the Acquiring Fund Shares then credited to the account of the Acquired Fund on the books of the Acquiring Fund to open accounts on the share records of the Acquiring Fund in the names of the Acquired Fund Shareholders. The Acquiring Fund shall have no obligation to inquire as to the validity, propriety or correctness of such records, but shall assume that such transaction is valid, proper and correct. The aggregate net asset value of Class A Acquiring Fund Shares to be so credited to the Class A Acquired Fund Shareholders shall be equal to the aggregate net asset value of the Acquired Fund shares owned by such shareholders as of the Valuation Time. All issued and outstanding shares of the Acquired Fund will simultaneously be cancelled on the books of the Acquired Fund, although share certificates representing interests in Class A shares of the Acquired Fund will represent a number of Acquiring Fund Shares after the Closing Date as determined in accordance with section 2.3. The Acquiring Fund will not issue certificates representing Acquiring Fund Shares.
1.6 Ownership of Acquiring Fund Shares will be shown on the books of the Acquiring Fund. Shares of the Acquiring Fund will be issued in the manner described in the Acquiring Fund’s then-current prospectus and statement of additional information.
A-2
1.7 Any reporting responsibility of the Acquired Fund including, without limitation, the responsibility for filing of regulatory reports, tax returns, or other documents with the Securities and Exchange Commission (the “Commission”), any state securities commission, and any federal, state or local tax authorities or any other relevant regulatory authority, is and shall remain the responsibility of the Acquired Fund.
1.8 All books and records of the Acquired Fund, including all books and records required to be maintained under the Investment Company Act of 1940, as amended (the “1940 Act”), and the rules and regulations thereunder, shall be available to the Acquiring Fund from and after the Closing Date and shall be turned over to the Acquiring Fund as soon as practicable following the Closing Date.
2.1 The value of the Assets and the liabilities of the Acquired Fund shall be computed as of the close of regular trading on The New York Stock Exchange, Inc. (the “NYSE”) on the business day immediately preceding the Closing Date, as defined in section 3.1 (the “Valuation Time”) after the declaration and payment of any dividends and/or other distributions on that date, using the valuation procedures set forth in the Acquiring Trust’s Declaration of Trust, as amended, and the Acquiring Fund’s then-current prospectus or statement of additional information, copies of which have been delivered to the Acquired Fund.
2.2 The net asset value of a Class A Acquiring Fund Share shall be the net asset value per share computed with respect to that class as of the Valuation Time using the valuation procedures referred to in section 2.1.
2.3 The number of Class A Acquiring Fund Shares to be issued (including fractional shares, if any) in consideration for the Assets shall be determined by dividing the value of the Assets net of liabilities of a Class A share of the Acquired Fund determined in accordance with section 2.1 by the net asset value of a Class A Acquiring Fund Share determined in accordance with section 2.2.
2.4 All computations of value hereunder shall be made by or under the direction of each Fund’s respective accounting agent, if applicable, in accordance with its regular practice and the requirements of the 1940 Act and shall be subject to confirmation by each Fund’s respective Independent Registered Public Accounting Firm upon the reasonable request of the other Fund.
| 3. | | Closing and Closing Date |
3.1 The Closing of the transactions contemplated by this Agreement shall be May 2, 2005, or such later date as the parties may agree in writing (the “Closing Date”). All acts taking place at the Closing shall be deemed to take place simultaneously as of 9:00
A-3
a.m., Eastern time, on the Closing Date, unless otherwise agreed to by the parties. The Closing shall be held at the offices of counsel to the Acquiring Fund, or at such other place and time as the parties may agree.
3.2 The Acquired Fund shall deliver to the Acquiring Fund on the Closing Date a schedule of Assets.
3.3 State Street Bank and Trust Company (“State Street”), custodian for the Acquired Fund, shall deliver at the Closing a certificate of an authorized officer stating that (a) the Assets shall have been delivered in proper form to State Street, custodian for the Acquiring Fund, prior to or on the Closing Date and (b) all necessary taxes in connection with the delivery of the Assets, including all applicable federal and state stock transfer stamps, if any, have been paid or provision for payment has been made. The Acquired Fund’s portfolio securities represented by a certificate or other written instrument shall be presented by the custodian for the Acquired Fund to the custodian for the Acquiring Fund for examination no later than five business days preceding the Closing Date and transferred and delivered by the Acquired Fund as of the Closing Date by the Acquired Fund for the account of Acquiring Fund duly endorsed in proper form for transfer in such condition as to constitute good delivery thereof. The Acquired Fund’s portfolio securities and instruments deposited with a securities depository, as defined in Rule 17f-4 under the 1940 Act, shall be delivered as of the Closing Date by book entry in accordance with the customary practices of such depositories and the custodian for the Acquiring Fund. The cash to be transferred by the Acquired Fund shall be delivered by wire transfer of federal funds on the Closing Date.
3.4 DST Systems, Inc. (“DST”), (or its designee) as transfer agent (or subtransfer agent) for the Acquired Fund, on behalf of the Acquired Fund, shall deliver at the Closing a certificate of an authorized officer stating that its records contain the names and addresses of the Acquired Fund Shareholders and the number and percentage ownership (to three decimal places) of outstanding Class A Acquired Fund shares owned by each such shareholder immediately prior to the Closing. The Acquiring Fund shall issue and deliver a confirmation evidencing the Acquiring Fund Shares to be credited on the Closing Date to the Acquired Fund or provide evidence satisfactory to the Acquired Fund that such Acquiring Fund Shares have been credited to the Acquired Fund’s account on the books of the Acquiring Fund. At the Closing, each party shall deliver to the other such bills of sale, checks, assignments, share certificates, if any, receipts or other documents as such other party or its counsel may reasonably request to effect the transactions contemplated by this Agreement.
3.5 In the event that immediately prior to the Valuation Time (a) the NYSE or another primary trading market for portfolio securities of the Acquiring Fund or the Acquired Fund shall be closed to trading or trading thereupon shall be restricted, or (b) trading or the reporting of trading on such Exchange or elsewhere shall be disrupted so that, in the judgment of the Board members of either party to this Agreement, accurate appraisal of the value of the net assets with respect to the Class A shares of the Acquiring Fund or the Acquired Fund is impracticable, the Closing Date shall be postponed until the first business day after the day when trading shall have been fully resumed and reporting shall have been restored.
A-4
3.6 The liabilities of the Acquired Fund shall include all of the Acquired Fund’s liabilities, debts, obligations, and duties of whatever kind or nature, whether absolute, accrued, contingent, or otherwise, whether or not arising in the ordinary course of business, whether or not determinable at the Closing Date, and whether or not specifically referred to in this Agreement including but not limited to any deferred compensation to the Acquired Trust’s Board members.
| 4. | | Representations and Warranties |
4.1 The Acquired Trust, on behalf of the Acquired Fund, represents and warrants to the Acquiring Fund as follows:
(a) The Acquired Trust is a voluntary association with transferable shares commonly referred to as a Massachusetts business trust duly organized and validly existing under the laws of The Commonwealth of Massachusetts with power under the Acquired Trust’s Declaration of Trust, as amended, to own all of its properties and assets and to carry on its business as it is now being conducted and, subject to approval of shareholders of the Acquired Fund, to carry out the Agreement. The Acquired Fund is a separate series of the Acquired Trust duly designated in accordance with the applicable provisions of the Acquired Trust’s Declaration of Trust. The Acquired Trust and Acquired Fund are qualified to do business in all jurisdictions in which they are required to be so qualified, except jurisdictions in which the failure to so qualify would not have a material adverse effect on the Acquired Trust or Acquired Fund. The Acquired Fund has all material federal, state and local authorizations necessary to own all of the properties and assets and to carry on its business as now being conducted, except authorizations which the failure to so obtain would not have a material adverse effect on the Acquired Fund;
(b) The Acquired Trust is registered with the Commission as an open-end management investment company under the 1940 Act, and such registration is in full force and effect and the Acquired Fund is in compliance in all material respects with the 1940 Act and the rules and regulations thereunder;
(c) No consent, approval, authorization, or order of any court or governmental authority is required for the consummation by the Acquired Fund of the transactions contemplated herein, except such as have been obtained under the Securities Act of 1933, as amended (the “1933 Act”), the Securities Exchange Act of 1934, as amended (the “1934 Act”), and the 1940 Act and such as may be required by state securities laws;
(d) The Acquired Trust is not, and the execution, delivery and performance of this Agreement by the Acquired Trust will not result (i) in violation of Massachusetts law or of the Acquired Trust’s Declaration of Trust, as amended, or By-Laws, (ii) in a violation or breach of, or constitute a default under, any material agreement, indenture, instrument, contract, lease or other undertaking to which the Acquired Fund is a party or by which it is bound, and the execution, delivery and performance of this Agreement by the Acquired Fund will not result in the acceleration of any obligation, or the imposition of any penalty, under any agreement, indenture, instrument, contract, lease, judgment or decree to which the Acquired Fund is a party or by which it is bound, or (iii) in the creation or imposition of any lien, charge or encumbrance on any property or assets of the Acquired Fund;
A-5
(e) Other than as disclosed on a schedule provided by the Acquired Fund, no material litigation or administrative proceeding or investigation of or before any court or governmental body is presently pending or to its knowledge threatened against the Acquired Fund or any properties or assets held by it. The Acquired Fund knows of no facts which might form the basis for the institution of such proceedings which would materially and adversely affect its business, other than as disclosed in the foregoing schedule, and is not a party to or subject to the provisions of any order, decree or judgment of any court or governmental body which materially and adversely affects its business or its ability to consummate the transactions herein contemplated;
(f) The Statements of Assets and Liabilities, Operations, and Changes in Net Assets, the Financial Highlights, and the Investment Portfolio of the Acquired Fund at and for the fiscal year ended December 31, 2004, have been audited by PricewaterhouseCoopers LLP, Independent Registered Public Accounting Firm, and are in accordance with GAAP consistently applied, and such statements (a copy of each of which has been furnished to the Acquiring Fund) present fairly, in all material respects, the financial position of the Acquired Fund as of such date in accordance with GAAP and there are no known contingent liabilities of the Acquired Fund required to be reflected on a balance sheet (including the notes thereto) in accordance with GAAP as of such date not disclosed therein;
(g) Since December 31, 2004, there has not been any material adverse change in the Acquired Fund’s financial condition, assets, liabilities or business other than changes occurring in the ordinary course of business, or any incurrence by the Acquired Fund of indebtedness maturing more than one year from the date such indebtedness was incurred except as otherwise disclosed to and accepted in writing by the Acquiring Fund. For purposes of this subsection (g), a decline in net asset value per share of the Acquired Fund due to declines in market values of securities in the Acquired Fund’s portfolio, the discharge of Acquired Fund liabilities, or the redemption of Acquired Fund shares by Acquired Fund Shareholders shall not constitute a material adverse change;
(h) At the date hereof and at the Closing Date, all federal and other tax returns and reports of the Acquired Fund required by law to have been filed by such dates (including any extensions) shall have been filed and are or will be correct in all material respects, and all federal and other taxes shown as due or required to be shown as due on said returns and reports shall have been paid or provision shall have been made for the payment thereof, and, to the best of the Acquired Fund’s knowledge, no such return is currently under audit and no assessment has been asserted with respect to such returns;
(i) For each taxable year of its operation (including the taxable year ending on the Closing Date), the Acquired Fund has met the requirements of Subchapter M of the Code for qualification as a regulated investment company and has elected to be treated as such, has been eligible to and has computed its federal income tax under Section 852 of the Code, and will have distributed all of its investment company taxable income and net capital gain (as defined in the Code) that has accrued through the Closing Date;
(j) All issued and outstanding shares of the Acquired Fund (i) have been offered and sold in every state and the District of Columbia in compliance in all material respects with applicable registration requirements of the 1933 Act and
A-6
state securities laws, (ii) are, and on the Closing Date will be, duly and validly issued and outstanding, fully paid and non-assessable and not subject to preemptive or dissenter’s rights (recognizing that, under Massachusetts law, Acquired Fund shareholders, under certain circumstances, could be held personally liable for the obligations of the Acquired Fund), and (iii) will be held at the time of the Closing by the persons and in the amounts set forth in the records of DST, as provided in section 3.4. The Acquired Fund does not have outstanding any options, warrants or other rights to subscribe for or purchase any of the Acquired Fund shares, nor is there outstanding any security convertible into any of the Acquired Fund shares;
(k) At the Closing Date, the Acquired Fund will have good and marketable title to the Acquired Fund’s assets to be transferred to the Acquiring Fund pursuant to section 1.2 and full right, power, and authority to sell, assign, transfer and deliver such assets hereunder free of any liens or other encumbrances, except those liens or encumbrances as to which the Acquiring Fund has received notice at or prior to the Closing, and upon delivery and payment for such assets, the Acquiring Fund will acquire good and marketable title thereto, subject to no restrictions on the full transfer thereof, including such restrictions as might arise under the 1933 Act and the 1940 Act, except those restrictions as to which the Acquiring Fund has received notice and necessary documentation at or prior to the Closing;
(l) The execution, delivery and performance of this Agreement will have been duly authorized prior to the Closing Date by all necessary action on the part of the Board members of the Acquired Trust (including the determinations required by Rule 17a-8(a) under the 1940 Act), and, subject to the approval of the Acquired Fund Shareholders, this Agreement constitutes a valid and binding obligation of the Acquired Trust, on behalf of the Acquired Fund, enforceable in accordance with its terms, subject, as to enforcement, to bankruptcy, insolvency, fraudulent transfer, reorganization, moratorium and other laws relating to or affecting creditors’ rights and to general equity principles;
(m) The information to be furnished by the Acquired Fund for use in applications for orders, registration statements or proxy materials or for use in any other document filed or to be filed with any federal, state or local regulatory authority (including the National Association of Securities Dealers, Inc. (the “NASD”)), which may be necessary in connection with the transactions contemplated hereby, shall be accurate and complete in all material respects and shall comply in all material respects with federal securities and other laws and regulations applicable thereto;
(n) The current prospectuses and statement of additional information of the Acquired Fund conform in all material respects to the applicable requirements of the 1933 Act and the 1940 Act and the rules and regulations of the Commission thereunder and do not include any untrue statement of a material fact or omit to state any material fact required to be stated therein or necessary to make the statements therein, in light of the circumstances under which they were made, not materially misleading; and
(o) The Registration Statement referred to in section 5.7, insofar as it relates to the Acquired Fund, will, on the effective date of the Registration Statement and on the Closing Date, (i) comply in all material respects with the provisions and regulations of the 1933 Act, the 1934 Act and the 1940 Act, as applicable, and (ii)
A-7
not contain any untrue statement of a material fact or omit to state a material fact required to be stated therein or necessary to make the statements therein, in light of the circumstances under which such statements are made, not materially misleading; provided, however, that the representations and warranties in this section shall not apply to statements in or omissions from the Registration Statement made in reliance upon and in conformity with information that was furnished or should have been furnished by the Acquiring Fund for use therein.
4.2 The Acquiring Trust, on behalf of the Acquiring Fund, represents and warrants to the Acquired Fund as follows:
(a) The Acquiring Trust is a voluntary association with transferable shares commonly referred to as a Massachusetts business trust duly organized and validly existing under the laws of The Commonwealth of Massachusetts with power under the Acquiring Trust’s Declaration of Trust, as amended, to own all of its properties and assets and to carry on its business as it is now being conducted and to carry out the Agreement. The Acquiring Fund is a separate series of the Acquiring Trust duly designated in accordance with the applicable provisions of the Acquiring Trust’s Declaration of Trust. The Acquiring Trust and Acquiring Fund are qualified to do business in all jurisdictions in which they are required to be so qualified, except jurisdictions in which the failure to so qualify would not have a material adverse effect on the Acquiring Trust or Acquiring Fund. The Acquiring Fund has all material federal, state and local authorizations necessary to own all of the properties and assets and to carry on its business as now being conducted, except authorizations which the failure to so obtain would not have a material adverse effect on the Acquiring Fund;
(b) The Acquiring Trust is registered with the Commission as an open-end management investment company under the 1940 Act, and such registration is in full force and effect and the Acquiring Fund is in compliance in all material respects with the 1940 Act and the rules and regulations thereunder;
(c) No consent, approval, authorization, or order of any court or governmental authority is required for the consummation by the Acquiring Fund of the transactions contemplated herein, except such as have been obtained under the 1933 Act, the 1934 Act and the 1940 Act and such as may be required by state securities laws;
(d) The Acquiring Trust is not, and the execution, delivery and performance of this Agreement by the Acquiring Trust will not result (i) in violation of Massachusetts law or of the Acquiring Trust’s Declaration of Trust, as amended, or By-Laws, (ii) in a violation or breach of, or constitute a default under, any material agreement, indenture, instrument, contract, lease or other undertaking known to counsel to which the Acquiring Fund is a party or by which it is bound, and the execution, delivery and performance of this Agreement by the Acquiring Fund will not result in the acceleration of any obligation, or the imposition of any penalty, under any agreement, indenture, instrument, contract, lease, judgment or decree to which the Acquiring Fund is a party or by which it is bound, or (iii) in the creation or imposition of any lien, charge or encumbrance on any property or assets of the Acquiring Fund;
(e) Other than as disclosed on a schedule provided by the Acquiring Fund, no material litigation or administrative proceeding or investigation of or before any
A-8
court or governmental body is presently pending or to its knowledge threatened against the Acquiring Fund or any properties or assets held by it. The Acquiring Fund knows of no facts which might form the basis for the institution of such proceedings which would materially and adversely affect its business, other than as disclosed in the foregoing schedule, and is not a party to or subject to the provisions of any order, decree or judgment of any court or governmental body which materially and adversely affects its business or its ability to consummate the transactions herein contemplated;
(f) The Statements of Assets and Liabilities, Operations, and Changes in Net Assets, the Financial Highlights, and the Investment Portfolio of the Acquiring Fund at and for the fiscal year ended December 31, 2004, have been audited by Ernst & Young LLP, Independent Registered Public Accounting Firm, and are in accordance with GAAP consistently applied, and such statements (a copy of each of which has been furnished to the Acquired Fund) present fairly, in all material respects, the financial position of the Acquiring Fund as of such date in accordance with GAAP, and there are no known contingent liabilities of the Acquiring Fund required to be reflected on a balance sheet (including the notes thereto) in accordance with GAAP as of such date not disclosed therein;
(g) Since December 31, 2004, there has not been any material adverse change in the Acquiring Fund’s financial condition, assets, liabilities or business other than changes occurring in the ordinary course of business, or any incurrence by the Acquiring Fund of indebtedness maturing more than one year from the date such indebtedness was incurred except as otherwise disclosed to and accepted in writing by the Acquired Fund. For purposes of this subsection (g), a decline in net asset value per share of the Acquiring Fund due to declines in market values of securities in the Acquiring Fund’s portfolio, the discharge of Acquiring Fund liabilities, or the redemption of Acquiring Fund shares by Acquiring Fund shareholders shall not constitute a material adverse change;
(h) At the date hereof and at the Closing Date, all federal and other tax returns and reports of the Acquiring Fund required by law to have been filed by such dates (including any extensions) shall have been filed and are or will be correct in all material respects, and all federal and other taxes shown as due or required to be shown as due on said returns and reports shall have been paid or provision shall have been made for the payment thereof, and, to the best of the Acquiring Fund’s knowledge, no such return is currently under audit and no assessment has been asserted with respect to such returns;
(i) For each taxable year of its operation, the Acquiring Fund has met the requirements of Subchapter M of the Code for qualification as a regulated investment company and has elected to be treated as such, has been eligible to and has computed its federal income tax under Section 852 of the Code, and will do so for the taxable year including the Closing Date;
(j) All issued and outstanding shares of the Acquiring Fund (i) have been offered and sold in every state and the District of Columbia in compliance in all material respects with applicable registration requirements of the 1933 Act and state securities laws and (ii) are, and on the Closing Date will be, duly and validly issued and outstanding, fully paid and non-assessable, and not subject to preemptive or dissenter’s rights (recognizing that, under Massachusetts law, Acquiring Fund shareholders, under certain circumstances, could be held
A-9
personally liable for the obligations of the Acquiring Fund). The Acquiring Fund does not have outstanding any options, warrants or other rights to subscribe for or purchase any of the Acquiring Fund shares, nor is there outstanding any security convertible into any of the Acquiring Fund Shares;
(k) The Acquiring Fund Shares to be issued and delivered to the Acquired Fund, for the account of the Acquired Fund Shareholders, pursuant to the terms of this Agreement, will at the Closing Date have been duly authorized and, when so issued and delivered, will be duly and validly issued and outstanding Acquiring Fund Shares, and will be fully paid and non-assessable (recognizing that, under Massachusetts law, Acquiring Fund shareholders, under certain circumstances, could be held personally liable for the obligations of the Acquiring Fund);
(l) At the Closing Date, the Acquiring Fund will have good and marketable title to the Acquiring Fund’s assets, free of any liens or other encumbrances, except those liens or encumbrances as to which the Acquired Fund has received notice at or prior to the Closing;
(m) The execution, delivery and performance of this Agreement will have been duly authorized prior to the Closing Date by all necessary action on the part of the Board members of the Acquiring Trust (including the determinations required by Rule 17a-8(a) under the 1940 Act) and this Agreement will constitute a valid and binding obligation of the Acquiring Trust, on behalf of the Acquiring Fund, enforceable in accordance with its terms, subject, as to enforcement, to bankruptcy, insolvency, fraudulent transfer, reorganization, moratorium and other laws relating to or affecting creditors’ rights and to general equity principles;
(n) The information to be furnished by the Acquiring Fund for use in applications for orders, registration statements or proxy materials or for use in any other document filed or to be filed with any federal, state or local regulatory authority (including the NASD), which may be necessary in connection with the transactions contemplated hereby, shall be accurate and complete in all material respects and shall comply in all material respects with federal securities and other laws and regulations applicable thereto;
(o) The current prospectuses and statement of additional information of the Acquiring Fund conform in all material respects to the applicable requirements of the 1933 Act and the 1940 Act and the rules and regulations of the Commission thereunder and do not include any untrue statement of a material fact or omit to state any material fact required to be stated therein or necessary to make the statements therein, in light of the circumstances under which they were made, not materially misleading;
(p) The Registration Statement, only insofar as it relates to the Acquiring Fund, will, on the effective date of the Registration Statement and on the Closing Date, (i) comply in all material respects with the provisions and regulations of the 1933 Act, the 1934 Act, and the 1940 Act and (ii) not contain any untrue statement of a material fact or omit to state a material fact required to be stated therein or necessary to make the statements therein, in light of the circumstances under which such statements were made, not materially misleading; provided, however, that the representations and warranties in this section shall not apply to statements in or omissions from the Registration Statement made in reliance upon and in conformity with information that was furnished or should have been furnished by the Acquired Fund for use therein; and
A-10
(q) The Acquiring Fund agrees to use all reasonable efforts to obtain the approvals and authorizations required by the 1933 Act, the 1940 Act and such of the state securities laws as may be necessary in order to continue its operations after the Closing Date.
| 5. | | Covenants of the Acquiring Fund and the Acquired Fund |
5.1 The Acquiring Fund and the Acquired Fund each covenants to operate its business in the ordinary course between the date hereof and the Closing Date, it being understood that (a) such ordinary course of business will include (i) the declaration and payment of customary dividends and other distributions and (ii) such changes as are contemplated by the Funds’ normal operations; and (b) each Fund shall retain exclusive control of the composition of its portfolio until the Closing Date. No party shall take any action that would, or reasonably would be expected to, result in any of its representations and warranties set forth in this Agreement being or becoming untrue in any material respect. The Acquired Fund and Acquiring Fund covenant and agree to coordinate the respective portfolios of the Acquired Fund and Acquiring Fund from the date of the Agreement up to and including the Closing Date in order that at Closing, when the Assets are added to the Acquiring Fund’s portfolio, the resulting portfolio will meet the Acquiring Fund’s investment objective, policies and restrictions, as set forth in the Acquiring Fund’s prospectus, a copy of which has been delivered to the Acquired Fund.
5.2 Upon reasonable notice, the Acquiring Trust’s officers and agents shall have reasonable access to the Acquired Fund’s books and records necessary to maintain current knowledge of the Acquired Fund and to ensure that the representations and warranties made by the Acquired Fund are accurate.
5.3 The Acquired Fund covenants to call a meeting of the Acquired Fund Shareholders entitled to vote thereon to consider and act upon this Agreement and to take all other reasonable action necessary to obtain approval of the transactions contemplated herein. Such meeting shall be scheduled for no later than June 15, 2005.
5.4 The Acquired Fund covenants that the Acquiring Fund Shares to be issued hereunder are not being acquired for the purpose of making any distribution thereof other than in accordance with the terms of this Agreement.
5.5 The Acquired Fund covenants that it will assist the Acquiring Fund in obtaining such information as the Acquiring Fund reasonably requests concerning the beneficial ownership of the Acquired Fund shares.
5.6 Subject to the provisions of this Agreement, the Acquiring Fund and the Acquired Fund will each take, or cause to be taken, all actions, and do or cause to be done, all things reasonably necessary, proper, and/or advisable to consummate and make effective the transactions contemplated by this Agreement.
5.7 Each Fund covenants to prepare in compliance with the 1933 Act, the 1934 Act and the 1940 Act the Registration Statement on Form N-14 (the “Registration Statement”) in connection with the meeting of the Acquired Fund Shareholders to
A-11
consider approval of this Agreement and the transactions contemplated herein. The Acquiring Trust will file the Registration Statement, including a proxy statement, with the Commission. The Acquired Fund will provide the Acquiring Fund with information reasonably necessary for the preparation of a prospectus, which will include a proxy statement, all to be included in the Registration Statement, in compliance in all material respects with the 1933 Act, the 1934 Act and the 1940 Act.
5.8 The Acquired Fund covenants that it will, from time to time, as and when reasonably requested by the Acquiring Fund, execute and deliver or cause to be executed and delivered all such assignments and other instruments, and will take or cause to be taken such further action as the Acquiring Fund may reasonably deem necessary or desirable in order to vest in and confirm the Acquiring Fund’s title to and possession of all the assets and otherwise to carry out the intent and purpose of this Agreement.
5.9 The Acquiring Fund covenants to use all reasonable efforts to obtain the approvals and authorizations required by the 1933 Act and 1940 Act, and such of the state securities laws as it deems appropriate in order to continue its operations after the Closing Date and to consummate the transactions contemplated herein; provided, however, that the Acquiring Fund may take such actions it reasonably deems advisable after the Closing Date as circumstances change.
5.10 The Acquiring Fund covenants that it will, from time to time, as and when reasonably requested by the Acquired Fund, execute and deliver or cause to be executed and delivered all such assignments, assumption agreements, releases, and other instruments, and will take or cause to be taken such further action, as the Acquired Fund may reasonably deem necessary or desirable in order to (i) vest and confirm to the Acquired Fund title to and possession of all Acquiring Fund shares to be transferred to the Acquired Fund pursuant to this Agreement and (ii) assume the liabilities from the Acquired Fund.
5.11 As soon as reasonably practicable after the Closing, the Acquired Fund shall make a liquidating distribution to its shareholders consisting of the Acquiring Fund Shares received at the Closing.
5.12 The Acquiring Fund and the Acquired Fund shall each use its reasonable best efforts to fulfill or obtain the fulfillment of the conditions precedent to effect the transactions contemplated by this Agreement as promptly as practicable.
5.13 The intention of the parties is that the transaction will qualify as a reorganization within the meaning of Section 368(a) of the Code. Neither the Trusts, the Acquiring Fund nor the Acquired Fund shall take any action, or cause any action to be taken (including, without limitation, the filing of any tax return) that is inconsistent with such treatment or results in the failure of the transaction to qualify as a reorganization within the meaning of Section 368(a) of the Code. At or prior to the Closing Date, the Trusts, the Acquiring Fund and the Acquired Fund will take such action, or cause such action to be taken, as is reasonably necessary to enable Willkie Farr & Gallagher LLP to render the tax opinion contemplated herein in section 8.5.
5.14 At or immediately prior to the Closing, the Acquired Fund will declare and pay to its shareholders a dividend or other distribution in an amount large enough so
A-12
that it will have distributed substantially all (and in any event not less than 98%) of its investment company taxable income (computed without regard to any deduction for dividends paid) and realized net capital gain, if any, for the current taxable year through the Closing Date.
5.15 The Acquiring Fund agrees to identify in writing prior to the Closing Date any assets of the Acquired Fund that it does not wish to acquire because they are not consistent with the current investment strategy of the Acquiring Fund, and the Acquired Fund agrees to dispose of such assets prior to the Closing Date.
| 6. | | Conditions Precedent to Obligations of the Acquired Fund |
The obligations of the Acquired Fund to consummate the transactions provided for herein shall be subject, at its election, to the performance by the Acquiring Fund of all the obligations to be performed by it hereunder on or before the Closing Date, and, in addition thereto, the following further conditions:
6.1 All representations and warranties of the Acquiring Trust, on behalf of the Acquiring Fund, contained in this Agreement shall be true and correct in all material respects as of the date hereof and, except as they may be affected by the transactions contemplated by this Agreement, as of the Closing Date, with the same force and effect as if made on and as of the Closing Date; and there shall be (i) no pending or threatened litigation brought by any person (other than the Acquired Fund, its adviser or any of their affiliates) against the Acquiring Fund or its investment adviser(s), Board members or officers arising out of this Agreement and (ii) no facts known to the Acquiring Fund which the Acquiring Fund reasonably believes might result in such litigation.
6.2 The Acquiring Fund shall have delivered to the Acquired Fund on the Closing Date a certificate executed in its name by the Acquiring Trust’s President or a Vice President, in a form reasonably satisfactory to the Acquired Trust, on behalf of the Acquired Fund, and dated as of the Closing Date, to the effect that the representations and warranties of the Acquiring Fund made in this Agreement are true and correct on and as of the Closing Date, except as they may be affected by the transactions contemplated by this Agreement, and as to such other matters as the Acquired Fund shall reasonably request.
6.3 The Acquired Fund shall have received on the Closing Date an opinion of Vedder, Price, Kaufman & Kammholz, P.C., in a form reasonably satisfactory to the Acquired Fund, and dated as of the Closing Date, to the effect that:
(a) the Acquiring Trust has been formed and is a business trust legally existing under the laws of The Commonwealth of Massachusetts;
(b) the Acquiring Fund has the power to carry on its business as presently conducted in accordance with the description thereof in the Acquiring Trust’s registration statement under the 1940 Act;
(c) the Agreement has been duly authorized, executed and delivered by the Acquiring Trust, on behalf of the Acquiring Fund, and is a valid and binding obligation of the Acquiring Trust, on behalf of the Acquiring Fund, enforceable in accordance with its terms, subject to bankruptcy, insolvency, fraudulent transfer, reorganization, moratorium and laws of general applicability relating to or affecting creditors’ rights and to general equity principles;
A-13
(d) the execution and delivery of the Agreement did not, and the issuance of Acquiring Fund Shares pursuant to the Agreement will not, violate the Acquiring Trust’s Declaration of Trust, as amended, or By-laws; and
(e) to the knowledge of such counsel, and without any independent investigation, (i) other than as disclosed on the schedule provided by the Acquiring Fund pursuant to section 4.2 of the Agreement, the Acquiring Fund is not subject to any litigation or other proceedings that might have a materially adverse effect on the operations of the Acquiring Fund, (ii) the Acquiring Trust is registered as an investment company under the 1940 Act and no stop order suspending the effectiveness of its registration statement has been issued under the 1933 Act and no order of suspension or revocation of registration pursuant to Section 8(e) of the 1940 Act has been issued, and (iii) all regulatory consents, authorizations, approvals or filings required to be obtained or made by the Acquiring Fund under the federal laws of the United States or the laws of The Commonwealth of Massachusetts for the issuance of Acquiring Fund Shares, pursuant to the Agreement have been obtained or made.
The delivery of such opinion is conditioned upon receipt by Vedder, Price, Kaufman & Kammholz, P.C. of customary representations it shall reasonably request of each of the Acquiring Trust and the Acquired Trust.
6.4 The Acquiring Fund shall have performed all of the covenants and complied with all of the provisions required by this Agreement to be performed or complied with by the Acquiring Fund on or before the Closing Date.
6.5 The Acquiring Fund shall have adopted a new investment management fee schedule of 0.470% of average daily net assets for the first $250 million in assets, 0.445% of average daily net assets for the next $750 million in assets and 0.410% of average daily assets exceeding $1 billion, and entered into an expense cap agreement with DeIM limiting the expenses of the Class A of the Acquiring Fund to 0.51%, excluding certain expenses, for the period commencing May 2, 2005 and ending May 1, 2008, in a form reasonably satisfactory to the Acquired Fund.
| 7. | | Conditions Precedent to Obligations of the Acquiring Fund |
The obligations of the Acquiring Fund to consummate the transactions provided for herein shall be subject, at its election, to the performance by the Acquired Fund of all of the obligations to be performed by it hereunder on or before the Closing Date and, in addition thereto, the following further conditions:
7.1 All representations and warranties of the Acquired Trust, on behalf of the Acquired Fund, contained in this Agreement shall be true and correct in all material respects as of the date hereof and, except as they may be affected by the transactions contemplated by this Agreement, as of the Closing Date, with the same force and effect as if made on and as of the Closing Date; and there shall be (i) no pending or threatened litigation brought by any person (other than the Acquiring Fund, its adviser or any of their affiliates) against the Acquired Fund or its investment adviser(s), Board members or officers arising out of this Agreement and (ii) no facts known to the Acquired Fund which the Acquired Fund reasonably believes might result in such litigation.
A-14
7.2 The Acquired Fund shall have delivered to the Acquiring Fund a statement of the Acquired Fund’s assets and liabilities as of the Closing Date, certified by the Treasurer of the Acquired Trust.
7.3 The Acquired Fund shall have delivered to the Acquiring Fund on the Closing Date a certificate executed in its name by the Acquired Trust’s President or a Vice President, in a form reasonably satisfactory to the Acquiring Trust, on behalf of the Acquiring Fund, and dated as of the Closing Date, to the effect that the representations and warranties of the Acquired Trust with respect to the Acquired Fund made in this Agreement are true and correct on and as of the Closing Date, except as they may be affected by the transactions contemplated by this Agreement, and as to such other matters as the Acquiring Fund shall reasonably request.
7.4 The Acquiring Fund shall have received on the Closing Date an opinion of Ropes & Gray LLP, in a form reasonably satisfactory to the Acquiring Fund, and dated as of the Closing Date, to the effect that:
(a) the Acquired Trust has been duly formed and is an existing business trust;
(b) the Acquired Fund has the power to carry on its business as presently conducted in accordance with the description thereof in the Acquired Trust’s registration statement under the 1940 Act;
(c) the Agreement has been duly authorized, executed and delivered by the Acquired Trust, on behalf of the Acquired Fund, and constitutes a valid and legally binding obligation of the Acquired Trust, on behalf of the Acquired Fund, enforceable in accordance with its terms, subject to bankruptcy, insolvency, fraudulent transfer, reorganization, moratorium and laws of general applicability relating to or affecting creditors’ rights and to general equity principles;
(d) the execution and delivery of the Agreement did not, and the exchange of the Acquired Fund’s assets for Acquiring Fund Shares pursuant to the Agreement will not, violate the Acquired Trust’s Declaration of Trust, as amended, or By-laws; and
(e) to the knowledge of such counsel, and without any independent investigation, (i) other than as disclosed on the schedule provided by the Acquired Fund pursuant to section 4.1 of the Agreement, the Acquired Fund is not subject to any litigation or other proceedings that might have a materially adverse effect on the operations of the Acquired Fund, (ii) the Acquired Trust is duly registered as an investment company with the Commission and is not subject to any stop order, and (iii) all regulatory consents, authorizations, approvals or filings required to be obtained or made by the Acquired Fund under the federal laws of the United States or the laws of The Commonwealth of Massachusetts for the exchange of the Acquired Fund’s assets for Acquiring Fund Shares, pursuant to the Agreement have been obtained or made.
The delivery of such opinion is conditioned upon receipt by Ropes & Gray LLP of customary representations it shall reasonably request of each of the Acquiring Trust and the Acquired Trust.
A-15
7.5 The Acquired Fund shall have performed all of the covenants and complied with all of the provisions required by this Agreement to be performed or complied with by the Acquired Fund on or before the Closing Date.
| 8. | | Further Conditions Precedent to Obligations of the Acquiring Fund and the Acquired Fund |
If any of the conditions set forth below have not been met on or before the Closing Date with respect to the Acquired Fund or the Acquiring Fund, the other party to this Agreement shall, at its option, not be required to consummate the transactions contemplated by this Agreement:
8.1 This Agreement and the transactions contemplated herein shall have been approved by the requisite vote of the holders of the outstanding shares of the Acquired Fund in accordance with the provisions of the Acquired Trust’s Declaration of Trust, as amended, and By-Laws, applicable Massachusetts law and the 1940 Act, and certified copies of the resolutions evidencing such approval shall have been delivered to the Acquiring Fund. Notwithstanding anything herein to the contrary, neither the Acquiring Fund nor the Acquired Fund may waive the conditions set forth in this section 8.1.
8.2 On the Closing Date, no action, suit or other proceeding shall be pending or to its knowledge threatened before any court or governmental agency in which it is sought to restrain or prohibit, or obtain material damages or other relief in connection with, this Agreement or the transactions contemplated herein.
8.3 All consents of other parties and all other consents, orders and permits of federal, state and local regulatory authorities deemed necessary by the Acquiring Fund or the Acquired Fund to permit consummation, in all material respects, of the transactions contemplated hereby shall have been obtained, except where failure to obtain any such consent, order or permit would not involve a risk of a material adverse effect on the assets or properties of the Acquiring Fund or the Acquired Fund, provided that either party hereto may for itself waive any of such conditions.
8.4 The Registration Statement shall have become effective under the 1933 Act and no stop orders suspending the effectiveness thereof shall have been issued and, to the best knowledge of the parties hereto, no investigation or proceeding for that purpose shall have been instituted or be pending, threatened or contemplated under the 1933 Act.
8.5 The parties shall have received an opinion of Willkie Farr & Gallagher LLP addressed to each of the Acquiring Fund and the Acquired Fund, in a form reasonably satisfactory to each such party to this Agreement, substantially to the effect that, based upon certain facts, assumptions and representations of the parties, for federal income tax purposes: (i) the acquisition by the Acquiring Fund of all of the assets of the Acquired Fund solely in exchange for Acquiring Fund Shares and the assumption by the Acquiring Fund of all of the liabilities of the Acquired Fund, followed by the distribution by the Acquired Fund to its shareholders of Acquiring Fund Shares in complete liquidation of the Acquired Fund, all pursuant to the Agreement, constitutes a reorganization within the meaning of Section 368(a) of the Code, and the Acquiring Fund and the Acquired Fund will each be a “party to a reorganization” within the meaning of Section 368(b) of the Code; (ii) under Section 361 of the Code, the Acquired Fund will not recognize gain
A-16
or loss upon the transfer of its assets to the Acquiring Fund in exchange for Acquiring Fund Shares and the assumption of the Acquired Fund liabilities by the Acquiring Fund, and the Acquired Fund will not recognize gain or loss upon the distribution to its shareholders of the Acquiring Fund Shares in liquidation of the Acquired Fund; (iii) under Section 354 of the Code, shareholders of the Acquired Fund will not recognize gain or loss on the receipt of Acquiring Fund Shares solely in exchange for Acquired Fund shares; (iv) under Section 358 of the Code, the aggregate basis of the Acquiring Fund Shares received by each shareholder of the Acquired Fund will be the same as the aggregate basis of the Acquired Fund shares exchanged therefor; (v) under Section 1223(1) of the Code, the holding period of the Acquiring Fund Shares received by each Acquired Fund shareholder will include the holding period of the Acquired Fund shares exchanged therefor, provided that the Acquired Fund shareholder held the Acquired Fund shares at the time of the reorganization as a capital asset; (vi) under Section 1032 of the Code, the Acquiring Fund will not recognize gain or loss upon the receipt of assets of the Acquired Fund in exchange for Acquiring Fund Shares and the assumption by the Acquiring Fund of all of the liabilities of the Acquired Fund; (vii) under Section 362(b) of the Code, the basis of the assets of the Acquired Fund transferred to the Acquiring Fund in the reorganization will be the same in the hands of the Acquiring Fund as the basis of such assets in the hands of the Acquired Fund immediately prior to the transfer; and (viii) under Section 1223(2) of the Code, the holding periods of the assets of the Acquired Fund transferred to the Acquiring Fund in the reorganization in the hands of the Acquiring Fund will include the periods during which such assets were held by the Acquired Fund. The delivery of such opinion is conditioned upon receipt by Willkie Farr & Gallagher LLP of representations it shall request of each of the Acquiring Trust and Acquired Trust. Notwithstanding anything herein to the contrary, neither the Acquiring Fund nor the Acquired Fund may waive the condition set forth in this section 8.5.
9.1 The Acquiring Fund agrees to indemnify and hold harmless the Acquired Fund and each of the Acquired Trust’s Board members and officers from and against any and all losses, claims, damages, liabilities or expenses (including, without limitation, the payment of reasonable legal fees and reasonable costs of investigation) to which jointly and severally, the Acquired Trust or any of its Board members or officers may become subject, insofar as any such loss, claim, damage, liability or expense (or actions with respect thereto) arises out of or is based on any breach by the Acquiring Fund of any of its representations, warranties, covenants or agreements set forth in this Agreement.
9.2 The Acquired Fund agrees to indemnify and hold harmless the Acquiring Fund and each of the Acquiring Trust’s Board members and officers from and against any and all losses, claims, damages, liabilities or expenses (including, without limitation, the payment of reasonable legal fees and reasonable costs of investigation) to which jointly and severally, the Acquiring Trust or any of its Board members or officers may become subject, insofar as any such loss, claim, damage, liability or expense (or actions with respect thereto) arises out of or is based on any breach by the Acquired Fund of any of its representations, warranties, covenants or agreements set forth in this Agreement.
10.1 Each of the Acquiring Trust, on behalf of the Acquiring Fund, and the Acquired Trust, on behalf of the Acquired Fund, represents and warrants to the other
A-17
that it has no obligations to pay any brokers or finders fees in connection with the transactions provided for herein.
10.2 DeIM will bear all the expenses associated with the Reorganization, including any transaction costs payable by the Acquired Fund in connection with sales of certain of its assets, as designated by the Acquiring Fund, in anticipation of the Reorganization.
The Acquiring Fund and the Acquired Fund agree that neither party has made any representation, warranty or covenant not set forth herein and that this Agreement constitutes the entire agreement between the parties.
This Agreement may be terminated and the transactions contemplated hereby may be abandoned (i) by mutual agreement of the parties, or (ii) by either party if the Closing shall not have occurred on or before July 1, 2005, unless such date is extended by mutual agreement of the parties, or (iii) by either party if the other party shall have materially breached its obligations under this Agreement or made a material and intentional misrepresentation herein or in connection herewith. In the event of any such termination, this Agreement shall become void and there shall be no liability hereunder on the part of any party or their respective Board members or officers, except for any such material breach or intentional misrepresentation, as to each of which all remedies at law or in equity of the party adversely affected shall survive.
This Agreement may be amended, modified or supplemented in such manner as may be mutually agreed upon in writing by any authorized officer of the Acquired Fund and any authorized officer of the Acquiring Fund; provided, however, that following the meeting of the Acquired Fund Shareholders called by the Acquired Fund pursuant to section 5.3 of this Agreement, no such amendment may have the effect of changing the provisions for determining the number of the Acquiring Fund Shares to be issued to the Acquired Fund Shareholders under this Agreement to the detriment of such shareholders without their further approval.
Any notice, report, statement or demand required or permitted by any provisions of this Agreement shall be in writing and shall be deemed duly given if delivered by hand (including by Federal Express or similar express courier) or transmitted by facsimile or three days after being mailed by prepaid registered or certified mail, return receipt requested, addressed to the Acquiring Fund, 222 South Riverside Plaza, Chicago, Illinois 60606, with a copy to Vedder, Price, Kaufman & Kammholz, P.C., 222 North LaSalle Street, Chicago, Illinois 60601, Attention: David A. Sturms, Esq., and Cathy G. O’Kelly, Esq., or to the Acquired Fund, Two International Place, Boston, Massachusetts, 02110-4103, with a copy to Ropes & Gray LLP, One International Place, Boston, Massachusetts, 02110-2624, Attention: John W. Gerstmayr, or to any other address that the Acquired Fund or the Acquiring Fund shall have last designated by notice to the other party.
A-18
| 15. | | Headings; Counterparts; Assignment; Limitation of Liability |
15.1 The Article and section headings contained in this Agreement are for reference purposes only and shall not affect in any way the meaning or interpretation of this Agreement.
15.2 This Agreement may be executed in any number of counterparts, each of which shall be deemed an original.
15.3 This Agreement shall bind and inure to the benefit of the parties hereto and their respective successors and assigns, but no assignment or transfer hereof or of any rights or obligations hereunder shall be made by any party without the written consent of the other party. Nothing herein expressed or implied is intended or shall be construed to confer upon or give any person, firm or corporation, other than the parties hereto and the shareholders of the Acquiring Fund and the Acquired Fund and their respective successors and assigns, any rights or remedies under or by reason of this Agreement.
15.4 References in this Agreement to each Trust mean and refer to the Board members of each Trust from time to time serving under its Declaration of Trust on file with the Secretary of State of The Commonwealth of Massachusetts, as the same may be amended from time to time, pursuant to which each Trust conducts its business. It is expressly agreed that the obligations of each Trust hereunder shall not be binding upon any of the Board members, shareholders, nominees, officers, agents, or employees of the Trusts or the Funds personally, but bind only the respective property of the Funds, as provided in each Trust’s Declaration of Trust. Moreover, no series of either Trust other than the Funds shall be responsible for the obligations of the Trusts hereunder, and all persons shall look only to the assets of the Funds to satisfy the obligations of the Trusts hereunder. The execution and the delivery of this Agreement have been authorized by each Trust’s Board members, on behalf of the applicable Fund, and this Agreement has been signed by authorized officers of each Fund acting as such, and neither such authorization by such Board members, nor such execution and delivery by such officers, shall be deemed to have been made by any of them individually or to impose any liability on any of them personally, but shall bind only the respective property of the Funds, as provided in each Trust’s Declaration of Trust.
Notwithstanding anything to the contrary contained in this Agreement, the obligations, agreements, representations and warranties with respect to each Fund shall constitute the obligations, agreements, representations and warranties of that Fund only (the “Obligated Fund”), and in no event shall any other series of the Trusts or the assets of any such series be held liable with respect to the breach or other default by the Obligated Fund of its obligations, agreements, representations and warranties as set forth herein.
15.5 This Agreement shall be governed by, and construed and enforced in accordance with, the laws of The Commonwealth of Massachusetts, without regard to its principles of conflicts of laws.
A-19
IN WITNESS WHEREOF, each of the parties hereto has caused this Agreement to be executed by an authorized officer and its seal to be affixed thereto and attested by its Secretary or Assistant Secretary.
| | |
Attest: | | SCUDDER VARIABLE SERIES II, on behalf of Scudder Total Return Portfolio |
| |
| |
|
Secretary | | By: Its: |
| |
Attest: | | SCUDDER VARIABLE SERIES I, on behalf of Balanced Portfolio |
| |
| |
|
Secretary | | By: Its: |
| |
AGREED TO AND ACKNOWLEDGED ONLY WITH RESPECT TO SECTION 10.2 HERETO DEUTSCHE INVESTMENT MANAGEMENT AMERICAS INC. | | |
| |
| | |
By: Its: | | |
A-20
EXHIBIT B
Updated financial highlights for Total Return Portfolio contained in the Annual Report to Shareholders for the fiscal year ended December 31, 2004
B-1
Financial Highlights
Class A
| | | | | | | | | | | | | | | | | | | | |
Years Ended December 31,
| | 2004
| | | 2003
| | | 2002
| | | 2001a
| | | 2000
| |
Selected Per Share Data | | | | | | | | | | | | | | | | | | | | |
Net asset value, beginning of period | | $ | 21.32 | | | $ | 18.66 | | | $ | 22.57 | | | $ | 25.91 | | | $ | 28.82 | |
| | |
|
|
| |
|
|
| |
|
|
| |
|
|
| |
|
|
|
Income (loss) from investment operations: | | | | | | | | | | | | | | | | | | | | |
Net investment income (loss)c | | | .47 | | | | .37 | | | | .47 | | | | .61 | | | | .74 | |
Net realized and unrealized gain (loss) on investment transactions | | | .93 | | | | 2.90 | | | | (3.81 | ) | | | (2.20 | ) | | | (1.40 | ) |
| | |
|
|
| |
|
|
| |
|
|
| |
|
|
| |
|
|
|
Total from investment operations | | | 1.40 | | | | 3.27 | | | | (3.34 | ) | | | (1.59 | ) | | | (.66 | ) |
| | |
|
|
| |
|
|
| |
|
|
| |
|
|
| |
|
|
|
Less distributions from: | | | | | | | | | | | | | | | | | | | | |
Net investment income | | | (.35 | ) | | | (.61 | ) | | | (.57 | ) | | | (.80 | ) | | | (.90 | ) |
Net realized gains on investment transactions | | | — | | | | — | | | | — | | | | (.95 | ) | | | (1.35 | ) |
Total distributions | | | (.35 | ) | | | (.61 | ) | | | (.57 | ) | | | (1.75 | ) | | | (2.25 | ) |
| | |
|
|
| |
|
|
| |
|
|
| |
|
|
| |
|
|
|
Net asset value, end of period | | $ | 22.37 | | | $ | 21.32 | | | $ | 18.66 | | | $ | 22.57 | | | $ | 25.91 | |
| | |
|
|
| |
|
|
| |
|
|
| |
|
|
| |
|
|
|
Total Return (%) | | | 6.64 | | | | 18.10 | | | | (15.17 | ) | | | (6.09 | ) | | | (2.63 | ) |
| | |
|
|
| |
|
|
| |
|
|
| |
|
|
| |
|
|
|
Ratios to Average Net Assets and Supplemental Data | | | | | | | | | | | | | | | | | | | | |
Net assets, end of period ($ millions) | | | 622 | | | | 667 | | | | 640 | | | | 861 | | | | 851 | |
Ratio of expenses (%) | | | .59 | | | | .59 | | | | .58 | | | | .58 | | | | .61 | |
Ratio of net investment income (loss) (%) | | | 2.18 | | | | 1.88 | | | | 2.32 | | | | 2.63 | | | | 2.75 | |
Portfolio turnover rate (%) | | | 131d | | | | 102d | | | | 140 | | | | 115 | | | | 107 | |
| a | | As required, effective January 1, 2001, the Portfolio adopted the provisions of the AICPA Audit and Accounting Guide for Investment Companies and began amortizing premium on debt securities. In addition, paydowns on mortgage-backed securities which were included in realized gain/loss on investment transactions prior to January 1, 2001 were included as interest income. The effect of this change for the year ended December 31, 2001 was to decrease net investment income per share by $.03, increase net realized and unrealized gains and losses per share by $.03 and decrease the ratio of net investment income to average net assets from 2.76% to 2.63%. Per share, ratios and supplemental data for periods prior to January 1, 2001 were not restated to reflect this change in presentation. |
| b | | On June 18, 2001, the Portfolio implemented a 1 for 10 reverse stock split. Per share information, for the period prior to December 31, 2001, has been restated to reflect the effect of the split. Shareholders received 1 share for every 10 shares owned and net asset value per share increased correspondingly. |
| c | | Based on average shares outstanding during the period. |
| d | | The portfolio turnover rate including mortgage dollar roll transactions was 140% and 108% for the periods ended December 31, 2004 and December 31, 2003, respectively. |
B-2
TABLE OF CONTENTS
Scudder Investments
222 South Riverside Plaza
Chicago, Illinois 60606
(312) 537-7000
For more information please call your Fund’s proxy solicitor,
Computershare Fund Services, at (877) 288-6285.
SBP_14954
FSIII-VA.B
YOUR VOTE IS IMPORTANT!
UNLESS VOTING BY TELEPHONE OR INTERNET,
PLEASE SIGN, DATE AND MAIL THIS PROXY CARD
PROMPTLY USING THE ENCLOSED ENVELOPE.
|
|
| Your Proxy Vote is important! |
|
| And now you can Vote your Proxy on the PHONE or the INTERNET. |
|
| It saves Money! Telephone and Internet voting saves postage costs. Savings which can help minimize expenses. |
|
| It saves Time! Telephone and Internet voting is instantaneous – 24 hours a day. |
|
| It’s Easy! Just follow these simple steps: |
|
| 1. Read your proxy statement and have it and this proxy card at hand. |
|
| 2. Call toll-free 1-866-241-6192, or go to website: https://vote.proxy-direct.com. |
|
| 3. Follow the recorded or on-screen directions. |
|
| 4. Do not mail your Proxy Card when you vote by phone or Internet. |
| | | | |
| | | Please detach at perforation before mailing. | | |
| | |

PO Box 18011 Hauppauge, NY 11788-8811 | | BALANCED PORTFOLIO SCUDDER VARIABLE SERIES I PROXY FOR THE SPECIAL MEETING OF SHAREHOLDERS 345 Park Avenue, 27th Floor, New York, New York 10154 9:00 a.m., Eastern time, on April 15, 2005 | | PROXY CARD |
The undersigned hereby appoints Daniel O. Hirsch, John Millette and Caroline Pearson, and each of them, with full power of substitution, as proxy or proxies of the undersigned to vote all shares of the Fund that the undersigned is entitled in any capacity to vote at the above-stated special meeting, and at any and all adjournments or postponements thereof (the ‘Special Meeting’), on the matter set forth in the Notice of Special Meeting of Shareholders and on this Proxy Card, and, in their discretion, upon all matters incident to the conduct of the Special Meeting and upon such other matters as may properly be brought before the Special Meeting. This proxy revokes all prior proxies given by the undersigned.
All properly executed proxies will be voted as directed. If no instructions are indicated on a properly executed proxy, the proxy will be voted FOR approval of the Proposal. All ABSTAIN votes will be counted in determining the existence of a quorum at the Special Meeting.
Receipt of the Notice of Special Meeting and the related Prospectus/Proxy Statement is hereby acknowledged.
| | |
| VOTE VIA THE INTERNET: https://vote.proxy-direct.com |
| VOTE VIA THE TELEPHONE: 1-866-241-6192 |
| | | |
| Note: Joint owners should EACH sign. Please sign EXACTLY as your name(s) appears on this card. When signing as attorney, trustee, executor, administrator, guardian or corporate officer, please give your FULL title as such. |
Signature(s) (Title(s), if applicable)
|
| Date | | SBP_14954 |
| | | FSIII-VA.B |
UNLESS VOTING BY TELEPHONE OR INTERNET, PLEASE SIGN, DATE AND MAIL THIS PROXY CARD PROMPTLY USING THE ENCLOSED ENVELOPE. NO POSTAGE REQUIRED.
YOUR VOTE IS IMPORTANT!
UNLESS VOTING BY TELEPHONE OR INTERNET,
PLEASE SIGN, DATE AND MAIL THIS PROXY CARD
PROMPTLY USING THE ENCLOSED ENVELOPE.
Please detach at perforation before mailing.
THIS PROXY IS SOLICITED ON BEHALF OF THE BOARD OF TRUSTEES WITH RESPECT TO YOUR FUND. THE FOLLOWING MATTER IS PROPOSED BY YOUR FUND. THE BOARD OF TRUSTEES RECOMMENDS A VOTE FOR THE PROPOSAL.
TO VOTE, MARK A BLOCK BELOW IN BLUE OR BLACK INK. Example: n
VOTE ON PROPOSAL 1:
| | | | | | | | |
| 1. | | Approve an Agreement and Plan of Reorganization and the transactions it contemplates, including the transfer of all of the assets of Balanced Portfolio to Scudder Total Return Portfolio, in exchange for shares of Scudder Total Return Portfolio and the assumption by Scudder Total Return Portfolio of all of the liabilities of Balanced Portfolio and the distribution of such shares, on a tax-free basis for federal income tax purposes, to the shareholders of Balanced Portfolio in complete liquidation of Balanced Portfolio. | | FOR
¨ | | AGAINST
¨ | | ABSTAIN
¨ |
| | | | |
| | | The appointed proxies will vote on any other business as may properly come before the Special Meeting. | | | | | | |
THIS PROXY CARD IS VALID ONLY WHEN SIGNED AND DATED ON REVERSE SIDE.
SBP_14954
FSIII-VA.B
Supplement to the currently effective prospectus of each of the listed portfolios:
Scudder Variable Series II
| | | | | | |
| | | |
| · | | Scudder Aggressive Growth Portfolio | | · | | Scudder Technology Growth Portfolio |
| | | |
| · | | Scudder Blue Chip Portfolio | | · | | Scudder Templeton Foreign Value Portfolio |
| | | |
| · | | Scudder Conservative Income Strategy Portfolio | | · | | Scudder Total Return Portfolio |
| | | |
| · | | Scudder Fixed Income Portfolio | | · | | SVS Davis Venture Value Portfolio |
| | | |
| · | | Scudder Global Blue Chip Portfolio | | · | | SVS Dreman Financial Services Portfolio |
| | | |
| · | | Scudder Government & Agency Securities Portfolio | | · | | SVS Dreman High Return Equity Portfolio |
| | | |
| · | | Scudder Growth Portfolio | | · | | SVS Dreman Small Cap Value Portfolio |
| | | |
| · | | Scudder Growth & Income Strategy Portfolio | | · | | SVS Eagle Focused Large Cap Growth Portfolio |
| | | |
| · | | Scudder Growth Strategy Portfolio | | · | | SVS Focus Value+Growth Portfolio |
| | | |
| · | | Scudder High Income Portfolio | | · | | SVS Index 500 Portfolio |
| | | |
| · | | Scudder Income & Growth Strategy Portfolio | | · | | SVS INVESCO Dynamic Growth Portfolio |
| | | |
| · | | Scudder International Select Equity Portfolio | | · | | SVS Janus Growth and Income Portfolio |
| | | |
| · | | Scudder Large Cap Value Portfolio | | · | | SVS Janus Growth Opportunities Portfolio |
| | | |
| · | | Scudder Mercury Large Cap Core Portfolio | | · | | SVS MFS Strategic Value Portfolio |
| | | |
| · | | Scudder Money Market Portfolio | | · | | SVS Oak Strategic Equity Portfolio |
| | | |
| · | | Scudder Small Cap Growth Portfolio | | · | | SVS Turner Mid Cap Growth Portfolio |
| | | |
| · | | Scudder Strategic Income Portfolio | | | | |
For all listed funds (except Scudder Money Market Portfolio). The following information replaces the applicable market timing disclosure under “Buying and Selling Shares” in each portfolio’s prospectus:
Market Timing Policies and Procedures. Short-term and excessive trading of portfolio shares may present risks to the portfolio’s long-term shareholders, including potential dilution in the value of portfolio shares, interference with the efficient management of the portfolio’s portfolio (including losses on the sale of investments), taxable gains to remaining shareholders and increased brokerage and administrative costs. These risks may be more pronounced for portfolios investing in certain securities such as those that trade in foreign markets, are illiquid or do not otherwise have “readily available market quotations.” Certain investors may seek to employ short-term trading strategies aimed at exploiting variations in portfolio valuation that arise from the nature of the securities held by the portfolio (e.g., “time zone arbitrage”).
Page 1
The portfolio discourages short-term and excessive trading. The portfolio will take steps to detect and deter short-term and excessive trading pursuant to the portfolio’s policies as described in this prospectus and approved by the Board.
The portfolio’s policies include:
| · | the portfolio reserves the right to reject or cancel a purchase or exchange order for any reason when, in the opinion of the Advisor, there appears to be a pattern of short-term or excessive trading activity by a shareholder or any other trading activity deemed harmful or disruptive to the portfolio; and |
| · | the portfolio has adopted certain fair valuation practices reasonably designed to protect the portfolio from “time zone arbitrage” with respect to its foreign securities holdings and other trading practices that seek to exploit variations in portfolio valuation that arise from the nature of the securities held by the portfolio. (See “How the portfolio calculates share price” in the portfolio’s prospectus.) |
When a pattern of short-term or excessive trading activity or other trading activity deemed harmful or disruptive to the portfolio is detected in a particular separate account, the Advisor will take steps to stop this activity by contacting the insurance company that maintains the accounts for the underlying contract holders and seeking to have the insurance company enforce the separate account’s policies on short-term or excessive trading, if any. In addition, the Advisor and the portfolios reserve the right to terminate a separate account’s ability to invest in the portfolios if apparent short-term or excessive trading activity persists. The detection of these patterns and the banning of further trading are inherently subjective and therefore involve some selectivity in their application. The Advisor seeks to make such determinations in a manner consistent with the interests of the portfolio’s long-term shareholders.
There is no assurance that these policies and procedures will be effective in limiting short-term and excessive trading in all cases. For example, the Advisor may not be able to effectively monitor, detect or limit short-term or excessive trading by underlying shareholders that occurs through separate accounts maintained by insurance companies or other financial intermediaries. Depending on the amount of portfolio shares held in a particular separate account (which may represent most of the portfolio’s shares) short-term and/or excessive trading of portfolio shares could adversely affect long-term shareholders in the portfolio. It is important to note that the Advisor and the portfolio do not have access to underlying shareholders’ trading activity and that investors will be subject to the policies and procedures of their insurance company with respect to short-term and excessive trading in the portfolio.
The portfolio’s policies and procedures may be modified or terminated at any time.
The following supplements the information under “Buying and Selling Shares” in both Scudder Money Market Portfolio prospectuses:
Since money market funds hold short-term instruments and are intended to provide liquidity to shareholders, the Advisor does not monitor or limit short-term and excessive trading activity in this portfolio and, accordingly, the Board of the portfolio has not approved any policies and procedures designed to limit this activity. However, the portfolio reserves the right to and may reject or cancel a purchase or exchange order into a money market fund for any reason, including if, in the opinion of the Advisor, there appears to be a pattern of short-term and excessive trading by an investor in other Scudder funds.
Page 2
The following replaces the disclosure regarding fair valuation under “How the portfolio calculates share price” in each portfolio’s prospectus:
We typically value securities using information furnished by an independent pricing service or market quotations, where appropriate. However, we may use methods approved by the portfolio’s Board, such as a fair valuation model, which are intended to reflect fair value when pricing service information or market quotations are not readily available or when a security’s value or a meaningful portion of the value of the portfolio is believed to have been materially affected by a significant event, such as a natural disaster, an economic event like a bankruptcy filing, or a substantial fluctuation in domestic or foreign markets, that has occurred between the close of the exchange or market on which the security is principally traded (for example, a foreign exchange or market) and the close of the New York Stock Exchange. In such a case, the portfolio’s value for a security is likely to be different from the last quoted market price or pricing service information. In addition, due to the subjective and variable nature of fair value pricing, it is possible that the value determined for a particular asset may be materially different from the value realized upon such asset’s sale. It is expected that the greater the percentage of portfolio assets that is invested in non-US securities, the more extensive will be the portfolio’s use of fair value pricing. This is intended to reduce the portfolio’s exposure to “time zone arbitrage” and other harmful trading practices. (See “Market Timing Policies and Procedures.”)
The following supplements the “Other Policies and Risks” or “Other Policies” section of each portfolio’s prospectus:
The portfolio’s complete portfolio holdings as of the end of each calendar month are posted on www.scudder.com ordinarily on the 15th day of the following calendar month, or the first business day thereafter. This posted information generally remains accessible at least until the portfolio files its Form N-CSR or N-Q with the Securities and Exchange Commission for the period that includes the date as of which the www.scudder.com information is current (expected to be at least three months). The portfolio’s Statement of Additional Information includes a description of the portfolio’s policies and procedures with respect to the disclosure of the portfolio’s portfolio holdings.
Please Retain This Supplement for Future Reference
March 16, 2005
Page 3
Supplement to the currently effective prospectus of each of the listed portfolios:
Scudder Variable Series II
| • | | Scudder Aggressive Growth Portfolio |
| • | | Scudder Blue Chip Portfolio |
| • | | Scudder Conservative Income Strategy Portfolio |
| • | | Scudder Fixed Income Portfolio |
| • | | Scudder Global Blue Chip Portfolio |
| • | | Scudder Government & Agency Securities Portfolio |
| • | | Scudder Growth Portfolio |
| • | | Scudder Growth & Income Strategy Portfolio |
| • | | Scudder Growth Strategy Portfolio |
| • | | Scudder High Income Portfolio |
| • | | Scudder Income & Growth Strategy Portfolio |
| • | | Scudder International Select Equity Portfolio |
| • | | Scudder Large Cap Value Portfolio |
| • | | Scudder Mercury Large Cap Core Portfolio |
| • | | Scudder Money Market Portfolio |
| • | | Scudder Small Cap Growth Portfolio |
| • | | Scudder Strategic Income Portfolio |
| • | | Scudder Technology Growth Portfolio |
| • | | Scudder Templeton Foreign Value Portfolio |
| • | | Scudder Total Return Portfolio |
| • | | SVS Davis Venture Value Portfolio |
| • | | SVS Dreman Financial Services Portfolio |
| • | | SVS Dreman High Return Equity Portfolio |
| • | | SVS Dreman Small Cap Value Portfolio |
| • | | SVS Eagle Focused Large Cap Growth Portfolio |
| • | | SVS Focus Value+Growth Portfolio |
| • | | SVS Index 500 Portfolio |
| • | | SVS INVESCO Dynamic Growth Portfolio |
| • | | SVS Janus Growth and Income Portfolio |
| • | | SVS Janus Growth Opportunities Portfolio |
| • | | SVS MFS Strategic Value Portfolio |
| • | | SVS Oak Strategic Equity Portfolio |
| • | | SVS Turner Mid Cap Growth Portfolio |
For all listed funds (except Scudder Money Market Portfolio). The following information replaces the applicable market timing disclosure under “Buying and Selling Shares” in each portfolio’s prospectus:
Market Timing Policies and Procedures. Short-term and excessive trading of portfolio shares may present risks to the portfolio’s long-term shareholders, including potential dilution in the value of portfolio shares, interference with the efficient management of the portfolio’s portfolio (including losses on the sale of investments), taxable gains to remaining shareholders and increased brokerage and administrative costs. These risks may be more pronounced for portfolios investing in certain securities such as those that trade in foreign markets, are illiquid or do not otherwise have “readily available market quotations.” Certain investors may seek to employ short-term trading strategies aimed at exploiting variations in portfolio valuation that arise from the nature of the securities held by the portfolio (e.g., “time zone arbitrage”).
The portfolio discourages short-term and excessive trading. The portfolio will take steps to detect and deter short-term and excessive trading pursuant to the portfolio’s policies as described in this prospectus and approved by the Board. The portfolio’s policies include:
| • | | the portfolio reserves the right to reject or cancel a purchase or exchange order for any reason when, in the opinion of the Advisor, there appears to be a pattern of short-term or excessive trading activity by a shareholder or any other trading activity deemed harmful or disruptive to the portfolio; and |
| • | | the portfolio has adopted certain fair valuation practices reasonably designed to protect the portfolio from “time zone arbitrage” with respect to its foreign securities holdings and other trading practices that seek to exploit variations in portfolio valuation that arise from the nature of the securities held by the portfolio. (See “How the portfolio calculates share price” in the portfolio’s prospectus.) |
When a pattern of short-term or excessive trading activity or other trading activity deemed harmful or disruptive to the portfolio by an investor is detected, the Advisor may determine to prohibit that investor from future purchases in the portfolios or to limit or terminate the investor’s exchange privilege. The detection of these patterns and the banning of further trading are inherently subjective and therefore involve some selectivity in their application. The Advisor seeks to make such determinations in a manner consistent with the interests of the portfolio’s long-term shareholders.
There is no assurance that these policies and procedures will be effective in limiting short-term and excessive trading in all cases. For example, the Advisor may not be able to effectively monitor, detect or limit short-term or excessive trading by underlying shareholders that occurs through omnibus accounts maintained by broker-dealers or other financial intermediaries. Depending on the amount of portfolio shares held in such omnibus accounts (which may represent most of the portfolio’s shares) short-term and/or excessive trading of portfolio shares could adversely affect long-term shareholders in the portfolio. It is important to note that shareholders that invest through omnibus accounts also may be subject to the policies and procedures of their financial intermediaries with respect to short-term and excessive trading in the portfolio.
The portfolio’s policies and procedures may be modified or terminated at any time.
The following supplements the information under “Buying and Selling Shares” in both Scudder Money Market Portfolio prospectuses:
Since money market funds hold short-term instruments and are intended to provide liquidity to shareholders, the Advisor does not monitor or limit short-term and excessive trading activity in this portfolio and, accordingly, the Board of the portfolio has not approved any policies and procedures designed to limit this activity. However, the portfolio reserves the right to and may reject or cancel a purchase or exchange order into a money market fund for any reason, including if, in the opinion of the Advisor, there appears to be a pattern of short-term and excessive trading by an investor in other Scudder funds.
The following replaces the disclosure regarding fair valuation under “How the portfolio calculates share price” in each portfolio’s prospectus:
We typically value securities using information furnished by an independent pricing service or market quotations, where appropriate. However, we may use methods approved by the portfolio’s Board, such as a fair valuation model, which are intended to reflect fair value when pricing service information or market quotations are not readily available or when a security’s value or a meaningful portion of the value of the portfolio is believed to have been materially affected by a significant event, such as a natural disaster, an economic event like a bankruptcy filing, or a substantial fluctuation in domestic or foreign markets, that has occurred between the close of the exchange or market on which the security is principally traded (for example, a foreign exchange or market) and the close of the New York Stock Exchange. In such a case, the portfolio’s value for a security is likely to be different from the last quoted market price or pricing service information. In addition, due to the subjective and variable nature of fair value pricing, it is possible that the value determined for a particular asset may be materially different from the value realized upon such asset’s sale. It is expected that the greater the percentage of portfolio assets that is invested in non-US securities, the more extensive will be the portfolio’s use of fair value pricing. This is intended to reduce the portfolio’s exposure to “time zone arbitrage” and other harmful trading practices. (See “Market Timing Policies and Procedures.”)
The following supplements the “Other Policies and Risks” or “Other Policies” section of each portfolio’s prospectus:
The portfolio’s complete portfolio holdings as of the end of each calendar month are posted on www.scudder.com ordinarily on the 15th day of the following calendar month, or the first business day thereafter. This posted information generally remains accessible at least until the portfolio files its Form N-CSR or N-Q with the Securities and Exchange Commission for the period that includes the date as of which the www.scudder.com information is current (expected to be at least three months). The portfolio’s Statement of Additional Information includes a description of the portfolio’s policies and procedures with respect to the disclosure of the portfolio’s portfolio holdings.
Please Retain This Supplement for Future Reference
February 9, 2005
Scudder Variable Series II
| | • | | Scudder Total Return Portfolio |
Supplement to the currently effective prospectus
The following information replaces the disclosure for Scudder Variable Series II: Scudder Total Return Portfolio in “The Portfolio’s Main Investment Strategy” section of the prospectus.
The Portfolio’s Main Investment Strategy
The portfolio seeks high total return, a combination of income and capital appreciation.
The portfolio follows a flexible investment program, investing in a mix of growth and value stocks of large and small capitalization companies and bonds. The investment advisor employs a team approach to allocate the portfolio’s assets among the various asset classes.
The portfolio can buy many types of securities, among them common stocks, convertible securities, corporate bonds, US government bonds and mortgage- and asset-backed securities.
The portfolio normally invests approximately 60% of its net assets in common stocks and other equity securities and approximately 40% of its net assets in fixed income securities, including lower-quality debt securities. Generally, most securities are from US issuers, but the portfolio may invest up to 25% of total assets in foreign securities.
The investment advisor regularly reviews the portfolio’s investment allocations and will vary them to favor asset classes that, in their judgment, provide the most favorable return outlook consistent with the portfolio’s investment objective. In deciding how to allocate the portfolio’s assets, the advisor will evaluate projections of risk, market and economic conditions, volatility, yields and expected returns.
The advisor follows specific strategies in selecting equity and fixed securities for the portfolio.
Equity securities in the portfolio generally include “growth” stocks as well as “value” stocks and normally include stocks of both small and large companies.
Growth Stocks. In choosing these securities, the investment advisor primarily invests in US companies that it believes offer the potential for sustainable growth of revenue or earnings and whose market values appear reasonable in light of their business prospects. The advisor focuses on high quality growth companies that are leaders or potential leaders in their respective industries. The advisor conducts in-depth company research, examining, among other factors, relative growth rates, innovation, regional and global exposure and management.
Value Stocks. When selecting value stocks, the investment advisor begins by screening for stocks whose price-to-earnings ratios are below the average for the S&P 500 Index. The advisor then compares a company’s stock price to its book value, cash flow and yield, and analyzes individual companies to identify those that are financially sound and appear to have strong potential for long-term growth, but are out of favor with the market.
Small Company Stocks. In selecting stocks of small companies, a quantitative stock valuation model compares each company’s stock price to the company’s earnings, book value, sales and other measures of performance potential. The advisor also looks for factors that may signal a rebound for a company, whether through a recovery in its markets, a change in business strategy or other factors.
The advisor believes that by combining techniques used by fundamental value investors with extensive growth and earnings analysis they can minimize investment style bias and ultimately produce a “pure” stock selection process that seeks to add value in any market environment. The advisor also incorporates technical analysis to capture short-term price changes and evaluate the market’s responsiveness to new information.
Fixed income securities in the portfolio include both investment grade and lower-quality debt securities, and may include securities of both US and non-US (including emerging market) issuers.
US Investment Grade Securities. In selecting these securities for investment, the investment advisor typically:
| | • | | assigns a relative value to each bond, based on creditworthiness, cash flow and price; |
| | • | | determines the value of each issue by examining the issuer’s credit quality, debt structure, option value and liquidity risks. The advisor looks to take advantage of any inefficiencies between this value and market trading price; |
| | • | | uses credit analysis to determine the issuer’s ability to fulfill its contracts; and |
| | • | | uses a bottom-up approach which subordinates sector weightings to individual bonds that the advisor believes may add above-market value. |
The advisor generally sells these securities when they reach their target price or when there is a negative change in their outlook relative to the other securities held by the portfolio. Bonds may also be sold to facilitate the purchase of an issue with more attractive risk/return characteristics.
Foreign Debt Securities. In selecting these securities for investment, the advisor follows a bottom-up, relative value strategy. The advisor looks to purchase foreign securities that offer incremental value over US Treasuries. The advisor invests in a focused fashion, so that it is not simply investing in a basket of all non-US fixed income markets, but instead only those markets that its relative value process has identified as being the most attractive. The advisor sells securities or exchange currencies when they meet their target price objectives or when the advisor revises price objectives downward. In selecting emerging market securities, the advisor also considers short-term factors such as market sentiment, capital flows, and new issue programs.
High Yield Securities. In selecting these securities for investment, the investment advisor:
| | • | | analyzes economic conditions for improving or undervalued sectors and industries; |
| | • | | uses independent credit research and on-site management visits to evaluate individual issuer’s debt service, growth rate, and both downgrade and upgrade potential; |
| | • | | assesses new issues versus secondary market opportunities; and |
| | • | | seeks issues within attractive industry sectors and with strong long-term fundamentals and improving credits. |
The portfolio may lend its investment securities up to 33 1/3% of its total assets to approved institutional borrowers who need to borrow securities in order to complete certain transactions.
Although major changes tend to be infrequent, the Board of Trustees could change the portfolio’s investment objective without seeking shareholder approval.
Other Investments
Normally, the portfolio’s bond component consists mainly of investment-grade bonds (those in the top four grades of credit quality). However, the portfolio could invest up to 35% of its total assets in junk bonds (i.e., grade BB/Ba and below). Compared to investment-grade bonds, junk bonds may pay higher yields and typically will have higher volatility and risk of default.
Although not one of its principal investment strategies, the portfolio is permitted, but not required, to use various types of derivatives (contracts whose value is based on, for example, indexes, currencies or securities). In particular, the portfolio may use futures, currency options and forward currency transactions. The portfolio may use derivatives in circumstances where the managers believe they offer an economical means of gaining exposure to a particular asset class or to keep cash on hand to meet shareholder redemptions or other needs while maintaining exposure to the market.
As a temporary defensive measure, the portfolio could shift up to 100% of assets into investments such as money market securities. This measure could prevent losses, but, while engaged in a temporary defensive position, the portfolio will not be pursuing its investment objective. However, the advisor may choose not to use these strategies for various reasons, even in very volatile market conditions.
The following information supplements “The Main Risks of Investing in the Portfolio” section.
Value Investing Risk. As with any investment strategy, the “value” strategy used in managing the portfolio will, at times, perform better than or worse than other investment styles and the overall market. If the advisor overestimates the value or return potential of one or more common stocks, the portfolio may underperform the general equity market. Value stocks may also be out of favor for certain periods in relation to growth stocks.
Small Company Capitalization Risk. Small company stocks tend to experience steeper price fluctuations — down as well as up — than the stocks of larger companies. A shortage of reliable information — the same information gap that creates opportunity — can also pose added risk. Industry-wide reversals may have a greater impact on small companies, since they lack a large company’s financial resources. Small company stocks are typically less liquid than large company stocks: when things are going poorly, it is harder to find a buyer for a small company’s shares.
Foreign Investment Risk. To the extent that the portfolio holds the securities of companies based outside the US, it faces the risks inherent in foreign investing. Adverse political, economic or social developments could undermine the value of the portfolio’s investments or prevent the portfolio from realizing their full value. Financial reporting standards for companies based in foreign markets differ from those in the US. Additionally, foreign securities markets generally are smaller and less liquid than the US markets. These risks tend to be greater in emerging markets, so to the extent the portfolio invests in emerging markets, it takes on greater risks. Finally, the currency of the country in which the portfolio has invested could decline relative to the value of the US dollar, which would decrease the value of the investment to US investors.
The following information supplements the disclosure under “The Investment Advisor.”
Scudder Total Return Portfolio’s Board has approved a subadvisory agreement between DeIM and Deutsche Asset Management Investment Services Ltd. (“DeAMIS”). DeAMIS, One Appold Street, London, England, an affiliate of the advisor, is the subadvisor to the Scudder Total Return Portfolio. DeAMIS renders investment advisory and management services including services related to foreign securities, foreign currency transactions and related investments with regard to the portion of the portfolio that is allocated to it by DeIM from time-to-time for management. DeAMIS provides a full range of international investment advisory services to institutional and retail clients. DeAMIS is an indirect, wholly owned subsidiary of Deutsche Bank AG. DeIM compensates DeAMIS out of the management fee it receives from the Scudder Total Return Portfolio.
The following information replaces the disclosure under “The Portfolio Managers.”
The portfolio is managed by a team of investment professionals who share responsibility for the portfolio’s investment management decisions.
| | | | |
| Julie M. Van Cleave | | J. Christopher Gagnier | | Arnim S. Holzer |
| | |
| CFA, Managing Director of Deutsche Asset Management and Portfolio Manager of the portfolio. | | Managing Director of Deutsche Asset Management and Portfolio Manager of the portfolio. | | Director of Deutsche Asset Management and Portfolio Manager of the portfolio. |
| | |
• Joined Deutsche Asset Management and the portfolio in 2002. | | • Joined Deutsche Asset Management in 1997 and the portfolio in 2002. | | • Joined Deutsche Asset Management in 1999, having served with the equity and fixed-income investment committees. |
| | |
• Head of Large Cap Growth Portfolio Selection Team. | | • Prior to that, portfolio manager, Paine Webber, from 1984 to 1997. | | • Senior Investment Strategist for Asset Allocation. |
| | |
• Previous experience includes 18 years of investment industry experience at Mason Street Advisors, as Managing Director and team leader for the large cap investment team. • MBA, University of Wisconsin — Madison. | | • Began investment career in 1979. • MBA, University of Chicago. | | • Previous experience includes 18 years of investment industry experience, including 3 years managing Emerging Markets Fixed Income, Emerging Markets Equity and Emerging Markets balanced accounts at Deltec Asset Management Corporation. • Joined the portfolio in 2004. • MBA, Fordham University. |
| | |
| Thomas F. Sassi | | Andrew P. Cestone | | Brett Diment |
| | |
| Managing Director of Deutsche Asset Management and Portfolio Manager of the portfolio. | | Managing Director of Deutsche Asset Management and Portfolio Manager of the portfolio. | | Managing Director of Deutsche Asset Management and Portfolio Manager of the portfolio. |
| | |
• Joined Deutsche Asset Management in 1996 and the portfolio in 2004. | | • Joined Deutsche Asset Management in 1998 and the portfolio in 2002. | | • Joined Deutsche Asset Management in 1991 and the portfolio in 2003. |
| | |
• Over 32 years of investment industry experience. • MBA, Hofstra University. | | • Head of Core Plus Fixed Income. • Prior to that, investment analyst, Phoenix Investment Partners, from 1997 to 1998. • Prior to that, credit officer, asset based lending group, Fleet Bank, from 1995 to 1997. | | • Head of Emerging Market Debt for London Fixed Income and responsible for coordinating research into Continental European markets and managing global fixed income, balanced and cash-based portfolios: London. • Began investment career in 1991. |
Supplement to the currently effective prospectus of each of the listed portfolios/funds:
Scudder Variable Series I
| | • | | 21st Century Growth Portfolio |
| | • | | Capital Growth Portfolio |
| | • | | Global Discovery Portfolio |
| | • | | Growth and Income Portfolio |
| | • | | Health Sciences Portfolio |
| | • | | International Portfolio |
Scudder Variable Series II
| | • | | Scudder Aggressive Growth Portfolio |
| | • | | Scudder Blue Chip Portfolio |
| | • | | Scudder Large Cap Value Portfolio |
| | • | | Scudder Fixed Income Portfolio |
| | • | | Scudder Global Blue Chip Portfolio |
| | • | | Scudder Government & Agency Securities Portfolio |
| | • | | Scudder Growth Portfolio |
| | • | | Scudder High Income Portfolio |
| | • | | Scudder International Select Equity Portfolio |
| | • | | Scudder Money Market Portfolio |
| | • | | Scudder Small Cap Growth Portfolio |
| | • | | Scudder Strategic Income Portfolio |
| | • | | Scudder Technology Growth Portfolio |
| | • | | Scudder Total Return Portfolio |
| | • | | SVS Davis Venture Value Portfolio |
| | • | | SVS Dreman Financial Services Portfolio |
| | • | | SVS Dreman High Return Equity Portfolio |
| | • | | SVS Dreman Small Cap Value Portfolio |
| | • | | SVS Eagle Focused Large Cap Growth Portfolio |
| | • | | SVS Focus Value + Growth Portfolio |
| | • | | SVS Index 500 Portfolio |
| | • | | SVS INVESCO Dynamic Growth Portfolio |
| | • | | SVS Janus Growth And Income Portfolio |
| | • | | SVS Janus Growth Opportunities Portfolio |
| | • | | SVS MFS Strategic Value Portfolio |
| | • | | SVS Oak Strategic Equity Portfolio |
| | • | | SVS Turner Mid Cap Growth Portfolio |
Scudder Investments VIT Funds
Scudder VIT Equity 500 Index Fund
Scudder VIT EAFE Equity Index Fund
Scudder VIT Small Cap Index Fund
Scudder VIT Real Estate Securities Portfolio
The following information is added to the prospectus of each portfolios/funds under the heading “Who Manages and Oversees the Portfolios/Funds”:
Regulatory and Litigation Matters
Since at least July 2003, federal, state and industry regulators have been conducting ongoing inquiries and investigations (“inquiries”) into the mutual fund industry, and have requested information from numerous mutual fund companies, including Scudder Investments. We are unable to determine what the outcome of these inquiries will be or what the effect, if any, would be on the portfolios/funds or their advisors. Publicity about mutual fund practices arising from these industry-wide inquiries serves as the general basis of a number of private lawsuits against the Scudder portfolios/funds. These lawsuits, which previously have been reported in the press, involve purported class action and derivative lawsuits, making various allegations and naming as defendants various persons, including certain Scudder portfolios/funds, Deutsche Asset Management (“DeAM”) and its affiliates, certain individuals, including in some cases portfolio/fund Trustees, and other parties. DeAM has undertaken to bear all liabilities and expenses incurred by the Scudder portfolios/funds in connection with these lawsuits, or other lawsuits or regulatory actions that may be filed making allegations similar to these lawsuits regarding fund valuation, market timing, revenue sharing or other subjects of the pending inquiries. Based on currently available information, DeAM believes the likelihood that the pending lawsuits will have a material adverse financial impact on a Scudder portfolio/fund is remote and such actions are not likely to materially affect its ability to perform under its investment management agreements with the Scudder portfolios/funds.
June 1, 2004
Scudder Variable Series II
| | • | | Scudder Total Return Portfolio |
Prospectus
May 1, 2004
Class A Shares
This prospectus should be read in conjunction with the variable life insurance or variable annuity contract prospectus. These shares are available and are being marketed exclusively as a pooled funding vehicle for life insurance companies writing all types of variable life insurance policies and variable annuity contracts.
The Securities and Exchange Commission (SEC) does not approve or disapprove these shares or determine whether the information in this prospectus is truthful or complete. It is a criminal offense for anyone to inform you otherwise.
Table of Contents
How the Portfolio Works
The portfolio is designed to serve as an investment option for certain variable annuity contracts and variable life insurance policies. Your investment in the portfolio is made in conjunction with one of these contracts or policies.
Remember that the portfolio is not a bank deposit. It’s not insured or guaranteed by the FDIC or any other government agency. Its share price will go up and down, and you could lose money by investing in it.
Please read this prospectus in conjunction with the prospectus for your variable life insurance policy or variable annuity contract.
Scudder Total Return Portfolio
The Portfolio’s Main Investment Strategy
The portfolio seeks high total return, a combination of income and capital appreciation.
The portfolio follows a flexible investment program, investing in a mix of growth stocks and bonds.
The portfolio can buy many types of securities, among them common stocks, convertible securities, corporate bonds, US government bonds and mortgage- and asset-backed securities. In deciding which types of securities to buy, the managers consider the relative attractiveness of growth stocks and bonds and determine allocations for each. Their decisions are based on a number of factors including interest rates and general market conditions. Generally, most are from US issuers, but the portfolio may invest up to 25% of total assets in foreign securities.
In choosing individual stocks, the managers favor large companies that have the potential to display above-average earnings growth, attractive prices relative to potential growth, sound financial strength and effective management, among other factors.
The portfolio managers may shift the proportion of the portfolio’s holdings, at different times favoring stocks or bonds (and within those asset classes, different types of securities), while still maintaining variety in terms of the securities, issuers, industries and economic sectors represented.
The portfolio managers will normally sell a stock when the managers believe its price is unlikely to go higher, the company’s fundamentals have changed, other investments offer better opportunities or in the course of adjusting the portfolio’s emphasis on a given industry.
In deciding what types of bonds to buy and sell, the managers consider their relative potential for stability and attractive income, and other factors such as credit quality and market conditions. The portfolio may invest in bonds of any duration.
The portfolio may lend its investment securities up to 33 1/3% of its total assets to approved institutional borrowers who need to borrow securities in order to complete certain transactions.
Although major changes tend to be infrequent, the Board of Trustees could change the portfolio’s investment objective without seeking shareholder approval.
Other Investments
Normally, this portfolio’s bond component consists mainly of investment-grade bonds (those in the top four grades of credit quality). However, the portfolio could invest up to 35% of its total assets in junk bonds (i.e., grade BB/Ba and below). Compared to investment-grade bonds, junk bonds may pay higher yields and typically will have higher volatility and risk of default.
Although not one of its principal investment strategies, the portfolio is permitted, but not required, to use various types of derivatives (contracts whose value is based on, for example, indices, currencies or securities). In particular, the portfolio may use futures, currency options and forward currency transactions. The portfolio may use derivatives in circumstances where the managers believe they offer an economical means of gaining exposure to a particular asset class or to keep cash on hand to meet shareholder redemptions or other needs while maintaining exposure to the market.
As a temporary defensive measure, the portfolio could shift up to 100% of assets into investments such as money market securities. This measure could prevent losses, but, while engaged in a temporary defensive position, the portfolio will not be pursuing its investment objective. However, the portfolio managers may choose not to use these strategies for various reasons, even in very volatile market conditions.
The Main Risks of Investing in the Portfolio
There are several risk factors that could hurt the portfolio’s performance, cause you to lose money or cause the portfolio’s performance to trail that of other investments.
Stock Market Risk. As with most stock portfolios, an important factor with this portfolio is how stock markets perform — in this case, the large company portion of the US stock market. When prices of these stocks fall, you should expect the value of your investment to fall as well. Large company stocks at times may not perform as well as stocks of smaller or mid-sized companies. Because a stock represents ownership in its issuer, stock prices can be hurt by poor management, shrinking product demand and other business risks. These may affect single companies as well as groups of companies. In addition, movements in financial markets may adversely affect a stock’s price, regardless of how well the company performs. The market as a whole may not favor the types of investments the portfolio makes and the portfolio may not be able to get attractive prices for them.
3
Industry Risk. While the portfolio does not concentrate in any industry, to the extent that the portfolio has exposure to a given industry or sector, any factors affecting that industry or sector could affect the value of portfolio securities. For example, manufacturers of consumer goods could be hurt by a rise in unemployment, or technology companies could be hurt by such factors as market saturation, price competition and rapid obsolescence.
Credit Risk. A portfolio purchasing bonds faces the risk that the creditworthiness of the issuer may decline, causing the value of its bonds to decline. In addition, an issuer may be unable or unwilling to make timely payments on the interest and principal on the bonds it has issued. Because the issuers of junk bonds (rated below the fourth highest category) may be in uncertain financial health, the prices of their bonds can be more vulnerable to bad economic news or even the expectation of bad news, than investment-grade bonds. In some cases, bonds may decline in credit quality or go into default. Because this portfolio may invest in securities not paying current interest or in securities already in default, these risks may be more pronounced.
Interest Rate Risk. Generally, fixed income securities will decrease in value when interest rates rise. The longer the effective maturity of the portfolio’s securities, the more sensitive it will be to interest rate changes. (As a general rule, a 1% rise in interest rates means a 1% fall in value for every year of duration.) As interest rates decline, the issuers of securities held by the portfolio may prepay principal earlier than scheduled, forcing the portfolio to reinvest in lower yielding securities. This prepayment may reduce the portfolio’s income. As interest rates increase, slower than expected principal payments may extend the average life of fixed income securities. This will have the effect of locking in a below-market interest rate, increasing the portfolio’s duration and reducing the value of such a security. Because the portfolio may invest in mortgage-related securities, it is more vulnerable to both of these risks.
Derivatives Risk. Risks associated with derivatives include: the risk that the derivative is not well correlated with the security, index or currency to which it relates; the risk that derivatives used for risk management may not have the intended effects and may result in losses or missed opportunities; the risk that the portfolio will be unable to sell the derivative because of an illiquid secondary market; the risk that a counterparty is unwilling or unable to meet its obligation; the risk of interest rate movements; and the risk that the derivatives transaction could expose the portfolio to the effects of leverage, which could increase the portfolio’s exposure to the market and magnify potential losses. There is no guarantee that derivatives activities will be employed or that they will work, and their use could cause lower returns or even losses to the portfolio.
Securities Lending Risk. Any loss in the market price of securities loaned by the portfolio that occurs during the term of the loan would be borne by the portfolio and would adversely affect the portfolio’s performance. Also, there may be delays in recovery of securities loaned or even a loss of rights in the collateral should the borrower of the securities fail financially while the loan is outstanding. However, loans will be made only to borrowers selected by the portfolio’s delegate after a review of relevant facts and circumstances, including the creditworthiness of the borrower.
Pricing Risk. At times, market conditions might make it hard to value some investments. For example, if the portfolio has valued its securities too highly, you may end up paying too much for portfolio shares when you buy into the portfolio. If the portfolio underestimates their price, you may not receive the full market value for your portfolio shares when you sell.
Other factors that could affect performance include:
| | • | | the managers could be incorrect in their analysis of industries, companies, economic trends, the relative attractiveness of different securities or other matters; |
| | • | | the advisor measures credit quality at the time it buys securities, using independent rating agencies or, for unrated securities, judged by the advisor to be of equivalent quality. In addition, the advisor applies its own credit quality standards to evaluate securities. If a security’s credit quality declines, the advisor will decide what to do with the security, based on the circumstances and its assessment of what would benefit shareholders most; and |
| | • | | foreign securities tend to be more volatile than their US counterparts, for reasons such as currency fluctuations and political and economic uncertainty. |
Because the portfolio invests in a mix of stocks and bonds, this portfolio could make sense for investors seeking asset class diversification in a single investment portfolio.
4
Performance
While a portfolio’s past performance isn’t necessarily a sign of how it will do in the future, it can be valuable information for an investor to know.
The bar chart shows how the returns for the portfolio’s Class A shares have varied from year to year, which may give some idea of risk. The table shows how average annual returns for the portfolio’s Class A shares compare with three broad-based market indices (which, unlike the portfolio, do not have any fees or expenses). The performance of both the portfolio and the indices varies over time. All figures on this page assume reinvestment of dividends and distributions.
This information doesn’t reflect charges and fees associated with the separate account that invests in the portfolio or any variable life insurance policy or variable annuity contract for which the portfolio is an investment option. These charges and fees will reduce returns.
Annual Total Returns (%) as of 12/31 each year — Class A shares
THE ORIGINAL DOCUMENT CONTAINS A BAR CHART HERE
| | | | | | | | | | | | | | | | | | |
-9.49 | | 25.97 | | 16.76 | | 19.96 | | 15.14 | | 14.81 | | -2.63 | | -6.09 | | -15.17 | | 18.10 |
1994 | | 1995 | | 1996 | | 1997 | | 1998 | | 1999 | | 2000 | | 2001 | | 2002 | | 2003 |
For the periods included in the bar chart:
| | |
| Best Quarter: 13.32%, Q2 1997 | | Worst Quarter: -9.91%, Q2 2002 |
| |
| 2004 Total Return as of March 31: 2.16% | | |
Average Annual Total Returns (%) as of 12/31/2003
| | | | | | |
| | | 1 Year
| | 5 Years
| | 10 Years
|
Portfolio — Class A | | 18.10 | | 1.02 | | 6.82 |
Index 1 | | 28.68 | | -0.57 | | 11.07 |
Index 2 | | 4.10 | | 6.62 | | 6.95 |
Index 3 | | 29.75 | | -5.11 | | 9.21 |
Index 1: The Standard & Poor’s (S&P) 500 Index is a capitalization-weighted index of 500 stocks designed to measure performance of the broad domestic economy through changes in the aggregate market value of 500 stocks representing all major industries.
Index 2: The Lehman Brothers Aggregate Bond Index is an index comprised of approximately 6,000 publicly traded bonds including US Government, mortgage-backed, corporate, and yankee bonds with an approximate average maturity of 10 years.
Index 3: The Russell 1000 Growth Index is an unmanaged index composed of common stocks of larger US companies with greater-than-average orientation.
Current performance information may be higher or lower than the performance data quoted above. For more recent performance information, contact your participating insurance company.
5
How Much Investors Pay
This table describes the fees and expenses that you may pay if you buy and hold portfolio shares. The information in the table does not reflect charges and fees associated with the separate account that invests in the portfolio or any variable life insurance policy or variable annuity contract for which the portfolio is an investment option. These charges and fees will increase expenses.
| | | |
Fee Table
| | Class A
| |
Annual Operating Expenses, deducted from portfolio assets | | | |
Management Fee | | 0.55 | % |
Distribution/Service (12b-1) Fee | | None | |
Other Expenses | | 0.04 | |
| | |
|
|
Total Annual Operating Expenses | | 0.59 | |
| | |
|
|
Based on the costs above, this example helps you compare the expenses of Class A shares to those of other mutual funds. This example assumes the expenses above remain the same. It also assumes that you invested $10,000, earned 5% annual returns, reinvested all dividends and distributions and sold your shares at the end of each period. This is only an example; actual expenses will be different.
| | | | | | | | | | | | |
Example
| | 1 Year
| | 3 Years
| | 5 Years
| | 10 Years
|
Class A shares | | $ | 60 | | $ | 189 | | $ | 329 | | $ | 738 |
6
The Portfolio Managers
The following people handle the day-to-day management of the portfolio:
The portfolio is managed by three teams of investment professionals who share responsibility for the portfolio’s investment management decisions.
Equity Team
Julie M. Van Cleave
CFA, Managing Director of Deutsche Asset Management and Lead Portfolio Manager of the portfolio.
| | • | | Joined Deutsche Asset Management and the portfolio in 2002. |
| | • | | Head of Large Cap Growth Portfolio Selection Team. |
| | • | | Previous experience includes 18 years’ investment industry experience at Mason Street Advisors, most recently serving as Managing Director and team leader for the large cap investment team. |
| | • | | MBA, University of Wisconsin — Madison. |
Jack A. Zehner
Director of Deutsche Asset Management and Portfolio Manager of the portfolio.
| | • | | Joined Deutsche Asset Management and the portfolio in 2002. |
| | • | | Previous experience includes nine years’ investment industry experience at Mason Street Advisors where he served most recently as Director — Common Stock. |
| | • | | MBA, Marquette University. |
Thomas J. Schmid
CFA, Director of Deutsche Asset Management and Portfolio Manager of the portfolio.
| | • | | Joined Deutsche Asset Management and the portfolio in 2002. |
| | • | | Previous experience includes 15 years’ investment industry experience, most recently serving as Director — Common Stock at Mason Street Advisors. |
| | • | | MBA, University of Chicago. |
Fixed Income Team
J. Christopher Gagnier
Managing Director of Deutsche Asset Management and Portfolio Manager of the portfolio.
| | • | | Joined Deutsche Asset Management in 1997 and the portfolio in 2002. |
| | • | | Prior to that, portfolio manager, Paine Webber, from 1984 to 1997. |
| | • | | Began investment career in 1979. |
| | • | | MBA, University of Chicago. |
Gary W. Bartlett
CFA, Managing Director of Deutsche Asset Management and Portfolio Manager of the portfolio.
| | • | | Joined Deutsche Asset Management in 1992 and the portfolio in 2002. |
| | • | | Began investment career in 1982. |
| | • | | MBA, Drexel University. |
Warren S. Davis
Managing Director of Deutsche Asset Management and Portfolio Manager of the portfolio.
| | • | | Joined Deutsche Asset Management in 1995 and the portfolio in 2002. |
| | • | | Began investment career in 1985. |
| | • | | MBA, Drexel University. |
Daniel R. Taylor
CFA, Managing Director of Deutsche Asset Management and Portfolio Manager of the portfolio.
| | • | | Joined Deutsche Asset Management in 1998 and the portfolio in 2002. |
| | • | | Prior to that, fixed income portfolio manager, asset-backed securities analyst and senior credit analyst, CoreStates Investment Advisors, from 1992 to 1998. |
| | • | | Began investment career in 1992. |
Thomas J. Flaherty
Managing Director of Deutsche Asset Management and Portfolio Manager of the portfolio.
| | • | | Joined Deutsche Asset Management in 1995 and the portfolio in 2002. |
| | • | | Began investment career in 1984. |
Andrew P. Cestone
Managing Director of Deutsche Asset Management and Portfolio Manager of the portfolio.
| | • | | Joined Deutsche Asset Management in 1998 and the portfolio in 2002. |
| | • | | Prior to that, investment analyst, Phoenix Investment Partners, from 1997 to 1998. |
| | • | | Prior to that, credit officer, asset based lending group, Fleet Bank, from 1995 to 1997. |
William T. Lissenden
Director of Deutsche Asset Management and Portfolio Manager of the portfolio.
| | • | | Joined Deutsche Asset Management in 2002 and the portfolio in 2003. |
| | • | | Prior to that, fixed income strategist and director of research at Conseco Capital Management, director of fixed income research and product management at Prudential Securities, national sales manager for fixed income securities at Prudential Securities and institutional sales professional at several firms including Prudential, Goldman Sachs and Merrill Lynch. |
Timothy C. Vile
CFA, Managing Director of Deutsche Asset Management and Portfolio Manager of the portfolio.
| | • | | Joined Deutsche Asset Management in 1991 and the portfolio in 2003. |
| | • | | Prior to that, portfolio manager for fixed income portfolios at Equitable Capital Management. |
| | • | | Began investment career in 1984. |
Brett Diment
Managing Director of Deutsche Asset Management and Consultant to the portfolio.
| | • | | Joined Deutsche Asset Management in 1991 and the portfolio in 2003. |
| | • | | Head of Emerging Market Debt for London Fixed Income and responsible for coordinating research into Continental European markets and managing global fixed income, balanced and cash based portfolios: London. |
| | • | | Began investment career in 1991. |
Asset Allocation Team
Janet Campagna
Managing Director of Deutsche Asset Management and Portfolio Manager of the portfolio.
| | • | | Joined Deutsche Asset Management in 1999 and the portfolio in 2002. |
| | • | | Head of global and tactical asset allocation. |
| | • | | Investment strategist and manager of the asset allocation strategies group for Barclays Global Investors from 1994 to 1999. |
| | • | | Over 16 years of investment industry experience. |
| | • | | Master’s degree in Social Science from California Institute of Technology. |
| | • | | Ph.D in Political Science from University of California at Irvine. |
7
Financial Highlights
This table is designed to help you understand the portfolio’s financial performance. The figures in the first part of the table are for a single share. The total return figures represent the percentage that an investor in the portfolio would have earned (or lost), assuming all dividends and distributions were reinvested. This information has been audited by Ernst & Young LLP, independent auditors, whose report, along with the portfolio’s financial statements, is included in the portfolio’s annual report (see “Shareholder reports” on the back cover).
The following table includes selected data for a share outstanding throughout each period and other performance information derived from the financial statements.
Scudder Total Return Portfolio — Class A
| | | | | | | | | | | | | | | | | | | | |
Years Ended December 31,
| | 2003
| | | 2002
| | | 2001^a
| | | 2000^b
| | | 1999^b
| |
Selected Per Share Data | | | | | | | | | | | | | | | | | | | | |
Net asset value, beginning of period | | $ | 18.66 | | | $ | 22.57 | | | $ | 25.91 | | | $ | 28.82 | | | $ | 27.35 | |
Income (loss) from investment operations: | | | | | | | | | | | | | | | | | | | | |
Net investment income (loss)^c | | | .37 | | | | .47 | | | | .61 | | | | .74 | | | | .84 | |
Net realized and unrealized gain (loss) on investment transactions | | | 2.90 | | | | (3.81 | ) | | | (2.20 | ) | | | (1.40 | ) | | | 3.03 | |
| | |
|
|
| |
|
|
| |
|
|
| |
|
|
| |
|
|
|
Total from investment operations | | | 3.27 | | | | (3.34 | ) | | | (1.59 | ) | | | (.66 | ) | | | 3.87 | |
| | |
|
|
| |
|
|
| |
|
|
| |
|
|
| |
|
|
|
Less distributions from: | | | | | | | | | | | | | | | | | | | | |
Net investment income | | | (.61 | ) | | | (.57 | ) | | | (.80 | ) | | | (.90 | ) | | | (.90 | ) |
Net realized gains on investment transactions | | | — | | | | — | | | | (.95 | ) | | | (1.35 | ) | | | (1.50 | ) |
| | |
|
|
| |
|
|
| |
|
|
| |
|
|
| |
|
|
|
Total distributions | | | (.61 | ) | | | (.57 | ) | | | (1.75 | ) | | | (2.25 | ) | | | (2.40 | ) |
| | |
|
|
| |
|
|
| |
|
|
| |
|
|
| |
|
|
|
Net asset value, end of period | | $ | 21.32 | | | $ | 18.66 | | | $ | 22.57 | | | $ | 25.91 | | | $ | 28.82 | |
Total Return (%) | | | 18.10 | | | | (15.17 | ) | | | (6.09 | ) | | | (2.63 | ) | | | 14.81 | |
| | |
|
|
| |
|
|
| |
|
|
| |
|
|
| |
|
|
|
| | | | | |
Ratios to Average Net Assets and Supplemental Data | | | | | | | | | | | | | | | | | | | | |
Net assets, end of period ($ millions) | | | 667 | | | | 640 | | | | 861 | | | | 851 | | | | 952 | |
Ratio of expenses (%) | | | .59 | | | | .58 | | | | .58 | | | | .61 | | | | .61 | |
Ratio of net investment income (loss) (%) | | | 1.88 | | | | 2.32 | | | | 2.63 | | | | 2.75 | | | | 3.12 | |
Portfolio turnover rate (%) | | | 102 | ^d | | | 140 | | | | 115 | | | | 107 | | | | 80 | |
| ^a | As required, effective January 1, 2001, the portfolio adopted the provisions of the AICPA Audit and Accounting Guide for Investment Companies and began amortizing premium on debt securities. In addition, paydowns on mortgage-backed securities which were included in realized gain/loss on investment transactions prior to January 1, 2001 were included as interest income. The effect of this change for the year ended December 31, 2001 was to decrease net investment income per share by $.03, increase net realized and unrealized gains and losses per share by $.03 and decrease the ratio of net investment income to average net assets from 2.76% to 2.63%. Per share, ratios and supplemental data for periods prior to January 1, 2001 were not restated to reflect this change in presentation. |
| ^b | On June 18, 2001, the portfolio implemented a 1 for 10 reverse stock split. Per share information, for the periods prior to December 31, 2001, has been restated to reflect the effect of the split. Shareholders received 1 share for every 10 shares owned and net asset value per share increased correspondingly. |
| ^c | Based on average shares outstanding during the period. |
| ^d | The portfolio turnover rate including mortgage dollar roll transactions was 108% for the year ended December 31, 2003. |
8
Other Policies and Risks
While the previous pages describe the main points of the portfolio’s strategy and risks, there are a few other issues to know about:
| | • | | The portfolio may trade securities actively. This strategy could raise transaction costs and lower performance. |
| | • | | The advisor or the portfolio’s subadvisor may establish a debt security’s credit quality when it buys a security, using independent ratings, or for unrated securities, its own credit determination. When ratings don’t agree, the portfolio may use the higher rating. If a security’s credit quality falls, the advisor or subadvisor will determine whether selling it would be in the portfolio’s best interest. |
This prospectus doesn’t tell you about every policy or risk of investing in the portfolio. If you want more information on the portfolio’s allowable securities and investment practices and its characteristics and risks, you may want to request a copy of the Statement of Additional Information (the back cover tells you how to do this).
Keep in mind that there is no assurance that any mutual fund will achieve its goal.
Investment Advisor
Deutsche Investment Management Americas Inc. (“DeIM” or the “advisor”), which is part of Deutsche Asset Management, is the investment advisor for the portfolio. Under the supervision of the Board of Trustees, DeIM, with headquarters at 345 Park Avenue, New York, NY, or its subadvisors makes the portfolio’s investment decisions, buys and sells securities for the portfolio and conducts research that leads to these purchase and sale decisions. DeIM has more than 80 years of experience managing mutual funds and provides a full range of investment advisory services to institutional and retail clients. The portfolio’s investment advisor or the subadvisor is also responsible for selecting brokers and dealers and for negotiating brokerage commissions and dealer charges.
Scudder Investments is part of Deutsche Asset Management, which is the marketing name in the US for the asset management activities of Deutsche Bank AG, DeIM, Deutsche Asset Management, Inc., Deutsche Asset Management Investment Services Ltd. (“DeAMIS”), Deutsche Bank Trust Company Americas and Scudder Trust Company.
Deutsche Asset Management is a global asset management organization that offers a wide range of investing expertise and resources, including hundreds of portfolio managers and analysts and an office network that reaches the world’s major investment centers. This well-resourced global investment platform brings together a wide variety of experience and investment insight, across industries, regions, asset classes and investing styles.
DeIM is an indirect, wholly owned subsidiary of Deutsche Bank AG. Deutsche Bank AG is a major global banking institution that is engaged in a wide range of financial services, including investment management, mutual fund, retail, private and commercial banking, investment banking and insurance.
The advisor receives a management fee from the portfolio. Below is the actual rate paid by the portfolio for the 12 months through the most recent fiscal year end, as a percentage of the portfolio’s average daily net assets:
| | | |
Portfolio Name
| | Fee Paid
| |
Scudder Total Return Portfolio | | 0.55 | % |
9
Your Investment in the Portfolio
The information in this section may affect anyone who selects the portfolio as an investment option in a variable annuity contract or variable life insurance policy that offers the portfolio. These contracts and policies are described in separate prospectuses issued by participating insurance companies. The portfolio assumes no responsibility for such prospectuses.
Policies about transactions
The information in this prospectus applies to Class A shares of the portfolio. Class A shares are offered at net asset value. The portfolio has another class of shares which is offered separately.
Technically, the shareholders of Scudder Variable Series II (which includes the portfolio just described) are the participating insurance companies (the “insurance companies”) that offer the portfolio as a choice for holders of certain variable annuity contracts or variable life insurance policies (the “contract(s)”) issued or sponsored by the insurance companies. The insurance companies effectively pass through the ownership of portfolio shares to their contract owners and some may pass through voting rights as well. The portfolio does not sell shares directly to the public. The portfolio sells shares only to separate accounts of insurance companies. As a contract owner, your premium payments are allocated to the portfolio by the insurance companies in accordance with your contract. Please see the contract prospectus that accompanies this prospectus for a detailed explanation of your contract.
Please bear in mind that there are important differences between funds available to any investor (a “Retail Fund”) and those that are only available through certain financial institutions, such as insurance companies. For example, Retail Funds, unlike the portfolio, are not sold to insurance company separate accounts to support investments in variable insurance contracts. In addition, the investment objectives, policies and strategies of the portfolio, while similar to those of a Retail Fund, may not be identical. Retail Funds may be smaller or larger than the portfolio and have different expense ratios than the portfolio. As a result, the performance of the portfolio and a Retail Fund will differ.
Should any conflict between contract owners arise that would require that a substantial amount of net assets be withdrawn from the portfolio, orderly portfolio management could be disrupted to the potential detriment of contract owners in the portfolio.
The portfolio has a verification process for new insurance company accounts to help the government fight the funding of terrorism and money laundering activities. Federal law requires all financial institutions to obtain, verify and record information that identifies each insurance company that opens an account. What this means to you: When an insurance company opens an account, the portfolio will ask for its name, address and other information that will allow the portfolio to identify the company. This information will be verified to ensure the identity of all insurance companies opening an account.
For certain insurance companies, the portfolio might request additional information (for instance, the portfolio would ask for documents such as the insurance company’s articles of incorporation) to help the portfolio verify the insurance company’s identity.
The portfolio will not complete the purchase of any shares for an account until all information has been provided and the application has been submitted in “good order.” Once the application is determined to be in good order, the purchase(s) will be effected at the net asset value per share next calculated.
The portfolio may reject a new account application if the insurance company doesn’t provide any required or requested identifying information, or for other reasons.
The advisor, Scudder Distributors, Inc. and/or their affiliates may pay additional compensation from their own assets to other persons for selling, distributing and/or servicing portfolio shares. This compensation may be significant. You should talk to your insurance company to determine if this compensation influenced the advisor’s recommendation of the portfolio.
10
Buying and Selling Shares
The portfolio is open for business each day the New York Stock Exchange is open. The portfolio calculates its share price every business day, as of the close of regular trading on the Exchange (typically 4 p.m. Eastern time, but sometimes earlier, as in the case of scheduled half-day trading or unscheduled suspensions of trading).
The portfolio continuously sells shares to each insurance company, without a sales charge, at the net asset value per share next determined after a proper purchase order is placed with the insurance company. The insurance company offers contract owners units in its separate accounts which directly correspond to shares in the portfolio. Each insurance company submits purchase and redemption orders to the portfolio based on allocation instructions for premium payments, transfer instructions and surrender or partial withdrawal requests for contract owners, as set forth in the accompanying prospectus for the contracts. These orders reflect the amount of premium payments to be invested, surrender and transfer requests, and other matters. Redemption orders are effected at the next net asset value per share determined after a proper redemption order is placed with the insurance company. Contract owners should look at their contract prospectuses for redemption procedures and fees.
Important information about buying and selling shares
| | • | | After receiving a contract owner’s order, the insurance company buys or sells shares at the net asset value next calculated on any day the portfolio is open for business. |
| | • | | Unless otherwise instructed, the portfolio normally makes payment of the proceeds from the sale of shares the next business day but always within seven calendar days. |
| | • | | The portfolio does not issue share certificates. |
| | • | | The portfolio reserves the right to reject purchases of shares for any reason. |
| | • | | The portfolio reserves the right to withdraw or suspend the offering of shares at any time. |
| | • | | The portfolio reserves the right to reject purchases of shares or to suspend or postpone redemptions at times when the New York Stock Exchange is closed (other than customary closings), trading is restricted or when an emergency exists that prevents the portfolio from disposing of its portfolio securities or pricing its shares. |
| | • | | The portfolio may refuse, cancel or rescind any purchase order; freeze any account (meaning the insurance company will not be able to purchase shares in its account); suspend account services; and/or involuntarily redeem the account if we think that the account is being used for fraudulent or illegal purposes by the insurance company, one or more of these actions will be taken when, at the sole discretion of the portfolio, they are deemed to be in the portfolio’s best interest or when the portfolio is requested or compelled to do so by governmental authority or by applicable law. |
| | • | | The portfolio may close and liquidate an account if the portfolio is unable to verify provided information, or for other reasons; if the portfolio decides to close the account, the shares will be redeemed at the net asset value per share next calculated after we determine to close the account; the insurance company may be subject to gain or loss on the redemption of the portfolio shares and the insurance company may incur tax liability. |
| | • | | Market timing — the frequent trading of portfolio shares designed to take advantage of short-term market movements — can harm the portfolio and its shareholders. The portfolio and its agents may reject or limit purchase orders when there appears to be a pattern of market timing or other frequent purchases and sales. Because the portfolio’s shares are offered exclusively to insurance company separate accounts that fund certain insurance contracts, the portfolio generally has little or no access to the records of individual contract holders. The portfolio is dependent on the ability of these separate accounts to limit market timing and excessive trading of portfolio shares. The portfolio is working with separate accounts to assess and improve controls against inappropriate trading. There can be no assurance that market timing in the portfolio’s shares will not occur. |
| | • | | A contract owner’s purchase order may not be accepted if the sale of portfolio shares has been suspended or if it is determined that the purchase would be detrimental to the interests of the portfolio’s shareholders. |
| | • | | Currently, the Board of Trustees of Scudder Variable Series II does not foresee any disadvantages to contract owners arising from the fact that the interests of contract owners may differ. Nevertheless, the Board intends to monitor events in order to identify any material irreconcilable conflicts that may possibly arise and to determine what action, if any, should be taken. |
How to receive account information
If you are a contract owner, you should contact your insurance company or the organization that provides record keeping services for information about your account.
Please see the contract prospectus that accompanies this prospectus for the customer service phone number.
11
How to buy and sell shares
Each insurance company has different provisions about how and when their contract owners may buy and sell portfolio shares. Each insurance company is responsible for communicating its contract owners’ instructions to the portfolio. Contract owners should contact their insurance company to effect transactions in the portfolio.
How the Portfolio Calculates Share Price
To calculate net asset value per share or NAV, the portfolio uses the following equation:
| | | | |
| | | TOTAL ASSETS - TOTAL LIABILITIES | | = NAV |
| | TOTAL NUMBER OF SHARES OUTSTANDING | |
The price at which you sell shares for the portfolio is also the NAV.
We typically value securities using market quotations or information furnished by a pricing service. However, we may use methods approved by the Board that are intended to reflect fair value when a market quotation or pricing service information is not readily available or when a security’s value is believed to have been materially affected by a significant event, such as a natural disaster, an economic event like a bankruptcy filing, or a substantial fluctuation in domestic or foreign markets, that has occurred after the close of the exchange or market on which the security is principally traded (for example, a foreign exchange or market). In such a case, the portfolio’s value for a security is likely to be different from the last quoted market price or pricing service information. In addition, due to the subjective and variable nature of fair value pricing, it is possible that the value determined for a particular security may be materially different from the value realized upon such security sale.
To the extent that the portfolio invests in securities that are traded primarily in foreign markets, the value of its holdings could change at a time when you aren’t able to buy or sell portfolio shares through the contract. This is because some foreign markets are open on days and at times when the portfolio doesn’t price their shares.
Distributions
The portfolio intends to declare and distribute dividends from its net investment income and capital gains, if any, annually. The portfolio may make additional distributions if necessary.
All distributions will be reinvested in shares of the portfolio unless we are informed by an insurance company that they should be paid out in cash. The insurance companies will be informed about the amount and character of distributions from the portfolio for federal income tax purposes.
Taxes
The portfolio intends to qualify each year as a regulated investment company under Subchapter M of the Internal Revenue Code of 1986, as amended, and to meet all requirements necessary to avoid paying any federal income or excise taxes.
Generally, owners of variable annuity and variable life contracts are not taxed currently on income or gains realized with respect to such contracts. However, some distributions from such contracts, whether made prior to or during the annuity payment period, may be taxable at ordinary income tax rates. In addition, distributions made to an owner who is younger than 59 1/2 may be subject to a 10% penalty tax. For further information concerning federal income tax consequences for the holders of variable annuity contracts and variable life insurance policies, such holders should consult the prospectus used in connection with the issuance of their particular contracts or policies.
In order for investors to receive the favorable tax treatment available to holders of variable annuity and variable life contracts, the separate accounts underlying such contracts, as well as the portfolio in which such accounts invest, must meet certain diversification requirements. The portfolio intends to comply with these requirements. If the portfolio or separate account does not meet such requirements, income allocable to the contracts associated with the separate account would be taxable currently to the holders of such contracts and income from prior periods with respect to such contracts also could be taxable.
Portfolio investments in securities of foreign issuers may be subject to withholding and other taxes at the source, including on dividend or interest payments. Participating insurance companies should consult their own tax advisors as to whether such distributions are subject to federal income tax if they are retained as part of policy reserves.
The preceding is a brief summary of certain of the relevant tax considerations. Because each shareholder and contract holder’s tax situation is unique, ask your tax professional about the tax consequences of your investments, including possible foreign, state or local taxes.
12
To Get More Information
Shareholder reports — These include commentary from the portfolio’s management team about recent market conditions and the portfolio’s performance. They also have detailed performance figures, a list of everything the portfolio owns and its financial statements. Shareholders get these reports automatically.
Statement of Additional Information (SAI) — This tells you more about the portfolio’s features and policies, including additional risk information. The SAI is incorporated by reference into this document (meaning that it’s legally part of this prospectus).
For a free copy of any of these documents or to request other information about a portfolio, call (800) 778-1482, or contact Scudder Investments at the address listed below. These documents and other information about the portfolio are available from the EDGAR Database on the SEC’s Internet site at www.sec.gov. If you like, you may obtain copies of this information, after paying a copying fee, by e-mailing a request to publicinfo@sec.gov or by writing the SEC at the address listed below. You can also review and copy these documents and other information about the portfolio, including the portfolio’s SAI, at the SEC’s Public Reference Room in Washington, D.C. Information on the operation of the SEC’s Public Reference Room may be obtained by calling (202) 942-8090.
| | |
Scudder Distributors, Inc. | | SEC |
| |
222 South Riverside Plaza Chicago, IL 60606-5808 (800)778-1482 | | 450 Fifth Street, N.W. Washington, D.C. 20549-0102 (202) 942-8090 www.sec.gov SEC File # |
| |
| |
| |
| |
| |
Scudder Variable Series II | | 811-5002 |
Supplement to the currently effective prospectus of each of the listed portfolios/funds:
Scudder Variable Series I
| | | | | | |
| | | |
| · | | 21st Century Growth Portfolio | | · | | Growth and Income Portfolio |
| | | |
| · | | Balanced Portfolio | | · | | Health Sciences Portfolio |
| | | |
| · | | Bond Portfolio | | · | | International Portfolio |
| | | |
| · | | Capital Growth Portfolio | | · | | Money Market Portfolio |
| | | |
| · | | Global Discovery Portfolio | | | | |
Scudder Investments VIT Funds
Scudder VIT Equity 500 Index Fund
Scudder VIT EAFE® Equity Index Fund
Scudder VIT Small Cap Index Fund
Scudder Real Estate Securities Portfolio
For all listed funds/portfolios (except Scudder Variable Series I Money Market Portfolio. The following information replaces the applicable market timing disclosure under “Buying and Selling Shares” in each portfolio’s/fund’s prospectus:
Market Timing Policies and Procedures. Short-term and excessive trading of portfolio/fund shares may present risks to the portfolio’s/fund’s long-term shareholders, including potential dilution in the value of portfolio/fund shares, interference with the efficient management of the portfolio’s/fund’s portfolio (including losses on the sale of investments), taxable gains to remaining shareholders and increased brokerage and administrative costs. These risks may be more pronounced for portfolios/funds investing in certain securities such as those that trade in foreign markets, are illiquid or do not otherwise have “readily available market quotations.” Certain investors may seek to employ short-term trading strategies aimed at exploiting variations in portfolio valuation that arise from the nature of the securities held by the portfolio/fund (e.g., “time zone arbitrage”).
The portfolio/fund discourages short-term and excessive trading. The portfolio/fund will take steps to detect and deter short-term and excessive trading pursuant to the portfolio’s/fund’s policies as described in this prospectus and approved by the Board.
The portfolio’s/fund’s policies include:
| · | the portfolio/fund reserves the right to reject or cancel a purchase or exchange order for any reason when, in the opinion of the Advisor, there appears to be a pattern of short-term or excessive trading activity by a shareholder or any other trading activity deemed harmful or disruptive to the portfolio/fund; and |
Page 1
| · | the portfolio/fund has adopted certain fair valuation practices reasonably designed to protect the portfolio/fund from “time zone arbitrage” with respect to its foreign securities holdings and other trading practices that seek to exploit variations in portfolio valuation that arise from the nature of the securities held by the portfolio/fund. (See “How the portfolio/fund calculates share price” in the portfolio’s/fund’s prospectus.) |
When a pattern of short-term or excessive trading activity or other trading activity deemed harmful or disruptive to the portfolio/fund is detected in a particular separate account, the Advisor will take steps to stop this activity by contacting the insurance company that maintains the accounts for the underlying contract holders and seeking to have the insurance company enforce the separate account’s policies on short-term or excessive trading, if any. In addition, the Advisor and the portfolios/funds reserve the right to terminate a separate account’s ability to invest in the portfolios/funds if apparent short-term or excessive trading activity persists. The detection of these patterns and the banning of further trading are inherently subjective and therefore involve some selectivity in their application. The Advisor seeks to make such determinations in a manner consistent with the interests of the portfolio’s/fund’s long-term shareholders.
There is no assurance that these policies and procedures will be effective in limiting short-term and excessive trading in all cases. For example, the Advisor may not be able to effectively monitor, detect or limit short-term or excessive trading by underlying shareholders that occurs through separate accounts maintained by insurance companies or other financial intermediaries. Depending on the amount of portfolio/fund shares held in a particular separate account (which may represent most of the portfolio’s/fund’s shares) short-term and/or excessive trading of portfolio/fund shares could adversely affect long-term shareholders in the portfolio/fund. It is important to note that the Advisor and the portfolio/fund do not have access to underlying shareholders’ trading activity and that investors will be subject to the policies and procedures of their insurance company with respect to short-term and excessive trading in the portfolio/fund.
The portfolio’s/fund’s policies and procedures may be modified or terminated at any time.
The following supplements the information under “Buying and Selling Shares” in both Scudder Variable Series I Money Market Portfolio prospectuses:
Since money market funds hold short-term instruments and are intended to provide liquidity to shareholders, the Advisor does not monitor or limit short-term and excessive trading activity in these portfolios/funds and, accordingly, the Board of the portfolio/fund has not approved any policies and procedures designed to limit this activity. However, the portfolio/fund reserves the right to and may reject or cancel a purchase or exchange order into a money market fund for any reason, including if, in the opinion of the Advisor, there appears to be a pattern of short-term and excessive trading by an investor in other Scudder funds.
The following replaces the disclosure regarding fair valuation under “How the portfolio/fund calculates share price” in each portfolio’s/fund’s prospectus:
We typically value securities using information furnished by an independent pricing service or market quotations, where appropriate. However, we may use methods approved by the portfolio’s/fund’s Board, such as a fair valuation model, which are intended to reflect fair value when pricing service information or market quotations are not readily available or when a security’s value or a meaningful portion of the value of the portfolio is believed to have been materially affected by a significant event, such as a natural disaster, an
Page 2
economic event like a bankruptcy filing, or a substantial fluctuation in domestic or foreign markets, that has occurred between the close of the exchange or market on which the security is principally traded (for example, a foreign exchange or market) and the close of the New York Stock Exchange. In such a case, the portfolio’s/fund’s value for a security is likely to be different from the last quoted market price or pricing service information. In addition, due to the subjective and variable nature of fair value pricing, it is possible that the value determined for a particular asset may be materially different from the value realized upon such asset’s sale. It is expected that the greater the percentage of portfolio/fund assets that is invested in non-US securities, the more extensive will be the portfolio’s/fund’s use of fair value pricing. This is intended to reduce the portfolio’s/fund’s exposure to “time zone arbitrage” and other harmful trading practices. (See “Market Timing Policies and Procedures.”)
The following supplements the “Other Policies and Risks” or “Other Policies” section of each portfolio’s/fund’s prospectus:
The portfolio’s/fund’s complete portfolio holdings as of the end of each calendar month are posted on www.scudder.com ordinarily on the 15th day of the following calendar month, or the first business day thereafter. This posted information generally remains accessible at least until the portfolio/fund files its Form N-CSR or N-Q with the Securities and Exchange Commission for the period that includes the date as of which the www.scudder.com information is current (expected to be at least three months). The portfolio’s/fund’s Statement of Additional Information includes a description of the portfolio’s/fund’s policies and procedures with respect to the disclosure of the portfolio’s/fund’s portfolio holdings.
Please Retain This Supplement for Future Reference
March 16, 2005
Page 3
Scudder Variable Series I
| • | | 21st Century Growth Portfolio |
Scudder Variable Series II
| • | | SVS Eagle Focused Large Cap Growth Portfolio |
| • | | SVS Focus Value+Growth Portfolio |
| • | | Scudder Growth Portfolio |
| • | | Scudder Strategic Income Portfolio |
Supplement to the currently effective prospectuses
Deutsche Investment Management Americas Inc. (the “Advisor”), the investment advisor of the above portfolios, is proposing the following mergers as part of the Advisor’s initiative to restructure and streamline the family of Scudder funds. In the chart below, the Acquired Portfolios on the left are merging into the Scudder Acquiring Portfolios on the right.
| | |
Acquired Portfolios
| | Acquiring Portfolios
|
Balanced Portfolio | | Scudder Total Return Portfolio |
21st Century Growth Portfolio | | Scudder Small Cap Growth Portfolio |
SVS Eagle Focused Large Cap Growth Portfolio | | Capital Growth Portfolio |
SVS Focus Value+Growth Portfolio | | Growth and Income Portfolio |
Scudder Growth Portfolio | | Capital Growth Portfolio |
Scudder Strategic Income Portfolio | | Bond Portfolio |
Completion of each merger is subject to a number of conditions, including final approval by each participating Portfolio’s Board and approval by shareholders of the applicable Acquired Portfolio at a shareholder meeting expected to be held within approximately the next three months. Prior to the shareholder meeting, shareholders of each Acquired Portfolio will receive: (i) a Proxy Statement/Prospectus describing in detail the proposed merger and the Board’s considerations in recommending that shareholders approve the merger; (ii) a proxy card(s) with which shareholders may vote on the proposed merger; and (iii) a Prospectus for the applicable Acquiring Portfolio.
Please Retain This Supplement for Future Reference
February 7, 2005
Supplement to the currently effective prospectus of each of the listed portfolios/funds:
Scudder Variable Series I
| • | | 21st Century Growth Portfolio |
| • | | Capital Growth Portfolio |
| • | | Global Discovery Portfolio |
| • | | Growth and Income Portfolio |
| • | | Health Sciences Portfolio |
| • | | International Portfolio |
Scudder Investments VIT Funds
Scudder VIT Equity 500 Index Fund
Scudder VIT EAFE(R) Equity Index Fund
Scudder VIT Small Cap Index Fund
Scudder Real Estate Securities Portfolio
For all listed funds/portfolios (except Scudder Variable Series I Money Market Portfolio. The following information replaces the applicable market timing disclosure under “Buying and Selling Shares” in each portfolio’s/fund’s prospectus:
Market Timing Policies and Procedures. Short-term and excessive trading of portfolio/fund shares may present risks to the portfolio’s/fund’s long-term shareholders, including potential dilution in the value of portfolio/fund shares, interference with the efficient management of the portfolio’s/fund’s portfolio (including losses on the sale of investments), taxable gains to remaining shareholders and increased brokerage and administrative costs. These risks may be more pronounced for portfolios/funds investing in certain securities such as those that trade in foreign markets, are illiquid or do not otherwise have “readily available market quotations.” Certain investors may seek to employ short-term trading strategies aimed at exploiting variations in portfolio valuation that arise from the nature of the securities held by the portfolio/fund (e.g., “time zone arbitrage”).
The portfolio/fund discourages short-term and excessive trading. The portfolio/fund will take steps to detect and deter short-term and excessive trading pursuant to the portfolio’s/fund’s policies as described in this prospectus and approved by the Board.
The portfolio’s/fund’s policies include:
| • | | the portfolio/fund reserves the right to reject or cancel a purchase or exchange order for any reason when, in the opinion of the Advisor, there appears to be a pattern of short-term or excessive trading activity by a shareholder or any other trading activity deemed harmful or disruptive to the portfolio/fund; and |
| • | | the portfolio/fund has adopted certain fair valuation practices reasonably designed to protect the portfolio/fund from “time zone arbitrage” with respect to its foreign securities holdings and other trading practices that seek to exploit variations in portfolio valuation that arise from the nature of the securities held by the portfolio/fund. (See “How the portfolio/fund calculates share price” in the portfolio’s/fund’s prospectus.) |
When a pattern of short-term or excessive trading activity or other trading activity deemed harmful or disruptive to the portfolio/fund by an investor is detected, the Advisor may determine to prohibit that investor from future purchases in the portfolios/funds or to limit or terminate the investor’s exchange privilege. The detection of these patterns and the banning of further trading are inherently subjective and therefore involve some selectivity in their application. The Advisor seeks to make such determinations in a manner consistent with the interests of the portfolio’s/fund’s long-term shareholders.
There is no assurance that these policies and procedures will be effective in limiting short-term and excessive trading in all cases. For example, the Advisor may not be able to effectively monitor, detect or limit short-term or excessive trading by underlying shareholders that occurs through omnibus accounts maintained by broker-dealers or other financial intermediaries. Depending on the amount of portfolio/fund shares held in such omnibus accounts (which may represent most of the portfolio’s/fund’s shares) short-term and/or excessive trading of portfolio/fund shares could adversely affect long-term shareholders in the portfolio/fund. It is important to note that shareholders that invest through omnibus accounts also may be subject to the policies and procedures of their financial intermediaries with respect to short-term and excessive trading in the portfolio/fund.
The portfolio’s/fund’s policies and procedures may be modified or terminated at any time.
The following supplements the information under “Buying and Selling Shares” in both Scudder Variable Series I Money Market Portfolio prospectuses:
Since money market funds hold short-term instruments and are intended to provide liquidity to shareholders, the Advisor does not monitor or limit short-term and excessive trading activity in these portfolios/funds and, accordingly, the Board of the portfolio/fund has not approved any policies and procedures designed to limit this activity. However, the portfolio/fund reserves the right to and may reject or cancel a purchase or exchange order into a money market fund for any reason, including if, in the opinion of the Advisor, there appears to be a pattern of short-term and excessive trading by an investor in other Scudder funds.
The following replaces the disclosure regarding fair valuation under “How the portfolio/fund calculates share price” in each portfolio’s/fund’s prospectus:
We typically value securities using information furnished by an independent pricing service or market quotations, where appropriate. However, we may use methods approved by the portfolio’s/fund’s Board, such as a fair valuation model, which are intended to reflect fair value when pricing service information or market quotations are not readily available or when a security’s value or a meaningful portion of the value of the portfolio is believed to have been materially affected by a significant event, such as a natural disaster, an economic event like a bankruptcy filing, or a substantial fluctuation in domestic or foreign markets, that has occurred between the close of the exchange or market on which the security is principally traded (for example, a foreign exchange or market) and the close of the New York Stock Exchange. In such a case, the portfolio’s/fund’s value for a security is likely to be different from the last quoted market price or pricing service information. In addition, due to the subjective and variable nature of fair value pricing, it is possible that the value determined for a particular asset may be materially different from the value realized upon such asset’s sale. It is expected that the greater the percentage of portfolio/fund assets that is invested in non-US securities, the more extensive will be the portfolio’s/fund’s use of fair value pricing. This is intended to reduce the portfolio’s/fund’s exposure to “time zone arbitrage” and other harmful trading practices. (See “Market Timing Policies and Procedures.”)
The following supplements the “Other Policies and Risks” or “Other Policies” section of each portfolio’s/fund’s prospectus:
The portfolio’s/fund’s complete portfolio holdings as of the end of each calendar month are posted on www.scudder.com ordinarily on the 15th day of the following calendar month, or the first business day thereafter. This posted information generally remains accessible at least until the portfolio/fund files its Form N-CSR or N-Q with the Securities and Exchange Commission for the period that includes the date as of which the www.scudder.com information is current (expected to be at least three months). The portfolio’s/fund’s Statement of Additional Information includes a description of the portfolio’s/fund’s policies and procedures with respect to the disclosure of the portfolio’s/fund’s portfolio holdings.
Please Retain This Supplement for Future Reference
February 4, 2005
MRKTIM-3600
Scudder Variable Series I
| | • | | 21st Century Growth Portfolio |
Scudder Variable Series II
| | • | | SVS Focus Value+Growth Portfolio |
| | • | | Scudder Growth Portfolio |
Supplement to the currently effective prospectuses
Deutsche Investment Management Americas Inc. (the “Advisor”), the investment advisor of the above portfolios, is proposing the following mergers as part of the Advisor’s initiative to restructure and streamline the family of Scudder funds. In the chart below the Acquired Portfolios on the left are merging into the Acquiring Portfolios on the right.
Acquired Portfolios
SVS Focus Value+Growth Portfolio
Balanced Portfolio
21st Century Growth Portfolio
Scudder Growth Portfolio
Acquiring Portfolios
Growth and Income Portfolio
Scudder Total Return Portfolio
Scudder Small Cap Growth Portfolio
Capital Growth Portfolio
Completion of each merger is subject to a number of conditions, including final approval by each participating Portfolio’s Board and approval by shareholders of the applicable Acquired Portfolio at a shareholder meeting expected to be held within approximately the next five months. Prior to the shareholder meeting, shareholders of each Acquired Portfolio will receive: (i) a Proxy Statement/Prospectus describing in detail the proposed merger and the Board’s considerations in recommending that shareholders approve the merger; (ii) a proxy card(s) with which shareholders may vote on the proposed merger; and (iii)a Prospectus for the applicable Acquiring Portfolio.
Please Retain This Supplement for Future Reference
January 20, 2005
ANN-3600
Scudder Variable Series I
| | • | | Scudder Balanced Portfolio |
Supplement to the currently effective prospectus
The following information replaces the disclosure for Scudder Variable Series I: Scudder Balanced Portfolio in “The Portfolio’s Main Investment Strategy” section of the prospectus.
The Portfolio’s Main Investment Strategy
The portfolio seeks a balance of growth and income from a diversified portfolio of equity and fixed-income securities.
The portfolio normally invests approximately 60% of its net assets in common stocks and other equity securities and approximately 40% of its net assets in fixed income securities, including lower-quality debt securities. The portfolio may, however, invest up to 75% of its net assets in equity securities and up to 50% in fixed income securities, based on the portfolio managers’ evaluation of the relative attractiveness of equity securities as compared to fixed income securities. At all times, the portfolio invests at least 25% of net assets in fixed-income senior securities. The portfolio may invest in foreign securities as well as securities of US issuers.
The investment advisor regularly reviews the portfolio’s investment allocations and will vary them to favor asset classes that, in its judgment, provide the most favorable return outlook consistent with the portfolio’s investment objective. In deciding how to allocate the portfolio’s assets, the investment advisor will evaluate projections of risk, market and economic conditions, volatility, yields and expected returns.
The advisor follows specific strategies in selecting equity and fixed securities for the portfolio.
Equity securities in the portfolio generally include “growth” stocks as well as “value” stocks and normally include stocks of both small and large companies.
Growth Stocks. In choosing these securities, the managers primarily invest in US companies that they believe offer the potential for sustainable growth of revenue or earnings and whose market values appear reasonable in light of their business prospects. The managers focus on high quality growth companies that are leaders or potential leaders in their respective industries. The managers conduct in-depth company research, examining, among other factors, relative growth rates, innovation, regional and global exposure and management.
Value Stocks. When selecting value stocks, these portfolio managers begin by screening for stocks whose price-to-earnings ratios are below the average for the S&P 500 Index. The managers then compare a company’s stock price to its book value, cash flow and yield, and analyze individual companies to identify those that are financially sound and appear to have strong potential for long-term growth.
Small Company Stocks. In selecting stocks of small companies, a quantitative stock valuation model compares each company’s stock price to the company’s earnings, book value, sales and other measures of performance potential. The managers also look for factors that may signal a rebound for a company, whether through a recovery in its markets, a change in business strategy or other factors.
The managers believe that by combining techniques used by fundamental value investors with extensive growth and earnings analysis they can minimize investment style bias and ultimately produce a “pure” stock selection process that seeks to add value in any market environment. The team also incorporates technical analysis to capture short-term price changes and evaluate the market’s responsiveness to new information.
Fixed income securities in the portfolio include both investment grade and lower-quality debt securities, and may include securities of both US and non-US (including emerging market) issuers.
US Investment Grade Securities. In selecting these securities for investment, the investment advisor typically:
| | • | | assigns a relative value to each bond, based on creditworthiness, cash flow and price; |
| | • | | determines the value of each issue by examining the issuer’s credit quality, debt structure, option value and liquidity risks. The portfolio managers look to take advantage of any inefficiencies between this value and market trading price; |
| | • | | uses credit analysis to determine the issuer’s ability to fulfill its contracts; and |
| | • | | uses a bottom-up approach which subordinates sector weightings to individual bonds that the advisor believes may add above-market-value. |
The investment advisor generally sells these securities when they reach their target price or when there is a negative change in their outlook relative to the other securities held by the portfolio. Bonds may also be sold to facilitate the purchase of an issue with more attractive risk/return characteristics.
Foreign Debt Securities. In selecting these securities for investment, the investment advisor follows a bottom-up, relative value strategy. The advisor looks to purchase foreign securities that offer incremental value over US Treasuries. The advisor invests in a focused fashion, so that it is not simply investing in a basket of all non-US fixed income markets, but instead only those markets that its relative value process has identified as being the most attractive. The investment advisor sells securities or exchanges currencies when they meet their target price objectives or when the investment advisor revises price objectives downward. In selecting emerging market securities, the investment advisor also considers short-term factors such as market sentiment, capital flows, and new issue programs.
High Yield Securities. In selecting these securities for investment, the investment advisor:
| | • | | analyzes economic conditions for improving or undervalued sectors and industries; |
| | • | | uses independent credit research and on-site management visits to evaluate individual issuer’s debt service, growth rate, and both downgrade and upgrade potential; |
| | • | | assesses new issues versus secondary market opportunities; and |
| | • | | seeks issues within attractive industry sectors and with strong long-term fundamentals and improving credits. |
The portfolio may lend its investment securities up to 33 1/3% of its total assets to approved institutional borrowers who need to borrow securities in order to complete certain transactions.
Although major changes tend to be infrequent, the Board of Trustees could change the portfolio’s investment objective without seeking shareholder approval.
Other Investments
The portfolio’s bond investments are primarily in the top four grades of credit quality. The portfolio could put up to 20% of total assets in junk bonds (i.e., grade BB/Ba and below). Compared to investment-grade bonds, junk bonds may pay higher yields and typically will have higher volatility and risk of default. The portfolio may also invest in foreign securities. The portfolio may also invest up to 15% of its total assets to buy or sell protection on credit exposure.
The portfolio is permitted, but not required, to use various types of derivatives (contracts whose value is based on, for example, indexes, currencies or securities). The portfolio may use derivatives in circumstances where the managers believe they offer an economical means of gaining exposure to a particular asset class or to keep cash on hand to meet shareholder redemptions or other needs while maintaining exposure to the market.
As a temporary defensive measure, the portfolio could shift up to 100% of assets into investments such as money market securities. This measure could prevent losses, but, while engaged in a temporary defensive position, a fund will not be pursuing its investment objective. However, the portfolio managers may choose not to use these strategies for various reasons, even in very volatile market conditions.
The following information supplements “The Main Risks of Investing in the Portfolio” section.
Value Investing Risk. As with any investment strategy, the “value” strategy used in managing the portfolio will, at times, perform better than or worse than other investment styles and the overall market. If the advisor overestimates the value or return potential of one or more common stocks, the portfolio may underperform the general equity market. Value stocks may also be out of favor for certain periods in relation to growth stocks.
Small Company Capitalization Risk. Small company stocks tend to experience steeper price fluctuations — down as well as up — than the stocks of larger companies. A shortage of reliable information — the same information gap that creates opportunity — can also pose added risk. Industry-wide reversals may have a greater impact on small companies, since they lack a large company’s financial resources. Small company stocks are typically less liquid than large company stocks: when things are going poorly, it is harder to find a buyer for a small company’s shares.
Foreign Investment Risk. To the extent that the portfolio holds the securities of companies based outside the US, it faces the risks inherent in foreign investing. Adverse political, economic or social developments could undermine the value of the portfolio’s investments or prevent the portfolio from realizing their full value. Financial reporting standards for companies based in foreign markets differ from those in the US. Additionally, foreign securities markets generally are smaller and less liquid than the US markets. These risks tend to be greater in emerging markets, so to the extent the fund invests in emerging markets, it takes on greater risks. Finally, the currency of the country in which the fund has invested could decline relative to the value of the US dollar, which would decrease the value of the investment to US investors.
The following information supplements the disclosure under “The Investment Advisor.”
Scudder Balanced Portfolio’s Board has approved a research and subadvisory agreement between DeIM and Deutsche Asset Management Investment Services Ltd. (“DeAMIS”). DeAMIS, One Appold Street, London, England, an affiliate of the advisor, is the subadvisor to the Scudder Balanced Portfolio. DeAMIS renders investment advisory and management services including services related to foreign securities, foreign currency transactions and related investments with regard to the portion of Scudder Balanced Portfolio’s portfolio that is allocated to it by DeIM from time-to-time for management. DeAMIS provides a full range of international investment advisory services to institutional and retail clients. DeAMIS is an indirect, wholly owned subsidiary of Deutsche Bank AG. DeIM compensates DeAMIS out of the management fee it receives from the Scudder Balanced Portfolio.
The following information replaces the disclosure under “The Portfolio Managers.”
The portfolio is managed by a team of investment professionals who share responsibility for the portfolio’s investment management decisions.
Julie M. Van Cleave
CFA, Managing Director of Deutsche Asset Management and Portfolio Manager of the portfolio.
| | • | | Joined Deutsche Asset Management and the portfolio in 2002. |
| | • | | Head of Large Cap Growth Portfolio Selection Team. |
| | • | | Previous experience includes 18 years of investment industry experience at Mason Street Advisors, as Managing Director and team leader for the large cap investment team. |
| | • | | MBA, University of Wisconsin — Madison. |
Thomas F. Sassi
Managing Director of Deutsche Asset Management and Portfolio Manager of the portfolio.
| | • | | Joined Deutsche Asset Management in 1996 and the portfolio in 2004. |
| | • | | Over 32 years of investment industry experience. |
| | • | | MBA, Hofstra University. |
J. Christopher Gagnier
Managing Director of Deutsche Asset Management and Portfolio Manager of the portfolio.
| | • | | Joined Deutsche Asset Management in 1997 and the portfolio in 2002. |
| | • | | Prior to that, portfolio manager, Paine Webber, from 1984 to 1997. |
| | • | | Began investment career in 1979. |
| | • | | MBA, University of Chicago. |
Andrew P. Cestone
Managing Director of Deutsche Asset Management and Portfolio Manager of the portfolio.
| | • | | Joined Deutsche Asset Management in 1998 and the portfolio in 2002. |
| | • | | Head of Core Plus Fixed Income. |
| | • | | Prior to that, investment analyst, Phoenix Investment Partners, from 1997 to 1998. |
| | • | | Prior to that, credit officer, asset based lending group, Fleet Bank, from 1995 to 1997. |
Arnim S. Holzer
Director of Deutsche Asset Management and Portfolio Manager of the portfolio.
| | • | | Joined Deutsche Asset Management in 1999, having served with the equity and fixed-income investment committees. |
| | • | | Senior Investment Strategist for Asset Allocation. |
| | • | | Previous experience includes 18 years of investment industry experience, including three years managing Emerging Markets Fixed Income, Emerging Markets Equity and Emerging Markets balanced accounts at Deltec Asset Management Corporation. |
| | • | | Joined the portfolio in 2004. |
| | • | | MBA, Fordham University. |
Brett Diment
Managing Director of Deutsche Asset Management and Portfolio Manager of the portfolio.
| | • | | Joined Deutsche Asset Management in 1991 and the portfolio in 2004. |
| | • | | Head of Emerging Market Debt for London Fixed Income and responsible for coordinating research into Continental European markets and managing global fixed income, balanced and cash-based portfolios: London. |
| | • | | Began investment career in 1991. |
Please Retain This Supplement for Future Reference
October 26, 2004
Scudder Variable Series I
Prospectus
May 1, 2004
Class A Shares
This prospectus should be read in conjunction with the variable life insurance or variable annuity contract prospectus. These shares are available and are being marketed exclusively as a pooled funding vehicle for life insurance companies writing all types of variable life insurance policies and variable annuity contracts.
The Securities and Exchange Commission (SEC) does not approve or disapprove these shares or determine whether the information in this prospectus is truthful or complete. It is a criminal offense for anyone to inform you otherwise.
Table of Contents
How the Portfolio Works
The portfolio is designed to serve as an investment option for certain variable annuity contracts and variable life insurance policies. Your investment in the portfolio is made in conjunction with one of these contracts or policies.
Remember that the portfolio is not a bank deposit. It’s not insured or guaranteed by the FDIC or any other government agency. Its share price will go up and down, and you could lose money by investing in it.
Please read this prospectus in conjunction with the prospectus for your variable life insurance policy or variable annuity contract.
Balanced Portfolio
The Portfolio’s Main Investment Strategy
The portfolio seeks a balance of growth and income from a diversified portfolio of equity and fixed-income securities.
The portfolio normally invests approximately 60% of its net assets in common stocks and other equity securities and approximately 40% of its net assets in investment-grade bonds and other fixed income securities. The fund may, however, invest up to 75% of its net assets in equity securities and up to 50% in fixed income securities, based on the portfolio managers’ evaluation of the relative attractiveness of equity securities as compared to fixed income securities. At all times, the fund invests at least 25% of net assets in fixed-income securities.
In choosing stocks, the managers primarily invest in US companies that they believe offer the potential for sustainable growth of revenue or earnings and whose market values appear reasonable in light of their business prospects. The managers focus on high quality growth companies that are leaders or potential leaders in their respective industries. The managers conduct in-depth company research, examining, among other factors, relative growth rates, innovation, regional and global exposure and management.
In choosing individual bonds, the managers review each bond’s fundamentals, consider how it is structured and use independent analysis of an issuer’s creditworthiness. The portfolio can buy many types of bonds of any maturity, including mortgage- and asset-backed securities, corporate bonds and government securities.
The managers will normally sell a security when the managers believe its fundamental factors have changed, other investments offer better opportunities or in the course of adjusting their emphasis on or within a given industry.
The managers may favor different types of securities at different times.
The portfolio may lend its investment securities up to 33 1/3% of its total assets to approved institutional borrowers who need to borrow securities in order to complete certain transactions.
Although major changes tend to be infrequent, the Board of Trustees could change the portfolio’s investment objective without seeking shareholder approval.
Other Investments
The portfolio’s bond investments are normally in the top four grades of credit quality. The portfolio could put up to 10% of total assets — though no more than 20% of its bond assets — in junk bonds (i.e., grade BB/Ba and below). Compared to investment-grade bonds, junk bonds may pay higher yields and typically will have higher volatility and risk of default.
The portfolio is permitted, but not required, to use various types of derivatives (contracts whose value is based on, for example, indexes, currencies or securities). The portfolio may use derivatives in circumstances where the managers believe they offer an economical means of gaining exposure to a particular asset class or to keep cash on hand to meet shareholder redemptions or other needs while maintaining exposure to the market.
As a temporary defensive measure, the portfolio could shift up to 100% of assets into investments such as money market securities. This measure could prevent losses, but, while engaged in a temporary defensive position, a fund will not be pursuing its investment objective. However, the portfolio managers may choose not to use these strategies for various reasons, even in very volatile market conditions.
The Main Risks of Investing in the Portfolio
There are several risk factors that could hurt the portfolio’s performance, cause you to lose money or cause the portfolio’s performance to trail that of other investments.
Stock Market Risk. An important factor with this portfolio is how stock markets perform. When stock prices fall you should expect the value of your investment to fall as well. Because a stock represents ownership in its issuer, stock prices can be hurt by poor management, shrinking product demand and other business risks. These may affect single companies as well as groups of companies. In addition, movements in financial markets may adversely affect a stock’s price, regardless of how well the company performs. The market as a whole may not favor the types of investments the portfolio makes and the portfolio may not be able to get attractive prices for them.
Industry Risk. While the portfolio does not concentrate in any industry, to the extent that the portfolio has exposure to a given industry or sector, any factors affecting that industry or sector could affect the value of portfolio securities. For example, manufacturers of consumer goods could be hurt by a rise in unemployment, or technology companies could be hurt by such factors as market saturation, price competition and rapid obsolescence.
3
Interest Rate Risk. Generally, fixed income securities will decrease in value when interest rates rise. The longer the effective maturity of the portfolio’s securities, the more sensitive it will be to interest rate changes. ( As a general rule, a 1% rise in interest rates means a 1% fall in value for every year of duration.) As interest rates decline, the issuers of securities held by the portfolio may prepay principal earlier than scheduled, forcing the portfolio to reinvest in lower yielding securities. This prepayment may reduce the portfolio’s income. As interest rates increase, fewer issuers tend to prepay, which may extend the average life of fixed income securities and have the effect of locking in a below-market interest rate, increasing the portfolio’s duration and reducing the value of the security. Because the portfolio may invest in mortgage-related securities, it is more vulnerable to both of these risks.
Credit Risk. A portfolio purchasing bonds faces the risk that the creditworthiness of the issuer may decline, causing the value of its bonds to decline. In addition, an issuer may be unable or unwilling to make timely payments on the interest and principal on the bonds it has issued. Because the issuers of high yield bonds (rated below the fourth highest category) may be in uncertain financial health, the prices of their bonds are generally more vulnerable to bad economic news or even the expectation of bad news, than those of investment-grade bonds. In some cases, bonds, particularly junk bonds, may decline in credit quality or go into default.
IPO Risk. Securities purchased in initial public offerings (IPOs) may be very volatile, rising and falling rapidly, often based, among other reasons, on investor perceptions rather than on economic factors. Additionally, investments in IPOs may magnify the portfolio’s performance if it has a small asset base. The portfolio is less likely to experience a similar impact on its performance as its assets grow because it is unlikely that the portfolio will be able to obtain proportionately larger IPO allocations.
Derivatives Risk. Risks associated with derivatives include: the risk that the derivative is not well correlated with the security, index or currency to which it relates; the risk that derivatives used for risk management may not have the intended effects and may result in losses or missed opportunities; the risk that the portfolio will be unable to sell the derivative because of an illiquid secondary market; the risk that a counterparty is unwilling or unable to meet its obligation; the risk of interest rate movements and the risk that the derivatives transaction could expose the portfolio to the effects of leverage, which could increase a portfolio’s exposure to the market and magnify potential losses. There is no guarantee that derivatives activities will be employed or that they will work, and their use could cause lower returns or even losses to the portfolio.
Securities Lending Risk. Any loss in the market price of securities loaned by the portfolio that occurs during the term of the loan would be borne by the portfolio and would adversely affect the portfolio’s performance. Also, there may be delays in recovery of securities loaned or even a loss of rights in the collateral should the borrower of the securities fail financially while the loan is outstanding. However, loans will be made only to borrowers selected by the portfolio’s delegate after a review of relevant facts and circumstances, including the creditworthiness of the borrower.
Pricing Risk. At times, market conditions might make it hard to value some investments. For example, if the portfolio has valued its securities too highly, you may end up paying too much for portfolio shares when you buy into the portfolio. If the portfolio underestimates their price, you may not receive the full market value for your portfolio shares when you sell.
Other factors that could affect performance include:
| | • | | the managers could be incorrect in their analysis of industries, companies, economic trends, the relative attractiveness of different securities or other matters |
| | • | | foreign stocks tend to be more volatile than their US counterparts, for reasons such as currency fluctuations and political and economic uncertainty |
This portfolio may make sense for investors interested in stock and bond investments in a single portfolio.
4
Performance
While a portfolio’s past performance isn’t necessarily a sign of how it will do in the future, it can be valuable for an investor to know.
The bar chart shows how the returns for the portfolio’s Class A shares have varied from year to year, which may give some idea of risk. The table shows average annual returns for the portfolio and three broad-based market indexes (which, unlike the portfolio, do not have any fees or expenses). The performance of both the portfolio and the indexes varies over time. All figures on this page assume reinvestment of dividends and distributions.
This information doesn’t reflect charges and fees associated with the separate account that invests in the portfolio or any variable life insurance policy or variable annuity contract for which the portfolio is an investment option. These charges and fees will reduce returns.
Annual Total Returns (%) as of 12/31 each year — Class A shares
THE ORIGINAL DOCUMENT CONTAINS A BAR CHART HERE
BAR CHART DATA:
| | | | | | | | | | | | | | | | | | |
| -2.05 | | 26.67 | | 11.89 | | 24.21 | | 23.19 | | 15.32 | | -2.02 | | -6.06 | | -15.07 | | 17.94 |
1994 | | 1995 | | 1996 | | 1997 | | 1998 | | 1999 | | 2000 | | 2001 | | 2002 | | 2003 |
For the periods included in the bar chart:
| | |
| Best Quarter: 15.51%, Q4 1998 | | Worst Quarter: -9.71%, Q2 2002 |
2004 Total Return as of March 31: 2.24%
Average Annual Total Returns (%) as of 12/31/2003
| | | | | | |
| | | 1 Year
| | 5 Years
| | 10 Years
|
Portfolio — Class A | | 17.94 | | 1.23 | | 8.49 |
Index 1 | | 28.68 | | -0.57 | | 11.07 |
Index 2 | | 29.75 | | -5.11 | | 9.21 |
Index 3 | | 4.10 | | 6.62 | | 6.95 |
Index 1: Standard & Poor’s (S&P) 500 Index is a capitalization-weighted index of 500 stocks, designed to measure performance of the broad domestic economy through changes in the aggregate market value of 500 stocks representing all major industries.
Index 2: Russell 1000 Growth Index is an unmanaged capitalization-weighted index containing those securities in the Russell 1000 Index with higher price-to-book ratios and higher forecasted-growth values.
Index 3: Lehman Brothers Aggregate Bond Index is an unmanaged market value-weighted measure of treasury issues, agency issues, corporate bond issues and mortgage securities.
Current performance information may be higher or lower than the performance data quoted above. For more recent performance information, contact your participating insurance company.
5
How Much Investors Pay
This table describes the fees and expenses that you may pay if you buy and hold portfolio shares. The information in the table does not reflect charges and fees associated with the separate account that invests in the portfolio or any variable life insurance policy or variable annuity contract for which the portfolio is an investment option. These charges and fees will increase expenses.
| | | |
Fee Table
| | Class A
| |
Annual Operating Expenses, deducted from portfolio assets | | | |
Management Fee | | 0.48 | % |
Distribution/Service (12b-1) Fee | | None | |
Other Expenses | | 0.11 | |
| | |
|
|
Total Annual Operating Expenses | | 0.59 | |
| | |
|
|
Based on the costs above, this example helps you compare the expenses of Class A shares to those of other mutual funds. This example assumes the expenses above remain the same. It also assumes that you invested $10,000, earned 5% annual returns, reinvested all dividends and distributions and sold your shares at the end of each period. This is only an example; actual expenses will be different.
| | | | | | | | | | | | |
| | | 1 Year
| | 3 Years
| | 5 Years
| | 10 Years
|
Class A Shares | | $ | 60 | | $ | 189 | | $ | 329 | | $ | 738 |
6
The Portfolio Managers
The following people handle the day-to-day management of the portfolio:
Julie M. Van Cleave
CFA, Managing Director of Deutsche Asset Management and Lead Portfolio Manager of the portfolio.
| | • | | Joined Deutsche Asset Management and the portfolio in 2002. |
| | • | | Head of Large Cap Growth Portfolio Selection Team. |
| | • | | Previous experience includes 18 years’ investment industry experience at Mason Street Advisors, most recently serving as Managing Director and team leader for the large cap investment team. |
| | • | | MBA, University of Wisconsin — Madison. |
Gary W. Bartlett
CFA, Managing Director of Deutsche Asset Management and Portfolio Manager of the portfolio.
| | • | | Joined Deutsche Asset Management in 1992 and the portfolio in 2002. |
| | • | | Began investment career in 1982. |
| | • | | MBA, Drexel University. |
Janet Campagna
Managing Director of Deutsche Asset Management and Portfolio Manager of the portfolio.
| | • | | Joined Deutsche Asset Management in 1999 and the portfolio in 2002. |
| | • | | Head of global and tactical asset allocation. |
| | • | | Investment strategist and managero of the asset allocation strategies group for Barclays Global Investors from 1994 to 1999. |
| | • | | Over 16 years of investment industry experience. |
| | • | | Master’s degree in Social Science from California Institute of Technology. |
| | • | | Ph.D, Political Science from University of California at Irvine. |
Andrew P. Cestone
Managing Director of Deutsche Asset Management and Portfolio Manager of the portfolio.
| | • | | Joined Deutsche Asset Management in 1998 and the portfolio in 2002. |
| | • | | Prior to that, Investment Analyst, Phoenix Investment Partners, from 1997 to 1998. |
| | • | | Prior to that, Credit Officer, asset based lending group, Fleet Bank, from 1995 to 1997. |
Warren S. Davis
Managing Director of Deutsche Asset Management and Portfolio Manager of the portfolio.
| | • | | Joined Deutsche Asset Management in 1995 and the portfolio in 2002. |
| | • | | Began investment career in 1985. |
| | • | | MBA, Drexel University. |
Thomas J. Flaherty
Managing Director of Deutsche Asset Management and Portfolio Manager of the portfolio.
| | • | | Joined Deutsche Asset Management in 1995 and the portfolio in 2002. |
| | • | | Began investment career in 1985. |
J. Christopher Gagnier
Managing Director of Deutsche Asset Management and Portfolio Manager of the portfolio.
| | • | | Joined Deutsche Asset Management in 1997 and the portfolio in 2002. |
| | • | | Prior to that, portfolio manager, Paine Webber (1984-1997). |
| | • | | Began investment career in 1979. |
| | • | | MBA, University of Chicago. |
William T. Lissenden
Director of Deutsche Asset Management and Portfolio Manager of the portfolio.
| | • | | Joined Deutsche Asset Management in 2002 and the portfolio in 2004. |
| | • | | Prior to that, fixed income strategist and director of research at Conseco Capital Management, director of fixed income research and product management at Prudential Securities, national sales manager for fixed income securities at Prudential Securities and institutional sales professional at several firms including Prudential, Goldman Sachs and Merrill Lynch. |
Thomas J. Schmid
CFA, Director of Deutsche Asset Management and Portfolio Manager of the portfolio.
| | • | | Joined Deutsche Asset Management and the portfolio in 2002. |
| | • | | Previous experience includes 15 years’ investment industry experience, most recently as Director — Common Stock at Mason Street Advisors. |
| | • | | MBA, University of Chicago. |
Daniel R. Taylor
CFA, Managing Director of Deutsche Asset Management and Portfolio Manager of the portfolio.
| | • | | Joined Deutsche Asset Management in 1998 and the portfolio in 2002. |
| | • | | Prior to that, fixed income portfolio manager, asset-backed securities analyst and senior credit analyst, CoreStates Investment Advisors, from 1992 to 1998. |
Timothy C. Vile
CFA, Managing Director of Deutsche Asset Management and Portfolio Manager of the portfolio.
| | • | | Joined Deutsche Asset Management in 1991 with 6 years experience that included portfolio manager for fixed income portfolios at Equitable Capital Management. |
| | • | | Portfolio manager for Core Fixed Income and Global Aggregate Fixed Income. |
| | • | | Joined the portfolio in 2002. |
Jack A. Zehner
Director of Deutsche Asset Management and Portfolio Manager of the portfolio.
| | • | | Joined Deutsche Asset Management and the portfolio in 2002. |
| | • | | Previous experience includes eight years’ investment industry experience at Mason Street Advisors where he served most recently as Director — Common Stock. |
| | • | | MBA, Marquette University. |
7
Financial Highlights
This table is designed to help you understand the portfolio’s financial performance. The figures in the first part of the table are for a single share. The total return figures represent the percentage that an investor in the portfolio would have earned (or lost), assuming all dividends and distributions were reinvested. This information has been audited by PricewaterhouseCoopers LLP, whose report, along with the portfolio’s financial statements, is included in the portfolio’s annual report (see “Shareholder reports” on the back cover).
The following table includes selected data for a share outstanding throughout each period and other performance information derived from the financial statements.
Balanced Portfolio — Class A
| | | | | | | | | | | | | | | | | | | | |
Years Ended December 31,
| | 2003
| | | 2002
| | | 2001^a
| | | 2000
| | | 1999
| |
Selected Per Share Data | | | | | | | | | | | | | | | | | | | | |
Net asset value, beginning of period | | $ | 9.72 | | | $ | 11.76 | | | $ | 13.39 | | | $ | 16.11 | | | $ | 15.21 | |
Income (loss) from investment operations: | | | | | | | | | | | | | | | | | | | | |
Net investment income^b | | | .19 | | | | .23 | | | | .30 | | | | .34 | | | | .35 | |
Net realized and unrealized gain (loss) on investment transactions | | | 1.53 | | | | (1.97 | ) | | | (1.07 | ) | | | (.62 | ) | | | 1.85 | |
| | |
|
|
| |
|
|
| |
|
|
| |
|
|
| |
|
|
|
Total from investment operations | | | 1.72 | | | | (1.74 | ) | | | (.77 | ) | | | (.28 | ) | | | 2.20 | |
| | |
|
|
| |
|
|
| |
|
|
| |
|
|
| |
|
|
|
Less distributions from: | | | | | | | | | | | | | | | | | | | | |
Net investment income | | | (.25 | ) | | | (.30 | ) | | | (.34 | ) | | | (.28 | ) | | | (.18 | ) |
Net realized gains on investment transactions | | | — | | | | — | | | | (.52 | ) | | | (2.16 | ) | | | (1.12 | ) |
| | |
|
|
| |
|
|
| |
|
|
| |
|
|
| |
|
|
|
Total distributions | | | (.25 | ) | | | (.30 | ) | | | (.86 | ) | | | (2.44 | ) | | | (1.30 | ) |
| | |
|
|
| |
|
|
| |
|
|
| |
|
|
| |
|
|
|
Net asset value, end of period | | $ | 11.19 | | | $ | 9.72 | | | $ | 11.76 | | | $ | 13.39 | | | $ | 16.11 | |
| | |
|
|
| |
|
|
| |
|
|
| |
|
|
| |
|
|
|
Total Return (%) | | | 17.94 | | | | (15.07 | ) | | | (6.06 | ) | | | (2.02 | ) | | | 15.32 | |
| | |
|
|
| |
|
|
| |
|
|
| |
|
|
| |
|
|
|
Ratios to Average Net Assets and Supplemental Data | | | | | | | | | | | | | | | | | | | | |
Net assets, end of period ($ millions) | | | 143 | | | | 130 | | | | 173 | | | | 190 | | | | 199 | |
Ratio of expenses before expense reductions (%) | | | .59 | | | | .56 | | | | .57^c | | | | .54 | | | | .55 | |
Ratio of expense after expense reductions (%) | | | .59 | | | | .56 | | | | .56c | | | | .54 | | | | .55 | |
Ratio of net investment income (%) | | | 1.82 | | | | 2.19 | | | | 2.46 | | | | 2.41 | | | | 2.36 | |
Portfolio turnover rate (%) | | | 99 | ^d | | | 141 | ^d | | | 100 | ^d | | | 127 | | | | 98 | |
| ^a | As required, effective January 1, 2001, the Portfolio has adopted the provisions of the AICPA Audit and Accounting Guide for Investment Companies and began amortizing premium on debt securities. In addition, paydowns on mortgage-backed securities which were included in realized gain/loss on investment transactions prior to January 1, 2001 are included as interest income. The effect of this change for the year ended December 31, 2001 was to decrease net investment income per share by $.01, increase net realized and unrealized gain (loss) per share by $.01, and decrease the ratio of net investment income to average net assets from 2.56% to 2.46%. Per share data and ratios for periods prior to January 1, 2001 have not been restated to reflect this change in presentation. |
| ^b | Based on average shares outstanding during the period. |
| ^c | The ratios of operating expenses excluding costs incurred in connection with a fund complex reorganization before and after expense reductions were .56% and .56%, respectively. |
| ^d | The Portfolio turnover rate including mortgage dollar roll transactions was 112%, 146% and 104% for the years ended December 31, 2003, December 31, 2002 and December 31, 2001, respectively. |
8
Other Policies and Risks
While the previous pages describe the main points of the portfolio’s strategy and risks, there are a few other issues to know about:
| | • | | The portfolio may trade securities actively. This could raise transaction costs and, accordingly, lower performance. |
| | • | | The advisor measures credit quality at the time it buys securities, using independent ratings or, for unrated securities, its own credit analysis. If a security’s credit quality declines, the advisor will decide what to do with the security based on its assessment of what would benefit shareholders most. |
For more information
This prospectus doesn’t tell you about every policy or risk of investing in the portfolio. If you want more information on the portfolio’s allowable securities and investment practices and its characteristics and risks, you may want to request a copy of the Statement of Additional Information (the back cover of this prospectus tells you how to do this).
Keep in mind that there is no assurance that the portfolio will achieve its objective.
The Investment Advisor
Deutsche Investment Management Americas Inc. (“DeIM”), which is part of Deutsche Asset Management, is the investment advisor for the portfolio. Under the supervision of the Board of Trustees, DeIM, with headquarters at 345 Park Avenue, New York, NY, makes the portfolio’s investment decisions, buys and sells securities for the portfolio and conducts research that leads to these purchase and sale decisions. DeIM and its predecessors have more than 80 years of experience managing mutual funds. DeIM provides a full range of investment advisory services to institutional and retail clients. DeIM is also responsible for selecting brokers and dealers and for negotiating brokerage commissions and dealer charges.
Scudder Investments is part of Deutsche Asset Management, which is the marketing name in the US for the asset management activities of Deutsche Bank AG, DeIM, Deutsche Asset Management, Inc., Deutsche Asset Management Investment Services Ltd., Deutsche Bank Trust Company Americas and Scudder Trust Company.
Deutsche Asset Management is a global asset management organization that offers a wide range of investing expertise and resources, including hundreds of portfolio managers and analysts and an office network that reaches the world’s major investment centers. This well-resourced global investment platform brings together a wide variety of experience and investment insight across industries, regions, asset classes and investing styles.
DeIM is an indirect, wholly owned subsidiary of Deutsche Bank AG. Deutsche Bank AG is a major global banking institution that is engaged in a wide range of financial services, including investment management, mutual fund, retail, private and commercial banking, investment banking and insurance.
The advisor receives a management fee from the portfolio. Below is the actual rate paid by the portfolio during the most recent fiscal year, as a percentage of the portfolio’s average daily net assets.
| | | |
Portfolio Name
| | Fee Paid
| |
Balanced Portfolio | | 0.475 | % |
9
Your Investment in the Portfolio
The information in this section may affect anyone who selects the portfolio as an investment option in a variable annuity contract or variable life insurance policy that offers the portfolio. These contracts and policies are described in separate prospectuses issued by participating insurance companies. The portfolio assumes no responsibility for such prospectuses.
Policies about transactions
The portfolio offers two classes of shares. The information in this prospectus applies to Class A shares of the portfolio. Class A shares are offered at net asset value and are not subject to 12b-1 fees.
Technically, the shareholders of Scudder Variable Series I (which includes the portfolio just described) are the participating insurance companies (the “insurance companies”) that offer the portfolio as a choice for holders of certain variable annuity contracts or variable life insurance policies (the “contract(s)”) issued or sponsored by the insurance companies. The insurance companies effectively pass through the ownership of portfolio shares to their contract owners and some may pass through voting rights as well. The portfolio does not sell shares directly to the public. The portfolio sells shares only to separate accounts of insurance companies. As a contract owner, your premium payments are allocated to the portfolio by the insurance companies in accordance with your contract. Please see the contract prospectus that accompanies this prospectus for a detailed explanation of your contract.
Please bear in mind that there are important differences between funds available to any investor (a “Retail Fund”) and those that are only available through certain financial institutions, such as insurance companies. For example, Retail Funds, unlike the portfolio, are not sold to insurance company separate accounts to support investments in variable insurance contracts. In addition, the investment objective, policies and strategies of the portfolio, while similar to those of a Retail Fund, are not identical. Retail Funds may be smaller or larger than the portfolio and have different expense ratios than the portfolio. As a result, the performance of the portfolio and a Retail Fund will differ.
Should any conflict between contract owners arise that would require that a substantial amount of net assets be withdrawn from the portfolio, orderly portfolio management could be disrupted to the potential detriment of contract owners in the portfolio.
The portfolio has a verification process for new insurance company accounts to help the government fight the funding of terrorism and money laundering activities. Federal law requires all financial institutions to obtain, verify and record information that identifies each insurance company that opens an account. What this means to you: When an insurance company opens an account, the portfolio will ask for its name, address and other information that will allow the portfolio to identify the company. This information will be verified to ensure the identity of all insurance companies opening an account.
For certain insurance companies, the portfolio might request additional information (for instance, the portfolio would ask for documents such as the insurance company’s articles of incorporation) to help the portfolio verify the insurance company’s identity.
The portfolio will not complete the purchase of any shares for an account until all information has been provided and the application has been submitted in “good order.” Once the application is determined to be in good order, the purchase(s) will be effected at the net asset value per share next calculated.
The portfolio may reject a new account application if the insurance company doesn’t provide any required or requested identifying information, or for other reasons.
The advisor, Scudder Distributors, Inc. and/or their affiliates may pay additional compensation from their own assets to other persons for selling, distributing and/or servicing portfolio shares. This compensation may be significant. You should talk to your insurance company to determine if this compensation influenced the advisor’s recommendation of the portfolio.
10
Buying and Selling Shares
The portfolio is open for business each day the New York Stock Exchange is open. The portfolio calculates its share price every business day, as of the close of regular trading on the Exchange (typically 4 p.m. Eastern time, but sometimes earlier, as in the case of scheduled half-day trading or unscheduled suspensions of trading).
The portfolio continuously sells shares to each insurance company, without a sales charge, at the net asset value per share next determined after a proper purchase order is placed with the insurance company. The insurance company offers contract owners units in its separate accounts which directly correspond to shares in the portfolio. Each insurance company submits purchase and redemption orders to the portfolio based on allocation instructions for premium payments, transfer instructions and surrender or partial withdrawal requests for contract owners, as set forth in the accompanying prospectus for the contracts. These orders reflect the amount of premium payments to be invested, surrender and transfer requests, and other matters. Redemption orders are effected at the next net asset value per share determined after a proper redemption order is placed with the insurance company. Contract owners should look at their contract prospectuses for redemption procedures and fees.
Important information about buying and selling shares
| | • | | After receiving a contract owner’s order, the insurance company buys or sells shares at the net asset value next calculated on any day the portfolio is open for business. |
| | • | | Unless otherwise instructed, the portfolio normally makes payment of the proceeds from the sale of shares the next business day but always within seven calendar days. |
| | • | | The portfolio does not issue share certificates. |
| | • | | The portfolio reserves the right to reject purchases of shares for any reason. |
| | • | | The portfolio reserves the right to withdraw or suspend the offering of shares at any time. |
| | • | | The portfolio reserves the right to reject purchases of shares or to suspend or postpone redemptions at times when the New York Stock Exchange is closed (other than customary closings), trading is restricted or when an emergency exists that prevents the portfolio from disposing of its portfolio securities or pricing its shares. |
| | • | | The portfolio may refuse, cancel or rescind any purchase order; freeze any account (meaning the insurance company will not be able to purchase shares in its account); suspend account services; and/or involuntarily redeem the account if we think that the account is being used for fraudulent or illegal purposes by the insurance company; one or more of these actions will be taken when, at the sole discretion of the portfolio, they are deemed to be in the portfolio’s best interest or when the portfolio is requested or compelled to do so by governmental authority or by applicable law. |
| | • | | The portfolio may close and liquidate an account if the portfolio is unable to verify provided information, or for other reasons; if the portfolio decides to close the account, the shares will be redeemed at the net asset value per share next calculated after we determine to close the account; the insurance company may be subject to gain or loss on the redemption of the portfolio shares and may incur tax liability. |
| | • | | Market timing — the frequent trading of portfolio shares designed to take advantage of short-term market movements — can harm the portfolio and its shareholders. The portfolio and their agents may reject or limit purchase orders when there appears to be a pattern of market timing or other frequent purchases and sales. Because the portfolio’s shares are offered exclusively to insurance company separate accounts that fund certain insurance contracts, the portfolio generally has little or no access to the records of individual contract holders. The portfolio is dependent on the ability of these separate accounts to limit market timing and excessive trading of portfolio shares. The portfolio is working with separate accounts to assess and improve controls against inappropriate trading. There can be no assurance that market timing in the portfolio’s shares will not occur. |
| | • | | A contract owner’s purchase order may not be accepted if the sale of portfolio shares has been suspended or if it is determined that the purchase would be detrimental to the interests of the portfolio’s shareholders. |
| | • | | Currently, the Board of Trustees of Scudder Variable Series I does not foresee any disadvantages to contract owners arising from the fact that the interests of contract owners may differ. Nevertheless, the Board intends to monitor events in order to identify any material irreconcilable conflicts that may possibly arise and to determine what action, if any, should be taken. |
How to receive account information
If you are a contract owner, you should contact your insurance company or the organization that provides record keeping services for information about your account.
Please see the contract prospectus that accompanies this prospectus for the customer service phone number.
11
How to buy and sell shares
Each insurance company has different provisions about how and when their contract owners may buy and sell portfolio shares. Each insurance company is responsible for communicating its contract owners’ instructions to the portfolio. Contract owners should contact their insurance company to effect transactions in the portfolio.
How the Portfolio Calculates Share Price
To calculate net asset value per share or NAV, the portfolio uses the following equation:
| | | | |
| | | TOTAL ASSETS - TOTAL LIABILITIES | | = NAV |
| | TOTAL NUMBER OF SHARES OUTSTANDING | |
The price at which you sell shares for the portfolio is also the NAV.
We typically value securities using market quotations or information furnished by a pricing service. However, we may use methods approved by the portfolio’s Board that are intended to reflect fair value when a market quotation or pricing service information is not readily available or when a security’s value is believed to have been materially affected by a significant event, such as a natural disaster, an economic event like a bankruptcy filing, or a substantial fluctuation in domestic or foreign markets, that has occurred after the close of the exchange or market on which the security is principally traded (for example, a foreign exchange or market). In such a case, the portfolio’s value for a security is likely to be different from the last quoted market price or pricing service information. In addition, due to the subjective and variable nature of fair value pricing, it is possible that the value determined for a particular security may be materially different from the value realized upon such security sale.
To the extent that the portfolio invests in securities that are traded primarily in foreign markets, the value of its holdings could change at a time when you aren’t able to buy or sell portfolio shares through the contract. This is because some foreign markets are open on days and at times when the portfolio doesn’t price their shares.
Distributions
The portfolio intends to declare and distribute dividends from their net investment income and capital gains, if any, annually. The portfolio may make additional distributions if necessary.
All distributions will be reinvested in shares of the portfolio unless we are informed by an insurance company that they should be paid out in cash. The insurance companies will be informed about the amount and character of distributions from the portfolio for federal income tax purposes.
Taxes
The portfolio intends to qualify each year as a regulated investment company under Subchapter M of the Internal Revenue Code of 1986, as amended, and to meet all requirements necessary to avoid paying any federal income or excise taxes.
Generally, owners of variable annuity and variable life contracts are not taxed currently on income or gains realized with respect to such contracts. However, some distributions from such contracts, whether made prior to or during the annuity payment period, may be taxable at ordinary income tax rates. In addition, distributions made to an owner who is younger than 59 1/2 may be subject to a 10% penalty tax. For further information concerning federal income tax consequences for the holders of variable annuity contracts and variable life insurance policies, such holders should consult the prospectus used in connection with the issuance of their particular contracts or policies.
In order for investors to receive the favorable tax treatment available to holders of variable annuity and variable life contracts, the separate accounts underlying such contracts, as well as the funds in which such accounts invest, must meet certain diversification requirements. The portfolio intends to comply with these requirements. If the portfolio or separate account does not meet such requirements, income allocable to the contracts associated with the separate account would be taxable currently to the holders of such contracts and income from prior periods with respect to such contracts also could be taxable.
Portfolio investments in securities of foreign issuers may be subject to withholding and other taxes at the source, including on dividend or interest payments. Participating insurance companies should consult their own tax advisors as to whether such distributions are subject to federal income tax if they are retained as part of policy reserves.
The preceding is a brief summary of certain of the relevant tax considerations. Because each shareholder and contract holder’s tax situation is unique, ask your tax professional about the tax consequences of your investments, including possible foreign, state or local taxes.
12
This page intentionally left blank.
To Get More Information
Shareholder reports — These include commentary from the portfolio’s management team about recent market conditions and the portfolio’s performance. They also have detailed performance figures, a list of everything the portfolio owns, and its financial statements. Shareholders get these reports automatically.
Statement of Additional Information (SAI) — This tells you more about the portfolio’s features and policies, including additional risk information. The SAI is incorporated by reference into this document (meaning that it’s legally part of this prospectus).
For a free copy of any of these documents or to request other information about the portfolio, call (800) 778-1482, or contact Scudder Investments at the address listed below. These documents and other information about the portfolio are available from the EDGAR Database on the SEC’s Internet site at www.sec.gov. If you like, you may obtain copies of this information, after paying a copying fee, by e-mailing a request to publicinfo@sec.gov or by writing the SEC at the address listed below. You can also review and copy these documents and other information about the portfolio, including the portfolio’s SAI, at the SEC’s Public Reference Room in Washington, D.C. Information on the operation of the SEC’s Public Reference Room may be obtained by calling (202) 942-8090.
| | |
| Scudder Distributors, Inc. | | SEC |
222 South Riverside Plaza Chicago, IL 60606-5808 (800) 778-1482 | | 450 Fifth Street, N.W. Washington, D.C. 20549-0102 (202) 942-8090 www.sec.gov SEC File # |
| |
| |
| |
| |
| |
| Scudder Variable Series I | | 811-4257 |
| |
| (05/01/04) | | |
| 1a-bal | | |
STATEMENT OF ADDITIONAL INFORMATION
SCUDDER VARIABLE SERIES II
SCUDDER TOTAL RETURN PORTFOLIO
222 S. Riverside Plaza
Chicago, Illinois 60606
This statement of additional information is not a prospectus, but should be read in conjunction with the Prospectus/Proxy Statement dated , 2005 for the Special Meeting of Shareholders of Balanced Portfolio, a series of Scudder Variable Series I, to be held on April 15, 2005, into which this statement of additional information is hereby incorporated by reference. Copies of the Prospectus/Proxy Statement may be obtained at no charge by contacting Scudder Distributors, Inc., 222 South Riverside Plaza, Chicago, Illinois 60606, (800) 621-1048, or from the firm from which this statement of additional information was obtained and are available along with other materials on the Securities and Exchange Commission’s Internet website (http://www.sec.gov). Unless otherwise indicated, capitalized terms used herein and not otherwise defined have the same meanings as are given to them in the Prospectus/Proxy Statement.
Further information about Scudder Total Return Portfolio (“Total Return Portfolio”), a series of Scudder Variable Series II, is contained in Total Return Portfolio’s statement of additional information dated May 1, 2004, as supplemented from time to time, for Class A shares and Class B shares, which is attached to this statement of additional information. The audited financial statements and related independent registered public accounting firm’s report for the Total Return Portfolio contained in the Annual Report for the fiscal year ended December 31, 2004 are incorporated herein by reference. No other parts of the Annual Report are incorporated by reference herein.
The unaudited pro forma financial statements, attached hereto, are intended to present the financial condition and related results of operations of the Total Return Portfolio and Balanced Portfolio as if the merger had been consummated on December 31, 2003, except as otherwise indicated.
Further information about the Balanced Portfolio is contained in its statement of additional information dated May 1, 2004, as supplemented from time to time, for Class A and Class B shares. The audited financial statements and related independent registered public accounting firm’s report for the Balanced Portfolio contained in the Annual Report for the fiscal year ended December 31, 2004 are incorporated herein by reference. No other parts of the Annual Report are incorporated by reference herein.
The date of this statement of additional information is [ ], 2005.
S – 1
Pro Forma
Portfolio of Investments
as of December 31, 2004
(UNAUDITED)
(See the Notes at the end of the Portfolio of Investments for a list of abbreviations used.)
| | | | | | | | | | | | |
| | | Balanced
Portfolio
Par/Share
Amount
| | Total Return
Portfolio
Par/Share
Amount
| | Total Return Portfolio– Combined
Pro Forma
Par/Share
Amount
| | Balanced
Portfolio
Market
Value ($)
| | Total Return
Portfolio
Market
Value ($)
| | Total Return
Portfolio– Combined
Pro Forma
Market
Value ($)
|
Common Stocks 60.0% | | | | | | | | | | | | |
Consumer Discretionary 7.5% | | | | | | | | | | | | |
Auto Components 0.1% | | | | | | | | | | | | |
Goodyear Tire & Rubber Co. | | 5,500 | | — | | 5,500 | | 80,630 | | — | | 80,630 |
Tenneco Automotive, Inc. | | 2,800 | | 17,700 | | 20,500 | | 48,272 | | 305,148 | | 353,420 |
| | | | | | | | |
| |
| |
|
| | | | | | | | | 128,902 | | 305,148 | | 434,050 |
| | | | | | | | |
| |
| |
|
Automobiles 0.5% | | | | | | | | | | | | |
Harley-Davidson, Inc. | | 8,700 | | 43,400 | | 52,100 | | 528,525 | | 2,636,550 | | 3,165,075 |
Monaco Coach Corp. | | 3,300 | | 16,400 | | 19,700 | | 67,881 | | 337,348 | | 405,229 |
| | | | | | | | |
| |
| |
|
| | | | | | | | | 596,406 | | 2,973,898 | | 3,570,304 |
| | | | | | | | |
| |
| |
|
Distributors 0.0% | | | | | | | | | | | | |
Handleman Co. | | — | | 2,200 | | 2,200 | | — | | 47,256 | | 47,256 |
| | | | | | |
Hotels Restaurants & Leisure 1.2% | | | | | | | | | | | | |
Alliance Gaming Corp. | | 5,600 | | 28,300 | | 33,900 | | 77,336 | | 390,823 | | 468,159 |
Ameristar Casinos, Inc. | | 1,500 | | 7,600 | | 9,100 | | 64,665 | | 327,636 | | 392,301 |
California Pizza Kitchen, Inc. | | 3,100 | | 15,200 | | 18,300 | | 71,300 | | 349,600 | | 420,900 |
CEC Entertainment, Inc. | | 2,400 | | 12,100 | | 14,500 | | 95,928 | | 483,637 | | 579,565 |
International Game Technology | | 10,500 | | 53,300 | | 63,800 | | 360,990 | | 1,832,454 | | 2,193,444 |
Jack in the Box, Inc. | | 200 | | — | | 200 | | 7,374 | | — | | 7,374 |
Landry’s Restaurants, Inc. | | — | | 13,800 | | 13,800 | | — | | 401,028 | | 401,028 |
McDonald’s Corp. | | 12,000 | | 59,900 | | 71,900 | | 384,720 | | 1,920,394 | | 2,305,114 |
YUM! Brands, Inc. | | 8,000 | | 40,000 | | 48,000 | | 377,440 | | 1,887,200 | | 2,264,640 |
| | | | | | | | |
| |
| |
|
| | | | | | | | | 1,439,753 | | 7,592,772 | | 9,032,525 |
| | | | | | | | |
| |
| |
|
Household Durables 0.1% | | | | | | | | | | | | |
American Woodmark Corp. | | 500 | | 3,100 | | 3,600 | | 21,840 | | 135,408 | | 157,248 |
Fortune Brands, Inc. | | 1,500 | | 7,300 | | 8,800 | | 115,770 | | 563,414 | | 679,184 |
| | | | | | | | |
| |
| |
|
| | | | | | | | | 137,610 | | 698,822 | | 836,432 |
| | | | | | | | |
| |
| |
|
Internet & Catalog Retail 0.3% | | | | | | | | | | | | |
eBay, Inc. | | 3,300 | | 16,800 | | 20,100 | | 383,724 | | 1,953,504 | | 2,337,228 |
J. Jill Group, Inc. | | — | | 14,900 | | 14,900 | | — | | 221,861 | | 221,861 |
| | | | | | | | |
| |
| |
|
| | | | | | | | | 383,724 | | 2,175,365 | | 2,559,089 |
| | | | | | | | |
| |
| |
|
Leisure Equipment & Products 0.1% | | | | | | | | | | | | |
Arctic Cat, Inc. | | 2,200 | | 7,200 | | 9,400 | | 58,344 | | 190,944 | | 249,288 |
RC2 Corp. | | 100 | | 11,300 | | 11,400 | | 3,260 | | 368,380 | | 371,640 |
| | | | | | | | |
| |
| |
|
| | | | | | | | | 61,604 | | 559,324 | | 620,928 |
| | | | | | | | |
| |
| |
|
Media 1.3% | | | | | | | | | | | | |
aQuantive, Inc. | | — | | 7,400 | | 7,400 | | — | | 66,156 | | 66,156 |
Comcast Corp., “A” | | 9,100 | | 45,600 | | 54,700 | | 298,844 | | 1,497,504 | | 1,796,348 |
McGraw-Hill Companies, Inc. | | 4,900 | | 24,600 | | 29,500 | | 448,546 | | 2,251,884 | | 2,700,430 |
Mediacom Communications Corp., “A” | | 7,700 | | 25,400 | | 33,100 | | 48,125 | | 158,750 | | 206,875 |
Omnicom Group, Inc. | | 5,700 | | 28,800 | | 34,500 | | 480,624 | | 2,428,416 | | 2,909,040 |
Reader’s Digest Association, Inc. | | 3,200 | | 32,600 | | 35,800 | | 44,512 | | 453,466 | | 497,978 |
Salem Communications Corp., “A” | | 1,200 | | 2,400 | | 3,600 | | 29,940 | | 59,880 | | 89,820 |
Viacom, Inc., “B” | | 8,270 | | 41,439 | | 49,709 | | 300,945 | | 1,507,965 | | 1,808,910 |
| | | | | | | | |
| |
| |
|
| | | | | | | | | 1,651,536 | | 8,424,021 | | 10,075,557 |
| | | | | | | | |
| |
| |
|
Multiline Retail 1.5% | | | | | | | | | | | | |
Family Dollar Stores, Inc. | | 19,300 | | 95,900 | | 115,200 | | 602,739 | | 2,994,957 | | 3,597,696 |
Kirkland’s, Inc. | | 2,400 | | 3,700 | | 6,100 | | 29,496 | | 45,473 | | 74,969 |
Kohl’s Corp. | | 3,100 | | 15,500 | | 18,600 | | 152,427 | | 762,135 | | 914,562 |
May Department Stores Co. | | 16,400 | | 81,600 | | 98,000 | | 482,160 | | 2,399,040 | | 2,881,200 |
Target Corp. | | 13,600 | | 68,600 | | 82,200 | | 706,248 | | 3,562,398 | | 4,268,646 |
| | | | | | | | |
| |
| |
|
| | | | | | | | | 1,973,070 | | 9,764,003 | | 11,737,073 |
| | | | | | | | |
| |
| |
|
Specialty Retail 2.2% | | | | | | | | | | | | |
Aeropostale, Inc. | | 1,900 | | 9,500 | | 11,400 | | 55,917 | | 279,585 | | 335,502 |
Bed Bath & Beyond, Inc. | | 2,700 | | 13,300 | | 16,000 | | 107,541 | | 529,739 | | 637,280 |
Cato Corp., “A” | | 3,000 | | 14,800 | | 17,800 | | 86,460 | | 426,536 | | 512,996 |
S-2
| | | | | | | | | | | | |
| | | Balanced
Portfolio
Par/Share
Amount
| | Total Return
Portfolio
Par/Share
Amount
| | Total Return
Portfolio– Combined
Pro Forma
Par/Share
Amount
| | Balanced
Portfolio
Market
Value ($)
| | Total Return
Portfolio
Market
Value ($)
| | Total Return
Portfolio– Combined
Pro Forma
Market
Value ($)
|
Charlotte Russe Holding, Inc. | | 4,400 | | 23,100 | | 27,500 | | 44,440 | | 233,310 | | 277,750 |
Charming Shoppes, Inc. | | 7,400 | | 33,500 | | 40,900 | | 69,338 | | 313,895 | | 383,233 |
Dick’s Sporting Goods, Inc. | | — | | 2,300 | | 2,300 | | — | | 80,845 | | 80,845 |
GameStop Corp., “A” | | — | | 2,400 | | 2,400 | | — | | 53,664 | | 53,664 |
Home Depot, Inc. | | 2,300 | | 11,500 | | 13,800 | | 98,302 | | 491,510 | | 589,812 |
Limited Brands | | 19,800 | | 98,500 | | 118,300 | | 455,796 | | 2,267,470 | | 2,723,266 |
Lowe’s Companies, Inc. | | 17,600 | | 87,700 | | 105,300 | | 1,013,584 | | 5,050,643 | | 6,064,227 |
Sherwin-Williams Co. | | 11,800 | | 58,500 | | 70,300 | | 526,634 | | 2,610,855 | | 3,137,489 |
Stage Stores, Inc. | | 1,500 | | 2,800 | | 4,300 | | 62,280 | | 116,256 | | 178,536 |
Staples, Inc. | | 7,100 | | 35,900 | | 43,000 | | 239,341 | | 1,210,189 | | 1,449,530 |
Stein Mart, Inc. | | 3,700 | | 17,800 | | 21,500 | | 63,122 | | 303,668 | | 366,790 |
Too, Inc. | | 3,000 | | 14,700 | | 17,700 | | 73,380 | | 359,562 | | 432,942 |
Trans World Entertainment Corp. | | 4,200 | | 4,600 | | 8,800 | | 52,374 | | 57,362 | | 109,736 |
| | | | | | | | |
| |
| |
|
| | | | | | | | | 2,948,509 | | 14,385,089 | | 17,333,598 |
| | | | | | | | |
| |
| |
|
Textiles, Apparel & Luxury Goods 0.2% | | | | | | | | | | | | |
Cherokee, Inc. | | — | | 600 | | 600 | | — | | 21,168 | | 21,168 |
Guess?, Inc. | | 4,000 | | 21,000 | | 25,000 | | 50,200 | | 263,550 | | 313,750 |
Phillips-Van Heusen Corp. | | — | | 1,600 | | 1,600 | | — | | 43,200 | | 43,200 |
Skechers USA, Inc., “A” | | 4,700 | | 23,200 | | 27,900 | | 60,912 | | 300,672 | | 361,584 |
Wolverine World Wide, Inc. | | — | | 15,300 | | 15,300 | | — | | 480,726 | | 480,726 |
| | | | | | | | |
| |
| |
|
| | | | | | | | | 111,112 | | 1,109,316 | | 1,220,428 |
| | | | | | | | |
| |
| |
|
Consumer Staples 5.0% | | | | | | | | | | | | |
Beverages 0.6% | | | | | | | | | | | | |
Boston Beer Co., Inc., “A” | | 2,400 | | 4,800 | | 7,200 | | 51,048 | | 102,096 | | 153,144 |
PepsiCo, Inc. | | 14,360 | | 72,720 | | 87,080 | | 749,592 | | 3,795,984 | | 4,545,576 |
| | | | | | | | |
| |
| |
|
| | | | | | | | | 800,640 | | 3,898,080 | | 4,698,720 |
| | | | | | | | |
| |
| |
|
Food & Staples Retailing 1.1% | | | | | | | | | | | | |
Casey’s General Stores, Inc. | | 3,100 | | — | | 3,100 | | 56,265 | | — | | 56,265 |
Nash-Finch Co. | | 1,300 | | 6,600 | | 7,900 | | 49,088 | | 249,216 | | 298,304 |
Pantry, Inc. | | 2,600 | | 12,700 | | 15,300 | | 78,234 | | 382,143 | | 460,377 |
Wal-Mart Stores, Inc. | | 17,600 | | 89,100 | | 106,700 | | 929,632 | | 4,706,262 | | 5,635,894 |
Walgreen Co. | | 9,800 | | 49,800 | | 59,600 | | 376,026 | | 1,910,826 | | 2,286,852 |
| | | | | | | | |
| |
| |
|
| | | | | | | | | 1,489,245 | | 7,248,447 | | 8,737,692 |
| | | | | | | | |
| |
| |
|
Food Products 1.9% | | | | | | | | | | | | |
ConAgra Foods, Inc. | | 19,900 | | 99,200 | | 119,100 | | 586,055 | | 2,921,440 | | 3,507,495 |
Dean Foods Co. | | 2,500 | | 12,700 | | 15,200 | | 82,375 | | 418,465 | | 500,840 |
General Mills, Inc. | | 14,800 | | 73,400 | | 88,200 | | 735,708 | | 3,648,714 | | 4,384,422 |
Hershey Foods Corp. | | 4,300 | | 21,800 | | 26,100 | | 238,822 | | 1,210,772 | | 1,449,594 |
Kellogg Co. | | 5,800 | | 29,200 | | 35,000 | | 259,028 | | 1,304,072 | | 1,563,100 |
Lance, Inc. | | 800 | | 21,800 | | 22,600 | | 15,224 | | 414,854 | | 430,078 |
Sara Lee Corp. | | 24,200 | | 120,100 | | 144,300 | | 584,188 | | 2,899,214 | | 3,483,402 |
| | | | | | | | |
| |
| |
|
| | | | | | | | | 2,501,400 | | 12,817,531 | | 15,318,931 |
| | | | | | | | |
| |
| |
|
Household Products 1.3% | | | | | | | | | | | | |
Colgate-Palmolive Co. | | 5,100 | | 25,700 | | 30,800 | | 260,916 | | 1,314,812 | | 1,575,728 |
Hooker Furniture Corp. | | — | | 8,300 | | 8,300 | | — | | 188,410 | | 188,410 |
Kimberly-Clark Corp. | | 10,800 | | 54,000 | | 64,800 | | 710,748 | | 3,553,740 | | 4,264,488 |
Procter & Gamble Co. | | 13,100 | | 66,300 | | 79,400 | | 721,548 | | 3,651,804 | | 4,373,352 |
| | | | | | | | |
| |
| |
|
| | | | | | | | | 1,693,212 | | 8,708,766 | | 10,401,978 |
| | | | | | | | |
| |
| |
|
Personal Products 0.1% | | | | | | | | | | | | |
Elizabeth Arden, Inc. | | 2,500 | | 12,600 | | 15,100 | | 59,350 | | 299,124 | | 358,474 |
| | | | | | |
Energy 5.1% | | | | | | | | | | | | |
Energy Equipment & Services 1.1% | | | | | | | | | | | | |
Baker Hughes, Inc. | | 9,000 | | 45,100 | | 54,100 | | 384,030 | | 1,924,417 | | 2,308,447 |
Cal Dive International, Inc. | | 2,100 | | 10,400 | | 12,500 | | 85,575 | | 423,800 | | 509,375 |
Nabors Industries Ltd. | | 7,300 | | 36,800 | | 44,100 | | 374,417 | | 1,887,472 | | 2,261,889 |
Offshore Logistics, Inc. | | — | | 1,000 | | 1,000 | | — | | 32,470 | | 32,470 |
Schlumberger Ltd. | | 6,600 | | 33,300 | | 39,900 | | 441,870 | | 2,229,435 | | 2,671,305 |
Transocean, Inc. | | 4,300 | | 21,800 | | 26,100 | | 182,277 | | 924,102 | | 1,106,379 |
| | | | | | | | |
| |
| |
|
| | | | | | | | | 1,468,169 | | 7,421,696 | | 8,889,865 |
| | | | | | | | |
| |
| |
|
Oil & Gas 4.0% | | | | | | | | | | | | |
BP PLC, (ADR) | | 6,900 | | 34,500 | | 41,400 | | 402,960 | | 2,014,800 | | 2,417,760 |
Burlington Resources, Inc. | | 9,200 | | 45,400 | | 54,600 | | 400,200 | | 1,974,900 | | 2,375,100 |
Callon Petroleum Co. | | 3,300 | | 9,800 | | 13,100 | | 47,718 | | 141,708 | | 189,426 |
S-3
| | | | | | | | | | | | |
| | | Balanced
Portfolio
Par/Share
Amount
| | Total Return
Portfolio
Par/Share
Amount
| | Total Return
Portfolio– Combined
Pro Forma
Par/Share
Amount
| | Balanced
Portfolio
Market
Value ($)
| | Total Return
Portfolio
Market
Value ($)
| | Total Return
Portfolio– Combined
Pro Forma
Market
Value ($)
|
ChevronTexaco Corp. | | 9,200 | | 45,700 | | 54,900 | | 483,092 | | 2,399,707 | | 2,882,799 |
Cimarex Energy Co. | | 2,000 | | 12,200 | | 14,200 | | 75,800 | | 462,380 | | 538,180 |
Comstock Resources, Inc. | | 3,700 | | 18,400 | | 22,100 | | 81,585 | | 405,720 | | 487,305 |
ConocoPhillips | | 9,000 | | 44,900 | | 53,900 | | 781,470 | | 3,898,667 | | 4,680,137 |
Devon Energy Corp. | | 11,000 | | 56,200 | | 67,200 | | 428,120 | | 2,187,304 | | 2,615,424 |
EOG Resources, Inc. | | 5,600 | | 27,800 | | 33,400 | | 399,616 | | 1,983,808 | | 2,383,424 |
ExxonMobil Corp. | | 19,800 | | 98,600 | | 118,400 | | 1,014,948 | | 5,054,236 | | 6,069,184 |
Houston Exploration Co. | | 1,700 | | 8,500 | | 10,200 | | 95,727 | | 478,635 | | 574,362 |
Meridian Resource Corp. | | — | | 27,500 | | 27,500 | | — | | 166,375 | | 166,375 |
Overseas Shipholding Group, Inc. | | 1,600 | | 8,200 | | 9,800 | | 88,320 | | 452,640 | | 540,960 |
Remington Oil & Gas Corp. | | 3,200 | | 15,500 | | 18,700 | | 87,200 | | 422,375 | | 509,575 |
Royal Dutch Petroleum Co., (NY Shares) | | 9,000 | | 45,000 | | 54,000 | | 516,420 | | 2,582,100 | | 3,098,520 |
Southwestern Energy Co. | | 1,300 | | 10,400 | | 11,700 | | 65,897 | | 527,176 | | 593,073 |
Tesoro Petroleum Corp. | | 2,300 | | 11,200 | | 13,500 | | 73,278 | | 356,832 | | 430,110 |
Vintage Petroleum, Inc. | | 3,500 | | 17,000 | | 20,500 | | 79,415 | | 385,730 | | 465,145 |
Whiting Petroleum Corp. | | 2,900 | | 14,200 | | 17,100 | | 87,725 | | 429,550 | | 517,275 |
| | | | | | | | |
| |
| |
|
| | | | | | | | | 5,209,491 | | 26,324,643 | | 31,534,134 |
| | | | | | | | |
| |
| |
|
Financials 11.7% | | | | | | | | | | | | |
Banks 4.9% | | | | | | | | | | | | |
AmSouth Bancorp. | | 12,800 | | 63,900 | | 76,700 | | 331,520 | | 1,655,010 | | 1,986,530 |
BancFirst Corp. | | — | | 400 | | 400 | | — | | 31,592 | | 31,592 |
Bank of America Corp. | | 34,800 | | 173,200 | | 208,000 | | 1,635,252 | | 8,138,668 | | 9,773,920 |
Banner Corp. | | 2,900 | | 4,900 | | 7,800 | | 90,451 | | 152,831 | | 243,282 |
BB&T Corp. | | 9,000 | | 44,700 | | 53,700 | | 378,450 | | 1,879,635 | | 2,258,085 |
Capitol Bancorp., Ltd. | | — | | 500 | | 500 | | — | | 17,610 | | 17,610 |
Central Pacific Financial Corp. | | — | | 500 | | 500 | | — | | 18,085 | | 18,085 |
Citizens Banking Corp. | | — | | 2,700 | | 2,700 | | — | | 92,745 | | 92,745 |
CoBiz, Inc. | | — | | 1,200 | | 1,200 | | — | | 24,360 | | 24,360 |
Columbia Banking System, Inc. | | — | | 3,100 | | 3,100 | | — | | 77,469 | | 77,469 |
Community Bank System, Inc. | | — | | 2,500 | | 2,500 | | — | | 70,625 | | 70,625 |
CVB Financial Corp. | | 3,900 | | 9,000 | | 12,900 | | 103,584 | | 239,040 | | 342,624 |
Dime Community Bancshares | | — | | 2,200 | | 2,200 | | — | | 39,402 | | 39,402 |
Downey Financial Corp. | | — | | 4,500 | | 4,500 | | — | | 256,500 | | 256,500 |
Fidelity Bancshares, Inc. | | 600 | | 4,700 | | 5,300 | | 25,656 | | 200,972 | | 226,628 |
First BanCorp. | | 1,800 | | 9,300 | | 11,100 | | 114,318 | | 590,643 | | 704,961 |
First Community Bancorp. | | 200 | | 2,400 | | 2,600 | | 8,540 | | 102,480 | | 111,020 |
FirstFed Financial Corp. | | 2,000 | | 9,200 | | 11,200 | | 103,740 | | 477,204 | | 580,944 |
Frontier Financial Corp. | | 300 | | 1,600 | | 1,900 | | 11,583 | | 61,776 | | 73,359 |
Hanmi Financial Corp. | | 2,300 | | 7,900 | | 10,200 | | 82,662 | | 283,926 | | 366,588 |
Harbor Florida Bancshares, Inc. | | 2,300 | | 6,600 | | 8,900 | | 79,603 | | 228,426 | | 308,029 |
Independent Bank Corp. | | — | | 1,400 | | 1,400 | | — | | 47,250 | | 47,250 |
Integra Bank Corp. | | 400 | | 2,200 | | 2,600 | | 9,244 | | 50,842 | | 60,086 |
MBT Financial Corp. | | — | | 1,300 | | 1,300 | | — | | 30,251 | | 30,251 |
National City Corp. | | 10,800 | | 53,500 | | 64,300 | | 405,540 | | 2,008,925 | | 2,414,465 |
National Penn Bancshares, Inc. | | — | | 800 | | 800 | | — | | 22,160 | | 22,160 |
Pacific Capital Bancorp. | | — | | 1,100 | | 1,100 | | — | | 37,389 | | 37,389 |
PNC Financial Services Group | | 14,300 | | 71,300 | | 85,600 | | 821,392 | | 4,095,472 | | 4,916,864 |
Prosperity Bancshares, Inc. | | — | | 2,000 | | 2,000 | | — | | 58,420 | | 58,420 |
Provident Bankshares Corp. | | 600 | | 3,000 | | 3,600 | | 21,822 | | 109,110 | | 130,932 |
Republic Bancorp., Inc. “A” | | — | | 1,200 | | 1,200 | | — | | 30,840 | | 30,840 |
Republic Bancorp., Inc. | | 6,700 | | 19,500 | | 26,200 | | 102,376 | | 297,960 | | 400,336 |
Silicon Valley Bancshares | | 2,300 | | 11,400 | | 13,700 | | 103,086 | | 510,948 | | 614,034 |
Southwest Bancorp. of Texas, Inc. | | — | | 3,100 | | 3,100 | | — | | 72,199 | | 72,199 |
Sterling Bancshares, Inc. | | 4,500 | | 16,900 | | 21,400 | | 64,215 | | 241,163 | | 305,378 |
Sterling Financial Corp. | | 2,500 | | 3,700 | | 6,200 | | 98,150 | | 145,262 | | 243,412 |
SunTrust Banks, Inc. | | 5,400 | | 27,100 | | 32,500 | | 398,952 | | 2,002,148 | | 2,401,100 |
Texas Capital Bancshares, Inc. | | — | | 2,300 | | 2,300 | | — | | 49,726 | | 49,726 |
TierOne Corp. | | 1,600 | | 3,500 | | 5,100 | | 39,760 | | 86,975 | | 126,735 |
Trustmark Corp. | | 1,200 | | 5,800 | | 7,000 | | 37,284 | | 180,206 | | 217,490 |
Umpqua Holdings Corp. | | — | | 3,300 | | 3,300 | | — | | 83,193 | | 83,193 |
United Community Banks, Inc. | | — | | 1,000 | | 1,000 | | — | | 26,930 | | 26,930 |
US Bancorp. | | 17,800 | | 88,900 | | 106,700 | | 557,496 | | 2,784,348 | | 3,341,844 |
Wachovia Corp. | | 12,900 | | 64,000 | | 76,900 | | 678,540 | | 3,366,400 | | 4,044,940 |
WesBanco, Inc | | 1,400 | | 3,100 | | 4,500 | | 44,758 | | 99,107 | | 143,865 |
S-4
| | | | | | | | | | | | |
| | | Balanced
Portfolio
Par/Share
Amount
| | Total Return
Portfolio
Par/Share
Amount
| | Total Return
Portfolio– Combined
Pro Forma
Par/Share
Amount
| | Balanced
Portfolio
Market
Value ($)
| | Total Return
Portfolio
Market
Value ($)
| | Total Return
Portfolio– Combined
Pro Forma
Market
Value ($)
|
Westamerica Bancorp. | | 400 | | 6,400 | | 6,800 | | 23,324 | | 373,184 | | 396,508 |
WSFS Financial Corp | | — | | 3,800 | | 3,800 | | — | | 229,216 | | 229,216 |
| | | | | | | | |
| |
| |
|
| | | | | | | | | 6,371,298 | | 31,678,623 | | 38,049,921 |
| | | | | | | | |
| |
| |
|
Capital Markets 1.3% | | | | | | | | | | | | |
Bear Stearns Companies, Inc. | | 4,300 | | 21,400 | | 25,700 | | 439,933 | | 2,189,434 | | 2,629,367 |
Goldman Sachs Group, Inc. | | 1,600 | | 8,200 | | 9,800 | | 166,464 | | 853,128 | | 1,019,592 |
Investment Technology Group, Inc. | | 3,500 | | 8,000 | | 11,500 | | 70,000 | | 160,000 | | 230,000 |
Lehman Brothers Holdings, Inc. | | 2,100 | | 10,600 | | 12,700 | | 183,708 | | 927,288 | | 1,110,996 |
Merrill Lynch & Co., Inc. | | 9,300 | | 46,500 | | 55,800 | | 555,861 | | 2,779,305 | | 3,335,166 |
Morgan Stanley | | 5,600 | | 28,100 | | 33,700 | | 310,912 | | 1,560,112 | | 1,871,024 |
| | | | | | | | |
| |
| |
|
| | | | | | | | | 1,726,878 | | 8,469,267 | | 10,196,145 |
| | | | | | | | |
| |
| |
|
Consumer Finance 0.6% | | | | | | | | | | | | |
American Express Co. | | 12,800 | | 64,800 | | 77,600 | | 721,536 | | 3,652,776 | | 4,374,312 |
| | | | | | |
Diversified Financial Services 2.9% | | | | | | | | | | | | |
Accredited Home Lenders Holding Co. | | 1,600 | | 8,400 | | 10,000 | | 79,488 | | 417,312 | | 496,800 |
ASTA Funding, Inc. | | — | | 5,000 | | 5,000 | | — | | 134,200 | | 134,200 |
Bank Mutual Corp. | | — | | 3,100 | | 3,100 | | — | | 37,727 | | 37,727 |
Chemical Financial Corp. | | — | | 2,200 | | 2,200 | | — | | 94,424 | | 94,424 |
Citigroup, Inc. | | 36,733 | | 184,299 | | 221,032 | | 1,769,796 | | 8,879,526 | | 10,649,322 |
F.N.B. Corp. | | — | | 4,100 | | 4,100 | | — | | 83,476 | | 83,476 |
Fannie Mae | | 6,500 | | 32,500 | | 39,000 | | 462,865 | | 2,314,325 | | 2,777,190 |
Freddie Mac | | 6,100 | | 30,400 | | 36,500 | | 449,570 | | 2,240,480 | | 2,690,050 |
JPMorgan Chase & Co. | | 23,800 | | 118,300 | | 142,100 | | 928,438 | | 4,614,883 | | 5,543,321 |
| | | | | | | | |
| |
| |
|
| | | | | | | | | 3,690,157 | | 18,816,353 | | 22,506,510 |
| | | | | | | | |
| |
| |
|
Insurance 1.3% | | | | | | | | | | | | |
AFLAC, Inc. | | 7,900 | | 39,600 | | 47,500 | | 314,736 | | 1,577,664 | | 1,892,400 |
Allstate Corp. | | 9,800 | | 48,600 | | 58,400 | | 506,856 | | 2,513,592 | | 3,020,448 |
American International Group, Inc. | | 11,310 | | 56,737 | | 68,047 | | 742,728 | | 3,725,919 | | 4,468,647 |
American Physicians Capital, Inc. | | — | | 1,000 | | 1,000 | | — | | 36,020 | | 36,020 |
Commerce Group, Inc. | | 1,000 | | 3,100 | | 4,100 | | 61,040 | | 189,224 | | 250,264 |
FPIC Insurance Group, Inc. | | — | | 3,200 | | 3,200 | | — | | 113,216 | | 113,216 |
LandAmerica Financial Group, Inc. | | 400 | | — | | 400 | | 21,572 | | — | | 21,572 |
Navigators Group, Inc. | | 900 | | 1,900 | | 2,800 | | 27,099 | | 57,209 | | 84,308 |
UICI | | — | | 4,700 | | 4,700 | | — | | 159,330 | | 159,330 |
Zenith National Insurance Corp. | | 1,300 | | 10,000 | | 11,300 | | 64,792 | | 498,400 | | 563,192 |
| | | | | | | | |
| |
| |
|
| | | | | | | | | 1,738,823 | | 8,870,574 | | 10,609,397 |
| | | | | | | | |
| |
| |
|
Real Estate 0.7% | | | | | | | | | | | | |
American Financial Realty Trust, (REIT) | | 3,000 | | 6,400 | | 9,400 | | 48,540 | | 103,552 | | 152,092 |
Amli Residential Properties Trust, (REIT) | | 1,100 | | 4,700 | | 5,800 | | 35,200 | | 150,400 | | 185,600 |
Bedford Property Investors, Inc., (REIT) | | — | | 2,600 | | 2,600 | | — | | 73,866 | | 73,866 |
CarrAmerica Realty Corp., (REIT) | | 1,400 | | 7,000 | | 8,400 | | 46,200 | | 231,000 | | 277,200 |
Colonial Properties Trust, (REIT) | | 100 | | 2,400 | | 2,500 | | 3,927 | | 94,248 | | 98,175 |
Commercial Net Lease Realty, (REIT) | | 1,900 | | 7,200 | | 9,100 | | 39,140 | | 148,320 | | 187,460 |
Cornerstone Realty Income Trust, Inc., (REIT) | | — | | 4,900 | | 4,900 | | — | | 48,902 | | 48,902 |
Corporate Office Properties Trust, (REIT) | | 1,300 | | 6,700 | | 8,000 | | 38,155 | | 196,645 | | 234,800 |
Cousins Properties, Inc., (REIT) | | 1,100 | | 4,600 | | 5,700 | | 33,297 | | 139,242 | | 172,539 |
EastGroup Properties, Inc., (REIT) | | 400 | | 1,800 | | 2,200 | | 15,328 | | 68,976 | | 84,304 |
Essex Property Trust, Inc., (REIT) | | 600 | | 2,900 | | 3,500 | | 50,280 | | 243,020 | | 293,300 |
FelCor Lodging Trust, Inc., (REIT) | | 2,700 | | 9,300 | | 12,000 | | 39,555 | | 136,245 | | 175,800 |
Gables Residential Trust, (REIT) | | 1,000 | | 5,100 | | 6,100 | | 35,790 | | 182,529 | | 218,319 |
Glenborough Realty Trust, Inc., (REIT) | | 400 | | 3,600 | | 4,000 | | 8,512 | | 76,608 | | 85,120 |
Glimcher Realty Trust, (REIT) | | 600 | | 3,200 | | 3,800 | | 16,626 | | 88,672 | | 105,298 |
Healthcare Realty Trust, Inc., (REIT) | | 1,200 | | 5,900 | | 7,100 | | 48,840 | | 240,130 | | 288,970 |
Heritage Property Investment Trust, (REIT) | | 1,100 | | 4,700 | | 5,800 | | 35,299 | | 150,823 | | 186,122 |
Highwoods Properties, Inc., (REIT) | | 1,600 | | 8,100 | | 9,700 | | 44,320 | | 224,370 | | 268,690 |
S-5
| | | | | | | | | | | | |
| | | Balanced
Portfolio
Par/Share
Amount
| | Total Return
Portfolio
Par/Share
Amount
| | Total Return
Portfolio– Combined
Pro Forma
Par/Share
Amount
| | Balanced
Portfolio
Market
Value ($)
| | Total Return
Portfolio
Market
Value ($)
| | Total Return
Portfolio– Combined
Pro Forma
Market
Value ($)
|
Jones Lang LaSalle, Inc. | | — | | 1,000 | | 1,000 | | — | | 37,410 | | 37,410 |
Kilroy Realty Corp., (REIT) | | 600 | | 4,300 | | 4,900 | | 25,650 | | 183,825 | | 209,475 |
Kramont Realty Trust, (REIT) | | — | | 1,000 | | 1,000 | | — | | 23,400 | | 23,400 |
Lexington Corporate Properties Trust, (REIT) | | 1,700 | | 8,400 | | 10,100 | | 38,386 | | 189,672 | | 228,058 |
LTC Properties, Inc., (REIT) | | — | | 1,300 | | 1,300 | | — | | 25,883 | | 25,883 |
Nationwide Health Properties, Inc., (REIT) | | 1,900 | | 9,500 | | 11,400 | | 45,125 | | 225,625 | | 270,750 |
Newcastle Investment Corp., (REIT) | | 1,200 | | 6,100 | | 7,300 | | 38,136 | | 193,858 | | 231,994 |
Novastar Financial, Inc., (REIT) | | 600 | | | | 600 | | 29,700 | | | | 29,700 |
OMEGA Healthcare Investors, Inc., (REIT) | | — | | 2,500 | | 2,500 | | — | | 29,500 | | 29,500 |
Parkway Properties, Inc., (REIT) | | 500 | | 3,100 | | 3,600 | | 25,375 | | 157,325 | | 182,700 |
Prentiss Properties Trust, (REIT) | | — | | 2,600 | | 2,600 | | — | | 99,320 | | 99,320 |
Senior Housing Properties Trust, (REIT) | | 2,000 | | 9,700 | | 11,700 | | 37,880 | | 183,718 | | 221,598 |
Sun Communities, Inc., (REIT) | | 800 | | 4,100 | | 4,900 | | 32,200 | | 165,025 | | 197,225 |
Town & Country Trust, (REIT) | | — | | 1,200 | | 1,200 | | — | | 33,156 | | 33,156 |
Trammell Crow Co. | | 1,900 | | 3,200 | | 5,100 | | 34,409 | | 57,952 | | 92,361 |
Urstadt Biddle Properties, “A”, (REIT) | | — | | 1,200 | | 1,200 | | — | | 20,460 | | 20,460 |
Washington Real Estate Investment Trust, (REIT) | | 1,300 | | 6,200 | | 7,500 | | 44,031 | | 209,994 | | 254,025 |
| | | | | | | | |
| |
| |
|
| | | | | | | | | 889,901 | | 4,433,671 | | 5,323,572 |
| | | | | | | | |
| |
| |
|
Health Care 9.8% | | | | | | | | | | | | |
Biotechnology 1.4% | | | | | | | | | | | | |
Amgen, Inc. | | 2,800 | | 14,100 | | 16,900 | | 179,620 | | 904,515 | | 1,084,135 |
Biogen Idec, Inc. | | 4,900 | | 24,900 | | 29,800 | | 326,389 | | 1,658,589 | | 1,984,978 |
deCODE genetics, Inc. | | 800 | | 11,900 | | 12,700 | | 6,248 | | 92,939 | | 99,187 |
Enzon Pharmaceuticals, Inc. | | 4,000 | | 19,300 | | 23,300 | | 54,880 | | 264,796 | | 319,676 |
Genentech, Inc. | | 14,000 | | 70,500 | | 84,500 | | 762,160 | | 3,838,020 | | 4,600,180 |
Gilead Sciences, Inc. | | 12,400 | | 63,000 | | 75,400 | | 433,876 | | 2,204,370 | | 2,638,246 |
Regeneron Pharmaceuticals, Inc. | | 4,300 | | 13,200 | | 17,500 | | 39,603 | | 121,572 | | 161,175 |
Third Wave Technologies | | 4,900 | | 24,300 | | 29,200 | | 42,140 | | 208,980 | | 251,120 |
| | | | | | | | |
| |
| |
|
| | | | | | | | | 1,844,916 | | 9,293,781 | | 11,138,697 |
| | | | | | | | |
| |
| |
|
Health Care Equipment & Supplies 2.4% | | | | | | | | | | | | |
Align Technology, Inc. | | 3,900 | | 19,600 | | 23,500 | | 41,925 | | 210,700 | | 252,625 |
Alliance Imaging, Inc. | | — | | 9,300 | | 9,300 | | — | | 104,625 | | 104,625 |
Baxter International, Inc. | | 31,000 | | 154,600 | | 185,600 | | 1,070,740 | | 5,339,884 | | 6,410,624 |
Biosite, Inc. | | 1,000 | | 5,100 | | 6,100 | | 61,540 | | 313,854 | | 375,394 |
Boston Scientific Corp. | | 8,800 | | 44,000 | | 52,800 | | 312,840 | | 1,564,200 | | 1,877,040 |
C.R. Bard, Inc. | | 3,500 | | 17,600 | | 21,100 | | 223,930 | | 1,126,048 | | 1,349,978 |
Closure Medical Corp. | | — | | 5,900 | | 5,900 | | — | | 115,050 | | 115,050 |
Haemonetics Corp. | | 2,300 | | 11,500 | | 13,800 | | 83,283 | | 416,415 | | 499,698 |
Hospira, Inc. | | 1,320 | | 6,450 | | 7,770 | | 44,220 | | 216,075 | | 260,295 |
Medtronic, Inc. | | 8,900 | | 44,300 | | 53,200 | | 442,063 | | 2,200,381 | | 2,642,444 |
Palomar Medical Technologies, Inc. | | 800 | | 5,000 | | 5,800 | | 20,856 | | 130,350 | | 151,206 |
PolyMedica Corp. | | 1,700 | | 8,700 | | 10,400 | | 63,393 | | 324,423 | | 387,816 |
VISX, Inc. | | 715 | | 7,009 | | 7,724 | | 18,497 | | 181,323 | | 199,820 |
Waters Corp. | | 3,600 | | 17,800 | | 21,400 | | 168,444 | | 832,862 | | 1,001,306 |
Zimmer Holdings, Inc. | | 7,200 | | 36,300 | | 43,500 | | 576,864 | | 2,908,356 | | 3,485,220 |
| | | | | | | | |
| |
| |
|
| | | | | | | | | 3,128,595 | | 15,984,546 | | 19,113,141 |
| | | | | | | | |
| |
| |
|
Health Care Providers & Services 1.2% | | | | | | | | | | | | |
Allscripts Healthcare Solutions, Inc. | | — | | 10,500 | | 10,500 | | — | | 112,035 | | 112,035 |
Amedisys, Inc. | | 2,100 | | 10,600 | | 12,700 | | 68,019 | | 343,334 | | 411,353 |
Centene Corp. | | 2,800 | | 13,600 | | 16,400 | | 79,380 | | 385,560 | | 464,940 |
Cerner Corp. | | 1,300 | | 6,000 | | 7,300 | | 69,121 | | 319,020 | | 388,141 |
Chemed Corp. | | 1,200 | | 6,000 | | 7,200 | | 80,532 | | 402,660 | | 483,192 |
Genesis HealthCare Corp. | | — | | 1,100 | | 1,100 | | — | | 38,533 | | 38,533 |
Healthcare Service Group, Inc. | | — | | 1,800 | | 1,800 | | — | | 37,512 | | 37,512 |
IDX Systems Corp. | | 2,000 | | 9,800 | | 11,800 | | 68,920 | | 337,708 | | 406,628 |
Lifeline Systems, Inc. | | 800 | | 2,800 | | 3,600 | | 20,608 | | 72,128 | | 92,736 |
MedCath Corp. | | 3,000 | | 8,600 | | 11,600 | | 73,920 | | 211,904 | | 285,824 |
S-6
| | | | | | | | | | | | |
| | | Balanced
Portfolio
Par/Share
Amount
| | Total Return
Portfolio
Par/Share
Amount
| | Total Return
Portfolio– Combined
Pro Forma
Par/Share
Amount
| | Balanced
Portfolio
Market
Value ($)
| | Total Return
Portfolio
Market
Value ($)
| | Total Return
Portfolio– Combined
Pro Forma
Market
Value ($)
|
Merge Technologies, Inc. | | 2,400 | | 6,500 | | 8,900 | | 53,400 | | 144,625 | | 198,025 |
Option Care, Inc. | | 3,300 | | 16,500 | | 19,800 | | 56,727 | | 283,635 | | 340,362 |
PDI, Inc. | | 1,500 | | 7,700 | | 9,200 | | 33,420 | | 171,556 | | 204,976 |
RehabCare Group, Inc. | | 1,000 | | 5,200 | | 6,200 | | 27,990 | | 145,548 | | 173,538 |
Res-Care, Inc. | | 4,100 | | 20,500 | | 24,600 | | 62,402 | | 312,010 | | 374,412 |
SFBC International, Inc. | | 1,600 | | 7,800 | | 9,400 | | 63,200 | | 308,100 | | 371,300 |
UnitedHealth Group, Inc. | | 9,400 | | 47,100 | | 56,500 | | 827,482 | | 4,146,213 | | 4,973,695 |
| | | | | | | | |
| |
| |
|
| | | | | | | | | 1,585,121 | | 7,772,081 | | 9,357,202 |
| | | | | | | | |
| |
| |
|
Pharmaceuticals 4.8% | | | | | | | | | | | | |
Abbott Laboratories | | 25,800 | | 129,600 | | 155,400 | | 1,203,570 | | 6,045,840 | | 7,249,410 |
Alpharma, Inc., “A” | | 3,400 | | 16,900 | | 20,300 | | 57,630 | | 286,455 | | 344,085 |
Bone Care International, Inc. | | — | | 2,300 | | 2,300 | | | | 64,055 | | 64,055 |
Bristol-Myers Squibb Co. | | 32,300 | | 160,400 | | 192,700 | | 827,526 | | 4,109,448 | | 4,936,974 |
Connetics Corp. | | 2,600 | | 12,700 | | 15,300 | | 63,154 | | 308,483 | | 371,637 |
Eli Lilly & Co. | | 4,100 | | 20,800 | | 24,900 | | 232,675 | | 1,180,400 | | 1,413,075 |
First Horizon Pharmaceutical Corp. | | 1,600 | | 7,600 | | 9,200 | | 36,624 | | 173,964 | | 210,588 |
Johnson & Johnson | | 25,616 | | 129,666 | | 155,282 | | 1,624,567 | | 8,223,417 | | 9,847,984 |
Kos Pharmaceuticals, Inc. | | 1,100 | | 5,700 | | 6,800 | | 41,404 | | 214,548 | | 255,952 |
Noven Pharmaceuticals, Inc. | | 2,500 | | 13,400 | | 15,900 | | 42,650 | | 228,604 | | 271,254 |
Perrigo Co. | | 4,100 | | 20,300 | | 24,400 | | 70,807 | | 350,581 | | 421,388 |
Pfizer, Inc. | | 45,150 | | 226,475 | | 271,625 | | 1,214,083 | | 6,089,913 | | 7,303,996 |
Pharmion Corp. | | 600 | | — | | 600 | | 25,326 | | — | | 25,326 |
POZEN, Inc. | | 4,900 | | 22,100 | | 27,000 | | 35,623 | | 160,667 | | 196,290 |
Rigel Pharmaceuticals, Inc. | | 900 | | 7,500 | | 8,400 | | 21,978 | | 183,150 | | 205,128 |
United Therapeutics Corp. | | 1,400 | | 8,900 | | 10,300 | | 63,210 | | 401,835 | | 465,045 |
USANA Health Sciences, Inc. | | — | | 1,400 | | 1,400 | | | | 47,880 | | 47,880 |
Valeant Pharmaceuticals International | | 2,700 | | 13,600 | | 16,300 | | 71,145 | | 358,360 | | 429,505 |
Wyeth | | 13,100 | | 65,300 | | 78,400 | | 557,929 | | 2,781,127 | | 3,339,056 |
| | | | | | | | |
| |
| |
|
| | | | | | | | | 6,189,901 | | 31,208,727 | | 37,398,628 |
| | | | | | | | |
| |
| |
|
Industrials 6.5% | | | | | | | | | | | | |
Aerospace & Defense 1.2% | | | | | | | | | | | | |
DRS Technologies, Inc. | | — | | 1,800 | | 1,800 | | — | | 76,878 | | 76,878 |
HEICO Corp. | | 3,400 | | 5,600 | | 9,000 | | 76,806 | | 126,504 | | 203,310 |
Honeywell International, Inc. | | 23,500 | | 117,000 | | 140,500 | | 832,135 | | 4,142,970 | | 4,975,105 |
Teledyne Technologies, Inc. | | — | | 4,500 | | 4,500 | | — | | 132,435 | | 132,435 |
United Technologies Corp. | | 6,800 | | 34,000 | | 40,800 | | 702,780 | | 3,513,900 | | 4,216,680 |
| | | | | | | | |
| |
| |
|
| | | | | | | | | 1,611,721 | | 7,992,687 | | 9,604,408 |
| | | | | | | | |
| |
| |
|
Air Freight & Logistics 0.3% | | | | | | | | | | | | |
FedEx Corp. | | 4,500 | | 22,500 | | 27,000 | | 443,205 | | 2,216,025 | | 2,659,230 |
Airlines 0.1% | | | | | | | | | | | | |
America West Holdings Corp., “B” | | 7,800 | | — | | 7,800 | | 51,324 | | — | | 51,324 |
Frontier Airlines, Inc. | | 3,800 | | 19,200 | | 23,000 | | 43,358 | | 219,072 | | 262,430 |
Pinnacle Airlines Corp. | | — | | 20,500 | | 20,500 | | — | | 285,770 | | 285,770 |
| | | | | | | | |
| |
| |
|
| | | | | | | | | 94,682 | | 504,842 | | 599,524 |
| | | | | | | | |
| |
| |
|
Commercial Services & Supplies 1.1% | | | | | | | | | | | | |
Avery Dennison Corp. | | 7,700 | | 38,400 | | 46,100 | | 461,769 | | 2,302,848 | | 2,764,617 |
Brady Corp., “A” | | 1,500 | | 4,000 | | 5,500 | | 93,855 | | 250,280 | | 344,135 |
Bright Horizons Family Solutions, Inc. | | — | | 500 | | 500 | | — | | 32,380 | | 32,380 |
Coinstar, Inc. | | 2,400 | | 11,800 | | 14,200 | | 64,392 | | 316,594 | | 380,986 |
Duratek, Inc. | | 3,000 | | 6,700 | | 9,700 | | 74,730 | | 166,897 | | 241,627 |
Electro Rent Corp. | | — | | 1,800 | | 1,800 | | — | | 25,614 | | 25,614 |
Euronet Worldwide, Inc. | | 2,200 | | 10,900 | | 13,100 | | 57,244 | | 283,618 | | 340,862 |
Heidrick & Struggles International, Inc. | | 800 | | 2,500 | | 3,300 | | 27,416 | | 85,675 | | 113,091 |
Navigant Consulting, Inc. | | 2,700 | | 13,500 | | 16,200 | | 71,820 | | 359,100 | | 430,920 |
NCO Group, Inc. | | 2,700 | | 11,500 | | 14,200 | | 69,795 | | 297,275 | | 367,070 |
NuCo2, Inc. | | 3,000 | | 13,700 | | 16,700 | | 66,570 | | 304,003 | | 370,573 |
Pitney Bowes, Inc. | | 9,700 | | 48,200 | | 57,900 | | 448,916 | | 2,230,696 | | 2,679,612 |
Stewart Enterprises, Inc., “A” | | 8,300 | | 19,100 | | 27,400 | | 58,017 | | 133,509 | | 191,526 |
TeleTech Holdings, Inc. | | 5,100 | | 25,200 | | 30,300 | | 49,419 | | 244,188 | | 293,607 |
Ventiv Health, Inc. | | 2,000 | | 9,800 | | 11,800 | | 40,640 | | 199,136 | | 239,776 |
| | | | | | | | |
| |
| |
|
| | | | | | | | | 1,584,583 | | 7,231,813 | | 8,816,396 |
| | | | | | | | |
| |
| |
|
S-7
| | | | | | | | | | | | |
| | | Balanced
Portfolio
Par/Share
Amount
| | Total Return
Portfolio
Par/Share
Amount
| | Total Return
Portfolio– Combined
Pro Forma
Par/Share
Amount
| | Balanced
Portfolio
Market
Value ($)
| | Total Return
Portfolio
Market
Value ($)
| | Total Return
Portfolio– Combined
Pro Forma
Market
Value ($)
|
Construction & Engineering 0.1% | | | | | | | | | | | | |
Dycom Industries, Inc. | | 2,500 | | 12,500 | | 15,000 | | 76,300 | | 381,500 | | 457,800 |
Perini Corp. | | 4,000 | | 20,100 | | 24,100 | | 66,760 | | 335,469 | | 402,229 |
| | | | | | | | |
| |
| |
|
| | | | | | | | | 143,060 | | 716,969 | | 860,029 |
| | | | | | | | |
| |
| |
|
Electrical Equipment 0.4% | | | | | | | | | | | | |
Artesyn Technologies, Inc. | | 4,600 | | 22,700 | | 27,300 | | 51,980 | | 256,510 | | 308,490 |
Emerson Electric Co. | | 7,600 | | 37,800 | | 45,400 | | 532,760 | | 2,649,780 | | 3,182,540 |
| | | | | | | | |
| |
| |
|
| | | | | | | | | 584,740 | | 2,906,290 | | 3,491,030 |
| | | | | | | | |
| |
| |
|
Industrial Conglomerates 2.5% | | | | | | | | | | | | |
3M Co. | | 3,500 | | 17,800 | | 21,300 | | 287,245 | | 1,460,846 | | 1,748,091 |
Blount International, Inc. | | — | | 2,300 | | 2,300 | | — | | 40,066 | | 40,066 |
General Electric Co. | | 65,600 | | 328,900 | | 394,500 | | 2,394,400 | | 12,004,850 | | 14,399,250 |
Textron, Inc. | | 8,000 | | 39,700 | | 47,700 | | 590,400 | | 2,929,860 | | 3,520,260 |
Tredegar Corp. | | — | | 5,600 | | 5,600 | | — | | 113,176 | | 113,176 |
| | | | | | | | |
| |
| |
|
| | | | | | | | | 3,272,045 | | 16,548,798 | | 19,820,843 |
| | | | | | | | |
| |
| |
|
Machinery 0.5% | �� | | | | | | | | | | | |
Actuant Corp., “A” | | 700 | | 5,800 | | 6,500 | | 36,505 | | 302,470 | | 338,975 |
Astec Industries, Inc. | | 3,500 | | 17,500 | | 21,000 | | 60,235 | | 301,175 | | 361,410 |
Caterpillar, Inc. | | 2,000 | | 10,100 | | 12,100 | | 195,020 | | 984,851 | | 1,179,871 |
Kennametal, Inc. | | 2,100 | | 10,500 | | 12,600 | | 104,517 | | 522,585 | | 627,102 |
Sauer-Danfoss, Inc. | | 2,500 | | 4,600 | | 7,100 | | 54,525 | | 100,326 | | 154,851 |
Terex Corp. | | 2,000 | | 10,100 | | 12,100 | | 95,300 | | 481,265 | | 576,565 |
The Manitowoc Co., Inc. | | 2,100 | | 10,600 | | 12,700 | | 79,065 | | 399,090 | | 478,155 |
Wabash National Corp. | | 2,300 | | 11,300 | | 13,600 | | 61,939 | | 304,309 | | 366,248 |
Wabtec Corp. | | — | | 2,200 | | 2,200 | | — | | 46,904 | | 46,904 |
| | | | | | | | |
| |
| |
|
| | | | | | | | | 687,106 | | 3,442,975 | | 4,130,081 |
| | | | | | | | |
| |
| |
|
Marine 0.1% | | | | | | | | | | | | |
Kirby Corp. | | 2,300 | | 11,300 | | 13,600 | | 102,074 | | 501,494 | | 603,568 |
| | | | | | |
Road & Rail 0.1% | | | | | | | | | | | | |
Knight Transportation, Inc. | | 3,300 | | 16,400 | | 19,700 | | 81,840 | | 406,720 | | 488,560 |
Old Dominion Freight Line, Inc. | | 1,800 | | 13,000 | | 14,800 | | 62,640 | | 452,400 | | 515,040 |
| | | | | | | | |
| |
| |
|
| | | | | | | | | 144,480 | | 859,120 | | 1,003,600 |
| | | | | | | | |
| |
| |
|
Trading Companies & Distributors 0.1% | | | | | | | | | | | | |
United Rentals, Inc. | | 3,200 | | 15,800 | | 19,000 | | 60,480 | | 298,620 | | 359,100 |
WESCO International, Inc. | | 2,100 | | 10,400 | | 12,500 | | 62,244 | | 308,256 | | 370,500 |
| | | | | | | | |
| |
| |
|
| | | | | | | | | 122,724 | | 606,876 | | 729,600 |
| | | | | | | | |
| |
| |
|
Information Technology 11.1% | | | | | | | | | | | | |
Communications Equipment 1.3% | | | | | | | | | | | | |
Aspect Communications Corp. | | 3,200 | | 16,400 | | 19,600 | | 35,648 | | 182,696 | | 218,344 |
Belden CDT, Inc. | | 1,800 | | — | | 1,800 | | 41,760 | | — | | 41,760 |
Cisco Systems, Inc. | | 28,800 | | 142,900 | | 171,700 | | 555,840 | | 2,757,970 | | 3,313,810 |
CommScope, Inc. | | 2,200 | | 16,200 | | 18,400 | | 41,580 | | 306,180 | | 347,760 |
Digi International, Inc. | | — | | 2,800 | | 2,800 | | — | | 48,132 | | 48,132 |
Ditech Communications Corp. | | 900 | | — | | 900 | | 13,455 | | — | | 13,455 |
Nokia Oyj, (ADR) | | 36,200 | | 180,100 | | 216,300 | | 567,254 | | 2,822,167 | | 3,389,421 |
QUALCOMM, Inc. | | 11,800 | | 60,000 | | 71,800 | | 500,320 | | 2,544,000 | | 3,044,320 |
| | | | | | | | |
| |
| |
|
| | | | | | | | | 1,755,857 | | 8,661,145 | | 10,417,002 |
| | | | | | | | |
| |
| |
|
Computers & Peripherals 2.3% | | | | | | | | | | | | |
Dell, Inc. | | 7,000 | | 35,400 | | 42,400 | | 294,980 | | 1,491,756 | | 1,786,736 |
EMC Corp. | | 41,200 | | 208,000 | | 249,200 | | 612,644 | | 3,092,960 | | 3,705,604 |
Hewlett-Packard Co. | | 27,700 | | 137,700 | | 165,400 | | 580,869 | | 2,887,569 | | 3,468,438 |
Intergraph Corp. | | 2,200 | | 14,100 | | 16,300 | | 59,246 | | 379,713 | | 438,959 |
International Business Machines Corp. | | 13,500 | | 67,700 | | 81,200 | | 1,330,830 | | 6,673,866 | | 8,004,696 |
Komag, Inc. | | — | | 15,800 | | 15,800 | | — | | 296,724 | | 296,724 |
PalmOne, Inc. | | 1,300 | | — | | 1,300 | | 41,015 | | — | | 41,015 |
Tyler Technologies, Inc. | | 2,900 | | 10,500 | | 13,400 | | 24,244 | | 87,780 | | 112,024 |
| | | | | | | | |
| |
| |
|
| | | | | | | | | 2,943,828 | | 14,910,368 | | 17,854,196 |
| | | | | | | | |
| |
| |
|
Electronic Equipment & Instruments 0.2% | | | | | | | | | | | | |
Agilysys, Inc. | | 3,100 | | 15,600 | | 18,700 | | 53,134 | | 267,384 | | 320,518 |
BEI Technologies, Inc. | | 1,800 | | 9,300 | | 11,100 | | 55,584 | | 287,184 | | 342,768 |
S-8
| | | | | | | | | | | | |
| | | Balanced
Portfolio
Par/Share
Amount
| | Total Return
Portfolio
Par/Share
Amount
| | Total Return
Portfolio– Combined
Pro Forma
Par/Share
Amount
| | Balanced
Portfolio
Market
Value ($)
| | Total Return
Portfolio
Market
Value ($)
| | Total Return
Portfolio– Combined
Pro Forma
Market
Value ($)
|
Keithley Instruments, Inc. | | — | | 3,300 | | 3,300 | | — | | 65,010 | | 65,010 |
LeCroy Corp. | | 2,900 | | 14,900 | | 17,800 | | 67,686 | | 347,766 | | 415,452 |
Rofin-Sinar Technologies, Inc. | | 1,700 | | 8,600 | | 10,300 | | 72,165 | | 365,070 | | 437,235 |
X-Rite, Inc. | | 4,600 | | 12,000 | | 16,600 | | 73,646 | | 192,120 | | 265,766 |
| | | | | | | | |
| |
| |
|
| | | | | | | | | 322,215 | | 1,524,534 | | 1,846,749 |
| | | | | | | | |
| |
| |
|
Internet Software & Services 0.2% | | | | | | | | | | | | |
Digital River, Inc. | | 1,100 | | 5,600 | | 6,700 | | 45,771 | | 233,016 | | 278,787 |
DoubleClick, Inc. | | 4,800 | | 23,700 | | 28,500 | | 37,344 | | 184,386 | | 221,730 |
EarthLink, Inc. | | 3,500 | | 20,100 | | 23,600 | | 40,320 | | 231,552 | | 271,872 |
eSPEED, Inc., “A” | | 2,900 | | 14,600 | | 17,500 | | 35,873 | | 180,602 | | 216,475 |
F5 Networks, Inc. | | 1,000 | | 4,900 | | 5,900 | | 48,720 | | 238,728 | | 287,448 |
InfoSpace, Inc. | | 800 | | 3,700 | | 4,500 | | 38,040 | | 175,935 | | 213,975 |
Openwave Systems, Inc. | | 2,700 | | — | | 2,700 | | 41,742 | | — | | 41,742 |
S1 Corp. | | — | | 3,500 | | 3,500 | | — | | 31,710 | | 31,710 |
| | | | | | | | |
| |
| |
|
| | | | | | | | | 287,810 | | 1,275,929 | | 1,563,739 |
| | | | | | | | |
| |
| |
|
IT Consulting & Services 1.3% | | | | | | | | | | | | |
Accenture Ltd., “A” | | 11,600 | | 58,800 | | 70,400 | | 313,200 | | 1,587,600 | | 1,900,800 |
Automatic Data Processing, Inc. | | 14,200 | | 70,700 | | 84,900 | | 629,770 | | 3,135,545 | | 3,765,315 |
CSG Systems International, Inc. | | 3,200 | | 15,900 | | 19,100 | | 59,840 | | 297,330 | | 357,170 |
eFunds Corp. | | — | | 7,200 | | 7,200 | | — | | 172,872 | | 172,872 |
Fiserv, Inc. | | 10,800 | | 54,300 | | 65,100 | | 434,052 | | 2,182,317 | | 2,616,369 |
Paychex, Inc. | | 4,400 | | 22,300 | | 26,700 | | 149,952 | | 759,984 | | 909,936 |
Sapient Corp. | | 3,700 | | 18,400 | | 22,100 | | 29,267 | | 145,544 | | 174,811 |
| | | | | | | | |
| |
| |
|
| | | | | | | | | 1,616,081 | | 8,281,192 | | 9,897,273 |
| | | | | | | | |
| |
| |
|
Office Electronics 0.0% | | | | | | | | | | | | |
CompX International, Inc. | | 300 | | — | | 300 | | 4,959 | | — | | 4,959 |
| | | | | | |
Semiconductors & Semiconductor Equipment 2.8% | | | | | | | | | | | | |
ADE Corp. | | 2,000 | | 10,200 | | 12,200 | | 37,440 | | 190,944 | | 228,384 |
Applied Materials, Inc. | | 28,600 | | 142,100 | | 170,700 | | 489,060 | | 2,429,910 | | 2,918,970 |
Axcelis Technologies, Inc. | | — | | 33,700 | | 33,700 | | — | | 273,981 | | 273,981 |
Diodes, Inc. | | 2,200 | | 11,300 | | 13,500 | | 49,786 | | 255,719 | | 305,505 |
Integrated Device Technology, Inc. | | 4,500 | | 23,400 | | 27,900 | | 52,020 | | 270,504 | | 322,524 |
Intel Corp. | | 64,200 | | 321,200 | | 385,400 | | 1,501,638 | | 7,512,868 | | 9,014,506 |
Kulicke & Soffa Industries, Inc. | | 4,200 | | 21,200 | | 25,400 | | 36,204 | | 182,744 | | 218,948 |
Linear Technology Corp. | | 9,600 | | 48,600 | | 58,200 | | 372,096 | | 1,883,736 | | 2,255,832 |
LTX Corp. | | — | | 24,300 | | 24,300 | | — | | 186,867 | | 186,867 |
Micrel, Inc. | | 4,100 | | 21,300 | | 25,400 | | 45,182 | | 234,726 | | 279,908 |
Microsemi Corp. | | 3,200 | | 15,900 | | 19,100 | | 55,552 | | 276,024 | | 331,576 |
OmniVision Technologies, Inc. | | 2,400 | | 12,400 | | 14,800 | | 44,040 | | 227,540 | | 271,580 |
Photronics, Inc. | | 2,600 | | 14,200 | | 16,800 | | 42,900 | | 234,300 | | 277,200 |
Silicon Image, Inc. | | 3,000 | | 14,900 | | 17,900 | | 49,380 | | 245,254 | | 294,634 |
Siliconix, Inc. | | 1,100 | | 1,600 | | 2,700 | | 40,139 | | 58,384 | | 98,523 |
Standard Microsystems Corp. | | 2,300 | | 11,600 | | 13,900 | | 41,009 | | 206,828 | | 247,837 |
Supertex, Inc. | | — | | 900 | | 900 | | — | | 19,530 | | 19,530 |
Texas Instruments, Inc. | | 28,100 | | 140,400 | | 168,500 | | 691,822 | | 3,456,648 | | 4,148,470 |
| | | | | | | | |
| |
| |
|
| | | | | | | | | 3,548,268 | | 18,146,507 | | 21,694,775 |
| | | | | | | | |
| |
| |
|
Software 3.0% | | | | | | | | | | | | |
Adobe Systems, Inc. | | 1,700 | | 8,400 | | 10,100 | | 106,658 | | 527,016 | | 633,674 |
Ansoft Corp. | | 2,700 | | 11,500 | | 14,200 | | 54,540 | | 232,300 | | 286,840 |
Aspen Technology, Inc. | | 1,200 | | 24,000 | | 25,200 | | 7,452 | | 149,040 | | 156,492 |
Borland Software Corp. | | 1,300 | | 24,400 | | 25,700 | | 15,184 | | 284,992 | | 300,176 |
Electronic Arts, Inc. | | 8,100 | | 40,700 | | 48,800 | | 499,608 | | 2,510,376 | | 3,009,984 |
Embarcadero Technologies, Inc. | | 4,900 | | 24,200 | | 29,100 | | 46,109 | | 227,722 | | 273,831 |
Epicor Software Corp. | | 3,600 | | 19,000 | | 22,600 | | 50,724 | | 267,710 | | 318,434 |
EPIQ Systems, Inc. | | 3,600 | | 14,800 | | 18,400 | | 52,704 | | 216,672 | | 269,376 |
FactSet Research Systems, Inc. | | — | | 1,800 | | 1,800 | | — | | 105,192 | | 105,192 |
Internet Security Systems, Inc. | | 1,600 | | 7,800 | | 9,400 | | 37,200 | | 181,350 | | 218,550 |
Interwoven, Inc. | | 2,100 | | 15,200 | | 17,300 | | 22,848 | | 165,376 | | 188,224 |
Intuit, Inc. | | 4,800 | | 24,200 | | 29,000 | | 211,248 | | 1,065,042 | | 1,276,290 |
Kronos, Inc. | | 1,500 | | 7,300 | | 8,800 | | 76,695 | | 373,249 | | 449,944 |
Macrovision Corp. | | 2,400 | | 6,700 | | 9,100 | | 61,728 | | 172,324 | | 234,052 |
Microsoft Corp. | | 73,400 | | 369,200 | | 442,600 | | 1,960,514 | | 9,861,332 | | 11,821,846 |
MicroStrategy, Inc. | | — | | 22 | | 22 | | — | | 1,326 | | 1,326 |
S-9
| | | | | | | | | | | | |
| | | Balanced
Portfolio
Par/Share
Amount
| | Total Return
Portfolio
Par/Share
Amount
| | Total Return
Portfolio– Combined
Pro Forma
Par/Share
Amount
| | Balanced
Portfolio
Market
Value ($)
| | Total Return
Portfolio
Market
Value ($)
| | Total Return
Portfolio– Combined
Pro Forma
Market
Value ($)
|
Oracle Corp. | | 20,300 | | 102,700 | | 123,000 | | 278,516 | | 1,409,044 | | 1,687,560 |
Quest Software, Inc. | | — | | 2,200 | | 2,200 | | — | | 35,090 | | 35,090 |
SeaChange International, Inc. | | 2,400 | | 11,900 | | 14,300 | | 41,856 | | 207,536 | | 249,392 |
Sonic Solutions | | 1,300 | | 14,700 | | 16,000 | | 29,172 | | 329,868 | | 359,040 |
SS&C Technologies, Inc. | | 2,200 | | 11,000 | | 13,200 | | 45,430 | | 227,150 | | 272,580 |
Symantec Corp. | | 11,400 | | 57,600 | | 69,000 | | 293,664 | | 1,483,776 | | 1,777,440 |
| | | | | | | | |
| |
| |
|
| | | | | | | | | 3,891,850 | | 20,033,483 | | 23,925,333 |
| | | | | | | | |
| |
| |
|
Materials 2.4% | | | | | | | | | | | | |
Chemicals 1.2% | | | | | | | | | | | | |
Air Products & Chemicals, Inc. | | 9,600 | | 47,700 | | 57,300 | | 556,512 | | 2,765,169 | | 3,321,681 |
Albermarle Corp. | | — | | 1,400 | | 1,400 | | — | | 54,194 | | 54,194 |
Compass Minerals International, Inc. | | 3,300 | | 15,700 | | 19,000 | | 79,959 | | 380,411 | | 460,370 |
Dow Chemical Co. | | 5,800 | | 28,900 | | 34,700 | | 287,158 | | 1,430,839 | | 1,717,997 |
Ecolab, Inc. | | 8,100 | | 40,800 | | 48,900 | | 284,553 | | 1,433,304 | | 1,717,857 |
FMC Corp. | | 2,000 | | 9,700 | | 11,700 | | 96,600 | | 468,510 | | 565,110 |
Georgia Gulf Corp. | | 1,800 | | 9,100 | | 10,900 | | 89,640 | | 453,180 | | 542,820 |
Octel Corp. | | 3,200 | | 15,200 | | 18,400 | | 66,592 | | 316,312 | | 382,904 |
Terra Industries, Inc. | | 6,700 | | 33,200 | | 39,900 | | 59,496 | | 294,816 | | 354,312 |
W.R. Grace & Co. | | 3,600 | | 17,800 | | 21,400 | | 48,996 | | 242,258 | | 291,254 |
| | | | | | | | |
| |
| |
|
| | | | | | | | | 1,569,506 | | 7,838,993 | | 9,408,499 |
| | | | | | | | |
| |
| |
|
Containers & Packaging 0.4% | | | | | | | | | | | | |
Crown Holdings, Inc. | | 2,800 | | — | | 2,800 | | 38,472 | | — | | 38,472 |
Silgan Holdings, Inc. | | 1,300 | | 2,100 | | 3,400 | | 79,248 | | 128,016 | | 207,264 |
Sonoco Products Co. | | 15,900 | | 79,200 | | 95,100 | | 471,435 | | 2,348,280 | | 2,819,715 |
| | | | | | | | |
| |
| |
|
| | | | | | | | | 589,155 | | 2,476,296 | | 3,065,451 |
| | | | | | | | |
| |
| |
|
Metals & Mining 0.7% | | | | | | | | | | | | |
Alcoa, Inc. | | 19,000 | | 94,700 | | 113,700 | | 596,980 | | 2,975,474 | | 3,572,454 |
Century Aluminum Co. | | 2,400 | | 12,700 | | 15,100 | | 63,024 | | 333,502 | | 396,526 |
Hecla Mining Co. | | 6,800 | | 34,000 | | 40,800 | | 39,644 | | 198,220 | | 237,864 |
Oregon Steel Mills, Inc. | | 3,200 | | 16,100 | | 19,300 | | 64,928 | | 326,669 | | 391,597 |
Quanex Corp. | | 1,400 | | 6,800 | | 8,200 | | 95,998 | | 466,276 | | 562,274 |
Steel Dynamics, Inc. | | 1,600 | | 7,000 | | 8,600 | | 60,608 | | 265,160 | | 325,768 |
| | | | | | | | |
| |
| |
|
| | | | | | | | | 921,182 | | 4,565,301 | | 5,486,483 |
| | | | | | | | |
| |
| |
|
Paper & Forest Products 0.1% | | | | | | | | | | | | |
Buckeye Technologies, Inc. | | — | | 4,600 | | 4,600 | | — | | 59,846 | | 59,846 |
Deltic Timber Corp. | | — | | 1,600 | | 1,600 | | — | | 67,920 | | 67,920 |
Pope & Talbot, Inc. | | — | | 8,800 | | 8,800 | | — | | 150,568 | | 150,568 |
Potlatch Corp. | | 2,200 | | 10,700 | | 12,900 | | 111,276 | | 541,206 | | 652,482 |
| | | | | | | | |
| |
| |
|
| | | | | | | | | 111,276 | | 819,540 | | 930,816 |
| | | | | | | | |
| |
| |
|
Telecommunication Services 0.5% | | | | | | | | | | | | |
Diversified Telecommunication Services 0.4% | | | | | | | | | | | | |
CT Communications, Inc. | | 2,400 | | 9,100 | | 11,500 | | 29,520 | | 111,930 | | 141,450 |
General Communication, Inc., “A” | | 5,000 | | 24,900 | | 29,900 | | 55,200 | | 274,896 | | 330,096 |
North Pittsburgh Systems, Inc. | | — | | 2,800 | | 2,800 | | — | | 69,244 | | 69,244 |
PTEK Holdings, Inc. | | 4,700 | | 24,300 | | 29,000 | | 50,337 | | 260,253 | | 310,590 |
SBC Communications, Inc. | | 12,200 | | 60,700 | | 72,900 | | 314,394 | | 1,564,239 | | 1,878,633 |
Verizon Communications, Inc. | | 2,900 | | 14,000 | | 16,900 | | 117,479 | | 567,140 | | 684,619 |
| | | | | | | | |
| |
| |
|
| | | | | | | | | 566,930 | | 2,847,702 | | 3,414,632 |
| | | | | | | | |
| |
| |
|
Wireless Telecommunication Services 0.1% | | | | | | | | | | | | |
Alamosa Holdings, Inc. | | 2,900 | | 14,200 | | 17,100 | | 36,163 | | 177,074 | | 213,237 |
Centennial Communications Corp. | | 5,200 | | 23,300 | | 28,500 | | 41,236 | | 184,769 | | 226,005 |
| | | | | | | | |
| |
| |
|
| | | | | | | | | 77,399 | | 361,843 | | 439,242 |
| | | | | | | | |
| |
| |
|
Utilities 0.4% | | | | | | | | | | | | |
Electric Utilities 0.3% | | | | | | | | | | | | |
PNM Resources, Inc. | | 4,000 | | 15,800 | | 19,800 | | 101,160 | | 399,582 | | 500,742 |
Progress Energy, Inc. | | 5,800 | | 28,900 | | 34,700 | | 262,392 | | 1,307,436 | | 1,569,828 |
| | | | | | | | |
| |
| |
|
| | | | | | | | | 363,552 | | 1,707,018 | | 2,070,570 |
| | | | | | | | |
| |
| |
|
Gas Utilities 0.0% | | | | | | | | | | | | |
Southern Union Co. | | — | | 2,800 | | 2,800 | | — | | 67,144 | | 67,144 |
| | | | | | |
Multi-Utilities 0.1% | | | | | | | | | | | | |
Energen Corp. | | 2,100 | | 10,200 | | 12,300 | | 123,795 | | 601,290 | | 725,085 |
| | | | | | | | |
| |
| |
|
Total Common Stocks (Cost $64,369,289, $328,259,805 and $392,629,094, respectively) | | | | | | | | 78,024,942 | | 392,579,874 | | 470,604,816 |
| | | | | | | | |
| |
| |
|
S-10
| | | | | | | | | | | | |
| | | Balanced
Portfolio
Par/Share
Amount
| | Total Return
Portfolio
Par/Share
Amount
| | Total Return
Portfolio– Combined
Pro Forma
Par/Share
Amount
| | Balanced
Portfolio
Market
Value
($)
| | Total Return
Portfolio
Market
Value ($)
| | Total Return
Portfolio– Combined
Pro Forma
Market
Value ($)
|
Preferred Stocks 0.1% | | | | | | | | | | | | |
Farm Credit Bank of Texas, Series 1, 7.561% | | 165,000 | | — | | 165,000 | | 169,744 | | — | | 169,744 |
Paxson Communications Corp., 14.25%, (PIK) | | 5 | | 27 | | 32 | | 36,750 | | 198,450 | | 235,200 |
TNP Enterprises, Inc. 14.5% “D” (PIK) | | — | | 530 | | 530 | | — | | 61,480 | | 61,480 |
| | | | | | | | |
| |
| |
|
Total Preferred Stocks (Cost $202,813, $268,141 and $470,954, respectively) | | | | | | | | 206,494 | | 259,930 | | 466,424 |
| | | | | | | | |
| |
| |
|
Corporate Bonds 11.2% | | | | | | | | | | | | |
Consumer Discretionary 1.9% | | | | | | | | | | | | |
Adesa, Inc., 7.625%, 6/15/2012 | | — | | 55,000 | | 55,000 | | — | | 58,025 | | 58,025 |
AMC Entertainment, Inc., 8.0%, 3/1/2014 | | 30,000 | | 145,000 | | 175,000 | | 29,850 | | 144,275 | | 174,125 |
American Lawyer Media, Inc., Series B, 9.75%, 12/15/2007 | | 35,000 | | 170,000 | | 205,000 | | 35,394 | | 171,912 | | 207,306 |
Atlantic Broadband Finance LLC, 144A, 9.375%, 1/15/2014 | | 35,000 | | 175,000 | | 210,000 | | 33,863 | | 169,313 | | 203,176 |
Auburn Hills Trust, 12.375%, 5/1/2020 | | 48,000 | | 83,000 | | 131,000 | | 75,286 | | 130,183 | | 205,469 |
Bally Total Fitness Holdings Corp., 10.5%, 7/15/2011 | | 30,000 | | 155,000 | | 185,000 | | 30,225 | | 156,163 | | 186,388 |
Cablevision Systems New York Group, 144A, 6.669%, 4/1/2009 | | 20,000 | | 105,000 | | 125,000 | | 21,200 | | 111,300 | | 132,500 |
Caesars Entertainment, Inc., 9.375%, 2/15/2007 | | — | | 55,000 | | 55,000 | | — | | 60,638 | | 60,638 |
Carrols Corp., 144A, 9.0%, 1/15/2013 | | 10,000 | | 50,000 | | 60,000 | | 10,350 | | 51,750 | | 62,100 |
Charter Communications Holdings LLC, Step-up Coupon, 0% to | | | | | | | | | | | | |
5/15/2006, 11.75% to 5/15/2011 | | 75,000 | | 380,000 | | 455,000 | | 55,125 | | 279,300 | | 334,425 |
9.625%, 11/15/2009 | | 65,000 | | 285,000 | | 350,000 | | 57,037 | | 250,087 | | 307,124 |
10.25%, 9/15/2010 | | 100,000 | | 500,000 | | 600,000 | | 106,000 | | 530,000 | | 636,000 |
Comcast Cable Communications, Inc., 8.375%, 3/15/2013 | | 100,000 | | — | | 100,000 | | 123,310 | | — | | 123,310 |
Comcast MO of Delaware, Inc., 9.0%, 9/1/2008 | | 150,000 | | — | | 150,000 | | 175,219 | | — | | 175,219 |
Cooper Standard Automotive, Inc., 144A, 8.375%, 12/15/2014 | | 15,000 | | 65,000 | | 80,000 | | 14,963 | | 64,838 | | 79,801 |
CSC Holdings, Inc., 7.875%, 12/15/2007 | | — | | 80,000 | | 80,000 | | — | | 85,800 | | 85,800 |
DaimlerChrysler NA Holding Corp., 4.75%, 1/15/2008 | | — | | 600,000 | | 600,000 | | — | | 612,811 | | 612,811 |
Dex Media East LLC/Financial, 12.125%, 11/15/2012 | | 115,000 | | 568,000 | | 683,000 | | 140,156 | | 692,250 | | 832,406 |
DIMON, Inc., Series B, 9.625%, 10/15/2011 | | 60,000 | | 305,000 | | 365,000 | | 65,700 | | 333,975 | | 399,675 |
Dura Operating Corp.: | | | | | | | | | | | | |
Series B, 8.625%, 4/15/2012 | | 10,000 | | 45,000 | | 55,000 | | 10,400 | | 46,800 | | 57,200 |
Series B, 9.0%, 5/1/2009 | | — | | 25,000 | | 25,000 | | — | | 32,282 | | 32,282 |
Series D, 9.0%, 5/1/2009 | | 15,000 | | 90,000 | | 105,000 | | 14,850 | | 89,100 | | 103,950 |
EchoStar DBS Corp., 144A, 6.625%, 10/1/2014 | | 25,000 | | 115,000 | | 140,000 | | 25,313 | | 116,438 | | 141,751 |
Foot Locker, Inc., 8.5%, 1/15/2022 | | 15,000 | | 70,000 | | 85,000 | | 16,500 | | 77,000 | | 93,500 |
Friendly Ice Cream Corp., 8.375%, 6/15/2012 | | 45,000 | | 205,000 | | 250,000 | | 44,156 | | 201,156 | | 245,312 |
General Motors Corp.: | | | | | | | | | | | | |
8.25%, 7/15/2023 | | 30,000 | | 140,000 | | 170,000 | | 31,250 | | 145,834 | | 177,084 |
8.375%, 7/15/2033 | | 15,000 | | — | | 15,000 | | 15,541 | | — | | 15,541 |
S-11
| | | | | | | | | | | | |
| | | Balanced
Portfolio
Par/Share
Amount
| | Total Return
Portfolio
Par/Share
Amount
| | Total Return
Portfolio– Combined
Pro Forma
Par/Share
Amount
| | Balanced
Portfolio
Market
Value ($)
| | Total Return
Portfolio
Market
Value ($)
| | Total Return
Portfolio– Combined
Pro Forma
Market
Value ($)
|
Icon Health & Fitness, Inc., 11.25%, 4/1/2012 | | 30,000 | | 140,000 | | 170,000 | | 25,200 | | 117,600 | | 142,800 |
Interep National Radio Sales, Inc., Series B, 10.0%, 7/1/2008 | | 25,000 | | 125,000 | | 150,000 | | 18,844 | | 94,219 | | 113,063 |
J Crew Intermediate LLC, Step-up Coupon, 0% to 11/15/2005, 16.0% to 5/15/2008 | | 6,461 | | 34,889 | | 41,350 | | 6,137 | | 33,141 | | 39,278 |
Jacobs Entertainment Co., 11.875%, 2/1/2009 | | 60,000 | | 300,000 | | 360,000 | | 67,800 | | 339,000 | | 406,800 |
Levi Strauss & Co.: | | | | | | | | | | | | |
7.0%, 11/1/2006 | | 25,000 | | 130,000 | | 155,000 | | 26,250 | | 136,500 | | 162,750 |
12.25%, 12/15/2012 | | — | | 15,000 | | 15,000 | | — | | 16,688 | | 16,688 |
Mediacom LLC, 9.5%, 1/15/2013 | | 60,000 | | 295,000 | | 355,000 | | 60,225 | | 296,106 | | 356,331 |
MGM MIRAGE: | | | | | | | | | | | | |
8.375%, 2/1/2011 | | 55,000 | | 260,000 | | 315,000 | | 62,012 | | 293,150 | | 355,162 |
9.75%, 6/1/2007 | | 10,000 | | 40,000 | | 50,000 | | 11,100 | | 44,400 | | 55,500 |
Mothers Work, Inc., 11.25%, 8/1/2010 | | 15,000 | | 80,000 | | 95,000 | | 14,550 | | 77,600 | | 92,150 |
NCL Corp., 144A, 10.625%, 7/15/2014 | | 40,000 | | 190,000 | | 230,000 | | 40,000 | | 190,000 | | 230,000 |
Paxson Communications Corp., 10.75%, 7/15/2008 | | 25,000 | | 120,000 | | 145,000 | | 26,250 | | 126,000 | | 152,250 |
PEI Holding, Inc., 11.0%, 3/15/2010 | | 35,000 | | 170,000 | | 205,000 | | 40,775 | | 198,050 | | 238,825 |
Petro Stopping Centers, 9.0%, 2/15/2012 | | 50,000 | | 250,000 | | 300,000 | | 52,875 | | 264,375 | | 317,250 |
Pinnacle Entertainment, Inc., 8.75%, 10/1/2013 | | 10,000 | | 60,000 | | 70,000 | | 10,825 | | 64,950 | | 75,775 |
Premier Entertainment Biloxi LLC/Finance, 10.75%, 2/1/2012 | | — | | 50,000 | | 50,000 | | — | | 54,625 | | 54,625 |
PRIMEDIA, Inc.: | | | | | | | | | | | | |
7.665%, 5/15/2010 | | 45,000 | | 225,000 | | 270,000 | | 47,700 | | 238,500 | | 286,200 |
8.875%, 5/15/2011 | | 30,000 | | 145,000 | | 175,000 | | 31,725 | | 153,337 | | 185,062 |
Rent-Way, Inc., 11.875%, 6/15/2010 | | — | | 50,000 | | 50,000 | | — | | 56,313 | | 56,313 |
Restaurant Co., 11.25%, 5/15/2008 | | 37,640 | | 199,779 | | 237,419 | | 38,110 | | 202,276 | | 240,386 |
Schuler Homes, Inc., 10.5%, 7/15/2011 | | 35,000 | | 175,000 | | 210,000 | | 39,813 | | 199,062 | | 238,875 |
Simmons Bedding Co., 144A, Step-up Coupon, 0% to 12/15/2009, 10.0% to 12/15/2014 | | 35,000 | | 165,000 | | 200,000 | | 21,350 | | 100,650 | | 122,000 |
Sinclair Broadcast Group, Inc.: | | | | | | | | | | | | |
8.0%, 3/15/2012 | | — | | 155,000 | | 155,000 | | — | | 164,688 | | 164,688 |
8.75%, 12/15/2011 | | 115,000 | | 410,000 | | 525,000 | | 125,206 | | 446,387 | | 571,593 |
Sonic Automotive, Inc., Series B, 8.625%, 8/15/2013 | | 45,000 | | 245,000 | | 290,000 | | 47,981 | | 261,231 | | 309,212 |
Tele-Communications, Inc., “A”, 9.875%, 6/15/2022 | | — | | 670,000 | | 670,000 | | — | | 951,119 | | 951,119 |
Toys “R” Us, Inc.: | | | | | | | | | | | | |
7.375%, 10/15/2018 | | 85,000 | | 355,000 | | 440,000 | | 78,625 | | 328,375 | | 407,000 |
7.875%, 4/15/2013 | | — | | 65,000 | | 65,000 | | — | | 64,512 | | 64,512 |
True Temper Sports, Inc., 8.375%, 9/15/2011 | | 20,000 | | 95,000 | | 115,000 | | 18,600 | | 88,350 | | 106,950 |
Trump Holdings & Funding, 11.625%, 3/15/2010 | | 25,000 | | 120,000 | | 145,000 | | 27,063 | | 129,900 | | 156,963 |
TRW Automotive, Inc., 11.0%, 2/15/2013 | | 40,000 | | 210,000 | | 250,000 | | 48,200 | | 253,050 | | 301,250 |
United Auto Group, Inc., 9.625%, 3/15/2012 | | 30,000 | | 140,000 | | 170,000 | | 33,150 | | 154,700 | | 187,850 |
Venetian Casino Resort LLC, 11.0%, 6/15/2010 | | 30,000 | | 160,000 | | 190,000 | | 34,238 | | 182,600 | | 216,838 |
VICORP Restaurants, Inc., 10.5%, 4/15/2011 | | 20,000 | | 90,000 | | 110,000 | | 20,100 | | 90,450 | | 110,550 |
Virgin River Casino Corp., 144A, 9.0%, 1/15/2012 | | — | | 15,000 | | 15,000 | | — | | 15,600 | | 15,600 |
Visteon Corp.: | | | | | | | | | | | | |
7.0%, 3/10/2014 | | 60,000 | | 190,000 | | 250,000 | | 57,300 | | 181,450 | | 238,750 |
8.25%, 8/1/2010 | | — | | 90,000 | | 90,000 | | — | | 94,275 | | 94,275 |
S-12
| | | | | | | | | | | | |
| | | Balanced
Portfolio
Par/Share
Amount
| | Total Return
Portfolio
Par/Share
Amount
| | Total Return
Portfolio– Combined
Pro Forma
Par/Share
Amount
| | Balanced
Portfolio
Market
Value ($)
| | Total Return
Portfolio
Market
Value ($)
| | Total Return
Portfolio– Combined
Pro Forma
Market
Value ($)
|
Wheeling Island Gaming, Inc., 10.125%, 12/15/2009 | | 25,000 | | 130,000 | | 155,000 | | 26,625 | | 138,450 | | 165,075 |
Williams Scotsman, Inc., 9.875%, 6/1/2007 | | 55,000 | | 270,000 | | 325,000 | | 55,000 | | 270,000 | | 325,000 |
Worldspan LP/WS Finance Corp., 9.625%, 6/15/2011 | | 25,000 | | 120,000 | | 145,000 | | 24,875 | | 119,400 | | 144,275 |
Wynn Las Vegas LLC, 144A, 6.625%, 12/1/2014 | | 65,000 | | 320,000 | | 385,000 | | 64,350 | | 316,800 | | 381,150 |
XM Satellite Radio, Inc., Step-up Coupon, 0% to 12/31/2005, 14.0% to 12/31/2009 | | 35,000 | | 165,000 | | 200,000 | | 35,700 | | 168,300 | | 204,000 |
Young Broadcasting, Inc., 8.75%, 1/15/2014 | | 40,000 | | 210,000 | | 250,000 | | 40,300 | | 211,575 | | 251,875 |
| | | | | | | | |
| |
| |
|
| | | | | | | | | 2,510,542 | | 12,538,984 | | 15,049,526 |
| | | | | | | | |
| |
| |
|
Consumer Staples 0.2% | | | | | | | | | | | | |
Agrilink Foods, Inc., 11.875%, 11/1/2008 | | — | | 15,000 | | 15,000 | | — | | 15,619 | | 15,619 |
Church & Dwight Co., Inc., 144A, 6.0%, 12/15/2012 | | 15,000 | | 85,000 | | 100,000 | | 15,263 | | 86,487 | | 101,750 |
Duane Reade, Inc.: | | | | | | — | | | | | | — |
144A, 7.01%, 12/15/2010 | | 15,000 | | 70,000 | | 85,000 | | 15,225 | | 71,050 | | 86,275 |
144A, 9.75%, 8/1/2011 | | 35,000 | | 175,000 | | 210,000 | | 31,850 | | 159,250 | | 191,100 |
North Atlantic Holding, Inc., Step-up Coupon, 0% to 3/1/2008, 12.25% to 3/1/2014 | | 15,000 | | 70,000 | | 85,000 | | 6,150 | | 28,700 | | 34,850 |
Pierre Foods, Inc., 144A, 9.875%, 7/15/2012 | | — | | 35,000 | | 35,000 | | — | | 36,225 | | 36,225 |
Pinnacle Foods Holding Corp., 144A, 8.25%, 12/1/2013 | | 45,000 | | 195,000 | | 240,000 | | 42,862 | | 185,737 | | 228,599 |
Prestige Brands, Inc., 144A, 9.25%, 4/15/2012 | | — | | 15,000 | | 15,000 | | — | | 15,938 | | 15,938 |
Revlon Consumer Products Corp., 9.0%, 11/1/2006 | | 30,000 | | 160,000 | | 190,000 | | 29,700 | | 158,400 | | 188,100 |
Rite Aid Corp., 11.25%, 7/1/2008 | | — | | 30,000 | | 30,000 | | — | | 32,550 | | 32,550 |
Standard Commercial Corp., 8.0%, 4/15/2012 | | 15,000 | | 80,000 | | 95,000 | | 15,413 | | 82,200 | | 97,613 |
Swift & Co., 12.5%, 1/1/2010 | | 30,000 | | 150,000 | | 180,000 | | 33,900 | | 169,500 | | 203,400 |
Wornick Co., 10.875%, 7/15/2011 | | — | | 65,000 | | 65,000 | | — | | 70,525 | | 70,525 |
| | | | | | | | |
| |
| |
|
| | | | | | | | | 190,363 | | 1,112,181 | | 1,302,544 |
| | | | | | | | |
| |
| |
|
Energy 0.8% | | | | | | | | | | | | |
Avista Corp., 9.75%, 6/1/2008 | | — | | 115,000 | | 115,000 | | — | | 133,338 | | 133,338 |
CenterPoint Energy Resources Corp., Series B, 7.875%, 4/1/2013 | | 120,000 | | 345,000 | | 465,000 | | 142,631 | | 410,064 | | 552,695 |
Chesapeake Energy Corp.: | | | | | | — | | | | | | — |
6.875%, 1/15/2016 | | 15,000 | | 100,000 | | 115,000 | | 15,713 | | 104,750 | | 120,463 |
9.0%, 8/15/2012 | | 35,000 | | 140,000 | | 175,000 | | 39,987 | | 159,950 | | 199,937 |
CITGO Petroleum Corp., 144A, 6.0%, 10/15/2011 | | 10,000 | | 60,000 | | 70,000 | | 9,950 | | 59,700 | | 69,650 |
Dynegy Holdings, Inc.: | | | | | | — | | | | | | — |
6.875%, 4/1/2011 | | 10,000 | | 15,000 | | 25,000 | | 9,625 | | 14,438 | | 24,063 |
7.125%, 5/15/2018 | | 35,000 | | 215,000 | | 250,000 | | 31,194 | | 191,619 | | 222,813 |
7.625%, 10/15/2026 | | 10,000 | | 55,000 | | 65,000 | | 8,687 | | 47,781 | | 56,468 |
144A, 9.875%, 7/15/2010 | | 40,000 | | 185,000 | | 225,000 | | 44,700 | | 206,737 | | 251,437 |
Edison Mission Energy, 7.73%, 6/15/2009 | | 100,000 | | 410,000 | | 510,000 | | 107,500 | | 440,750 | | 548,250 |
El Paso Production Holding Corp., 7.75%, 6/1/2013 | | 35,000 | | 175,000 | | 210,000 | | 36,663 | | 183,312 | | 219,975 |
Enterprise Products Operating LP, 7.5%, 2/1/2011 | | 164,000 | | 793,000 | | 957,000 | | 185,942 | | 899,099 | | 1,085,041 |
Mission Resources Corp., 9.875%, 4/1/2011 | | 30,000 | | 155,000 | | 185,000 | | 32,025 | | 165,463 | | 197,488 |
Newpark Resources, Inc., Series B, 8.625%, 12/15/2007 | | 40,000 | | 195,000 | | 235,000 | | 40,600 | | 197,925 | | 238,525 |
S-13
| | | | | | | | | | | | |
| | | Balanced
Portfolio
Par/Share
Amount
| | Total Return
Portfolio
Par/Share
Amount
| | Total Return
Portfolio– Combined
Pro Forma
Par/Share
Amount
| | Balanced
Portfolio
Market
Value ($)
| | Total Return
Portfolio
Market
Value ($)
| | Total Return
Portfolio– Combined
Pro Forma
Market
Value ($)
|
NGC Corp. Capital Trust, Series B, 8.316%, 6/1/2027 | | — | | 100,000 | | 100,000 | | — | | 84,875 | | 84,875 |
Pemex Project Funding Master Trust, 144A, 3.79%, 6/15/2010 | | 165,000 | | 805,000 | | 970,000 | | 169,290 | | 825,930 | | 995,220 |
Southern Natural Gas, 8.875%, 3/15/2010 | | 15,000 | | 105,000 | | 120,000 | | 16,800 | | 117,600 | | 134,400 |
Stone Energy Corp.: | | | | | | — | | | | | | — |
144A, 6.75%, 12/15/2014 | | 20,000 | | 90,000 | | 110,000 | | 19,950 | | 89,775 | | 109,725 |
8.25%, 12/15/2011 | | 45,000 | | 215,000 | | 260,000 | | 48,600 | | 232,200 | | 280,800 |
Williams Companies, Inc.: | | | | | | — | | | | | | — |
8.125%, 3/15/2012 | | 45,000 | | 215,000 | | 260,000 | | 51,975 | | 248,325 | | 300,300 |
8.75%, 3/15/2032 | | 20,000 | | 100,000 | | 120,000 | | 22,975 | | 114,875 | | 137,850 |
| | | | | | | | |
| |
| |
|
| | | | | | | | | 1,034,807 | | 4,928,506 | | 5,963,313 |
| | | | | | | | |
| |
| |
|
Financials 3.4% | | | | | | | | | | | | |
AAC Group Holding Corp., 144A, Step-up Coupon, 0% to 10/1/2008, 10.25% to 10/1/2012 | | 30,000 | | 130,000 | | 160,000 | | 20,175 | | 87,425 | | 107,600 |
Affinia Group, Inc., 144A, 9.0%, 11/30/2014 | | 50,000 | | 235,000 | | 285,000 | | 52,125 | | 244,987 | | 297,112 |
Ahold Finance USA, Inc., 6.25%, 5/1/2009 | | — | | 105,000 | | 105,000 | | — | | 109,200 | | 109,200 |
American General Institutional Capital, 144A, 8.125%, 3/15/2046 | | 230,000 | | 1,774,000 | | 2,004,000 | | 301,028 | | 1,720,434 | | 2,021,462 |
AmeriCredit Corp., 9.25%, 5/1/2009 | | 10,000 | | 235,000 | | 245,000 | | 10,725 | | 252,037 | | 262,762 |
BF Saul Real Estate Investment Trust, 7.5%, 3/1/2014 | | 10,000 | | 145,000 | | 155,000 | | 10,300 | | 149,350 | | 159,650 |
Capital One Bank, 4.875%, 5/15/2008 | | — | | 70,000 | | 70,000 | | — | | 71,891 | | 71,891 |
Dow Jones CDX: | | | | | | | | | | | | |
Series 3-1, 144A, 7.75%, 12/29/2009 | | 410,000 | | 955,000 | | 1,365,000 | | 421,531 | | 981,859 | | 1,403,390 |
Series 3-3, 144A, 8.0%, 12/29/2009 | | 850,000 | | 2,065,000 | | 2,915,000 | | 871,781 | | 2,117,916 | | 2,989,697 |
E*TRADE Financial Corp., 144A, 8.0%, 6/15/2011 | | 50,000 | | 250,000 | | 300,000 | | 53,750 | | 268,750 | | 322,500 |
Farmers Insurance Exchange, 144A, 8.625%, 5/1/2024 | | 50,000 | | 255,000 | | 305,000 | | 58,978 | | 300,788 | | 359,766 |
FINOVA Group, Inc., 7.5%, 11/15/2009 | | 281,050 | | 1,390,650 | | 1,671,700 | | 137,714 | | 681,418 | | 819,132 |
Ford Motor Credit Co.: | | | | | | | | | | | | |
5.8%, 1/12/2009 | | 197,000 | | 792,000 | | 989,000 | | 201,362 | | 809,536 | | 1,010,898 |
6.875%, 2/1/2006 | | 160,000 | | 2,293,000 | | 2,453,000 | | 164,832 | | 2,362,249 | | 2,527,081 |
General Motors Acceptance Corp.: | | | | | | | | | | | | |
6.75%, 1/15/2006 | | 930,000 | | 3,910,000 | | 4,840,000 | | 954,068 | | 4,011,191 | | 4,965,259 |
6.875%, 9/15/2011 | | — | | 305,000 | | 305,000 | | — | | 312,562 | | 312,562 |
Goldman Sachs Group, Inc., 4.75%, 7/15/2013 | | 155,000 | | 745,000 | | 900,000 | | 153,378 | | 737,204 | | 890,582 |
HSBC Bank USA, 5.875%, 11/1/2034 | | — | | 550,000 | | 550,000 | | — | | 556,929 | | 556,929 |
JPMorgan Chase & Co., 5.125%, 9/15/2014 | | 115,000 | | 570,000 | | 685,000 | | 115,754 | | 573,739 | | 689,493 |
LNR Property Corp., 7.625%, 7/15/2013 | | 15,000 | | 75,000 | | 90,000 | | 17,025 | | 85,125 | | 102,150 |
Morgan Stanley, 4.0%, 1/15/2010 | | — | | 676,000 | | 676,000 | | — | | 668,321 | | 668,321 |
Poster Financial Group, Inc., 8.75%, 12/1/2011 | | 35,000 | | 160,000 | | 195,000 | | 35,962 | | 164,400 | | 200,362 |
PXRE Capital Trust I, 8.85%, 2/1/2027 | | 30,000 | | 140,000 | | 170,000 | | 30,000 | | 140,000 | | 170,000 |
Qwest Capital Funding, Inc., 6.5%, 11/15/2018 | | 30,000 | | 150,000 | | 180,000 | | 24,900 | | 124,500 | | 149,400 |
R.H. Donnelly Finance Corp., 10.875%, 12/15/2012 | | 15,000 | | 65,000 | | 80,000 | | 17,813 | | 77,188 | | 95,001 |
Radnor Holdings Corp., 11.0%, 3/15/2010 | | 20,000 | | 70,000 | | 90,000 | | 17,150 | | 60,025 | | 77,175 |
S-14
| | | | | | | | | | | | |
| | | Balanced
Portfolio
Par/Share
Amount
| | Total Return
Portfolio
Par/Share
Amount
| | Total Return
Portfolio– Combined
Pro Forma
Par/Share
Amount
| | Balanced
Portfolio
Market
Value ($)
| | Total Return
Portfolio
Market
Value ($)
| | Total Return
Portfolio– Combined
Pro Forma
Market
Value ($)
|
RAM Holdings Ltd., 144A, 6.875%, 4/1/2024 | | 345,000 | | 1,500,000 | | 1,845,000 | | 338,821 | | 1,473,135 | | 1,811,956 |
Republic New York Corp., 5.875%, 10/15/2008 | | 195,000 | | 985,000 | | 1,180,000 | | 207,554 | | 1,048,414 | | 1,255,968 |
Thornburg Mortgage, Inc., 8.0%, 5/15/2013 | | — | | 45,000 | | 45,000 | | — | | 47,813 | | 47,813 |
TIG Capital Holdings Trust, 144A, 8.597%, 1/15/2027 | | 35,000 | | 185,000 | | 220,000 | | 30,713 | | 162,337 | | 193,050 |
UGS Corp., 144A, 10.0%, 6/1/2012 | | 25,000 | | 115,000 | | 140,000 | | 28,438 | | 130,813 | | 159,251 |
Universal City Development, 11.75%, 4/1/2010 | | 20,000 | | 180,000 | | 200,000 | | 23,625 | | 212,625 | | 236,250 |
Universal City Florida Holding Co., 144A, 7.2%, 5/1/2010 | | 15,000 | | 65,000 | | 80,000 | | 15,600 | | 67,600 | | 83,200 |
Venoco, Inc., 144A, 8.75%, 12/15/2011 | | 15,000 | | 70,000 | | 85,000 | | 15,450 | | 72,100 | | 87,550 |
Wells Fargo & Co., 4.2%, 1/15/2010 | | 236,000 | | 1,118,000 | | 1,354,000 | | 236,959 | | 1,122,544 | | 1,359,503 |
| | | | | | | | |
| |
| |
|
| | | | | | | | | 4,567,511 | | 22,006,405 | | 26,573,916 |
| | | | | | | | |
| |
| |
|
Health Care 0.6% | | | | | | | | | | | | |
AmeriPath, Inc., 10.5%, 4/1/2013 | | 20,000 | | 110,000 | | 130,000 | | 21,250 | | 116,875 | | 138,125 |
AmerisourceBergen Corp., 7.25%, 11/15/2012 | | — | | 11,000 | | 11,000 | | — | | 12,293 | | 12,293 |
Cinacalcet Royalty Subordinated LLC, 8.0%, 3/30/2017 | | 30,000 | | 145,000 | | 175,000 | | 30,150 | | 145,725 | | 175,875 |
Curative Health Services, Inc., 10.75%, 5/1/2011 | | 20,000 | | 95,000 | | 115,000 | | 17,900 | | 85,025 | | 102,925 |
Encore Medical Corp., 144A, 9.75%, 10/1/2012 | | 20,000 | | 85,000 | | 105,000 | | 20,200 | | 85,850 | | 106,050 |
Hanger Orthopedic Group, Inc., 10.375%, 2/15/2009 | | 30,000 | | 145,000 | | 175,000 | | 30,975 | | 149,713 | | 180,688 |
Health Care Service Corp., 144A, 7.75%, 6/15/2011 | | — | | 2,695,000 | | 2,695,000 | | — | | 3,153,155 | | 3,153,155 |
HEALTHSOUTH Corp., 10.75%, 10/1/2008 | | 45,000 | | 230,000 | | 275,000 | | 47,475 | | 242,650 | | 290,125 |
IDI Acquisition Corp., 144A, 10.75%, 12/15/2011 | | 10,000 | | 50,000 | | 60,000 | | 10,250 | | 51,250 | | 61,500 |
InSight Health Services Corp., Series B, 9.875%, 11/1/2011 | | 20,000 | | 105,000 | | 125,000 | | 20,200 | | 106,050 | | 126,250 |
Interactive Health LLC, 144A, 7.25%, 4/1/2011 | | 20,000 | | 105,000 | | 125,000 | | 17,400 | | 91,350 | | 108,750 |
National Mentor, Inc., 144A, 9.625%, 12/1/2012 | | — | | 20,000 | | 20,000 | | — | | 21,250 | | 21,250 |
Tenet Healthcare Corp., 6.375%, 12/1/2011 | | 110,000 | | 555,000 | | 665,000 | | 102,025 | | 514,762 | | 616,787 |
| | | | | | | | |
| |
| |
|
| | | | | | | | | 317,825 | | 4,775,948 | | 5,093,773 |
| | | | | | | | |
| |
| |
|
Industrials 1.0% | | | | | | | | | | | | |
Aavid Thermal Technologies, Inc., 12.75%, 2/1/2007 | | 30,000 | | 140,000 | | 170,000 | | 32,850 | | 153,300 | | 186,150 |
Allied Security Escrow Corp., 144A, 11.375%, 7/15/2011 | | 25,000 | | 135,000 | | 160,000 | | 26,125 | | 141,075 | | 167,200 |
Allied Waste North America, Inc., Series B, 5.75%, 2/15/2011 | | 120,000 | | 575,000 | | 695,000 | | 112,800 | | 540,500 | | 653,300 |
AMI Semiconductor, Inc., 10.75%, 2/1/2013 | | 10,000 | | 45,000 | | 55,000 | | 11,750 | | 52,875 | | 64,625 |
Avondale Mills, Inc., 144A, 9.02%, 7/1/2012 | | 10,000 | | 30,000 | | 40,000 | | 9,000 | | 27,000 | | 36,000 |
BAE System 2001 Asset Trust, “B”, Series 2001, 144A, 7.156%, 12/15/2011 | | 194,549 | | 309,509 | | 504,058 | | 211,170 | | 335,952 | | 547,122 |
Browning-Ferris Industries: | | | | | | | | | | | | |
7.4%, 9/15/2035 | | 15,000 | | 70,000 | | 85,000 | | 13,125 | | 61,250 | | 74,375 |
9.25%, 5/1/2021 | | — | | 15,000 | | 15,000 | | — | | 15,975 | | 15,975 |
Cenveo Corp., 7.875%, 12/1/2013 | | 35,000 | | 185,000 | | 220,000 | | 32,550 | | 172,050 | | 204,600 |
Clean Harbors, Inc., 144A, 11.25%, 7/15/2012 | | — | | 30,000 | | 30,000 | | — | | 33,600 | | 33,600 |
S-15
| | | | | | | | | | | | |
| | | Balanced
Portfolio
Par/Share
Amount
| | Total Return
Portfolio
Par/Share
Amount
| | Total Return
Portfolio– Combined
Pro Forma
Par/Share
Amount
| | Balanced
Portfolio
Market
Value ($)
| | Total Return
Portfolio
Market
Value ($)
| | Total Return
Portfolio– Combined
Pro Forma
Market
Value ($)
|
Collins & Aikman Floor Cover, Series B, 9.75%, 2/15/2010 | | 55,000 | | 260,000 | | 315,000 | | 59,125 | | 279,500 | | 338,625 |
Collins & Aikman Products, 10.75%, 12/31/2011 | | 35,000 | | 165,000 | | 200,000 | | 35,700 | | 168,300 | | 204,000 |
Continental Airlines, Inc., “B”, 8.0%, 12/15/2005 | | 25,000 | | 140,000 | | 165,000 | | 24,375 | | 136,500 | | 160,875 |
Cornell Companies, Inc., 10.75%, 7/1/2012 | | 40,000 | | 185,000 | | 225,000 | | 42,750 | | 197,719 | | 240,469 |
Corrections Corp. of America, 9.875%, 5/1/2009 | | 30,000 | | 150,000 | | 180,000 | | 33,300 | | 166,500 | | 199,800 |
Dana Corp., 7.0%, 3/1/2029 | | 40,000 | | 210,000 | | 250,000 | | 39,900 | | 209,475 | | 249,375 |
Eagle-Picher Industries, Inc., 9.75%, 9/1/2013 | | 10,000 | | 30,000 | | 40,000 | | 10,000 | | 30,000 | | 40,000 |
Erico International Corp., 8.875%, 3/1/2012 | | 25,000 | | 120,000 | | 145,000 | | 26,250 | | 126,000 | | 152,250 |
Evergreen International Aviation, Inc., 12.0%, 5/15/2010 | | 10,000 | | 40,000 | | 50,000 | | 7,575 | | 30,300 | | 37,875 |
Goodman Global Holding Co., Inc., 144A, 7.875%, 12/15/2012 | | 40,000 | | 205,000 | | 245,000 | | 39,600 | | 202,950 | | 242,550 |
Interface, Inc., 10.375%, 2/1/2010 | | 10,000 | | 60,000 | | 70,000 | | 11,500 | | 69,000 | | 80,500 |
ISP Chemco, Inc., Series B, 10.25%, 7/1/2011 | | 45,000 | | 230,000 | | 275,000 | | 50,850 | | 259,900 | | 310,750 |
Kansas City Southern: | | | | | | | | | | | | |
7.5%, 6/15/2009 | | 95,000 | | 370,000 | | 465,000 | | 99,750 | | 388,500 | | 488,250 |
9.5%, 10/1/2008 | | — | | 100,000 | | 100,000 | | — | | 113,625 | | 113,625 |
Kinetek, Inc., Series D, 10.75%, 11/15/2006 | | 55,000 | | 260,000 | | 315,000 | | 53,762 | | 254,150 | | 307,912 |
Laidlaw International, Inc., 10.75%, 6/15/2011 | | 10,000 | | 70,000 | | 80,000 | | 11,675 | | 81,725 | | 93,400 |
Millennium America, Inc.: | | | | | | | | | | | | |
7.625%, 11/15/2026 | | 55,000 | | 270,000 | | 325,000 | | 54,175 | | 265,950 | | 320,125 |
9.25%, 6/15/2008 | | 40,000 | | 190,000 | | 230,000 | | 45,500 | | 216,125 | | 261,625 |
Remington Arms Co., Inc., 10.5%, 2/1/2011 | | 25,000 | | 125,000 | | 150,000 | | 24,125 | | 120,625 | | 144,750 |
Sea Containers Ltd., 10.5%, 5/15/2012 | | — | | 45,000 | | 45,000 | | — | | 47,362 | | 47,362 |
Securus Technologies, Inc., 144A, 11.0%, 9/1/2011 | | 30,000 | | 145,000 | | 175,000 | | 30,000 | | 145,000 | | 175,000 |
Ship Finance International Ltd., 8.5%, 12/15/2013 | | 35,000 | | 175,000 | | 210,000 | | 36,050 | | 180,250 | | 216,300 |
SPX Corp.: | | | | | | | | | | | | |
6.25%, 6/15/2011 | | 15,000 | | 55,000 | | 70,000 | | 15,825 | | 58,025 | | 73,850 |
7.5%, 1/1/2013 | | 40,000 | | 210,000 | | 250,000 | | 43,400 | | 227,850 | | 271,250 |
Technical Olympic USA, Inc.: | | | | | | | | | | | | |
7.5%, 3/15/2011 | | — | | 70,000 | | 70,000 | | — | | 70,525 | | 70,525 |
10.375%, 7/1/2012 | | 30,000 | | 160,000 | | 190,000 | | 33,600 | | 179,200 | | 212,800 |
Texas Genco LLC, 144A, 6.875%, 12/15/2014 | | 35,000 | | 170,000 | | 205,000 | | 36,181 | | 175,737 | | 211,918 |
The Brickman Group Ltd., Series B, 11.75%, 12/15/2009 | | — | | 60,000 | | 60,000 | | — | | 70,200 | | 70,200 |
United Rentals North America, Inc.: | | | | | | — | | | | | | — |
6.5%, 2/15/2012 | | 30,000 | | 155,000 | | 185,000 | | 29,250 | | 151,125 | | 180,375 |
7.0%, 2/15/2014 | | 25,000 | | 120,000 | | 145,000 | | 23,375 | | 112,200 | | 135,575 |
7.75%, 11/15/2013 | | 15,000 | | 80,000 | | 95,000 | | 14,700 | | 78,400 | | 93,100 |
Westlake Chemical Corp., 8.75%, 7/15/2011 | | — | | 16,000 | | 16,000 | | — | | 18,080 | | 18,080 |
| | | | | | | | |
| |
| |
|
| | | | | | | | | 1,381,663 | | 6,364,375 | | 7,746,038 |
| | | | | | | | |
| |
| |
|
Information Technology 0.1% | | | | | | | | | | | | |
Activant Solutions, Inc., 10.5%, 6/15/2011 | | 30,000 | | 150,000 | | 180,000 | | 32,250 | | 161,250 | | 193,500 |
Itron, Inc., 144A, 7.75%, 5/15/2012 | | 20,000 | | 105,000 | | 125,000 | | 20,350 | | 106,837 | | 127,187 |
Lucent Technologies, Inc., 6.45%, 3/15/2029 | | 85,000 | | 425,000 | | 510,000 | | 76,925 | | 384,625 | | 461,550 |
Spheris, Inc., 144A, 11.0%, 12/15/2012 | | 15,000 | | 85,000 | | 100,000 | | 15,375 | | 87,125 | | 102,500 |
| | | | | | | | |
| |
| |
|
| | | | | | | | | 144,900 | | 739,837 | | 884,737 |
| | | | | | | | |
| |
| |
|
S-16
| | | | | | | | | | | | |
| | | Balanced
Portfolio
Par/Share
Amount
| | Total Return
Portfolio
Par/Share
Amount
| | Total Return
Portfolio– Combined
Pro Forma
Par/Share
Amount
| | Balanced
Portfolio
Market
Value ($)
| | Total Return
Portfolio
Market
Value ($)
| | Total Return
Portfolio– Combined
Pro Forma
Market
Value ($)
|
Materials 0.9% | | | | | | | | | | | | |
Aqua Chemical, Inc., 11.25%, 7/1/2008 | | 30,000 | | 155,000 | | 185,000 | | 24,000 | | 124,000 | | 148,000 |
ARCO Chemical Co., 9.8%, 2/1/2020 | | 145,000 | | 685,000 | | 830,000 | | 165,300 | | 780,900 | | 946,200 |
Associated Materials, Inc., Step-up Coupon, 0% to 3/1/2009, 11.25% to 3/01/2014 | | 80,000 | | 375,000 | | 455,000 | | 57,600 | | 270,000 | | 327,600 |
Caraustar Industries, Inc., 9.875%, 4/1/2011 | | 30,000 | | 140,000 | | 170,000 | | 32,550 | | 151,900 | | 184,450 |
Constar International, Inc., 11.0%, 12/1/2012 | | 35,000 | | 170,000 | | 205,000 | | 36,313 | | 176,375 | | 212,688 |
Dayton Superior Corp.: | | | | | | | | | | | | |
10.75%, 9/15/2008 | | 30,000 | | 145,000 | | 175,000 | | 32,100 | | 155,150 | | 187,250 |
13.0%, 6/15/2009 | | 70,000 | | 325,000 | | 395,000 | | 72,800 | | 338,000 | | 410,800 |
Georgia-Pacific Corp.: | | | | | | | | | | | | |
8.0%, 1/15/2024 | | 75,000 | | 365,000 | | 440,000 | | 87,000 | | 423,400 | | 510,400 |
9.375%, 2/1/2013 | | 35,000 | | 185,000 | | 220,000 | | 40,775 | | 215,525 | | 256,300 |
Hercules, Inc.: | | | | | | | | | | | | |
6.75%, 10/15/2029 | | 25,000 | | 115,000 | | 140,000 | | 25,812 | | 118,738 | | 144,550 |
11.125%, 11/15/2007 | | 15,000 | | 85,000 | | 100,000 | | 17,850 | | 101,150 | | 119,000 |
Huntsman Advanced Materials, 144A, 11.0%, 7/15/2010 | | — | | 100,000 | | 100,000 | | — | | 119,000 | | 119,000 |
Huntsman International LLC: | | | | | | | | | | | | |
144A, 7.375%, 1/1/2015 | | 15,000 | | 50,000 | | 65,000 | | 15,038 | | 50,125 | | 65,163 |
144A, 7.5%, 1/1/2015 | | — | | 30,000 | | 30,000 | | — | | 40,777 | | 40,777 |
Huntsman LLC, 11.625%, 10/15/2010 | | 40,000 | | 200,000 | | 240,000 | | 47,300 | | 236,500 | | 283,800 |
IMC Global, Inc., 10.875%, 8/1/2013 | | — | | 35,000 | | 35,000 | | — | | 43,750 | | 43,750 |
Intermet Corp., 9.75%, 6/15/2009 | | 10,000 | | 55,000 | | 65,000 | | 4,900 | | 26,950 | | 31,850 |
International Steel Group, Inc., 6.5%, 4/15/2014 | | 60,000 | | 295,000 | | 355,000 | | 64,350 | | 316,387 | | 380,737 |
MMI Products, Inc., Series B, 11.25%, 4/15/2007 | | 25,000 | | 130,000 | | 155,000 | | 25,375 | | 131,950 | | 157,325 |
Neenah Corp., 144A, 11.0%, 9/30/2010 | | 50,000 | | 250,000 | | 300,000 | | 55,250 | | 276,250 | | 331,500 |
Omnova Solutions, Inc., 11.25%, 6/1/2010 | | 40,000 | | 210,000 | | 250,000 | | 45,000 | | 236,250 | | 281,250 |
Owens-Brockway Glass Container, 8.25%, 5/15/2013 | | 10,000 | | 55,000 | | 65,000 | | 11,000 | | 60,500 | | 71,500 |
Oxford Automotive, Inc., 144A, 12.0%, 10/15/2010 | | 10,000 | | 30,000 | | 40,000 | | 6,300 | | 18,900 | | 25,200 |
Pliant Corp.: | | | | | | | | | | | | |
Step-up Coupon, 0.00%, 6/15/2009 | | — | | 25,000 | | 25,000 | | — | | 23,094 | | 23,094 |
11.125%, 9/1/2009 | | 35,000 | | 180,000 | | 215,000 | | 38,150 | | 196,200 | | 234,350 |
Portola Packaging, Inc., 8.25%, 2/1/2012 | | 25,000 | | 120,000 | | 145,000 | | 19,750 | | 94,800 | | 114,550 |
Rockwood Specialties Group, Inc., 144A, 7.625%, 11/15/2014 (EUR) | | 50,000 | | 220,000 | | 270,000 | | 69,916 | | 307,632 | | 377,548 |
Sheffield Steel Corp., 144A, 11.375%, 8/15/2011 | | 20,000 | | 85,000 | | 105,000 | | 20,600 | | 87,550 | | 108,150 |
TriMas Corp., 9.875%, 6/15/2012 | | 75,000 | | 385,000 | | 460,000 | | 79,500 | | 408,100 | | 487,600 |
United States Steel LLC: | | | | | | | | | | | | |
9.75%, 5/15/2010 | | 10,000 | | 133,000 | | 143,000 | | 11,400 | | 151,620 | | 163,020 |
10.75%, 8/1/2008 | | 30,000 | | 60,000 | | 90,000 | | 35,325 | | 70,650 | | 105,975 |
| | | | | | | | |
| |
| |
|
| | | | | | | | | 1,141,254 | | 5,752,123 | | 6,893,377 |
| | | | | | | | |
| |
| |
|
Telecommunication Services 1.0% | | | | | | | | | | | | |
American Cellular Corp., Series B, 10.0%, 8/1/2011 | | 100,000 | | 505,000 | | 605,000 | | 85,750 | | 433,037 | | 518,787 |
American Tower Corp., 144A, 7.125%, 10/15/2012 | | 15,000 | | 85,000 | | 100,000 | | 15,338 | | 86,913 | | 102,251 |
AT&T Corp.: | | | | | | | | | | | | |
9.05%, 11/15/2011 | | 35,000 | | 175,000 | | 210,000 | | 40,294 | | 201,469 | | 241,763 |
9.75%, 11/15/2031 | | 35,000 | | 170,000 | | 205,000 | | 41,781 | | 202,937 | | 244,718 |
S-17
| | | | | | | | | | | | |
| | | Balanced
Portfolio
Par/Share
Amount
| | Total Return
Portfolio
Par/Share
Amount
| | Total Return
Portfolio– Combined
Pro Forma
Par/Share
Amount
| | Balanced
Portfolio
Market
Value ($)
| | Total Return
Portfolio
Market
Value ($)
| | Total Return
Portfolio– Combined
Pro Forma
Market
Value ($)
|
Bell Atlantic New Jersey, Inc., Series A, 5.875%, 1/17/2012 | | 170,000 | | 825,000 | | 995,000 | | 180,619 | | 876,534 | | 1,057,153 |
BellSouth Corp., 5.2%, 9/15/2014 | | 125,000 | | 610,000 | | 735,000 | | 127,403 | | 621,725 | | 749,128 |
Cincinnati Bell, Inc., 8.375%, 1/15/2014 | | 120,000 | | 580,000 | | 700,000 | | 121,500 | | 587,250 | | 708,750 |
Dobson Cellular Systems, Inc., 144A, 6.96%, 11/1/2011 | | — | | 35,000 | | 35,000 | | — | | 36,225 | | 36,225 |
Dobson Communications Corp., 8.875%, 10/1/2013 | | 35,000 | | 165,000 | | 200,000 | | 24,588 | | 115,912 | | 140,500 |
GCI, Inc., 7.25%, 2/15/2014 | | 25,000 | | 120,000 | | 145,000 | | 25,000 | | 120,000 | | 145,000 |
Insight Midwest LP, 9.75%, 10/1/2009 | | — | | 35,000 | | 35,000 | | — | | 36,663 | | 36,663 |
IWO Escrow Co., 144A, 6.32%, 1/15/2012 | | — | | 15,000 | | 15,000 | | — | | 15,113 | | 15,113 |
LCI International, Inc., 7.25%, 6/15/2007 | | 45,000 | | 220,000 | | 265,000 | | 43,762 | | 213,950 | | 257,712 |
Level 3 Financing, Inc., 144A, 10.75%, 10/15/2011 | | 20,000 | | 85,000 | | 105,000 | | 18,100 | | 76,925 | | 95,025 |
MCI, Inc., 8.735%, 5/1/2014 | | 115,000 | | 560,000 | | 675,000 | | 123,625 | | 602,000 | | 725,625 |
Nextel Communications, Inc., 5.95%, 3/15/2014 | | 20,000 | | 105,000 | | 125,000 | | 20,700 | | 108,675 | | 129,375 |
Nextel Partners, Inc., 8.125%, 7/1/2011 | | 25,000 | | 130,000 | | 155,000 | | 27,750 | | 144,300 | | 172,050 |
Northern Telecom Capital, 7.875%, 6/15/2026 | | — | | 60,000 | | 60,000 | | — | | 59,400 | | 59,400 |
PanAmSat Corp., 144A, 9.0%, 8/15/2014 | | 65,000 | | 300,000 | | 365,000 | | 72,556 | | 334,875 | | 407,431 |
Qwest Corp.: | | | | | | | | | | | | |
7.25%, 9/15/2025 | | 135,000 | | 480,000 | | 615,000 | | 131,287 | | 466,800 | | 598,087 |
144A, 7.875%, 9/1/2011 | | — | | 180,000 | | 180,000 | | — | | 195,300 | | 195,300 |
Qwest Services Corp.: | | | | | | | | | | | | |
144A, 13.5%, 12/15/2010 | | 15,000 | | 70,000 | | 85,000 | | 18,037 | | 84,175 | | 102,212 |
144A, 14.0%, 12/15/2014 | | 85,000 | | 430,000 | | 515,000 | | 107,525 | | 543,950 | | 651,475 |
Rural Cellular Corp., 9.875%, 2/1/2010 | | 25,000 | | 120,000 | | 145,000 | | 25,438 | | 122,100 | | 147,538 |
SBA Telecom, Inc., Step-up Coupon, 0% to 12/15/2007, 9.75% to 12/15/2011 | | 10,000 | | 55,000 | | 65,000 | | 8,425 | | 46,338 | | 54,763 |
SBC Communications, Inc., 4.125%, 9/15/2009 | | 265,000 | | — | | 265,000 | | 264,516 | | — | | 264,516 |
Triton PCS, Inc., 8.5%, 6/1/2013 | | 10,000 | | 35,000 | | 45,000 | | 9,650 | | 33,775 | | 43,425 |
Ubiquitel Operating Co., 9.875%, 3/1/2011 | | 10,000 | | 25,000 | | 35,000 | | 11,225 | | 28,063 | | 39,288 |
US Unwired, Inc., Series B, 10.0%, 6/15/2012 | | 35,000 | | 170,000 | | 205,000 | | 39,463 | | 191,675 | | 231,138 |
Western Wireless Corp., 9.25%, 7/15/2013 | | 10,000 | | 30,000 | | 40,000 | | 10,875 | | 32,625 | | 43,500 |
| | | | | | | | |
| |
| |
|
| | | | | | | | | 1,595,207 | | 6,618,704 | | 8,213,911 |
| | | | | | | | |
| |
| |
|
Utilities 1.3% | | | | | | | | | | | | |
AES Corp., 144A, 8.75%, 5/15/2013 | | — | | 35,000 | | 35,000 | | — | | 39,769 | | 39,769 |
Allegheny Energy Supply Co. LLC, 144A, 8.25%, 4/15/2012 | | — | | 75,000 | | 75,000 | | — | | 83,813 | | 83,813 |
Calpine Corp.: | | | | | | | | | | | | |
8.25%, 8/15/2005 | | 27,000 | | 144,000 | | 171,000 | | 27,270 | | 145,440 | | 172,710 |
144A, 8.5%, 7/15/2010 | | 45,000 | | 215,000 | | 260,000 | | 38,587 | | 184,362 | | 222,949 |
CMS Energy Corp., 8.5%, 4/15/2011 | | — | | 20,000 | | 20,000 | | — | | 22,725 | | 22,725 |
Consumers Energy Co., Series F, 4.0%, 5/15/2010 | | 345,000 | | 1,245,000 | | 1,590,000 | | 338,862 | | 1,222,849 | | 1,561,711 |
Dayton Power & Light Co., 144A, 5.125%, 10/1/2013 | | 180,000 | | 975,000 | | 1,155,000 | | 183,903 | | 992,519 | | 1,176,422 |
DPL, Inc., 6.875%, 9/1/2011 | | 60,000 | | 280,000 | | 340,000 | | 65,528 | | 305,797 | | 371,325 |
Midwest Generation LLC, 8.75%, 5/1/2034 | | 15,000 | | 80,000 | | 95,000 | | 17,025 | | 90,800 | | 107,825 |
S-18
| | | | | | | | | | | | |
| | | Balanced
Portfolio
Par/Share
Amount
| | Total Return
Portfolio
Par/Share
Amount
| | Total Return
Portfolio– Combined
Pro Forma
Par/Share
Amount
| | Balanced
Portfolio
Market
Value ($)
| | Total Return
Portfolio
Market
Value ($)
| | Total Return
Portfolio– Combined
Pro Forma
Market
Value ($)
|
NorthWestern Corp., 144A, 5.875%, 11/1/2014 | | — | | 55,000 | | 55,000 | | — | | 56,263 | | 56,263 |
NRG Energy, Inc., 144A, 8.0%, 12/15/2013 | | 105,000 | | 525,000 | | 630,000 | | 114,450 | | 572,250 | | 686,700 |
Pedernales Electric Cooperative, Series 2002-A, 144A, 6.202%, 11/15/2032 | | 210,000 | | 1,050,000 | | 1,260,000 | | 225,935 | | 1,129,674 | | 1,355,609 |
Progress Energy, Inc., 6.75%, 3/1/2006 | | 220,000 | | 1,275,000 | | 1,495,000 | | 228,284 | | 1,323,011 | | 1,551,295 |
PSE&G Energy Holdings LLC: | | | | | | | | | | | | |
8.5%, 6/15/2011 | | 30,000 | | 155,000 | | 185,000 | | 34,238 | | 176,894 | | 211,132 |
10.0%, 10/1/2009 | | 35,000 | | 165,000 | | 200,000 | | 41,387 | | 195,112 | | 236,499 |
TNP Enterprises, Inc., Series B, 10.25%, 4/1/2010 | | — | | 85,000 | | 85,000 | | — | | 90,738 | | 90,738 |
Xcel Energy, Inc., 7.0%, 12/1/2010 | | 245,000 | | 1,780,000 | | 2,025,000 | | 276,171 | | 2,006,469 | | 2,282,640 |
| | | | | | | | |
| |
| |
|
| | | | | | | | | 1,591,640 | | 8,638,485 | | 10,230,125 |
| | | | | | | | |
| |
| |
|
Total Corporate Bonds (Cost $14,342,213, $72,042,402 and $86,384,615, respectively) | | | | | | | | 14,475,712 | | 73,475,548 | | 87,951,260 |
| | | | | | |
Foreign Bonds - US$ Denominated 5.3% | | | | | | | | | | | | |
| | | | | | |
Consumer Discretionary 0.2% | | | | | | | | | | | | |
Advertising Directory Solutions, Inc., 144A, 9.25%, 11/15/2012 | | 20,000 | | 110,000 | | 130,000 | | 21,000 | | 115,500 | | 136,500 |
Jafra Cosmetics International, Inc., 10.75%, 5/15/2011 | | 50,000 | | 235,000 | | 285,000 | | 56,500 | | 265,550 | | 322,050 |
Kabel Deutschland GmbH, 144A, 10.625%, 7/1/2014 | | 45,000 | | 245,000 | | 290,000 | | 51,750 | | 281,750 | | 333,500 |
Shaw Communications, Inc.: | | | | | | | | | | | | |
7.25%, 4/6/2011 | | | | 60,000 | | 60,000 | | — | | 66,150 | | 66,150 |
8.25%, 4/11/2010 | | 100,000 | | 415,000 | | 515,000 | | 113,750 | | 472,062 | | 585,812 |
Vicap SA, 11.375%, 5/15/2007 | | 10,000 | | 25,000 | | 35,000 | | 10,125 | | 25,313 | | 35,438 |
Vitro Envases Norteamerica SA, 144A, 10.75%, 7/23/2011 | | 15,000 | | 85,000 | | 100,000 | | 15,563 | | 88,188 | | 103,751 |
Vitro SA de CV, Series A, 144A, 11.75%, 11/1/2013 | | 35,000 | | 200,000 | | 235,000 | | 33,862 | | 193,500 | | 227,362 |
| | | | | | | | |
| |
| |
|
| | | | | | | | | 302,550 | | 1,508,013 | | 1,810,563 |
| | | | | | | | |
| |
| |
|
Consumer Staples 0.1% | | | | | | | | | | | | |
Burns Philip Capital Property Ltd., 10.75%, 2/15/2011 | | 30,000 | | 140,000 | | 170,000 | | 33,750 | | 157,500 | | 191,250 |
Fage Dairy Industry SA, 9.0%, 2/1/2007 | | — | | 230,000 | | 230,000 | | — | | 231,150 | | 231,150 |
Grupo Cosan SA, 144A, 9.0%, 11/1/2009 | | 10,000 | | 50,000 | | 60,000 | | 10,450 | | 52,250 | | 62,700 |
| | | | | | | | |
| |
| |
|
| | | | | | | | | 44,200 | | 440,900 | | 485,100 |
| | | | | | | | |
| |
| |
|
Energy 0.3% | | | | | | | | | | | | |
Gazprom OAO, 144A, 9.625%, 3/1/2013 | | 100,000 | | 300,000 | | 400,000 | | 118,000 | | 354,000 | | 472,000 |
Luscar Coal Ltd., 9.75%, 10/15/2011 | | 10,000 | | 105,000 | | 115,000 | | 11,350 | | 119,175 | | 130,525 |
Petroleos Mexicanos, Series P, 9.5%, 9/15/2027 | | 90,000 | | 450,000 | | 540,000 | | 113,400 | | 567,000 | | 680,400 |
Petroleum Geo-Services ASA, 10.0%, 11/5/2010 | | 125,000 | | 624,002 | | 749,002 | | 142,500 | | 711,362 | | 853,862 |
Secunda International Ltd., 144A, 9.76%, 9/1/2012 | | 30,000 | | 140,000 | | 170,000 | | 29,400 | | 137,200 | | 166,600 |
| | | | | | | | |
| |
| |
|
| | | | | | | | | 414,650 | | 1,888,737 | | 2,303,387 |
| | | | | | | | |
| |
| |
|
Financials 1.8% | | | | | | | | | | | | |
Arcel Finance Ltd., 144A, 5.984%, 2/1/2009 | | — | | 954,930 | | 954,930 | | — | | 986,261 | | 986,261 |
Conproca SA de CV, 12.0%, 6/16/2010 | | — | | 100,000 | | 100,000 | | — | | 126,000 | | 126,000 |
Deutsche Telekom International Finance BV: | | | | | | | | | | | | |
8.5%, 6/15/2010 | | 50,000 | | 240,000 | | 290,000 | | 59,569 | | 285,930 | | 345,499 |
8.75%, 6/15/2030 | | 239,000 | | 1,149,000 | | 1,388,000 | | 315,589 | | 1,517,206 | | 1,832,795 |
S-19
| | | | | | | | | | | | |
| | | Balanced
Portfolio
Par/Share
Amount
| | Total Return
Portfolio
Par/Share
Amount
| | Total Return
Portfolio– Combined
Pro Forma
Par/Share
Amount
| | Balanced
Portfolio
Market
Value ($)
| | Total Return
Portfolio
Market
Value ($)
| | Total Return
Portfolio– Combined
Pro Forma
Market
Value ($)
|
Eircom Funding, 8.25%, 8/15/2013 | | 30,000 | | 155,000 | | 185,000 | | 33,150 | | 171,275 | | 204,425 |
Endurance Specialty Holdings Ltd., 7.0%, 7/15/2034 | | — | | 195,000 | | 195,000 | | | | 200,791 | | 200,791 |
Mantis Reef Ltd., 144A, 4.692%, 11/14/2008 | | 230,000 | | 1,115,000 | | 1,345,000 | | 230,671 | | 1,118,255 | | 1,348,926 |
Mizuho Financial Group, 8.375%, 12/29/2049 | | 350,000 | | 1,865,000 | | 2,215,000 | | 383,565 | | 2,043,853 | | 2,427,418 |
New ASAT (Finance) Ltd., 144A, 9.25%, 2/1/2011 | | 35,000 | | 175,000 | | 210,000 | | 31,763 | | 158,813 | | 190,576 |
QBE Insurance Group Ltd., 144A, 5.647%, 7/1/2023 | | 250,000 | | 1,155,000 | | 1,405,000 | | 245,544 | | 1,134,412 | | 1,379,956 |
Royal Bank of Scotland Group PLC, Series 3, 7.816%, 11/29/2049 | | — | | 1,045,000 | | 1,045,000 | | — | | 1,086,640 | | 1,086,640 |
Westfield Capital Corp.: | | | | | | | | | | | | |
144A, 4.375%, 11/15/2010 | | 40,000 | | 3,475,000 | | 3,515,000 | | 39,562 | | 3,436,987 | | 3,476,549 |
144A, 5.125%, 11/15/2014 | | 460,000 | | — | | 460,000 | | 457,790 | | — | | 457,790 |
| | | | | | | | |
| |
| |
|
| | | | | | | | | 1,797,203 | | 12,266,423 | | 14,063,626 |
| | | | | | | | |
| |
| |
|
Health Care 0.0% | | | | | | | | | | | | |
Biovail Corp., 7.875%, 4/1/2010 | | 20,000 | | 110,000 | | 130,000 | | 20,700 | | 113,850 | | 134,550 |
Elan Financial PLC, 144A, 7.75%, 11/15/2011 | | 10,000 | | 30,000 | | 40,000 | | 10,650 | | 31,950 | | 42,600 |
| | | | | | | | |
| |
| |
|
| | | | | | | | | 31,350 | | 145,800 | | 177,150 |
| | | | | | | | |
| |
| |
|
Industrials 0.3% | | | | | | | | | | | | |
CP Ships Ltd., 10.375%, 7/15/2012 | | 35,000 | | 170,000 | | 205,000 | | 40,381 | | 196,137 | | 236,518 |
Grupo Transportacion Ferroviaria Mexicana SA de CV: | | | | | | | | | | | | |
10.25%, 6/15/2007 | | 25,000 | | 235,000 | | 260,000 | | 26,625 | | 250,275 | | 276,900 |
11.75%, 6/15/2009 | | — | | 85,000 | | 85,000 | | — | | 86,594 | | 86,594 |
12.5%, 6/15/2012 | | 15,000 | | 98,000 | | 113,000 | | 17,512 | | 114,415 | | 131,927 |
LeGrand SA, 8.5%, 2/15/2025 | | 20,000 | | 130,000 | | 150,000 | | 23,600 | | 153,400 | | 177,000 |
Stena AB: | | | | | | | | | | | | |
144A, 7.0%, 12/1/2016 | | 10,000 | | 55,000 | | 65,000 | | 9,900 | | 54,450 | | 64,350 |
9.625%, 12/1/2012 | | 20,000 | | 95,000 | | 115,000 | | 22,600 | | 107,350 | | 129,950 |
Tyco International Group SA: | | | | | | | | | | | | |
6.875%, 1/15/2029 | | 101,000 | | 481,000 | | 582,000 | | 115,697 | | 550,991 | | 666,688 |
7.0%, 6/15/2028 | | 69,000 | | 484,000 | | 553,000 | | 80,222 | | 562,716 | | 642,938 |
| | | | | | | | |
| |
| |
|
| | | | | | | | | 336,537 | | 2,076,328 | | 2,412,865 |
| | | | | | | | |
| |
| |
|
Information Technology 0.1% | | | | | | | | | | | | |
Flextronics International Ltd., 144A, 6.25%, 11/15/2014 | | 40,000 | | 190,000 | | 230,000 | | 39,600 | | 188,100 | | 227,700 |
Magnachip Semiconductor SA: | | | | | | — | | | | | | — |
144A, 6.875%, 12/15/2011 | | 15,000 | | 70,000 | | 85,000 | | 15,450 | | 72,100 | | 87,550 |
144A, 8.0%, 12/15/2014 | | 15,000 | | 65,000 | | 80,000 | | 15,638 | | 67,763 | | 83,401 |
| | | | | | | | |
| |
| |
|
| | | | | | | | | 70,688 | | 327,963 | | 398,651 |
| | | | | | | | |
| |
| |
|
Materials 1.1% | | | | | | | | | | | | |
Alrosa Finance SA, 144A, 8.875%, 11/17/2014 | | 20,000 | | 125,000 | | 145,000 | | 20,550 | | 128,438 | | 148,988 |
Avecia Group PLC, 11.0%, 7/1/2009 | | 80,000 | | 385,000 | | 465,000 | | 82,400 | | 396,550 | | 478,950 |
Cascades, Inc.: | | | | | | | | | | | | |
7.25%, 2/15/2013 | | 45,000 | | 225,000 | | 270,000 | | 47,700 | | 238,500 | | 286,200 |
144A, 7.25%, 2/15/2013 | | — | | 10,000 | | 10,000 | | — | | 10,600 | | 10,600 |
Celulosa Arauco y Constitucion SA, 7.75%, 9/13/2011 | | 440,000 | | 435,000 | | 875,000 | | 510,279 | | 504,480 | | 1,014,759 |
Citigroup (JSC Severstal), 144A, 9.25%, 4/19/2014 | | — | | 200,000 | | 200,000 | | — | | 199,000 | | 199,000 |
Citigroup Global (Severstal), 8.625%, 2/24/2009 | | — | | 24,000 | | 24,000 | | — | | 24,098 | | 24,098 |
Crown Euro Holdings SA, 10.875%, 3/1/2013 | | 25,000 | | 125,000 | | 150,000 | | 29,562 | | 147,812 | | 177,374 |
ISPAT Inland ULC, 9.75%, 4/1/2014 | | 29,000 | | 150,000 | | 179,000 | | 35,815 | | 185,250 | | 221,065 |
Rhodia SA, 8.875%, 6/1/2011 | | 30,000 | | 150,000 | | 180,000 | | 30,225 | | 151,125 | | 181,350 |
Sappi Papier Holding AG, 144A, 6.75%, 6/15/2012 | | 485,000 | | 1,735,000 | | 2,220,000 | | 538,888 | | 1,927,774 | | 2,466,662 |
Sino-Forest Corp., 144A, 9.125%, 8/17/2011 | | 20,000 | | 85,000 | | 105,000 | | 21,850 | | 92,863 | | 114,713 |
S-20
| | | | | | | | | | | | |
| | | Balanced
Portfolio
Par/Share
Amount
| | Total Return
Portfolio
Par/Share
Amount
| | Total Return
Portfolio– Combined
Pro Forma
Par/Share
Amount
| | Balanced
Portfolio
Market
Value ($)
| | Total Return
Portfolio
Market
Value ($)
| | Total Return
Portfolio– Combined
Pro Forma
Market
Value ($)
|
Sociedad Concesionaria Autopista Central, 144A, 6.223%, 12/15/2026 | | 435,000 | | 2,015,000 | | 2,450,000 | | 456,472 | | 2,114,460 | | 2,570,932 |
Tembec Industries, Inc., 8.5%, 2/1/2011 | | 130,000 | | 620,000 | | 750,000 | | 130,650 | | 623,100 | | 753,750 |
| | | | | | | | |
| |
| |
|
| | | | | | | | | 1,904,391 | | 6,744,050 | | 8,648,441 |
| | | | | | | | |
| |
| |
|
Sovereign Bonds 0.9% | | | | | | | | | | | | |
Dominican Republic, 9.04%, 1/23/2013 | | 20,000 | | 100,000 | | 120,000 | | 16,750 | | 83,750 | | 100,500 |
Federative Republic of Brazil: | | | | | | | | | | | | |
8.875%, 10/14/2019 | | 40,000 | | 215,000 | | 255,000 | | 42,160 | | 226,610 | | 268,770 |
9.25%, 10/22/2010 | | 60,000 | | 280,000 | | 340,000 | | 67,080 | | 313,040 | | 380,120 |
11.0%, 8/17/2040 | | 60,000 | | 310,000 | | 370,000 | | 71,190 | | 367,815 | | 439,005 |
Government of Ukraine, 7.65%, 6/11/2013 | | — | | 300,000 | | 300,000 | | — | | 320,400 | | 320,400 |
Republic of Argentina: | | | | | | | | | | | | |
Series BGLO, 8.375%, 12/20/2049 | | 110,000 | | 595,000 | | 705,000 | | 35,750 | | 193,375 | | 229,125 |
11.75%, 4/7/2009 | | 120,000 | | 475,000 | | 595,000 | | 40,800 | | 160,312 | | 201,112 |
11.75%, 6/15/2015 | | 105,000 | | 515,000 | | 620,000 | | 35,437 | | 175,100 | | 210,537 |
Republic of Bulgaria, 8.25%, 1/15/2015 | | 60,000 | | 300,000 | | 360,000 | | 75,444 | | 377,220 | | 452,664 |
Republic of Colombia: | | | | | | | | | | | | |
10.75%, 1/15/2013 | | 10,000 | | 50,000 | | 60,000 | | 11,950 | | 59,750 | | 71,700 |
11.75%, 2/25/2020 | | 10,000 | | 40,000 | | 50,000 | | 12,850 | | 51,400 | | 64,250 |
Republic of Ecuador, Step-up Coupon 8.0% to 8/15/2005, 9.0% to 8/15/2006, 10.0% to 8/15/2030 | | 40,000 | | 170,000 | | 210,000 | | 34,500 | | 146,625 | | 181,125 |
Republic of Philippines, 9.375%, 1/18/2017 | | 50,000 | | 270,000 | | 320,000 | | 51,938 | | 280,463 | | 332,401 |
Republic of Turkey: | | | | | | | | | | | | |
7.25%, 3/15/2015 | | 45,000 | | 135,000 | | 180,000 | | 46,237 | | 138,712 | | 184,949 |
9.0%, 6/30/2011 | | — | | 20,000 | | 20,000 | | — | | 22,850 | | 22,850 |
9.5%, 1/15/2014 | | — | | 45,000 | | 45,000 | | — | | 53,100 | | 53,100 |
11.75%, 6/15/2010 | | 50,000 | | 300,000 | | 350,000 | | 62,750 | | 376,500 | | 439,250 |
11.875%, 1/15/2030 | | 60,000 | | 260,000 | | 320,000 | | 86,400 | | 374,400 | | 460,800 |
Republic of Venezuela: | | | | | | | | | | | | |
9.25%, 9/15/2027 | | 30,000 | | 140,000 | | 170,000 | | 31,650 | | 147,700 | | 179,350 |
10.75%, 9/19/2013 | | 40,000 | | 270,000 | | 310,000 | | 47,900 | | 323,325 | | 371,225 |
Russian Federation: | | | | | | | | | | | | |
Step-up Coupon, 5.0% to 3/31/2007, 7.5% to 3/31/2030 | | 80,000 | | 400,000 | | 480,000 | | 82,752 | | 413,760 | | 496,512 |
11.0%, 7/24/2018 | | 90,000 | | 230,000 | | 320,000 | | 125,838 | | 321,586 | | 447,424 |
Russian Ministry of Finance, Series VII, 3.0%, 5/14/2011 | | — | | 60,000 | | 60,000 | | — | | 50,598 | | 50,598 |
United Mexican States: | | | | | | | | | | | | |
Series A, 6.75%, 9/27/2034 | | 80,000 | | 375,000 | | 455,000 | | 79,000 | | 370,312 | | 449,312 |
8.125%, 12/30/2019 | | 10,000 | | 125,000 | | 135,000 | | 11,735 | | 146,813 | | 158,548 |
11.375%, 9/15/2016 | | 60,000 | | 270,000 | | 330,000 | | 88,560 | | 398,520 | | 487,080 |
| | | | | | | | |
| |
| |
|
| | | | | | | | | 1,158,671 | | 5,894,036 | | 7,052,707 |
| | | | | | | | |
| |
| |
|
Telecommunication Services 0.5% | | | | | | | | | | | | |
Alestra SA de RL de CV, 8.0%, 6/30/2010 | | 10,000 | | 35,000 | | 45,000 | | 8,475 | | 29,663 | | 38,138 |
America Movil SA de CV, Series L, 144A, 5.75%, 1/15/2015 | | 195,000 | | 790,000 | | 985,000 | | 194,555 | | 788,198 | | 982,753 |
Axtel SA, 11.0%, 12/15/2013 | | 40,000 | | 200,000 | | 240,000 | | 43,100 | | 215,500 | | 258,600 |
Embratel, Series B, 11.0%, 12/15/2008 | | 30,000 | | 145,000 | | 175,000 | | 34,200 | | 165,300 | | 199,500 |
Esprit Telecom Group PLC, 11.5%, 12/15/2007 | | — | | 630,000 | | 630,000 | | — | | 63 | | 63 |
Global Crossing UK Finance, 144A, 10.75%, 12/15/2014 | | 30,000 | | 160,000 | | 190,000 | | 29,625 | | 158,000 | | 187,625 |
Inmarsat Finance PLC, 7.625%, 6/30/2012 | | 30,000 | | 160,000 | | 190,000 | | 31,200 | | 166,400 | | 197,600 |
S-21
| | | | | | | | | | | | |
| | | Balanced
Portfolio
Par/Share
Amount
| | Total Return
Portfolio
Par/Share
Amount
| | Total Return
Portfolio– Combined
Pro Forma
Par/Share
Amount
| | Balanced
Portfolio
Market
Value ($)
| | Total Return
Portfolio
Market
Value ($)
| | Total Return
Portfolio– Combined
Pro Forma
Market
Value ($)
|
Innova S. de R.L., 9.375%, 9/19/2013 | | 20,000 | | 100,000 | | 120,000 | | 22,750 | | 113,750 | | 136,500 |
INTELSAT, 6.5%, 11/1/2013 | | 40,000 | | 200,000 | | 240,000 | | 36,400 | | 182,000 | | 218,400 |
Millicom International Cellular SA, 144A, 10.0%, 12/1/2013 | | 65,000 | | 315,000 | | 380,000 | | 68,006 | | 329,569 | | 397,575 |
Mobifon Holdings BV, 12.5%, 7/31/2010 | | — | | 65,000 | | 65,000 | | — | | 77,106 | | 77,106 |
Mobile Telesystems Financial, 144A, 8.375%, 10/14/2010 | | 20,000 | | 110,000 | | 130,000 | | 20,400 | | 112,200 | | 132,600 |
Nortel Networks Corp., 6.875%, 9/1/2023 | | 80,000 | | 260,000 | | 340,000 | | 75,200 | | 244,400 | | 319,600 |
Nortel Networks Ltd., 6.125%, 2/15/2006 | | 120,000 | | 580,000 | | 700,000 | | 122,100 | | 590,150 | | 712,250 |
Rogers Wireless Communications, Inc., 6.375%, 3/1/2014 | | 25,000 | | 115,000 | | 140,000 | | 24,750 | | 113,850 | | 138,600 |
| | | | | | | | |
| |
| |
|
| | | | | | | | | 710,761 | | 3,286,149 | | 3,996,910 |
| | | | | | | | |
| |
| |
|
Utilities 0.0% | | | | | | | | | | | | |
Calpine Canada Energy Finance, 8.5%, 5/1/2008 | | 70,000 | | 345,000 | | 415,000 | | 57,400 | | 282,900 | | 340,300 |
Total Foreign Bonds - US$ Denominated (Cost $6,689,629, $34,707,820 and $41,397,449, respectively) | | | | | | | | 6,828,401 | | 34,861,299 | | 41,689,700 |
| | | | | | |
Foreign Bonds - Non US$ Denominated 0.6% | | | | | | | | | | | | |
Consumer Discretionary 0.0% | | | | | | | | | | | | |
Victoria Acquisition III BV, 144A, 7.875%, 10/1/2014 (EUR) | | — | | 80,000 | | 80,000 | | — | | 109,284 | | 109,284 |
| | | | | | |
Industrials 0.0% | | | | | | | | | | | | |
Grohe Holdings GmbH, 144A, 8.625%, 10/1/2014 (EUR) | | 50,000 | | 185,000 | | 235,000 | | 72,720 | | 269,063 | | 341,783 |
| | | | | | |
Materials 0.0% | | | | | | | | | | | | |
Rhodia SA, 9.25%, 6/1/2011 (EUR) | | 25,000 | | 115,000 | | 140,000 | | 34,576 | | 159,049 | | 193,625 |
| | | | | | |
Sovereign Bonds 0.6% | | | | | | | | | | | | |
Mexican Bonds: | | | | | | | | | | | | |
Series M-20, 8.0%, 12/7/2023 (MXN) | | 550,000 | | 2,750,000 | | 3,300,000 | | 38,535 | | 192,675 | | 231,210 |
Series MI-10, 8.0%, 12/19/2013 (MXN) | | 8,806,000 | | 44,797,000 | | 53,603,000 | | 703,642 | | 3,579,500 | | 4,283,142 |
Republic of Argentina: | | | | | | | | | | | | |
Step-up Coupon, 8.25% to 7/6/2006, 9.0% to 7/6/2010 (EUR) | | 50,000 | | 180,000 | | 230,000 | | 19,879 | | 71,565 | | 91,444 |
Series FEB, 8.0%, 2/26/2008 (EUR) | | 20,000 | | 80,000 | | 100,000 | | 7,952 | | 31,806 | | 39,758 |
Republic of Colombia, 11.75%, 3/1/2010 (COP) | | 26,000,000 | | 131,000,000 | | 157,000,000 | | 11,329 | | 57,081 | | 68,410 |
Republic of Romania, 5.75%, 7/2/2010 (EUR) | | 20,000 | | 110,000 | | 130,000 | | 29,694 | | 163,318 | | 193,012 |
| | | | | | | | |
| |
| |
|
| | | | | | | | | 811,031 | | 4,095,945 | | 4,906,976 |
| | | | | | | | |
| |
| |
|
Total Foreign Bonds - Non US$ Denominated (Cost $887,170, $4,469,099 and $5,356,269, respectively) | | | | | | | | 918,327 | | 4,633,341 | | 5,551,668 |
| | | | | | |
Asset Backed 2.8% | | | | | | | | | | | | |
Automobile Receivables 0.4% | | | | | | | | | | | | |
Daimler Chrysler Auto Trust, “A4”, Series 2002-A, 4.49%, 10/6/2008 | | — | | 672,000 | | 672,000 | | — | | 676,146 | | 676,146 |
S-22
| | | | | | | | | | | | |
| | | Balanced
Portfolio
Par/Share
Amount
| | Total Return
Portfolio
Par/Share
Amount
| | Total Return
Portfolio– Combined
Pro Forma
Par/Share
Amount
| | Balanced
Portfolio
Market
Value ($)
| | Total Return
Portfolio
Market
Value ($)
| | Total Return
Portfolio– Combined
Pro Forma
Market
Value ($)
|
MMCA Automobile Trust: | | | | | | | | | | | | |
“A4”, Series 2002-4, 3.05%, 11/16/2009 | | — | | 700,000 | | 700,000 | | — | | 697,937 | | 697,937 |
“A4”, Series 2002-3, 3.57%, 8/17/2009 | | 650,000 | | — | | 650,000 | | 651,280 | | — | | 651,280 |
“A4”, Series 2002-2, 4.3%, 3/15/2010 | | 511,987 | | — | | 511,987 | | 513,845 | | — | | 513,845 |
“B”, Series 2002-2, 4.67%, 3/15/2010 | | 75,452 | | 327,711 | | 403,163 | | 74,919 | | 331,095 | | 406,014 |
| | | | | | | | |
| |
| |
|
| | | | | | | | | 1,240,044 | | 1,705,178 | | 2,945,222 |
| | | | | | | | |
| |
| |
|
Home Equity Loans 2.1% | | | | | | | | | | | | |
Advanta Mortgage Loan Trust, “A6”, Series 2000-2, 7.72%, 3/25/2015 | | 311,747 | | — | | 311,747 | | 328,101 | | — | | 328,101 |
Argent NIM Trust, “A”, Series 2004-WN10, 144A, 4.212%, 11/25/2034 | | 224,523 | | 396,093 | | 620,616 | | 224,741 | | 396,861 | | 621,602 |
Centex Home Equity, “A6”, Series 2000-B, 7.97%, 7/25/2031 | | 389,481 | | — | | 389,481 | | 399,085 | | — | | 399,085 |
Countrywide Asset-Backed Certificates, “N1”, Series 2004-2N, 144A, 5.0%, 2/25/2035 | | — | | 639,347 | | 639,347 | | — | | 636,189 | | 636,189 |
Countrywide Home Equity Loan Trust: | | | | | | | | | | | | |
Series 2004-C, 2.32%, 1/15/2034 | | — | | 1,352,885 | | 1,352,885 | | — | | 1,350,007 | | 1,350,007 |
“2A”, Series 2004-D, 2.65%, 6/15/2029 | | 346,769 | | 1,651,283 | | 1,998,052 | | 346,769 | | 1,651,282 | | 1,998,051 |
Countrywide Home Loans: | | | | | | | | | | | | |
“A16”, Series 2002-36, 5.25%, 1/25/2033 | | 52,576 | | 250,507 | | 303,083 | | 52,551 | | 250,389 | | 302,940 |
“1A6”, Series 2003-1, 5.5%, 3/25/2033 | | — | | 352,932 | | 352,932 | | — | | 353,882 | | 353,882 |
Long Beach Asset Holdings Corp., “N1”, Seies 2004-2, 144A, 4.94%, 6/25/2034 | | — | | 1,640,741 | | 1,640,741 | | — | | 1,636,639 | | 1,636,639 |
Master Alternative Loan Trust, “5A1”, Series 2005-1, 5.5%, 1/1/2019 | | 30,000 | | 1,290,000 | | 1,320,000 | | 30,858 | | 1,326,886 | | 1,357,744 |
Merrill Lynch Mortgage Investors, Inc., “A2B”, Series 2004-HE2, 2.798%, 8/25/2035 | | — | | 1,840,000 | | 1,840,000 | | — | | 1,841,291 | | 1,841,291 |
Park Place Securities NIM Trust: | | | | | | | | | | | | |
“A”, Series 2004-MHQ1, 144A, 2.487%, 12/25/2034 | | — | | 1,293,605 | | 1,293,605 | | — | | 1,293,605 | | 1,293,605 |
“C”, Series 2004-MHQ1, 144A, 4.458%, 12/25/2034 | | — | | 1,445,000 | | 1,445,000 | | — | | 1,445,000 | | 1,445,000 |
Park Place Securities Trust, “B”, Series 2004-WHQ1, 144A, 3.483%, 9/25/2034 | | — | | 1,555,000 | | 1,555,000 | | — | | 1,552,667 | | 1,552,667 |
Residential Asset Securities Corp., “AI6”, Series 2000-KS1, 7.905%, 2/25/2031 | | — | | 1,741,772 | | 1,741,772 | | — | | 1,814,561 | | 1,814,561 |
| | | | | | | | |
| |
| |
|
| | | | | | | | | 1,382,105 | | 15,549,259 | | 16,931,364 |
| | | | | | | | |
| |
| |
|
Industrials 0.2% | | | | | | | | | | | | |
Delta Air Lines, Inc., “G-2”, Series 2002-1, 6.417%, 7/2/2012 | | — | | 868,000 | | 868,000 | | — | | 906,126 | | 906,126 |
Northwest Airlines, “G”, Series 1999-3, 7.935%, 4/1/2019 | | — | | 804,126 | | 804,126 | | — | | 880,155 | | 880,155 |
| | | | | | | | |
| |
| |
|
| | | | | | | | | — | | 1,786,281 | | 1,786,281 |
| | | | | | | | |
| |
| |
|
Manufactured Housing Receivables 0.1% | | | | | | | | | | | | |
Vanderbilt Acquisition Loan Trust, “A2”, Series 2002-1, 4.77%, 10/7/2018 | | 578,181 | | — | | 578,181 | | 583,349 | | — | | 583,349 |
Total Asset Backed (Cost $3,236,227, $19,104,253 and $22,340,480. respectively) | | | | | | | | 3,205,498 | | 19,040,718 | | 22,246,216 |
S-23
| | | | | | | | | | | | |
| | | Balanced
Portfolio
Par/Share
Amount
| | Total Return
Portfolio
Par/Share
Amount
| | Total Return
Portfolio– Combined
Pro Forma
Par/Share
Amount
| | Balanced
Portfolio
Market
Value ($)
| | Total Return
Portfolio
Market
Value ($)
| | Total Return
Portfolio– Combined
Pro Forma
Market
Value ($)
|
| | | | | | |
US Government Agency Sponsored Pass-Throughs 1.2% | | | | | | | | | | | | |
Federal National Mortgage Association: | | | | | | | | | | | | |
4.5%, 5/1/2033 | | 130,000 | | — | | 130,000 | | 125,613 | | — | | 125,613 |
5.0%, 3/1/2034 | | 621,839 | | 3,965,751 | | 4,587,590 | | 618,192 | | 3,965,028 | | 4,583,220 |
5.5% with various maturities from 3/1/2033 until 5/1/2034 | | 1,036,204 | | — | | 1,036,204 | | 1,052,244 | | — | | 1,052,244 |
6.0%, 11/1/2017 | | 169,461 | | 818,371 | | 987,832 | | 177,892 | | 859,089 | | 1,036,981 |
6.5%, 9/1/2034 | | 285,443 | | 1,503,946 | | 1,789,389 | | 299,441 | | 1,579,834 | | 1,879,275 |
7.13%, 1/1/2012 | | 195,898 | | — | | 195,898 | | 206,809 | | — | | 206,809 |
| | | | | | | | |
| |
| |
|
8.0%, 9/1/2015 | | 67,007 | | 304,995 | | 372,002 | | 71,268 | | 324,394 | | 395,662 |
| | | | | | | | |
| |
| |
|
Total US Government Agency Sponsored Pass-Throughs (Cost $2,535,331, $6,728,364 and $9,277,608, respectively) | | | | | | | | 2,551,459 | | 6,728,345 | | 9,279,804 |
| | | | | | |
US Government Backed 3.5% | | | | | | | | | | | | |
US Treasury Bills: | | | | | | | | | | | | |
1.583%, 1/20/2005 | | 25,000 | | — | | 25,000 | | 24,979 | | — | | 24,979 |
1.56%, 1/20/2005 | | — | | 30,000 | | 30,000 | | — | | 29,975 | | 29,975 |
US Treasury Bond: | | | | | | | | | | | | |
6.0%, 2/15/2026 | | 1,355,000 | | 6,507,000 | | 7,862,000 | | 1,552,163 | | 7,453,820 | | 9,005,983 |
7.25%, 5/15/2016 | | 300,000 | | 3,396,000 | | 3,696,000 | | 375,516 | | 4,250,838 | | 4,626,354 |
7.5%, 11/15/2016 | | 20,000 | | 240,000 | | 260,000 | | 25,559 | | 306,703 | | 332,262 |
US Treasury Note: | | | | | | | | | | | | |
1.5%, 3/31/2006 | | 1,350,000 | | — | | 1,350,000 | | 1,327,957 | | — | | 1,327,957 |
3.25%, 1/15/2009 | | 1,751,000 | | 9,449,000 | | 11,200,000 | | 1,735,816 | | 9,367,058 | | 11,102,874 |
4.25%, 11/15/2013 | | — | | 970,000 | | 970,000 | | — | | 976,101 | | 976,101 |
| | | | | | |
Total US Government Backed (Cost $4,945,080, 21,765,475 and $26,710,555, respectively) | | | | | | | | 5,041,990 | | 22,384,495 | | 27,426,485 |
| | | | | | |
Commercial and Non-Agency Mortgage-Backed Securities 2.3% | | | | | | | | | | | | |
Bank of America Mortgage Securities, “2A6”, Series 2004-G, 4.657%, 8/25/2034 | | — | | 2,275,000 | | 2,275,000 | | — | | 2,308,576 | | 2,308,576 |
Bank of America-First Union Commercial Mortgage, Inc., “A1”, Series 2001-3, 4.89%, 4/11/2037 | | — | | 753,626 | | 753,626 | | — | | 770,617 | | 770,617 |
Chase Commercial Mortgage Securities Corp., “A1”, Series 2000-1, 7.656%, 4/15/2032 | | 176,853 | | — | | 176,853 | | 182,102 | | — | | 182,102 |
Citigroup Mortgage Loan Trust, Inc., “1CB2”, Series 2004-NCM2, 6.75%, 8/25/2034 | | 347,023 | | 249,145 | | 596,168 | | 361,663 | | 259,655 | | 621,318 |
Countrywide Alternative Loan Trust, “1A1”, Series 2004-J1, 6.0%, 2/25/2034 | | 118,618 | | 552,355 | | 670,973 | | 120,257 | | 559,991 | | 680,248 |
Countrywide Home Loans, “A5”, Series 2002-27, 5.5%, 12/25/2032 | | 132,533 | | 631,480 | | 764,013 | | 132,605 | | 631,825 | | 764,430 |
DLJ Mortgage Acceptance Corp., “A1B”, Series 1997-CF2, 144A, 6.82%, 10/15/2030 | | 192,386 | | | | 192,386 | | 204,564 | | | | 204,564 |
S-24
| | | | | | | | | | | | |
| | | Balanced
Portfolio
Par/Share
Amount
| | Total Return
Portfolio
Par/Share
Amount
| | Total Return
Portfolio– Combined
Pro Forma
Par/Share
Amount
| | Balanced
Portfolio
Market
Value ($)
| | Total Return
Portfolio
Market
Value ($)
| | Total Return
Portfolio– Combined
Pro Forma
Market
Value ($)
|
First Union-Lehman Brothers Commercial Mortgae, “A3”, Series 1997-C1, 7.38%, 4/18/2029 | | — | | 1,639,701 | | 1,639,701 | | — | | 1,744,730 | | 1,744,730 |
GMAC Commercial Mortgage Securities, Inc., “A3”, Series 1997-C1, 6.869%, 7/15/2029 | | 241,227 | | — | | 241,227 | | 255,205 | | — | | 255,205 |
GS Mortgage Securities Corp. II, “C”, Series 1998-C1, 6.91%, 10/18/2030 | | 205,000 | | — | | 205,000 | | 224,359 | | — | | 224,359 |
Master Adjustable Rate Mortgages Trust, “9A2”, Series 2004-5, 4.88%, 6/25/2032 | | — | | 1,200,000 | | 1,200,000 | | — | | 1,203,475 | | 1,203,475 |
Master Alternative Loan Trust: | | | | | | | | | | | | |
“3A1”, Series 2004-5, 6.5%, 6/25/2034 | | 62,994 | | 319,168 | | 382,162 | | 65,573 | | 332,234 | | 397,807 |
“8A1”, Series 2004-3, 7.0%, 4/25/2034 | | — | | 621,960 | | 621,960 | | — | | 649,753 | | 649,753 |
Master Asset Securitization Trust, “8A1”, Series 2003-6, 5.5%, 7/25/2033 | | 231,923 | | 1,107,927 | | 1,339,850 | | 233,807 | | 1,116,929 | | 1,350,736 |
Merrill Lynch Mortgage Investors, Inc., “B”, Series 1999-C1, 7.71%, 11/15/2031 | | 220,000 | | — | | 220,000 | | 251,790 | | — | | 251,790 |
Mortgage Capital Funding, Inc., “A3”, Series 1997-MC1, 7.288%, 7/20/2027 | | — | | 1,152,161 | | 1,152,161 | | — | | 1,191,259 | | 1,191,259 |
Residential Asset Securities Corp., “AI”, Series 2003-KS9, 4.71%, 3/25/2033 | | — | | 1,845,000 | | 1,845,000 | | — | | 1,874,116 | | 1,874,116 |
Structured Asset Securities Corp., “2A1”, Series 2003-1, 6.0%, 2/25/2018 | | 105,819 | | 105,819 | | 211,638 | | 109,787 | | 109,787 | | 219,574 |
TIAA Real Estate CDO Ltd., “A2”, Series 2001-C1A, 144A, 6.3%, 6/19/2021 | | 146,344 | | — | | 146,344 | | 155,323 | | — | | 155,323 |
Wachovia Bank Commercial Mortgage Trust, “A5”, Series 2004-C11, 5.215%, 1/15/2041 | | 289,000 | | 1,097,000 | | 1,386,000 | | 297,541 | | 1,129,422 | | 1,426,963 |
Washington Mutual Mortgage Securities Corp.: | | | | | | | | | | | | |
“A7”, Series 2004-AR9, 4.267%, 8/25/2034 | | 227,000 | | 1,098,000 | | 1,325,000 | | 227,179 | | 1,098,865 | | 1,326,044 |
“4A1”, Series 2002-S7, 4.5%, 11/25/2032 | | — | | 204,173 | | 204,173 | | — | | 204,567 | | 204,567 |
| | | | | | | | |
| |
| |
|
Total Commercial and Non-Agency Mortgage-Backed Securities (Cost $2,841,767,$15,222,370 and $18,064,137, respectively | | | | | | | | 2,821,755 | | 15,185,801 | | 18,007,556 |
| | | | | | | | |
| |
| |
|
Collateralized Mortgage Obligations 6.9% | | | | | | | | | | | | |
Fannie Mae, | | | | | | | | | | | | |
“A1”, Series 2002-93, 6.5%, 3/25/2032 | | — | | 479,385 | | 479,385 | | — | | 497,038 | | 497,038 |
“C”, Series 1997-M5, 6.74%, 8/25/2007 | | 390,000 | | — | | 390,000 | | 417,009 | | — | | 417,009 |
Fannie Mae Grantor Trust: | | | | | | | | | | | | |
“1A3”, Series 2004-T2, 7.0%, 11/25/2043 | | 119,237 | | 562,651 | | 681,888 | | 126,354 | | 596,233 | | 722,587 |
“A2”, Series 2002-T16, 7.0%, 7/25/2042 | | 132,686 | | 1,315,416 | | 1,448,102 | | 140,605 | | 1,393,927 | | 1,534,532 |
Fannie Mae Whole Loan: | | | | | | | | | | | | |
“3A2B”, Series 2003-W10, 3.056%, 7/25/2037 | | 260,000 | | 1,250,000 | | 1,510,000 | | 257,971 | | 1,240,246 | | 1,498,217 |
S-25
| | | | | | | | | | | | |
| | | Balanced
Portfolio
Par/Share
Amount
| | Total Return
Portfolio
Par/Share
Amount
| | Total Return
Portfolio– Combined
Pro Forma
Par/Share
Amount
| | Balanced
Portfolio
Market
Value ($)
| | Total Return
Portfolio
Market
Value ($)
| | Total Return
Portfolio– Combined
Pro Forma
Market
Value ($)
|
“1A3”, Series 2004-W1, 4.49%, 11/25/2043 | | — | | 1,195,000 | | 1,195,000 | | — | | 1,200,508 | | 1,200,508 |
“2A”, Series 2002-W1, 7.5%, 2/25/2042 | | 177,556 | | 866,549 | | 1,044,105 | | 189,685 | | 925,744 | | 1,115,429 |
“5A”, Series 2004-W2, 7.5%, 3/25/2044 | | 362,761 | | 1,718,056 | | 2,080,817 | | 388,308 | | 1,839,049 | | 2,227,357 |
Federal Home Loan Mortgage Corp.: | | | | | | | | | | | | |
“PV”, Series 2726, 3.5%, 4/15/2026 | | — | | 1,645,000 | | 1,645,000 | | — | | 1,640,101 | | 1,640,101 |
“QC”, Series 2694, 3.5%, 9/15/2020 | | — | | 1,900,000 | | 1,900,000 | | — | | 1,888,295 | | 1,888,295 |
“NB”, Series 2750, 4.0%, 12/15/2022 | | — | | 1,558,000 | | 1,558,000 | | — | | 1,555,936 | | 1,555,936 |
“ME”, Series 2691, 4.5%, 4/15/2032 | | 285,000 | | 3,040,000 | | 3,325,000 | | 272,718 | | 2,908,995 | | 3,181,713 |
“PE”, Series 2727, 4.5%, 7/15/2032 | | 470,000 | | 1,250,000 | | 1,720,000 | | 448,179 | | 1,191,966 | | 1,640,145 |
“QH”, Series 2694, 4.5%, 3/15/2032 | | 595,000 | | 2,990,000 | | 3,585,000 | | 573,161 | | 2,880,253 | | 3,453,414 |
“PE”, Series 2777, 5.0%, 4/15/2033 | | — | | 2,365,000 | | 2,365,000 | | — | | 2,348,994 | | 2,348,994 |
“PQ”, Series 2844, 5.0%, 5/15/2023 | | — | | 2,220,000 | | 2,220,000 | | — | | 2,287,088 | | 2,287,088 |
“QC”, Series 2836, 5.0%, 9/15/2022 | | — | | 2,220,000 | | 2,220,000 | | — | | 2,279,616 | | 2,279,616 |
“TE”, Series 2780, 5.0%, 1/15/2033 | | — | | 1,685,000 | | 1,685,000 | | — | | 1,675,349 | | 1,675,349 |
“BG”, Series 2640, 5.0%, 2/15/2032 | | 510,000 | | — | | 510,000 | | 511,929 | | — | | 511,929 |
“EG”, Series 2836, 5.0%, 12/15/2032 | | 455,000 | | — | | 455,000 | | 451,157 | | — | | 451,157 |
“JD”, Series 2778, 5.0%, 12/15/2032 | | 290,000 | | — | | 290,000 | | 288,188 | | — | | 288,188 |
“NE”, Series 2802, 5.0%, 2/15/2033 | | 460,000 | | — | | 460,000 | | 457,758 | | — | | 457,758 |
“PE”, Series 2512, 5.5%, 2/15/2022 | | — | | 420,000 | | 420,000 | | — | | 436,118 | | 436,118 |
“BD”, Series 2453, 6.0%, 5/15/2017 | | — | | 2,250,000 | | 2,250,000 | | — | | 2,347,692 | | 2,347,692 |
“Z”, Series 2173, 6.5%, 7/15/2029 | | 78,137 | | — | | 78,137 | | 82,024 | | — | | 82,024 |
“H”, Series 2278, 6.5%, 1/15/2031 | | 92,535 | | — | | 92,535 | | 94,966 | | — | | 94,966 |
Federal National Mortgage Association: | | | | | | | | | | | | |
“TU”, Series 2003-122, 4.0%, 5/25/2016 | | 350,000 | | — | | 350,000 | | 353,416 | | — | | 353,416 |
“NE”, Series 2004-52, 4.5%, 7/25/2033 | | — | | 1,118,000 | | 1,118,000 | | — | | 1,062,241 | | 1,062,241 |
“QG”, Series 2004-29, 4.5%, 12/25/2032 | | — | | 1,245,000 | | 1,245,000 | | — | | 1,183,932 | | 1,183,932 |
“WB”, Series 2003-106, 4.5%, 10/25/2015 | | — | | 1,870,000 | | 1,870,000 | | — | | 1,897,847 | | 1,897,847 |
“A2”, Series 2002-W10, 4.7%, 8/25/2042 | | 5,097 | | 13,886 | | 18,983 | | 5,093 | | 13,874 | | 18,967 |
“1A3”, Series 2003-W18, 4.732%, 8/25/2043 | | 270,000 | | — | | 270,000 | | 271,302 | | — | | 271,302 |
“A2”, Series 2002-60, 4.75%, 2/25/2044 | | 30,529 | | — | | 30,529 | | 30,476 | | — | | 30,476 |
“KY”, Series 2002-55, 4.75%, 4/25/2028 | | — | | 138,093 | | 138,093 | | — | | 137,873 | | 137,873 |
“1A3”, Series 2003-W19, 4.783%, 11/25/2033 | | — | | 1,175,000 | | 1,175,000 | | — | | 1,181,965 | | 1,181,965 |
“KH”, Series 2003-92, 5.0%, 3/25/2032 | | 260,000 | | — | | 260,000 | | 257,157 | | — | | 257,157 |
S-26
| | | | | | | | | | | | |
| | | Balanced
Portfolio
Par/Share
Amount
| | Total Return
Portfolio
Par/Share
Amount
| | Total Return
Portfolio– Combined
Pro Forma
Par/Share
Amount
| | Balanced
Portfolio
Market
Value ($)
| | Total Return
Portfolio
Market
Value ($)
| | Total Return
Portfolio– Combined
Pro Forma
Market
Value ($)
|
“PD”, Series 2002-31, 6.0%, 11/25/2021 | | 1,300,000 | | 6,500,000 | | 7,800,000 | | 1,344,279 | | 6,721,396 | | 8,065,675 |
“PM”, Series 2001-60, 6.0%, 3/25/2030 | | 119,253 | | 555,004 | | 674,257 | | 120,795 | | 562,179 | | 682,974 |
“HM”, Series 2002-36, 6.5%, 12/25/2029 | | — | | 111,715 | | 111,715 | | — | | 113,051 | | 113,051 |
“2A”, Series 2003-W8, 7.0%, 10/25/2042 | | 168,485 | | — | | 168,485 | | 177,746 | | — | | 177,746 |
FHLMC Structured Pass-Through Securities, “3A”, Series T-58, 7.0%, 9/25/2043 | | 183,399 | | 871,147 | | 1,054,546 | | 194,174 | | 922,327 | | 1,116,501 |
Government National Mortgage Association: | | | | | | | | | | | | |
“DH”, Series 2004-3, 3.75%, 2/20/2027 | | 810,000 | | — | | 810,000 | | 806,141 | | — | | 806,141 |
“PD”, Series 2004-30, 5.0%, 2/20/2033 | | — | | 1,115,000 | | 1,115,000 | | — | | 1,109,851 | | 1,109,851 |
| | | | | | | | |
| |
| |
|
Total Collateralized Mortgage Obligations (Cost $8,170,421, $45,449,574 and $53,619,995, respectively) | | | | | | | | 8,260,591 | | 46,039,684 | | 54,300,275 |
| | | | | | | | |
| |
| |
|
Government National Mortgage Association 0.6% | | | | | | | | | | | | |
Government National Mortgage Association: | | | | | | | | | | | | |
5.0%, 9/20/2033 | | 223,786 | | 1,053,108 | | 1,276,894 | | 223,979 | | 1,054,020 | | 1,277,999 |
6.0% with various maturities from 7/20/2034 until 8/20/2034 | | 818,318 | | 1,637,251 | | 2,455,569 | | 847,685 | | 1,696,008 | | 2,543,693 |
6.5%, 4/20/2034 | | 287,983 | | — | | 287,983 | | 303,310 | | — | | 303,310 |
| | | | | | | | |
| |
| |
|
Total Government National Mortgage Association (Cost $1,369,996, $2,727,906 and $4,097,902, respectively) | | | | | | | | 1,374,974 | | 2,750,028 | | 4,125,002 |
| | | | | | | | |
| |
| |
|
Municipal Investments 1.9% | | | | | | | | | | | | |
Brockton, MA, Core City General Obligation, Economic Development, Series A, 6.45%, 5/1/2017 | | 560,000 | | — | | 560,000 | | 622,658 | | — | | 622,658 |
Broward County, FL, Airport Revenue, Airport Systems Revenue, Series J-2, 6.13%, 10/1/2007 | | — | | 1,000,000 | | 1,000,000 | | — | | 1,062,080 | | 1,062,080 |
Charlotte-Meckelberg, NC, Hospital Authority Health Care System Revenue, ETM, 5.0%, 8/1/2015 | | 510,000 | | — | | 510,000 | | 517,900 | | — | | 517,900 |
Hoboken, NJ, Core City General Obligation, Series B, 3.8%, 1/1/2008 | | 270,000 | | — | | 270,000 | | 270,419 | | — | | 270,419 |
Illinois, Higher Education Revenue, Educational Facilities Authority, Series C, 7.1%, 7/1/2012 | | — | | 1,000,000 | | 1,000,000 | | — | | 1,156,040 | | 1,156,040 |
Jersey City, NJ, Water & Sewer Revenue, Municipal Utilities Authority, Water Revenue, Series B, 4.91%, 5/15/2015 | | 385,000 | | — | | 385,000 | | 381,739 | | — | | 381,739 |
Jicarilla, NM, Sales & Special Tax Revenue, Apache Nation Revenue, 5.2%, 12/1/2013 | | 215,000 | | — | | 215,000 | | 220,433 | | — | | 220,433 |
Mashantucket, CT, Special Assessment Revenue, Western Pequot Tribe Special Revenue, Series A, 144A, 6.57%, 9/1/2013 | | — | | 1,285,000 | | 1,285,000 | | — | | 1,410,030 | | 1,410,030 |
S-27
| | | | | | | | | | | | |
| | | Balanced
Portfolio
Par/Share
Amount
| | Total Return
Portfolio
Par/Share
Amount
| | Total Return
Portfolio– Combined
Pro Forma
Par/Share
Amount
| | Balanced
Portfolio
Market
Value ($)
| | Total Return
Portfolio
Market
Value ($)
| | Total Return
Portfolio– Combined
Pro Forma
Market
Value ($)
|
New York, General Obligation, Environmental Facilities Corp., Series B, 4.95%, 1/1/2013 | | — | | 1,895,000 | | 1,895,000 | | — | | 1,933,260 | | 1,933,260 |
Ohio, Sales & Special Tax Revenue, 7.6%, 10/1/2016 | | — | | 1,000,000 | | 1,000,000 | | — | | 1,081,940 | | 1,081,940 |
Passaic County, NJ, County General Obligation, 5.0%, 2/15/2017 | | — | | 1,735,000 | | 1,735,000 | | — | | 1,727,886 | | 1,727,886 |
Texas, American Campus Properties Student Housing Financing Ltd, 6.125%, 8/1/2023 | | — | | 1,040,000 | | 1,040,000 | | — | | 1,109,857 | | 1,109,857 |
Union County, NJ, Improvement Authority, Student Loan Revenue, 5.29%, 4/1/2018 | | — | | 1,185,000 | | 1,185,000 | | — | | 1,208,807 | | 1,208,807 |
Washington, Industrial Development Revenue, 3.5%, 10/1/2010 | | — | | 1,840,000 | | 1,840,000 | | — | | 1,766,529 | | 1,766,529 |
Yazoo County, MS, Sales & Special Tax Revenue, Series B, 4.3%, 9/1/2010 | | 355,000 | | — | | 355,000 | | 357,077 | | — | | 357,077 |
| | | | | | | | |
| |
| |
|
Total Municipal Investments (Cost $2,285,380, $12,310,926 and $14,596,306, respectively) | | | | | | | | 2,370,226 | | 12,456,429 | | 14,826,655 |
| | | | | | | | |
| |
| |
|
Convertible Bond 0.0% | | | | | | | | | | | | |
DIMON, Inc., 6.25%, 3/31/2007 | | — | | 70,000 | | 70,000 | | — | | 65,625 | | 65,625 |
HIH Capital Ltd., 144A, Series DOM, 7.5%, 9/25/2006 | | 10,000 | | 50,000 | | 60,000 | | 9,900 | | 49,500 | | 59,400 |
| | | | | | | | |
| |
| |
|
Total Convertible Bond (Cost $9,930, $114,979 and $124,909, respectively) | | | | | | | | 9,900 | | 115,125 | | 125,025 |
| | | | | | | | |
| |
| |
|
Warrants 0.0% | | | | | | | | | | | | |
MircoStrategy, Inc. | | — | | 96 | | 96 | | — | | 9 | | 9 |
TravelCenters of America, Inc. | | 10 | | 40 | | 50 | | 50 | | 200 | | 250 |
| | | | | | | | |
| |
| |
|
Total Warrants (Cost $50, $200 and $250, respectively) | | | | | | | | 50 | | 209 | | 259 |
| | | | | | | | |
| |
| |
|
Other Investments 0.1% | | | | | | | | | | | | |
Hercules Trust II, (Common Stock Unit) | | | | | | | | | | | | |
| | | | | | |
Total Other Investments (Cost $87,375, $398,781 and $486,156, respectively) | | 105,000 | | 510,000 | | 615,000 | | 88,200 | | 428,400 | | 516,600 |
| | | | | | | | |
| |
| |
|
Exchange Traded Funds 0.1% | | | | | | | | | | | | |
Semiconductor HOLDRs Trust | | | | | | | | | | | | |
| | | | | | |
Total Exchange Traded Funds (Cost $167,341, $843,677 and $1,011,018, respectively) | | 4,800 | | 24,200 | | 29,000 | | 160,129 | | 807,312 | | 967,441 |
| | | | | | | | |
| |
| |
|
Securities Lending Collateral 0.0% | | | | | | | | | | | | |
Daily Assets Fund Institutional, 2.25% | | | | | | | | | | | | |
| | | | | | |
Total Securities Lending Collateral (Cost $79,425, $0 and $79,425, respectively) | | 79,425 | | — | | 79,425 | | 79,425 | | — | | 79,425 |
| | | | | | | | |
| |
| |
|
| | | | | | |
Cash Equivalents 3.2% | | | | | | | | | | | | |
Scudder Cash Management QP Trust, 2.24% | | | | | | | | | | | | |
| | | | | | |
Total Cash Equivalents (Cost $3,967,120, $21,146,078 and $25,113,198, respectively) | | 3,967,120 | | 21,146,078 | | 25,113,198 | | 3,967,120 | | 21,146,078 | | 25,113,198 |
| | | | | | | | |
| |
| |
|
S-28
| | | | | | | | | | | | | |
| | | Balanced
Portfolio
Par/Share
Amount
| | Total Return
Portfolio
Par/Share
Amount
| | Total Return
Portfolio– Combined
Pro Forma
Par/Share
Amount
| | Balanced
Portfolio
Market
Value ($)
| | | Total Return
Portfolio
Market
Value ($)
| | Total Return
Portfolio– Combined
Pro Forma
Market
Value ($)
|
Total Investment Portfolio (Cost $116,186,557, $585,559,850 and $701,746,407, respectively) 99.8% | | | | | | | | 130,385,193 | | | 652,892,616 | | 783,277,809 |
Other Assets and Liabilities, Net 0.2% | | | | | | | | (7,933 | ) | | 1,657,614 | | 1,649,681 |
| | | | | | | | |
|
| |
| |
|
Net Assets 100.0% | | | | | | | | 130,377,260 | | | 654,550,230 | | 784,927,490 |
| | | | | | | | |
|
| |
| |
|
Portfolio Abbreviations and Definitions:
| 144A: | Security exempt from registration under Rule 144A of the Securities Act of 1933. These securities may be resold in transactions exempt from registration, normally to qualified institutional buyers. |
| ADR: | American Depository Receipts |
| PIK: | Denotes that all or a portion of the income is paid in kind. |
| REIT: | Real Estate Investment Trust |
| HOLDRS: | Holding Company Depository Receipts |
Currency Abbreviations:
S-29
Capitalization. The following table sets forth the unaudited capitalization of each Fund as of December 31, 2004 and of Total Return Portfolio on a pro forma combined basis, giving effect to the proposed acquisition of assets at net asset value as of that date:(1)
| | | | | | | | | | | | | |
| | | Total Return
Portfolio
| | Balanced
Portfolio
| | Pro Forma
Adjustments
| | | Total Return
Portfolio–Pro
Forma Combined
|
Net Assets | | | | | | | | | | | | | |
Class A Shares | | $ | 621,557,263 | | $ | 130,377,260 | | $ | — | | | $ | 751,934,523 |
Class B Shares | | | 32,992,967 | | | — | | | — | | | | 32,992,967 |
| | |
|
| |
|
| |
|
|
| |
|
|
Total Net Assets | | $ | 654,550,230 | | $ | 130,377,260 | | $ | — | | | $ | 784,927,490 |
| | |
|
| |
|
| |
|
|
| |
|
|
Shares Outstanding | | | | | | | | | | | | | |
Class A Shares | | | 27,789,320 | | | 11,143,673 | | | (5,315,454 | ) | | | 33,617,539 |
Class B Shares | | | 1,477,597 | | | — | | | — | | | | 1,477,597 |
| | | | |
Net Asset Value Per Share | | | | | | | | | | | | | |
Class A Shares | | $ | 22.37 | | $ | 11.70 | | | — | | | $ | 22.37 |
Class B Shares | | $ | 22.33 | | | — | | | — | | | $ | 22.33 |
| 1) | Assumes the merger had been consummated on December 31, 2004, and is for information purposes only. No assurance can be given as to how many shares of Total Return Portfolio will be received by the shareholders of Balanced Portfolio on the date the merger takes place, and the foregoing should not be relied upon to reflect the number of shares of Total Return Portfolio that actually will be received on or after such date. |
S-30
PRO FORMA COMBINED CONDENSED STATEMENT OF ASSETS
AND LIABILITIES AS OF DECEMBER 31, 2004 (UNAUDITED)
| | | | | | | | | | | | | | |
| | | Total Return
Portfolio
| | Balanced
Portfolio
| | | Pro Forma
Adjustments
| | | Total Return
Portfolio–Pro
Forma Combined
|
Investments, at value | | $ | 652,892,616 | | $ | 130,385,193 | | | $ | — | | | $ | 783,277,809 |
Cash | | | 39,710 | | | 180,441 | | | | — | | | | 220,151 |
Other assets less liabilities | | | 1,617,904 | | | (188,374 | ) | | | — | | | | 1,429,530 |
| | |
|
| |
|
|
| |
|
|
| |
|
|
Total Net Assets | | $ | 654,550,230 | | $ | 130,377,260 | | | | — | | | $ | 784,927,490 |
| | |
|
| |
|
|
| |
|
|
| |
|
|
Net Assets | | | | | | | | | | | | | | |
Class A Shares | | $ | 621,557,263 | | $ | 130,377,260 | | | | — | | | $ | 751,934,523 |
Class B Shares | | | 32,992,967 | | | — | | | | — | | | | 32,992,967 |
| | |
|
| |
|
|
| |
|
|
| |
|
|
Total Net Assets | | $ | 654,550,230 | | $ | 130,377,260 | | | | — | | | $ | 784,927,490 |
| | |
|
| |
|
|
| |
|
|
| |
|
|
Shares Outstanding | | | | | | | | | | | | | | |
Class A Shares | | | 27,789,320 | | | 11,143,673 | | | | (5,315,454 | ) | | | 33,617,539 |
Class B Shares | | | 1,477,597 | | | — | | | | — | | | | 1,477,597 |
| | | | |
Net Asset Value Per Share | | | | | | | | | | | | | | |
Class A Shares | | $ | 22.37 | | $ | 11.70 | | | | — | | | $ | 22.37 |
Class B Shares | | $ | 22.33 | | | — | | | | — | | | $ | 22.33 |
S-31
PRO FORMA COMBINED CONDENSED STATEMENT OF OPERATIONS
FOR THE YEAR ENDED DECEMBER 31, 2004 (UNAUDITED)
| | | | | | | | | | | | | | | | |
| | | Total Return
Portfolio
| | | Balanced
Portfolio
| | | Pro Forma
Adjustments
| | | Total Return
Portfolio–Pro
Forma Combined
| |
Investment Income: | | | | | | | | | | | | | | | | |
Interest and dividend income | | $ | 18,463,172 | | | $ | 3,696,800 | | | $ | — | | | $ | 22,159,972 | |
| | |
|
|
| |
|
|
| |
|
|
| |
|
|
|
Total Investment Income | | | 18,463,172 | | | | 3,696,800 | | | | | | | | 22,159,972 | |
Expenses | | | | | | | | | | | | | | | | |
Management fees | | | 3,670,402 | | | | 646,731 | | | | (679,505 | )(2) | | | 3,637,628 | |
Record keeping fee | | | 34,972 | | | | — | | | | — | | | | 34,972 | |
Accounting Fee | | | — | | | | 79,611 | | | | 53,414 | (3) | | | 133,025 | |
Custodian Fee | | | 39,230 | | | | 24,310 | | | | (12,658 | )(3) | | | 50,882 | |
Distribution Service Fees | | | 66,432 | | | | — | | | | — | | | | 66,432 | |
Auditing | | | 22,235 | | | | 32,580 | | | | (5,144 | )(3) | | | 49,671 | |
Legal | | | 25,057 | | | | 12,830 | | | | (5,724 | )(3) | | | 32,163 | |
Trustees fees | | | 26,175 | | | | 7,172 | | | | (12,815 | )(3) | | | 20,532 | |
Reports to Shareholders | | | 105,061 | | | | 14,160 | | | | 15,383 | (3) | | | 134,604 | |
All other expenses | | | 33,337 | | | | 2,906 | | | | (15,105 | )(3) | | | 21,138 | |
| | |
|
|
| |
|
|
| |
|
|
| |
|
|
|
Total expenses before reductions | | | 4,022,901 | | | | 820,300 | | | | (662,154 | ) | | | 4,181,047 | |
Expense reductions | | | (6,817 | ) | | | (3,588 | ) | | | — | | | | (10,405 | ) |
| | |
|
|
| |
|
|
| |
|
|
| |
|
|
|
Expenses, net | | | 4,016,084 | | | | 816,712 | | | | (662,154 | ) | | | 4,170,642 | |
| | |
|
|
| |
|
|
| |
|
|
| |
|
|
|
Net investment income (loss) | | | 14,447,088 | | | | 2,880,088 | | | | 662,154 | | | | 17,989,330 | |
| | |
|
|
| |
|
|
| |
|
|
| |
|
|
|
Net Realized and Unrealized Gain (Loss) | | | | | | | | | | | | | | | | |
Net realized gain (loss) on investments, foreign currency related transactions | | | 39,912,342 | | | | 9,114,340 | | | | — | | | | 49,026,682 | |
Net unrealized appreciation (depreciation) on investments, and foreign currency related transactions | | | (12,171,380 | ) | | | (3,739,258 | ) | | | — | | | | (15,910,638 | ) |
| | |
|
|
| |
|
|
| |
|
|
| |
|
|
|
Net increase in net assets from operations | | $ | 42,188,050 | | | $ | 8,255,170 | | | $ | 662,154 | | | $ | 51,105,374 | |
| | |
|
|
| |
|
|
| |
|
|
| |
|
|
|
Notes to Pro Forma Combined Financial Statements
December 31, 2004
| 1. | These financial statements set forth the unaudited pro forma condensed Statement of Assets and Liabilities as of December 31, 2004, and the unaudited pro forma condensed Statement of Operations for the year ended December 31, 2004 for Total Return Portfolio and Balanced Portfolio as adjusted giving effect to the merger as if it had occurred as of the beginning of the period. These statements have been derived from the books and records utilized in calculating daily net asset value for each portfolio and have been prepared in accordance with accounting principles generally accepted in the United States of America which require use of management estimates. Actual results could differ from those estimates. |
Basis of Combination
Under the terms of the Plan of Reorganization, the combination will be accounted for by the method of accounting for tax-free mergers of investment companies. The acquisition would be accomplished by an acquisition of the net assets of Balanced Portfolio in exchange for shares of Total Return Portfolio at net asset value. Following the acquisition, Total Return Portfolio will be the accounting survivor. In accordance with accounting principles generally accepted in the United States of America, the historical
S-32
cost of investment securities will be carried forward to the surviving fund and the results of operations for pre-combination periods will not be restated.
Portfolio Valuation
Investments are stated at value determined as of the close of regular trading on the New York Stock Exchange on each day the exchange is open for trading. Equity securities are valued at the most recent sales price or official closing price reported on the exchange (US or foreign) or over-the-counter market on which the security is traded most extensively. Securities for which no sales are reported are valued at the calculated mean between the most recent bid and asked quotations on the relevant market or, if a mean cannot be determined, at the most recent bid quotation.
Debt securities are valued by independent pricing services approved by the Trustees of the Fund. If the pricing services are unable to provide valuations, the securities are valued at the most recent bid quotation or evaluated price, as applicable, obtained from one or more broker-dealers. Such services may use various pricing techniques which may take into account appropriate factors such as yield, quality, coupon rate, maturity, type of issue, trading characteristics and other data, as well as broker quotes.
Money market instruments purchased with an original or remaining maturity of sixty days or less, maturing at par, are valued at amortized cost. Investments in open-end investment companies and Scudder Cash Management QP Trust are valued at their net asset value each day.
Securities and other assets for which market quotations are not readily available or for which the above valuation procedures are deemed not to reflect fair value are valued in a manner that is intended to reflect their fair value as determined in accordance with procedures approved by the Trustees.
Federal Income Taxes
It is each Portfolio’s policy to comply with the requirements of the Internal Revenue Code, as amended, which are applicable to regulated investment companies, and to distribute all of their taxable income to shareholders. After the acquisition, Total Return Portfolio intends to continue to qualify as a regulated investment company.
| 2. | Represents reduction in management fees resulting from the application of Total Return Fund’s lower management fee agreement, which will go into effect upon the consummation of the merger, to the pro forma combined average daily net assets. |
| 3. | Represents estimated increase (decrease) in expenses resulting from the merger. |
S-33
Supplement to the currently effective Statement of Additional Information of each of the listed portfolios:
Scudder Variable Series II
| • | | Scudder Aggressive Growth Portfolio |
| • | | Scudder Blue Chip Portfolio |
| • | | Scudder Conservative Income Strategy Portfolio |
| • | | Scudder Fixed Income Portfolio |
| • | | Scudder Global Blue Chip Portfolio |
| • | | Scudder Government & Agency Securities Portfolio |
| • | | Scudder Growth Portfolio |
| • | | Scudder Growth & Income Strategy Portfolio |
| • | | Scudder Growth Strategy Portfolio |
| • | | Scudder High Income Portfolio |
| • | | Scudder Income & Growth Strategy Portfolio |
| • | | Scudder International Select Equity Portfolio |
| • | | Scudder Large Cap Value Portfolio |
| • | | Scudder Mercury Large Cap Core Portfolio |
| • | | Scudder Money Market Portfolio |
| • | | Scudder Small Cap Growth Portfolio |
| • | | Scudder Strategic Income Portfolio |
| • | | Scudder Technology Growth Portfolio |
| • | | Scudder Templeton Foreign Value Portfolio |
| • | | Scudder Total Return Portfolio |
| • | | SVS Davis Venture Value Portfolio |
| • | | SVS Dreman Financial Services Portfolio |
| • | | SVS Dreman High Return Equity Portfolio |
| • | | SVS Dreman Small Cap Value Portfolio |
| • | | SVS Eagle Focused Large Cap Growth Portfolio |
| • | | SVS Focus Value+Growth Portfolio |
| • | | SVS Index 500 Portfolio |
| • | | SVS INVESCO Dynamic Growth Portfolio |
| • | | SVS Janus Growth and Income Portfolio |
| • | | SVS Janus Growth Opportunities Portfolio |
| • | | SVS MFS Strategic Value Portfolio |
| • | | SVS Oak Strategic Equity Portfolio |
| • | | SVS Turner Mid Cap Growth Portfolio |
The following supplements the “Investment Restrictions” section of each portfolio’s Statement of Additional Information:
The Portfolio’s complete portfolio holdings as of the end of each calendar month are posted on www.scudder.com ordinarily on the 15th day of the following calendar month, or the first business day thereafter. This posted information generally remains accessible at least until the Portfolio files its Form N-CSR or N-Q with the Securities and Exchange Commission for the period that includes the date as of which the www.scudder.com information is current (expected to be at least three months). The Portfolio does not disseminate nonpublic information about portfolio holdings except in accordance with policies and procedures adopted by the Portfolio.
The Portfolio’s procedures permit nonpublic portfolio holdings information to be shared with affiliates of the advisor, subadvisors, custodians, independent registered public accounting firms, securities lending agents and other service providers to the Portfolio who require access to this information to fulfill their duties to the Portfolio, subject to the requirements described below. This information may also be disclosed to certain mutual fund analysts and rating and tracking agencies, such as Lipper, or other entities if the Portfolio has a legitimate business purpose in providing the information sooner than 16 days after month-end or on a more frequent basis, as applicable, subject to the requirements described below.
Prior to any disclosure of the Portfolio’s nonpublic portfolio holdings information to the foregoing types of entities or persons, a person authorized by the Portfolio’s Trustees must make a good faith determination in light of the facts then known that the Portfolio has a legitimate business purpose for providing the information, that the disclosure is in the best interest of the Portfolio, and that the recipient assents or otherwise has a duty to keep the information confidential and agrees not to disclose, trade or make any investment recommendation based on the information received. Periodic reports regarding these procedures will be provided to the Portfolio’s Trustees.
The third paragraph is deleted from the “Purchases and Redemptions” section in the Statement of Additional Information.
Please Retain This Supplement for Future Reference
February 9, 2005
Supplement to the currently effective Statement of Additional Information of each of the listed portfolios:
Scudder Variable Series II
| • | | Scudder Aggressive Growth Portfolio |
| • | | Scudder Blue Chip Portfolio |
| • | | Scudder Conservative Income Strategy Portfolio |
| • | | Scudder Fixed Income Portfolio |
| • | | Scudder Global Blue Chip Portfolio |
| • | | Scudder Government & Agency Securities Portfolio |
| • | | Scudder Growth Portfolio |
| • | | Scudder Growth & Income Strategy Portfolio |
| • | | Scudder Growth Strategy Portfolio |
| • | | Scudder High Income Portfolio |
| • | | Scudder Income & Growth Strategy Portfolio |
| • | | Scudder International Select Equity Portfolio |
| • | | Scudder Large Cap Value Portfolio |
| • | | Scudder Mercury Large Cap Core Portfolio |
| • | | Scudder Money Market Portfolio |
| • | | Scudder Small Cap Growth Portfolio |
| • | | Scudder Strategic Income Portfolio |
| • | | Scudder Technology Growth Portfolio |
| • | | Scudder Templeton Foreign Value Portfolio |
| • | | Scudder Total Return Portfolio |
| • | | SVS Davis Venture Value Portfolio |
| • | | SVS Dreman Financial Services Portfolio |
| • | | SVS Dreman High Return Equity Portfolio |
| • | | SVS Dreman Small Cap Value Portfolio |
| • | | SVS Eagle Focused Large Cap Growth Portfolio |
| • | | SVS Index 500 Portfolio |
| • | | SVS Janus Growth and Income Portfolio |
| • | | SVS Janus Growth Opportunities Portfolio |
| • | | SVS MFS Strategic Value Portfolio |
| • | | SVS Oak Strategic Equity Portfolio |
| • | | SVS Turner Mid Cap Growth Portfolio |
The following information replaces the disclosure in the portfolios’ Statements of Additional Information regarding the Advisor’s policies with respect to its selection of broker-dealers to execute the purchase and sale of the portfolios’ portfolio securities for the above-listed portfolios, the allocation of trades among the portfolios and the use of broker-dealers that are affiliated with the Advisor appearing under the caption: “Portfolio Transactions.” Other disclosure appearing under this caption, including the amount of brokerage commissions paid by a portfolio during the three most recent fiscal years, the amount of brokerage commissions directed for research during a portfolio’s most recent fiscal year, the amount of brokerage commissions paid to affiliated broker-dealers during a portfolio’s three most recent fiscal years and a portfolio’s holdings of securities issued by its regular brokers and dealers as of the end of the portfolio’s most recent fiscal year, is not affected by this supplement.
PORTFOLIO TRANSACTIONS
The Advisor is generally responsible for placing the orders for the purchase and sale of portfolio securities, including the allocation of brokerage. With respect to those portfolios for which a sub-investment advisor manages the portfolio’s investments, references in this section to the “Advisor” should be read to mean the Sub-Advisor.
The policy of the Advisor in placing orders for the purchase and sale of securities for the portfolios is to seek best execution, taking into account such factors, among others, as price; commission (where applicable); the broker-dealer’s ability to ensure that securities will be delivered on settlement date; the willingness of the broker-dealer to commit its capital and purchase a thinly traded security for its own inventory; whether the broker-dealer specializes in block orders or large program trades; the broker-dealer’s knowledge of the market and the security; the broker-dealer’s ability to maintain confidentiality; the financial condition of the broker-dealer; and whether the broker-dealer has the infrastructure and operational capabilities to execute and settle the trade. The Advisor seeks to evaluate the overall reasonableness of brokerage commissions with commissions charged on comparable transactions and compares the brokerage commissions (if any) paid by the portfolios to reported commissions paid by others. The Advisor routinely reviews commission rates, execution and settlement services performed and makes internal and external comparisons.
Commission rates on transactions in equity securities on U.S. securities exchanges are subject to negotiation. Commission rates on transactions in equity securities on foreign securities exchanges are generally fixed. Purchases and sales of fixed-income securities and other over-the-counter securities are effected on a net basis, without the payment of brokerage commissions. Transactions in fixed income and other over-the-counter
securities are generally placed by the Advisor with the principal market makers for these securities unless the Advisor reasonably believes more favorable results are available elsewhere. Transactions with dealers serving as market makers reflect the spread between the bid and asked prices. Purchases of underwritten issues will include an underwriting fee paid to the underwriter. Money market instruments are normally purchased in principal transactions directly from the issuer or from an underwriter or market maker.
It is likely that the broker-dealers selected based on the considerations described in this section will include firms that also sell shares of the portfolios to their customers. However, the Advisor does not consider sales of shares of the portfolios as a factor in the selection of broker-dealers to execute portfolio transactions for the portfolios and, accordingly, has implemented policies and procedures reasonably designed to prevent its traders from considering sales of shares of the portfolios as a factor in the selection of broker-dealers to execute portfolio transactions for the portfolios.
The Advisor is permitted by Section 28(e) of the Securities Exchange Act of 1934, as amended (“1934 Act”), when placing portfolio transactions for a portfolio, to cause the portfolio to pay brokerage commissions in excess of that which another broker-dealer might charge for executing the same transaction in order to obtain research and brokerage services. The Advisor, however, does not as a matter of policy execute transactions with broker-dealers for the portfolio in order to obtain research from such broker-dealers that is prepared by third parties (i.e., “third party research”). However, the Advisor may from time to time, in reliance on Section 28(e) of the 1934 Act, obtain proprietary research prepared by the executing broker-dealer in connection with a transaction or transactions through that broker-dealer (i.e., “proprietary research”). Consistent with the Advisor’s policy regarding best execution, where more than one broker is believed to be capable of providing best execution for a particular trade, the Advisor may take into consideration the receipt of proprietary research in selecting the broker-dealer to execute the trade. Proprietary research provided by broker-dealers may include, but is not limited to, information on the economy, industries, groups of securities, individual companies, statistical information, accounting and tax law interpretations, political developments, legal developments affecting portfolio securities, technical market action, pricing and appraisal services, credit analysis, risk measurement analysis, performance analysis and measurement and analysis of corporate responsibility issues. Proprietary research is typically received in the form of written reports, telephone contacts and personal meetings with security analysts, but may also be provided in the form of access to various computer software and associated hardware, and meetings arranged with corporate and industry representatives.
In reliance on Section 28(e) of the 1934 Act, the Advisor may also select broker-dealers and obtain from them brokerage services in the form of software and/or hardware that is used in connection with executing trades. Typically, this computer software and/or hardware is used by the Advisor to facilitate trading activity with those broker-dealers.
Proprietary research and brokerage services received from a broker-dealer chosen to execute a particular trade may be useful to the Advisor in providing services to clients other than the portfolio making the trade, and not all such information is used by the Advisor in connection with such portfolio. Conversely, such information provided to the Advisor by broker-dealers through which other clients of the Advisor effect securities transactions may be useful to the Advisor in providing services to the portfolio.
The Advisor will monitor regulatory developments and market practice in the use of client commissions to obtain research and brokerage services, whether proprietary or third party.
Investment decisions for each portfolio and for other investment accounts managed by the Advisor are made independently of each other in light of differing conditions. However, the same investment decision may be made for two or more of such accounts. In such cases, simultaneous transactions are inevitable. To the extent permitted by law, the Advisor may aggregate the securities to be sold or purchased for a portfolio with those to be sold or purchased for other accounts in executing transactions. Purchases or sales are then averaged as to price and commission and allocated as to amount in a manner deemed equitable to each account. While in some cases this practice could have a detrimental effect on the price paid or received by, or on the size of the position obtained or
2
disposed of for, the portfolio, in other cases it is believed that the ability to engage in volume transactions will be beneficial to the portfolio.
Deutsche Bank AG or one of its affiliates (or in the case of a sub-adviser, the sub-adviser or one of its affiliates) may act as a broker for the portfolios and receive brokerage commissions or other transaction-related compensation from the funds in the purchase and sale of securities, options or futures contracts when, in the judgment of the Advisor, and in accordance with procedures approved by the portfolios’ Boards, the affiliated broker will be able to obtain a price and execution at least as favorable as those obtained from other qualified brokers and if, in the transaction, the affiliated broker charges the portfolio a rate consistent with that charged to comparable unaffiliated customers in similar transactions.
Please Retain This Supplement for Future Reference
February 9, 2005
3
Scudder Variable Series II:
Scudder Aggressive Growth Portfolio
Scudder Blue Chip Portfolio
Scudder Large Cap Value Portfolio
Scudder Fixed Income Portfolio
Scudder Global Blue Chip Portfolio
Scudder Government & Agency Securities Portfolio
Scudder Growth Portfolio
Scudder High Income Portfolio
Scudder International Select Equity Portfolio
Scudder Money Market Portfolio
Scudder Small Cap Growth Portfolio
Scudder Strategic Income Portfolio
Scudder Technology Growth Portfolio
Scudder Total Return Portfolio
SVS Davis Venture Value Portfolio
SVS Dreman Financial Services Portfolio
SVS Dreman High Return Equity Portfolio
SVS Dreman Small Cap Value Portfolio
SVS Eagle Focused Large Cap Growth Portfolio
SVS Focus Value+Growth Portfolio
SVS Index 500 Portfolio
SVS INVESCO Dynamic Growth Portfolio
SVS Janus Growth & Income Portfolio
SVS Janus Growth Opportunities Portfolio
SVS MFS Strategic Value Portfolio
SVS Oak Strategic Equity Portfolio
SVS Turner Mid Cap Growth Portfolio
Scudder Templeton Foreign Value Portfolio
The following supplements information presented in the Portfolios Statement of Additional Information under the heading “Investment Restrictions”:
Each of the above Portfolios will not acquire securities of registered, open-end investment companies or registered unit investment trusts in reliance on Sections 12(d)(1)(F) or 12(d)(1)(G) of the Investment Company Act of 1940, as amended.
December 22, 2004
S-38
November 22, 2004
SVS2-36XX
Supplement to the currently effective Statement of Additional Information for the following Portfolio:
Scudder Variable Series II - Total Return Portfolio
The following supplements the disclosure in the “Investment and Restrictions” section of the Portfolio’s currently effective SAI:
The Portfolio may also invest up to 15% of its total assets in credit default swaps. Credit default swaps are used as a means of “buying” credit protection, i.e., attempting to mitigate the risk of default or credit quality deterioration in some portion of the Portfolio’s holdings, or “selling” credit protection, i.e., attempting to gain exposure to an underlying issuer’s credit quality characteristics without directly investing in that issuer. No more than 5% of the Portfolio’s assets may be invested in credit default swaps for the purposes of buying credit protection. The Portfolio will only sell credit protection with respect to securities in which it would be authorized to invest directly. The Portfolio may also borrow up to 5% of the Portfolio’s net assets against called and tendered bonds in the Portfolio. For the risks associated with borrowing, please see the “Borrowing” subsection of the “Investment Restrictions” section of the SAI.
The following supplements the disclosure in the “Investment Policies and Techniques” section of the Portfolio’s currently effective SAI:
Bank Loans. The Portfolio may invest in bank loans, which are typically senior debt obligations of borrowers (issuers) and as such, are considered to hold a senior position in the capital structure of the borrower. These may include loans which hold the most senior position, that hold an equal ranking with other senior debt, or loans that are, in the judgment of the Advisor, in the category of senior debt of the borrower. This capital structure position generally gives the holders of these loans a priority claim on some or all of the borrower’s assets in the event of a default. In most cases, these loans are either partially or fully collateralized by the assets of a corporation, partnership, limited liability company or other business entity, or by cash flow that the Advisor believes has a market value at the time of acquisition that equals or exceeds the principal amount of the loan. These loans are often issued in connection with recapitalizations, acquisitions, leveraged buy-outs and refinancings. It is important to note that Moody’s and S&P generally rate bank loans a notch or two higher than high yield bonds of the same issuer to reflect their more senior position. The Portfolio may invest in both fixed- and floating-rate loans. In addition, bank loans can trade either as an “assignment” or “participation.” When the Portfolio buys an assignment, it is essentially becoming a party to the bank agreement. The vast majority of all trades are assignments and would therefore generally represent the preponderance of bank loans held by the Portfolio. In certain cases, the Portfolio may buy bank loans on a participation basis, if for example, the Portfolio did not want to become party to the bank agreement. However, in all cases, the Portfolio will not purchase bank loans where Deutsche Bank, or an affiliate, serves as an agent bank.
Participations and assignments involve credit risk, interest rate risk, liquidity risk, and the risk of being a lender. If the Portfolio purchases a participation, it may only be able to enforce its rights through the lender, and may assume the credit risk of both the lender and the borrower.
Investments in loans through direct assignment of a financial institution’s interests with respect to a loan may involve additional risks. For example, if a loan is foreclosed, the purchaser could become part owner of any collateral, and would bear the costs and liabilities associated with owning and disposing of the collateral. In addition, it is at least conceivable that under emerging legal theories of lender liability, a purchaser could be held liable as a co-lender.
In the case of loans administered by a bank or other financial institution that acts as agent for all holders, if assets held by the agent for the benefit of a purchaser are determined to be subject to the claims of the
S-34
agent’s general creditors, the purchaser might incur certain costs and delays in realizing payment on the loan or loan participation and could suffer a loss of principal or interest.
In the case of loan participations where a bank or other lending institution serves as financial intermediary between a fund and the borrower, if the participation does not shift to the portfolio the direct debtor-creditor relationship with the borrower, SEC interpretations require the portfolio, in some circumstances, to treat both the lending bank or other lending institution and the borrower as issuers for purposes of the Portfolio’s investment policies. Treating a financial intermediary as an issuer of indebtedness may restrict the Portfolio’s ability to invest in indebtedness related to a single financial intermediary, or a group of intermediaries engaged in the same industry, even if the underlying borrowers represent many different companies and industries.
Sovereign Debt. Investment in sovereign debt can involve a high degree of risk. The governmental entity that controls the repayment of sovereign debt may not be able or willing to repay the principal and/or interest when due in accordance with the terms of such debt. A governmental entity’s willingness or ability to repay principal and interest due in a timely manner may be affected by, among other factors, its cash flow situation, the extent of its foreign reserves, the availability of sufficient foreign exchange on the date a payment is due, the relative size of the debt service burden to the economy as a whole, the governmental entity’s policy toward the International Monetary Fund, and the political constraints to which a governmental entity may be subject. Governmental entities may also be dependent on expected disbursements from foreign governments, multilateral agencies and others abroad to reduce principal and interest arrearages on their debt. The commitment on the part of these governments, agencies and others to make such disbursements may be conditioned on a governmental entity’s implementation of economic reforms and/or economic performance and the timely service of such debtor’s obligations. Failure to implement such reforms, achieve such levels of economic performance or repay principal or interest when due may result in the cancellation of such third parties commitments to lend funds to the governmental entity, which may further impair such debtor’s ability or willingness to service its debts in a timely manner. Consequently, governmental entities may default on their sovereign debt. Holders of sovereign debt may be requested to participate in the rescheduling of such debt and to extend further loans to governmental entities. There is no bankruptcy proceeding by which sovereign debt on which governmental entities have defaulted may be collected in whole or in part.
Variable Rate Securities. The Portfolio, may invest in Variable Rate Securities, instruments having rates of interest that are adjusted periodically or that “float” continuously according to formulae intended to minimize fluctuation in values of the instruments. The interest rate of Variable Rate Securities ordinarily is determined by reference to or is a percentage of an objective standard such as a bank’s prime rate, the 90-day US Treasury Bill rate, or the rate of return on commercial paper or bank certificates of deposit. Generally, the changes in the interest rate on Variable Rate Securities reduce the fluctuation in the market value of such securities. Accordingly, as interest rates decrease or increase, the potential for capital appreciation or depreciation is less than for fixed-rate obligations. Some Variable Rate Demand Securities (“Variable Rate Demand Securities”) have a demand feature entitling the purchaser to resell the securities at an amount approximately equal to amortized cost or the principal amount thereof plus accrued interest. As is the case for other Variable Rate Securities, the interest rate on Variable Rate Demand Securities varies according to some objective standard intended to minimize fluctuation in the values of the instruments. The Portfolio determines the maturity of Variable Rate Securities in accordance with Rule 2a-7, which allows the Portfolio to consider certain of such instruments as having maturities shorter than the maturity date on the face of the instrument.
The following replaces related disclosure in the “Swaps, Caps, Floors and Collars” subsection of the “Investment Policies and Techniques” section of the Portfolio’s currently effective SAI:
Among the Strategic Transactions into which the Portfolio may enter are currency, and other types of swaps and the purchase or sale of related caps, floors and collars. The Portfolio expects to enter into these transactions primarily to preserve a return or spread on a particular investment or portion of its portfolio, to protect against currency fluctuations, as a duration management technique or to protect against any increase in the price of securities the Portfolio anticipates purchasing at a later date. The Portfolio will not sell
S-35
interest rate caps or floors where it does not own securities or other instruments providing the income stream the Portfolio may be obligated to pay. Interest rate swaps involve the exchange by the Portfolio with another party of their respective commitments to pay or receive interest, e.g., an exchange of floating rate payments for fixed rate payments with respect to a notional amount of principal. A currency swap is an agreement to exchange cash flows on a notional amount of two or more currencies based on the relative value differential among them and an index swap is an agreement to swap cash flows on a notional amount based on changes in the values of the reference indices. The purchase of a cap entitles the purchaser to receive payments on a notional principal amount from the party selling such cap to the extent that a specified index exceeds a predetermined interest rate or amount. The purchase of a floor entitles the purchaser to receive payments on a notional principal amount from the party selling such floor to the extent that a specified index falls below a predetermined interest rate or amount. A collar is a combination of a cap and a floor that preserves a certain return within a predetermined range of interest rates or values. A credit default swap is a contract between a buyer and a seller of protection against a pre-defined credit event. The buyer of protection pays the seller a fixed, regular fee. The seller of protection provides the buyer with a contingent exchange that occurs upon a credit event.
Swaps have special risks associated including possible default by the counterparty to the transaction, illiquidity and, where swaps are used for hedges, the risk that the use of a swap could result in losses greater than if the swap had not been employed. Whether the use of swap agreements will be successful in furthering its investment objective will depend on the Advisor’s ability to correctly predict whether certain types of investments are likely to produce greater returns than other investments. Certain swap agreements may be considered to be illiquid because they are two party contracts and because they may have terms of greater than seven days. Moreover, the Portfolio bears the risk of loss of the amount expected to be received under a swap agreement in the event of the default or bankruptcy of a swap agreement counterparty.
Subadvisor. Effective November 2004, Deutsche Asset Management Investment Services Limited (“DeAMIS”), One Appold Street, London, England, an affiliate of the Advisor, is the subadvisor for a portion of the assets of Scudder Total Return Portfolio. DeAMIS serves as sub-advisor pursuant to the terms of a Subadvisory Agreement between it and the Advisor.
Under the terms of the Subadvisory Agreement, DeAMIS manages the investment and reinvestment of a portion of the Portfolio’s portfolio and will provide such investment advice, research and assistance as the Advisor may, from time to time, reasonably request.
The Advisor pays DeAMIS for its services a subadvisory fee, payable monthly, at the annual rate of 0.50% of the Portfolio’s average daily net assets for assets allocated to DeAMIS.
The Subadvisory Agreement provides that DeAMIS will not be liable for any error of judgment or mistake of law or for any loss suffered by the Portfolio in connection with matters to which the Subadvisory Agreement relates, except a loss resulting from willful misconduct, bad faith or gross negligence on the part of DeAMIS in the performance of its duties or from reckless disregard by DeAMIS of its obligations and duties under the Subadvisory Agreement.
The Subadvisory Agreement remains in effect until September 30, 2005 unless sooner terminated or not annually approved as described below. Notwithstanding the foregoing, the Subadvisory Agreement shall continue in effect until September 30, 2005 and year to year thereafter, but only as long as such continuance is specifically approved at least annually (a) by a majority of the Trustees of the Trust who are not parties to such agreement or interested persons of any such party except in their capacity as Trustees of the Trust, or (b) by the shareholders or the Board of Trustees of the Trust. The Subadvisory Agreement may be terminated at any time upon 60 days’ notice by the Advisor or by the Board of Trustees of the Trust or by majority vote of the outstanding shares of the Portfolio, and will terminate automatically upon assignment or upon termination of the Portfolio’s investment management agreement.
S-36
Please Retain This Supplement for Future Reference
November 22, 2004
S-37
Supplement to the currently effective Statement of Additional Information of each of the listed funds:
Cash Account Trust
| | • | | Government & Agency Securities Portfolio |
Cash Equivalent Fund
| | • | | Government & Agency Securities Portfolio |
Cash Reserve Fund, Inc.
Investors Cash Trust
| | • | | Government & Agency Securities Portfolio |
Investors Municipal Cash Fund
| | • | | Investors Florida Municipal Cash Fund |
| | • | | Investors Michigan Municipal Cash Fund |
| | • | | Investors New Jersey Municipal Cash Fund |
| | • | | Investors Pennsylvania Municipal Cash Fund |
| | • | | Tax-Exempt New York Money Market Fund |
Scudder 21st Century Growth Fund
Scudder Aggressive Growth Fund
Scudder Advisor Funds
| | • | | New York Tax Free Money |
| | • | | PreservationPlus Income Fund |
Scudder Advisor Funds III
Scudder Balanced Fund
Scudder Blue Chip Fund
Scudder California Tax-Free Income Fund
Scudder Capital Growth Fund
Scudder Cash Investment Trust
Scudder Cash Reserves Fund
Scudder-Dreman Financial Services Fund
Scudder-Dreman High Return Equity Fund
Scudder Dreman-Small Cap Value Fund
Scudder Development Fund
Scudder Dynamic Growth Fund
Scudder EAFE Equity Index Fund
Scudder Emerging Markets Debt Fund
Scudder Emerging Markets Growth Fund
Scudder Emerging Markets Income Fund
Scudder Fixed Income Fund
Scudder Flag Investors Communications Fund
Scudder Flag Investors Equity Partners Fund
Scudder Flag Investors Value Builder Fund
Scudder Florida Tax-Free Income Fund
Scudder Focus Value Plus Growth Fund
Scudder Global Biotechnology Fund
Scudder Global Bond Fund
Scudder Global Discovery Fund
Scudder Global Fund
Scudder GNMA Fund
Scudder Gold and Precious Metals Fund
Scudder Greater Europe Growth Fund
Scudder Growth Fund
Scudder Growth & Income Fund
Scudder Health Care Fund
Scudder High Income Fund
Scudder High Income Plus Fund
Scudder High Income Opportunity Fund
Scudder High Yield Tax-Free Fund
Scudder Income Fund
Scudder Institutional Funds
| | • | | Scudder International Equity Fund |
| | • | | Scudder Equity 500 Index Fund |
Scudder Intermediate Tax/AMT Free Fund
Scudder International Equity Fund
Scudder International Fund
Scudder International Select Equity Fund
Scudder Japanese Equity Fund
Scudder Large Cap Value Fund
Scudder Large Company Growth Fund
Scudder Large Company Value Fund
Scudder Latin America Fund
Scudder Lifecycle Long Range Fund
Scudder Lifecycle Mid Range Fund
Scudder Lifecycle Short Range Fund
Scudder Managed Municipal Bond Fund
Scudder Massachusetts Tax-Free Fund
Scudder Mid Cap Growth Fund
Scudder Micro Cap Fund
Scudder Money Funds
| | • | | Scudder Government & Agency Money Fund |
| | • | | Scudder Money Market Fund |
| | • | | Scudder Tax-Exempt Money Fund |
Scudder Money Market Series
Scudder Municipal Bond Fund
Scudder New Europe Fund
Scudder New York Tax-Free Income Fund
Scudder Pacific Opportunities Fund
Scudder Pathway Series: Conservative Portfolio
Scudder Pathway Series: Growth Portfolio
Scudder Pathway Series: Moderate Portfolio
Scudder Retirement Fund — Series V
Scudder Retirement Fund — Series VI
Scudder Retirement Fund — Series VII
Scudder RREEF Real Estate Securities Fund
Scudder S&P 500 Index Fund
Scudder S&P 500 Stock Fund
Scudder Select 500 Fund
Scudder Short Duration Fund
Scudder Short-Term Bond Fund
Scudder Short-Term Municipal Bond Fund
Scudder Small Cap Growth Fund
Scudder Small Company Stock Fund
Scudder Small Company Value Fund
Scudder Strategic Income Fund
Scudder Target 2010 Fund
Scudder Target 2011 Fund
Scudder Target 2012 Fund
Scudder Target 2013 Fund
Scudder Tax Advantaged Dividend Fund
Scudder Tax-Free Money Fund
Scudder Technology Fund
Scudder Technology Innovation Fund
Scudder Total Return Bond Fund
Scudder Total Return Fund
Scudder US Bond Index Fund
Scudder US Government Securities Fund
Scudder U.S. Treasury Money Fund
Scudder Worldwide 2004 Fund
S-41
Scudder Yieldwise Funds
| | • | | Scudder Yieldwise Government & Agency Money Fund |
| | • | | Scudder Yieldwise Money Fund |
| | • | | Scudder Yieldwise Municipal Money Fund |
Scudder Investments VIT Funds
| | • | | Scudder EAFE Equity Index Fund |
| | • | | Scudder Equity 500 Index Fund |
| | • | | Scudder Real Estate Securities Portfolio |
| | • | | Scudder Small Cap Index Fund |
Scudder Variable Series I
| | • | | Scudder Balanced Portfolio |
| | • | | Scudder Growth and Income Portfolio |
| | • | | Scudder Capital Growth Portfolio |
| | • | | Scudder 21st Century Growth Portfolio |
| | • | | Scudder Global Discovery Portfolio |
| | • | | Scudder International Portfolio |
| | • | | Scudder Health Sciences Portfolio |
Scudder Variable Series II
| | • | | Scudder Aggressive Growth Portfolio |
| | • | | Scudder Blue Chip Portfolio |
| | • | | Scudder Conservative Income Strategy Portfolio |
| | • | | Scudder Growth and Income Strategy Portfolio |
| | • | | Scudder Growth Strategy Portfolio |
| | • | | Scudder Income and Growth Strategy Portfolio |
| | • | | Scudder Large Cap Value Portfolio |
| | • | | SVS Davis Venture Value Portfolio |
| | • | | SVS Dreman Financial Services Portfolio |
| | • | | SVS Dreman High Return Equity Portfolio |
| | • | | SVS Dreman Small Cap Value Portfolio |
| | • | | SVS Eagle Focused Large Cap Growth Portfolio |
| | • | | SVS Focus Value+Growth Portfolio |
| | • | | SVS Index 500 Portfolio |
| | • | | SVS Invesco Dynamic Growth Portfolio |
| | • | | SVS Janus Growth and Income Portfolio |
| | • | | SVS Janus Growth Opportunities Portfolio |
| | • | | SVS MFS Strategic Value Portfolio |
| | • | | SVS Turner Mid Cap Growth Portfolio |
| | • | | SVS Oak Strategic Equity Portfolio |
| | • | | Scudder Fixed Income Portfolio |
| | • | | Scudder Global Blue Chip Portfolio |
| | • | | Scudder Government & Agency Securities Portfolio |
| | • | | Scudder Growth Portfolio |
| | • | | Scudder High Income Portfolio |
| | • | | Scudder International Select Equity Portfolio |
| | • | | Scudder Money Market Portfolio |
| | • | | Scudder Small Cap Growth Portfolio |
| | • | | Scudder Strategic Income Portfolio |
| | • | | Scudder Technology Growth Portfolio |
| | • | | Scudder Total Return Portfolio |
Tax-Exempt California Money Market Fund
The following paragraph supplements the “Directors/Trustees and Officers” section of each Fund’s Statement of Additional Information:
Agreement to Indemnify Independent Directors/Trustees for Certain Expenses
In connection with litigation or regulatory action related to possible improper market timing or other improper trading activity or possible improper marketing and sales activity in the Funds, each Fund’s investment advisor has agreed, subject to applicable law and regulation, to indemnify and hold harmless the applicable Funds against any and all loss, damage, liability and expense, arising from market timing or marketing and sales matters alleged in any enforcement actions brought by governmental authorities involving or potentially affecting the Funds or the investment advisor (“Enforcement Actions”) or that are the basis for private actions brought by shareholders of the Funds against the Funds, their directors and officers, the Funds’ investment advisor and/or certain other parties (“Private Litigation”), or any proceedings or actions that may be threatened or commenced in the future by any person (including governmental authorities), arising from or similar to the matters alleged in the Enforcement Actions or Private Litigation. In recognition of its undertaking to indemnify the applicable Funds and in light of the rebuttable presumption generally afforded to independent directors/trustees of investment companies that they have not engaged in disabling conduct, each Fund’s investment advisor has also agreed, subject to applicable law and regulation, to indemnify the applicable Funds’ Independent Trustees against certain liabilities the Independent Trustees may incur from the matters alleged in any Enforcement Actions or Private Litigation or arising from or similar to the matters alleged in the Enforcement Actions or Private Litigation, and advance expenses that may be incurred by the Independent Trustees in connection with any Enforcement Actions or Private Litigation. The applicable investment advisor is not, however, required to provide indemnification and advancement of expenses: (1) with respect to any proceeding or action with respect to which the applicable Fund’s Board determines that the Independent Trustee ultimately would not be entitled to indemnification or (2) for any liability of the Independent Trustee to the Funds or their shareholders to which the Independent Trustee would otherwise be subject by reason of willful misfeasance, bad faith, gross negligence or reckless disregard of the Independent Trustee’s duties as a director or trustee of the Funds as determined in a final adjudication in such action or proceeding. The estimated amount of any expenses that may be advanced to the Independent Trustees or indemnity that may be payable under the indemnity agreements is currently unknown. These agreements by each Fund’s
S-42
investment advisor will survive the termination of the investment management agreements between the applicable investment advisor and the Funds.
PLEASE RETAIN THIS SUPPLEMENT FOR FUTURE REFERENCE
October 20, 2004
S-43
Supplement to the currently effective Statement of Additional Information of each of the listed funds:
Cash Account Trust
| | • | | Government & Agency Securities Portfolio |
Cash Equivalent Fund
| | • | | Government & Agency Securities Portfolio |
Cash Reserve Fund, Inc.
Investors Cash Trust
| | • | | Government & Agency Securities Portfolio |
Investors Municipal Cash Fund
| | • | | Investors Florida Municipal Cash Fund |
| | • | | Investors Michigan Municipal Cash Fund |
| | • | | Investors New Jersey Municipal Cash Fund |
| | • | | Investors Pennsylvania Municipal Cash Fund |
| | • | | Tax-Exempt New York Money Market Fund |
Scudder 21st Century Growth Fund
Scudder Aggressive Growth Fund
Scudder Advisor Funds
| | • | | New York Tax Free Money |
| | • | | PreservationPlus Income Fund |
Scudder Advisor Funds III
Scudder Balanced Fund
Scudder Blue Chip Fund
Scudder California Tax-Free Income Fund
Scudder Capital Growth Fund
Scudder Cash Reserves Fund
Scudder-Dreman Financial Services Fund
Scudder-Dreman High Return Equity Fund
Scudder Dreman-Small Cap Value Fund
Scudder Development Fund
Scudder Dynamic Growth Fund
Scudder EAFE Equity Index Fund
Scudder Emerging Markets Debt Fund
Scudder Emerging Markets Growth Fund
Scudder Emerging Markets Income Fund
Scudder Fixed Income Fund
Scudder Flag Investors Communications Fund
Scudder Flag Investors Equity Partners Fund
Scudder Flag Investors Value Builder Fund
Scudder Florida Tax-Free Income Fund
Scudder Focus Value Plus Growth Fund
Scudder Global Bond Fund
Scudder Global Discovery Fund
Scudder Global Fund
Scudder GNMA Fund
Scudder Gold and Precious Metals Fund
Scudder Greater Europe Growth Fund
Scudder Growth Fund
Scudder Growth & Income Fund
Scudder High Income Fund
Scudder High Income Plus Fund
Scudder High Income Opportunity Fund
Scudder Income Fund
Scudder Institutional Funds
| | • | | Scudder International Equity Fund |
| | • | | Scudder Equity 500 Index Fund |
Scudder International Equity Fund
Scudder International Fund
Scudder International Select Equity Fund
Scudder Japanese Equity Fund
Scudder Large Cap Value Fund
Scudder Large Company Growth Fund
Scudder Large Company Value Fund
Scudder Latin America Fund
Scudder Lifecycle Long Range Fund
Scudder Lifecycle Mid Range Fund
Scudder Lifecycle Short Range Fund
Scudder Massachusetts Tax-Free Fund
Scudder Mid Cap Fund
Scudder Micro Cap Fund
Scudder Money Funds
| | • | | Scudder Government & Agency Money Fund |
| | • | | Scudder Money Market Fund |
| | • | | Scudder Tax-Exempt Money Fund |
Scudder Municipal Bond Fund
Scudder New Europe Fund
Scudder New York Tax-Free Income Fund
Scudder Pacific Opportunities Fund
Scudder Pathway Series: Conservative Portfolio
Scudder Pathway Series: Growth Portfolio
Scudder Pathway Series: Moderate Portfolio
Scudder Retirement Fund — Series V
Scudder Retirement Fund — Series VI
Scudder Retirement Fund — Series VII
Scudder RREEF Real Estate Securities Fund
Scudder S&P 500 Index Fund
Scudder S&P 500 Stock Fund
Scudder Select 500 Fund
Scudder Short Duration Fund
Scudder Short-Term Bond Fund
Scudder Short-Term Municipal Bond Fund
Scudder Small Cap Growth Fund
Scudder Small Company Stock Fund
Scudder Small Company Value Fund
Scudder Strategic Income Fund
Scudder Target 2010 Fund
Scudder Target 2011 Fund
Scudder Target 2012 Fund
Scudder Target 2013 Fund
Scudder Tax Advantaged Dividend Fund
Scudder Total Return Bond Fund
Scudder Total Return Fund
Scudder US Bond Index Fund
Scudder US Government Securities Fund
Scudder Worldwide 2004 Fund
Scudder Yieldwise Funds
| | • | | Scudder Yieldwise Government & Agency Money Fund |
| | • | | Scudder Yieldwise Money Fund |
| | • | | Scudder Yieldwise Municipal Money Fund |
Scudder Investments VIT Funds
| | • | | Scudder EAFE Equity Index Fund |
| | • | | Scudder Equity 500 Index Fund |
| | • | | Scudder Real Estate Securities Portfolio |
| | • | | Scudder Small Cap Index Fund |
Scudder Variable Series I
| | • | | Scudder Balanced Portfolio |
| | • | | Scudder Growth and Income Portfolio |
S-39
| | • | | Scudder Capital Growth Portfolio |
| | • | | Scudder 21st Century Growth Portfolio |
| | • | | Scudder Global Discovery Portfolio |
| | • | | Scudder International Portfolio |
| | • | | Scudder Health Sciences Portfolio |
Scudder Variable Series II
| | • | | Scudder Aggressive Growth Portfolio |
| | • | | Scudder Blue Chip Portfolio |
| | • | | Scudder Large Cap Value Portfolio |
| | • | | SVS Davis Venture Value Portfolio |
| | • | | SVS Dreman Financial Services Portfolio |
| | • | | SVS Dreman High Return Equity Portfolio |
| | • | | SVS Dreman Small Cap Value Portfolio |
| | • | | SVS Eagle Focused Large Cap Growth Portfolio |
| | • | | SVS Focus Value+Growth Portfolio |
| | • | | SVS Index 500 Portfolio |
| | • | | SVS Invesco Dynamic Growth Portfolio |
| | • | | SVS Janus Growth and Income Portfolio |
| | • | | SVS Janus Growth Opportunities Portfolio |
| | • | | SVS MFS Strategic Value Portfolio |
| | • | | SVS Turner Mid Cap Growth Portfolio |
| | • | | SVS Oak Strategic Equity Portfolio |
| | • | | Scudder Fixed Income Portfolio |
| | • | | Scudder Global Blue Chip Portfolio |
| | • | | Scudder Government & Agency Securities Portfolio |
| | • | | Scudder Growth Portfolio |
| | • | | Scudder High Income Portfolio |
| | • | | Scudder International Select Equity Portfolio |
| | • | | Scudder Money Market Portfolio |
| | • | | Scudder Small Cap Growth Portfolio |
| | • | | Scudder Strategic Income Portfolio |
| | • | | Scudder Technology Growth Portfolio |
| | • | | Scudder Total Return Portfolio |
Tax-Exempt California Money Market Fund
The following information is added to or amends each Fund’s Statement of Additional Information:
You may obtain information about how a fund voted proxies related to its portfolio securities during the 12-month period ended June 30 by visiting the Securities and Exchange Commission’s Web site at www.sec.gov or by visiting our Web site at: aarp.scudder.com for Class AARP shares, myscudder.com for Class S shares, or scudder.com for all other classes (type “proxy voting” in the search field).
PLEASE RETAIN THIS SUPPLEMENT FOR FUTURE REFERENCE
September 27, 2004
S-40
STATEMENT OF ADDITIONAL INFORMATION
May 1, 2004
CLASS A AND B SHARES
SCUDDER VARIABLE SERIES II
222 South Riverside Plaza, Chicago, Illinois 60606
1-800-778-1482
This combined Statement of Additional Information is not a prospectus. It should be read in conjunction with the applicable prospectuses of Scudder Variable Series II (the “Fund”) dated May 1, 2004, as amended from time to time. The prospectuses may be obtained without charge from the Fund by calling the toll-free number listed above, and are also available along with other related materials on the Securities and Exchange Commission Internet web site (http://www.sec.gov). The prospectuses are also available from Participating Insurance Companies.
Scudder Variable Series II offers a choice of 31 portfolios (each a “Portfolio,” collectively, the “Portfolios”), 27 of which are offered herein, to holders of certain variable life insurance and variable annuity contracts offered by participating insurance companies.
The Portfolios offered herein are:
Scudder Aggressive Growth Portfolio
Scudder Blue Chip Portfolio
Scudder Fixed Income Portfolio
Scudder Global Blue Chip Portfolio
Scudder Government & Agency Securities Portfolio (formerly, Scudder Government Securities Portfolio)
Scudder Growth Portfolio
Scudder High Income Portfolio
Scudder International Select Equity Portfolio
Scudder Large Cap Value Portfolio (formerly, Scudder Contrarian Value Portfolio)
Scudder Money Market Portfolio
Scudder Small Cap Growth Portfolio
Scudder Strategic Income Portfolio
Scudder Technology Growth Portfolio
Scudder Total Return Portfolio
SVS Davis Venture Value Portfolio
SVS Dreman Financial Services Portfolio
SVS Dreman High Return Equity Portfolio
SVS Dreman Small Cap Value Portfolio
SVS Eagle Focused Large Cap Growth Portfolio
SVS Focus Value+Growth Portfolio
SVS Index 500 Portfolio
SVS INVESCO Dynamic Growth Portfolio
SVS Janus Growth And Income Portfolio
SVS Janus Growth Opportunities Portfolio
SVS MFS Strategic Value Portfolio
SVS Oak Strategic Equity Portfolio
SVS Turner Mid Cap Growth Portfolio
S-44
TABLE OF CONTENTS
S-45
INVESTMENT RESTRICTIONS
Except as otherwise indicated, each Portfolio’s investment objective and policies are not fundamental and may be changed without a vote of shareholders. There can be no assurance that a Portfolio’s objective will be met.
If a percentage restriction is adhered to at the time of the investment, a later increase or decrease in percentage beyond the specified limit resulting from a change in values or net assets will not be considered a violation.
The Fund has adopted for each Portfolio certain fundamental investment restrictions that cannot be changed for a Portfolio without approval by a “majority” of the outstanding voting shares of that Portfolio. As defined in the Investment Company Act of 1940, as amended (the “1940 Act”), this means the lesser of the vote of (a) 67% of the shares of a Portfolio present at a meeting where more than 50% of the outstanding shares are present in person or by proxy or (b) more than 50% of the outstanding shares of a Portfolio.
Each Portfolio (except SVS Focus Value+Growth Portfolio, SVS Dreman Financial Services Portfolio, Scudder Aggressive Growth Portfolio and Scudder Technology Growth Portfolio) is classified as a diversified open-end management investment company. A diversified portfolio may not, with respect to 75% of total assets, invest more than 5% of total assets in the securities of a single issuer or invest in more than 10% of the outstanding voting securities of such issuer.
SVS Focus Value+Growth Portfolio, SVS Dreman Financial Services Portfolio, Scudder Aggressive Growth Portfolio and Scudder Technology Growth Portfolio are classified as non-diversified open-end management investment companies. A non-diversified portfolio may invest a greater proportion of its assets in the obligations of a small number of issuers, and may be subject to greater risk and substantial losses as a result of changes in the financial condition or the market’s assessment of the issuers. While not limited by the 1940 Act as to the proportion of its assets that it may invest in obligations of a single issuer, each of the foregoing Portfolios intends to comply with the diversification requirements imposed by the Internal Revenue Code of 1986 (the “Code”) for qualification as a regulated investment company.
Each Portfolio may not, as a fundamental policy:
| (1) | borrow money, except as permitted under the 1940 Act, and as interpreted or modified by regulatory authority having jurisdiction, from time to time; |
| (2) | issue senior securities, except as permitted under the 1940 Act, and as interpreted or modified by regulatory authority having jurisdiction, from time to time; |
| (3) | for all Portfolios except Scudder Money Market Portfolio and Scudder Technology Growth Portfolio: concentrate its investments in a particular industry, as that term is used in the 1940 Act, and as interpreted or modified by regulatory authority having jurisdiction, from time to time; |
for Scudder Money Market Portfolio: concentrate its investments in a particular industry, as that term is used in the 1940 Act, and as interpreted or modified by regulatory authority having jurisdiction, from time to time, except that the Portfolio reserves the freedom of action to concentrate in government securities and instruments issued by domestic banks.
for Scudder Technology Growth Portfolio: concentrate its investments in a particular industry, as that term is used in the 1940 Act, and as interpreted or modified by regulatory authority having jurisdiction, from time to time, except that the Portfolio will concentrate its assets in the group of industries constituting the technology sector and may concentrate in one or more industries in the technology sector.
| (4) | engage in the business of underwriting securities issued by others, except to the extent that the Portfolio may be deemed to be an underwriter in connection with the disposition of portfolio securities; |
S-46
| (5) | purchase or sell real estate, which term does not include securities of companies which deal in real estate or mortgages or investments secured by real estate or interests therein, except that the Portfolio reserves freedom of action to hold and to sell real estate acquired as a result of the Portfolio’s ownership of securities; |
| (6) | purchase physical commodities or contracts relating to physical commodities; or |
| (7) | make loans except as permitted under the 1940 Act, as amended, and as interpreted or modified by regulatory authority having jurisdiction, from time to time. |
With regard to Restriction (3) above, for purposes of determining the percentage of Scudder Money Market Portfolio’s total assets invested in securities of issuers having their principal business activities in a particular industry, asset-backed securities will be classified separately, based on standard classifications utilized by ratings agencies.
Scudder Money Market Portfolio may not invest more than 50% of it assets in asset-backed securities.
With regard to Restriction (3) above, for purposes of determining the percentage of each Portfolio’s (except Scudder Money Market Portfolio) total assets invested in securities of issuers having their principal business activities in a particular industry, asset-backed securities will be classified as a single industry.
With respect to investment restriction (3) for Scudder Money Market Portfolio, domestic banks include US banks and US branches of foreign banks that are subject to the same regulation as US banks. Domestic banks may also include foreign branches of domestic banks if the investment risk associated with investing in instruments issued by the foreign branch of a domestic bank is the same as investing in instruments issued by the domestic parent. As a result, the Portfolio may be more adversely affected by changes in market or economic conditions and other circumstances affecting the banking industry than it would be if the Portfolio’s assets were not so concentrated.
The Fund has also adopted the following non-fundamental policies, which may be changed or eliminated for each Portfolio by the Fund’s Board of Trustees without a vote of the shareholders:
As a matter of non-fundamental policy, each Portfolio, except Scudder Money Market Portfolio, does not intend to:
| (1) | borrow money in an amount greater than 5% of its total assets, except (i) for temporary or emergency purposes and (ii) by engaging in reverse repurchase agreements, dollar rolls, or other investments or transactions described in the Portfolio’s registration statement which may be deemed to be borrowings; |
| (2) | purchase securities on margin or make short sales, except (i) short sales against the box, (ii) in connection with arbitrage transactions, (iii) for margin deposits in connection with futures contracts, options or other permitted investments, (iv) that transactions in futures contracts and options shall not be deemed to constitute selling securities short, and (v) that the Portfolio may obtain such short-term credits as may be deemed necessary for the clearance of securities transactions; |
| (3) | purchase options, unless the aggregate premiums paid on all such options held by a Portfolio at any time do not exceed 20% of its total assets; or sell put options, if as a result, the aggregate value of the obligations underlying such put options would exceed 50% of its total assets; |
| (4) | enter into futures contracts or purchase options thereon unless immediately after the purchase, the value of the aggregate initial margin with respect to such futures contracts entered into on behalf of a Portfolio and the premium paid for such options on futures contracts does not exceed 5% of the fair market value of a Portfolio’s total assets; provided that in the case of an option that is in-the-money at the time of purchase, the in-the money amount may be excluded in computing the 5% limit; |
| (5) | purchase warrants if as a result, such securities, taken at the lower of cost or market value, would represent more than 5% of the value of a Portfolio’s total assets (for this purpose, warrants acquired in units or attached to securities will be deemed to have no value); and |
S-47
| (6) | invest more than 15% of net assets in illiquid securities. |
For all portfolios except Scudder Fixed Income Portfolio, Scudder Government & Agency Securities Portfolio, Scudder High Income Portfolio, Scudder Money Market Portfolio and Scudder Strategic Income Portfolio:
| (7) | enter into either of reverse repurchase agreements or dollar rolls in an amount greater than 5% of its total assets. |
For all portfolios except Scudder Dreman Small Cap Value Portfolio and Scudder Money Market Portfolio:
| (8) | lend portfolio securities in an amount greater than one third of its total assets. |
For Scudder Money Market Portfolio:
| (9) | borrow money in an amount greater than 5% of its total assets, except for temporary emergency purposes; |
| (10) | lend portfolio securities in an amount greater than 5% of its total assets; and |
| (11) | invest more than 10% of total assets in non-affiliated registered investment companies. |
Concentration. Scudder Technology Growth Portfolio “concentrates,” for purposes of the 1940 Act, its assets in securities related to a particular industry which means that at least 25% of its net assets will be invested in these assets at all times. As a result, the Portfolio may be subject to greater market fluctuation than a portfolio which has securities representing a broader range of investment alternatives.
Master-feeder Fund Structure
The Fund’s Board of Trustees has the discretion with respect to each Portfolio to retain the current distribution arrangement for the Portfolio while investing in a master fund in a master-feeder fund structure as described below.
A master-feeder fund structure is one in which a fund (a “feeder fund”), instead of investing directly in a portfolio of securities, invests most or all of its investment assets in a separate registered investment company (the “master fund”) with substantially the same investment objective and policies as the feeder fund. Such a structure permits the pooling of assets of two or more feeder funds, preserving separate identities or distribution channels at the feeder fund level. Based on the premise that certain of the expenses of operating an investment portfolio are relatively fixed, a larger investment portfolio may eventually achieve a lower ratio of operating expenses to average net assets. An existing investment company is able to convert to a feeder fund by selling all of its investments, which involves brokerage and other transaction costs and realization of a taxable gain or loss, or by contributing its assets to the master fund and avoiding transaction costs and, if proper procedures are followed, the realization of taxable gain or loss.
INVESTMENT POLICIES AND TECHNIQUES
General Investment Objectives and Policies
Descriptions in this Statement of Additional Information of a particular investment practice or technique in which a Portfolio may engage (such as short selling, hedging, etc.) or a financial instrument which a Portfolio may purchase (such as options, forward foreign currency contracts, etc.) are meant to describe the spectrum of investments that Deutsche Investment Management Americas Inc. (“DeIM” or the “Advisor”), in its discretion, might, but is not required to, use in managing each Portfolio’s assets. The Advisor may, in its discretion, at any time employ such practice, technique or instrument for one or more Portfolios but not for all investment companies advised by it. Furthermore, it is possible that certain types of financial instruments or investment techniques described herein may not be available, permissible, economically feasible or effective for their intended purposes in all markets. Certain practices, techniques, or instruments may not be principal activities of a Portfolio but, to the extent employed, could from time to time have a material impact on the Portfolio’s performance.
It is possible that certain investment practices and techniques described below may not be permissible for a Portfolio based on its investment restrictions, as described herein, and in the Portfolio’s applicable prospectus.
S-48
Two classes of shares of each Portfolio of the Fund are currently offered through Participating Insurance Companies. Class A shares are offered at net asset value and are not subject to a Rule 12b-1 Distribution Plan. Class B shares are offered at net asset value and are subject to a 12b-1 fee.
Each Portfolio has a different investment objective which it pursues through separate investment policies, as described below. The differences in objectives and policies among the Portfolios can be expected to affect the degree of market and financial risk to which each Portfolio is subject and the return of each Portfolio. The investment objectives and policies of each Portfolio may, unless otherwise specifically stated, be changed by the Trustees of the Fund without a vote of the shareholders. There is no assurance that the objectives of any Portfolio will be achieved.
Each Portfolio, except Scudder Money Market Portfolio, may engage in futures, options, and other derivatives transactions in accordance with its respective investment objectives and policies. Each such Portfolio may engage in such transactions if it appears to the Advisor or Subadvisor to be advantageous to do so, in order to pursue its objective, to hedge (i.e., protect) against the effects of fluctuating interest rates and to stabilize the value of its assets and not for speculation. The use of futures and options, and possible benefits and attendant risks, are discussed below along with information concerning certain other investment policies and techniques.
Portfolio Turnover. The portfolio turnover rates for each Portfolio, other than Scudder Money Market Portfolio, are listed under “Financial Highlights” in the Fund’s Annual Report dated December 31, 2003. Each Portfolio’s average portfolio turnover rate is the ratio of the lesser of sales or purchases to the monthly average value of the portfolio securities owned during the year, excluding all securities with maturities or expiration dates at the time of acquisition of one year or less. Securities with maturities of less than one year are excluded from portfolio turnover rate calculations. Frequency of portfolio turnover will not be a limiting factor should a Portfolio’s Advisor or Subadvisor deem it desirable to purchase or sell securities. Purchases and sales are made for a Portfolio whenever necessary, in management’s opinion, to meet a Portfolio’s objective. Higher portfolio turnover (over 100%) involves correspondingly greater brokerage commissions or other transaction costs. Higher portfolio turnover may result in the realization of greater net short-term capital gains.
The Portfolios do not generally make investments for short-term profits, but are not restricted in policy with regard to portfolio turnover and will make changes in their investment portfolios from time to time as business and economic conditions and market prices may dictate and as its investment policy may require.
Asset-Backed Securities. Asset-backed securities may include pools of mortgages (“mortgage-backed securities”), loans, receivables or other assets. Payment of principal and interest may be largely dependent upon the cash flows generated by the assets backing the securities. Asset-backed securities present certain risks that are not presented by mortgage-backed securities. Primarily, these securities may not have the benefit of any security interest in the related assets. Credit card receivables are generally unsecured and the debtors are entitled to the protection of a number of state and federal consumer credit laws, many of which give such debtors the right to set off certain amounts owed on the credit cards, thereby reducing the balance due. There is the possibility that recoveries on repossessed collateral may not, in some cases, be available to support payments on these securities. Asset-backed securities are often backed by a pool of assets representing the obligations of a number of different parties. To lessen the effect of failures by obligors on underlying assets to make payments, the securities may contain elements of credit support which fall into two categories: (i) liquidity protection, and (ii) protection against losses resulting from ultimate default by an obligor on the underlying assets. Liquidity protection refers to the provision of advances, generally by the entity administering the pool of assets, to ensure that the receipt of payments on the underlying pool occurs in a timely fashion. Protection against losses results from payment of the insurance obligations on at least a portion of the assets in the pool. This protection may be provided through guarantees, policies or letters of credit obtained by the issuer or sponsor from third parties, through various means of structuring the transaction or through a combination of such approaches. A Portfolio will not pay any additional or separate fees for credit support. The degree of credit support provided for each issue is generally based on historical information respecting the level of credit risk associated with the underlying assets. Delinquency or loss in excess of that anticipated or failure of the credit support could adversely affect the return on an investment in such a security. The availability of asset-backed securities may be affected by legislative or regulatory developments. It is possible that such developments may require the Portfolios to dispose of any then existing holdings of such securities. The Portfolios, except Scudder Fixed Income Portfolio, Scudder Total Return Portfolio and Scudder Money Market Portfolio, do not intend to invest more than 5% of total assets in asset-backed securities. Scudder Fixed Income Portfolio and Scudder Total Return Portfolio currently do not intend to invest more than 25% of total assets in asset-backed securities. Scudder Money Market Portfolio may not invest more than 50% of its assets in asset back securities.
S-49
Bank and Savings and Loan Obligations for Scudder High Income Portfolio. Scudder High Income Portfolio may also invest in bank loans, which are typically senior debt obligations of borrowers (issuers) and as such, are considered to hold a senior position in the capital structure of the borrower. These may include loans which hold the most senior position, that hold an equal ranking with other senior debt, or loans that are, in the judgment of the Advisor, in the category of senior debt of the borrower. This capital structure position generally gives the holders of these loans a priority claim on some or all of the borrower’s assets in the event of a default. In most cases, these loans are either partially or fully collateralized by the assets of a corporation, partnership, limited liability company or other business entity, or by cash flow that the Advisor believes has a market value at the time of acquisition that equals or exceeds the principal amount of the loan. These loans are often issued in connection with recapitalizations, acquisitions, leveraged buy-outs and refinancings. It is important to note that Moody’s and S&P generally rate bank loans a notch or two higher than high yield bonds of the same issuer to reflect their more senior position. The Portfolio may invest in both fixed- and floating-rate loans. In addition, bank loans can trade either as an “assignment” or “participation”. When the Portfolio buys an assignment, it is essentially becoming a party to the bank agreement. The vast majority of all trades are assignments and would therefore generally represent the preponderance of bank loans held by the Portfolio. In certain cases, the Portfolio may buy bank loans on a participation basis, if for example, the Portfolio did not want to become party to the bank agreement. However, in all cases, the Portfolio will not purchase bank loans where Deutsche Bank, or an affiliate, serves as an agent bank.
Participations and assignments involve credit risk, interest rate risk, liquidity risk, and the risk of being a lender. If the Portfolio purchases a participation, it may only be able to enforce its rights through the lender, and may assume the credit risk of both the lender and the borrower.
Investments in loans through direct assignment of a financial institution’s interests with respect to a loan may involve additional risks. For example, if a loan is foreclosed, the purchaser could become part owner of any collateral, and would bear the costs and liabilities associated with owning and disposing of the collateral. In addition, it is at least conceivable that under emerging legal theories of lender liability, a purchaser could be held liable as a co-lender.
In the case of loans administered by a bank or other financial institution that acts as agent for all holders, if assets held by the agent for the benefit of a purchaser are determined to be subject to the claims of the agent’s general creditors, the purchaser might incur certain costs and delays in realizing payment on the loan or loan participation and could suffer a loss of principal or interest.
In the case of loan participations where a bank or other lending institution serves as financial intermediary between the Portfolio and the borrower, if the participation does not shift to the Portfolio the direct debtor-creditor relationship with the borrower, SEC interpretations require the Portfolio, in some circumstances, to treat both the lending bank or other lending institution and the borrower as issuers for purposes of the Portfolio’s investment policies. Treating a financial intermediary as an issuer of indebtedness may restrict the Portfolio’s ability to invest in indebtedness related to a single financial intermediary, or a group of intermediaries engaged in the same industry, even if the underlying borrowers represent many different companies and industries.
Borrowing. Each Portfolio will borrow only when the Advisor or Subadvisor believes that borrowing will benefit the Portfolio after taking into account considerations such as the costs of the borrowing. Borrowing by each Portfolio will involve special risk considerations. Although the principal of each Portfolio’s borrowings will be fixed, a Portfolio’s assets may change in value during the time a borrowing is outstanding, proportionately increasing exposure to capital risk.
Certificates of Deposit and Bankers’ Acceptances. Certificates of deposit are receipts issued by a depository institution in exchange for the deposit of funds. The issuer agrees to pay the amount deposited plus interest to the bearer of the receipt on the date specified on the certificate. The certificate usually can be traded in the secondary market prior to maturity. Bankers’ acceptances typically arise from short-term credit arrangements designed to enable businesses to obtain funds to finance commercial transactions. Generally, an acceptance is a time draft drawn on a bank by an exporter or an importer to obtain a stated amount of funds to pay for specific merchandise. The draft is then “accepted” by a bank that, in effect, unconditionally guarantees to pay the face value of the instrument on its maturity date. The acceptance may then be held by the accepting bank as an earning asset or it may be sold in the secondary market at the going rate of discount for a specific maturity. Although maturities for acceptances can be as long as 270 days, most acceptances have maturities of six months or less.
S-50
Banker’s acceptances are credit instruments evidencing the obligations of a bank to pay a draft drawn on it by a customer. These instruments reflect the obligation both of the bank and of the drawer to pay the face amount of the instrument upon maturity.
Time deposits are non-negotiable deposits maintained in a banking institution for a specified period of time at a stated interest rate. Time deposits which may be held by the Portfolios will not benefit from insurance from the Bank Insurance Fund or the Savings Association Insurance Fund administered by the Federal Deposit Insurance Corporation. Fixed time deposits may be withdrawn on demand by the investor, but may be subject to early withdrawal penalties that vary with market conditions and the remaining maturity of the obligation. Fixed time deposits subject to withdrawal penalties maturing in more than seven calendar days are subject to a Portfolio’s limitation on investments in illiquid securities.
Collateralized Obligations. Subject to its investment objectives and policies, a Portfolio may purchase collateralized obligations, including interest only (“IO”) and principal only (“PO”) securities. A collateralized obligation is a debt security issued by a corporation, trust or custodian, or by a US Government agency or instrumentality, that is collateralized by a portfolio or pool of mortgages, mortgage-backed securities, US Government securities or other assets. The issuer’s obligation to make interest and principal payments is secured by the underlying pool or portfolio of securities. Collateralized obligations issued or guaranteed by a US Government agency or instrumentality, such as the Federal Home Loan Mortgage Corporation, are considered US Government securities. Privately-issued collateralized obligations collateralized by a portfolio of US Government securities are not direct obligations of the US Government or any of its agencies or instrumentalities and are not considered US Government securities. A variety of types of collateralized obligations are available currently and others may become available in the future.
Collateralized obligations, depending on their structure and the rate of prepayments, can be volatile. Some collateralized obligations may not be as liquid as other securities. Since collateralized obligations may be issued in classes with varying maturities and interest rates, the investor may obtain greater predictability of maturity than with direct investments in mortgage-backed securities. Classes with shorter maturities may have lower volatility and lower yield while those with longer maturities may have higher volatility and higher yield. This provides the investor with greater control over the characteristics of the investment in a changing interest rate environment. With respect to interest only and principal only securities, an investor has the option to select from a pool of underlying collateral the portion of the cash flows that most closely corresponds to the investor’s forecast of interest rate movements. These instruments tend to be highly sensitive to prepayment rates on the underlying collateral and thus place a premium on accurate prepayment projections by the investor.
A Portfolio, other than Scudder Money Market Portfolio, may invest in collateralized obligations whose yield floats inversely against a specified index rate. These “inverse floaters” are more volatile than conventional fixed or floating rate collateralized obligations and the yield thereon, as well as the value thereof, will fluctuate in inverse proportion to changes in the index upon which rate adjustments are based. As a result, the yield on an inverse floater will generally increase when market yields (as reflected by the index) decrease and decrease when market yields increase. The extent of the volatility of inverse floaters depends on the extent of anticipated changes in market rates of interest. Generally, inverse floaters provide for interest rate adjustments based upon a multiple of the specified interest index, which further increases their volatility. The degree of additional volatility will be directly proportional to the size of the multiple used in determining interest rate adjustments. Currently, none of the Portfolios intends to invest more than 5% of its net assets in inverse floaters. Scudder Money Market Portfolio does not invest in inverse floaters.
A Portfolio will currently invest in only those collateralized obligations that are fully collateralized and that meet the quality standards otherwise applicable to the Portfolio’s investments. Fully collateralized means that the collateral will generate cash flows sufficient to meet obligations to holders of the collateralized obligations under even the most conservative prepayment and interest rate projections. Thus, the collateralized obligations are structured to anticipate a worst case prepayment condition and to minimize the reinvestment rate risk for cash flows between coupon dates for the collateralized obligations. A worst case prepayment condition generally assumes immediate prepayment of all securities purchased at a premium and zero prepayment of all securities purchased at a discount. Reinvestment rate risk may be minimized by assuming very conservative reinvestment rates and by other means such as by maintaining the flexibility to increase principal distributions in a low interest rate environment. The effective credit quality of the collateralized obligations in such instances is the credit quality of the issuer of the collateral. The requirements as to collateralization are determined by the issuer or sponsor of the collateralized obligation in order to satisfy rating agencies, if rated. Payments of principal and interest on the underlying collateral securities are not passed through directly to the holders of
S-51
the collateralized obligations as such. Collateralized obligations, depending on their structure and the rate of prepayments, can be volatile. Some collateralized obligations may not be as liquid as other securities.
Collateralized obligations often are issued in two or more classes with varying maturities and stated rates of interest. Because interest and principal payments on the underlying securities are not passed through directly to holders of collateralized obligations, such obligations of varying maturities may be secured by a single portfolio or pool of securities, the payments on which are used to pay interest on each class and to retire successive maturities in sequence. These relationships may in effect “strip” the interest payments from principal payments of the underlying securities and allow for the separate purchase of either the interest or the principal payments. Collateralized obligations are designed to be retired as the underlying securities are repaid. In the event of prepayment on or call of such securities, the class of collateralized obligation first to mature generally will be paid down first. Therefore, although in most cases the issuer of collateralized obligations will not supply additional collateral in the event of such prepayment, there will be sufficient collateral to secure collateralized obligations that remain outstanding. It is anticipated that no more than 5% of a Portfolio’s net assets will be invested in IO and PO securities. Governmentally-issued and privately-issued IO’s and PO’s will be considered illiquid for purposes of a Portfolio’s limitation on illiquid securities, however, the Board of Trustees may adopt guidelines under which governmentally-issued IO’s and PO’s may be determined to be liquid.
Common Stocks. Common stock is issued by companies to raise cash for business purposes and represents a proportionate interest in the issuing companies. Therefore, a Portfolio participates in the success or failure of any company in which it holds stock. The market values of common stock can fluctuate significantly, reflecting the business performance of the issuing company, investor perception and general economic or financial market movements. Despite the risk of price volatility, however, common stocks have historically offered a greater potential for long-term gain on investment, compared to other classes of financial assets, such as bonds or cash equivalents, although there can be no assurance that this will be true in the future.
Convertible Securities. Subject to its investment objectives and policies, each Portfolio (except Scudder Money Market Portfolio) may invest in convertible securities, that is, bonds, notes, debentures, preferred stocks and other securities which are convertible into common stock. Investments in convertible securities can provide an opportunity for capital appreciation and/or income through interest and dividend payments and/or by virtue of their conversion or exchange features.
The convertible securities in which a Portfolio may invest include fixed-income or zero coupon debt securities which may be converted or exchanged at a stated or determinable exchange ratio into underlying shares of common stock including Liquid Yield Option Notes (“LYONs”(TM)). The exchange ratio for any particular convertible security may be adjusted from time to time due to stock splits, dividends, spin-offs, other corporate distributions or scheduled changes in the exchange ratio. Convertible debt securities and convertible preferred stocks, until converted, have general characteristics similar to both debt and equity securities. Although to a lesser extent than with debt securities generally, the market value of convertible securities tends to decline as interest rates increase and, conversely, tends to increase as interest rates decline. In addition, because of the conversion or exchange feature, the market value of convertible securities typically changes as the market value of the underlying common stocks changes, and, therefore, also tends to follow movements in the general market for equity securities. A unique feature of convertible securities is that as the market price of the underlying common stock declines, convertible securities tend to trade increasingly on a yield basis, and so may not experience market value declines to the same extent as the underlying common stock. When the market price of the underlying common stock increases, the prices of the convertible securities tend to rise as a reflection of the value of the underlying common stock, although typically not as much as the underlying common stock. While no securities investments are without risk, investments in convertible securities generally entail less risk than investments in common stock of the same issuer.
Convertible securities often provide for a stream of income (or in the case of zero coupon securities, accretion of income) with generally higher yields than common stocks. Convertible securities generally offer lower yields than non-convertible securities of similar quality because of their conversion or exchange features. Of course, like all debt securities, there can be no assurance of income or principal payments because the issuers of the convertible securities may default on their obligations.
Convertible securities generally are subordinated to other similar but non-convertible securities of the same issuer, although convertible bonds, as corporate debt obligations, enjoy seniority in right of payment to all equity securities, and
S-52
convertible preferred stock is senior to common stock of the same issuer. However, because of the subordination feature, convertible bonds and convertible preferred stock typically have lower ratings than similar non-convertible securities.
Daily Cash Allocation and Re-balancing Procedures for SVS Focus Value+Growth Portfolio. The growth and value sub-portfolios (or “segment”) of the portfolio were allocated 50% of the available assets on May 1, 2001, the beginning of the portfolio’s new strategy. After this date, the portfolio’s daily net flows are normally allocated 50% to the growth segment and 50% to the value segment. Segment allocations will be monitored daily by the Advisor.
Equal allocations continue as long as neither of the two sub-portfolios drops below 45% of the portfolio’s total assets. If this threshold is crossed, on days that the portfolio has positive net new flows, 100% of net flows will be allocated to the under-weighted segment. On days that the portfolio has negative net new flows, 100% of the net redemptions will be funded by the over-weighted segment. This practice will be handled by the Advisor (working with the custodian) and will continue until the under-weighted segment grows to at least 45% of the portfolio’s total assets, at which time the cash allocations will return to 50% for each.
If the segment with less than 45% of the Portfolio’s total net assets drops below 40% for two consecutive business days, the Advisor will send a first notice to formally notify the portfolio management teams of this imbalance as well as any other designated contacts. If changes in stock prices and cash flows have not brought the under-weighted sub-portfolio above 40% after 30 calendar days, the Advisor will send a final notice.
Upon receipt of any imbalance notification, the portfolio management teams may recommend reallocation. Reallocation prior to the final notice will only occur with the consent of the portfolio management teams. This reallocation will not necessarily occur automatically. Even after a 30 day imbalance, other factors may postpone the event. For example, it is unlikely that a full reallocation would occur late in the year due to potentially negative tax implications.
Unless otherwise agreed, dividend distributions will be taken 50% from each segment.
Sub-portfolio allocations will be distributed daily by State Street Bank to the portfolio management teams.
If either segment has an overdraft position, corrections will be made at the segment level. If the portfolio’s management teams deem appropriate, a reallocation may be advised, provided that the portfolio does not go below a 40/60 allocation. In addition, a reallocation may also be advised if the portfolio management teams deem that special and unusual circumstances exist, and it is in the best interest of the shareholders. For instance, if the managers were faced with a large redemption, and one manager had more cash available at the time, an imbalanced redemption may be transacted. Following such a transaction, it is possible that a reallocation may be advised in order to rectify the allocations.
Delayed Delivery Transactions. Scudder Aggressive Growth Portfolio, Scudder Global Blue Chip Portfolio, Scudder Government & Agency Securities Portfolio, Scudder Growth Portfolio, Scudder High Income Portfolio, Scudder Fixed Income Portfolio, Scudder Strategic Income Portfolio, Scudder Technology Growth Portfolio, Scudder Total Return Portfolio, SVS Davis Venture Value Portfolio, SVS Dreman Financial Services Portfolio, SVS Eagle Focused Large Cap Growth Portfolio, SVS Index 500 Portfolio, SVS INVESCO Dynamic Growth Portfolio, SVS Janus Growth And Income Portfolio, SVS Janus Growth Opportunities Portfolio, SVS Oak Strategic Equity Portfolio and SVS Turner Mid Cap Growth Portfolio may purchase or sell portfolio securities on a when-issued or delayed delivery basis. When-issued or delayed delivery transactions arise when securities are purchased by the Portfolio with payment and delivery to take place in the future in order to secure what is considered to be an advantageous price and yield to the Portfolio at the time of entering into the transaction. When the Portfolio enters into a delayed delivery transaction, it becomes obligated to purchase securities and it has all of the rights and risks attendant to ownership of a security, although delivery and payment occur at a later date. The value of fixed-income securities to be delivered in the future will fluctuate as interest rates vary. At the time a Portfolio makes the commitment to purchase a security on a when-issued or delayed delivery basis, it will record the transaction and reflect the liability for the purchase and the value of the security in determining its net asset value. Likewise, at the time a Portfolio makes the commitment to sell a security on a delayed delivery basis, it will record the transaction and include the proceeds to be received in determining its net asset value; accordingly, any fluctuations in the value of the security sold pursuant to a delayed delivery commitment are ignored in calculating net asset value so long as the commitment remains in effect. The Portfolio generally has the ability to close out a purchase obligation on or before the settlement date, rather than take delivery of the security.
S-53
Depositary Receipts. Investments in securities of foreign issuers may be in the form of sponsored or unsponsored American Depositary Receipts (“ADRs”), European Depositary Receipts (“EDRs”), Global Depositary Receipts (“GDRs”), International Depositary Receipts (“IDRs”) and other types of Depositary Receipts (which, together with ADRs, EDRs, GDRs and IDRs are hereinafter referred to as “Depositary Receipts”). Depositary Receipts provide indirect investment in securities of foreign issuers. Prices of unsponsored Depositary Receipts may be more volatile than if they were sponsored by the issuer of the underlying securities. Depositary Receipts may not necessarily be denominated in the same currency as the underlying securities into which they may be converted. In addition, the issuers of the stock of unsponsored Depositary Receipts are not obligated to disclose material information in the United States and, therefore, there may not be a correlation between such information and the market value of the Depositary Receipts. ADRs are Depository Receipts typically issued by a US bank or trust company which evidence ownership of underlying securities issued by a foreign corporation. GDRs, IDRs and other types of Depositary Receipts are typically issued by foreign banks or trust companies, although they also may be issued by United States banks or trust companies, and evidence ownership of underlying securities issued by either a foreign or a United States corporation. Generally, Depositary Receipts in registered form are designed for use in the United States securities markets and Depositary Receipts in bearer form are designed for use in securities markets outside the United States. For purposes of a Portfolio’s investment policies, a Portfolio’s investments in ADRs, GDRs and other types of Depositary Receipts will be deemed to be investments in the underlying securities. Depositary Receipts, including those denominated in US dollars, will be subject to foreign currency exchange rate risk. However, by investing in US dollar-denominated ADRs rather than directly in foreign issuers’ stock, a Portfolio avoids currency risks during the settlement period. In general, there is a large, liquid market in the United States for most ADRs. However, certain Depositary Receipts may not be listed on an exchange and therefore may be illiquid securities.
Foreign Fixed-Income Securities. Since most foreign fixed-income securities are not rated, a Portfolio will invest in foreign fixed-income securities based upon the Advisor’s or Subadvisor’s analysis without relying on published ratings. Since such investments will be based upon the Advisor or Subadvisor’s analysis rather than upon published ratings, achievement of a Portfolio’s goals may depend more upon the abilities of the Advisor or Subadvisor than would otherwise be the case.
The value of the foreign fixed-income securities held by a Portfolio, and thus the net asset value of the Portfolio’s shares, generally will fluctuate with (a) changes in the perceived creditworthiness of the issuers of those securities, (b) movements in interest rates, and (c) changes in the relative values of the currencies in which a Portfolio’s investments in fixed-income securities are denominated with respect to the US Dollar. The extent of the fluctuation will depend on various factors, such as the average maturity of a Portfolio’s investments in foreign fixed-income securities, and the extent to which a Portfolio hedges against its interest rate, credit and currency exchange rate risks. Many of the foreign fixed-income obligations in which a Portfolio will invest will have long maturities. A longer average maturity generally is associated with a higher level of volatility in the market value of such securities in response to changes in market conditions.
Investments in sovereign debt, including Brady Bonds, involve special risks. Brady Bonds are debt securities issued under a plan implemented to allow debtor nations to restructure their outstanding commercial bank indebtedness. Foreign governmental issuers of debt or the governmental authorities that control the repayment of the debt may be unable or unwilling to repay principal or pay interest when due. In the event of default, there may be limited or no legal recourse in that, generally, remedies for defaults must be pursued in the courts of the defaulting party. Political conditions, especially a sovereign entity’s willingness to meet the terms of its fixed-income securities, are of considerable significance. Also, there can be no assurance that the holders of commercial bank loans to the same sovereign entity may not contest payments to the holders of sovereign debt in the event of default under commercial bank loan agreements. In addition, there is no bankruptcy proceeding with respect to sovereign debt on which a sovereign has defaulted, and a Portfolio may be unable to collect all or any part of its investment in a particular issue.
Foreign investment in certain sovereign debt is restricted or controlled to varying degrees, including requiring governmental approval for the repatriation of income, capital or proceeds of sales by foreign investors. These restrictions or controls may at times limit or preclude foreign investment in certain sovereign debt or increase the costs and expenses of a Portfolio. A significant portion of the sovereign debt in which a Portfolio may invest is issued as part of debt restructuring and such debt is to be considered speculative. There is a history of defaults with respect to commercial bank loans by public and private entities issuing Brady Bonds. All or a portion of the interest payments and/or principal repayment with respect to Brady Bonds may be uncollateralized.
S-54
High Yield, High Risk Bonds. Certain Portfolios may also purchase debt securities which are rated below investment-grade (commonly referred to as “junk bonds”), that is, rated below Baa by Moody’s or below BBB by S&P or judged to be of equivalent quality as determined by the Advisor or Subadvisor. These securities usually entail greater risk (including the possibility of default or bankruptcy of the issuers of such securities), generally involve greater volatility of price and risk to principal and income, and may be less liquid, than securities in the higher rating categories. The lower the ratings of such debt securities, the more their risks render them like equity securities. Securities rated D may be in default with respect to payment of principal or interest. See the Appendix to this Statement of Additional Information for a more complete description of the ratings assigned by ratings organizations and their respective characteristics.
Issuers of such high yielding securities often are highly leveraged and may not have available to them more traditional methods of financing. Therefore, the risk associated with acquiring the securities of such issuers generally is greater than is the case with higher rated securities. For example, during an economic downturn or a sustained period of rising interest rates, highly leveraged issuers of high yield securities may experience financial stress. During such periods, such issuers may not have sufficient revenues to meet their interest payment obligations. The issuer’s ability to service its debt obligations may also be adversely affected by specific corporate developments, or the issuer’s inability to meet specific projected business forecasts, or the unavailability of additional financing. The risk of loss from default by the issuer is significantly greater for the holders of high yield securities because such securities are generally unsecured and are often subordinated to other creditors of the issuer. Prices and yields of high yield securities will fluctuate over time and, during periods of economic uncertainty, volatility of high yield securities may adversely affect a Portfolio’s net asset value. In addition, investments in high yield zero coupon or pay-in-kind bonds, rather than income-bearing high yield securities, may be more speculative and may be subject to greater fluctuations in value due to changes in interest rates.
A Portfolio may have difficulty disposing of certain high yield (high risk) securities because they may have a thin trading market. Because not all dealers maintain markets in all high yield securities, a Portfolio anticipates that such securities could be sold only to a limited number of dealers or institutional investors. The lack of a liquid secondary market may have an adverse effect on the market price and a Portfolio’s ability to dispose of particular issues and may also make it more difficult for a Portfolio to obtain accurate market quotations for purposes of valuing a Portfolio’s assets. Market quotations generally are available on many high yield issues only from a limited number of dealers and may not necessarily represent firm bids of such dealers or prices for actual sales. Adverse publicity and investor perceptions may decrease the values and liquidity of high yield securities. These securities may also involve special registration responsibilities, liabilities and costs, and liquidity and valuation difficulties.
Credit quality in the high-yield securities market can change suddenly and unexpectedly, and even recently-issued credit ratings may not fully reflect the actual risks posed by a particular high-yield security. For these reasons, it is generally the policy of the Advisor and Subadvisors not to rely exclusively on ratings issued by established credit rating agencies, but to supplement such ratings with their own independent and ongoing review of credit quality. The achievement of a Portfolio’s investment objective by investment in such securities may be more dependent on the Advisor’s or Subadvisor’s credit analysis than is the case for higher quality bonds. Should the rating of a portfolio security be downgraded, the Advisor or Subadvisor will determine whether it is in the best interests of the Portfolio to retain or dispose of such security.
Prices for below investment-grade securities may be affected by legislative and regulatory developments. Also, Congress has from time to time considered legislation which would restrict or eliminate the corporate tax deduction for interest payments in these securities and regulate corporate restructurings. Such legislation may significantly depress the prices of outstanding securities of this type.
Scudder Fixed Income Portfolio will not invest more than 5% of its net assets in junk bonds.
Interfund Borrowing and Lending Program. The Fund has received exemptive relief from the SEC which permits a Portfolio to participate in an interfund lending program among certain investment companies advised by the Advisor. The interfund lending program allows the participating portfolios to borrow money from and loan money to each other for temporary or emergency purposes. The program is subject to a number of conditions designed to ensure fair and equitable treatment of all participating funds, including the following: (1) no Portfolio may borrow money through the program unless it receives a more favorable interest rate than a rate approximating the lowest interest rate at which bank loans would be available to any of the participating portfolio under a loan agreement; and (2) no Portfolio may lend money through the program unless it receives a more favorable return than that available from an investment in repurchase agreements and, to the extent applicable, money market cash sweep arrangements. In addition, a Portfolio
S-55
may participate in the program only if and to the extent that such participation is consistent with the Portfolio’s investment objectives and policies (for instance, money market funds would normally participate only as lenders and tax exempt funds only as borrowers). Interfund loans and borrowings may extend overnight, but could have a maximum duration of seven days. Loans may be called on one day’s notice. A Portfolio may have to borrow from a bank at a higher interest rate if an interfund loan is called or not renewed. Any delay in repayment to a lending Portfolio could result in a lost investment opportunity or additional costs. The program is subject to the oversight and periodic review of the Boards of the participating funds. Borrowings through the interfund lending program are subject to each Portfolio’s policies on borrowing.
Investing in Emerging Markets. A Portfolio’s investments in foreign securities may be in developed countries or in countries considered by a Portfolio’s Advisor or Subadvisor to have developing or “emerging” markets, which involves exposure to economic structures that are generally less diverse and mature than in the United States, and to political systems that may be less stable. A developing or emerging market country can be considered to be a country that is in the initial stages of its industrialization cycle. Currently, emerging markets generally include every country in the world other than the United States, Canada, Japan, Australia, New Zealand, Hong Kong, Singapore and most Western European countries. Currently, investing in many emerging markets may not be desirable or feasible because of the lack of adequate custody arrangements for a Portfolio’s assets, overly burdensome repatriation and similar restrictions, the lack of organized and liquid securities markets, unacceptable political risks or other reasons. As opportunities to invest in securities in emerging markets develop, a Portfolio may expand and further broaden the group of emerging markets in which it invests. In the past, markets of developing or emerging market countries have been more volatile than the markets of developed countries; however, such markets often have provided higher rates of return to investors. The Advisor believes that these characteristics may be expected to continue in the future.
Most emerging securities markets have substantially less volume and are subject to less governmental supervision than US securities markets. Securities of many issuers in emerging markets may be less liquid and more volatile than securities of comparable domestic issuers. In addition, there is less regulation of securities exchanges, securities dealers, and listed and unlisted companies in emerging markets than in the US.
Emerging markets also have different clearance and settlement procedures, and in certain markets there have been times when settlements have not kept pace with the volume of securities transactions. Delays in settlement could result in temporary periods when a portion of the assets of the Portfolio is uninvested and no return is earned thereon. The inability of a Portfolio to make intended security purchases due to settlement problems could cause a Portfolio to miss attractive investment opportunities. Inability to dispose of portfolio securities due to settlement problems could result either in losses to a Portfolio due to subsequent declines in value of the portfolio security or, if a Portfolio has entered into a contract to sell the security, could result in possible liability to the purchaser. Costs associated with transactions in foreign securities are generally higher than costs associated with transactions in US securities. Such transactions also involve additional costs for the purchase or sale of foreign currency.
Certain emerging markets require prior governmental approval of investments by foreign persons, limit the amount of investment by foreign persons in a particular company, limit the investment by foreign persons only to a specific class of securities of a company that may have less advantageous rights than the classes available for purchase by domiciliaries of the countries and/or impose additional taxes on foreign investors. Certain emerging markets may also restrict investment opportunities in issuers in industries deemed important to national interest.
Certain emerging markets may require governmental approval for the repatriation of investment income, capital or the proceeds of sales of securities by foreign investors. In addition, if a deterioration occurs in an emerging market’s balance of payments or for other reasons, a country could impose temporary restrictions on foreign capital remittances. A Portfolio could be adversely affected by delays in, or a refusal to grant, any required governmental approval for repatriation of capital, as well as by the application to a Portfolio of any restrictions on investments.
In the course of investment in emerging markets, a Portfolio will be exposed to the direct or indirect consequences of political, social and economic changes in one or more emerging markets. While a Portfolio will manage its assets in a manner that will seek to minimize the exposure to such risks, there can be no assurance that adverse political, social or economic changes will not cause a Portfolio to suffer a loss of value in respect of the securities in a Portfolio’s holdings.
The risk also exists that an emergency situation may arise in one or more emerging markets as a result of which trading of securities may cease or may be substantially curtailed and prices for a Portfolio’s securities in such markets may not be
S-56
readily available. A Portfolio may suspend redemption of its shares for any period during which an emergency exists, to the extent consistent with guidelines of the Securities and Exchange Commission (“SEC”).
Volume and liquidity in most foreign markets are less than in the US, and securities of many foreign companies are less liquid and more volatile than securities of comparable US companies. Fixed commissions on foreign securities exchanges are generally higher than negotiated commissions on US exchanges, although a Portfolio endeavors to achieve the most favorable net results on its portfolio transactions. There is generally less government supervision and regulation of business and industry practices, securities exchanges, brokers, dealers and listed companies than in the US Mail service between the US and foreign countries may be slower or less reliable than within the US, thus increasing the risk of delayed settlements of portfolio transactions or loss of certificates for certificated portfolio securities. In addition, with respect to certain emerging markets, there is the possibility of expropriation or confiscatory taxation, political or social instability, or diplomatic developments which could affect a Portfolio’s investments in those countries. Moreover, individual emerging market economies may differ favorably or unfavorably from the US economy in such respects as growth of gross national product, rate of inflation, capital reinvestment, resource self-sufficiency and balance of payments position.
A Portfolio may have limited legal recourse in the event of a default with respect to certain debt obligations it holds. If the issuer of a fixed-income security owned by a Portfolio defaults, a Portfolio may incur additional expenses to seek recovery. Debt obligations issued by emerging market country governments differ from debt obligations of private entities; remedies for defaults on debt obligations issued by emerging market governments, unlike those on private debt, must be pursued in the courts of the defaulting party itself. A Portfolio’s ability to enforce its rights against private issuers may be limited. The ability to attach assets to enforce a judgment may be limited. Legal recourse is therefore somewhat diminished. Bankruptcy, moratorium and other similar laws applicable to private issuers of debt obligations may be substantially different from those of other countries. The political context, expressed as an emerging market governmental issuer’s willingness to meet the terms of the debt obligation, for example, is of considerable importance. In addition, no assurance can be given that the holders of commercial bank debt may not contest payments to the holders of debt obligations in the event of default under commercial bank loan agreements.
Income from securities held by a Portfolio could be reduced by a withholding tax at the source or other taxes imposed by the emerging market countries in which a Portfolio makes its investments. A Portfolio’s net asset value may also be affected by changes in the rates or methods of taxation applicable to a Portfolio or to entities in which a Portfolio has invested. The Advisor or Subadvisor will consider the cost of any taxes in determining whether to acquire any particular investments, but can provide no assurance that the taxes will not be subject to change.
Many emerging market countries have experienced substantial, and, in some periods, extremely high rates of inflation for many years. Inflation and rapid fluctuations in inflation rates have had and may continue to have adverse effects on the economies and securities markets of certain emerging market countries. In an attempt to control inflation, wage and price controls have been imposed in certain countries. Of these countries, some, in recent years, have begun to control inflation through prudent economic policies.
Emerging market governmental issuers are among the largest debtors to commercial banks, foreign governments, international financial organizations and other financial institutions. Certain emerging market governmental issuers have not been able to make payments of interest on or principal of debt obligations as those payments have come due. Obligations arising from past restructuring agreements may affect the economic performance and political and social stability of those issuers.
Governments of many emerging market countries have exercised and continue to exercise substantial influence over many aspects of the private sector through the ownership or control of many companies, including some of the largest in any given country. As a result, government actions in the future could have a significant effect on economic conditions in emerging markets, which in turn, may adversely affect companies in the private sector, general market conditions and prices and yields of certain of the securities in the portfolio. Expropriation, confiscatory taxation, nationalization, political, economic or social instability or other similar developments have occurred frequently over the history of certain emerging markets and could adversely affect assets should these conditions recur.
The ability of emerging market country governmental issuers to make timely payments on their obligations is likely to be influenced strongly by the country’s balance of payments, including export performance, and its access to international credits and investments. An emerging market country whose exports are concentrated in a few commodities could be vulnerable to a decline in the international prices of one or more of those commodities. Increased protectionism on the part
S-57
of a country’s trading partners could also adversely affect the country’s exports and diminish its trade account surplus, if any. To the extent that emerging market countries receive payment for its exports in currencies other than dollars or non-emerging market currencies, its ability to make debt payments denominated in dollars or non-emerging market currencies could be affected.
Another factor bearing on the ability of governmental issues of emerging market countries to repay debt obligations is the level of international reserves of the country. Fluctuations in the level of these reserves affect the amount of foreign exchange readily available for external debt payments and thus could have a bearing on the capacity of governmental issues to make payments on these debt obligations.
To the extent that an emerging market country cannot generate a trade surplus, it must depend on continuing loans from foreign governments, multilateral organizations or private commercial banks, aid payments from foreign governments and inflows of foreign investment. The access of emerging market countries to these forms of external funding may not be certain, and a withdrawal of external funding could adversely affect the capacity of governmental issuers to make payments on their obligations. In addition, the cost of servicing emerging market debt obligations can be affected by a change in international interest rates because the majority of these obligations carry interest rates that are adjusted periodically based upon international rates.
Investment Company Securities. Each Portfolio may acquire securities of other investment companies to the extent consistent with its investment objective and subject to the limitations of the 1940 Act. The Portfolio will indirectly bear its proportionate share of any management fees and other expenses paid by such other investment companies. For example, a Portfolio may invest in a variety of investment companies which seek to track the composition and performance of specific indexes or a specific portion of an index. These index-based investments hold substantially all of their assets in securities representing their specific index or a specific portion of an index. Accordingly, the main risk of investing in index-based investments is the same as investing in a portfolio of equity securities comprising the index. The market prices of index-based investments will fluctuate in accordance with both changes in the market value of their underlying portfolio securities and due to supply and demand for the instruments on the exchanges on which they are traded (which may result in their trading at a discount or premium to their NAVs). Index-based investments may not replicate exactly the performance of their specified index because of transaction costs and because of the temporary unavailability of certain component securities of the index.
Examples of index-based investments include:
SPDRs(R): SPDRs, an acronym for “Standard & Poor’s Depositary Receipts,” are based on the S&P 500 Composite Stock Price Index. They are issued by the SPDR Trust, a unit investment trust that holds shares of substantially all the companies in the S&P 500 in substantially the same weighting and seeks to closely track the price performance and dividend yield of the Index.
MidCap SPDRs(R): MidCap SPDRs are based on the S&P MidCap 400 Index. They are issued by the MidCap SPDR Trust, a unit investment trust that holds a portfolio of securities consisting of substantially all of the common stocks in the S&P MidCap 400 Index in substantially the same weighting and seeks to closely track the price performance and dividend yield of the Index.
Select Sector SPDRs(R): Select Sector SPDRs are based on a particular sector or group of industries that are represented by a specified Select Sector Index within the Standard & Poor’s Composite Stock Price Index. They are issued by The Select Sector SPDR Trust, an open-end management investment company with nine portfolios that each seeks to closely track the price performance and dividend yield of a particular Select Sector Index.
DIAMONDS(SM): DIAMONDS are based on the Dow Jones Industrial Average(SM). They are issued by the DIAMONDS Trust, a unit investment trust that holds a portfolio of all the component common stocks of the Dow Jones Industrial Average and seeks to closely track the price performance and dividend yield of the Dow.
Nasdaq-100 Shares: Nasdaq-100 Shares are based on the Nasdaq 100 Index. They are issued by the Nasdaq-100 Trust, a unit investment trust that holds a portfolio consisting of substantially all of the securities, in substantially the same weighting, as the component stocks of the Nasdaq-100 Index and seeks to closely track the price performance and dividend yield of the Index.
S-58
WEBs(SM): WEBs, an acronym for “World Equity Benchmark Shares,” are based on 17 country-specific Morgan Stanley Capital International Indexes. They are issued by the WEBs Index Fund, Inc., an open-end management investment company that seeks to generally correspond to the price and yield performance of a specific Morgan Stanley Capital International Index.
Investment-Grade Bonds. “Investment-grade” bonds are those rated Aaa, Aa, A or Baa by Moody’s or AAA, AA, A or BBB by S&P or, if unrated, judged to be of equivalent quality as determined by the Advisor or a Subadvisor. Moody’s considers bonds it rates Baa to have speculative elements as well as investment-grade characteristics. To the extent that a Portfolio invests in higher-grade securities, a Portfolio will not be able to avail itself of opportunities for higher income which may be available at lower grades.
Investment of Uninvested Cash Balances. Each Portfolio, may have cash balances that have not been invested in portfolio securities (“Uninvested Cash”). Uninvested Cash may result from a variety of sources, including dividends or interest received from portfolio securities, unsettled securities transactions, reserves held for investment strategy purposes, scheduled maturity of investments, liquidation of investment securities to meet anticipated redemptions and dividend payments, and new cash received from investors. Uninvested Cash may be invested directly in money market instruments or other short-term debt obligations. Pursuant to an Exemptive Order issued by the SEC, each Portfolio (except Scudder Money Market Portfolio) may use Uninvested Cash to purchase shares of affiliated funds including money market funds, short-term bond funds and Scudder Cash Management QP Trust or one or more future entities for which DeIM acts as trustee or investment advisor that operate as cash management investment vehicles and that are excluded from the definition of investment company pursuant to Section 3(c)(1) or 3(c)(7) of the 1940 Act (collectively, the “Central Funds”) in excess of the limitations of Section 12(d)(1) of the 1940 Act. Investment by each Portfolio in shares of the Central Funds will be in accordance with Portfolio’s investment policies and restrictions as set forth in its registration statement. Currently, Scudder Money Market Portfolio does not intend to investing in the Central Fund.
Certain of the Central Funds comply with Rule 2a-7 under the Act. The other Central Funds are or will be short-term bond funds that invest in fixed-income securities and maintain a dollar-weighted average maturity of three years or less. Each of the Central Funds will be managed specifically to maintain a highly liquid portfolio, and access to them will enhance each Portfolio’s ability to manage Uninvested Cash.
Each Portfolio will invest Uninvested Cash in Central Funds only to the extent that each Portfolio’s aggregate investment in the Central Funds does not exceed 25% of its total assets (except Scudder Fixed Income Portfolio cannot exceed 20% of its total assets) in shares of the Central Funds. Purchase and sales of shares of Central Funds are made at net asset value.
Lending of Portfolio Securities. Each Portfolio (with the exception of Scudder Money Market Portfolio and Scudder Dreman Small Cap Value Portfolio) may lend its investment securities to approved institutional borrowers who need to borrow securities in order to complete certain transactions, such as covering short sales, avoiding failures to deliver securities or completing arbitrage operations. By lending their investment securities, the Portfolios attempt to increase their net investment income through the receipt of interest on the loan. Any gain or loss in the market price of the securities loaned that might occur during the term of the loan would belong to a Portfolio. A Portfolio may lend its investment securities so long as the terms, structure and the aggregate amount of such loans are not inconsistent with the 1940 Act or the rules and regulations or interpretations of the SEC thereunder, which currently require that (a) the borrower pledge and maintain with a Portfolio collateral consisting of liquid, unencumbered assets having a value at all times not less than 100% of the value of the securities loaned, (b) the borrower add to such collateral whenever the price of the securities loaned rises (i.e., the borrower “marks to the market” on a daily basis), (c) the loan be made subject to termination by a Portfolio at any time, and (d) a Portfolio receives reasonable interest on the loan (which may include the Portfolio investing any cash collateral in interest bearing short-term investments), and distributions on the loaned securities and any increase in their market value. There may be risks of delay in recovery of the securities or even loss of rights in the collateral should the borrower of the securities fail financially. However, loans will be made only to borrowers selected by a Portfolio’s delegate after a commercially reasonable review of relevant facts and circumstances, including the creditworthiness of the borrower.
At the present time, the staff of the SEC does not object if an investment company pays reasonable negotiated fees in connection with loaned securities, so long as such fees are set forth in a written contract and approved by the investment company’s Board of Trustees/Directors. In addition, voting rights may pass with the loaned securities, but if a material event occurs affecting an investment on loan, the loan must be called and the securities voted. Pursuant to an exemptive
S-59
order granted by the SEC, cash collateral received by a Portfolio may be invested in a money market fund managed by the Advisor or a Subadvisor (or one of its affiliates).
Maintenance of $1.00 Net Asset Value, Credit Quality and Portfolio Maturity. Scudder Money Market Portfolio effects sales, redemptions and repurchases at the net asset value per share, normally $1.00. In fulfillment of their responsibilities under Rule 2a-7 of the 1940 Act, the Fund’s Board has approved policies established by the Portfolio’s Advisor reasonably calculated to prevent the Fund’s net asset value per share from deviating from $1.00 except under unusual or extraordinary circumstances and the Fund’s Board will periodically review the Advisor’s operations under such policies at regularly scheduled Board meetings. Those policies include a weekly monitoring by the Advisor of unrealized gains and losses in the Portfolio’s portfolio, and when necessary, in an effort to avoid deviation, taking corrective action, such as adjusting the maturity of the portfolio, or, if possible, realizing gains or losses to offset in part unrealized losses or gains. The result of those policies may be that the yield on shares of the Portfolio will be lower than would be the case if the policies were not in effect. Such policies also provide for certain action to be taken with respect to portfolio securities which experience a downgrade in rating or suffer a default.
Non-Diversified Portfolios. SVS Focus Value+Growth Portfolio, SVS Dreman Financial Services Portfolio, Scudder Aggressive Growth Portfolio and Scudder Technology Growth Portfolio are each classified as a “non-diversified” portfolio so that each will be able to invest more than 5% of its assets in the obligations of an issuer, subject to the diversification requirements of Subchapter M of the Code applicable to the Portfolio. This allows each Portfolio, as to 50% of its assets, to invest more than 5% of its assets, but not more than 25%, in the securities of an individual foreign government or corporate issuer. Since the Portfolio may invest a relatively high percentage of its assets in the obligations of a limited number of issuers, the Portfolio may be more susceptible to any single economic, political or regulatory occurrence than a diversified portfolio.
Privatized Enterprises. Investments in foreign securities may include securities issued by enterprises that have undergone or are currently undergoing privatization. The governments of certain foreign countries have, to varying degrees, embarked on privatization programs contemplating the sale of all or part of their interests in state enterprises. A Portfolio’s investments in the securities of privatized enterprises may include privately negotiated investments in a government or state-owned or controlled company or enterprise that has not yet conducted an initial equity offering, investments in the initial offering of equity securities of a state enterprise or former state enterprise and investments in the securities of a state enterprise following its initial equity offering.
In certain jurisdictions, the ability of foreign entities, such as a Portfolio, to participate in privatizations may be limited by local law, or the price or terms on which a Portfolio may be able to participate may be less advantageous than for local investors. Moreover, there can be no assurance that governments that have embarked on privatization programs will continue to divest their ownership of state enterprises, that proposed privatizations will be successful or that governments will not re-nationalize enterprises that have been privatized.
In the case of the enterprises in which a Portfolio may invest, large blocks of the stock of those enterprises may be held by a small group of stockholders, even after the initial equity offerings by those enterprises. The sale of some portion or all of those blocks could have an adverse effect on the price of the stock of any such enterprise.
Prior to making an initial equity offering, most state enterprises or former state enterprises go through an internal reorganization or management. Such reorganizations are made in an attempt to better enable these enterprises to compete in the private sector. However, certain reorganizations could result in a management team that does not function as well as the enterprise’s prior management and may have a negative effect on such enterprise. In addition, the privatization of an enterprise by its government may occur over a number of years, with the government continuing to hold a controlling position in the enterprise even after the initial equity offering for the enterprise.
Prior to privatization, most of the state enterprises in which a Portfolio may invest enjoy the protection of and receive preferential treatment from the respective sovereigns that own or control them. After making an initial equity offering these enterprises may no longer have such protection or receive such preferential treatment and may become subject to market competition from which they were previously protected. Some of these enterprises may not be able to effectively operate in a competitive market and may suffer losses or experience bankruptcy due to such competition.
Real Estate Investment Trusts (REITs). Certain Portfolios may invest in REITs. REITs are sometimes informally characterized as equity REITs, mortgage REITs and hybrid REITs. Investment in REITs may subject the Portfolio to
S-60
risks associated with the direct ownership of real estate, such as decreases in real estate values, overbuilding, increased competition and other risks related to local or general economic conditions, increases in operating costs and property taxes, changes in zoning laws, casualty or condemnation losses, possible environmental liabilities, regulatory limitations on rent and fluctuations in rental income. Equity REITs generally experience these risks directly through fee or leasehold interests, whereas mortgage REITs generally experience these risks indirectly through mortgage interests, unless the mortgage REIT forecloses on the underlying real estate. Changes in interest rates may also affect the value of the Portfolio’s investment in REITs. For instance, during periods of declining interest rates, certain mortgage REITs may hold mortgages that the mortgagors elect to prepay, which prepayment may diminish the yield on securities issued by those REITs.
Certain REITs have relatively small market capitalization, which may tend to increase the volatility of the market price of their securities. Furthermore, REITs are dependent upon specialized management skills, have limited diversification and are, therefore, subject to risks inherent in operating and financing a limited number of projects. REITs are also subject to heavy cash flow dependency, defaults by borrowers and the possibility of failing to qualify for tax-free pass-through of income under the Code and to maintain exemption from the registration requirements of the 1940 Act. By investing in REITs indirectly through the Portfolio, a shareholder will bear not only his or her proportionate share of the expenses of the Portfolio, but also, indirectly, similar expenses of the REITs. In addition, REITs depend generally on their ability to generate cash flow to make distributions to shareholders.
Repurchase Agreements. Each Portfolio may invest in repurchase agreements pursuant to its investment guidelines. In a repurchase agreement, the Portfolio acquires ownership of a security and simultaneously commits to resell that security to the seller, typically a bank or broker/dealer.
A repurchase agreement provides a means for a Portfolio to earn income on funds for periods as short as overnight. It is an arrangement under which the purchaser (i.e., the Portfolio) acquires a security (“Obligation”) and the seller agrees, at the time of sale, to repurchase the Obligation at a specified time and price. Securities subject to a repurchase agreement are held in a segregated account and, as described in more detail below, the value of such securities is kept at least equal to the repurchase price on a daily basis. The repurchase price may be higher than the purchase price, the difference being income to a Portfolio, or the purchase and repurchase prices may be the same, with interest at a stated rate due to a Portfolio together with the repurchase price upon repurchase. In either case, the income to a Portfolio is unrelated to the interest rate on the Obligation itself. Obligations will be held by the custodian or in the Federal Reserve Book Entry System.
It is not clear whether a court would consider the Obligation purchased by a Portfolio subject to a repurchase agreement as being owned by a Portfolio or as being collateral for a loan by a Portfolio to the seller. In the event of the commencement of bankruptcy or insolvency proceedings with respect to the seller of the Obligation before repurchase of the Obligation under a repurchase agreement, a Portfolio may encounter delay and incur costs before being able to sell the security. Delays may involve loss of interest or decline in price of the Obligation. If the court characterizes the transaction as a loan and a Portfolio has not perfected a security interest in the Obligation, a Portfolio may be required to return the Obligation to the seller’s estate and be treated as an unsecured creditor of the seller. As an unsecured creditor, a Portfolio would be at risk of losing some or all of the principal and income involved in the transaction. As with any unsecured debt Obligation purchased for a Portfolio, the Advisor or Subadvisor seeks to reduce the risk of loss through repurchase agreements by analyzing the creditworthiness of the obligor, in this case the seller of the Obligation. Apart from the risk of bankruptcy or insolvency proceedings, there is also the risk that the seller may fail to repurchase the Obligation, in which case a Portfolio may incur a loss if the proceeds to a Portfolio of the sale to a third party are less than the repurchase price. However, if the market value (including interest) of the Obligation subject to the repurchase agreement becomes less than the repurchase price (including interest), a Portfolio will direct the seller of the Obligation to deliver additional securities so that the market value (including interest) of all securities subject to the repurchase agreement will equal or exceed the repurchase price.
Reverse Repurchase Agreements. Each Portfolio (except Scudder Money Market Portfolio) may enter into “reverse repurchase agreements,” which are repurchase agreements in which a Portfolio, as the seller of the securities, agrees to repurchase such securities at an agreed time and price. Each Portfolio maintains a segregated account in connection with outstanding reverse repurchase agreements. A Portfolio will enter into reverse repurchase agreements only when the Advisor or Subadvisor believes that the interest income to be earned from the investment of the proceeds of the transaction will be greater than the interest expense of the transaction. Such transactions may increase fluctuations in the market value of Portfolio assets and its yield.
S-61
Section 4(2) Paper. Subject to its investment objectives and policies, each Portfolio may invest in commercial paper issued by major corporations under the Securities Act of 1933 in reliance on the exemption from registration afforded by Section 3(a)(3) thereof. Such commercial paper may be issued only to finance current transactions and must mature in nine months or less. Trading of such commercial paper is conducted primarily by institutional investors through investment dealers, and individual investor participation in the commercial paper market is very limited. A Portfolio also may invest in commercial paper issued in reliance on the so-called “private placement” exemption from registration afforded by Section 4(2) of the Securities Act of 1933 (“Section 4(2) paper”). Section 4(2) paper is restricted as to disposition under the federal securities laws, and generally is sold to institutional investors such as a Portfolio who agree that they are purchasing the paper for investment and not with a view to public distribution. Any resale by the purchaser must be in an exempt transaction. Section 4(2) paper normally is resold to other institutional investors like the Portfolio through or with the assistance of the issuer or investment dealers who make a market in the Section 4(2) paper, thus providing liquidity. The Advisor or Subadvisor considers the legally restricted but readily saleable Section 4(2) paper to be liquid; however, pursuant to procedures approved by the Board of Trustees of the Fund, if a particular investment in Section 4(2) paper is not determined to be liquid, that investment will be included within the limitation of the particular Portfolio on illiquid securities. The Advisor or Subadvisor monitors the liquidity of each Portfolio’s investments in Section 4(2) paper on a continuing basis.
Short Sales Against-the-Box. All Portfolios (except Scudder Money Market Portfolio) may make short sales against-the-box for the purpose of, but not limited to, deferring realization of loss when deemed advantageous for federal income tax purposes. A short sale “against-the-box” is a short sale in which a Portfolio owns at least an equal amount of the securities sold short or securities convertible into or exchangeable for, without payment of any further consideration, securities of the same issue as, and at least equal in amount to, the securities sold short. The Portfolio will incur a loss as a result of the short sale if the price of the security increases between the dates of the short sale and the date on which the Portfolio replaces the borrowed security. The Portfolio will incur transaction costs, including interest expenses in connection with opening, maintaining, and closing short sales against the box. Each Portfolio does not currently intend to engage in such short sales to the extent that more than 5% of its net assets will be held as collateral.
SPECIAL RISK FACTORS. There are risks inherent in investing in any security, including shares of each Portfolio. The Advisor and, when applicable, the Subadvisor, attempts to reduce risk through a variety of means such as fundamental research, diversification and the use of Strategic Transactions; however, there is no guarantee that such efforts will be successful and each Portfolio’s returns and net asset value will fluctuate over time. There are special risks associated with each Portfolio’s investments that are discussed below.
Special Risk Factors — Foreign Securities. Scudder Aggressive Growth Portfolio, Scudder Blue Chip Portfolio, Scudder Growth Portfolio, Scudder Total Return Portfolio, Scudder Small Cap Growth Portfolio, SVS Focus Value+Growth Portfolio and Scudder INVESCO Dynamic Growth Portfolio invest mainly in US common stocks, but may invest up to 25% of total assets in foreign securities. SVS Dreman Financial Services Portfolio may invest up to 30% of total assets in foreign securities. Scudder Fixed Income Portfolio generally invests in US bonds or instruments, but up to 25% of total assets could be in bonds from foreign issuers. Scudder Technology Growth Portfolio and SVS MFS Strategic Value Portfolio invest mainly in US stocks, but may invest up to 20% of net assets in foreign securities. SVS Dreman High Return Equity Portfolio, and SVS Dreman Small Cap Value Portfolio may invest up to 20% of net assets in US Dollar-denominated American Depositary Receipts (“ADRs”) and in securities of foreign companies traded principally in securities markets outside the US. See “Investment Policies and Techniques — Options and Financial Futures Transactions — Foreign Currency Transactions.” Scudder Money Market Portfolio and Scudder Government & Agency Securities Portfolio, each within its quality standards, may also invest in securities of foreign issuers. However, such investments will be in US Dollar denominated instruments.
Investing in foreign securities involves certain special considerations, including those set forth below, which are not typically associated with investing in US securities and which may favorably or unfavorably affect a Portfolio’s performance. As foreign companies are not generally subject to uniform accounting, auditing and financial reporting standards, practices and requirements comparable to those applicable to domestic companies, there may be less publicly available information about a foreign company than about a domestic company. Many foreign securities markets, while growing in volume of trading activity, have substantially less volume than the US market, and securities of some foreign issuers are less liquid and more volatile than securities of domestic issuers. Similarly, volume and liquidity in most foreign bond markets is less than in the US and, at times, volatility of price can be greater than in the US. Fixed commissions on some foreign securities exchanges and bid to asked spreads in foreign bond markets are generally higher than commissions or bid to asked spreads on US markets, although the Advisor and Subadvisor will endeavor to achieve
S-62
the most favorable net results on its portfolio transactions. There is generally less governmental supervision and regulation of securities exchanges, brokers and listed companies in foreign countries than in the US. It may be more difficult for a Portfolio’s agents to keep currently informed about corporate actions in foreign countries which may affect the prices of portfolio securities. Communications between the US and foreign countries may be less reliable than within the US, thus increasing the risk of delayed settlements of portfolio transactions or loss of certificates for portfolio securities. Payment for securities without delivery may be required in certain foreign markets. In addition, with respect to certain foreign countries, there is the possibility of expropriation or confiscatory taxation, political or social instability, or diplomatic developments which could affect US investments in those countries. Moreover, individual foreign economies may differ favorably or unfavorably from the US economy in such respects as growth of gross national product, rate of inflation, capital reinvestment, resource self-sufficiency and balance of payments position. The management of a Portfolio seeks to mitigate the risks associated with the foregoing considerations through continuous professional management.
Special Risk Factors — Small Company Risk. Scudder Small Cap Growth Portfolio and SVS Dreman Small Cap Value Portfolio intend to invest a substantial portion of their assets in small capitalization stocks similar in size to those comprising the Russell 2000 Growth Index, Russell 2000 Index and Russell 2000 Value Index, respectively. Other Portfolios may invest in small capitalization stocks to a lesser degree. Many small companies may have sales and earnings growth rates which exceed those of larger companies and such growth rates may in turn be reflected in more rapid share price appreciation over time; however, investing in smaller company stocks involves greater risk than is customarily associated with investing in larger, more established companies. For example, smaller companies can have limited product lines, markets, or financial and managerial resources. Smaller companies may also be dependent on one or a few key persons, and may be more susceptible to losses and risks of bankruptcy. Also, the securities of smaller companies may be thinly traded (and therefore have to be sold at a discount from current market prices or sold in small lots over an extended period of time). Transaction costs in smaller company stocks may be higher than those of larger companies. Investors should therefore expect that the value of the shares of the Scudder Small Cap Growth Portfolio, SVS Dreman Small Cap Value Portfolio may be more volatile than the shares of a portfolio that invests in larger capitalization stocks.
Strategic Transactions and Derivatives (all Portfolios except Scudder Money Market Portfolio). A Portfolio may, but is not required to, utilize various other investment strategies as described below for a variety of purposes, such as hedging various market risks, managing the effective maturity or duration of fixed-income securities in a portfolio, or enhancing potential gain. These strategies may be executed through the use of derivative contracts.
In the course of pursuing these investment strategies, a Portfolio may purchase and sell exchange-listed and over-the-counter put and call options on securities, equity and fixed-income indices and other instruments, purchase and sell futures contracts and options thereon, enter into various transactions such as swaps, caps, floors, collars, currency forward contracts, currency futures contracts, currency swaps or options on currencies, or currency futures and various other currency transactions (collectively, all the above are called “Strategic Transactions”). In addition, Strategic Transactions may also include new techniques, instruments or strategies that are permitted as regulatory changes occur. Strategic Transactions may be used without limit (subject to certain limitations imposed by the 1940 Act) to attempt to protect against possible changes in the market value of securities held in or to be purchased for a Portfolio’s portfolio resulting from securities markets or currency exchange rate fluctuations, to protect a Portfolio’s unrealized gains in the value of its portfolio securities, to facilitate the sale of such securities for investment purposes, to manage the effective maturity or duration of fixed-income securities in a portfolio, or to establish a position in the derivatives markets as a substitute for purchasing or selling particular securities. Some Strategic Transactions may also be used to enhance potential gain although no more than 5% of a Portfolio’s assets (20% for SVS Index 500 Portfolio) will be committed to certain Strategic Transactions entered into for non-hedging purposes. Any or all of these investment techniques may be used at any time and in any combination, and there is no particular strategy that dictates the use of one technique rather than another, as use of any Strategic Transaction is a function of numerous variables including market conditions. The ability of a Portfolio to utilize these Strategic Transactions successfully will depend on the Advisor’s ability to predict pertinent market movements, which cannot be assured. A Portfolio will comply with applicable regulatory requirements when implementing these strategies, techniques and instruments. Strategic Transactions will not be used to alter fundamental investment purposes and characteristics of a Portfolio, and each Fund will segregate assets (or as provided by applicable regulations, enter into certain offsetting positions) to cover its obligations under options, futures and swaps to limit leveraging of a Portfolio.
S-63
Strategic Transactions, including derivative contracts, have risks associated with them including possible default by the other party to the transaction, illiquidity and, to the extent the Advisor’s or Subadvisor’s view as to certain market movements is incorrect, the risk that the use of such Strategic Transactions could result in losses greater than if they had not been used. Use of put and call options may result in losses to a Portfolio, force the sale or purchase of portfolio securities at inopportune times or for prices higher than (in the case of put options) or lower than (in the case of call options) current market values, limit the amount of appreciation a Portfolio can realize on its investments or cause a Portfolio to hold a security it might otherwise sell. The use of currency transactions can result in a Portfolio incurring losses as a result of a number of factors including the imposition of exchange controls, suspension of settlements, or the inability to deliver or receive a specified currency. The use of options and futures transactions entails certain other risks. In particular, the variable degree of correlation between price movements of futures contracts and price movements in the related portfolio position of a Portfolio creates the possibility that losses on the hedging instrument may be greater than gains in the value of a Portfolio’s position. In addition, futures and options markets may not be liquid in all circumstances and certain over-the-counter options may have no markets. As a result, in certain markets, a Portfolio might not be able to close out a transaction without incurring substantial losses, if at all. Although the use of futures and options transactions for hedging should tend to minimize the risk of loss due to a decline in the value of the hedged position, at the same time they tend to limit any potential gain which might result from an increase in value of such position. Finally, the daily variation margin requirements for futures contracts would create a greater ongoing potential financial risk than would purchases of options, where the exposure is limited to the cost of the initial premium. Losses resulting from the use of Strategic Transactions would reduce net asset value, and possibly income, and such losses can be greater than if the Strategic Transactions had not been utilized.
General Characteristics of Options. Put options and call options typically have similar structural characteristics and operational mechanics regardless of the underlying instrument on which they are purchased or sold. Thus, the following general discussion relates to each of the particular types of options discussed in greater detail below. In addition, many Strategic Transactions involving options require segregation of Portfolio assets in special accounts, as described below under “Use of Segregated and Other Special Accounts.”
A put option gives the purchaser of the option, upon payment of a premium, the right to sell, and the writer the obligation to buy, the underlying security, commodity, index, currency or other instrument at the exercise price. For instance, a Portfolio’s purchase of a put option on a security might be designed to protect its holdings in the underlying instrument (or, in some cases, a similar instrument) against a substantial decline in the market value by giving a Portfolio the right to sell such instrument at the option exercise price. A call option, upon payment of a premium, gives the purchaser of the option the right to buy, and the seller the obligation to sell, the underlying instrument at the exercise price. A Portfolio’s purchase of a call option on a security, financial future, index, currency or other instrument might be intended to protect a Portfolio against an increase in the price of the underlying instrument that it intends to purchase in the future by fixing the price at which it may purchase such instrument. An American style put or call option may be exercised at any time during the option period while a European style put or call option may be exercised only upon expiration or during a fixed period prior thereto. A Portfolio is authorized to purchase and sell exchange listed options and over-the-counter options (“OTC options”). Exchange listed options are issued by a regulated intermediary such as the Options Clearing Corporation (“OCC”), which guarantees the performance of the obligations of the parties to such options. The discussion below uses the OCC as an example, but is also applicable to other financial intermediaries.
With certain exceptions, OCC issued and exchange listed options generally settle by physical delivery of the underlying security or currency, although in the future cash settlement may become available. Index options and Eurodollar instruments are cash settled for the net amount, if any, by which the option is “in-the-money” (i.e., where the value of the underlying instrument exceeds, in the case of a call option, or is less than, in the case of a put option, the exercise price of the option) at the time the option is exercised. Frequently, rather than taking or making delivery of the underlying instrument through the process of exercising the option, listed options are closed by entering into offsetting purchase or sale transactions that do not result in ownership of the new option.
A Portfolio’s ability to close out its position as a purchaser or seller of an OCC or exchange listed put or call option is dependent, in part, upon the liquidity of the option market. Among the possible reasons for the absence of a liquid option market on an exchange are: (i) insufficient trading interest in certain options; (ii) restrictions on transactions imposed by an exchange; (iii) trading halts, suspensions or other restrictions imposed with respect to particular classes or series of options or underlying securities including reaching daily price limits; (iv) interruption of the normal operations of the OCC or an exchange; (v) inadequacy of the facilities of an exchange or OCC to handle current trading volume; or (vi) a decision by one or more exchanges to discontinue the trading of options (or a particular class or series of options), in
S-64
which event the relevant market for that option on that exchange would cease to exist, although outstanding options on that exchange would generally continue to be exercisable in accordance with their terms.
The hours of trading for listed options may not coincide with the hours during which the underlying financial instruments are traded. To the extent that the option markets close before the markets for the underlying financial instruments, significant price and rate movements can take place in the underlying markets that cannot be reflected in the option markets.
OTC options are purchased from or sold to securities dealers, financial institutions or other parties (“Counterparties”) through direct bilateral agreement with the Counterparty. In contrast to exchange listed options, which generally have standardized terms and performance mechanics, all the terms of an OTC option, including such terms as method of settlement, term, exercise price, premium, guarantees and security, are set by negotiation of the parties. A Portfolio will only sell OTC options (other than OTC currency options) that are subject to a buy-back provision permitting a Portfolio to require the Counterparty to sell the option back to a Portfolio at a formula price within seven days. A Portfolio expects generally to enter into OTC options that have cash settlement provisions, although it is not required to do so.
Unless the parties provide for it, there is no central clearing or guaranty function in an OTC option. As a result, if the Counterparty fails to make or take delivery of the security, currency or other instrument underlying an OTC option it has entered into with a Portfolio or fails to make a cash settlement payment due in accordance with the terms of that option, a Portfolio will lose any premium it paid for the option as well as any anticipated benefit of the transaction. Accordingly, the Advisor or Subadvisor must assess the creditworthiness of each such Counterparty or any guarantor or credit enhancement of the Counterparty’s credit to determine the likelihood that the terms of the OTC option will be satisfied. A Portfolio will engage in OTC option transactions only with US Government securities dealers recognized by the Federal Reserve Bank of New York as “primary dealers” or broker/dealers, domestic or foreign banks or other financial institutions which have received (or the guarantors of the obligation of which have received) a short-term credit rating of A-1 from Standard & Poor’s Ratings Services (“S&P”) or P-1 from Moody’s Investors Service (“Moody’s”) or an equivalent rating from any nationally recognized statistical rating organization (“NRSRO”) or, in the case of OTC currency transactions, are determined to be of equivalent credit quality by the Advisor or Subadvisor. The staff of the SEC currently takes the position that OTC options purchased by a Portfolio, and portfolio securities “covering” the amount of a Portfolio’s obligation pursuant to an OTC option sold by it (the cost of the sell-back plus the in-the-money amount, if any) are illiquid, and are subject to a Portfolio’s limitation on investing no more than 15% of its net assets in illiquid securities.
If a Portfolio sells a call option, the premium that it receives may serve as a partial hedge, to the extent of the option premium, against a decrease in the value of the underlying securities or instruments in its portfolio or will increase a Portfolio’s income. The sale of put options can also provide income.
A Portfolio may purchase and sell call options on securities including US Treasury and agency securities, mortgage-backed securities, foreign sovereign debt, corporate debt securities, equity securities (including convertible securities) and Eurodollar instruments that are traded on US and foreign securities exchanges and in the over-the-counter markets, and on securities indices, currencies and futures contracts. All calls sold by a Portfolio must be “covered” (i.e., a Portfolio must own the securities or futures contract subject to the call) or must meet the asset segregation requirements described below as long as the call is outstanding. Even though a Portfolio will receive the option premium to help protect it against loss, a call sold by a Portfolio exposes a Portfolio during the term of the option to possible loss of opportunity to realize appreciation in the market price of the underlying security or instrument and may require a Portfolio to hold a security or instrument which it might otherwise have sold.
A Portfolio may purchase and sell put options on securities including US Treasury and agency securities, mortgage-backed securities, foreign sovereign debt, corporate debt securities, equity securities (including convertible securities) and Eurodollar instruments (whether or not it holds the above securities in its portfolio), and on securities indices, currencies and futures contracts other than futures on individual corporate debt and individual equity securities. A Portfolio will not sell put options if, as a result, more than 50% of a Portfolio’s total assets would be required to be segregated to cover its potential obligations under such put options other than those with respect to futures and options thereon. In selling put options, there is a risk that a Portfolio may be required to buy the underlying security at a disadvantageous price above the market price.
S-65
General Characteristics of Futures. A Portfolio may enter into futures contracts or purchase or sell put and call options on such futures as a hedge against anticipated interest rate, currency or equity market changes, and for duration management, risk management and return enhancement purposes. Futures are generally bought and sold on the commodities exchanges where they are listed with payment of initial and variation margin as described below. The sale of a futures contract creates a firm obligation by a Portfolio, as seller, to deliver to the buyer the specific type of financial instrument called for in the contract at a specific future time for a specified price (or, with respect to index futures and Eurodollar instruments, the net cash amount). Options on futures contracts are similar to options on securities except that an option on a futures contract gives the purchaser the right in return for the premium paid to assume a position in a futures contract and obligates the seller to deliver such position.
The portfolios have claimed exclusion from the definition of the term “commodity pool operator” adopted by the CFTC and the National Futures Association, which regulate trading in the futures markets. Therefore, the Portfolios are not subject to commodity pool operator registration and regulation under the Commodity Exchange Act. Futures and options on futures may be entered into for bona fide hedging, risk management (including duration management) or other portfolio and return enhancement management purposes to the extent consistent with the exclusion from commodity pool operator registration. Typically, maintaining a futures contract or selling an option thereon requires a Portfolio to deposit with a financial intermediary as security for its obligations an amount of cash or other specified assets (initial margin) which initially is typically 1% to 10% of the face amount of the contract (but may be higher in some circumstances). Additional cash or assets (variation margin) may be required to be deposited thereafter on a daily basis as the mark to market value of the contract fluctuates. The purchase of an option on financial futures involves payment of a premium for the option without any further obligation on the part of a Portfolio. If a Portfolio exercises an option on a futures contract it will be obligated to post initial margin (and potential subsequent variation margin) for the resulting futures position just as it would for any position. Futures contracts and options thereon are generally settled by entering into an offsetting transaction but there can be no assurance that the position can be offset prior to settlement at an advantageous price, nor that delivery will occur.
Options on Securities Indices and Other Financial Indices. A Portfolio also may purchase and sell call and put options on securities indices and other financial indices and in so doing can achieve many of the same objectives it would achieve through the sale or purchase of options on individual securities or other instruments. Options on securities indices and other financial indices are similar to options on a security or other instrument except that, rather than settling by physical delivery of the underlying instrument, they settle by cash settlement, i.e., an option on an index gives the holder the right to receive, upon exercise of the option, an amount of cash if the closing level of the index upon which the option is based exceeds, in the case of a call, or is less than, in the case of a put, the exercise price of the option (except if, in the case of an OTC option, physical delivery is specified). This amount of cash is equal to the excess of the closing price of the index over the exercise price of the option, which also may be multiplied by a formula value. The seller of the option is obligated, in return for the premium received, to make delivery of this amount. The gain or loss on an option on an index depends on price movements in the instruments making up the market, market segment, industry or other composite on which the underlying index is based, rather than price movements in individual securities, as is the case with respect to options on securities.
Currency Transactions. A Portfolio may engage in currency transactions with Counterparties primarily in order to hedge, or manage the risk of the value of portfolio holdings denominated in particular currencies against fluctuations in relative value. Currency transactions include forward currency contracts, exchange listed currency futures, exchange listed and OTC options on currencies, and currency swaps. A forward currency contract involves a privately negotiated obligation to purchase or sell (with delivery generally required) a specific currency at a future date, which may be any fixed number of days from the date of the contract agreed upon by the parties, at a price set at the time of the contract. A currency swap is an agreement to exchange cash flows based on the notional difference among two or more currencies and operates similarly to an interest rate swap, which is described below. A Portfolio may enter into currency transactions with Counterparties which have received (or the guarantors of the obligations which have received) a credit rating of A-1 or P-1 by S&P or Moody’s, respectively, or that have an equivalent rating from a NRSRO or (except for OTC currency options) are determined to be of equivalent credit quality by the Advisor or Subadvisor.
A Portfolio’s dealings in forward currency contracts and other currency transactions such as futures, options, options on futures and swaps generally will be limited to hedging involving either specific transactions or portfolio positions except as described below. Transaction hedging is entering into a currency transaction with respect to specific assets or liabilities of a Portfolio, which will generally arise in connection with the purchase or sale of its portfolio securities or the
S-66
receipt of income therefrom. Position hedging is entering into a currency transaction with respect to portfolio security positions denominated in, exposed to or generally quoted in that currency.
A Portfolio generally will not enter into a transaction to hedge currency exposure to an extent greater, after netting all transactions intended wholly or partially to offset other transactions, than the aggregate market value (at the time of entering into the transaction) of the securities held in its portfolio that are denominated in, exposed to or generally quoted in or currently convertible into such currency, other than with respect to proxy hedging or cross hedging as described below.
A Portfolio may also cross-hedge currencies by entering into transactions to purchase or sell one or more currencies that are expected to decline in value relative to other currencies to which a Portfolio has or in which a Portfolio expects to have portfolio exposure.
To reduce the effect of currency fluctuations on the value of existing or anticipated holdings of portfolio securities, a Portfolio may also engage in proxy hedging. Proxy hedging is often used when the currency to which a Portfolio’s portfolio is exposed is difficult to hedge or to hedge against the dollar. Proxy hedging entails entering into a commitment or option to sell a currency whose changes in value are generally considered to be correlated to a currency or currencies in which some or all of a Portfolio’s portfolio securities are or are expected to be denominated, in exchange for US dollars. The amount of the commitment or option would not exceed the value of a Portfolio’s securities denominated in correlated currencies. Currency hedging involves some of the same risks and considerations as other transactions with similar instruments. Currency transactions can result in losses to a Portfolio if the currency being hedged fluctuates in value to a degree or in a direction that is not anticipated. Further, there is the risk that the perceived correlation between various currencies may not be present or may not be present during the particular time that a Portfolio is engaging in proxy hedging. If a Portfolio enters into a currency hedging transaction, a Portfolio will comply with the asset segregation requirements described below.
Risks of Currency Transactions. Currency transactions are subject to risks different from those of other portfolio transactions. Because currency control is of great importance to the issuing governments and influences economic planning and policy, purchases and sales of currency and related instruments can be negatively affected by government exchange controls, blockages, and manipulations or exchange restrictions imposed by governments. These can result in losses to a Portfolio if it is unable to deliver or receive currency or funds in settlement of obligations and could also cause hedges it has entered into to be rendered useless, resulting in full currency exposure as well as incurring transaction costs. Buyers and sellers of currency futures are subject to the same risks that apply to the use of futures generally. Further, settlement of a currency futures contract for the purchase of most currencies must occur at a bank based in the issuing nation. Trading options on currency futures is relatively new, and the ability to establish and close out positions on such options is subject to the maintenance of a liquid market which may not always be available. Currency exchange rates may fluctuate based on factors extrinsic to that country’s economy.
Combined Transactions. A Portfolio may enter into multiple transactions, including multiple options transactions, multiple futures transactions, multiple currency transactions (including forward currency contracts) and multiple interest rate transactions and any combination of futures, options, currency and interest rate transactions (“component” transactions), instead of a single Strategic Transaction, as part of a single or combined strategy when, in the opinion of the Advisor or Subadvisor, it is in the best interests of a Portfolio to do so. A combined transaction will usually contain elements of risk that are present in each of its component transactions. Although combined transactions are normally entered into based on the Advisor’s or Subadvisor’s judgment that the combined strategies will reduce risk or otherwise more effectively achieve the desired portfolio management goal, it is possible that the combination will instead increase such risks or hinder achievement of the portfolio management objective.
Swaps, Caps, Floors and Collars. Among the Strategic Transactions into which a Portfolio may enter are interest rate, currency, index and other swaps and the purchase or sale of related caps, floors and collars. A Portfolio expects to enter into these transactions primarily to preserve a return or spread on a particular investment or portion of its portfolio, to protect against currency fluctuations, as a duration management technique or to protect against any increase in the price of securities a Portfolio anticipates purchasing at a later date. A Portfolio will not sell interest rate caps or floors where it does not own securities or other instruments providing the income stream a Portfolio may be obligated to pay. Interest rate swaps involve the exchange by a Portfolio with another party of their respective commitments to pay or receive interest, e.g., an exchange of floating rate payments for fixed rate payments with respect to a notional amount of principal. A currency swap is an agreement to exchange cash flows on a notional amount of two or more currencies
S-67
based on the relative value differential among them and an index swap is an agreement to swap cash flows on a notional amount based on changes in the values of the reference indices. The purchase of a cap entitles the purchaser to receive payments on a notional principal amount from the party selling such cap to the extent that a specified index exceeds a predetermined interest rate or amount. The purchase of a floor entitles the purchaser to receive payments on a notional principal amount from the party selling such floor to the extent that a specified index falls below a predetermined interest rate or amount. A collar is a combination of a cap and a floor that preserves a certain return within a predetermined range of interest rates or values.
A Portfolio will usually enter into swaps on a net basis, i.e., the two payment streams are netted out in a cash settlement on the payment date or dates specified in the instrument, with a Portfolio receiving or paying, as the case may be, only the net amount of the two payments. Inasmuch as a Portfolio will segregate assets (or enter into offsetting positions) to cover its obligations under swaps, the Advisor and a Portfolio believe such obligations do not constitute senior securities under the 1940 Act and, accordingly, will not treat them as being subject to its borrowing restrictions. A Portfolio will not enter into any swap, cap, floor or collar transaction unless, at the time of entering into such transaction, the unsecured long-term debt of the Counterparty, combined with any credit enhancements, is rated at least A by S&P or Moody’s or has an equivalent rating from a NRSRO or is determined to be of equivalent credit quality by the Advisor. If there is a default by the Counterparty, a Portfolio may have contractual remedies pursuant to the agreements related to the transaction. The swap market has grown substantially in recent years with a large number of banks and investment banking firms acting both as principals and as agents utilizing standardized swap documentation. As a result, the swap market has become relatively liquid. Caps, floors and collars are more recent innovations for which standardized documentation has not yet been fully developed and, accordingly, they are less liquid than swaps.
Eurodollar Instruments. A Portfolio may make investments in Eurodollar instruments. Eurodollar instruments are US dollar-denominated futures contracts or options thereon which are linked to the London Interbank Offered Rate (“LIBOR”), although foreign currency-denominated instruments are available from time to time. Eurodollar futures contracts enable purchasers to obtain a fixed rate for the lending of funds and sellers to obtain a fixed rate for borrowings. A Portfolio might use Eurodollar futures contracts and options thereon to hedge against changes in LIBOR, to which many interest rate swaps and fixed income instruments are linked.
Risks of Strategic Transactions Outside the US. When conducted outside the US, Strategic Transactions may not be regulated as rigorously as in the US, may not involve a clearing mechanism and related guarantees, and are subject to the risk of governmental actions affecting trading in, or the prices of, foreign securities, currencies and other instruments. The value of such positions also could be adversely affected by: (i) other complex foreign political, legal and economic factors, (ii) lesser availability than in the US of data on which to make trading decisions, (iii) delays in a Portfolio’s ability to act upon economic events occurring in foreign markets during non-business hours in the US, (iv) the imposition of different exercise and settlement terms and procedures and margin requirements than in the US, and (v) lower trading volume and liquidity.
Use of Segregated and Other Special Accounts. Many Strategic Transactions, in addition to other requirements, require that a Portfolio segregate cash or liquid assets with its custodian to the extent Fund obligations are not otherwise “covered” through ownership of the underlying security, financial instrument or currency. In general, either the full amount of any obligation by a Portfolio to pay or deliver securities or assets must be covered at all times by the securities, instruments or currency required to be delivered, or, subject to any regulatory restrictions, an amount of cash or liquid assets at least equal to the current amount of the obligation must be segregated with the custodian. The segregated assets cannot be sold or transferred unless equivalent assets are substituted in their place or it is no longer necessary to segregate them. For example, a call option written by a Portfolio will require a Portfolio to hold the securities subject to the call (or securities convertible into the needed securities without additional consideration) or to segregate cash or liquid assets sufficient to purchase and deliver the securities if the call is exercised. A call option sold by a Portfolio on an index will require a Portfolio to own portfolio securities which correlate with the index or to segregate cash or liquid assets equal to the excess of the index value over the exercise price on a current basis. A put option written by a Portfolio requires a Portfolio to segregate cash or liquid assets equal to the exercise price.
Except when a Portfolio enters into a forward contract for the purchase or sale of a security denominated in a particular currency, which requires no segregation, a currency contract which obligates a Portfolio to buy or sell currency will generally require a Portfolio to hold an amount of that currency or liquid assets denominated in that currency equal to a Portfolio’s obligations or to segregate cash or liquid assets equal to the amount of a Portfolio’s obligation.
S-68
OTC options entered into by a Portfolio, including those on securities, currency, financial instruments or indices and OCC issued and exchange listed index options, will generally provide for cash settlement. As a result, when a Portfolio sells these instruments it will only segregate an amount of cash or liquid assets equal to its accrued net obligations, as there is no requirement for payment or delivery of amounts in excess of the net amount. These amounts will equal 100% of the exercise price in the case of a non cash-settled put, the same as an OCC guaranteed listed option sold by a Portfolio, or the in-the-money amount plus any sell-back formula amount in the case of a cash-settled put or call. In addition, when a Portfolio sells a call option on an index at a time when the in-the-money amount exceeds the exercise price, a Portfolio will segregate, until the option expires or is closed out, cash or cash equivalents equal in value to such excess. OCC issued and exchange listed options sold by a Portfolio other than those above generally settle with physical delivery, or with an election of either physical delivery or cash settlement and a Portfolio will segregate an amount of cash or liquid assets equal to the full value of the option. OTC options settling with physical delivery, or with an election of either physical delivery or cash settlement will be treated the same as other options settling with physical delivery.
In the case of a futures contract or an option thereon, a Portfolio must deposit initial margin and possible daily variation margin in addition to segregating cash or liquid assets sufficient to meet its obligation to purchase or provide securities or currencies, or to pay the amount owed at the expiration of an index-based futures contract. Such liquid assets may consist of cash, cash equivalents, liquid debt or equity securities or other acceptable assets.
With respect to swaps, a Portfolio will accrue the net amount of the excess, if any, of its obligations over its entitlements with respect to each swap on a daily basis and will segregate an amount of cash or liquid assets having a value equal to the accrued excess. Caps, floors and collars require segregation of assets with a value equal to a Portfolio’s net obligation, if any.
Strategic Transactions may be covered by other means when consistent with applicable regulatory policies. A Portfolio may also enter into offsetting transactions so that its combined position, coupled with any segregated assets, equals its net outstanding obligation in related options and Strategic Transactions. For example, a Portfolio could purchase a put option if the strike price of that option is the same or higher than the strike price of a put option sold by a Portfolio. Moreover, instead of segregating cash or liquid assets if a Portfolio held a futures or forward contract, it could purchase a put option on the same futures or forward contract with a strike price as high or higher than the price of the contract held. Other Strategic Transactions may also be offset in combinations. If the offsetting transaction terminates at the time of or after the primary transaction no segregation is required, but if it terminates prior to such time, cash or liquid assets equal to any remaining obligation would need to be segregated.
Warrants. Each Portfolio (except Scudder Money Market Portfolio) may invest in warrants up to five percent of the value of its respective net assets. The holder of a warrant has the right, until the warrant expires, to purchase a given number of shares of a particular issuer at a specified price. Such investments can provide a greater potential for profit or loss than an equivalent investment in the underlying security. Prices of warrants do not necessarily move, however, in tandem with the prices of the underlying securities and are, therefore, considered speculative investments. Warrants pay no dividends and confer no rights other than a purchase option. Thus, if a warrant held by a Portfolio were not exercised by the date of its expiration, a Portfolio would lose the entire purchase price of the warrant.
Zero Coupon Government Securities. Subject to its investment objective and policies, a Portfolio may invest in zero coupon US Government securities. Zero coupon bonds are purchased at a discount from the face amount. The buyer receives only the right to receive a fixed payment on a certain date in the future and does not receive any periodic interest payments. These securities may include those created directly by the US Treasury and those created as collateralized obligations through various proprietary custodial, trust or other relationships. The effect of owning instruments which do not make current interest payments is that a fixed yield is earned not only on the original investment but also, in effect, on all discount accretion during the life of the obligations. This implicit reinvestment of earnings at the same rate eliminates the risk of being unable to reinvest distributions at a rate as high as the implicit yield on the zero coupon bond, but at the same time eliminates any opportunity to reinvest earnings at higher rates. For this reason, zero coupon bonds are subject to substantially greater price fluctuations during periods of changing market interest rates than those of comparable securities that pay interest currently, which fluctuation is greater as the period to maturity is longer. Zero coupon bonds created as collateralized obligations are similar to those created through the US Treasury, but the former investments do not provide absolute certainty of maturity or of cash flows after prior classes of the collateralized obligations are retired. No Portfolio currently intends to invest more than 20% of its net assets in zero coupon US Government securities.
S-69
MANAGEMENT OF THE FUND
Investment Advisor
Deutsche Investment Management Americas Inc. (“DeIM” or the “Advisor”), which is part of Deutsche Asset Management (DeAM), is the investment advisor for each Portfolio. Under the supervision of the Board of Trustees of the Fund, DeIM, with headquarters at 345 Park Avenue, New York, New York, makes the Portfolios’ investment decisions, buys and sells securities for each Portfolio and conducts research that leads to these purchase and sale decisions. DeIM and its predecessors have more than 80 years of experience managing mutual funds. DeIM provides a full range of investment advisory services to institutional and retail clients. The Fund’s investment advisor is also responsible for selecting brokers and dealers and for negotiating brokerage commissions and dealer charges.
Deutsche Asset Management is the marketing name in the US for the asset management activities of Deutsche Bank AG, DeIM, Deutsche Asset Management Inc., Deutsche Asset Management Investment Services Ltd., Deutsche Bank Trust Company Americas and Scudder Trust Company. Deutsche Asset Management is a global asset management organization that offers a wide range of investing expertise and resources, including hundreds of portfolio managers and analysts and an office network that reaches the world’s major investment centers. This well-resourced global investment platform brings together a wide variety of experience and investment insight, across industries, regions, asset classes and investing styles. DeIM is an indirect, wholly owned subsidiary of Deutsche Bank AG. Deutsche Bank AG is a major global banking institution that is engaged in a wide range of financial services, including investment management, mutual fund, retail, private and commercial banking, investment banking and insurance.
DeIM, together with its predecessors, is one of the most experienced investment counsel firms in the US. Scudder was established as a partnership in 1919 and pioneered the practice of providing investment counsel to individual clients on a fee basis. In 1928, it introduced the first no-load mutual fund to the public. In 1953, Scudder introduced Scudder International Fund, Inc., the first mutual fund available in the US investing internationally in securities of issuers in several foreign countries. The predecessor firm to DeIM, Zurich Scudder Investments, Inc. (“Scudder”) reorganized from a partnership to a corporation on June 28, 1985. On December 31, 1997, Zurich Insurance Company (“Zurich”) acquired a majority interest in Scudder, and Zurich Kemper Investments, Inc., a Zurich subsidiary, became part of Scudder. Scudder’s name was changed to Scudder Kemper Investments, Inc. On January 1, 2001, Scudder changed its name from Scudder Kemper Investments, Inc. to Zurich Scudder Investments, Inc. On April 5, 2002, 100% of Scudder, not including certain UK operations (known as Threadneedle Investments), was acquired by Deutsche Bank AG.
The Advisor or a subadvisor manages each Portfolio’s daily investment and business affairs subject to the policies established by the Board of Trustees.
Pursuant to an investment management agreement with each Portfolio (each an “Agreement,” and collectively, the “Agreements”), the Advisor acts as each Portfolio’s investment advisor, manages its investments, administers its business
S-70
affairs, furnishes office facilities and equipment, provides clerical and administrative services and permits its officers and employees to serve without compensation as trustees or officers of one or both funds if elected to such positions. To the extent permissible by law, the Advisor may appoint certain of its affiliates as sub-advisors to perform certain of the Advisor’s duties.
The Advisor provides investment counsel for many individuals and institutions, including insurance companies, industrial corporations, and financial and banking organizations, as well as providing investment advice to open- and closed-end SEC registered funds.
The Advisor maintains a large research department, which conducts continuous studies of the factors that affect the position of various industries, companies and individual securities. The Advisor receives published reports and statistical compilations from issuers and other sources, as well as analyses from brokers and dealers who may execute portfolio transactions for the Advisor’s clients. However, the Advisor regards this information and material as an adjunct to its own research activities. The Advisor’s international investment management team travels the world, researching hundreds of companies. In selecting the securities in which the Portfolios may invest, the conclusions and investment decisions of the Advisor with respect to the Portfolios are based primarily on the analyses of its own research department.
In certain cases, the investments for a Portfolio are managed by the same individuals who manage one or more other mutual funds advised by the Advisor, that have similar names, objectives and investment styles. You should be aware that the Portfolios are likely to differ from these other mutual funds in size, cash flow pattern and tax matters. Accordingly, the holdings and performance of the Portfolios can be expected to vary from those of these other mutual funds.
Certain investments may be appropriate for a Portfolio and also for other clients advised by the Advisor. Investment decisions for a fund and other clients are made with a view to achieving their respective investment objectives and after consideration of such factors as their current holdings, availability of cash for investment and the size of their investments generally. Frequently, a particular security may be bought or sold for only one client or in different amounts and at different times for more than one but less than all clients. Likewise, a particular security may be bought for one or more clients when one or more other clients are selling the security. In addition, purchases or sales of the same security may be made for two or more clients on the same day. In such event, such transactions will be allocated among the clients in a manner believed by the Advisor to be equitable to each. In some cases, this procedure could have an adverse effect on the price or amount of the securities purchased or sold by a Portfolio. Purchase and sale orders for a Portfolio may be combined with those of other clients of the Advisor in the interest of achieving the most favorable net results to that Portfolio.
Each Portfolio is managed by a team of investment professionals who each play an important role in a Portfolio’s management process. Team members work together to develop investment strategies and select securities for a Portfolio. This team works for the Advisor or its affiliates and is supported by a large staff of economists, research analysts, traders and other investment specialists. The Advisor or its affiliates believe(s) its team approach benefits Portfolio investors by bringing together many disciplines and leveraging its extensive resources. Team members with primary responsibility for management of the Portfolios, as well as team members who have other ongoing management responsibilities for each Portfolio, are identified in each Portfolio’s prospectus, as of the date of the Portfolio’s prospectus. Composition of the team may change over time, and Portfolio shareholders and investors will be notified of changes affecting individuals with primary Portfolio management responsibility.
S-71
The current Agreements for all Portfolios were last renewed by the Trustees on August 12, 2003. Each Agreement continues in effect until September 30, 2004 and from year to year thereafter only if their continuance is approved annually by the vote of a majority of those Trustees who are not parties to such Agreements or interested persons of the Advisor or the Fund, cast in person at a meeting called for the purpose of voting on such approval, and either by a vote of the Fund’s Trustees or of a majority of the outstanding voting securities of the respective Portfolio. The Agreements may be terminated at any time without payment of penalty by either party on sixty days’ written notice and automatically terminate in the event of their assignment.
Under the Agreements, the Advisor regularly provides the Portfolios with investment research, advice and supervision and furnishes continuously an investment program consistent with the investment objectives and policies of each Portfolio, and determines, for each Portfolio, what securities shall be purchased, what securities shall be held or sold, and what portion of a Portfolio’s assets shall be held uninvested, subject always to the provisions of the Fund’s Declaration of Trust and By-Laws, and of the 1940 Act and to a Portfolio’s investment objectives, policies and restrictions, and subject further to such policies and instructions as the Trustees may from time to time establish. The Advisor also advises and assists the officers of the Fund in taking such steps as are necessary or appropriate to carry out the decisions of its Trustees and the appropriate committees of the Trustees regarding the conduct of the business of the Fund.
Under the Agreements, the Advisor also renders significant administrative services (not otherwise provided by third parties) necessary for each Portfolio’s operations as an open-end investment company including, but not limited to, preparing reports and notices to the Trustees and shareholders; supervising, negotiating contractual arrangements with, and monitoring various third-party service providers to the Portfolios (such as the Portfolios’ transfer agent, pricing agents, custodian, accountants and others); preparing and making filings with the SEC and other regulatory agencies; assisting in the preparation and filing of each Portfolio’s federal, state and local tax returns; preparing and filing the Fund’s federal excise tax returns; assisting with investor and public relations matters; monitoring the valuation of securities and the calculation of net asset value, monitoring the registration of shares of the Fund under applicable federal and state securities laws; maintaining each Portfolio’s books and records to the extent not otherwise maintained by a third party; assisting in establishing accounting policies of the Fund; assisting in the resolution of accounting and legal issues; establishing and monitoring each Portfolio’s operating budget; processing the payment of each Portfolio’s bills; assisting the Fund and the Portfolios in, and otherwise arranging for, the payment of distributions and dividends and otherwise assisting the Fund and the Portfolios in the conduct of their business, subject to the direction and control of the Trustees.
Pursuant to a sub-accounting and administrator agreement among the Advisor, SFAC and State Street Bank and Trust Company (“SSB”), the Advisor has delegated certain administrative functions to SSB under the fund’s investment management agreements. The costs and expenses of such delegation are borne by the Advisor, not by the Fund.
For its investment management services, the Advisor receives compensation monthly at the following annual rates from each Portfolio:
| | | |
Portfolio
| | Fee Rate
| |
Scudder Blue Chip Portfolio | | 0.650 | % |
Scudder Large Cap Value Portfolio | | 0.750 | % |
Scudder Fixed Income Portfolio | | 0.600 | % |
Scudder Government & Agency Securities Portfolio | | 0.550 | % |
Scudder Growth Portfolio | | 0.600 | % |
Scudder High Income Portfolio | | 0.600 | % |
Scudder International Select Equity Portfolio | | 0.750 | % |
Scudder Money Market Portfolio | | 0.500 | % |
Scudder Small Cap Growth Portfolio | | 0.650 | % |
Scudder Strategic Income Portfolio | | 0.650 | % |
Scudder Total Return Portfolio | | 0.550 | % |
S-72
| | | |
Portfolio
| | Fee Rate
| |
SVS Dreman Small Cap Value Portfolio | | 0.750 | % |
SVS Focus Value+Growth Portfolio | | 0.750 | % |
Scudder Aggressive Growth Portfolio, SVS Dreman Financial Services Portfolio, SVS Dreman High Return Equity Portfolio, and Scudder Technology Growth Portfolio each pay the Advisor a graduated investment management fee, based on the average daily net assets of the Portfolio, payable monthly, at the annual rates shown below:
| | | |
Average Daily Net Assets of the Portfolio
| | Fee Rate
| |
$0-$250 million | | 0.750 | % |
next $750 million | | 0.720 | % |
next $1.5 billion | | 0.700 | % |
next $2.5 billion | | 0.680 | % |
next $2.5 billion | | 0.650 | % |
next $2.5 billion | | 0.640 | % |
next $2.5 billion | | 0.630 | % |
Over $12.5 billion | | 0.620 | % |
Scudder Global Blue Chip Portfolio pays the Advisor a graduated investment management fee, based on the average daily net assets of the Portfolio, payable monthly, at the annual rates shown below:
| | | |
Average Daily Net Assets of the Portfolio
| | Fee Rate
| |
$0-$250 million | | 1.000 | % |
next $500 million | | 0.950 | % |
next $750 million | | 0.900 | % |
next $1.5 billion | | 0.850 | % |
Over $3 billion | | 0.800 | % |
SVS Index 500 Portfolio pays the Advisor a graduated investment fee based on the average daily net assets of the Portfolio, payable monthly, at the annual rates shown below:
| | | |
Average Daily Net Assets of the Portfolio
| | Fee Rate
| |
$0-$250 million | | 0.370 | % |
next $250 million | | 0.330 | % |
next $500 million | | 0.310 | % |
next $1.5 billion | | 0.295 | % |
Over $2.5 billion | | 0.270 | % |
SVS INVESCO Dynamic Growth Portfolio and SVS Turner Mid Cap Growth Portfolio each pay the Advisor a graduated investment management fee based on the average daily net assets of a Portfolio, payable monthly, at the annual rates shown below:
| | | |
Average Daily Net Assets of the Portfolio
| | Fee Rate
| |
$0-$250 million | | 1.000 | % |
next $250 million | | 0.975 | % |
next $500 million | | 0.950 | % |
next $1.5 billion | | 0.925 | % |
Over $2.5 billion | | 0.900 | % |
SVS Eagle Focused Large Cap Growth Portfolio, SVS Janus Growth And Income Portfolio, SVS Janus Growth Opportunities Portfolio, SVS Oak Strategic Equity Portfolio and SVS Davis Venture Value Portfolio each pay the
S-73
Advisor a graduated investment management fee based on the average daily net assets of the Portfolio, payable monthly, at the annual rates shown below:
| | | |
Average Daily Net Assets of the Portfolio
| | Fee Rate
| |
$0-$250 million | | 0.950 | % |
next $250 million | | 0.925 | % |
next $500 million | | 0.900 | % |
next $1.5 billion | | 0.875 | % |
Over $2.5 billion | | 0.850 | % |
SVS MFS Strategic Value Portfolio pays the Advisor a graduated investment management fee based on the average daily net assets of Portfolio, payable monthly, at the annual rates shown below:
| | | |
Average Daily Net Assets of the Portfolio
| | Fee Rate
| |
$0-$250 million | | 0.950 | % |
$250-$500 million | | 0.925 | % |
$500 million-$1 billion | | 0.900 | % |
$1 billion-$1.5 billion | | 0.825 | % |
$1.5 billion-$2.5 billion | | 0.800 | % |
Over $2.5 billion | | 0.775 | % |
The investment management fees paid by each Portfolio for its last three fiscal years are shown in the table below:
| | | | | | | | | | |
Portfolio
| | Fiscal 2003
| | | Fiscal 2002
| | Fiscal 2001
|
Scudder Aggressive Growth Portfolio | | $ | 379,697 | (4) | | $ | 410,143 | | $ | 483,759 |
Scudder Blue Chip Portfolio | | $ | 1,406,973 | | | $ | 1,373,856 | | $ | 1,442,334 |
Scudder Large Cap Value Portfolio | | $ | 1,728,833 | | | $ | 1,869,062 | | $ | 1,710,166 |
Scudder Fixed Income Portfolio | | $ | 1,453,086 | | | $ | 1,056,716 | | $ | 619,125 |
Scudder Global Blue Chip Portfolio | | $ | 476,692 | (6) | | $ | 454,436 | | $ | 360,873 |
Scudder Government & Agency Securities Portfolio | | $ | 2,701,849 | | | $ | 2,330,550 | | $ | 1,288,534 |
Scudder Growth Portfolio | | $ | 1,735,405 | | | $ | 1,930,712 | | $ | 2,797,103 |
Scudder High Income Portfolio | | $ | 2,301,804 | | | $ | 1,907,361 | | $ | 1,817,767 |
Scudder International Select Equity Portfolio | | $ | 962,216 | | | $ | 835,181 | | $ | 1,082,916 |
Scudder Money Market Portfolio | | $ | 2,504,325 | | | $ | 2,991,068 | | $ | 2,318,839 |
Scudder Small Cap Growth Portfolio | | $ | 1,195,267 | | | $ | 1,216,116 | | $ | 1,542,283 |
Scudder Strategic Income Portfolio | | $ | 435,782 | | | $ | 256,045 | | $ | 94,858 |
Scudder Technology Growth Portfolio | | $ | 1,620,836 | | | $ | 2,050,402 | | $ | 2,370,718 |
Scudder Total Return Portfolio | | $ | 3,591,741 | | | $ | 4,163,477 | | $ | 4,673,078 |
SVS Davis Venture Value Portfolio(1) | | $ | 1,812,833 | | | $ | 1,419,371 | | $ | 262,447 |
SVS Dreman Financial Services Portfolio | | $ | 977,258 | | | $ | 964,831 | | $ | 650,194 |
SVS Dreman High Return Equity Portfolio | | $ | 4,278,201 | | | $ | 3,846,139 | | $ | 2,030,660 |
SVS Dreman Small Cap Value Portfolio | | $ | 2,170,456 | | | $ | 1,932,765 | | $ | 908,121 |
SVS Eagle Focused Large Cap Growth Portfolio | | $ | 732,724 | | | $ | 629,622 | | $ | 351,121 |
SVS Focus Value+Growth Portfolio | | $ | 800,121 | (3) | | $ | 905,500 | | $ | 1,057,299 |
SVS Index 500 Portfolio(8) | | $ | 1,002,180 | | | $ | 933,197 | | $ | 615,130 |
SVS INVESCO Dynamic Growth Portfolio(1) | | $ | 304,792 | (5) | | $ | 253,612 | | $ | 65,026 |
SVS Janus Growth And Income Portfolio | | $ | 1,721,907 | | | $ | 1,734,797 | | $ | 1,222,426 |
SVS Janus Growth Opportunities Portfolio | | $ | 1,194,758 | | | $ | 1,319,879 | | $ | 1,394,470 |
SVS MFS Strategic Value Portfolio(2) | | $ | 97,981 | (7) | | $ | 24,692 | | | n/a |
SVS Oak Strategic Equity Portfolio(1) | | $ | 568,504 | | | $ | 411,997 | | $ | 112,052 |
SVS Turner Mid Cap Growth Portfolio(1) | | $ | 861,498 | | | $ | 614,364 | | $ | 112,802 |
| (1) | Commenced operations on May 1, 2001. |
S-74
| (2) | Commenced operations on May 1, 2002. |
| (3) | For the year ended December 31, 2003 the Advisor agreed to limit its fees and reimburse expenses of each class of the SVS Focus Value+Growth Portfolio to the extent necessary to maintain the annualized expenses of Class A at 0.84% and Class B at 1.09%. Effective May 1, 2003 the Advisor increased the expense limitation for Class B to 1.24%. Accordingly, for the year ended December 31, 2003 the Advisor waived $6,300 of management fee and the fees pursuant to the Management Agreement was equivalent to an annual effective rate of 0.74% of the Portfolio’s average daily net assets. |
| (4) | For the year ended December 31, 2003 the Advisor agreed to limit its fees and reimburse expenses of each class of the Scudder Aggressive Growth Portfolio to the extent necessary to maintain the annualized expenses of Class A at 0.95% and Class B at 1.20%. Effective May 1, 2003 the Advisor increased the expense limitation for Class B to 1.35%. For the year ended December 31, 2003 the Advisor waived $15,030 of management fees. |
| (5) | For the year ended December 31, 2003 the Advisor agreed to limit its fees and reimburse expenses of each class of the SVS INVESCO Dynamic Growth Portfolio to the extent necessary to maintain the annualized expenses of Class A at 1.30% and Class B at 1.55%. Effective May 1, 2003 the Advisor increased the expense limitation for Class B to 1.70%. For the year ended December 31, 2003 the Advisor waived $48,767 of management fees. |
| (6) | The Advisor agreed to limit its management fee to 0.85% for the Scudder Global Blue Chip Portfolio through April 30, 2003. Accordingly, for the year ended December 31, 2003 the Advisor waived $142,979 of management fee and the fees pursuant to the Management Agreement were equivalent to an annual effective rate of 0.70% for the Portfolio’s average daily net assets. |
| (7) | For the year ended December 31, 2003 the Advisor agreed to limit its fees and reimburse expenses of each class of the SVS MFS Strategic Value Portfolio to the extent necessary to maintain the annualized expenses of Class A at 1.15% and Class B at 1.40%. Effective May 1, 2003 the Advisor increased the expense limitation for Class B to 1.55%. Accordingly, for the year ended December 31, 2003 the Advisor waived $80,609 of management fee and the fees pursuant to the Management Agreement were equivalent to an annual effective rate of 0.17% of the Portfolio’s average daily net assets. |
| (8) | Effective April 5, 2002, the sub-advisor agreement between the SVS Index 500 Portfolio and Deutsche Asset Management, Inc. was terminated and the investment management fee was lowered. Prior to April 5, 2002, the Portfolio paid the Advisor an investment management fee of 0.440% of the first $200 million of the Portfolio’s average daily net assets, 0.400% of the next $550 million of the Portfolio’s average daily net assets, 0.380% of the next $1.25 billion of the Portfolio’s average daily net assets, 0.365% of the next $3 billion of the Portfolio’s average daily net assets and 0.335% of such assets in excess of $5 billion. |
Subadvisor to SVS Index 500 Portfolio
Effective April 30, 2003, Northern Trust Investments, N.A. (“NTI”), 50 South LaSalle Street, Chicago, Illinois is the subadvisor for SVS Index 500 Portfolio. NTI has managed accounts, including registered investment companies, designed to mirror the performance of the same index as the Portfolio seeks to replicate. NTI primarily manages assets for defined contribution and benefit plans, investment companies and other institutional investors. As of December 31, 2003, NTI had approximately $243.6 billion in assets under management.
DeIM pays a fee to NTI for serving as subadvisor to SVS Index 500 Portfolio as shown below:
| | | |
Average Daily Net Assets
| | Annualized Rate
| |
On the first $2 billion | | 0.015 | % |
On the next $2 billion | | 0.010 | % |
Over $4 billion | | 0.005 | % |
S-75
For the fiscal year ended December 31, 2003, the fee paid by DeIM to NTI was as follows:
| | | |
| | | 2003
|
SVS Index 500 Portfolio | | $ | 31,149 |
Subadvisor to Scudder International Select Equity Portfolio and Scudder Strategic Income Portfolio. Effective May 1, 2002 for Scudder International Select Equity Portfolio and September 2, 2002 for Scudder Strategic Income Portfolio, Deutsche Asset Management Investment Services Limited (“DeAMIS”), One Appold Street, London, England, an affiliate of the Advisor, is the subadvisor for Scudder International Select Equity Portfolio and Scudder Strategic Income Portfolio. DeAMIS serves as subadvisor pursuant to the terms of a sub-advisory agreement between it and the Advisor. Under the terms of each sub-advisory agreement, DeAMIS manages the investment and reinvestment of the Portfolio’s portfolios and will provide such investment advice, research and assistance as the Advisor may, from time to time, reasonably request. DeAMIS will manage the portion of each Portfolio’s assets invested in emerging market debt securities.
The Advisor pays DeAMIS for its services for Scudder International Select Equity Portfolio a sub-advisory fee, payable monthly, at the annual rate of 0.375% of the Portfolio’s average daily net assets.
The Advisor pays DeAMIS for its services for Scudder Strategic Income Portfolio a sub-advisory fee, payable monthly, at the annual rate of 0.425% of the Portfolio’s average daily net assets.
The sub-advisory agreements provide that DeAMIS will not be liable for any error of judgment or mistake of law or for any loss suffered by the Portfolio in connection with matters to which the sub-advisory agreement relates, except a loss resulting from willful misconduct, bad faith or gross negligence on the part of DeAMIS in the performance of its duties or from reckless disregard by DeAMIS of its obligations and duties under the sub-advisory agreement. The sub-advisory agreements had an initial term ending September 30, 2002 and continue in effect year to year thereafter, but only as long as such continuance is specifically approved at least annually (a) by a majority of the Trustees of the Portfolio who are not parties to such agreement or interested persons of any such party except in their capacity as Trustees of the Portfolio (“Independent Trustees” or “Non-interested Trustees”), and (b) by a majority of the shareholders or the Board of Trustees of the Portfolio. The sub-advisory agreement may be terminated at any time upon 60 days’ notice by the Advisor or the Subadvisor or by the Board of Trustees of the Portfolio or by majority vote of the outstanding shares of the Portfolio, and will terminate automatically upon assignment or upon termination of the Portfolio’s investment management agreement.
Subadvisor to SVS Dreman Financial Services Portfolio, SVS Dreman High Return Equity Portfolio and SVS Dreman Small Cap Value Portfolio. Dreman Value Management, L.L.C. (“DVM”), 520 East Cooper Avenue, Aspen, Colorado, is the subadvisor to SVS Dreman High Return Equity Portfolio, SVS Dreman Financial Services Portfolio and SVS Dreman Small Cap Value Portfolio. DVM is controlled by David N. Dreman. DVM serves as subadvisor pursuant to the terms of a subadvisory agreement between it and the Advisor for each Portfolio. DVM was formed in April 1997 and has served as subadvisor for SVS Dreman Financial Services Portfolio and SVS Dreman High Return Equity Portfolio since their inception and for SVS Dreman Small Cap Value Portfolio since January 18, 2002. DVM is controlled by David Dreman.
Under the terms of each subadvisory agreement, DVM manages the investment and reinvestment of each Portfolio’s assets and will provide such investment advice, research and assistance as the Advisor may, from time to time, reasonably request.
Each subadvisory agreement provides that DVM will not be liable for any error of judgment or mistake of law or for any loss suffered by the Portfolio in connection with matters to which the subadvisory agreement relates, except a loss resulting from willful misfeasance, bad faith or gross negligence on the part of DVM in the performance of its duties or from reckless disregard by DVM of its obligations and duties under the subadvisory agreement.
S-76
Each subadvisory agreement with DVM had an initial term ending May 1, 2003 (June 30, 2007 for SVS Dreman Small Cap Value Portfolio) and continues in effect from year to year thereafter, but only as long as such continuance is specifically approved at least annually (a) by a majority of the trustees who are not parties to such agreement or interested persons of any such party except in their capacity as trustees of the Fund, and (b) by the shareholders or the Board of Trustees of the Fund. Each subadvisory agreement may be terminated at any time upon 60 days’ notice by the Advisor or by the Board of Trustees of the Fund or by majority vote of the outstanding shares of the Portfolio, and will terminate automatically upon assignment or upon termination of the Portfolio’s investment management agreement. DVM may terminate the subadvisory agreement upon 90 days’ notice to the Advisor.
Pursuant to separate subadvisory agreements dated April 8, 2002 and April 5, 2002, DVM receives a subadvisory fee of 1/12 of an annualized rate of 0.3375% of 1% of the average daily net assets for SVS Dreman Financial Services Portfolio and SVS Dreman High Return Equity Portfolio, respectively. Effective January 18, 2002, DVM also receives a subadvisory fee of 1/12 of an annualized rate of 0.375% of 1% of the average daily net assets for SVS Dreman Small Cap Value Portfolio. Fees paid to DVM for the last three fiscal years were as follows:
| | | | | | | | | |
| | | 2003
| | 2002
| | 2001
|
SVS Dreman Financial Services Portfolio | | $ | 376,743 | | $ | 433,523 | | $ | 208,089 |
SVS Dreman High Return Equity Portfolio | | $ | 1,800,568 | | $ | 1,755,676 | | $ | 639,408 |
SVS Dreman Small Cap Value Portfolio | | $ | 966,304 | | $ | 878,478 | | | n/a |
Subadvisor to SVS Eagle Focused Large Cap Growth Portfolio. Eagle Asset Management (“EAM”), 880 Carillon Parkway, St. Petersburg, Florida, 33716, is the subadvisor for SVS Eagle Focused Large Cap Growth Portfolio. Eagle Asset Management, is a wholly-owned subsidiary of Raymond James Financial, Inc. EAM manages approximately $8.15 billion in assets for institutional, high net worth individuals and subadvisory clients as of December 31, 2003.
Under the terms of the subadvisory agreement, EAM manages the investment and reinvestment of the Portfolio’s assets and will provide such investment advice, research and assistance as the Advisor may, from time to time, reasonably request.
The subadvisory agreement provides that EAM will not be liable for any error of judgment or mistake of law or for any loss suffered by the Portfolio in connection with matters to which the subadvisory agreement relates, except a loss resulting from willful misfeasance, bad faith or gross negligence on the part of EAM in the performance of its duties or from reckless disregard by EAM of its obligations and duties under the subadvisory agreement.
The subadvisory agreement with EAM had an initial term ending September 30, 2002 and continues in effect from year to year thereafter, but only as long as such continuance is specifically approved at least annually (a) by a majority of the trustees who are not parties to such agreement or interested persons of any such party except in their capacity as trustees of the Fund, and (b) by a majority of the shareholders or the Board of Trustees of the Fund. The subadvisory agreement may be terminated at any time upon 60 days’ notice by EAM, by DeIM or by the Board of Trustees of the Fund or by majority vote of the outstanding shares of the Portfolio, and will terminate automatically upon assignment or upon termination of the Portfolio’s investment management agreement.
The Advisor pays EAM for its services a subadvisory fee, payable monthly, at the annual rates shown below:
| | | |
Average Daily Net Assets of the Portfolio
| | Annual Subadvisory Fee Rate
| |
$0-$50 million | | 0.45 | % |
Next $250 million | | 0.40 | % |
Amounts over $300 million | | 0.30 | % |
The subadvisory fees paid by DeIM to EAM for SVS Eagle Focused Large Cap Portfolio for the past three fiscal years is as follows:
| | | | | | | | | |
| | | 2003
| | 2002
| | 2001
|
SVS Eagle Focused Large Cap Portfolio | | $ | 333,835 | | $ | 290,131 | | $ | 166,516 |
S-77
Subadvisor to SVS Janus Growth And Income Portfolio and SVS Janus Growth Opportunities Portfolio. Janus Capital Management LLC (“JCM”) (formerly, Janus Capital Corporation) 151 Detroit Street, Denver, Colorado 80206-4928, is the subadvisor to SVS Janus Growth And Income Portfolio and SVS Janus Growth Opportunities Portfolio. JCM is a direct subsidiary of Janus Capital Group Inc. JCM began serving as investment advisor to Janus Fund in 1970 and currently serves as investment advisor to all of the Janus Funds, acts as subadvisor for a number of private-label mutual funds and provides separate account advisory services for institutional accounts. JCM has served as subadvisor to the Portfolios since their inception on October 29, 1999.
Under the terms of each subadvisory agreement, JCM manages the investment and reinvestment of each Portfolio’s assets and will provide such investment advice, research and assistance as the Advisor may, from time to time, reasonably request.
Each subadvisory agreement provides that JCM will not be liable for any error of judgment or mistake of law or for any loss suffered by the Portfolio in connection with matters to which the subadvisory agreement relates, except a loss resulting from willful misfeasance, bad faith or gross negligence on the part of JCM in the performance of its duties or from reckless disregard by JCM of its obligations and duties under the subadvisory agreement.
Each subadvisory agreement with JCM had an initial term ending September 30, 2002 and continues in effect from year to year thereafter, but only as long as such continuance is specifically approved at least annually (a) by a majority of the trustees who are not parties to such agreement or interested persons of any such party except in their capacity as trustees of the Fund, and (b) by a majority of the shareholders or the Board of Trustees of the Fund. The subadvisory agreement may be terminated at any time upon 60 days’ notice by JCM, by the Advisor or by the Board of Trustees of the Fund or by majority vote of the outstanding shares of the Portfolio, and will terminate automatically upon assignment or upon termination of the Portfolio’s investment management agreement.
The Advisor pays JCM for its services a subadvisory fee, payable monthly, at the annual rates shown below:
| | | |
Average Daily Net Assets of the Portfolios
| | Annual Subadvisory Fee Rate
| |
$0-$100 million | | 0.55 | % |
$100 million-$500 million | | 0.50 | % |
On the balance over $500 million | | 0.45 | % |
The subadvisory fees paid by DeIM to JCM for SVS Janus Growth And Income Portfolio and SVS Janus Growth Opportunities Portfolio for the past three fiscal years is as follows:
| | | | | | | | | |
| | | 2003
| | 2002
| | 2001
|
SVS Janus Growth And Income Portfolio | | $ | 936,074 | | $ | 941,234 | | $ | 430,226 |
SVS Janus Growth Opportunities Portfolio | | $ | 649,430 | | $ | 724,231 | | $ | 760,392 |
Subadvisor to SVS INVESCO Dynamic Growth Portfolio. INVESCO Funds Group, Inc. (“IFG”), 4350 South Monaco Street, Denver, Colorado 80237, is the subadvisor to SVS INVESCO Dynamic Growth Portfolio. IFG has served as subadvisor to the Portfolio since its inception on May 1, 2001.
Under the terms of the subadvisory agreement, IFG manages the investment and reinvestment of the Portfolio’s assets and will provide such investment advice, research and assistance as the Advisor may, from time to time, reasonably request.
The subadvisory agreement provides that IFG will not be liable for any error of judgment or mistake of law or for any loss suffered by the Portfolio in connection with matters to which the subadvisory agreement relates, except a loss resulting from willful misfeasance, bad faith or gross negligence on the part of IFG in the performance of its duties or from reckless disregard by IFG of its obligations and duties under the subadvisory agreement.
The subadvisory agreement with IFG had an initial term ending September 30, 2002 and continues in effect from year to year thereafter, but only as long as such continuance is specifically approved at least annually (a) by a majority of the trustees who are not parties to such agreement or interested persons of any such party except in their capacity as trustees
S-78
of the Fund, and (b) by a majority of the shareholders or the Board of Trustees of the Fund. The subadvisory agreement may be terminated at any time upon 60 days’ notice by IFG, by DeIM or by the Board of Trustees of the Fund or by majority vote of the outstanding shares of the Portfolio, and will terminate automatically upon assignment or upon termination of the Portfolio’s investment management agreement.
The Advisor pays IFG for its services a subadvisory fee, payable monthly, at the annual rates shown below:
| | | |
Average Daily Net Assets of the Portfolio
| | Annual Subadvisory Fee Rate
| |
$0-$100 million | | 0.550 | % |
Next $400 million | | 0.525 | % |
Next $500 million | | 0.500 | % |
On amounts over $1 billion | | 0.470 | % |
The subadvisory fees paid by DeIM to IFG for SVS INVESCO Dynamic Growth Portfolio for the period May 1, 2001 (inception) through December 31, 2001 and for the prior two fiscal years is as follows:
| | | | | | | | | |
| | | 2003
| | 2002
| | 2001
|
SVS INVESCO Dynamic Growth Portfolio | | $ | 167,790 | | $ | 139,907 | | $ | 36,021 |
Subadvisor to SVS Turner Mid Cap Growth Portfolio. Turner Investment Partners, Inc. (“TIP”), 1235 Westlakes Drive, Suite 350, Berwyn, PA 19312, is the subadvisor to SVS Turner Mid Cap Growth Portfolio. TIP is controlled by Robert E. Turner and Mark D. Turner. TIP has served as subadvisor to the Portfolio since its inception on May 1, 2001.
Under the terms of the subadvisory agreement, TIP manages the investment and reinvestment of the Portfolio’s assets and will provide such investment advice, research and assistance as the Advisor may, from time to time, reasonably request.
The subadvisory agreement provides that TIP will not be liable for any error of judgment or mistake of law or for any loss suffered by the Portfolio in connection with matters to which the subadvisory agreement relates, except a loss resulting from willful misfeasance, bad faith or gross negligence on the part of TIP in the performance of its duties or from reckless disregard by TIP of its obligations and duties under the subadvisory agreement.
The subadvisory agreement with TIP had an initial term ending September 30, 2002 and continues in effect from year to year thereafter, but only as long as such continuance is specifically approved at least annually (a) by a majority of the trustees who are not parties to such agreement or interested persons of any such party except in their capacity as trustees of the Fund, and (b) by a majority of the shareholders or the Board of Trustees of the Fund. The subadvisory agreement may be terminated at any time upon 60 days’ notice by TIP, by the Advisor or by the Board of Trustees of the Fund or by majority vote of the outstanding shares of the Portfolio, and will terminate automatically upon assignment or upon termination of the Portfolio’s investment management agreement.
The Advisor pays TIP for its services a subadvisory fee, payable monthly, at the annual rates shown below:
| | | |
Average Daily Net Assets of the Portfolio
| | Annual Subadvisory Fee Rate
| |
$0-$50 million | | 0.550 | % |
Next $250 million | | 0.525 | % |
On amounts over $250 million | | 0.500 | % |
The subadvisory fees paid by DeIM to TIP for SVS Turner Mid Cap Growth Portfolio for the period May 1, 2001 (inception) through December 31, 2001 and for the past two fiscal years is as follows:
| | | | | | | | | |
| | | 2003
| | 2002
| | 2001
|
SVS Turner Mid Cap Growth Portfolio | | $ | 465,545 | | $ | 335,230 | | $ | 62,657 |
S-79
Subadvisor to SVS Oak Strategic Equity Portfolio. Oak Associates, Ltd., (“OAL”), 3875 Embassy Parkway, Suite 250, Akron, OH 44333, is the subadvisor to SVS Oak Strategic Equity Portfolio. OAL has served as subadvisor to the Portfolio since its inception on May 1, 2001.
Under the terms of the subadvisory agreement, OAL manages the investment and reinvestment of the Portfolio’s assets and will provide such investment advice, research and assistance as the Advisor may, from time to time, reasonably request.
The subadvisory agreement provides that OAL will not be liable for any error of judgment or mistake of law or for any loss suffered by the Portfolio in connection with matters to which the subadvisory agreement relates, except a loss resulting from willful misfeasance, bad faith or gross negligence on the part of OAL in the performance of its duties or from reckless disregard by OAL of its obligations and duties under the subadvisory agreement.
The subadvisory agreement with OAL had an initial term ending September 30, 2002 and continues in effect from year to year thereafter, but only as long as such continuance is specifically approved at least annually (a) by a majority of the trustees who are not parties to such agreement or interested persons of any such party except in their capacity as trustees of the Fund, and (b) by a majority of the shareholders or the Board of Trustees of the Fund. The subadvisory agreement may be terminated at any time upon 60 days’ notice by OAL, by DeIM or by the Board of Trustees of the Fund or by majority vote of the outstanding shares of the Portfolio, and will terminate automatically upon assignment or upon termination of the Portfolio’s investment management agreement.
The Advisor pays OAL for its services a subadvisory fee, payable monthly, at the annual rates shown below:
| | | |
Average Daily Net Assets of the Portfolio
| | Annual Subadvisory Fee Rate
| |
On all assets | | 0.300 | % |
The subadvisory fees paid by DeIM to OAL for SVS Oak Strategic Equity Portfolio for the period May 1, 2001 (inception) through December 31, 2001 and for the past two fiscal years is as follows:
| | | | | | | | | |
| | | 2003
| | 2002
| | 2001
|
SVS Oak Strategic Equity Portfolio | | $ | 179,780 | | $ | 130,081 | | $ | 35,692 |
Subadvisor to SVS Davis Venture Value Portfolio. Davis Selected Advisors, L.P. (“DSA”), 2949 E. Elvira Road, Suite 101, Tucson, AZ 85706, is the subadvisor to SVS Davis Venture Value Portfolio. DSA has served as subadvisor to the Portfolio since its inception. DSA is a limited partnership, Davis Investments, LLC is the general partner; Christopher C. Davis is the managing member of Davis Investments, LLC.
Under the terms of the subadvisory agreement, DSA manages the investment and reinvestment of the Portfolio’s assets and will provide such investment advice, research and assistance as the Advisor may, from time to time, reasonably request.
The subadvisory agreement provides that DSA will not be liable for any error of judgment or mistake of law or for any loss suffered by the Portfolio in connection with matters to which the subadvisory agreement relates, except a loss resulting from willful misfeasance, bad faith or gross negligence on the part of DSA in the performance of its duties or from reckless disregard by DSA of its obligations and duties under the subadvisory agreement.
The subadvisory agreement with DSA had an initial term ending September 30, 2002 and continues in effect from year to year thereafter, but only as long as such continuance is specifically approved at least annually (a) by a majority of the trustees who are not parties to such agreement or interested persons of any such party except in their capacity as trustees of the Fund, and (b) by a majority of the shareholders or the Board of Trustees of the Fund. The subadvisory agreement may be terminated at any time upon 60 days’ notice by DSA, by DeIM or by the Board of Trustees of the Fund or by majority vote of the outstanding shares of the Portfolio, and will terminate automatically upon assignment or upon termination of the Portfolio’s investment management agreement.
S-80
The Advisor pays DSA for its services a subadvisory fee, payable monthly, at the annual rates shown below:
| | | |
Average Daily Net Assets of the Portfolio
| | Annual Subadvisory Fee Rate
| |
$0-$100 million | | 0.50 | % |
Next $400 million | | 0.45 | % |
On amounts over $500 million | | 0.40 | % |
The subadvisory fees paid by DeIM to DSA for SVS Davis Venture Value Portfolio for the period May 1, 2001 (inception) through December 31, 2001 and past two fiscal years is as follows:
| | | | | | | | | |
| | | 2003
| | 2002
| | 2001
|
SVS Davis Venture Value Portfolio | | $ | 909,672 | | $ | 722,987 | | $ | 139,441 |
Subadvisor to SVS MFS Strategic Value Portfolio. Massachusetts Financial Services Company (“MFS”), 500 Boylston Street, Boston, Massachusetts 02116, is the subadvisor to SVS MFS Strategic Value Portfolio. MFS is controlled by Sun Life of Canada (U.S.) Financial Services Holdings, Inc. MFS has served as the subadvisor to the Portfolio since its inception.
Under the terms of the subadvisory agreement, MFS manages the investment and reinvestment of the Portfolio’s assets and will provide such investment advice, research and assistance as the Advisor may, from time to time, reasonably request.
The subadvisory agreement provides that MFS will not be liable for any error of judgment or mistake of law or for any loss suffered by the Portfolio in connection with matters to which the subadvisory agreement relates, except a loss resulting from willful misfeasance, bad faith or gross negligence on the part of MFS in the performance of its duties or from reckless disregard by MFS of its obligations and duties under the subadvisory agreement.
The subadvisory agreement with MFS had an initial term ending September 30, 2002, and continues in effect from year to year thereafter, but only as long as such continuance is specifically approved at least annually (a) by a majority of the trustees who are not parties to such agreement or interested persons of any such party except in their capacity as trustees of the Fund, and (b) by a majority of the shareholders or the Board of Trustees of the Fund. The subadvisory agreement may be terminated at any time upon 60 days’ notice by MFS, by the Advisor or by the Board of Trustees of the Fund or by majority vote of the outstanding shares of the Portfolio, and will terminate automatically upon assignment or upon termination of the Portfolio’s investment management agreement.
The Advisor pays MFS for its services a subadvisory fee, payable monthly, at the annual rates shown below:
| | | |
Average Daily Net Assets of the Portfolio
| | Annual Subadvisory Fee Rate
| |
On the first $100 million | | 0.475 | % |
On the next $150 million | | 0.425 | % |
On the next $250 million | | 0.375 | % |
On the next $500 million | | 0.350 | % |
On the next $500 million | | 0.275 | % |
Over $1.5 billion | | 0.250 | % |
The subadvisory fee paid by DeIM to MFS for SVS MFS Strategic Value Portfolio for the past two fiscal years is as follows:
| | | | | | |
| | | 2003
| | 2002
|
SVS MFS Strategic Value Portfolio | | $ | 49,179 | | $ | 12,335 |
Subadvisors to SVS Focus Value+Growth Portfolio. Jennison Associates LLC (“Jennison”), a wholly-owned subsidiary of The Prudential Insurance Company of America, located at 466 Lexington Avenue, New York, 10017, is the subadvisor to the growth portion of SVS Focus Value+Growth Portfolio. Jennison Associates was founded in 1969 and
S-81
has served as an investment advisor to registered investment companies since 1990. Jennison is an indirect, wholly-owned subsidiary of Prudential Financial, Inc. As of December 31, 2003, Jennison Associates managed approximately $59 billion on behalf of its clients.
DeIM pays Jennison Associates for acting as subadvisor to the “growth” portion of SVS Focus Value+Growth Portfolio at an annual rate based on the portion of the average combined daily net assets of the Portfolio and Scudder Focus Value+Growth Fund (another fund advised by DeIM) subadvised by Jennison Associates as shown below:
| | | |
Average Daily Net Assets of the Portfolios
| | Annual Subadvisory Fee Rate
| |
On the first $100 million | | 0.450 | % |
On the next $400 million | | 0.400 | % |
On the next $500 million | | 0.350 | % |
On the next $1 billion | | 0.300 | % |
Over $2 billion | | 0.250 | % |
Effective April 5, 2002, Dreman Value Management, L.L.C., 520 East Cooper Avenue, Aspen, Colorado, is the subadvisor for the value portion of SVS Focus Value+Growth Portfolio. Founded in 1977, Dreman Value Management L.L.C. currently manages over $7 billion in assets.
DeIM pays Dreman Value Management for acting as the subadvisor to the value portion of the portfolio at an annual rate applied to the portion of the portfolio’s average daily net assets subadvised by Dreman Value Management as shown below:
| | | |
Average Daily Net Assets of the Portfolio
| | Annual Subadvisory Fee Rate
| |
On the first $250 million | | 0.4000 | % |
On the next $250 million | | 0.3500 | % |
On the next $500 million | | 0.3375 | % |
Over $1 billion | | 0.3150 | % |
The subadvisory agreement for the Portfolio remains in effect until June 30, 2007, unless sooner terminated or not annually approved as described below. Notwithstanding the foregoing, the subadvisory agreement shall continue in effect through June 30, 2007 and year to year thereafter, but only as long as such continuance is specifically approved at least annually by (a) a majority of the Trustees who are not parties to such agreement or interested persons of any such party except in their capacity as Trustees of the Portfolio, and (b) a majority of the shareholders or the Board of the Fund. The subadvisory agreement may be terminated at any time upon 60 days notice by the Advisor or by the Board of the Fund or by majority vote of the outstanding shares of the Portfolio, and will terminate automatically upon assignment or upon termination of the Fund’s investment management agreement with the Advisor. DVM may terminate the subadvisory agreement upon 90 days notice to the Advisor.
The subadvisory fee paid by DeIM to Jennison for the “growth” portion of the SVS Focus Value+Growth Portfolio for the past two fiscal years is as follows:
| | | | | | |
| | | 2003
| | 2002
|
SVS Focus Value+Growth Portfolio | | $ | 244,563 | | $ | 273,389 |
The subadvisory fee paid by DeIM to DVM for the “value” portion of the SVS Focus Value+Growth Portfolio for the period April 5, 2002 through December 31, 2002 and for the fiscal year ended 2003 were as follows:
| | | | | | |
| | | 2003
| | 2002
|
SVS Focus Value+Growth Portfolio | | $ | 152,656 | | $ | 183,280 |
S-82
Pursuant to a sub-administration and sub-accounting agreement among the Advisor, SFAC and State Street Bank and Trust Company (“SSB”), the Advisor has delegated certain administrative functions to SSB under the fund’s investment management agreements. The costs and expenses of such delegation are borne by the Advisor, not by the fund.
Board Considerations in Connection with Annual Renewal of Investment Management Agreements
The Board of Trustees approved the renewal of each Portfolio’s advisory contract with DeIM on September 26, 2003. As part of the annual contract review process, commencing in July, 2003, the Board, as a whole, the Independent Trustees, separately, and each Portfolio’s Oversight Committee met on several occasions to consider the renewal of each Portfolio’s investment management agreement. The Oversight Committee initially analyzed and reviewed extensive materials, received responses from the Advisor and received advice from counsel. The Committee presented their findings and recommendations to the Independent Trustees as a group. The Independent Trustees then reviewed the Committee’s findings and recommendations and presented their recommendations to the full Board. At a meeting on September 26, 2003, the Board concluded that the terms of the investment management agreements for each Portfolio are fair and reasonable and the continuance of each agreement is in the best interest of each Portfolio.
In connection with their meetings, the Oversight Committee and the Board received comprehensive materials from the Advisor and from independent sources relating to the management fees charged and services provided, including information about (i) the nature and quality of services provided by the Advisor and subadvisors; (ii) the management fees, expense ratios and asset sizes of the Portfolios relative to peer groups; (iii) the level of the Advisor’s profits with respect to the management of the Portfolios, including the methodology used to allocate costs among funds advised by the Advisor; (iv) the short-term and long-term performance of the Portfolios relative to appropriate peer groups and one or a combination of market indices; (v) fall-out benefits to the Advisor from its relationship to the Portfolios, including revenues derived from services provided to the Portfolios by affiliates of the Advisor; and (vi) the potential benefits to the Advisor, subadvisors, the Portfolios and its shareholders of receiving research services from broker/dealer firms in connection with the allocation of portfolio transactions to such firms.
Investment Performance. The Independent Trustees and Board reviewed each Portfolio’s investment performance as well as the performance of a peer group of funds, and the performance of an appropriate index or combination of indices. The Board considered short-term and long-term performance, as well as the factors contributing to underperformance of certain funds advised by the Advisor and steps taken by the Advisor to improve such underperformance. In particular, the Board requested the Advisor to identify Scudder funds whose performance ranks in the lowest quartile of their peer group (“Focus Funds”) and to provide more frequent reports of steps to monitor and improve performance of the Focus Funds.
Fees and Expenses. The Independent Trustees and Board considered each Portfolio’s management fee rates, subadvisory fee rates, expense ratios and asset sizes relative to an appropriate peer group of funds.
Profitability. The Independent Trustees and Board considered the level of the Advisor’s profits with respect to the management of the Portfolios, including a review of the Advisor’s methodology in allocating its costs to the management of the Portfolios. The Board considered the profits realized by the Advisor in connection with the operation of the Portfolio and whether the amount of profit is a fair entrepreneurial profit for the management of the Portfolios. The Board also considered the Advisor’s profit margins in comparison with available industry data.
Economies of Scale. The Independent Trustees and Board considered whether there have been economies of scale with respect to the management of the Portfolios and whether the Portfolios have appropriately benefited from any economies of scale. The Board considered whether the management fee rate is reasonable in relation to the asset size of the Portfolios.
Advisor Personnel and Methods. The Independent Trustees and Board considered the size, education and experience of the Advisor’s staff, its use of technology and its approach to recruiting, training and retaining portfolio managers and other research and management personnel.
Nature and Quality of Other Services. The Independent Trustees and Board considered the nature, quality, cost and extent of administrative and shareholder services performed by the Advisor and its affiliated companies and subadvisors.
S-83
Other Benefits to the Advisor. The Independent Trustees and Board also considered the character and amount of other incidental benefits received by the Advisor and its affiliates, including the receipt of research through the use of soft dollars.
Board Considerations in Connection with Annual Renewal of Subadvisory Agreements As part of the annual contract review process, commencing in July, 2003, the Board, as a whole, the Independent Trustees, separately, and the Portfolio’s Oversight Committees met to consider the renewal of each applicable Portfolio’s subadvisory agreement. In determining whether to approve each subadvisory agreement, the Board considered similar factors to those it considered in approving the investment management agreements, to the extent applicable. The Independent Trustees and the Board considered various factors and reviewed various materials furnished by the Advisor and the Subadvisors, including (i) the investment performance of the Portfolios relative to broad-based indices and to comparably managed mutual funds, (ii) the investment approach of the Subadvisors, and (iii) the knowledge and experience of the investment professionals who would be responsible for the day-to-day management of the Portfolios. The Independent Trustees and Board also considered the following factors: the favorable history, reputation, qualifications and background of the Subadvisors, as well as the qualifications of their personnel; the nature and quality of services provided by the Subadvisors to the Portfolios; and a Subadvisor’s relationship with the Advisor and, as applicable, experience with other funds managed by the Advisor. The Board also considered that the Advisor is responsible for any payment of fees to the Subadvisors.
Portfolio Transactions
The Advisor is responsible for placing the orders for the purchase and sale of portfolio securities, including the allocation of brokerage.
The primary objective of the Advisor in placing orders for the purchase and sale of securities for a Portfolio is to obtain the most favorable net results, taking into account such factors, among others, as price, commission (where applicable), size of order, difficulty of execution and skill required of the executing broker-dealer. The Advisor seeks to evaluate the overall reasonableness of brokerage commissions paid with commissions charged on comparable transactions, as well as by comparing commissions paid by a Portfolio to reported commissions paid by others. The Advisor routinely reviews commission rates, execution and settlement services performed and makes internal and external comparisons.
A Portfolio’s purchases and sales of fixed-income securities are generally placed by the Advisor with primary market makers for these securities on a net basis, without any brokerage commission being paid by a Portfolio. Trading does, however, involve transaction costs. Transactions with dealers serving as primary market makers reflect the spread between the bid and asked prices. Purchases of underwritten issues may be made, which will include an underwriting fee paid to the underwriter. In effecting transactions in over-the-counter securities, orders are placed with the principal market makers for the security being traded unless, after exercising care, it appears that more favorable results are available elsewhere.
When it can be done consistently with the policy of obtaining the most favorable net results, the Advisor may place such orders with broker-dealers who supply research services to the Advisor or a Portfolio. The term “research services”, may include, but is not limited to, advice as to the value of securities; the advisability of investing in, purchasing or selling securities; the availability of securities or purchasers or sellers of securities; and analyses and reports concerning issuers, industries, securities, economic factors and trends, portfolio strategy and the performance of accounts. The Advisor is authorized when placing portfolio transactions, if applicable, for a Portfolio to pay a brokerage commission in excess of that which another broker-dealer might charge for executing the same transaction on account of execution services and the receipt of research services. The Advisor has negotiated arrangements, which are not applicable to most fixed income transactions, with certain broker-dealers pursuant to which a broker-dealer will provide research services to the Advisor in exchange for the direction by the Advisor of brokerage transactions to the broker-dealer. These arrangements regarding receipt of research services generally apply to equity security transactions. Although certain research services from broker-dealers may be useful to a Portfolio and to the Advisor, it is the opinion of the Advisor that such information only supplements its own research effort since the information must still be analyzed, weighed and reviewed by the Advisor’s staff. Such information may be useful to the Advisor in providing services to clients other than a Portfolio and not all such information is used by the Advisor in connection with a Portfolio. Conversely, such information provided to the Advisor by broker-dealers through whom other clients of the Advisor effect securities transactions may be useful to the Advisor in providing services to a Portfolio.
S-84
It is likely that the broker-dealers selected based on the foregoing considerations will include firms that also sell shares of the Scudder Funds to their customers. However, the Advisor does not consider sales of Fund shares as a factor in the selection of broker-dealers to execute portfolio transactions for the Scudder Funds.
Dreman Value Management, L.L.C.
Under the subadvisory agreements between the Advisor and Dreman Value Management, L.L.C. (“DVM”), DVM places all orders for purchases and sales of the SVS Dreman High Return Equity Portfolio, SVS Dreman Financial Services Portfolio, SVS Dreman Small Cap Value Portfolio and the “value” portion of SVS Focus Value+Growth Portfolio. At times, investment decisions may be made to purchase or sell the same investment securities of a Portfolio and for one or more of the other clients managed by DVM. When two or more of such clients are simultaneously engaged in the purchase or sale of the same security through the same trading facility, the transactions are allocated as to amount and price in a manner considered equitable to each. Position limits imposed by national securities exchanges may restrict the number of options the Portfolio will be able to write on a particular security.
The above mentioned factors may have a detrimental effect on the quantities or prices of securities, options or future contracts available to the Portfolios. On the other hand, the ability of the Portfolios to participate in volume transactions may produce better executions for the Portfolios in some cases.
DVM, in effecting purchases and sales of portfolio securities for the account of the Portfolios, will implement each Portfolio’s policy of seeking best execution of orders. DVM may be permitted to pay higher brokerage commissions for research services as described below. Consistent with this policy, orders for portfolio transactions are placed with broker-dealer firms giving consideration to the quality, quantity and nature of each firm’s professional services, which include execution, financial responsibility, responsiveness, clearance procedures, wire service quotations and statistical and other research information provided to the Portfolios and DVM. Subject to seeking best execution of an order, brokerage is allocated on the basis of all services provided. Any research benefits derived are available for all clients of DVM. In selecting among firms believed to meet the criteria for handling a particular transaction, DVM may give consideration to those firms that provide market, statistical and other research information to the Portfolios and DVM, although DVM is not authorized to pay higher commissions to firms that provide such services, except as described below.
DVM may in certain instances be permitted to pay higher brokerage commissions for receipt of market, statistical and other research services as defined in Section 28(e) of the Securities Exchange Act of 1934 and interpretations thereunder. Such services may include among other things: economic, industry or company research reports or investment recommendations; computerized databases; quotation and execution equipment and software; and research or analytical computer software and services. Where products or services have a “mixed use,” a good faith effort is made to make a reasonable allocation of the cost of products or services in accordance with the anticipated research and non-research uses and the cost attributable to non-research use is paid by DVM in cash. Subject to Section 28(e) the Portfolio could pay a firm that provides research services commissions for effecting a securities transaction for the Portfolio in excess of the amount other firms would have charged for the transaction if DVM determines in good faith that the greater commission is reasonable in relation to the value of the brokerage and research services provided by the executing firm viewed in terms either of a particular transaction or DVM’s overall responsibilities to the Portfolio and other clients. Not all of such research services may be useful or of value in advising the Portfolio. Research benefits will be available for all clients of DVM. The subadvisory fee paid by DeIM to DVM is not reduced because these research services are received.
Eagle Asset Management, Janus Capital Management LLC, Davis Selected Advisors, L.P., Oak Associates, Ltd., Turner Investment Partners, Inc., INVESCO Funds Group, Inc., Jennison Associates LLC and Massachusetts Financial Services Company.
Under the subadvisory agreements between the Advisor and each Subadvisor, each Subadvisor places all orders for the purchase securities for each portfolio (or portion of each portfolio, as applicable) it manages. At times investment decisions may be made to purchase or sell the same investment securities of a Portfolio and for one or more of the other clients managed by each Subadvisor. When two or more of such clients are simultaneously engaged in the purchase or sale of the same security through the same trading facility, the transactions are allocated as to amount and price in a manner considered equitable to each. Position limits imposed by national securities exchanges may restrict the number of options a Portfolio will be able to write on a particular security.
S-85
The above mentioned factors may have a detrimental effect on the quantities or prices of securities, options or future contracts available to a Portfolio. On the other hand, the ability of a Portfolio to participate in volume transactions may produce better executions for a Portfolio in some cases.
Each Subadvisor in effecting purchases and sales of portfolio securities for the account of the Portfolios, will implement the Portfolios’ policy of seeking best execution of orders. Each Subadvisor may be permitted to pay higher brokerage commissions for research services as described below. Consistent with this policy, orders for portfolio transactions are placed with broker-dealer firms giving consideration to the quality, quantity and nature of each firm’s professional services, which include execution, financial responsibility, responsiveness, clearance procedures, wire service quotations and statistical and other research information provided to the Portfolios, and each Subadvisor. Subject to seeking best execution of an order, brokerage is allocated on the basis of all services provided. Any research benefits derived are available for all clients of each Subadvisor. In selecting among firms believed to meet the criteria for handling a particular transaction, each subadvisor may each give consideration to those firms as well as to those firms that provide market, statistical and other research information to the Portfolio, and each Subadvisor, although each are not authorized to pay higher commissions to firms that provide such services, except as described below.
Each Subadvisor may each in certain instances be permitted to pay higher brokerage commissions for receipt of market, statistical and other research services as defined in Section 28(e) of the Securities Exchange Act of 1934 and interpretations thereunder. Such services may include among other things: economic, industry or company research reports or investment recommendations; computerized databases; quotation and execution equipment and software; and research or analytical computer software and services. Where products or services have a “mixed use,” a good faith effort is made to make a reasonable allocation of the cost of products or services in accordance with the anticipated research and non-research uses and the cost attributable to non-research use is paid by each subadvisor in cash. Subject to Section 28(e) the Portfolios could pay a firm that provides research services commissions for effecting a securities transaction for the Portfolio in excess of the amount other firms would have charged for the transaction if each subadvisor determines in good faith that the greater commission is reasonable in relation to the value of the brokerage and research services provided by the executing firm viewed in terms either of a particular transaction or each Subadvisor’s overall responsibilities to the Portfolios and other clients. Not all of such research services may be useful or of value in advising the Portfolios. Research benefits will be available for all clients of each subadvisor. The subadvisory fees paid by each subadvisor are not reduced because these research services are received.
The table below shows total brokerage commissions paid by each Portfolio for the last three fiscal years, as applicable.
| | | | | | | | | |
Portfolio
| | Fiscal 2003
| | Fiscal 2002
| | Fiscal 2001
|
Scudder Aggressive Growth Portfolio | | $ | 129,184 | | $ | 143,254 | | $ | 34,253 |
Scudder Blue Chip Portfolio | | $ | 365,208 | | | 671,982 | | | 536,231 |
Scudder Large Cap Value Portfolio | | $ | 362,438 | | | 577,420 | | | 412,534 |
Scudder Fixed Income Portfolio | | $ | 0 | | | 0 | | | 0 |
Scudder Global Blue Chip Portfolio | | $ | 97,252 | | | 61,899 | | | 49,691 |
Scudder Government & Agency Securities Portfolio | | $ | 0 | | | 6,312 | | | 480 |
Scudder Growth Portfolio | | $ | 157,577 | | | 348,962 | | | 570,848 |
Scudder High Income Portfolio | | $ | 0 | | | 8,707 | | | 6335 |
Scudder International Select Equity Portfolio | | $ | 461,119 | | | 379,066 | | | 400,055 |
Scudder Money Market Portfolio | | $ | 0 | | | 0 | | | 0 |
Scudder Small Cap Growth Portfolio | | $ | 982,755 | | | 538,528 | | | 521,070 |
Scudder Strategic Income Portfolio | | $ | 0 | | | 0 | | | 4,639 |
Scudder Technology Growth Portfolio | | $ | 591,677 | | | 632,705 | | | 385,288 |
Scudder Total Return Portfolio | | $ | 139,867 | | | 714,788 | | | 1,195,032 |
SVS Davis Venture Value Portfolio(1) | | $ | 52,683 | | | 159,049 | | | 130,730 |
SVS Dreman Financial Services Portfolio | | $ | 39,552 | | | 74,474 | | | 93,656 |
SVS Dreman High Return Equity Portfolio | | $ | 339,487 | | | 655,721 | | | 439,785 |
SVS Dreman Small Cap Value Portfolio | | $ | 1,129,408 | | | 1,043,580 | | | 60,059 |
SVS Eagle Focused Large Cap Growth Portfolio | | $ | 315,586 | | | 326,787 | | | 125,852 |
SVS Focus Value+Growth Portfolio | | $ | 239,533 | | | 360,012 | | | 237,105 |
SVS Index 500 Portfolio | | $ | 66,204 | | | 76,616 | | | 112,220 |
SVS INVESCO Dynamic Growth Portfolio(1) | | $ | 113,346 | | | 72,549 | | | 16,404 |
S-86
| | | | | | | |
Portfolio
| | Fiscal 2003
| | Fiscal 2002
| | Fiscal 2001
|
SVS Janus Growth And Income Portfolio | | $ | 176,783 | | 233,462 | | 196,087 |
SVS Janus Growth Opportunities Portfolio | | $ | 161,639 | | 224,896 | | 263,615 |
SVS MFS Strategic Value Portfolio(2) | | $ | 28,139 | | 14,160 | | n/a |
SVS Oak Strategic Equity Portfolio(1) | | $ | 48,753 | | 82,715 | | 24,844 |
SVS Turner Mid Cap Growth Portfolio(1) | | $ | 1,123,591 | | 494,623 | | 68,806 |
| (1) | Commenced operations on May 1, 2001. |
| (2) | Commenced operations on May 1, 2002. |
For the fiscal year ended December 31, 2003:
| | | | | | | | | |
Portfolio
| | Percentage of
Commissions Paid to
Affiliated Brokers
| | | Percentage of
Transactions Involving
Commissions Paid to
Affiliated Brokers
| | | Dollar Amount of
Commissions
Paid to Brokers
for Research
Services
|
Scudder Aggressive Growth Portfolio | | 0 | % | | 0 | % | | $ | 10,816 |
Scudder Blue Chip Portfolio | | 0 | | | 0 | | | $ | 82,784 |
Scudder Large Cap Value Portfolio | | 0 | | | 0 | | | $ | 64,124 |
Scudder Fixed Income Portfolio | | 0 | | | 0 | | | $ | 0 |
Scudder Global Blue Chip Portfolio | | 0 | | | 0 | | | $ | 13,714 |
Scudder Government & Agency Securities Portfolio | | 0 | | | 0 | | | $ | 0 |
Scudder Growth Portfolio | | 0 | | | 0 | | | $ | 21,723 |
Scudder High Income Portfolio | | 0 | | | 0 | | | $ | 0 |
Scudder International Select Equity Portfolio | | 0 | | | 0 | | | $ | 60,751 |
Scudder Money Market Portfolio | | 0 | | | 0 | | | $ | 0 |
Scudder Small Cap Growth Portfolio | | 0 | | | 0 | | | $ | 81,979 |
Scudder Strategic Income Portfolio | | 0 | | | 0 | | | $ | 0 |
Scudder Technology Growth Portfolio | | 0 | | | 0 | | | $ | 39,054 |
Scudder Total Return Portfolio | | 0 | | | 0 | | | $ | 20,308 |
SVS Davis Venture Value Portfolio | | 0 | | | 0 | | | $ | 4,941 |
SVS Dreman Financial Services Portfolio | | 0 | | | 0 | | | $ | 600 |
SVS Dreman High Return Equity Portfolio | | 0 | | | 0 | | | $ | 9,754 |
SVS Dreman Small Cap Value Portfolio | | 0 | | | 0 | | | $ | 2,915 |
SVS Eagle Focused Large Cap Growth Portfolio | | 0 | | | 0 | | | $ | 5,333 |
SVS Focus Value+Growth Portfolio | | 0 | | | 0 | | | $ | 28,844 |
SVS Index 500 Portfolio | | 0 | | | 0 | | | $ | 0 |
SVS INVESCO Dynamic Growth Portfolio | | 0 | | | 0 | | | $ | 6,260 |
SVS Janus Growth And Income Portfolio | | 0 | | | 0 | | | $ | 21,584 |
SVS Janus Growth Opportunities Portfolio | | 0 | | | 0 | | | $ | 10,437 |
SVS MFS Strategic Value Portfolio | | 0 | | | 0 | | | $ | 0 |
SVS Oak Strategic Equity Portfolio | | 0 | | | 0 | | | $ | 14,489 |
SVS Turner Mid Cap Growth Portfolio | | 0 | | | 0 | | | $ | 47,529 |
Code of Ethics. The Fund, the Advisor and Subadvisors, and principal underwriter have each adopted codes of ethics under Rule 17j-1 under the 1940 Act. Board members, officers of the Fund and employees of the Advisor or Subadvisors, and principal underwriter are permitted to make personal securities transactions, including transactions in securities that may be purchased or held by the Fund, subject to requirements and restrictions set forth in the applicable Code of Ethics. The Advisor’s Code of Ethics contains provisions and requirements designed to identify and address certain conflicts of interest between personal investment activities and the interests of the Fund. Among other things, the Advisor’s Code of Ethics prohibits certain types of transactions absent prior approval, imposes time periods during which personal transactions may not be made in certain securities, imposes holding periods (generally 30 days) on most
S-87
transactions and requires the submission of duplicate broker confirmations and quarterly reporting of securities transactions. Exceptions to these and other provisions of the Advisor’s Code of Ethics may be granted in particular circumstances after review by appropriate personnel.
Distributor
Scudder Distributors, Inc. (“SDI” or the “Distributor”), 222 South Riverside Plaza, Chicago, Illinois 60606, a wholly-owned subsidiary of DeIM, is the distributor and principal underwriter for shares of each Portfolio pursuant to an Underwriting Agreement in the continuous offering of its shares. Terms of continuation, termination and assignment under the underwriting agreement are identical to those described above with regard to the investment management agreements, except that termination other than upon assignment requires sixty days’ notice.
Each Portfolio has adopted a distribution plan under Rule 12b-1 (the “Plan”) that provides for fees payable as an expense of the Class B shares. Under the plan, the Fund may make quarterly payments as reimbursement to the distributor for distribution and shareholder servicing related expenses incurred or paid by the distributor or a participating insurance company. No such payment shall be made with respect to any quarterly period in excess of an amount determined for such period at the annual rate of .25% of the average daily net assets of Class B shares during that quarterly period. The fee is payable by the Fund, on behalf of each Portfolio, of up to 0.25% of the average daily net assets attributable to the Class B shares of a Portfolio. Because 12b-1 fees are paid out of Portfolio assets on an ongoing basis, they will, over time, increase the cost of investment and may cost more than other types of sales charges. The Plan and any Rule 12b-1-related agreement that is entered into by the Fund or the Distributor in connection with the Plan will continue in effect for a period of more than one year only so long as continuance is specifically approved at least annually by a vote of a majority of the Fund’s Board of Trustees, and of a majority of the Trustees who are not interested persons (as defined in the 1940 Act) of the Fund or a Portfolio (“Independent Trustees”), cast in person at a meeting called for the purpose of voting on the Plan, or the Rule 12b-1 related agreement, as applicable. In addition, the Plan and any Rule 12b-1 related agreement, may be terminated as to Class B shares of a Portfolio at any time, without penalty, by vote of a majority of the outstanding Class B shares of that Portfolio or by vote of a majority of the Independent Trustees. The Plan and Underwriting Agreement also provide that it may not be amended to increase materially the amount that may be spent for distribution of Class B shares of a Portfolio without the approval of Class B shareholders of that Portfolio.
For the fiscal year 2003, the distribution fees paid were as follows:
| | | | | | |
Portfolio
| | Total Aggregated Fee
for Fiscal 2003
| | Fees Waived
|
Scudder Aggressive Growth Portfolio | | $ | 3,462 | | | — |
Scudder Blue Chip Portfolio | | $ | 17,238 | | | — |
Scudder Large Cap Value Portfolio | | $ | 15,999 | | | — |
Scudder Fixed Income Portfolio | | $ | 63,474 | | | — |
Scudder Global Blue Chip Portfolio | | $ | 6,508 | | | — |
Scudder Government & Agency Securities Portfolio | | $ | 86,751 | | | — |
Scudder Growth Portfolio | | $ | 7,373 | | | — |
Scudder High Income Portfolio | | $ | 42,154 | | | — |
Scudder International Select Equity Portfolio | | $ | 19,174 | | | — |
Scudder Money Market Portfolio(1) | | $ | 91,574 | | $ | 3,564 |
Scudder Small Cap Growth Portfolio | | $ | 15,387 | | | — |
Scudder Strategic Income Portfolio(2) | | $ | 7,015 | | | — |
Scudder Technology Growth Portfolio | | $ | 10,997 | | | — |
Scudder Total Return Portfolio | | $ | 24,991 | | | — |
SVS Davis Venture Value Portfolio(2) | | $ | 30,928 | | | — |
SVS Dreman Financial Services Portfolio | | $ | 10,825 | | | — |
SVS Dreman High Return Equity Portfolio | | $ | 73,850 | | | — |
SVS Dreman Small Cap Value Portfolio | | $ | 35,148 | | | — |
SVS Eagle Focused Large Cap Growth Portfolio | | $ | 16,086 | | | — |
SVS Focus Value+Growth Portfolio | | $ | 8,341 | | | — |
SVS Index 500 Portfolio | | $ | 34,789 | | | — |
S-88
| | | | | |
Portfolio
| | Total Aggregated Fee
for Fiscal 2003
| | Fees Waived
|
SVS INVESCO Dynamic Growth Portfolio | | $ | 5,499 | | — |
SVS Janus Growth And Income Portfolio | | $ | 16,450 | | — |
SVS Janus Growth Opportunities Portfolio | | $ | 7,285 | | — |
SVS MFS Strategic Value Portfolio | | $ | 12,647 | | — |
SVS Oak Strategic Equity Portfolio | | $ | 10,426 | | — |
SVS Turner Mid Cap Growth Portfolio | | $ | 14,987 | | — |
| ^1 | For Scudder Money Market Portfolio, the Advisor agreed to waive 0.15% of the 12b-1 fee for the period January 1, 2003 through April 30, 2003. |
| ^2 | Class B shares were not offered until May 1, 2003. |
In addition, SDI may, from time to time, from its own resources pay certain firms additional amounts for ongoing administrative services and assistance provided to their customers and clients who are shareholders of the Fund.
FUND SERVICE PROVIDERS
Transfer Agent
Scudder Investments Service Company (“SISC”), 811 Main Street, Kansas City, Missouri 64105-2005, an affiliate of the Advisor, acts as each Portfolio’s transfer agent, dividend-paying agent and shareholder service agent. Pursuant to a sub-transfer agency agreement between SISC and DST Systems, Inc. (“DST”), SISC has delegated certain transfer agent and dividend paying agent functions to DST. The costs and expenses of such delegation are borne by SISC, not by the Portfolios.
Recordkeeping
Technically, the shareholders of the Portfolios of the Fund are the Participating Insurance Companies that offer the Portfolios as investment options for holders of certain variable annuity contracts and variable life insurance policies. Effectively, ownership of Portfolio shares is passed through to insurance company contract and policy holders. The holders of the shares of the Portfolios on the records of the Fund are the Participating Insurance Companies and no information concerning the Portfolio holdings of specific contract and policy holders is maintained by the Fund. The insurance companies place orders for the purchase and redemption of Portfolio shares with the Fund reflecting the investment of premiums paid, surrender and transfer requests and other matters on a net basis; they maintain all records of the transactions and holdings of Portfolio shares and distributions thereon for individual contract and policy holders; and they prepare and mail to contract and policy holders confirmations and periodic account statements reflecting such transactions and holdings.
The Portfolios of the Fund may compensate certain insurance companies for record keeping and other administrative services performed with regard to holdings of Class B Portfolio shares as an expense of the Class B shares. These fees are included within the “Other Expenses” category in the fee table for each portfolio in the Class B Shares Prospectus (see “How Much Investors Pay” in a Portfolio’s prospectus). In addition, the Advisor may, from time to time, pay from its own resources certain insurance companies for record keeping and other administrative services related to Class A and Class B shares of the Portfolios held by such insurance companies on behalf of their contract and policy holders.
Custodian
State Street, 225 Franklin Street, Boston, Massachusetts 02110, as custodian, has custody of all securities and cash of each Portfolio (other than the Scudder International Select Equity Portfolio and Scudder Global Blue Chip Portfolio). Brown Brothers Harriman & Co., as custodian, has custody of all securities and cash of Scudder International Select Equity Portfolio and Scudder Global Blue Chip Portfolio. Each custodian attends to the collection of principal and income, and payment for and collection of proceeds of securities bought and sold by those Portfolios.
S-89
Independent Auditors
The Fund’s independent auditors, Ernst & Young LLP, 200 Clarendon Street, Boston, MA 02116 audit and report on the Portfolios’ annual financial statements, review certain regulatory reports and the Portfolios’ federal income tax returns, and perform other professional accounting, auditing, tax and advisory services when engaged to do so by the Fund. Shareholders will receive annual audited financial statements and semi-annual unaudited financial statements.
Counsel
Vedder, Price, Kaufman & Kammholz P.C., 222 N. LaSalle St., Chicago, Illinois, serves as legal counsel to each Portfolio and the Independent Trustees of the Fund.
Fund Accounting Agent
Scudder Fund Accounting Corp. (“SFAC”), Two International Place, Boston, Massachusetts, 02210-4103, a subsidiary of DeIM, is responsible for determining the daily net asset value per share and maintaining the portfolio and general accounting records of each Portfolio. SFAC receives no fee for its services to each Portfolio, other than the Portfolios noted below. However, subject to Board approval, at some time in the future, SFAC may seek payment for its services to other Portfolios under its agreement with such Portfolios.
For the fiscal years ended December 31, 2003, 2002 and 2001, respectively, SFAC received the following fees for its services for the following Portfolios:
| | | | | | | | | | | | | | |
Portfolio
| | Fiscal 2003
| | Unpaid at
December 31,
2003
| | Fiscal 2002
| | | Fiscal 2001
| |
Scudder Aggressive Growth Portfolio | | $ | 40,010 | | $ | 9,448 | | $ | 6,114 | | | $ | 28,773 | |
Scudder Global Blue Chip Portfolio | | $ | 61,017 | | $ | 17,666 | | $ | 52,678 | | | $ | 49,771 | |
Scudder Technology Growth Portfolio | | $ | 67,604 | | $ | 25,665 | | $ | 46,465 | | | $ | 67,464 | |
SVS Davis Venture Value Portfolio | | $ | 55,063 | | $ | 10,231 | | $ | 46,548 | | | $ | 23,755 | |
SVS Dreman Financial Services Portfolio | | $ | 46,761 | | $ | 10,997 | | $ | 42,577 | | | $ | 43,868 | |
SVS Dreman High Return Equity Portfolio | | $ | 83,669 | | $ | 15,939 | | $ | 95,203 | | | $ | 81,776 | |
SVS Eagle Focused Large Cap Growth Portfolio | | $ | 29,997 | | $ | 7,428 | | $ | 21,745 | | | $ | 37,500 | |
SVS Index 500 Portfolio | | $ | 170,616 | | $ | 61,995 | | $ | 96,904 | | | $ | 168,631 | (2) |
SVS INVESCO Dynamic Growth Portfolio | | $ | 55,989 | | $ | 16,362 | | $ | 18,190 | | | $ | 36,878 | (3) |
SVS Janus Growth And Income Portfolio | | $ | 77,682 | | $ | 20,505 | | $ | 76,303 | | | $ | 57,543 | |
SVS Janus Growth Opportunities Portfolio | | $ | 48,173 | | $ | 11,701 | | $ | 39,556 | | | $ | 156,916 | |
SVS MFS Strategic Value Portfolio | | $ | 36,987 | | $ | 28,810 | | $ | 24,898 | (1) | | $ | 23,755 | |
SVS Oak Strategic Equity Portfolio | | $ | 37,800 | | $ | 7,648 | | $ | 6,453 | | | $ | 28,595 | (4) |
SVS Turner Mid Cap Growth Portfolio | | $ | 55,282 | | $ | 16,321 | | $ | 48,267 | | | $ | 57,921 | (5) |
| (1) | Of which $24,898 was not imposed by the Advisor. |
| (2) | Of which $141,896 was not imposed by the Advisor. |
| (3) | Of which $36,878 was not imposed by the Advisor. |
| (4) | Of which $28,595 was not imposed by the Advisor. |
| (5) | Of which $57,630 was not imposed by the Advisor. |
Pursuant to a sub-administration and sub-accounting agreement among the Advisor, SFAC and State Street Bank and Trust Company (“SSB”), SFAC has delegated certain fund accounting functions to SSB under the each Portfolio’s fund accounting agreements. The costs and expenses of such delegation are borne by SFAC, not by the Portfolios.
S-90
PURCHASE AND REDEMPTIONS
Portfolio shares are sold at their net asset value next determined after an order and payment are received as described below. (See “Net Asset Value.”)
Upon receipt by a Portfolio’s transfer agent of a request for redemption, shares will be redeemed by the Fund, on behalf of a particular Portfolio, at the applicable net asset value as described below.
Market timing — the frequent trading of portfolio shares designed to take advantage of short-term market movements — can harm a Portfolio and its shareholders. The Portfolios and their agents may reject or limit purchase orders when there appears to be a pattern of market timing or other frequent purchases and sales. Because the Portfolios’ shares are offered exclusively to insurance company separate accounts that fund certain insurance contracts, a portfolio generally has little or no access to the records of individual contract holders. The Portfolios are dependent on the ability of these separate accounts to limit market timing and excessive trading of portfolio shares. The Portfolios are working with separate accounts to assess and improve controls against inappropriate trading. There can be no assurance that market timing in the Portfolios’ shares will not occur. The Fund, on behalf of a particular Portfolio, may suspend the right of redemption or delay payment more than seven days (a) during any period when the New York Stock Exchange (“Exchange”) is closed, other than customary weekend and holiday closings or during any period in which trading on the Exchange is restricted, (b) during any period when an emergency exists as a result of which (i) disposal of a Portfolio’s investments is not reasonably practicable, or (ii) it is not reasonably practicable for the Portfolio to determine the value of its net assets, or (c) for such other periods as the SEC may by order permit for the protection of the Fund’s shareholders.
DIVIDENDS, CAPITAL GAINS AND TAXES
Scudder Money Market Portfolio. The net asset value per share of the Scudder Money Market Portfolio is determined as of the earlier of 4:00 p.m. Eastern time or the close of the Exchange on each day the Exchange is open for trading, except that the net asset value will not be computed on a day in which no orders to purchase shares were received or no shares were tendered for redemption. The net asset value per share is determined by dividing the total assets of the Portfolio minus its liabilities by the total number of its shares outstanding. The net asset value per share of the Scudder Money Market Portfolio is ordinarily $1.00 calculated at amortized cost in accordance with Rule 2a-7 under the 1940 Act. While this rule provides certainty in valuation, it may result in periods during which value, as determined by amortized cost, is higher or lower than the price the Portfolio would have received if all its investments were sold. Under the direction of the Board of Trustees, certain procedures have been adopted to monitor and stabilize the price per share for the Portfolio. Calculations are made to compare the value of its investments valued at amortized cost with market-based values. Market-based values will be obtained by using actual quotations provided by market makers, estimates of market value, or values obtained from yield data relating to classes of money market instruments or government securities published by reputable sources. In the event that a deviation of 1/2 of 1% or more exists between the Portfolio’s $1.00 per share net asset value, calculated at amortized cost, and the net asset value calculated by reference to market-based quotations, or if there is any other deviation that the Board of Trustees believes would result in a material dilution to shareholders or purchasers, the Board of Trustees will promptly consider what action, if any, should be initiated. In order to value its investments at amortized cost, the Scudder Money Market Portfolio purchases only securities with a maturity of one year or less and maintains a dollar-weighted average portfolio maturity of 90 days or less. In addition, the Scudder Money Market Portfolio limits its portfolio investments to securities that meet the quality and diversification requirements of Rule 2a-7.
Dividends for Scudder Money Market Portfolio. Scudder Money Market Portfolio’s net investment income is declared as a dividend daily and paid monthly in additional shares. If a shareholder withdraws its entire account, all dividends accrued to the time of withdrawal will be paid at that time.
S-91
Dividends for All Portfolios Except Scudder Money Market Portfolio. The Fund normally follows the practice of declaring and distributing substantially all the net investment income and any net short-term and long-term capital gains of these Portfolios at least annually.
The Fund may at any time vary the dividend practices with respect to a Portfolio and, therefore, reserves the right from time to time to either distribute or retain for reinvestment such of its net investment income and its net short-term and long-term capital gains as the Board of Trustees of the Fund determines appropriate under the then current circumstances.
Taxes. Each Portfolio intends to qualify as a regulated investment company under subchapter M of the Internal Revenue Code (“Code”) in order to avoid taxation of the Portfolio and its shareholders.
Pursuant to the requirements of Section 817(h) of the Code, with certain limited exceptions, the only shareholders of the Portfolios will be insurance companies and their separate accounts that fund variable insurance contracts. The prospectus that describes a particular variable insurance contract discusses the taxation of separate accounts and the owner of the particular variable insurance contract.
Each Portfolio intends to comply with the requirements of Section 817(h) and related regulations. Section 817(h) of the Code and the regulations issued by the Treasury Department impose certain diversification requirements affecting the securities in which the Portfolios may invest. These diversification requirements are in addition to the diversification requirements under subchapter M and the 1940 Act. The consequences of failure to meet the requirements of Section 817(h) could result in taxation of the insurance company offering the variable insurance contract and immediate taxation of the owner of the contract to the extent of appreciation on investment under the contract.
The preceding is a brief summary of certain of the relevant tax considerations. The summary is not intended as a complete explanation or a substitute for careful tax planning and consultation with individual tax advisors.
NET ASSET VALUE
All Portfolios (other than the Scudder Money Market Portfolio). The net asset value of shares of each Portfolio is computed as of the close of regular trading on the New York Stock Exchange (the “Exchange”) on each day the Exchange is open for trading (the “Value Time”). The Exchange is scheduled to be closed on the following holidays: New Year’s Day, Dr. Martin Luther King, Jr. Day, Presidents’ Day, Good Friday, Memorial Day, Independence Day, Labor Day, Thanksgiving and Christmas, and on the preceding Friday or subsequent Monday when one of these holidays falls on a Saturday or Sunday, respectively. Net asset value per share is determined separately for each class of shares by dividing the value of the total assets of each Portfolio attributable to the shares of that class, less all liabilities attributable to that class, by the total number of shares of that class outstanding. The per share net asset value may be lower for certain classes of each Portfolio because of higher expenses borne by these classes.
An equity security is valued at its most recent sale price on the relevant exchange or OTC market as of the Value Time. Lacking any sales, the security is valued at the calculated mean between the most recent bid quotation and the most recent asked quotation (the “Calculated Mean”) on such exchange or OTC market as of the Value Time. If it is not possible to determine the Calculated Mean, the security is valued at the most recent bid quotation on such exchange or OTC market as of the Value Time. In the case of certain foreign exchanges or OTC markets, the closing price reported by the exchange or OTC market (which may sometimes be referred to as the “official close” or the “official closing price” or other similar term) will be considered the most recent sale price. If a security is traded on more than one exchange, or upon one or more exchanges and in the OTC market, quotations are taken from the market in which the security is traded most extensively.
S-92
Debt securities are valued as follows. Money market instruments purchased with an original or remaining maturity of 60 days or less, maturing at par, are valued at amortized cost. Other money market instruments are valued based on information obtained from an approved pricing agent or, if such information is not readily available, by using matrix pricing techniques (formula driven calculations based primarily on current market yields). Bank loans are valued at prices supplied by an approved pricing agent (which are intended to reflect the mean between the bid and asked prices), if available, and otherwise at the mean of the most recent bid and asked quotations or evaluated prices, as applicable, based on quotations or evaluated prices obtained from one or more broker-dealers. Privately placed debt securities, other than Rule 144A debt securities, initially are valued at cost and thereafter based on all relevant factors including type of security, size of holding and restrictions on disposition. Municipal debt securities are valued at prices supplied by an approved pricing agent (which are intended to reflect the mean between the bid and asked prices), if available, and otherwise at the average of the means based on the most recent bid and asked quotations or evaluated prices obtained from two broker-dealers. Other debt securities not addressed above are valued at prices supplied by an approved pricing agent, if available, and otherwise at the most recent bid quotation or evaluated price, as applicable, obtained from one or more broker-dealers. If it is not possible to value a particular debt security pursuant to the above methods, the security is valued on the basis of factors including (but not limited to) maturity, coupon, creditworthiness, currency denomination, and the movement of the market in which the security is normally traded.
An exchange-traded option contract on securities, currencies and other financial instruments is valued at its most recent sale price on such exchange. Lacking any sales, the option contract is valued at the Calculated Mean. If it is not possible to determine the Calculated Mean, the option contract is valued at the most recent bid quotation in the case of a purchased option contract or the most recent asked quotation in the case of a written option contract, in each case as of the Value Time. An option contract on securities, currencies and other financial instruments traded in the OTC market is valued on the Value Date at the market to market price, or if not available, at the evaluated price provided by the broker-dealer with which it was traded. Futures contracts (and options thereon) are valued at the most recent settlement price, if available, on the exchange on which they are traded most extensively. With the exception of stock index futures contracts which trade on the Chicago Mercantile Exchange, closing settlement times are prior to the close of trading on the New York Stock Exchange. For stock index futures contracts which trade on the Chicago Mercantile Exchange, closing settlement prices are normally available at approximately 4:20 Eastern time. If no settlement price is available, the last traded price on such exchange will be used.
Following the valuations of securities or other portfolio assets in terms of the currency in which the market quotation used is expressed (“Local Currency”), the value of these portfolio assets in terms of US dollars is calculated by converting the Local Currency into US dollars at the prevailing currency exchange rate on the valuation date.
If market quotations for a portfolio asset are not readily available or the value of a portfolio asset as determined in accordance with Board-approved procedures does not represent the fair market value of a portfolio asset, the value of the portfolio asset is taken to be an amount which, in the opinion of a portfolio’s Pricing Committee (or, in some cases, the Board’s Valuation Committee), represents fair market value. The value of other portfolio holdings owned by a Portfolio in the Fund is determined in a manner which is intended to reflect the fair market value of the asset on the valuation date, based on valuation procedures adopted by the portfolio’s Board and overseen by the portfolio’s Pricing Committee.
For Money Market Portfolio. The net asset value of shares of the Portfolio is calculated at 4:00 p.m. Eastern time or the close of business on each day the New York Stock Exchange (the “Exchange”) is open for trading. The Exchange is scheduled to be closed on the following holidays: New Year’s Day, Dr. Martin Luther King, Jr. Day, Presidents’ Day, Good Friday, Memorial Day, Independence Day, Labor Day, Thanksgiving and Christmas, and on the preceding Friday or subsequent Monday when one of these holidays falls on a Saturday or Sunday, respectively.
The Money Market Portfolio values its portfolio instruments at amortized cost, which does not take into account unrealized capital gains or losses. This involves initially valuing an instrument at its cost and thereafter assuming a constant amortization to maturity of any discount or premium, regardless of the impact of fluctuating interest rates on the market value of the instrument. While this method provides certainty in valuation, it may result in periods during which value, as determined by amortized cost, is higher or lower than the price the Portfolio would receive if it sold the
S-93
instrument. Calculations are made to compare the value of the Portfolio’s investments valued at amortized cost with market values. Market valuations are obtained by using actual quotations provided by market makers, estimates of market value, or values obtained from yield data relating to classes of money market instruments published by reputable sources at the mean between the bid and asked prices for the instruments. If a deviation of 1/2 of 1% or more were to occur between the net asset value per share calculated by reference to market values and the Portfolio’s $1.00 per share net asset value, or if there were any other deviation that the Board of Trustees of the Fund believed would result in a material dilution to shareholders or purchasers, the Board of Trustees would promptly consider what action, if any, should be initiated. If a the Portfolio’s net asset value per share (computed using market values) declined, or were expected to decline, below $1.00 (computed using amortized cost), the Board of Trustees of the Fund might temporarily reduce or suspend dividend payments in an effort to maintain the net asset value at $1.00 per share. As a result of such reduction or suspension of dividends or other action by the Board of Trustees, an investor would receive less income during a given period than if such a reduction or suspension had not taken place. Such action could result in investors receiving no dividend for the period during which they hold their shares and receiving, upon redemption, a price per share lower than that which they paid. On the other hand, if the Portfolio’s net asset value per share (computed using market values) were to increase, or were anticipated to increase above $1.00 (computed using amortized cost), the Board of Trustees might supplement dividends in an effort to maintain the net asset value at $1.00 per share. Redemption orders received in connection with the administration of checkwriting programs by certain dealers or other financial services firms prior to the determination of the Portfolio’s net asset value also may be processed on a confirmed basis in accordance with the procedures established by SDI.
TRUSTEES AND OFFICERS
The following table presents certain information regarding the Trustees and Officers of Scudder Variable Series II as of May 1, 2004. Each individual’s year of birth is set forth in parentheses after his or her name. Unless otherwise noted, (i) each individual has engaged in the principal occupation(s) noted in the table for at least the most recent five years, although not necessarily in the same capacity, and (ii) the address of each individual is c/o Deutsche Asset Management, 222 South Riverside Plaza, Chicago, Illinois, 60606. Each Trustee’s term of office extends until the next shareholders’ meeting called for the purpose of electing such Trustee and until the election and qualification of a successor, or until such Trustee sooner dies, retires, resigns or is removed as provided in the governing documents of the Fund.
Independent Trustees
| | | | |
Name, Year of Birth, Position(s) Held with the Fund and Length of Time Served^1
| | Principal Occupation(s) During Past 5 Years and Other Directorships Held
| | Number of Funds in
Fund Complex
Overseen
|
John W. Ballantine (1946) Trustee, 1999-present | | Retired; formerly, Executive Vice President and Chief Risk Management Officer, First Chicago NBD Corporation/The First National Bank of Chicago (1996-1998); Executive Vice President and Head of International Banking (1995-1996). Directorships: Enron Corporation (energy trading firm) (effective May 30, 2002); First Oak Brook Bancshares, Inc.; Oak Brook Bank; American Healthways, Inc. (provider of disease and care management services); Portland General Electric (utility company). | | 82 |
| | |
Lewis A. Burnham (1933) Trustee, 1977-present | | Retired; formerly, Director of Management Consulting, McNulty & Company; (1990-1998); prior thereto, Executive Vice President, Anchor Glass Container Corporation. | | 82 |
| | |
Donald L. Dunaway (1937) Trustee, 1980-present | | Retired; formerly, Executive Vice President, A. O. Smith Corporation (diversified manufacturer) (1963-1994). | | 82 |
S-94
| | | | |
Name, Year of Birth, Position(s) Held with the Fund and Length of Time Served^1
| | Principal Occupation(s) During Past 5 Years and Other Directorships Held
| | Number of Funds
in Fund Complex
Overseen
|
James R. Edgar (1946) Trustee, 1999-present | | Distinguished Fellow, University of Illinois, Institute of Government and Public Affairs (1999-present); formerly, Governor, State of Illinois (1991-1999). Directorships: Kemper Insurance Companies; John B. Sanfilippo & Son, Inc. (processor/packager/marketer of nuts, snacks and candy products); Horizon Group Properties, Inc.; Youbet.com (online wagering platform); Alberto-Culver Company (manufactures, distributes and markets health and beauty care products). | | 82 |
| | |
Paul K. Freeman (1950) Trustee, 2002-present | | President, Cook Street Holdings (consulting); Senior Visiting Research Scholar, Graduate School of International Studies, University of Denver; Consultant, World Bank/Inter-American Development Bank; formerly, Project Leader, International Institute for Applied Systems Analysis (1998-2001); Chief Executive Officer, The Eric Group, Inc. (environmental insurance) (1986-1998) | | 82 |
| | |
Robert B. Hoffman (1936) Trustee, 1981-present | | Retired; formerly, Chairman, Harnischfeger Industries, Inc. (machinery for the mining and paper industries) (1999-2000); prior thereto, Vice Chairman and Chief Financial Officer, Monsanto Company (agricultural, pharmaceutical and nutritional/food products) (1994-1999). Directorship: RCP Advisors, LLC (a private equity investment advisory firm). | | 82 |
| | |
Shirley D. Peterson (1941) Trustee, 1995-present | | Retired; formerly, President, Hood College (1995-2000); prior thereto, Partner, Steptoe & Johnson (law firm); Commissioner, Internal Revenue Service; Assistant Attorney General (Tax), US Department of Justice. Directorships: Federal Mogul Corp. (supplier of automotive components and subsystems); AK Steel (steel production); Goodyear Tire & Rubber Co. Trustee, Bryn Mawr College. Former Directorship: Bethlehem Steel Corp. | | 82 |
| | |
Fred B. Renwick (1930) Trustee, 1988-present | | Retired; Professor Emeritus of Finance, New York University, Stern School of Business (2001- present); formerly, Professor, New York University Stern School of Business (1965-2001). Directorships: The Wartburg Foundation; Chairman, Finance Committee of Morehouse College Board of Trustees; formerly, Director of Board of Pensions, Evangelical Lutheran Church in America; member of the Investment Committee of Atlanta University Board of Trustees; Chair of the Investment Committee, American Bible Society Board of Trustees. | | 82 |
| | |
John G. Weithers (1933) Trustee, 1993-present | | Retired; formerly, Chairman of the Board and Chief Executive Officer, Chicago Stock Exchange. Directorships: Federal Life Insurance Company; Chairman of the Members of the Corporation and Trustee, DePaul University; formerly, International Federation of Stock Exchanges; Records Management Systems. | | 82 |
S-95
Interested Trustee and Officers^2
| | | | |
Name, Date of Birth, Position(s) Held with the Fund and Length of Time Served^1
| | Principal Occupation(s) During Past 5 Years and Other Directorships Held
| | Number of Funds in
Scudder Fund
Complex Overseen
|
Richard T. Hale^3 (1945) Chairman and Trustee, 2002-present, Chief Executive Officer, 2003-present | | Managing Director, Deutsche Investment Management Americas Inc. (2003 to present); Managing Director, Deutsche Bank Securities Inc. (formerly Deutsche Banc Alex. Brown Inc.) and Deutsche Asset Management (1999 to present); Director and President, Investment Company Capital Corp. (registered investment advisor) (1996 to present); Director, Deutsche Global Funds, Ltd. (2000 to present), (registered investment company); Director, Scudder Global Opportunities Funds (since 2003); Director/Officer Deutsche/Scudder Mutual Funds (various dates); President, Montgomery Street Income Securities, Inc. (2002 to present) (registered investment companies); Vice President, Deutsche Asset Management, Inc. (2000 to present); formerly, Director, CABEI Fund (2000 to 2003), North American Income Fund (2000 to 2003) (registered investment companies), ISI Family of Funds (registered investment companies; 4 funds overseen) (1992-1999) | | 202 |
| | |
Brenda Lyons^4 (1963) President, 2003-present | | Managing Director, Deutsche Asset Management | | n/a |
| | |
Philip J. Collora (1945) Vice President and Assistant Secretary, 1986-present | | Director, Deutsche Asset Management | | n/a |
| | |
Kenneth Murphy^4 (1963) Vice President, 2002-present | | Vice President, Deutsche Asset Management (2000-present); formerly, Director, John Hancock Signature Services (1992-2000) | | n/a |
| | |
Charles A. Rizzo^4 (1957) Treasurer and Chief Financial Officer, 2002- present | | Managing Director, Deutsche Asset Management (April 2004 to present); formerly, Director, Deutsche Asset Management (April 2000-April 2004), Vice President and Department Head, BT Alex. Brown Incorporated (now Deutsche Bank Securities Inc.) (1998-1999); Senior Manager, Coopers & Lybrand L.L.P. (now PricewaterhouseCoopers LLP) (1993-1998) | | n/a |
| | |
John Millette^4 (1962) Secretary, 2001-present | | Director, Deutsche Asset Management | | n/a |
| | |
Lisa Hertz^5 (1970) Assistant Secretary, 2003-present | | Assistant Vice President, Deutsche Asset Management | | n/a |
| | |
Daniel O. Hirsch^3 (1954) Assistant Secretary, 2002-present | | Managing Director, Deutsche Asset Management (2002-present) and Director, Deutsche Global Funds Ltd. (2002-present); formerly, Director, Deutsche Asset Management (1999-2002); Principal, BT Alex. Brown Incorporated (now Deutsche Bank Securities Inc.) (1998-1999); Assistant General Counsel, United States Securities and Exchange Commission (1993-1998) | | n/a |
| | |
Caroline Pearson^4 (1962) Assistant Secretary, 1998-present | | Managing Director, Deutsche Asset Management | | n/a |
| | |
Kathleen Sullivan D’Eramo^4 (1957) Assistant Treasurer, 2003-present | | Director, Deutsche Asset Management | | n/a |
S-96
| | | | |
Name, Date of Birth, Position(s) Held with the Fund and Length of Time Served^1
| | Principal Occupation(s) During Past 5 Years and Other Directorships Held
| | Number of Funds in
Scudder Fund
Complex Overseen
|
Salvatore Schiavone^4 (1965) Assistant Treasurer, 2003-present | | Director, Deutsche Asset Management | | n/a |
| | |
Lucinda Stebbins^4 (1945) Assistant Treasurer, 2003-present | | Director, Deutsche Asset Management | | n/a |
| ^1 | Length of time served represents the date that each Trustee was first elected to the common board of Trustees which oversees a number of investment companies, including the Fund, managed by the Advisor. For the Officers of the Fund, length of time served represents the date that each Officer was first elected to serve as an officer of any fund overseen by the aforementioned common board of Trustees. |
| ^2 | As a result of their respective positions held with the Advisor, these individuals are considered “interested persons” of the Advisor within the meaning of the 1940 Act. Interested persons receive no compensation from the Fund. |
| ^3 | Address: One South Street, Baltimore, Maryland |
| ^4 | Address: Two International Place, Boston, Massachusetts |
| ^5 | Address: 345 Park Avenue, New York, New York |
Officers’ Role with Principal Underwriter: Scudder Distributors, Inc.
| | |
| Kenneth Murphy: | | Vice President |
| Caroline Pearson: | | Secretary |
| Philip J. Collora: | | Assistant Secretary |
Trustees’ Responsibilities. The officers of the Fund manage its day-to-day operations under the direction of the Fund’s Board of Trustees. The primary responsibility of the Board is to represent the interests of the shareholders of the Fund and to provide oversight of the management of the Fund. A majority of the Fund’s Board members are not affiliated with the Advisor.
The Board has adopted its own Governance Procedures and Guidelines and has established a number of committees, as described below. For each of the following Committees, the Board has adopted a written charter setting forth the Committees’ responsibilities.
Board Committees: The Fund’s Board has the following committees:
Audit Committee: The Audit Committee makes recommendations regarding the selection of independent auditors for the Fund, confers with the independent auditors regarding the Fund’s financial statements, the results of audits and related matters, and performs such other tasks as the full Board deems necessary or appropriate. The Audit Committee receives annual representations from the auditors as to their independence. The members of the Audit Committee are Donald L. Dunaway (Chair), Robert B. Hoffman and Lewis A. Burnham. The Audit Committee held ten meetings during calendar year 2003.
Nominating and Governance Committee: The Nominating and Governance Committee, which consists entirely of Independent Trustees, seeks and reviews candidates for consideration as nominees for membership on the Board and oversees the administration of the Fund’s Governance Procedures and Guidelines. The members of the Nominating and Governance Committee are Lewis A. Burnham (Chair), James R. Edgar and Shirley D. Peterson. The Nominating and Governance Committee held six meetings during calendar year 2003. Shareholders wishing to submit the name of a
S-97
candidate for consideration as a Board member by the Committee should submit their recommendation(s) to the Secretary of the Fund.
Valuation Committee: The Valuation Committee reviews Valuation Procedures adopted by the Board, determines fair value of the Fund’s securities as needed in accordance with the Valuation Procedures and performs such other tasks as the full Board deems necessary. The members of the Valuation Committee are John W. Ballantine (Chair) and Richard T. Hale. Alternate members are Donald L. Dunaway and John G. Weithers. During calendar year 2003, the Fund’s Valuation Committee held two meetings for each Portfolio except as follows: SVS Eagle Focused Large Cap Growth Portfolio - three meetings, Scudder Focus Value+Growth Portfolio - three meetings; Scudder Global Blue Chip Portfolio - five meetings; SVS Janus Growth Opportunities Portfolio - three meetings; Scudder Small Cap Growth Portfolio - six meetings; SVS Dreman Small Cap Value Portfolio - eight meetings; SVS Turner Mid Cap Growth Portfolio - three meetings and SVS Index 500 Portfolio - three meetings.
Equity Oversight Committee: The Equity Oversight Committee oversees investment activities of the Fund, such as investment performance and risk, expenses and services provided under the investment management agreement. The members of the Equity Oversight Committee are Robert B. Hoffman (Chair), Lewis A. Burnham and John G. Weithers. The Equity Oversight Committee held four meetings during calendar year 2003.
Fixed-Income Oversight Committee: The Fixed-Income Oversight Committee oversees investment activities of the Fund, such as investment performance and risk, expenses and services provided under the investment management agreements. The members of the Fixed-Income Oversight Committee are Paul K. Freeman (Chair), Donald L. Dunaway and Shirley D. Peterson. The Fixed-Income Oversight Committee held five meetings during calendar year 2003.
Operations Committee: The Operations Committee oversees the operations of the Fund, such as reviewing administrative fees and expenses, distribution arrangements, portfolio transaction policies, custody and transfer agency arrangements and shareholder services. Currently, the members of the Operations Committee are John W. Ballantine (Chair), Paul K. Freeman, Fred B. Renwick and John G. Weithers. The Operations Committee held seven meetings during calendar year 2003.
Remuneration. Each Independent Trustee receives a monthly retainer, paid on a quarterly basis, and an attendance fee, plus expenses, for each Board meeting and Committee meeting attended. The Trustees serve as board members of various other funds advised by the Advisor. The Advisor supervises the Fund’s investments, pays the compensation and expenses of its personnel who serve as Trustees and officers on behalf of the Fund and receives a management fee for its services.
The Board of Trustees of the Fund established a deferred compensation plan for the Independent Trustees (“Deferred Compensation Plan”). Under the Deferred Compensation Plan, the Independent Trustees may defer receipt of all, or a portion, of the compensation they earn for their services to the Fund, in lieu of receiving current payments of such compensation. Any deferred amount is treated as though an equivalent dollar amount has been invested in shares of one or more funds advised by the Advisor (“Shadow Shares”). Governor Edgar currently has elected to defer at least a portion of his fees. In addition, previously, Mr. Dunaway elected to defer fees that were payable, which are now included under the Deferred Compensation Plan. The equivalent Shadow Shares are reflected below in the table describing the Trustee’s share ownership.
Members of the Board of Trustees who are officers, directors, employees or stockholders of the Advisor or its affiliates receive no direct compensation from the Fund, although they are compensated as employees of the Advisor, or its affiliates, and as a result may be deemed to participate in fees paid by the Fund. The Independent Trustees are not entitled to benefits under any fund pension or retirement plan. The following table shows compensation received by each Trustee from the Fund and aggregate compensation from the fund complex during the calendar year 2003.
| | | | | | | | | |
Name of Trustee
| | Compensation from Scudder
Variable Series II
| | Pension or Retirement
Benefits Accrued
as Part of
Fund Expenses
| | Total Compensation Paid to
Trustee
from Fund Complex(4)(5)
|
John W. Ballantine | | $ | 13,907 | | $ | 0 | | $ | 218,350 |
Lewis A. Burnham | | $ | 12,630 | | $ | 0 | | $ | 209,620 |
Donald L. Dunaway(1) | | $ | 17,853 | | $ | 0 | | $ | 239,200 |
S-98
| | | | | | | | | |
Name of Trustee
| | Compensation from Scudder
Variable Series II
| | Pension or Retirement Benefits Accrued
as Part of
Fund Expenses
| | Total Compensation Paid to
Trustee
from Fund Complex(4)(5)
|
James R. Edgar(2) | | $ | 10,860 | | $ | 0 | | $ | 175,210 |
Paul K. Freeman | | $ | 13,006 | | $ | 0 | | $ | 194,280 |
Robert B. Hoffman | | $ | 10,990 | | $ | 0 | | $ | 189,160 |
Shirley D. Peterson(3) | | $ | 13,504 | | $ | 0 | | $ | 207,790 |
Fred B. Renwick | | $ | 10,772 | | $ | 0 | | $ | 183,940 |
John G. Weithers | | $ | 12,193 | | $ | 0 | | $ | 185,380 |
| (1) | Does not include deferred fees. Pursuant to a Deferred Compensation Plan, as discussed above, Mr. Dunaway previously elected, in prior years, to defer fees. Deferred amounts are treated as though an equivalent dollar amount has been invested in Shadow Shares (as defined above) of funds managed by the Advisor. Total deferred fees (including interest thereon and the return from the assumed investment in the funds managed by the Advisor) payable from the Fund to Mr. Dunaway are $0. |
| (2) | Includes deferred fees. Pursuant to a Deferred Compensation Plan, as discussed above, deferred amounts are treated as though an equivalent dollar amount has been invested in Shadow Shares (as defined above) of funds managed by the Advisor in which compensation may be deferred by Governor Edgar. Total deferred fees (including interest thereon and the return from the assumed investment in the funds managed by the Advisor) payable from the Fund to Governor Edgar are $34,439. |
| (3) | Includes $19,020 in annual retainer fees received by Ms. Peterson as Lead Trustee. |
| (4) | For each Trustee, total compensation includes compensation for service on the boards of 31 trusts/corporations comprised of 81 funds/portfolios. Each Trustee currently serves on the boards of 31 DeAM trusts/corporations comprised of 82 funds/portfolios. |
| (5) | Aggregate compensation reflects amounts paid to the Trustees for special meetings in connection with amending the administrative services agreement and the transfer agency agreement and the delegation of certain fund accounting functions to State Street Bank and Trust Company. Such amounts totaled $15,510 for Messrs. Ballantine and Dunaway, $8,560 for Messrs. Freeman, Hoffman, Renwick, and Weithers, and $5,170 for Messrs. Burnham and Edgar and Ms. Peterson. These meeting fees were borne by the Advisor. |
Mr. Freeman, prior to his service as Independent Trustee of the Fund, served as a board member of certain funds in the Deutsche Bank complex (“DB Funds”). In connection with his resignation and the resignation of certain other board members as Trustees of the DB Funds on July 30, 2002 (the “Effective Date”), which was part of a restructuring of the boards overseeing the DB Funds, Deutsche Asset Management, Inc. (“DeAM”) agreed to recommend, and, if necessary obtain, directors and officers (“D&O”) liability insurance coverage for the prior board members, including Mr. Freeman, that is at least as equivalent in scope and amount to the D&O coverage provided to the prior board members for the six-year period following the Effective Date. In the event that D&O insurance coverage is not available in the commercial marketplace on commercially reasonable terms from a conventional third party insurer, DeAM reserved the right to provide substantially equivalent protection in the form of an indemnity or financial guarantee from an affiliate of DeAM. The D&O policy in effect prior to the Effective Date provided aggregate coverage of $25,000,000, subject to a $250,000 per claim deductible.
S-99
Trustee Fund Ownership. Under the Fund’s Governance Procedures and Guidelines, the Independent Trustees have established the expectation that within three years, an Independent Trustee will have invested an amount in those funds he or she oversees (which shall include amounts held under a deferred fee agreement that are valued based on “shadow investments” in such funds) in the aggregate equal to at least one times the amount of the annual retainer received from such funds, with investments allocated to at least one money market, fixed-income and equity fund portfolio, where such an investment is suitable for the particular Independent Trustee’s personal investment needs. Each interested Trustee is also encouraged to own an amount of shares (based upon their own individual judgment) of those funds that he or she oversees that is suitable for his or her own appropriate investment needs. The following tables set forth each Trustee’s share ownership of the Fund and all funds in the fund complex overseen by each Trustee as of December 31, 2003.
| | | | |
Name of Trustee
| | Dollar Range of
Securities Owned in
Scudder Variable Series II(1)
| | Aggregate Dollar Range of Securities Owned in All
Funds in the Fund Complex Overseen by Trustee
|
John W. Ballantine | | None | | Over $100,000 |
Lewis A. Burnham | | None | | Over $100,000 |
Donald L. Dunaway(2) | | None | | Over $100,000 |
James R. Edgar(2) | | None | | Over $100,000 |
Paul K. Freeman | | None | | Over $100,000 |
Richard T. Hale | | None | | Over $100,000 |
Robert B. Hoffman | | None | | Over $100,000 |
Shirley D. Peterson | | None | | Over $100,000 |
Fred B. Renwick | | None | | Over $100,000 |
John G. Weithers | | None | | Over $100,000 |
| ^1 | Scudder Variable Series II, and each of its series; these include: |
Scudder Aggressive Growth Portfolio
Scudder Blue Chip Portfolio
Scudder Large Cap Value Portfolio
Scudder Fixed Income Portfolio
Scudder Global Blue Chip Portfolio
Scudder Government & Agency Securities Portfolio
Scudder Growth Portfolio
Scudder High Income Portfolio
Scudder International Select Equity Portfolio
Scudder Money Market Portfolio
Scudder Small Cap Growth Portfolio
Scudder Strategic Income Portfolio
Scudder Technology Growth Portfolio
Scudder Total Return Portfolio
SVS Davis Venture Value Portfolio
SVS Dreman Financial Services Portfolio
SVS Dreman High Return Equity Portfolio
SVS Dreman Small Cap Value Portfolio
SVS Eagle Focused Large Cap Growth Portfolio
SVS Focus Value+Growth Portfolio
SVS Index 500 Portfolio
SVS INVESCO Dynamic Growth Portfolio
SVS Janus Growth & Income Portfolio
SVS Janus Growth Opportunities Portfolio
SVS MFS Strategic Value Portfolio
SVS Oak Strategic Equity Portfolio
SVS Turner Mid Cap Growth Portfolio
S-100
| 2 | The dollar range of shares shown includes share equivalents of certain Scudder funds in which Mr. Dunaway and Governor Edgar are deemed to be invested pursuant to the Fund’s Deferred Compensation Plan as more fully described above under “Remuneration.” |
As of April 5, 2004, all Trustees and Officers of the Fund as a group owned beneficially (as that term is defined is section 13(d) of the Securities Exchange Act of 1934) less than 1% of the outstanding securities of the Fund.
To the best of the Fund’s knowledge, as of April 5, 2004, no person owned of record or beneficially 5% or more of any class of a Portfolio’s outstanding shares, except as noted below:
As of April 5, 2004, 2,045,611 shares in the aggregate, or 34.86% of the outstanding shares of Scudder Variable Series II: Aggressive Growth Portfolio, Class A were held in the name of Allmerica Life SVSII, 440 Lincoln St., Worcester, MA 01653-0002 who may be deemed to be the beneficial owner of such shares.
As of April 5, 2004, 3,739,864 shares in the aggregate, or 63.73% of the outstanding shares of Scudder Variable Series II: Aggressive Growth Portfolio, Class A were held in the name of Zurich Destinations Farmers SVS II, C/O Kilico, Windy Point II, 1600 McConnor Pkwy, Schaumburg, IL 60196-6800 who may be deemed to be the beneficial owner of such shares.
As of April 5, 2004, 491,260 shares in the aggregate, or 92.46% of the outstanding shares of Scudder Variable Series II: Aggressive Growth Portfolio, Class B were held in the name of The Manufactures Life Ins. Co. (USA), 500 Boylston St., Ste. 400, Boston, MA 02116-3740 who may be deemed to be the beneficial owner of such shares.
As of April 5, 2004, 29,829 shares in the aggregate, or 5.61% of the outstanding shares of Scudder Variable Series II: Aggressive Growth Portfolio, Class B were held in the name of Travelers Life & Annuity Company, 1 City Place, Hartford, CT 06103-3408 who may be deemed to be the beneficial owner of such shares.
As of April 5, 2004, 8,458,728 shares in the aggregate, or 92.67% of the outstanding shares of Scudder Variable Series II: Blue Chip Portfolio, Class A were held in the name of Allmerica Life SVS II, 440 Lincoln St., Worcester, MA 01653-0002 who may be deemed to be the beneficial owner of such shares.
As of April 5, 2004, 11,201,307 shares in the aggregate, or 5.13% of the outstanding shares of Scudder Variable Series II: Blue Chip Portfolio, Class A were held in the name of Zurich Destinations Farmers SVS II, C/O Kilico, Windy Point II, 1600 McConnor Pkwy, Schaumburg, IL 60196-6800 who may be deemed to be the beneficial owner of such shares.
As of April 5, 2004, 1,667,447 shares in the aggregate, or 41.40% of the outstanding shares of Scudder Variable Series II: Blue Chip Portfolio, Class B were held in the name of The Manufactures Life Ins. Co. (USA), 500 Boylston St., Ste. 400, Boston, MA 02116-3740 who may be deemed to be the beneficial owner of such shares.
As of April 5, 2004, 92,244 shares in the aggregate, or 54.83% of the outstanding shares of Scudder Variable Series II: Blue Chip Portfolio, Class B were held in the name of Travelers Life & Annuity Company, 1 City Place, Hartford, CT 06103-3408 who may be deemed to be the beneficial owner of such shares.
As of April 5, 2004, 7,528,650 shares in the aggregate, or 40.99% of the outstanding shares of Scudder Variable Series II: Large Cap Value Portfolio, Class A were held in the name of Allmerica Life SVS II, 440 Lincoln, St., Worcester, MA 01653-0002 who may be deemed to be the beneficial owner of such shares.
As of April 5, 2004, 3,308,913 shares in the aggregate, or 18.01% of the outstanding shares of Scudder Variable Series II: Large Cap Value Portfolio, Class A were held in the name of Kemper Investors Life, Windy Point II, 1600 McConnor Pkwy, Schaumburg, IL 60196-6800 who may be deemed to be the beneficial owner of such shares.
As of April 5, 2004, 7,318,118 shares in the aggregate, or 39.84% of the outstanding shares of Scudder Variable Series II: Large Cap Value Portfolio, Class A were held in the name of Zurich Destinations Farmers SVS II, C/O Kilico, Windy Point II, 1600 McConnor Pkwy, Schaumburg, IL 60196-6800 who may be deemed to be the beneficial owner of such shares.
S-101
As of April 5, 2004, 1,706,826 shares in the aggregate, or 91.41% of the outstanding shares of Scudder Variable Series II: Large Cap Value Portfolio, Class B were held in the name of The Manufactures Life Ins. Co. (USA), 500 Boylston St., Ste. 400, Boston, MA 02116-3740 who may be deemed to be the beneficial owner of such shares.
As of April 5, 2004, 131,852 shares in the aggregate, or 7.06% of the outstanding shares of Scudder Variable Series II: Large Cap Value Portfolio, Class B were held in the name of Travelers Life & Annuity Company, 1 City Place, Hartford, CT 06103-3408 who may be deemed to be the beneficial owner of such shares.
As of April 5, 2004, 5,601,841 shares in the aggregate, or 92.27% of the outstanding shares of Scudder Variable Series II: SVS Davis Venture Value Portfolio, Class A were held in the name of Allmerica Life SVS II, 440 Lincoln St., Worcester, MA 01653-0002 who may be deemed to be the beneficial owner of such shares.
As of April 5, 2004, 16,180,322 shares in the aggregate, or 5.61% of the outstanding shares of Scudder Variable Series II: SVS Davis Venture Value Portfolio, Class A were held in the name of Zurich Destinations Farmers SVS II, C/O Kilico, Windy Point II, 1600 McConnor Pkwy, Schaumburg, IL 60196-6800 who may be deemed to be the beneficial owner of such shares.
As of April 5, 2004, 3,271,217 shares in the aggregate, or 25.50% of the outstanding shares of Scudder Variable Series II: SVS Davis Venture Value Portfolio, Class B were held in the name of The Manufactures Life Ins. Co. (USA), 500 Boylston St., Ste. 400, Boston, MA 02116-3740 who may be deemed to be the beneficial owner of such shares.
As of April 5, 2004, 199,009 shares in the aggregate, or 73.66% of the outstanding shares of Scudder Variable Series II: SVS Davis Venture Value Portfolio, Class B were held in the name of Travelers Life & Annuity Company, 1 City Place, Hartford, CT 06103-3408 who may be deemed to be the beneficial owner of such shares.
As of April 5, 2004, 5,226,502 shares in the aggregate, or 44.99% of the outstanding shares of Scudder Variable Series II: SVS Dreman Financial Services Portfolio, Class A were held in the name of Allmerica Life SVS II, 440 Lincoln St., Worcester, MA 01653-0002 who may be deemed to be the beneficial owner of such shares.
As of April 5, 2004, 6,027,762 shares in the aggregate, or 51.89% of the outstanding shares of Scudder Variable Series II: SVS Dreman Financial Services Portfolio, Class A were held in the name of Zurich Destinations Farmers SVS II, C/O Kilico, Windy Point II, 1600 McConnor Pkwy, Schaumburg, IL 60196-6800 who may be deemed to be the beneficial owner of such shares.
As of April 5, 2004, 921,141 shares in the aggregate, or 92.70% of the outstanding shares of Scudder Variable Series II: SVS Dreman Financial Services Portfolio, Class B were held in the name of The Manufactures Life Ins. Co. (USA), 500 Boylston St., Ste. 400, Boston, MA 02116-3740 who may be deemed to be the beneficial owner of such shares.
As of April 5, 2004, 55,664 shares in the aggregate, or 5.60% of the outstanding shares of Scudder Variable Series II: SVS Dreman Financial Services Portfolio, Class B were held in the name of Travelers Life & Annuity Company, 1 City Place, Hartford, CT 06103-3408 who may be deemed to be the beneficial owner of such shares.
As of April 5, 2004, 18,602,806 shares in the aggregate, or 30.79% of the outstanding shares of Scudder Variable Series II: SVS Dreman High Return Equity Portfolio, Class A were held in the name of Allmerica Life SVS II, 440 Lincoln St., Worcester, MA 01653-0002 who may be deemed to be the beneficial owner of such shares.
As of April 5, 2004, 39,366,530 shares in the aggregate, or 65.15% of the outstanding shares of Scudder Variable Series II: SVS Dreman High Return Equity Portfolio, Class A were held in the name of Zurich Destinations Farmers SVS II, C/O Kilico, Windy Point II, 1600 McConnor Pkwy, Schaumburg, IL 60196-6800 who may be deemed to be the beneficial owner of such shares.
As of April 5, 2004, 6,845,695 shares in the aggregate, or 95.30% of the outstanding shares of Scudder Variable Series II: SVS Dreman High Return Equity Portfolio, Class B were held in the name of The Manufactures Life Ins.
S-102
Co. (USA), 500 Boylston St., Ste. 400, Boston, MA 02116-3740 who may be deemed to be the beneficial owner of such shares.
As of April 5, 2004, 7,366,946 shares in the aggregate, or 33.12% of the outstanding shares of Scudder Variable Series II: SVS Dreman Small Cap Value Portfolio, Class A were held in the name of Allmerica Life SVS II, 440 Lincoln St., Worcester, MA 01653-0002, who may be deemed to be the beneficial owner of such shares.
As of April 5, 2004, 2,699,107 shares in the aggregate, or 12.14% of the outstanding shares of Scudder Variable Series II: SVS Dreman Small Cap Value Portfolio, Class A were held in the name of Kemper Investors Life, Windy Point II, 1600 McConnor Pkwy, Schaumburg, IL 60196-6800 who may be deemed to be the beneficial owner of such shares.
As of April 5, 2004, 11,698,892 shares in the aggregate, or 52.60% of the outstanding shares of Scudder Variable Series II: SVS Dreman Small Cap Value Portfolio, Class A were held in the name of Zurich Destinations Farmers SVS II, C/O Kilico, Windy Point II, 1600 McConnor Pkwy, Schaumburg, IL 60196-6800 who may be deemed to be the beneficial owner of such shares.
As of April 5, 2004, 2,283,432 shares in the aggregate, or 92.68% of the outstanding shares of Scudder Variable Series II: SVS Dreman Small Cap Value Portfolio, Class B were held in the name of The Manufactures Life Ins. Co. (USA), 500 Boylston St., Ste. 400, Boston, MA 02116-3740 who may be deemed to be the beneficial owner of such shares.
As of April 5, 2004, 124,698 shares in the aggregate, or 5.06% of the outstanding shares of Scudder Variable Series II: SVS Dreman Small Cap Value Portfolio, Class B were held in the name of Travelers Life & Annuity Company, 1 City Place, Hartford, CT 06103-3408 who may be deemed to be the beneficial owner of such shares.
As of April 5, 2004, 2,764,783 shares in the aggregate, or 28.02% of the outstanding shares of Scudder Variable Series II: SVS Eagle Focused Large Cap Growth Portfolio, Class A were held in the name of Allmerica Life SVS II, 440 Lincoln St., Worcester, MA 01653-0002 who may be deemed to be the beneficial owner of such shares.
As of April 5, 2004, 7,014,748 shares in the aggregate, or 71.08% of the outstanding shares of Scudder Variable Series II: SVS Eagle Focused Large Cap Growth Portfolio, Class A were held in the name of Zurich Destinations Farmers SVS II, C/O Kilico, Windy Point II, 1600 McConnor Pkwy, Schaumburg, IL 60196-6800 who may be deemed to be the beneficial owner of such shares.
As of April 5, 2004, 2,149,431 shares in the aggregate, or 93.28% of the outstanding shares of Scudder Variable Series II: SVS Eagle Focused Large Cap Growth Portfolio, Class B were held in the name of The Manufactures Life Ins. Co. (USA), 500 Boylston St., Ste. 400, Boston, MA 02116-3740 who may be deemed to be the beneficial owner of such shares.
As of April 5, 2004, 8,088,909 shares in the aggregate, or 48.23% of the outstanding shares of Scudder Variable Series II: Fixed Income Portfolio, Class A were held in the name of Allmerica Life SVS II, 440 Lincoln St., Worcester, MA 01653-0002 who may be deemed to be the beneficial owner of such shares.
As of April 5, 2004, 1,176,012 shares in the aggregate, or 7.01% of the outstanding shares of Scudder Variable Series II: Fixed Income Portfolio, Class A were held in the name of Kemper Investors Life, Windy Point II, 1600 McConnor Pkwy, Schaumburg, IL 60196-6800 who may be deemed to be the beneficial owner of such shares.
As of April 5, 2004, 7,037,698,935 shares in the aggregate, or 41.96% of the outstanding shares of Scudder Variable Series II: Fixed Income Portfolio, Class A were held in the name of Zurich Destinations Farmers SVS II, c/o Kilico, Windy Point II, 1600 McConnor Pkwy, Schaumburg, IL 60196-6800 who may be deemed to be the beneficial owner of such shares.
As of April 5, 2004, 4,621,420 shares in the aggregate, or 93.26% of the outstanding shares of Scudder Variable Series II: Fixed Income Portfolio, Class B were held in the name of The Manufacturer’s Life Ins. Co. (USA), 500 Boylston Street, Boston, MA 02116-3740 who may be deemed to be the beneficial owner of such shares.
S-103
As of April 5, 2004, 254,857 shares in the aggregate, or 5.14% of the outstanding shares of Scudder Variable Series II: Fixed Income Portfolio, Class B were held in the name of Travelers Life & Annuity Company, 1 City Place, Hartford, CT 06103-3408 who may be deemed to be the beneficial owner of such shares.
As of April 5, 2004, 4,872,655 shares in the aggregate, or 52.85% of the outstanding shares of Scudder Variable Series II: SVS Focus Value+Growth Portfolio, Class A were held in the name of Allmerica Life SVS II, 440 Lincoln St., Worcester, MA 01653-0002 who may be deemed to be the beneficial owner of such shares.
As of April 5, 2004, 1,263,460 shares in the aggregate, or 13.71% of the outstanding shares of Scudder Variable Series II: SVS Focus Value+Growth Portfolio, Class A were held in the name of Kemper Investors Life, Windy Point II, 1600 McConnor Pkwy, Schaumburg, IL 60196-6800 who may be deemed to be the beneficial owner of such shares.
As of April 5, 2004, 2,924,857 shares in the aggregate, or 31.73% of the outstanding shares of Scudder Variable Series II: SVS Focus Value+Growth Portfolio, Class A were held in the name of Zurich Destinations Farmers SVS II, C/O Kilico, Windy Point II, 1600 McConnor Pkwy, Schaumburg, IL 60196-6800 who may be deemed to be the beneficial owner of such shares.
As of April 5, 2004, 625,010 shares in the aggregate, or 96.61% of the outstanding shares of Scudder Variable Series II: SVS Focus Value+Growth Portfolio, Class B were held in the name of The Manufactures Life Ins. Co. (USA), 500 Boylston St., Ste. 400, Boston, MA 02116-3740 who may be deemed to be the beneficial owner of such shares.
As of April 5, 2004, 2,176,551 shares in the aggregate, or 40.17% of the outstanding shares of Scudder Variable Series II: Global Blue Chip Portfolio, Class A were held in the name of Allmerica Life SVS II, 440 Lincoln St., Worcester, MA 01653-0002 who may be deemed to be the beneficial owner of such shares.
As of April 5, 2004, 3,134,799 shares in the aggregate, or 57.85% of the outstanding shares of Scudder Variable Series II: Global Blue Chip Portfolio, Class A were held in the name of Zurich Destinations Farmers SVS II, C/O Kilico, Windy Point II, 1600 McConnor Pkwy, Schaumburg, IL 60196-6800 who may be deemed to be the beneficial owner of such shares.
As of April 5, 2004, 640,955 shares in the aggregate, or 86.30% of the outstanding shares of Scudder Variable Series II: Global Blue Chip Portfolio, Class B were held in the name of The Manufactures Life Ins. Co. (USA), 500 Boylston St., Ste. 400, Boston, MA 02116-3740 who may be deemed to be the beneficial owner of such shares.
As of April 5, 2004, 54,733 shares in the aggregate, or 7.37% of the outstanding shares of Scudder Variable Series: Global Blue Chip Portfolio, Class B were held in the name of The Travelers Life & Annuity Company, 1 City Place, Hartford, CT 06103-3408 who may be deemed to be the beneficial owner of such shares.
As of April 5, 2004, 44,211 shares in the aggregate, or 5.95% of the outstanding shares of Scudder Variable Series II: Global Blue Chip Portfolio, Class B were held in the name of Travelers Insurance Company, Attn: Shareholder Accounting Unit, P.O. Box 990027, Hartford, CT 06199-0027 who may be deemed to be the beneficial owner of such shares.
As of April 5, 2004, 11,904,621 shares in the aggregate, or 46.35% of the outstanding shares of Scudder Variable Series II: Government & Agency Securities Portfolio, Class A were held in the name of Allmerica Life SVS II, 440 Lincoln St., Worcester, MA 01653-0002 who may be deemed to be the beneficial owner of such shares.
As of April 5, 2004, 5,053,080 shares in the aggregate, or 19.67% of the outstanding shares of Scudder Variable Series II: Government & Agency Securities Portfolio, Class A were held in the name of Kemper Investors Life, Windy Point II, 1600 McConnor Pkwy, Schaumburg, IL 60196-6800 who may be deemed to be the beneficial owner of such shares.
As of April 5, 2004, 7,391,411 shares in the aggregate, or 28.78% of the outstanding shares of Scudder Variable Series II: Government & Agency Securities Portfolio, Class A were held in the name of Zurich Destinations Farmers SVS II, C/O Kilico, Windy Point II, 1600 McConnor Pkwy, Schaumburg, IL 60196-6800 who may be deemed to be the beneficial owner of such shares.
S-104
As of April 5, 2004, 3,576,754 shares in the aggregate, or 96.51% of the outstanding shares of Scudder Variable Series II: Government & Agency Securities Portfolio, Class B were held in the name of The Manufactures Life Ins. Co. (USA), 500 Boylston St., Ste. 400, Boston, MA 02116-3740 who may be deemed to be the beneficial owner of such shares.
As of April 5, 2004, 3,421,659 shares in the aggregate, or 20.96% of the outstanding shares of Scudder Variable Series II: Growth Portfolio, Class A were held in the name of Allmerica Life SVS II, 440 Lincoln St., Worcester, MA 01653-0002 who may be deemed to be the beneficial owner of such shares.
As of April 5, 2004, 8,042,230 shares in the aggregate, or 49.25% of the outstanding shares of Scudder Variable Series II: Growth Portfolio, Class A were held in the name of Kemper Investors Life, Windy Point II, 1600 McConnor Pkwy, Schaumburg, IL 60196-6800 who may be deemed to be the beneficial owner of such shares.
As of April 5, 2004, 4,547,065 shares in the aggregate, or 27.85% of the outstanding shares of Scudder Variable Series II: Growth Portfolio, Class A were held in the name of Zurich Destinations Farmers SVS II, C/O Kilico, Windy Point II, 1600 McConnor Pkwy, Schaumburg, IL 60196-6800 who may be deemed to be the beneficial owner of such shares.
As of April 5, 2004, 478,029 shares in the aggregate, or 92.55% of the outstanding shares of Scudder Variable Series II: Growth Portfolio, Class B were held in the name of The Manufactures Life Ins. Co. (USA), 500 Boylston St., Ste. 400, Boston, MA 02116-3740 who may be deemed to be the beneficial owner of such shares.
As of April 5, 2004, 20,306,966 shares in the aggregate, or 40.54% of the outstanding shares of Scudder Variable Series II: High Income Portfolio, Class A were held in the name of Allmerica Life SVS II, 440 Lincoln St., Worcester, MA 01653-0002 who may be deemed to be the beneficial owner of such shares.
As of April 5, 2004, 13,855,360 shares in the aggregate, or 27.66% of the outstanding shares of Scudder Variable Series II: High Income Portfolio, Class A were held in the name of Kemper Investors Life, Windy Point II, 1600 McConnor Pkwy, Schaumburg, IL 60196-6800 who may be deemed to be the beneficial owner of such shares.
As of April 5, 2004, 14,618,042 shares in the aggregate, or 29.18% of the outstanding shares of Scudder Variable Series II: High Income Portfolio, Class A were held in the name of Zurich Destinations Farmers SVS II, C/O Kilico, Windy Point II, 1600 McConnor Pkwy, Schaumburg, IL 60196-6800 who may be deemed to be the beneficial owner of such shares,
As of April 5, 2004, 4,811,095 shares in the aggregate, or 91.71% of the outstanding shares of Scudder Variable Series II: High Income Portfolio, Class B were held in the name of The Manufactures Life Ins. Co. (USA), 500 Boylston St., Ste. 400, Boston, MA 02116-3740 who may be deemed to be the beneficial owner of such shares.
As of April 5, 2004, 316,609 shares in the aggregate, or 6.03% of the outstanding shares of Scudder Variable Series II: High Income Portfolio, Class B were held in the name of Travelers Life & Annuity Company, 1 City Place, Hartford, CT 06103-3408 who may be deemed to be the beneficial owner of such shares.
As of April 5, 2004, 12,536,015 shares in the aggregate, or 91.54% of the outstanding shares of Scudder Variable Series II: SVS Index 500 Portfolio, Class A were held in the name of Allmerica Life SVS II, 440 Lincoln St., Worcester, MA 01653-0002 who may be deemed to be the beneficial owner of such shares.
As of April 5, 2004, 24,492,584 shares in the aggregate, or 6.73% of the outstanding shares of Scudder Variable Series II: SVS Index 500 Portfolio, Class A were held in the name of Zurich Destinations Farmers SVS II, C/O Kilico, Windy Point II, 1600 McConnor Pkwy, Schaumburg, IL 60196-6800 who may be deemed to be the beneficial owner of such shares.
S-105
As of April 5, 2004, 5,117,020 shares in the aggregate, or 33.48% of the outstanding shares of Scudder Variable Series II: SVS Index 500 Portfolio, Class B were held in the name of The Manufactures Life Ins. Co. (USA), 500 Boylston St., Ste. 400, Boston, MA 02116-3740 who may be deemed to be the beneficial owner of such shares.
As of April 5, 2004, 376,284 shares in the aggregate, or 65.42% of the outstanding shares of Scudder Variable Series II: SVS Index 500 Portfolio, Class B were held in the name of Travelers Life & Annuity Company, 1 City Place, Hartford, CT 06103-3408 who may be deemed to be the beneficial owner of such shares.
As of April 5, 2004, 2,002,041 shares in the aggregate, or 83.46% of the outstanding shares of Scudder Variable Series II: International Select Equity Portfolio, Class B were held in the name of the Manufactures Life Ins. Co. (USA), 500 Boylston St., Ste. 400, Boston, MA 02116-3740 who may be deemed to be the beneficial owner of such shares.
As of April 5, 2004, 337,689 shares in the aggregate, or 14.08% of the outstanding shares of Scudder Variable Series II: International Select Equity Portfolio, Class B were held in the name of Travelers Life & Annuity Company, 1 City Place, Hartford, CT 06103-3408 who may be deemed to be the beneficial owner of such shares.
As of April 5, 2004, 4,642,210 shares in the aggregate, or 31.84% of the outstanding shares of Scudder Variable Series II: International Select Equity Portfolio, Class A were held in the name of Allmerica Life SVS II, 440 Lincoln St., Worcester, MA 01653-0002 who may be deemed to be the beneficial owner of such shares.
As of April 5, 2004, 5,133,797 shares in the aggregate, or 35.18% of the outstanding shares of Scudder Variable Series II: International Select Equity, Class A were held in the name of Zurich Destinations Farmers SVS II, C/O Kilico, Windy Point II, 1600 McConnor Pkwy, Schaumburg, IL 60196-6800 who may be deemed to be the beneficial owner of such shares,
As of April 5, 2004, 4,623,682 shares in the aggregate, or 31.69% of the outstanding shares of Scudder Variable Series II: International Select Equity Portfolio, Class A were held in the name of Kemper Investors Life, Windy Point II, 1600 McConnor Pkwy, Schaumburg, IL 60196-6800 who may be deemed to be the beneficial owner of such shares.
As of April 5, 2004, 840,983 shares in the aggregate, or 92.92% of the outstanding shares of Scudder Variable Series II: SVS INVESCO Dynamic Growth Portfolio, Class B were held in the name of Allmerica Life SVS II, 440 Lincoln St., Worcester, MA 01653-0002 who may be deemed to be the beneficial owner of such shares.
As of April 5, 2004, 3,192,158 shares in the aggregate, or 20.75% of the outstanding shares of Scudder Variable Series II: SVS INVESCO Dynamic Growth Portfolio, Class A were held in the name of Zurich Destinations Farmers SVS II, C/O Kilico, Windy Point II, 1600 McConnor Pkwy, Schaumburg, IL 60196-6800 who may be deemed to be the beneficial owner of such shares.
As of April 5, 2004, 592,248 shares in the aggregate, or 78.78% of the outstanding shares of Scudder Variable Series II: SVS INVESCO Dynamic Growth Portfolio, Class B were held in the name of The Manufactures Life Ins. Co. (USA), 500 Boylston St., Ste. 400, Boston, MA 02116-3740 who may be deemed to be the beneficial owner of such shares,
As of April 5, 2004, 6,299,624 shares in the aggregate, or 30.55% of the outstanding shares of Scudder Variable Series: SVS Janus Growth And Income Portfolio, Class A were held in the name of Allmerica Life SVS II, 440 Lincoln St., Worcester, MA 01653-0002 who may be deemed to be the beneficial owner of such shares.
As of April 5, 2004, 14,095,084 shares in the aggregate, or 68.35% of the outstanding shares of Scudder Variable Series II: SVS Janus Growth And Income Portfolio, Class A were held in the name of Zurich Destinations Farmers SVS II, C/O Kilico, Windy Point II, 1600 McConnor Pkwy, Schaumburg, IL 60196-6800 who may be deemed to be the beneficial owner of such shares.
As of April 5, 2004, 1,864,909 shares in the aggregate, or 92.10% of the outstanding shares of Scudder Variable Series II: SVS Janus Growth And Income Portfolio, Class B were held in the name of The Manufactures Life Ins. Co.
S-106
(USA), 500 Boylston St., Ste. 400, Boston, MA 02116-3740 who may be deemed to be the beneficial owner of such shares.
As of April 5, 2004, 869,506 shares in the aggregate, or 5.25% of the outstanding shares of Scudder Variable Series II: SVS Janus Growth And Income Portfolio, Class B were held in the name of The Manufacturer’s Life Ins. Co. (USA), 500 Boylston Street, Boston, MA, 02116-3740 who may be deemed to be the beneficial owner of such shares.
As of April 5, 2004, 5,700,851 shares in the aggregate, or 30.63% of the outstanding shares of Scudder Variable Series II: SVS Janus Growth Opportunities Portfolio, Class A were held in the name of Allmerica Life SVS II, 440 Lincoln St., Worcester, MA 01653-0002 who may be deemed to be the beneficial owner of such shares.
As of April 5, 2004, 12,745,193 shares in the aggregate, or 68.48% of the outstanding shares of Scudder Variable Series II: SVS Janus Growth Opportunities Portfolio, Class A were held in the name of Zurich Destinations Farmers SVS II, C/O Kilico, Windy Point II, 1600 McConnor Pkwy, Schaumburg, IL 60196-6800 who may be deemed to be the beneficial owner of such shares.
As of April 5, 2004, 252,601 shares in the aggregate, or 92.01% of the outstanding shares of Scudder Variable Series II: SVS MFS Strategic Value Portfolio, Class A were held in the name of SSC Investment Corp., Attn: V. Ramtakah, 345 Park Ave. Fl. 26, New York, NY 10154-0004 who may be deemed to be the beneficial owner of such shares.
As of April 5, 2004, 456,846 shares in the aggregate, or 6.37% of the outstanding shares of Scudder Variable Series II: SVS MFS Strategic Value Portfolio, Class A were held in the name of Allmerica Life SVS II, 440 Lincoln St., Worcester, MA 01653-0002 who may be deemed to be the beneficial owner of such shares.
As of April 5, 2004, 1,553,371 shares in the aggregate, or 34.94% of the outstanding shares of Scudder Variable Series II: SVS MFS Strategic Value Portfolio, Class B were held in the name of The Manufactures Life Ins. Co. (USA), 500 Boylston St., Ste. 400, Boston, MA 02116-3740 who may be deemed to be the beneficial owner of such shares.
As of April 5, 2004, 107,471 shares in the aggregate, or 63.20% of the outstanding shares of Scudder Variable Series II: SVS MFS Strategic Value Portfolio, Class B were held in the name of Travelers Life & Annuity Company, 1 City Place, Hartford, CT 06103-3408 who may be deemed to be the beneficial owner of such shares.
As of April 5, 2004, 104,372,252 shares in the aggregate, or 35.21% of the outstanding shares of Scudder Variable Series II: Money Market Portfolio, Class A were held in the name of Allmerica Life SVS II, 440 Lincoln St., Worcester, MA 01653-0002 who may be deemed to be the beneficial owner of such shares.
As of April 5, 2004, 60,637,308 shares in the aggregate, or 20.46% of the outstanding shares of Scudder Variable Series II: Money Market Portfolio, Class A were held in the name of Kemper Investors Life, Windy Point II, 1600 McConnor Pkwy, Schaumburg, IL 60196-6800 who may be deemed to be the beneficial owner of such shares.
As of April 5, 2004, 127,605,653 shares in the aggregate, or 43.05% of the outstanding shares of Scudder Variable Series II: Money Market Portfolio, Class A were held in the name of Zurich Destinations Farmers SVS II, C/O Kilico, Windy Point II, 1600 McConnor Pkwy, Schaumburg, IL 60196-6800 who may be deemed to be the beneficial owner of such shares.
As of April 5, 2004, 39,877,806 shares in the aggregate, or 69.65% of the outstanding shares of Scudder Variable Series II: Money Market Portfolio, Class B were held in the name of The Manufacturer’s Life Ins. Co. (USA), 500 Boylston St., Ste. 400, Boston, MA 02116-3740 who may be deemed to be the beneficial owner of such shares.
As of April 5, 2004, 16,920,835 shares in the aggregate, or 29.55% of the outstanding shares of Scudder Variable Series II: Money Market Portfolio, Class B were held in the name of Travelers Life & Annuity Company, 1 City Place, Hartford, CT 06103-3408 who may be deemed to be the beneficial owner of such shares.
S-107
As of April 5, 2004, 2,232,796 shares in the aggregate, or 19.57% of the outstanding shares of Scudder Variable Series II: SVS Oak Strategic Equity Portfolio, Class A were held in the name of Allmerica Life SVS II, 440 Lincoln St., Worcester, MA 01653-0002 who may be deemed to be the beneficial owner of such shares.
As of April 5, 2004, 9,142,444 shares in the aggregate, or 80.11% of the outstanding shares of Scudder Variable Series II: SVS Oak Strategic Equity Portfolio, Class A were held in the name of Zurich Destinations Farmers SVS II, C/O Kilico, Windy Point II, 1600 McConnor Pkwy, Schaumburg, IL 60196-6800 who may be deemed to be the beneficial owner of such shares.
As of April 5, 2004, 2,012,476 shares in the aggregate, or 94.32% of the outstanding shares of Scudder Variable Series II: SVS Oak Strategic Equity Portfolio, Class B were held in the name of The Manufactures Life Ins. Co. (USA), 500 Boylston St., Ste. 400, Boston, MA 02116-3740 who may be deemed to be the beneficial owner of such shares.
As of April 5, 2004, 5,217,812 shares in the aggregate, or 27.74% of the outstanding shares of Scudder Variable Series II: Small Cap Growth Portfolio, Class A were held in the name of Allmerica Life SVS II, 440 Lincoln St., Worcester, MA 01653-0002 who may be deemed to be the beneficial owner of such shares.
As of April 5, 2004, 5,536,117 shares in the aggregate, or 29.43% of the outstanding shares of Scudder Variable Series II: Small Cap Growth Portfolio, Class A were held in the name of Kemper Investors Life, Windy Point II, 1600 McConnor Pkwy, Schaumburg, IL 60196-6800 who may be deemed to be the beneficial owner of such shares.
As of April 5, 2004, 7,401,341 shares in the aggregate, or 39.35% of the outstanding shares of Scudder Variable Series II: Small Cap Growth Portfolio, Class A were held in the name of Zurich Destinations Farmers SVS II, C/O Kilico, Windy Point II, 1600 McConnor Pkwy, Schaumburg, IL 60196-6800 who may be deemed to be the beneficial owner of such shares.
As of April 5, 2004, 1,565,000 shares in the aggregate, or 94.06% of the outstanding shares of Scudder Variable Series II: Small Cap Growth Portfolio, Class B were held in the name of The Manufacturers Life Ins, CO. (USA), 500 Boylston St., Ste. 400, Boston, MA 02116-3740 who may be deemed to be the beneficial owner of such shares.
As of April 5, 2004, 310,489 shares in the aggregate, or 5.65% of the outstanding shares of Scudder Variable Series II: Strategic Income Portfolio, Class A were held in the name of First Allmerica SVS II, 440 Lincoln St., Worcester, MA 01653-0002 who may be defined as the beneficial owner of such shares.
As of April 5, 2004, 2,722,011 shares in the aggregate, or 49.57% of the outstanding shares of Scudder Variable Series II: Strategic Income Portfolio, Class A were held in the name of Allmerica Life SVS II, 400 Lincoln St., Worcester, MA 01653-0002 who may be deemed to be the beneficial owner of such shares.
As of April 5, 2004, 2,422,674 shares in the aggregate, or 44.12% of the outstanding shares of Scudder Variable Series II: Strategic Income Portfolio, Class A were held in the name of Zurich Destinations Farmers SVS II, C/O Kilico, Windy Point II, 1600 McConnor Pkwy, Schaumburg, IL 60196-6800 who may be deemed to be the beneficial owner of such shares.
As of April 5, 2004, 959,904 shares in the aggregate, or 87.92% of the outstanding shares of Scudder Variable Series II: Strategic Income Portfolio, Class B were held in the name of The Manufactures Life Ins. Co. (USA), 500 Boylston St., Ste. 400, Boston, MA 02116-3740 who may be deemed to be the beneficial owner of such shares.
As of April 5, 2004, 88,612 shares in the aggregate, or 8.12% of the outstanding shares of Scudder Variable Series II: Strategic Income Portfolio, Class B were held in the name of Travelers Life & Annuity Company, 1 City Place, Hartford, CT 06103-3408 who may be deemed to be the beneficial owner of such shares.
As of April 5, 2004, 9,999,381 shares in the aggregate, or 36.08% of the outstanding shares of Scudder Variable Series II: Technology Growth Portfolio, Class A were held in the name of Allmerica Life SVS II, 440 Lincoln St., Worcester, MA 01653-0002 who may be deemed to be the beneficial owner of such shares.
S-108
As of April 5, 2004, 16,442,790 shares in the aggregate, or 59.32% of the outstanding shares of Scudder Variable Series II: Technology Growth Portfolio, Class A were held in the name of Zurich Destinations Farmers SVS II, C/O Kilico, Windy Point II, 1600 McConnor Pkwy, Schaumburg, IL 60196-6800 who may be deemed to be the beneficial owner of such shares.
As of April 5, 2004, 1,341,186 shares in the aggregate, or 89.45% of the outstanding shares of Scudder Variable Series II: Technology Growth Portfolio, Class B were held in the name of The Manufactures Life Ins. Co. (USA), 500 Boylston St., Ste. 400, Boston, MA 02116-3740 who may be deemed to be the beneficial owner of such shares.
As of April 5, 2004, 108,117 shares in the aggregate, or 7.21% of the outstanding shares of Scudder Variable Series II: Technology Growth Portfolio, Class B were held in the name of Travelers Life & Annuity Company, 1 City Place, Hartford, CT 06103-3408 who may be deemed to be the beneficial owner of such shares.
As of April 5, 2004, 10,127,454 shares in the aggregate, or 32.64% of the outstanding shares of Scudder Variable Series II: Total Return Portfolio, Class A were held in the name of Allmerica Life SVS II, 440 Lincoln St., Worcester, MA 01653-0002 who may be defined as the beneficial owner of such shares.
As of April 5, 2004, 15,030,013 shares in the aggregate, or 48.44% of the outstanding shares of Scudder Variable Series II: Total Return Portfolio, Class A were held in the name of Kemper Investors Life, Windy Point II, 1600 McConnor Pkwy, Schaumburg, IL 60196-6800 who may be deemed to be the beneficial owner of such shares.
As of April 5, 2004, 5,621,385 shares in the aggregate, or 18.12% of the outstanding shares of Scudder Variable Series II: Total Return Portfolio, Class A were held in the name of Zurich Destinations Farmers SVS II, C/O Kilico, Windy Point II, 1600 McConnor Pkwy, Schaumburg, IL 60196-6800 who may be deemed to be the beneficial owner of such shares.
As of April 5, 2004, 1,043,937 shares in the aggregate, or 93.80% of the outstanding shares of Scudder Variable Series II: Total Return Portfolio, Class B were held in the name of The Manufactures Life Ins. Co. (USA), 500 Boylston St., Ste. 400, Boston, MA 02116-3740 who may be deemed to be the beneficial owner of such shares.
As of April 5, 2004, 2,719,345 shares in the aggregate, or 21.31% of the outstanding shares of Scudder Variable Series II: SVS Turner Mid Cap Growth Portfolio, Class A were held in the name of Allmerica Life SVS II, 440 Lincoln St., Worcester, MA 01653-0002 who may be deemed to be the beneficial owner of such shares.
As of April 5, 2004, 9,987,724 shares in the aggregate, or 78.27% of the outstanding shares of Scudder Variable Series II: SVS Turner Mid Cap Growth Portfolio, Class A were held in the name of Zurich Destinations Farmers SVS II, C/O Kilico, Windy Point II, 1600 McConnor Pkwy, Schaumburg, IL 60196-6800 who may be deemed to be the beneficial owner of such shares.
As of April 5, 2004, 1,756,275 shares in the aggregate, or 93.84% of the outstanding shares of Scudder Variable Series II: SVS Turner Mid Cap Growth Portfolio, Class B were held in the name of The Manufactures Life Ins. Co. (USA), 500 Boylston St., Ste. 400, Boston, MA 02116-3740 who may be deemed to be the beneficial owner of such shares.
Ownership in Securities of the Advisor and Related Companies
As reported to the Fund, the information in the following table reflects ownership by the Independent Trustees and their immediate family members of certain securities as of December 31, 2003. An immediate family member can be a spouse, children residing in the same household including step and adoptive children and any dependents. The securities represent ownership in an investment advisor or principal underwriter of the Fund and any persons (other than a registered investment company) directly or indirectly controlling, controlled by, or under common control with an investment advisor or principal underwriter of the Fund (including Deutsche Bank AG).
S-109
| | | | | | | | | | |
Independent Trustee
| | Owner and Relationship
to Trustee
| | Company
| | Title of Class
| | Value of
Securities on an Aggregate Basis
| | Percent of
Class on an
Aggregate Basis
|
John W. Ballantine | | | | None | | | | | | |
Lewis A. Burnham | | | | None | | | | | | |
Donald L. Dunaway | | | | None | | | | | | |
James R. Edgar | | | | None | | | | | | |
Paul K. Freeman | | | | None | | | | | | |
Robert B. Hoffman | | | | None | | | | | | |
Shirley D. Peterson | | | | None | | | | | | |
Fred B. Renwick | | | | None | | | | | | |
John G. Weithers | | | | None | | | | | | |
FUND ORGANIZATION
The Fund was organized as a business trust under the laws of Massachusetts on January 22, 1987. On May 1, 1997, the Fund changed its name from “Kemper Investors Fund” to “Investors Fund Series”. On May 1, 1999 the Fund changed its name from “Investors Fund Series” to “Kemper Variable Series” and on May 1, 2001, the Fund changed its name from “Kemper Variable Series” to “Scudder Variable Series II.” The Fund may issue an unlimited number of shares of beneficial interest all having no par value. Since the Fund offers multiple Portfolios, it is known as a “series company.” Currently, each Portfolio offers two classes of shares: Class A and Class B shares. Shares of each Portfolio have equal noncumulative voting rights except that each Portfolio’s Class B shares have separate and exclusive voting rights with respect to the Portfolios’ Rule 12b-1 Plan. Shares of each class also have equal rights with respect to dividends, assets and liquidation subject to any preferences (such as resulting from different Rule 12b-1 distribution fees), rights or privileges of any classes of shares of a Portfolio. Shares are fully paid and nonassessable when issued, and have no preemptive or conversion rights.
Information about the Portfolios’ investment performance is contained in the Fund’s 2003 Annual Report to Shareholders, which may be obtained without charge from the Fund or from Participating Insurance Companies which offer the Portfolios.
Shareholder inquiries should be made by writing the Fund at the address shown on the front cover or from Participating Insurance Companies which offer the Portfolios.
The Fund is generally not required to hold meetings of its shareholders. Under the Agreement and Declaration of Trust of the Fund (“Declaration of Trust”), however, shareholder meetings will be held in connection with the following matters: (a) the election or removal of trustees if a meeting is called for such purpose; (b) the adoption of any contract for which approval is required by the 1940 Act; (c) any termination or reorganization of the Fund to the extent and as provided in the Declaration of Trust; (d) any amendment of the Declaration of Trust (other than amendments changing the name of the Fund or any Portfolio, establishing a Portfolio, supplying any omission, curing any ambiguity or curing, correcting or supplementing any defective or inconsistent provision thereof); (e) as to whether a court action, preceding or claim should or should not be brought or maintained derivatively or as a class action on behalf of the Fund or the shareholders, to the same extent as the stockholders of a Massachusetts business corporation; and (f) such additional matters as may be required by law, the Declaration of Trust, the By-laws of the Fund, or any registration of the Fund with the SEC or any state, or as the trustees may consider necessary or desirable. The shareholders also would vote upon changes in fundamental investment objectives, policies or restrictions.
The Board may, at any time, terminate the Fund, a Portfolio or a class without shareholder approval.
Under current interpretations of the 1940 Act, the Fund expects that Participating Insurance Company shareholders will offer VLI and VA contract holders the opportunity to instruct them as to how Fund shares attributable to such contracts will be voted with respect to the matters described above. The separate prospectuses describing the VLI and VA contracts include additional disclosure of how contract holder voting rights are computed.
S-110
Under Massachusetts law, shareholders of a Massachusetts business trust could, under certain circumstances, be held personally liable for obligations of the Fund. The Declaration of Trust, however, contains provisions designed to protect shareholders from liability for acts or obligations of the Fund and requires that notice of such provisions be given in each agreement, obligation or instrument entered into or executed by the Fund or the trustees. Moreover, the Declaration of Trust provides for indemnification out of Fund property for all losses and expenses of any shareholders held personally liable for the obligations of the Fund and the Fund will be covered by insurance which the trustees consider adequate to cover foreseeable tort claims. Thus, the risk of a shareholder incurring financial loss on account of shareholder liability is considered by DeIM remote and not material since it is limited to circumstances in which the provisions limiting liability are inoperative and the Fund itself is unable to meet its obligations.
The Declaration of Trust further provides that the trustees will not be liable for errors of judgment or mistakes of fact or law. The Declaration of Trust does not protect a trustee against any liability to which he or she should otherwise be subject by reason of willful misfeasance, bad faith, gross negligence or reckless disregard of the duties of a trustee. The Declaration of Trust permits the Fund to purchase insurance against certain liabilities on behalf of the Trustees.
PROXY VOTING GUIDELINES
The Fund has delegated proxy voting responsibilities to its investment advisor, subject to the Board’s general oversight. The Fund has delegated proxy voting to the Advisor with the direction that proxies should be voted consistent with the Fund’s best economic interests. The Advisor has adopted its own Proxy Voting Policies and Procedures (“Policies”), and Proxy Voting Guidelines (“Guidelines”) for this purpose. The Policies address, among other things, conflicts of interest that may arise between the interests of the Fund, and the interests of the Advisor and its affiliates, including the Fund’s principal underwriter. The Guidelines set forth the Advisor’s general position on various proposals, such as:
| | • | | Shareholder Rights — The Advisor generally votes against proposals that restrict shareholder rights. |
| | • | | Corporate Governance — The Advisor generally votes for confidential and cumulative voting and against supermajority voting requirements for charter and bylaw amendments. |
| | • | | Anti-Takeover Matters — The Advisor generally votes for proposals that require shareholder ratification of poison pills or that request boards to redeem poison pills, and votes against the adoption of poison pills if they are submitted for shareholder ratification. The Advisor generally votes for fair price proposals. |
| | • | | Compensation Matters — The Advisor generally votes for executive cash compensation proposals, unless they are unreasonably excessive. The Advisor generally votes against stock option plans that do not meet the Advisor’s criteria. |
| | • | | Routine Matters — The Advisor generally votes for the ratification of auditors, procedural matters related to the annual meeting and changes in company name, and against bundled proposals and adjournment. |
The general provisions described above do not apply to investment companies. The Advisor generally votes proxies solicited by investment companies in accordance with the recommendations of an independent third party, except for proxies solicited by or with respect to investment companies for which the Advisor or an affiliate serves as investment advisor or principal underwriter (“affiliated investment companies”). The Advisor votes affiliated investment company proxies in the same proportion as the vote of the investment company’s other shareholders (sometimes called “mirror” or “echo” voting). Master fund proxies solicited from feeder funds are voted in accordance with applicable requirements of the Investment Company Act of 1940.
Although the Guidelines set forth the Advisor’s general voting positions on various proposals, the Advisor may, consistent with the Fund’s best interests, determine under some circumstances to vote contrary to those positions.
The Guidelines on a particular issue may or may not reflect the view of individual members of the Board or of a majority of the Board. In addition, the Guidelines may reflect a voting position that differs from the actual practices of the public companies within the Deutsche Bank organization or of the investment companies for which the Advisor or an affiliate serves as investment advisor or sponsor.
S-111
The Advisor may consider the views of a portfolio company’s management in deciding how to vote a proxy or in establishing general voting positions for the Guidelines, but management’s views are not determinative.
As mentioned above, the Policies describe the way in which the Advisor resolves conflicts of interest. To resolve conflicts, the advisor, under normal circumstances, votes proxies in accordance with its Guidelines. If the Advisor departs from the Guidelines with respect to a particular proxy or if the Guidelines do not specifically address a certain proxy proposal, a proxy voting committee established by the advisor will vote the proxy. Before voting any such proxy, however, the Advisor’s conflicts review committee will conduct an investigation to determine whether any potential conflicts of interest exist in connection with the particular proxy proposal. If the conflicts review committee determines that the Advisor has a material conflict of interest, or certain individuals on the proxy voting committee should be recused from participating in a particular proxy vote, it will inform the proxy voting committee. If notified that the Advisor has a material conflict, or fewer than three voting members are eligible to participate in the proxy vote, typically the Advisor will engage an independent third party to vote the proxy or follow the proxy voting recommendations of an independent third party.
Under certain circumstances, the Advisor may not be able to vote proxies or the Advisor may find that the expected economic costs from voting outweigh the benefits associated with voting. For example, the Advisor may not vote proxies on certain foreign securities due to local restrictions or customs. The Advisor generally does not vote proxies on securities subject to share blocking restrictions.
ADDITIONAL INFORMATION
Other Information
The CUSIP number for each Portfolio is as follows:
| | | | |
| | | Class A
| | Class B
|
Scudder Aggressive Growth Portfolio | | 81123X-695 | | 81123X-646 |
Scudder Blue Chip Portfolio | | 81123X-869 | | 81123X-638 |
Scudder Large Cap Value Portfolio | | 81123X-836 | | 81123X-620 |
Scudder Fixed Income Portfolio | | 81123X-505 | | 81123X-331 |
Scudder Global Blue Chip Portfolio | | 81123X-828 | | 81123X-612 |
Scudder Government & Agency Securities Portfolio | | 81123X-406 | | 81123X-596 |
Scudder Growth Portfolio | | 81123X-786 | | 81123X-588 |
Scudder High Income Portfolio | | 81123X-604 | | 81123X-570 |
Scudder International Select Equity Portfolio | | 81123X-844 | | 81123X-562 |
Scudder Money Market Portfolio | | 81123X-109 | | 81123X-554 |
Scudder Small Cap Growth Portfolio | | 81123X-745 | | 81123X-547 |
Scudder Strategic Income Portfolio | | 81123X-794 | | 81123X-323 |
Scudder Technology Growth Portfolio | | 81123X-752 | | 81123X-521 |
Scudder Total Return Portfolio | | 81123X-703 | | 81123X-513 |
SVS Dreman Financial Services Portfolio | | 81123X-307 | | 81123X-489 |
SVS Dreman High Return Equity Portfolio | | 81123X-208 | | 81123X-471 |
SVS Dreman Small Cap Value Portfolio | | 81123X-778 | | 81123X-539 |
SVS INVESCO Dynamic Growth Portfolio | | 81123X-687 | | 81123X-497 |
SVS Eagle Focused Large Cap Growth Portfolio | | 81123X-877 | | 81123X-455 |
SVS Focus Value+Growth Portfolio | | 81123X-760 | | 81123X-463 |
SVS Janus Growth And Income Portfolio | | 81123X-802 | | 81123X-448 |
SVS Janus Growth Opportunities Portfolio | | 81123X-885 | | 81123X-430 |
SVS Index 500 Portfolio | | 81123X-851 | | 81123X-422 |
SVS Turner Mid Cap Growth Portfolio | | 81123X-679 | | 81123X-414 |
SVS Oak Strategic Equity Portfolio | | 81123X-661 | | 81123X-398 |
SVS Davis Venture Value Portfolio | | 81123X-653 | | 81123X-380 |
SVS MFS Strategic Value Portfolio | | 81123X-356 | | 81123X-349 |
The Fund has a fiscal year ending December 31.
S-112
Many of the investment changes in the Fund will be made at prices different from those prevailing at the time they may be reflected in a regular report to shareholders of the Fund. These transactions will reflect investment decisions made by the Advisor in light of each Portfolio’s investment objectives and policies, its other portfolio holdings and tax considerations, and should not be construed as recommendations for similar action by other investors.
The Portfolios’ prospectus and this Statement of Additional Information omit certain information contained in the Registration Statement and its amendments which the Fund has filed with the SEC under the Securities Act of 1933 and reference is hereby made to the Registration Statement for further information with respect to the Fund and the securities offered hereby. The Registration Statement and its amendments are available for inspection by the public at the SEC in Washington, D.C.
FINANCIAL STATEMENTS
The financial statements, including the investment portfolios of each Portfolio, as applicable, together with the Report of Independent Auditors, Financial Highlights and notes to financial statements in the Annual Report to the Shareholders of each Portfolio dated December 31, 2003 are incorporated herein by reference and are hereby deemed to be a part of this Statement of Additional Information.
Information concerning portfolio holdings of a portfolio as of a month-end is available upon request no earlier than the 16th day after month-end. Please call Scudder Investments at the number appearing on the front cover of this Statement of Additional Information to make such a request.
S-113
APPENDIX A
BOND AND COMMERCIAL PAPER RATINGS
Set forth below are descriptions of ratings which represent opinions as to the quality of the securities. It should be emphasized, however, that ratings are relative and subjective and are not absolute standards of quality.
MOODY’S INVESTORS SERVICE, INC. — CORPORATE BOND RATINGS
Aaa: Bonds which are rated Aaa are judged to be of the highest quality. They carry the smallest degree of investment risk and are generally referred to as “gilt-edged.” Interest payments are protected by a large or by an exceptionally stable margin and principal is secure. While the various protective elements are likely to change, such changes as can be visualized are most unlikely to impair the fundamentally strong position of such issues.
Aa: Bonds which are rated Aa are judged to be of high quality by all standards. Together with the Aaa group they comprise what are generally known as high grade bonds. They are rated lower than the best bonds because margins of protection may not be as large as in Aaa securities or fluctuations of protective elements may be of greater amplitude or there may be other elements present which make the long-term risk appear somewhat larger than in Aaa securities.
A: Bonds which are rated A possess many favorable investment attributes and are to be considered as upper -medium grade obligations. Factors giving security to principal and interest are considered adequate, but elements may be present which suggest a susceptibility to impairment sometime in the future.
Baa: Bonds which are rated Baa are considered as medium grade obligations, (i.e., they are neither highly protected nor poorly secured). Interest payments and principal security appear adequate for the present, but certain protective elements may be lacking or may be characteristically unreliable over any great length of time. Such bonds lack outstanding investment characteristics and in fact have speculative characteristics as well.
Ba: Bonds which are rated Ba are judged to have speculative elements; their future cannot be considered as well assured. Often the protection of interest and principal payments may be very moderate and thereby not well safe-guarded during both good and bad times over the future. Uncertainty of position characterizes bonds in this class.
B: Bonds which are rated B are considered speculative and generally lack characteristics of the desirable investment. Assurance of interest and principal payments or of maintenance of other terms of the contract over any long period of time may be small.
Caa: Bonds which are rated Caa are of poor standing. Such issues may be in default or there may be present elements of danger with respect to principal or interest.
Ca: Bonds which are rated Ca represent obligations which are highly speculative. Such issues are often in default or have other marked shortcomings.
C: Bonds which are rated C are the lowest rated class of bonds, typically are in default and can be regarded as having extremely poor prospects of ever attaining any real investment standing.
Note: Moody’s appends numerical modifiers 1, 2 and 3 to each generic rating classification from Aa through Caa in its corporate bond rating system. The modifier 1 indicates that the issue ranks in the higher end of its generic rating category; the modifier 2 indicates a mid-range ranking; and the modifier 3 indicates that the issue ranks in the lower end of its generic rating category.
S-114
MOODY’S INVESTORS SERVICE, INC. — SHORT-TERM RATINGS
Moody’s short-term debt ratings are opinions of the ability of issuers to honor short-term financial obligations. Ratings may be assigned to issuers, short-term programs or to individual short-term debt instruments. Such obligations generally have an original maturity not exceeding thirteen months, unless explicitly noted. Issuers rated Prime-1 or P-1 (or supporting institutions) have a superior ability for repayment of short-term debt obligations. Prime-1 or P-1 repayment ability will often be evidenced by many of the following characteristics:
| | • | | Leading market positions in well established industries. |
| | • | | High rates of return on funds employed. |
| | • | | Conservative capitalization structure with moderate reliance on debt and ample asset protection. |
| | • | | Broad margins in earnings coverage of fixed financial charges and high internal cash generation. |
| | • | | Well established access to a range of financial markets and assured sources of alternate liquidity. |
Issuers rated Prime-2 or P-2 (or supporting institutions) have a strong ability for repayment of short-term debt obligations. This will normally be evidenced by many of the characteristics cited above but to a lesser degree. Earnings trends and coverage ratios, while sound, may be more subject to variation. Capitalization characteristics, while still appropriate, may be more affected by external conditions. Ample alternate liquidity is maintained.
STANDARD & POOR’S RATINGS SERVICES — CORPORATE BOND RATINGS
INVESTMENT GRADE
AAA: Debt rated AAA has the highest rating assigned by S&P’s to a debt obligation. Capacity to pay interest and repay principal is extremely strong.
AA: Debt rated AA has a very strong capacity to pay interest and repay principal and differs from the higher rated issues only in small degree.
A: Debt rated A has a strong capacity to pay interest and repay principal although it is somewhat more susceptible to the adverse effects of changes in circumstances and economic conditions than bonds in higher rated categories.
BBB: Debt rated BBB has an adequate capacity to pay interest and repay principal. Whereas it normally exhibits adequate protection parameters, adverse economic conditions or changing circumstances are more likely to lead to a weakened capacity to pay interest and repay principal for debt in this category than in higher rated categories.
SPECULATIVE GRADE
Debt rated BB, B, CCC, CC, and C has significant speculative characteristics with respect to capacity to pay interest and repay principal. BB indicates the least degree of speculation and C the highest. While such debt will likely have some quality and protective characteristics, these may be outweighed by large uncertainties or major exposures to adverse conditions.
BB: Debt rated BB has less near-term vulnerability to default than other speculative issues. However, it faces major ongoing uncertainties or exposure to adverse business, financial, or economic conditions which could lead to inadequate capacity to meet timely interest and principal payments.
The BB rating category is also used for debt subordinated to senior debt that is assigned an actual or implied BBB- rating.
B: Debt rated B has a greater vulnerability to default but currently has the capacity to meet interest payments and principal repayments. Adverse business, financial, or economic conditions will likely impair capacity or willingness to pay interest and repay principal.
S-115
The B rating category is also used for debt subordinated to senior debt that is assigned an actual or implied BB or BB- rating.
CCC: Debt rated CCC has a current vulnerability to default, and is dependent upon favorable business, financial, and economic conditions to meet timely payment of interest and repayment of principal. In the event of adverse business, financial, or economic conditions, it is not likely to have the capacity to pay interest and repay principal.
The CCC rating category is also used for debt subordinated to senior debt that is assigned an actual or implied B or B- rating.
CC: Debt rated CC has a current high vulnerability to default, and is dependent upon favorable business, financial, and economic conditions to meet timely payment of interest and repayment of principal.
The rating CC is also applied to debt subordinated to senior debt which is assigned an actual or implied CCC debt rating.
C: The rating C is typically applied to debt subordinated to senior debt which is assigned an actual or implied CCC- debt rating. The C rating may be used to cover a situation where a bankruptcy petition has been filed, but debt service payments are continued.
C1: The Rating C1 is reserved for income bonds on which no interest is being paid.
D: Debt rated D is in payment default. The D rating category is used when interest payments or principal payments are not made on the date due even if the applicable grace period has not expired, unless Standard & Poor’s believes that such payments will be made during such grace period. The D rating also will be used upon the filing of a bankruptcy petition if debt service payments are jeopardized.
Plus (+) or Minus (-): The ratings from AA to CCC may be modified by the addition of a plus or minus sign to show relative standing within the major rating categories.
R: Debt rated ‘R’ is under regulatory supervision owing to its financial condition. During the pendency of the regulatory supervision, the regulators may have the power to favor one class of obligations over others or pay some obligations and not others.
N.R.: Bonds may lack a S&P’s rating because no public rating has been requested, because there is insufficient information on which to base a rating, or because S&P’s does not rate a particular type of obligation as a matter of policy.
STANDARD & POOR’S RATINGS SERVICES — SHORT-TERM RATINGS
S&P’s commercial paper rating is a current assessment of the likelihood of timely payment of debt considered short-term in the relevant market.
A-1: This highest category indicates that the degree of safety regarding timely payment is strong. Those issues determined to possess extremely strong safety characteristics are denoted with a plus (+) sign designation.
A-2: Capacity for timely payment on issues with this designation is satisfactory. However, the relative degree of safety is not as high as for issues designated A-1.
A-3: Issues carrying this designation have adequate capacity for timely payment. However, adverse economic conditions or changing circumstances are more likely to lead to a weakened capacity of the issuer to meet its financial commitments.
FITCH INVESTORS SERVICE, INC. — BOND RATINGS
INVESTMENT GRADE
AAA: Bonds considered to be investment grade and of the highest credit quality. The obligor has an exceptionally strong ability to pay interest and repay principal, which is unlikely to be affected by reasonably foreseeable events.
S-116
AA: Bonds considered to be investment grade and of very high credit quality. The obligor’s ability to pay interest and repay principal is very strong, although not quite as strong as bonds rated AAA. Bonds rated in the AAA and AA categories are not significantly vulnerable to foreseeable events.
A: Bonds considered to be investment grade and of high credit quality. The obligor’s ability to pay interest and repay principal is considered to be strong, but may be more vulnerable to adverse changes in economic conditions and circumstances than bonds with higher ratings.
BBB: Bonds considered to be investment grade and of good credit quality. The obligor’s ability to pay interest and repay principal is considered to be adequate. Adverse changes in economic conditions and circumstances, however, are more likely to have adverse impact on these bonds, and therefore, impair timely payment. The likelihood that the ratings of these bonds will fall below investment grade is higher than for bonds with higher ratings.
SPECULATIVE GRADE
BB: Bonds are considered speculative. The obligor’s ability to pay interest and repay principal may be affected over time by adverse economic changes. However, business or financial alternatives may be available which could assist the obligor in satisfying its debt service requirements.
B: Bonds are considered highly speculative. While bonds in this class are currently meeting debt service requirements, the probability of continued timely payment of principal and interest reflects the obligor’s limited margin of safety and the need for reasonable business and economic activity throughout the life of the issue.
CCC: Bonds have certain identifiable characteristics which, if not remedied, may lead to default. The ability to meet obligations requires an advantageous business and economic environment.
CC: Bonds are minimally protected. Default in payment of interest and/or principal seems probable over time.
C: Bonds are in imminent default in payment of interest or principal.
DDD, DD and D: Bonds are in default of interest and/or principal payments. Such bonds are extremely speculative and should be valued on the basis of their ultimate recovery value in liquidation or reorganization of the obligor. DDD represents the highest potential for recovery on these bonds, and D represents the lowest potential for recovery.
Plus (+) or Minus (-): The ratings from AA to CC may be appended by the addition of a plus or minus sign to denote the relative status within the rating category.
NR: Indicates that Fitch Rating does not publicly rate the specific issue.
FITCH INVESTORS SERVICE, INC. — SHORT-TERM RATINGS
Fitch’s short-term ratings apply to debt obligations that are payable on demand or have original maturities of generally up to three years, including commercial paper, certificates of deposit, medium-term notes, and municipal and investment notes.
F-1+: Exceptionally Strong Credit Quality. Issues assigned this rating are regarded as having the strongest capacity for timely payment.
F-1: Very Strong Credit Quality. Issues assigned this rating reflect a capacity for timely payment only slightly less than issues rated F-1+.
F-2: Good Credit Quality. Issues assigned this rating have a satisfactory capacity for timely payment, but the margin of safety is not as great as the F-1+ and F-1 categories.
F-3: Fair Credit Quality. Issues assigned this rating have characteristics suggesting that the capacity for timely payment is adequate; however, near-term adverse changes could cause these securities to be rated below investment grade.
S-117
B: Speculative. Minimal capacity for timely payment of financial commitments, plus vulnerability to near-term adverse changes in financial and economic conditions.
C: High default risk. Default is a real possibility. Capacity for meeting financial commitments is solely reliant upon a sustained, favorable business and economic environment.
D: Default. Denotes actual or imminent payment default.
S-118
Supplement to the currently effective Statement of Additional Information of each of the listed portfolios/funds:
Scudder Variable Series I
| • | | 21st Century Growth Portfolio |
| • | | Capital Growth Portfolio |
| • | | Global Discovery Portfolio |
| • | | Growth and Income Portfolio |
| • | | Health Sciences Portfolio |
| • | | International Portfolio |
Scudder Investments VIT Funds
Scudder VIT Equity 500 Index Fund
Scudder VIT EAFE(R) Equity Index Fund
Scudder VIT Small Cap Index Fund
Scudder Real Estate Securities Portfolio
The following information replaces the disclosure in the portfolios’/funds’ Statements of Additional Information regarding the Advisor’s policies with respect to its selection of brokers and dealers to execute the purchase and sale of the portfolios’/funds’ portfolio securities, the allocation of trades among the portfolios/funds and the use of brokers that are affiliated with the Advisor appearing under one of the following captions: “Portfolio Transactions and Brokerage Commissions” or “Portfolio Transactions.” Other disclosure appearing under those captions, including the amount of brokerage commissions paid by a portfolio/fund during the three most recent fiscal years, the amount of brokerage commissions directed for research during a portfolio’s/fund’s most recent fiscal year, the amount of brokerage commissions paid to affiliated brokers during a portfolio’s/fund’s three most recent fiscal years and a portfolio’s/fund’s holdings of securities issued by its regular brokers and dealers as of the end of the portfolio’s/fund’s most recent fiscal year, is not affected by this supplement.
PORTFOLIO TRANSACTIONS
The Advisor is generally responsible for placing the orders for the purchase and sale of portfolio securities, including the allocation of brokerage. With respect to those portfolios/funds for which a sub-investment advisor manages the portfolio’s/fund’s investments, references in this section to the “Advisor” should be read to mean the Sub-Advisor.
The policy of the Advisor in placing orders for the purchase and sale of securities for the portfolios/funds is to seek best execution, taking into account such factors, among others, as price; commission (where applicable); the broker-dealer’s ability to ensure that securities will be delivered on settlement date; the willingness of the broker-dealer to commit its capital and purchase a thinly traded security for its own inventory; whether the broker-dealer specializes in block orders or large program trades; the broker-dealer’s knowledge of the market and the security; the broker-dealer’s ability to maintain confidentiality; the financial condition of the broker-dealer; and whether the broker-dealer has the infrastructure and operational capabilities to execute and settle the trade. The Advisor seeks to evaluate the overall reasonableness of brokerage commissions with commissions charged on comparable transactions and compares the brokerage commissions (if any) paid by the portfolios/funds to reported commissions paid by others. The Advisor routinely reviews commission rates, execution and settlement services performed and makes internal and external comparisons.
Commission rates on transactions in equity securities on U.S. securities exchanges are subject to negotiation. Commission rates on transactions in equity securities on foreign securities exchanges are generally fixed. Purchases and sales of fixed-income securities and other over-the-counter securities are effected on a net basis, without the payment of brokerage commissions. Transactions in fixed income and other over-the-counter securities are generally placed by the Advisor with the principal market makers for these securities unless the Advisor reasonably believes more favorable results are available elsewhere. Transactions with dealers serving as market makers reflect the spread between the bid and asked prices. Purchases of underwritten issues will include an underwriting fee paid to the underwriter. Money market instruments are normally purchased in principal transactions directly from the issuer or from an underwriter or market maker.
It is likely that the broker-dealers selected based on the considerations described in this section will include firms that also sell shares of the portfolios/funds to their customers. However, the Advisor does not consider sales of shares of the portfolios/funds as a factor in the selection of broker-dealers to execute portfolio transactions for the portfolios/funds and, accordingly, has implemented policies and procedures reasonably designed to prevent its
2
traders from considering sales of shares of the portfolios/funds as a factor in the selection of broker-dealers to execute portfolio transactions for the portfolios/funds.
The Advisor is permitted by Section 28(e) of the Securities Exchange Act of 1934, as amended (“1934 Act”), when placing portfolio transactions for a portfolio/fund, to cause the portfolio/fund to pay brokerage commissions in excess of that which another broker-dealer might charge for executing the same transaction in order to obtain research and brokerage services. The Advisor, however, does not as a matter of policy execute transactions with broker-dealers for the portfolio/fund in order to obtain research from such broker-dealers that is prepared by third parties (i.e., “third party research”). However, the Advisor may from time to time, in reliance on Section 28(e) of the 1934 Act, obtain proprietary research prepared by the executing broker-dealer in connection with a transaction or transactions through that broker-dealer (i.e., “proprietary research”). Consistent with the Advisor’s policy regarding best execution, where more than one broker is believed to be capable of providing best execution for a particular trade, the Advisor may take into consideration the receipt of proprietary research in selecting the broker-dealer to execute the trade. Proprietary research provided by broker-dealers may include, but is not limited to, information on the economy, industries, groups of securities, individual companies, statistical information, accounting and tax law interpretations, political developments, legal developments affecting portfolio securities, technical market action, pricing and appraisal services, credit analysis, risk measurement analysis, performance analysis and measurement and analysis of corporate responsibility issues. Proprietary research is typically received in the form of written reports, telephone contacts and personal meetings with security analysts, but may also be provided in the form of access to various computer software and associated hardware, and meetings arranged with corporate and industry representatives.
In reliance on Section 28(e) of the 1934 Act, the Advisor may also select broker-dealers and obtain from them brokerage services in the form of software and/or hardware that is used in connection with executing trades. Typically, this computer software and/or hardware is used by the Advisor to facilitate trading activity with those broker-dealers.
Proprietary research and brokerage services received from a broker-dealer chosen to execute a particular trade may be useful to the Advisor in providing services to clients other than the portfolio/fund making the trade, and not all such information is used by the Advisor in connection with such portfolio/fund. Conversely, such information provided to the Advisor by broker-dealers through which other clients of the Advisor effect securities transactions may be useful to the Advisor in providing services to the portfolio/fund.
The Advisor will monitor regulatory developments and market practice in the use of client commissions to obtain research and brokerage services, whether proprietary or third party.
Investment decisions for each portfolio/fund and for other investment accounts managed by the Advisor are made independently of each other in light of differing conditions. However, the same investment decision may be made for two or more of such accounts. In such cases, simultaneous transactions are inevitable. To the extent permitted by law, the Advisor may aggregate the securities to be sold or purchased for a portfolio/fund with those to be sold or purchased for other accounts in executing transactions. Purchases or sales are then averaged as to price and commission and allocated as to amount in a manner deemed equitable to each account. While in some cases this practice could have a detrimental effect on the price paid or received by, or on the size of the position obtained or disposed of for, the portfolio/fund, in other cases it is believed that the ability to engage in volume transactions will be beneficial to the portfolio/fund.
Deutsche Bank AG or one of its affiliates (or in the case of a sub-adviser, the sub-adviser or one of its affiliates) may act as a broker for the portfolios/funds and receive brokerage commissions or other transaction-related compensation from the funds in the purchase and sale of securities, options or futures contracts when, in the judgment of the Advisor, and in accordance with procedures approved by the portfolios’/funds’ Boards, the affiliated broker will be able to obtain a price and execution at least as favorable as those obtained from other qualified brokers and if, in the transaction, the affiliated broker charges the portfolio/fund a rate consistent with that charged to comparable unaffiliated customers in similar transactions.
Please Retain This Supplement for Future Reference
February 4, 2005
Supplement to the currently effective Statement of Additional Information for the following portfolio:
Scudder Variable Series I — Balanced Portfolio
The following supplements the disclosure in the “Investment and Restrictions” section of the Portfolio’s currently effective SAI:
The Portfolio may also invest up to 15% of its total assets in credit default swaps. Credit default swaps are used as a means of “buying” credit protection, i.e., attempting to mitigate the risk of default or credit quality deterioration in some portion of the Portfolio’s holdings, or “selling” credit protection, i.e., attempting to gain exposure to an underlying issuer’s credit quality characteristics without directly investing in that issuer. No more than 5% of the Portfolio’s assets may be invested in credit default swaps for the purposes of buying credit protection. The Portfolio will only sell credit protection with respect to securities in which it would be authorized to invest directly. The Portfolio may also borrow up to 5% of the Portfolio’s net assets against called and tendered bonds in the Portfolio. For the risks associated with borrowing, please see the “Borrowing” subsection of the “Investment Restrictions” section of the SAI.
The following supplements the disclosure in the “Investment Policies and Techniques” section of the Portfolio’s currently effective SAI:
Bank Loans. The Portfolio may invest in bank loans, which are typically senior debt obligations of borrowers (issuers) and as such, are considered to hold a senior position in the capital structure of the borrower. These may include loans which hold the most senior position, that hold an equal ranking with other senior debt, or loans that are, in the judgment of the Advisor, in the category of senior debt of the borrower. This capital structure position generally gives the holders of these loans a priority claim on some or all of the borrower’s assets in the event of a default. In most cases, these loans are either partially or fully collateralized by the assets of a corporation, partnership, limited liability company or other business entity, or by cash flow that the Advisor believes has a market value at the time of acquisition that equals or exceeds the principal amount of the loan. These loans are often issued in connection with recapitalizations, acquisitions, leveraged buy-outs and refinancings. It is important to note that Moody’s and S&P generally rate bank loans a notch or two higher than high yield bonds of the same issuer to reflect their more senior position. The Portfolio may invest in both fixed- and floating-rate loans. In addition, bank loans can trade either as an “assignment” or “participation.” When the Portfolio buys an assignment, it is essentially becoming a party to the bank agreement. The vast majority of all trades are assignments and would therefore generally represent the preponderance of bank loans held by the Portfolio. In certain cases, the Portfolio may buy bank loans on a participation basis, if for example, the Portfolio did not want to become party to the bank agreement. However, in all cases, the Portfolio will not purchase bank loans where Deutsche Bank, or an affiliate, serves as an agent bank.
Participations and assignments involve credit risk, interest rate risk, liquidity risk, and the risk of being a lender. If the Portfolio purchases a participation, it may only be able to enforce its rights through the lender, and may assume the credit risk of both the lender and the borrower.
Investments in loans through direct assignment of a financial institution’s interests with respect to a loan may involve additional risks. For example, if a loan is foreclosed, the purchaser could become part owner of any collateral, and would bear the costs and liabilities associated with owning and disposing of the collateral. In addition, it is at least conceivable that under emerging legal theories of lender liability, a purchaser could be held liable as a co-lender.
In the case of loans administered by a bank or other financial institution that acts as agent for all holders, if assets held by the agent for the benefit of a purchaser are determined to be subject to the claims of the
agent’s general creditors, the purchaser might incur certain costs and delays in realizing payment on the loan or loan participation and could suffer a loss of principal or interest.
In the case of loan participations where a bank or other lending institution serves as financial intermediary between a fund and the borrower, if the participation does not shift to the portfolio the direct debtor-creditor relationship with the borrower, SEC interpretations require the portfolio, in some circumstances, to treat both the lending bank or other lending institution and the borrower as issuers for purposes of the Portfolio’s investment policies. Treating a financial intermediary as an issuer of indebtedness may restrict the Portfolio’s ability to invest in indebtedness related to a single financial intermediary, or a group of intermediaries engaged in the same industry, even if the underlying borrowers represent many different companies and industries.
Short Sales Against the Box. The Portfolio may make short sales of common stocks if, at all times when a short position is open, the Portfolio owns the stock or owns preferred stocks or debt securities convertible or exchangeable, without payment of further consideration, into the shares of common stock sold short. Short sales of this kind are referred to as short sales “against the box.” The portfolio will incur a loss as a result of the short sale if the price of the security increases between the dates of the short sale and the date on which the Portfolio replaces the borrowed security. The broker/dealer that executes a short sale generally invests cash proceeds of the sale until they are paid to the Portfolio. Arrangements may be made with the broker/dealer to obtain a portion of the interest earned by the broker on the investment of short sale proceeds. The Portfolio will segregate the common stock or convertible or exchangeable preferred stock or debt securities in a special account with the custodian. The Portfolio will incur transaction costs, including interest expenses in connection with opening, maintaining, and closing short sales against the box. Uncertainty regarding the tax effects of short sales of appreciated investments may limit the extent to which the Portfolio may enter into short sales against the box.
Variable Rate Securities. The Portfolio, may invest in Variable Rate Securities, instruments having rates of interest that are adjusted periodically or that “float” continuously according to formulae intended to minimize fluctuation in values of the instruments. The interest rate of Variable Rate Securities ordinarily is determined by reference to or is a percentage of an objective standard such as a bank’s prime rate, the 90-day US Treasury Bill rate, or the rate of return on commercial paper or bank certificates of deposit. Generally, the changes in the interest rate on Variable Rate Securities reduce the fluctuation in the market value of such securities. Accordingly, as interest rates decrease or increase, the potential for capital appreciation or depreciation is less than for fixed-rate obligations. Some Variable Rate Demand Securities (“Variable Rate Demand Securities”) have a demand feature entitling the purchaser to resell the securities at an amount approximately equal to amortized cost or the principal amount thereof plus accrued interest. As is the case for other Variable Rate Securities, the interest rate on Variable Rate Demand Securities varies according to some objective standard intended to minimize fluctuation in the values of the instruments. The Portfolio determines the maturity of Variable Rate Securities in accordance with Rule 2a-7, which allows the Portfolio to consider certain of such instruments as having maturities shorter than the maturity date on the face of the instrument.
The following replaces related disclosure in the “Swaps, Caps, Floors and Collars” subsection of the “Investment Policies and Techniques” section of the Portfolio’s currently effective SAI:
Among the Strategic Transactions into which the Portfolio may enter are currency, and other types of swaps and the purchase or sale of related caps, floors and collars. The Portfolio expects to enter into these transactions primarily to preserve a return or spread on a particular investment or portion of its portfolio, to protect against currency fluctuations, as a duration management technique or to protect against any increase in the price of securities the Portfolio anticipates purchasing at a later date. The Portfolio will not sell interest rate caps or floors where it does not own securities or other instruments providing the income stream the Portfolio may be obligated to pay. Interest rate swaps involve the exchange by the Portfolio with another party of their respective commitments to pay or receive interest, e.g., an exchange of floating rate payments for fixed rate payments with respect to a notional amount of principal. A currency swap is an agreement to exchange cash flows on a notional amount of two or more currencies based on the relative value differential among them and an index swap is an agreement to swap cash flows on a notional amount
2
based on changes in the values of the reference indices. The purchase of a cap entitles the purchaser to receive payments on a notional principal amount from the party selling such cap to the extent that a specified index exceeds a predetermined interest rate or amount. The purchase of a floor entitles the purchaser to receive payments on a notional principal amount from the party selling such floor to the extent that a specified index falls below a predetermined interest rate or amount. A collar is a combination of a cap and a floor that preserves a certain return within a predetermined range of interest rates or values. A credit default swap is a contract between a buyer and a seller of protection against a pre-defined credit event. The buyer of protection pays the seller a fixed, regular fee. The seller of protection provides the buyer with a contingent exchange that occurs upon a credit event.
Swaps have special risks associated including possible default by the counterparty to the transaction, illiquidity and, where swaps are used for hedges, the risk that the use of a swap could result in losses greater than if the swap had not been employed. Whether the use of swap agreements will be successful in furthering its investment objective will depend on the Advisor’s ability to correctly predict whether certain types of investments are likely to produce greater returns than other investments. Certain swap agreements may be considered to be illiquid because they are two party contracts and because they may have terms of greater than seven days. Moreover, the Portfolio bears the risk of loss of the amount expected to be received under a swap agreement in the event of the default or bankruptcy of a swap agreement counterparty.
Subadvisor. Effective October 26, 2004, Deutsche Asset Management Investment Services Limited (“DeAMIS”), One Appold Street, London, England, an affiliate of the Advisor, is the subadvisor for Balanced Portfolio. DeAMIS serves as subadvisor pursuant to the terms of a Research and Advisory Agreement between it and the Advisor.
Under the terms of the Research and Advisory Agreement, DeAMIS manages the investment and reinvestment of the Portfolio’s portfolio and will provide such investment advice, research and assistance as the Advisor may, from time to time, reasonably request.
The Advisor pays DeAMIS for its services a subadvisory fee, payable monthly, at the annual rate of 0.50% of the Advisory Fee.
The Research and Advisory Agreement provides that DeAMIS will not be liable for any error of judgment or mistake of law or for any loss suffered by the Portfolio in connection with matters to which the Research and Advisory Agreement relates, except a loss resulting from willful misconduct, bad faith or gross negligence on the part of DeAMIS in the performance of its duties or from reckless disregard by DeAMIS of its obligations and duties under the Research and Advisory Agreement.
The Research and Advisory Agreement remains in effect until September 30, 2005 unless sooner terminated or not annually approved as described below. Notwithstanding the foregoing, the Research and Advisory Agreement shall continue in effect until September 30, 2005 and year to year thereafter, but only as long as such continuance is specifically approved at least annually (a) by a majority of the Trustees of the Trust who are not parties to such agreement or interested persons of any such party except in their capacity as Trustees of the Trust, and (b) by the shareholders or the Trustees of the Trust. The Research and Advisory Agreement may be terminated at any time upon 60 days’ notice by the Advisor or by the Board of Trustees of the Trust or by majority vote of the outstanding shares of the Portfolio, and will terminate automatically upon assignment or upon termination of the Portfolio’s investment management agreement.
Please Retain This Supplement for Future Reference
October 26, 2004
3
The following information supplements “The Main Risks of Investing in the Portfolio” section.
Value Investing Risk. As with any investment strategy, the “value” strategy used in managing the portfolio will, at times, perform better than or worse than other investment styles and the overall market. If the advisor overestimates the value or return potential of one or more common stocks, the portfolio may underperform the general equity market. Value stocks may also be out of favor for certain periods in relation to growth stocks.
Small Company Capitalization Risk. Small company stocks tend to experience steeper price fluctuations — down as well as up — than the stocks of larger companies. A shortage of reliable information — the same information gap that creates opportunity — can also pose added risk. Industry-wide reversals may have a greater impact on small companies, since they lack a large company’s financial resources. Small company stocks are typically less liquid than large company stocks: when things are going poorly, it is harder to find a buyer for a small company’s shares.
Foreign Investment Risk. To the extent that the portfolio holds the securities of companies based outside the US, it faces the risks inherent in foreign investing. Adverse political, economic or social developments could undermine the value of the portfolio’s investments or prevent the portfolio from realizing their full value. Financial reporting standards for companies based in foreign markets differ from those in the US. Additionally, foreign securities markets generally are smaller and less liquid than the US markets. These risks tend to be greater in emerging markets, so to the extent the fund invests in emerging markets, it takes on greater risks. Finally, the currency of the country in which the fund has invested could decline relative to the value of the US dollar, which would decrease the value of the investment to US investors.
The following information supplements the disclosure under “The Investment Advisor.”
Scudder Balanced Portfolio’s Board has approved a research and subadvisory agreement between DeIM and Deutsche Asset Management Investment Services Ltd. (“DeAMIS”). DeAMIS, One Appold Street, London, England, an affiliate of the advisor, is the subadvisor to the Scudder Balanced Portfolio. DeAMIS renders investment advisory and management services including services related to foreign securities, foreign currency transactions and related investments with regard to the portion of Scudder Balanced Portfolio’s portfolio that is allocated to it by DeIM from time-to-time for management. DeAMIS provides a full range of international investment advisory services to institutional and retail clients. DeAMIS is an indirect, wholly owned subsidiary of Deutsche Bank AG. DeIM compensates DeAMIS out of the management fee it receives from the Scudder Balanced Portfolio.
STATEMENT OF ADDITIONAL INFORMATION
May 1, 2004
CLASS A AND B SHARES
SCUDDER VARIABLE SERIES I
Two International Place, Boston, Massachusetts 02110
1-800-778-1482
This combined Statement of Additional Information is not a prospectus. It should be read in conjunction with the applicable prospectuses of Scudder Variable Series I (the “Fund”) dated May 1, 2004, as amended from time to time. The prospectuses may be obtained without charge from the Fund by calling the toll-free number listed above, and is also available along with other related materials on the Securities and Exchange Commission Internet web site (http://www.sec.gov). The prospectus is also available from Participating Insurance Companies.
Scudder Variable Series I offers a choice of nine portfolios (each a “Portfolio,” collectively, the “Portfolios”), to holders of certain variable life insurance and variable annuity contracts offered by Participating Insurance Companies.
The nine portfolios are:
MONEY MARKET PORTFOLIO
BOND PORTFOLIO
BALANCED PORTFOLIO
GROWTH AND INCOME PORTFOLIO
CAPITAL GROWTH PORTFOLIO
21ST CENTURY GROWTH PORTFOLIO
GLOBAL DISCOVERY PORTFOLIO
INTERNATIONAL PORTFOLIO
HEALTH SCIENCES PORTFOLIO
TABLE OF CONTENTS
i
INVESTMENT RESTRICTIONS
The following fundamental policies may not be changed with respect to any Portfolio without the approval of the majority of outstanding voting securities of that Portfolio which, under the Investment Company Act of 1940, as amended (the “1940 Act”), and the rules thereunder and as used in this Statement of Additional Information, means the lesser of (1) 67% of the shares of that Portfolio present at a meeting if the holders of more than 50% of the outstanding shares of that Portfolio are present in person or by proxy, or (2) more than 50% of the outstanding shares of that Portfolio. Any investment restrictions which involve a maximum percentage of securities or assets shall not be considered to be violated unless an excess over the percentage occurs immediately after, and is caused by, an acquisition or encumbrance of securities or assets of, or borrowings by or on behalf of, a Portfolio.
As a matter of fundamental policy, the Fund may not on behalf of any Portfolio:
| 1. | borrow money, except as permitted under the 1940 Act, and as interpreted or modified by regulatory authority having jurisdiction, from time to time; |
| 2. | issue senior securities, except as permitted under the 1940 Act, and as interpreted or modified by regulatory authority having jurisdiction, from time to time; |
| 3. | For all Portfolios (except Health Sciences Portfolio): concentrate its investments in a particular industry, as that term is used in the 1940 Act, and as interpreted or modified by regulatory authority having jurisdiction, from time to time; |
| 4. | purchase physical commodities or contracts relating to physical commodities; |
| 5. | engage in the business of underwriting securities issued by others, except to the extent that the Portfolio may be deemed to be an underwriter in connection with the disposition of portfolio securities; |
| 6. | purchase or sell real estate, which term does not include securities of companies which deal in real estate or mortgages or investments secured by real estate or interests therein, except that the Portfolio reserves freedom of action to hold and to sell real estate acquired as a result of the Portfolio’s ownership of securities; or |
| 7. | make loans except as permitted under the 1940 Act, and as interpreted or modified by regulatory authority having jurisdiction, from time to time. |
Other Investment Policies. The Board of Trustees of the Fund has voluntarily adopted policies and restrictions which are observed in the conduct of the Fund’s affairs. These represent intentions of the Board based upon current circumstances. They differ from fundamental investment policies in that they may be changed or amended by action of the Board without prior notice to or approval of shareholders.
As a matter of nonfundamental policy, the Fund currently does not intend on behalf of the indicated Portfolio(s):
| 1. | For Money Market Portfolio: to borrow money in an amount greater than 5% of its total assets, except for temporary or emergency purposes; |
| 2. | For all Portfolios (except Money Market Portfolio): to borrow money in an amount greater than 5% of its total assets, except (i) for temporary or emergency purposes and (ii) by engaging in reverse repurchase agreements, dollar rolls, or other investments or transactions described in the Portfolio’s registration statement which may be deemed to be borrowings; |
| 3. | For all Portfolios (except Money Market Portfolio and Bond Portfolio): to enter into either of reverse repurchase agreements or dollar rolls in an amount greater than 5% of its total assets; |
| 4. | For all Portfolios (except Money Market Portfolio): to purchase securities on margin or make short sales, except (i) short sales against the box, (ii) in connection with arbitrage transactions, (iii) for margin deposits in connection with futures contracts, options or other permitted investments, (iv) that transactions in futures contracts and options shall not be deemed to constitute selling securities short, and (v) that the Portfolio may obtain such short-term credits as may be necessary for the clearance of securities transactions; |
| 5. | For all Portfolios (except Money Market Portfolio): to purchase options, unless the aggregate premiums paid on all such options held by the Portfolio at any time do not exceed 20% of its total assets; or sell put options, if as a result, the aggregate value of the obligations underlying such put options would exceed 50% of its total assets; |
| 6. | For all Portfolios (except Money Market Portfolio): to enter into futures contracts or purchase options thereon, unless immediately after the purchase, the value of the aggregate initial margin with respect to such futures contracts entered into on behalf of the Portfolio and the premiums paid for such options on futures contracts does not exceed 5% of the fair market value of the Portfolio’s total assets; provided that in the case of an option that is in-the-money at the time of purchase, and in-the-money amount may be excluded in computing the 5% limit; |
| 7. | For all Portfolios (except Money Market Portfolio): to purchase warrants if as a result, such securities, taken at the lower of cost or market value, would represent more than 5% of the value of the Portfolio’s total assets (for this purpose, warrants acquired in units or attached to securities will be deemed to have no value); |
| 8. | For all Portfolios (except Money Market Portfolio): to lend portfolio securities in an amount greater than 33 1/3% of its total assets; |
| 9. | For Money Market Portfolio: to lend portfolio securities in an amount greater than 5% of its total assets; and |
| 10. | For Money Market Portfolio: to invest more than 10% of total assets in non-affiliated registered investment companies. |
“Value” for the purposes of all investment restrictions shall mean the value used in determining a Portfolio’s net asset value. (See “NET ASSET VALUE.”)
Master/feeder Fund Structure
The Fund’s Board of Trustees has the discretion with respect to each Portfolio to retain the current distribution arrangement for the Portfolio while investing in a master fund in a master/feeder fund structure as described below.
A master/feeder fund structure is one in which a fund (a “feeder fund”), instead of investing directly in a portfolio of securities, invests most or all of its investment assets in a separate registered investment company (the “master fund”) with substantially the same investment objective and policies as the feeder fund. Such a structure permits the pooling of assets of two or more feeder funds, preserving separate identities or distribution channels at the feeder fund level. Based on the premise that certain of the expenses of operating an investment portfolio are relatively fixed, a larger investment portfolio may eventually achieve a lower ratio of operating expenses to average net assets. An existing investment company is able to convert to a feeder fund by selling all of its investments, which involves brokerage and other transaction costs and realization of a taxable gain or loss, or by contributing its assets to the master fund and avoiding transaction costs and, if proper procedures are followed, the realization of taxable gain or loss.
Money Market Portfolio. Money Market Portfolio seeks to maintain the stability of capital and, consistent therewith, to maintain the liquidity of capital and to provide current income.
Money Market Portfolio purchases US Treasury bills, notes and bonds; obligations of agencies and instrumentalities of the US Government; domestic and foreign bank certificates of deposit; variable and floating rate instruments; bankers’ acceptances; finance company and corporate commercial paper; and repurchase agreements and corporate obligations.
2
Investments are limited to those that are US Dollar-denominated and at the time of purchase are rated, or judged by the Advisor, subject to the supervision of the Trustees, to be equivalent to those rated high quality (i.e., rated in the two highest short-term rating categories) by any two nationally-recognized statistical rating services such as Moody’s Investors Service, Inc. (“Moody’s”) and Standard & Poor’s Corporation (“S&P”). In addition, the Advisor seeks through its own credit analysis to limit investments to high quality instruments presenting minimal credit risks. Securities eligible for investment by Money Market Portfolio which are rated in the highest short-term rating category by at least two rating services (or by one rating service, if no other rating service has issued a rating with respect to that security) are known as “first tier securities.” Securities eligible for investment by Money Market Portfolio rated in the top two categories which are not first tier securities are known as “second tier securities.” Investments in commercial paper and finance company paper will be limited to securities which, at the time of purchase, will be rated A-1 or A-2 by S&P or Prime 1 or Prime 2 by Moody’s or the equivalent by any nationally-recognized statistical rating service or judged to be equivalent by the Advisor. Obligations which are subject to repurchase agreements will be limited to those of the type and quality described above. Money Market Portfolio may also hold cash. Shares of the Portfolio are not insured by an agency of the US Government. Securities and instruments in which the Portfolio may invest may be issued by the US Government, its agencies and instrumentalities, corporations, trusts, banks, finance companies and other business entities.
Money Market Portfolio may invest in bankers’ acceptances of large domestic or foreign banks (i.e., banks which at the time of their most recent annual financial statements show total assets in excess of $1 billion) including foreign branches of such domestic banks, which involve different risks than those associated with investments in certificates of deposit of domestic banks, and of smaller banks as described below. The Portfolio will invest in US dollar-denominated certificates of deposit and bankers’ acceptances of foreign banks if such banks meet the stated qualifications. Although the Portfolio recognizes that the size of a bank is important, this fact alone is not necessarily indicative of its creditworthiness. Investment in certificates of deposit and bankers’ acceptances issued by foreign banks and foreign branches of domestic banks involves investment risks that are different in some respects from those associated with investments in certificates of deposit and bankers’ acceptances issued by domestic banks. (See “Foreign Securities” in this Statement of Additional Information for further risks of foreign investment.)
Money Market Portfolio may also invest in certificates of deposit issued by banks and savings and loan institutions which had at the time of their most recent annual financial statements total assets of less than $1 billion, provided that (i) the principal amounts of such certificates of deposit are insured by an agency of the US Government, (ii) at no time will the Portfolio hold more than $100,000 principal amount of certificates of deposit of any one such bank, and (iii) at the time of acquisition, no more than 10% of the Portfolio’s assets (taken at current value) are invested in certificates of deposit of such banks.
The assets of Money Market Portfolio consist entirely of cash items and investments having a remaining maturity date of 397 calendar days or less from date of purchase. The Portfolio will be managed so that the average maturity of all instruments in the portfolio (on a dollar-weighted basis) will be 90 days or less. The average maturity of the Portfolio’s investments varies according to the Advisor’s appraisal of money market conditions.
The Portfolio may invest more than 5% but not more than 25% of its total assets in the first tier securities of a single issuer for a period of up to three business days after purchase, although the Portfolio may not make more than one such investment at any time. The Portfolio may not invest more than 5% of its total assets in securities which were second tier securities when acquired by the Portfolio. Further, the Portfolio may not invest more than the greater of (1) 1% of its total assets, or (2) one million dollars, in the securities of a single issuer which were second tier securities when acquired by the Portfolio.
Bond Portfolio. Bond Portfolio seeks to provide a high level of income consistent with a high quality portfolio of debt securities.
Balanced Portfolio. Balanced Portfolio seeks a balance of growth and income from a diversified portfolio of equity and fixed income securities.
3
The portfolio normally invests between 50% and 75% of its net assets in common stocks and other equity securities and 25% to 50% of its net assets in investment grade bonds and other fixed-income securities. For liquidity and defensive purposes, the Portfolio may invest without limit in cash and in money market securities such as commercial paper, bankers’ acceptances, and certificates of deposit issued by domestic and foreign branches of US banks. The Portfolio may also enter into repurchase agreements with respect to US Government securities.
Not less than 50% of the Portfolio’s debt securities will be invested in debt obligations, including money market instruments, that (a) are issued or guaranteed by the US Government, (b) are rated at the time of purchase within the two highest ratings categories by any nationally-recognized rating service or (c) if not rated, are judged at the time of purchase, by the Advisor to be of a quality comparable to obligations rated as described in (b) above. Not less than 80% of the debt obligations in which the Portfolio invests will, at the time of purchase, be rated within the three highest ratings categories of any such service or, if not rated, will be judged to be of comparable quality by the Advisor.
Should the rating of any security held by the Portfolio be downgraded after the time of purchase, the Advisor will determine whether it is in the best interest of the Portfolio to retain or dispose of the security.
Growth and Income Portfolio. Growth and Income Portfolio seeks long-term growth of capital, current income and growth of income. The portfolio may invest up to 25% of its total assets in foreign securities.
Capital Growth Portfolio. Capital Growth Portfolio seeks to maximize long-term capital growth through a broad and flexible investment program.
The Portfolio, as a matter of nonfundamental policy, may invest up to 20% of its net assets in intermediate to longer term debt securities. Generally, these securities will be in the top four grades of credit quality (i.e. BBB/Baa and above). In order to reduce risk, as market or economic conditions periodically warrant, the Portfolio may also invest up to 25% of its assets in short-term debt instruments. The Portfolio’s intermediate to longer-term debt securities may also include those which are rated below investment grade as long as no more than 5% of its net assets are invested in such securities. While the portfolio invests mainly in US stocks, it could invest up to 25% of total assets in foreign equity securities.
Should the rating of any security held by the Portfolio be downgraded after the time of purchase, the Advisor will determine whether it is in the best interest of the Portfolio to retain or dispose of the security.
21st Century Growth Portfolio. 21st Century Growth Portfolio seeks long-term growth of capital by investing primarily in equity securities issued by emerging growth companies.
For temporary defensive purposes the Portfolio may vary from its investment policy during periods in which conditions in securities markets or other economic or political conditions warrant. It is impossible to accurately predict how long such alternate strategies may be utilized. In such cases, the Portfolio may hold without limit, cash, high grade debt securities, without equity features, which are rated Aaa, Aa or A by Moody’s or AAA, AA or A by S&P, or, if unrated, are deemed by the Advisor to be of equivalent quality, US Government securities and invest in money market instruments which are rated in the two highest categories by Moody’s or S&P, or, if unrated, are deemed by the Advisor to be of equivalent quality.
Global Discovery Portfolio. Global Discovery Portfolio seeks above-average capital appreciation over the long term by investing primarily in the equity securities of small companies located throughout the world. The Portfolio may purchase investment-grade bonds, those rated Aaa, Aa, A or Baa by Moody’s or AAA, AA, A or BBB by S&P or, if unrated, of equivalent quality as determined by the Advisor.
The Portfolio invests in no less than five foreign countries; provided that, (i) if foreign securities comprise less than 80% of the value of the Portfolio’s net assets, the Portfolio shall invest in no less than four foreign countries; (ii) if foreign securities comprise less than 60% of the value of the Portfolio’s net assets, the Portfolio shall invest in no less than three foreign countries; (iii) if foreign securities comprise less than 40% of the value of the Portfolio’s net assets, the Portfolio shall invest in no less than two foreign countries; and (iv) if foreign securities comprise less than 20% of the value of the Portfolio’s net assets the Portfolio may invest in a single foreign country.
4
The Portfolio shall invest no more than 20% of the value of its net assets in securities of issuers located in any one country; provided that an additional 15% of the value of the Portfolio’s net assets may be invested in securities of issuers located in any one of the following countries: Australia, Canada, France, Japan, the United Kingdom and Germany; and provided further that 100% of the Portfolio’s assets may be invested in securities of issuers located in the United States. The Portfolio will limit investments in securities of issuers located in Eastern Europe to 5% of its total assets.
International Portfolio. International Portfolio seeks long-term growth of capital primarily through diversified holdings of marketable foreign equity investments. The Portfolio typically will invest in companies in at least three different countries, excluding the United States.
Under exceptional economic or market conditions abroad, the Portfolio may temporarily, until normal conditions return, invest all or a major portion of its assets in Canadian or US Government obligations or currencies, or securities of companies incorporated in and having their principal activities in Canada or the United States.
Health Sciences Portfolio. Under normal circumstances, Health Sciences Portfolio seeks long-term growth of capital by investing at least 80% of total assets, plus the amount of any borrowings for investment purposes, in common stocks of companies in the health care sector. The Portfolio “concentrates,” for purposes of the 1940 Act, its assets in securities related to a particular industry or group of related industries, which means that at least 25% of its net assets will be invested in these assets at all times.
A security will be considered appropriate for the Portfolio if at least 50% of its total assets, revenues, or net income is related to or derived from the industry or industries designated for the Portfolio. Health Sciences Portfolio may invest up to 20% of total assets in debt securities, including bonds of private issuers. The Portfolio may invest up to 20% of its total assets in US Treasury securities, and agency and instrumentality obligations.
Temporary Defensive Policy. For temporary defensive purposes, each Portfolio may invest, without limit, in cash and cash equivalents, US government securities, money market instruments and high quality debt securities without equity features. In such a case, a Portfolio would not be pursuing, and may not achieve, its investment objective.
INVESTMENT POLICIES AND TECHNIQUES
General Investment Policies
Scudder Variable Series I is an open-end, registered management investment company established as a Massachusetts business trust. The Fund is a series fund consisting of eight diversified portfolios: Money Market Portfolio, Bond Portfolio, Balanced Portfolio, Growth and Income Portfolio, Capital Growth Portfolio, 21st Century Growth Portfolio, Global Discovery Portfolio and International Portfolio, and one non-diversified portfolio: Health Sciences Portfolio (individually or collectively hereinafter referred to as a “Portfolio” or the “Portfolios”). Additional portfolios may be created from time to time. The Fund is intended to be the funding vehicle for variable annuity contracts (“VA contracts”) and variable life insurance policies (“VLI policies”) to be offered to the separate accounts of certain life insurance companies (“Participating Insurance Companies”).
Except for Money Market Portfolio, which does not offer separate classes of shares, two classes of shares of each Portfolio of the Fund are currently offered through Participating Insurance Companies. Class A shares are offered at net asset value and are not subject to a Rule 12b-1 Distribution Plan. Class B shares are offered at net asset value and are subject to a Distribution Plan. There are currently no outstanding Class B shares of Bond Portfolio or Balanced Portfolio.
Each Portfolio has a different investment objective which it pursues through separate investment policies, as described below. The differences in objectives and policies among the Portfolios can be expected to affect the degree of market and financial risk to which each Portfolio is subject and the return of each Portfolio. The investment objectives and policies of each Portfolio may, unless otherwise specifically stated, be changed by the Trustees of the Fund without a vote of shareholders. There is no assurance that the objectives of any Portfolio will be achieved.
5
Descriptions in this Statement of Additional Information of a particular investment practice or technique in which a Portfolio may engage (such as short selling, hedging, etc.) or a financial instrument which a Portfolio may purchase (such as options, forward foreign currency contracts, etc.) are meant to describe the spectrum of investments that Deutsche Investment Management Americas Inc. (“DeIM” or the “Advisor”), in its discretion, might, but is not required to, use in managing each Portfolio’s assets. The Advisor may, in its discretion, at any time employ such practice, technique or instrument for one or more Portfolios but not for all investment companies advised by it. Furthermore, it is possible that certain types of financial instruments or investment techniques described herein may not be available, permissible, economically feasible or effective for their intended purposes in all markets. Certain practices, techniques, or instruments may not be principal activities of a Portfolio but, to the extent employed, could from time to time have a material impact on the Portfolio’s performance.
It is possible that certain investment practices and techniques described below may not be permissible for a Portfolio based on its investment restrictions, as described herein, and in the Portfolio’s applicable prospectus.
Borrowing. As a matter of fundamental policy, each Portfolio (except Money Market Portfolio) will not borrow money, except as permitted under the 1940 Act, and as interpreted by regulatory authority having jurisdiction, from time to time. While the Trustees do not currently intend to borrow for investment leveraging purposes, if such a strategy were implemented in the future it would increase a Portfolio’s volatility and the risk of loss in a declining market. Borrowing by a Portfolio will involve special risk considerations. Although the principal of a Portfolio’s borrowings will be fixed, the Portfolio’s assets may change in value during the time that a borrowing is outstanding, thus increasing exposure to capital risk.
Asset-Backed Securities. Asset backed securities may include pools of mortgages (“mortgage-backed securities”), loans, receivables or other assets. Payment of principal and interest may be largely dependent upon the cash flows generated by the assets backing the securities. For purposes of determining the percentage of a Portfolio’s total assets invested in securities of issuers having their principal business activities in a particular industry, asset backed securities will be classified separately. Asset-backed securities present certain risks that are not presented by mortgage-backed securities. Primarily, these securities may not have the benefit of any security interest in the related assets. Credit card receivables are generally unsecured and the debtors are entitled to the protection of a number of state and federal consumer credit laws, many of which give such debtors the right to set off certain amounts owed on the credit cards, thereby reducing the balance due. There is the possibility that recoveries on repossessed collateral may not, in some cases, be available to support payments on these securities. Asset-backed securities are often backed by a pool of assets representing the obligations of a number of different parties. To lessen the effect of failures by obligors on underlying assets to make payments, the securities may contain elements of credit support which fall into two categories: (i) liquidity protection, and (ii) protection against losses resulting from ultimate default by an obligor on the underlying assets. Liquidity protection refers to the provision of advances, generally by the entity administering the pool of assets, to ensure that the receipt of payments on the underlying pool occurs in a timely fashion. Protection against losses results from payment of the insurance obligations on at least a portion of the assets in the pool. This protection may be provided through guarantees, policies or letters of credit obtained by the issuer or sponsor from third parties, through various means of structuring the transaction or through a combination of such approaches. The Portfolios will not pay any additional or separate fees for credit support. The degree of credit support provided for each issue is generally based on historical information respecting the level of credit risk associated with the underlying assets. Delinquency or loss in
6
excess of that anticipated or failure of the credit support could adversely affect the return on an investment in such a security. The availability of asset-backed securities may be affected by legislative or regulatory developments. It is possible that such developments may require the funds to dispose of any then existing holdings of such securities.
Asset-Indexed Securities. Health Sciences Portfolio may purchase asset-indexed securities which are debt securities usually issued by companies in precious metals related businesses such as mining, the principal amount, redemption terms, or interest rates of which are related to the market price of a specified precious metal. The Portfolio will only enter into transactions in publicly traded asset-indexed securities. Market prices of asset-indexed securities will relate primarily to changes in the market prices of the precious metals to which the securities are indexed rather than to changes in market rates of interest. However, there may not be a perfect correlation between the price movements of the asset-indexed securities and the underlying precious metals. Asset-indexed securities typically bear interest or pay dividends at below market rates (and in certain cases at nominal rates). The Portfolio may purchase asset-indexed securities to the extent permitted by law.
Bank and Savings and Loan Obligations. These obligations include negotiable certificates of deposit, bankers’ acceptances, deposit notes, fixed time deposits or other short-term bank obligations. Certificates of deposit are negotiable certificates evidencing the obligations of a bank to repay funds deposited with it for a specified period of time. The Portfolios may invest in certificates of deposit of large domestic banks and their foreign branches, large US regulated subsidiaries of large foreign banks (i.e., banks which at the time of their most recent annual financial statements show total assets in excess of $1 billion), and of smaller banks as described below. Although the Portfolios recognize that the size of a bank is important, this fact alone is not necessarily indicative of its creditworthiness.
Certificates of Deposit and Bankers’ Acceptances. Certificates of deposit are receipts issued by a depository institution in exchange for the deposit of funds. The issuer agrees to pay the amount deposited plus interest to the bearer of the receipt on the date specified on the certificate. The certificate usually can be traded in the secondary market prior to maturity. Bankers’ acceptances typically arise from short-term credit arrangements designed to enable businesses to obtain funds to finance commercial transactions. Generally, an acceptance is a time draft drawn on a bank by an exporter or an importer to obtain a stated amount of funds to pay for specific merchandise. The draft is then “accepted” by a bank that, in effect, unconditionally guarantees to pay the face value of the instrument on its maturity date. The acceptance may then be held by the accepting bank as an earning asset or it may be sold in the secondary market at the going rate of discount for a specific maturity. Although maturities for acceptances can be as long as 270 days, most acceptances have maturities of six months or less.
Banker’s acceptances are credit instruments evidencing the obligations of a bank to pay a draft drawn on it by a customer. These instruments reflect the obligation both of the bank and of the drawer to pay the face amount of the instrument upon maturity.
Time deposits are non-negotiable deposits maintained in a banking institution for a specified period of time at a stated interest rate. Time deposits which may be held by a Portfolio will not benefit from insurance from the Bank Insurance Fund or the Savings Association Insurance Fund administered by the Federal Deposit Insurance Corporation. Fixed time deposits may be withdrawn on demand by the investor, but may be subject to early withdrawal penalties that vary with market conditions and the remaining maturity of the obligation. Fixed time deposits subject to withdrawal penalties maturing in more than seven calendar days are subject to a fund’s limitation on investments in illiquid securities.
Collateralized Mortgage Obligations (“CMOs”). CMOs are hybrids between a mortgage-backed bond and mortgage pass-through securities. Similar to a bond, interest and prepaid principal are paid, in most cases, semiannually. CMOs may be collateralized by whole mortgage loans but are more typically collateralized by portfolios of mortgage pass-through securities guaranteed by GNMA, FHLMC, or Fannie Mae, and their income streams.
CMOs are structured into multiple classes, each bearing a different stated maturity. Actual maturity and average life will depend upon the prepayment experience of the collateral. CMOs provide for a modified form of call protection through a de facto breakdown of the underlying pool of mortgages according to how quickly the loans are repaid. Monthly payment of principal received from the pool of underlying mortgages, including prepayments, is first returned to investors holding the shortest maturity class. Investors holding the longer maturity classes receive principal only after
7
the first class has been retired. An investor is partially guarded against a sooner than desired return of principal because of the sequential payments. The prices of certain CMOs, depending on their structure and the rate of prepayments, can be volatile. Some CMOs may also not be as liquid as other securities.
In a typical CMO transaction, a corporation issues multiple series, (e.g., A, B, C, Z) of CMO bonds (“Bonds”). Proceeds of the Bond offering are used to purchase mortgages or mortgage pass-through certificates (“Collateral”). The Collateral is pledged to a third party trustee as security for the Bonds. Principal and interest payments from the Collateral are used to pay principal on the Bonds in the order A, B, C, Z. The Series A, B, and C bonds all bear current interest. Interest on the Series Z Bond is accrued and added to principal and a like amount is paid as principal on the Series A, B, or C Bond currently being paid off. When the Series A, B, and C Bonds are paid in full, interest and principal on the Series Z Bond begins to be paid currently. With some CMOs, the issuer serves as a conduit to allow loan originators (primarily builders or savings and loan associations) to borrow against their loan portfolios.
Combined Transactions. Each Portfolio may enter into multiple transactions, including multiple options transactions, multiple futures transactions and multiple interest rate transactions and any combination of futures, options and interest rate transactions (“component” transactions), instead of a single Strategic Transaction, as part of a single or combined strategy when, in the opinion of the Adviser, it is in the best interests of a Portfolio to do so. A combined transaction will usually contain elements of risk that are present in each of its component transactions. Although combined transactions are normally entered into based on the Adviser’s judgment that the combined strategies will reduce risk or otherwise more effectively achieve the desired portfolio management goal, it is possible that the combination will instead increase such risks or hinder achievement of the portfolio management objective.
Commercial Paper. Commercial paper consists of short-term, unsecured promissory notes issued to finance short-term credit needs. The commercial paper purchased by a fund will consist only of direct obligations issued by domestic and foreign entities.
Common Stocks. Balanced Portfolio, Growth and Income Portfolio, Capital Growth Portfolio, 21st Century Growth Portfolio, Global Discovery Portfolio, International Portfolio and Health Sciences Portfolio invest in common stocks. Common stock is issued by companies to raise cash for business purposes and represents a proportionate interest in the issuing companies. Therefore, the Portfolios may participate in the success or failure of any company in which it holds stock. The market values of common stock can fluctuate significantly, reflecting the business performance of the issuing company, investor perception and general economic or financial market movements. Despite the risk of price volatility, however, common stocks have historically offered a greater potential for long-term gain on investment, compared to other classes of financial assets such as bonds or cash equivalents, although there can be no assurance that this will be true in the future.
Convertible Securities. Bond Portfolio, Balanced Portfolio, Growth and Income Portfolio, Capital Growth Portfolio, 21st Century Growth Portfolio, Global Discovery Portfolio, International Portfolio and Health Sciences Portfolio may each invest in convertible securities; that is, bonds, notes, debentures, preferred stocks and other securities which are convertible into common stock. Investments in convertible securities can provide an opportunity for capital appreciation and/or income through interest and dividend payments by virtue of their conversion or exchange features.
The convertible securities in which a Portfolio may invest include fixed-income or zero coupon debt securities which may be converted or exchanged at a stated or determinable exchange ratio into underlying shares of common stock. The exchange ratio for any particular convertible security may be adjusted from time to time due to stock splits, dividends, spin-offs, other corporate distributions or scheduled changes in the exchange ratio. Convertible securities and convertible preferred stocks, until converted, have general characteristics similar to both debt and equity securities. Although to a lesser extent than with debt securities generally, the market values of convertible securities tends to decline as interest rates increase and, conversely, tend to increase as interest rates decline. In addition, because of the conversion or exchange feature, the market values of convertible securities typically changes as the market value of the underlying common stocks changes, and, therefore, also tend to follow movements in the general market for equity securities. A unique feature of convertible securities is that as the market price of the underlying common stock declines, convertible securities tend to trade increasingly on a yield basis, and so may not experience market value declines to the same extent as the underlying common stock. When the market price of the underlying common stock
8
increases, the prices of the convertible securities tend to rise as a reflection of the value of the underlying common stock, although typically not as much as the underlying common stock. While no securities investments are without risk, investments in convertible securities generally entail less risk than investments in common stock of the same issuer.
As debt securities, convertible securities are investments which provide for a stream of income (or in the case of zero coupon securities, accretion of income) with generally higher yields than common stocks. Convertible securities generally offer lower yields than non-convertible securities of similar quality because of their conversion or exchange features.
Of course, like all debt securities, there can be no assurance of income or principal payments because the issuers of the convertible securities may default on their obligations.
Convertible securities are generally subordinated to other similar but non-convertible securities of the same issuer, although convertible bonds, as corporate debt obligations, enjoy seniority in right of payment to all equity securities, and convertible preferred stock is senior to common stock, of the same issuer. However, because of the subordination feature, convertible bonds and convertible preferred stock typically have lower ratings than similar non-convertible securities. Convertible securities may be issued as fixed income obligations that pay current income or as zero coupon notes and bonds, including Liquid Yield Option Notes (“LYONs”).
Corporate Obligations. Investment in corporate debt obligations involves credit and interest rate risk. The value of fixed-income investments will fluctuate with changes in interest rates and bond market conditions, tending to rise as interest rates decline and to decline as interest rates rise. Corporate debt obligations generally offer less current yield than securities of lower quality, but lower-quality securities generally have less liquidity, greater credit and market risk, and as a result, more price volatility. Longer-term bonds are, however, generally more volatile than bonds with shorter maturities.
Depositary Receipts. Balanced, 21st Century Growth, Global Discovery, International and Health Sciences Portfolios may each invest in sponsored or unsponsored American Depositary Receipts (“ADRs”), European Depositary Receipts (“EDRs”), Global Depositary Receipts (“GDRs”), International Depositary Receipts (“IDRs”) and other types of Depositary Receipts (which, together with ADRs, EDRs, GDRs and IDRs are hereinafter referred to as “Depositary Receipts”). Depositary receipts provide indirect investment in securities of foreign issuers. Prices of unsponsored Depositary Receipts may be more volatile than if they were sponsored by the issuer of the underlying securities. Depositary Receipts may not necessarily be denominated in the same currency as the underlying securities into which they may be converted. In addition, the issuers of the stock of unsponsored Depositary Receipts are not obligated to disclose material information in the United States and, therefore, there may not be a correlation between such information and the market value of the Depositary Receipts. ADRs are Depositary Receipts which are bought and sold in the United States and are typically issued by a bank or trust company which evidence ownership of underlying securities issued by a foreign corporation. GDRs and IDRs and other types of Depositary Receipts are typically issued by foreign banks or trust companies, although they also may be issued by United States banks or trust companies, and evidence ownership of underlying securities issued by either a foreign or a United States corporation. Generally, Depositary Receipts in registered form are designed for use in the United States securities markets and Depositary Receipts in bearer form are designed for use in securities markets outside the United States. For purposes of the Balanced, Growth and Income, Capital Growth and International Portfolios’ investment policies, the Portfolios’ investments in ADRs, GDRs and other types of Depositary Receipts will be deemed to be investments in the underlying securities. Depositary Receipts including those denominated in US dollars will be subject to foreign currency exchange rate risk. However, by investing in US dollar-denominated ADRs rather than directly in foreign issuers’ stock, a Portfolio avoids currency risks during the settlement period. In general, there is a large, liquid market in the United States for most ADRs. However, certain Depositary Receipts may not be listed on an exchange and therefore may be illiquid securities.
Dollar Roll Transactions. Dollar roll transactions consist of the sale by a Portfolio to a bank or broker/dealer (the “counterparty”) of GNMA certificates or other mortgage-backed securities together with a commitment to purchase from the counterparty similar, but not identical, securities at a future date, at the same price. The counterparty receives all principal and interest payments, including prepayments, made on the security while it is the holder. A Portfolio receives
9
a fee from the counterparty as consideration for entering into the commitment to purchase. Dollar rolls may be renewed over a period of several months with a different purchase and repurchase price fixed and a cash settlement made at each renewal without physical delivery of securities. Moreover, the transaction may be preceded by a firm commitment agreement pursuant to which a Portfolio agrees to buy a security on a future date.
Each Portfolio will segregate cash, US Government securities or other liquid assets in an amount sufficient to meet their purchase obligations under the transactions. The Portfolios will also maintain asset coverage of at least 300% for all outstanding firm commitments, dollar rolls and other borrowings.
Dollar rolls may be treated for purposes of the of 1940 Act, as amended, as borrowings of each Portfolio because they involve the sale of a security coupled with an agreement to repurchase. A dollar roll involves costs to the Portfolio. For example, while a Portfolio receives a fee as consideration for agreeing to repurchase the security, the Fund forgoes the right to receive all principal and interest payments while the counterparty holds the security. These payments to the counterparty may exceed the fee received by the Portfolio, thereby effectively charging the Portfolio interest on its borrowing. Further, although a Portfolio can estimate the amount of expected principal prepayment over the term of the dollar roll, a variation in the actual amount of prepayment could increase or decrease the cost of the Portfolio’s borrowing.
The entry into dollar rolls involves potential risks of loss that are different from those related to the securities underlying the transactions. For example, if the counterparty becomes insolvent, a Portfolio’s right to purchase from the counterparty might be restricted. Additionally, the value of such securities may change adversely before a Fund is able to purchase them. Similarly, a Portfolio may be required to purchase securities in connection with a dollar roll at a higher price than may otherwise be available on the open market. Since, as noted above, the counterparty is required to deliver a similar, but not identical security to a Portfolio, the security that the Portfolio is required to buy under the dollar roll may be worth less than an identical security. Finally, there can be no assurance that each Portfolio’s use of the cash that it receives from a dollar roll will provide a return that exceeds borrowing costs.
Eastern Europe. Global Discovery Portfolio may invest up to 5% of its total assets in the securities of issuers domiciled in Eastern European countries. Investments in companies domiciled in Eastern European countries may be subject to potentially greater risks than those of other foreign issuers. These risks include (i) potentially less social, political and economic stability; (ii) the small current size of the markets for such securities and the low volume of trading, which result in less liquidity and in greater price volatility; (iii) certain national policies which may restrict the Portfolio’s investment opportunities, including restrictions on investment in issuers or industries deemed sensitive to national interests; (iv) foreign taxation; (v) the absence of developed legal structures governing private or foreign investment or allowing for judicial redress for injury to private property; (vi) the absence, until recently in certain Eastern European countries, of a capital market structure or market-oriented economy; and (vii) the possibility that recent favorable economic developments in Eastern Europe may be slowed or reversed by unanticipated political or social events in such countries, or in the countries of the former Soviet Union.
Investments in such countries involve risks of nationalization, expropriation and confiscatory taxation. The Communist governments of a number of East European countries expropriated large amounts of private property in the past, in many cases without adequate compensation, and there may be no assurance that such expropriation will not occur in the future. In the event of such expropriation, the Portfolio could lose a substantial portion of any investments it has made in the affected countries. Further, no accounting standards exist in East European countries. Finally, even though certain East European currencies may be convertible into US dollars, the conversion rates may be artificial to the actual market values and may be adverse to the Portfolio.
Eurodollar Instruments. Each Portfolio may make investments in Eurodollar instruments. Eurodollar instruments are US dollar-denominated futures contracts or options thereon which are linked to the London Interbank Offered Rate (“LIBOR”), although foreign currency-denominated instruments are available from time to time. Eurodollar futures contracts enable purchasers to obtain a fixed rate for the lending of funds and sellers to obtain a fixed rate for borrowings. Each Portfolio might use Eurodollar futures contracts and options thereon to hedge against changes in LIBOR, to which many interest rate swaps and fixed income instruments are linked.
10
Eurodollar Obligations. Eurodollar bank obligations are US dollar-denominated certificates of deposit and time deposits issued outside the US capital markets by foreign branches of US banks and US branches of foreign banks. Eurodollar obligations are subject to the same risks that pertain to domestic issues, notably credit risk, market risk and liquidity risk. Additionally, Eurodollar obligations are subject to certain sovereign risks.
FHLMC Collateralized Mortgage Obligations. Federal Home Loan Mortgage Corporation (“FHLMC”) CMOs are debt obligations of FHLMC issued in multiple classes having different maturity dates which are secured by the pledge of a pool of conventional mortgage loans purchased by FHLMC. Unlike FHLMC PCs, payments of principal and interest on the CMOs are made semiannually, as opposed to monthly. The amount of principal payable on each semiannual payment date is determined in accordance with FHLMC’s mandatory sinking fund schedule, which, in turn, is equal to approximately 100% of FHA prepayment experience applied to the mortgage collateral pool. All sinking fund payments in the CMOs are allocated to the retirement of the individual classes of bonds in the order of their stated maturities. Payment of principal on the mortgage loans in the collateral pool in excess of the amount of FHLMC’s minimum sinking fund obligation for any payment date are paid to the holders of the CMOs as additional sinking fund payments. Because of the “pass-through” nature of all principal payments received on the collateral pool in excess of FHLMC’s minimum sinking fund requirement, the rate at which principal of the CMOs is actually repaid is likely to be such that each class of bonds will be retired in advance of its scheduled maturity date.
If collection of principal (including prepayments) on the mortgage loans during any semiannual payment period is not sufficient to meet FHLMC’s minimum sinking fund obligation on the next sinking fund payment date, FHLMC agrees to make up the deficiency from its general funds.
Criteria for the mortgage loans in the pool backing the CMOs are identical to those of FHLMC PCs. FHLMC has the right to substitute collateral in the event of delinquencies and/or defaults.
Foreign Currencies. Because investments in foreign securities usually will involve currencies of foreign countries, and because a Portfolio may hold foreign currencies and forward contracts, futures contracts and options on foreign currencies and foreign currency futures contracts, the value of the assets of a Portfolio as measured in US dollars may be affected favorably or unfavorably by changes in foreign currency exchange rates and exchange control regulations, and a Portfolio may incur costs and experience conversion difficulties and uncertainties in connection with conversions between various currencies. Fluctuations in exchange rates may also affect the earning power and asset value of the foreign entity issuing the security.
The strength or weakness of the US dollar against these currencies is responsible for part of a Portfolio’s investment performance. If the dollar falls in value relative to the Japanese yen, for example, the dollar value of a Japanese stock held in the portfolio will rise even though the price of the stock remains unchanged. Conversely, if the dollar rises in value relative to the yen, the dollar value of the Japanese stock will fall.
Although a Portfolio values its assets daily in terms of US dollars, it does not intend to convert its holdings of foreign currencies into US dollars on a daily basis. It will do so from time to time, and investors should be aware of the costs of currency conversion. Although foreign exchange dealers typically do not charge a fee for conversion, they do realize a profit based on the difference (the “spread”) between the prices at which they are buying and selling various currencies. Thus, a dealer may offer to sell a foreign currency to a Portfolio at one rate, while offering a lesser rate of exchange should a Portfolio desire to resell that currency to the dealer. The Portfolio will conduct its foreign currency exchange transactions either on a spot (i.e., cash) basis at the spot rate prevailing in the foreign currency exchange market, or through entering into options or forward or futures contracts to purchase or sell foreign currencies.
Foreign Currency Transactions. Bond Portfolio, Balanced Portfolio, Capital Growth Portfolio and International Portfolio may enter into forward foreign currency exchange contracts (“forward contracts”) for hedging purposes. These Portfolios may also, for hedging purposes, purchase foreign currencies in the form of bank deposits as well as other foreign money market instruments, including but not limited to, bankers’ acceptances, certificates of deposit, commercial paper, short-term government and corporate obligations and repurchase agreements. International Portfolio may also enter into foreign currency futures contracts and foreign currency options.
11
Because investments in foreign companies usually will involve currencies of foreign countries, and because the Portfolios temporarily may hold funds in bank deposits in foreign currencies during the completion of investment programs, the value of their assets as measured in US dollars may be affected favorably or unfavorably by changes in foreign currency exchange rates and exchange control regulations, and they may incur costs in connection with conversions between various currencies. Although the Portfolios value their assets daily in terms of US dollars, they do not intend to convert their holdings of foreign currencies into US dollars on a daily basis. They will do so from time to time, and investors should be aware of the costs of currency conversion. Although foreign exchange dealers do not charge a fee for conversion, they do realize a profit based on the difference (the “spread”) between the prices at which they are buying and selling various currencies. Thus, a dealer may offer to sell a foreign currency to the Portfolios at one rate, while offering a lesser rate of exchange should the Portfolios desire to resell that currency to the dealer. The Portfolios will conduct their foreign currency exchange transactions either on a spot (i.e., cash) basis at the spot rate prevailing in the foreign currency exchange market, or through entering into forward or, in the case of International Portfolio, futures contracts to purchase or sell foreign currencies.
A forward contract involves an obligation to purchase or sell a specific currency at a future date, which may be any fixed number of days from the date of the contract agreed upon by the parties, at a price set at the time of the contract. These contracts are traded in the interbank market conducted directly between currency traders (usually large commercial banks) and their customers. A forward contract generally has no deposit requirement, and no commissions are charged at any stage for trades.
A foreign currency futures contract is a standardized contract for the future delivery of a specified amount of a foreign currency at a future date at a price set at the time of the contract. The agreed price may be fixed or within a specified range of prices. Foreign currency futures contracts traded in the United States are designed by and traded on exchanges regulated by the Commodity Futures Trading Commission (“CFTC”), such as the Chicago Mercantile Exchange. Futures contracts involve brokerage costs, which may vary from less than 1% to 2.5% of the contract price, and require parties to the contract to make “margin” deposits to secure performance of the contract. International Portfolio would also be required to segregate assets to cover contracts that would require it to purchase foreign currencies. International Portfolio would enter into futures contracts solely for hedging or other appropriate risk management purposes as defined in CFTC regulations.
Forward contracts differ from foreign currency futures contracts in certain respects. For example, the maturity date of a forward contract may be any fixed number of days from the date of the contract agreed upon by the parties, rather than a predetermined date in a given month, and they may be in any amounts agreed upon by the parties rather than predetermined amounts. Also, forward contracts are traded directly between currency traders so that no intermediary is required. A forward contract generally requires no margin or other deposit.
Upon the maturity of a forward or foreign currency futures contract a Portfolio may either accept or make delivery of the currency specified in the contract or, at or prior to maturity, enter into a closing purchase transaction involving the purchase or sale of an offsetting contract. Closing purchase transactions with respect to forward contracts are usually effected with the currency trader who is a party to the original forward contract. Closing purchase transactions with respect to futures contracts are effected on a commodities exchange; a clearing corporation associated with the exchange assumes responsibility for closing out such contracts.
A Portfolio may enter into forward contracts and foreign currency futures contracts under certain circumstances. When a Portfolio enters into a contract for the purchase or sale of a security denominated in a foreign currency, or when a Portfolio anticipates the receipt in a foreign currency of dividends or interest payments on such a security which it holds, the Portfolio may desire to “lock in” the US dollar price of the security or the US dollar equivalent of such dividend or interest payment, as the case may be. By entering into a forward or futures contract for the purchase or sale, for a fixed amount of dollars, of the amount of foreign currency involved in the underlying transactions, the Portfolio will attempt to protect itself against a possible loss resulting from an adverse change in the relationship between the US dollar and the foreign currency during the period between the date on which the security is purchased or sold, or on which the dividend or interest payment is declared, and the date on which such payments are made or received.
12
Additionally, when management of a Portfolio believes that the currency of a particular foreign country may suffer a substantial decline against the US dollar, it may enter into a forward or futures contract to sell, for a fixed amount of dollars, the amount of foreign currency approximating the value of some or all of the Portfolio’s securities denominated in such foreign currency. The precise matching of the forward or futures contract amounts and the value of the securities involved will not generally be possible because the future value of such securities in foreign currencies will change as a consequence of market movements in the value of those securities between the date on which the contract is entered into and the date it matures. The precise projection of short-term currency market movements is not possible, and short-term hedging provides a means of fixing the dollar value of a portion of the Portfolio’s foreign assets.
The Portfolios do not intend to enter into such forward or futures contracts to protect the value of their portfolio securities on a regular continuous basis, and will not do so if, as a result, a Portfolio will have more than 15% of the value of its total assets committed to the consummation of such contracts. A Portfolio also will not enter into such forward or foreign currency futures contracts or maintain a net exposure to such contracts where the consummation of the contracts would obligate the Portfolio to deliver an amount of foreign currency in excess of the value of the Portfolio’s securities or other assets denominated in that currency. Under normal circumstances, consideration of the prospect for currency parities will be incorporated into the long-term investment decisions made with regard to overall diversification strategies. However, the Portfolios believe that it is important to have the flexibility to enter into such forward or foreign currency futures contracts when each determines that the best interests of the Portfolio will be served.
Except when a Portfolio enters into a forward contract for the purpose of the purchase or sale of a security denominated in a foreign currency, Brown Brothers Harriman & Co. or State Street Bank and Trust Company (each a “Custodian”), will place cash or liquid securities into a segregated account of the Portfolio in an amount equal to the value of the Portfolio’s total assets committed to the consummation of forward contracts (or the Portfolio’s forward contracts will be otherwise covered consistent with applicable regulatory policies) and foreign currency futures contracts that require the Portfolio to purchase foreign currencies. If the value of the securities placed in the segregated account declines, additional cash or securities will be placed in the account on a daily basis so that the value of the account will equal the amount of the Portfolio’s commitments with respect to such contracts.
The Portfolios generally will not enter into a forward or foreign currency futures contract with a term of greater than one year. It also should be realized that this method of protecting the value of a Portfolio’s securities against a decline in the value of a currency does not eliminate fluctuations in the underlying prices of the securities. It simply establishes a rate of exchange which the Portfolio can achieve at some future point in time.
While the Portfolios will enter into forward and, in the case of International Portfolio, foreign currency futures contracts and foreign currency options to reduce currency exchange rate risks, transactions in such contracts involve certain other risks. Thus, while a Portfolio may benefit from such transactions, unanticipated changes in currency prices may result in a poorer overall performance for the Portfolio than if it had not engaged in any such transaction. Moreover, there may be imperfect correlation between the value of the Portfolio’s holdings of securities denominated in a particular currency and forward or futures contracts entered into by the Portfolio. Such imperfect correlation may prevent the Portfolio from achieving a complete hedge or expose the Portfolio to risk of foreign exchange loss.
International Portfolio may purchase options on foreign currencies for hedging purposes in a manner similar to that of transactions in forward contracts. For example, a decline in the dollar value of a foreign currency in which portfolio securities are denominated will reduce the dollar value of such securities, even if their value in the foreign currency remains constant. In order to protect against such decreases in the value of portfolio securities, the Portfolio may purchase put options on the foreign currency. If the value of the currency declines, the Portfolio will have the right to sell such currency for a fixed amount of dollars which exceeds the market value of such currency. This would result in a gain that may offset, in whole or in part, the negative effect of currency depreciation on the value of the Portfolio’s securities denominated in that currency.
Conversely, if a rise in the dollar value of a currency is projected for those securities to be acquired, thereby increasing the cost of such securities, International Portfolio may purchase call options on such currency. If the value of such currency increased, the purchase of such call options would enable the Portfolio to purchase currency for a fixed amount of dollars which is less than the market value of such currency. Such a purchase would result in a gain that may offset,
13
at least partially, the effect of any currency related increase in the price of securities the Portfolio intends to acquire. As in the case of other types of options transactions, however, the benefit the Portfolio derives from purchasing foreign currency options will be reduced by the amount of the premium and related transaction costs. In addition, if currency exchange rates do not move in the direction or to the extent anticipated, the Portfolio could sustain losses on transactions in foreign currency options which would deprive it of a portion or all of the benefits of advantageous changes in such rates.
International Portfolio may close out its position in a currency option by either selling the option it has purchased or entering into an offsetting option.
Foreign Fixed Income Securities. Since most foreign fixed income securities are not rated, a Portfolio will invest in foreign fixed income securities based on the Advisor’s analysis without relying on published ratings. Since such investments will be based upon the Advisor’s analysis rather than upon published ratings, achievement of a Portfolio’s goals may depend more upon the abilities of the Advisor than would otherwise be the case.
The value of the foreign fixed income securities held by a Portfolio, and thus the net asset value of a Portfolio’s shares, generally will fluctuate with (a) changes in the perceived creditworthiness of the issuers of those securities, (b) movements in interest rates, and (c) changes in the relative values of the currencies in which a Portfolio’s investments in fixed income securities are denominated with respect to the US Dollar. The extent of the fluctuation will depend on various factors, such as the average maturity of a Portfolio’s investments in foreign fixed income securities, and the extent to which a Portfolio hedges its interest rate, credit and currency exchange rate risks. A longer average maturity generally is associated with a higher level of volatility in the market value of such securities in response to changes in market conditions.
Investments in sovereign debt, including Brady Bonds, involve special risks. Brady Bonds are debt securities issued under a plan implemented to allow debtor nations to restructure their outstanding commercial bank indebtedness. Foreign governmental issuers of debt or the governmental authorities that control the repayment of the debt may be unable or unwilling to repay principal or pay interest when due. In the event of default, there may be limited or no legal recourse in that, generally, remedies for defaults must be pursued in the courts of the defaulting party. Political conditions, especially a sovereign entity’s willingness to meet the terms of its fixed income securities, are of considerable significance. Also, there can be no assurance that the holders of commercial bank loans to the same sovereign entity may not contest payments to the holders of sovereign debt in the event of default under commercial bank loan agreements. In addition, there is no bankruptcy proceeding with respect to sovereign debt on which a sovereign has defaulted, and a Portfolio may be unable to collect all or any part of its investment in a particular issue. Foreign investment in certain sovereign debt is restricted or controlled to varying degrees, including requiring governmental approval for the repatriation of income, capital or proceeds of sales by foreign investors. These restrictions or controls may at times limit or preclude foreign investment in certain sovereign debt or increase the costs and expenses of a Portfolio. Sovereign debt may be issued as part of debt restructuring and such debt is to be considered speculative. There is a history of defaults with respect to commercial bank loans by public and private entities issuing Brady Bonds. All or a portion of the interest payments and/or principal repayment with respect to Brady Bonds may be uncollateralized.
Foreign Investment. Bond Portfolio, Balanced Portfolio, Growth and Income Portfolio, Capital Growth Portfolio, 21st Century Growth Portfolio, Global Discovery Portfolio and International Portfolio may each invest, except as applicable to debt securities generally, in US dollar-denominated foreign debt securities (including those issued by the Dominion of Canada and its provinces and other debt securities which meet the criteria applicable to the Portfolio’s domestic investments), and in certificates of deposit issued by foreign banks and foreign branches of United States banks, to any extent deemed appropriate by the Advisor. Bond Portfolio may invest up to 25% of its assets in non-US dollar-denominated foreign debt securities. Balanced Portfolio may invest up to 20% of its debt securities in non-US dollar-denominated foreign debt securities, and may invest up to 25% of its equity securities in non-US dollar-denominated foreign equity securities. Growth and Income Portfolio may invest up to 25% of its assets in non-US dollar denominated equity securities of foreign issuers. Capital Growth Portfolio may invest up to 25% of its assets, and 21st Century Growth Portfolio, Global Discovery and International Portfolio may invest without limit, in non-US dollar-denominated
14
equity securities of foreign issuers. However, 21st Century Growth Portfolio has no current intention of investing more than 20% of its net assets in foreign securities.
Foreign Securities. Investments in foreign securities involve certain special considerations, including those set forth below, which are not typically associated with investing in US securities and which may adversely affect a portfolio’s performance. As foreign companies are not generally subject to uniform accounting, auditing and financial reporting standards, practices and requirements comparable to those applicable to domestic companies, there may be less publicly available information about a foreign company than about a domestic company. Many foreign stock markets, while growing in volume of trading activity, have substantially less volume than the New York Stock Exchange, Inc. (the “Exchange”), and securities of some foreign companies are less liquid and more volatile than securities of domestic companies. Similarly, volume and liquidity in most foreign bond markets is less than in the US and at times, volatility of price can be greater than in the US. Further, foreign markets have different clearance and settlement procedures and in certain markets there have been times when settlements have been unable to keep pace with the volume of securities transactions, making it difficult to conduct such transactions. Delays in settlement could result in temporary periods when assets of a fund are uninvested and no return is earned thereon. The inability of a fund to make intended security purchases due to settlement problems could cause the fund to miss attractive investment opportunities. Inability to dispose of portfolio securities due to settlement problems either could result in losses to a fund due to subsequent declines in value of the portfolio security or, if a fund has entered into a contract to sell the security, could result in a possible liability to the purchaser. Payment for securities without delivery may be required in certain foreign markets. Fixed commissions on some foreign stock exchanges are generally higher than negotiated commissions on US exchanges, although a fund will endeavor to achieve the most favorable net results on its portfolio transactions. Further, a fund may encounter difficulties or be unable to pursue legal remedies and obtain judgments in foreign courts. There is generally less government supervision and regulation of business and industry practices, stock exchanges, brokers and listed companies than in the US. It may be more difficult for a fund’s agents to keep currently informed about corporate actions such as stock dividends or other matters which may affect the prices of portfolio securities. Communications between the US and foreign countries may be less reliable than within the US, thus increasing the risk of delayed settlements of portfolio transactions or loss of certificates for portfolio securities. In addition, with respect to certain foreign countries, there is the possibility of expropriation or confiscatory taxation, political or social instability, or diplomatic developments which could affect US investments in those countries. Moreover, individual foreign economies may differ favorably or unfavorably from the US economy in such respects as growth of gross national product, rate of inflation, capital reinvestment, resource self-sufficiency and balance of payments position. The management of a portfolio seeks to mitigate the risks associated with the foregoing considerations through diversification and continuous professional management.
Because investments in foreign securities will usually involve currencies of foreign countries, and because a portfolio may hold foreign currencies and forward foreign currency exchange contracts (“forward contracts”), futures contracts and options on futures contracts on foreign currencies, the value of the assets of a fund as measured in US dollars may be affected favorably or unfavorably by changes in foreign currency exchange rates and exchange control regulations, and a portfolio may incur costs in connection with conversions between various currencies. Although a portfolio values its assets daily in terms of US dollars, it does not intend to convert its holdings of foreign currencies into US dollars on a daily basis. It will do so from time to time, however, and investors should be aware of the costs of currency conversion.
Futures Contracts. The Fund may, on behalf of Bond Portfolio, Balanced Portfolio and International Portfolio, purchase and sell futures contracts on debt securities to hedge against anticipated changes in interest rates that might otherwise have an adverse effect upon the value of the Portfolio’s debt securities. In addition, the Fund may, on behalf of the Portfolios, purchase and sell securities index futures to hedge the equity securities of a Portfolio with regard to market (systematic) risk as distinguished from stock-specific risk. Each of these Portfolios may also purchase and write put and call options on futures contracts of the type which such Portfolio is authorized to enter into and may engage in related closing transactions. All of such futures on debt securities, stock index futures and related options will be traded on exchanges that are licensed and regulated by the “CFTC” or on appropriate foreign exchanges, to the extent permitted by law. Even though at the present time no contracts based on global indices which meet International Portfolio’s investment criteria are available, there are US stock indices which may be used to hedge US securities held in that Portfolio.
15
Futures on Debt Securities. A futures contract on a debt security is a binding contractual commitment which, if held to maturity, will result in an obligation to make or accept delivery, during a particular future month, of securities having a standardized face value and rate of return. By purchasing futures on debt securities — assuming a “long” position — the Fund, on behalf of a Portfolio, will legally obligate itself to accept the future delivery of the underlying security and pay the agreed price. By selling futures on debt securities — assuming a “short” position — it will legally obligate itself to make the future delivery of the security against payment of the agreed price. Open futures positions on debt securities will be valued at the most recent settlement price, unless such price does not appear to the Trustees to reflect the fair value of the contract, in which case the positions will be valued by or under the direction of the Trustees.
Positions taken in the futures markets are normally not held to maturity, but are instead liquidated through offsetting transactions which may result in a profit or a loss. While futures positions taken by the Fund on behalf of a Portfolio will usually be liquidated in this manner, the Fund may instead make or take delivery of the underlying securities whenever it appears economically advantageous to the Portfolio to do so. A clearing corporation associated with the exchange on which futures are traded assumes responsibility for closing-out and guarantees that the sale and purchase obligations will be performed with regard to all positions that remain open at the termination of the contract.
Hedging by use of futures on debt securities seeks to establish more certainly than would otherwise be possible the effective rate of return on portfolio securities. A Portfolio may, for example, take a “short” position in the futures market by selling contracts for the future delivery of debt securities held by the Portfolio (or securities having characteristics similar to those held by the Portfolio) in order to hedge against an anticipated rise in interest rates that would adversely affect the value of the Portfolio’s portfolio securities. When hedging of this character is successful, any depreciation in the value of portfolio securities will be substantially offset by appreciation in the value of the futures position.
On other occasions, the Portfolio may take a “long” position by purchasing futures on debt securities. This would be done, for example, when the Fund intends to purchase for the Portfolio particular securities when it has the necessary cash, but expects the rate of return available in the securities markets at that time to be less favorable than rates currently available in the futures markets. If the anticipated rise in the price of the securities should occur (with its concomitant reduction in yield), the increased cost to the Portfolio of purchasing the securities will be offset, at least to some extent, by the rise in the value of the futures position taken in anticipation of the subsequent securities purchase.
High Yield/High Risk Bonds. Bond Portfolio, Balanced Portfolio, Capital Growth Portfolio and Global Discovery Portfolio may also purchase debt securities which are rated below investment-grade (commonly referred to as “junk bonds”), that is, rated below Baa by Moody’s or below BBB by S&P and unrated securities judged to be of equivalent quality as determined by the Advisor. These securities usually entail greater risk (including the possibility of default or bankruptcy of the issuers of such securities), generally involve greater volatility of price and risk to principal and income, and may be less liquid, than securities in the higher rating categories. The lower the ratings of such debt securities, the more their risks render them like equity securities. Securities rated D may be in default with respect to payment of principal or interest. See the Appendix to this Statement of Additional Information for a more complete description of the ratings assigned by ratings organizations and their respective characteristics.
Issuers of such high yielding securities often are highly leveraged and may not have available to them more traditional methods of financing. Therefore, the risk associated with acquiring the securities of such issuers generally is greater than is the case with higher rated securities. For example, during an economic downturn or a sustained period of rising interest rates, highly leveraged issuers of high yield securities may experience financial stress. During such periods, such issuers may not have sufficient revenues to meet their interest payment obligations. The issuer’s ability to service its debt obligations may also be adversely affected by specific corporate developments, or the issuer’s inability to meet specific projected business forecasts, or the unavailability of additional financing. The risk of loss from default by the issuer is significantly greater for the holders of high yield securities because such securities are generally unsecured and are often subordinated to other creditors of the issuer. Prices and yields of high yield securities will fluctuate over time and, during periods of economic uncertainty, volatility of high yield securities may adversely affect a Portfolio’s net asset value. In addition, investments in high yield zero coupon or pay-in-kind bonds, rather than income-bearing high yield securities, may be more speculative and may be subject to greater fluctuations in value due to changes in interest rates.
16
A Portfolio may have difficulty disposing of certain high yield (high risk) securities because they may have a thin trading market. Because not all dealers maintain markets in all high yield securities, a Portfolio anticipates that such securities could be sold only to a limited number of dealers or institutional investors. The lack of a liquid secondary market may have an adverse effect on the market price and a Portfolio’s ability to dispose of particular issues and may also make it more difficult for a Portfolio to obtain accurate market quotations for purposes of valuing a Portfolio’s assets. Market quotations generally are available on many high yield issues only from a limited number of dealers and may not necessarily represent firm bids of such dealers or prices for actual sales. Adverse publicity and investor perceptions may decrease the values and liquidity of high yield securities. These securities may also involve special registration responsibilities, liabilities and costs, and liquidity and valuation difficulties.
Credit quality in the high-yield securities market can change suddenly and unexpectedly, and even recently issued credit ratings may not fully reflect the actual risks posed by a particular high-yield security. For these reasons, it is generally the policy of the Advisor not to rely exclusively on ratings issued by established credit rating agencies, but to supplement such ratings with its own independent and on-going review of credit quality. The achievement of a Portfolio’s investment objective by investment in such securities may be more dependent on the Advisor’s credit analysis than is the case for higher quality bonds. Should the rating of a portfolio security be downgraded, the Advisor will determine whether it is in the best interests of the Fund to retain or dispose of such security.
Prices for below investment-grade securities may be affected by legislative and regulatory developments. Also, Congress has from time to time considered legislation which would restrict or eliminate the corporate tax deduction for interest payments in these securities and regulate corporate restructurings. Such legislation may significantly depress the prices of outstanding securities of this type.
Illiquid Securities and Restricted Securities. A Portfolio may purchase securities that are subject to legal or contractual restrictions on resale (“restricted securities”). Generally speaking, restricted securities may be sold (i) only to qualified institutional buyers; (ii) in a privately negotiated transaction to a limited number of purchasers; (iii) in limited quantities after they have been held for a specified period of time and other conditions are met pursuant to an exemption from registration; or (iv) in a public offering for which a registration statement is in effect under the Securities Act of 1933, as amended. Issuers of restricted securities may not be subject to the disclosure and other investor protection requirements that would be applicable if their securities were publicly traded.
Restricted securities are often illiquid, but they may also be liquid. For example, restricted securities that are eligible for resale under Rule 144A are often deemed to be liquid.
A Portfolio’s Board has approved guidelines for use by the Advisor in determining whether a security is liquid or illiquid. Among the factors the Advisor may consider in reaching liquidity decisions relating to Rule 144A securities are: (1) the frequency of trades and quotes for the security; (2) the number of dealers wishing to purchase or sell the security and the number of other potential purchasers; (3) dealer undertakings to make a market in the security; and (4) the nature of the security and the nature of the market for the security (i.e., the time needed to dispose of the security, the method of soliciting offers, and the mechanics of the transfer). Issuers of restricted securities may not be subject to the disclosure and other investor protection requirement that would be applicable if their securities were publicly traded. Where a registration statement is required for the resale of restricted securities, a Portfolio may be required to bear all or part of the registration expenses. A Portfolio may be deemed to be an “underwriter” for purposes of the Securities Act of 1933, as amended when selling restricted securities to the public and, in such event, a Portfolio may be liable to purchasers of such securities if the registration statement prepared by the issuer is materially inaccurate or misleading.
A Portfolio may also purchase securities that are not subject to legal or contractual restrictions on resale, but that are deemed illiquid. Such securities may be illiquid, for example, because there is a limited trading market for them.
A Portfolio may be unable to sell a restricted or illiquid security. In addition, it may be more difficult to determine a market value for restricted or illiquid securities. Moreover, if adverse market conditions were to develop during the period between a Portfolio’s decision to sell a restricted or illiquid security and the point at which a Portfolio is permitted or able to sell such security, a Portfolio might obtain a price less favorable than the price that prevailed when it
17
decided to sell. This investment practice, therefore, could have the effect of increasing the level of illiquidity of a Portfolio.
Indexed Securities. Bond Portfolio and Balanced Portfolio may each invest in indexed securities, the value of which is linked to currencies, interest rates, commodities, indices or other financial indicators (“reference instruments”). Most indexed securities have maturities of three years or less.
Indexed securities differ from other types of debt securities in which a Portfolio may invest in several respects. First, the interest rate or, unlike other debt securities, the principal amount payable at maturity of an indexed security may vary based on changes in one or more specified reference instruments, such as an interest rate compared with a fixed interest rate or the currency exchange rates between two currencies (neither of which need be the currency in which the instrument is denominated). The reference instrument need not be related to the terms of the indexed security. For example, the principal amount of a US dollar denominated indexed security may vary based on the exchange rate of two foreign currencies. An indexed security may be positively or negatively indexed; that is, its value may increase or decrease if the value of the reference instrument increases. Further, the change in the principal amount payable or the interest rate of an indexed security may be a multiple of the percentage change (positive or negative) in the value of the underlying reference instrument(s).
Investment in indexed securities involves certain risks. In addition to the credit risk of the security’s issuer and the normal risks of price changes in response to changes in interest rates, the principal amount of indexed securities may decrease as a result of changes in the value of reference instruments. Further, in the case of certain indexed securities in which the interest rate is linked to a reference instrument, the interest rate may be reduced to zero, and any further declines in the value of the security may then reduce the principal amount payable on maturity. Finally, indexed securities may be more volatile than the reference instruments underlying indexed securities.
Interfund Borrowing and Lending Program. The Fund, on behalf of each Portfolio, has received exemptive relief from the Securities and Exchange Commission (“SEC”) which permits the Portfolios to participate in an interfund lending program among certain investment companies advised by the Advisor. The interfund lending program allows the participating funds to borrow money from and loan money to each other for temporary or emergency purposes. The program is subject to a number of conditions designed to ensure fair and equitable treatment of all participating funds, including the following: (1) no fund may borrow money through the program unless it receives a more favorable interest rate than a rate approximating the lowest interest rate at which bank loans would be available to any of the participating funds under a loan agreement; and (2) no fund may lend money through the program unless it receives a more favorable return than that available from an investment in repurchase agreements and, to the extent applicable, money market cash sweep arrangements. In addition, a fund may participate in the program only if and to the extent that such participation is consistent with the fund’s investment objectives and policies (for instance, money market funds would normally participate only as lenders and tax exempt funds only as borrowers). Interfund loans and borrowings may extend overnight, but could have a maximum duration of seven days. Loans may be called on one day’s notice. A fund may have to borrow from a bank at a higher interest rate if an interfund loan is called or not renewed. Any delay in repayment to a lending fund could result in a lost investment opportunity or additional costs. The program is subject to the oversight and periodic review of the Boards of the participating funds. To the extent a Portfolio is actually engaged in borrowing through the interfund lending program, the Portfolio, as a matter of non-fundamental policy, may not borrow for other than temporary or emergency purposes (and not for leveraging), except that a Portfolio (except Money Market Portfolio) may engage in reverse repurchase agreements and dollar rolls for any purpose.
Investment Company Securities. Each Portfolio may acquire securities of other investment companies to the extent consistent with its investment objective and subject to the limitations of the 1940 Act. Each Portfolio will indirectly bear its proportionate share of any management fees and other expenses paid by such other investment companies.
For example, a Portfolio may invest in a variety of investment companies which seek to track the composition and performance of specific indexes or a specific portion of an index. These index-based investments hold substantially all of their assets in securities representing their specific index. Accordingly, the main risk of investing in index-based investments is the same as investing in a portfolio of equity securities comprising the index. The market prices of index-based investments will fluctuate in accordance with both changes in the market value of their underlying portfolio
18
securities and due to supply and demand for the instruments on the exchanges on which they are traded (which may result in their trading at a discount or premium to their Net Asset Value (“NAVs”). Index-based investments may not replicate exactly the performance of their specified index because of transaction costs and because of the temporary unavailability of certain component securities of the index.
Examples of index-based investments include:
SPDRs(R): SPDRs, an acronym for “Standard & Poor’s Depositary Receipts,” are based on the S&P 500. They are issued by the SPDR Trust, a unit investment trust that holds shares of substantially all the companies in the S&P 500 in substantially the same weighting and seeks to closely track the price performance and dividend yield of the Index.
MidCap SPDRs(R): MidCap SPDRs are based on the S&P MidCap 400 Index. They are issued by the MidCap SPDR Trust, a unit investment trust that holds a portfolio of securities consisting of substantially all of the common stocks in the S&P MidCap 400 Index in substantially the same weighting and seeks to closely track the price performance and dividend yield of the Index.
Select Sector SPDRs(R): Select Sector SPDRs are based on a particular sector or group of industries that are represented by a specified Select Sector Index within the S&P 500. They are issued by The Select Sector SPDR Trust, an open-end management investment company with nine portfolios that each seeks to closely track the price performance and dividend yield of a particular Select Sector Index.
DIAMONDS(SM): DIAMONDS are based on the Dow Jones Industrial Average(SM). They are issued by the DIAMONDS Trust, a unit investment trust that holds a portfolio of all the component common stocks of the Dow Jones Industrial Average and seeks to closely track the price performance and dividend yield of the Dow.
Nasdaq-100 Shares: Nasdaq-100 Shares are based on the Nasdaq 100 Index. They are issued by the Nasdaq-100 Trust, a unit investment trust that holds a portfolio consisting of substantially all of the securities, in substantially the same weighting, as the component stocks of the Nasdaq-100 Index and seeks to closely track the price performance and dividend yield of the Index.
WEBs(SM): WEBs, an acronym for “World Equity Benchmark Shares,” are based on 17 country-specific Morgan Stanley Capital International Indexes. They are issued by the WEBs Index Fund, Inc., an open-end management investment company that seeks to generally correspond to the price and yield performance of a specific Morgan Stanley Capital International Index.
Investment-Grade Bonds. Bond, Balanced, Capital Growth, 21st Century Growth, Global Discovery, Health Sciences and International Portfolios may each purchase “investment-grade” bonds, which are those rated Aaa, Aa, A or Baa by Moody’s or AAA, AA, A or BBB by S&P or, if unrated, judged to be of equivalent quality as determined by the Advisor. Moody’s considers bonds it rates Baa to have speculative elements as well as investment-grade characteristics. To the extent that a Portfolio invests in higher-grade securities, a Portfolio will not be able to avail itself of opportunities for higher income which may be available at lower grades.
Investment of Uninvested Cash Balances. Each Portfolio may have cash balances that have not been invested in portfolio securities (“Uninvested Cash”). Uninvested Cash may result from a variety of sources, including dividends or interest received from portfolio securities, unsettled securities transactions, reserves held for investment strategy purposes, scheduled maturity of investments, liquidation of investment securities to meet anticipated redemptions and dividend payments, and new cash received from investors. Uninvested Cash may be invested directly in money market instruments or other short-term debt obligations. Pursuant to an Exemptive Order issued by the SEC, each Portfolio may use Uninvested Cash to purchase shares of affiliated funds including money market funds, short-term bond funds and Scudder Cash Management QP Trust and Scudder Trust Company, or one or more future entities for which Deutsche Asset Management acts as trustee or investment advisor that operate as cash management investment vehicles and that are excluded from the definition of investment company pursuant to section 3(c)(1) or 3(c)(7) of the 1940 Act (collectively, the “Central Funds”) in excess of the limitations of Section 12(d)(1) of the 1940 Act. Investment by a
19
Portfolio in shares of the Central Funds will be in accordance with the Portfolio’s investment policies and restrictions as set forth in its registration statement.
Certain of the Central Funds comply with rule 2a-7 under the Act. The other Central Funds are or will be short-term bond funds that invest in fixed-income securities and maintain a dollar weighted average maturity of three years or less. Each of the Central Funds will be managed specifically to maintain a highly liquid portfolio, and access to them will enhance a Portfolio’s ability to manage Uninvested Cash.
Each Portfolio will invest Uninvested Cash in Central Funds only to the extent that the Portfolio’s aggregate investment in the Central Funds does not exceed 25% of its total assets in shares of the Central Funds. Purchase and sales of shares of Central Funds are made at net asset value.
Investing in Africa. Africa is a continent of roughly 50 countries with a total population of approximately 840 million people. Literacy rates (the percentage of people who are over 15 years of age and who can read and write) are relatively low, ranging from 20% to 60%. The primary industries include crude oil, natural gas, manganese ore, phosphate, bauxite, copper, iron, diamond, cotton, coffee, cocoa, timber, tobacco, sugar, tourism, and cattle.
Many African countries are fraught with political instability. However, there has been a trend over the past five years toward democratization. Many countries are moving from a military style, Marxist, or single party government to a multi-party system. Still, there remain many countries that do not have a stable political process. Other countries have been enmeshed in civil wars and border clashes.
Economically, the Northern Rim countries (including Morocco, Egypt, and Algeria) and Nigeria, Zimbabwe and South Africa are the wealthier countries on the continent. The market capitalization of these countries has been growing recently as more international companies invest in Africa and as local companies start to list on the exchanges. However, religious and ethnic strife has been a significant source of instability.
On the other end of the economic spectrum are countries, such as Burkinafaso, Madagascar, and Malawi, that are considered to be among the poorest or least developed in the world. These countries are generally landlocked or have poor natural resources. The economies of many African countries are heavily dependent on international oil prices. Of all the African industries, oil has been the most lucrative, accounting for 40% to 60% of many countries’ GDP. However, general decline in oil prices has had an adverse impact on many economies.
Foreign securities such as those purchased by certain Portfolios may be subject to foreign government taxes which could reduce the yield on such securities, although a shareholder of the Portfolio may, subject to certain limitations, be entitled to claim a credit or deduction for US federal income tax purposes for his or her proportionate share of such foreign taxes paid by a Portfolio. (See “Dividends, Capital Gains and Taxes.”)
Investing in Emerging Markets. A Portfolio’s investments in foreign securities may be in developed countries or in countries considered by a Portfolio’s Advisor to have developing or “emerging” markets, which involve exposure to economic structures that are generally less diverse and mature than in the United States, and to political systems that may be less stable. A developing or emerging market country can be considered to be a country that is in the initial stages of its industrialization cycle. Currently, emerging markets generally include every country in the world other than the United States, Canada, Japan, Australia, New Zealand, Hong Kong, Singapore and most Western European countries. Currently, investing in many emerging markets may not be desirable or feasible because of the lack of adequate custody arrangements for a Portfolio’s assets, overly burdensome repatriation and similar restrictions, the lack of organized and liquid securities markets, unacceptable political risks or other reasons. As opportunities to invest in securities in emerging markets develop, a Portfolio may expand and further broaden the group of emerging markets in which it invests. In the past, markets of developing or emerging market countries have been more volatile than the markets of developed countries; however, such markets often have provided higher rates of return to investors. The Advisor believes that these characteristics may be expected to continue in the future.
Most emerging securities markets have substantially less volume and are subject to less governmental supervision than US securities markets. Securities of many issuers in emerging markets may be less liquid and more volatile than
20
securities of comparable domestic issuers. In addition, there is less regulation of securities exchanges, securities dealers, and listed and unlisted companies in emerging markets than in the US.
Emerging markets also have different clearance and settlement procedures, and in certain markets there have been times when settlements have not kept pace with the volume of securities transactions. Delays in settlement could result in temporary periods when a portion of the assets of a Portfolio is uninvested and therefore no return is earned thereon. The inability of a Portfolio to make intended security purchases due to settlement problems could cause a Portfolio to miss attractive investment opportunities. Inability to dispose of portfolio securities due to settlement problems could result either in losses to a Portfolio due to subsequent declines in value of the portfolio security or, if a Portfolio has entered into a contract to sell the security, could result in possible liability to the purchaser. Costs associated with transactions in foreign securities, particularly in emerging markets, are generally higher than costs associated with transactions in US securities. Such transactions may also involve additional costs for the purchase or sale of foreign currency.
Certain emerging markets require prior governmental approval of investments by foreign persons, limit the amount of investment by foreign persons in a particular company, limit the investment by foreign persons only to a specific class of securities of a company that may have less advantageous rights than the classes available for purchase by domiciliaries of the countries and/or impose additional taxes on foreign investors. Certain emerging markets may also restrict investment opportunities in issuers in industries deemed important to national interest.
Certain emerging markets may require governmental approval for the repatriation of investment income, capital or the proceeds of sales of securities by foreign investors. In addition, if a deterioration occurs in an emerging market’s balance of payments or for other reasons, a country could impose temporary restrictions on foreign capital remittances. A Portfolio could be adversely affected by delays in, or a refusal to grant, any required governmental approval for repatriation of capital, as well as by the application to a Portfolio of any restrictions on investments.
In the course of investment in emerging markets, a Portfolio will be exposed to the direct or indirect consequences of political, social and economic changes in one or more emerging markets. While a Portfolio will manage its assets in a manner that will seek to minimize the exposure to such risks, there can be no assurance that adverse political, social or economic changes will not cause a Portfolio to suffer a loss of value in respect of the securities in a Portfolio’s holdings.
The risk also exists that an emergency situation may arise in one or more emerging markets as a result of which trading of securities may cease or may be substantially curtailed and prices for a Portfolio’s securities in such markets may not be readily available. A Portfolio may suspend redemption of its shares for any period during which an emergency exists, as determined by the Securities and Exchange Commission. Accordingly if a Portfolio believes that appropriate circumstances exist, it will promptly apply to the Securities and Exchange Commission for a determination that an emergency is present. During the period commencing from a Portfolio’s identification of such condition until the date of the Securities and Exchange Commission action, a Portfolio’s securities in the affected markets will be valued at fair value determined in good faith by or under the direction of a Portfolio’s Board.
Volume and liquidity in most foreign markets are less than in the US, and securities of many foreign companies are less liquid and more volatile than securities of comparable US companies. Fixed commissions on foreign securities exchanges are generally higher than negotiated commissions on US exchanges, although a Portfolio endeavors to achieve the most favorable net results on its portfolio transactions. There is generally less government supervision and regulation of business and industry practices, securities exchanges, brokers, dealers and listed companies than in the US. Mail service between the US and foreign countries may be slower or less reliable than within the US, thus increasing the risk of delayed settlements of portfolio transactions or loss of certificates for certificated portfolio securities. In addition, with respect to certain emerging markets, there is the possibility of expropriation or confiscatory taxation, political or social instability, or diplomatic developments which could affect a Portfolio’s investments in those countries. Moreover, individual emerging market economies may differ favorably or unfavorably from the US economy in such respects as growth of gross national product, rate of inflation, capital reinvestment, resource self-sufficiency and balance of payments position.
A Portfolio may have limited legal recourse in the event of a default with respect to certain debt obligations it holds. If the issuer of a fixed-income security owned by a Portfolio defaults, a Portfolio may incur additional expenses to seek
21
recovery. Debt obligations issued by emerging market country governments differ from debt obligations of private entities; remedies from defaults on debt obligations issued by emerging market governments, unlike those on private debt, must be pursued in the courts of the defaulting party itself. A Portfolio’s ability to enforce its rights against private issuers may be limited. The ability to attach assets to enforce a judgment may be limited. Legal recourse is therefore somewhat diminished. Bankruptcy, moratorium and other similar laws applicable to private issuers of debt obligations may be substantially different from those of other countries. The political context, expressed as an emerging market governmental issuer’s willingness to meet the terms of the debt obligation, for example, is of considerable importance. In addition, no assurance can be given that the holders of commercial bank debt may not contest payments to the holders of debt obligations in the event of default under commercial bank loan agreements.
Income from securities held by a Portfolio could be reduced by a withholding tax at the source or other taxes imposed by the emerging market countries in which a Portfolio makes its investments. A Portfolio’s net asset value may also be affected by changes in the rates or methods of taxation applicable to a Portfolio or to entities in which a Portfolio has invested. The Advisor will consider the cost of any taxes in determining whether to acquire any particular investments, but can provide no assurance that the taxes will not be subject to change.
Many emerging markets have experienced substantial, and, in some periods, extremely high rates of inflation for many years. Inflation and rapid fluctuations in inflation rates have had and may continue to have adverse effects on the economies and securities markets of certain emerging market countries. In an attempt to control inflation, wage and price controls have been imposed in certain countries. Of these countries, some, in recent years, have begun to control inflation through prudent economic policies.
Emerging market governmental issuers are among the largest debtors to commercial banks, foreign governments, international financial organizations and other financial institutions. Certain emerging market governmental issuers have not been able to make payments of interest on or principal of debt obligations as those payments have come due. Obligations arising from past restructuring agreements may affect the economic performance and political and social stability of those issuers.
Governments of many emerging market countries have exercised and continue to exercise substantial influence over many aspects of the private sector through the ownership or control of many companies, including some of the largest in any given country. As a result, government actions in the future could have a significant effect on economic conditions in emerging markets, which in turn, may adversely affect companies in the private sector, general market conditions and prices and yields of certain of the securities in a Portfolio’s portfolio. Expropriation, confiscatory taxation, nationalization, political, economic or social instability or other similar developments have occurred frequently over the history of certain emerging markets and could adversely affect a Portfolio’s assets should these conditions recur.
The ability of emerging market country governmental issuers to make timely payments on their obligations is likely to be influenced strongly by the issuer’s balance of payments, including export performance, and its access to international credits and investments. An emerging market whose exports are concentrated in a few commodities could be vulnerable to a decline in the international prices of one or more of those commodities. Increased protectionism on the part of an emerging market’s trading partners could also adversely affect the country’s exports and diminish its trade account surplus, if any. To the extent that emerging markets receive payment for its exports in currencies other than dollars or non-emerging market currencies, its ability to make debt payments denominated in dollars or non-emerging market currencies could be affected.
Another factor bearing on the ability of emerging market countries to repay debt obligations is the level of international reserves of the country. Fluctuations in the level of these reserves affect the amount of foreign exchange readily available for external debt payments and thus could have a bearing on the capacity of emerging market countries to make payments on these debt obligations.
To the extent that an emerging market country cannot generate a trade surplus, it must depend on continuing loans from foreign governments, multilateral organizations or private commercial banks, aid payments from foreign governments and inflows of foreign investment. The access of emerging markets to these forms of external funding may not be certain, and a withdrawal of external funding could adversely affect the capacity of emerging market country
22
governmental issuers to make payments on their obligations. In addition, the cost of servicing emerging market debt obligations can be affected by a change in international interest rates since the majority of these obligations carry interest rates that are adjusted periodically based upon international rates.
Investing in Europe. Most Eastern European nations, including Hungary, Poland, Czechoslovakia, and Romania have had centrally planned, socialist economies since shortly after World War II. A number of their governments, including those of Hungary, the Czech Republic, and Poland are currently implementing or considering reforms directed at political and economic liberalization, including efforts to foster multi-party political systems, decentralize economic planning, and move toward free market economies. At present, no Eastern European country has a developed stock market, but Poland, Hungary, and the Czech Republic have small securities markets in operation. Ethnic and civil conflict currently rage through the former Yugoslavia. The outcome is uncertain.
Both the European Community (the “EC”) and Japan, among others, have made overtures to establish trading arrangements and assist in the economic development of the Eastern European nations. A great deal of interest also surrounds opportunities created by the reunification of East and West Germany. Following reunification, the Federal Republic of Germany has remained a firm and reliable member of the EC and numerous other international alliances and organizations. To reduce inflation caused by the unification of East and West Germany, Germany has adopted a tight monetary policy which has led to weakened exports and a reduced domestic demand for goods and services. However, in the long-term, reunification could prove to be an engine for domestic and international growth.
The conditions that have given rise to these developments are changeable, and there is no assurance that reforms will continue or that their goals will be achieved.
Portugal is a genuinely emerging market which has experienced rapid growth since the mid-1980s, except for a brief period of stagnation over 1990-91. Portugal’s government remains committed to privatization of the financial system away from one dependent upon the banking system to a more balanced structure appropriate for the requirements of a modern economy. Inflation continues to be about three times the EC average.
Economic reforms launched in the 1980s continue to benefit Turkey in the 1990s. Turkey’s economy has grown steadily since the early 1980s, with real growth in per capita Gross Domestic Product (the “GDP”) increasing more than 6% annually. Agriculture remains the most important economic sector, employing approximately 55% of the labor force, and accounting for nearly 20% of GDP and 20% of exports. Inflation and interest rates remain high, and a large budget deficit will continue to cause difficulties in Turkey’s substantial transformation to a dynamic free market economy.
Like many other Western economies, Greece suffered severely from the global oil price hikes of the 1970s, with annual GDP growth plunging from 8% to 2% in the 1980s, and inflation, unemployment, and budget deficits rising sharply. The fall of the socialist government in 1989 and the inability of the conservative opposition to obtain a clear majority have led to business uncertainty and the continued prospects for flat economic performance. Once Greece has sorted out its political situation, it will have to face the challenges posed by the steadily increasing integration of the EC, including the progressive lowering of trade and investment barriers. Tourism continues as a major industry, providing a vital offset to a sizable commodity trade deficit.
Securities traded in certain emerging European securities markets may be subject to risks due to the inexperience of financial intermediaries, the lack of modern technology and the lack of a sufficient capital base to expand business operations. Additionally, former Communist regimes of a number of Eastern European countries had expropriated a large amount of property, the claims of which have not been entirely settled. There can be no assurance that the Portfolio’s investments in Eastern Europe would not also be expropriated, nationalized or otherwise confiscated. Finally, any change in leadership or policies of Eastern European countries, or countries that exercise a significant influence over those countries, may halt the expansion of or reverse the liberalization of foreign investment policies now occurring and adversely affect existing investment opportunities.
Global Discovery Portfolio will limit investments in securities of issuers located in Eastern Europe to 5% of its total assets.
23
Investing in Latin America. Investing in securities of Latin American issuers may entail risks relating to the potential political and economic instability of certain Latin American countries and the risks of expropriation, nationalization, confiscation or the imposition of restrictions on foreign investment and on repatriation of capital invested. In the event of expropriation, nationalization or other confiscation by any country, the Portfolio could lose its entire investment in any such country.
The securities markets of Latin American countries are substantially smaller, less developed, less liquid and more volatile than the major securities markets in the US. Disclosure and regulatory standards are in many respects less stringent than US standards. Furthermore, there is a lower level of monitoring and regulation of the markets and the activities of investors in such markets.
The limited size of many Latin American securities markets and limited trading volume in the securities of Latin American issuers could cause prices to be erratic for reasons apart from factors that affect the soundness and competitiveness of the securities issuers. For example, limited market size may cause prices to be unduly influenced by traders who control large positions. Adverse publicity and investors’ perceptions, whether or not based on in-depth fundamental analysis, may decrease the value and liquidity of portfolio securities.
Some Latin American countries also may have managed currencies, which are not free floating against the US dollar. In addition, there is risk that certain Latin American countries may restrict the free conversion of their currencies into other currencies. Further, certain Latin American currencies may not be internationally traded. Certain of these currencies have experienced a steep devaluation relative to the US dollar. Any devaluations in the currencies in which Portfolio securities are denominated may have a detrimental impact on the Portfolio’s net asset value.
The economies of individual Latin American countries may differ favorably or unfavorably from the US economy in such respects as the rate of growth of gross domestic product, the rate of inflation, capital reinvestment, resource self-sufficiency and balance of payments position. Certain Latin American countries have experienced high levels of inflation which can have a debilitating effect on an economy, although some have begun to control inflation in recent years through prudent economic policies. Furthermore, certain Latin American countries may impose withholding taxes on dividends payable to a Portfolio at a higher rate than those imposed by other foreign countries. This may reduce the Portfolio’s investment income available for distribution to shareholders.
Investing in the Pacific Basin. Economies of individual Pacific Basin countries may differ favorably or unfavorably from the US economy in such respects as growth of gross national product, rate of inflation, capital reinvestment, resource self-sufficiency, interest rate levels, and balance of payments position. Of particular importance, most of the economies in this region of the world are heavily dependent upon exports, particularly to developed countries, and, accordingly, have been and may continue to be adversely affected by trade barriers, managed adjustments in relative currency values, and other protectionist measures imposed or negotiated by the US and other countries with which they trade. These economies also have been and may continue to be negatively impacted by economic conditions in the US and other trading partners, which can lower the demand for goods produced in the Pacific Basin.
With respect to the Peoples Republic of China and other markets in which the Portfolio may participate, there is the possibility of nationalization, expropriation or confiscatory taxation, political changes, government regulation, social instability or diplomatic developments that could adversely impact a Pacific Basin country or the Portfolio’s investment in the debt of that country.
Foreign companies, including Pacific Basin companies, are not generally subject to uniform accounting, auditing and financial reporting standards, practices and disclosure requirements comparable to those applicable to US companies. Consequently, there may be less publicly available information about such companies than about US companies. Moreover, there is generally less government supervision and regulation in the Pacific Basin than in the US.
IPO Risk. Securities issued through an initial public offering (IPO) can experience an immediate drop in value if the demand for the securities does not continue to support the offering price. Information about the issuers of IPO securities is also difficult to acquire since they are new to the market and may not have lengthy operating histories. The Health Sciences Portfolio may engage in short-term trading in connection with its IPO investments, which could produce higher
24
trading costs and adverse tax consequences. The number of securities issued in an IPO is limited, so it is likely that IPO securities will represent a smaller component of the Portfolio’s portfolio as its assets increase (and thus have a more limited effect on the Portfolio’s performance).
Lending of Portfolio Securities. Each Portfolio (except Money Market Portfolio) may lend its investment securities to approved institutional borrowers who need to borrow securities in order to complete certain transactions, such as covering short sales, avoiding failures to deliver securities or completing arbitrage operations. By lending its investment securities, a portfolio attempts to increase its net investment income through the receipt of interest on the loan. Any gain or loss in the market price of the securities loaned that might occur during the term of the loan would belong to a portfolio. A portfolio may lend its investment securities so long as the terms, structure and the aggregate amount of such loans are not inconsistent with the 1940 Act or the rules and regulations or interpretations of the SEC thereunder, which currently require that (a) the borrower pledge and maintain with the portfolio collateral consisting of liquid, unencumbered assets having a value at all times not less than 100% of the value of the securities loaned, (b) the borrower add to such collateral whenever the price of the securities loaned rises (i.e., the borrower “marks to the market” on a daily basis), (c) the loan be made subject to termination by a portfolio at any time, and (d) a portfolio receives reasonable interest on the loan (which may include the portfolio investing any cash collateral in interest bearing short-term investments), and distributions on the loaned securities and any increase in their market value. There may be risks of delay in recovery of the securities or even loss of rights in the collateral should the borrower of the securities fail financially. However, loans will be made only to borrowers selected by a portfolio’s delegate after a commercially reasonable review of relevant facts and circumstances, including the creditworthiness of the borrower.
At the present time, the staff of the SEC does not object if an investment company pays reasonable negotiated fees in connection with loaned securities, so long as such fees are set forth in a written contract and approved by the investment company’s Board of Trustees. In addition, voting rights may pass with the loaned securities, but if a material event occurs affecting an investment on loan, the loan must be called and the securities voted. Pursuant to an exemptive order granted by the SEC, cash collateral received by a portfolio may be invested in a money market fund managed by the Advisor (or one of its affiliates).
Letters of Credit. Municipal obligations, including certificates of participation, commercial paper and other short-term obligations, may be backed by an irrevocable letter of credit of a bank which assumes the obligation for payment of principal and interest in the event of default by the issuer. Only banks which, in the opinion of the Advisor, are of investment quality comparable to other permitted investments of the Fund may be used for letter of credit backed investments.
Limitations on the Use of Futures Contracts and Options on Futures. All of the futures contracts and options on futures transactions into which the Fund will enter will be for bona fide hedging or other appropriate risk management purposes as permitted by CFTC regulations and to the extent consistent with requirements of the “SEC”.
To ensure that its futures and options transactions meet this standard, the Fund will enter into them only for the purposes or with the intent specified in CFTC regulations, subject to the requirements of the SEC. The Fund will further seek to assure that fluctuations in the price of the futures contracts and options on futures that it uses for hedging purposes will be substantially correlated to fluctuations in the price of the securities held by a Portfolio or which it expects to purchase, though there can be no assurance that this result will be achieved. The Fund will sell futures contracts or acquire puts to protect against a decline in the price of securities that a Portfolio owns. The Fund will purchase futures contracts or calls on futures contracts to protect a Portfolio against an increase in the price of securities the Fund intends later to purchase for the Portfolio before it is in a position to do so.
As evidence of this hedging intent, the Fund expects that on 75% or more of the occasions on which it purchases a long futures contract or call option on futures for a Portfolio the Fund will effect the purchase of securities in the cash market or take delivery as it closes out a Portfolio’s futures position. In particular cases, however, when it is economically advantageous to the Portfolio, a long futures position may be terminated (or an option may expire) without the corresponding purchase of securities.
25
As an alternative to literal compliance with the bona fide hedging definition, a CFTC definition now permits the Fund to elect to comply with a different test, under which its long futures positions will not exceed the sum of (a) cash or cash equivalents segregated for this purpose, (b) cash proceeds on existing investments due within thirty days and (c) accrued profits on the particular futures or options positions. However, the Fund will not utilize this alternative unless it is advised by counsel that to do so is consistent with the requirements of the SEC.
Futures on debt securities and stock index futures are at present actively traded on exchanges that are licensed and registered by the CFTC, or consistent with the CFTC regulations on foreign exchanges. Portfolios will incur brokerage fees in connection with their futures and options transactions, and will be required to deposit and maintain funds with brokers as margin to guarantee performance of futures obligations. In addition, while futures contracts and options on futures will be purchased and sold to reduce certain risks, those transactions themselves entail certain other risks. Thus, while a Portfolio may benefit from the use of futures and options on futures, unanticipated changes in interest rates or stock price movements may result in a poorer overall performance for the Portfolio than if it had not entered into any futures contracts or options transactions. Moreover, in the event of an imperfect correlation between the futures position and the portfolio position which is intended to be protected, the desired protection may not be obtained and the Portfolio may be exposed to risk of loss.
Each Portfolio, in dealing in futures contracts and options on futures, is subject to the 300% asset coverage requirement for borrowings set forth under “Investment Restrictions” in the Fund’s prospectus. The Trustees have also adopted a policy (which is not fundamental and may be modified by the Trustees without a shareholder vote) that, immediately after the purchase or sale of a futures contract or option thereon, the value of the aggregate initial margin with respect to all futures contracts and premiums on options on futures contracts entered into by a Portfolio will not exceed 5% of the fair market value of the Portfolio’s total assets. Additionally, the value of the aggregate premiums paid for all put and call options held by the Portfolio will not exceed 20% of its total assets. A futures contract for the receipt of a debt security and long index futures will be offset by assets of the Portfolio held in a segregated account in an amount equal to the total market value of the futures contracts less the amount of the initial margin for the contracts.
Maintenance of $1.00 Net Asset Value, Credit Quality and Portfolio Maturity. Money Market Portfolio effects sales, redemptions and repurchases at the net asset value per share, normally $1.00. In fulfillment of their responsibilities under Rule 2a-7 of the 1940 Act, the Fund’s Board has approved policies established by the Fund’s Advisor reasonably calculated to prevent the Fund’s net asset value per share from deviating from $1.00 except under unusual or extraordinary circumstances and the Fund’s Board will periodically review the Advisor’s operations under such policies at regularly scheduled Board meetings. Those policies include a weekly monitoring by the Advisor of unrealized gains and losses in the Fund’s portfolio, and when necessary, in an effort to avoid deviation, taking corrective action, such as adjusting the maturity of the portfolio, or, if possible, realizing gains or losses to offset in part unrealized losses or gains. The result of those policies may be that the yield on shares of the Fund will be lower than would be the case if the policies were not in effect. Such policies also provide for certain action to be taken with respect to portfolio securities which experience a downgrade in rating or suffer a default.
Micro-Cap Company Risk. While, historically, micro-capitalization company stocks have outperformed the stocks of large companies, the former have customarily involved more investment risk as well. There can be no assurance that this will continue to be true in the future. Micro-capitalization companies may have limited product lines, markets or financial resources; may lack management depth or experience; and may be more vulnerable to adverse general market or economic developments than large companies. The prices of micro-capitalization company securities are often more volatile than prices associated with large company issues, and can display abrupt or erratic movements at times, due to limited trading volumes and less publicly available information.
Also, because micro-capitalization companies normally have fewer shares outstanding and these shares trade less frequently than large companies, it may be more difficult for a fund to buy and sell significant amounts of such shares without an unfavorable impact on prevailing market prices.
Some of the companies in which a fund may invest may distribute, sell or produce products which have recently been brought to market and may be dependent on key personnel. The securities of micro-capitalization companies are often traded over-the-counter and may not be traded in the volumes typical on a national securities exchange. Consequently, in
26
order to sell this type of holding, a fund may need to discount the securities from recent prices or dispose of the securities over a long period of time. Mortgage-Backed Securities and Mortgage Pass-Through Securities. Bond Portfolio, Balanced Portfolio, Global Discovery Portfolio and Growth and Income Portfolio may also invest in mortgage-backed securities, which are interests in pools of mortgage loans, including mortgage loans made by savings and loan institutions, mortgage bankers, commercial banks, and others. Pools of mortgage loans are assembled as securities for sale to investors by various governmental, government-related, and private organizations as further described below. Underlying mortgages may be of a variety of types, including adjustable rate, conventional 30-year, graduated payment and 15-year.
A decline in interest rates will often lead to a faster rate of repayment of the underlying mortgages, and expose the Portfolios to a lower rate of return upon reinvestment. To the extent that such mortgage-backed securities are held by the Portfolios, the prepayment right will tend to limit to some degree the increase in net asset value of the Portfolios because the value of the mortgage-backed securities held by the Portfolios may not appreciate as rapidly as the price of non-callable debt securities. Mortgage-backed securities are subject to the risk of prepayment and the risk that the underlying loans will not be repaid. Because principal may be prepaid at any time, mortgage-backed securities may involve significantly greater price and yield volatility than traditional debt securities.
When interest rates rise, mortgage prepayment rates tend to decline, thus lengthening the life of mortgage-related securities and increasing their volatility, affecting the price volatility of the Fund’s shares.
Interests in pools of mortgage-backed securities differ from other forms of debt securities, which normally provide for periodic payment of interest in fixed amounts with principal payments at maturity or specified call dates. Instead, these securities provide a monthly payment which consists of both interest and principal payments. In effect, these payments are a “pass-through” of the monthly payments made by the individual borrowers on their mortgage loans, net of any fees paid to the issuer or guarantor of such securities. Additional payments are caused by repayments of principal resulting from the sale of the underlying property, refinancing or foreclosure, net of fees or costs which may be incurred. Some mortgage-related securities such as securities issued by the “GNMA” are described as “modified pass-through.” These securities entitle the holder to receive all interest and principal payments owed on the mortgage pool, net of certain fees, at the scheduled payment dates regardless of whether or not the mortgagor actually makes the payment.
The principal governmental guarantor of mortgage-related securities is GNMA. GNMA is a wholly owned US Government corporation within the Department of Housing and Urban Development. GNMA is authorized to guarantee, with the full faith and credit of the US Government, the timely payment of principal and interest on securities issued by institutions approved by GNMA (such as savings and loan institutions, commercial banks, and mortgage bankers) and backed by pools of FHA-insured or VA-guaranteed mortgages. These guarantees, however, do not apply to the market value or yield of mortgage-backed securities or to the value of Portfolio shares. Also, GNMA securities often are purchased at a premium over the maturity value of the underlying mortgages. This premium is not guaranteed and will be lost if prepayment occurs.
Government-related guarantors (i.e., not backed by the full faith and credit of the US Government) include Fannie Mae and the “FHLMC.” Fannie Mae is a government-sponsored corporation owned entirely by private stockholders. It is subject to general regulation by the Secretary of Housing and Urban Development. Fannie Mae purchases conventional (i.e., not insured or guaranteed by any governmental agency) mortgages from a list of approved seller/servicers which include state and federally chartered savings and loan associations, mutual savings banks, commercial banks, credit unions, and mortgage bankers. Pass-through securities issued by Fannie Mae are guaranteed as to timely payment of principal and interest by Fannie Mae but are not backed by the full faith and credit of the US Government.
FHLMC is a corporate instrumentality of the US Government and was created by Congress in 1970 for the purpose of increasing the availability of mortgage credit for residential housing. Its stock is owned by the twelve Federal Home Loan Banks. FHLMC issues Participation Certificates (“PCs”) which represent interests in conventional mortgages from FHLMC’s national portfolio. FHLMC guarantees the timely payment of interest and ultimate collection of principal, but PCs are not backed by the full faith and credit of the US Government.
27
Commercial banks, savings and loan institutions, private mortgage insurance companies, mortgage bankers, and other secondary market issuers also create pass-through pools of conventional mortgage loans. Such issuers may, in addition, be the originators and/or servicers of the underlying mortgage loans as well as the guarantors of the mortgage-related securities. Pools created by such non-governmental issuers generally offer a higher rate of interest than governmental and government-related pools because there are no direct or indirect government or agency guarantees of payments. However, timely payment of interest and principal of these pools may be supported by various forms of insurance or guarantees, including individual loan, title, pool and hazard insurance, and letters of credit. The insurance and guarantees are issued by governmental entities, private insurers, and the mortgage poolers. Such insurance and guarantees and the creditworthiness of the issuers thereof will be considered in determining whether a mortgage-related security meets the Portfolios’ investment quality standards. There can be no assurance that the private insurers or guarantors can meet their obligations under the insurance policies or guarantee arrangements. The Portfolios may buy mortgage-related securities without insurance or guarantees, if through an examination of the loan experience and practices of the originators/servicers and poolers, the Advisor determines that the securities meet the Portfolios’ quality standards. Although the market for such securities is becoming increasingly liquid, securities issued by certain private organizations may not be readily marketable.
Other Mortgage-Backed Securities. The Advisor expects that governmental, government-related, or private entities may create mortgage loan pools and other mortgage-related securities offering mortgage pass-through and mortgage-collateralized investments in addition to those described above. The mortgages underlying these securities may include alternative mortgage instruments, that is, mortgage instruments whose principal or interest payments may vary or whose terms to maturity may differ from customary long-term fixed rate mortgages. Bond Portfolio and Balanced Portfolio will not purchase mortgage-backed securities or any other assets which, in the opinion of the Advisor, are illiquid if, as a result, more than 15% of the value of the Portfolio’s net assets will be illiquid. As new types of mortgage-related securities are developed and offered to investors, the Advisor will, consistent with the Portfolio’s investment objectives, policies, and quality standards, consider making investments in such new types of mortgage-related securities.
Mortgage Dollar Rolls. The Bond Portfolio and Balanced Portfolio may enter into mortgage dollar rolls in which the Portfolio sells mortgage-backed securities for delivery in the current month and simultaneously contracts to repurchase similar, but not identical, securities on a fixed date. The Portfolio receives compensation as consideration for entering into the commitment to repurchase. The compensation is paid in the form of a fee which is recorded as deferred income and amortized to income over the roll period, or alternatively, a lower price for the security upon its repurchase. Mortgage dollar rolls may be renewed with a new sale and repurchase price and a cash settlement made at each renewal without physical delivery of the securities subject to the contract.
Municipal Obligations. Bond Portfolio and Balanced Portfolio may each invest in municipal obligations. Municipal obligations are issued by or on behalf of states, territories and possessions of the United States and their political subdivisions, agencies and instrumentalities and the District of Columbia to obtain funds for various public purposes. The interest on these obligations is generally exempt from federal income tax in the hands of most investors. The two principal classifications of municipal obligations are “notes” and “bonds.” Municipal notes are generally used to provide for short-term capital needs and generally have maturities of one year or less. Municipal notes include: Tax Anticipation Notes; Revenue Anticipation Notes; Bond Anticipation Notes; and Construction Loan Notes.
Tax Anticipation Notes are sold to finance working capital needs of municipalities. They are generally payable from specific tax revenues expected to be received at a future date. Revenue Anticipation Notes are issued in expectation of receipt of other types of revenue. Tax Anticipation Notes and Revenue Anticipation Notes are generally issued in anticipation of various seasonal revenue such as income, sales, use and business taxes. Bond Anticipation Notes are sold to provide interim financing and Construction Loan Notes are sold to provide construction financing. These notes are generally issued in anticipation of long-term financing in the market. In most cases, these monies provide for the repayment of the notes. After the projects are successfully completed and accepted, many projects receive permanent financing through the FHA under Fannie Mae or GNMA. There are, of course, a number of other types of notes issued for different purposes and secured differently than those described above.
Municipal bonds, which meet longer-term capital needs and generally have maturities of more than one year when issued, have two principal classifications: “general obligation” bonds and “revenue” bonds.
28
Issuers of general obligation bonds include states, counties, cities, towns and regional districts. The proceeds of these obligations are used to fund a wide range of public projects including the construction or improvement of schools, highways and roads, water and sewer systems and a variety of other public purposes. The basic security behind general obligation bonds is the issuer’s pledge of its full faith, credit, and taxing power for the payment of principal and interest. The taxes that can be levied for the payment of debt service may be limited or unlimited as to rate or amount or special assessments.
The principal security for a revenue bond is generally the net revenues derived from a particular facility or group of facilities or, in some cases, from the proceeds of a special excise or other specific revenue source. Revenue bonds have been issued to fund a wide variety of capital projects including: electric, gas, water and sewer systems; highways, bridges and tunnels; port and airport facilities; colleges and universities; and hospitals. Although the principal security behind these bonds varies widely, many provide additional security in the form of a debt service reserve fund whose monies may also be used to make principal and interest payments on the issuer’s obligations. Housing finance authorities have a wide range of security including partially or fully-insured, rent-subsidized and/or collateralized mortgages, and/or the net revenues from housing or other public projects. In addition to a debt service reserve fund, some authorities provide further security in the form of a state’s ability (without obligation) to make up deficiencies in the debt reserve fund. Lease rental bonds issued by a state or local authority for capital projects are secured by annual lease rental payments from the state or locality to the authority sufficient to cover debt service on the authority’s obligations.
Some issues of municipal bonds are payable from United States Treasury bonds and notes held in escrow by a trustee, frequently a commercial bank. The interest and principal on these US Government securities are sufficient to pay all interest and principal requirements of the municipal securities when due. Some escrowed Treasury securities are used to retire municipal bonds at their earliest call date, while others are used to retire municipal bonds at their maturity.
Securities purchased for a Portfolio may include variable/floating rate instruments, variable mode instruments, put bonds, and other obligations which have a specified maturity date but also are payable before maturity after notice by the holder (“demand obligations”). Demand obligations are considered for a Portfolio’s purposes to mature at the demand date.
There are, in addition, a variety of hybrid and special types of municipal obligations as well as numerous differences in the security of municipal obligations both within and between the two principal classifications (i.e., notes and bonds) discussed above.
An entire issue of municipal securities may be purchased by one or a small number of institutional investors such as a Portfolio. Thus, such an issue may not be said to be publicly offered. Unlike the equity securities of operating companies or mutual funds which must be registered under the Securities Act of 1933 prior to offer and sale unless an exemption from such registration is available, municipal securities, whether publicly or privately offered, may nevertheless be readily marketable. A secondary market exists for municipal securities which have been publicly offered as well as securities which have not been publicly offered initially but which may nevertheless be readily marketable. Municipal securities purchased for a Portfolio are subject to the limitations on holdings of securities which are not readily marketable based on whether it may be sold in a reasonable time consistent with the customs of the municipal markets (usually seven days) at a price (or interest rate) which accurately reflects its recorded value. A Portfolio believes that the quality standards applicable to their investments enhance marketability. In addition, stand-by commitments, participation interests and demand obligations also enhance marketability.
Provisions of the federal bankruptcy statutes relating to the adjustment of debts of political subdivisions and authorities of states of the United States provide that, in certain circumstances, such subdivisions or authorities may be authorized to initiate bankruptcy proceedings without prior notice to or consent of creditors, which proceedings could result in material and adverse modification or alteration of the rights of holders of obligations issued by such subdivisions or authorities.
Litigation challenging the validity under state constitutions of present systems of financing public education has been initiated or adjudicated in a number of states, and legislation has been introduced to effect changes in public school
29
finances in some states. In other instances there has been litigation challenging the issuance of pollution control revenue bonds or the validity of their issuance under state or federal law which litigation could ultimately affect the validity of those Municipal Securities or the tax-free nature of the interest thereon.
For the purpose of a Portfolio’s investment restrictions, the identification of the “issuer” of municipal obligations which are not general obligation bonds is made by the Advisor on the basis of the characteristics of the obligation as described above, the most significant of which is the source of funds for the payment of principal and interest on such obligations.
Bond Portfolio and Balanced Portfolio may each acquire municipal obligations when, due to disparities in the debt securities markets, the anticipated total return on such obligations is higher than that on taxable obligations. Bond Portfolio and Balanced Portfolio have no current intention of purchasing tax-exempt municipal obligations that would amount to greater than 5% of the Portfolio’s total assets.
Participation Interests. A Portfolio may purchase from financial institutions participation interests in securities in which a Portfolio may invest. A participation interest gives a Portfolio an undivided interest in the security in the proportion that a Portfolio’s participation interest bears to the principal amount of the security. These instruments may have fixed, floating or variable interest rates, with remaining maturities of 397 days or less. If the participation interest is unrated, or has been given a rating below that which is permissible for purchase by a Portfolio, the participation interest will be backed by an irrevocable letter of credit or guarantee of a bank, or the payment obligation otherwise will be collateralized by US Government securities, or, in the case of unrated participation interest, determined by the Advisor to be of comparable quality to those instruments in which a Portfolio may invest. For certain participation interests, a Portfolio will have the right to demand payment, on not more than seven days’ notice, for all or any part of a Portfolio’s participation interests in the security, plus accrued interest. As to these instruments, a Portfolio generally intends to exercise its right to demand payment only upon a default under the terms of the security.
Privatized Enterprises. Investments in foreign securities may include securities issued by enterprises that have undergone or are currently undergoing privatization. The governments of certain foreign countries have, to varying degrees, embarked on privatization programs contemplating the sale of all or part of their interests in state enterprises. A Portfolio’s investments in the securities of privatized enterprises may include privately negotiated investments in a government or state-owned or controlled company or enterprise that has not yet conducted an initial equity offering, investments in the initial offering of equity securities of a state enterprise or former state enterprise and investments in the securities of a state enterprise following its initial equity offering.
In certain jurisdictions, the ability of foreign entities, such as a Portfolio, to participate in privatizations may be limited by local law, or the price or terms on which a Portfolio may be able to participate may be less advantageous than for local investors. Moreover, there can be no assurance that governments that have embarked on privatization programs will continue to divest their ownership of state enterprises, that proposed privatizations will be successful or that governments will not re-nationalize enterprises that have been privatized.
In the case of the enterprises in which a Portfolio may invest, large blocks of the stock of those enterprises may be held by a small group of stockholders, even after the initial equity offerings by those enterprises. The sale of some portion or all of those blocks could have an adverse effect on the price of the stock of any such enterprise.
Prior to making an initial equity offering, most state enterprises or former state enterprises go through an internal reorganization of management. Such reorganizations are made in an attempt to better enable these enterprises to compete in the private sector. However, certain reorganizations could result in a management team that does not function as well as an enterprise’s prior management and may have a negative effect on such enterprise. In addition, the privatization of an enterprise by its government may occur over a number of years, with the government continuing to hold a controlling position in the enterprise even after the initial equity offering for the enterprise.
Prior to privatization, most of the state enterprises in which a Portfolio may invest enjoy the protection of and receive preferential treatment from the respective sovereigns that own or control them. After making an initial equity offering, these enterprises may no longer have such protection or receive such preferential treatment and may become subject to
30
market competition from which they were previously protected. Some of these enterprises may not be able to operate effectively in a competitive market and may suffer losses or experience bankruptcy due to such competition.
Options. The Fund may, on behalf of each of the Bond, Balanced, Capital Growth and International Portfolios, write covered call options on the portfolio securities of such Portfolio in an attempt to enhance investment performance. A call option is a contract generally having a duration of nine months or less which gives the purchaser of the option, in return for a premium paid, the right to buy, and the writer the obligation to sell, the underlying security at the exercise price at any time upon the assignment of an exercise notice prior to the expiration of the option, regardless of the market price of the security during the option period. A covered call option is an option written on a security which is owned by the writer throughout the option period. (See “Strategic Transactions and Derivatives.”)
The Fund will write, on behalf of a Portfolio, covered call options both to reduce the risks associated with certain of its investments and to increase total investment return. In return for the premium income, the Portfolio will give up the opportunity to profit from an increase in the market price of the underlying security above the exercise price so long as its obligations under the contract continue, except insofar as the premium represents a profit. Moreover, in writing the option, the Portfolio will retain the risk of loss should the price of the security decline, which loss the premium is intended to offset in whole or in part. Unlike the situation in which the Fund owns securities not subject to a call option, the Fund, in writing call options, must assume that the call may be exercised at any time prior to the expiration of its obligations as a writer, and that in such circumstances the net proceeds realized from the sale of the underlying securities pursuant to the call may be substantially below the prevailing market price. The Fund may forego the benefit of appreciation in its Portfolios on securities sold pursuant to call options.
When the Portfolio writes a covered call option, it gives the purchaser of the option the right to buy the underlying security at the price specified in the option (the “exercise price”) by exercising the option at any time during the option period, generally ranging up to nine months. Some of the options which the Fund writes may be of the European type which means they may be exercised only at a specified time. If the option expires unexercised, the Portfolio will realize income in an amount equal to the premium received for the written option. If the option is exercised, a decision over which the Portfolio has no control, the Portfolio must sell the underlying security to the option holder at the exercise price. By writing a covered call option, the Portfolio forgoes, in exchange for the premium less the commission (“net premium”), the opportunity to profit during the option period from an increase in the market value of the underlying security above the exercise price.
Balanced, Capital Growth and International Portfolios may each write covered call and put options to a limited extent in an attempt to earn additional income on their portfolios, consistent with their investment objectives. The Portfolios may forego the benefits of appreciation on securities sold or depreciation on securities acquired pursuant to call and put options written by the Portfolios. Each Portfolio has no current intention of writing options on more than 5% of its net assets.
When the Fund, on behalf of the Balanced, Capital Growth and International Portfolios, writes a put option, it gives the purchaser of the option the right to sell the underlying security to the Portfolio at the specified exercise price at any time during the option period. Some of the European type options which the Fund writes may be exercised only at a specified time. If the option expires unexercised, the Portfolio will realize income in the amount of the premium received for writing the option. If the put option is exercised, a decision over which the Portfolio has no control, the Portfolio must purchase the underlying security from the option holder at the exercise price. By writing a put option, the Portfolio, in exchange for the net premium received, accepts the risk of a decline in the market value of the underlying security below the exercise price. With respect to each put option it writes, the Portfolio will have deposited in a separate account with its custodian US Treasury obligations, high-grade debt securities or cash equal in value to the exercise price of the put option, will have purchased a put option with a higher exercise price that will expire no earlier than the put option written or will have used some combination of these two methods. The Fund on behalf of each Portfolio, will only write put options involving securities for which a determination is made that it wishes to acquire the securities at the exercise price at the time the option is written.
31
A Portfolio may terminate its obligation as a writer of a call or put option by purchasing an option with the same exercise price and expiration date as the option previously written. This transaction is called a “closing purchase transaction.”
When a Portfolio writes an option, an amount equal to the net premium received by the Portfolio is included in the liability section of the Portfolio Statement of Assets and Liabilities as a deferred credit. The amount of the deferred credit will be subsequently marked to market to reflect the current market value of the option written. The current market value of a traded option is the last sale price or, in the absence of a sale, the mean between the closing bid and asked price. If an option expires on its stipulated expiration date or if the Portfolio enters into a closing purchase transaction, the Portfolio will realize a gain (or loss if the cost of a closing purchase transaction exceeds the premium received when the option was sold), and the deferred credit related to such option will be eliminated. If a call option is exercised, the Portfolio will realize a gain or loss from the sale of the underlying security and the proceeds of the sale will be increased by the premium originally received. The writing of covered call options may be deemed to involve the pledge of the securities against which the option is being written. Securities against which call options are written will be segregated on the books of the custodian for the Portfolio.
A Portfolio may purchase call options on any securities in which it may invest in anticipation of an increase in the market value of such securities. The purchase of a call option would entitle the Portfolio, in exchange for the premium paid, to purchase a security at a specified price during the option period. The Portfolio would ordinarily have a gain if the value of the securities increased above the exercise price sufficiently to cover the premium and would have a loss if the value of the securities remained at or below the exercise price during the option period.
Balanced, Capital Growth and International Portfolios will normally purchase put options in anticipation of a decline in the market value of securities in their portfolios (“protective puts”) or securities of the type in which they are permitted to invest. The purchase of a put option would entitle the Portfolio, in exchange for the premium paid, to sell a security, which may or may not be held by the Portfolio, at a specified price during the option period. The purchase of protective puts is designed merely to offset or hedge against a decline in the market value of the Portfolio’s portfolio securities. Put options may also be purchased by the Portfolio for the purpose of affirmatively benefiting from a decline in the price of securities which the Portfolio does not own. The Portfolio would ordinarily recognize a gain if the value of the securities decreased below the exercise price sufficiently to cover the premium and would recognize a loss if the value of the securities remained at or above the exercise price. Gains and losses on the purchase of protective put options would tend to be offset by countervailing changes in the value of underlying portfolio securities.
The hours of trading for options on securities may not conform to the hours during which the underlying securities are traded. To the extent that the option markets close before the markets for the underlying securities, significant price and rate movements can take place in the underlying securities markets that cannot be reflected in the option markets. Exchange markets in securities options are a relatively new and untested concept. It is impossible to predict the volume of trading that may exist in such options, and there can be no assurance that viable exchange markets will develop or continue.
The Fund, on behalf of a Portfolio, may engage in over-the-counter options transactions with broker-dealers who make markets in these options. At present, approximately thirty broker-dealers make these markets and the Advisor will consider risk factors such as their creditworthiness when determining a broker-dealer with which to engage in options transactions. The ability to terminate over-the-counter option positions is more limited than with exchange-traded option positions because the predominant market is the issuing broker rather than an exchange, and may involve the risk that broker-dealers participating in such transactions will not fulfill their obligations. Written over-the-counter options purchased by the Fund and portfolio securities “covering” the Fund’s obligation pursuant to an over-the-counter option may be deemed to be illiquid and may not be readily marketable. The Advisor will monitor the creditworthiness of dealers with whom the Fund enters into such options transactions under the general supervision of the Fund’s Trustees.
Options on Futures. For bona fide hedging purposes, the Fund may also purchase and write, on behalf of each of the Bond, Balanced, Capital Growth and International Portfolios, call and put options on futures contracts, which are traded on exchanges that are licensed and regulated by the CFTC or on any foreign exchange for the purpose of options trading, to the extent permitted by law. A “call” option on a futures contract gives the purchaser the right, in return for
32
the premium paid, to purchase a futures contract (assume a “long” position) at a specified exercise price at any time before the option expires. A “put” option gives the purchaser the right, in return for the premium paid, to sell a futures contract (assume a “short” position), for a specified exercise price, at any time before the option expires. (See “Strategic Transactions and Derivatives.”)
Upon the exercise of a “call,” the writer of the option is obligated to sell the futures contract (to deliver a “long” position to the option holder) at the option exercise price, which will presumably be lower than the current market price of the contract in the futures market. Upon exercise of a “put,” the writer of the option is obligated to purchase the futures contract (deliver a “short” position to the option holder) at the option exercise price, which will presumably be higher than the current market price of the contract in the futures market. When a person exercises an option and assumes a long futures position, in the case of a “call,” or a short futures position, in the case of a “put,” his gain will be credited to his futures margin account, while the loss suffered by the writer of the option will be debited to his account. However, as with the trading of futures, most participants in the options markets do not seek to realize their gains or losses by exercise of their option rights. Instead, the holder of an option will usually realize a gain or loss by buying or selling an offsetting option at a market price that will reflect an increase or a decrease from the premium originally paid.
Options on futures can be used by a Portfolio to hedge substantially the same risks as might be addressed by the direct purchase or sale of the underlying futures contracts. If the Portfolio purchases an option on a futures contract, it may obtain benefits similar to those that would result if it held the futures position itself. But in contrast to a futures transaction, in which only transaction costs are involved, benefits received in an option transaction will be reduced by the amount of the premium paid as well as by transaction costs. In the event of an adverse market movement, however, the Portfolio will not be subject to a risk of loss on the option transaction beyond the price of the premium it paid plus its transaction costs, and may consequently benefit from a favorable movement in the value of its portfolio securities that would have been more completely offset if the hedge had been effected through the use of futures.
If a Portfolio writes options on futures contracts, the Portfolio will receive a premium but will assume a risk of adverse movement in the price of the underlying futures contract comparable to that involved in holding a futures position. If the option is not exercised, the Portfolio will gain the amount of the premium, which may partially offset unfavorable changes in the value of securities held in or to be acquired for the Portfolio. If the option is exercised, the Portfolio will incur a loss in the option transaction, which will be reduced by the amount of the premium it has received, but which may partially offset favorable changes in the value of its portfolio securities.
While the holder or writer of an option on a futures contract may normally terminate its position by selling or purchasing an offsetting option of the same series, the Portfolio’s ability to establish and close out options positions at fairly established prices will be subject to the maintenance of a liquid market. A Portfolio will not purchase or write options on futures contracts unless, in the Advisor’s opinion, the market for such options has sufficient liquidity that the risks associated with such options transactions are not at unacceptable levels.
Other Asset-Backed Securities. The securitization techniques used to develop mortgaged-backed securities are now being applied to a broad range of assets. Through the use of trusts and special purpose corporations, various types of assets, including automobile loans, computer leases and credit card receivables, are being securitized in pass-through structures similar to the mortgage pass-through structures or in a structure similar to the CMO structure. In general, the collateral supporting these securities is of shorter maturity than mortgage loans and is less likely to experience substantial prepayments with interest rate fluctuations.
Several types of asset-backed securities have already been offered to investors, including Certificates for Automobile Receivables(SM) (“CARS(SM)”). CARS(SM) represent undivided fractional interests in a trust whose assets consist of a pool of motor vehicle retail installment sales contracts and security interests in the vehicles securing the contracts. Payments of principal and interest on CARS(SM) are passed through monthly to certificate holders, and are guaranteed up to certain amounts and for a certain time period by a letter of credit issued by a financial institution unaffiliated with the trustee or originator of the trust. An investor’s return on CARS(SM) may be affected by early prepayment of principal on the underlying vehicle sales contracts. If the letter of credit is exhausted, the trust may be prevented from realizing the full amount due on a sales contract because of state law requirements and restrictions relating to foreclosure sales of vehicles
33
and the obtaining of deficiency judgments following such sales or because of depreciation, damage or loss of a vehicle, the application of federal and state bankruptcy and insolvency laws, or other factors. As a result, certificate holders may experience delays in payments or losses if the letter of credit is exhausted.
Asset-backed securities present certain risks that are not presented by mortgage-backed securities. Primarily, these securities may not have the benefit of any security interest in the related assets. Credit card receivables are generally unsecured and the debtors are entitled to the protection of a number of state and federal consumer credit laws, many of which give such debtors the right to set off certain amounts owed on the credit cards, thereby reducing the balance due. There is the possibility that recoveries on repossessed collateral may not, in some cases, be available to support payments on these securities.
Asset-backed securities are often backed by a pool of assets representing the obligations of a number of different parties. To lessen the effect of failures by obligors on underlying assets to make payments, the securities may contain elements of credit support which fall into two categories: (i) liquidity protection, and (ii) protection against losses resulting from ultimate default by an obligor on the underlying assets. Liquidity protection refers to the provision of advances, generally by the entity administering the pool of assets, to ensure that the receipt of payments on the underlying pool occurs in a timely fashion. Protection against losses results from payment of the insurance obligations on at least a portion of the assets in the pool. This protection may be provided through guarantees, policies or letters of credit obtained by the issuer or sponsor from third parties, through various means of structuring the transaction or through a combination of such approaches. Bond Portfolio and Balanced Portfolio will not pay any additional or separate fees for credit support. The degree of credit support provided for each issue is generally based on historical information respecting the level of credit risk associated with the underlying assets. Delinquency or loss in excess of that anticipated, or failure of the credit support could adversely affect the return on an investment in such a security.
Bond Portfolio and Balanced Portfolio may also invest in residual interests in asset-backed securities. In the case of asset-backed securities issued in a pass-through structure, the cash flow generated by the underlying assets is applied to make required payments on the securities and to pay related administrative expenses. The residual interest in an asset-backed security pass-through structure represents the interest in any excess cash flow remaining after making the foregoing payments. The amount of residual cash flow resulting from a particular issue of asset-backed securities will depend on, among other things, the characteristics of the underlying assets, the coupon rates on the securities, prevailing interest rates, the amount of administrative expenses and the actual prepayment experience on the underlying assets. Asset-backed security residuals not registered under the Securities Act of 1933 may be subject to certain restrictions on transferability. In addition, there may be no liquid market for such securities.
The availability of asset-backed securities may be affected by legislative or regulatory developments. It is possible that such developments may require Bond Portfolio and Balanced Portfolio to dispose of any then existing holdings of such securities.
Real Estate Investment Trusts (“REITs”). Bond Portfolio, Growth and Income Portfolio, Global Discovery Portfolio and Health Sciences Portfolio may each invest in REITs. REITs are sometimes informally categorized as equity REITs, mortgage REITs and hybrid REITs. Investment in REITs may subject a Portfolio to risks associated with the direct ownership of real estate, such as decreases in real estate values, overbuilding, increased competition and other risks related to local or general economic conditions, increases in operating costs and property taxes, changes in zoning laws, casualty or condemnation losses, possible environmental liabilities, regulatory limitations on rent and fluctuations in rental income. Equity REITs generally experience these risks directly through fee or leasehold interests, whereas mortgage REITs generally experience these risks indirectly through mortgage interests, unless the mortgage REIT forecloses on the underlying real estate. Equity REITs may also realize capital gains by selling properties that have appreciated in value. Changes in interest rates may also affect the value of a Portfolio’s investment in REITs. For instance, during periods of declining interest rates, certain mortgage REITs may hold mortgages that the mortgagors elect to prepay, which prepayment may diminish the yield on securities issued by those REITs.
Certain REITs have relatively small market capitalizations, which may tend to increase the volatility of the market prices of their securities. Furthermore, REITs are dependent upon specialized management skills, have limited diversification and are, therefore, subject to risks inherent in operating and financing a limited number of projects. REITs are also
34
subject to heavy cash flow dependency, defaults by borrowers and the possibility of failing to qualify for tax-free pass-through of income under the Internal Revenue Code of 1986, as amended, and to maintain exemption from the registration requirements of the Investment Company Act of 1940, as amended. By investing in REITs indirectly through a Portfolio, a shareholder will bear not only his or her proportionate share of the expenses of a Portfolio, but also, indirectly, similar expenses of the REITs. In addition, REITs depend generally on their ability to generate cash flow to make distributions to shareholders.
Repurchase Agreements. On behalf of a Portfolio, the Fund may invest in repurchase agreements pursuant to its investment guidelines. In a repurchase agreement, the Fund acquires ownership of a security and simultaneously commits to resell that security to the seller, typically a bank or broker/dealer.
A repurchase agreement provides a means for a Portfolio to earn income on funds for periods as short as overnight. It is an arrangement under which the purchaser (i.e., the Portfolio) acquires a security (“Obligation”) and the seller agrees, at the time of sale, to repurchase the Obligation at a specified time and price. Securities subject to a repurchase agreement are held in a segregated account and, as described in more detail below, the value of such securities is kept at least equal to the repurchase price on a daily basis. The repurchase price may be higher than the purchase price, the difference being income to a Portfolio, or the purchase and repurchase prices may be the same, with interest at a stated rate due to a Portfolio together with the repurchase price upon repurchase. In either case, the income to a Portfolio is unrelated to the interest rate on the Obligation itself. Obligations will be held by the custodian or in the Federal Reserve Book Entry system.
It is not clear whether a court would consider the Obligation purchased by a Portfolio subject to a repurchase agreement as being owned by a Portfolio or as being collateral for a loan by a Portfolio to the seller. In the event of the commencement of bankruptcy or insolvency proceedings with respect to the seller of the Obligation before repurchase of the Obligation under a repurchase agreement, a Portfolio may encounter delay and incur costs before being able to sell the security. Delays may involve loss of interest or decline in price of the Obligation. If the court characterizes the transaction as a loan and a Portfolio has not perfected a security interest in the Obligation, a Portfolio may be required to return the Obligation to the seller’s estate and be treated as an unsecured creditor of the seller. As an unsecured creditor, a Portfolio would be at risk of losing some or all of the principal and income involved in the transaction. As with any unsecured debt Obligation purchased for the Portfolio, the Fund seeks to reduce the risk of loss through repurchase agreements by analyzing the creditworthiness of the obligor, in this case the seller of the Obligation. Apart from the risk of bankruptcy or insolvency proceedings, there is also the risk that the seller may fail to repurchase the Obligation, in which case a Portfolio may incur a loss if the proceeds to a Portfolio of the sale to a third party are less than the repurchase price. However, if the market value (including interest) of the Obligation subject to the repurchase agreement becomes less than the repurchase price (including interest), a Portfolio will direct the seller of the Obligation to deliver additional securities so that the market value (including interest) of all securities subject to the repurchase agreement will equal or exceed the repurchase price.
Reverse Repurchase Agreements. Each Portfolio may enter into “reverse repurchase agreements,” which are repurchase agreements in which a Portfolio, as the seller of the securities, agrees to repurchase such securities at an agreed upon time and price. The Portfolio maintains a segregated account in connection with outstanding reverse repurchase agreements. Each Portfolio will enter into reverse repurchase agreements only when the Advisor believes that the interest income to be earned from the investment of the proceeds of the transaction will be greater than the interest expense of the transaction. Such transactions may increase fluctuations in the market value of Portfolio assets and its yield.
Section 4(2) Paper. Subject to its investment objectives and policies, the Fund, on behalf of the Money Market Portfolio, may invest in commercial paper issued by major corporations under the Securities Act of 1933 in reliance on the exemption from registration afforded by Section 3(a)(3) thereof. Such commercial paper may be issued only to finance current transactions and must mature in nine months or less. Trading of such commercial paper is conducted primarily by institutional investors through investment dealers, and individual investor participation in the commercial paper market is very limited. The Fund also may invest in commercial paper issued in reliance on the so-called “private placement” exemption from registration afforded by Section 4(2) of the Securities Act of 1933 (“Section 4(2) paper”). Section 4(2) paper is restricted as to disposition under the federal securities laws, and generally is sold to institutional
35
investors such as the Fund who agree that they are purchasing the paper for investment and not with a view to public distribution. Any resale by the purchaser must be in an exempt transaction. Section 4(2) paper normally is resold to other institutional investors like the Fund through or with the assistance of the issuer or investment dealers who make a market in the Section 4(2) paper, thus providing liquidity. The Advisor considers the legally restricted but readily saleable Section 4(2) paper to be liquid; however, pursuant to procedures approved by the Fund’s Board, if a particular investment in Section 4(2) paper is not determined to be liquid, that investment will be included within the limitation of the Fund on illiquid securities. The Advisor monitors the liquidity of its investments in Section 4(2) paper on a continuing basis.
Securities Backed by Guarantees. On behalf of the Money Market Portfolio, the Fund may invest in securities backed by guarantees from banks, insurance companies and other financial institutions. A money market fund’s ability to maintain a stable share price may depend upon such guarantees, which are not supported by federal deposit insurance. Consequently, changes in the credit quality of these institutions could have an adverse impact on securities they have guaranteed or backed, which could cause losses to a Fund and affect its share price.
Securities Index Options. Bond Portfolio, Balanced Portfolio, Capital Growth Portfolio and International Portfolio may each purchase call and put options on securities indexes for the purpose of hedging against the risk of unfavorable price movements adversely affecting the value of a Portfolio’s securities. Options on securities indexes are similar to options on stock except that the settlement is made in cash. (See “Strategic Transactions and Derivatives”.)
Unlike a securities option, which gives the holder the right to purchase or sell a specified security at a specified price, an option on a securities index gives the holder the right to receive a cash “exercise settlement amount” equal to (i) the difference between the exercise price of the option and the value of the underlying securities index on the exercise date, multiplied by (ii) a fixed “index multiplier.” In exchange for undertaking the obligation to make such cash payment, the writer of the securities index option receives a premium.
A securities index fluctuates with changes in the market values of the securities so included. Some securities index options are based on a broad market index such as the S&P 500 or the NYSE Composite Index, or a narrower market index such as the S&P 100. Indices are also based on an industry or market segment such as the AMEX Oil and Gas Index or the Computer and Business Equipment Index. Options on securities indexes are currently traded on exchanges including the Chicago Board Options Exchange, Philadelphia Exchange, New York Stock Exchange, and American Stock Exchange.
The effectiveness of hedging through the purchase of securities index options will depend upon the extent to which price movements in the portion of the securities portfolio being hedged correlate with price movements in the selected securities index. Perfect correlation is not possible because the securities holdings of a Portfolio will not exactly match the composition of the securities indexes on which options are written. In addition, the purchase of securities index options involves essentially the same risks as the purchase of options on futures contracts. The principal risk is that the premium and transactions costs paid by a Portfolio in purchasing an option will be lost as a result of unanticipated movements in prices of the securities comprising the securities index on which the option is written. Options on securities indexes also entail the risk that a liquid secondary market to close out the option will not exist, although a Portfolio will generally only purchase or write such an option if the Advisor believes the option can be closed out.
Securities with Put Rights. On behalf of the Money Market Portfolio, the Fund may enter into put transactions with respect to obligations held in its portfolio with broker/dealers pursuant to a rule under the 1940 Act and with commercial banks.
The right of the Portfolio to exercise a put is unconditional and unqualified. A put is not transferable by the Portfolios, although the Portfolio may sell the underlying securities to a third party at any time. If necessary and advisable, the Portfolio may pay for certain puts either separately in cash or by paying a higher price for portfolio securities that are acquired subject to such a put (thus reducing the yield to maturity otherwise available for the same securities). The Portfolio expects, however, that puts generally will be available without the payment of any direct or indirect consideration.
36
The Portfolio may enter into puts only with banks or broker/dealers that, in the opinion of the Advisor, present minimal credit risks. The ability of the Portfolio to exercise a put will depend on the ability of the bank or broker/dealer to pay for the underlying securities at the time the put is exercised. In the event that a bank or broker/dealer should default on its obligation to repurchase an underlying security, the Portfolio might be unable to recover all or a portion of any loss sustained from having to sell the security elsewhere.
The Portfolio intends to enter into puts solely to maintain liquidity and does not intend to exercise its rights thereunder for trading purposes. The puts will only be for periods of substantially less than the life of the underlying security. The acquisition of a put will not affect the valuation by the Portfolio of the underlying security. The actual put will be valued at zero in determining net asset value of the Portfolio. Where the Portfolio pays directly or indirectly for a put, its cost will be reflected in realized gain or loss when the put is exercised or expires. If the value of the underlying security increases, the potential for unrealized or realized gain is reduced by the cost of the put. The maturity of an obligation purchased by the Portfolio will not be considered shortened by any put to which such obligation is subject.
Short Sales Against the Box. Health Sciences Portfolio may make short sales of common stocks if, at all times when a short position is open, the Portfolio owns the stock or owns preferred stocks or debt securities convertible or exchangeable, without payment of further consideration, into the shares of common stock sold short. Short sales of this kind are referred to as short sales “against the box.” The portfolio will incur a loss as a result of the short sale if the price of the security increases between the dates of the short sale and the date on which the Portfolio replaces the borrowed security. The broker/dealer that executes a short sale generally invests cash proceeds of the sale until they are paid to the Portfolio. Arrangements may be made with the broker/dealer to obtain a portion of the interest earned by the broker on the investment of short sale proceeds. The Portfolio will segregate the common stock or convertible or exchangeable preferred stock or debt securities in a special account with the custodian. The Portfolio will incur transaction costs, including interest expenses in connection with opening, maintaining, and closing short sales against the box. Uncertainty regarding the tax effects of short sales of appreciated investments may limit the extent to which the Portfolio may enter into short sales against the box.
Small Company Risk. The Advisor believes that many small companies often have sales and earnings growth rates which exceed those of larger companies, and that such growth rates may in turn be reflected in more rapid share price appreciation over time. However, investing in smaller company stocks involves greater risk than is customarily associated with investing in larger, more established companies. For example, smaller companies can have limited product lines, markets, or financial and managerial resources. Smaller companies may also be dependent on one or a few key persons, and may be more susceptible to losses and risks of bankruptcy. Also, the securities of smaller companies may be thinly traded (and therefore have to be sold at a discount from current market prices or sold in small lots over an extended period of time). Transaction costs in smaller company stocks may be higher than those of larger companies.
Sovereign Debt. Investment in sovereign debt can involve a high degree of risk. The governmental entity that controls the repayment of sovereign debt may not be able or willing to repay the principal and/or interest when due in accordance with the terms of such debt. A governmental entity’s willingness or ability to repay principal and interest due in a timely manner may be affected by, among other factors, its cash flow situation, the extent of its foreign reserves, the availability of sufficient foreign exchange on the date a payment is due, the relative size of the debt service burden to the economy as a whole, the governmental entity’s policy toward the International Monetary Fund, and the political constraints to which a governmental entity may be subject. Governmental entities may also be dependent on expected disbursements from foreign governments, multilateral agencies and others abroad to reduce principal and interest arrearages on their debt. The commitment on the part of these governments, agencies and others to make such disbursements may be conditioned on a governmental entity’s implementation of economic reforms and/or economic performance and the timely service of such debtor’s obligations. Failure to implement such reforms, achieve such levels of economic performance or repay principal or interest when due may result in the cancellation of such third parties commitments to lend funds to the governmental entity, which may further impair such debtor’s ability or willingness to service its debts in a timely manner. Consequently, governmental entities may default on their sovereign debt. Holders of sovereign debt may be requested to participate in the rescheduling of such debt and to extend further loans to governmental entities. There is no bankruptcy proceeding by which sovereign debt on which governmental entities have defaulted may be collected in whole or in part.
37
Stock Index Futures. A stock index futures contract does not require the physical delivery of securities, but merely provides for profits and losses resulting from changes in the market value of the contract to be credited or debited at the close of each trading day to the respective accounts of the parties to the contract. On the contract’s expiration date a final cash settlement occurs and the futures positions are simply closed out. Changes in the market value of a particular stock index futures contract reflect changes in the specified index of equity securities on which the future is based. That index is designed to reflect overall price trends in the market for equity securities.
Stock index futures may be used to hedge the equity securities of each of Balanced, Growth and Income, Capital Growth or International Portfolios with regard to market (systematic) risk (involving the market’s assessment of overall economic prospects), as distinguished from stock-specific risk (involving the market’s evaluation of the merits of the issuer of a particular security). By establishing an appropriate “short” position in stock index futures, the Fund may seek to protect the value of the equity of a Portfolio’s securities against an overall decline in the market for equity securities. Alternatively, in anticipation of a generally rising market, the Fund can seek on behalf of a Portfolio to avoid losing the benefit of apparently low current prices by establishing a “long” position in stock index futures and later liquidating that position as particular equity securities are in fact acquired. To the extent that these hedging strategies are successful, the Portfolio will be affected to a lesser degree by adverse overall market price movements, unrelated to the merits of specific portfolio equity securities, than would otherwise be the case. (See “Strategic Transactions and Derivatives”.)
Stripped Zero Coupon Securities. Zero coupon securities include securities issued directly by the US Treasury, and US Treasury bonds or notes and their unmatured interest coupons and receipts for their underlying principal (“coupons”) which have been separated by their holder, typically a custodian bank or investment brokerage firm. A holder will separate the interest coupons from the underlying principal (the “corpus”) of the US Treasury security. A number of securities firms and banks have stripped the interest coupons and receipts and then resold them in custodial receipt programs with a number of different names, including “Treasury Income Growth Receipts” (“TIGRS(TM)”) and Certificate of Accrual on Treasuries (“CATS(TM)”). The underlying US Treasury bonds and notes themselves are held in book-entry form at the Federal Reserve Bank or, in the case of bearer securities (i.e., unregistered securities which are owned ostensibly by the bearer or holder thereof), in trust on behalf of the owners thereof. The Treasury has facilitated transfers of ownership of zero coupon securities by accounting separately for the beneficial ownership of particular interest coupons and corpus payments on Treasury securities through the Federal Reserve book-entry record-keeping system. The Federal Reserve program as established by the Treasury Department is known as “STRIPS” or “Separate Trading of Registered Interest and Principal of Securities.” Under the STRIPS program, the Portfolio will be able to have its beneficial ownership of zero coupon securities recorded directly in the book-entry record-keeping system in lieu of having to hold certificates or other evidences of ownership of the underlying US Treasury securities.
When US Treasury obligations have been stripped of their unmatured interest coupons by the holder, the principal or corpus is sold at a deep discount because the buyer receives only the right to receive a future fixed payment on the security and does not receive any rights to periodic interest (i.e. cash) payments. Once stripped or separated, the corpus and coupons may be sold separately. Typically, the coupons are sold separately or grouped with other coupons with like maturity dates and sold in such bundled form. Purchasers of stripped obligations acquire, in effect, discount obligations that are economically identical to the zero coupon securities that the Treasury sells itself.
Third Party Puts. On behalf of the Money Market Portfolio, the Fund may purchase long-term fixed rate bonds that have been coupled with an option granted by a third party financial institution allowing a fund at specified intervals (not exceeding 397 calendar days) to tender (or “put”) the bonds to the institution and receive the face value thereof (plus accrued interest). These third party puts are available in several different forms, may be represented by custodial receipts or trust certificates and may be combined with other features such as interest rate swaps. A fund receives a short-term rate of interest (which is periodically reset), and the interest rate differential between that rate and the fixed rate on the bond is retained by the financial institution. The financial institution granting the option does not provide credit enhancement, and in the event that there is a default in the payment of principal or interest, or downgrading of a bond or a loss of the bond’s tax-exempt status, the put option will terminate automatically, the risk to a Portfolio will be that of holding such a long-term bond and the weighted average maturity of a fund’s portfolio would be adversely affected.
These bonds coupled with puts may present the same tax issues as are associated with Stand-By Commitments. As with any Stand-By Commitments acquired by a Portfolio, a fund intends to take the position that it is the owner of any
38
municipal obligation acquired subject to a third-party put, and that tax-exempt interest earned with respect to such municipal obligations will be tax-exempt in its hands. There is no assurance that the Internal Revenue Service will agree with such position in any particular case. Additionally, the federal income tax treatment of certain other aspects of these investments, including the treatment of tender fees and swap payments, in relation to various regulated investment company tax provisions is unclear. However, the Advisor seeks to manage a fund’s portfolio in a manner designed to minimize any adverse impact from these investments.
Supranational Entities. Supranational entities are international organizations designated or supported by governmental entities to promote economic reconstruction or development and international banking institutions and related government agencies. Examples include the International Bank for Reconstruction and Development (the World Bank), the European Coal and Steel Community, The Asian Development Bank and the InterAmerican Development Bank. Obligations of supranational entities are backed by the guarantee of one or more foreign governmental parties which sponsor the entity.
Trust Preferred Securities. Bond Portfolio and Balanced Portfolio may each invest in Trust Preferred Securities, which are hybrid instruments issued by a special purpose trust (the “Special Trust”), the entire equity interest of which is owned by a single issuer. The proceeds of the issuance to the Portfolios of Trust Preferred Securities are typically used to purchase a junior subordinated debenture, and distributions from the Special Trust are funded by the payments of principal and interest on the subordinated debenture.
If payments on the underlying junior subordinated debentures held by the Special Trust are deferred by the debenture issuer, the debentures would be treated as original issue discount (“OID”) obligations for the remainder of their term. As a result, holders of Trust Preferred Securities, such as the Portfolios, would be required to accrue daily for Federal income tax purposes, their share of the stated interest and the de minimis OID on the debentures (regardless of whether a Portfolio receives any cash distributions from the Special Trust), and the value of Trust Preferred Securities would likely be negatively affected. Interest payments on the underlying junior subordinated debentures typically may only be deferred if dividends are suspended on both common and preferred stock of the issuer. The underlying junior subordinated debentures generally rank slightly higher in terms of payment priority than both common and preferred securities of the issuer, but rank below other subordinated debentures and debt securities. Trust Preferred Securities may be subject to mandatory prepayment under certain circumstances. The market values of Trust Preferred Securities may be more volatile than those of conventional debt securities. Trust Preferred Securities may be issued in reliance on Rule 144A under the Securities Act of 1933, as amended, and, unless and until registered, are restricted securities; there can be no assurance as to the liquidity of Trust Preferred Securities and the ability of holders of Trust Preferred Securities, such as the Portfolios, to sell their holdings.
US Government Securities. There are two broad categories of US Government-related debt instruments: (a) direct obligations of the US Treasury, and (b) securities issued or guaranteed by US Government agencies.
Examples of direct obligations of the US Treasury are Treasury Bills, Notes, Bonds and other debt securities issued by the US Treasury. These instruments are backed by the “full faith and credit” of the United States. They differ primarily in interest rates, the length of maturities and the dates of issuance. Treasury bills have original maturities of one year or less. Treasury notes have original maturities of one to ten years and Treasury bonds generally have original maturities of greater than ten years.
Some agency securities are backed by the full faith and credit of the United States (such as Maritime Administration Title XI Ship Financing Bonds and Agency for International Development Housing Guarantee Program Bonds) and others are backed only by the rights of the issuer to borrow from the US Treasury (such as Federal Home Loan Bank Bonds and Federal National Mortgage Association Bonds), while still others, such as the securities of the Federal Farm Credit Bank, are supported only by the credit of the issuer. With respect to securities supported only by the credit of the issuing agency or by an additional line of credit with the US Treasury, there is no guarantee that the US Government will provide support to such agencies and such securities may involve risk of loss of principal and interest.
39
US Government Securities may include “zero coupon” securities that have been stripped by the US Government of their unmatured interest coupons and collateralized obligations issued or guaranteed by a US Government agency or instrumentality.
Interest rates on US Government obligations may be fixed or variable. Interest rates on variable rate obligations are adjusted at regular intervals, at least annually, according to a formula reflecting then current specified standard rates, such as 91-day US Treasury bill rates. These adjustments generally tend to reduce fluctuations in the market value of the securities.
The government guarantee of the US Government Securities in a Portfolio’s portfolio does not guarantee the net asset value of the shares of a fund. There are market risks inherent in all investments in securities and the value of an investment in a fund will fluctuate over time. Normally, the value of investments in US Government Securities varies inversely with changes in interest rates. For example, as interest rates rise the value of investments in US Government Securities will tend to decline, and as interest rates fall the value of a fund’s investments will tend to increase. In addition, the potential for appreciation in the event of a decline in interest rates may be limited or negated by increased principal prepayments with respect to certain Mortgage-Backed Securities, such as GNMA Certificates. Prepayments of high interest rate Mortgage-Backed Securities during times of declining interest rates will tend to lower the return of a fund and may even result in losses to a fund if some securities were acquired at a premium. Moreover, during periods of rising interest rates, prepayments of Mortgage-Backed Securities may decline, resulting in the extension of a Portfolio’s average portfolio maturity. As a result, a Portfolio’s portfolio may experience greater volatility during periods of rising interest rates than under normal market conditions.
Variable Rate Securities. On behalf of the Money Market Portfolio, the Portfolio may invest in Variable Rate Securities, instruments having rates of interest that are adjusted periodically or that “float” continuously according to formulae intended to minimize fluctuation in values of the instruments. The interest rate of Variable Rate Securities ordinarily is determined by reference to or is a percentage of an objective standard such as a bank’s prime rate, the 90-day US Treasury Bill rate, or the rate of return on commercial paper or bank certificates of deposit. Generally, the changes in the interest rate on Variable Rate Securities reduce the fluctuation in the market value of such securities. Accordingly, as interest rates decrease or increase, the potential for capital appreciation or depreciation is less than for fixed-rate obligations. Some Variable Rate Demand Securities (“Variable Rate Demand Securities”) have a demand feature entitling the purchaser to resell the securities at an amount approximately equal to amortized cost or the principal amount thereof plus accrued interest. As is the case for other Variable Rate Securities, the interest rate on Variable Rate Demand Securities varies according to some objective standard intended to minimize fluctuation in the values of the instruments. The Portfolio determines the maturity of Variable Rate Securities in accordance with Rule 2a-7, which allows the Portfolio to consider certain of such instruments as having maturities shorter than the maturity date on the face of the instrument.
Warrants. Each Portfolio (except Money Market Portfolio) may invest in warrants up to 5% of the value of its total assets. The holder of a warrant has the right, until the warrant expires, to purchase a given number of shares of a particular issuer at a specified price. Such investments can provide a greater potential for profit or loss than an equivalent investment in the underlying security. Prices of warrants do not necessarily move, however, in tandem with the prices of the underlying securities and are, therefore, considered speculative investments. Warrants pay no dividends and confer no rights other than a purchase option. Thus, if a warrant held by a Portfolio were not exercised by the date of its expiration, the Portfolio would lose the entire purchase price of the warrant.
When-Issued Securities. A Portfolio may from time to time purchase securities on a “when-issued” or “forward delivery” basis. Debt securities are often issued on this basis. The price of such securities, which may be expressed in yield terms, is generally fixed at the time a commitment to purchase is made, but delivery and payment for the when-issued or forward delivery securities take place at a later date. During the period between purchase and settlement, no payment is made by the Portfolio and no interest accrues to the Portfolio. When a Portfolio purchases such securities, it immediately assumes the risks of ownership, including the risk of price fluctuation. Failure to deliver a security purchased on this basis may result in a loss or missed opportunity to make an alternative investment.
40
To the extent that assets of a Portfolio are held in cash pending the settlement of a purchase of securities, that Portfolio would earn no income. While such securities may be sold prior to the settlement date, a Portfolio intends to purchase them with the purpose of actually acquiring them unless a sale appears desirable for investment reasons. At the time a Portfolio makes the commitment to purchase a security on this basis, it will record the transaction and reflect the value of the security in determining its net asset value. The market value of the securities may be more or less than the purchase price. A Portfolio will establish a segregated account in which it will maintain cash and liquid securities equal in value to commitments for such securities.
Zero Coupon Securities. Bond, Balanced, Growth and Income, Capital Growth and Global Discovery Portfolios may each invest in zero coupon securities which pay no cash income and are sold at substantial discounts from their value at maturity. When held to maturity, their entire income, which consists of accretion of discount, comes from the difference between the issue price and their value at maturity. The effect of owning instruments which do not make current interest payments is that a fixed yield is earned not only on the original investment but also, in effect, on all discount accretion during the life of the obligation. This implicit reinvestment of earnings at the same rate eliminates the risk of being unable to reinvest distributions at a rate as high as the implicit yield on the zero coupon bond, but at the same time eliminates any opportunity to reinvest earnings at higher rates. For this reason, zero coupon bonds are subject to substantially greater price fluctuations during periods of changing market interest rates than those of comparable securities that pay interest currently, which fluctuation is greater as the period to maturity is longer. Zero coupon securities which are convertible into common stock offer the opportunity for capital appreciation (or depreciation) as increases (or decreases) in market value of such securities closely follow the movements in the market value of the underlying common stock. Zero coupon convertible securities generally are expected to be less volatile than the underlying common stocks, as they usually are issued with maturities of 15 years or less and are issued with options and/or redemption features exercisable by the holder of the obligation entitling the holder to redeem the obligation and receive a defined cash payment.
Strategic Transactions and Derivatives. Applicable to Bond, Growth and Income, 21st Century Growth, Global Discovery and Health Sciences Portfolios.
Bond Portfolio, Growth and Income Portfolio, 21st Century Growth Portfolio, Global Discovery Portfolio and Health Sciences Portfolio may, but are not required to, utilize various other investment strategies as described below for a variety of purposes, such as hedging various market risks, managing the effective maturity or duration of fixed-income securities in the Fund’s portfolio, or enhancing potential gain. These strategies may be executed through the use of derivative contracts.
In the course of pursuing these investment strategies, Bond, Growth and Income Portfolio, 21st Century Growth Portfolio, Global Discovery Portfolio and Health Sciences Portfolio may purchase and sell exchange-listed and over-the-counter put and call options on securities, equity and fixed-income indices and other instruments, purchase and sell futures contracts and options thereon, enter into various transactions such as swaps, caps, floors, collars, currency forward contracts, currency futures contracts, currency swaps or options on currencies, or currency futures and various other currency transactions (collectively, all the above are called “Strategic Transactions”). In addition, strategic transactions may also include new techniques, instruments or strategies that are permitted as regulatory changes occur. Strategic Transactions may be used without limit (subject to certain limitations imposed by the 1940 Act) to attempt to protect against possible changes in the market value of securities held in or to be purchased for a Portfolio’s portfolio resulting from securities markets or currency exchange rate fluctuations, to protect a Portfolio’s unrealized gains in the value of its portfolio securities, to facilitate the sale of such securities for investment purposes, to manage the effective maturity or duration of fixed-income securities in a Portfolio’s portfolio, or to establish a position in the derivatives markets as a substitute for purchasing or selling particular securities. Some Strategic Transactions may also be used to enhance potential gain although no more than 5% of the Portfolio’s assets (10% for Bond Portfolio) will be committed to Strategic Transactions entered into for non-hedging purposes. Any or all of these investment techniques may be used at any time and in any combination, and there is no particular strategy that dictates the use of one technique rather than another, as use of any Strategic Transaction is a function of numerous variables including market conditions. The ability of a Portfolio to utilize these Strategic Transactions successfully will depend on the Advisor’s ability to predict pertinent market movements, which cannot be assured. Each Portfolio will comply with applicable regulatory requirements when implementing these strategies, techniques and instruments. Strategic Transactions will not be used to alter fundamental
41
investment purposes and characteristics of a Portfolio, and a Portfolio will segregate assets (or as provided by applicable regulations, enter into certain offsetting positions) to cover its obligations under options, futures and swaps to limit leveraging of the Portfolio.
Strategic Transactions, including derivative contracts, have risks associated with them including possible default by the other party to the transaction, illiquidity and, to the extent the Advisor’s view as to certain market movements is incorrect, the risk that the use of such Strategic Transactions could result in losses greater than if they had not been used. Use of put and call options may result in losses to a Portfolio, force the sale or purchase of portfolio securities at inopportune times or for prices higher than (in the case of put options) or lower than (in the case of call options) current market values, limit the amount of appreciation a Portfolio can realize on its investments or cause a Portfolio to hold a security it might otherwise sell. The use of currency transactions can result in a Portfolio incurring losses as a result of a number of factors including the imposition of exchange controls, suspension of settlements, or the inability to deliver or receive a specified currency. The use of options and futures transactions entails certain other risks. In particular, the variable degree of correlation between price movements of futures contracts and price movements in the related portfolio position of a Portfolio creates the possibility that losses on the hedging instrument may be greater than gains in the value of a Portfolio’s position. In addition, futures and options markets may not be liquid in all circumstances and certain over-the-counter options may have no markets. As a result, in certain markets, a Portfolio might not be able to close out a transaction without incurring substantial losses, if at all. Although the use of futures and options transactions for hedging should tend to minimize the risk of loss due to a decline in the value of the hedged position, at the same time they tend to limit any potential gain which might result from an increase in value of such position. Finally, the daily variation margin requirements for futures contracts would create a greater ongoing potential financial risk than would purchases of options, where the exposure is limited to the cost of the initial premium. Losses resulting from the use of Strategic Transactions would reduce net asset value, and possibly income, and such losses can be greater than if the Strategic Transactions had not been utilized.
General Characteristics of Options. Put options and call options typically have similar structural characteristics and operational mechanics regardless of the underlying instrument on which they are purchased or sold. Thus, the following general discussion relates to each of the particular types of options discussed in greater detail below. In addition, many Strategic Transactions involving options require segregation of a Portfolio’s assets in special accounts, as described below under “Use of Segregated and Other Special Accounts.”
A put option gives the purchaser of the option, upon payment of a premium, the right to sell, and the writer the obligation to buy, the underlying security, commodity, index, currency or other instrument at the exercise price. For instance, a Portfolio’s purchase of a put option on a security might be designed to protect its holdings in the underlying instrument (or, in some cases, a similar instrument) against a substantial decline in the market value by giving a Portfolio the right to sell such instrument at the option exercise price. A call option, upon payment of a premium, gives the purchaser of the option the right to buy, and the seller the obligation to sell, the underlying instrument at the exercise price. Each Portfolio’s purchase of a call option on a security, financial future, index, currency or other instrument might be intended to protect a Portfolio against an increase in the price of the underlying instrument that it intends to purchase in the future by fixing the price at which it may purchase such instrument. An American style put or call option may be exercised at any time during the option period while a European style put or call option may be exercised only upon expiration or during a fixed period prior thereto. Each Portfolio is authorized to purchase and sell exchange listed options and over-the-counter options (“OTC options”). Exchange listed options are issued by a regulated intermediary such as the Options Clearing Corporation (“OCC”), which guarantees the performance of the obligations of the parties to such options. The discussion below uses the OCC as an example, but is also applicable to other financial intermediaries.
With certain exceptions, OCC issued and exchange listed options generally settle by physical delivery of the underlying security or currency, although in the future cash settlement may become available. Index options and Eurodollar instruments are cash settled for the net amount, if any, by which the option is “in-the-money” (i.e., where the value of the underlying instrument exceeds, in the case of a call option, or is less than, in the case of a put option, the exercise price of the option) at the time the option is exercised. Frequently, rather than taking or making delivery of the underlying instrument through the process of exercising the option, listed options are closed by entering into offsetting purchase or sale transactions that do not result in ownership of the new option.
42
Each Portfolio’s ability to close out its position as a purchaser or seller of an OCC or exchange listed put or call option is dependent, in part, upon the liquidity of the option market. Among the possible reasons for the absence of a liquid option market on an exchange are: (i) insufficient trading interest in certain options; (ii) restrictions on transactions imposed by an exchange; (iii) trading halts, suspensions or other restrictions imposed with respect to particular classes or series of options or underlying securities including reaching daily price limits; (iv) interruption of the normal operations of the OCC or an exchange; (v) inadequacy of the facilities of an exchange or OCC to handle current trading volume; or (vi) a decision by one or more exchanges to discontinue the trading of options (or a particular class or series of options), in which event the relevant market for that option on that exchange would cease to exist, although outstanding options on that exchange would generally continue to be exercisable in accordance with their terms.
The hours of trading for listed options may not coincide with the hours during which the underlying financial instruments are traded. To the extent that the option markets close before the markets for the underlying financial instruments, significant price and rate movements can take place in the underlying markets that may not be reflected in the option markets.
OTC options are purchased from or sold to securities dealers, financial institutions or other parties (“Counterparties”) through direct bilateral agreement with the Counterparty. In contrast to exchange listed options, which generally have standardized terms and performance mechanics, all the terms of an OTC option, including such terms as method of settlement, term, exercise price, premium, guarantees and security, are set by negotiation of the parties. Each Portfolio will only sell OTC options (other than OTC currency options) that are subject to a buy-back provision permitting a Portfolio to require the Counterparty to sell the option back to a Portfolio at a formula price within seven days. Each Portfolio expects generally to enter into OTC options that have cash settlement provisions, although it is not required to do so.
Unless the parties provide for it, there is no central clearing or guaranty function in an OTC option. As a result, if the Counterparty fails to make or take delivery of the security, currency or other instrument underlying an OTC option it has entered into with a Portfolio or fails to make a cash settlement payment due in accordance with the terms of that option, a Portfolio will lose any premium it paid for the option as well as any anticipated benefit of the transaction. Accordingly, the Advisor must assess the creditworthiness of each such Counterparty or any guarantor or credit enhancement of the Counterparty’s credit to determine the likelihood that the terms of the OTC option will be satisfied. Each Portfolio will engage in OTC option transactions only with US government securities dealers recognized by the Federal Reserve Bank of New York as “primary dealers” or broker/dealers, domestic or foreign banks or other financial institutions which have received (or the guarantors of the obligation of which have received) a short-term credit rating of A-1 from S&P or P-1 from Moody’s or an equivalent rating from any nationally recognized statistical rating organization (“NRSRO”) or, in the case of OTC currency transactions, are determined to be of equivalent credit quality by the Advisor. The staff of the SEC currently takes the position that OTC options purchased by a Portfolio, and portfolio securities “covering” the amount of a Portfolio’s obligation pursuant to an OTC option sold by it (the cost of the sell-back plus the in-the-money amount, if any) are illiquid, and are subject to a Portfolio’s limitation on investing no more than 15% of its net assets in illiquid securities.
If a Portfolio sells a call option, the premium that it receives may serve as a partial hedge, to the extent of the option premium, against a decrease in the value of the underlying securities or instruments in its portfolio or will increase a Portfolio’s income. The sale of put options can also provide income.
Each Portfolio may purchase and sell call options on securities including US Treasury and agency securities, mortgage-backed securities, foreign sovereign debt, corporate debt securities, equity securities (including convertible securities) and Eurodollar instruments that are traded on US and foreign securities exchanges and in the over-the-counter markets, and on securities indices, currencies and futures contracts. All calls sold by a Portfolio must be “covered” (i.e., a Portfolio must own the securities or futures contract subject to the call) or must meet the asset segregation requirements described below as long as the call is outstanding. Even though a Portfolio will receive the option premium to help protect it against loss, a call sold by a Portfolio exposes a Portfolio during the term of the option to possible loss of opportunity to realize appreciation in the market price of the underlying security or instrument and may require a Portfolio to hold a security or instrument which it might otherwise have sold.
43
Each Portfolio may purchase and sell put options on securities including US Treasury and agency securities, mortgage-backed securities, foreign sovereign debt, corporate debt securities, equity securities (including convertible securities) and Eurodollar instruments (whether or not it holds the above securities in its portfolio), and on securities indices, currencies and futures contracts other than futures on individual corporate debt and individual equity securities. Each Portfolio will not sell put options if, as a result, more than 50% of a Portfolio’s total assets would be required to be segregated to cover its potential obligations under such put options other than those with respect to futures and options thereon. In selling put options, there is a risk that a Portfolio may be required to buy the underlying security at a disadvantageous price above the market price.
General Characteristics of Futures. Each Portfolio may enter into futures contracts or purchase or sell put and call options on such futures as a hedge against anticipated interest rate, currency or equity market changes, and for duration management, risk management and return enhancement purposes. Futures are generally bought and sold on the commodities exchanges where they are listed with payment of initial and variation margin as described below. The sale of a futures contract creates a firm obligation by a Portfolio, as seller, to deliver to the buyer the specific type of financial instrument called for in the contract at a specific future time for a specified price (or, with respect to index futures and Eurodollar instruments, the net cash amount). Options on futures contracts are similar to options on securities except that an option on a futures contract gives the purchaser the right in return for the premium paid to assume a position in a futures contract and obligates the seller to deliver such position.
The portfolios have claimed exclusion from the definition of the term “commodity pool operator” adopted by the CFTC and the National Futures Association, which regulate trading in the futures markets. Therefore, the Portfolios are not subject to commodity pool operator registration and regulation under the Commodity Exchange Act. Futures and options on futures may be entered into for bona fide hedging, risk management (including duration management) or other portfolio and return enhancement management purposes to the extent consistent with the exclusion from commodity pool operator registration. Typically, maintaining a futures contract or selling an option thereon requires a Portfolio to deposit with a financial intermediary as security for its obligations an amount of cash or other specified assets (initial margin) which initially is typically 1% to 10% of the face amount of the contract (but may be higher in some circumstances). Additional cash or assets (variation margin) may be required to be deposited thereafter on a daily basis as the marked to market value of the contract fluctuates. The purchase of an option on financial futures involves payment of a premium for the option without any further obligation on the part of a Portfolio. If a Portfolio exercises an option on a futures contract it will be obligated to post initial margin (and potential subsequent variation margin) for the resulting futures position just as it would for any position. Futures contracts and options thereon are generally settled by entering into an offsetting transaction but there can be no assurance that the position can be offset prior to settlement at an advantageous price, nor that delivery will occur.
Each Portfolio will not enter into a futures contract or related option (except for closing transactions) if, immediately thereafter, the sum of the amount of its initial margin and premiums on open futures contracts and options thereon would exceed 5% of a Portfolio’s total assets (taken at current value); however, in the case of an option that is in-the-money at the time of the purchase, the in-the-money amount may be excluded in calculating the 5% limitation. The segregation requirements with respect to futures contracts and options thereon are described below.
Options on Securities Indices and Other Financial Indices. Each Portfolio also may purchase and sell call and put options on securities indices and other financial indices and in so doing can achieve many of the same objectives it would achieve through the sale or purchase of options on individual securities or other instruments. Options on securities indices and other financial indices are similar to options on a security or other instrument except that, rather than settling by physical delivery of the underlying instrument, they settle by cash settlement, i.e., an option on an index gives the holder the right to receive, upon exercise of the option, an amount of cash if the closing level of the index upon which the option is based exceeds, in the case of a call, or is less than, in the case of a put, the exercise price of the option (except if, in the case of an OTC option, physical delivery is specified). This amount of cash is equal to the excess of the closing price of the index over the exercise price of the option, which also may be multiplied by a formula value. The seller of the option is obligated, in return for the premium received, to make delivery of this amount. The gain or loss on an option on an index depends on price movements in the instruments making up the market, market segment, industry or other composite on which the underlying index is based, rather than price movements in individual securities, as is the case with respect to options on securities.
44
Currency Transactions. Each Portfolio may engage in currency transactions with Counterparties primarily in order to hedge, or manage the risk of the value of portfolio holdings denominated in particular currencies against fluctuations in relative value. Currency transactions include forward currency contracts, exchange listed currency futures, exchange listed and OTC options on currencies, and currency swaps. A forward currency contract involves a privately negotiated obligation to purchase or sell (with delivery generally required) a specific currency at a future date, which may be any fixed number of days from the date of the contract agreed upon by the parties, at a price set at the time of the contract. A currency swap is an agreement to exchange cash flows based on the notional difference among two or more currencies and operates similarly to an interest rate swap, which is described below. Each Portfolio may enter into currency transactions with Counterparties which have received (or the guarantors of the obligations which have received) a credit rating of A-1 or P-1 by S&P or Moody’s, respectively, or that have an equivalent rating from a NRSRO or (except for OTC currency options) are determined to be of equivalent credit quality by the Advisor.
Each Portfolio’s dealings in forward currency contracts and other currency transactions such as futures, options, options on futures and swaps generally will be limited to hedging involving either specific transactions or portfolio positions except as described below. Transaction hedging is entering into a currency transaction with respect to specific assets or liabilities of a Portfolio, which will generally arise in connection with the purchase or sale of its portfolio securities or the receipt of income therefrom. Position hedging is entering into a currency transaction with respect to portfolio security positions denominated or generally quoted in that currency.
Each Portfolio generally will not enter into a transaction to hedge currency exposure to an extent greater, after netting all transactions intended wholly or partially to offset other transactions, than the aggregate market value (at the time of entering into the transaction) of the securities held in its portfolio that are denominated or generally quoted in or currently convertible into such currency, other than with respect to proxy hedging or cross hedging as described below.
Each Portfolio may also cross-hedge currencies by entering into transactions to purchase or sell one or more currencies that are expected to decline in value relative to other currencies to which a Portfolio has or in which a Portfolio expects to have portfolio exposure.
To reduce the effect of currency fluctuations on the value of existing or anticipated holdings of portfolio securities, each Portfolio may also engage in proxy hedging. Proxy hedging is often used when the currency to which a Portfolio’s portfolio is exposed is difficult to hedge against the dollar. Proxy hedging entails entering into a commitment or option to sell a currency whose changes in value are generally considered to be correlated to a currency or currencies in which some or all of a Portfolio’s portfolio securities are or are expected to be denominated, in exchange for US dollars. The amount of the commitment or option would not exceed the value of a Portfolio’s securities denominated in correlated currencies. For example, if the Advisor considers that the Austrian schilling is correlated to the German deutschemark (the “D-mark”), a Portfolio holds securities denominated in schillings and the Advisor believes that the value of schillings will decline against the US dollar, the Advisor may enter into a commitment or option to sell D-marks and buy dollars. Currency hedging involves some of the same risks and considerations as other transactions with similar instruments. Currency transactions can result in losses to a Portfolio if the currency being hedged fluctuates in value to a degree or in a direction that is not anticipated. Further, there is the risk that the perceived correlation between various currencies may not be present or may not be present during the particular time that a Portfolio is engaging in proxy hedging. If a Portfolio enters into a currency hedging transaction, a Portfolio will comply with the asset segregation requirements described below.
Risks of Currency Transactions. Currency transactions are subject to risks different from those of other portfolio transactions. Because currency control is of great importance to the issuing governments and influences economic planning and policy, purchases and sales of currency and related instruments can be negatively affected by government exchange controls, blockages, and manipulations or exchange restrictions imposed by governments. These can result in losses to a Portfolio if it is unable to deliver or receive currency or funds in settlement of obligations and could also cause hedges it has entered into to be rendered useless, resulting in full currency exposure as well as incurring transaction costs. Buyers and sellers of currency futures are subject to the same risks that apply to the use of futures generally. Further, settlement of a currency futures contract for the purchase of most currencies must occur at a bank based in the issuing nation. Trading options on currency futures is relatively new, and the ability to establish and close
45
out positions on such options is subject to the maintenance of a liquid market which may not always be available. Currency exchange rates may fluctuate based on factors extrinsic to that country’s economy.
Combined Transactions. Each Portfolio may enter into multiple transactions, including multiple options transactions, multiple futures transactions, multiple currency transactions (including forward currency contracts) and multiple interest rate transactions and any combination of futures, options, currency and interest rate transactions (“component” transactions), instead of a single Strategic Transaction, as part of a single or combined strategy when, in the opinion of the Advisor, it is in the best interests of a Portfolio to do so. A combined transaction will usually contain elements of risk that are present in each of its component transactions. Although combined transactions are normally entered into based on the Advisor’s judgment that the combined strategies will reduce risk or otherwise more effectively achieve the desired portfolio management goal, it is possible that the combination will instead increase such risks or hinder achievement of the portfolio management objective.
Swaps, Caps, Floors and Collars. Among the Strategic Transactions into which a Portfolio may enter are interest rate, currency, index and other swaps and the purchase or sale of related caps, floors and collars. Each Portfolio expects to enter into these transactions primarily to preserve a return or spread on a particular investment or portion of its portfolio, to protect against currency fluctuations, as a duration management technique or to protect against any increase in the price of securities a Portfolio anticipates purchasing at a later date. Each Portfolio will not sell interest rate caps or floors where it does not own securities or other instruments providing the income stream a Portfolio may be obligated to pay. Interest rate swaps involve the exchange by a Portfolio with another party of their respective commitments to pay or receive interest, e.g., an exchange of floating rate payments for fixed rate payments with respect to a notional amount of principal. A currency swap is an agreement to exchange cash flows on a notional amount of two or more currencies based on the relative value differential among them and an index swap is an agreement to swap cash flows on a notional amount based on changes in the values of the reference indices. The purchase of a cap entitles the purchaser to receive payments on a notional principal amount from the party selling such cap to the extent that a specified index exceeds a predetermined interest rate or amount. The purchase of a floor entitles the purchaser to receive payments on a notional principal amount from the party selling such floor to the extent that a specified index falls below a predetermined interest rate or amount. A collar is a combination of a cap and a floor that preserves a certain return within a predetermined range of interest rates or values.
Each Portfolio will usually enter into swaps on a net basis, i.e., the two payment streams are netted out in a cash settlement on the payment date or dates specified in the instrument, with a Portfolio receiving or paying, as the case may be, only the net amount of the two payments. Inasmuch as a Portfolio will segregate assets (or enter into offsetting positions) to cover its obligations under swaps, the Advisor and the Portfolio believe such obligations do not constitute senior securities under the 1940 Act and, accordingly, will not treat them as being subject to its borrowing restrictions. Each Portfolio will not enter into any swap, cap, floor or collar transaction unless, at the time of entering into such transaction, the unsecured long-term debt of the Counterparty, combined with any credit enhancements, is rated at least A by S&P or Moody’s or has an equivalent rating from a NRSRO or is determined to be of equivalent credit quality by the Advisor. If there is a default by the Counterparty, a Portfolio may have contractual remedies pursuant to the agreements related to the transaction. The swap market has grown substantially in recent years with a large number of banks and investment banking firms acting both as principals and as agents utilizing standardized swap documentation. As a result, the swap market has become relatively liquid. Caps, floors and collars are more recent innovations for which standardized documentation has not yet been fully developed and, accordingly, they are less liquid than swaps.
Risks of Strategic Transactions Outside the US. When conducted outside the US, Strategic Transactions may not be regulated as rigorously as in the US, may not involve a clearing mechanism and related guarantees, and are subject to the risk of governmental actions affecting trading in, or the prices of, foreign securities, currencies and other instruments. The value of such positions also could be adversely affected by: (i) other complex foreign political, legal and economic factors, (ii) lesser availability than in the US of data on which to make trading decisions, (iii) delays in a Portfolio’s ability to act upon economic events occurring in foreign markets during non-business hours in the US, (iv) the imposition of different exercise and settlement terms and procedures and margin requirements than in the US, and (v) lower trading volume and liquidity.
46
Use of Segregated and Other Special Accounts. Many Strategic Transactions, in addition to other requirements, require that a Portfolio segregate cash or liquid assets with its custodian to the extent a Portfolio’s obligations are not otherwise “covered” through ownership of the underlying security, financial instrument or currency. In general, either the full amount of any obligation by a Portfolio to pay or deliver securities or assets must be covered at all times by the securities, instruments or currency required to be delivered, or, subject to any regulatory restrictions, an amount of cash or liquid assets at least equal to the current amount of the obligation must be segregated with the custodian. The segregated assets cannot be sold or transferred unless equivalent assets are substituted in their place or it is no longer necessary to segregate them. For example, a call option written by a Portfolio will require the Portfolio to hold the securities subject to the call (or securities convertible into the needed securities without additional consideration) or to segregate cash or liquid assets sufficient to purchase and deliver the securities if the call is exercised. A call option sold by a Portfolio on an index will require the Portfolio to own portfolio securities which correlate with the index or to segregate cash or liquid assets equal to the excess of the index value over the exercise price on a current basis. A put option written by a Portfolio requires the Portfolio to segregate cash or liquid assets equal to the exercise price.
Except when a Portfolio enters into a forward contract for the purchase or sale of a security denominated in a particular currency, which requires no segregation, a currency contract which obligates a Portfolio to buy or sell currency will generally require a Portfolio to hold an amount of that currency or liquid assets denominated in that currency equal to the Portfolio’s obligations or to segregate cash or liquid assets equal to the amount of a Portfolio’s obligation.
OTC options entered into by a Portfolio, including those on securities, currency, financial instruments or indices and OCC issued and exchange listed index options, will generally provide for cash settlement. As a result, when a Portfolio sells these instruments it will only segregate an amount of cash or liquid assets equal to its accrued net obligations, as there is no requirement for payment or delivery of amounts in excess of the net amount. These amounts will equal 100% of the exercise price in the case of a non cash-settled put, the same as an OCC guaranteed listed option sold by a Portfolio, or the in-the-money amount plus any sell-back formula amount in the case of a cash-settled put or call. In addition, when a Portfolio sells a call option on an index at a time when the in-the-money amount exceeds the exercise price, the Portfolio will segregate, until the option expires or is closed out, cash or cash equivalents equal in value to such excess. OCC issued and exchange listed options sold by a Portfolio other than those above generally settle with physical delivery, or with an election of either physical delivery or cash settlement and a Portfolio will segregate an amount of cash or liquid assets equal to the full value of the option. OTC options settling with physical delivery, or with an election of either physical delivery or cash settlement will be treated the same as other options settling with physical delivery.
In the case of a futures contract or an option thereon, a Portfolio must deposit initial margin and possible daily variation margin in addition to segregating cash or liquid assets sufficient to meet its obligation to purchase or provide securities or currencies, or to pay the amount owed at the expiration of an index-based futures contract. Such liquid assets may consist of cash, cash equivalents, liquid debt or equity securities or other acceptable assets.
With respect to swaps, a Portfolio will accrue the net amount of the excess, if any, of its obligations over its entitlements with respect to each swap on a daily basis and will segregate an amount of cash or liquid assets having a value equal to the accrued excess. Caps, floors and collars require segregation of assets with a value equal to a Portfolio’s net obligation, if any.
Strategic Transactions may be covered by other means when consistent with applicable regulatory policies. Each Portfolio may also enter into offsetting transactions so that its combined position, coupled with any segregated assets, equals its net outstanding obligation in related options and Strategic Transactions. For example, a Portfolio could purchase a put option if the strike price of that option is the same or higher than the strike price of a put option sold by the Portfolio. Moreover, instead of segregating cash or liquid assets if a Portfolio held a futures or forward contract, it could purchase a put option on the same futures or forward contract with a strike price as high or higher than the price of the contract held. Other Strategic Transactions may also be offset in combinations. If the offsetting transaction terminates at the time of or after the primary transaction no segregation is required, but if it terminates prior to such time, cash or liquid assets equal to any remaining obligation would need to be segregated.
47
Risks of Specialized Investment Techniques Outside the US. When conducted outside the US, the above described specialized investment techniques may not be regulated as effectively as in the US; may not involve a clearing mechanism and related guarantees; and are subject to the risk of governmental actions affecting trading in, or the prices of, foreign securities, currencies and other instruments. The value of such positions also could be adversely affected by: (i) other complex foreign political, legal and economic factors; (ii) lesser availability than in the US of data on which to make trading decisions; (iii) delays in a Portfolio’s ability to act upon economic events occurring in foreign markets during non-business hours in the US; (iv) the imposition of different exercise and settlement terms and procedures and margin requirements than in the US; and (v) lower trading volume and liquidity.
MANAGEMENT OF THE FUND
Investment Advisor
Deutsche Investment Management Americas Inc. (“DeIM” or the “Advisor”), which is part of Deutsche Asset Management (DeAM), is the investment advisor for each Portfolio. Under the supervision of the Board of Trustees of the Fund, DeIM, with headquarters at 345 Park Avenue, New York, New York, makes the Portfolios’ investment decisions, buys and sells securities for each Portfolio and conducts research that leads to these purchase and sale decisions. DeIM and its predecessors have more than 80 years of experience managing mutual funds. DeIM provides a full range of investment advisory services to institutional and retail clients. The Fund’s investment advisor is also responsible for selecting brokers and dealers and for negotiating brokerage commissions and dealer charges.
Deutsche Asset Management is the marketing name in the US for the asset management activities of Deutsche Bank AG, DeIM, Deutsche Asset Management Inc., Deutsche Asset Management Investment Services Ltd., Deutsche Bank Trust Company Americas and Scudder Trust Company. Deutsche Asset Management is a global asset management organization that offers a wide range of investing expertise and resources, including hundreds of portfolio managers and analysts and an office network that reaches the world’s major investment centers. This well-resourced global investment platform brings together a wide variety of experience and investment insight, across industries, regions, asset classes and investing styles. DeIM is an indirect, wholly owned subsidiary of Deutsche Bank AG. Deutsche Bank AG is a major global banking institution that is engaged in a wide range of financial services, including investment management, mutual fund, retail, private and commercial banking, investment banking and insurance.
DeIM, together with its predecessors, is one of the most experienced investment counseling firms in the US. It was established as a partnership in 1919 and pioneered the practice of providing investment counsel to individual clients on a fee basis. In 1928 it introduced the first no-load mutual fund to the public. In 1953 Scudder introduced Scudder International Fund, Inc., the first mutual fund available in the US investing internationally in securities of issuers in several foreign countries. The predecessor firm to DeIM, Zurich Scudder Investments, Inc. (“Scudder”), reorganized from a partnership to a corporation on June 28, 1985. On December 31, 1997, Zurich Insurance Company (“Zurich”) acquired a majority interest in Scudder, and Zurich Kemper Investments, Inc., a Zurich subsidiary, became part of Scudder. Scudder’s name changed to Scudder Kemper Investments, Inc. On January 1, 2001, the Advisor changed its name from Scudder Kemper Investments, Inc. to Zurich Scudder Investments, Inc. On April 5, 2002, 100% of Scudder, not including certain UK operations (known as Threadneedle Investments), was acquired by Deutsche Bank AG.
The Advisor or a subadvisor manages each Portfolio’s daily investment and business affairs subject to the policies established by the Board of Trustees.
Pursuant to an investment management agreement with each Portfolio (each an “Agreement,” and collectively, the Agreements”), the Advisor acts as each Portfolio’s investment advisor, manages its investments, administers its business affairs, furnishes office facilities and equipment, provides clerical and administrative services and permits its officers and employees to serve without compensation as trustees or officers of one or both funds if elected to such positions. To the extent permissible by law, the Advisor may appoint certain of its affiliates as sub-advisors to perform certain of the Advisor’s duties.
48
The Advisor provides investment counsel for many individuals and institutions, including insurance companies, industrial corporations, and financial and banking organizations, as well as providing investment advice to open- and closed-end SEC registered funds.
The Advisor maintains a large research department, which conducts continuous studies of the factors that affect the position of various industries, companies and individual securities. The Advisor receives published reports and statistical compilations from issuers and other sources, as well as analyses from brokers and dealers who may execute portfolio transactions for the Advisor’s clients. However, the Advisor regards this information and material as an adjunct to its own research activities. The Advisor’s international investment management team travels the world, researching hundreds of companies. In selecting the securities in which the Portfolios may invest, the conclusions and investment decisions of the Advisor with respect to the Portfolios are based primarily on the analyses of its own research department.
In certain cases, the investments for a Portfolio are managed by the same individuals who manage one or more other mutual funds advised by the Advisor, that have similar names, objectives and investment styles. You should be aware that the Portfolios are likely to differ from these other mutual funds in size, cash flow pattern and tax matters. Accordingly, the holdings and performance of the Portfolios can be expected to vary from those of these other mutual funds.
Certain investments may be appropriate for a Portfolio and also for other clients advised by the Advisor. Investment decisions for a fund and other clients are made with a view to achieving their respective investment objectives and after consideration of such factors as their current holdings, availability of cash for investment and the size of their investments generally. Frequently, a particular security may be bought or sold for only one client or in different amounts and at different times for more than one but less than all clients. Likewise, a particular security may be bought for one or more clients when one or more other clients are selling the security. In addition, purchases or sales of the same security may be made for two or more clients on the same day. In such event, such transactions will be allocated among the clients in a manner believed by the Advisor to be equitable to each. In some cases, this procedure could have an adverse effect on the price or amount of the securities purchased or sold by a Portfolio. Purchase and sale orders for a Portfolio may be combined with those of other clients of the Advisor in the interest of achieving the most favorable net results to that Portfolio.
Each Portfolio is managed by a team of investment professionals who each play an important role in a Portfolio’s management process. Team members work together to develop investment strategies and select securities for a Portfolio. This team works for the Advisor or its affiliates and is supported by a large staff of economists, research analysts, traders and other investment specialists. The Advisor or its affiliates believe(s) its team approach benefits Portfolio investors by bringing together many disciplines and leveraging its extensive resources. Team members with primary responsibility for management of the Portfolios, as well as team members who have other ongoing management responsibilities for each Portfolio, are identified in each Portfolio’s prospectus, as of the date of the Portfolio’s prospectus. Composition of the team may change over time, and Portfolio shareholders and investors will be notified of changes affecting individuals with primary Portfolio management responsibility.
The current Agreements for all Portfolios, each dated April 5, 2002, were last renewed by the Trustees on August 12, 2003. Each Agreement had an initial term ending September 30, 2002 and continues in effect until September 30, 2004 and from year to year thereafter only if their continuance is approved annually by the vote of a majority of those Trustees who are not parties to such Agreements or interested persons of the Advisor or the Fund, cast in person at a meeting called for the purpose of voting on such approval, and either by a vote of the Fund’s Trustees or of a majority of the outstanding voting securities of the respective Portfolio. The Agreements may be terminated at any time without payment of penalty by either party on sixty days’ written notice and automatically terminate in the event of their assignment.
Under the Agreements, the Advisor regularly provides the Portfolios with investment research, advice and supervision and furnishes continuously an investment program consistent with the investment objectives and policies of each Portfolio, and determines, for each Portfolio, what securities shall be purchased, what securities shall be held or sold, and what portion of a Portfolio’s assets shall be held uninvested, subject always to the provisions of the Fund’s
49
Declaration of Trust and By-Laws, and of the 1940 Act and to a Portfolio’s investment objectives, policies and restrictions, and subject further to such policies and instructions as the Trustees may from time to time establish. The Advisor also advises and assists the officers of the Fund in taking such steps as are necessary or appropriate to carry out the decisions of its Trustees and the appropriate committees of the Trustees regarding the conduct of the business of the Fund.
Under the Agreements, the Advisor also renders significant administrative services (not otherwise provided by third parties) necessary for each Portfolio’s operations as an open-end investment company including, but not limited to, preparing reports and notices to the Trustees and shareholders; supervising, negotiating contractual arrangements with, and monitoring various third-party service providers to the Portfolios (such as the Portfolios’ transfer agent, pricing agents, custodian, accountants and others); preparing and making filings with the SEC and other regulatory agencies; assisting in the preparation and filing of each Portfolio’s federal, state and local tax returns; preparing and filing the Fund’s federal excise tax returns; assisting with investor and public relations matters; monitoring the valuation of securities and the calculation of net asset value, monitoring the registration of shares of the Fund under applicable federal and state securities laws; maintaining each Portfolio’s books and records to the extent not otherwise maintained by a third party; assisting in establishing accounting policies of the Fund; assisting in the resolution of accounting and legal issues; establishing and monitoring each Portfolio’s operating budget; processing the payment of each Portfolio’s bills; assisting the Fund and the Portfolios in, and otherwise arranging for, the payment of distributions and dividends and otherwise assisting the Fund and the Portfolios in the conduct of their business, subject to the direction and control of the Trustees.
Pursuant to a sub-accounting and administrator agreement among the Advisor, SFAC and State Street Bank and Trust Company (“SSB”), the Advisor has delegated certain administrative functions to SSB under the fund’s investment management agreements. The costs and expenses of such delegation are borne by the Advisor, not by the Fund.
For its investment management services, the Advisor receives compensation monthly at the following annual rates, and received the amounts for the years as indicated, from each Portfolio:
| | | | | | | | | | | | |
Portfolio
| | % of the average
daily net asset
values of
each Portfolio
| | | 2003
| | 2002
| | 2001
|
Money Market Portfolio | | 0.370 | % | | $ | 314,670 | | $ | 449,733 | | $ | 475,038 |
Bond Portfolio | | 0.475 | % | | | 867,690 | | | 755,776 | | | 745,082 |
Balanced Portfolio | | 0.475 | % | | | 643,415 | | | 716,548 | | | 841,094 |
Growth and Income Portfolio | | 0.475 | % | | | 730,659 | | | 808,530 | | | 886,970 |
Capital Growth Portfolio* | | | | | | 2,927,691 | | | 3,274,898 | | | 4,293,640 |
21st Century Growth Portfolio** | | 0.875 | % | | | 367,279 | | | 343,247 | | | 272,234 |
Global Discovery Portfolio*** | | 0.975 | % | | | 1,456,437 | | | 1,401,011 | | | 1,481,960 |
International Portfolio+ | | | | | | 3,810,737 | | | 4,282,369 | | | 5,296,558 |
Health Sciences Portfolio++ | | | | | | 662,973 | | | 520,626 | | | 94,344 |
| * | The investment management fee for the Capital Growth Portfolio is calculated according to the following schedule: 0.475% of average daily net assets on the first $500 million, 0.450% of average daily net assets on the next $500 million and 0.425% of average daily net assets in excess of $1 billion. As a result, the Advisor received compensation at an annual rate of 0.46%, 0.47% and 0.47% for the fiscal years ended December 31, 2001, 2002 and 2003, respectively. |
| ** | Until April 30, 2005, the Advisor has agreed to limit total operating expenses of 21st Century Growth Portfolio to 1.50%, of average daily net assets for Class A and 1.75% of average daily net assets for Class B. |
50
| *** | Until April 30, 2005, the Advisor agreed to waive all or a portion of its management fee to limit the expenses of Global Discovery Portfolio to 1.25% of average daily net assets for Class A and 1.65% of average daily net assets for Class B. |
| + | The investment management fee for the International Portfolio is calculated according to the following schedule: 0.875% of average daily net assets on the first $500 million and 0.725% of average daily net assets in excess of $500 million. As a result, the Advisor received compensation at an annual rate of 0.84%, 0.87% and 0.875% for the fiscal years ended December 31, 2001, 2002 and 2003, respectively. |
| ++ | Health Sciences Portfolio commenced operations on May 1, 2001. The investment management fee for the Health Sciences Portfolio is calculated according to the following schedule: 0.750% of average daily net assets on the first $250 million, 0.725% of average daily net assets on the next $750 million, 0.700% of average daily net assets on the next $1.5 billion, 0.680% of average daily net assets on the next $2.5 billion, 0.650% of average daily net assets on the next $2.5 billion, 0.640% of average daily net assets on the next $2.5 billion, 0.630% of average daily net assets on the next $2.5 billion and 0.620% of average daily net assets over $12.5 billion. The Advisor received compensation equivalent to an annual effective rate of 0.56% during the fiscal year 2001 and during this period the Advisor waived $23,371. The Advisor received compensation at an annual rate of 0.75% for each of the fiscal years ended December 31, 2002 and 2003. Until April 30, 2005, the Advisor has agreed to maintain the expenses, excluding 12b-1 fees, to 0.95% of average daily net assets for Class A and 1.35% of average daily net assets for Class B. |
Under the Agreements, each Portfolio is responsible for all of its other expenses, including clerical salaries; fees and expenses incurred in connection with membership in investment company organizations; brokers’ commissions; legal, auditing and accounting expenses; taxes and governmental fees; the charges of custodians, transfer agents and other agents; any other expenses, including clerical expenses, of issue, sale, underwriting, distribution, redemption or repurchase of shares; the expenses of and fees for registering or qualifying securities for sale; the fees and expenses of the Trustees of the Fund who are not affiliated with the Advisor; and the cost of preparing and distributing reports and notices to shareholders. The Fund may arrange to have third parties assume all or part of the expense of sale, underwriting and distribution of a Portfolio’s shares. Each Portfolio is also responsible for its expenses incurred in connection with litigation, proceedings and claims and the legal obligation it may have to indemnify its officers and Trustees with respect thereto.
In addition to payments for investment management services provided by the Advisor, the Trustees, consistent with the Portfolios’ investment management agreements and underwriting agreement, have approved payments to the Advisor and Scudder Investor Services, Inc. for clerical, accounting and certain other services they may provide the Fund or the particular Portfolio. Effective October 1, 1994, the Trustees authorized the elimination of these administrative expenses. Under a new agreement, effective October 1, 1994, the Trustees authorized the Fund, on behalf of each Portfolio, to pay Scudder Fund Accounting Corporation, a subsidiary of the Advisor, for determining the daily net asset value per share and maintaining the portfolio and general accounting records of the Portfolios.
In reviewing the terms of the Agreements and in discussions with the Advisor concerning the Agreements, Independent Trustees (as defined in the 1940 Act) of the Fund are represented by independent counsel at the Fund’s expense.
The Agreements provide that the Advisor shall not be liable for any error of judgment or mistake of law or for any loss suffered by the Fund in connection with matters to which the Agreements relate, except a loss resulting from willful misfeasance, bad faith or gross negligence on the part of the Advisor in the performance of its duties or from reckless disregard by the Advisor of its obligations and duties under the Agreements.
Each Participating Insurance Company has agreed with the Advisor to reimburse the Advisor for a period of five years to the extent that the aggregate annual advisory fee paid on behalf of all Portfolios with respect to the average daily net asset value of the shares of all Portfolios held in that Participating Insurance Company’s general or separate account (or those of affiliates) is less than $25,000 in any year. It is expected that insurance companies which become Participating Insurance Companies in the future will be required to enter into similar arrangements.
51
Officers and employees of the Advisor from time to time may have transactions with various banks, including the Fund’s custodian bank. It is the Advisor’s opinion that the terms and conditions of those transactions were not influenced by existing or potential custodial or other Fund relationships.
The Advisor may serve as Advisor to other funds with investment objectives and policies similar to those of the Portfolios that may have different distribution arrangements or expenses, which may affect performance.
None of the Officers and Trustees of the Fund may have dealings with the Fund as principals in the purchase or sale of securities, except as individual subscribers to or holders of shares of the Fund.
The Agreement identifies the Advisor as the exclusive licensee of the rights to use and sublicense the names “Scudder,” “Scudder Investments” and “Scudder, Stevens and Clark, Inc.” (together, the “Scudder Marks”). Under this license, the Trust, with respect to the fund, has the non-exclusive right to use and sublicense the Scudder name and marks as part of its name, and to use the Scudder Marks in the Trust’s investment products and services.
The term “Scudder Investments” is the designation given to the services provided by the Advisor and its affiliates to the Scudder Family of Funds.
Board Considerations in Connection with Annual Renewal of Investment Management Agreements for Scudder Variable Series I Fund and the Sub-Advisory Agreements for Bond Portfolio and International Portfolio
As noted above, the Board of Trustees of Scudder Variable Series I approved the continuation of each Portfolio’s current agreement in August 2003. In connection with their deliberations, the Trustees considered such information and factors as they believed, in light of the legal advice furnished to them by their independent legal counsel and their own business judgment, to be relevant to the interests of the shareholders of the Portfolios. The factors considered by the Trustees included, among others, the nature, quality and extent of services provided by the Advisor to the Portfolios; investment performance, the Portfolios themselves and relative to appropriate peer groups and market indices; investment management fees, expense ratios and asset sizes of the Portfolios themselves and relative to appropriate peer groups; the Advisor’s profitability from managing the Portfolios and other investment companies managed by the Advisor before marketing expenses paid by the Advisor; possible economies of scale; and possible financial and other benefits to the Advisor from serving as investment adviser and from affiliates of the Advisor providing various services to the Portfolios. In assessing the possible financial and other benefits to the Advisor and its affiliates, the benefits considered by the Trustees included research services available to the Advisor by reason of brokerage business generated by the Portfolios. The Trustees approved the subadvisory agreements for International Portfolio and Bond Portfolio on August 12, 2003 and April 12, 2004, respectively.
The Trustees requested and received extensive information from the Advisor in connection with their consideration of the factors cited above. The Trustees met privately with their independent legal counsel on several occasions to review this information, and requested and received additional information on a range of topics. In conducting their review, the Trustees also considered the Advisor���s recent acquisition by Deutsche Bank AG, including the possible effects of this transaction and the resulting organizational changes on the utility of certain historic information regarding the Portfolios and the Advisor. To the extent they deemed them relevant, the Trustees also considered the extensive materials they had requested and received in connection with their consideration of that acquisition of the Advisor. The Independent Trustees also considered similar factors regarding the subadvisor for Bond Portfolio and International Portfolio, to the extent applicable.
Subadvisor — Bond Portfolio and International Portfolio
Deutsche Asset Management Investment Services Ltd. (“DeAMIS”), One Appold Street, London, England, an affiliate of the Advisor, is the subadvisor for Bond Portfolio and International Portfolio and is responsible for managing each Portfolio’s assets. DeAMIS provides a full range of international investment advisory services to institutional and retail clients. The Advisor compensates DeAMIS out of the management fee it receives from each portfolio.
52
Effective August 5, 2003 the Advisor pays DeAMIS for its services a sub-advisory fee rate, payable monthly at the annual rate of 0.438% of International Portfolio’s average weekly net assets. The Advisor pays DeAMIS for its services a sub-advisory fee rate, payable monthly at the annual rate of 0.50% of Bond Portfolio’s average weekly net assets.
The sub-advisory agreements provide that DeAMIS will not be liable for any error of judgment or mistake of law or for any loss suffered by a Portfolio in connection with matters to which the sub-advisory agreements relate, except a loss resulting from willful misconduct, bad faith or gross negligence on the part of DeAMIS in the performance of its duties or from reckless disregard by DeAMIS of its obligations and duties under the sub-advisory agreement.
The sub-advisory agreements were first approved on April 12, 2004 and June 11, 2002 for Bond Portfolio and International Portfolio, respectively, and continue in effect from year to year thereafter, but only as long as such continuance is specifically approved at least annually (a) by a majority of the Trustees of the Fund who are not parties to such agreement or interested persons of any such party except in their capacity as Trustees of the Fund, and (b) by the shareholders or the Board of Trustees of the Fund. The continuation of International Portfolio’s sub-advisory agreement was approved on August 12, 2003. The sub-advisory agreement may be terminated at any time upon 60 days’ written notice by the Advisor or by the Board of Trustees of the Fund or by vote of a majority of the outstanding voting securities of the Portfolios, and will terminate automatically upon assignment or upon termination of the Portfolios’ investment management agreement.
AMA InvestmentLink(SM) Program
Pursuant to an Agreement between the Advisor and AMA Solutions, Inc., a subsidiary of the American Medical Association (the “AMA”), dated May 9, 1997, the Advisor has agreed, subject to applicable state regulations, to pay AMA Solutions, Inc. royalties in an amount equal to 5% of the management fee received by the Advisor with respect to assets invested by AMA members in Scudder funds in connection with the AMA InvestmentLink(SM) Program. The Advisor will also pay AMA Solutions, Inc. a general monthly fee, currently in the amount of $833 in connection with these arrangements. The AMA and AMA Solutions, Inc. are not engaged in the business of providing investment advice and neither is registered as an investment Advisor or broker/dealer under federal securities laws. Any person who participates in the AMA InvestmentLink(SM) Program will be a customer of the Advisor (or of a subsidiary thereof) and not the AMA or AMA Solutions, Inc. AMA InvestmentLink(SM) is a service mark of AMA Solutions, Inc.
Codes of Ethics
The Fund, Advisor and subadvisor, as applicable, and the Fund’s principal underwriter have each adopted codes of ethics under rule 17j-1 of the 1940 Act. Board members, officers of the Fund and employees of the Advisor and principal underwriter are permitted to make personal securities transactions, including transactions in securities that may be purchased or held by the Fund, subject to requirements and restrictions set forth in the applicable Code of Ethics. The Advisor’s Code of Ethics contains provisions and requirements designed to identify and address certain conflicts of interest between personal investment activities and the interests of the Fund. Among other things, the Advisor’s Code of Ethics prohibits certain types of transactions absent prior approval, imposes time periods during which personal transactions may not be made in certain securities, and requires the submission of duplicate broker confirmations and quarterly reporting of securities transactions. Additional restrictions apply to portfolio managers, traders, research analysts and others involved in the investment advisory process. Exceptions to these and other provisions of the Advisor’s Code of Ethics may be granted in particular circumstances after review by appropriate personnel.
FUND SERVICE PROVIDERS
Principal Underwriter
Pursuant to an underwriting agreement dated September 30, 2002, Scudder Distributors, Inc., 222 South Riverside Plaza, Chicago, Illinois 60606 (the “Distributor”), an affiliate of the Advisor, is the principal underwriter for the Class A and Class B shares of each Portfolio.
53
Under the principal underwriting agreement between the Fund and the Distributor, the Fund is responsible for the payment of all fees and expenses in connection with the preparation and filing of any registration statement and prospectus covering the issue and sale of shares, and the registration and qualification of shares for sale with the SEC in the various states, including registering the Distributor as a broker or dealer. The Fund will also pay the fees and expenses of preparing, printing and mailing prospectuses annually to existing shareholders and any notice, proxy statement, report, prospectus or other communication to shareholders of the Fund, printing and mailing confirmations of purchases of shares, any issue taxes or any initial transfer taxes, a portion of toll-free telephone service for shareholders, wiring funds for share purchases and redemptions (unless paid by the shareholder who initiates the transaction), printing and postage of business reply envelopes and a portion of the computer terminals used by both the Fund and the Distributor.
The Distributor will pay for printing and distributing prospectuses or reports prepared for its use in connection with the offering of the shares to the public and preparing, printing and mailing any other literature or advertising in connection with the offering of the shares to the public. The Distributor will pay all fees and expenses in connection with its qualification and registration as a broker or dealer under Federal and state laws, a portion of the toll-free telephone service and of computer terminals, and of any activity which is primarily intended to result in the sale of shares issued by the Fund, except with respect to Class B shares, for which a 12b-l Plan is in effect which provides that the Fund shall bear some or all of the distribution related expenses attributable to such shares. The Distributor has entered into agreements with broker-dealers authorized to offer and sell VA contracts and VLI policies on behalf of the Participating Insurance Companies under which agreements the broker-dealers have agreed to be responsible for the fees and expenses of any prospectus, statement of additional information and printed information supplemental thereto of the Fund distributed in connection with their offer of VA contracts and VLI policies.
The Distributor currently offers shares of each Portfolio on a continuous basis to the separate accounts of Participating Insurance Companies in all states in which a Portfolio or the Fund may from time to time be registered or where permitted by applicable law. The underwriting agreement provides that the Distributor accepts orders for shares at net asset value without sales commission or load being charged. The Distributor has made no commitment to acquire shares of any Portfolio.
Each Portfolio has adopted a distribution plan under Rule 12b-1 (the “Plan”) that provides for fees payable as an expense of the Class B shares. Under the plan, Scudder Variable Series I may make quarterly payments to the distributor as reimbursement for distribution and shareholder servicing related expenses incurred or paid by the distributor or a participating insurance company. No such payment shall be made with respect to any quarterly period in excess of an amount determined for such period at the annual rate of .25% of the average daily net assets of Class B shares during that quarterly period. The fee is payable by the Fund, on behalf of each Portfolio, of up to 0.25% of the average daily net assets attributable to the Class B shares of a Portfolio. Because 12b-1 fees are paid out of Portfolio assets on an ongoing basis, they will, over time, increase the cost of investment and may cost more than other types of sales charges. In connection with its consideration of the Plan, the Board of Trustees was furnished with drafts of the Plan and related materials, including information related to the advantages and disadvantages of Rule 12b-1 plans currently being used in the mutual fund industry. Legal counsel for the Fund provided additional information, summarized the provisions of the proposed Plan and discussed the legal and regulatory considerations in adopting such Plan.
Expenses of the Portfolios and of the Distributor in connection with the Rule 12b-1 plan for the Class B shares are set forth below:
| | | | | | |
Class B Shares*
| | Fiscal Year 2002
| | Fiscal Year 2003
|
Growth and Income Portfolio | | $ | 20,214 | | $ | 27,480 |
Capital Growth Portfolio | | $ | 1,484 | | $ | 18,025 |
21st Century Growth Portfolio | | $ | 30 | | $ | 6,246 |
Global Discovery Portfolio | | $ | 13,767 | | $ | 19,924 |
International Portfolio | | $ | 13,199 | | $ | 35,650 |
Health Sciences Portfolio | | $ | 54 | | $ | 12,477 |
| * | Bond Portfolio and Balanced Portfolio do not have any outstanding Class B shares. |
54
The Board considered various factors in connection with its decision as to whether to approve the Plan, including (a) the nature and causes of the circumstances which make implementation of the Plan necessary and appropriate; (b) the way in which the Plan would address those circumstances, including the nature and potential amount of expenditures; (c) the nature of the anticipated benefits; (d) the possible benefits of the Plan to any other person relative to those of the Fund; (e) the effect of the Plan on existing owners of VA contracts and VLI policies; (f) the merits of possible alternative plans or pricing structures; (g) competitive conditions in the variable products industry and (h) the relationship of the Plan to other distribution efforts of the Fund.
Based upon its review of the foregoing factors and the materials presented to it, and in light of its fiduciary duties under relevant state law and the 1940 Act, the Board determined, in the exercise of its business judgment, that the Fund’s Plan is reasonably likely to benefit the Fund and the VA contract and VLI policy owners in at least one of several ways. Specifically, the Board concluded that the Participating Insurance Companies would have less incentive to educate VA contract and VLI policy owners and sales people concerning the Fund if expenses associated with such services were not paid for by the Fund. In addition, the Board determined that the payment of distribution fees to insurers should motivate them to maintain and enhance the level of services relating to the Fund provided to VA contract and VLI policy owners, which would, of course, benefit such VA contract and VLI policy owners. Further, the adoption of the Plan would likely help to maintain and may lead to an increase in net assets under management given the distribution financing alternatives available through the multi-class structure. The Board also took into account expense structures of other competing products and administrative compensation arrangements between other funds, their advisers and insurance companies that currently are in use in the variable products industry. Further, it is anticipated that Plan fees may be used to educate potential and existing owners of VA contracts and VLI policies concerning the Fund, the securities markets and related risks.
The Board realizes that there is no assurance that the expenditure of Fund assets to finance distribution of Fund shares will have the anticipated results. However, the Board believes there is a reasonable likelihood that one or more of such benefits will result, and since the Board will be in a position to monitor the distribution expenses of the Fund, it will be able to evaluate the benefit of such expenditures in deciding whether to continue the Plan.
The Plan and any Rule 12b-1-related agreement that is entered into by the Fund or the Distributor in connection with the Plan will continue in effect for a period of more than one year only so long as continuance is specifically approved at least annually by a vote of a majority of the Fund’s Board of Trustees, and of a majority of the Trustees who are not interested persons (as defined in the 1940 Act) of the Fund or a Portfolio and who have no financial interest in the operation of the Plan (“Independent Trustees”), cast in person at a meeting called for the purpose of voting on the Plan, or the Rule 12b-1 related agreement, as applicable. In addition, the Plan and any Rule 12b-1 related agreement, may be terminated as to Class B shares of a Portfolio at any time, without penalty, by vote of a majority of the outstanding Class B shares of that Portfolio or by vote of a majority of the Independent Trustees. The Plan also provides that it may not be amended to increase materially the amount that may be spent for distribution of Class B shares of a Portfolio without the approval of Class B shareholders of that Portfolio.
Transfer Agent
Scudder Investments Service Company (“SISC”), 811 Main Street, Kansas City, Missouri 64105-2005, is the transfer and dividend paying agent for the Fund. The Fund reimburses SISC, or pays directly, for “out-of-pocket” expenses. Such expenses include, but are not limited to: telephone (portion allocable to servicing accounts); postage, overnight service or similar services; stationary and envelopes; shareholder statements, printing and postage; checks, stock supply, printing and postage; data circuits; lease and maintenance of SAIL and Easy Access; forms; microfilm and microfiche; and expenses incurred at the specific direction of the Fund. SISC receives no fee for its services to the Fund. These expenses will be billed by SISC to the Fund within the first five (5) business days of each month and will be paid by wire within five (5) business days of receipt.
55
Certain record-keeping and administrative services that would otherwise be performed by the transfer agent may be performed by the Participating Insurance Company that purchases a Portfolio’s shares, and the Fund or the Advisor (including any affiliate of the Advisor), or both, may pay the Participating Insurance Company for such services.
Pursuant to a sub-transfer agency agreement between SISC and DST Systems, Inc. (“DST”), SISC has delegated certain transfer agent and dividend paying agent functions to DST. The costs and expenses of such delegation are borne by SISC, not by the Funds.
Custodian
Portfolio securities of the Money Market, Bond, Balanced, Growth and Income, Capital Growth, Health Sciences and 21st Century Growth Portfolios are held separately, pursuant to a custodian agreement, by State Street Bank and Trust Company, 225 Franklin Street, Boston, Massachusetts 02110, as custodian. Portfolio securities of Global Discovery and International Portfolios are held separately, pursuant to a custodian agreement, by Brown Brothers Harriman & Co., 40 Water Street, Boston, Massachusetts 02109, as custodian.
Independent Accountants and Reports to Shareholders
The Financial Highlights of the Portfolios included in the Fund’s prospectuses and the Financial Statements incorporated by reference into this Statement of Additional Information have been so included or incorporated by reference in reliance on the report of PricewaterhouseCoopers LLP, 125 High Street, Boston, Massachusetts 02110, independent accountants, and given on the authority of that firm as experts in accounting and auditing. PricewaterhouseCoopers, LLP audits the financial statements of the Fund and provides other audit, tax, and related services. Shareholders will receive annual audited financial statements and semiannual unaudited financial statements.
Legal Counsel
The law firm of Ropes & Gray LLP, One International Place, Boston, Massachusetts 02110, is counsel for the Fund and its Independent Trustees.
Fund Accounting Agent
Scudder Fund Accounting Corporation (“SFAC”), Two International Place, Boston, Massachusetts 02110-4103, a subsidiary of the Advisor, computes net asset value for the Portfolios. Money Market Portfolio pays SFAC an annual fee equal to 0.020% of the first $150 million of average daily net assets, 0.0060% of such assets in excess of $150 million and 0.0035% of such assets in excess of $1 billion, plus holding and transaction charges for this service. Bond Portfolio, Balanced Portfolio, Growth and Income Portfolio, Capital Growth, Health Sciences Portfolio and 21st Century Growth Portfolio each pay SFAC an annual fee equal to 0.025% of the first $150 million of average daily net assets, 0.0075% of such assets in excess of $150 million and 0.0045% of such assets in excess of $1 billion, plus holding and transaction charges for this service. Global Discovery and International Portfolios each pay SFAC an annual fee equal to 0.065% of the first $150 million of average daily net assets, 0.040% of such assets in excess of $150 million and 0.020% of such assets in excess of $1 billion, plus holding and transaction charges for this service. SFAC computes net asset value for the Portfolios. The Fund pays SFAC an annual fee equal to 0.065% of the first $150 million of average daily net assets, 0.040% of such assets in excess of $150 million and 0.020% of such assets in excess of $1 billion, plus holding and transaction charges for this service.
Pursuant to a sub-administration and sub-accounting agreement among the Advisor, SFAC and SSB, SFAC has delegated certain fund accounting functions to SSB under each Portfolio’s fund accounting agreement. The costs and expenses of such delegation are borne by SFAC, not by the Portfolios.
56
The table below shows the fees paid to SFAC for the last three fiscal years.
| | | | | | | | | | |
Portfolio
| | Fiscal 2003
| | Fiscal 2002
| | Fiscal 2001
| |
Money Market Portfolio | | $ | 30,276 | | $ | 28,979 | | $ | 31,500 | |
Bond Portfolio | | $ | 78,258 | | $ | 59,250 | | $ | 45,115 | |
Balanced Portfolio | | $ | 59,616 | | $ | 57,366 | | $ | 61,696 | |
Growth and Income Portfolio | | $ | 68,392 | | $ | 69,585 | | $ | 69,932 | |
Capital Growth Portfolio | | $ | 108,362 | | $ | 116,650 | | $ | 132,101 | |
21st Century Growth Portfolio | | $ | 44,980 | | $ | 42,245 | | $ | 45,285 | |
Global Discovery Portfolio | | $ | 125,625 | | $ | 142,659 | | $ | 148,091 | |
International Portfolio | | $ | 326,304 | | $ | 353,261 | | $ | 434,504 | |
Health Sciences Portfolio | | $ | 47,373 | | $ | 57,322 | | $ | 33,884 | * |
| * | From May 1, 2001 (commencement of operations) through December 31, 2001. |
PORTFOLIO TRANSACTIONS
The Advisor is responsible for placing the orders for the purchase and sale of portfolio securities, including the allocation of brokerage.
The primary objective of the Advisor in placing orders for the purchase and sale of securities for a Portfolio is to obtain the most favorable net results, taking into account such factors, among others, as price, commission (where applicable), size of order, difficulty of execution and skill required of the executing broker-dealer. The Advisor seeks to evaluate the overall reasonableness of brokerage commissions paid with commissions charged on comparable transactions, as well as by comparing commissions paid by a Portfolio to reported commissions paid by others. The Advisor routinely reviews commission rates, execution and settlement services performed and makes internal and external comparisons.
A Portfolio’s purchases and sales of fixed-income securities are generally placed by the Advisor with primary market makers for these securities on a net basis, without any brokerage commission being paid by a Portfolio. Trading does, however, involve transaction costs. Transactions with dealers serving as primary market makers reflect the spread between the bid and asked prices. Purchases of underwritten issues may be made, which will include an underwriting fee paid to the underwriter. In effecting transactions in over-the-counter securities, orders are placed with the principal market makers for the security being traded unless, after exercising care, it appears that more favorable results are available elsewhere.
When it can be done consistently with the policy of obtaining the most favorable net results, the Advisor may place such orders with broker-dealers who supply research services to the Advisor or a Portfolio. The term “research services”, may include, but is not limited to, advice as to the value of securities; the advisability of investing in, purchasing or selling securities; the availability of securities or purchasers or sellers of securities; and analyses and reports concerning issuers, industries, securities, economic factors and trends, portfolio strategy and the performance of accounts. The Advisor is authorized when placing portfolio transactions, if applicable, for a Portfolio to pay a brokerage commission in excess of that which another broker-dealer might charge for executing the same transaction on account of execution services and the receipt of research services. The Advisor has negotiated arrangements, which are not applicable to most fixed income transactions, with certain broker-dealers pursuant to which a broker-dealer will provide research services to the Advisor in exchange for the direction by the Advisor of brokerage transactions to the broker-dealer. These arrangements regarding receipt of research services generally apply to equity security transactions. Although certain research services from broker-dealers may be useful to a Portfolio and to the Advisor, it is the opinion of the Advisor that such information only supplements its own research effort since the information must still be analyzed, weighed and reviewed by the Advisor’s staff. Such information may be useful to the Advisor in providing services to clients other than a Fund and not all such information is used by the Advisor in connection with a Portfolio.
57
Conversely, such information provided to the Advisor by broker-dealers through whom other clients of the Advisor effect securities transactions may be useful to the Advisor in providing services to a Portfolio.
It is likely that the broker-dealers selected based on the foregoing considerations will include firms that also sell shares of the Scudder Funds to their customers. However, the Advisor does not consider sales of Portfolio shares as a factor in the selection of broker-dealers to execute portfolio transactions for the Scudder Funds.
The table below shows total brokerage commissions paid by each Portfolio then existing for the last three fiscal years as applicable and, for the most recent fiscal year, the percentage thereof that was allocated to firms based upon research information provided.
| | | | | | | | | | | | |
Portfolio
| | Fiscal 2001
| | Fiscal 2002
| | Fiscal 2003
| | Allocated to Firms Based on Research in Fiscal 2003
|
Money Market Portfolio | | $ | 0 | | $ | 0 | | $ | 0 | | $ | 0 |
Bond Portfolio | | $ | 0 | | $ | 0 | | $ | 0 | | $ | 0 |
Balanced Portfolio | | $ | 241,759 | | $ | 146,093 | | $ | 28,854 | | $ | 6,013 |
Growth And Income Portfolio | | $ | 262,263 | | $ | 293,418 | | $ | 141,538 | | $ | 21,520 |
Capital Growth Portfolio | | $ | 609,731 | | $ | 351,893 | | $ | 186,147 | | $ | 16,781 |
21st Century Growth Portfolio | | $ | 35,604 | | $ | 115,527 | | $ | 214,675 | | $ | 17,723 |
Global Discovery Portfolio | | $ | 224,998 | | $ | 225,802 | | $ | 209,722 | | $ | 17,620 |
International Portfolio | | $ | 2,449,189 | | $ | 1,852,650 | | $ | 1,586,007 | | $ | 1,925 |
Health Sciences Portfolio* | | $ | 38,237 | | $ | 107,097 | | $ | 160,579 | | $ | 33,227 |
| * | Commenced operations May 1, 2001 |
The Trustees will periodically review whether the recapture for the benefit of the Fund of some portion of the brokerage commissions or similar fees paid by the Fund on portfolio transactions is legally permissible and advisable. No recapture arrangements are currently in effect.
Portfolio Turnover
Portfolio turnover rate is defined by the SEC as the ratio of the lesser of sales or purchases to the monthly average value of securities owned during the year, excluding all securities whose remaining maturities at the time of acquisition were one year or less. Higher levels of activity by a Portfolio result in higher transaction costs and may also result in taxes on realized capital gains to be borne by a Portfolio’s shareholders. Purchases and sales are made whenever necessary, in the Advisor’s discretion, to meet a Portfolio’s objective.
58
Portfolio turnover rates for the two most recent fiscal periods are as follows:
| | | | | | |
| | | 12/31/02
| | | 12/31/03
| |
Bond Portfolio | | 262 | % | | 242 | % |
Balanced Portfolio | | 141 | % | | 99 | % |
Growth and Income Portfolio | | 66 | % | | 37 | % |
Capital Growth Portfolio | | 25 | % | | 13 | % |
Global Discovery Portfolio | | 47 | % | | 41 | % |
International Portfolio | | 123 | % | | 119 | % |
21st Century Growth Portfolio | | 72 | % | | 113 | % |
Health Sciences Portfolio* | | 53 | % | | 64 | % |
Higher levels of activity by a Portfolio result in higher transaction costs and may also result in taxes on realized capital gains to be borne by the Portfolio’s shareholders. Purchases and sales are made whenever necessary, in the Advisor’s discretion, to meet a Portfolio’s objective. Under the above definition, Money Market Portfolio will have no portfolio turnover.
PURCHASES AND REDEMPTIONS
The separate accounts of the Participating Insurance Companies purchase and redeem shares of each Portfolio based on, among other things, the amount of premium payments to be invested and surrender and transfer requests to be effected on that day pursuant to variable annuity contracts and variable life insurance policies, but only on days on which the Exchange is open for trading. Such purchases and redemptions of the shares of each Portfolio are effected at their respective net asset values per share, determined as of the close of regular trading on the Exchange (normally 4 p.m. Eastern time) on that same day except that, in the case of Money Market Portfolio, purchases will not be effected until the next determination of net asset value after federal funds have been made available to the Fund. (See “NET ASSET VALUE.”) Payment for redemptions will be made by State Street Bank and Trust Company or Brown Brothers Harriman & Co., as applicable, on behalf of the Fund and the applicable Portfolios within seven days thereafter. No fee is charged the separate accounts of the Participating Insurance Companies when they redeem Fund shares.
The Fund may suspend the right of redemption of shares of any Portfolio and may postpone payment for any period: (i) during which the Exchange is closed (other than customary weekend and holiday closings) or during which trading on the Exchange is restricted; (ii) when the SEC determines that a state of emergency exists which may make payment or transfer not reasonably practicable, (iii) as the SEC may by order permit for the protection of the security holders of the Fund or (iv) at any other time when the Fund may, under applicable laws and regulations, suspend payment on the redemption of its shares.
Market timing — the frequent trading of portfolio shares designed to take advantage of short-term market movements —can harm a Portfolio and its shareholders. The Portfolios and their agents may reject or limit purchase orders when there appears to be a pattern of market timing or other frequent purchases and sales. Because the Portfolios’ shares are offered exclusively to insurance company separate accounts that fund certain insurance contracts, a portfolio generally has little or no access to the records of individual contract holders. The Portfolios are dependent on the ability of these separate accounts to limit market timing and excessive trading of portfolio shares. The Portfolios are working with separate accounts to assess and improve controls against inappropriate trading. There can be no assurance that market timing in the Portfolios’ shares will not occur.
Should any conflict between VA contract and VLI policy holders arise which would require that a substantial amount of net assets be withdrawn from the Fund, orderly portfolio management could be disrupted to the potential detriment of such contract and policy holders.
59
DIVIDENDS, CAPITAL GAINS AND TAXES
Money Market Portfolio
The net investment income of Money Market Portfolio is determined as of the close of regular trading on the Exchange (normally 4 p.m. Eastern time) on each day on which the Exchange is open for business. All of the net income so determined normally will be declared as a dividend to shareholders of record as of the close of regular trading on such Exchange after the purchase and redemption of shares. Unless the business day before a weekend or holiday is the last day of an accounting period, the dividend declared on that day will include an amount in respect of the Portfolio’s income for the subsequent non-business day or days. No daily dividend will include any amount of net income in respect of a subsequent semi-annual accounting period. Dividends commence on the next business day after the date of purchase. Dividends will be invested in additional shares of the Portfolio at the net asset value per share, normally $1.00, determined as of the first business day of each month unless payment of the dividend in cash has been requested.
Net investment income of Money Market Portfolio consists of all interest income accrued on portfolio assets less all expenses of the Portfolio and amortized market premium. Accredited market discount is included in interest income. The Portfolio does not anticipate that it will normally realize any long-term capital gains with respect to its portfolio.
Normally Money Market Portfolio will have a positive net income at the time of each determination thereof. Net income may be negative if an unexpected liability must be accrued or a loss realized. If the net income of the Portfolio determined at any time is a negative amount, the net asset value per share will be reduced below $1.00 unless one or more of the following steps are taken: the Trustees have the authority (1) to reduce the number of shares in each shareholder’s account, (2) to offset each shareholder’s pro rata portion of negative net income from the shareholder’s accrued dividend account or from future dividends, or (3) to combine these methods in order to seek to maintain the net asset value per share at $1.00. The Fund may endeavor to restore the Portfolio’s net asset value per share to $1.00 by not declaring dividends from net income on subsequent days until restoration, with the result that the net asset value per share will increase to the extent of positive net income which is not declared as a dividend.
Should Money Market Portfolio incur or anticipate, with respect to its portfolio, any unusual or unexpected significant expense or loss which would affect disproportionately the Portfolio’s income for a particular period, the Trustees would at that time consider whether to adhere to the dividend policy described above or to revise it in light of the then prevailing circumstances in order to ameliorate to the extent possible the disproportionate effect of such expense or loss on then existing shareholders. Such expenses or losses may nevertheless result in a shareholder’s receiving no dividends for the period during which the shares are held and in receiving upon redemption a price per share lower than that which was paid. Similarly, should Money Market Portfolio incur or anticipate any unusual or unexpected significant income, appreciation or gain which would affect disproportionately the fund’s income for a particular period, the Trustees or the Executive Committee of the Trustees may consider whether to adhere to the dividend policy described above or to revise it in light of the then prevailing circumstances in order to ameliorate to the extent possible the disproportionate effect of such income, appreciation or gain on the dividend received by existing shareholders. Such actions may reduce the amount of the daily dividend received by existing shareholders.
All Portfolios (except Money Market Portfolio)
Each Portfolio, except Money Market Portfolio, intends to follow the practice of distributing substantially all of its investment company taxable income which includes any excess of net realized short-term capital gains over net realized long-term capital losses. A Portfolio may follow the practice of distributing the entire excess of net realized long-term capital gains over net realized short-term capital losses. However, a Portfolio may retain all or part of such gain for reinvestment, after paying the related federal taxes for which shareholders may then be able to claim a credit against their federal tax liability. If a Portfolio does not distribute the amount of capital gain and/or ordinary income required to be distributed by an excise tax provision of the Code, that Portfolio may be subject to that excise tax.
Each Portfolio, except Money Market Portfolio, intends to distribute investment company taxable income and any net realized capital gains in April each year. Additional distributions may be made if necessary.
60
All distributions will be made in shares of a Portfolio. Both dividends and capital gain distributions will be reinvested in additional shares of such a Portfolio unless an election is made on behalf of a separate account to receive dividends and capital gain distributions in cash.
Each Portfolio of the Fund has elected to be treated as a regulated investment company (a “RIC”) under Subchapter M of the Internal Revenue Code of 1986, as amended (the “Code”). In order to qualify for the special tax treatment accorded RICs and their shareholders, each Portfolio must, among other things, (a) derive at least 90% of its gross income from dividends, interest, payments with respect to certain securities loans, and gains from the sale or other disposition of stock, securities and foreign currencies, or other income (including but not limited to gains from options, futures, or forward contracts) derived with respect to its business of investing in such stock, securities, or currencies; (b) diversify its holdings so that, at the end of each quarter of its taxable year, (i) at least 50% of the market value of the Portfolio’s assets consists of cash and cash items, US government securities, securities of other RICs, and other securities limited in respect of any one issuer to a value not greater than 5% of the value of the Portfolio’s total assets and not more than 10% of the outstanding voting securities of such issuer, and (ii) not more than 25% of the value of its total assets is invested in the securities (other than those of the US Government or other RICs) of any one issuer or of two or more issuers which the fund controls and which are engaged in the same, similar, or related trades or businesses; and (c) distribute to its shareholders with respect to each taxable year at least 90% of the sum of its taxable net investment income, its net tax-exempt income (if any), and, the excess, if any, of net short-term capital gains over net long-term capital losses for such year. To the extent each Portfolio qualifies for treatment as a RIC, it will not be subject to federal income tax on income paid to its shareholders in the form of dividends or capital gain distributions. Such qualification does not involve governmental supervision or management of investment practices or policy.
If for any taxable year a Portfolio does not qualify for the special federal income tax treatment afforded RICs, all of its taxable income will be subject to federal income tax at regular corporate rates. In addition, the fund could be required to recognize unrealized gains, pay substantial taxes and interest and make substantial distributions before requalifying as a RIC that is accorded special tax treatment.
Section 817(h) of the Code requires that the investments of a segregated asset account (a “Separate Account”) of an insurance company be “adequately diversified” as provided therein or in accordance with US Treasury Regulations in order for the account to serve as the basis for VA contracts or VLI policies. Each Portfolio intends to comply with applicable requirements so that the Portfolio’s investments are “adequately diversified” for this purpose. Section 817(h) and the US Treasury Regulations thereunder provide the manner in which a segregated asset account will treat investments in a RIC for purposes of the diversification requirements. If a Portfolio satisfies certain conditions, a Separate Account owning shares of the Portfolio will be treated as owning multiple investments consisting of the Separate Account’s proportionate share of each of the assets of the Portfolio. Each Portfolio intends to satisfy these conditions so that the shares of the Portfolio owned by a segregated asset account of an insurance company depositor will be treated as multiple investments. If, however, a Portfolio is not “adequately diversified” within the meaning of Section 817(h) of the Code, the VA contracts and VLI policies supported by the Portfolio may not be treated as annuity or life insurance contracts, as the case may be, for any period (or subsequent period) during which the Portfolio is not “adequately diversified.”
Shareholders of the Portfolios may be subject to state and local taxes on distributions received from such Portfolios and on redemptions of their shares.
Each distribution is accompanied by a brief explanation of the form and character of the distribution.
The Fund is organized as a Massachusetts business trust, and neither the Fund nor the Portfolios are liable for any income or franchise tax in the Commonwealth of Massachusetts providing each Portfolio continues to qualify as a regulated investment company under Subchapter M of the Code.
The foregoing discussion of US federal income tax law relates solely to the application of that law to US persons. Each shareholder which is not a US person should consider the US and foreign tax consequences of ownership of shares of the Portfolio, including the possibility that such a shareholder may be subject to a US withholding tax at a rate of 30% (or at
61
a lower rate under an applicable income tax treaty) on amounts constituting ordinary income received by it, where such amounts are treated as income from US sources under the Code.
For further information concerning federal income tax consequences for the holders of the VA contracts and VLI policies, shareholders should consult the prospectus used in connection with the issuance of their particular contracts or policies. Shareholders should consult their tax advisers about the application of the provisions of tax law described in this statement of additional information in light of their particular tax situations.
NET ASSET VALUE
The net asset value of each Portfolio is computed as of the close of regular trading on the New York Stock Exchange (the “Exchange”) on each day the Exchange is open for regular trading (the “Value Time”). The Exchange is scheduled to be closed on the following holidays: New Year’s Day, Dr. Martin Luther King, Jr. Day, Presidents’ Day, Good Friday, Memorial Day, Independence Day, Labor Day, Thanksgiving and Christmas, and on the preceding Friday or subsequent Monday when one of these holidays falls on a Saturday or Sunday, respectively. Net asset value per share is determined separately for each class of shares by dividing the net asset value of such class, which is the value of the total assets of each Portfolio attributable to the shares of that class, less all liabilities attributable to that class, by the total number of shares of that class outstanding. The per share net asset value may be lower for certain classes of each Portfolio because of higher expenses borne by these classes.
An equity security is valued at its most recent sale price on the relevant exchange or OTC market as of the Value Time. Lacking any sales, the security is valued at the calculated mean between the most recent bid quotation and the most recent asked quotation (the “Calculated Mean”) on such exchange or OTC market as of the Value Time. If it is not possible to determine the Calculated Mean, the security is valued at the most recent bid quotation on such exchange or OTC market as of the Value Time. In the case of certain foreign exchanges or OTC markets, the closing price reported by the exchange or OTC market (which may sometimes be referred to as the “official close” or the “official closing price” or other similar term) will be considered the most recent sale price. If a security is traded on more than one exchange, or upon one or more exchanges and in the OTC market, quotations are taken from the market in which the security is traded most extensively.
Debt securities are valued as follows. Money market instruments purchased with an original or remaining maturity of 60 days or less, maturing at par, are valued at amortized cost. Other money market instruments are valued based on information obtained from an approved pricing agent or, if such information is not readily available, by using matrix pricing techniques (formula driven calculations based primarily on current market yields). Bank loans are valued at prices supplied by an approved pricing agent (which are intended to reflect the mean between the bid and asked prices), if available, and otherwise at the mean of the most recent bid and asked quotations or evaluated prices, as applicable, based on quotations or evaluated prices obtained from one or more broker-dealers. Privately placed debt securities, other than Rule 144A debt securities, initially are valued at cost and thereafter based on all relevant factors including type of security, size of holding and restrictions on disposition. Municipal debt securities are valued at prices supplied by an approved pricing agent (which are intended to reflect the mean between the bid and asked prices), if available, and otherwise at the average of the means based on the most recent bid and asked quotations or evaluated prices obtained from two broker-dealers. Other debt securities are valued at prices supplied by an approved pricing agent, if available, and otherwise at the most recent bid quotation or evaluated price, as applicable, obtained from one or more broker-dealers. If it is not possible to value a particular debt security pursuant to the above methods, the security is valued on the basis of factors including (but not limited to) maturity, coupon, creditworthiness, currency denomination, and the movement of the market in which the security is normally traded.
An exchange-traded option contract on securities, currencies and other financial instruments is valued at its most recent sale price on such exchange. Lacking any sales, the option contract is valued at the Calculated Mean. If it is not possible to determine the Calculated Mean, the option contract is valued at the most recent bid quotation in the case of a purchased option contract or the most recent asked quotation in the case of a written option contract, in each case as of the Value Time. An option contract on securities, currencies and other financial instruments traded in the OTC market is valued at the evaluated price provided by the broker-dealer with which it was traded. Futures contracts (and options thereon) are valued at the most recent settlement price, if available, on the exchange on which they are traded most
62
extensively. With the exception of stock index futures contracts which trade on the Chicago Mercantile Exchange, closing settlement times are prior to the close of trading on the New York Stock Exchange. For stock index futures contracts which trade on the Chicago Mercantile Exchange, closing settlement prices are normally available at approximately 4:20 Eastern time. If no settlement price is available, the last trade price on such exchange will be used.
Following the valuations of securities or other portfolio assets in terms of the currency in which the market quotation used is expressed (“Local Currency”), the value of these portfolio assets in terms of US dollars is calculated by converting the Local Currency into US dollars at the prevailing currency exchange rate on the valuation date.
If market quotations for a portfolio asset are not readily available or the value of a portfolio asset as determined in accordance with Board approved procedures does not represent the fair market value of the portfolio asset, the value of the portfolio asset is taken to be an amount which, in the opinion of the Fund’s Pricing Committee (or, in some cases, the Board’s Valuation Committee), represents fair market value. The value of other portfolio holdings owned by the Fund is determined in a manner which is intended to fairly reflect the fair market value of the asset on the valuation date, based on valuation procedures adopted by the Fund’s Board and overseen primarily by the Fund’s Pricing Committee.
For Money Market Portfolio. The net asset value of shares of the Portfolio is calculated at 4:00 p.m. Eastern time or the close of business on each day the New York Stock Exchange (the “Exchange”) is open for trading. The Exchange is scheduled to be closed on the following holidays: New Year’s Day, Dr. Martin Luther King, Jr. Day, Presidents’ Day, Good Friday, Memorial Day, Independence Day, Labor Day, Thanksgiving and Christmas, and on the preceding Friday or subsequent Monday when one of these holidays falls on a Saturday or Sunday, respectively.
Money Market Portfolio values its portfolio instruments at amortized cost, which does not take into account unrealized capital gains or losses. This involves initially valuing an instrument at its cost and thereafter assuming a constant amortization to maturity of any discount or premium, regardless of the impact of fluctuating interest rates on the market value of the instrument. While this method provides certainty in valuation, it may result in periods during which value, as determined by amortized cost, is higher or lower than the price the Portfolio would receive if it sold the instrument. Calculations are made to compare the value of the Portfolio’s investments valued at amortized cost with market values. Market valuations are obtained by using actual quotations provided by market makers, estimates of market value, or values obtained from yield data relating to classes of money market instruments published by reputable sources at the mean between the bid and asked prices for the instruments. If a deviation of 1/2 of 1% or more were to occur between the net asset value per share calculated by reference to market values and the Portfolio’s $1.00 per share net asset value, or if there were any other deviation that the Board of Trustees of the Fund believed would result in a material dilution to shareholders or purchasers, the Board of Trustees would promptly consider what action, if any, should be initiated. If a the Portfolio’s net asset value per share (computed using market values) declined, or were expected to decline, below $1.00 (computed using amortized cost), the Board of Trustees of the Fund might temporarily reduce or suspend dividend payments in an effort to maintain the net asset value at $1.00 per share. As a result of such reduction or suspension of dividends or other action by the Board of Trustees, an investor would receive less income during a given period than if such a reduction or suspension had not taken place. Such action could result in investors receiving no dividend for the period during which they hold their shares and receiving, upon redemption, a price per share lower than that which they paid. On the other hand, if the Portfolio’s net asset value per share (computed using market values) were to increase, or were anticipated to increase above $1.00 (computed using amortized cost), the Board of Trustees might supplement dividends in an effort to maintain the net asset value at $1.00 per share. Redemption orders received in connection with the administration of checkwriting programs by certain dealers or other financial services firms prior to the determination of the Portfolio’s net asset value also may be processed on a confirmed basis in accordance with the procedures established by SDI.
TRUSTEES AND OFFICERS
Scudder Variable Series I
The following table presents certain information regarding the Trustees and Officers of the Fund as of May 1, 2004. Each Trustee’s year of birth is set forth in parentheses after his or her name. Unless otherwise noted, (i) each Trustee has engaged in the principal occupation(s) noted in the table for at least the most recent five years, although not necessarily
63
in the same capacity, and (ii) the address of each Trustee is c/o Dawn-Marie Driscoll, PO Box 100176, Cape Coral, FL 33910. Unless otherwise indicated, the address of each Officer is Two International Place, Boston, MA 02110. The term of office for each Trustee is until the next meeting of shareholders called for the purpose of electing Trustees and until the election and qualification of a successor, or until such Trustee sooner dies, resigns, retires or is removed as provided in the governing documents of Scudder Variable Series I. Because the Fund does not hold an annual meeting of shareholders, each Trustee will hold office for an indeterminate period. The Trustees of the Fund may also serve in similar capacities with other funds in the fund complex.
Independent Trustees
| | | | |
Name, Year of Birth, Position(s)
Held with the Fund and Length of Time
Served^1
| | Principal Occupation(s) During Past 5 Years and Other Directorships Held
| | Number of Funds in
Fund Complex
Overseen
|
| Henry P. Becton, Jr. (1943) Trustee, 1990-present | | President, WGBH Educational Foundation. Directorships: Becton Dickinson and Company (medical technology company); The A.H. Belo Company (media company); Concord Academy; Boston Museum of Science; Public Radio International, Former Directorships: American Public Television; New England Aquarium; Mass. Corporation for Educational Telecommunications; Committee for Economic Development; Public Broadcasting Service | | 48 |
| | |
| Dawn-Marie Driscoll (1946) Trustee, 1987-present | | President, Driscoll Associates (consulting firm); Executive Fellow, Center for Business Ethics, Bentley College; formerly, Partner, Palmer & Dodge (1988-1990); Vice President of Corporate Affairs and General Counsel, Filene’s (1978-1988). Directorships: CRS Technology (technology service company); Advisory Board, Center for Business Ethics, Bentley College; Board of Governors, Investment Company Institute; former Chairman, ICI Directors Services Committee | | 48 |
| | |
Keith R. Fox (1954)
Trustee, 1996-present | | Managing Partner, Exeter Capital Partners (private equity funds). Directorships: Facts on File (school and library publisher); Progressive Holding Corporation (kitchen importer and distributor); Cloverleaf Transportation Inc. (trucking); K-Media, Inc. (broadcasting); Natural History, Inc. (magazine publisher); National Association of Small Business Investment Companies (trade association) | | 48 |
| | |
Louis E. Levy (1932)
Trustee, 2002-present | | Retired. Formerly, Chairman of the Quality Control Inquiry Committee, American Institute of Certified Public Accountants (1992-1998); Partner, KPMG LLP (1958-1990). Directorships: Household International (banking and finance); ISI Family of Funds (registered investment companies; 4 funds overseen) | | 48 |
| | |
| Jean Gleason Stromberg (1943) Trustee, 1999-present | | Retired. Formerly, Consultant (1997-2001); Director, US General Accounting Office (1996-1997); Partner, Fulbright & Jaworski, L.L.P. (law firm) (1978-1996). Directorships: The William and Flora Hewlett Foundation; Service Source, Inc. | | 48 |
64
| | | | |
Name, Year of Birth,
Position(s)
Held with the Fund and
Length of Time Served^1
| | Principal Occupation(s) During Past 5 Years and
Other Directorships Held
| | Number of Funds in
Fund Complex
Overseen
|
Jean C. Tempel (1943)
Trustee, 1994-present | | Managing Partner, First Light Capital (venture capital group) (2000-present); formerly, Special Limited Partner, TL Ventures(1994-1996); President and Chief Operating Officer, Safeguard Scientifics, Inc. (public technology business incubator company) (1991-1993). Directorships: Sonesta International Hotels, Inc.; Aberdeen Group (technology research); United Way of Mass. Bay; The Commonwealth Institute (supports women entrepreneurs) Trusteeships: Connecticut College, Vice Chair of Board, Chair, Finance Committee; Northeastern University, Vice Chair of Finance Committee, Chair, Funds and Endowment Committee | | 48 |
| | |
Carl W. Vogt (1936)
Trustee, 2002-present | | Senior Partner, Fulbright & Jaworski, L.L.P (law firm); formerly, President (interim) of Williams College (1999-2000); President, certain funds in the Deutsche Asset Management Family of Funds (formerly, Flag Investors Family of Funds) (registered investment companies) (1999-2000). Directorships: Yellow Corporation (trucking); American Science & Engineering (x-ray detection equipment); ISI Family of Funds (registered investment companies; 4 funds overseen); National Railroad Passenger Corporation (Amtrak); formerly, Chairman and Member, National Transportation Safety Board | | 48 |
Interested Trustee and Officers^2
| | | | |
Name, Year of Birth, Position(s) Held with the Fund and Length of Time Served^1
| | Principal Occupation(s) During Past 5 Years and
Other Directorships Held
| | Number of Funds in
Fund Complex
Overseen
|
Richard T. Hale^3 (1945)Chairman and Trustee,
2002-present, Chief Executive Officer, 2003-present | | Managing Director, Deutsche Investment Management Americas Inc (2003 to present); Managing Director, Deutsche Bank Securities Inc. (formerly Deutsche Banc Alex. Brown Inc.) and Deutsche Asset Management (1999 to present); Director and President, InvestmentCompany Capital Corp. (registered investment advisor) (1996 to present); Director, Deutsche Global Funds, Ltd. (2000 to present), (registered investment company); Director, Scudder Global Opportunities Funds (since 2003); Director/Officer Deutsche/Scudder Mutual Funds (various dates); President, Montgomery Street Income Securities, Inc. (2002 to present) (registered investment companies); Vice President, Deutsche Asset Management, Inc. (2000 to present); formerly, Director, ISI Family of Funds (registered investment companies; 4 funds overseen) (1992-1999) | | 202 |
| | |
Brenda Lyons (1963)
President, 2003-present | | Managing Director, Deutsche Asset Management | | n/a |
| | |
John Millette (1962)
Vice President and Secretary,
1999-present | | Director, Deutsche Asset Management | | n/a |
65
| | | | |
Name, Year of Birth, Position(s) Held with the Fund and Length of Time Served^1
| | Principal Occupation(s) During Past 5 Years and
Other Directorships Held
| | Number of Funds in
Fund Complex
Overseen
|
Kenneth Murphy (1963)
Vice President, 2002-present | | Vice President, Deutsche Asset Management (2000-present); formerly, Director, John Hancock Signature Services (1992-2000) | | n/a |
| | |
Charles A. Rizzo (1957)
Treasurer and Chief Financial Officer, 2002-present | | Managing Director, Deutsche Asset Management (April 2000-present); formerly, Vice President and Department Head, BT Alex. Brown Incorporated (now Deutsche Bank Securities Inc.)(1998-1999); Senior Manager, Coopers & Lybrand L.L.P. (now PricewaterhouseCoopers LLP) (1993-1998) | | n/a |
| | |
Lisa Hertz^4 (1970)
Assistant Secretary,
2003-present | | Assistant Vice President, Deutsche Asset Management | | n/a |
| | |
Daniel O. Hirsch^3 (1954)
Assistant Secretary,
2002-present | | Managing Director, Deutsche Asset Management (2002-present) and Director, Deutsche Global Funds Ltd. (2002-present); formerly, Director, Deutsche Asset Management (1999-2002); Principal, BT Alex. Brown Incorporated (now Deutsche Bank Securities Inc.) (1998-1999); Assistant General Counsel, United States Securities and Exchange Commission (1993-1998) | | n/a |
| | |
Caroline Pearson (1962)
Assistant Secretary,
1997-present | | Managing Director, Deutsche Asset Management | | n/a |
| | |
Kathleen Sullivan D’Eramo
(1957) Assistant Treasurer,
2003-present | | Director, Deutsche Asset Management | | n/a |
| | |
Salvatore Schiavone (1965) Assistant Treasurer,
2003-present | | Director, Deutsche Asset Management | | n/a |
| | |
Lucinda Stebbins (1945)
Assistant Treasurer,
2003-present | | Director, Deutsche Asset Management | | n/a |
| ^1 | Length of time served represents the date that each Trustee was first elected to the common Board of Trustees which oversees a number of investment companies, including the fund, managed by the Advisor. For the Officers of the Fund, the length of time served represents the date that each Officer was first elected to serve as an Officer of any fund overseen by the aforementioned common board of Trustees. |
| ^2 | As a result of their respective positions held with the Advisor, these individuals are considered “interested persons” of the Advisor within the meaning of the 1940 Act. Interested persons receive no compensation from the Funds. |
| ^3 | Address: One South Street, Baltimore, Maryland |
| ^4 | Address: 345 Park Avenue, New York, New York |
Officers’ Role with Principal Underwriter: Scudder Distributors, Inc.
| | |
Kenneth Murphy: | | Vice President |
Caroline Pearson: | | Secretary |
66
Trustees’ Responsibilities. The primary responsibility of the Board of Trustees is to represent the interests of the Fund’s shareholders and to provide oversight of the management of the Fund. Currently, seven of the Board’s members are “Independent Trustees;” that is, they are not “interested persons” (as defined in the 1940 Act) of the Fund or the Advisor.
The Trustees meet multiple times during the year to review the investment performance of the Fund and other operational matters, including policies and procedures designed to assure compliance with regulatory and other requirements. In 2003, the Trustees conducted 34 meetings to deal with fund issues (including regular and special board and committee meetings). These meetings were held over the course of 19 different days. In addition, various Trustees participated as members of the Board’s Valuation Committee throughout the year. Furthermore, the Independent Trustees review the fees paid to the Advisor and its affiliates for investment advisory services and other administrative and shareholder services. The Trustees have adopted specific policies and guidelines that, among other things, seek to further enhance the effectiveness of the Independent Trustees in performing their duties. Many of these are similar to those suggested in the Investment Company Institute’s 1999 Report of the Advisory Group on Best Practices for Fund Directors. For example, the Independent Trustees select independent legal counsel to work with them in reviewing fees, advisory and other contracts and overseeing fund matters. The Trustees are also assisted in this regard by the Fund’s independent public accountants and other independent experts retained from time to time for this purpose. The Independent Trustees regularly meet privately with their counsel and other advisors. In addition, the Independent Trustees from time to time have appointed task forces and subcommittees from their members to focus on particular matters such as investment, accounting and shareholders servicing issues.
For a discussion of the factors considered by the Board in connection with its most recent approval of the continuation of the Fund’s management contracts, please refer to “Management of the Funds—Board Considerations in Connection with Annual Renewal of Investment Management Agreements.”
Board Committees. The Board has the following standing committees:
Audit Committee: The Audit Committee makes recommendations regarding the selection of independent auditors for the Fund, reviews the independence of such firm, reviews the scope of audit and internal controls, considers and reports to the Board on matters relating to the Fund’s accounting and financial reporting practices, and performs such other tasks as the full Board deems necessary or appropriate. The Audit Committee receives annual representations from the independent accountants as to their independence. The members of the Audit Committee are Henry P. Becton, Jr., Dawn-Marie Driscoll, Keith R. Fox, Louis E. Levy (Chair), Jean Gleason Stromberg, Jean C. Tempel and Carl W. Vogt. The Audit Committee held six meetings during the calendar year 2003.
Committee on Independent Trustees: The Committee on Independent Trustees selects and nominates Independent Trustees*; establishes Trustee compensation, retirement, fund ownership and other corporate governance policies and conducts periodic reviews of independent legal counsel. The members of the Committee on Independent Trustees are Henry P. Becton, Jr., Dawn-Marie Driscoll (Chair), Keith R. Fox, Louis E. Levy, Jean Gleason Stromberg, Jean C. Tempel and Carl W. Vogt. The Committee on Independent Trustees held five meetings during the calendar year 2003.
Valuation Committee: The Valuation Committee oversees fund valuation matters, reviews Valuation Procedures adopted by the Board, determines fair value of the Fund’s securities as needed in accordance with the Valuation Procedures when actual market values are unavailable and performs such other tasks as the full Board deems necessary. The members of the Valuation Committee are Keith R. Fox and Richard T. Hale. The Alternate Valuation Committee members are Henry P. Becton, Jr., Jean Gleason Stromberg and Jean C. Tempel. The Valuation Committee held one meeting on behalf of each Portfolio during the calendar year 2003.
Investment Oversight Committee: The Board has established two Investment Oversight Committees, one focusing on funds primarily investing in equity securities (the “Equity Oversight Committee”) and one focusing on funds primarily investing in fixed income securities (the “Fixed Income Oversight Committee”). These Committees meet regularly with fund portfolio managers and other investment personnel to review the relevant funds’ investment strategies and investment performance. The members of the Equity Oversight Committee are Henry P. Becton, Jr. (Chair), Jean C. Tempel and Carl W. Vogt. The members of the Fixed Income Oversight Committee are Dawn-Marie Driscoll, Keith R.
67
Fox, Louis E. Levy and Jean Gleason Stromberg (Chair). Each Investment Oversight Committee held four meetings during the calendar year 2003.
Shareholder Servicing and Distribution Committee: The Shareholder Servicing and Distribution Committee oversees (i) the quality, type and level of shareholder services provided to the Fund and its shareholders, and (ii) the distribution related services provided to the Fund and its shareholders. The members of the Shareholder Servicing and Distribution Committee are Henry P. Becton, Jr., Dawn-Marie Driscoll, Keith R. Fox (Co-Chair), Louis E. Levy, Jean Gleason Stromberg, Jean C. Tempel (Co-Chair) and Carl W. Vogt. The Shareholder Servicing and Distribution Committee held four meetings during the calendar year 2003.
| * | Fund Shareholders may also submit nominees that will be considered by the committee when a Board vacancy occurs. Submissions should be mailed to: c/o Dawn-Marie Driscoll, PO Box 100176, Cape Coral, FL 33910. |
Remuneration. Each Independent Trustee receives compensation from the Fund for his or her services, which includes an annual retainer and an attendance fee for each meeting attended. No additional compensation is paid to any Independent Trustee for travel time to meetings, attendance at directors’ educational seminars or conferences, service on industry or association committees, participation as speakers at directors’ conferences or service on special director task forces or subcommittees. Independent Trustees do not receive any employee benefits such as pension or retirement benefits or health insurance.
Members of the Board of Trustees who are officers, directors, employees or stockholders of the Advisor or its affiliates receive no direct compensation from the Fund, although they are compensated as employees of the Advisor, or its affiliates, and as a result may be deemed to participate in fees paid by the Fund. The following table shows compensation received by each Trustee from the Fund and aggregate compensation from all of the funds in the fund complex during the calendar year 2003.
| | | | | | | | | |
Name of Trustee
| | Compensation from
Scudder Variable
Series I
| | Pension or
Retirement Benefits
Accrued as Part of
Fund Expenses
| | Total Compensation
Paid to Trustee from
the Fund Complex (3)(4)
|
Henry P. Becton, Jr. | | $ | 9,795 | | $ | 0 | | $ | 163,000 |
Dawn-Marie Driscoll(1) | | $ | 10,492 | | $ | 0 | | $ | 179,780 |
Keith R. Fox | | $ | 10,082 | | $ | 0 | | $ | 169,780 |
Louis E. Levy(2) | | $ | 9,839 | | $ | 0 | | $ | 163,000 |
Jean Gleason Stromberg | | $ | 9,796 | | $ | 0 | | $ | 163,000 |
Jean C. Tempel | | $ | 9,591 | | $ | 0 | | $ | 158,000 |
Carl W. Vogt | | $ | 9,842 | | $ | 0 | | $ | 162,000 |
| (1) | Includes $10,000 in annual retainer fees in Ms. Driscoll’s role as Lead Trustee. |
| (2) | In addition to these payments, Mr. Levy received payments in the amount of $2,569 (representing amounts earned in prior years and gain or interest thereon) from funds existing prior to the Deutsche Bank purchase of Scudder Investments. |
| (3) | For each Trustee, total compensation includes compensation for service on the boards of 18 trusts/corporations comprised of 47 funds/portfolios. Each Trustee currently serves on the boards of 19 DeAM trusts/corporations comprised of 48 funds/portfolios. |
| (4) | Aggregate compensation reflects amounts paid to the Trustees for special meetings in connection with amending the administrative services agreement and the transfer agency agreement and the delegation of certain fund accounting functions to State Street Bank and Trust Company. Such amounts totaled $8,000 for each Trustee, except Mr. Vogt who was paid $7,000. These meeting fees were borne by the Advisor. |
68
Trustee Fund Ownership of Independent and Interested Trustees
The following sets forth ranges of Trustee beneficial share ownership as of December 31, 2003.
| | | | |
Name of Trustee
| | Dollar Range of
Securities Owned in
Scudder Variable Series I
| | Aggregate Dollar Range of
Securities Owned in All Funds
in the Fund Complex
Overseen by Trustee
|
Henry P. Becton, Jr. | | None | | Over $100,000 |
Dawn-Marie Driscoll | | None | | Over $100,000 |
Keith R. Fox | | None | | Over $100,000 |
Richard T. Hale | | None | | Over $100,000 |
Louis E. Levy | | None | | Over $100,000 |
Jean Gleason Stromberg | | None | | Over $100,000 |
Jean C. Tempel | | None | | Over $100,000 |
Carl W. Vogt | | None | | Over $100,000 |
Securities Beneficially Owned
As of April 5, 2004, all Trustees and Officers of the Fund as a group owned beneficially (as that term is defined is section 13(d) of the Securities Exchange Act of 1934) less than 1% of each class of the Fund’s portfolios.
To the best of the Fund’s knowledge, as of April 5, 2004, no person owned of record or beneficially 5% or more of any class of a Portfolio’s outstanding shares, except as noted below:
As of April 5, 2004, 2,179,798 shares in the aggregate, or 22.74% of the outstanding shares of Scudder Variable Series I: 21st Century Growth Portfolio, Class A were held in the name of Allmerica Life Ins. Co., 440 Lincoln Street, Worcester, MA 01653-0002 who may be deemed to be the beneficial owner of such shares.
As of April 5, 2004, 1,242,556 shares in the aggregate, or 12.97% of the outstanding shares of Scudder Variable Series I: 21st Century Growth Portfolio, Class A were held in the name of Charter Nat. Life Ins. Co.-Horizon, 2940 S. 84th Street, Lincoln, NE 68506-4142 who may be deemed to be the beneficial owner of such shares.
As of April 5, 2004, 5,850,019 shares in the aggregate, or 61.04% of the outstanding shares of Scudder Variable Series I: 21st Century Growth Portfolio, Class A were held in the name of Zurich Destinations/Farmers Fund, C/O Kilico Windy Point II, 1600 McConnor Pkwy, Schaumburg, IL 60196-6800 who may be deemed to be the beneficial owner of such shares.
As of April 5, 2004, 1,485,735 shares in the aggregate, or 96.48% of the outstanding shares of Scudder Variable Series I: 21st Century Growth Portfolio, Class B were held in the name of The Manufactures Life Ins. Co., (USA) 500 Boylston St., Ste. 400, Boston, MA 02116-3740 who may be deemed to be the beneficial owner of such shares.
As of April 5, 2004, 4,295,247 shares in the aggregate, or 34.51% of the outstanding shares of Scudder Variable Series I: Balanced Portfolio, Class A were held in the name of Charter Nat. Life Ins. Co.-Horizon, 2940 S. 84th Street, Lincoln, NE 68506-4142 who may be deemed to be the beneficial owner of such shares.
As of April 5, 2004, 1,798,425 shares in the aggregate, or 14.45% of the outstanding shares of Scudder Variable Series I: Balanced Portfolio, Class A were held in the name of Lincoln Benefit Life Annuity-270, 2940 S. 84th Street, Lincoln, NE 68506-4142 who may be deemed to be the beneficial owner of such shares.
As of April 5, 2004, 5,089,507 shares in the aggregate, or 40.89% of the outstanding shares of Scudder Variable Series I: Balanced Portfolio, Class A were held in the name of SAFECO-130, Mutual Fund Controllers, Separate
69
Accounts Accounting, 4854 154th PL NE, Redmond, WA 98052-9664 who may be deemed to be the beneficial owner of such shares.
As of April 5, 2004, 2,475,917 shares in the aggregate, or 10.13% of the outstanding shares of Scudder Variable Series I: Bond Portfolio, Class A were held in the name of Charter Nat. Life Ins. Co.-Horizon, 2940 S. 84th Street, Lincoln, NE 68506-4142 who may be deemed to be the beneficial owner of such shares.
As of April 5, 2004, 3,040,677 shares in the aggregate, or 12.44% of the outstanding shares of Scudder Variable Series I: Bond Portfolio, Class A were held in the name of Lincoln Benefit Life Annuity-270, 2940 S. 84th Street, Lincoln, NE 68506-4142 who may be deemed to be the beneficial owner of such shares.
As of April 5, 2004, 7,356,853 shares in the aggregate, or 30.10% of the outstanding shares of Scudder Variable Series I: Bond Portfolio, Class A were held in the name of Mutual of America, 320 Park Ave., New York, NY 10022-6815 who may be deemed to be the beneficial owner of such shares.
As of April 5, 2004, 5,620,009 shares in the aggregate, or 23.00% of the outstanding shares of Scudder Variable Series I: Bond Portfolio, Class A were held in the name of Mutual of America Sep. Acct. 2, 320 Park Ave., Saint Louis, MO 63122 who may be deemed to be the beneficial owner of such shares.
As of April 5, 2004, 2,371,840 shares in the aggregate, or 5.01% of the outstanding shares of Scudder Variable Series I: Capital Growth Portfolio, Class A were held in the name of Allmerica Life Ins. Co., 440 Lincoln St., Worcester, MA 01653-0002 who may be deemed to be the beneficial owner of such shares.
As of April 5, 2004, 7,203,001 shares in the aggregate, or 15.22% of the outstanding shares of Scudder Variable Series I: Capital Growth Portfolio, Class A were held in the name of Mutual of America, 320 Park Ave., New York, NY 10022-6815 who may be deemed to be the beneficial owner of such shares.
As of April 5, 2004, 20,738,331 shares in the aggregate, or 43.83% of the outstanding shares of Scudder Variable Series I: Capital Growth Portfolio, Class A were held in the name of Mutual of America Sep. Acct. 2, 320 Park Ave., Saint Louis, MO 63122 who may be deemed to be the beneficial owner of such shares.
As of April 5, 2004, 3,322,511 shares in the aggregate, or 7.02% of the outstanding shares of Scudder Variable Series I: Capital Growth Portfolio, Class A were held in the name of Zurich Destinations/Farmers Fund, C/O Kilico, Windy Point II, 1600 McConnor Pkwy, Schaumburg, IL 60196-6800 who may be deemed to be the beneficial owner of such shares.
As of April 5, 2004, 1,105,742 shares in the aggregate, or 91.40% of the outstanding shares of Scudder Variable Series I: Capital Growth Portfolio, Class B were held in the name of The Manufactures Life Ins. Co. (USA), 500 Boylston St., Ste. 400, Boston, MA 02116-3740 who may be deemed to be the beneficial owner of such shares.
As of April 5, 2004, 5,958,487 shares in the aggregate, or 12.59% of the outstanding shares of Scudder Variable Series I: Capital Growth Portfolio, Class A were held in the name of Charter Nat. Life Ins. Co.,-Horizon, 2940 S. 84th St., Lincoln, NE 68506-4142 who may be deemed to be the beneficial owner of such shares
As of April 5, 2004, 3,984,775 shares in the aggregate, or 22.31% of the outstanding shares of Scudder Variable Series I: Global Discovery Portfolio, Class A were held in the name of Allmerica Life Ins. Co., 440 Lincoln St., Worcester, MA 01653-0002 who may be deemed to be the beneficial owner of such shares.
As of April 5, 2004, 1,975,674 shares in the aggregate, or 11.06% of the outstanding shares of Scudder Variable Series I: Global Discovery Portfolio, Class A were held in the name of Allmerica Life Ins. Co.-Horizon, 2940 S. 84th St., Lincoln, NE 68506-4142 who may be deemed to be the beneficial owner of such shares.
As of April 5, 2004, 518,605 shares in the aggregate, or 35.11% of the outstanding shares of Scudder Variable Series I: Global Discovery Portfolio, Class B were held in the name of United of Omaha, Attn: Product Accounting and
70
Reporting, 11th Floor, Mutual of Omaha Plaza, Omaha, NE 68175-0001 who may be deemed to be the beneficial owner of such shares.
As of April 5, 2004, 9,638,638 shares in the aggregate, or 53.96% of the outstanding shares of Scudder Variable Series I: Global Discovery Portfolio, Class A were held in the name of Zurich Destinations/Farmers Fund, C/O Kilico, Windy Point II, 1600 McConnor Pkwy, Schaumburg, IL 60196-6800 who may be deemed to be the beneficial owner of such shares.
As of April 5, 2004, 871,472 shares in the aggregate, or 59.00% of the outstanding shares of Scudder Variable Series I: Global Discovery Portfolio, Class B were held in the name of The Manufactures Life Ins. Co. (USA), 500 Boylston St., Ste. 400, Boston, MA 02116-3740 who may be deemed to be the beneficial owner of such shares.
As of April 5, 2004, 4,319,159 shares in the aggregate, or 23.20% of the outstanding shares of Scudder Variable Series I: Growth and Income Portfolio, Class A were held in the name of Allmerica Life Ins. Co., 440 Lincoln St., Worcester, MA 01653-0002 who may be deemed to be the beneficial owner of such shares.
As of April 5, 2004, 4,245,066 shares in the aggregate, or 22.80% of the outstanding shares of Scudder Variable Series I: Growth and Income Portfolio, Class A were held in the name of Charter Nat. Life Ins. Co.-Horizon, 2940 S. 84th St., Lincoln, NE 68506-4142 who may be deemed to be the beneficial owner of such shares.
As of April 5, 2004, 696,509 shares in the aggregate, or 28.64% of the outstanding shares of Scudder Variable Series I: Growth and Income Portfolio, Class B were held in the name of United of Omaha, Attn: Product Accounting & Reporting, 11th Floor, Mutual of Omaha Plaza, Omaha, NE 68175-0001 who may be deemed to be the beneficial owner of such shares.
As of April 5, 2004, 5,512,674 shares in the aggregate, or 29.61% of the outstanding shares of Scudder Variable Series I: Growth and Income Portfolio, Class A were held in the name of Zurich Destinations/Farmers Fund, C/O Kilico, Windy Point II, 1600 McConnor Pkwy, Schaumburg, IL 60196-6800 who may be deemed to be the beneficial owner of such shares.
As of April 5, 2004, 1,495,066 shares in the aggregate, or 61.48% of the outstanding shares of Scudder Variable Series I: Growth and Income Portfolio, Class B were held in the name of The Manufactures Life Ins. Co., (USA) 500 Boylston St., Ste. 400, Boston, MA 02116-3740 who may be deemed to be the beneficial owner of such shares.
As of April 5, 2004, 136,642 shares in the aggregate, or 5.62% of the outstanding shares of Scudder Variable Series I: Growth and Income Portfolio, Class B were held in the name of Travelers Life & Annuity Company, 1 City Place, Hartford, CT 06103-3408 who may be deemed to be the beneficial owner of such shares.
As of April 5, 2004, 2,596,253 shares in the aggregate, or 27.17% of the outstanding shares of Scudder Variable Series I: Health Sciences Portfolio, Class A were held in the name of Allmerica Life Ins. Co., 440 Lincoln St., Worcester, MA 01653-0002 who may be deemed to be the beneficial owner of such shares.
As of April 5, 2004, 6,893,652 shares in the aggregate, or 72.13% of the outstanding shares of Scudder Variable Series I: Health Sciences Portfolio, Class A were held in the name of Zurich Destinations/Farmers Fund, C/O Kilico, Windy Point II, 1600 McConnor Pkwy, Schaumburg, IL 60196-6800 who may be deemed to be the beneficial owner of such shares.
As of April 5, 2004, 1,186,161 shares in the aggregate, or 92.63% of the outstanding shares of Scudder Variable Series I: Health Sciences Portfolio, Class B were held in the name of The Manufactures Life Ins. Co. (USA), 500 Boylston St., Ste. 400, Boston, MA 02116-3740 who may be deemed to be the beneficial owner of such shares.
As of April 5, 2004, 69,534 shares in the aggregate, or 5.43% of the outstanding shares of Scudder Variable Series I: Health Sciences Portfolio, Class B were held in the name of Travelers Life & Annuity Company, 1 City Place, Hartford, CT 06103-3408 who may be deemed to be the beneficial owner of such shares.
71
As of April 5, 2004, 1,000,975 shares in the aggregate, or 29.98% of the outstanding shares of Scudder Variable Series I: International Portfolio, Class B were held in the name of Metlife Inv. Variable Ann. Acct. 1, 501 Boylston St., Boston, MA 02116-3769 who may be deemed to be the beneficial owner of such shares.
As of April 5, 2004, 4,081,530 shares in the aggregate, or 7.03% of the outstanding shares of Scudder Variable Series I: International Portfolio, Class A were held in the name of Allmerica Life Ins. Co., 440 Lincoln St., Worcester, MA 01653-0002 who may be deemed to be the beneficial owner of such shares.
As of April 5, 2004, 4,389,778 shares in the aggregate, or 7.56% of the outstanding shares of Scudder Variable Series I: International Portfolio, Class A were held in the name of Charter Nat. Life Ins. Co.-Horizon, 2940 S. 84th St., Lincoln, NE 68506-4142 who may be deemed to be the beneficial owner of such shares.
As of April 5, 2004, 7,985,334 shares in the aggregate, or 13.76% of the outstanding shares of Scudder Variable Series I: International Portfolio, Class A were held in the name of Mutual of America, 320 Park Ave., New York, NY 10022-6815 who may be deemed to be the beneficial owner of such shares.
As of April 5, 2004, 12,001,896 shares in the aggregate, or 20.67% of the outstanding shares of Scudder Variable Series I: International Portfolio, Class A were held in the name of Mutual of America, Sep. Acct. 2, 320 Park Ave., St. Louis, MO 63122 who may be deemed to be the beneficial owner of such shares.
As of April 5, 2004, 3,924,391 shares in the aggregate, or 6.76% of the outstanding shares of Scudder Variable Series I: International Portfolio, Class A were held in the name of Union Central Esp. International, P.O. Box 179, Cincinnati, OH 45201-0179 who may be deemed to be the beneficial owner of such shares.
As of April 5, 2004, 10,421,922 shares in the aggregate, or 17.95% of the outstanding shares of Scudder Variable Series I: International Portfolio, Class A were held in the name of Zurich Destinations/Farmers Fund, C/O Kilico Windy Point II, 1600 McConnor Pkwy, Schaumburg, IL 60196-6800 who may be deemed to be the beneficial owner of such shares.
As of April 5, 2004, 2,062,664 shares in the aggregate, or 61.79% of the outstanding shares of Scudder Variable Series I: International Portfolio, Class B were held in the name of The Manufactures Life Ins. Co., (USA) 500 Boylston St., Ste. 400, Boston, MA 02116-3740 who may be deemed to be the beneficial owner of such shares.
As of April 5, 2004, 4,627,020 shares in the aggregate, or 7.46% of the outstanding shares of Scudder Variable Series I: Money Market Portfolio, were held in the name of Intramerica Horizon Financial Control, P.O. Box 94200, Palatine, IL 60094-4200 who may be deemed to be the beneficial owner of such shares.
As of April 5, 2004, 28,655,769 shares in the aggregate, or 46.19% of the outstanding shares of Scudder Variable Series I: Money Market Portfolio, were held in the name of Charter Nat. Life Ins. Co.-Horizon, 2940 S. 84th St., Lincoln, NE 68506-4142 who may be deemed to be the beneficial owner of such shares.
As of April 5, 2004, 4,153,116 shares in the aggregate, or 6.69% of the outstanding shares of Scudder Variable Series I: Money Market Portfolio, were held in the name of Paragon Multi-Manager, 190 Carondelet Plz., Saint Louis, MO 63105-3443 who may be deemed to be the beneficial owner of such shares.
As of April 5, 2004, 10,354,833 shares in the aggregate, or 16.69% of the outstanding shares of Scudder Variable Series I: Money Market Portfolio, were held in the name of Union Cen. Individual Money Market, P.O Box 179, Cincinnati, OH 45201-0179 who may be deemed to be the beneficial owner of such shares.
As of April 5, 2004, 4,140,144 shares in the aggregate, or 6.67% of the outstanding shares of Scudder Variable Series I: Money Market Portfolio, were held in the name of ING USA Annuity & Life Insurance Co., 151 Farmington Ave., Hartford, CT 06156-0001 who may be deemed to be the beneficial owner of such shares.
72
Ownership in Securities of the Advisor and Related Companies
As reported to the Fund, the information in the following table reflects ownership by the Independent Trustees and their immediate family members of certain securities as of December 31, 2003. An immediate family member can be a spouse, children residing in the same household including step and adoptive children and any dependents. The securities represent ownership in an investment advisor or principal underwriter of the Fund and any persons (other than a registered investment company) directly or indirectly controlling, controlled by, or under common control with an investment advisor or principal underwriter of the Fund (including Deutsche Bank AG).
| | | | | | | | | | |
Independent Trustee
| | Owner and
Relationship
to Trustee
| | Company
| | Title of Class
| | Value of
Securities on
an Aggregate
Basis
| | Percent of
Class on an
Basis Aggregate
|
Henry P. Becton, Jr. | | | | None | | | | | | |
Dawn-Marie Driscoll | | | | None | | | | | | |
Keith R. Fox | | | | None | | | | | | |
Louis E. Levy | | | | None | | | | | | |
Jean Gleason Stromberg | | | | None | | | | | | |
Jean C. Tempel | | | | None | | | | | | |
Carl W. Vogt | | | | None | | | | | | |
SHAREHOLDER COMMUNICATIONS
Owners of policies and contracts issued by Participating Insurance Companies for which shares of one or more Portfolios are the investment vehicle will receive from the Participating Insurance Companies unaudited semi-annual financial statements and audited year-end financial statements certified by the Portfolios’ independent public accountants. Each report will show the investments owned by a Portfolio and the market values thereof as determined by the Trustees and will provide other information about a Portfolio and its operations.
Participating Insurance Companies with inquiries regarding the Fund or its Portfolios may call the Fund’s underwriter, Scudder Distributors, Inc., at 1-800-778-1482 or write Scudder Distributors, Inc., 222 South Riverside Plaza, Chicago, IL 60606-5808.
FUND ORGANIZATION
General
The Portfolios are series of Scudder Variable Series I, a Massachusetts business trust established under an Amended and Restated Declaration of Trust dated October 24, 1997, as amended from time to time. The Fund offers nine portfolios: Money Market Portfolio, Bond Portfolio, Balanced Portfolio, Growth and Income Portfolio, Capital Growth Portfolio, 21st Century Growth Portfolio, Global Discovery Portfolio, International Portfolio and Health Sciences Portfolio.
The Fund may issue an unlimited number of shares of beneficial interest in the Portfolios, all having $.01 par value, which may be divided by the Board of Trustees into classes of shares. The Board of Trustees of the Fund may authorize the issuance of additional classes and additional Portfolios if deemed desirable, each with its own investment objective, policies and restrictions. Since the Fund offers multiple Portfolios, it is known as a “series company.” Shares of a Portfolio have equal noncumulative voting rights and equal rights with respect to dividends, assets and liquidation of such Portfolio and are subject to any preferences, rights or privileges of any classes of shares of the Portfolio. Currently, each Portfolio (except Money Market Portfolio, which does not offer separate classes of shares) offers two classes of shares: Class A and Class B shares. Shares of each Portfolio have equal noncumulative voting rights except that each Portfolio’s Class A and Class B shares have separate and exclusive voting rights with respect to the Portfolios’ Class A and Class B Rule 12b-1 Plans, respectively. Shares of each class also have equal rights with respect to dividends, assets
73
and liquidation subject to any preferences (such as resulting from different Rule 12b-1 distribution fees), rights or privileges of any classes of shares of a Portfolio. Shares of each Portfolio are fully paid and nonassessable when issued, are transferable without restriction and have no preemptive or conversion rights. The Fund is not required to hold annual shareholder meetings and does not intend to do so. However, the Fund will hold special meetings as required or deemed desirable for such purposes as electing Trustees, changing fundamental policies or approving an investment management agreement. Subject to the Declaration of Trust, shareholders may remove Trustees. If shares of more than one Portfolio are outstanding, shareholders will vote by Portfolio and not in the aggregate or by class except when voting in the aggregate is required under the 1940 Act, such as for the election of Trustees, or when voting by class is appropriate.
The Portfolios generally are not required to hold meetings of their shareholders. Under the Declaration of Trust, however, shareholder meetings will be held in connection with the following matters: (a) the election or removal of Trustees if a meeting is called for such purpose; (b) the adoption of any contract for which shareholder approval is required by the 1940 Act; (c) any termination of a Portfolio or a class to the extent and as provided in the Declaration of Trust; (d) any amendment of the Declaration of Trust (other than amendments changing the name of the Fund or Portfolios, supplying any omission, curing any ambiguity or curing, correcting or supplementing any defective or inconsistent provision thereof); and (e) such additional matters as may be required by law, the Declaration of Trust, the By-laws of the Portfolios, or any registration of the Portfolios with the Securities and Exchange Commission or any state, or as the Trustees may consider necessary or desirable. The shareholders also would vote upon changes in fundamental investment objectives, policies or restrictions.
The activities of the Fund are supervised by its Trustees, who are elected by shareholders. Shareholders have one vote for each share held. Fractional shares have fractional votes.
Each Trustee serves until the next meeting of shareholders, if any, called for the purpose of electing trustees and until the election and qualification of a successor or until such trustee sooner dies, resigns, retires or is removed by a majority vote of the shares entitled to vote (as described below) or a majority of the trustees. In accordance with the 1940 Act, (a) the Fund will hold a shareholder meeting for the election of trustees at such time as less than a majority of the Trustees have been elected by shareholders, and (b) if, as a result of a vacancy on the Board of Trustees, less than two-thirds of the Trustees have been elected by the shareholders, that vacancy will be filled only by a vote of the shareholders.
Trustees may be removed from office by a vote of the holders of two-thirds of the outstanding shares at a meeting called for that purpose, which meeting shall be held upon the written request of the holders of not less than 10% of the outstanding shares. Upon the written request of ten or more shareholders who have been such for at least six months and who hold shares constituting at least 1% of the outstanding shares of a Portfolio stating that such shareholders wish to communicate with the other shareholders for the purpose of obtaining the signatures necessary to demand a meeting to consider removal of a trustee, each Portfolio has undertaken to disseminate appropriate materials at the expense of the requesting shareholders.
The Fund’s Declaration of Trust provides that the presence at a shareholder meeting in person or by proxy of at least 30% of the shares entitled to vote on a matter shall constitute a quorum. Thus, a meeting of shareholders of a Portfolio could take place even if less than a majority of the shareholders were represented on its scheduled date. Shareholders would in such a case be permitted to take action which does not require a larger vote than a majority of a quorum, such as the election of trustees and ratification of the selection of auditors. Some matters requiring a larger vote under the Declaration of Trust, such as termination or reorganization of a Portfolio and certain amendments of the Declaration of Trust, would not be effected by this provision; nor would matters which under the 1940 Act require the vote of a “majority of the outstanding voting securities” as defined in the 1940 Act. The Fund will vote its shares in each Underlying Fund in proportion to the vote of all other shareholders of each respective Underlying Fund.
The Fund’s Declaration of Trust specifically authorizes the Board of Trustees to terminate any Portfolio or class by notice to the shareholders without shareholder approval.
74
Shareholder and Trustee Liability
Under Massachusetts law, shareholders of a Massachusetts business trust could, under certain circumstances, be held personally liable for obligations of a portfolio thereof. The Declaration of Trust, however, disclaims shareholder liability for acts or obligations of each Portfolio and requires that notice of such disclaimer be given in each agreement, obligation, or instrument entered into or executed by a Portfolio or the Fund’s Trustees. Moreover, the Declaration of Trust provides for indemnification out of Portfolio property for all losses and expenses of any shareholder held personally liable for the obligations of a Portfolio and each Portfolio will be covered by insurance which the Trustees consider adequate to cover foreseeable tort claims. Thus, the risk of a shareholder incurring financial loss on account of shareholder liability is considered by the Advisor remote and not material, since it is limited to circumstances in which a disclaimer is inoperative and such Portfolio itself is unable to meet its obligations. It is possible that a Portfolio might become liable for a misstatement regarding another Portfolio. The Trustees of the Fund have considered this and approved the use of a combined Statement of Additional Information for the Portfolios.
The Declaration of Trust provides that obligations of the Fund are not binding upon the Trustees individually but only upon the property of the Fund, that the Trustees and officers will not be liable for errors of judgment or mistakes of fact or law, and that the Fund, will indemnify its Trustees and officers against liabilities and expenses incurred in connection with litigation in which they may be involved because of their offices with the Fund, except if it is determined in the manner provided in the Declaration of Trust that they have not acted in good faith in the reasonable belief that their actions were in the best interests of the Fund. However, nothing in the Declaration of Trust protects or indemnifies a Trustee or officer against any liability to which he or she would otherwise be subject by reason of willful misfeasance, bad faith, gross negligence, of reckless disregard of duties involved in the conduct of his or her office.
Shares entitle their holders to one vote per share; however, separate votes will be taken by each Portfolio on matters affecting an individual Portfolio. For example, a change in investment policy for Money Market Portfolio would be voted upon only by shareholders of Money Market Portfolio. Additionally, approval of the investment advisory agreement covering a Portfolio is a matter to be determined separately by each Portfolio. Approval by the shareholders of one Portfolio is effective as to that Portfolio. Shares have noncumulative voting rights, which means that holders of more than 50% of the shares voting for the election of Trustees can elect all Trustees and, in such event, the holders of the remaining shares voting for the election of Trustees will not be able to elect any person or persons as Trustees. Shares have no preemptive or subscription rights, and are transferable.
Shareholders have certain rights, as set forth in the Declaration of Trust of the Fund, including the right to call a meeting of shareholders for the purpose of voting on the removal of one or more Trustees. Such removal can be effected upon the action of two-thirds of the outstanding shares of beneficial interest of the Fund.
PROXY VOTING GUIDELINES
The Fund has delegated proxy voting responsibilities to its investment advisor, subject to the Board’s general oversight. The Fund has delegated proxy voting to the Advisor with the direction that proxies should be voted consistent with the Fund’s best economic interests. The Advisor has adopted its own Proxy Voting Policies and Procedures (“Policies”), and Proxy Voting Guidelines (“Guidelines”) for this purpose. The Policies address, among other things, conflicts of interest that may arise between the interests of the Fund, and the interests of the Advisor and its affiliates, including the Fund’s principal underwriter. The Guidelines set forth the Advisor’s general position on various proposals, such as:
| | • | | Shareholder Rights — The Advisor generally votes against proposals that restrict shareholder rights. |
| | • | | Corporate Governance — The Advisor generally votes for confidential and cumulative voting and against supermajority voting requirements for charter and bylaw amendments. |
| | • | | Anti-Takeover Matters — The Advisor generally votes for proposals that require shareholder ratification of poison pills or that request boards to redeem poison pills, and votes against the adoption of poison pills if they are submitted for shareholder ratification. The Advisor generally votes for fair price proposals. |
75
| | • | | Compensation Matters — The Advisor generally votes for executive cash compensation proposals, unless they are unreasonably excessive. The Advisor generally votes against stock option plans that do not meet the Advisor’s criteria. |
| | • | | Routine Matters — The Advisor generally votes for the ratification of auditors, procedural matters related to the annual meeting and changes in company name, and against bundled proposals and adjournment. |
The general provisions described above do not apply to investment companies. The Advisor generally votes proxies solicited by investment companies in accordance with the recommendations of an independent third party, except for proxies solicited by or with respect to investment companies for which the Advisor or an affiliate serves as investment advisor or principal underwriter (“affiliated investment companies”). The Advisor votes affiliated investment company proxies in the same proportion as the vote of the investment company’s other shareholders (sometimes called “mirror” or “echo” voting). Master fund proxies solicited from feeder funds are voted in accordance with applicable requirements of the Investment Company Act of 1940.
Although the Guidelines set forth the Advisor’s general voting positions on various proposals, the Advisor may, consistent with the Fund’s best interests, determine under some circumstances to vote contrary to those positions.
The Guidelines on a particular issue may or may not reflect the view of individual members of the Board or of a majority of the Board. In addition, the Guidelines may reflect a voting position that differs from the actual practices of the public companies within the Deutsche Bank organization or of the investment companies for which the Advisor or an affiliate serves as investment advisor or sponsor.
The Advisor may consider the views of a portfolio company’s management in deciding how to vote a proxy or in establishing general voting positions for the Guidelines, but management’s views are not determinative.
As mentioned above, the Policies describe the way in which the Advisor resolves conflicts of interest. To resolve conflicts, the advisor, under normal circumstances, votes proxies in accordance with its Guidelines. If the Advisor departs from the Guidelines with respect to a particular proxy or if the Guidelines do not specifically address a certain proxy proposal, a proxy voting committee established by the advisor will vote the proxy. Before voting any such proxy, however, the Advisor’s conflicts review committee will conduct an investigation to determine whether any potential conflicts of interest exist in connection with the particular proxy proposal. If the conflicts review committee determines that the Advisor has a material conflict of interest, or certain individuals on the proxy voting committee should be recused from participating in a particular proxy vote, it will inform the proxy voting committee. If notified that the Advisor has a material conflict, or fewer than three voting members are eligible to participate in the proxy vote, typically the Advisor will engage an independent third party to vote the proxy or follow the proxy voting recommendations of an independent third party.
Under certain circumstances, the Advisor may not be able to vote proxies or the Advisor may find that the expected economic costs from voting outweigh the benefits associated with voting. For example, the Advisor may not vote proxies on certain foreign securities due to local restrictions or customs. The Advisor generally does not vote proxies on securities subject to share blocking restrictions.
ADDITIONAL INFORMATION
The CUSIP number of Money Market Portfolio is 81123R 10 2.
The CUSIP number of Bond Portfolio Class A shares is 81123R 20 1.
The CUSIP number of Bond Portfolio Class B shares is 81123R 83 9.
The CUSIP number of Balanced Portfolio Class A shares is 81123R 40 9.
76
The CUSIP number of Balanced Portfolio Class B shares is 81123R 81 3.
The CUSIP number of Growth and Income Portfolio Class A shares is 81123R 8 54.
The CUSIP number of Growth and Income Portfolio Class B shares is 81123R 77 1.
The CUSIP number of Capital Growth Portfolio Class A shares is 81123R 30 0.
The CUSIP number of Capital Growth Portfolio Class B shares is 81123R 82 1.
The CUSIP number of 21st Century Growth Portfolio Class A shares is 81123R 74 8.
The CUSIP number of 21st Century Growth Portfolio Class B shares is 81123R 73 0.
The CUSIP number of Global Discovery Portfolio Class A shares is 81123R 84 7.
The CUSIP number of Global Discovery Portfolio Class B shares is 81123R 78 9.
The CUSIP number of International Portfolio Class A shares is 81123R 50 8.
The CUSIP number of International Portfolio Class B shares is 81123R 79 7.
The CUSIP number of Health Sciences Portfolio Class A shares is 81123R 72 2.
The CUSIP number of Health Sciences Portfolio Class B shares is 81123R 71 4.
Each Portfolio has a December 31 fiscal year end.
The name “Scudder Variable Series I” is the designation of the Trustees for the time being under an amended and restated Declaration of Trust dated October 24, 1997, as amended from time to time, and all persons dealing with the Fund must look solely to the property of the Fund for the enforcement of any claims against the Fund as neither the Trustees, officers, agents or shareholders assume any personal liability for obligations entered into on behalf of the Fund. Upon the initial purchase of shares, the shareholder agrees to be bound by the Fund’s Declaration of Trust, as amended from time to time. The Declaration of Trust is on file at the Massachusetts Secretary of State’s Office in Boston, Massachusetts.
Each Portfolio, through its combined Prospectuses and combined Statement of Additional Information, offers only its own share classes, yet it is possible that one Portfolio might become liable for a misstatement regarding the other Portfolio. The Trustees have considered this, and have approved the use of the Prospectus and Statement of Additional Information.
The Fund’s prospectuses and this Statement of Additional Information omit certain information contained in the Registration Statement which the Fund has filed with the SEC under the Securities Act of 1933 and reference is hereby made to the Registration Statement, and its amendments, for further information with respect to the Fund and the securities offered hereby. The Registration Statement and its amendments are available for inspection by the public at the SEC in Washington, D.C.
77
FINANCIAL STATEMENTS
The financial statements of Scudder Variable Series I are comprised of the following:
Money Market Portfolio
Balanced Portfolio
Bond Portfolio
Growth and Income Portfolio
Capital Growth Portfolio
21st Century Growth Portfolio
Global Discovery Portfolio
International Portfolio
Health Sciences Portfolio
The financial statements, including the investment portfolios of Scudder Variable Series I, together with the Report of Independent Auditors, Financial Highlights and notes to financial statements are incorporated by reference and attached hereto, in the Annual Report to the Shareholders of the Fund dated December 31, 2003, and are hereby deemed to be part of this Statement of Additional Information.
Information concerning portfolio holdings of a Portfolio as of a month end is available upon request no earlier than the 16th day after month end. Please call Scudder Investments at the number appearing on the front cover of this Statement of Additional Information to make such a request.
78
APPENDIX A
BOND AND COMMERCIAL PAPER RATINGS
Set forth below are descriptions of ratings which represent opinions as to the quality of the securities. It should be emphasized, however, that ratings are relative and subjective and are not absolute standards of quality.
MOODY’S INVESTORS SERVICE, INC. — CORPORATE BOND RATINGS
Aaa: Bonds which are rated Aaa are judged to be of the highest quality. They carry the smallest degree of investment risk and are generally referred to as “gilt-edged.” Interest payments are protected by a large or by an exceptionally stable margin and principal is secure. While the various protective elements are likely to change, such changes as can be visualized are most unlikely to impair the fundamentally strong position of such issues.
Aa: Bonds which are rated Aa are judged to be of high quality by all standards. Together with the Aaa group they comprise what are generally known as high grade bonds. They are rated lower than the best bonds because margins of protection may not be as large as in Aaa securities or fluctuations of protective elements may be of greater amplitude or there may be other elements present which make the long-term risk appear somewhat larger than in Aaa securities.
A: Bonds which are rated A possess many favorable investment attributes and are to be considered as upper -medium grade obligations. Factors giving security to principal and interest are considered adequate, but elements may be present which suggest a susceptibility to impairment sometime in the future.
Baa: Bonds which are rated Baa are considered as medium grade obligations, (i.e., they are neither highly protected nor poorly secured). Interest payments and principal security appear adequate for the present, but certain protective elements may be lacking or may be characteristically unreliable over any great length of time. Such bonds lack outstanding investment characteristics and in fact have speculative characteristics as well.
Ba: Bonds which are rated Ba are judged to have speculative elements; their future cannot be considered as well assured. Often the protection of interest and principal payments may be very moderate and thereby not well safe-guarded during both good and bad times over the future. Uncertainty of position characterizes bonds in this class.
B: Bonds which are rated B are considered speculative and generally lack characteristics of the desirable investment. Assurance of interest and principal payments or of maintenance of other terms of the contract over any long period of time may be small.
Caa: Bonds which are rated Caa are of poor standing. Such issues may be in default or there may be present elements of danger with respect to principal or interest.
Ca: Bonds which are rated Ca represent obligations which are highly speculative. Such issues are often in default or have other marked shortcomings.
C: Bonds which are rated C are the lowest rated class of bonds, typically are in default and can be regarded as having extremely poor prospects of ever attaining any real investment standing.
Note: Moody’s appends numerical modifiers 1, 2 and 3 to each generic rating classification from Aa through Caa in its corporate bond rating system. The modifier 1 indicates that the issue ranks in the higher end of its generic rating category; the modifier 2 indicates a mid-range ranking; and the modifier 3 indicates that the issue ranks in the lower end of its generic rating category.
79
MOODY’S INVESTORS SERVICE, INC. — SHORT-TERM RATINGS
Moody’s short-term debt ratings are opinions of the ability of issuers to honor short-term financial obligations. Ratings may be assigned to issuers, short-term programs or to individual short-term debt instruments. Such obligations generally have an original maturity not exceeding thirteen months, unless explicitly noted. Issuers rated Prime-1 or P-1 (or supporting institutions) have a superior ability for repayment of short-term debt obligations. Prime-1 or P-1 repayment ability will often be evidenced by many of the following characteristics:
| | • | | Leading market positions in well established industries. |
| | • | | High rates of return on funds employed. |
| | • | | Conservative capitalization structure with moderate reliance on debt and ample asset protection. |
| | • | | Broad margins in earnings coverage of fixed financial charges and high internal cash generation. |
| | • | | Well established access to a range of financial markets and assured sources of alternate liquidity. |
Issuers rated Prime-2 or P-2 (or supporting institutions) have a strong ability for repayment of short-term debt obligations. This will normally be evidenced by many of the characteristics cited above but to a lesser degree. Earnings trends and coverage ratios, while sound, may be more subject to variation. Capitalization characteristics, while still appropriate, may be more affected by external conditions. Ample alternate liquidity is maintained.
STANDARD & POOR’S RATINGS SERVICES — CORPORATE BOND RATINGS
INVESTMENT GRADE
AAA: Debt rated AAA has the highest rating assigned by S&P’s to a debt obligation. Capacity to pay interest and repay principal is extremely strong.
AA: Debt rated AA has a very strong capacity to pay interest and repay principal and differs from the higher rated issues only in small degree.
A: Debt rated A has a strong capacity to pay interest and repay principal although it is somewhat more susceptible to the adverse effects of changes in circumstances and economic conditions than bonds in higher rated categories.
BBB: Debt rated BBB has an adequate capacity to pay interest and repay principal. Whereas it normally exhibits adequate protection parameters, adverse economic conditions or changing circumstances are more likely to lead to a weakened capacity to pay interest and repay principal for debt in this category than in higher rated categories.
SPECULATIVE GRADE
Debt rated BB, B, CCC, CC, and C has significant speculative characteristics with respect to capacity to pay interest and repay principal. BB indicates the least degree of speculation and C the highest. While such debt will likely have some quality and protective characteristics, these may be outweighed by large uncertainties or major exposures to adverse conditions.
BB: Debt rated BB has less near-term vulnerability to default than other speculative issues. However, it faces major ongoing uncertainties or exposure to adverse business, financial, or economic conditions which could lead to inadequate capacity to meet timely interest and principal payments.
80
The BB rating category is also used for debt subordinated to senior debt that is assigned an actual or implied BBB- rating.
B: Debt rated B has a greater vulnerability to default but currently has the capacity to meet interest payments and principal repayments. Adverse business, financial, or economic conditions will likely impair capacity or willingness to pay interest and repay principal.
The B rating category is also used for debt subordinated to senior debt that is assigned an actual or implied BB or BB- rating.
CCC: Debt rated CCC has a current vulnerability to default, and is dependent upon favorable business, financial, and economic conditions to meet timely payment of interest and repayment of principal. In the event of adverse business, financial, or economic conditions, it is not likely to have the capacity to pay interest and repay principal.
The CCC rating category is also used for debt subordinated to senior debt that is assigned an actual or implied B or B- rating.
CC: Debt rated CC has a current high vulnerability to default, and is dependent upon favorable business, financial, and economic conditions to meet timely payment of interest and repayment of principal.
The rating CC is also applied to debt subordinated to senior debt which is assigned an actual or implied CCC debt rating.
C: The rating C is typically applied to debt subordinated to senior debt which is assigned an actual or implied CCC- debt rating. The C rating may be used to cover a situation where a bankruptcy petition has been filed, but debt service payments are continued.
C1: The Rating C1 is reserved for income bonds on which no interest is being paid.
D: Debt rated D is in payment default. The D rating category is used when interest payments or principal payments are not made on the date due even if the applicable grace period has not expired, unless Standard & Poor’s believes that such payments will be made during such grace period. The D rating also will be used upon the filing of a bankruptcy petition if debt service payments are jeopardized.
Plus (+) or Minus (-): The ratings from AA to CCC may be modified by the addition of a plus or minus sign to show relative standing within the major rating categories.
R: Debt rated ‘R’ is under regulatory supervision owing to its financial condition. During the pendency of the regulatory supervision, the regulators may have the power to favor one class of obligations over others or pay some obligations and not others.
N.R.: Bonds may lack a S&P’s rating because no public rating has been requested, because there is insufficient information on which to base a rating, or because S&P’s does not rate a particular type of obligation as a matter of policy.
STANDARD & POOR’S RATINGS SERVICES — SHORT-TERM RATINGS
S&P’s commercial paper rating is a current assessment of the likelihood of timely payment of debt considered short-term in the relevant market.
A-1: This highest category indicates that the degree of safety regarding timely payment is strong. Those issues determined to possess extremely strong safety characteristics are denoted with a plus (+) sign designation.
81
A-2: Capacity for timely payment on issues with this designation is satisfactory. However, the relative degree of safety is not as high as for issues designated A-1.
A-3: Issues carrying this designation have adequate capacity for timely payment. However, adverse economic conditions or changing circumstances are more likely to lead to a weakened capacity of the issuer to meet its financial commitments.
FITCH INVESTORS SERVICE, INC. — BOND RATINGS
INVESTMENT GRADE
AAA: Bonds considered to be investment grade and of the highest credit quality. The obligor has an exceptionally strong ability to pay interest and repay principal, which is unlikely to be affected by reasonably foreseeable events.
AA: Bonds considered to be investment grade and of very high credit quality. The obligor’s ability to pay interest and repay principal is very strong, although not quite as strong as bonds rated AAA. Bonds rated in the AAA and AA categories are not significantly vulnerable to foreseeable events.
A: Bonds considered to be investment grade and of high credit quality. The obligor’s ability to pay interest and repay principal is considered to be strong, but may be more vulnerable to adverse changes in economic conditions and circumstances than bonds with higher ratings.
BBB: Bonds considered to be investment grade and of good credit quality. The obligor’s ability to pay interest and repay principal is considered to be adequate. Adverse changes in economic conditions and circumstances, however, are more likely to have adverse impact on these bonds, and therefore, impair timely payment. The likelihood that the ratings of these bonds will fall below investment grade is higher than for bonds with higher ratings.
SPECULATIVE GRADE
BB: Bonds are considered speculative. The obligor’s ability to pay interest and repay principal may be affected over time by adverse economic changes. However, business or financial alternatives may be available which could assist the obligor in satisfying its debt service requirements.
B: Bonds are considered highly speculative. While bonds in this class are currently meeting debt service requirements, the probability of continued timely payment of principal and interest reflects the obligor’s limited margin of safety and the need for reasonable business and economic activity throughout the life of the issue.
CCC: Bonds have certain identifiable characteristics which, if not remedied, may lead to default. The ability to meet obligations requires an advantageous business and economic environment.
CC: Bonds are minimally protected. Default in payment of interest and/or principal seems probable over time.
C: Bonds are in imminent default in payment of interest or principal.
DDD, DD and D: Bonds are in default of interest and/or principal payments. Such bonds are extremely speculative and should be valued on the basis of their ultimate recovery value in liquidation or reorganization of the obligor. DDD represents the highest potential for recovery on these bonds, and D represents the lowest potential for recovery.
Plus (+) or Minus (-): The ratings from AA to CC may be appended by the addition of a plus or minus sign to denote the relative status within the rating category.
NR: Indicates that Fitch Rating does not publicly rate the specific issue.
82
FITCH INVESTORS SERVICE, INC. — SHORT-TERM RATINGS
Fitch’s short-term ratings apply to debt obligations that are payable on demand or have original maturities of generally up to three years, including commercial paper, certificates of deposit, medium-term notes, and municipal and investment notes.
F-1+: Exceptionally Strong Credit Quality. Issues assigned this rating are regarded as having the strongest capacity for timely payment.
F-1: Very Strong Credit Quality. Issues assigned this rating reflect a capacity for timely payment only slightly less than issues rated F-1+.
F-2: Good Credit Quality. Issues assigned this rating have a satisfactory capacity for timely payment, but the margin of safety is not as great as the F-1+ and F-1 categories.
F-3: Fair Credit Quality. Issues assigned this rating have characteristics suggesting that the capacity for timely payment is adequate; however, near-term adverse changes could cause these securities to be rated below investment grade.
B: Speculative. Minimal capacity for timely payment of financial commitments, plus vulnerability to near-term adverse changes in financial and economic conditions.
C: High default risk. Default is a real possibility. Capacity for meeting financial commitments is solely reliant upon a sustained, favorable business and economic environment.
D: Default. Denotes actual or imminent payment default.
83
Annual report to
shareholders for the year
ended December 31, 2004
Scudder Variable Series II
Scudder Aggressive Growth Portfolio
Scudder Blue Chip Portfolio
Scudder Conservative Income Strategy Portfolio
Scudder Fixed Income Portfolio
Scudder Global Blue Chip Portfolio
Scudder Government & Agency Securities Portfolio
Scudder Growth Portfolio
Page 1 of 466
Scudder Growth & Income Strategy Portfolio
Scudder Growth Strategy Portfolio
Scudder High Income Portfolio
Scudder Income & Growth Strategy Portfolio
Scudder International Select Equity Portfolio
Scudder Large Cap Value Portfolio
Scudder Mercury Large Cap Core Portfolio
Scudder Money Market Portfolio
Scudder Small Cap Growth Portfolio
Scudder Strategic Income Portfolio
Scudder Technology Growth Portfolio
Scudder Templeton Foreign Value Portfolio
Scudder Total Return Portfolio
SVS Davis Venture Value Portfolio
SVS Dreman Financial Services Portfolio
SVS Dreman High Return Equity Portfolio
SVS Dreman Small Cap Value Portfolio
SVS Eagle Focused Large Cap Growth Portfolio
SVS Focus Value+Growth Portfolio
SVS Index 500 Portfolio
SVS INVESCO Dynamic Growth Portfolio
SVS Janus Growth and Income Portfolio
SVS Janus Growth Opportunities Portfolio
SVS MFS Strategic Value Portfolio
SVS Oak Strategic Equity Portfolio
SVS Turner Mid Cap Growth Portfolio
Page 2 of 466
Contents
Performance Summary, Information About Your Portfolio’s Expenses, Management Summary, Investment Portfolio, Financial Statements and Financial Highlights for:
Page 3 of 466
This report must be preceded or accompanied by a prospectus. To obtain a prospectus, call (800) 778-1482 or your financial representative. We advise you to carefully consider the product’s objectives, risks, charges and expenses before investing. The prospectus contains this and other important information about the product. Please read the prospectus carefully before you invest.
NOT FDIC/NCUA INSURED NO BANK GUARANTEE MAY LOSE VALUE
Investments in variable portfolios involve risk. Some portfolios have more risk than others. These include portfolios that allow exposure to or otherwise concentrate investments in certain sectors, geographic regions, security types, market capitalization or foreign securities (e.g., political or economic instability, which can be accentuated in Emerging Market countries). Please read the prospectus for specific details regarding its investments and risk profile.
Page 4 of 466
Performance Summary December 31, 2004
Scudder Aggressive Growth Portfolio
All performance shown is historical, assumes reinvestment of all dividends and capital gains, and does not guarantee future results. Investment return and principal value fluctuate with changing market conditions so that, when redeemed, shares may be worth more or less then their original cost. Current performance may be lower or higher than the performance data quoted. Please visit scudder.com for the product’s most recent month-end performance. Performance doesn’t reflect charges and fees (“contract charges”) associated with the separate account that invests in the Portfolio or any variable life insurance policy or variable annuity contract for which the Portfolio is an investment option. These charges and fees will reduce returns.
This Portfolio is subject to stock market risk, meaning stocks in the portfolio may decline in value for extended periods of time due to the activities and financial prospects of individual companies, or due to general market and economic conditions. Please read this Portfolio’s prospectus for specific details regarding its investments and risk profile.
The investment advisor has agreed to either limit, waive or reduce certain fees temporarily for this Portfolio; see the prospectus for complete details. Without such limits, waivers or reductions, the performance figures for this Portfolio would be lower.
| | |
Growth of an Assumed $10,000 Investment in Scudder Aggressive Growth Portfolio from 5/1/1999 to 12/31/2004 |
¨ Scudder Aggressive Growth Portfolio — Class A ¨ Russell 3000 Growth Index ¨ S&P 500 Index |
 | | The Russell 3000 Growth Index is an unmanaged, capitalization-weighted index containing the growth stocks in the Russell 3000 Index with higher price-to-book ratios and higher forecasted growth values. The Standard & Poor’s (S&P) 500 Index is a capitalization-weighted index of 500 stocks designed to measure performance of the broad domestic economy through changes in the aggregate market value of 500 stocks representing all major industries. Index returns assume reinvested dividends and, unlike Portfolio returns, do not reflect any fees or expenses. It is not possible to invest directly into an index. |
| | |
|
Yearly periods ended December 31 |
Comparative Results
| | | | | | | | | | | | | | | | | | |
Scudder Aggressive Growth Portfolio
| | | | 1-Year
| | | 3-Year
| | | 5-Year
| | | Life of Portfolio*
| |
Class A | | Growth of $10,000 | | $ | 10,402 | | | $ | 9,664 | | | $ | 7,186 | | | $ | 10,053 | |
| | | Average annual total return | | | 4.02 | % | | | -1.13 | % | | | -6.40 | % | | | .09 | % |
Russell 3000 Growth Index | | Growth of $10,000 | | $ | 10,693 | | | $ | 10,078 | | | $ | 6,285 | | | $ | 7,895 | |
| | | Average annual total return | | | 6.93 | % | | | .26 | % | | | -8.87 | % | | | -4.09 | % |
S&P 500 Index | | Growth of $10,000 | | $ | 11,088 | | | $ | 11,115 | | | $ | 8,902 | | | $ | 9,882 | |
| | | Average annual total return | | | 10.88 | % | | | 3.59 | % | | | -2.30 | % | | | -.21 | % |
| | | | | |
Scudder Aggressive Growth Portfolio
| | | | | | | | | | 1-Year
| | | Life of Class**
| |
Class B | | Growth of $10,000 | | | | | | | | | | $ | 10,361 | | | $ | 13,136 | |
| | | Average annual total return | | | | | | | | | | | 3.61 | % | | | 11.52 | % |
Russell 3000 Growth Index | | Growth of $10,000 | | | | | | | | | | $ | 10,693 | | | $ | 12,684 | |
| | | Average annual total return | | | | | | | | | | | 6.93 | % | | | 9.98 | % |
S&P 500 Index | | Growth of $10,000 | | | | | | | | | | $ | 11,088 | | | $ | 12,800 | |
| | | Average annual total return | | | | | | | | | | | 10.88 | % | | | 10.38 | % |
The growth of $10,000 is cumulative.
| * | The Portfolio commenced operations on May 1, 1999. Index returns begin April 30, 1999. |
| ** | The Portfolio commenced offering Class B shares on July 1, 2002. Index returns begin June 30, 2002. |
Page 5 of 466
Information About Your Portfolio’s Expenses
Scudder Aggressive Growth Portfolio
As an investor of the Portfolio, you incur two types of costs: ongoing expenses and transaction costs. Ongoing expenses include management fees, distribution and service (12b-1) fees and other Portfolio expenses. Examples of transaction costs include sales charges (loads), redemption fees and account maintenance fees, which are not shown in this section. The following tables are intended to help you understand your ongoing expenses (in dollars) of investing in the Portfolio and to help you compare these expenses with the ongoing expenses of investing in other mutual funds. In the most recent six-month period, the Portfolio limited these expenses; had it not done so, expenses would have been higher. The tables are based on an investment of $1,000 made at the beginning of the six-month period ended December 31, 2004.
The tables illustrate your Portfolio’s expenses in two ways:
Actual Portfolio Return. This helps you estimate the actual dollar amount of ongoing expenses (but not transaction costs) paid on a $1,000 investment in the Portfolio using the Portfolio’s actual return during the period. To estimate the expenses you paid over the period, simply divide your account value by $1,000 (for example, an $8,600 account value divided by $1,000 = 8.6), then multiply the result by the number in the “Expenses Paid per $1,000” line under the share class you hold.
Hypothetical 5% Portfolio Return. This helps you to compare your Portfolio’s ongoing expenses (but not transaction costs) with those of other mutual funds using the Portfolio’s actual expense ratio and a hypothetical rate of return of 5% per year before expenses. Examples using a 5% hypothetical Portfolio return may be found in the shareholder reports of other mutual funds. The hypothetical account values and expenses may not be used to estimate the actual ending account balance or expenses you paid for the period.
Please note that the expenses shown in these tables are meant to highlight your ongoing expenses only and do not reflect any transaction costs. The “Expenses Paid per $1,000” line of the tables is useful in comparing ongoing expenses only and will not help you determine the relative total expense of owning different funds. If these transaction costs had been included, your costs would have been higher.
Expenses and Value of a $1,000 Investment for the six months ended December 31, 2004
| | | | | | |
Actual Portfolio Return
| | Class A
| | Class B
|
Beginning Account Value 7/1/04 | | $ | 1,000.00 | | $ | 1,000.00 |
Ending Account Value 12/31/04 | | $ | 1,058.10 | | $ | 1,056.30 |
Expenses Paid per $1,000* | | $ | 5.10 | | $ | 7.05 |
| | |
Hypothetical 5% Portfolio Return
| | Class A
| | Class B
|
Beginning Account Value 7/1/04 | | $ | 1,000.00 | | $ | 1,000.00 |
Ending Account Value 12/31/04 | | $ | 1,020.25 | | $ | 1,018.35 |
Expenses Paid per $1,000* | | $ | 5.00 | | $ | 6.92 |
| * | Expenses are equal to the Portfolio’s annualized expense ratio for each share class, multiplied by the average account value over the period, multiplied by the number of days in the most recent six-month period, then divided by 365. |
| | | | | | |
Annualized Expense Ratios
| | Class A
| | | Class B
| |
Scudder Variable Series II — Scudder Aggressive Growth Portfolio | | .98 | % | | 1.36 | % |
For more information, please refer to the Portfolio’s prospectus.
Page 6 of 466
Management Summary December 31, 2004
Scudder Aggressive Growth Portfolio
Growth stocks produced favorable returns during 2004, but as a group this asset class underperformed value stocks in the large-cap segment with the reverse holding true in small caps. Among the market capitalization segments, mid-cap stocks outperformed both small caps and large caps. Notably, small, low-quality and high-beta companies that dominated market returns in 2003 continued their reversal as larger-cap, higher-quality and dividend-paying securities outperformed during the annual period. The portfolio produced a total return of 4.02% (Class A shares, unadjusted for contract charges) for the 12-month period ended December 31, 2004, trailing the 6.93% return of its benchmark, the Russell 3000 Growth Index. During the period, the market was able to weather a mixed-bag of labor reports, the insurgency in Iraq, a mid-year spike in oil prices and the hotly contested presidential election.
Throughout the period, stock selection was the primary detractor from fund performance. While our stock selection in the financials, health care and materials sectors aided performance, our stock picks in information technology, industrials, consumer staples, and energy lagged their benchmark counterparts. Asset allocation contributed to performance for the period. The portfolio’s underweight in industrials and health care and overweight in information technology detracted from performance. However, the portfolio’s overweight in consumer discretionary and energy and underweight in consumer staples aided performance.
Going forward, we believe investors’ renewed emphasis on fundamentals and valuations should generate additional performance opportunities for the portfolio given its emphasis on fundamental research and individual stock selection. We will continue to focus on sound growth companies, which are or should be able to produce healthy earnings growth.
Samuel A. Dedio
Robert S. Janis
Co-Lead Portfolio Managers
Deutsche Investment Management Americas Inc.
All performance shown is historical, assumes reinvestment of all dividends and capital gains, and does not guarantee future results. Investment return and principal value fluctuate with changing market conditions so that, when redeemed, shares may be worth more or less then their original cost. Current performance may be lower or higher than the performance data quoted. Please visit scudder.com for the product’s most recent month-end performance. Performance doesn’t reflect charges and fees (“contract charges”) associated with the separate account that invests in the portfolio or any variable life insurance policy or variable annuity contract for which the portfolio is an investment option. These charges and fees will reduce returns.
Page 7 of 466
Risk Considerations
This portfolio is subject to stock market risk, meaning stocks in the portfolio may decline in value for extended periods of time due to the activities and financial prospects of individual companies, or due to general market and economic conditions. Please read this portfolio’s prospectus for specific details regarding its investments and risk profile.
The Russell 3000 Growth Index is an unmanaged, capitalization-weighted index containing the growth stocks in the Russell 3000 Index with higher price-to- book ratios and higher forecasted growth values.
The Standard & Poor’s (S&P) 500 Index is a capitalization-weighted index of 500 stocks designed to measure performance of the broad domestic economy through changes in the aggregate market value of 500 stocks representing all major industries.
Index returns assume reinvested dividends and, unlike Portfolio returns, do not reflect any fees or expenses. It is not possible to invest directly into an index.
Portfolio management market commentary is as of December 31, 2004, and may not come to pass. This information is subject to change at any time based on market and other conditions.
Portfolio Summary
Scudder Aggressive Growth Portfolio
| | | | | | |
Asset Allocation (Excludes Securities Lending Collateral)
| | 12/31/04
| | | 12/31/03
| |
Common Stocks | | 97 | % | | 97 | % |
Cash Equivalents | | 3 | % | | 3 | % |
| | |
|
| |
|
|
| | | 100 | % | | 100 | % |
| | |
|
| |
|
|
| | | | | | |
Sector Diversification (Excludes Cash Equivalents and Securities Lending Collateral)
| | 12/31/04
| | | 12/31/03
| |
Health Care | | 26 | % | | 22 | % |
Information Technology | | 25 | % | | 33 | % |
Consumer Discretionary | | 17 | % | | 17 | % |
Financials | | 13 | % | | 9 | % |
Consumer Staples | | 5 | % | | 5 | % |
Industrials | | 5 | % | | 9 | % |
Materials | | 5 | % | | 1 | % |
Telecommunication Services | | 2 | % | | 1 | % |
Energy | | 2 | % | | 3 | % |
| | |
|
| |
|
|
| | | 100 | % | | 100 | % |
| | |
|
| |
|
|
Asset allocation and sector diversification are subject to change.
For more complete details about the Portfolio’s investment portfolio, see page 9. A quarterly Fact Sheet is available upon request. Information concerning portfolio holdings of the Portfolio as of month end will be posted to scudder.com on the 15th of the following month.
Following the Portfolio’s fiscal first and third quarter-end, a complete portfolio holdings listing is filed with the SEC on Form N-Q. The form will be available on the SEC’s Web site at www.sec.gov, and it also may be reviewed and copied at the SEC’s Public Reference Room in Washington, D.C. Information on the operation of the SEC’s Public Reference Room may be obtained by calling (800) SEC-0330.
Page 8 of 466
Investment Portfolio December 31, 2004
Scudder Aggressive Growth Portfolio
| | | | |
| | | Shares
| | Value ($)
|
Common Stocks 97.1% | | | | |
Consumer Discretionary 16.7% | | | | |
Hotels Restaurants & Leisure 4.5% | | | | |
RARE Hospitality International, Inc.* | | 19,400 | | 618,084 |
Station Casinos, Inc. | | 17,200 | | 940,496 |
The Cheesecake Factory, Inc.* (c) | | 34,200 | | 1,110,474 |
| | | | |
|
| | | | | 2,669,054 |
| | | | |
|
Household Durables 2.7% | | | | |
Harman International Industries, Inc. | | 12,800 | | 1,625,600 |
| | | | |
|
Specialty Retail 5.5% | | | | |
Aeropostale, Inc.* | | 39,400 | | 1,159,542 |
Chico’s FAS, Inc.* | | 27,700 | | 1,261,181 |
Urban Outfitters, Inc.* | | 18,300 | | 812,520 |
| | | | |
|
| | | | | 3,233,243 |
| | | | |
|
Textiles, Apparel & Luxury Goods 4.0% | | | | |
Columbia Sportswear Co.* | | 18,400 | | 1,096,824 |
Polo Ralph Lauren Corp. | | 29,900 | | 1,273,740 |
| | | | |
|
| | | | | 2,370,564 |
| | | | |
|
Consumer Staples 4.9% | | | | |
Beverages 1.1% | | | | |
| | | | | |
Constellation Brands, Inc. “A”* | | 14,200 | | 660,442 |
| | | | |
|
Food & Staples Retailing 2.7% | | | | |
Wal-Mart Stores, Inc. | | 30,700 | | 1,621,574 |
| | | | |
|
Household Products 1.1% | | | | |
Jarden Corp.* | | 15,100 | | 655,944 |
| | | | |
|
Energy 1.9% | | | | |
Energy Equipment & Services | | | | |
BJ Services Co. | | 12,100 | | 563,134 |
Rowan Companies, Inc.* | | 22,700 | | 587,930 |
| | | | |
|
| | | | | 1,151,064 |
| | | | |
|
Financials 12.5% | | | | |
Capital Markets 10.2% | | | | |
E*TRADE Financial Corp.* | | 87,900 | | 1,314,105 |
Goldman Sachs Group, Inc. | | 8,300 | | 863,532 |
Investors Financial Services Corp. (c) | | 20,800 | | 1,039,584 |
Legg Mason, Inc. | | 26,250 | | 1,923,075 |
Lehman Brothers Holdings, Inc. | | 10,400 | | 909,792 |
| | | | |
|
| | | | | 6,050,088 |
| | | | |
|
Page 9 of 466
| | | | |
Diversified Financial Services 2.3% | | | | |
Citigroup, Inc. | | 13,600 | | 655,248 |
The First Marblehead Corp.* (c) | | 12,700 | | 714,375 |
| | | | |
|
| | | | | 1,369,623 |
| | | | |
|
Health Care 25.7% | | | | |
Biotechnology 2.8% | | | | |
Amgen, Inc.* | | 14,800 | | 949,420 |
Charles River Laboratories International, Inc.* | | 15,200 | | 699,352 |
| | | | |
|
| | | | | 1,648,772 |
| | | | |
|
| | |
| | | Shares
| | Value ($)
|
Health Care Equipment & Supplies 9.3% | | | | |
C.R. Bard, Inc. | | 14,500 | | 927,710 |
Cooper Companies, Inc. (c) | | 8,300 | | 585,897 |
Fisher Scientific International, Inc.* | | 9,500 | | 592,610 |
Kinetic Concepts, Inc.* | | 23,200 | | 1,770,160 |
PerkinElmer, Inc. | | 36,800 | | 827,632 |
Zimmer Holdings, Inc.* | | 10,500 | | 841,260 |
| | | | |
|
| | | | | 5,545,269 |
| | | | |
|
Health Care Providers & Services 8.9% | | | | |
Aetna, Inc. | | 7,900 | | 985,525 |
Community Health Systems, Inc.* | | 48,400 | | 1,349,392 |
Coventry Health Care, Inc.* | | 14,000 | | 743,120 |
Triad Hospitals, Inc.* | | 36,200 | | 1,347,002 |
UnitedHealth Group, Inc. | | 9,500 | | 836,285 |
| | | | |
|
| | | | | 5,261,324 |
| | | | |
|
Pharmaceuticals 4.7% | | | | |
Celgene Corp.* | | 41,400 | | 1,098,342 |
Johnson & Johnson | | 16,800 | | 1,065,456 |
Pfizer, Inc. | | 22,800 | | 613,092 |
| | | | |
|
| | | | | 2,776,890 |
| | | | |
|
Industrials 4.6% | | | | |
Aerospace & Defense 1.0% | | | | |
| | | | | |
United Technologies Corp. | | 5,700 | | 589,095 |
| | | | |
|
Commercial Services & Supplies 1.4% | | | | |
| | | | |
|
Avery Dennison Corp. | | 13,700 | | 821,589 |
| | | | |
|
Machinery 2.2% | | | | |
Caterpillar, Inc. | | 7,300 | | 711,823 |
Dover Corp. | | 14,100 | | 591,354 |
| | | | |
|
| | | | | 1,303,177 |
| | | | |
|
Information Technology 24.6% | | | | |
Communications Equipment 4.4% | | | | |
Cisco Systems, Inc.* | | 58,100 | | 1,121,330 |
Polycom, Inc.* | | 25,800 | | 601,656 |
QUALCOMM, Inc. | | 20,500 | | 869,200 |
| | | | |
|
| | | | | 2,592,186 |
| | | | |
|
Page 10 of 466
| | | | |
Computers & Peripherals 5.5% | | | | |
Dell, Inc.* | | 32,300 | | 1,361,122 |
EMC Corp.* | | 67,000 | | 996,290 |
QLogic Corp.* | | 24,700 | | 907,231 |
| | | | |
|
| | | | | 3,264,643 |
| | | | |
|
Internet Software & Services 2.6% | | | | |
Check Point Software Technologies Ltd.* | | 36,100 | | 889,143 |
Google, Inc. “A”* | | 3,400 | | 656,540 |
| | | | |
|
| | | | | 1,545,683 |
| | | | |
|
IT Consulting & Services 2.0% | | | | |
Paychex, Inc. | | 34,400 | | 1,172,352 |
| | | | |
|
Office Electronics 1.5% | | | | |
Zebra Technologies Corp. “A”* | | 16,200 | | 911,736 |
| | | | |
|
| | |
| | | Shares
| | Value ($)
|
Semiconductors & Semiconductor Equipment 2.9% | | | | |
Linear Technology Corp. | | 25,500 | | 988,380 |
Microchip Technology, Inc. | | 27,800 | | 741,148 |
| | | | |
|
| | | | | 1,729,528 |
| | | | |
|
Software 5.7% | | | | |
Cognos, Inc.* | | 34,800 | | 1,533,288 |
Microsoft Corp. | | 69,600 | | 1,859,016 |
| | | | |
|
| | | | | 3,392,304 |
| | | | |
|
Materials 4.2% | | | | |
Containers & Packaging 1.4% | | | | |
Packaging Corp. of America | | 35,400 | | 833,670 |
| | | | |
|
Metals & Mining 2.8% | | | | |
| | | | | |
Peabody Energy Corp. | | 20,600 | | 1,666,746 |
| | | | |
|
Telecommunication Services 2.0% | | | | |
Wireless Telecommunication Services | | | | |
Nextel Partners, Inc. “A”* | | 59,400 | | 1,160,676 |
| | | | |
|
Total Common Stocks (Cost $47,343,395) | | | | 57,622,836 |
| | | | |
|
| | |
| | | Shares
| | Value ($)
|
Securities Lending Collateral 3.6% | | | | |
Daily Assets Fund Institutional, 2.25% (d) (e) (Cost $2,157,464) | | 2,157,464 | | 2,157,464 |
| | | | |
|
Cash Equivalents 3.0% | | | | |
Scudder Cash Management QP Trust, 2.24% (b) (Cost $1,745,508) | | 1,745,508 | | 1,745,508 |
| | | | |
|
| | | | | | |
| | | % of Net Assets
| | | Value ($)
| |
Total Investment Portfolio (Cost $51,246,367) (a) | | 103.7 | | | 61,525,808 | |
| | | | | |
|
|
Other Assets and Liabilities, Net | | (3.7 | ) | | (2,173,449 | ) |
| | | | | |
|
|
Net Assets | | 100.0 | | | 59,352,359 | |
| | | | | |
|
|
Notes to Scudder Aggressive Growth Portfolio of Investments
| * | Non-income producing security. |
Page 11 of 466
| (a) | The cost for federal income tax purposes was $51,278,559. At December 31, 2004, net unrealized appreciation for all securities based on tax cost was $10,247,249. This consisted of aggregate gross unrealized appreciation for all securities in which there was an excess of value over tax cost of $10,854,843 and aggregate gross unrealized depreciation for all securities in which there was an excess of tax cost over value of $607,594. |
| (b) | Scudder Cash Management QP Trust is managed by Deutsche Investment Management Americas Inc. The rate shown is the annualized seven-day yield at period end. |
| (c) | All or a portion of these securities were on loan (see Notes to Financial Statements). The value of all securities loaned at December 31, 2004 amounted to $2,111,098, which is 3.6% of net assets. |
| (d) | Daily Assets Fund Institutional, an affiliated fund, is also managed by Deutsche Asset Management, Inc. The rate shown is the annualized seven-day yield at period end. |
| (e) | Represents collateral held in connection with securities lending. |
The accompanying notes are an integral part of the financial statements.
Financial Statements
Statement of Assets and Liabilities as of December 31, 2004
| | | | |
Assets | | | | |
Investments: | | | | |
Investments in securities, at value (cost $47,343,395) — including $2,111,098 of securities loaned | | $ | 57,622,836 | |
Investment in Daily Assets Fund Institutional (cost $2,157,464)* | | | 2,157,464 | |
Investment in Scudder Cash Management QP Trust (cost $1,745,508) | | | 1,745,508 | |
| | |
|
|
|
Total investments in securities, at value (cost $51,246,367) | | | 61,525,808 | |
| | |
|
|
|
Receivable for investments sold | | | 52,680 | |
Dividends receivable | | | 17,385 | |
Interest receivable | | | 3,379 | |
Other assets | | | 1,833 | |
| | |
|
|
|
Total assets | | | 61,601,085 | |
| | |
|
|
|
Liabilities | | | | |
Payable for fund shares redeemed | | | 1,007 | |
Accrued management fee | | | 14,561 | |
Payable upon return of securities loaned | | | 2,157,464 | |
Other accrued expenses and payables | | | 75,694 | |
| | |
|
|
|
Total liabilities | | | 2,248,726 | |
| | |
|
|
|
Net assets, at value | | $ | 59,352,359 | |
| | |
|
|
|
Net Assets | | | | |
Net assets consist of: | | | | |
Accumulated net investment loss | | | (2,093 | ) |
Net unrealized appreciation (depreciation) on investments | | | 10,279,441 | |
Accumulated net realized gain (loss) | | | (39,182,351 | ) |
Paid-in capital | | | 88,257,362 | |
| | |
|
|
|
Net assets, at value | | $ | 59,352,359 | |
| | |
|
|
|
Class A | | | | |
| |
Net Asset Value, offering and redemption price per share ($53,160,434 ÷ 5,401,258 outstanding shares of beneficial interest, $.01 par value, unlimited number of shares authorized) | | $ | 9.84 | |
| | |
|
|
|
| Class B | | | | |
| |
Net Asset Value, offering and redemption price per share ($6,191,925 ÷ 634,195 outstanding shares of beneficial interest, $.01 par value, unlimited number of shares authorized) | | $ | 9.76 | |
| | |
|
|
|
| * | Represents collateral on securities loaned. |
Page 12 of 466
| | | | |
| Statement of Operations for the year ended December 31, 2004 | | | |
| Investment Income | | | | |
| |
Income: | | | | |
Dividends (net of foreign taxes withheld of $1,370) | | $ | 428,176 | |
Interest — Scudder Cash Management QP Trust | | | 45,181 | |
Securities lending income, including income from Daily Assets Fund Institutional | | | 11,628 | |
| | |
|
|
|
Total Income | | | 484,985 | |
| | |
|
|
|
Expenses: | | | | |
Management fee | | | 433,852 | |
Custodian and accounting fees | | | 79,450 | |
Distribution service fees (Class B) | | | 12,985 | |
Record keeping fees (Class B) | | | 6,834 | |
Auditing | | | 44,356 | |
Legal | | | 16,080 | |
Reports to shareholders | | | 16,635 | |
Other | | | 2,616 | |
| | |
|
|
|
Total expenses before expense reductions | | | 612,808 | |
| | |
|
|
|
Expense reductions | | | (43,768 | ) |
| | |
|
|
|
Total expenses after expense reductions | | | 569,040 | |
| | |
|
|
|
Net investment income (loss) | | | (84,055 | ) |
| | |
|
|
|
| Realized and Unrealized Gain (Loss) on Investment Transactions | | | | |
Net realized gain (loss) from investments | | | 2,570,533 | |
Net unrealized appreciation (depreciation) during the period on investments | | | (452,406 | ) |
| | |
|
|
|
Net gain (loss) on investment transactions | | | 2,118,127 | |
| | |
|
|
|
Net increase (decrease) in net assets resulting from operations | | $ | 2,034,072 | |
| | |
|
|
|
The accompanying notes are an integral part of the financial statements.
Page 13 of 466
Statement of Changes in Net Assets
| | | | | | | | |
| | | Years Ended December 31,
| |
| Increase (Decrease) in Net Assets | | 2004
| | | 2003
| |
Operations: | | | | | | | | |
Net investment income (loss) | | $ | (84,055 | ) | | $ | (295,832 | ) |
Net realized gain (loss) on investment transactions | | | 2,570,533 | | | | (6,980,374 | ) |
Net unrealized appreciation (depreciation) on investment transactions during the period | | | (452,406 | ) | | | 21,899,078 | |
Net increase (decrease) in net assets resulting from operations | | | 2,034,072 | | | | 14,622,872 | |
Portfolio share transactions: | | | | | | | | |
| | |
Class A | | | | | | | | |
Proceeds from shares sold | | | 4,965,372 | | | | 19,207,656 | |
Cost of shares redeemed | | | (9,699,886 | ) | | | (21,817,569 | ) |
Net increase (decrease) in net assets from Class A share transactions | | | (4,734,514 | ) | | | (2,609,913 | ) |
| | |
Class B | | | | | | | | |
| | |
Proceeds from shares sold | | | 2,601,994 | | | | 3,541,180 | |
Cost of shares redeemed | | | (435,771 | ) | | | (186,774 | ) |
Net increase (decrease) in net assets from Class B share transactions | | | 2,166,223 | | | | 3,354,406 | |
Increase (decrease) in net assets | | | (534,219 | ) | | | 15,367,365 | |
Net assets at beginning of period | | | 59,886,578 | | | | 44,519,213 | |
| | |
|
|
| |
|
|
|
Net assets at end of period (including accumulated net investment loss of $2,093 and $85, respectively) | | $ | 59,352,359 | | | $ | 59,886,578 | |
| | |
|
|
| |
|
|
|
| Other Information | | | | | | | | |
| | |
Class A | | | | | | | | |
Shares outstanding at beginning of period | | | 5,923,874 | | | | 6,292,403 | |
Shares sold | | | 534,758 | | | | 2,320,895 | |
Shares redeemed | | | (1,057,374 | ) | | | (2,689,424 | ) |
Net increase (decrease) in Portfolio shares | | | (522,616 | ) | | | (368,529 | ) |
| | |
|
|
| |
|
|
|
Shares outstanding at end of period | | | 5,401,258 | | | | 5,923,874 | |
| | |
|
|
| |
|
|
|
| | |
Class B | | | | | | | | |
Shares outstanding at beginning of period | | | 405,258 | | | | 11,689 | |
Shares sold | | | 277,046 | | | | 417,145 | |
Shares redeemed | | | (48,109 | ) | | | (23,576 | ) |
Net increase (decrease) in Portfolio shares | | | 228,937 | | | | 393,569 | |
| | |
|
|
| |
|
|
|
Shares outstanding at end of period | | | 634,195 | | | | 405,258 | |
| | |
|
|
| |
|
|
|
The accompanying notes are an integral part of the financial statements.
Page 14 of 466
Financial Highlights
Class A
| | | | | | | | | | | | | | | | | | | | |
Years Ended December 31,
| | 2004
| | | 2003
| | | 2002
| | | 2001
| | | 2000a
| |
Selected Per Share Data | | | | | | | | | | | | | | | | | | | | |
Net asset value, beginning of period | | $ | 9.46 | | | $ | 7.06 | | | $ | 10.22 | | | $ | 13.20 | | | $ | 13.99 | |
| | |
|
|
| |
|
|
| |
|
|
| |
|
|
| |
|
|
|
Income (loss) from investment operations: | | | | | | | | | | | | | | | | | | | | |
Net investment income (loss)b | | | (.01 | ) | | | (.05 | ) | | | (.01 | ) | | | .06 | | | | .18 | |
Net realized and unrealized gain (loss) on investment transactions | | | .39 | | | | 2.45 | | | | (3.11 | ) | | | (2.92 | ) | | | (.87 | ) |
| | |
|
|
| |
|
|
| |
|
|
| |
|
|
| |
|
|
|
Total from investment operations | | | .38 | | | | 2.40 | | | | (3.12 | ) | | | (2.86 | ) | | | (.69 | ) |
| | |
|
|
| |
|
|
| |
|
|
| |
|
|
| |
|
|
|
Less distributions from: | | | | | | | | | | | | | | | | | | | | |
Net investment income | | | — | | | | — | | | | (.04 | ) | | | (.12 | ) | | | — | |
Net realized gains on investment transactions | | | — | | | | — | | | | — | | | | — | | | | (.10 | ) |
| | |
|
|
| |
|
|
| |
|
|
| |
|
|
| |
|
|
|
Total distributions | | | — | | | | — | | | | (.04 | ) | | | (.12 | ) | | | (.10 | ) |
| | |
|
|
| |
|
|
| |
|
|
| |
|
|
| |
|
|
|
Net asset value, end of period | | $ | 9.84 | | | $ | 9.46 | | | $ | 7.06 | | | $ | 10.22 | | | $ | 13.20 | |
| | |
|
|
| |
|
|
| |
|
|
| |
|
|
| |
|
|
|
Total Return (%) | | | 4.02 | c | | | 33.99 | c | | | (30.66 | ) | | | (21.76 | ) | | | (4.96 | ) |
| | |
|
|
| |
|
|
| |
|
|
| |
|
|
| |
|
|
|
Ratios to Average Net Assets and Supplemental Data | | | | | | | | | | | | | | | | | | | | |
Net assets, end of period ($ millions) | | | 53 | | | | 56 | | | | 44 | | | | 71 | | | | 66 | |
Ratio of expenses before expense reductions (%) | | | 1.02 | | | | .98 | | | | .81 | | | | .86 | | | | .95 | |
Ratio of expenses after expense reductions (%) | | | .95 | | | | .95 | | | | .81 | | | | .86 | | | | .94 | |
Ratio of net investment income (loss) (%) | | | (.11 | ) | | | (.57 | ) | | | (.19 | ) | | | .58 | | | | 1.22 | |
Portfolio turnover rate (%) | | | 103 | | | | 91 | | | | 71 | | | | 42 | | | | 103 | |
| a | On June 18, 2001, the Portfolio implemented a 1 for 10 reverse stock split. Per share information, for the period prior to December 31, 2001, has been restated to reflect the effect of the split. Shareholders received 1 share for every 10 shares owned and net asset value per share increased correspondingly. |
| b | Based on average shares outstanding during the period. |
| c | Total return would have been lower had certain expenses not been reduced. |
Class B
| | | | | | | | | | | | |
Years Ended December 31,
| | 2004
| | | 2003
| | | 2002a
| |
Selected Per Share Data | | | | | | | | | | | | |
Net asset value, beginning of period | | $ | 9.42 | | | $ | 7.06 | | | $ | 7.43 | |
| | |
|
|
| |
|
|
| |
|
|
|
Income (loss) from investment operations: | | | | | | | | | | | | |
Net investment income (loss)b | | | (.05 | ) | | | (.09 | ) | | | (.02 | ) |
Net realized and unrealized gain (loss) on investment transactions | | | .39 | | | | 2.45 | | | | (.35 | ) |
| | |
|
|
| |
|
|
| |
|
|
|
Total from investment operations | | | .34 | | | | 2.36 | | | | (.37 | ) |
| | |
|
|
| |
|
|
| |
|
|
|
Net asset value, end of period | | $ | 9.76 | | | $ | 9.42 | | | $ | 7.06 | |
| | |
|
|
| |
|
|
| |
|
|
|
Total Return (%) | | | 3.61 | c | | | 33.43 | c | | | (4.98 | )** |
| | |
|
|
| |
|
|
| |
|
|
|
Ratios to Average Net Assets and Supplemental Data | | | | | | | | | | | | |
Net assets, end of period ($ millions) | | | 6 | | | | 4 | | | | .1 | |
Ratio of expenses before expense reductions (%) | | | 1.41 | | | | 1.37 | | | | 1.06 | * |
Ratio of expenses after expense reductions (%) | | | 1.34 | | | | 1.34 | | | | 1.06 | * |
Ratio of net investment income (loss) (%) | | | (.50 | ) | | | (.96 | ) | | | (.47 | )* |
Portfolio turnover rate (%) | | | 103 | | | | 91 | | | | 71 | |
| a | For the period from July 1, 2002 (commencement of operations of Class B shares) to December 31, 2002. |
Page 15 of 466
| b | Based on average shares outstanding during the period. |
| c | Total return would have been lower had certain expenses not been reduced. |
Performance Summary December 31, 2004
Scudder Blue Chip Portfolio
All performance shown is historical, assumes reinvestment of all dividends and capital gains, and does not guarantee future results. Investment return and principal value fluctuate with changing market conditions so that, when redeemed, shares may be worth more or less then their original cost. Current performance may be lower or higher than the performance data quoted. Please visit scudder.com for the product’s most recent month-end performance. Performance doesn’t reflect charges and fees (“contract charges”) associated with the separate account that invests in the Portfolio or any variable life insurance policy or variable annuity contract for which the Portfolio is an investment option. These charges and fees will reduce returns.
This Portfolio is subject to stock market risk, meaning stocks in the portfolio may decline in value for extended periods of time due to the activities and financial prospects of individual companies, or due to general market and economic conditions. This may result in greater share price volatility. Please read this Portfolio’s prospectus for specific details regarding its investments and risk profile.
Growth of an Assumed $10,000 Investment in Scudder Blue Chip Portfolio from 5/1/1997 to 12/31/2004
| | |
¨ Scudder Blue Chip Portfolio —Class A ¨ Russell 1000 Index |
| |
 | | The Russell 1000 Index is an unmanaged capitalization-weighted price-only index composed of the largest-capitalized United States companies whose common stocks are traded in the US. This larger capitalization, market-oriented index is highly correlated with the S&P 500 Index. Index returns assume reinvested dividends and, unlike Portfolio returns, do not reflect any fees or expenses. It is not possible to invest directly into an index. |
Yearly periods ended December 31
Comparative Results
| | | | | | | | | | | | | | | | | | |
Scudder Blue Chip Portfolio
| | | | 1-Year
| | | 3-Year
| | | 5-Year
| | | Life of Portfolio*
| |
Class A | | Growth of $10,000 | | $ | 11,604 | | | $ | 11,500 | | | $ | 8,923 | | | $ | 14,190 | |
| | | Average annual total return | | | 16.04 | % | | | 4.77 | % | | | -2.25 | % | | | 4.67 | % |
Russell 1000 Index | | Growth of $10,000 | | $ | 11,140 | | | $ | 11,337 | | | $ | 9,153 | | | $ | 17,447 | |
| | | Average annual total return | | | 11.40 | % | | | 4.27 | % | | | -1.76 | % | | | 7.53 | % |
| | | | | |
Scudder Blue Chip Portfolio
| | | | | | | | | | 1-Year
| | | Life of Class**
| |
Class B | | Growth of $10,000 | | | | | | | | | | $ | 11,555 | | | $ | 13,323 | |
| | | Average annual total return | | | | | | | | | | | 15.55 | % | | | 12.15 | % |
Russell 1000 Index | | Growth of $10,000 | | | | | | | | | | $ | 11,140 | | | $ | 13,004 | |
| | | Average annual total return | | | | | | | | | | | 11.40 | % | | | 11.08 | % |
The growth of $10,000 is cumulative.
| * | The Portfolio commenced operations on May 1, 1997. Index returns begin April 30, 1997. |
Page 16 of 466
| ** | The Portfolio commenced offering Class B shares on July 1, 2002. Index returns begin June 30, 2002. |
Information About Your Portfolio’s Expenses
Scudder Blue Chip Portfolio
As an investor of the Portfolio, you incur two types of costs: ongoing expenses and transaction costs. Ongoing expenses include management fees, distribution and service (12b-1) fees and other Portfolio expenses. Examples of transaction costs include sales charges (loads), redemption fees and account maintenance fees, which are not shown in this section. The following tables are intended to help you understand your ongoing expenses (in dollars) of investing in the Portfolio and to help you compare these expenses with the ongoing expenses of investing in other mutual funds. The tables are based on an investment of $1,000 made at the beginning of the six-month period ended December 31, 2004.
The tables illustrate your Portfolio’s expenses in two ways:
Actual Portfolio Return. This helps you estimate the actual dollar amount of ongoing expenses (but not transaction costs) paid on a $1,000 investment in the Portfolio using the Portfolio’s actual return during the period. To estimate the expenses you paid over the period, simply divide your account value by $1,000 (for example, an $8,600 account value divided by $1,000 = 8.6), then multiply the result by the number in the “Expenses Paid per $1,000” line under the share class you hold.
Hypothetical 5% Portfolio Return. This helps you to compare your Portfolio’s ongoing expenses (but not transaction costs) with those of other mutual funds using the Portfolio’s actual expense ratio and a hypothetical rate of return of 5% per year before expenses. Examples using a 5% hypothetical Portfolio return may be found in the shareholder reports of other mutual funds. The hypothetical account values and expenses may not be used to estimate the actual ending account balance or expenses you paid for the period.
Please note that the expenses shown in these tables are meant to highlight your ongoing expenses only and do not reflect any transaction costs. The “Expenses Paid per $1,000” line of the tables is useful in comparing ongoing expenses only and will not help you determine the relative total expense of owning different funds. If these transaction costs had been included, your costs would have been higher.
Expenses and Value of a $1,000 Investment for the six months ended December 31, 2004
| | | | | | |
Actual Portfolio Return
| | Class A
| | Class B
|
Beginning Account Value 7/1/04 | | $ | 1,000.00 | | $ | 1,000.00 |
Ending Account Value 12/31/04 | | $ | 1,085.10 | | $ | 1,081.90 |
Expenses Paid per $1,000* | | $ | 3.72 | | $ | 5.68 |
| | |
Hypothetical 5% Portfolio Return
| | Class A
| | Class B
|
Beginning Account Value 7/1/04 | | $ | 1,000.00 | | $ | 1,000.00 |
Ending Account Value 12/31/04 | | $ | 1,021.63 | | $ | 1,019.75 |
Expenses Paid per $1,000* | | $ | 3.61 | | $ | 5.51 |
| * | Expenses are equal to the Portfolio’s annualized expense ratio for each share class, multiplied by the average account value over the period, multiplied by the number of days in the most recent six-month period, then divided by 365. |
Page 17 of 466
| | | | | | |
Annualized Expense Ratios
| | Class A
| | | Class B
| |
Scudder Variable Series II — Scudder Blue Chip Portfolio | | .71 | % | | 1.08 | % |
For more information, please refer to the Portfolio’s prospectus.
Management Summary December 31, 2004
Scudder Blue Chip Portfolio
The US equity market produced a strong return in 2004, as steady economic growth and favorable corporate earnings results supported stock prices amid a potentially challenging environment. The portfolio returned 16.04% (Class A shares, unadjusted for contract charges), ahead of the 11.40% return of its benchmark, the Russell 1000 Index for the year ended December 31, 2004.
We believe the portfolio’s strong performance is attributable to our disciplined focus on individual stock selection. We generated the best relative performance within the diversified financials, media and materials industry groups. The portfolio’s position in Ryder System, Inc. (1.3% of net assets), a company that provides transportation and supply-chain-management solutions worldwide, also was a key contributor to performance as an improving economy sparked increased demand for trucking services. Our stock selection was weakest within the industrials sector, where an underweight position in General Electric Co. (2.1% of net assets) detracted from relative performance. General Electric looked weak based on our model, as its fundamental characteristics were poor relative to its industry peers, but the stock nevertheless outperformed in 2004.
Overall, we are pleased with the portfolio’s performance and its current positioning. As always, we will continue to utilize a balanced approach to our stock selection methodology — using both value and growth attributes as well as technical signals — to help us pinpoint timely market opportunities.
Janet Campagna
Robert Wang
Co-Managers
Deutsche Investment Management Americas Inc.
All performance shown is historical, assumes reinvestment of all dividends and capital gains, and does not guarantee future results. Investment return and principal value fluctuate with changing market conditions so that, when redeemed, shares may be worth more or less then their original cost. Current performance may be lower or higher than the performance data quoted. Please visit scudder.com for the product’s most recent month-end performance. Performance doesn’t reflect charges and fees (“contract charges”) associated with the separate account that invests in the portfolio or any variable life insurance policy or variable annuity contract for which the portfolio is an investment option. These charges and fees will reduce returns.
Risk Considerations
This Portfolio is subject to stock market risk, meaning stocks in the portfolio may decline in value for extended periods of time due to the activities and financial prospects of individual companies, or due to general market and economic conditions. This may result in greater share price volatility. Please read this portfolio’s prospectus for specific details regarding its investments and risk profile.
Page 18 of 466
The Russell 1000 Index is an unmanaged capitalization-weighted price-only index composed of the largest-capitalized United States companies whose common stocks are traded in the US. This larger capitalization, market-oriented index is highly correlated with the S&P 500 Index. Index returns assume reinvestment of all distributions and do not reflect fees or expenses. It is not possible to invest directly into an index.
Portfolio management market commentary is as of December 31, 2004, and may not come to pass. This information is subject to change at any time based on market and other conditions.
Portfolio Summary
Scudder Blue Chip Portfolio
| | | | | | |
Asset Allocation (Excludes Securities Lending Collateral)
| | 12/31/04
| | | 12/31/03
| |
Common Stocks | | 96 | % | | 97 | % |
Cash Equivalents | | 4 | % | | 3 | % |
| | |
|
| |
|
|
| | | 100 | % | | 100 | % |
| | |
|
| |
|
|
| | | | | | |
Sector Diversification (Excludes Cash Equivalents and Securities Lending Collateral)
| | 12/31/04
| | | 12/31/03
| |
Financials | | 19 | % | | 19 | % |
Health Care | | 15 | % | | 15 | % |
Information Technology | | 14 | % | | 17 | % |
Industrials | | 13 | % | | 10 | % |
Consumer Discretionary | | 12 | % | | 15 | % |
Consumer Staples | | 8 | % | | 7 | % |
Energy | | 8 | % | | 6 | % |
Materials | | 5 | % | | 4 | % |
Telecommunication Services | | 4 | % | | 4 | % |
Utilities | | 2 | % | | 3 | % |
| | |
|
| |
|
|
| | | 100 | % | | 100 | % |
| | |
|
| |
|
|
Asset allocation and sector diversification are subject to change.
For more complete details about the Portfolio’s investment portfolio, see page 19. A quarterly Fact Sheet is available upon request. Information concerning portfolio holdings of the Portfolio as of month end will be posted to scudder.com on the 15th of the following month.
Following the Portfolio’s fiscal first and third quarter-end, a complete portfolio holdings listing is filed with the SEC on Form N-Q. The form will be available on the SEC’s Web site at www.sec.gov, and it also may be reviewed and copied at the SEC’s Public Reference Room in Washington, D.C. Information on the operation of the SEC’s Public Reference Room may be obtained by calling (800) SEC-0330.
Page 19 of 466
|
| Investment Portfolio December 31, 2004 |
Scudder Blue Chip Portfolio
| | | | |
| | | Shares
| | Value ($)
|
Common Stocks 96.6% | | | | |
Consumer Discretionary 11.9% | | | | |
Auto Components 1.2% | | | | |
American Axle & Manufacturing Holdings, Inc. | | 87,100 | | 2,670,486 |
Autoliv, Inc. | | 25,600 | | 1,236,480 |
| | | | |
|
| | | | | 3,906,966 |
| | | | |
|
Hotels Restaurants & Leisure 1.0% | | | | |
McDonald’s Corp. | | 88,300 | | 2,830,898 |
Regal Entertainment Group “A” | | 24,100 | | 500,075 |
| | | | |
|
| | | | | 3,330,973 |
| | | | |
|
Internet & Catalog Retail 0.7% | | | | |
eBay, Inc.* | | 18,200 | | 2,116,296 |
| | | | |
|
Media 3.2% | | | | |
McGraw-Hill Companies, Inc. | | 54,100 | | 4,952,314 |
Walt Disney Co. | | 186,100 | | 5,173,580 |
| | | | |
|
| | | | | 10,125,894 |
| | | | |
|
Multiline Retail 0.8% | | | | |
Target Corp. | | 48,500 | | 2,518,605 |
| | | | |
|
Specialty Retail 3.5% | | | | |
American Eagle Outfitters, Inc. | | 54,300 | | 2,557,530 |
Home Depot, Inc. | | 129,400 | | 5,530,556 |
PETCO Animal Supplies, Inc.* | | 11,900 | | 469,812 |
The Gap, Inc. | | 124,800 | | 2,635,776 |
| | | | |
|
| | | | | 11,193,674 |
| | | | |
|
Textiles, Apparel & Luxury Goods 1.5% | | | | |
NIKE, Inc. “B” | | 31,800 | | 2,883,942 |
V.F. Corp. | | 34,200 | | 1,893,996 |
| | | | |
|
| | | | | 4,777,938 |
| | | | |
|
Consumer Staples 7.8% | | | | |
Beverages 0.5% | | | | |
Adolph Coors Co. “B” (e) | | 22,900 | | 1,732,843 |
| | | | |
|
Food & Drug Retailing 1.7% | | | | |
7-Eleven, Inc.* | | 24,400 | | 584,380 |
BJ’s Wholesale Club, Inc.* | | 43,800 | | 1,275,894 |
Costco Wholesale Corp. | | 73,800 | | 3,572,658 |
Wal-Mart Stores, Inc. | | 100 | | 5,282 |
| | | | |
|
| | | | | 5,438,214 |
| | | | |
|
Food Products 2.9% | | | | |
Pilgrim’s Pride Corp. (e) | | 97,000 | | 2,975,960 |
Tyson Foods, Inc. “A” | | 179,500 | | 3,302,800 |
William Wrigley Jr. Co. | | 44,500 | | 3,078,955 |
| | | | |
|
| | | | | 9,357,715 |
| | | | |
|
Page 20 of 466
| | | | |
Personal Products 1.7% | | | | |
Gillette Co. | | 119,900 | | 5,369,122 |
Tobacco 1.0% | | | | |
Altria Group, Inc. | | 19,200 | | 1,173,120 |
Loews Corp. — Carolina Group | | 9,100 | | 263,445 |
UST, Inc. | | 35,900 | | 1,727,149 |
| | | | |
|
| | | | | 3,163,714 |
| | | | |
|
| | |
| | | Shares
| | Value ($)
|
Energy 7.6% | | | | |
Oil & Gas | | | | |
Anadarko Petroleum Corp. | | 72,200 | | 4,679,282 |
Apache Corp. | | 89,100 | | 4,505,787 |
Burlington Resources, Inc. | | 41,100 | | 1,787,850 |
Chesapeake Energy Corp. | | 42,500 | | 701,250 |
Devon Energy Corp. | | 32,300 | | 1,257,116 |
El Paso Corp. | | 147,800 | | 1,537,120 |
ExxonMobil Corp. | | 101,940 | | 5,225,444 |
Noble Energy Inc. | | 20,500 | | 1,264,030 |
Valero Energy Corp. | | 76,000 | | 3,450,400 |
| | | | |
|
| | | | | 24,408,279 |
| | | | |
|
Financials 18.3% | | | | |
Banks 6.5% | | | | |
Bank of America Corp. | | 203,800 | | 9,576,562 |
Fremont General Corp. | | 21,900 | | 551,442 |
Golden West Financial Corp. | | 2,400 | | 147,408 |
National City Corp. | | 9,400 | | 352,970 |
US Bancorp. | | 173,500 | | 5,434,020 |
Wachovia Corp. | | 30,800 | | 1,620,080 |
Wells Fargo & Co. | | 49,400 | | 3,070,210 |
| | | | |
|
| | | | | 20,752,692 |
| | | | |
|
Capital Markets 2.5% | | | | |
Lehman Brothers Holdings, Inc. | | 50,200 | | 4,391,496 |
Morgan Stanley | | 64,400 | | 3,575,488 |
| | | | |
|
| | | | | 7,966,984 |
| | | | |
|
Consumer Finance 1.0% | | | | |
American Express Co. | | 10,600 | | 597,522 |
Capital One Financial Corp. | | 19,000 | | 1,599,990 |
Providian Financial Corp.* | | 64,400 | | 1,060,668 |
| | | | |
|
| | | | | 3,258,180 |
| | | | |
|
Diversified Financial Services 2.7% | | | | |
Citigroup, Inc. | | 52,600 | | 2,534,268 |
Freddie Mac | | 77,600 | | 5,719,120 |
JPMorgan Chase & Co. | | 9,464 | | 369,191 |
| | | | |
|
| | | | | 8,622,579 |
| | | | |
|
Page 21 of 466
| | | | |
Insurance 4.1% | | | | |
American International Group, Inc. | | 8,412 | | 552,416 |
Chubb Corp. | | 30,700 | | 2,360,830 |
Loews Corp. | | 19,300 | | 1,356,790 |
MetLife, Inc. | | 97,500 | | 3,949,725 |
Odyssey Re Holdings Corp. (e) | | 6,800 | | 171,428 |
W.R. Berkley Corp. | | 101,650 | | 4,794,830 |
| | | | |
|
| | | | | 13,186,019 |
| | | | |
|
Real Estate 1.5% | | | | |
Apartment Investment & Management Co. “A” (REIT) | | 5,700 | | 219,678 |
Avalonbay Communities, Inc. (REIT) | | 10,300 | | 775,590 |
Camden Property Trust (REIT) | | 7,200 | | 367,200 |
CenterPoint Properties Corp. (REIT) | | 5,200 | | 249,028 |
Equity Office Properties Trust (REIT) | | 29,600 | | 861,952 |
Equity Residential (REIT) | | 16,300 | | 589,734 |
General Growth Properties, Inc. (REIT) | | 12,300 | | 444,768 |
| | |
| | | Shares
| | Value ($)
|
Rayonier, Inc. | | 8,200 | | 401,062 |
The Mills Corp. (REIT) | | 4,900 | | 312,424 |
Vornado Realty Trust (REIT) | | 5,800 | | 441,554 |
| | | | |
|
| | | | | 4,662,990 |
| | | | |
|
Health Care 14.1% | | | | |
Biotechnology 2.4% | | | | |
Cephalon, Inc.* | | 10,000 | | 508,800 |
Charles River Laboratories International, Inc.* | | 52,000 | | 2,392,520 |
Genzyme Corp.* | | 30,400 | | 1,765,328 |
Gilead Sciences, Inc.* | | 86,500 | | 3,026,635 |
| | | | |
|
| | | | | 7,693,283 |
| | | | |
|
Health Care Equipment & Supplies 2.1% | | | | |
Baxter International, Inc. | | 25,200 | | 870,408 |
Becton, Dickinson & Co. | | 79,600 | | 4,521,280 |
Dade Behring, Inc.* | | 7,900 | | 442,400 |
Respironics, Inc.* | | 14,400 | | 782,784 |
| | | | |
|
| | | | | 6,616,872 |
| | | | |
|
Health Care Providers & Services 4.1% | | | | |
AmerisourceBergen Corp. | | 55,600 | | 3,262,608 |
Covance, Inc.* | | 11,800 | | 457,250 |
Coventry Health Care, Inc.* | | 66,300 | | 3,519,204 |
UnitedHealth Group, Inc. | | 67,000 | | 5,898,010 |
| | | | |
|
| | | | | 13,137,072 |
| | | | |
|
Pharmaceuticals 5.5% | | | | |
Allergan, Inc. | | 6,000 | | 486,420 |
Bristol-Myers Squibb Co. | | 8,000 | | 204,960 |
Johnson & Johnson | | 137,182 | | 8,700,082 |
Medicis Pharmaceutical Corp. “A” | | 12,500 | | 438,875 |
Page 22 of 466
| | | | |
Merck & Co., Inc. | | 59,900 | | 1,925,186 |
Pfizer, Inc. | | 221,150 | | 5,946,724 |
| | | | |
|
| | | | | 17,702,247 |
| | | | |
|
Industrials 12.3% | | | | |
Aerospace & Defense 3.8% | | | | |
Boeing Co. | | 87,400 | | 4,524,698 |
General Dynamics Corp. | | 29,700 | | 3,106,620 |
Northrop Grumman Corp. | | 2,100 | | 114,156 |
Raytheon Co. | | 116,200 | | 4,512,046 |
| | | | |
|
| | | | | 12,257,520 |
| | | | |
|
Air Freight & Logistics 3.1% | | | | |
FedEx Corp. | | 52,400 | | 5,160,876 |
J.B. Hunt Transport Services, Inc. | | 13,700 | | 614,445 |
Ryder System, Inc. | | 86,900 | | 4,151,213 |
| | | | |
|
| | | | | 9,926,534 |
| | | | |
|
Commercial Services & Supplies 2.1% | | | | |
Cendant Corp. | | 181,600 | | 4,245,808 |
Corporate Executive Board Co. | | 12,600 | | 843,444 |
The Brinks Co. | | 37,200 | | 1,470,144 |
| | | | |
|
| | | | | 6,559,396 |
| | | | |
|
Industrial Conglomerates 2.2% | | | | |
3M Co. | | 2,500 | | 205,175 |
General Electric Co. | | 188,100 | | 6,865,650 |
| | | | |
|
| | | | | 7,070,825 |
| | | | |
|
| | |
| | | Shares
| | Value ($)
|
Machinery 0.8% | | | | |
Cummins, Inc. | | 31,000 | | 2,597,490 |
| | | | |
|
Road & Rail 0.3% | | | | |
Norfolk Southern Corp. | | 22,200 | | 803,418 |
| | | | |
|
Information Technology 13.8% | | | | |
Communications Equipment 1.9% | | | | |
Cisco Systems, Inc.* | | 296,900 | | 5,730,170 |
Motorola, Inc. | | 14,600 | | 251,120 |
| | | | |
|
| | | | | 5,981,290 |
| | | | |
|
Computers & Peripherals 3.0% | | | | |
International Business Machines Corp. | | 73,000 | | 7,196,340 |
Sun Microsystems, Inc.* | | 443,200 | | 2,384,416 |
| | | | |
|
| | | | | 9,580,756 |
| | | | |
|
Internet Software & Services 0.8% | | | | |
Ingram Micro, Inc. “A”* | | 65,600 | | 1,364,480 |
Yahoo!, Inc.* | | 29,800 | | 1,122,864 |
| | | | |
|
| | | | | 2,487,344 |
| | | | |
|
IT Consulting & Services 0.7% | | | | |
| | | | |
|
Unisys Corp.* | | 236,800 | | 2,410,624 |
| | | | |
|
Page 23 of 466
| | | | |
Semiconductors & Semiconductor Equipment 4.8% | | | | |
Advanced Micro Devices, Inc.* | | 83,900 | | 1,847,478 |
Cree, Inc.* (e) | | 48,300 | | 1,935,864 |
Intel Corp. | | 270,900 | | 6,336,351 |
MEMC Electronic Materials, Inc.* | | 59,700 | | 791,025 |
Microchip Technology, Inc. | | 46,800 | | 1,247,688 |
Micron Technology, Inc.* | | 186,000 | | 2,297,100 |
National Semiconductor Corp.* | | 50,600 | | 908,270 |
| | | | |
|
| | | | | 15,363,776 |
| | | | |
|
Software 2.6% | | | | |
Autodesk, Inc. | | 24,800 | | 941,160 |
Microsoft Corp. | | 111,300 | | 2,972,823 |
Oracle Corp.* | | 285,400 | | 3,915,688 |
Symantec Corp.* | | 14,600 | | 376,096 |
| | | | |
|
| | | | | 8,205,767 |
| | | | |
|
Materials 4.4% | | | | |
Chemicals 1.2% | | | | |
Eastman Chemical Co. | | 19,100 | | 1,102,643 |
Monsanto Co. | | 49,100 | | 2,727,505 |
| | | | |
|
| | | | | 3,830,148 |
| | | | |
|
Containers & Packaging 0.9% | | | | |
| | | | |
|
Owens-Illinois, Inc.* | | 119,800 | | 2,713,470 |
| | | | |
|
Metals & Mining 2.3% | | | | |
Phelps Dodge Corp. | | 36,900 | | 3,650,148 |
Southern Peru Copper Corp. (e) | | 10,600 | | 500,426 |
United States Steel Corp. (e) | | 61,800 | | 3,167,250 |
| | | | |
|
| | | | | 7,317,824 |
| | | | |
|
Paper & Forest Products 0.0% | | | | |
| | | | | |
Louisiana-Pacific Corp. | | 3,100 | | 82,894 |
| | | | |
|
| | |
| | | Shares
| | Value ($)
|
Telecommunication Services 4.3% | | | | |
Diversified Telecommunication Services 2.8% | | | | |
Sprint Corp. | | 130,300 | | 3,237,955 |
Verizon Communications, Inc. | | 142,900 | | 5,788,879 |
| | | | |
|
| | | | | 9,026,834 |
| | | | |
|
Wireless Telecommunication Services 1.5% | | | | |
Nextel Communications, Inc. “A”* | | 39,800 | | 1,194,000 |
Nextel Partners, Inc. “A”* | | 96,800 | | 1,891,472 |
Western Wireless Corp. “A”* | | 53,300 | | 1,561,690 |
| | | | |
|
| | | | | 4,647,162 |
| | | | |
|
Utilities 2.1% | | | | |
Electric Utilities 1.5% | | | | |
American Electric Power Co. | | 31,000 | | 1,064,540 |
Exelon Corp. | | 83,600 | | 3,684,251 |
| | | | |
|
| | | | | 4,748,791 |
| | | | |
|
Multi-Utilities 0.6% | | | | |
| | | | | |
Duke Energy Corp. | | 85,200 | | 2,158,115 |
| | | | |
|
Total Common Stocks (Cost $272,550,345) | | | | 308,809,130 |
| | | | |
|
Page 24 of 466
| | | | |
| | | Principal
Amount ($)
| | Value ($)
|
US Government Backed 0.2% | | | | |
US Treasury Bill: | | | | |
1.949%**, 1/20/2005 (f) | | 90,000 | | 89,922 |
1.813%**, 1/20/2005 (f) | | 615,000 | | 614,422 |
2.946%**, 1/20/2005 (f) | | 25,000 | | 24,975 |
| | | | |
|
Total US Government Backed (Cost $729,066) | | | | 729,319 |
| | | | |
|
| | | | |
| | | Shares
| | Value ($)
|
Securities Lending Collateral 2.4% | | | | |
| | | | |
|
Daily Assets Fund Institutional, 2.25% (c) (d) (Cost $7,703,810) | | 7,703,810 | | 7,703,810 |
| | | | |
|
| | |
Cash Equivalents 3.7% | | | | |
| | | | |
|
Scudder Cash Management QP Trust, 2.24% (b) (Cost $11,626,481) | | 11,626,481 | | 11,626,481 |
| | | | |
|
| | | | | | |
| | | % of Net Assets
| | | Value ($)
| |
Total Investment Portfolio (Cost $292,609,702) (a) | | 102.9 | | | 328,868,740 | |
| | | | | |
|
|
Other Assets and Liabilities, Net | | (2.9 | ) | | (9,176,138 | ) |
| | | | | |
|
|
Net Assets | | 100.0 | | | 319,692,602 | |
| | | | | |
|
|
Notes to Scudder Blue Chip Portfolio of Investments
| * | Non-income producing security. |
| ** | Annualized yield at time of purchase; not a coupon rate. |
| (a) | The cost for federal income tax purposes was $294,567,784. At December 31, 2004, net unrealized appreciation for all securities based on tax cost was $34,300,956. This consisted of aggregate gross unrealized appreciation for all securities in which there was an excess of value over tax cost of $36,329,188 and aggregate gross unrealized depreciation for all securities in which there was an excess of tax cost over value of $2,028,232. |
| (b) | Scudder Cash Management QP Trust is managed by Deutsche Investment Management Americas Inc. The rate shown is the annualized seven-day yield at period end. |
| (c) | Daily Assets Fund Institutional, an affiliated fund, is managed by Deutsche Asset Management, Inc. The rate shown is the annualized seven-day yield at period end. |
| (d) | Represents collateral held in connection with securities lending. |
| (e) | All or a portion of these securities were on loan (see Notes to Financial Statements). The value of all securities loaned at December 31, 2004 amounted to $7,509,709 which is 2.3% of total net assets. |
| (f) | At December 31, 2004, this security, in part or in whole, has been segregated to cover initial margin requirements for open futures contracts. |
| REIT: | Real Estate Investment Trust |
Page 25 of 466
At December 31, 2004, open futures contracts purchased were as follows:
| | | | | | | | | | |
Futures
| | Expiration Date
| | Contracts
| | Aggregate Face Value ($)
| | Value ($)
| | Unrealized
Appreciation ($)
|
S&P 500 | | 3/17/2005 | | 36 | | 10,694,997 | | 10,923,300 | | 228,303 |
The accompanying notes are an integral part of the financial statements.
Financial Statements
Statement of Assets and Liabilities as of December 31, 2004
| | | | |
Assets | | | | |
Investments: | | | | |
Investments in securities, at value (cost $273,279,411) — including $7,509,709 of securities loaned | | $ | 309,538,449 | |
Investment in Daily Assets Fund Institutional (cost $7,703,810)* | | | 7,703,810 | |
Investment in Scudder Cash Management QP Trust (cost $11,626,481) | | | 11,626,481 | |
| | |
|
|
|
Total investments in securities, at value (cost $292,609,702) | | | 328,868,740 | |
| | |
|
|
|
Receivable for investments sold | | | 42,265,548 | |
Dividends receivable | | | 290,468 | |
Interest receivable | | | 21,375 | |
Receivable for Portfolio shares sold | | | 154,705 | |
Other assets | | | 9,451 | |
| | |
|
|
|
Total assets | | | 371,610,287 | |
| | |
|
|
|
Liabilities | | | | |
Payable for Portfolio shares redeemed | | | 328,600 | |
Payable for investments purchased | | | 43,622,453 | |
Payable for daily variation margin on open futures contracts | | | 8,259 | |
Payable upon return of securities loaned | | | 7,703,810 | |
Accrued management fee | | | 173,127 | |
Other accrued expenses and payables | | | 81,436 | |
| | |
|
|
|
Total liabilities | | | 51,917,685 | |
| | |
|
|
|
Net assets, at value | | $ | 319,692,602 | |
| | |
|
|
|
Net Assets | | | | |
Net assets consist of: | | | | |
Undistributed net investment income | | | 2,788,284 | |
Net unrealized appreciation (depreciation) on: | | | 36,259,038 | |
Investments | | | | |
Futures | | | 228,303 | |
Accumulated net realized gain (loss) | | | (18,711,816 | ) |
Paid-in capital | | | 299,128,793 | |
| | |
|
|
|
Net assets, at value | | $ | 319,692,602 | |
| | |
|
|
|
Class A | | | | |
Net Asset Value, offering and redemption price per share ($282,957,768 ÷ 20,734,323 outstanding shares of beneficial interest, $.01 par value, unlimited number of shares authorized) | | $ | 13.65 | |
| | |
|
|
|
Class B | | | | |
Net Asset Value, offering and redemption price per share ($36,734,834 ÷ 2,700,912 outstanding shares of beneficial interest, $.01 par value, unlimited number of shares authorized) | | $ | 13.60 | |
| | |
|
|
|
| * | Represents collateral on securities loaned. |
Page 26 of 466
| | | | |
| Statement of Operations for the year ended December 31, 2004 | | | | |
| |
Investment Income | | | | |
Income: | | | | |
Dividends (net of foreign taxes withheld of $88) | | $ | 4,842,841 | |
Interest — Scudder Cash Management QP Trust | | | 126,342 | |
Interest | | | 7,305 | |
Securities lending income, including income from Daily Assets Fund Institutional | | | 7,304 | |
| | |
|
|
|
Total Income | | | 4,983,792 | |
| | |
|
|
|
Expenses: | �� | | | |
Management fee | | | 1,814,765 | |
Custodian fees | | | 18,656 | |
Distribution service fees (Class B) | | | 67,530 | |
Record keeping fees (Class B) | | | 34,564 | |
Auditing | | | 47,569 | |
Legal | | | 19,110 | |
Trustees’ fees and expenses | | | 7,091 | |
Reports to shareholders | | | 32,455 | |
Other | | | 16,886 | |
| | |
|
|
|
Total expenses, before expense reductions | | | 2,058,626 | |
| | |
|
|
|
Expense reductions | | | (2,934 | ) |
| | |
|
|
|
Total expenses, after expense reductions | | | 2,055,692 | |
| | |
|
|
|
Net investment income (loss) | | | 2,928,100 | |
| | |
|
|
|
Realized and Unrealized Gain (Loss) on Investment Transactions | | | | |
Net realized gain (loss) from: | | | | |
Investments | | | 37,952,397 | |
Futures | | | 766,622 | |
| | | | 38,719,019 | |
Net unrealized appreciation (depreciation) during the period on: | | | | |
Investments | | | 1,044,088 | |
Futures | | | 67,347 | |
| | | | 1,111,435 | |
| | |
|
|
|
Net gain (loss) on investment transactions | | | 39,830,454 | |
| | |
|
|
|
Net increase (decrease) in net assets resulting from operations | | $ | 42,758,554 | |
| | |
|
|
|
The accompanying notes are an integral part of the financial statements.
Page 27 of 466
Statement of Changes in Net Assets
| | | | | | | | |
| | | Years Ended December 31,
| |
Increase (Decrease) in Net Assets
| | 2004
| | | 2003
| |
Operations: | | | | | | | | |
Net investment income (loss) | | $ | 2,928,100 | | | $ | 1,750,488 | |
Net realized gain (loss) on investment transactions | | | 38,719,019 | | | | 15,303,859 | |
Net unrealized appreciation (depreciation) on investment transactions during the period | | | 1,111,435 | | | | 40,462,393 | |
Net increase (decrease) in net assets resulting from operations | | | 42,758,554 | | | | 57,516,740 | |
Distributions to shareholders from: | | | | | | | | |
Net investment income | | | | | | | | |
Class A | | | (1,626,701 | ) | | | (1,353,726 | ) |
Class B | | | (56,503 | ) | | | (7,619 | ) |
Portfolio share transactions: | | | | | | | | |
| | |
Class A | | | | | | | | |
Proceeds from shares sold | | | 28,844,570 | | | | 48,054,210 | |
Reinvestment of distributions | | | 1,626,701 | | | | 1,353,726 | |
Cost of shares redeemed | | | (26,173,350 | ) | | | (35,300,630 | ) |
Net increase (decrease) in net assets from Class A share transactions | | | 4,297,921 | | | | 14,107,306 | |
| | |
Class B | | | | | | | | |
Proceeds from shares sold | | | 16,893,828 | | | | 14,291,287 | |
Reinvestment of distributions | | | 56,503 | | | | 7,619 | |
Cost of shares redeemed | | | (1,310,947 | ) | | | (18,533 | ) |
Net increase (decrease) in net assets from Class B share transactions | | | 15,639,384 | | | | 14,280,373 | |
Increase (decrease) in net assets | | | 61,012,655 | | | | 84,543,074 | |
Net assets at beginning of period | | | 258,679,947 | | | | 174,136,873 | |
| | |
|
|
| |
|
|
|
Net assets at end of period (including undistributed net investment income of $2,788,284 and $1,620,422, respectively) | | $ | 319,692,602 | | | $ | 258,679,947 | |
| | |
|
|
| |
|
|
|
| | |
Other Information | | | | | | | | |
| | |
Class A | | | | | | | | |
Shares outstanding at beginning of period | | | 20,421,127 | | | | 18,535,421 | |
Shares sold | | | 2,286,747 | | | | 5,312,621 | |
Shares issued to shareholders in reinvestment of distributions | | | 132,360 | | | | 150,749 | |
Shares redeemed | | | (2,105,911 | ) | | | (3,577,664 | ) |
Net increase (decrease) in Portfolio shares | | | 313,196 | | | | 1,885,706 | |
| | |
|
|
| |
|
|
|
Shares outstanding at end of period | | | 20,734,323 | | | | 20,421,127 | |
| | |
|
|
| |
|
|
|
| | |
Class B | | | | | | | | |
Shares outstanding at beginning of period | | | 1,427,149 | | | | 40,975 | |
Shares sold | | | 1,373,668 | | | | 1,387,142 | |
Shares issued to shareholders in reinvestment of distributions | | | 4,597 | | | | 849 | |
Shares redeemed | | | (104,502 | ) | | | (1,817 | ) |
Net increase (decrease) in Portfolio shares | | | 1,273,763 | | | | 1,386,174 | |
| | |
|
|
| |
|
|
|
Shares outstanding at end of period | | | 2,700,912 | | | | 1,427,149 | |
| | |
|
|
| |
|
|
|
The accompanying notes are an integral part of the financial statements.
Page 28 of 466
Financial Highlights
Class A
| | | | | | | | | | | | | | | | | | | | |
Years Ended December 31,
| | 2004
| | | 2003
| | | 2002
| | | 2001
| | | 2000a
| |
Selected Per Share Data | | | | | | | | | | | | | | | | | | | | |
Net asset value, beginning of period | | $ | 11.84 | | | $ | 9.37 | | | $ | 12.07 | | | $ | 14.41 | | | $ | 15.69 | |
| | |
|
|
| |
|
|
| |
|
|
| |
|
|
| |
|
|
|
Income (loss) from investment operations: | | | | | | | | | | | | | | | | | | | | |
Net investment income (loss)b | | | .13 | | | | .08 | | | | .07 | | | | .05 | | | | .07 | |
Net realized and unrealized gain (loss) on investment transactions | | | 1.76 | | | | 2.45 | | | | (2.73 | ) | | | (2.33 | ) | | | (1.29 | ) |
| | |
|
|
| |
|
|
| |
|
|
| |
|
|
| |
|
|
|
Total from investment operations | | | 1.89 | | | | 2.53 | | | | (2.66 | ) | | | (2.28 | ) | | | (1.22 | ) |
| | |
|
|
| |
|
|
| |
|
|
| |
|
|
| |
|
|
|
Less distributions from: | | | | | | | | | | | | | | | | | | | | |
Net investment income | | | (.08 | ) | | | (.06 | ) | | | (.04 | ) | | | (.06 | ) | | | (.06 | ) |
| | |
|
|
| |
|
|
| |
|
|
| |
|
|
| |
|
|
|
Net asset value, end of period | | $ | 13.65 | | | $ | 11.84 | | | $ | 9.37 | | | $ | 12.07 | | | $ | 14.41 | |
| | |
|
|
| |
|
|
| |
|
|
| |
|
|
| |
|
|
|
Total Return (%) | | | 16.04 | | | | 27.25 | | | | (22.11 | ) | | | (15.81 | ) | | | (7.84 | ) |
| | |
|
|
| |
|
|
| |
|
|
| |
|
|
| |
|
|
|
Ratios to Average Net Assets and Supplemental Data | | | | | | | | | | | | | | | | | | | | |
Net assets, end of period ($ millions) | | | 283 | | | | 242 | | | | 174 | | | | 240 | | | | 228 | |
Ratio of expenses (%) | | | .70 | | | | .71 | | | | .69 | | | | .69 | | | | .71 | |
Ratio of net investment income (loss) (%) | | | 1.08 | | | | .82 | | | | .65 | | | | .42 | | | | .44 | |
Portfolio turnover rate (%) | | | 249 | | | | 182 | | | | 195 | | | | 118 | | | | 86 | |
| a | On June 18, 2001, the Portfolio implemented a 1 for 10 reverse stock split. Per share information, for the period prior to December 31, 2001, has been restated to reflect the effect of the split. Shareholders received 1 share for every 10 shares owned and net asset value per share increased correspondingly. |
| b | Based on average shares outstanding during the period. |
Page 29 of 466
Class B
| | | | | | | | | | | | |
Years Ended December 31,
| | 2004
| | | 2003
| | | 2002a
| |
Selected Per Share Data | | | | | | | | | | | | |
Net asset value, beginning of period | | $ | 11.80 | | | $ | 9.35 | | | $ | 10.28 | |
| | |
|
|
| |
|
|
| |
|
|
|
Income (loss) from investment operations: | | | | | | | | | | | | |
Net investment income (loss)b | | | .09 | | | | .04 | | | | .03 | |
Net realized and unrealized gain (loss) on investment transactions | | | 1.74 | | | | 2.45 | | | | (.96 | ) |
| | |
|
|
| |
|
|
| |
|
|
|
Total from investment operations | | | 1.83 | | | | 2.49 | | | | (.93 | ) |
| | |
|
|
| |
|
|
| |
|
|
|
Less distributions from: | | | | | | | | | | | | |
Net investment income | | | (.03 | ) | | | (.04 | ) | | | — | |
| | |
|
|
| |
|
|
| |
|
|
|
Net asset value, end of period | | $ | 13.60 | | | $ | 11.80 | | | $ | 9.35 | |
| | |
|
|
| |
|
|
| |
|
|
|
Total Return (%) | | | 15.55 | | | | 26.76 | | | | (9.05 | )** |
| | |
|
|
| |
|
|
| |
|
|
|
Ratios to Average Net Assets and Supplemental Data | | | | | | | | | | | | |
Net assets, end of period ($ millions) | | | 37 | | | | 17 | | | | .4 | |
Ratio of expenses (%) | | | 1.08 | | | | 1.10 | | | | .94 | * |
Ratio of net investment income (loss) (%) | | | .70 | | | | .43 | | | | .61 | * |
Portfolio turnover rate (%) | | | 249 | | | | 182 | | | | 195 | |
| a | For the period July 1, 2002 (commencement of operations of Class B shares) to December 31, 2002. |
| b | Based on average shares outstanding during the period. |
Information About Your Portfolio’s Expenses
Scudder Conservative Income Strategy Portfolio
As an investor of the Portfolio, you incur two types of costs: ongoing expenses and transaction costs. Ongoing expenses include management fees, distribution and service (12b-1) fees and other Portfolio expenses. Examples of transaction costs include sales charges (loads), redemption fees and account maintenance fees, which are not shown in this section. The following tables are intended to help you understand your ongoing expenses (in dollars) of investing in the Portfolio and to help you compare these expenses with the ongoing expenses of investing in other mutual funds. In the most recent period, the Portfolio limited these expenses; had it not done so, expenses would have been higher. The tables are based on an investment of $1,000 made at the beginning of the period (August 16, 2004) ended December 31, 2004.
The tables illustrate your Portfolio’s expenses in two ways:
Actual Portfolio Return. This helps you estimate the actual dollar amount of ongoing expenses (but not transaction costs) paid on a $1,000 investment in the Portfolio using the Portfolio’s actual return during the period. To estimate the expenses you paid over the period, simply divide your account value by $1,000 (for example, an $8,600 account value divided by $1,000 = 8.6), then multiply the result by the number in the “Expenses Paid per $1,000” line under the share class you hold.
Hypothetical 5% Portfolio Return. This helps you to compare your Portfolio’s ongoing expenses (but not transaction costs) with those of other mutual funds using the Portfolio’s actual expense ratio and a
Page 30 of 466
hypothetical rate of return of 5% per year before expenses. Examples using a 5% hypothetical Portfolio return may be found in the shareholder reports of other mutual funds. The hypothetical account values and expenses may not be used to estimate the actual ending account balance or expenses you paid for the period.
Please note that the expenses shown in these tables are meant to highlight your ongoing expenses only and do not reflect any transaction costs. The “Expenses Paid per $1,000” line of the tables is useful in comparing ongoing expenses only and will not help you determine the relative total expense of owning different funds. If these transaction costs had been included, your costs would have been higher.
Expenses and Value of a $1,000 Investment for the period ended December 31, 2004
| | | |
Actual Portfolio Return
| | Class B
|
Beginning Account Value 8/16/04 | | $ | 1,000.00 |
Ending Account Value 12/31/04 | | $ | 1,049.00 |
Expenses Paid per $1,000* | | $ | 2.88 |
| |
Hypothetical 5% Portfolio Return
| | Class B
|
Beginning Account Value 8/16/04 | | $ | 1,000.00 |
Ending Account Value 12/31/04 | | $ | 1,015.95 |
Expenses Paid per $1,000* | | $ | 2.84 |
| * | Expenses are equal to the Portfolio’s annualized expense ratio for the share class, multiplied by the average account value over the period, multiplied by the number of days since the commencement of the class (August 16, 2004), then divided by 365. |
| | | |
Annualized Expense Ratio
| | Class B
| |
Scudder Variable Series II — Scudder Conservative Income Strategy Portfolio | | .75 | % |
For more information, please refer to the Portfolio’s prospectus.
Management Summary December 31, 2004
Scudder Conservative Income Strategy Portfolio
Scudder Conservative Income Strategy Portfolio is one of four new fund-of-funds portfolios. Each portfolio is constructed as a strategically allocated mix of variable portfolios and managed to pursue consistent returns over time, while mitigating risk and pursuing a long-term investment objective. Scudder Conservative Income Strategy Portfolio seeks current income and, as a secondary objective, long-term growth of capital. The portfolio gained 4.90% (Class B shares, unadjusted for contract charges) from its date of inception, August 16, 2004, through December 31, 2004. Investors should keep in mind that during the start-up phase of the portfolio, it required some time to invest all the cash inflows. Because we had large cash flows, often exceeding the size of the portfolio, our allocation was heavily weighted in cash — even though we invested the cash right away every day.
Stocks performed exceptionally well in 2003, when profit margins widened because productivity accelerated but labor costs remained low (due to a soft labor market). However, equity performance was lower in 2004, due in part to rising interest rates, concerns about inflation and soaring energy prices, all of which can impact the revenue growth of companies. Performance did improve at the end of 2004 as signs of economic strength emerged and oil prices decreased. The end of uncertainty surrounding the US
Page 31 of 466
presidential election also helped the stock market find its footing. Specifically, the energy and materials sectors performed particularly well in 2004, while the technology, consumer staples and consumer discretionary sectors lagged behind. Going forward, profit margins are not likely to widen further, and may even narrow. As a result, we believe that returns will likely be modest. The portfolio underweighted equities relative to fixed income only in December and overweighted equities for all other months since inception.
The Federal Reserve Board (“the Fed”), in attempt to prevent the economy from overheating and inflation from rising, raised interest rates five times from 12/31/03 through 12/31/04. Because bond prices typically move in the opposite direction of interest rates, bond prices fell in response. Still, bond investors seemed to be betting that the economy faces too many hurdles for the Fed to raise interest rates drastically, so the price of bonds did not fall significantly. However, it seems likely that the Fed will continue to raise interest rates, so we believe that the bull market for bonds we have experienced over the past decades is likely over. Although, the portfolio is currently overweighting (or favoring) bonds relative to cash, these weightings may change.
Arnim Holzer Inna Okounkova Robert Wang
Co-Managers
Deutsche Investment Management Americas Inc.
All performance shown is historical, assumes reinvestment of all dividends and capital gains, and does not guarantee future results. Investment return and principal value fluctuate with changing market conditions so that, when redeemed, shares may be worth more or less then their original cost. Current performance may be lower or higher than the performance data quoted. Please visit scudder.com for the product’s most recent month-end performance. Performance doesn’t reflect charges and fees (“contract charges”) associated with the separate account that invests in the portfolio or any variable life insurance policy or variable annuity contract for which the portfolio is an investment option. These charges and fees will reduce returns.
Returns during part or all of the periods shown reflect a fee waiver and/or expense reimbursement. Without this waiver/reimbursement, returns would have been lower.
Risk Considerations
Diversification does not eliminate risk. The underlying portfolios invest in individual equity and bond funds whose yields and market values fluctuate, so that your investment may be worth more or less that its original cost. In addition, the underlying portfolios are subject to stock market risk, meaning stocks in the portfolio may decline in value for extended periods of time due to the activities and financial prospects of individual companies, or due to general market and economic conditions. Investing in foreign securities presents certain unique risks not associated with domestic investments, such as currency fluctuation, political and economic changes, and market risks. Derivatives may be more volatile and less liquid than traditional securities, and the portfolio could suffer losses on its derivative positions. Please read this portfolio’s prospectus for specific details regarding its risk profile.
Portfolio management market commentary is as of December 31, 2004, and may not come to pass. This information is subject to change at any time based on market and other conditions.
Scudder Conservative Income Strategy Portfolio
| | | |
Asset Allocation
| | 12/31/04
| |
Fixed Income | | 72 | % |
Equity | | 25 | % |
Cash Equivalents | | 3 | % |
| | |
|
|
| | | 100 | % |
| | |
|
|
Page 32 of 466
Asset allocation is subject to change.
For more complete details about the Portfolio’s investment portfolio, see page 29. A quarterly Fact Sheet is available upon request. Information concerning portfolio holdings of the Portfolio as of month end will be posted to scudder.com on the 15th of the following month.
Following the Portfolio’s fiscal first and third quarter-end, a complete portfolio holdings listing is filed with the SEC on Form N-Q. The form will be available on the SEC’s Web site at www.sec.gov, and it also may be reviewed and copied at the SEC’s Public Reference Room in Washington, D.C. Information on the operation of the SEC’s Public Reference Room may be obtained by calling (800) SEC-0330.
Investment Portfolio December 31, 2004
Scudder Conservative Income Strategy Portfolio
| | | | |
| | | Shares
| | Value ($)
|
Equity Funds 22.6% | | | | |
Scudder SVS I Global Discovery Portfolio “A” | | 273 | | 3,484 |
Scudder SVS I Growth & Income Portfolio “A” | | 7,921 | | 73,590 |
Scudder SVS I International Portfolio “A” | | 2,200 | | 20,900 |
Scudder SVS II Aggressive Growth Portfolio “A” | | 2,285 | | 22,489 |
Scudder SVS II Blue Chip Portfolio “A” | | 6,023 | | 82,218 |
Scudder SVS II Dreman High Return Equity Portfolio “A” | | 3,083 | | 39,001 |
Scudder SVS II Dreman Small Cap Value Portfolio “A” | | 816 | | 16,363 |
Scudder SVS II Eagle Focused Large Cap Growth Portfolio “A” | | 1,678 | | 14,750 |
Scudder SVS II Growth Portfolio “A” | | 2,005 | | 38,920 |
Scudder SVS II International Select Equity Portfolio “A” | | 1,243 | | 14,802 |
Scudder SVS II Large Cap Value Portfolio “A” | | 2,743 | | 43,307 |
Scudder SVS II MFS Strategic Value Portfolio “A” | | 1,806 | | 21,666 |
Scudder SVS II Small Cap Growth Portfolio “A” | | 1,436 | | 18,076 |
Scudder VIT Real Estate Portfolio “A” | | 638 | | 10,412 |
| | | | |
|
Total Equity Funds (Cost $399,842) | | | | 419,978 |
| | | | |
|
| | |
| | | Shares
| | Value ($)
|
Fixed Income Funds 65.5% | | | | |
Scudder SVS II Fixed Income Portfolio “A” | | 84,823 | | 1,023,809 |
Scudder SVS II Government and Agency Securities Portfolio “A” | | 10,062 | | 126,283 |
Scudder SVS II High Income Portfolio “A” | | 5,799 | | 50,913 |
Scudder SVS II Strategic Income Portfolio “A” | | 1,385 | | 16,964 |
| | | | |
|
Total Fixed Income Funds (Cost $1,210,701) | | | | 1,217,969 |
| | | | |
|
| | |
Cash Equivalents 2.7% | | | | |
| | | | |
|
Scudder Cash Management QP Trust, 2.24%(b) (Cost $50,936) | | 50,936 | | 50,936 |
| | | | |
|
Page 33 of 466
| | | | |
| | | % of Net Assets
| | Value ($)
|
Total Investment Portfolio (Cost $1,661,479) (a) | | 90.8 | | 1,688,883 |
Other Assets and Liabilities, Net | | 9.2 | | 171,801 |
| | | | |
|
Net Assets | | 100.0 | | 1,860,684 |
| | | | |
|
Notes to Scudder Conservative Income Strategy Portfolio of Investments
| (a) | The cost for federal income tax purposes was $1,661,479. At December 31, 2004, net unrealized appreciation for all securities based on tax cost was $27,404. This consisted of aggregate gross unrealized appreciation for all securities in which there was an excess of value over tax cost of $27,404 and aggregate gross unrealized depreciation for all securities in which there was an excess of tax cost over value of $0. |
| (b) | Scudder Cash Management QP Trust is managed by Deutsche Investment Management Americas Inc. The rate shown is the annualized seven-day yield at period end. |
The accompanying notes are an integral part of the financial statements.
Financial Statements
| | | |
| Statement of Assets and Liabilities as of December 31, 2004 | | | |
| |
Assets | | | |
Investments: | | | |
Investments in securities, at value (cost $1,610,543) | | $ | 1,637,947 |
Investment in Scudder Cash Management QP Trust (cost $50,936) | | | 50,936 |
Total investments in securities, at value (cost $1,661,479) | | | 1,688,883 |
Interest receivable | | | 85 |
Receivable for Portfolio shares sold | | | 161,910 |
Due from Advisor | | | 37,040 |
Other assets | | | 593 |
| | |
|
|
Total assets | | | 1,888,511 |
| | |
|
|
Liabilities | | | |
Payable for Portfolio shares redeemed | | | 416 |
Other accrued expenses and payables | | | 27,411 |
| | |
|
|
Total liabilities | | | 27,827 |
| | |
|
|
Net assets, at value | | $ | 1,860,684 |
| | |
|
|
Net Assets | | | |
Net assets consist of: | | | |
Net unrealized appreciation (depreciation) on investments | | | 27,404 |
Accumulated net realized gain (loss) | | | 4,048 |
Paid-in capital | | | 1,829,232 |
| | |
|
|
Net assets, at value | | $ | 1,860,684 |
| | |
|
|
Class B Shares | | | |
| | | | |
Net asset value, offering and redemption price per share ($1,860,684 ÷ 177,411 shares outstanding shares of beneficial interest, $.01 par value, unlimited number of shares authorized) | | $ | 10.49 |
| | |
|
|
Page 34 of 466
Statement of Operations
for the period ended December 31, 2004
| | | | |
| Investment Income | | | | |
Income: | | | | |
Interest — Scudder Cash Management QP Trust | | $ | 282 | |
| | |
|
|
|
Total Income | | | 282 | |
| | |
|
|
|
Expenses: | | | | |
Management fee | | | 363 | |
Custodian and accounting fees | | | 22,806 | |
Distribution service fees (Class B) | | | 604 | |
Record keeping fees (Class B) | | | 363 | |
Auditing | | | 24,001 | |
Legal | | | 493 | |
Trustees’ fees and expenses | | | 92 | |
Reports to shareholders | | | 2,046 | |
Offering costs | | | 1,011 | |
Other | | | 128 | |
| | |
|
|
|
Total expenses, before expense reductions | | | 51,907 | |
| | |
|
|
|
Expense reductions | | | (50,066 | ) |
| | |
|
|
|
Total expenses, after expense reductions | | | 1,841 | |
| | |
|
|
|
Net investment income (loss) | | | (1,559 | ) |
| | |
|
|
|
| Realized and Unrealized Gain (Loss) on Investment Transactions | | | | |
Net realized gain (loss) from investments | | | 4,596 | |
Net unrealized appreciation (depreciation) during the period on investments | | | 27,404 | |
| | |
|
|
|
Net gain (loss) on investment transactions | | | 32,000 | |
| | |
|
|
|
Net increase (decrease) in net assets resulting from operations | | $ | 30,441 | |
| | |
|
|
|
The accompanying notes are an integral part of the financial statements.
Page 35 of 466
Statement of Changes in Net Assets
| | | | |
Increase (Decrease) in Net Assets
| | Period Ended December 31, 2004a
| |
Operations: | | | | |
Net investment income (loss) | | $ | (1,559 | ) |
Net realized gain (loss) on investment transactions | | | 4,596 | |
Net unrealized appreciation (depreciation) on investment transactions during the period | | | 27,404 | |
Net increase (decrease) in net assets resulting from operations | | | 30,441 | |
Portfolio share transactions: | | | | |
| |
Class B | | | | |
Proceeds from shares sold | | | 1,899,687 | |
Cost of shares redeemed | | | (69,444 | ) |
Net increase (decrease) in net assets from Class B share transactions | | | 1,830,243 | |
Increase (decrease) in net assets | | | 1,860,684 | |
Net assets at beginning of period | | | — | |
| | |
|
|
|
Net assets at end of period | | $ | 1,860,684 | |
| | |
|
|
|
Other Information | | | | |
| |
Class B | | | | |
Shares outstanding at beginning of period | | | — | |
Shares sold | | | 184,103 | |
Shares redeemed | | | (6,692 | ) |
Net increase (decrease) in Portfolio shares | | | 177,411 | |
| | |
|
|
|
Shares outstanding at end of period | | | 177,411 | |
| | |
|
|
|
| a | For the period from August 16, 2004 (commencement of operations) to December 31, 2004. |
The accompanying notes are an integral part of the financial statements.
Financial Highlights
Class B
| | | | |
| | | 2004a
| |
Selected Per Share Data | | | | |
| | |
|
|
|
Net asset value, beginning of period | | $ | 10.00 | |
| | |
|
|
|
Income (loss) from investment operations: | | | | |
Net investment income (loss)b | | | (.02 | ) |
Net realized and unrealized gain (loss) on investment transactions | | | .51 | |
Total from investment operations | | | .49 | |
| | |
|
|
|
Net asset value, end of period | | $ | 10.49 | |
| | |
|
|
|
Total Return (%)c | | | 4.90 | ** |
| |
Ratios to Average Net Assets and Supplemental Data | | | | |
Net assets, end of period ($ millions) | | | 2 | |
Ratio of expenses before expense reductions (%) | | | 21.20 | * |
Ratio of expenses after expense reductions (%) | | | .75 | * |
Ratio of net investment income (loss) (%) | | | (.63 | )* |
Portfolio turnover rate (%) | | | 37 | * |
| a | For the period from August 16, 2004 (commencement of operations) to December 31, 2004. |
| b | Based on average shares outstanding during the period. |
| c | Total return would have been lower had certain expenses not been reduced. |
Page 36 of 466
Performance Summary December 31, 2004
Scudder Fixed Income Portfolio
All performance shown is historical, assumes reinvestment of all dividends and capital gains, and does not guarantee future results. Investment return and principal value fluctuate with changing market conditions so that, when redeemed, shares may be worth more or less then their original cost. Current performance may be lower or higher than the performance data quoted. Please visit scudder.com for the product’s most recent month-end performance. Performance doesn’t reflect charges and fees (“contract charges”) associated with the separate account that invests in the Portfolio or any variable life insurance policy or variable annuity contract for which the Portfolio is an investment option. These charges and fees will reduce returns.
Investments by the Portfolio in lower-rated bonds present greater risk to principal and income than investments in higher-quality securities. This Portfolio invests in individual bonds whose yields and market values fluctuate so that your investment may be worth more or less than its original cost. Additionally, investing in foreign securities presents certain unique risks not associated with domestic investments, such as currency fluctuation and changes in political/economic conditions and market risks. All of these factors may result in greater share price volatility. Please see this Portfolio’s prospectus for specific details regarding its investments and risk profile.
|
| Growth of an Assumed $10,000 Investment in Scudder Fixed Income Portfolio from 5/1/1996 to 12/31/2004 |
| | |
|
| ¨ Scudder Fixed Income Portfolio — Class A |
|
| ¨ Lehman Brothers Aggregate Bond Index |
| |
 | | The Lehman Brothers Aggregate Bond (LBAB) Index is an unmanaged market value-weighted measure of Treasury issues, agency issues, corporate bond issues and mortgage securities. Index returns assume reinvested dividends and, unlike Portfolio returns, do not reflect any fees or expenses. It is not possible to invest directly into an index. |
Yearly periods ended December 31
Comparative Results
| | | | | | | | | | | | | | | | | | |
Scudder Fixed Income Portfolio
| | | | 1-Year
| | | 3-Year
| | | 5-Year
| | | Life of Portfolio*
| |
Class A | | Growth of $10,000 | | $ | 10,453 | | | $ | 11,869 | | | $ | 13,790 | | | $ | 16,462 | |
| | | Average annual total return | | | 4.53 | % | | | 5.88 | % | | | 6.64 | % | | | 5.92 | % |
Lehman Brothers Aggregate Bond Index | | Growth of $10,000 | | $ | 10,434 | | | $ | 11,976 | | | $ | 14,497 | | | $ | 18,181 | |
| | | Average annual total return | | | 4.34 | % | | | 6.19 | % | | | 7.71 | % | | | 7.14 | % |
| | | | | |
Scudder Fixed Income Portfolio
| | | | | | | | | | 1-Year
| | | Life of Class**
| |
Class B | | Growth of $10,000 | | | | | | | | | | $ | 10,410 | | | $ | 11,482 | |
| | | Average annual total return | | | | | | | | | | | 4.10 | % | | | 5.68 | % |
Lehman Brothers Aggregate Bond Index | | Growth of $10,000 | | | | | | | | | | $ | 10,434 | | | $ | 11,539 | |
| | | Average annual total return | | | | | | | | | | | 4.34 | % | | | 5.89 | % |
The growth of $10,000 is cumulative.
| * | The Portfolio commenced operations on May 1, 1996. Index returns begins April 30, 1996. Total returns would have been lower for the 5-Year and Life of Portfolio periods for Class A shares if the Portfolio’s expenses were not maintained. |
| ** | The Portfolio commenced offering Class B shares on July 1, 2002. Index returns begin June 30, 2002. |
Page 37 of 466
Information About Your Portfolio’s Expenses
Scudder Fixed Income Portfolio
As an investor of the Portfolio, you incur two types of costs: ongoing expenses and transaction costs. Ongoing expenses include management fees, distribution and service (12b-1) fees and other Portfolio expenses. Examples of transaction costs include sales charges (loads), redemption fees and account maintenance fees, which are not shown in this section. The following tables are intended to help you understand your ongoing expenses (in dollars) of investing in the Portfolio and to help you compare these expenses with the ongoing expenses of investing in other mutual funds. The tables are based on an investment of $1,000 made at the beginning of the six-month period ended December 31, 2004.
The tables illustrate your Portfolio’s expenses in two ways:
Actual Portfolio Return. This helps you estimate the actual dollar amount of ongoing expenses (but not transaction costs) paid on a $1,000 investment in the Portfolio using the Portfolio’s actual return during the period. To estimate the expenses you paid over the period, simply divide your account value by $1,000 (for example, an $8,600 account value divided by $1,000 = 8.6), then multiply the result by the number in the “Expenses Paid per $1,000” line under the share class you hold.
Hypothetical 5% Portfolio Return. This helps you to compare your Portfolio’s ongoing expenses (but not transaction costs) with those of other mutual funds using the Portfolio’s actual expense ratio and a hypothetical rate of return of 5% per year before expenses. Examples using a 5% hypothetical Portfolio return may be found in the shareholder reports of other mutual funds. The hypothetical account values and expenses may not be used to estimate the actual ending account balance or expenses you paid for the period.
Please note that the expenses shown in these tables are meant to highlight your ongoing expenses only and do not reflect any transaction costs. The “Expenses Paid per $1,000” line of the tables is useful in comparing ongoing expenses only and will not help you determine the relative total expense of owning different funds. If these transaction costs had been included, your costs would have been higher.
Expenses and Value of a $1,000 Investment for the six months ended December 31, 2004
| | | | | | |
Actual Portfolio Return
| | Class A
| | Class B
|
Beginning Account Value 7/1/04 | | $ | 1,000.00 | | $ | 1,000.00 |
Ending Account Value 12/31/04 | | $ | 1,041.40 | | $ | 1,038.80 |
Expenses Paid per $1,000* | | $ | 3.37 | | $ | 5.26 |
| | |
Hypothetical 5% Portfolio Return
| | Class A
| | Class B
|
Beginning Account Value 7/1/04 | | $ | 1,000.00 | | $ | 1,000.00 |
Ending Account Value 12/31/04 | | $ | 1,021.90 | | $ | 1,020.05 |
Expenses Paid per $1,000* | | $ | 3.34 | | $ | 5.21 |
| * | Expenses are equal to the Portfolio’s annualized expense ratio for each share class, multiplied by the average account value over the period, multiplied by the number of days in the most recent six-month period, then divided by 365. |
Page 38 of 466
| | | | | | |
Annualized Expense Ratios
| | Class A
| | | Class B
| |
Scudder Variable Series II — Scudder Fixed Income Portfolio | | .66 | % | | 1.02 | % |
For more information, please refer to the Portfolio’s prospectus.
Management Summary December 31, 2004
Scudder Fixed Income Portfolio
Although delayed on mixed economic data, the Federal Open Market Committee finally embarked on a “measured” pace of monetary policy tightening at mid-year that included five separate 25 basis points (“bps” — a basis point is one hundredth of a percentage point) increases. The federal funds rate finished the year 125 bps higher at 2.25%. The yield curve flattened in response to the Fed policy coupled with moderate employment growth and the perception that inflation will not accelerate too quickly. The two-year Treasury yield rose 125 bps, in line with the Fed, while the 10-year Treasury yield circuitously finished the year at 4.22% — down only 3 bps from where it started. Against this backdrop, the portfolio returned 4.53% (Class A shares, unadjusted for contract charges) for the 12-month period ended December 31, 2004, outpacing the 4.34% return of its benchmark, the Lehman Brothers Aggregate Bond Index. Please see the following page for standardized performance as of December 31, 2004.
All non-Treasury sectors significantly outperformed similar duration Treasury issues during the year. Credit, the best-performing sector, benefited from excellent fundamentals, continued demand for yield and low volatility. Our security selection within Credit was a positive contributor to performance. Our mortgage holdings emphasized securities that are less prepayment-sensitive than the pass-through issues that comprise the index. On balance, our activities in the mortgage sector contributed to performance, despite declining volatility. The remaining high-quality sectors (asset-backed securities, collateralized mortgage-backed securities) generated solid excess returns as valuations improved.
Gary W. Bartlett Timothy C. Vile
Warren S. Davis J. Christopher Gagnier
Thomas J. Flaherty Daniel R. Taylor William T. Lissenden
Co-Lead Managers Portfolio Manager
Deutsche Investment Management Americas Inc.
All performance shown is historical, assumes reinvestment of all dividends and capital gains, and does not guarantee future results. Investment return and principal value fluctuate with changing market conditions so that, when redeemed, shares may be worth more or less then their original cost. Current performance may be lower or higher than the performance data quoted. Please visit scudder.com for the product’s most recent month-end performance. Performance doesn’t reflect charges and fees (“contract charges”) associated with the separate account that invests in the portfolio or any variable life insurance policy or variable annuity contract for which the portfolio is an investment option. These charges and fees will reduce returns.
Risk Considerations
Investments by the portfolio in lower-rated bonds present greater risk to principal and income than investments in higher-quality securities. This portfolio invests in individual bonds whose yields and market values fluctuate so that your investment may be worth more or less than its original cost. Additionally, investing in foreign securities presents certain unique risks not associated with domestic investments, such as currency fluctuation and changes in political/economic conditions and market risks. All of these factors may result in greater share price volatility. Please see this portfolio’s prospectus for specific details regarding its investments and risk profile.
A Treasury’s guarantee relates only to the prompt payment of principal and interest and does not remove market risks if the investment is sold prior to maturity.
Page 39 of 466
The Lehman Brothers Aggregate Bond Index is an unmanaged, market-value-weighted measure of Treasury issues, agency issues, corporate bond issues and mortgage securities. Index returns assume reinvested dividends and, unlike portfolio returns, do not reflect any fees or expenses. It is not possible to invest directly into an index.
Portfolio management market commentary is as of December 31, 2004, and may not come to pass. This information is subject to change at any time based on market and other conditions.
Portfolio Summary
Scudder Fixed Income Portfolio
| | | | | | |
Asset Allocation (Excludes Securities Lending Collateral)
| | 12/31/04
| | | 12/31/03
| |
Collateralized Mortgage Obligations | | 24 | % | | 19 | % |
US Government Backed | | 17 | % | | 10 | % |
Corporate Bonds | | 16 | % | | 25 | % |
Commercial and Non-Agency Mortgage Backed Securities | | 11 | % | | — | |
Asset Backed | | 8 | % | | 12 | % |
Foreign Bonds — US$ Denominated | | 8 | % | | 5 | % |
US Government Agency Sponsored Pass-Throughs | | 7 | % | | 18 | % |
Municipal Investments | | 5 | % | | 5 | % |
Cash Equivalents, net | | 4 | % | | 6 | % |
| | |
|
| |
|
|
| | | 100 | % | | 100 | % |
| | |
|
| |
|
|
| | | | | | |
Corporate and Foreign Bonds Diversification (Excludes Cash Equivalents and Securities Lending Collateral)
| | 12/31/04
| | | 12/31/03
| |
Financials | | 45 | % | | 29 | % |
Utilities | | 18 | % | | 12 | % |
Energy | | 11 | % | | 15 | % |
Telecommunication Services | | 8 | % | | 4 | % |
Health Care | | 7 | % | | 4 | % |
Consumer Discretionary | | 6 | % | | 12 | % |
Materials | | 4 | % | | 8 | % |
Industrials | | 1 | % | | 15 | % |
Consumer Staples | | — | | | 1 | % |
| | |
|
| |
|
|
| | | 100 | % | | 100 | % |
| | |
|
| |
|
|
| | | | | | |
Quality (Excludes Securities Lending Collateral)
| | 12/31/04
| | | 12/31/03
| |
US Government and Agencies | | 49 | % | | 46 | % |
AAA* | | 26 | % | | 26 | % |
AA | | 3 | % | | 2 | % |
A | | 11 | % | | 9 | % |
BBB | | 11 | % | | 11 | % |
BB | | — | | | 4 | % |
B | | — | | | 2 | % |
| | |
|
| |
|
|
| | | 100 | % | | 100 | % |
| | |
|
| |
|
|
| * | Includes cash equivalents |
Page 40 of 466
| | | | | | |
Effective Maturity (Excludes Cash Equivalents and Securities Lending Collateral)
| | 12/31/04
| | | 12/31/03
| |
Under 1 year | | 9 | % | | 6 | % |
1 < 5 years | | 46 | % | | 51 | % |
5 < 10 years | | 25 | % | | 24 | % |
10 < 15 years | | 10 | % | | 8 | % |
15 years or greater | | 10 | % | | 11 | % |
| | |
|
| |
|
|
| | | 100 | % | | 100 | % |
| | |
|
| |
|
|
Weighted average effective maturity: 6.7 years and 6.8 years, respectively.
Asset allocation, diversification, quality and effective maturity are subject to change.
The quality ratings represent the lower of Moody’s Investors Service, Inc. (“Moody’s”) or Standard & Poor’s Corporation (“S&P”) credit ratings. The ratings of Moody’s and S&P represent their opinions as to the quality of the securities they rate. Ratings are relative and subjective and are not absolute standards of quality. The Fund’s credit quality does not remove market risk.
For more complete details about the Portfolio’s investment portfolio, see page 38. A quarterly Fact Sheet is available upon request. Information concerning portfolio holdings of the Portfolio as of month end will be posted to scudder.com on the 15th of the following month.
Following the Portfolio’s fiscal first and third quarter-end, a complete portfolio holdings listing is filed with the SEC on Form N-Q. The form will be available on the SEC’s Web site at www.sec.gov, and it also may be reviewed and copied at the SEC’s Public Reference Room in Washington, D.C. Information on the operation of the SEC’s Public Reference Room may be obtained by calling (800) SEC-0330.
| | |
| Investment Portfolio December 31, 2004 | | |
Scudder Fixed Income Portfolio
| | | | |
| | | Principal Amount ($)
| | Value ($)
|
Corporate Bonds 16.5% | | | | |
Consumer Discretionary 0.9% | | | | |
Auburn Hills Trust, 12.375%, 5/1/2020 | | 161,000 | | 252,523 |
Comcast Cable Communications Holdings, Inc., 8.375%, 3/15/2013 | | 690,000 | | 850,836 |
Comcast MO of Delaware, Inc., 9.0%, 9/1/2008 | | 490,000 | | 572,383 |
DaimlerChrysler NA Holdings Corp., 4.75%, 1/15/2008 | | 540,000 | | 551,530 |
General Motors Corp., 8.375%, 7/15/2033 | | 205,000 | | 212,397 |
Tele-Communications, Inc., “A”, 9.875%, 6/15/2022 | | 250,000 | | 354,895 |
| | | | |
|
| | | | | 2,794,564 |
| | | | |
|
Page 41 of 466
| | | | |
Energy 1.9% | | | | |
CenterPoint Energy Resources Corp., Series B, 7.875%, 4/1/2013 | | 735,000 | | 873,614 |
Enterprise Products Operating LP, 7.5%, 2/1/2011 | | 580,000 | | 657,601 |
Halliburton Co., 5.5%, 10/15/2010 | | 1,770,000 | | 1,864,302 |
Pemex Project Funding Master Trust, 144A, 3.79%*, 6/15/2010 | | 930,000 | | 954,180 |
Tri-State Generation & Transmission Association, 144A, 6.04%, 1/31/2018 | | 1,190,000 | | 1,257,211 |
| | | | |
|
| | | | | 5,606,908 |
| | | | |
|
Financials 7.5% | | | | |
American General Finance Corp., Series H, 4.0%, 3/15/2011 | | 1,417,000 | | 1,374,214 |
Capital One Bank, 4.875%, 5/15/2008 | | 75,000 | | 77,026 |
DBS Capital Funding Corp., 144A, 7.657%*, 3/31/2049 | | 1,330,000 | | 1,537,953 |
Duke Capital LLC, 4.302%, 5/18/2006 | | 1,204,000 | | 1,218,532 |
Ford Motor Credit Co.: | | | | |
5.8%, 1/12/2009 | | 1,070,000 | | 1,093,692 |
6.875%, 2/1/2006 | | 3,468,000 | | 3,572,734 |
General Electric Capital Corp., 2.8%, 1/15/2007 | | 1,902,000 | | 1,876,764 |
General Motors Acceptance Corp.: | | | | |
6.75%, 1/15/2006 | | 1,702,000 | | 1,746,048 |
6.875%, 9/15/2011 | | 1,075,000 | | 1,101,652 |
Goldman Sachs Group, Inc., 4.75%, 7/15/2013 | | 945,000 | | 935,111 |
HSBC Bank USA, 5.875%, 11/1/2034 (e) | | 880,000 | | 891,086 |
Merrill Lynch & Co., Inc., Series C, 5.0%, 1/15/2015 | | 1,360,000 | | 1,354,670 |
Morgan Stanley, 4.0%, 1/15/2010 (e) | | 945,000 | | 934,265 |
PLC Trust, Series 2003-1, 144A, 2.709%, 3/31/2006 | | 1,426,665 | | 1,420,644 |
RAM Holdings Ltd., 144A, 6.875%, 4/1/2024 | | 1,500,000 | | 1,473,135 |
Wells Fargo & Co., 4.2%, 1/15/2010 | | 1,775,000 | | 1,782,214 |
| | | | |
|
| | | | | 22,389,740 |
| | | | |
|
| | |
| | | Principal Amount ($)
| | Value ($)
|
Health Care 1.2% | | | | |
Health Care Service Corp., 144A, 7.75%, 6/15/2011 | | 2,330,000 | | 2,726,105 |
Highmark, Inc., 144A, 6.8%, 8/15/2013 | | 675,000 | | 736,246 |
| | | | |
|
| | | | | 3,462,351 |
| | | | |
|
Industrials 0.1% | | | | |
BAE System 2001 Asset Trust, “B”, Series 2001, 144A, 7.156%, 12/15/2011 | | 282,980 | | 307,156 |
| | | | |
|
| | |
Materials 0.7% | | | | |
Lubrizol Corp., 6.5%, 10/1/2034 | | 1,267,000 | | 1,290,385 |
Weyerhaeuser Co.: | | | | |
6.875%, 12/15/2033 | | 235,000 | | 263,082 |
7.125%, 7/15/2023 | | 95,000 | | 107,595 |
7.375%, 3/15/2032 | | 255,000 | | 302,391 |
| | | | |
|
| | | | | 1,963,453 |
| | | | |
|
Telecommunication Services 1.3% | | | | |
Bell Atlantic New Jersey, Inc., Series A, 5.875%, 1/17/2012 | | 810,000 | | 860,598 |
BellSouth Corp., 5.2%, 9/15/2014 | | 970,000 | | 988,645 |
SBC Communications, Inc., 4.125%, 9/15/2009 | | 2,085,000 | | 2,081,195 |
| | | | |
|
| | | | | 3,930,438 |
| | | | |
|
Page 42 of 466
| | | | |
Utilities 2.9% | | | | |
Centerior Energy Corp., Series B, 7.13%, 7/1/2007 | | 1,490,000 | | 1,608,974 |
Consumers Energy Co.: | | | | |
Series F, 4.0%, 5/15/2010 | | 1,655,000 | | 1,625,554 |
144A, 5.0%, 2/15/2012 | | 1,160,000 | | 1,180,843 |
Pedernales Electric Cooperative, Series 02-A, 144A, 6.202%, 11/15/2032 | | 1,715,000 | | 1,845,134 |
Progress Energy, Inc., 6.75%, 3/1/2006 | | 1,000,000 | | 1,037,656 |
Xcel Energy, Inc., 7.0%, 12/1/2010 | | 1,240,000 | | 1,397,765 |
| | | | |
|
| | | | | 8,695,926 |
| | | | |
|
Total Corporate Bonds (Cost $48,540,622) | | | | 49,150,536 |
| | | | |
|
Foreign Bonds — US$ Denominated 8.4% | | | | |
| | |
Energy 0.3% | | | | |
| | | | | |
Petroleos Mexicanos, Series P, 9.5%, 9/15/2027 | | 565,000 | | 711,900 |
| | | | |
|
| | |
Financials 4.5% | | | | |
Deutsche Telekom International Finance BV: | | | | |
8.5%, 6/15/2010 | | 255,000 | | 303,800 |
8.75%, 6/15/2030 | | 1,955,000 | | 2,581,495 |
Endurance Specialty Holdings Ltd., 7.0%, 7/15/2034 | | 225,000 | | 231,682 |
HSBC Capital Funding LP, 144A, 4.61%*, 12/29/2049 | | 340,000 | | 328,190 |
Korea First Bank, 144A, 5.75%*, 3/10/2013 | | 520,000 | | 540,791 |
Mantis Reef Ltd., 144A, 4.692%, 11/14/2008 | | 2,720,000 | | 2,727,940 |
Mizuho Financial Group, 8.375%, 12/29/2049 | | 2,230,000 | | 2,443,857 |
| | |
| | | Principal Amount ($)
| | Value ($)
|
QBE Insurance Group Ltd., 144A, 5.647%*, 7/1/2023 | | 1,085,000 | | 1,065,660 |
Westfield Capital Corp.: | | | | |
144A, 4.375%, 11/15/2010 | | 235,000 | | 232,430 |
144A, 5.125%, 11/15/2014 | | 2,950,000 | | 2,935,825 |
| | | | |
|
| | | | | 13,391,670 |
| | | | |
|
Industrials 1.6% | | | | |
Tyco International Group SA: | | | | |
6.75%, 2/15/2011 | | 1,900,000 | | 2,129,497 |
6.875%, 1/15/2029 | | 1,831,000 | | 2,097,431 |
7.0%, 6/15/2028 | | 539,000 | | 626,661 |
| | | | |
|
| | | | | 4,853,589 |
| | | | |
|
Materials 0.9% | | | | |
Sappi Papier Holding AG, 144A, 7.5%, 6/15/2032 | | 620,000 | | 721,608 |
Sociedad Concesionaria Autopista Central, 144A, 6.223%, 12/15/2026 | | 1,915,000 | | 2,009,525 |
| | | | |
|
| | | | | 2,731,133 |
| | | | |
|
Sovereign Bonds 0.2% | | | | |
United Mexican States: | | | | |
Series A, 6.75%, 9/27/2034 (e) | | 475,000 | | 469,062 |
8.375%, 1/14/2011 | | 145,000 | | 170,303 |
| | | | |
|
| | | | | 639,365 |
| | | | |
|
Page 43 of 466
| | | | |
Telecommunication Services 0.9% | | | | |
America Movil SA de CV, 144A, 5.75%, 1/15/2015 | | 1,065,000 | | 1,062,571 |
Telecom Italia Capital, 144A, 4.95%, 9/30/2014 | | 910,000 | | 891,562 |
Telecomunicaciones de Puerto Rico, 6.8%, 5/15/2009 | | 625,000 | | 665,349 |
| | | | |
|
| | | | | 2,619,482 |
| | | | |
|
Total Foreign Bonds — US$ Denominated (Cost $24,071,893) | | | | 24,947,139 |
| | | | |
|
Asset Backed 7.7% | | | | |
Automobile Receivables 2.4% | | | | |
Daimler Chrysler Auto Trust, “A4”, Series 2002-A, 4.49%, 10/6/2008 | | 1,083,000 | | 1,089,682 |
Drive Auto Receivables Trust, “A3”, Series 2004-1, 144A, 3.5%, 8/15/2008 | | 1,490,000 | | 1,493,492 |
MMCA Automobile Trust: | | | | |
“A4”, Series 2002-4, 3.05%, 11/16/2009 | | 1,150,000 | | 1,146,610 |
“A4”, Series 2002-2, 4.3%, 3/15/2010 | | 2,348,246 | | 2,356,770 |
“B”, Series 2002-2, 4.67%, 3/15/2010 | | 486,668 | | 483,227 |
“B”, Series 2002-1, 5.37%, 1/15/2010 | | 438,264 | | 442,790 |
| | | | |
|
| | | | | 7,012,571 |
| | | | |
|
| | |
| | | Principal
Amount ($)
| | Value ($)
|
Home Equity Loans 5.0% | | | | |
Chase Funding Mortgage Loan, “2A2”, Series 2004-1*, 2.411%, 12/25/2033 | | 2,110,000 | | 2,110,038 |
Countrywide Asset-Backed Certificates, “N1”, Series 2004-2N, 144A, 5.0%, 2/25/2035 | | 782,440 | | 778,575 |
Countrywide Home Equity Loan Trust: | | | | |
Series 2004-C, 2.62%*, 1/15/2034 | | 1,100,545 | | 1,098,204 |
“A2”, Series 2004-0, 2.68%*, 2/15/2034 | | 3,948,727 | | 3,948,040 |
Long Beach Mortgage Loan Trust, “N1”, Series 2003-4, 144A, 6.535%, 8/25/2033 | | 109,472 | | 109,573 |
Master Alternative Loan Trust, “5A1”, Series 2005-1, 5.5%, 1/1/2019 | | 790,000 | | 812,589 |
Merrill Lynch Mortgage Investors, Inc., “A2B”, Series 2004-HE2, 2.561%*, 8/25/2035 | | 1,778,000 | | 1,779,247 |
Novastar NIM Trust, Series 2004-N1, 144A, 4.458%, 2/26/2034 | | 516,052 | | 516,830 |
Park Place Securities NIM Trust, “A”, Series 2004-MHQ1, 144A, 2.487%, 12/25/2034 | | 1,319,477 | | 1,319,477 |
Renaissance NIM Trust, “A”, Series 2004-A, 144A, 4.45%, 6/25/2034 | | 693,718 | | 693,068 |
Residential Asset Securities Corp., “AI6”, Series 2000-KS1, 7.905%, 2/25/2031 | | 1,648,091 | | 1,716,965 |
| | | | |
|
| | | | | 14,882,606 |
| | | | |
|
Industrials 0.3% | | | | |
Delta Air Lines, Inc., “G-2”, Series 2002-1, 6.417%, 7/2/2012 (e) | | 990,000 | | 1,033,484 |
| | | | |
|
Total Asset Backed (Cost $22,991,451) | | | | 22,928,661 |
| | | | |
|
Preferred Stocks 0.2% | | | | |
| | | | | |
Farm Credit Bank of Texas, Series 1, 7.561%, 11/29/2049 (Cost $725,000) | | 725,000 | | 745,844 |
| | | | |
|
US Government Agency Sponsored Pass-Throughs 6.6% | | | | |
Federal Home Loan Mortgage Corp.: | | | | |
4.0%, 5/1/2019 | | 2,549,105 | | 2,493,952 |
6.0%, 12/1/2034 | | 1,790,000 | | 1,849,998 |
Page 44 of 466
| | | | |
Federal National Mortgage Association: | | | | |
4.5%, 12/1/2018 | | 384,971 | | 384,612 |
5.0%, 3/1/2034 | | 5,039,201 | | 5,009,640 |
5.5% with various maturities from 3/1/2033 until 7/1/2033 (d) | | 3,264,991 | | 3,315,085 |
6.0% with various maturities from 7/1/2017 until 11/1/2017 | | 1,177,258 | | 1,235,198 |
6.31%, 6/1/2008 | | 1,500,000 | | 1,595,373 |
6.5% with various maturities from 3/1/2017 until 9/1/2034 | | 2,421,989 | | 2,544,647 |
7.13%, 1/1/2012 | | 1,125,276 | | 1,187,951 |
| | |
| | | Principal
Amount ($)
| | Value ($)
|
8.0%, 9/1/2015 | | 67,007 | | 71,268 |
| | | | |
|
Total US Government Agency Sponsored Pass-Throughs (Cost $19,547,908) | | | | 19,687,724 |
| | | | |
|
Commercial and Non-Agency Mortgage-Backed Securities 11.1% | | | | |
Banc of America Commercial Mortgage, Inc., “A5”, Series 2004-3, 5.31%, 6/10/2039 | | 2,830,000 | | 2,963,563 |
Chase Commercial Mortgage Securities Corp., “A1”, Series 2000-1, 7.656%, 4/15/2032 | | 718,729 | | 740,063 |
Citicorp Mortgage Securities, Inc., “A4”, Series 2003-3, 5.5%, 3/25/2033 | | 1,300,000 | | 1,324,218 |
Citigroup Mortgage Loan Trust, Inc.: | | | | |
“1A2”, Series 2004-NCM-1, 6.5%, 6/25/2034 | | 1,583,415 | | 1,656,154 |
“1CB2”, Series 2004-NCM2, 6.75%, 8/25/2034 | | 2,068,793 | | 2,156,065 |
Countrywide Alternative Loan Trust: | | | | |
“1A1”, Series 2004-J1, 6.0%, 2/25/2034 | | 532,660 | | 540,023 |
“7A1”, Series 2004-J2, 6.0%, 12/25/2033 | | 625,564 | | 640,421 |
First Union-Lehman Brothers Commercial Mortgage, “A3”, Series 1997-C1, 7.38%, 4/18/2029 | | 1,745,245 | | 1,857,034 |
GMAC Commercial Mortgage Securities, Inc., “A3”, Series 1997-C1, 6.869%, 7/15/2029 | | 1,390,121 | | 1,470,670 |
GS Mortgage Securities Corp. II, “C”, Series 1998-C1, 6.91%, 10/18/2030 | | 1,260,000 | | 1,378,987 |
Master Adjustable Rate Mortgages Trust, “9A2”, Series 2004-5, 4.88%*, 6/25/2032 | | 1,865,000 | | 1,870,401 |
Master Alternative Loan Trust: | | | | |
“3A1”, Series 2004-5, 6.5%, 6/25/2034 | | 79,792 | | 83,059 |
“5A1”, Series 2004-3, 6.5%, 3/25/2034 | | 834,601 | | 866,681 |
“8A1”, Series 2004-3, 7.0%, 4/25/2034 | | 627,143 | | 655,167 |
Master Asset Securitization Trust, “8A1”, Series 2003-6, 5.5%, 7/25/2033 | | 1,053,991 | | 1,062,555 |
Merrill Lynch Mortgage Investors, Inc., “D”, Series 1996-C1, 7.42%, 4/25/2028 | | 2,130,000 | | 2,202,933 |
Park Place Securities NIM Trust, “B”, Series 2004-MHQ1, 144A, 3.474%, 12/25/2034 | | 2,090,000 | | 2,090,000 |
Residential Asset Securitization Trust, “A1”, Series 2003-A11, 4.25%, 11/25/2033 | | 2,164,835 | | 2,169,463 |
TIAA Real Estate CDO Ltd., “A2”, Series 2001-C1A, 144A, 6.3%, 6/19/2021 | | 1,931,107 | | 2,049,584 |
Wachovia Bank Commercial Mortgage Trust, “A5”, Series 2004-C11, 5.215%, 1/15/2041 | | 853,000 | | 878,211 |
Washington Mutual: | | | | |
“2A1”, Series 2002-S8, 4.5%, 1/25/2018 | | 847,038 | | 850,127 |
“4A”, Series 2004-CB2, 6.5%, 8/25/2034 | | 272,891 | | 285,427 |
| | |
| | | Principal
Amount ($)
| | Value ($)
|
Washington Mutual Mortgage Securities Corp., “A7, Series 2004-AR9, 4.26%*, 8/25/2034 | | 1,393,000 | | 1,394,097 |
Wells Fargo Mortgage Backed Securities Trust: | | | | |
“1A6”, Series 2003-1, 4.5%, 2/25/2018 | | 697,914 | | 701,083 |
“1A1”, Series 2003-6, 5.0%, 6/25/2018 | | 1,313,436 | | 1,324,929 |
| | | | |
|
Total Commercial and Non-Agency Mortgage-Backed Securities (Cost $33,461,281) | | | | 33,210,915 |
| | | | |
|
Page 45 of 466
| | | | |
Collateralized Mortgage Obligations 24.0% | | | | |
Fannie Mae Grantor Trust: | | | | |
“1A3”, Series 2004-T2, 7.0%, 11/25/2043 | | 599,913 | | 635,719 |
“1A3”, Series 2004-T3, 7.0%, 2/25/2044 | | 300,217 | | 318,135 |
Fannie Mae Whole Loan: | | | | |
“2A”, Series 2002-W1, 7.5%, 2/25/2042 | | 1,042,175 | | 1,113,367 |
“5A”, Series 2004-W2, 7.5%, 3/25/2044 | | 1,735,182 | | 1,857,381 |
Federal Home Loan Mortgage Corp.: | | | | |
“AU”, Series 2759, 3.5%, 5/15/2019 | | 1,313,000 | | 1,309,386 |
“EK”, Series 2773, 3.5%, 5/15/2010 | | 1,274,000 | | 1,275,987 |
“QC”, Series 2694, 3.5%, 9/15/2020 | | 2,290,000 | | 2,275,892 |
“LB”, Series 2755, 4.0%, 9/15/2023 | | 1,970,000 | | 1,973,498 |
“NB”, Series 2750, 4.0%, 12/15/2022 | | 2,839,000 | | 2,835,240 |
“XG”, Series 2737, 4.0%, 11/15/2022 | | 1,050,000 | | 1,049,033 |
“LC”, Series 2682, 4.5%, 7/15/2032 | | 1,690,000 | | 1,632,944 |
“ME”, Series 2691, 4.5%, 4/15/2032 | | 1,911,000 | | 1,828,648 |
“ON”, Series 2776, 4.5%, 11/15/2032 | | 1,410,000 | | 1,342,274 |
“QH”, Series 2694, 4.5%, 3/15/2032 | | 2,500,000 | | 2,408,238 |
“1A2B”, Series T-48, 4.688%, 7/25/2022 | | 149,297 | | 149,305 |
“HG”, Series 2543, 4.75%, 9/15/2028 | | 1,628,207 | | 1,642,144 |
“BG”, Series 2640, 5.0%, 2/15/2032 | | 2,060,000 | | 2,067,793 |
“EG”, Series 2836, 5.0%, 12/15/2032 | | 2,770,000 | | 2,746,601 |
“NE”, Series 2802, 5.0%, 2/15/2033 | | 2,640,000 | | 2,627,135 |
“OE”, Series 2840, 5.0%, 2/15/2033 | | 2,780,000 | | 2,735,517 |
“OL”, Series 2840, 5.0%, 11/15/2022 | | 2,335,000 | | 2,397,704 |
“PD”, Series 2783, 5.0%, 1/15/2033 | | 1,283,000 | | 1,272,328 |
“PD”, Series 2844, 5.0%, 12/15/2032 | | 2,765,000 | | 2,736,505 |
“PE”, Series 2721, 5.0%, 1/15/2023 | | 135,000 | | 133,546 |
| | |
| | | Principal
Amount ($)
| | Value ($)
|
“PQ”, Series 2844, 5.0%, 5/15/2023 | | 1,616,000 | | 1,664,835 |
“QK”, Series 2513, 5.0%, 8/15/2028 | | 301,006 | | 301,310 |
“TE”, Class 2764, 5.0%, 10/15/2032 | | 1,495,000 | | 1,480,800 |
“TE”, Series 2780, 5.0%, 1/15/2033 | | 1,785,000 | | 1,774,776 |
“CH”, Series 2390, 5.5%, 12/15/2016 | | 440,000 | | 456,296 |
“PE”, Series 2378, 5.5%, 11/15/2016 | | 1,765,000 | | 1,837,349 |
“PE”, Series 2512, 5.5%, 2/15/2022 | | 45,000 | | 46,727 |
“TG”, Series 2517, 5.5%, 4/15/2028 | | 748,181 | | 750,826 |
“BD”, Series 2453, 6.0%, 5/15/2017 | | 1,050,000 | | 1,095,590 |
“Z”, Series 2173, 6.5%, 7/15/2029 | | 333,859 | | 350,464 |
“3A”, Series T-41, 7.5%, 7/25/2032 | | 1,403,657 | | 1,496,388 |
Page 46 of 466
| | | | |
Federal National Mortgage Association: | | | | |
“A2”, Series 2003-63, 2.34%, 7/25/2044 | | 247,513 | | 246,893 |
“NA”, Series 2003-128, 4.0%, 8/25/2009 | | 2,307,000 | | 2,319,051 |
“2A3”, Series 2001-4, 4.16%, 6/25/2042 | | 1,200,000 | | 1,203,705 |
“NE”, Series 2004-52, 4.5%, 7/25/2033 | | 1,282,000 | | 1,218,062 |
“QG”, Series 2004-29, 4.5%, 12/25/2032 | | 1,420,000 | | 1,350,349 |
“WB”, Series 2003-106, 4.5%, 10/25/2015 | | 1,735,000 | | 1,760,836 |
“A2”, Series 2002-W10, 4.7%, 8/25/2042 | | 8,964 | | 8,957 |
“2A3”, Series 2003-W15, 4.71%, 8/25/2043 | | 2,113,370 | | 2,118,480 |
“1A3”, Series 2003-W18, 4.732%, 8/25/2043 | | 1,160,000 | | 1,165,593 |
“A2”, Series 2002-60, 4.75%, 2/25/2044 | | 44,895 | | 44,817 |
“KY”, Series 2002-55, 4.75%, 4/25/2028 | | 132,708 | | 132,497 |
“KH”, Series 2003-92, 5.0%, 3/25/2032 | | 1,100,000 | | 1,087,975 |
“MC”, Series 2002-56, 5.5%, 9/25/2017 | | 947,587 | | 975,562 |
“PG”, Series 2002-3, 5.5%, 2/25/2017 | | 500,000 | | 514,082 |
“QC”, Series 2002-11, 5.5%, 3/25/2017 | | 640,000 | | 665,482 |
“PM”, Series 2001-60, 6.0%, 3/25/2030 | | 366,829 | | 371,571 |
“VD”, Series 2002-56, 6.0%, 4/25/2020 | | 214,624 | | 218,317 |
“A2”, Series 1998-M6, 6.32%, 8/15/2008 | | 1,124,756 | | 1,201,071 |
“HM”, Series 2002-36, 6.5%, 12/25/2029 | | 86,159 | | 87,189 |
“1A2”, Series 2003-W3, 7.0%, 8/25/2042 | | 645,327 | | 683,843 |
| | |
| | | Principal
Amount ($)
| | Value ($)
|
“A2”, Series 2002-T19, Grantor Trust, 7.0%, 7/25/2042 | | 820,229 | | 869,185 |
FHLMC Structured Pass-Through Securities: | | | | |
“1A2”, Series T-59, 7.0%, 10/25/2043 | | 840,479 | | 889,857 |
“3A”, Series T-58, 7.0%, 9/25/2043 | | 818,748 | | 866,849 |
| | | | |
|
Total Collateralized Mortgage Obligations (Cost $71,469,198) | | | | 71,619,904 |
| | | | |
|
Municipal Investments 4.8% | | | | |
Brockton, MA, Core City General Obligation, Economic Development, Series A, 6.45%, 5/1/2017 (c) | | 1,530,000 | | 1,701,192 |
Illinois, Higher Education Revenue, 7.05%, 7/1/2009 (c) | | 1,410,000 | | 1,581,625 |
Jicarilla, NM, Sales & Special Tax Revenue, Apache Nation Revenue, 5.2%, 12/1/2013 | | 945,000 | | 968,880 |
Los Angeles, CA, Community Redevelopment Agency, Community Redevelopment Financing Authority Revenue, Bunker Hill Project, Series B, 5.83%, 12/1/2017 (c) | | 2,500,000 | | 2,563,250 |
New York, General Obligation, Environmental Facilities Corp., Series B, 4.95%, 1/1/2013 (c) | | 1,500,000 | | 1,530,285 |
Oklahoma City, OK, Airport Revenue, 5.2%, 10/1/2012 (c) | | 1,430,000 | | 1,472,614 |
Oregon, School District General Obligation, School Board Association, Series A, Zero Coupon, 6/30/2017 (c) | | 3,830,000 | | 1,958,049 |
Portland, OR, Industrial Development Revenue, 3.35%, 6/15/2010 (c) | | 1,550,000 | | 1,489,255 |
Trenton, NJ, School District General Obligation, 4.3%, 4/1/2011 (c) | | 1,040,000 | | 1,028,602 |
| | | | |
|
Total Municipal Investments (Cost $13,951,696) | | | | 14,293,752 |
| | | | |
|
Government National Mortgage Association 0.1% | | | | |
Government National Mortgage Association, 6.0% with various maturities from 1/15/2034 until 6/20/2034 (Cost $377,267) | | 367,880 | | 381,544 |
| | | | |
|
Page 47 of 466
| | | | | | |
US Government Backed 17.5 % | | | | | | |
US Treasury Bond: | | | | | | |
6.0%, 2/15/2026 (e) | | 10,386,000 | | | 11,897,246 | |
7.25%, 5/15/2016 (e) | | 4,682,000 | | | 5,860,548 | |
US Treasury Note: | | | | | | |
1.5%, 3/31/2006 (e) | | 4,000,000 | | | 3,934,688 | |
3.125%, 10/15/2008 (e) | | 207,000 | | | 204,793 | |
3.25%, 1/15/2013 (e) | | 28,575,000 | | | 28,327,198 | |
4.25%, 11/15/2013 (e) | | 1,995,000 | | | 2,007,546 | |
| | | | | |
|
|
Total US Government Backed (Cost $52,667,724) | | | | | 52,232,019 | |
| | | | | |
|
|
| | |
| | | Shares
| | | Value ($)
| |
Securities Lending Collateral 19.0 % | | | | | | |
Daily Assets Fund Institutional, 2.25% (f) (g) (Cost $56,591,078) | | 56,591,078 | | | 56,591,078 | |
Cash Equivalents 3.5 % | | | | | | |
Scudder Cash Management QP Trust, 2.24% (b) (Cost $10,557,817) | | 10,557,817 | | | 10,557,817 | |
| | | | | |
|
|
| | |
| | | % of Net Assets
| | | Value ($)
| |
Total Investment Portfolio (Cost $354,952,935) (a) | | 119.4 | | | 356,346,933 | |
| | | | | |
|
|
Other Assets and Liabilities, Net | | (19.4 | ) | | (57,959,700 | ) |
| | | | | |
|
|
Net Assets | | 100.0 | | | 298,387,233 | |
| | | | | |
|
|
Notes to Scudder Fixed Income Portfolio of Investments
| * | Floating rate notes are securities whose yields vary with a designated market index or market rate, such as the coupon-equivalent of the US Treasury bill rate. These securities are shown at their current rate as of December 31, 2004. |
| (a) | The cost for federal income tax purposes was $354,991,184. At December 31, 2004, net unrealized appreciation for all securities based on tax cost was $1,355,749. This consisted of aggregate gross unrealized appreciation for all securities in which there was an excess of value over tax cost of $3,274,728 and aggregate gross unrealized depreciation for all securities in which there was an excess of tax cost over value of $1,918,979. |
| (b) | Scudder Cash Management QP Trust is managed by Deutsche Investment Management Americas Inc. The rate shown is the annualized seven-day yield at period end. |
| (c) | Bond is insured by one of these companies: |
| | | | | |
Insurance Coverage
| | As a % of
Total Investment Portfolio
| |
AMBAC | | AMBAC Assurance Corp. | | 1.3 | % |
FGIC | | Financial Guaranty Insurance Company | | 1.7 | % |
FSA | | Financial Security Assurance | | 0.7 | % |
| (d) | Mortgage dollar roll included. |
| (e) | All or a portion of these securities were on loan (see Notes to Financial Statements). The value of all securities loaned at December 31, 2004, amounted to $55,585,732, which is 18.6% of total net assets. |
| (f) | Daily Assets Fund Institutional, an affiliated fund, is managed by Deutsche Asset Management, Inc. The rate shown is the annualized seven-day yield at period end. |
| (g) | Represents collateral held in connection with securities lending. |
144A: Security exempt from registration under Rule 144A of the Securities Act of 1933. These securities may be resold in transactions exempt from registration, normally to qualified institutional buyers.
Included in the portfolio are investments in mortgage or asset-backed securities which are interests in separate pools of mortgages or assets. Effective maturities of these investments may be shorter than stated maturities due to prepayments. Some separate investments in the Federal National Mortgage Association, Federal Home Loan Mortgage Corp. and the Government National Mortgage Association issues which have similar coupon rates have been aggregated for presentation purposes in the investment portfolio.
The accompanying notes are an integral part of the financial statements.
Page 48 of 466
Financial Statements
Statement of Assets and Liabilities as of December 31, 2004
| | | |
Assets | | | |
Investments: | | | |
Investments in securities, at value (cost $287,804,040) — including $55,585,732 of securities loaned | | $ | 289,198,038 |
Investment in Daily Assets Fund Institutional (cost $56,591,078)* | | | 56,591,078 |
Investment in Scudder Cash Management QP Trust (cost $10,557,817) | | | 10,557,817 |
Total investments in securities, at value (cost $354,952,935) | | | 356,346,933 |
Cash | | | 73,857 |
Receivable for investments sold | | | 934,790 |
Interest receivable | | | 2,459,749 |
Receivable for Portfolio shares sold | | | 1,478,427 |
Other assets | | | 11,167 |
| | |
|
|
Total assets | | | 361,304,923 |
| | |
|
|
Liabilities | | | |
Payable for investments purchased | | | 3,659,384 |
Payable for investments purchased — mortgage dollar rolls | | | 2,263,450 |
Payable upon return of securities loaned | | | 56,591,078 |
Deferred mortgage dollar roll income | | | 2,521 |
Accrued management fee | | | 145,855 |
Payable for Portfolio shares redeemed | | | 140,575 |
Other accrued expenses and payables | | | 114,827 |
| | |
|
|
Total liabilities | | | 62,917,690 |
| | |
|
|
Net assets, at value | | $ | 298,387,233 |
| | |
|
|
Net Assets | | | |
Net assets consist of: | | | |
Undistributed net investment income | | | 9,524,556 |
Net unrealized appreciation (depreciation) on investments | | | 1,393,998 |
Accumulated net realized gain (loss) | | | 2,647,909 |
Paid-in capital | | | 284,820,770 |
| | |
|
|
Net assets, at value | | $ | 298,387,233 |
| | |
|
|
Class A | | | |
Net Asset Value, offering and redemption price per share ($210,037,506 ÷ 17,397,738 outstanding shares of beneficial interest, $.01 par value, unlimited number of shares authorized) | | $ | 12.07 |
| | |
|
|
Class B | | | |
Net Asset Value, offering and redemption price per share ($88,349,727 ÷ 7,335,272 outstanding shares of beneficial interest, $.01 par value, unlimited number of shares authorized) | | $ | 12.04 |
| | |
|
|
| * | Represents collateral on securities loaned. |
Page 49 of 466
Statement of Operations for the year ended December 31, 2004
| | | | |
Investment Income | | | | |
Dividends | | $ | 47,575 | |
Interest | | | 11,599,430 | |
Interest — Scudder Cash Management QP Trust | | | 15,353 | |
Mortgage dollar roll income | | | 172,308 | |
Securities lending income, including income from Daily Assets Fund Institutional | | | 24,595 | |
| | |
|
|
|
Total Income | | | 11,859,261 | |
| | |
|
|
|
Expenses: | | | | |
Management fee | | | 1,589,597 | |
Custodian fees | | | 23,243 | |
Distribution service fees (Class B) | | | 175,814 | |
Record keeping fees (Class B) | | | 91,731 | |
Auditing | | | 42,156 | |
Legal | | | 18,958 | |
Trustees’ fees and expenses | | | 3,041 | |
Reports to shareholders | | | 50,572 | |
Other | | | 16,201 | |
| | |
|
|
|
Total expenses, before expense reductions | | | 2,011,313 | |
| | |
|
|
|
Expense reductions | | | (4,070 | ) |
| | |
|
|
|
Total expenses, after expense reductions | | | 2,007,243 | |
| | |
|
|
|
Net investment income | | | 9,852,018 | |
| | |
|
|
|
Realized and Unrealized Gain (Loss) on Investment Transactions | | | | |
| | | | | |
Net realized gain (loss) from investments | | | 2,613,421 | |
| | | | | |
Net unrealized appreciation (depreciation) during the period on investments | | | (740,835 | ) |
| | |
|
|
|
Net gain (loss) on investment transactions | | | 1,872,586 | |
| | |
|
|
|
Net increase (decrease) in net assets resulting from operations | | $ | 11,724,604 | |
| | |
|
|
|
The accompanying notes are an integral part of the financial statements.
Page 50 of 466
Statement of Changes in Net Assets
| | | | | | | | |
| | | Years Ended December 31,
| |
Increase (Decrease) in Net Assets
| | 2004
| | | 2003
| |
Operations: | | | | | | | | |
Net investment income (loss) | | $ | 9,852,018 | | | $ | 9,005,497 | |
Net realized gain (loss) on investment transactions | | | 2,613,421 | | | | 5,632,277 | |
Net unrealized appreciation (depreciation) on investment transactions during the period | | | (740,835 | ) | | | (3,106,535 | ) |
Net increase (decrease) in net assets resulting from operations | | | 11,724,604 | | | | 11,531,239 | |
Distributions to shareholders from: | | | | | | | | |
Net investment income | | | | | | | | |
Class A | | | (6,899,791 | ) | | | (7,642,555 | ) |
Class B | | | (1,766,032 | ) | | | (352,039 | ) |
Net realized gains | | | | | | | | |
Class A | | | (3,369,665 | ) | | | — | |
Class B | | | (976,642 | ) | | | — | |
Portfolio share transactions: | | | | | | | | |
| | |
Class A | | | | | | | | |
Proceeds from shares sold | | | 43,408,606 | | | | 33,556,029 | |
Reinvestment of distributions | | | 10,269,456 | | | | 7,642,555 | |
Cost of shares redeemed | | | (42,555,105 | ) | | | (59,678,316 | ) |
Net increase (decrease) in net assets from Class A share transactions | | | 11,122,957 | | | | (18,479,732 | ) |
| | |
Class B | | | | | | | | |
Proceeds from shares sold | | | 46,084,279 | | | | 45,408,382 | |
Reinvestment of distributions | | | 2,742,674 | | | | 352,039 | |
Cost of shares redeemed | | | (6,180,393 | ) | | | (2,824,214 | ) |
Net increase (decrease) in net assets from Class B share transactions | | | 42,646,560 | | | | 42,936,207 | |
Increase (decrease) in net assets | | | 52,481,991 | | | | 27,993,120 | |
Net assets at beginning of period | | | 245,905,242 | | | | 217,912,122 | |
| | |
|
|
| |
|
|
|
Net assets at end of period (including undistributed net investment income of $9,524,556 and $8,499,174, respectively) | | $ | 298,387,233 | | | | 245,905,242 | |
| | |
|
|
| |
|
|
|
Other Information | | | | | | | | |
| | |
Class A | | | | | | | | |
Shares outstanding at beginning of period | | | 16,493,825 | | | | 18,049,005 | |
Shares sold | | | 3,610,180 | | | | 2,793,008 | |
Shares issued to shareholders in reinvestment of distributions | | | 865,161 | | | | 650,984 | |
Shares redeemed | | | (3,571,428 | ) | | | (4,999,172 | ) |
Net increase (decrease) in Portfolio shares | | | 903,913 | | | | (1,555,180 | ) |
| | |
|
|
| |
|
|
|
Shares outstanding at end of period | | | 17,397,738 | | | | 16,493,825 | |
| | |
|
|
| |
|
|
|
Class B | | | | | | | | |
Shares outstanding at beginning of period | | | 3,731,351 | | | | 144,625 | |
Shares sold | | | 3,887,722 | | | | 3,792,922 | |
Shares issued to shareholders in reinvestment of distributions | | | 230,865 | | | | 29,986 | |
Shares redeemed | | | (514,666 | ) | | | (236,182 | ) |
Net increase (decrease) in Portfolio shares | | | 3,603,921 | | | | 3,586,726 | |
| | |
|
|
| |
|
|
|
Shares outstanding at end of period | | | 7,335,272 | | | | 3,731,351 | |
| | |
|
|
| |
|
|
|
The accompanying notes are an integral part of the financial statements.
Page 51 of 466
Financial Highlights
Class A
| | | | | | | | | | | | | | | | | | | | |
Years Ended December 31,
| | 2004
| | | 2003
| | | 2002
| | | 2001a
| | | 2000b
| |
Selected Per Share Data | | | | | | | | | | | | | | | | | | | | |
| | | | | | | | | | | | | | | | | | | | | |
Net asset value, beginning of period | | $ | 12.16 | | | $ | 11.98 | | | $ | 11.48 | | | $ | 11.45 | | | $ | 11.00 | |
| | |
|
|
| |
|
|
| |
|
|
| |
|
|
| |
|
|
|
Income from investment operations: | | | | | | | | | | | | | | | | | | | | |
Net investment incomec | | | .50 | | | | .45 | | | | .53 | | | | .62 | | | | .69 | |
Net realized and unrealized gain (loss) on investment transactions | | | .05 | | | | .14 | | | | .37 | | | | .01 | | | | .36 | |
| | |
|
|
| |
|
|
| |
|
|
| |
|
|
| |
|
|
|
Total from investment operations | | | .55 | | | | .59 | | | | .90 | | | | .63 | | | | 1.05 | |
| | |
|
|
| |
|
|
| |
|
|
| |
|
|
| |
|
|
|
Less distributions from: | | | | | | | | | | | | | | | | | | | | |
Net investment income | | | (.43 | ) | | | (.41 | ) | | | (.40 | ) | | | (.60 | ) | | | (.60 | ) |
Net realized gains on investment transactions | | | (.21 | ) | | | — | | | | — | | | | — | | | | — | |
| | |
|
|
| |
|
|
| |
|
|
| |
|
|
| |
|
|
|
Total distributions | | | (.64 | ) | | | (.41 | ) | | | (.40 | ) | | | (.60 | ) | | | (.60 | ) |
| | |
|
|
| |
|
|
| |
|
|
| |
|
|
| |
|
|
|
Net asset value, end of period | | $ | 12.07 | | | $ | 12.16 | | | $ | 11.98 | | | $ | 11.48 | | | $ | 11.45 | |
| | |
|
|
| |
|
|
| |
|
|
| |
|
|
| |
|
|
|
Total Return (%) | | | 4.53 | | | | 5.13 | | | | 8.01 | | | | 5.71 | | | | 9.90 | |
| | |
|
|
| |
|
|
| |
|
|
| |
|
|
| |
|
|
|
Ratios to Average Net Assets and Supplemental Data | | | | | | | | | | | | | | | | | | | | |
Net assets, end of period ($ millions) | | | 210 | | | | 201 | | | | 216 | | | | 134 | | | | 78 | |
Ratio of expenses before expense reductions (%) | | | .66 | | | | .66 | | | | .65 | | | | .64 | | | | .68 | |
Ratio of expenses after expense reductions (%) | | | .66 | | | | .66 | | | | .65 | | | | .64 | | | | .67 | |
Ratio of net investment income (loss) (%) | | | 4.18 | | | | 3.75 | | | | 4.57 | | | | 5.46 | | | | 6.36 | |
Portfolio turnover rate (%) | | | 185d | | | | 229d | | | | 267 | | | | 176 | | | | 311 | |
| a | As required, effective January 1, 2001, the Portfolio has adopted the provisions of the AICPA Audit and Accounting Guide for Investment Companies and began amortizing premium on debt securities. In addition, paydowns on mortgage-backed securities which were included in realized gain/loss on investment transactions prior to January 1, 2001 are included as interest income. The effect of this change for the year ended December 31, 2001 was to decrease net investment income per share by $.01, increase net realized and unrealized gains and losses per share by $.01 and decrease the ratio of net investment income to average net assets from 5.54% to 5.46%. Per share, ratios and supplemental data for periods prior to January 1, 2001 have not been restated to reflect this change in presentation. |
| b | On June 18, 2001, the Portfolio implemented a 1 for 10 reverse stock split. Per share information, for the periods prior to December 31, 2001, has been restated to reflect the effect of the split. Shareholders received 1 share for every 10 shares owned and net asset value per share increased correspondingly. |
| c | Based on average shares outstanding during the period. |
| d | The portfolio turnover rate including mortgage dollar roll transactions was 204% and 265% for the year ended December 31, 2004 and December 31, 2003, respectively. |
Page 52 of 466
Class B
| | | | | | | | | | | | |
Years Ended December 31,
| | 2004
| | | 2003
| | | 2002a
| |
Selected Per Share Data | | | | | | | | | | | | |
Net asset value, beginning of period | | $ | 12.13 | | | $ | 11.96 | | | $ | 11.36 | |
| | |
|
|
| |
|
|
| |
|
|
|
Income from investment operations: | | | | | | | | | | | | |
Net investment incomeb | | | .45 | | | | .40 | | | | .27 | |
Net realized and unrealized gain (loss) on investment transactions | | | .05 | | | | .15 | | | | .33 | |
| | |
|
|
| |
|
|
| |
|
|
|
Total from investment operations | | | .50 | | | | .55 | | | | .60 | |
| | |
|
|
| |
|
|
| |
|
|
|
Less distributions from: | | | | | | | | | | | | |
Net investment income | | | (.38 | ) | | | (.38 | ) | | | — | |
Net realized gains on investment transactions | | | (.21 | ) | | | — | | | | — | |
| | |
|
|
| |
|
|
| |
|
|
|
Total distributions | | | (.59 | ) | | | (.38 | ) | | | — | |
| | |
|
|
| |
|
|
| |
|
|
|
Net asset value, end of period | | $ | 12.04 | | | $ | 12.13 | | | $ | 11.96 | |
| | |
|
|
| |
|
|
| |
|
|
|
Total Return (%) | | | 4.10 | | | | 4.76 | | | | 5.28 | ** |
Ratios to Average Net Assets and Supplemental Data | | | | | | | | | | | | |
Net assets, end of period ($ millions) | | | 88 | | | | 45 | | | | 2 | |
Ratio of expenses (%) | | | 1.03 | | | | 1.05 | | | | .92 | * |
Ratio of net investment income (loss) (%) | | | 3.81 | | | | 3.36 | | | | 4.69 | * |
Portfolio turnover rate (%) | | | 185 | c | | | 229 | c | | | 267 | |
| a | For the period from July 1, 2002 (commencement of operations of Class B shares) to December 31, 2002. |
| b | Based on average shares outstanding during the period. |
| c | The portfolio turnover rate including mortgage dollar roll transactions was 204% and 265% for the year ended December 31, 2004 and December 31, 2003, respectively. |
Performance Summary December 31, 2004
Scudder Global Blue Chip Portfolio
All performance shown is historical, assumes reinvestment of all dividends and capital gains, and does not guarantee future results. Investment return and principal value fluctuate with changing market conditions so that, when redeemed, shares may be worth more or less then their original cost. Current performance may be lower or higher than the performance data quoted. Please visit scudder.com for the product’s most recent month-end performance. Performance doesn’t reflect charges and fees (“contract charges”) associated with the separate account that invests in the Portfolio or any variable life insurance policy or variable annuity contract for which the Portfolio is an investment option. These charges and fees will reduce returns.
This Portfolio is subject to stock market risk. Investing in foreign securities presents certain unique risks not associated with domestic investments, such as currency fluctuation, political and economic changes and market risks. All of these factors may result in greater share price volatility. Please read this Portfolio’s prospectus for specific details regarding its investments and risk profile.
Page 53 of 466
Growth of an Assumed $10,000 Investment in Scudder Global Blue Chip Portfolio from 5/5/1998 to 12/31/2004
¨ Scudder Global Blue Chip Portfolio — Class A
¨ MSCI World Index
| | |
 | | MSCI World Index is an unmanaged, capitalization-weighted measure of stock markets around the world, including North America, Europe, Australia and Asia. The index is calculated using closing local market prices and converts to US dollars using the London close foreign exchange rates. Index returns assume reinvested dividends and, unlike Portfolio returns, do not reflect any fees or expenses. It is not possible to invest directly into an index. |
Yearly periods ended December 31
Comparative Results
| | | | | | | | | | | | | | | | | | |
Scudder Global Blue Chip Portfolio
| | | | 1-Year
| | | 3-Year
| | | 5-Year
| | | Life of Portfolio*
| |
Class A | | Growth of $10,000 | | $ | 11,476 | | | $ | 12,483 | | | $ | 10,196 | | | $ | 12,647 | |
| | | Average annual total return | | | 14.76 | % | | | 7.67 | % | | | .39 | % | | | 3.59 | % |
MSCI World Index | | Growth of $10,000 | | $ | 11,472 | | | $ | 12,233 | | | $ | 8,834 | | | $ | 11,890 | |
| | | Average annual total return | | | 14.72 | % | | | 6.95 | % | | | -2.45 | % | | | 2.63 | % |
| | | | | |
Scudder Global Blue Chip Portfolio
| | | | | | | | | | 1-Year
| | | Life of Class**
| |
Class B | | Growth of $10,000 | | | | | | | | | | $ | 11,433 | | | $ | 13,234 | |
| | | Average annual total return | | | | | | | | | | | 14.33 | % | | | 11.85 | % |
MSCI World Index | | Growth of $10,000 | | | | | | | | | | $ | 11,472 | | | $ | 13,416 | |
| | | Average annual total return | | | | | | | | | | | 14.72 | % | | | 12.47 | % |
The growth of $10,000 is cumulative.
| * | The Portfolio commenced operations on May 5, 1998. Index returns begin April 30, 1998. |
| ** | The Portfolio commenced offering Class B shares on July 1, 2002. Index returns begin June 30, 2002. |
Information About Your Portfolio’s Expenses
Scudder Global Blue Chip Portfolio
As an investor of the Portfolio, you incur two types of costs: ongoing expenses and transaction costs. Ongoing expenses include management fees, distribution and service (12b-1) fees and other Portfolio expenses. Examples of transaction costs include sales charges (loads), redemption fees and account maintenance fees, which are not shown in this section. The following tables are intended to help you understand your ongoing expenses (in dollars) of investing in the Portfolio and to help you compare these expenses with the ongoing expenses of investing in other mutual funds. The tables are based on an investment of $1,000 made at the beginning of the six-month period ended December 31, 2004.
The tables illustrate your Portfolio’s expenses in two ways:
Actual Portfolio Return. This helps you estimate the actual dollar amount of ongoing expenses (but not transaction costs) paid on a $1,000 investment in the Portfolio using the Portfolio’s actual return during the period. To estimate the expenses you paid over the period, simply divide your account value by $1,000 (for example, an $8,600 account value divided by $1,000 = 8.6), then multiply the result by the number in the “Expenses Paid per $1,000” line under the share class you hold.
Page 54 of 466
Hypothetical 5% Portfolio Return. This helps you to compare your Portfolio’s ongoing expenses (but not transaction costs) with those of other mutual funds using the Portfolio’s actual expense ratio and a hypothetical rate of return of 5% per year before expenses. Examples using a 5% hypothetical Portfolio return may be found in the shareholder reports of other mutual funds. The hypothetical account values and expenses may not be used to estimate the actual ending account balance or expenses you paid for the period.
Please note that the expenses shown in these tables are meant to highlight your ongoing expenses only and do not reflect any transaction costs. The “Expenses Paid per $1,000” line of the tables is useful in comparing ongoing expenses only and will not help you determine the relative total expense of owning different funds. If these transaction costs had been included, your costs would have been higher.
Expenses and Value of a $1,000 Investment for the six months ended December 31, 2004
| | | | | | |
Actual Portfolio Return
| | Class A
| | Class B
|
Beginning Account Value 7/1/04 | | $ | 1,000.00 | | $ | 1,000.00 |
Ending Account Value 12/31/04 | | $ | 1,143.70 | | $ | 1,141.50 |
Expenses Paid per $1,000* | | $ | 8.24 | | $ | 10.26 |
| | |
Hypothetical 5% Portfolio Return
| | Class A
| | Class B
|
Beginning Account Value 7/1/04 | | $ | 1,000.00 | | $ | 1,000.00 |
Ending Account Value 12/31/04 | | $ | 1,017.52 | | $ | 1,015.62 |
Expenses Paid per $1,000* | | $ | 7.76 | | $ | 9.66 |
| * | Expenses are equal to the Portfolio’s annualized expense ratio for each share class, multiplied by the average account value over the period, multiplied by the number of days in the most recent six-month period, then divided by 365. |
| | | | | | |
Annualized Expense Ratios
| | Class A
| | | Class B
| |
Scudder Variable Series II — Scudder Global Blue Chip Portfolio | | 1.53 | % | | 1.90 | % |
For more information, please refer to the Portfolio’s prospectus.
Management Summary December 31, 2004
Scudder Global Blue Chip Portfolio
Amid a positive environment for the global equity markets, the portfolio returned 14.76% for the year ended December 31, 2004 (Class A shares, unadjusted for contract charges), in line with the 14.72% return of the MSCI World Index. Performance was helped by overweights in energy and materials as well as underweights in health care and technology. We also added value to the portfolio through stock selection in a number of sectors, including health care, financials and utilities. However, the positive impact from these factors was offset by underperforming stocks within the consumer sector.
We continue to invest in companies that we believe will benefit from longer-term themes in the world economy. There are currently 10 themes at work in the portfolio. All produced a positive return in 2004 with the exception of the theme called “Safety Assets,” which invests in gold stocks. The top-performing theme was “New Annuities,” which invests in companies with assets that can generate predictable
Page 55 of 466
long-term returns. Our most notable shift during the year was to take profits by reducing the portfolio’s weighting in commodity-related stocks. We maintained its weighting in energy, however, based on our belief that the sector has further upside.
The key factors driving the markets in 2004 were interest rates, the dollar and China. All of these were important components of the portfolio’s performance, and we will be watching for key shifts in 2005. Overall, we continue to believe that at a time of continued uncertainty in the markets, our emphasis on longer-term trends will help the portfolio deliver steady returns.
Oliver Kratz
Steve M. Wreford
Co-Managers
Deutsche Investment Management Americas Inc.
All performance shown is historical, assumes reinvestment of all dividends and capital gains, and does not guarantee future results. Investment return and principal value fluctuate with changing market conditions so that, when redeemed, shares may be worth more or less then their original cost. Current performance may be lower or higher than the performance data quoted. Please visit scudder.com for the product’s most recent month-end performance. Performance doesn’t reflect charges and fees (“contract charges”) associated with the separate account that invests in the portfolio or any variable life insurance policy or variable annuity contract for which the portfolio is an investment option. These charges and fees will reduce returns.
Risk Considerations
This portfolio is subject to stock market risk. Investing in foreign securities presents certain unique risks not associated with domestic investments, such as currency fluctuation, political and economic changes and market risks. All of these factors may result in greater share price volatility. Please read this portfolio’s prospectus for specific details regarding its investments and risk profile.
The Morgan Stanley Capital International (MSCI) World Index is an unmanaged, capitalization-weighted measure of stock markets around the world, including North America, Europe, Australia and Asia. The index is calculated using closing local market prices and converts to US dollars using the London close foreign exchange rates. Index returns assume reinvested dividends and, unlike portfolio returns, do not reflect any fees or expenses. It is not possible to invest directly into an index.
Portfolio management market commentary is as of December 31, 2004, and may not come to pass. This information is subject to change at any time based on market and other conditions.
Portfolio Summary
Scudder Global Blue Chip Portfolio
| | | | | | |
Asset Allocation (Excludes Securities Lending Collateral)
| | 12/31/04
| | | 12/31/03
| |
Common Stocks | | 89 | % | | 97 | % |
Cash Equivalents | | 8 | % | | 3 | % |
Exchange Traded Fund | | 2 | % | | — | |
Preferred Stocks | | 1 | % | | — | |
| | |
|
| |
|
|
| | | 100 | % | | 100 | % |
| | |
|
| |
|
|
Page 56 of 466
| | | | | | |
Sector Diversification (Excludes Cash Equivalents and Securities Lending Collateral)
| | 12/31/04
| | | 12/31/03
| |
Financials | | 21 | % | | 17 | % |
Materials | | 16 | % | | 19 | % |
Energy | | 13 | % | | 14 | % |
Industrials | | 12 | % | | 7 | % |
Information Technology | | 11 | % | | 10 | % |
Health Care | | 9 | % | | 8 | % |
Utilities | | 7 | % | | 6 | % |
Consumer Discretionary | | 6 | % | | 10 | % |
Consumer Staples | | 3 | % | | 2 | % |
Telecommunication Services | | 2 | % | | 7 | % |
| | |
|
| |
|
|
| | | 100 | % | | 100 | % |
| | |
|
| |
|
|
| | | | | | |
Geographical Diversification (Excludes Cash Equivalents and Securities Lending Collateral)
| | 12/31/04
| | | 12/31/03
| |
Continental Europe | | 30 | % | | 19 | % |
United States | | 28 | % | | 34 | % |
Asia (excluding Japan) | | 13 | % | | 11 | % |
Japan | | 11 | % | | 9 | % |
United Kingdom | | 7 | % | | 10 | % |
Canada | | 6 | % | | 5 | % |
Latin America | | 3 | % | | 6 | % |
Africa | | 2 | % | | 3 | % |
Australia | | — | | | 3 | % |
| | |
|
| |
|
|
| | | 100 | % | | 100 | % |
| | |
|
| |
|
|
Asset allocation, sector diversification and geographical diversification are subject to change.
For more complete details about the Portfolio’s investment portfolio, see page 51. A quarterly Fact Sheet is available upon request. Information concerning portfolio holdings of the Portfolio as of month end will be posted to scudder.com on the 15th of the following month.
Following the Portfolio’s fiscal first and third quarter-end, a complete portfolio holdings listing is filed with the SEC on Form N-Q. The form will be available on the SEC’s Web site at www.sec.gov, and it also may be reviewed and copied at the SEC’s Public Reference Room in Washington, D.C. Information on the operation of the SEC’s Public Reference Room may be obtained by calling (800) SEC-0330.
Page 57 of 466
|
| Investment Portfolio December 31, 2004 |
Scudder Global Blue Chip Portfolio
| | | | |
| | | Shares
| | Value ($)
|
Common Stocks 88.7% | | | | |
Australia 0.3% | | | | |
Alumina Ltd. (Cost $126,894) | | 48,800 | | 227,231 |
| | | | |
|
Austria 1.5% | | | | |
Erste Bank der oesterreichischen Sparkassen AG | | 6,200 | | 331,195 |
Wienerberger AG | | 16,600 | | 793,108 |
| | | | |
|
(Cost $845,372) | | | | 1,124,303 |
| | | | |
|
Brazil 1.2% | | | | |
Aracruz Celulose SA “B” (ADR) | | 10,900 | | 410,930 |
Companhia Vale do Rio Doce (ADR) | | 17,200 | | 498,972 |
| | | | |
|
(Cost $441,014) | | | | 909,902 |
| | | | |
|
Canada 5.1% | | | | |
Canadian National Railway Co.* | | 23,200 | | 1,414,868 |
EnCana Corp. | | 15,899 | | 907,642 |
Goldcorp, Inc.* | | 36,600 | | 551,680 |
Meridian Gold, Inc.* | | 32,700 | | 620,622 |
Placer Dome, Inc.* | | 20,600 | | 388,222 |
| | | | |
|
(Cost $2,098,359) | | | | 3,883,034 |
| | | | |
|
China 0.9% | | | | |
China Petroleum & Chemical Corp. “H” (Cost $576,393) | | 1,580,000 | | 645,400 |
| | | | |
|
France 4.2% | | | | |
Carrefour SA | | 16,002 | | 762,145 |
Societe Generale | | 5,339 | | 540,286 |
Total SA | | 8,405 | | 1,835,916 |
| | | | |
|
(Cost $2,646,842) | | | | 3,138,347 |
| | | | |
|
Germany 11.9% | | | | |
Allianz AG (Registered) | | 10,299 | | 1,366,294 |
BASF AG (d) | | 25,950 | | 1,869,444 |
Commerzbank AG* (d) | | 58,320 | | 1,201,755 |
Deutsche Boerse AG (d) | | 7,679 | | 462,181 |
E.ON AG (d) | | 21,239 | | 1,935,962 |
Schering AG (d) | | 11,600 | | 867,359 |
Volkswagen AG | | 28,183 | | 1,277,563 |
| | | | |
|
(Cost $6,593,907) | | | | 8,980,558 |
| | | | |
|
Hong Kong 3.1% | | | | |
China Mobile (Hong Kong) Ltd. | | 145,600 | | 493,594 |
Denway Motors Ltd. | | 812,000 | | 289,899 |
Fountain Set (Holdings) Ltd. | | 908,000 | | 589,937 |
Hutchison Whampoa Ltd. | | 100,000 | | 935,968 |
| | | | |
|
(Cost $2,160,807) | | | | 2,309,398 |
| | | | |
|
India 1.0% | | | | |
Oil & Natural Gas Corp. Ltd. | | 9,600 | | 180,991 |
Reliance Industries Ltd. | | 44,000 | | 540,308 |
| | | | |
|
(Cost $693,189) | | | | 721,299 |
| | | | |
|
Israel 0.4% | | | | |
| | | | |
|
Teva Pharmaceutical Industries Ltd. (ADR) (Cost $308,214) | | 10,600 | | 316,516 |
| | | | |
|
Page 58 of 466
| | | | |
| | | Shares
| | Value ($)
|
Italy 2.4% | | | | |
Capitalia SpA | | 169,300 | | 775,508 |
Enel SpA | | 56,500 | | 555,247 |
Mediobanca SpA | | 28,200 | | 456,520 |
| | | | |
|
(Cost $1,492,530) | | | | 1,787,275 |
| | | | |
|
Japan 10.2% | | | | |
Daiwa Securities Group, Inc. | | 62,000 | | 447,741 |
FANUC Ltd. | | 21,000 | | 1,373,085 |
Japan Retail Fund Investment Corp. (REIT) | | 24 | | 202,596 |
Komatsu Ltd. | | 165,000 | | 1,154,533 |
Mitsubishi Estate Co., Ltd. | | 77,000 | | 901,727 |
Mitsubishi Tokyo Financial Group, Inc. | | 38 | | 385,674 |
Mitsui Fudosan Co., Ltd. | | 107,000 | | 1,300,039 |
Mizuho Financial Group, Inc. | | 119 | | 599,239 |
Nomura Holdings, Inc. | | 93,000 | | 1,355,928 |
| | | | |
|
(Cost $6,699,056) | | | | 7,720,562 |
| | | | |
|
Korea 2.8% | | | | |
Daewoo Shipbuilding & Marine Engineering Co., Ltd. | | 20,800 | | 309,428 |
LG Electronics, Inc. | | 13,200 | | 817,349 |
Samsung Electronics Co., Ltd. | | 2,310 | | 1,005,270 |
(Cost $1,884,767) | | | | 2,132,047 |
| | | | |
|
Malaysia 0.3% | | | | |
| | | | |
|
Resorts World Berhad (Cost $211,544) | | 81,200 | | 213,684 |
| | | | |
|
Mexico 1.4% | | | | |
Cemex SA de CV (ADR) | | 10,700 | | 389,694 |
Fomento Economico Mexicano SA de CV (ADR) | | 8,200 | | 431,402 |
Grupo Televisa SA (ADR) | | 4,100 | | 248,050 |
| | | | |
|
(Cost $826,238) | | | | 1,069,146 |
| | | | |
|
Peru 1.0% | | | | |
Compania de Minas Buenaventura SA (ADR) (Cost $595,582) | | 34,300 | | 785,470 |
| | | | |
|
Russia 1.8% | | | | |
Gazprom “S” (ADR) 144A (d) | | 23,000 | | 823,600 |
LUKOIL (ADR) | | 4,500 | | 551,250 |
| | | | |
|
(Cost $840,793) | | | | 1,374,850 |
| | | | |
|
Singapore 1.8% | | | | |
DBS Group Holdings Ltd. | | 62,000 | | 611,492 |
Singapore Telecommunications Ltd. | | 519,060 | | 756,777 |
| | | | |
|
(Cost $1,072,310) | | | | 1,368,269 |
| | | | |
|
South Africa 1.3% | | | | |
Gold Fields Ltd. | | 49,100 | | 605,715 |
Impala Platinum Holdings Ltd. (ADR) | | 17,700 | | 376,228 |
| | | | |
|
(Cost $773,476) | | | | 981,943 |
| | | | |
|
Sweden 1.8% | | | | |
Skandinaviska Enskilda Banken AB (Cost $1,081,446) | | 70,600 | | 1,365,170 |
| | | | |
|
Page 59 of 466
| | | | |
| | | Shares
| | Value ($)
|
Switzerland 2.9% | | | | |
ABB Ltd.* | | 101,358 | | 566,022 |
Credit Suisse Group | | 11,425 | | 480,270 |
Nestle SA (Registered) | | 1,527 | | 399,510 |
Novartis AG (Registered) | | 14,463 | | 728,810 |
| | | | |
|
(Cost $1,889,687) | | | | 2,174,612 |
| | | | |
|
Taiwan 1.8% | | | | |
Hon Hai Precision Industry Co., Ltd. | | 132,249 | | 613,462 |
Quanta Computer, Inc. | | 300,417 | | 540,352 |
Taiwan Semiconductor Manufacturing Co., Ltd. (ADR) | | 27,042 | | 229,587 |
| | | | |
|
(Cost $1,243,503) | | | | 1,383,401 |
| | | | |
|
Thailand 0.5% | | | | |
Bangkok Bank PCL (Foreign Registered)* (Cost $312,623) | | 125,600 | | 368,556 |
| | | | |
|
United Kingdom 6.0% | | | | |
| | | | | |
Anglo American PLC | | 24,231 | | 573,140 |
GlaxoSmithKline PLC | | 55,355 | | 1,298,695 |
Lonmin PLC | | 27,333 | | 481,211 |
National Grid Transco PLC | | 89,984 | | 856,892 |
Rio Tinto PLC | | 14,318 | | 421,409 |
RT Group PLC* | | 54,206 | | 11,448 |
William Morrison Supermarkets PLC | | 218,828 | | 869,665 |
| | | | |
|
(Cost $4,053,674) | | | | 4,512,460 |
| | | | |
|
United States 23.1% | | | | |
Affiliated Computer Services, Inc. “A”* | | 11,200 | | 674,128 |
AFLAC, Inc. | | 26,800 | | 1,067,712 |
Anadarko Petroleum Corp. | | 15,300 | | 991,593 |
AutoZone, Inc.* | | 4,500 | | 410,895 |
Avocent Corp.* | | 12,500 | | 506,500 |
Caremark Rx, Inc.* | | 12,300 | | 484,989 |
Caterpillar, Inc. | | 11,500 | | 1,121,365 |
ConocoPhillips | | 16,400 | | 1,424,012 |
Dean Foods Co.* | | 17,000 | | 560,150 |
Devon Energy Corp. | | 15,300 | | 595,476 |
Eaton Corp. | | 5,500 | | 397,980 |
Equity Residential (REIT) | | 11,900 | | 430,542 |
Hewlett-Packard Co. | | 65,300 | | 1,369,341 |
Medicines Co.* | | 14,600 | | 420,480 |
Microsoft Corp. | | 38,300 | | 1,022,993 |
Page 60 of 466
| | | | |
| | | Shares
| | Value ($)
|
Monsanto Co. | | 32,400 | | 1,799,820 |
Newmont Mining Corp. | | 12,500 | | 555,125 |
Pfizer, Inc. | | 48,300 | | 1,298,787 |
Schlumberger Ltd. | | 13,500 | | 903,825 |
VERITAS Software Corp.* | | 22,600 | | 645,230 |
Wyeth | | 18,700 | | 796,433 |
| | | | |
|
(Cost $14,656,440) | | | | 17,477,376 |
| | | | |
|
Venezuela 0.0% | | | | |
Compania Anonima Nacional Telefonos de Venezuela (ADR) (Cost $35,275) | | 1,700 | | 38,063 |
| | | | |
|
Total Common Stocks (Cost $54,159,935) | | | | 67,008,872 |
| | | | |
|
Preferred Stocks 0.8% | | | | |
Germany | | | | |
Porsche AG (Cost $645,846) | | 1,000 | | 638,168 |
| | | | |
|
Exchange Traded Funds 2.1% | | | | |
iShares MSCI Malaysia Index Fund | | 11,700 | | 83,655 |
iShares Nasdaq Biotechnology Index Fund* (d) | | 19,900 | | 1,500,460 |
| | | | |
|
Total Exchange Traded Funds (Cost $1,484,286) | | | | 1,584,115 |
| | | | |
|
Securities Lending Collateral 8.8% | | | | |
Daily Assets Fund Institutional, 2.25% (c) (e) (Cost $6,643,847) | | 6,643,847 | | 6,643,847 |
| | | | |
|
Cash Equivalent 8.4% | | | | |
Scudder Cash Management QP Trust, 2.24% (b) (Cost $6,382,314) | | 6,382,314 | | 6,382,314 |
| | | | |
|
| | | | | | |
| | | % of Net Assets
| | | Value ($)
| |
Total Investment Portfolio (Cost $69,316,228) (a) | | 108.8 | | | 82,257,316 | |
| | | | | |
|
|
Other Assets and Liabilities, Net | | (8.8 | ) | | (6,684,153 | ) |
| | | | | |
|
|
Net Assets | | 100.0 | | | 75,573,163 | |
| | | | | |
|
|
Notes to Scudder Global Blue Chip Portfolio of Investments
| * | Non-income producing security. |
| (a) | The cost for federal income tax purposes was $69,467,378. At December 31, 2004, net unrealized appreciation for all securities based on tax cost was $12,789,938. This consisted of aggregate gross unrealized appreciation for all securities in which there was an excess of value over tax cost of $13,964,276 and aggregate gross unrealized depreciation for all securities in which there was an excess of tax cost over value of $1,174,338. |
| (b) | Scudder Cash Management QP Trust is managed by Deutsche Investment Management Americas Inc. The rate shown is the annualized seven-day yield at period end. |
| (c) | Daily Assets Fund Institutional, an affiliated fund, is also managed by Deutsche Asset Management, Inc. The rate shown is the annualized seven-day yield at period end. |
| (d) | All or a portion of these securities were on loan (see Notes to Financial Statements). The value of all securities loaned at December 31, 2004 amounted to $6,351,889, which is 8.4% of total net assets. |
| (e) | Represents collateral held in connection with securities lending. |
ADR: American Depositary Receipts
REIT: Real Estate Investment Trust
144A: Security exempt from registration under Rule 144A of the Securities Act of 1933. These securities may be resold in transactions exempt from registration, normally to qualified institutional buyers.
The accompanying notes are an integral part of the financial statements.
Page 61 of 466
Financial Statements
Statement of Assets and Liabilities as of December 31, 2004
| | | | |
Assets | | | | |
Investments: | | | | |
Investments in securities, at value (cost $56,290,067) — including $6,351,889 of securities loaned | | $ | 69,231,155 | |
Investment in Daily Assets Fund Institutional (cost $6,643,847)* | | | 6,643,847 | |
Investment in Scudder Cash Management QP Trust (cost $6,382,314) | | | 6,382,314 | |
Total investments in securities, at value (cost $69,316,228) | | | 82,257,316 | |
Cash | | | 1,336 | |
Foreign currency, at value (cost $60,569) | | | 64,671 | |
Receivables for investments sold | | | 793,632 | |
Dividends receivable | | | 81,978 | |
Interest receivable | | | 8,053 | |
Receivable for Portfolio shares sold | | | 28,292 | |
Foreign taxes recoverable | | | 10,210 | |
Other assets | | | 7,566 | |
| | |
|
|
|
Total assets | | | 83,253,054 | |
| | |
|
|
|
Liabilities | | | | |
Payable for investments purchased | | | 808,096 | |
Payable upon return of securities loaned | | | 6,643,847 | |
Payable for Portfolio shares redeemed | | | 68,054 | |
Accrued management fee | | | 61,268 | |
Other accrued expenses and payables | | | 98,626 | |
| | |
|
|
|
Total liabilities | | | 7,679,891 | |
| | |
|
|
|
Net assets, at value | | $ | 75,573,163 | |
| | |
|
|
|
Net Assets | | | | |
Net assets consist of: | | | | |
Undistributed net investment income | | | 102,166 | |
Net unrealized appreciation (depreciation) on: | | | | |
Investments | | | 12,941,088 | |
Foreign currency related transactions | | | 6,433 | |
Accumulated net realized gain (loss) | | | (4,812,938 | ) |
Paid-in capital | | | 67,336,414 | |
| | |
|
|
|
Net assets, at value | | $ | 75,573,163 | |
| | |
|
|
|
Class A | | | | |
Net Asset Value, offering and redemption price per share ($63,027,127 ÷ 5,350,985 outstanding shares of beneficial interest, $.01 par value, unlimited number of shares authorized) | | $ | 11.78 | |
| | |
|
|
|
Class B | | | | |
Net Asset Value, offering and redemption price per share ($12,546,036 ÷ 1,064,827 outstanding shares of beneficial interest, $.01 par value, unlimited number of shares authorized) | | $ | 11.78 | |
| | |
|
|
|
| * | Represents collateral on securities loaned. |
Page 62 of 466
Statement of Operations for the year ended December 31, 2004
| | | | |
Investment Income | | | | |
Income: | | | | |
Dividends (net of foreign taxes withheld of $86,153) | | $ | 1,100,189 | |
Interest — Scudder Cash Management QP Trust | | | 41,410 | |
Securities lending income, including income from Daily Assets Fund Institutional | | | 29,814 | |
Total Income | | | 1,171,413 | |
Expenses: | | | | |
Management fee | | | 647,402 | |
Custodian and accounting fees | | | 190,058 | |
Distribution service fees (Class B) | | | 23,461 | |
Record keeping fees (Class B) | | | 12,031 | |
Auditing | | | 50,584 | |
Legal | | | 16,830 | |
Trustees’ fees and expenses | | | 1,909 | |
Reports to shareholders | | | 13,947 | |
Other | | | 11,575 | |
Total expenses, before expense reductions | | | 967,797 | |
Expense reductions | | | (1,159 | ) |
| | |
|
|
|
Total expenses, after expense reductions | | | 966,638 | |
| | |
|
|
|
Net investment income (loss) | | | 204,775 | |
| | |
|
|
|
Realized and Unrealized Gain (Loss) on Investment Transactions | |
Net realized gain (loss) from: | | | | |
Investments | | | 5,258,185 | |
Foreign currency related transactions | | | (17,858 | ) |
| | | | 5,240,327 | |
Net unrealized appreciation (depreciation) during the period on: | | | | |
Investments | | | 3,765,804 | |
Foreign currency related transactions | | | (116 | ) |
| | | | 3,765,688 | |
| | |
|
|
|
Net gain (loss) on investment transactions | | | 9,006,015 | |
| | |
|
|
|
Net increase (decrease) in net assets resulting from operations | | $ | 9,210,790 | |
| | |
|
|
|
The accompanying notes are an integral part of the financial statements.
Page 63 of 466
Statement of Changes in Net Assets
| | | | | | | | |
| | | Years Ended December 31,
| |
Increase (Decrease) in Net Assets
| | 2004
| | | 2003
| |
Operations: | | | | | | | | |
Net investment income (loss) | | $ | 204,775 | | | $ | 469,875 | |
Net realized gain (loss) on investment transactions | | | 5,240,327 | | | | (902,561 | ) |
Net unrealized appreciation (depreciation) on investment transactions during the period | | | 3,765,688 | | | | 13,515,142 | |
Net increase (decrease) in net assets resulting from operations | | | 9,210,790 | | | | 13,082,456 | |
Distributions to shareholders from: | | | | | | | | |
| | |
Net investment income | | | | | | | | |
Class A | | | (686,309 | ) | | | (164,671 | ) |
Class B | | | (57,902 | ) | | | (1,208 | ) |
Portfolio share transactions: | | | | | | | | |
| | |
Class A | | | | | | | | |
Proceeds from shares sold | | | 10,246,696 | | | | 14,111,779 | |
Reinvestment of distributions | | | 686,309 | | | | 164,671 | |
Cost of shares redeemed | | | (9,557,336 | ) | | | (14,079,045 | ) |
Net increase (decrease) in net assets from Class A share transactions | | | 1,375,669 | | | | 197,405 | |
| | |
Class B | | | | | | | | |
Proceeds from shares sold | | | 5,449,125 | | | | 5,128,199 | |
Reinvestment of distributions | | | 57,902 | | | | 1,208 | |
Cost of shares redeemed | | | (572,691 | ) | | | (196,055 | ) |
Net increase (decrease) in net assets from Class B share transactions | | | 4,934,336 | | | | 4,933,352 | |
Increase (decrease) in net assets | | | 14,776,584 | | | | 18,047,334 | |
Net assets at beginning of period | | | 60,796,579 | | | | 42,749,245 | |
| | |
|
|
| |
|
|
|
Net assets at end of period (including undistributed net investment income of $102,166 and $671,339, respectively) | | $ | 75,573,163 | | | $ | 60,796,579 | |
| | |
|
|
| |
|
|
|
Other Information | | | | | | | | |
| | |
Class A | | | | | | | | |
Shares outstanding at beginning of period | | | 5,262,148 | | | | 5,267,978 | |
Shares sold | | | 941,848 | | | | 1,644,533 | |
Shares issued to shareholders in reinvestment of distributions | | | 64,503 | | | | 21,782 | |
Shares redeemed | | | (917,514 | ) | | | (1,672,145 | ) |
Net increase (decrease) in Portfolio shares | | | 88,837 | | | | (5,830 | ) |
| | |
|
|
| |
|
|
|
Shares outstanding at end of period | | | 5,350,985 | | | | 5,262,148 | |
| | |
|
|
| |
|
|
|
Class B | | | | | | | | |
Shares outstanding at beginning of period | | | 588,861 | | | | 24,654 | |
Shares sold | | | 522,896 | | | | 585,383 | |
Shares issued to shareholders in reinvestment of distributions | | | 5,427 | | | | 160 | |
Shares redeemed | | | (52,357 | ) | | | (21,336 | ) |
Net increase (decrease) in Portfolio shares | | | 475,966 | | | | 564,207 | |
| | |
|
|
| |
|
|
|
Shares outstanding at end of period | | | 1,064,827 | | | | 588,861 | |
| | |
|
|
| |
|
|
|
The accompanying notes are an integral part of the financial statements.
Page 64 of 466
Financial Highlights
Class A
| | | | | | | | | | | | | | | | | | | | |
Years Ended December 31,
| | 2004
| | | 2003
| | | 2002
| | | 2001
| | | 2000a
| |
Selected Per Share Data | | | | | | | | | | | | | | | | | | | | |
Net asset value, beginning of period | | $ | 10.39 | | | $ | 8.08 | | | $ | 9.64 | | | $ | 11.81 | | | $ | 12.37 | |
| | |
|
|
| |
|
|
| |
|
|
| |
|
|
| |
|
|
|
Income (loss) from investment operations: | | | | | | | | | | | | | | | | | | | | |
Net investment income (loss)b | | | .04 | | | | .09 | | | | .07 | | | | .08 | | | | .03 | |
Net realized and unrealized gain (loss) on investment transactions | | | 1.48 | | | | 2.25 | | | | (1.57 | ) | | | (1.90 | ) | | | (.44 | ) |
| | |
|
|
| |
|
|
| |
|
|
| |
|
|
| |
|
|
|
Total from investment operations | | | 1.52 | | | | 2.34 | | | | (1.50 | ) | | | (1.82 | ) | | | (.41 | ) |
| | |
|
|
| |
|
|
| |
|
|
| |
|
|
| |
|
|
|
Less distributions from: | | | | | | | | | | | | | | | | | | | | |
Net investment income | | | (.13 | ) | | | (.03 | ) | | | (.06 | ) | | | — | | | | — | |
Net realized gains on investment transactions | | | — | | | | — | | | | — | | | | (.35 | ) | | | (.15 | ) |
| | |
|
|
| |
|
|
| |
|
|
| |
|
|
| |
|
|
|
Total distributions | | | (.13 | ) | | | (.03 | ) | | | (.06 | ) | | | (.35 | ) | | | (.15 | ) |
| | |
|
|
| |
|
|
| |
|
|
| |
|
|
| |
|
|
|
Net asset value, end of period | | $ | 11.78 | | | $ | 10.39 | | | $ | 8.08 | | | $ | 9.64 | | | $ | 11.81 | |
| | |
|
|
| |
|
|
| |
|
|
| |
|
|
| |
|
|
|
Total Return (%) | | | 14.76 | | | | 29.13 | c | | | (15.77 | ) | | | (15.48 | ) | | | (3.36 | )c |
Ratios to Average Net Assets and Supplemental Data | | | | | | | | | | | | | | | | | | | | |
Net assets, end of period ($ millions) | | | 63 | | | | 55 | | | | 43 | | | | 44 | | | | 33 | |
Ratio of expenses before expense reductions (%) | | | 1.44 | | | | 1.48 | | | | 1.32 | | | | 1.24 | | | | 1.78 | |
Ratio of expenses after expense reductions (%) | | | 1.43 | | | | 1.17 | | | | 1.32 | | | | 1.24 | | | | 1.50 | |
Ratio of net investment income (loss) (%) | | | .38 | | | | 1.02 | | | | .79 | | | | .76 | | | | .28 | |
Portfolio turnover rate (%) | | | 81 | | | | 65 | | | | 41 | | | | 52 | | | | 54 | |
| a | On June 18, 2001, the Portfolio implemented a 1 for 10 reverse stock split. Per share information, for the period prior to December 31, 2001, has been restated to reflect the effect of the split. Shareholders received 1 share for every 10 shares owned and net asset value per share increased correspondingly. |
| b | Based on average shares outstanding during the period. |
| c | Total returns would have been lower had certain expenses not been reduced. |
Page 65 of 466
Class B
| | | | | | | | | | | | |
Years Ended December 31,
| | 2004
| | | 2003
| | | 2002a
| |
Selected Per Share Data | | | | | | | | | | | | |
Net asset value, beginning of period | | $ | 10.38 | | | $ | 8.06 | | | $ | 8.98 | |
| | |
|
|
| |
|
|
| |
|
|
|
| | | |
Income (loss) from investment operations: | | | | | | | | | | | | |
Net investment income (loss)b | | | .00 | d | | | .04 | | | | .02 | |
Net realized and unrealized gain (loss) on investment transactions | | | 1.48 | | | | 2.29 | | | | (.94 | ) |
| | |
|
|
| |
|
|
| |
|
|
|
Total from investment operations | | | 1.48 | | | | 2.33 | | | | (.92 | ) |
| | |
|
|
| |
|
|
| |
|
|
|
Less distributions from: | | | | | | | | | | | | |
Net investment income | | | (.08 | ) | | | (.01 | ) | | | — | |
| | |
|
|
| |
|
|
| |
|
|
|
Net asset value, end of period | | $ | 11.78 | | | $ | 10.38 | | | $ | 8.06 | |
| | |
|
|
| |
|
|
| |
|
|
|
Total Return (%) | | | 14.33 | | | | 28.96 | c | | | (10.24 | )** |
Ratios to Average Net Assets and Supplemental Data | | | | | | | | | | | | |
Net assets, end of period ($ millions) | | | 13 | | | | 6 | | | | .2 | |
Ratio of expenses before expense reductions (%) | | | 1.84 | | | | 1.87 | | | | 1.60 | * |
Ratio of expenses after expense reductions (%) | | | 1.83 | | | | 1.64 | | | | 1.60 | * |
Ratio of net investment income (loss) (%) | | | .02 | | | | .55 | | | | .49 | * |
Portfolio turnover rate (%) | | | 81 | | | | 65 | | | | 41 | |
| a | For the period July 1, 2002 (commencement of operations of Class B shares) to December 31, 2002. |
| b | Based on average shares outstanding during the period. |
| c | Total returns would have been lower had certain expenses not been reduced. |
| d | Amount is less than $.005 per share. |
Performance Summary December 31, 2004
Scudder Government & Agency Securities Portfolio
All performance shown is historical, assumes reinvestment of all dividends and capital gains, and does not guarantee future results. Investment return and principal value fluctuate with changing market conditions so that, when redeemed, shares may be worth more or less then their original cost. Current performance may be lower or higher than the performance data quoted. Please visit scudder.com for the product’s most recent month-end performance. Performance doesn’t reflect charges and fees (“contract charges”) associated with the separate account that invests in the Portfolio or any variable life insurance policy or variable annuity contract for which the Portfolio is an investment option. These charges and fees will reduce returns.
The guarantee relates only to the prompt payment of principal and interest and does not remove market risks. Additionally, yields will fluctuate in response to changing interest rates and may be affected by the prepayment of mortgage-backed securities. Please read this Portfolio’s prospectus for specific details regarding its investments and risk profile.
| | |
| Growth of an Assumed $10,000 Investment in Scudder Government & Agency Securities Portfolio from 12/31/1994 to 12/31/2004 |
|
¨ Scudder Government & Agency Securities Portfolio — Class A ¨ Lehman Brothers GNMA Index |
| |
 | | The Lehman Brothers GNMA Index is an unmanaged market-value-weighted measure of all fixed-rate securities backed by mortgage pools of the Government National Mortgage Association. Index returns assume reinvested dividends and, unlike Portfolio returns, do not reflect any fees or expenses. It is not possible to invest directly into an index. |
Page 66 of 466
Yearly periods ended December 31
Comparative Results
| | | | | | | | | | | | | | | | | | |
Scudder Government & Agency Securities Portfolio
| | | | 1-Year
| | | 3-Year
| | | 5-Year
| | | 10-Year
| |
Class A | | Growth of $10,000 | | $ | 10,375 | | | $ | 11,464 | | | $ | 13,668 | | | $ | 19,584 | |
| | | Average annual total return | | | 3.75 | % | | | 4.66 | % | | | 6.45 | % | | | 6.95 | % |
Lehman Brothers GNMA Index | | Growth of $10,000 | | $ | 10,435 | | | $ | 11,666 | | | $ | 14,027 | | | $ | 20,684 | |
| | | Average annual total return | | | 4.35 | % | | | 5.27 | % | | | 7.00 | % | | | 7.54 | % |
| | | | | |
Scudder Government & Agency Securities Portfolio
| | | | | | | | | | 1-Year
| | | Life of Class*
| |
Class B | | Growth of $10,000 | | | | | | | | | | $ | 10,336 | | | $ | 10,917 | |
| | | Average annual total return | | | | | | | | | | | 3.36 | % | | | 3.57 | % |
Lehman Brothers GNMA Index | | Growth of $10,000 | | | | | | | | | | $ | 10,435 | | | $ | 11,180 | |
| | | Average annual total return | | | | | | | | | | | 4.35 | % | | | 4.56 | % |
The growth of $10,000 is cumulative.
| * | The Portfolio commenced offering Class B shares on July 1, 2002. Index returns begin June 30, 2002. |
Information About Your Portfolio’s Expenses
Scudder Government & Agency Securities Portfolio
As an investor of the Portfolio, you incur two types of costs: ongoing expenses and transaction costs. Ongoing expenses include management fees, distribution and service (12b-1) fees and other Portfolio expenses. Examples of transaction costs include sales charges (loads), redemption fees and account maintenance fees, which are not shown in this section. The following tables are intended to help you understand your ongoing expenses (in dollars) of investing in the Portfolio and to help you compare these expenses with the ongoing expenses of investing in other mutual funds. The tables are based on an investment of $1,000 made at the beginning of the six-month period ended December 31, 2004.
The tables illustrate your Portfolio’s expenses in two ways:
Actual Portfolio Return. This helps you estimate the actual dollar amount of ongoing expenses (but not transaction costs) paid on a $1,000 investment in the Portfolio using the Portfolio’s actual return during the period. To estimate the expenses you paid over the period, simply divide your account value by $1,000 (for example, an $8,600 account value divided by $1,000 = 8.6), then multiply the result by the number in the “Expenses Paid per $1,000” line under the share class you hold.
Hypothetical 5% Portfolio Return. This helps you to compare your Portfolio’s ongoing expenses (but not transaction costs) with those of other mutual funds using the Portfolio’s actual expense ratio and a hypothetical rate of return of 5% per year before expenses. Examples using a 5% hypothetical Portfolio return may be found in the shareholder reports of other mutual funds. The hypothetical account values and expenses may not be used to estimate the actual ending account balance or expenses you paid for the period.
Please note that the expenses shown in these tables are meant to highlight your ongoing expenses only and do not reflect any transaction costs. The “Expenses Paid per $1,000” line of the tables is useful in comparing ongoing expenses only and will not help you determine the relative total expense of owning different funds. If these transaction costs had been included, your costs would have been higher.
Page 67 of 466
Expenses and Value of a $1,000 Investment for the six months ended December 31, 2004
| | | | | | |
Actual Portfolio Return
| | Class A
| | Class B
|
Beginning Account Value 7/1/04 | | $ | 1,000.00 | | $ | 1,000.00 |
Ending Account Value 12/31/04 | | $ | 1,033.80 | | $ | 1,031.60 |
Expenses Paid per $1,000* | | $ | 3.12 | | $ | 5.06 |
| | |
Hypothetical 5% Portfolio Return
| | Class A
| | Class B
|
Beginning Account Value 7/1/04 | | $ | 1,000.00 | | $ | 1,000.00 |
Ending Account Value 12/31/04 | | $ | 1,022.14 | | $ | 1,020.22 |
Expenses Paid per $1,000* | | $ | 3.10 | | $ | 5.04 |
| * | Expenses are equal to the Portfolio’s annualized expense ratio for each share class, multiplied by the average account value over the period, multiplied by the number of days in the most recent six-month period, then divided by 365. |
| | | | | | |
Annualized Expense Ratios
| | Class A
| | | Class B
| |
Scudder Variable Series II — Scudder Government & Agency Securities Portfolio | | .61 | % | | .99 | % |
For more information, please refer to the Portfolio’s prospectus.
Management Summary December 31, 2004
Scudder Government & Agency Securities Portfolio
The year 2004 produced a more positive environment for mortgage securities than the previous year. Several factors were responsible: (1) interest rates were relatively stable, and any increases — mainly on the short end of the yield curve — were carefully communicated in advance by the Federal Reserve; (2) job growth rose to a respectable average level per month, beginning with the March nonfarm payroll report, and is now in line with economists’ forecasts; (3) significant US dollar weakness prompted foreign central banks, primarily in Asia, to intervene and purchase dollars in significant volume to support the value of their own currencies. These actions dampened what might otherwise have been larger long-term interest rate increases during the year; and (4) the net supply of mortgages declined drastically — from $230 billion in 2003 to $40 billion in 2004 while demand remained stable.
During the 12-month period ended December 31, 2004, the portfolio provided a total return of 3.75% (Class A shares, unadjusted for contract charges) compared with the 4.35% return of its benchmark, the Lehman Brothers GNMA Index. The portfolio’s return also outperformed the 3.61% return of the average peer in its Lipper category.
During the past 12 months, we focused on mortgages that will maintain their yield in a wide variety of interest rate scenarios. The strategy has been to purchase GNMA mortgages with specifically defined geographic characteristics and smaller loan sizes. Our security selection in this sector of the market has helped performance in terms of price appreciation and a higher yield. In addition, because we anticipated a stable rate environment, we emphasized 30-year mortgages over 15-year instruments because of the yield advantage of longer-term issues. Going forward, we believe that the Fed will continue to raise short-term interest rates incrementally. If interest rates continue to be relatively stable, we expect to maintain our current strategy of emphasizing certain mortgage pool characteristics and longer-term mortgages.
Sean P. McCaffrey
William Chepolis
Co-Managers
Deutsche Investment Management Americas Inc.
Page 68 of 466
All performance shown is historical, assumes reinvestment of all dividends and capital gains, and does not guarantee future results. Investment return and principal value fluctuate with changing market conditions so that, when redeemed, shares may be worth more or less then their original cost. Current performance may be lower or higher than the performance data quoted. Please visit scudder.com for the product’s most recent month-end performance. Performance doesn’t reflect charges and fees (“contract charges”) associated with the separate account that invests in the portfolio or any variable life insurance policy or variable annuity contract for which the portfolio is an investment option. These charges and fees will reduce returns.
Risk Considerations
The government guarantee relates only to the prompt payment of principal and interest and does not remove market risks. Additionally, yields will fluctuate in response to changing interest rates and may be affected by the prepayment of mortgage-backed securities. Please read this portfolio’s prospectus for specific details regarding its investments and risk profile.
The Lehman Brothers GNMA Index is an unmanaged market-value-weighted measure of all fixed-rate securities backed by mortgage pools of the Government National Mortgage Association. Index returns assume reinvestment of dividends and, unlike Fund returns, do not reflect any fees or expenses. It is not possible to invest directly into an index.
Portfolio management market commentary is as of December 31, 2004, and may not come to pass. This information is subject to change at any time based on market and other conditions.
Portfolio Summary
Scudder Government & Agency Securities Portfolio
| | | | | | |
Asset Allocation
| | 12/31/04
| | | 12/31/03
| |
Agencies Backed by the Full Faith and Credit of the US Government (GNMA) | | 57 | % | | 62 | % |
Agencies Not Backed by the Full Faith and Credit of the US Government (FNMA, FHLMC) | | 21 | % | | 31 | % |
Cash Equivalents | | 18 | % | | 3 | % |
US Government Backed | | 4 | % | | 1 | % |
Repurchase Agreements | | — | | | 3 | % |
| | |
|
| |
|
|
| | | 100 | % | | 100 | % |
| | |
|
| |
|
|
| | | | | | |
Credit Quality
| | 12/31/04
| | | 12/31/03
| |
AAA | | 100 | % | | 100 | % |
| | |
|
| |
|
|
| | | | |
Interest Rate Sensitivity
| | 12/31/04
| | 12/31/03
|
Average Maturity | | 4.6 years | | 2.9 years |
Average Duration | | 2.6 years | | 2.6 years |
Page 69 of 466
Asset allocation, credit quality and interest rate sensitivity are subject to change.
The quality ratings represent the lower of Moody’s Investors Service, Inc. (“Moody’s”) or Standard & Poor’s Corporation (“S&P”) credit ratings. The ratings of Moody’s and S&P represent their opinions as to the quality of the securities they rate. Ratings are relative and subjective and are not absolute standards of quality.
The Fund’s credit quality does not remove market risk.
For more complete details about the Portfolio’s investment portfolio, see page 7. A quarterly Fact Sheet is available upon request. Information concerning portfolio holdings of the Portfolio as of month end will be posted to scudder.com on the 15th of the following month.
Following the Portfolio’s fiscal first and third quarter-end, a complete portfolio holdings listing is filed with the SEC on Form N-Q. The form will be available on the SEC’s Web site at www.sec.gov, and it also may be reviewed and copied at the SEC’s Public Reference Room in Washington, D.C. Information on the operation of the SEC’s Public Reference Room may be obtained by calling (800) SEC-0330.
Investment Portfolio December 31, 2004
Scudder Government & Agency Securities Portfolio
| | | | |
| | | Principal
Amount ($)
| | Value ($)
|
Agencies Backed by the Full Faith and Credit of the US Government 68.0% | | | | |
Government National Mortgage Association: | | | | |
4.5%, 8/15/2018 | | 3,026,940 | | 3,044,920 |
5.0% with various maturities from 7/15/2018 until 7/20/2034 (c) | | 38,372,263 | | 38,394,313 |
5.5% with various maturities from 12/15/2032 until 12/20/2034 (c) | | 83,284,492 | | 85,074,527 |
6.0% with various maturities from 5/15/2016 until 12/20/2034 (c) | | 50,128,635 | | 51,947,012 |
6.5% with various maturities from 3/15/2014 until 8/20/2034 (c) | | 27,649,702 | | 29,131,129 |
7.0% with various maturities from 4/15/2007 until 10/15/2032 | | 7,716,379 | | 8,200,573 |
7.5% with various maturities from 12/15/2013 until 7/15/2032 | | 5,852,419 | | 6,282,828 |
8.0% with various maturities from 12/15/2026 until 11/15/2031 | | 1,612,228 | | 1,750,673 |
8.5% with various maturities from 5/15/2016 until 12/15/2030 | | 204,983 | | 224,605 |
9.0%, 8/15/2027 | | 22,317 | | 25,170 |
9.5% with various maturities from 6/15/2013 until 12/15/2022 | | 73,681 | | 82,967 |
10.0% with various maturities from 2/15/2016 until 3/15/2016 | | 32,718 | | 36,327 |
| | | | |
|
Total Agencies Backed by the Full Faith and Credit of the US Government (Cost $222,211,883) | | | | 224,195,044 |
| | | | |
|
Agencies Not Backed by the Full Faith and Credit of the US Government 24.8% | | | | |
Federal Farm Credit Bank, 2.25%, 9/1/2006 | | 7,445,000 | | 7,333,846 |
Federal Home Loan Bank, Series 1, 3.25%, 12/17/2007 | | 15,000,000 | | 14,903,670 |
Federal Home Loan Mortgage Corp.: | | | | |
4.5%, 5/1/2019 | | 81,382 | | 81,161 |
5.0% with various maturities from 6/1/2033 until 6/1/2034 | | 5,704,506 | | 5,671,799 |
5.5% with various maturities from 2/1/2017 until 4/1/2034 | | 1,290,022 | | 1,313,147 |
6.0% with various maturities from 3/1/2017 until 11/1/2033 (c) | | 8,821,349 | | 9,120,822 |
6.5%, 9/1/2032 | | 342,357 | | 359,489 |
7.0% with various maturities from 5/1/2029 until 9/1/2032 | | 5,321,910 | | 5,640,651 |
Page 70 of 466
| | | | |
| | | Principal
Amount ($)
| | Value ($)
|
7.5% with various maturities from 1/1/2027 until 11/1/2033 | | 1,385,816 | | 1,484,792 |
8.0%, 11/1/2030 | | 11,325 | | 12,273 |
8.5%, 7/1/2030 | | 7,796 | | 8,485 |
Federal National Mortgage Association: | | | | |
5.0% with various maturities from 10/1/2019 until 10/1/2033 | | 6,149,849 | | 6,231,275 |
5.5% with various maturities from 1/1/2034 until 6/1/2034 | | 5,203,959 | | 5,286,216 |
6.0% with various maturities from 7/1/2016 until 9/1/2033 | | 3,878,105 | | 4,037,761 |
6.5% with various maturities from 9/1/2016 until 7/1/2034 (c) | | 7,484,421 | | 7,854,208 |
7.0% with various maturities from 9/1/2013 until 7/1/2034 | | 1,694,428 | | 1,795,572 |
7.5% with various maturities from 6/1/2015 until 3/1/2032 | | 3,701,670 | | 3,965,391 |
8.0%, 12/1/2024 | | 29,854 | | 32,496 |
Tennessee Valley Authority, 5.625%, 1/18/2011 | | 6,000,000 | | 6,445,968 |
| | | | |
|
Total Agencies Not Backed by the Full Faith and Credit of the US Government (Cost $81,555,644) | | | | 81,579,022 |
| | | | |
|
US Government Backed 4.9% | | | | |
US Treasury Bill, 1.813%*, 1/20/2005 (d) | | 165,000 | | 164,845 |
US Treasury Note, 4.25%, 8/15/2014 | | 15,825,000 | | 15,860,242 |
| | | | |
|
Total US Government Backed (Cost $15,957,730) | | | | 16,025,087 |
Collateralized Mortgage Obligations 0.1% | | | | |
| | | | |
|
Federal National Mortgage Association, “IN”, Series 2003-84, Interest Only, 4.5%, 4/25/2013 (Cost $356,191) | | 4,608,888 | | 330,973 |
| | | | |
|
Cash Equivalents 20.6% | | | | |
Scudder Cash Management QP Trust, 2.24% (b) (Cost $67,948,768) | | 67,948,768 | | 67,948,768 |
| | | | |
|
| | | | | | |
| | | % of Net Assets
| | | Value ($)
| |
Total Investment Portfolio (Cost $388,030,216) (a) | | 118.4 | | | 390,078,894 | |
| | | | | |
|
|
Other Assets and Liabilities, Net | | (18.4 | ) | | (60,509,199 | ) |
| | | | | |
|
|
Net Assets | | 100.0 | | | 329,569,695 | |
| | | | | |
|
|
Notes to Scudder Government & Agency Securities Portfolio of Investments
| * | Annualized yield at time of purchase; not a coupon rate. |
| (a) | The cost for federal income tax purposes was $388,052,593. At December 31, 2004, net unrealized appreciation for all securities based on tax cost was $2,026,301. This consisted of aggregate gross unrealized appreciation for all securities in which there was an excess of value over tax cost of $2,785,335 and aggregate gross unrealized depreciation for all securities in which there was an excess of tax cost over value of $759,034. |
| (b) | Scudder Cash Management QP Trust is managed by Deutsche Investment Management Americas Inc. The rate shown is the annualized seven-day yield at period end. |
| (c) | Mortgage dollar roll included. |
| (d) | At December 31, 2004, these securities have been segregated, in part or in whole, to cover initial margin requirements for open futures contracts. |
Page 71 of 466
At December 31, 2004, open futures contracts purchased were as follows:
| | | | | | | | | | |
Futures
| | Expiration
| | Contracts
| | Aggregate
Face Value ($)
| | Market
Value ($)
| | Net Unrealized Appreciation/ (Depreciation) ($)
|
10 year US Treasury Note | | 3/21/2005 | | 23 | | 2,558,062 | | 2,574,563 | | 16,501 |
At December 31, 2004, open futures contracts sold short were as follows:
| | | | | | | | | | | | | |
Futures
| | Expiration
| | Contracts
| | Aggregate
Face Value ($)
| | | Market
Value ($)
| | | Net Unrealized Appreciation/ (Depreciation) ($)
| |
2 year US Treasury Note | | 3/31/2005 | | 40 | | (8,399,213 | ) | | (8,383,750 | ) | | 15,463 | |
5 year US Treasury Note | | 3/21/2005 | | 85 | | (9,298,524 | ) | | (9,310,156 | ) | | (11,632 | ) |
| | | | | | | | | | | | |
|
|
Total net unrealized appreciation | | | | | | | | | | | | 3,831 | |
| | | | | | | | | | | | |
|
|
Included in the portfolio are investments in mortgage or asset-backed securities which are interests in separate pools of mortgages or assets. Effective maturities of these investments may be shorter than stated maturities due to prepayments. Some separate investments in the Federal National Mortgage Association, Government National Mortgage Association and Federal Home Loan Mortgage Corp. issues which have similar coupon rates have been aggregated for presentation purposes in the investment portfolio.
The accompanying notes are an integral part of the financial statements.
Financial Statements
Statement of Assets and Liabilities as of December 31, 2004
| | | |
Assets | | | |
Investments: | | | |
Investments in securities, at value (cost $320,081,448) | | $ | 322,130,126 |
Investment in Scudder Cash Management QP Trust (cost $67,948,768) | | | 67,948,768 |
| | |
|
|
Total investments in securities, at value (cost $388,030,216) | | | 390,078,894 |
| | |
|
|
Receivable for investments sold | | | 39,960,613 |
Interest receivable | | | 1,909,217 |
Receivable for Portfolio shares sold | | | 323,832 |
Other assets | | | 10,053 |
| | |
|
|
Total assets | | | 432,282,609 |
| | |
|
|
Liabilities | | | |
Payable for investments purchased | | | 30,127,633 |
Payable for when issued and forward delivery securities | | | 5,971,711 |
Payable for investments purchased — mortgage dollar rolls | | | 66,166,759 |
Deferred mortgage dollar roll income | | | 76,424 |
Payable for Portfolio shares redeemed | | | 86,162 |
Page 72 of 466
| | | |
Payable for daily variation margin on open futures contracts | | | 11,469 |
Accrued management fee | | | 156,889 |
Other accrued expenses and payables | | | 115,867 |
| | |
|
|
Total liabilities | | | 102,712,914 |
| | |
|
|
Net assets, at value | | $ | 329,569,695 |
| | |
|
|
Net Assets | | | |
Net assets consist of: | | | |
Undistributed net investment income | | | 10,896,663 |
Net unrealized appreciation (depreciation) on: | | | |
Investments | | | 2,048,678 |
Futures | | | 20,332 |
Accumulated net realized gain (loss) | | | 2,157,418 |
Paid-in capital | | | 314,446,604 |
| | |
|
|
Net assets, at value | | $ | 329,569,695 |
| | |
|
|
Class A | | | |
Net Asset Value, offering and redemption price per share ($280,091,543 ÷ 22,309,252 outstanding shares of beneficial interest, $.01 par value, unlimited number of shares authorized) | | $ | 12.55 |
| | |
|
|
Class B | | | |
Net Asset Value, offering and redemption price per share ($49,478,152 ÷ 3,952,379 outstanding shares of beneficial interest, $.01 par value, unlimited number of shares authorized) | | $ | 12.52 |
| | |
|
|
Statement of Operations for the year ended December 31, 2004
| | | | |
Investment Income | | | | |
Income: | | | | |
Interest | | $ | 12,383,702 | |
Interest — Scudder Cash Management QP Trust | | | 872,299 | |
Mortgage dollar roll income | | | 1,323,021 | |
Securities lending income, including income from Daily Assets Fund Institutional | | | 10,160 | |
Total Income | | | 14,589,182 | |
Expenses: | | | | |
Management fee | | | 1,908,304 | |
Custodian fees | | | 36,725 | |
Distribution service fees (Class B) | | | 112,953 | |
Record keeping fees (Class B) | | | 61,467 | |
Auditing | | | 58,595 | |
Legal | | | 26,856 | |
Trustees’ fees and expenses | | | 2,572 | |
Reports to shareholders | | | 76,696 | |
Other | | | 22,019 | |
Total expenses, before expense reductions | | | 2,306,187 | |
Expense reductions | | | (3,977 | ) |
Page 73 of 466
| | | | |
Total expenses, after expense reductions | | | 2,302,210 | |
| | |
|
|
|
Net investment income | | | 12,286,972 | |
| | |
|
|
|
Realized and Unrealized Gain (Loss) on Investment Transactions | | | | |
Net realized gain (loss) from: | | | | |
Investments | | | 1,710,270 | |
Futures | | | (144,216 | ) |
Net increase from payments by affiliates and net gains (losses) realized on the disposal of investments in violations of restrictions | | | — | |
| | | | 1,566,054 | |
Net unrealized appreciation (depreciation) during the period on: | | | (1,062,304 | ) |
Investments | | | | |
Futures | | | 1,329 | |
| | | | (1,060,975 | ) |
| | |
|
|
|
Net gain (loss) on investment transactions | | | 505,079 | |
| | |
|
|
|
Net increase (decrease) in net assets resulting from operations | | $ | 12,792,051 | |
| | |
|
|
|
The accompanying notes are an integral part of the financial statements.
Statement of Changes in Net Assets
| | | | | | | | |
| | | Years Ended December 31,
| |
Increase (Decrease) in Net Assets
| | 2004
| | | 2003
| |
Operations: | | | | | | | | |
Net investment income (loss) | | $ | 12,286,972 | | | $ | 12,142,038 | |
Net realized gain (loss) on investment transactions | | | 1,566,054 | | | | 469,040 | |
Net unrealized appreciation (depreciation) on investment transactions during the period | | | (1,060,975 | ) | | | (3,359,459 | ) |
Net increase (decrease) in net assets resulting from operations | | | 12,792,051 | | | | 9,251,619 | |
Distributions to shareholders from: | | | | | | | | |
Net investment income | | | | | | | | |
Class A | | | (8,701,916 | ) | | | (14,733,066 | ) |
Class B | | | (986,391 | ) | | | (755,455 | ) |
Net realized gains | | | | | | | | |
Class A | | | (2,734,888 | ) | | | (9,005,857 | ) |
Class B | | | (359,519 | ) | | | (509,269 | ) |
Portfolio share transactions: | | | | | | | | |
| | |
Class A | | | | | | | | |
Proceeds from shares sold | | | 20,190,555 | | | | 45,404,708 | |
Reinvestment of distributions | | | 11,436,803 | | | | 23,738,923 | |
Page 74 of 466
| | | | | | | | |
Cost of shares redeemed | | | (97,935,807 | ) | | | (259,047,177 | ) |
Net increase (decrease) in net assets from Class A share transactions | | | (66,308,449 | ) | | | (189,903,546 | ) |
| | |
Class B | | | | | | | | |
Proceeds from shares sold | | | 23,191,368 | | | | 71,406,944 | |
Reinvestment of distributions | | | 1,345,911 | | | | 1,264,724 | |
Cost of shares redeemed | | | (13,460,654 | ) | | | (36,011,827 | ) |
Net increase (decrease) in net assets from Class B share transactions | | | 11,076,625 | | | | 36,659,841 | |
Increase (decrease) in net assets | | | (55,222,487 | ) | | | (168,995,733 | ) |
Net assets at beginning of period | | | 384,792,182 | | | | 553,787,915 | |
| | |
|
|
| |
|
|
|
Net assets at end of period (including undistributed net investment income of $10,896,663 and $9,445,556, respectively) | | $ | 329,569,695 | | | $ | 384,792,182 | |
| | |
|
|
| |
|
|
|
Other Information | | | | | | | | |
| | |
Class A | | | | | | | | |
Shares outstanding at beginning of period | | | 27,631,433 | | | | 42,918,597 | |
Shares sold | | | 1,635,527 | | | | 3,576,998 | |
Shares issued to shareholders in reinvestment of distributions | | | 932,855 | | | | 1,917,523 | |
Shares redeemed | | | (7,890,563 | ) | | | (20,781,685 | ) |
Net increase (decrease) in Portfolio shares | | | (5,322,181 | ) | | | (15,287,164 | ) |
| | |
|
|
| |
|
|
|
Shares outstanding at end of period | | | 22,309,252 | | | | 27,631,433 | |
| | |
|
|
| |
|
|
|
| | |
Class B | | | | | | | | |
Shares outstanding at beginning of period | | | 3,055,787 | | | | 216,015 | |
Shares sold | | | 1,876,522 | | | | 5,681,579 | |
Shares issued to shareholders in reinvestment of distributions | | | 109,781 | | | | 102,159 | |
Shares redeemed | | | (1,089,711 | ) | | | (2,943,966 | ) |
Net increase (decrease) in Portfolio shares | | | 896,592 | | | | 2,839,772 | |
| | |
|
|
| |
|
|
|
Shares outstanding at end of period | | | 3,952,379 | | | | 3,055,787 | |
| | |
|
|
| |
|
|
|
The accompanying notes are an integral part of the financial statements.
Financial Highlights
Class A
| | | | | | | | | | | | | | | | |
Years Ended December 31,
| | 2004
| | 2003
| | | 2002
| | 2001a
| | 2000b
|
Selected Per Share Data | | | | | | | | | | | | | | | | |
Net asset value, beginning of period | | $ | 12.54 | | $ | 12.84 | | | $ | 12.32 | | $ | 11.96 | | $ | 11.56 |
| | |
|
| |
|
|
| |
|
| |
|
| |
|
|
Income from investment operations: | | | | | | | | | | | | | | | | |
Net investment incomec | | | .44 | | | .31 | | | | .62 | | | .61 | | | .75 |
Net realized and unrealized gain (loss) on investment transactions | | | .03 | | | (.04 | ) | | | .35 | | | .25 | | | .45 |
| | |
|
| |
|
|
| |
|
| |
|
| |
|
|
Total from investment operations | | | .47 | | | .27 | | | | .97 | | | .86 | | | 1.20 |
| | |
|
| |
|
|
| |
|
| |
|
| |
|
|
Page 75 of 466
| | | | | | | | | | | | | | | | | | | | |
Less distributions from: | | | | | | | | | | | | | | | | | | | | |
Net investment income | | | (.35 | ) | | | (.35 | ) | | | (.45 | ) | | | (.50 | ) | | | (.80 | ) |
Net realized gain on investment transactions | | | (.11 | ) | | | (.22 | ) | | | — | | | | — | | | | — | |
Total distributions | | | (.46 | ) | | | (.57 | ) | | | (.45 | ) | | | (.50 | ) | | | (.80 | ) |
| | |
|
|
| |
|
|
| |
|
|
| |
|
|
| |
|
|
|
Net asset value, end of period | | $ | 12.55 | | | $ | 12.54 | | | $ | 12.84 | | | $ | 12.32 | | | $ | 11.96 | |
| | |
|
|
| |
|
|
| |
|
|
| |
|
|
| |
|
|
|
Total Return (%) | | | 3.75 | e | | | 2.26 | | | | 8.05 | | | | 7.48 | | | | 10.93 | |
Ratios to Average Net Assets and Supplemental Data | | | | | | | | | | | | | | | | | | | | |
Net assets, end of period ($ millions) | | | 280 | | | | 347 | | | | 551 | | | | 305 | | | | 152 | |
Ratio of expenses (%) | | | .61 | | | | .61 | | | | .59 | | | | .60 | | | | .61 | |
Ratio of net investment income (loss) (%) | | | 3.59 | | | | 2.50 | | | | 4.96 | | | | 5.06 | | | | 6.60 | |
Portfolio turnover rate (%) | | | 226 | d | | | 511 | d | | | 534 | d | | | 334 | | | | 173 | |
| a | As required, effective January 1, 2001, the Portfolio has adopted the provisions of the AICPA Audit and Accounting Guide for Investment Companies and began amortizing premium on debt securities. In addition, gain/losses on paydowns on mortgage-backed securities which were included in realized gain/loss on investment transactions prior to January 1, 2001 are included as interest income. The effect of this change for the year ended December 31, 2001 was to decrease net investment income per share by $.08, increase net realized and unrealized gains and losses per share by $.08 and decrease the ratio of net investment income to average net assets from 5.67% to 5.06%. Per share, ratios and supplemental data for periods prior to January 1, 2001 have not been restated to reflect this change in presentation. |
| b | On June 18, 2001, the Portfolio implemented a 1 for 10 reverse stock split. Per share information, for the periods prior to December 31, 2001, has been restated to reflect the effect of the split. Shareholders received 1 share for every 10 shares owned and net asset value per share increased correspondingly. |
| c | Based on average shares outstanding during the period. |
| d | The portfolio turnover rate including mortgage dollar roll transactions was 391%, 536% and 651% for the periods ended December 31, 2004, December 31, 2003 and December 31, 2002, respectively. |
| e | Reimbursement of $2,420 due to disposal of investments in violation of restrictions had no effect on total return. |
Class B
| | | | | | | | | | | | |
Years Ended December 31,
| | 2004
| | | 2003
| | | 2002a
| |
Selected Per Share Data | | | | | | | | | | | | |
Net asset value, beginning of period | | $ | 12.51 | | | $ | 12.82 | | | $ | 12.36 | |
| | |
|
|
| |
|
|
| |
|
|
|
Income from investment operations: | | | | | | | | | | | | |
Net investment incomeb | | | .40 | | | | .27 | | | | .31 | |
Net realized and unrealized gain (loss) on investment transactions | | | .02 | | | | (.04 | ) | | | .15 | |
Total from investment operations | | | .42 | | | | .23 | | | | .46 | |
Less distributions from: | | | | | | | | | | | | |
Net investment income | | | (.30 | ) | | | (.32 | ) | | | — | |
Net realized gains on investment transactions | | | (.11 | ) | | | (.22 | ) | | | — | |
Total distributions | | | (.41 | ) | | | (.54 | ) | | | — | |
| | |
|
|
| |
|
|
| |
|
|
|
Net asset value, end of period | | $ | 12.52 | | | $ | 12.51 | | | $ | 12.82 | |
| | |
|
|
| |
|
|
| |
|
|
|
Total Return (%) | | | 3.36 | d | | | 1.83 | | | | 3.72 | ** |
Ratios to Average Net Assets and Supplemental Data | | | | | | | | | | | | |
Net assets, end of period ($ millions) | | | 49 | | | | 38 | | | | 3 | |
Ratio of expenses (%) | | | 1.00 | | | | .98 | | | | .84 | * |
Ratio of net investment income (loss) (%) | | | 3.21 | | | | 2.13 | | | | 4.95 | * |
Portfolio turnover rate (%) | | | 226 | c | | | 511 | c | | | 534 | c |
| a | For the period July 1, 2002 (commencement of operations of Class B shares) to December 31, 2002. |
Page 76 of 466
| b | Based on average shares outstanding during the period. |
| c | The portfolio turnover rate including mortgage dollar roll transactions was 391%, 536% and 651% for the periods ended December 31, 2004, December 31, 2003 and December 31, 2002, respectively. |
| d | Reimbursement of $2,420 due to disposal of investments in violation of restrictions had no effect on total return. |
Performance Summary December 31, 2004
Scudder Growth Portfolio
All performance shown is historical, assumes reinvestment of all dividends and capital gains, and does not guarantee future results. Investment return and principal value fluctuate with changing market conditions so that, when redeemed, shares may be worth more or less then their original cost. Current performance may be lower or higher than the performance data quoted. Please visit scudder.com for the product’s most recent month-end performance. Performance doesn’t reflect charges and fees (“contract charges”) associated with the separate account that invests in the Portfolio or any variable life insurance policy or variable annuity contract for which the Portfolio is an investment option. These charges and fees will reduce returns.
This Portfolio is subject to stock market risk, meaning stocks in the Portfolio may decline in value for extended periods of time due to the activities and financial prospects of individual companies, or due to general market and economic conditions. Please read this Portfolio’s prospectus for specific details regarding its investments and risk profile.
| | |
| Growth of an Assumed $10,000 Investment in Scudder Growth Portfolio from 12/31/1994 to 12/31/2004 |
|
¨ Scudder Growth Portfolio — Class A ¨ Russell 1000 Growth Index |
| |
 | | The Russell 1000 Growth Index is an unmanaged index composed of common stock of larger US companies with higher price -to-book ratios and higher forecasted growth values. Index returns assume reinvested dividends and, unlike Portfolio returns, do not reflect any fees or expenses. It is not possible to invest directly into an index. |
Yearly periods ended December 31
Comparative Results
| | | | | | | | | | | | | | | | | | |
Scudder Growth Portfolio
| | | | 1-Year
| | | 3-Year
| | | 5-Year
| | | 10-Year
| |
Class A | | Growth of $10,000 | | $ | 10,514 | | | $ | 9,257 | | | $ | 5,819 | | | $ | 18,023 | |
| | | Average annual total return | | | 5.14 | % | | | -2.54 | % | | | -10.26 | % | | | 6.07 | % |
Russell 1000 Growth Index | | Growth of $10,000 | | $ | 10,630 | | | $ | 9,946 | | | $ | 6,140 | | | $ | 24,994 | |
| | | Average annual total return | | | 6.30 | % | | | -.18 | % | | | -9.29 | % | | | 9.59 | % |
| | | | | |
Scudder Growth Portfolio
| | | | | | | | | | 1-Year
| | | Life of Class*
| |
Class B | | Growth of $10,000 | | | | | | | | | | $ | 10,477 | | | $ | 12,039 | |
| | | Average annual total return | | | | | | | | | | | 4.77 | % | | | 7.70 | % |
Russell 1000 Growth Index | | Growth of $10,000 | | | | | | | | | | $ | 10,630 | | | $ | 12,555 | |
| | | Average annual total return | | | | | | | | | | | 6.30 | % | | | 9.53 | % |
The growth of $10,000 is cumulative.
| * | The Portfolio commenced offering Class B shares on July 1, 2002. Index returns begin June 30, 2002. |
Page 77 of 466
Information About Your Portfolio’s Expenses
Scudder Growth Portfolio
As an investor of the Portfolio, you incur two types of costs: ongoing expenses and transaction costs. Ongoing expenses include management fees, distribution and service (12b-1) fees and other Portfolio expenses. Examples of transaction costs include sales charges (loads), redemption fees and account maintenance fees, which are not shown in this section. The following tables are intended to help you understand your ongoing expenses (in dollars) of investing in the Portfolio and to help you compare these expenses with the ongoing expenses of investing in other mutual funds. In the most recent six-month period, the Portfolio limited these expenses; had it not done so, expenses would have been higher. The tables are based on an investment of $1,000 made at the beginning of the six-month period ended December 31, 2004.
The tables illustrate your Portfolio’s expenses in two ways:
Actual Portfolio Return. This helps you estimate the actual dollar amount of ongoing expenses (but not transaction costs) paid on a $1,000 investment in the Portfolio using the Portfolio’s actual return during the period. To estimate the expenses you paid over the period, simply divide your account value by $1,000 (for example, an $8,600 account value divided by $1,000 = 8.6), then multiply the result by the number in the “Expenses Paid per $1,000” line under the share class you hold.
Hypothetical 5% Portfolio Return. This helps you to compare your Portfolio’s ongoing expenses (but not transaction costs) with those of other mutual funds using the Portfolio’s actual expense ratio and a hypothetical rate of return of 5% per year before expenses. Examples using a 5% hypothetical Portfolio return may be found in the shareholder reports of other mutual funds. The hypothetical account values and expenses may not be used to estimate the actual ending account balance or expenses you paid for the period.
Please note that the expenses shown in these tables are meant to highlight your ongoing expenses only and do not reflect any transaction costs. The “Expenses Paid per $1,000” line of the tables is useful in comparing ongoing expenses only and will not help you determine the relative total expense of owning different funds. If these transaction costs had been included, your costs would have been higher.
Expenses and Value of a $1,000 Investment for the six months ended December 31, 2004
| | | | | | |
Actual Portfolio Return
| | Class A
| | Class B
|
Beginning Account Value 7/1/04 | | $ | 1,000.00 | | $ | 1,000.00 |
Ending Account Value 12/31/04 | | $ | 1,030.80 | | $ | 1,029.30 |
Expenses Paid per $1,000* | | $ | 3.28 | | $ | 5.17 |
| | |
Hypothetical 5% Portfolio Return
| | Class A
| | Class B
|
Beginning Account Value 7/1/04 | | $ | 1,000.00 | | $ | 1,000.00 |
Ending Account Value 12/31/04 | | $ | 1,021.77 | | $ | 1,020.11 |
Expenses Paid per $1,000* | | $ | 3.27 | | $ | 5.15 |
| * | Expenses are equal to the Portfolio’s annualized expense ratio for each share class, multiplied by the average account value over the period, multiplied by the number of days in the most recent six-month period, then divided by 365. |
Page 78 of 466
| | | | | | |
Annualized Expense Ratios
| | Class A
| | | Class B
| |
Scudder Variable Series II — Scudder Growth Portfolio | | .64 | % | | 1.01 | % |
For more information, please refer to the Portfolio’s prospectus.
Management Summary December 31, 2004
Scudder Growth Portfolio
While equity market performance in general was positive in 2004, substantial performance disparities existed between investment styles and market capitializations. Small caps outperformed large cap as the 18.33% advance of the Russell 2000 Index outpaced the 10.88% gain of the S&P 500 index. In terms of investment style, the 6.30% annual return of the Russell 1000 Growth Index significantly trailed the 16.49% advance of the Russell 1000 Value Index, marking the fifth consecutive year that value outperformed growth.
The Scudder Growth Portfolio’s return of 5.14% (Class A shares, unadjusted for contract charges) underperformed its benchmark, the Russell 1000 Growth Index in the year ended December 31, 2004 as positioning in the Information Technology and Consumer Discretionary sectors detracted from relative performance. As 2004 progressed, we reduced the portfolio’s cyclical exposure and emphasized more consistent earners in anticipation of slowing profit growth. This strategy proved successful for most of 2004. In the fourth quarter however, as the presidential election was decided and oil prices declined from near-record highs, investor optimism grew. This optimism led to a sharp rebound in the more cyclical, volatile sectors of the market. The Scudder Growth Portfolio, therefore, underperformed in the fourth quarter and the outperformance we had enjoyed through the first three quarters of the year was negated.
In a continued example of adding value through top-down sector allocation, the portfolio’s overweight in the Energy sector remained in place throughout 2004 and proved to be extremely additive to annual performance. While oil prices remain volatile, our investment thesis is focused on the long-term growth opportunities created by a chronic underinvestment in the exploration and production of new reserves.
Our investment philosophy is unchanged as we maintain our belief that a diversified portfolio of high-quality large-cap growth stocks will outperform over longer time periods. Therefore, we continue to seek out and find companies that reconcile well with our key selection criteria of quality, growth and innovation.
Julie M. Van Cleave
Jack A. Zehner
Thomas J. Schmid
Co-Managers
Deutsche Investment Management Americas Inc.
Page 79 of 466
All performance shown is historical, assumes reinvestment of all dividends and capital gains, and does not guarantee future results. Investment return and principal value fluctuate with changing market conditions so that, when redeemed, shares may be worth more or less then their original cost. Current performance may be lower or higher than the performance data quoted. Please visit scudder.com for the product’s most recent month-end performance. Performance doesn’t reflect charges and fees (“contract charges”) associated with the separate account that invests in the portfolio or any variable life insurance policy or variable annuity contract for which the portfolio is an investment option. These charges and fees will reduce returns.
Risk Considerations
This portfolio is subject to stock market risk, meaning stocks in the portfolio may decline in value for extended periods of time due to the activities and financial prospects of individual companies, or due to general market and economic conditions. Please read this portfolio’s prospectus for specific details regarding its investments and risk profile.
The Russell 1000 Growth Index is an unmanaged index composed of common stock of larger US companies with higher price -to-book ratios and higher forecasted growth values. Index returns assume reinvested dividends and, unlike Portfolio returns, do not reflect any fees or expenses. It is not possible to invest directly into an index.
Portfolio management market commentary is as of December 31, 2004, and may not come to pass. This information is subject to change at any time based on market and other conditions.
Portfolio Summary
Scudder Growth Portfolio
| | | | | | |
Asset Allocation (Excludes Securities Lending Collateral)
| | 12/31/04
| | | 12/31/03
| |
Common Stocks | | 97 | % | | 99 | % |
Exchange Traded Funds | | 1 | % | | — | |
Cash Equivalents | | 2 | % | | 1 | % |
| | |
|
| |
|
|
| | | 100 | % | | 100 | % |
| | |
|
| |
|
|
| | | | | | |
Sector Diversification (Excludes Cash Equivalents and Securities Lending Collateral)
| | 12/31/04
| | | 12/31/03
| |
Information Technology | | 24 | % | | 30 | % |
Health Care | | 23 | % | | 20 | % |
Consumer Discretionary | | 15 | % | | 16 | % |
Consumer Staples | | 12 | % | | 12 | % |
Industrials | | 9 | % | | 8 | % |
Energy | | 9 | % | | 5 | % |
Financials | | 7 | % | | 8 | % |
Materials | | 1 | % | | 1 | % |
| | |
|
| |
|
|
| | | 100 | % | | 100 | % |
| | |
|
| |
|
|
Asset allocation and sector diversification are subject to change.
Page 80 of 466
For more complete details about the Portfolio’s investment portfolio, see page 17. A quarterly Fact Sheet is available upon request. Information concerning portfolio holdings of the Portfolio as of month end will be posted to scudder.com on the 15th of the following month.
Following the Portfolio’s fiscal first and third quarter-end, a complete portfolio holdings listing is filed with the SEC on Form N-Q. The form will be available on the SEC’s Web site at www.sec.gov, and it also may be reviewed and copied at the SEC’s Public Reference Room in Washington, D.C. Information on the operation of the SEC’s Public Reference Room may be obtained by calling (800) SEC-0330.
| | |
| Investment Portfolio December 31, 2004 | | |
Scudder Growth Portfolio
| | | | |
| | | Shares
| | Value ($)
|
Common Stocks 97.9% | | | | |
Consumer Discretionary 14.3% | | | | |
Automobiles 1.6% | | | | |
Harley-Davidson, Inc. | | 82,900 | | 5,036,175 |
| | | | |
|
Hotels Restaurants & Leisure 1.5% | | | | |
International Game Technology | | 105,800 | | 3,637,404 |
YUM! Brands, Inc. | | 17,800 | | 839,804 |
| | | | |
|
| | | | | 4,477,208 |
| | | | |
|
Household Durables 0.3% | | | | |
Fortune Brands, Inc. | | 13,400 | | 1,034,212 |
| | | | |
|
Internet & Catalog Retail 1.2% | | | | |
eBay, Inc.* | | 30,800 | | 3,581,424 |
| | | | |
|
Media 3.8% | | | | |
Comcast Corp. “A”* | | 74,000 | | 2,430,160 |
McGraw-Hill Companies, Inc. | | 18,800 | | 1,720,952 |
Omnicom Group, Inc. | | 57,440 | | 4,843,341 |
Viacom, Inc. “B” | | 76,230 | | 2,774,010 |
| | | | |
|
| | | | | 11,768,463 |
| | | | |
|
Multiline Retail 2.7% | | | | |
Kohl’s Corp.* | | 33,700 | | 1,657,029 |
Target Corp. | | 125,400 | | 6,512,022 |
| | | | |
|
| | | | | 8,169,051 |
| | | | |
|
Specialty Retail 3.2% | | | | |
Bed Bath & Beyond, Inc.* | | 56,500 | | 2,250,395 |
Home Depot, Inc. | | 41,900 | | 1,790,806 |
Lowe’s Companies, Inc. | | 32,100 | | 1,848,639 |
Staples, Inc. | | 116,900 | | 3,940,699 |
| | | | |
|
| | | | | 9,830,539 |
| | | | |
|
Page 81 of 466
| | | | |
Consumer Staples 11.5% | | | | |
Beverages 2.2% | | | | |
PepsiCo, Inc. | | 127,450 | | 6,652,890 |
| | | | |
|
Food & Drug Retailing 4.3% | | | | |
Wal-Mart Stores, Inc. | | 162,990 | | 8,609,132 |
Walgreen Co. | | 119,700 | | 4,592,889 |
| | | | |
|
| | | | | 13,202,021 |
| | | | |
|
Food Products 1.5% | | | | |
Dean Foods Co.* | | 40,200 | | 1,324,590 |
Hershey Foods Corp. | | 34,900 | | 1,938,346 |
Kellogg Co. | | 33,900 | | 1,513,974 |
| | | | |
|
| | | | | 4,776,910 |
| | | | |
|
Household Products 3.5% | | | | |
Colgate-Palmolive Co. | | 42,840 | | 2,191,694 |
Kimberly-Clark Corp. | | 22,900 | | 1,507,049 |
Procter & Gamble Co. | | 125,700 | | 6,923,556 |
| | | | |
|
| | | | | 10,622,299 |
| | | | |
|
Energy 8.7% | | | | |
Energy Equipment & Services 4.1% | | | | |
Baker Hughes, Inc. | | 83,900 | | 3,580,013 |
Nabors Industries Ltd.* | | 64,300 | | 3,297,947 |
Schlumberger Ltd. | | 58,800 | | 3,936,660 |
| | |
| | | Shares
| | Value ($)
|
Transocean, Inc.* | | 38,900 | | 1,648,971 |
| | | | |
|
| | | | | 12,463,591 |
| | | | |
|
Oil & Gas 4.6% | | | | |
ConocoPhillips | | 38,700 | | 3,360,321 |
Devon Energy Corp. | | 98,600 | | 3,837,512 |
EOG Resources, Inc. | | 98,000 | | 6,993,280 |
| | | | |
|
| | | | | 14,191,113 |
| | | | |
|
Financials 7.1% | | | | |
Capital Markets 2.2% | | | | |
Goldman Sachs Group, Inc. | | 14,600 | | 1,518,984 |
Lehman Brothers Holdings, Inc. | | 23,100 | | 2,020,788 |
Morgan Stanley | | 55,400 | | 3,075,808 |
| | | | |
|
| | | | | 6,615,580 |
| | | | |
|
Consumer Finance 1.6% | | | | |
American Express Co. | | 87,900 | | 4,954,923 |
| | | | |
|
Diversified Financial Services 1.4% | | | | |
Citigroup, Inc. | | 91,200 | | 4,394,016 |
| | | | |
|
Insurance 1.9% | | | | |
AFLAC, Inc. | | 72,400 | | 2,884,416 |
American International Group, Inc. | | 43,810 | | 2,877,003 |
| | | | |
|
| | | | | 5,761,419 |
| | | | |
|
Page 82 of 466
| | | | |
Health Care 22.1% | | | | |
Biotechnology 5.6% | | | | |
Amgen, Inc.* | | 74,800 | | 4,798,420 |
Biogen Idec, Inc.* | | 55,700 | | 3,710,177 |
Genentech, Inc.* | | 86,000 | | 4,681,840 |
Gilead Sciences, Inc.* | | 111,100 | | 3,887,389 |
| | | | |
|
| | | | | 17,077,826 |
| | | | |
|
Health Care Equipment & Supplies 6.0% | | | | |
Baxter International, Inc. | | 69,900 | | 2,414,346 |
Boston Scientific Corp.* | | 82,300 | | 2,925,765 |
C.R. Bard, Inc. | | 39,800 | | 2,546,404 |
Medtronic, Inc. | | 108,200 | | 5,374,294 |
Zimmer Holdings, Inc.* | | 65,300 | | 5,231,836 |
| | | | |
|
| | | | | 18,492,645 |
| | | | |
|
Health Care Providers & Services 1.9% | | | | |
UnitedHealth Group, Inc. | | 66,600 | | 5,862,798 |
| | | | |
|
Pharmaceuticals 8.6% | | | | |
Abbott Laboratories | | 53,300 | | 2,486,445 |
Eli Lilly & Co. | | 32,000 | | 1,816,000 |
Johnson & Johnson | | 179,586 | | 11,389,344 |
Pfizer, Inc. | | 242,702 | | 6,526,257 |
Teva Pharmaceutical Industries Ltd. (ADR) | | 139,800 | | 4,174,428 |
| | | | |
|
| | | | | 26,392,474 |
| | | | |
|
Industrials 9.3% | | | | |
Aerospace & Defense 2.1% | | | | |
United Technologies Corp. | | 61,600 | | 6,366,360 |
| | | | |
|
Air Freight & Logistics 1.6% | | | | |
FedEx Corp. | | 51,400 | | 5,062,386 |
| | | | |
|
| | |
| | | Shares
| | Value ($)
|
Industrial Conglomerates 5.0% | | | | |
3M Co. | | 37,000 | | 3,036,590 |
General Electric Co. | | 334,940 | | 12,225,310 |
| | | | |
|
| | | | | 15,261,900 |
| | | | |
|
Machinery 0.6% | | | | |
Caterpillar, Inc. | | 17,900 | | 1,745,429 |
| | | | |
|
Information Technology 24.0% | | | | |
Communications Equipment 3.8% | | | | |
Cisco Systems, Inc.* | | 365,420 | | 7,052,606 |
QUALCOMM, Inc. | | 109,400 | | 4,638,560 |
| | | | |
|
| | | | | 11,691,166 |
| | | | |
|
Computers & Peripherals 4.3% | | | | |
Dell, Inc.* | | 60,400 | | 2,545,256 |
EMC Corp.* | | 385,700 | | 5,735,359 |
International Business Machines Corp. | | 50,000 | | 4,929,000 |
| | | | |
|
| | | | | 13,209,615 |
| | | | |
|
Page 83 of 466
| | | | |
IT Consulting & Services 3.3% | | | | |
Accenture Ltd. “A”* | | 105,200 | | 2,840,400 |
Fiserv, Inc.* | | 86,000 | | 3,456,340 |
Paychex, Inc. | | 106,300 | | 3,622,704 |
| | | | |
|
| | | | | 9,919,444 |
| | | | |
|
Semiconductors & Semiconductor Equipment 4.5% | | | | |
Intel Corp. | | 331,740 | | 7,759,398 |
Linear Technology Corp. | | 91,230 | | 3,536,075 |
Texas Instruments, Inc. | | 99,400 | | 2,447,228 |
| | | | |
|
| | | | | 13,742,701 |
| | | | |
|
Software 8.1% | | | | |
Adobe Systems, Inc. | | 15,000 | | 941,100 |
Electronic Arts, Inc.* (c) | | 74,200 | | 4,576,656 |
| | |
| | | Shares
| | Value ($)
|
Intuit, Inc.* | | 43,700 | | 1,923,237 |
Microsoft Corp. | | 457,480 | | 12,219,290 |
Oracle Corp.* | | 184,000 | | 2,524,480 |
Symantec Corp.* | | 104,000 | | 2,679,040 |
| | | | |
|
| | | | | 24,863,803 |
| | | | |
|
Materials 0.9% | | | | |
| | |
Chemicals | | | | |
Ecolab, Inc. | | 76,000 | | 2,669,880 |
| | | | |
|
Total Common Stocks (Cost $229,803,236) | | | | 299,890,261 |
| | | | |
|
Exchange Traded Funds 0.9% | | | | |
iShares Nasdaq Biotechnology Index Fund* (c) | | 18,400 | | 1,387,360 |
Semiconductor HOLDRs Trust | | 44,600 | | 1,487,856 |
| | | | |
|
Total Exchange Traded Funds (Cost $3,020,966) | | | | 2,875,216 |
| | | | |
|
Securities Lending Collateral 1.5% | | | | |
Daily Assets Fund Institutional, 2.25% (d) (e) (Cost $4,617,400) | | 4,617,400 | | 4,617,400 |
| | | | |
|
Cash Equivalents 1.9% | | | | |
Scudder Cash Management QP Trust, 2.24% (b) (Cost $5,958,356) | | 5,958,356 | | 5,958,356 |
| | | | |
|
| | | | | | |
| | | % of Net Assets
| | | Value ($)
| |
Total Investment Portfolio (Cost $243,399,958) (a) | | 102.2 | �� | | 313,341,233 | |
| | | | | |
|
|
Other Assets and Liabilities, Net | | (2.2 | ) | | (6,861,289 | ) |
| | | | | |
|
|
Net Assets | | 100.0 | | | 306,479,944 | |
| | | | | |
|
|
Notes to Scudder Growth Portfolio of Investments
| * | Non-income producing security. |
| (a) | The cost for federal income tax purposes was $245,015,726. At December 31, 2004, net unrealized appreciation for all securities based on tax cost was $68,325,507. This consisted of aggregate gross unrealized appreciation for all securities in which there was an excess of value over tax cost of $70,905,457 and aggregate gross unrealized depreciation for all securities in which there was an excess of tax cost over value of $2,579,950. |
Page 84 of 466
| (b) | Scudder Cash Management QP Trust is managed by Deutsche Investment Management Americas Inc. The rate shown is the annualized seven-day yield at period end. |
| (c) | All or a portion of these securities were on loan (see Notes to Financial Statements). The value of all securities loaned at December 31, 2004 amounted to $4,479,075, which is 1.5% of net assets. |
| (d) | Daily Assets Fund Institutional, an affiliated fund, is managed by Deutsche Asset Management, Inc. The rate shown is the annualized seven-day yield at period end. |
| (e) | Represents collateral held in connection with securities lending. |
ADR: American Depositary Receipts.
HOLDRs: Holding Company Depositary Receipts
The accompanying notes are an integral part of the financial statements.
Financial Statements
Statement of Assets and Liabilities as of December 31, 2004
| | | | |
Assets | | | | |
Investments: | | | | |
Investments in securities, at value (cost $232,824,202) — including $4,479,075 of securities loaned | | $ | 302,765,477 | |
Investments in Daily Assets Fund Institutional (cost $4,617,400)* | | | 4,617,400 | |
Investment in Scudder Cash Management QP Trust (cost $5,958,356) | | | 5,958,356 | |
Total investments in securities, at value (cost $243,399,958) | | | 313,341,233 | |
Cash | | | 153 | |
Dividends receivable | | | 236,859 | |
Interest receivable | | | 12,072 | |
Receivable for Portfolio shares sold | | | 348,923 | |
Other assets | | | 16,835 | |
| | |
|
|
|
Total assets | | | 313,956,075 | |
| | |
|
|
|
Liabilities | | | | |
Payable for Portfolio shares redeemed | | | 2,634,253 | |
Payable upon return of securities loaned | | | 4,617,400 | |
Accrued management fee | | | 156,458 | |
Other accrued expenses and payables | | | 68,020 | |
Total liabilities | | | 7,476,131 | |
| | |
|
|
|
Net assets, at value | | $ | 306,479,944 | |
| | |
|
|
|
Net Assets | | | | |
Net assets consist of: | | | | |
Undistributed net investment income | | | 2,081,479 | |
Net unrealized appreciation (depreciation) on investments | | | 69,941,275 | |
Accumulated net realized gain (loss) | | | (162,361,013 | ) |
Paid-in capital | | | 396,818,203 | |
| | |
|
|
|
Net assets, at value | | $ | 306,479,944 | |
| | |
|
|
|
Class A | | | | |
Net Asset Value, offering and redemption price per share ($290,395,910 ÷ 14,958,026 outstanding shares of beneficial interest, $.01 par value, unlimited number of shares authorized) | | $ | 19.41 | |
| | |
|
|
|
Class B | | | | |
Net Asset Value, offering and redemption price per share ($16,084,034 ÷ 832,962 outstanding shares of beneficial interest, $.01 par value, unlimited number of shares authorized) | | $ | 19.31 | |
| | |
|
|
|
| * | Represents collateral on securities loaned. |
Page 85 of 466
Statement of Operations for the year ended December 31, 2004
| | | | |
Investment Income | | | | |
Income: | | | | |
Dividends (net of foreign taxes withheld of $7,592) | | $ | 4,162,057 | |
Interest — Scudder Cash Management QP Trust | | | 73,263 | |
Securities lending income, including income from Daily Assets Fund Institutional | | | 3,559 | |
| | |
|
|
|
Total Income | | | 4,238,879 | |
| | |
|
|
|
Expenses: | | | | |
Management fee | | | 1,842,117 | |
Custodian fees | | | 16,638 | |
Distribution service fees (Class B) | | | 29,642 | |
Record keeping fees (Class B) | | | 14,980 | |
Auditing | | | 41,460 | |
Legal | | | 18,398 | |
Trustees’ fees and expenses | | | 4,785 | |
Reports to shareholders | | | 64,805 | |
Other | | | 6,451 | |
Total expenses, before expense reductions | | | 2,039,276 | |
Expense reductions | | | (3,043 | ) |
Total expenses, after expense reductions | | | 2,036,233 | |
| | |
|
|
|
Net investment income (loss) | | | 2,202,646 | |
| | |
|
|
|
Realized and Unrealized Gain (Loss) on Investment Transactions | |
Net realized gain (loss) from investments | | | (2,112,683 | ) |
Net unrealized appreciation (depreciation) during the period on investments | | | 15,006,327 | |
| | |
|
|
|
Net gain (loss) on investment transactions | | | 12,893,644 | |
| | |
|
|
|
Net increase (decrease) in net assets resulting from operations | | $ | 15,096,290 | |
| | |
|
|
|
The accompanying notes are an integral part of the financial statements.
Page 86 of 466
Statement of Changes in Net Assets
| | | | | | | | |
| |
| | | Years Ended December 31,
| |
| | | 2004
| | | 2003
| |
Increase (Decrease) in Net Assets | | | | | | | | |
Operations: | | | | | | | | |
Net investment income (loss) | | $ | 2,202,646 | | | $ | 830,426 | |
Net realized gain (loss) on investment transactions | | | (2,112,683 | ) | | | (12,111,531 | ) |
Net unrealized appreciation (depreciation) on investment transactions during the period | | | 15,006,327 | | | | 78,050,590 | |
Net increase (decrease) in net assets resulting from operations | | | 15,096,290 | | | | 66,769,485 | |
Distributions to shareholders from: | | | | | | | | |
Net investment income | | | (815,090 | ) | | | (328,128 | ) |
| | |
Class A | | | | | | | | |
Portfolio share transactions: | | | | | | | | |
| | |
Class A | | | | | | | | |
Proceeds from shares sold | | | 18,466,237 | | | | 46,556,451 | |
Reinvestment of distributions | | | 815,090 | | | | 328,128 | |
Cost of shares redeemed | | | (55,750,428 | ) | | | (45,206,144 | ) |
Net increase (decrease) in net assets from Class A share transactions | | | (36,469,101 | ) | | | 1,678,435 | |
| | |
Class B | | | | | | | | |
Proceeds from shares sold | | | 8,950,573 | | | | 6,505,025 | |
Cost of shares redeemed | | | (494,088 | ) | | | (422,693 | ) |
Net increase (decrease) in net assets from Class B share transactions | | | 8,456,485 | | | | 6,082,332 | |
Increase (decrease) in net assets | | | (13,731,416 | ) | | | 74,202,124 | |
Net assets at beginning of period | | | 320,211,360 | | | | 246,009,236 | |
| | |
|
|
| |
|
|
|
Net assets at end of period (including undistributed net investment income of $2,081,479 and $702,179, respectively) | | $ | 306,479,944 | | | $ | 320,211,360 | |
| | |
|
|
| |
|
|
|
Other Information | |
| | |
Class A | | | | | | | | |
Shares outstanding at beginning of period | | | 16,929,119 | | | | 16,549,770 | |
Shares sold | | | 995,737 | | | | 3,153,740 | |
Shares issued to shareholders in reinvestment of distributions | | | 43,869 | | | | 22,156 | |
Shares redeemed | | | (3,010,699 | ) | | | (2,796,547 | ) |
Net increase (decrease) in Portfolio shares | | | (1,971,093 | ) | | | 379,349 | |
| | |
|
|
| |
|
|
|
Shares outstanding at end of period | | | 14,958,026 | | | | 16,929,119 | |
| | |
|
|
| |
|
|
|
Class B | | | | | | | | |
Shares outstanding at beginning of period | | | 374,544 | | | | 8,811 | |
Shares sold | | | 485,347 | | | | 390,729 | |
Shares redeemed | | | (26,929 | ) | | | (24,996 | ) |
Net increase (decrease) in Portfolio shares | | | 458,418 | | | | 365,733 | |
| | |
|
|
| |
|
|
|
Shares outstanding at end of period | | | 832,962 | | | | 374,544 | |
| | |
|
|
| |
|
|
|
The accompanying notes are an integral part of the financial statements.
Page 87 of 466
Financial Highlights
Class A
| | | | | | | | | | | | | | | | | | | | |
Years Ended December 31,
| | 2004
| | | 2003
| | | 2002
| | | 2001
| | | 2000a
| |
Selected Per Share Data | | | | | | | | | | | | | | | | | | | | |
Net asset value, beginning of period | | $ | 18.51 | | | $ | 14.86 | | | $ | 21.05 | | | $ | 30.12 | | | $ | 40.54 | |
| | |
|
|
| |
|
|
| |
|
|
| |
|
|
| |
|
|
|
Income (loss) from investment operations: | | | | | | | | | | | | | | | | | | | | |
Net investment income (loss)b | | | .14 | | | | .05 | | | | .01 | | | | .03 | | | | (.01 | ) |
Net realized and unrealized gain (loss) on investment transactions | | | .81 | | | | 3.62 | | | | (6.20 | ) | | | (6.75 | ) | | | (6.81 | ) |
Total from investment operations | | | .95 | | | | 3.67 | | | | (6.19 | ) | | | (6.72 | ) | | | (6.82 | ) |
Less distributions from: | | | | | | | | | | | | | | | | | | | | |
Net investment income | | | (.05 | ) | | | (.02 | ) | | | — | | | | (.03 | ) | | | — | |
Net realized gains on investment transactions | | | — | | | | — | | | | — | | | | (2.31 | ) | | | (3.60 | ) |
Return of capital | | | — | | | | — | | | | — | | | | (.01 | ) | | | — | |
| | |
|
|
| |
|
|
| |
|
|
| |
|
|
| |
|
|
|
Total distributions | | | (.05 | ) | | | (.02 | ) | | | — | | | | (2.35 | ) | | | (3.60 | ) |
| | |
|
|
| |
|
|
| |
|
|
| |
|
|
| |
|
|
|
Net asset value, end of period | | $ | 19.41 | | | $ | 18.51 | | | $ | 14.86 | | | $ | 21.05 | | | $ | 30.12 | |
| | |
|
|
| |
|
|
| |
|
|
| |
|
|
| |
|
|
|
Total Return (%) | | | 5.14 | | | | 24.71 | | | | (29.41 | ) | | | (22.34 | ) | | | (19.06 | ) |
| | |
|
|
| |
|
|
| |
|
|
| |
|
|
| |
|
|
|
Ratios to Average Net Assets and Supplemental Data | | | | | | | | | | | | | | | | | | | | |
Net assets, end of period ($ millions) | | | 290 | | | | 313 | | | | 246 | | | | 420 | | | | 583 | |
Ratio of expenses (%) | | | .65 | | | | .64 | | | | .64 | | | | .63 | | | | .65 | |
Ratio of net investment income (loss) (%) | | | .73 | | | | .29 | | | | .07 | | | | .13 | | | | (.03 | ) |
Portfolio turnover rate (%) | | | 21 | | | | 26 | | | | 38 | | | | 73 | | | | 65 | |
| a | On June 18, 2001, the Portfolio implemented a 1 for 10 reverse stock split. Per share information, for the period prior to December 31, 2001, has been restated to reflect the effect of the split. Shareholders received 1 share for every 10 shares owned and net asset value per share increased correspondingly. |
| b | Based on average shares outstanding during the period. |
Class B
| | | | | | | | | | | |
Years Ended December 31,
| | 2004
| | 2003
| | | 2002a
| |
Selected Per Share Data | | | | | | | | | | | |
Net asset value, beginning of period | | $ | 18.43 | | $ | 14.83 | | | $ | 16.04 | |
| | |
|
| |
|
|
| |
|
|
|
Income (loss) from investment operations: | | | | | | | | | | | |
Net investment income (loss)b | | | .07 | | | (.03 | ) | | | .06 | |
Net realized and unrealized gain (loss) on investment transactions | | | .81 | | | 3.63 | | | | (1.27 | ) |
| | |
|
| |
|
|
| |
|
|
|
Total from investment operations | | | .88 | | | 3.60 | | | | (1.21 | ) |
| | |
|
| |
|
|
| |
|
|
|
Net asset value, end of period | | $ | 19.31 | | $ | 18.43 | | | $ | 14.83 | |
| | |
|
| |
|
|
| |
|
|
|
Total Return (%) | | | 4.77 | | | 24.28 | | | | (7.54 | )** |
| | |
|
| |
|
|
| |
|
|
|
Ratios to Average Net Assets and Supplemental Data | | | | | | | | | | | |
Net assets, end of period ($ millions) | | | 16 | | | 7 | | | | .1 | |
Ratio of expenses (%) | | | 1.03 | | | 1.03 | | | | .88 | * |
Ratio of net investment income (loss) (%) | | | .35 | | | (.10 | ) | | | .80 | * |
Portfolio turnover rate (%) | | | 21 | | | 26 | | | | 38 | |
| a | For the period from July 1, 2002 (commencement of operations of Class B shares) to December 31, 2002. |
Page 88 of 466
| b | Based on average shares outstanding during the period. |
Information About Your Portfolio’s Expenses
Scudder Growth & Income Strategy Portfolio
As an investor of the Portfolio, you incur two types of costs: ongoing expenses and transaction costs. Ongoing expenses include management fees, distribution and service (12b-1) fees and other Portfolio expenses. Examples of transaction costs include sales charges (loads), redemption fees and account maintenance fees, which are not shown in this section. The following tables are intended to help you understand your ongoing expenses (in dollars) of investing in the Portfolio and to help you compare these expenses with the ongoing expenses of investing in other mutual funds. In the most recent six-month period, the Portfolio limited these expenses; had it not done so, expenses would have been higher. The tables are based on an investment of $1,000 made at the beginning of the period (August 16, 2004) ended December 31, 2004.
The tables illustrate your Portfolio’s expenses in two ways:
Actual Portfolio Return. This helps you estimate the actual dollar amount of ongoing expenses (but not transaction costs) paid on a $1,000 investment in the Portfolio using the Portfolio’s actual return during the period. To estimate the expenses you paid over the period, simply divide your account value by $1,000 (for example, an $8,600 account value divided by $1,000 = 8.6), then multiply the result by the number in the “Expenses Paid per $1,000” line under the share class you hold.
Hypothetical 5% Portfolio Return. This helps you to compare your Portfolio’s ongoing expenses (but not transaction costs) with those of other mutual funds using the Portfolio’s actual expense ratio and a hypothetical rate of return of 5% per year before expenses. Examples using a 5% hypothetical Portfolio return may be found in the shareholder reports of other mutual funds. The hypothetical account values and expenses may not be used to estimate the actual ending account balance or expenses you paid for the period.
Please note that the expenses shown in these tables are meant to highlight your ongoing expenses only and do not reflect any transaction costs. The “Expenses Paid per $1,000” line of the tables is useful in comparing ongoing expenses only and will not help you determine the relative total expense of owning different funds. If these transaction costs had been included, your costs would have been higher.
Page 89 of 466
Expenses and Value of a $1,000 Investment for the period ended December 31, 2004
| | | |
| |
Actual Portfolio Return
| | Class B
|
Beginning Account Value 8/16/04 | | $ | 1,000.00 |
Ending Account Value 12/31/04 | | $ | 1,084.80 |
Expenses Paid per $1,000* | | $ | 2.92 |
| |
Hypothetical 5% Portfolio Return
| | Class B
|
Beginning Account Value 8/16/04 | | $ | 1,000.00 |
Ending Account Value 12/31/04 | | $ | 1,015.96 |
Expenses Paid per $1,000* | | $ | 2.83 |
| * | Expenses are equal to the Portfolio’s annualized expense ratio for share class, multiplied by the average account value over the period, multiplied by the number of days since inception (August 16, 2004), then divided by 365. |
| | | |
| |
Annualized Expense Ratios
| | Class B
| |
Scudder Variable Series II — Scudder Growth & Income Strategy Portfolio | | .75 | % |
For more information, please refer to the Portfolio’s prospectus.
Management Summary December 31, 2004
Scudder Growth & Income Strategy Portfolio
Scudder Growth & Income Strategy Portfolio is one of four new fund-of-funds portfolios. Each portfolio is constructed as a strategically allocated mix of variable portfolios and managed to pursue consistent returns over time, while mitigating risk and pursuing a long-term investment objective. Scudder Growth & Income Strategy Portfolio seeks a balance of long-term growth of capital and current income with an emphasis on growth of capital. The portfolio gained 8.40% (Class B shares, unadjusted for contract charges) from its date of inception, August 16, 2004, through December 31, 2004. Investors should keep in mind that during the start-up phase of the portfolio, it required some time to invest all the cash inflows. Because we had large cash flows, often exceeding the size of the portfolio, our allocation was heavily weighted in cash — even though we invested the cash right away every day.
Stocks performed exceptionally well in 2003, when profit margins widened because productivity accelerated but labor costs remained low (due to a soft labor market). However, equity performance was lower in 2004, due in part to rising interest rates, concerns about inflation and soaring energy prices, all of which can impact the revenue growth of companies. Performance did improve at the end of 2004 as signs of economic strength emerged and oil prices decreased. The end of uncertainty surrounding the US presidential election also helped the stock market find its footing. Specifically, the energy and materials sectors performed particularly well in 2004, while the technology, consumer staples and consumer discretionary sectors lagged behind. Going forward, profit margins are not likely to widen further, and may even narrow. As a result, we believe that returns will likely be modest. The portfolio underweighted equities relative to fixed income only in December and overweighted equities for all other months since inception. To improve diversification within the stock category, the portfolio overweighted small-cap stocks for all months since inception except December.
Page 90 of 466
The Federal Reserve Board (“the Fed”), in attempt to prevent the economy from overheating and inflation from rising, raised interest rates five times from 12/31/03 through 12/31/04. Because bond prices typically move in the opposite direction of interest rates, bond prices fell in response. Still, bond investors seemed to be betting that the economy faces too many hurdles for the Fed to raise interest rates drastically, so the price of bonds did not fall significantly. However, it seems likely that the Fed will continue to raise interest rates, so we believe that the bull market for bonds we have experienced over the past two decades is likely over. Although, the portfolio is currently overweighting (or favoring) bonds relative to cash, these weightings may change.
Arnim Holzer Inna Okounkova Robert Wang
Co-Managers
Deutsche Investment Management Americas Inc.
All performance shown is historical, assumes reinvestment of all dividends and capital gains, and does not guarantee future results. Investment return and principal value fluctuate with changing market conditions so that, when redeemed, shares may be worth more or less then their original cost. Current performance may be lower or higher than the performance data quoted. Please visit scudder.com for the product’s most recent month-end performance. Performance doesn’t reflect charges and fees (“contract charges”) associated with the separate account that invests in the portfolio or any variable life insurance policy or variable annuity contract for which the portfolio is an investment option. These charges and fees will reduce returns.
Returns during part or all of the periods shown reflect a fee waiver and/or expense reimbursement. Without this waiver/reimbursement, returns would have been lower.
Risk Considerations
Diversification does not eliminate risk. The underlying portfolios invest in individual bonds whose yields and market values fluctuate, so that your investment may be worth more or less that its original cost. In addition, the underlying portfolios are subject to stock market risk, meaning stocks in the portfolio may decline in value for extended periods of time due to the activities and financial prospects of individual companies, or due to general market and economic conditions. Investing in foreign securities presents certain unique risks not associated with domestic investments, such as currency fluctuation, political and economic changes, and market risks. Derivatives may be more volatile and less liquid than traditional securities, and the portfolio could suffer losses on its derivative positions. Please read this portfolio’s prospectus for specific details regarding its risk profile.
Portfolio management market commentary is as of December 31, 2004, and may not come to pass. This information is subject to change at any time based on market and other conditions.
Portfolio Summary
Scudder Growth & Income Strategy Portfolio
| | | |
Asset Allocation
| | 12/31/04
| |
Equity | | 58 | % |
Fixed Income | | 38 | % |
Cash Equivalents | | 4 | % |
| | |
|
|
| | | 100 | % |
| | |
|
|
Asset allocation is subject to change.
For more complete details about the Portfolio’s investment portfolio, see page 27. A quarterly Fact Sheet is available upon request. Information concerning portfolio holdings of the Portfolio as of month end will be posted to scudder.com on the 15th of the following month.
Page 91 of 466
Following the Portfolio’s fiscal first and third quarter-end, a complete portfolio holdings listing is filed with the SEC on Form N-Q. The form will be available on the SEC’s Web site at www.sec.gov, and it also may be reviewed and copied at the SEC’s Public Reference Room in Washington, D.C. Information on the operation of the SEC’s Public Reference Room may be obtained by calling (800) SEC-0330.
Investment Portfolio December 31, 2004
Scudder Growth & Income Strategy Portfolio
| | | | |
| | | Shares
| | Value ($)
|
Equity Funds 58.8% | | | | |
Scudder SVS I Global Discovery Portfolio “A” | | 10,718 | | 136,866 |
Scudder SVS I Growth & Income Portfolio “A” | | 511,565 | | 4,752,442 |
Scudder SVS I International Portfolio “A” | | 104,778 | | 995,386 |
Scudder SVS II Aggressive Growth Portfolio “A” | | 57,115 | | 562,011 |
Scudder SVS II Blue Chip Portfolio “A” | | 344,262 | | 4,699,177 |
Scudder SVS II Davis Venture Value Portfolio “A” | | 16,900 | | 194,016 |
Scudder SVS II Dreman High Return Equity Portfolio “A” | | 115,127 | | 1,456,356 |
Scudder SVS II Dreman Small Cap Value Portfolio “A” | | 46,219 | | 927,146 |
Scudder SVS II Eagle Focused Large Cap Growth Portfolio “A” | | 161,086 | | 1,415,946 |
Scudder SVS II Growth Portfolio “A” | | 109,825 | | 2,131,705 |
Scudder SVS II International Select Equity Portfolio “A” | | 50,811 | | 605,165 |
Scudder SVS II Large Cap Value Portfolio “A” | | 148,710 | | 2,348,138 |
Scudder SVS II MFS Strategic Value Portfolio “A” | | 80,777 | | 969,326 |
Scudder SVS II Small Cap Growth Portfolio “A” | | 79,470 | | 1,000,524 |
Scudder VIT Real Estate Portfolio “A” | | 29,674 | | 484,581 |
| | | | |
|
Total Equity Funds (Cost $21,339,889) | | | | 22,678,785 |
| | | | |
|
| | |
| | | Shares
| | Value ($)
|
Fixed Income Funds 38.7% | | | | |
Scudder SVS II Fixed Income Portfolio “A” | | 993,421 | | 11,990,598 |
Scudder SVS II Government and Agency Securities Portfolio “A” | | 171,514 | | 2,152,503 |
Scudder SVS II High Income Portfolio “A” | | 86,606 | | 760,402 |
| | | | |
|
Total Fixed Income Funds (Cost $14,785,921) | | | | 14,903,503 |
| | | | |
|
Cash Equivalents 4.4% | | | | |
Scudder Cash Management QP Trust, 2.24% (b) (Cost $1,697,721) | | 1,697,721 | | 1,697,721 |
| | | | |
|
| | | | | | |
| | | % of Net Assets
| | | Value ($)
| |
Total Investment Portfolio (Cost $37,823,531) (a) | | 101.9 | | | 39,280,009 | |
| | | | | |
|
|
Other Assets and Liabilities, Net | | (1.9 | ) | | (746,028 | ) |
| | | | | |
|
|
Net Assets | | 100.0 | | | 38,533,981 | |
| | | | | |
|
|
Notes to Scudder Growth & Income Strategy Portfolio of Investments
| (a) | The cost for federal income tax purposes was $37,823,531. At December 31, 2004, net unrealized appreciation for all securities based on tax cost was $1,456,478. This consisted of aggregate gross unrealized appreciation for all securities in which there was an excess of value over tax cost of $1,456,478 and aggregate gross unrealized depreciation for all securities in which there was an excess of tax cost over value of $0. |
Page 92 of 466
| (b) | Scudder Cash Management QP Trust is managed by Deutsche Investment Management Americas Inc. The rate shown is the annualized seven-day yield at period end. |
The accompanying notes are an integral part of the financial statements.
Financial Statements
Statement of Assets and Liabilities
as of December 31, 2004
| | | |
Assets | | | |
Investments: | | | |
Investments in securities, at value (cost $36,125,810) | | $ | 37,582,288 |
Investment in Scudder Cash Management QP Trust (cost $1,697,721) | | | 1,697,721 |
Total investments in securities, at value (cost $37,823,531) | | | 39,280,009 |
Interest receivable | | | 1,403 |
Receivable for Portfolio shares sold | | | 200,828 |
Other assets | | | 299 |
| | |
|
|
Total assets | | | 39,482,539 |
| | |
|
|
Liabilities | | | |
Payable for investments purchased | | | 922,723 |
Payable for Portfolio shares redeemed | | | 3,418 |
Other accrued expenses and payables | | | 22,417 |
| | |
|
|
Total liabilities | | | 948,558 |
| | |
|
|
Net assets, at value | | $ | 38,533,981 |
| | |
|
|
Net Assets | | | |
Net assets consist of: | | | |
Net unrealized appreciation (depreciation) on investments | | | 1,456,478 |
Accumulated net realized gain (loss) | | | 58,128 |
Paid-in capital | | | 37,019,375 |
| | |
|
|
Net assets, at value | | $ | 38,533,981 |
| | |
|
|
Class B | | | |
Net Asset Value, offering and redemption price per share ($38,533,981 ÷ 3,555,593 outstanding shares of beneficial interest, $.01 par value, unlimited number of shares authorized) | | $ | 10.84 |
| | |
|
|
Page 93 of 466
Statement of Operations
for the period ended December 31, 2004
| | | | |
Investment Income | | | | |
Income: | | | | |
Interest — Scudder Cash Management QP Trust | | | 4,690 | |
Total Income | | | 4,690 | |
Expenses: | | | | |
Management fee | | | 9,387 | |
Custodian and accounting fees | | | 31,926 | |
Distribution service fees (Class B) | | | 15,635 | |
Record keeping fees (Class B) | | | 9,381 | |
Auditing | | | 24,001 | |
Legal | | | 1,077 | |
Trustees’ fees and expenses | | | 477 | |
Reports to shareholders | | | 3,011 | |
Offering costs | | | 1,011 | |
Other | | | 530 | |
Total expenses | | | 96,436 | |
Expense reductions | | | (49,254 | ) |
Total expenses, after expense reductions | | | 47,182 | |
| | |
|
|
|
Net investment income (loss) | | | (42,492 | ) |
| | |
|
|
|
Realized and Unrealized Gain (Loss) on Investment Transactions | | | | |
Net realized gain (loss) from investments | | | 99,609 | |
Net unrealized appreciation (depreciation) during the period on investments | | | 1,456,478 | |
| | |
|
|
|
Net gain (loss) on investment transactions | | | 1,556,087 | |
| | |
|
|
|
Net increase (decrease) in net assets resulting from operations | | $ | 1,513,595 | |
| | |
|
|
|
The accompanying notes are an integral part of the financial statements.
Statement of Changes in Net Assets
| | | | |
Increase (Decrease) in Net Assets
| | Period Ended
December 31,
2004a
| |
Operations: | | | | |
Net investment income (loss) | | $ | (42,492 | ) |
Net realized gain (loss) on investment transactions | | | 99,609 | |
Net unrealized appreciation (depreciation) on investment transactions during the period | | | 1,456,478 | |
Net increase (decrease) in net assets resulting from operations | | | 1,513,595 | |
Portfolio share transactions: | | | | |
| |
Class B | | | | |
Proceeds from shares sold | | | 37,742,213 | |
Cost of shares redeemed | | | (721,827 | ) |
Net increase (decrease) in net assets from Class B share transactions | | | 37,020,386 | |
Increase (decrease) in net assets | | | 38,533,981 | |
Net assets at beginning of period | | | — | |
| | |
|
|
|
Net assets at end of period | | $ | 38,533,981 | |
| | |
|
|
|
Other Information | | | | |
| |
Class B | | | | |
Shares outstanding at beginning of period | | | — | |
Shares sold | | | 3,624,260 | |
Shares redeemed | | | (68,667 | ) |
Net increase (decrease) in Portfolio shares | | | 3,555,593 | |
| | |
|
|
|
Shares outstanding at end of period | | | 3,555,593 | |
| | |
|
|
|
| a | For the period from August 16, 2004 (commencement of operations) to December 31, 2004. |
The accompanying notes are an integral part of the financial statements.
Page 94 of 466
Financial Highlights
Class B
| | | | |
| | | 2004a
| |
Selected Per Share Data | | | | |
Net asset value, beginning of period | | $ | 10.00 | |
| | |
|
|
|
Income (loss) from investment operations: | | | | |
Net investment income (loss)b | | | (.03 | ) |
Net realized and unrealized gain (loss) on investment transactions | | | .87 | |
| | |
|
|
|
Total from investment operations | | | .84 | |
| | |
|
|
|
Net asset value, end of period | | $ | 10.84 | |
| | |
|
|
|
Total Return (%)c | | | 8.40 | ** |
| | |
|
|
|
Ratios to Average Net Assets and Supplemental Data | | | | |
Net assets, end of period ($ millions) | | | 39 | |
Ratio of expenses before expense reductions (%) | | | 1.53 | * |
Ratio of expenses after expense reductions (%) | | | .75 | * |
Ratio of net investment income (loss) (%) | | | (.68 | )* |
Portfolio turnover rate (%) | | | 13 | * |
| a | For the period from August 16, 2004 (commencement of operations) to December 31, 2004. |
| b | Based on average shares outstanding during the period. |
| c | Total return would have been lower had certain expenses not been reduced. |
Page 95 of 466
Information About Your Portfolio’s Expenses
Scudder Growth Strategy Portfolio
As an investor of the Portfolio, you incur two types of costs: ongoing expenses and transaction costs. Ongoing expenses include management fees, distribution and service (12b-1) fees and other Portfolio expenses. Examples of transaction costs include sales charges (loads), redemption fees and account maintenance fees, which are not shown in this section. The following tables are intended to help you understand your ongoing expenses (in dollars) of investing in the Portfolio and to help you compare these expenses with the ongoing expenses of investing in other mutual funds. In the most recent six-month period, the Portfolio limited these expenses; had it not done so, expenses would have been higher. The tables are based on an investment of $1,000 made at the beginning of the period (August 16, 2004) ended December 31, 2004.
The tables illustrate your Portfolio’s expenses in two ways:
Actual Portfolio Return. This helps you estimate the actual dollar amount of ongoing expenses (but not transaction costs) paid on a $1,000 investment in the Portfolio using the Portfolio’s actual return during the period. To estimate the expenses you paid over the period, simply divide your account value by $1,000 (for example, an $8,600 account value divided by $1,000 = 8.6), then multiply the result by the number in the “Expenses Paid per $1,000” line under the share class you hold.
Hypothetical 5% Portfolio Return. This helps you to compare your Portfolio’s ongoing expenses (but not transaction costs) with those of other mutual funds using the Portfolio’s actual expense ratio and a hypothetical rate of return of 5% per year before expenses. Examples using a 5% hypothetical Portfolio return may be found in the shareholder reports of other mutual funds. The hypothetical account values and expenses may not be used to estimate the actual ending account balance or expenses you paid for the period.
Please note that the expenses shown in these tables are meant to highlight your ongoing expenses only and do not reflect any transaction costs. The “Expenses Paid per $1,000” line of the tables is useful in comparing ongoing expenses only and will not help you determine the relative total expense of owning different funds. If these transaction costs had been included, your costs would have been higher.
Expenses and Value of a $1,000 Investment for the period ended December 31, 2004
| | | |
Actual Portfolio Return
| | Class B
|
Beginning Account Value 8/16/04 | | $ | 1,000.00 |
Ending Account Value 12/31/04 | | $ | 1,103.00 |
Expenses Paid per $1,000* | | $ | 2.96 |
| |
Hypothetical 5% Portfolio Return
| | Class B
|
Beginning Account Value 8/16/04 | | $ | 1,000.00 |
Ending Account Value 12/31/04 | | $ | 1,015.95 |
Expenses Paid per $1,000* | | $ | 2.84 |
| * | Expenses are equal to the Portfolio’s annualized expense ratio for the share class, multiplied by the average account value over the period, multiplied by the number of days since the commencement of the class (August 16, 2004), then divided by 365. |
Page 96 of 466
| | | |
| |
Annualized Expense Ratios
| | Class B
| |
Scudder Variable Series II — Scudder Growth Strategy Portfolio | | .75 | % |
For more information, please refer to the Portfolio’s prospectus.
Management Summary December 31, 2004
Scudder Growth Strategy Portfolio
Scudder Growth Strategy Portfolio is one of four new fund-of-funds portfolios. Each portfolio is constructed as a strategically allocated mix of variable portfolios and managed to pursue consistent returns over time, while mitigating risk and pursuing a long-term investment objective. Scudder Growth Strategy Portfolio seeks a balance of long-term growth of capital and, as a secondary objective, current income. The portfolio gained 10.30% (Class B shares, unadjusted for contract charges) from its date of inception, August 16, 2004 through December 31, 2004. Because we had large cash flows, often exceeding the size of the portfolio, our allocation was heavily weighted in cash — even though we invested the cash right away every day.
Stocks performed exceptionally well in 2003, when profit margins widened because productivity accelerated but labor costs remained low (due to soft labor market). However, equity performance was lower in 2004, due in part to rising interest rates, concerns about inflation and soaring energy prices, all of which can impact the revenue growth of companies. Performance did improve at the end of 2004 as signs of economic strength emerged and oil prices decreased. The end of uncertainty surrounding the US presidential election also helped the stock market find its footing. Specifically, the energy and materials sectors performed particularly well in 2004, while the technology, consumer staples and consumer discretionary sectors lagged behind. Going forward, profit margins are not likely to widen further, and may even narrow. As a result, we believe that returns will likely be modest. The portfolio underweighted equities relative to fixed income only in December and overweighted equities for all other months since inception. To improve diversification within the stock category, the portfolio overweighted small-cap stocks for all months since inception except December.
The Federal Reserve Board (“the Fed”), in attempt to prevent the economy from overheating and inflation from rising, raised interest rates five times from 12/31/03 through 12/31/04. Because bond prices typically move in the opposite direction of interest rates, bond prices fell in response. Still, bond investors seemed to be betting that the economy faces too many hurdles for the Fed to raise interest rates drastically, so the price of bonds did not fall significantly. However, it seems likely that the Fed will continue to raise interest rates, so we believe that the bull market for bonds we have experienced over the past two decades is likely over. Although, the portfolio is currently overweighting (or favoring) bonds relative to cash, these weightings may change.
Arnim Holzer Inna Okounkova Robert Wang
Co-Managers
Deutsche Investment Management Americas Inc.
Page 97 of 466
All performance shown is historical, assumes reinvestment of all dividends and capital gains, and does not guarantee future results. Investment return and principal value fluctuate with changing market conditions so that, when redeemed, shares may be worth more or less than their original cost. Current performance may be lower or higher than the performance data quoted. Please visit scudder.com for the product’s most recent month-end performance. Performance doesn’t reflect charges and fees (“contract charges”) associated with the separate account that invests in the portfolio or any variable life insurance policy or variable annuity contract for which the portfolio is an investment option. These charges and fees will reduce returns.
Returns during part or all of the periods shown reflect a fee waiver and/or expense reimbursement. Without this waiver/reimbursement, returns would have been lower.
Risk Considerations
Diversification does not eliminate risk. The underlying portfolios invest in individual equity and bond funds whose yields and market values fluctuate, so that your investment may be worth more or less that its original cost. In addition, the underlying portfolios are subject to stock market risk, meaning stocks in the portfolio may decline in value for extended periods of time due to the activities and financial prospects of individual companies, or due to general market and economic conditions. Investing in foreign securities presents certain unique risks not associated with domestic investments, such as currency fluctuation, political and economic changes, and market risks. Derivatives may be more volatile and less liquid than traditional securities, and the portfolio could suffer losses on its derivative positions. Please read this portfolio’s prospectus for specific details regarding its risk profile.
Portfolio management market commentary is as of December 31, 2004, and may not come to pass. This information is subject to change at any time based on market and other conditions.
Portfolio Summary
Scudder Growth Strategy Portfolio
| | | |
| |
Asset Allocation
| | 12/31/04
| |
Equity | | 73 | % |
Fixed Income | | 25 | % |
Cash Equivalents | | 2 | % |
| | |
|
|
| | | 100 | % |
| | |
|
|
Asset allocation is subject to change.
For more complete details about the Portfolio’s investment portfolio, see page 35. A quarterly Fact Sheet is available upon request. Information concerning portfolio holdings of the Portfolio as of month end will be posted to scudder.com on the 15th of the following month.
Following the Portfolio’s fiscal first and third quarter-end, a complete portfolio holdings listing is filed with the SEC on Form N-Q. The form will be available on the SEC’s Web site at www.sec.gov, and it also may be reviewed and copied at the SEC’s Public Reference Room in Washington, D.C. Information on the operation of the SEC’s Public Reference Room may be obtained by calling (800) SEC-0330.
Page 98 of 466
Investment Portfolio December 31, 2004
Scudder Growth Strategy Portfolio
| | | | |
| | | Shares
| | Value ($)
|
Equity Funds 73.2% | | | | |
Scudder SVS I Global Discovery Portfolio “A” | | 20,421 | | 260,772 |
Scudder SVS I Growth & Income Portfolio “A” | | 754,162 | | 7,006,164 |
Scudder SVS I International Portfolio “A” | | 206,338 | | 1,960,211 |
Scudder SVS II Aggressive Growth Portfolio “A” | | 66,902 | | 658,313 |
Scudder SVS II Blue Chip Portfolio “A” | | 508,265 | | 6,937,820 |
Scudder SVS II Davis Venture Value Portfolio “A” | | 43,052 | | 494,237 |
Scudder SVS II Dreman High Return Equity Portfolio “A” | | 149,070 | | 1,885,739 |
Scudder SVS II Dreman Small Cap Value Portfolio “A” | | 67,788 | | 1,359,836 |
Scudder SVS II Eagle Focused Large Cap Growth Portfolio “A” | | 281,775 | | 2,476,800 |
Scudder SVS II Growth Portfolio “A” | | 153,831 | | 2,985,866 |
Scudder SVS II International Select Equity Portfolio “A” | | 95,181 | | 1,133,608 |
Scudder SVS II Large Cap Value Portfolio “A” | | 229,401 | | 3,622,239 |
Scudder SVS II MFS Strategic Value Portfolio “A” | | 117,680 | | 1,412,155 |
Scudder SVS II Small Cap Growth Portfolio “A” | | 115,479 | | 1,453,884 |
Scudder VIT Real Estate Portfolio “A” | | 46,368 | | 757,184 |
| | | | |
|
Total Equity Funds (Cost $32,412,712) | | | | 34,404,828 |
| | | | |
|
| | |
| | | Shares
| | Value ($)
|
Fixed Income Funds 24.9% | | | | |
Scudder SVS II Fixed Income Portfolio “A” | | 698,663 | | 8,432,859 |
Scudder SVS II Government and Agency Securities Portfolio “A” | | 222,549 | | 2,792,996 |
Scudder SVS II High Income Portfolio “A” | | 52,493 | | 460,886 |
| | | | |
|
Total Fixed Income Funds (Cost $11,601,822) | | | | 11,686,741 |
| | | | |
|
Cash Equivalents 1.9% | | | | |
Scudder Cash Management QP Trust, 2.24% (b) (Cost $883,152) | | 883,152 | | 883,152 |
| | | | |
|
| | | | | |
| | | % of Net Assets
| | | Value ($)
|
Total Investment Portfolio (Cost $44,897,686) (a) | | 100.0 | | | 46,974,721 |
| | | | | |
|
Other Assets and Liabilities, Net | | (0.0 | ) | | 21,610 |
| | | | | |
|
Net Assets | | 100.0 | | | 46,996,331 |
| | | | | |
|
Notes to Scudder Growth Strategy Portfolio of Investments
| (a) | The cost for federal income tax purposes was $44,897,686. At December 31, 2004, net unrealized appreciation for all securities based on tax cost was $2,077,035. This consisted of aggregate gross unrealized appreciation for all securities in which there was an excess of value over tax cost of $2,077,035 and aggregate gross unrealized depreciation for all securities in which there was an excess of tax cost over value of $0. |
| (b) | Scudder Cash Management QP Trust is managed by Deutsche Investment Management Americas Inc. The rate shown is the annualized seven-day yield at period end. |
The accompanying notes are an integral part of the financial statements.
Page 99 of 466
Financial Statements
Statement of Assets and Liabilities as of December 31, 2004
| | | |
Assets | | | |
Investments: | | | |
Investments in securities, at value (cost $44,014,534) | | $ | 46,091,569 |
Investment in Scudder Cash Management QP Trust (cost $883,152) | | | 883,152 |
| | |
|
|
Total investments in securities, at value (cost $44,897,686) | | | 46,974,721 |
| | |
|
|
Interest receivable | | | 1,629 |
Receivable for Portfolio shares sold | | | 50,293 |
Due from Advisor | | | 1,103 |
Other assets | | | 361 |
| | |
|
|
Total assets | | | 47,028,107 |
| | |
|
|
Liabilities | | | |
Payable for Portfolio shares redeemed | | | 2,840 |
Other accrued expenses and payables | | | 28,936 |
| | |
|
|
Total liabilities | | | 31,776 |
| | |
|
|
Net assets, at value | | $ | 46,996,331 |
| | |
|
|
Net Assets | | | |
Net assets consist of: | | | |
Net unrealized appreciation (depreciation) on investments | | | 2,077,035 |
Accumulated net realized gain (loss) | | | 93,109 |
Paid-in capital | | | 44,826,187 |
| | |
|
|
Net assets, at value | | $ | 46,996,331 |
| | |
|
|
Class B | | | |
Net Asset Value, offering and redemption price per share ($46,996,331 ÷ 4,262,187 outstanding shares of beneficial interest, $.01 par value, unlimited number of shares authorized) | | $ | 11.03 |
| | |
|
|
Page 100 of 466
Statement of Operations as of December 31, 2004
| | | | |
Investment Income | | | | |
Income: | | | | |
Interest — Scudder Cash Management QP Trust | | $ | 4,860 | |
| | |
|
|
|
Total Income | | | 4,860 | |
| | |
|
|
|
Expenses: | | | | |
Management fee | | | 11,104 | |
Custodian and accounting fees | | | 31,927 | |
Distribution service fees (Class B) | | | 18,496 | |
Record keeping fees (Class B) | | | 11,097 | |
Auditing | | | 24,001 | |
Legal | | | 1,077 | |
Trustees’ fees and expenses | | | 477 | |
Reports to shareholders | | | 3,011 | |
Offering costs | | | 1,011 | |
Other | | | 512 | |
| | |
|
|
|
Total expenses, before expense reductions | | | 102,713 | |
| | |
|
|
|
Expense reductions | | | (46,619 | ) |
| | |
|
|
|
Total expenses, after expense reductions | | | 56,094 | |
| | |
|
|
|
Net investment income (loss) | | | (51,234 | ) |
| | |
|
|
|
Realized and Unrealized Gain (Loss) on Investment Transactions | | | | |
Net realized gain (loss) from investments | | | 143,332 | |
Net unrealized appreciation (depreciation) during the period on investments | | | 2,077,035 | |
| | |
|
|
|
Net gain (loss) on investment transactions | | | 2,220,367 | |
| | |
|
|
|
Net increase (decrease) in net assets resulting from operations | | $ | 2,169,133 | |
| | |
|
|
|
The accompanying notes are an integral part of the financial statements.
Statement of Changes in Net Assets
| | | | |
Increase (Decrease) in Net Assets
| | Period Ended
December 31, 2004a
| |
Operations: | | | | |
Net investment income (loss) | | $ | (51,234 | ) |
Net realized gain (loss) on investment transactions | | | 143,332 | |
Net unrealized appreciation (depreciation) on investment transactions during the period | | | 2,077,035 | |
Net increase (decrease) in net assets resulting from operations | | | 2,169,133 | |
Portfolio share transactions: | | | | |
| |
Class B | | | | |
Proceeds from shares sold | | | 45,093,561 | |
Cost of shares redeemed | | | (266,363 | ) |
Net increase (decrease) in net assets from Class B share transactions | | | 44,827,198 | |
Increase (decrease) in net assets | | | 46,996,331 | |
Net assets at beginning of period | | | — | |
| | |
|
|
|
Net assets at end of period | | $ | 46,996,331 | |
| | |
|
|
|
Other Information | | | | |
| |
Class B | | | — | |
Shares outstanding at beginning of period | | | | |
Shares sold | | | 4,287,740 | |
Shares redeemed | | | (25,553 | ) |
Net increase (decrease) in Portfolio shares | | | 4,262,187 | |
| | |
|
|
|
Shares outstanding at end of period | | | 4,262,187 | |
| | |
|
|
|
| a | For the period from August 16, 2004 (commencement of operations) to December 31, 2004. |
The accompanying notes are an integral part of the financial statements.
Page 101 of 466
Financial Highlights
Class B
| | | | |
| | | 2004a
| |
Selected Per Share Data | | | | |
Net asset value, beginning of period | | $ | 10.00 | |
| | |
|
|
|
Income (loss) from investment operations: | | | | |
Net investment income (loss)b | | | (.03 | ) |
Net realized and unrealized gain (loss) on investment transactions | | | 1.06 | |
Total from investment operations | | | 1.03 | |
| | |
|
|
|
Net asset value, end of period | | $ | 11.03 | |
| | |
|
|
|
Total Return (%)c | | | 10.30 | ** |
Ratios to Average Net Assets and Supplemental Data | | | | |
Net assets, end of period ($ millions) | | | 47 | |
Ratio of expenses before expense reductions (%) | | | 1.38 | * |
Ratio of expenses after expense reductions (%) | | | 0.75 | * |
Ratio of net investment income (loss) (%) | | | (0.69 | )* |
Portfolio turnover rate (%) | | | 15 | * |
| a | For the period from August 16, 2004 (commencement of operations) to December 31, 2004. |
| b | Based on average shares outstanding during the period. |
| c | Total return would have been lower had certain expenses not been reduced. |
Performance Summary December 31, 2004
Scudder High Income Portfolio
All performance shown is historical, assumes reinvestment of all dividends and capital gains, and does not guarantee future results. Investment return and principal value fluctuate with changing market conditions so that, when redeemed, shares may be worth more or less then their original cost. Current performance may be lower or higher than the performance data quoted. Please visit scudder.com for the product’s most recent month-end performance. Performance doesn’t reflect charges and fees (“contract charges”) associated with the separate account that invests in the Portfolio or any variable life insurance policy or variable annuity contract for which the Portfolio is an investment option. These charges and fees will reduce returns.
Investing in foreign securities presents certain unique risks not associated with domestic investments, such as currency fluctuation, political and economic changes and market risks. Additionally, the Portfolio may invest in lower-quality and nonrated securities which present greater risk of loss of principal and interest than higher-quality securities. All of these factors may result in greater share price volatility. Please read this Portfolio’s prospectus for specific details regarding its investments and risk profile.
Page 102 of 466
Growth of an Assumed $10,000 Investment in Scudder High Income Portfolio from 12/31/1994 to 12/31/2004
| | |
¨ Scudder High Income Portfolio — Class A ¨ CSFB High Yield Index ¨ Citigroup Long-Term High Yield Bond Index | | |
 | | The CSFB High Yield Index is an unmanaged index that is market-weighted, including publicly traded bonds having a rating below BBB by Standard & Poor’s and Moody’s. The Citigroup Long-Term High Yield Bond Index (formerly known as Salomon Smith Barney Long-Term High Yield Bond Index) is an unmanaged index that is on a total return basis with all dividends reinvested and is composed of high-yield bonds with a par value of $50 million or higher and a remaining maturity of ten years or longer rated BB+ or lower by Standard & Poor’s Corporation or Bal or lower by Moody’s Investors Service, Inc. |
| |
| | | Index returns assume reinvested dividends and, unlike Portfolio returns, do not reflect any fees or expenses. It is not possible to invest directly into an index. |
Yearly periods ended December 31 | | |
Comparative Results
| | | | | | | | | | | | | | | | | | |
Scudder High Income Portfolio
| | | | 1-Year
| | | 3-Year
| | | 5-Year
| | | 10-Year
| |
| Class A | | Growth of $10,000 | | $ | 11,242 | | | $ | 13,967 | | | $ | 13,090 | | | $ | 20,274 | |
| | | Average annual total return | | | 12.42 | % | | | 11.78 | % | | | 5.53 | % | | | 7.32 | % |
| CSFB High Yield Index | | Growth of $10,000 | | $ | 11,195 | | | $ | 14,768 | | | $ | 14,810 | | | $ | 22,866 | |
| | | Average annual total return | | | 11.95 | % | | | 13.88 | % | | | 8.17 | % | | | 8.62 | % |
| Citigroup Long-Term High Yield Bond Index | | Growth of $10,000 | | $ | 11,202 | | | $ | 15,888 | | | $ | 19,501 | | | $ | 35,088 | |
| | | Average annual total return | | | 12.02 | % | | | 16.69 | % | | | 14.29 | % | | | 13.37 | % |
| | | | | |
Scudder High Income Portfolio
| | | | | | | | | | 1-Year
| | | Life of Class*
| |
| Class B | | Growth of $10,000 | | | | | | | | | | $ | 11,208 | | | $ | 14,261 | |
| | | Average annual total return | | | | | | | | | | | 12.08 | % | | | 15.24 | % |
| CSFB High Yield Index | | Growth of $10,000 | | | | | | | | | | $ | 11,195 | | | $ | 14,744 | |
| | | Average annual total return | | | | | | | | | | | 11.95 | % | | | 16.72 | % |
| Citigroup Long-Term High Yield Bond Index | | Growth of $10,000 | | | | | | | | | | $ | 11,202 | | | $ | 17,511 | |
| | | Average annual total return | | | | | | | | | | | 12.02 | % | | | 25.00 | % |
The growth of $10,000 is cumulative.
| * | The Portfolio commenced offering Class B shares on July 1, 2002. Index returns begin June 30, 2002. |
Effective 10/7/2002 the Portfolio changed its investment objective.
Information About Your Portfolio’s Expenses
Scudder High Income Portfolio
As an investor of the Portfolio, you incur two types of costs: ongoing expenses and transaction costs. Ongoing expenses include management fees, distribution and service (12b-1) fees and other Portfolio expenses. Examples of transaction costs include sales charges (loads), redemption fees and account maintenance fees, which are not shown in this section. The following tables are intended to help you understand your ongoing expenses (in dollars) of investing in the Portfolio and to help you compare these expenses with the ongoing expenses of investing in other mutual funds. The tables are based on an investment of $1,000 made at the beginning of the six-month period ended December 31, 2004.
Page 103 of 466
The tables illustrate your Portfolio’s expenses in two ways:
Actual Portfolio Return. This helps you estimate the actual dollar amount of ongoing expenses (but not transaction costs) paid on a $1,000 investment in the Portfolio using the Portfolio’s actual return during the period. To estimate the expenses you paid over the period, simply divide your account value by $1,000 (for example, an $8,600 account value divided by $1,000 = 8.6), then multiply the result by the number in the “Expenses Paid per $1,000” line under the share class you hold.
Hypothetical 5% Portfolio Return. This helps you to compare your Portfolio’s ongoing expenses (but not transaction costs) with those of other mutual funds using the Portfolio’s actual expense ratio and a hypothetical rate of return of 5% per year before expenses. Examples using a 5% hypothetical Portfolio return may be found in the shareholder reports of other mutual funds. The hypothetical account values and expenses may not be used to estimate the actual ending account balance or expenses you paid for the period.
Please note that the expenses shown in these tables are meant to highlight your ongoing expenses only and do not reflect any transaction costs. The “Expenses Paid per $1,000” line of the tables is useful in comparing ongoing expenses only and will not help you determine the relative total expense of owning different funds. If these transaction costs had been included, your costs would have been higher.
Expenses and Value of a $1,000 Investment for the six months ended December 31, 2004
| | | | | | |
Actual Portfolio Return
| | Class A
| | Class B
|
Beginning Account Value 7/1/04 | | $ | 1,000.00 | | $ | 1,000.00 |
Ending Account Value 12/31/04 | | $ | 1,105.80 | | $ | 1,103.10 |
Expenses Paid per $1,000* | | $ | 3.48 | | $ | 5.52 |
| | |
Hypothetical 5% Portfolio Return
| | Class A
| | Class B
|
Beginning Account Value 7/1/04 | | $ | 1,000.00 | | $ | 1,000.00 |
Ending Account Value 12/31/04 | | $ | 1,021.90 | | $ | 1,019.96 |
Expenses Paid per $1,000* | | $ | 3.34 | | $ | 5.30 |
| * | Expenses are equal to the Portfolio’s annualized expense ratio for each share class, multiplied by the average account value over the period, multiplied by the number of days in the most recent six-month period, then divided by 365. |
| | | | | | |
Annualized Expense Ratios
| | Class A
| | | Class B
| |
Scudder Variable Series II — Scudder High Income Portfolio | | .66 | % | | 1.04 | % |
For more information, please refer to the Portfolio’s prospectus.
Management Summary December 31, 2004
Scudder High Income Portfolio
The high-yield market produced a solid return for the year, making it the top-performing fixed income asset class. Performance of the high-yield market was supported by the continued improvement in its fundamentals, which was reflected in lower default rates, corporations steadily improving financial positions and an increasing ratio of upgrades to downgrades. For the year ended December 31, 2004, the portfolio produced a total return of 12.42% (Class A shares, unadjusted for contract charges) compared with 11.95% for the CS First Boston (CSFB) High Yield Index, the portfolio’s benchmark.
Page 104 of 466
We strive to add value by using fundamental research to identify undervalued individual securities rather than making broad predictions about sector performance, interest rates or the overall high-yield market. As a result of this investment approach, we continued to find the most relative value opportunities in higher-yielding securities. Security selection added to return, as did an underweight to issues rated BB and above (since higher-rated bonds underperformed the market as a whole). The portfolio remained underweight in CC/defaulted securities, and this detracted from return somewhat. On a sector basis, the most significant contributor was a position in bonds issued by chemical companies. Overall, we remain positive on the fundamentals of the high-yield asset class. We continue to find value in the middle-tier quality segment of the market, and we will therefore maintain a modestly aggressive positioning within the portfolio.
Andrew P. Cestone
Portfolio Manager
Deutsche Investment Management Americas Inc.
All performance shown is historical, assumes reinvestment of all dividends and capital gains, and does not guarantee future results. Investment return and principal value fluctuate with changing market conditions so that, when redeemed, shares may be worth more or less then their original cost. Current performance may be lower or higher than the performance data quoted. Please visit scudder.com for the product’s most recent month-end performance. Performance doesn’t reflect charges and fees (“contract charges”) associated with the separate account that invests in the portfolio or any variable life insurance policy or variable annuity contract for which the portfolio is an investment option. These charges and fees will reduce returns.
Risk Considerations
Investing in foreign securities presents certain unique risks not associated with domestic investments, such as currency fluctuation, political and economic changes and market risks. Additionally, the portfolio may invest in lower-quality and nonrated securities which present greater risk of loss of principal and interest than higher-quality securities. All of these factors may result in greater share price volatility. Please read this portfolio’s prospectus for specific details regarding its investments and risk profile.
Credit quality ratings cited are the ratings of Moody’s Investors Service, Inc. (Moody’s) and Standard & Poor’s Corporation (S&P), which represent these companies’ opinions as to the quality of the securities they rate. Ratings are relative and subjective and are not absolute standards of quality. The portfolio’s credit quality does not remove market risk.
The CS First Boston High Yield Index (CSFB) is an unmanaged index that is market-weighted, including publicly traded bonds having a rating below BBB by Standard & Poor’s and Moody’s.
Index returns assume reinvested dividends and, unlike portfolio returns, do not reflect any fees or expenses. It is not possible to invest directly into an index.
Portfolio management market commentary is as of December 31, 2004, and may not come to pass. This information is subject to change at any time based on market and other conditions.
Page 105 of 466
Portfolio Summary
Scudder High Income Portfolio
| | | | | | |
Asset Allocation (Excludes Securities Lending Collateral)
| | 12/31/04
| | | 12/31/03
| |
Corporate Bonds | | 74 | % | | 82 | % |
Foreign Bonds — US$ Denominated | | 20 | % | | 12 | % |
Foreign Bonds — Non US$ Denominated | | 2 | % | | 1 | % |
Cash Equivalents | | 2 | % | | 1 | % |
Asset Backed | | 1 | % | | 1 | % |
Convertible Bonds | | 1 | % | | 1 | % |
Stocks | | — | | | 1 | % |
US Government Backed | | — | | | 1 | % |
| | |
|
| |
|
|
| | | 100 | % | | 100 | % |
| | |
|
| |
|
|
| | |
Corporate and Foreign Bond Diversification (Excludes Cash Equivalents and Securities Lending Collateral)
| | 12/31/04
| | | 12/31/03
| |
Consumer Discretionary | | 24 | % | | 26 | % |
Materials | | 16 | % | | 13 | % |
Industrials | | 14 | % | | 15 | % |
Telecommunication Services | | 14 | % | | 12 | % |
Financials | | 9 | % | | 9 | % |
Energy | | 7 | % | | 10 | % |
Utilities | | 5 | % | | 6 | % |
Consumer Staples | | 4 | % | | 4 | % |
Health Care | | 3 | % | | 3 | % |
Sovereign Bonds | | 2 | % | | 1 | % |
Information Technology | | 2 | % | | 1 | % |
| | |
|
| |
|
|
| | | 100 | % | | 100 | % |
| | |
|
| |
|
|
Asset allocation and sector diversification are subject to change.
For more complete details about the Portfolio’s investment portfolio, see page 44. A quarterly Fact Sheet is available upon request. Information concerning portfolio holdings of the Portfolio as of month end will be posted to scudder.com on the 15th of the following month.
Following the Portfolio’s fiscal first and third quarter-end, a complete portfolio holdings listing is filed with the SEC on Form N-Q. The form will be available on the SEC’s Web site at www.sec.gov, and it also may be reviewed and copied at the SEC’s Public Reference Room in Washington, D.C. Information on the operation of the SEC’s Public Reference Room may be obtained by calling (800) SEC-0330.
Investment Portfolio December 31, 2004
Scudder High Income Portfolio
| | | | |
| | | Principal
Amount ($)(c)
| | Value ($)
|
Corporate Bonds 72.7% | | | | |
Consumer Discretionary 19.2% | | | | |
Adesa, Inc., 7.625%, 6/15/2012 | | 515,000 | | 543,325 |
AMC Entertainment, Inc., 8.0%, 3/1/2014 | | 1,085,000 | | 1,079,575 |
American Lawyer Media, Inc., Series B, 9.75%, 12/15/2007 | | 1,235,000 | | 1,248,894 |
Page 106 of 466
| | | | |
Atlantic Broadband Finance LLC, 144A, 9.375%, 1/15/2014 | | 1,351,000 | | 1,307,092 |
Bally Total Fitness Holdings Corp., 10.5%, 7/15/2011 | | 1,145,000 | | 1,153,587 |
Cablevision Systems New York Group, 144A, 6.669%**, 4/1/2009 (e) | | 790,000 | | 837,400 |
Caesars Entertainment, Inc., 9.375%, 2/15/2007 | | 380,000 | | 418,950 |
Carrols Corp., 144A, 9.0%, 1/15/2013 | | 365,000 | | 377,775 |
Charter Communications Holdings LLC: | | | | |
Step-up Coupon, 0% to 5/15/2006, 11.75% to 5/15/2011 | | 2,695,000 | | 1,980,825 |
9.625%, 11/15/2009 (e) | | 2,055,000 | | 1,803,262 |
10.25%, 9/15/2010 | | 3,815,000 | | 4,043,900 |
Cooper Standard Automotive, Inc., 144A, 8.375%, 12/15/2014 | | 515,000 | | 513,713 |
CSC Holdings, Inc., 7.875%, 12/15/2007 | | 1,200,000 | | 1,287,000 |
Dex Media East LLC/Financial, 12.125%, 11/15/2012 | | 4,322,000 | | 5,267,437 |
DIMON, Inc.: | | | | |
7.75%, 6/1/2013 | | 430,000 | | 451,500 |
Series B, 9.625%, 10/15/2011 | | 3,160,000 | | 3,460,200 |
Dura Operating Corp.: | | | | |
Series B, 8.625%, 4/15/2012 (e) | | 410,000 | | 426,400 |
Series B, 9.0%,5/1/2009 EUR | | 185,000 | | 238,888 |
Series D, 9.0%, 5/1/2009 (e) | | 665,000 | | 658,350 |
Dyersburg Corp., Series B, 9.75%, 9/1/2007* | | 1,260,000 | | 126 |
EchoStar DBS Corp., 144A, 6.625%, 10/1/2014 | | 780,000 | | 789,750 |
EPL Intermediate, Inc., Step-up Coupon, 0% to 3/15/2009, 12.5% to 3/15/2010 | | 475,000 | | 311,125 |
Foot Locker, Inc., 8.5%, 1/15/2022 | | 545,000 | | 599,500 |
Friendly Ice Cream Corp., 8.375%, 6/15/2012 (e) | | 1,490,000 | | 1,462,062 |
General Motors Corp., 8.25%, 7/15/2023 | | 970,000 | | 1,010,422 |
Icon Health & Fitness, Inc., 11.25%, 4/1/2012 | | 1,005,000 | | 844,200 |
Imperial Home Decor Group, Inc., Series B, 11.0%, 3/15/2008* | | 1,050,000 | | 0 |
Interep National Radio Sales, Inc., Series B, 10.0%, 7/1/2008 (e) | | 860,000 | | 648,225 |
J Crew Intermediate LLC, Step-up Coupon, 0% to 11/15/2005, 16.0% to 5/15/2008 (e) | | 602,862 | | 572,659 |
Jacobs Entertainment Co., 11.875%, 2/1/2009 | | 2,220,000 | | 2,508,600 |
Kellwood Co., 7.625%, 10/15/2017 | | 230,000 | | 252,952 |
| | |
| | | Principal
Amount ($)(c)
| | Value ($)
|
Levi Strauss & Co.: | | | | |
7.0%, 11/1/2006 (e) | | 935,000 | | 981,750 |
12.25%, 12/15/2012 (e) | | 95,000 | | 105,688 |
Mediacom LLC, 9.5%, 1/15/2013 (e) | | 2,165,000 | | 2,173,119 |
MGM MIRAGE: | | | | |
8.375%, 2/1/2011 (e) | | 1,905,000 | | 2,147,887 |
9.75%, 6/1/2007 | | 380,000 | | 421,800 |
Mothers Work, Inc., 11.25%, 8/1/2010 | | 535,000 | | 518,950 |
NCL Corp., 144A, 10.625%, 7/15/2014 | | 1,290,000 | | 1,290,000 |
Norcraft Holdings/Capital, Step-up Coupon, 0% to 9/1/2008, 9.75% to 9/1/2012 | | 1,090,000 | | 817,500 |
Paxson Communications Corp., 10.75%, 7/15/2008 (e) | | 870,000 | | 913,500 |
PEI Holding, Inc., 11.0%, 3/15/2010 | | 1,310,000 | | 1,526,150 |
Petro Stopping Centers, 9.0%, 2/15/2012 | | 1,730,000 | | 1,829,475 |
Page 107 of 466
| | | | |
Pinnacle Entertainment, Inc., 8.75%, 10/1/2013 (e) | | 425,000 | | 460,063 |
Premier Entertainment Biloxi LLC/Finance, 10.75%, 2/1/2012 | | 940,000 | | 1,026,950 |
PRIMEDIA, Inc.: | | | | |
7.665%**, 5/15/2010 | | 1,655,000 | | 1,754,300 |
8.875%, 5/15/2011 (e) | | 1,110,000 | | 1,173,825 |
Renaissance Media Group LLC, 10.0%, 4/15/2008 | | 1,110,000 | | 1,143,300 |
Rent-Way, Inc., 11.875%, 6/15/2010 | | 650,000 | | 732,063 |
Restaurant Co., 11.25%, 5/15/2008 | | 1,438,991 | | 1,456,978 |
Sbarro, Inc., 11.0%, 9/15/2009 (e) | | 870,000 | | 878,700 |
Schuler Homes, Inc., 10.5%, 7/15/2011 (e) | | 1,210,000 | | 1,376,375 |
Simmons Bedding Co., 144A, Step-up Coupon, 0% to 12/15/2009, 10.0% to 12/15/2014 | | 1,160,000 | | 707,600 |
Sinclair Broadcast Group, Inc.: | | | | |
8.0%, 3/15/2012 | | 2,390,000 | | 2,539,375 |
8.75%, 12/15/2011 | | 1,755,000 | | 1,910,756 |
Sonic Automotive, Inc., Series B, 8.625%, 8/15/2013 (e) | | 1,800,000 | | 1,919,250 |
Toys “R” Us, Inc.: | | | | |
7.375%, 10/15/2018 | | 2,320,000 | | 2,146,000 |
7.875%, 4/15/2013 (e) | | 850,000 | | 843,625 |
True Temper Sports, Inc., 8.375%, 9/15/2011 (e) | | 685,000 | | 637,050 |
Trump Holdings & Funding, 12.625%, 3/15/2010* | | 885,000 | | 958,013 |
TRW Automotive, Inc.: | | | | |
11.0%, 2/15/2013 (e) | | 950,000 | | 1,144,750 |
11.75%, 2/15/2013 EUR | | 490,000 | | 812,559 |
United Auto Group, Inc., 9.625%, 3/15/2012 | | 1,060,000 | | 1,171,300 |
Venetian Casino Resort LLC, 11.0%, 6/15/2010 | | 1,215,000 | | 1,386,619 |
Virgin River Casino Corp., 144A, 9.0%, 1/15/2012 | | 95,000 | | 98,800 |
Visteon Corp.: | | | | |
7.0%, 3/10/2014 (e) | | 1,140,000 | | 1,088,700 |
8.25%, 8/1/2010 (e) | | 860,000 | | 900,850 |
Wheeling Island Gaming, Inc., 10.125%, 12/15/2009 | | 990,000 | | 1,054,350 |
| | |
| | | Principal
Amount ($)(c)
| | Value ($)
|
Williams Scotsman, Inc., 9.875%, 6/1/2007 (e) | | 2,015,000 | | 2,015,000 |
Worldspan LP/WS Finance Corp., 9.625%, 6/15/2011 (e) | | 830,000 | | 825,850 |
Wynn Las Vegas LLC, 144A, 6.625%, 12/1/2014 | | 2,420,000 | | 2,395,800 |
XM Satellite Radio, Inc., Step-up Coupon, 0% to 12/31/2005, 14.0% to 12/31/2009 | | 1,291,934 | | 1,317,773 |
Young Broadcasting, Inc., 8.75%, 1/15/2014 (e) | | 1,595,000 | | 1,606,962 |
| | | | |
|
| | | | | 86,307,049 |
| | | | |
|
Consumer Staples 2.6% | | | | |
Agrilink Foods, Inc., 11.875%, 11/1/2008 | | 588,000 | | 612,255 |
Church & Dwight Co., Inc., 144A, 6.0%, 12/15/2012 | | 580,000 | | 590,150 |
Duane Reade, Inc.: | | | | |
144A, 7.01%**, 12/15/2010 | | 480,000 | | 487,200 |
144A, 9.75%, 8/1/2011 (e) | | 1,255,000 | | 1,142,050 |
North Atlantic Holding, Inc., Step-up Coupon, 0% to 3/1/2008, 12.25% to 3/1/2014 | | 960,000 | | 393,600 |
Pierre Foods, Inc., 144A, 9.875%, 7/15/2012 | | 470,000 | | 486,450 |
Page 108 of 466
| | | | |
Pinnacle Foods Holding Corp., 144A, 8.25%, 12/1/2013 (e) | | 1,420,000 | | 1,352,550 |
Prestige Brands, Inc., 144A, 9.25%, 4/15/2012 | | 240,000 | | 255,000 |
Revlon Consumer Products Corp., 9.0%, 11/1/2006 | | 1,160,000 | | 1,148,400 |
Rite Aid Corp., 11.25%, 7/1/2008 (e) | | 1,725,000 | | 1,871,625 |
Standard Commercial Corp., 8.0%, 4/15/2012 | | 580,000 | | 595,950 |
Swift & Co., 12.5%, 1/1/2010 (e) | | 1,005,000 | | 1,135,650 |
VICORP Restaurants, Inc., 10.5%, 4/15/2011 (e) | | 680,000 | | 683,400 |
Wornick Co., 10.875%, 7/15/2011 | | 955,000 | | 1,036,175 |
| | | | |
|
| | | | | 11,790,455 |
| | | | |
|
Energy 4.6% | | | | |
Avista Corp., 9.75%, 6/1/2008 | | 1,700,000 | | 1,971,082 |
Chesapeake Energy Corp.: | | | | |
6.875%, 1/15/2016 | | 1,025,000 | | 1,073,687 |
9.0%, 8/15/2012 | | 645,000 | | 736,913 |
CITGO Petroleum Corp., 144A, 6.0%, 10/15/2011 | | 445,000 | | 442,775 |
Dynegy Holdings, Inc.: | | | | |
6.875%, 4/1/2011 (e) | | 255,000 | | 245,438 |
7.125%, 5/15/2018 | | 1,210,000 | | 1,078,412 |
7.625%, 10/15/2026 | | 405,000 | | 351,844 |
144A, 9.875%, 7/15/2010 | | 1,350,000 | | 1,508,625 |
Edison Mission Energy, 7.73%, 6/15/2009 | | 2,615,000 | | 2,811,125 |
El Paso Production Holding Corp., 7.75%, 6/1/2013 | | 1,335,000 | | 1,398,412 |
Mission Resources Corp., 9.875%, 4/1/2011 | | 1,070,000 | | 1,142,225 |
Newpark Resources, Inc., Series B, 8.625%, 12/15/2007 | | 1,470,000 | | 1,492,050 |
NGC Corp. Capital Trust I, Series B, 8.316%, 6/1/2027 (e) | | 470,000 | | 398,913 |
Southern Natural Gas, 8.875%, 3/15/2010 (e) | | 810,000 | | 907,200 |
| | |
| | | Principal
Amount ($)(c)
| | Value ($)
|
Stone Energy Corp.: | | | | |
144A, 6.75%, 12/15/2014 | | 635,000 | | 633,412 |
8.25%, 12/15/2011 | | 1,570,000 | | 1,695,600 |
Williams Cos., Inc.: | | | | |
8.125%, 3/15/2012 (e) | | 1,540,000 | | 1,778,700 |
8.75%, 3/15/2032 | | 820,000 | | 941,975 |
| | | | |
|
| | | | | 20,608,388 |
| | | | |
|
Financials 8.0% | | | | |
AAC Group Holding Corp., 144A, Step-up Coupon, 0% to 10/1/2008, 10.25% to 10/1/2012 | | 970,000 | | 652,325 |
Affinia Group, Inc., 144A, 9.0%, 11/30/2014 | | 1,805,000 | | 1,881,712 |
Ahold Finance USA, Inc., 6.25%, 5/1/2009 | | 715,000 | | 743,600 |
Alamosa Delaware, Inc., Step-up Coupon, 0% to 7/31/2005, 12.0% to 7/31/2009 | | 633,000 | | 686,805 |
American Commercial Bank, 6.5%, 6/30/2006 | | 1,250,000 | | 1,281,250 |
AmeriCredit Corp., 9.25%, 5/1/2009 | | 2,445,000 | | 2,622,263 |
Atlantic Mutual Insurance Co., 144A, 8.15%, 2/15/2028 | | 605,000 | | 368,930 |
BF Saul Real Estate Investment Trust, 7.5%, 3/1/2014 | | 1,765,000 | | 1,817,950 |
DFG Holdings, Inc.: | | | | |
144A, 13.95%, 5/15/2012 | | 467,238 | | 467,238 |
Page 109 of 466
| | | | |
144A, 16.0%, 5/15/2012 | | 476,302 | | 523,932 |
Dow Jones CDX: | | | | |
144A, Series 3-1, 7.75%, 12/29/2009 (e) | | 1,550,000 | | 1,593,593 |
144A, Series 3-3, 8.0%, 12/29/2009 | | 1,550,000 | | 1,589,719 |
E*TRADE Financial Corp., 144A, 8.0%, 6/15/2011 | | 1,820,000 | | 1,956,500 |
Farmers Insurance Exchange, 144A, 8.625%, 5/1/2024 | | 1,865,000 | | 2,199,878 |
FINOVA Group, Inc., 7.5%, 11/15/2009 | | 10,464,550 | | 5,127,629 |
FRD Acquisition Co., Series B, 12.5%, 7/15/2004* | | 210,000 | | 0 |
Level 3 Commerce Bank, Zero Coupon, 12/15/2011 | | 1,000,000 | | 1,032,500 |
LNR Property Corp., 7.625%, 7/15/2013 | | 555,000 | | 629,925 |
Poster Financial Group, Inc., 8.75%, 12/1/2011 (e) | | 1,175,000 | | 1,207,313 |
PXRE Capital Trust I, 8.85%, 2/1/2027 | | 1,055,000 | | 1,055,000 |
Qwest Capital Funding, Inc., 6.5%, 11/15/2018 | | 1,140,000 | | 946,200 |
R.H. Donnelly Finance Corp., 10.875%, 12/15/2012 | | 500,000 | | 593,750 |
Radnor Holdings Corp., 11.0%, 3/15/2010 | | 1,060,000 | | 908,950 |
Thornburg Mortgage, Inc., 8.0%, 5/15/2013 | | 255,000 | | 270,938 |
TIG Capital Holdings Trust, 144A, 8.597%, 1/15/2027 | | 1,465,000 | | 1,285,538 |
UAP Holdings Corp., 144A, Step-up Coupon, 0% to 1/15/2008, 10.75% to 7/15/2012 | | 665,000 | | 522,025 |
UGS Corp., 144A, 10.0%, 6/1/2012 | | 805,000 | | 915,688 |
Universal City Development, 11.75%, 4/1/2010 | | 1,800,000 | | 2,126,250 |
| | |
| | | Principal
Amount ($)(c)
| | Value ($)
|
Universal City Florida Holding Co., 144A, 7.2%**, 5/1/2010 | | 465,000 | | 483,600 |
Venoco, Inc., 144A, 8.75%, 12/15/2011 | | 505,000 | | 520,150 |
| | | | |
|
| | | | | 36,011,151 |
| | | | |
|
Health Care 2.5% | | | | |
AmeriPath, Inc., 10.5%, 4/1/2013 | | 760,000 | | 807,500 |
AmerisourceBergen Corp., 7.25%, 11/15/2012 | | 15,000 | | 16,762 |
Cinacalcet Royalty Subordinated LLC, 8.0%, 3/30/2017 | | 1,005,000 | | 1,010,025 |
Curative Health Services, Inc., 10.75%, 5/1/2011 | | 645,000 | | 577,275 |
Encore Medical Corp., 144A, 9.75%, 10/1/2012 | | 605,000 | | 611,050 |
Hanger Orthopedic Group, Inc., 10.375%, 2/15/2009 (e) | | 1,030,000 | | 1,063,475 |
HEALTHSOUTH Corp., 10.75%, 10/1/2008 (e) | | 1,650,000 | | 1,740,750 |
IDI Acquisition Corp., 144A, 10.75%, 12/15/2011 | | 355,000 | | 363,875 |
InSight Health Services Corp., Series B, 9.875%, 11/1/2011 (e) | | 745,000 | | 752,450 |
Interactive Health LLC, 144A, 8.0%, 4/1/2011 | | 815,000 | | 709,050 |
National Mentor, Inc., 144A, 9.625%, 12/1/2012 | | 140,000 | | 148,750 |
Tenet Healthcare Corp., 6.375%, 12/1/2011 (e) | | 3,800,000 | | 3,524,500 |
| | | | |
|
| | | | | 11,325,462 |
| | | | |
|
Industrials 11.0% | | | | |
Aavid Thermal Technologies, Inc., 12.75%, 2/1/2007 | | 960,000 | | 1,051,200 |
Allied Security Escrow Corp., 144A, 11.375%, 7/15/2011 | | 980,000 | | 1,024,100 |
Allied Waste North America, Inc., Series B, 5.75%, 2/15/2011 | | 3,110,000 | | 2,923,400 |
AMI Semiconductor, Inc., 10.75%, 2/1/2013 | | 323,000 | | 379,525 |
Page 110 of 466
| | | | |
Avondale Mills, Inc.: | | | | |
144A, 9.00%**, 7/1/2012 | | 1,125,000 | | 1,012,500 |
10.25%, 7/1/2013 | | 365,000 | | 295,650 |
Browning-Ferris Industries: | | | | |
7.4%, 9/15/2035 | | 830,000 | | 726,250 |
9.25%, 5/1/2021 | | 485,000 | | 516,525 |
Cenveo Corp., 7.875%, 12/1/2013 (e) | | 1,275,000 | | 1,185,750 |
Clean Harbors, Inc., 144A, 11.25%, 7/15/2012 | | 715,000 | | 800,800 |
Collins & Aikman Floor Cover, Series B, 9.75%, 2/15/2010 | | 2,105,000 | | 2,262,875 |
Collins & Aikman Products, 10.75%, 12/31/2011 (e) | | 1,150,000 | | 1,173,000 |
Congoleum Corp., 8.625%, 8/1/2008* | | 595,000 | | 600,950 |
Continental Airlines, Inc., 8.0%, 12/15/2005 (e) | | 1,040,000 | | 1,014,000 |
Cornell Companies, Inc., 10.75%, 7/1/2012 | | 1,360,000 | | 1,453,500 |
Corrections Corp. of America, 9.875%, 5/1/2009 | | 1,285,000 | | 1,426,350 |
Dana Corp., 7.0%, 3/1/2029 | | 1,535,000 | | 1,531,163 |
| | |
| | | Principal Amount ($)(c)
| | Value ($)
|
Delta Air Lines, Inc.: | | | | |
7.9%, 12/15/2009 (e) | | 505,000 | | 315,625 |
8.3%, 12/15/2029 (e) | | 685,000 | | 332,225 |
Eagle-Picher Industries, Inc., 9.75%, 9/1/2013 | | 215,000 | | 215,000 |
Erico International Corp., 8.875%, 3/1/2012 | | 905,000 | | 950,250 |
Evergreen International Aviation, Inc., 12.0%, 5/15/2010 | | 310,000 | | 234,825 |
Goodman Global Holding Co., Inc., 144A, 7.875%, 12/15/2012 | | 1,515,000 | | 1,499,850 |
GS Technologies Operating Co., Inc., 12.0%, 9/1/2024* | | 315,268 | | 788 |
Interface, Inc., 10.375%, 2/1/2010 | | 445,000 | | 511,750 |
ISP Chemco, Inc., Series B, 10.25%, 7/1/2011 | | 1,615,000 | | 1,824,950 |
Joy Global, Inc., Series B, 8.75%, 3/15/2012 | | 145,000 | | 162,400 |
Kansas City Southern: | | | | |
7.5%, 6/15/2009 | | 1,520,000 | | 1,596,000 |
9.5%, 10/1/2008 | | 1,735,000 | | 1,971,394 |
Kinetek, Inc., Series D, 10.75%, 11/15/2006 | | 2,170,000 | | 2,121,175 |
Laidlaw International, Inc., 10.75%, 6/15/2011 | | 1,140,000 | | 1,330,950 |
Millennium America, Inc.: | | | | |
7.625%, 11/15/2026 (e) | | 1,980,000 | | 1,950,300 |
9.25%, 6/15/2008 (e) | | 1,865,000 | | 2,121,437 |
Remington Arms Co., Inc., 10.5%, 2/1/2011 (e) | | 895,000 | | 863,675 |
Sea Containers Ltd., 10.5%, 5/15/2012 | | 580,000 | | 610,450 |
Securus Technologies, Inc., 144A, 11.0%, 9/1/2011 | | 1,100,000 | | 1,100,000 |
Ship Finance International Ltd., 8.5%, 12/15/2013 | | 1,275,000 | | 1,313,250 |
SPX Corp.: | | | | |
6.25%, 6/15/2011 (e) | | 400,000 | | 422,000 |
7.5%, 1/1/2013 | | 1,440,000 | | 1,562,400 |
Technical Olympic USA, Inc.: | | | | |
7.5%, 3/15/2011 | | 405,000 | | 408,038 |
10.375%, 7/1/2012 | | 1,210,000 | | 1,355,200 |
Texas Genco LLC, 144A, 6.875%, 12/15/2014 | | 1,155,000 | | 1,193,981 |
The Brickman Group, Ltd., Series B, 11.75%, 12/15/2009 | | 770,000 | | 900,900 |
Page 111 of 466
| | | | |
Thermadyne Holdings Corp., 9.25%, 2/1/2014 | | 825,000 | | 804,375 |
United Rentals North America, Inc.: | | | | |
6.5%, 2/15/2012 | | 1,140,000 | | 1,111,500 |
7.0%, 2/15/2014 (e) | | 930,000 | | 869,550 |
7.75%, 11/15/2013 (e) | | 580,000 | | 568,400 |
Westlake Chemical Corp., 8.75%, 7/15/2011 | | 110,000 | | 124,300 |
| | | | |
|
| | | | | 49,724,476 |
| | | | |
|
Information Technology 1.3% | | | | |
Activant Solutions, Inc., 10.5%, 6/15/2011 | | 1,075,000 | | 1,155,625 |
Itron, Inc., 144A, 7.75%, 5/15/2012 | | 705,000 | | 717,337 |
Lucent Technologies, Inc.: | | | | |
6.45%, 3/15/2029 (e) | | 3,055,000 | | 2,764,775 |
7.25%, 7/15/2006 (e) | | 400,000 | | 418,000 |
| | |
| | | Principal Amount ($)(c)
| | Value ($)
|
Spheris, Inc., 144A, 11.0%, 12/15/2012 | | 605,000 | | 620,125 |
| | | | |
|
| | | | | 5,675,862 |
| | | | |
|
Materials 11.1% | | | | |
Aqua Chemical, Inc., 11.25%, 7/1/2008 | | 1,220,000 | | 976,000 |
ARCO Chemical Co., 9.8%, 2/1/2020 (e) | | 4,955,000 | | 5,648,700 |
Associated Materials, Inc., Step-up Coupon, 0% to 3/1/2009, 11.25% to 3/1/2014 | | 2,765,000 | | 1,990,800 |
Caraustar Industries, Inc., 9.875%, 4/1/2011 (e) | | 1,040,000 | | 1,128,400 |
Constar International, Inc., 11.0%, 12/1/2012 (e) | | 1,185,000 | | 1,229,438 |
Dayton Superior Corp.: | | | | |
10.75%, 9/15/2008 | | 1,030,000 | | 1,102,100 |
13.0%, 6/15/2009 (e) | | 2,350,000 | | 2,444,000 |
GEO Specialty Chemicals, Inc.: | | | | |
1.0%, 12/31/2009* | | 368,000 | | 368,000 |
10.125%, 8/1/2008* | | 765,000 | | 443,700 |
Georgia-Pacific Corp.: | | | | |
8.0%, 1/15/2024 | | 2,820,000 | | 3,271,200 |
9.375%, 2/1/2013 | | 1,320,000 | | 1,537,800 |
Hercules, Inc.: | | | | |
6.75%, 10/15/2029 | | 855,000 | | 882,788 |
11.125%, 11/15/2007 | | 1,220,000 | | 1,451,800 |
Hexcel Corp., 9.75%, 1/15/2009 (e) | | 980,000 | | 1,019,200 |
Huntsman Advanced Materials, 144A, 11.0%, 7/15/2010 | | 1,225,000 | | 1,457,750 |
Huntsman International LLC: | | | | |
144A, 7.375%, 1/1/2015 (e) | | 355,000 | | 355,888 |
144A, 7.5%, 1/1/2015 | | 205,000 | | 278,646 |
Huntsman LLC, 11.625%, 10/15/2010 | | 1,610,000 | | 1,903,825 |
IMC Global, Inc., 10.875%, 8/1/2013 (e) | | 115,000 | | 143,750 |
Intermet Corp.: | | | | |
144A, 1.0%, 3/31/2009 | | 2,000,000 | | 1,750,000 |
9.75%, 6/15/2009* (e) | | 600,000 | | 294,000 |
International Steel Group, Inc., 6.5%, 4/15/2014 | | 2,245,000 | | 2,407,762 |
Page 112 of 466
| | | | |
MMI Products, Inc., Series B, 11.25%, 4/15/2007 | | 1,015,000 | | 1,030,225 |
Neenah Corp.: | | | | |
144A, 11.0%, 9/30/2010 | | 1,922,000 | | 2,123,810 |
144A, 13.0%, 9/30/2013 | | 1,102,460 | | 1,130,021 |
Omnova Solutions, Inc., 11.25%, 6/1/2010 | | 1,595,000 | | 1,794,375 |
Owens-Brockway Glass Container, 8.25%, 5/15/2013 | | 400,000 | | 440,000 |
Oxford Automotive, Inc., 144A, 12.0%, 10/15/2010* (e) | | 1,975,000 | | 1,244,250 |
Pliant Corp.: | | | | |
Step-up Coupon, 0% to 12/15/2006, 11.125% to 6/15/2009 | | 220,000 | | 203,225 |
11.125%, 9/1/2009 | | 1,385,000 | | 1,509,650 |
Portola Packaging, Inc., 8.25%, 2/1/2012 (e) | | 910,000 | | 718,900 |
Rockwood Specialties Group, Inc., 144A, 7.625%, 11/15/2014 | | 1,790,000 | | 2,503,007 |
| | |
| | | Principal Amount ($)(c)
| | Value ($)
|
Sheffield Steel Corp., 144A, 11.375%, 8/15/2011 | | 595,000 | | 612,850 |
TriMas Corp., 9.875%, 6/15/2012 | | 2,630,000 | | 2,787,800 |
United States Steel LLC: | | | | |
9.75%, 5/15/2010 | | 1,254,000 | | 1,429,560 |
10.75%, 8/1/2008 (e) | | 155,000 | | 182,513 |
| | | | |
|
| | | | | 49,795,733 |
| | | | |
|
Telecommunication Services 8.6% | | | | |
AirGate PCS, Inc., 144A, 5.85%**, 10/15/2011 | | 505,000 | | 518,888 |
American Cellular Corp., Series B, 10.0%, 8/1/2011 | | 3,515,000 | | 3,014,112 |
American Tower Corp., 144A, 7.125%, 10/15/2012 | | 580,000 | | 593,050 |
AT&T Corp.: | | | | |
9.05%, 11/15/2011 | | 1,205,000 | | 1,387,256 |
9.75%, 11/15/2031 | | 1,170,000 | | 1,396,688 |
Cincinnati Bell, Inc., 8.375%, 1/15/2014 (e) | | 4,425,000 | | 4,480,312 |
Crown Castle International Corp., 9.375%, 8/1/2011 | | 720,000 | | 806,400 |
Dobson Cellular Systems, Inc., 144A, 6.96%**, 11/1/2011 | | 450,000 | | 465,750 |
Dobson Communications Corp., 8.875%, 10/1/2013 | | 1,255,000 | | 881,637 |
GCI, Inc., 7.25%, 2/15/2014 | | 840,000 | | 840,000 |
Insight Midwest LP, 9.75%, 10/1/2009 (e) | | 610,000 | | 638,975 |
IWO Escrow Co., 144A, 6.32%**, 1/15/2012 | | 100,000 | | 100,750 |
LCI International, Inc., 7.25%, 6/15/2007 | | 1,610,000 | | 1,565,725 |
Level 3 Financing, Inc., 144A, 10.75%, 10/15/2011 (e) | | 605,000 | | 547,525 |
MCI, Inc., 8.735%, 5/1/2014 | | 3,360,000 | | 3,612,000 |
Nextel Communications, Inc., 5.95%, 3/15/2014 | | 705,000 | | 729,675 |
Nextel Partners, Inc., 8.125%, 7/1/2011 | | 950,000 | | 1,054,500 |
Northern Telecom Capital, 7.875%, 6/15/2026 (e) | | 865,000 | | 856,350 |
PanAmSat Corp., 144A, 9.0%, 8/15/2014 | | 2,160,000 | | 2,411,100 |
Qwest Corp., 7.25%, 9/15/2025 | | 3,390,000 | | 3,296,775 |
Qwest Services Corp.: | | | | |
6.95%, 6/30/2010 | | 1,665,000 | | 1,709,331 |
144A, 13.5%, 12/15/2010 | | 1,940,000 | | 2,332,850 |
144A, 14.0%, 12/15/2014 | | 1,550,000 | | 1,960,750 |
Page 113 of 466
| | | | |
Rural Cellular Corp., 9.875%, 2/1/2010 (e) | | 895,000 | | 910,662 |
SBA Telecom, Inc., Step-up Coupon, 0% to 12/15/2007, 9.75% to 12/15/2011 | | 405,000 | | 341,213 |
Triton PCS, Inc., 8.5%, 6/1/2013 | | 695,000 | | 670,675 |
Ubiquitel Operating Co., 9.875%, 3/1/2011 | | 190,000 | | 213,275 |
US Unwired, Inc., Series B, 10.0%, 6/15/2012 (e) | | 1,210,000 | | 1,364,275 |
Western Wireless Corp., 9.25%, 7/15/2013 | | 200,000 | | 217,500 |
| | | | |
|
| | | | | 38,917,999 |
| | | | |
|
Utilities 3.8% | | | | |
AES Corp., 144A, 8.75%, 5/15/2013 | | 395,000 | | 448,819 |
| | |
| | | Principal Amount ($)(c)
| | Value ($)
|
Allegheny Energy Supply Co. LLC: | | | | |
144A, 8.25%, 4/15/2012 (e) | | 765,000 | | 854,887 |
144A, 10.25%, 11/15/2007 | | 15,000 | | 17,025 |
Aquila, Inc., 14.875%, 7/1/2012 | | 405,000 | | 567,506 |
Calpine Corp.: | | | | |
8.25%, 8/15/2005 (e) | | 1,065,000 | | 1,075,650 |
144A, 8.5%, 7/15/2010 (e) | | 1,495,000 | | 1,281,962 |
CMS Energy Corp., 8.5%, 4/15/2011 | | 150,000 | | 170,438 |
DPL, Inc., 6.875%, 9/1/2011 | | 2,795,000 | | 3,052,509 |
Midwest Generation LLC, 8.75%, 5/1/2034 | | 585,000 | | 663,975 |
Mission Energy Holding Co., 13.5%, 7/15/2008 | | 205,000 | | 255,738 |
NorthWestern Corp., 144A, 5.875%, 11/1/2014 (e) | | 385,000 | | 393,844 |
NRG Energy, Inc., 144A, 8.0%, 12/15/2013 | | 3,585,000 | | 3,907,650 |
PSE&G Energy Holdings LLC: | | | | |
8.5%, 6/15/2011 | | 1,115,000 | | 1,272,494 |
10.0%, 10/1/2009 | | 1,350,000 | | 1,596,375 |
TNP Enterprises, Inc., Series B, 10.25%, 4/1/2010 | | 1,460,000 | | 1,558,550 |
| | | | |
|
| | | | | 17,117,422 |
| | | | |
|
Total Corporate Bonds (Cost $321,181,919) | | | | 327,273,997 |
| | | | |
|
Asset Backed 0.6% | | | | |
| | | | | |
Golden Tree High Yield Opportunities LP, “D1”, Series 1, 13.054%, 10/31/2007 (Cost $2,500,000) | | 2,500,000 | | 2,582,250 |
| | | | |
|
Foreign Bonds — US$ Denominated 20.1% | | | | |
Consumer Discretionary 2.7% | | | | |
Advertising Directory Solutions, Inc., 144A, 9.25%, 11/15/2012 (e) | | 810,000 | | 850,500 |
Grupo Posadas SA de CV, 144A, Series A, 8.75%, 10/4/2011 | | 10,000 | | 10,675 |
Jafra Cosmetics International, Inc., 10.75%, 5/15/2011 | | 1,705,000 | | 1,926,650 |
Kabel Deutschland GmbH, 144A, 10.625%, 7/1/2014 | | 1,775,000 | | 2,041,250 |
Shaw Communications, Inc.: | | | | |
7.2%, 12/15/2011 (e) | | 195,000 | | 215,231 |
7.25%, 4/6/2011 (e) | | 730,000 | | 804,825 |
8.25%, 4/11/2010 | | 2,510,000 | | 2,855,125 |
Telenet Group Holding NV, 144A, Step-up Coupon, 0% to 12/15/2008, 11.5% to 6/15/2014 | | 1,745,000 | | 1,326,200 |
Vicap SA, 11.375%, 5/15/2007 | | 395,000 | | 399,938 |
Page 114 of 466
| | | | |
Vitro Envases Norteamerica SA, 144A, 10.75%, 7/23/2011 | | 655,000 | | 679,563 |
Vitro SA de CV, Series A, 144A, 11.75%, 11/1/2013 (e) | | 1,225,000 | | 1,185,187 |
| | | | |
|
| | | | | 12,295,144 |
| | | | |
|
Consumer Staples 1.0% | | | | |
Burns, Philip Capital Property Ltd., 10.75%, 2/15/2011 | | 1,055,000 | | 1,186,875 |
Fage Dairy Industry SA, 9.0%, 2/1/2007 | | 2,913,000 | | 2,927,565 |
| | |
| | | Principal Amount ($)(c)
| | Value ($)
|
Grupo Cosan SA, 144A, 9.0%, 11/1/2009 | | 375,000 | | 391,875 |
| | | | |
|
| | | | | 4,506,315 |
| | | | |
|
Energy 2.3% | | | | |
Gazprom OAO, 144A, 9.625%, 3/1/2013 | | 1,975,000 | | 2,330,500 |
Luscar Coal Ltd., 9.75%, 10/15/2011 | | 1,415,000 | | 1,606,025 |
Petroleum Geo-Services ASA, 10.0%, 11/5/2010 | | 4,755,066 | | 5,420,775 |
Secunda International Ltd., 144A, 9.76%**, 9/1/2012 | | 1,005,000 | | 984,900 |
| | | | |
|
| | | | | 10,342,200 |
| | | | |
|
Financials 1.0% | | | | |
Conproca SA de CV, 12.0%, 6/16/2010 | | 920,000 | | 1,159,200 |
Eircom Funding, 8.25%, 8/15/2013 | | 1,160,000 | | 1,281,800 |
Mizuho Financial Group, 8.375%, 12/29/2049 | | 590,000 | | 646,581 |
New ASAT (Finance) Ltd., 144A, 9.25%, 2/1/2011 | | 1,375,000 | | 1,247,812 |
| | | | |
|
| | | | | 4,335,393 |
| | | | |
|
Health Care 0.2% | | | | |
Biovail Corp., 7.875%, 4/1/2010 (e) | | 760,000 | | 786,600 |
Elan Financial PLC, 144A, 7.75%, 11/15/2011 | | 225,000 | | 239,625 |
| | | | |
|
| | | | | 1,026,225 |
| | | | |
|
Industrials 2.1% | | | | |
CP Ships Ltd., 10.375%, 7/15/2012 | | 1,280,000 | | 1,476,800 |
Grupo Transportacion Ferroviaria Mexicana SA de CV: | | | | |
10.25%, 6/15/2007 | | 2,480,000 | | 2,641,200 |
11.75%, 6/15/2009 | | 1,510,000 | | 1,538,313 |
12.5%, 6/15/2012 | | 1,451,000 | | 1,694,042 |
LeGrand SA, 8.5%, 2/15/2025 | | 1,235,000 | | 1,457,300 |
Stena AB: | | | | |
144A, 7.0%, 12/1/2016 | | 385,000 | | 381,150 |
9.625%, 12/1/2012 | | 395,000 | | 446,350 |
Supercanal Holding SA, 11.5%, 5/15/2005* | | 100,000 | | 9,000 |
| | | | |
|
| | | | | 9,644,155 |
| | | | |
|
Information Technology 0.6% | | | | |
Flextronics International Ltd., 144A, 6.25%, 11/15/2014 | | 1,480,000 | | 1,465,200 |
Magnachip Semiconductor SA: | | | | |
144A, 6.875%, 12/15/2011 | | 510,000 | | 525,300 |
144A, 8.0%, 12/15/2014 | | 485,000 | | 505,612 |
| | | | |
|
| | | | | 2,496,112 |
| | | | |
|
Materials 3.6% | | | | |
Alrosa Finance SA, 144A, 8.875%, 11/17/2014 | | 955,000 | | 981,263 |
Page 115 of 466
| | | | |
Avecia Group PLC, 11.0%, 7/1/2009 | | 2,815,000 | | 2,899,450 |
Cascades, Inc.: | | | | |
7.25%, 2/15/2013 | | 1,695,000 | | 1,796,700 |
144A, 7.25%, 2/15/2013 | | 95,000 | | 100,700 |
Citigroup (JSC Severstal), 144A, 9.25%, 4/19/2014 | | 1,410,000 | | 1,402,950 |
Citigroup Global (Severstal), 8.625%, 2/24/2009 | | 124,000 | | 124,508 |
| | |
| | | Principal Amount ($)(c)
| | Value ($)
|
Corp. Durango SA: | | | | |
13.125%, 8/1/2006* | | 350,000 | | 236,250 |
144A, 13.75%, 7/15/2009* | | 350,000 | | 234,500 |
Crown Euro Holdings SA, 10.875%, 3/1/2013 | | 895,000 | | 1,058,337 |
ISPAT Inland ULC, 9.75%, 4/1/2014 | | 1,141,000 | | 1,409,135 |
Rhodia SA, 8.875%, 6/1/2011 (e) | | 950,000 | | 957,125 |
Sino-Forest Corp., 144A, 9.125%, 8/17/2011 | | 635,000 | | 693,738 |
Tembec Industries, Inc., 8.5%, 2/1/2011 (e) | | 4,475,000 | | 4,497,375 |
| | | | |
|
| | | | | 16,392,031 |
| | | | |
|
Sovereign Bonds 1.8% | | | | |
Aries Vermogensverwaltung GmbH, 144A, Series C, 9.6%, 10/25/2014 | | 1,500,000 | | 1,845,000 |
Dominican Republic, 144A, 9.04%, 1/23/2013 | | 510,000 | | 422,025 |
Federative Republic of Brazil, 8.875%, 10/14/2019 | | 1,545,000 | | 1,628,430 |
Republic of Argentina: | | | | |
11.375%, 3/15/2010* | | 1,980,000 | | 673,200 |
Series BGL5, 11.375%, 1/30/2017* | | 775,000 | | 263,500 |
11.375%, 6/15/2015* | | 475,000 | | 160,313 |
11.75%, 4/7/2009* | | 1,340,000 | | 455,600 |
Series 2031, 12.0%, 6/19/2031* | | 376,300 | | 123,238 |
12.375%, 2/21/2012* (e) | | 1,205,000 | | 406,687 |
Republic of Turkey: | | | | |
7.25%, 3/15/2015 (e) | | 710,000 | | 729,525 |
9.0%, 6/30/2011 | | 440,000 | | 502,700 |
9.5%, 1/15/2014 | | 260,000 | | 306,800 |
Republic of Uruguay, 7.875%, 1/15/2033 (PIK) | | 999 | | 887 |
Russian Ministry of Finance, Series VII, 3.0%, 5/14/2011 | | 470,000 | | 396,351 |
| | | | |
|
| | | | | 7,914,256 |
| | | | |
|
Telecommunication Services 4.3% | | | | |
Alestra SA de RL de CV, 8.0%, 6/30/2010 | | 235,000 | | 199,163 |
Axtel SA, 11.0%, 12/15/2013 | | 1,440,000 | | 1,551,600 |
Embratel, Series B, 11.0%, 12/15/2008 | | 985,000 | | 1,122,900 |
Esprit Telecom Group PLC: | | | | |
10.875%, 6/15/2008* | | 800,000 | | 80 |
11.5%, 12/15/2007* | | 1,625,000 | | 163 |
Global Crossing UK Finance, 144A, 10.75%, 12/15/2014 | | 1,220,000 | | 1,204,750 |
Grupo Iusacell SA de CV, Series B, 10.0%, 7/15/2004* | | 240,000 | | 184,800 |
Inmarsat Finance PLC, 7.625%, 6/30/2012 | | 1,075,000 | | 1,118,000 |
Innova S. de R.L., 9.375%, 9/19/2013 (e) | | 755,000 | | 858,812 |
Page 116 of 466
| | | | |
INTELSAT, 6.5%, 11/1/2013 | | 1,435,000 | | 1,305,850 |
Millicom International Cellular SA, 144A, 10.0%, 12/1/2013 | | 2,335,000 | | 2,442,994 |
Mobifon Holdings BV, 12.5%, 7/31/2010 | | 1,760,000 | | 2,087,800 |
Mobile Telesystems Financial, 144A, 8.375%, 10/14/2010 | | 805,000 | | 821,100 |
Nortel Networks Corp., 6.875%, 9/1/2023 | | 1,345,000 | | 1,264,300 |
| | |
| | | Principal
Amount ($)(c)
| | Value ($)
|
Nortel Networks Ltd., 6.125%, 2/15/2006 | | 4,165,000 | | 4,237,887 |
Rogers Wireless Communications, Inc., 6.375%, 3/1/2014 | | 880,000 | | 871,200 |
| | | | |
|
| | | | | 19,271,399 |
| | | | |
|
Utilities 0.5% | | | | |
Calpine Canada Energy Finance, 8.5%, 5/1/2008 (e) | | 2,690,000 | | 2,205,800 |
| | | | |
|
Total Foreign Bonds — US$ Denominated (Cost $88,697,061) | | | | 90,429,030 |
| | | | |
|
Foreign Bonds — Non US$ Denominated 1.7% | | | | |
Consumer Discretionary 0.1% | | | | |
Victoria Acquisition III BV, 144A, 7.875%, 10/1/2014 EUR | | 460,000 | | 628,381 |
| | | | |
|
Industrials 0.5% | | | | |
Grohe Holdings GmbH, 144A, 8.625%, 10/1/2014 EUR | | 1,375,000 | | 1,999,796 |
| | | | |
|
Materials 0.6% | | | | |
Huntsman International LLC, 10.125%, 7/1/2009 EUR | | 995,000 | | 1,423,457 |
Rhodia SA, 9.25%, 6/1/2011 EUR | | 865,000 | | 1,196,327 |
| | | | |
|
| | | | | 2,619,784 |
| | | | |
|
Sovereign Bonds 0.5% | | | | |
Mexican Bonds, Series MI-10, 8.0%, 12/19/2013 MXN | | 15,202,000 | | 1,214,714 |
Republic of Argentina: | | | | |
8.0%, 2/26/2008* EUR | | 775,000 | | 310,759 |
Series FEB, 8.0%, 2/26/2008* EUR | | 560,000 | | 222,645 |
10.25%, 2/6/2049* EUR | | 956,116 | | 376,884 |
10.25%, 11/14/2049* EUR | | 465,276 | | 183,403 |
11.25%, 4/10/2006* EUR | | 273,541 | | 116,191 |
12.0%, 9/19/2016* EUR | | 35,790 | | 14,352 |
| | | | |
|
| | | | | 2,438,948 |
| | | | |
|
Total Foreign Bonds — Non US$ Denominated (Cost $6,648,149) | | | | 7,686,909 |
| | | | |
|
Convertible Bond 0.5% | | | | |
DIMON, Inc., 6.25%, 3/31/2007 | | 1,600,000 | | 1,500,000 |
HIH Capital Ltd.: | | | | |
144A, Series DOM, 7.5%, 9/25/2006 | | 665,000 | | 658,350 |
144A, Series EURO, 7.5%, 9/25/2006 | | 85,000 | | 84,150 |
| | | | |
|
Total Convertible Bond (Cost $2,209,763) | | | | 2,242,500 |
| | | | |
|
Common Stocks 0.0% | | | | |
Catalina Restaurant Group, Inc.* | | 3,870 | | 6,192 |
IMPSAT Fiber Networks, Inc.* | | 33,652 | | 193,499 |
| | | | |
|
Total Common Stocks (Cost $1,938,197) | | | | 199,691 |
| | | | |
|
Page 117 of 466
| | | | |
| | | Shares
| | Value ($)
|
Warrants 0.0% | | | | |
Dayton Superior Corp., 144A* | | 90 | | 1 |
DeCrane Aircraft Holdings, Inc., 144A* | | 1,350 | | 14 |
Destia Communications, Inc., 144A* | | 1,260 | | 0 |
Hayes Lemmerz International, Inc.* | | 1,690 | | 642 |
TravelCenters of America, Inc.* | | 280 | | 1,400 |
UIH Australia Pacific, Inc.* | | 750 | | 0 |
| | | | |
|
Total Warrants (Cost $1,583) | | | | 2,057 |
| | | | |
|
Preferred Stocks 0.5% | | | | |
Paxson Communications Corp., 14.25%, (PIK) | | 199 | | 1,462,650 |
TNP Enterprises, Inc., 14.5%, “D”, (PIK) | | 8,000 | | 928,000 |
| | | | |
|
Total Preferred Stocks (Cost $2,734,260) | | | | 2,390,650 |
| | | | |
|
Other Investments 0.7% | | | | |
Hercules Trust II, (Bond Unit) | | 3,680,000 | | 3,091,200 |
| | |
| | | Shares
| | Value ($)
|
SpinCycle, Inc., “F” (Common Stock Unit)* | | 69 | | 76 |
SpinCycle, Inc., (Common Stock Unit)* | | 9,913 | | 10,904 |
| | | | |
|
Total Other Investments (Cost $2,667,709) | | | | 3,102,180 |
| | | | |
|
Securities Lending Collateral 16.6% | | | | |
Daily Assets Fund Institutional, 2.25% (d) (f) (Cost $74,814,217) | | 74,814,217 | | 74,814,217 |
| | | | |
|
Cash Equivalents 1.6% | | | | |
Scudder Cash Management QP Trust, 2.24% (b) (Cost $7,191,545) | | 7,191,545 | | 7,191,545 |
| | | | |
|
| | | | | | |
| | | % of Net Assets
| | | Value ($)
| |
Total Investment Portfolio (Cost $510,584,403) (a) | | 115.0 | | | 517,915,026 | |
| | | | | |
|
|
Other Assets and Liabilities, Net | | (15.0 | ) | | (67,715,584 | ) |
| | | | | |
|
|
Net Assets | | 100.0 | | | 450,199,442 | |
| | | | | |
|
|
Notes to Scudder High Income Portfolio of Investments
| * | Non-income producing security. In the case of a bond, generally denotes that the issuer has defaulted on the payment of principal or interest. The following table represents bonds that are in default. |
| | | | | | | | | | | | | | |
Security
| | Coupon
| | Maturity Date
| | Principal Amount
| | Acquisition Cost
| | Value
|
Congoleum Corp. | | 8.625 | | 8/1/2008 | | 595,000 | | USD | | $ | 441,519 | | $ | 600,950 |
Corp. Durango SA: | | | | | | | | | | | | | | |
| | | 13.125 | | 8/1/2006 | | 350,000 | | USD | | | 179,500 | | | 236,250 |
| | | 13.75 | | 7/15/2009 | | 350,000 | | USD | | | 337,395 | | | 234,500 |
Dyersburg Corp. | | 9.75 | | 9/1/2007 | | 1,260,000 | | USD | | | 1,291,288 | | | 126 |
Page 118 of 466
| | | | | | | | | | | | | | |
Esprit Telecom Group PLC: | | | | | | | | | | | | | | |
| | | 10.875 | | 6/15/2008 | | 800,000 | | USD | | | 792,956 | | | 80 |
| | | 11.5 | | 12/15/2007 | | 1,625,000 | | USD | | | 1,628,444 | | | 163 |
FRD Acquisition Co. | | 12.5 | | 7/15/2004 | | 210,000 | | USD | | | 0 | | | 0 |
GEO Specialty Chemicals, Inc. | | | | | | | | | | | | | | |
| | | 1 | | 12/31/2009 | | 368,000 | | USD | | | 368,000 | | | 368,000 |
| | | 10.125 | | 8/1/2008 | | 765,000 | | USD | | | 262,225 | | | 443,700 |
Grupo Iusacell SA de CV | | 10 | | 7/15/2004 | | 240,000 | | USD | | | 144,738 | | | 184,800 |
GS Technologies Operating Co., Inc. | | 12 | | 9/1/2024 | | 315,268 | | USD | | | 314,686 | | | 788 |
Imperial Home Decor Group, Inc. | | 11 | | 3/15/2008 | | 1,050,000 | | USD | | | 1,029,755 | | | 0 |
Intermet Corp. | | | | | | | | | | | | | | |
| | | 9.75 | | 6/15/2009 | | 600,000 | | USD | | | 248,411 | | | 294,000 |
Oxford Automotive, Inc. | | 12 | | 10/15/2010 | | 1,975,000 | | USD | | | 1,321,584 | | | 1,244,250 |
| | | | | |
Security
| | Coupon
| | Maturity Date
| | Principal Amount
| | Acquisition Cost
| | Value
|
Republic of Argentina: | | | | | | | | | | | | | | |
| | | 8 | | 2/26/2008 | | 775,000 | | EUR | | | 224,642 | | | 310,759 |
| | | 8 | | 2/26/2008 | | 560,000 | | EUR | | | 180,836 | | | 222,645 |
| | | 10.25 | | 2/6/2049 | | 956,116 | | EUR | | | 209,225 | | | 376,884 |
| | | 10.25 | | 11/14/2049 | | 465,276 | | EUR | | | 99,469 | | | 183,403 |
| | | 11.25 | | 4/10/2006 | | 273,541 | | EUR | | | 85,600 | | | 116,191 |
| | | 11.375 | | 3/15/2010 | | 1,980,000 | | USD | | | 534,600 | | | 673,200 |
| | | 11.375 | | 1/30/2017 | | 775,000 | | USD | | | 232,985 | | | 263,500 |
| | | 11.375 | | 6/15/2015 | | 475,000 | | USD | | | 148,308 | | | 160,313 |
| | | 11.75 | | 4/7/2009 | | 1,340,000 | | USD | | | 430,150 | | | 455,600 |
| | | 12 | | 9/19/2016 | | 35,790 | | EUR | | | 8,225 | | | 7,338 |
| | | 12 | | 6/19/2031 | | 376,300 | | USD | | | 81,845 | | | 123,238 |
| | | 12.375 | | 2/21/2012 | | 1,205,000 | | USD | | | 334,939 | | | 406,687 |
Supercanal Holding SA | | 11.5 | | 5/15/2005 | | 100,000 | | USD | | | 36,505 | | | 9,000 |
Trump Holdings & Funding | | 12.625 | | 3/15/2010 | | 885,000 | | USD | | | 903,435 | | | 958,013 |
| | | | | | | | | | |
|
| |
|
|
| | | | | | | | | | | $ | 11,871,265 | | $ | 7,874,378 |
| | | | | | | | | | |
|
| |
|
|
| ** | Floating rate notes are securities whose yields vary with a designated market index or market rate, such as the coupon-equivalent of the US Treasury bill rate. These securities are shown at their current rate as of December 31, 2004. |
| (a) | The cost for federal income tax purposes was $510,755,235. At December 31, 2004, net unrealized appreciation for all securities based on tax cost was $7,159,791. This consisted of aggregate gross unrealized appreciation for all securities in which there was an excess of value over tax cost of $18,263,308 and aggregate gross unrealized depreciation for all securities in which there was an excess of tax cost over value of $11,103,517. |
| (b) | Scudder Cash Management QP Trust is managed by Deutsche Investment Management Americas Inc. The rate shown is the annualized seven-day yield at period end. |
| (c) | Principal amount stated in US dollars unless otherwise noted. |
| (d) | Daily Assets Fund Institutional, an affiliated fund, is managed by Deutsche Asset Management, Inc. The rate shown is the annualized seven-day yield at period end. |
| (e) | All or a portion of these securities were on loan (see Notes to Financial Statements). The value of all securities loaned at December 31, 2004, amounted to $73,177,211, which is 16.3% of total net assets. |
Page 119 of 466
| (f) | Represents collateral held in connection with securities lending. |
144A: Security exempt from registration under Rule 144A of the Securities Act of 1933. These securities may be resold in transactions exempt from registration, normally to qualified institutional buyers.
PIK denotes that interest and dividend is paid in kind.
| | |
Currency Abbreviation |
EUR | | Euro |
MXN | | Mexican Peso |
The accompanying notes are an integral part of the financial statements.
Financial Statements
Statement of Assets and Liabilities as of December 31, 2004
| | | | |
Assets | | | | |
Investments: | | | | |
Investments in securities, at value (cost $428,578,641) — including $73,177,211 of securities loaned | | $ | 435,909,264 | |
Investment in Daily Assets Fund Institutional (cost $74,814,217)* | | | 74,814,217 | |
Investment in Scudder Cash Management QP Trust (cost $7,191,545) | | | 7,191,545 | |
| | |
|
|
|
Total investments in securities, at value (cost $510,584,403) | | | 517,915,026 | |
| | |
|
|
|
Cash | | | 143,928 | |
Foreign currency, at value (cost $37,247) | | | 37,816 | |
Receivable for investments sold | | | 3,372,406 | |
Interest receivable | | | 8,856,107 | |
Receivable for Portfolio shares sold | | | 52,070 | |
Other assets | | | 13,291 | |
| | |
|
|
|
Total assets | | | 530,390,644 | |
| | |
|
|
|
Liabilities | | | | |
Payable upon return of securities loaned | | | 74,814,217 | |
Payable for investments purchased | | | 3,215,607 | |
Payable for Portfolio shares redeemed | | | 553,570 | |
Unrealized depreciation on forward foreign currency exchange contracts | | | 884,605 | |
Net payable on closed forward foreign currency exchange contract | | | 343,717 | |
Accrued management fee | | | 232,383 | |
Other accrued expenses and payables | | | 147,103 | |
| | |
|
|
|
Total liabilities | | | 80,191,202 | |
| | |
|
|
|
Net assets, at value | | $ | 450,199,442 | |
| | |
|
|
|
Net Assets | | | | |
Net assets consist of: | | | | |
Undistributed net investment income | | | 34,372,843 | |
Net unrealized appreciation (depreciation) on: | | | | |
Investments | | | 7,330,623 | |
Foreign currency related transactions | | | (867,532 | ) |
Accumulated net realized gain (loss) | | | (113,027,989 | ) |
Paid-in capital | | | 522,391,497 | |
| | |
|
|
|
Net assets, at value | | $ | 450,199,442 | |
| | |
|
|
|
Class A | | | | |
Net Asset Value, offering and redemption price per share ($393,438,214 ÷ 44,826,321 outstanding shares of beneficial interest, $.01 par value, unlimited number of shares authorized) | | $ | 8.78 | |
| | |
|
|
|
Class B | | | | |
Net Asset Value, offering and redemption price per share ($56,761,228 ÷ 6,474,194 outstanding shares of beneficial interest, $.01 par value, unlimited number of shares authorized) | | $ | 8.77 | |
| | |
|
|
|
| * | Represents collateral on securities loaned. |
Page 120 of 466
Statement of Operations for the year ended December 31, 2004
| | | | |
Investment Income | | | | |
Income: | | | | |
Dividends | | $ | 553,283 | |
Interest | | | 36,445,585 | |
Interest — Scudder Cash Management QP Trust | | | 119,706 | |
Securities lending income, including income from Daily Assets Fund Institutional | | | 124,889 | |
| | |
|
|
|
Total Income | | | 37,243,463 | |
| | |
|
|
|
Expenses: | | | | |
Management fee | | | 2,547,280 | |
Custodian fees | | | 60,081 | |
Distribution service fees (Class B) | | | 116,895 | |
Record keeping fees (Class B) | | | 61,482 | |
Auditing | | | 53,376 | |
Legal | | | 3,356 | |
Trustees’ fees and expenses | | | 5,863 | |
Reports to shareholders | | | 134,828 | |
Other | | | 30,569 | |
Total expenses, before expense reductions | | | 3,013,730 | |
Expense reductions | | | (8,909 | ) |
Total expenses, after expense reductions | | | 3,004,821 | |
| | |
|
|
|
Net investment income | | | 34,238,642 | |
| | |
|
|
|
Realized and Unrealized Gain (Loss) on Investment Transactions | | | | |
Net realized gain (loss) from: | | | | |
Investments | | | 9,835,203 | |
Foreign currency related transactions | | | (364,967 | ) |
| | | | 9,470,236 | |
Net unrealized appreciation (depreciation) during the period on: | | | | |
Investments | | | 6,010,970 | |
Foreign currency related transactions | | | (719,594 | ) |
| | | | 5,291,376 | |
| | |
|
|
|
Net gain (loss) on investment transactions | | | 14,761,612 | |
| | |
|
|
|
Net increase (decrease) in net assets resulting from operations | | $ | 49,000,254 | |
| | |
|
|
|
The accompanying notes are an integral part of the financial statements.
Page 121 of 466
Statement of Changes in Net Assets
| | | | | | | | |
Increase (Decrease) in Net Assets
| | Years Ended December 31,
| |
| | 2004
| | | 2003
| |
Operations: | | | | | | | | |
Net investment income | | $ | 34,238,642 | | | $ | 33,045,620 | |
Net realized gain (loss) on investment transactions | | | 9,470,236 | | | | (3,182,002 | ) |
Net unrealized appreciation (depreciation) on investment transactions during the period | | | 5,291,376 | | | | 53,500,177 | |
Net increase (decrease) in net assets resulting from operations | | | 49,000,254 | | | | 83,363,795 | |
Distributions to shareholders from: | | | | | | | | |
Net investment income | | | | | | | | |
Class A | | | (29,352,659 | ) | | | (29,871,076 | ) |
Class B | | | (3,056,845 | ) | | | (462,410 | ) |
Portfolio share transactions: | | | | | | | | |
| | |
Class A | | | | | | | | |
Proceeds from shares sold | | | 56,878,387 | | | | 120,856,182 | |
Reinvestment of distributions | | | 29,352,659 | | | | 29,871,076 | |
Cost of shares redeemed | | | (119,443,412 | ) | | | (117,016,053 | ) |
Net increase (decrease) in net assets from Class A share transactions | | | (33,212,366 | ) | | | 33,711,205 | |
| | |
Class B | | | | | | | | |
Proceeds from shares sold | | | 37,277,037 | | | | 36,410,776 | |
Reinvestment of distributions | | | 3,056,845 | | | | 462,410 | |
Cost of shares redeemed | | | (23,434,006 | ) | | | (3,751,439 | ) |
Net increase (decrease) in net assets from Class B share transactions | | | 16,899,876 | | | | 33,121,747 | |
Increase (decrease) in net assets | | | 278,260 | | | | 119,863,261 | |
Net assets at beginning of period | | | 449,921,182 | | | | 330,057,921 | |
| | |
|
|
| |
|
|
|
Net assets at end of period (including undistributed net investment income of $34,372,843 and $32,285,235, respectively) | | $ | 450,199,442 | | | $ | 449,921,182 | |
| | |
|
|
| |
|
|
|
Other Information | | | | | | | | |
| | |
Class A | | | | | | | | |
Shares outstanding at beginning of period | | | 48,977,744 | | | | 44,487,776 | |
Shares sold | | | 6,841,589 | | | | 15,606,467 | |
Shares issued to shareholders in reinvestment of distributions | | | 3,696,808 | | | | 4,207,191 | |
Shares redeemed | | | (14,689,820 | ) | | | (15,323,690 | ) |
Net increase (decrease) in Portfolio shares | | | (4,151,423 | ) | | | 4,489,968 | |
| | |
|
|
| |
|
|
|
Shares outstanding at end of period | | | 44,826,321 | | | | 48,977,744 | |
| | |
|
|
| |
|
|
|
Class B | | | | | | | | |
Shares outstanding at beginning of period | | | 4,421,727 | | | | 136,396 | |
Shares sold | | | 4,504,371 | | | | 4,693,294 | |
Shares issued to shareholders in reinvestment of distributions | | | 384,026 | | | | 65,037 | |
Shares redeemed | | | (2,835,930 | ) | | | (473,000 | ) |
Net increase (decrease) in Portfolio shares | | | 2,052,467 | | | | 4,285,331 | |
| | |
|
|
| |
|
|
|
Shares outstanding at end of period | | | 6,474,194 | | | | 4,421,727 | |
| | |
|
|
| |
|
|
|
The accompanying notes are an integral part of the financial statements.
Page 122 of 466
Financial Highlights
Class A
| | | | | | | | | | | | | | | | | | | | |
Years Ended December 31,
| | 2004
| | | 2003
| | | 2002
| | | 2001a
| | | 2000b
| |
Selected Per Share Data | | | | | | | | | | | | | | | | | | | | |
Net asset value, beginning of period | | $ | 8.43 | | | $ | 7.40 | | | $ | 8.13 | | | $ | 9.16 | | | $ | 11.46 | |
| | |
|
|
| |
|
|
| |
|
|
| |
|
|
| |
|
|
|
Income (loss) from investment operations: | | | | | | | | | | | | | | | | | | | | |
Net investment incomec | | | .67 | | | | .67 | | | | .75 | | | | .84 | | | | 1.14 | |
Net realized and unrealized gain (loss) on investment transactions | | | .31 | | | | 1.03 | | | | (.74 | ) | | | (.59 | ) | | | (2.04 | ) |
Total from investment operations | | | .98 | | | | 1.70 | | | | .01 | | | | .25 | | | | (.90 | ) |
Less distributions from: | | | | | | | | | | | | | | | | | | | | |
Net investment income | | | (.63 | ) | | | (.67 | ) | | | (.74 | ) | | | (1.28 | ) | | | (1.40 | ) |
| | |
|
|
| |
|
|
| |
|
|
| |
|
|
| |
|
|
|
Net asset value, end of period | | $ | 8.78 | | | $ | 8.43 | | | $ | 7.40 | | | $ | 8.13 | | | $ | 9.16 | |
| | |
|
|
| |
|
|
| |
|
|
| |
|
|
| |
|
|
|
Total Return (%) | | | 12.42 | | | | 24.62 | | | | (.30 | ) | | | 2.63 | | | | (8.68 | ) |
Ratios to Average Net Assets and Supplemental Data | | | | | | | | | | | | | | | | | | | | |
Net assets, end of period ($ millions) | | | 393 | | | | 413 | | | | 329 | | | | 335 | | | | 309 | |
Ratio of expenses (%) | | | .66 | | | | .67 | | | | .66 | | | | .70 | | | | .68 | |
Ratio of net investment income (%) | | | 8.11 | | | | 8.62 | | | | 10.07 | | | | 9.89 | | | | 11.23 | |
Portfolio turnover rate (%) | | | 162 | | | | 165 | | | | 138 | | | | 77 | | | | 54 | |
| a | As required, effective January 1, 2001, the Portfolio has adopted the provisions of the AICPA Audit and Accounting Guide for Investment Companies and began amortizing premium on debt securities. The effect of this change for the year ended December 31, 2001 was to decrease net investment income per share by $.08, increase net realized and unrealized gains and losses per share by $.08 and decrease the ratio of net investment income to average net assets from 10.74% to 9.89%. |
Per share, ratios and supplemental data for periods prior to January 1, 2001 have not been restated to reflect this change in presentation.
Page 123 of 466
| b | On June 18, 2001, the Portfolio implemented a 1 for 10 reverse stock split. Per share information, for the periods prior to December 31, 2001, has been restated to reflect the effect of the split. Shareholders received 1 share for every 10 shares owned and net asset value per share increased correspondingly. |
| c | Based on average shares outstanding during the period. |
Class B
| | | | | | | | | | | | |
Years Ended December 31,
| | 2004
| | | 2003
| | | 2002a
| |
Selected Per Share Data | |
Net asset value, beginning of period | | $ | 8.41 | | | $ | 7.39 | | | $ | 7.21 | |
| | |
|
|
| |
|
|
| |
|
|
|
Income (loss) from investment operations: | | | | | | | | | | | | |
Net investment incomeb | | | .64 | | | | .64 | | | | .31 | |
Net realized and unrealized gain (loss) on investment transactions | | | .32 | | | | 1.03 | | | | (.13 | ) |
Total from investment operations | | | .96 | | | | 1.67 | | | | .18 | |
Less distributions from: | | | | | | | | | | | | |
Net investment income | | | (.60 | ) | | | (.65 | ) | | | — | |
| | |
|
|
| |
|
|
| |
|
|
|
Net asset value, end of period | | $ | 8.77 | | | $ | 8.41 | | | $ | 7.39 | |
| | |
|
|
| |
|
|
| |
|
|
|
Total Return (%) | | | 12.08 | | | | 24.14 | | | | 2.50 | ** |
Ratios to Average Net Assets and Supplemental Data | |
Net assets, end of period ($ millions) | | | 57 | | | | 37 | | | | 1 | |
Ratio of expenses (%) | | | 1.06 | | | | 1.06 | | | | .92 | * |
Ratio of net investment income (%) | | | 7.71 | | | | 8.23 | | | | 8.78 | * |
Portfolio turnover rate (%) | | | 162 | | | | 165 | | | | 138 | ** |
| a | For the period July 1, 2002 (commencement of operations of Class B shares) to December 31, 2002. |
| b | Based on average shares outstanding during the period. |
Information About Your Portfolio’s Expenses
Scudder Income & Growth Strategy Portfolio
As an investor of the Portfolio, you incur two types of costs: ongoing expenses and transaction costs. Ongoing expenses include management fees, distribution and service (12b-1) fees and other Portfolio expenses. Examples of transaction costs include sales charges (loads), redemption fees and account maintenance fees, which are not shown in this section. The following tables are intended to help you understand your ongoing expenses (in dollars) of investing in the Portfolio and to help you compare these expenses with the ongoing expenses of investing in other mutual funds. In the most recent period, the portfolio limited these expenses; had it not done so, expenses would have been higher. The tables are based on an investment of $1,000 made at the beginning of the period (August 16, 2004) ended December 31, 2004.
Page 124 of 466
The tables illustrate your Portfolio’s expenses in two ways:
Actual Portfolio Return. This helps you estimate the actual dollar amount of ongoing expenses (but not transaction costs) paid on a $1,000 investment in the Portfolio using the Portfolio’s actual return during the period. To estimate the expenses you paid over the period, simply divide your account value by $1,000 (for example, an $8,600 account value divided by $1,000 = 8.6), then multiply the result by the number in the “Expenses Paid per $1,000” line under the share class you hold.
Hypothetical 5% Portfolio Return. This helps you to compare your Portfolio’s ongoing expenses (but not transaction costs) with those of other mutual funds using the Portfolio’s actual expense ratio and a hypothetical rate of return of 5% per year before expenses. Examples using a 5% hypothetical Portfolio return may be found in the shareholder reports of other mutual funds. The hypothetical account values and expenses may not be used to estimate the actual ending account balance or expenses you paid for the period.
Please note that the expenses shown in these tables are meant to highlight your ongoing expenses only and do not reflect any transaction costs. The “Expenses Paid per $1,000” line of the tables is useful in comparing ongoing expenses only and will not help you determine the relative total expense of owning different funds. If these transaction costs had been included, your costs would have been higher.
Expenses and Value of a $1,000 Investment for the period ended December 31, 2004
| | | |
Actual Portfolio Return
| | Class B
|
Beginning Account Value 8/16/04 | | $ | 1,000.00 |
Ending Account Value 12/31/04 | | $ | 1,066.00 |
Expenses Paid per $1,000* | | $ | 2.91 |
| |
Hypothetical 5% Portfolio Return
| | Class B
|
Beginning Account Value 8/16/04 | | $ | 1,000.00 |
Ending Account Value 12/31/04 | | $ | 1,015.95 |
Expenses Paid per $1,000* | | $ | 2.84 |
| * | Expenses are equal to the Portfolio’s annualized expense ratio for the share class, multiplied by the average account value over the period, multiplied by the number of days since the commencement of the class (August 16, 2004), then divided by 365. |
| | | |
Annualized Expense Ratios
| | Class B
| |
Scudder Variable Series II — Scudder Income & Growth Strategy Portfolio | | .75 | % |
For more information, please refer to the Portfolio’s prospectus.
Management Summary December 31, 2004
Scudder Income & Growth Strategy Portfolio
Scudder Income & Growth Strategy Portfolio is one of four new fund-of-funds portfolios. Each portfolio is constructed as a strategically allocated mix of variable portfolios and managed to pursue consistent returns over time, while mitigating risk and pursuing a long-term investment objective. Scudder Income & Growth Strategy Portfolio seeks current income and, as a secondary objective, long-term growth of capital. The portfolio gained 6.60% (Class B shares, unadjusted for contract charges) from its date of
Page 125 of 466
inception, August 16, 2004 through December 31, 2004. Investors should keep in mind that during the start-up phase of the portfolio, it required some time to invest all the cash inflows. Because we had large cash flows, often exceeding the size of the portfolio, our allocation was heavily weighted in cash — even though we invested the cash right away every day.
Stocks performed exceptionally well in 2003, when profit margins widened because productivity accelerated but labor costs remained low (due to a soft labor market). However, equity performance was lower in 2004, due in part to rising interest rates, concerns about inflation and soaring energy prices, all of which can impact the revenue growth of companies. Performance did improve at the end of 2004 as signs of economic strength emerged and oil prices decreased. The end of uncertainty surrounding the US presidential election also helped the stock market find its footing. Specifically, the energy and materials sectors performed particularly well in 2004, while the technology, consumer staples and consumer discretionary sectors lagged behind. Going forward, profit margins are not likely to widen further, and may even narrow. As a result, we believe that returns will likely be modest. The portfolio underweighted equities relative to fixed income only in December and overweighted equities for all other months since inception. To improve diversification within the stock category, the portfolio overweighted small-cap stocks for all months since inception except December.
The Federal Reserve (“the Fed”), in attempt to prevent the economy from overheating and inflation from rising, raised interest rates five times from 12/31/03 through 12/31/04. Because bond prices typically move in the opposite direction of interest rates, bond prices fell in response. Still, bond investors seemed to be betting that the economy faces too many hurdles for the Fed to raise interest rates drastically, so the price of bonds did not fall significantly. However, it seems likely that the Fed will continue to raise interest rates, so we believe that the bull market for bonds we have experienced over the past two decades is likely over. Although, the portfolio is currently overweighting (or favoring) bonds relative to cash, these weightings may change.
Arnim Holzer Inna Okounkova Robert Wang
Co-Managers
Deutsche Investment Management Americas Inc.
All performance shown is historical, assumes reinvestment of all dividends and capital gains, and does not guarantee future results. Investment return and principal value fluctuate with changing market conditions so that, when redeemed, shares may be worth more or less then their original cost. Current performance may be lower or higher than the performance data quoted. Please visit scudder.com for the product’s most recent month-end performance. Performance doesn’t reflect charges and fees (“contract charges”) associated with the separate account that invests in the portfolio or any variable life insurance policy or variable annuity contract for which the portfolio is an investment option. These charges and fees will reduce returns.
Returns during part or all of the periods shown reflect a fee waiver and/or expense reimbursement. Without this waiver/reimbursement, returns would have been lower.
Risk Considerations
Diversification does not eliminate risk. The underlying portfolios invest in individual equity and bond funds whose yields and market values fluctuate, so that your investment may be worth more or less that its original cost. In addition, the underlying portfolios are subject to stock market risk, meaning stocks in the portfolio may decline in value for extended periods of time due to the activities and financial prospects of individual companies, or due to general market and economic conditions. Investing in foreign securities presents certain unique risks not associated with domestic investments, such as currency fluctuation, political and economic changes, and market risks. Derivatives may be more volatile and less liquid than traditional securities, and the portfolio could suffer losses on its derivative positions. Please read this portfolio’s prospectus for specific details regarding its risk profile.
Portfolio management market commentary is as of December 31, 2004, and may not come to pass. This information is subject to change at any time based on market and other conditions.
Page 126 of 466
Portfolio Summary
Scudder Income & Growth Strategy Portfolio
| | | |
Asset Allocation
| | 12/31/04
| |
Fixed Income Funds | | 56 | % |
Equity Funds | | 42 | % |
Cash Equivalents | | 2 | % |
| | |
|
|
| | | 100 | % |
| | |
|
|
Asset allocation is subject to change.
For more complete details about the Portfolio’s investment portfolio, see page 6. A quarterly Fact Sheet is available upon request. Information concerning portfolio holdings of the Portfolio as of month end will be posted to scudder.com on the 15th of the following month.
Following the Portfolio’s fiscal first and third quarter-end, a complete portfolio holdings listing is filed with the SEC on Form N-Q. The form will be available on the SEC’s Web site at www.sec.gov, and it also may be reviewed and copied at the SEC’s Public Reference Room in Washington, D.C. Information on the operation of the SEC’s Public Reference Room may be obtained by calling (800) SEC-0330.
Investment Portfolio December 31, 2004
Scudder Income & Growth Strategy Portfolio
| | | | |
| | | Shares
| | Value ($)
|
Equity Funds 41.5% | | | | |
Scudder SVS I Global Discovery Portfolio “A” | | 2,729 | | 34,847 |
Scudder SVS I Growth & Income Portfolio “A” | | 119,292 | | 1,108,222 |
Scudder SVS I International Portfolio “A” | | 33,005 | | 313,545 |
Scudder SVS II Aggressive Growth Portfolio “A” | | 21,800 | | 214,513 |
Scudder SVS II Blue Chip Portfolio “A” | | 81,158 | | 1,107,801 |
Scudder SVS II Dreman High Return Equity Portfolio “A” | | 32,888 | | 416,031 |
Scudder SVS II Dreman Small Cap Value Portfolio “A” | | 13,051 | | 261,804 |
Scudder SVS II Eagle Focused Large Cap Growth Portfolio “A” | | 34,748 | | 305,432 |
Scudder SVS II Growth Portfolio “A” | | 26,381 | | 512,049 |
Scudder SVS II International Select Equity Portfolio “A” | | 15,792 | | 188,085 |
Scudder SVS II Large Cap Value Portfolio “A” | | 33,792 | | 533,568 |
Scudder SVS II MFS Strategic Value Portfolio “A” | | 20,224 | | 242,682 |
Scudder SVS II Small Cap Growth Portfolio “A” | | 22,974 | | 289,246 |
Page 127 of 466
| | | | |
| | | Shares
| | Value ($)
|
Scudder VIT Real Estate Portfolio “A” | | 8,077 | | 131,904 |
| | | | |
|
Total Equity Funds (Cost $5,291,079) | | | | 5,659,729 |
| | | | |
|
Fixed Income Funds 55.8% | | | | |
Scudder SVS II Fixed Income Portfolio “A” | | 521,556 | | 6,295,184 |
Scudder SVS II Government and Agency Securities Portfolio “A” | | 71,917 | | 902,553 |
Scudder SVS II High Income Portfolio “A” | | 42,526 | | 373,376 |
Scudder SVS II Strategic Income Portfolio “A” | | 2,770 | | 33,932 |
| | | | |
|
Total Fixed Income Funds (Cost $7,539,134) | | | | 7,605,045 |
| | | | |
|
Cash Equivalents 2.6% | | | | |
Scudder Cash Management QP Trust, 2.24% (b) (Cost $348,360) | | 348,360 | | 348,360 |
| | | | |
|
| | | | |
| | | % of Net Assets
| | Value ($)
|
Total Investment Portfolio (Cost $13,178,573) (a) | | 99.9 | | 13,613,134 |
| | | | |
|
Other Assets and Liabilities, Net | | 0.1 | | 8,900 |
| | | | |
|
Net Assets | | 100.0 | | 13,622,034 |
| | | | |
|
Notes to Scudder Income & Growth Strategy Portfolio of Investments
| (a) | The cost for federal income tax purposes was $13,178,573. At December 31, 2004, net unrealized appreciation for all securities based on tax cost was $434,561. This consisted of aggregate gross unrealized appreciation for all securities in which there was an excess of value over tax cost of $434,561 and aggregate gross unrealized depreciation for all securities in which there was an excess of tax cost over value of $0. |
| (b) | Scudder Cash Management QP Trust is managed by Deutsche Investment Management Americas Inc. The rate shown is the annualized seven-day yield at period end. |
The accompanying notes are an integral part of the financial statements.
Page 128 of 466
Financial Statements
Statement of Assets and Liabilities
as of December 31, 2004
| | | |
Assets | | | |
Investments: | | | |
Investments in securities, at value (cost $12,830,213) | | $ | 13,264,774 |
Investment in Scudder Cash Management QP Trust (cost $348,360) | | | 348,360 |
| | |
|
|
Total investments in securities, at value (cost $13,178,573) | | | 13,613,134 |
| | |
|
|
Interest receivable | | | 544 |
Receivable for Portfolio shares sold | | | 11,710 |
Due from Advisor | | | 26,510 |
Other assets | | | 122 |
| | |
|
|
Total assets | | | 13,652,020 |
| | |
|
|
Liabilities | | | |
Payable for Portfolio shares redeemed | | | 708 |
Other accrued expenses and payables | | | 29,278 |
| | |
|
|
Total liabilities | | | 29,986 |
| | |
|
|
Net assets, at value | | $ | 13,622,034 |
| | |
|
|
Net Assets | | | |
Net assets consist of: | | | |
Net unrealized appreciation (depreciation) on investments | | | 434,561 |
Accumulated net realized gain (loss) | | | 33,651 |
Paid-in capital | | | 13,153,822 |
| | |
|
|
Net assets, at value | | $ | 13,622,034 |
| | |
|
|
Class B Shares | | | |
Net asset value, offering and redemption price per share ($13,622,034 ÷ 1,277,644 shares outstanding shares of beneficial interest, $.01 par value, unlimited number of shares authorized) | | $ | 10.66 |
| | |
|
|
Statement of Operations
for the period ended December 31, 2004
| | | | |
Investment Income | | | | |
Income: | | | | |
Interest — Scudder Cash Management QP Trust | | $ | 2,050 | |
| | |
|
|
|
Total Income | | | 2,050 | |
| | |
|
|
|
Expenses: | | | | |
Management fee | | | 3,818 | |
Custodian and accounting fees | | | 31,927 | |
Distribution service fees (Class B) | | | 6,354 | |
Record keeping fees (Class B) | | | 3,813 | |
Auditing | | | 24,001 | |
Legal | | | 1,077 | |
Trustees’ fees and expenses | | | 477 | |
Reports to shareholders | | | 3,011 | |
Offering costs | | | 1,011 | |
Other | | | 528 | |
| | |
|
|
|
Total expenses, before expense reductions | | | 76,017 | |
| | |
|
|
|
Expense reductions | | | (56,748 | ) |
Total expenses, after expense reductions | | | 19,269 | |
| | |
|
|
|
Net investment income (loss) | | | (17,219 | ) |
| | |
|
|
|
|
Realized and Unrealized Gain (Loss) on Investment Transactions | |
Net realized gain (loss) from investments | | | 49,859 | |
Net unrealized appreciation (depreciation) during the period on investments | | | 434,561 | |
| | |
|
|
|
Net gain (loss) on investment transactions | | | 484,420 | |
| | |
|
|
|
Net increase (decrease) in net assets resulting from operations | | $ | 467,201 | |
| | |
|
|
|
The accompanying notes are an integral part of the financial statements.
Page 129 of 466
Statement of Changes in Net Assets
| | | | |
Increase (Decrease) in Net Assets
| | Period Ended
December 31, 2004a
| |
Operations: | | | | |
Net investment income (loss) | | $ | (17,219 | ) |
Net realized gain (loss) on investment transactions | | | 49,859 | |
Net unrealized appreciation (depreciation) on investment transactions during the period | | | 434,561 | |
Net increase (decrease) in net assets resulting from operations | | | 467,201 | |
Portfolio share transactions: | | | | |
| |
Class B | | | | |
Proceeds from shares sold | | | 13,456,607 | |
Cost of shares redeemed | | | (301,774 | ) |
Increase (decrease) in net assets | | | 13,154,833 | |
Net assets at beginning of period | | | — | |
| | |
|
|
|
Net assets at end of period | | $ | 13,622,034 | |
| | |
|
|
|
Other Information | | | | |
| |
Class B | | | | |
Shares outstanding at beginning of period | | | — | |
Shares sold | | | 1,306,747 | |
Shares redeemed | | | (29,103 | ) |
Net increase (decrease) in Portfolio shares | | | 1,277,644 | |
| | |
|
|
|
Shares outstanding at end of period | | | 1,277,644 | |
| | |
|
|
|
| a | For the period from August 16, 2004 (commencement of operations) to December 31, 2004. |
The accompanying notes are an integral part of the financial statements.
Page 130 of 466
Financial Highlights
Class B
| | | | |
Selected Per Share Data
| | 2004a
| |
Net asset value, beginning of period | | $ | 10.00 | |
| | |
|
|
|
Income (loss) from investment operations: | | | (.03 | ) |
Net investment income (loss)b | | | | |
Net realized and unrealized gain (loss) on investment transactions | | | .69 | |
Total from investment operations | | | .66 | |
| | |
|
|
|
Net asset value, end of period | | $ | 10.66 | |
| | |
|
|
|
Total Return (%)c | | | 6.60 | ** |
| | |
|
|
|
| |
Ratios to Average Net Assets and Supplemental Data | | | | |
Net assets, end of period ($ millions) | | | 14 | |
Ratio of expenses before expense reductions (%) | | | 2.96 | * |
Ratio of expenses after expense reductions (%) | | | .75 | * |
Ratio of net investment income (%) | | | (.67 | )* |
Portfolio turnover rate (%) | | | 18 | * |
| a | For the period from August 16, 2004 (commencement of operations) to December 31, 2004. |
| b | Based on average shares outstanding during the period. |
| c | Total return would have been lower had certain expenses not been reduced. |
Performance Summary December 31, 2004
Scudder International Select Equity Portfolio
All performance shown is historical, assumes reinvestment of all dividends and capital gains, and does not guarantee future results. Investment return and principal value fluctuate with changing market conditions so that, when redeemed, shares may be worth more or less then their original cost. Current performance may be lower or higher than the performance data quoted. Please visit scudder.com for the product’s most recent month-end performance. Performance doesn’t reflect charges and fees (“contract charges”) associated with the separate account that invests in the Portfolio or any variable life insurance policy or variable annuity contract for which the Portfolio is an investment option. These charges and fees will reduce returns.
This Portfolio is subject to stock market risk, meaning stocks in the Portfolio may decline in value for extended periods of time due to the activities and financial prospects of individual companies, or due to general market and economic conditions. Additionally, investing in foreign securities presents certain unique risks not associated with domestic investments, such as currency fluctuation, political and economic changes and market risks. This may result in greater share price volatility.
Please read this Portfolio’s prospectus for specific details regarding its investments and risk profile.
Growth of an Assumed $10,000 Investment in Scudder International Select Equity Portfolio from 12/31/1994 to 12/31/2004
| | |
¨ Scudder International Select Equity Portfolio — Class A ¨ MSCI EAFE + EM Index |
| |
 | | The MSCI EAFE + EM Index (Morgan Stanley Capital International Europe, Australasia, Far East + Emerging Markets Index) is an unmanaged index generally accepted as a benchmark for major overseas markets plus emerging markets. The index is calculated using closing local market prices and converts to US dollars using the London close foreign exchange rates. Index returns assume reinvested dividends and, unlike Portfolio returns, do not reflect any fees or expenses. It is not possible to invest directly into an index. |
| Yearly periods ended December 31 | |
Comparative Results
| | | | | | | | | | | | | | | | | | |
Scudder International Select Equity Portfolio
| | | | 1-Year
| | | 3-Year
| | | 5-Year
| | | 10-Year
| |
Class A | | Growth of $10,000 | | $ | 11,825 | | | $ | 13,282 | | | $ | 7,981 | | | $ | 18,408 | |
| | | Average annual total return | | | 18.25 | % | | | 9.92 | % | | | -4.41 | % | | | 6.29 | % |
MSCI EAFE + EM Index | | Growth of $10,000 | | $ | 12,126 | | | $ | 14,544 | | | $ | 9,853 | | | $ | 17,726 | |
| | | Average annual total return | | | 21.26 | % | | | 13.30 | % | | | -.30 | % | | | 5.89 | % |
| | | | | |
Scudder International Select Equity Portfolio
| | | | | | | | | | 1-Year
| | | Life of Class*
| |
Class B | | Growth of $10,000 | | | | | | | | | | $ | 11,784 | | | $ | 13,485 | |
| | | Average annual total return | | | | | | | | | | | 17.84 | % | | | 12.69 | % |
MSCI EAFE + EM Index | | Growth of $10,000 | | | | | | | | | | $ | 12,126 | | | $ | 14,687 | |
| | | Average annual total return | | | | | | | | | | | 21.26 | % | | | 16.62 | % |
The growth of $10,000 is cumulative.
| * | The Portfolio commenced offering Class B shares on July 1, 2002. Index returns begin June 30, 2002. |
Page 131 of 466
Information About Your Portfolio’s Expenses
Scudder International Select Equity Portfolio
As an investor of the Portfolio, you incur two types of costs: ongoing expenses and transaction costs. Ongoing expenses include management fees, distribution and service (12b-1) fees and other Portfolio expenses. Examples of transaction costs include sales charges (loads), redemption fees and account maintenance fees, which are not shown in this section. The following tables are intended to help you understand your ongoing expenses (in dollars) of investing in the Portfolio and to help you compare these expenses with the ongoing expenses of investing in other mutual funds. The tables are based on an investment of $1,000 made at the beginning of the six-month period ended December 31, 2004.
The tables illustrate your Portfolio’s expenses in two ways:
Actual Portfolio Return. This helps you estimate the actual dollar amount of ongoing expenses (but not transaction costs) paid on a $1,000 investment in the Portfolio using the Portfolio’s actual return during the period. To estimate the expenses you paid over the period, simply divide your account value by $1,000 (for example, an $8,600 account value divided by $1,000 = 8.6), then multiply the result by the number in the “Expenses Paid per $1,000” line under the share class you hold.
Hypothetical 5% Portfolio Return. This helps you to compare your Portfolio’s ongoing expenses (but not transaction costs) with those of other mutual funds using the Portfolio’s actual expense ratio and a hypothetical rate of return of 5% per year before expenses. Examples using a 5% hypothetical Portfolio return may be found in the shareholder reports of other mutual funds. The hypothetical account values and expenses may not be used to estimate the actual ending account balance or expenses you paid for the period.
Please note that the expenses shown in these tables are meant to highlight your ongoing expenses only and do not reflect any transaction costs. The “Expenses Paid per $1,000” line of the tables is useful in comparing ongoing expenses only and will not help you determine the relative total expense of owning different funds. If these transaction costs had been included, your costs would have been higher.
Page 132 of 466
Expenses and Value of a $1,000 Investment for the six months ended December 31, 2004
| | | | | | |
Actual Portfolio Return
| | Class A
| | Class B
|
Beginning Account Value 7/1/04 | | $ | 1,000.00 | | $ | 1,000.00 |
Ending Account Value 12/31/04 | | $ | 1,158.60 | | $ | 1,156.80 |
Expenses Paid per $1,000* | | $ | 4.94 | | $ | 6.83 |
| | |
Hypothetical 5% Portfolio Return
| | Class A
| | Class B
|
Beginning Account Value 7/1/04 | | $ | 1,000.00 | | $ | 1,000.00 |
Ending Account Value 12/31/04 | | $ | 1,020.62 | | $ | 1,018.87 |
Expenses Paid per $1,000* | | $ | 4.63 | | $ | 6.40 |
| * | Expenses are equal to the Portfolio’s annualized expense ratio for each share class, multiplied by the average account value over the period, multiplied by the number of days in the most recent six-month period, then divided by 365. |
| | | | | | |
Annualized Expense Ratios
| | Class A
| | | Class B
| |
Scudder Variable Series II — Scudder International Select Equity Portfolio | | .91 | % | | 1.26 | % |
For more information, please refer to the Portfolio’s prospectus.
Management Summary December 31, 2004
Scudder International Select Equity Portfolio
Continued strength in corporate earnings and worldwide economic growth provided a positive underpinning for international equities in 2004. For US investors, the rising value of foreign currencies in relation to the dollar provided an additional boost to performance. The Class A shares of the portfolio produced a positive absolute return of 18.25% (Class A shares, unadjusted for contract charges) during the year ended December 31, 2004, but lagged the 21.26% return of the MSCI EAFE Plus EM Index.
Performance was helped by strong stock selection in the materials, energy and information technology sectors. Materials and energy delivered robust returns, as commodities exporters in those sectors benefited from their exposure to China’s growth. Examples include the materials companies POSCO (Korea) (1.2% of net assets as of December 31) and BHP Billiton PLC (United Kingdom) (.97% of net assets), and the energy companies Eni SpA (Italy) (2.9% of net assets) and Total S.A. (France) (3.2% of net assets%). Performance was hurt by exposure to sectors that are sensitive to rising energy and input costs, such as the industrials stock A.P. Moller Maersk*, which was unable to pass on higher transport costs to customers; and consumer staples companies such as Nestle S.A. and Henckel*, whose margins were also pressured by rising input costs and heightened competition.
We continue to emphasize companies with pricing power. In an environment of slow to moderate demand growth, the ability to raise prices will enable companies to maintain their profit margins even if input costs increase. In addition, we continue to look for opportunities to invest in companies positioned to take advantage of the burgeoning consumer sector in Asia.
Alex Tedder
Lead Portfolio Manager
Matthias Knerr
Sangita Uberoi
Page 133 of 466
Managers
Deutsche Asset Management Investment Services Ltd., Subadvisor to the Portfolio
All performance shown is historical, assumes reinvestment of all dividends and capital gains, and does not guarantee future results. Investment return and principal value fluctuate with changing market conditions so that, when redeemed, shares may be worth more or less then their original cost. Current performance may be lower or higher than the performance data quoted. Please visit scudder.com for the product’s most recent month-end performance. Performance doesn’t reflect charges and fees (“contract charges”) associated with the separate account that invests in the portfolio or any variable life insurance policy or variable annuity contract for which the portfolio is an investment option. These charges and fees will reduce returns.
Risk Considerations
This portfolio is subject to stock market risk, meaning stocks in the portfolio may decline in value for extended periods of time due to the activities and financial prospects of individual companies, or due to general market and economic conditions. Additionally, investing in foreign securities presents certain unique risks not associated with domestic investments, such as currency fluctuation, political and economic changes and market risks. This may result in greater share price volatility. Please read this portfolio’s prospectus for specific details regarding its investments and risk profile.
The MSCI EAFE + EM Index (Morgan Stanley Capital International Europe, Australasia, Far East + Emerging Markets Free Index) is an unmanaged index generally accepted as a benchmark for major overseas markets plus emerging markets. The index is calculated using closing local market prices and converts to US dollars using the London close foreign exchange rates. Index returns assume reinvestment of all distributions and do not reflect any fees or expenses. It is not possible to invest directly into an index.
| * | This security was not held in the portfolio at the end of the reporting period. |
Portfolio management market commentary is as of December 31, 2004, and may not come to pass. This information is subject to change at any time based on market and other conditions.
Portfolio Summary
Scudder International Select Equity Portfolio
| | | | | | |
Asset Allocation (Excludes Securities Lending Collateral)
| | 12/31/04
| | | 12/31/03
| |
Common Stocks | | 99 | % | | 96 | % |
Cash Equivalents | | 1 | % | | 2 | % |
Preferred Stocks | | — | | | 2 | % |
| | |
|
| |
|
|
| | | 100 | % | | 100 | % |
| | |
|
| |
|
|
| | | | | | |
Geographical Diversification (Excludes Cash Equivalents and Securities Lending Collateral)
| | 12/31/04
| | | 12/31/03
| |
Continental Europe | | 51 | % | | 50 | % |
Japan | | 19 | % | | 22 | % |
United Kingdom | | 18 | % | | 23 | % |
Asia (excluding Japan) | | 12 | % | | 5 | % |
| | |
|
| |
|
|
| | | 100 | % | | 100 | % |
| | |
|
| |
|
|
| | | | | | |
Sector Diversification (Excludes Cash Equivalents and Securities Lending Collateral)
| | 12/31/04
| | | 12/31/03
| |
Financials | | 27 | % | | 25 | % |
Consumer Discretionary | | 14 | % | | 18 | % |
Industrials | | 13 | % | | 10 | % |
Energy | | 10 | % | | 7 | % |
Telecommunication Services | | 8 | % | | 8 | % |
Information Technology | | 8 | % | | 6 | % |
Health Care | | 8 | % | | 8 | % |
Materials | | 5 | % | | 7 | % |
Consumer Staples | | 4 | % | | 7 | % |
Utilities | | 3 | % | | 4 | % |
| | |
|
| |
|
|
| | | 100 | % | | 100 | % |
| | |
|
| |
|
|
Page 134 of 466
Asset allocation, geographical and sector diversification are subject to change.
For more complete details about the Portfolio’s investment portfolio, see page 15. A quarterly Fact Sheet is available upon request. Information concerning portfolio holdings of the Portfolio as of month end will be posted to scudder.com on the 15th of the following month.
Following the Portfolio’s fiscal first and third quarter-end, a complete portfolio holdings listing is filed with the SEC on Form N-Q. The form will be available on the SEC’s Web site at www.sec.gov, and it also may be reviewed and copied at the SEC’s Public Reference Room in Washington, D.C. Information on the operation of the SEC’s Public Reference Room may be obtained by calling (800) SEC-0330.
|
| Investment Portfolio December 31, 2004 |
Scudder International Select Equity Portfolio
| | | | |
| | | Shares
| | Value ($)
|
Common Stocks 95.7% | | | | |
Belgium 2.0% | | | | |
Belgacom SA* (Cost $3,863,300) | | 108,000 | | 4,668,207 |
| | | | |
|
China 1.7% | | | | |
PetroChina Co., Ltd. “H” (Cost $3,606,829) | | 7,467,670 | | 3,987,138 |
| | | | |
|
France 7.7% | | | | |
Christian Dior SA | | 48,900 | | 3,326,689 |
Credit Agricole SA | | 159,709 | | 4,819,274 |
Total SA | | 33,461 | | 7,308,934 |
Vinci SA (d) | | 17,300 | | 2,323,284 |
| | | | |
|
(Cost $12,687,700) | | | | 17,778,181 |
| | | | |
|
Germany 10.6% | | | | |
Adidas-Salomon AG | | 30,200 | | 4,874,609 |
E.ON AG | | 65,400 | | 5,961,294 |
Hypo Real Estate Holdings AG* | | 119,200 | | 4,941,688 |
Metro AG | | 97,063 | | 5,341,961 |
Siemens AG | | 39,900 | | 3,383,121 |
| | | | |
|
(Cost $16,029,706) | | | | 24,502,673 |
| | | | |
|
Page 135 of 466
| | | | |
Greece 2.3% | | | | |
Alpha Bank AE (Cost $4,010,044) | | 153,600 | | 5,357,314 |
| | | | |
|
Hong Kong 2.0% | | | | |
Swire Pacific Ltd. “A” (Cost $3,859,366) | | 545,831 | | 4,564,568 |
| | | | |
|
India 1.6% | | | | |
State Bank of India (GDR) (Cost $2,998,549) | | 99,566 | | 3,634,159 |
| | | | |
|
Ireland 2.2% | | | | |
CRH PLC (Cost $3,172,767) | | 191,458 | | 5,126,713 |
| | | | |
|
Italy 3.0% | | | | |
Eni SpA (Cost $4,061,818) | | 271,560 | | 6,799,151 |
| | | | |
|
Japan 18.6% | | | | |
Canon, Inc. | | 97,800 | | 5,277,974 |
Credit Saison Co., Ltd. | | 130,400 | | 4,746,677 |
Daito Trust Construction Co., Ltd. | | 107,900 | | 5,128,067 |
KDDI Corp. | | 400 | | 2,154,777 |
Kirin Brewery Co., Ltd. | | 465,900 | | 4,587,617 |
Millea Holdings, Inc. | | 250 | | 3,708,402 |
Mitsubishi Corp. | | 417,000 | | 5,387,996 |
SMC Corp. | | 36,800 | | 4,212,589 |
Toyota Motor Corp. | | 130,200 | | 5,298,468 |
Trend Micro, Inc. | | 42,000 | | 2,266,615 |
| | | | |
|
(Cost $31,971,638) | | | | 42,769,182 |
| | | | |
|
Korea 3.8% | | | | |
POSCO (ADR) (d) | | 64,100 | | 2,854,373 |
Samsung Electronics Co., Ltd. (GDR), 144A | | 26,940 | | 5,899,860 |
| | | | |
|
(Cost $8,345,830) | | | | 8,754,233 |
| | | | |
|
| | |
| | | Shares
| | Value ($)
|
Netherlands 6.8% | | | | |
European Aeronautic Defense & Space Co. | | 125,800 | | 3,657,553 |
ING Groep NV | | 245,255 | | 7,420,656 |
TPG NV | | 166,700 | | 4,527,207 |
| | | | |
|
(Cost $12,495,804) | | | | 15,605,416 |
| | | | |
|
Singapore 2.0% | | | | |
DBS Group Holdings Ltd. (Cost $4,078,758) | | 471,315 | | 4,648,476 |
| | | | |
|
Spain 6.8% | | | | |
Indra Sistemas SA | | 303,000 | | 5,176,988 |
Industria de Diseno Textil SA | | 149,400 | | 4,406,660 |
Telefonica SA | | 322,630 | | 6,078,091 |
| | | | |
|
(Cost $11,357,163) | | | | 15,661,739 |
| | | | |
|
Switzerland 7.7% | | | | |
Credit Suisse Group | | 166,500 | | 6,999,121 |
Nestle SA (Registered) | | 16,566 | | 4,334,170 |
Roche Holding AG | | 56,280 | | 6,478,807 |
| | | | |
|
(Cost $14,154,265) | | | | 17,812,098 |
| | | | |
|
Page 136 of 466
| | | | |
United Kingdom 16.9% | | | | |
BHP Billiton PLC | | 191,550 | | 2,245,158 |
Centrica PLC | | 717,600 | | 3,254,867 |
GlaxoSmithKline PLC | | 253,600 | | 5,949,760 |
HSBC Holdings PLC | | 315,200 | | 5,319,295 |
Royal Bank of Scotland Group PLC | | 116,485 | | 3,918,168 |
Smith & Nephew PLC | | 428,088 | | 4,380,657 |
Trinity Mirror PLC | | 324,893 | | 3,967,130 |
Vodafone Group PLC | | 2,192,721 | | 5,946,355 |
WPP Group PLC | | 364,600 | | 4,010,979 |
| | | | |
|
(Cost $31,606,411) | | | | 38,992,369 |
| | | | |
|
Total Common Stocks (Cost $168,299,949) | | | | 220,661,617 |
| | | | |
|
Securities Lending Collateral 2.1% | | | | |
Daily Assets Fund Institutional, 2.25% (c) (e) (Cost $4,791,625) | | 4,791,625 | | 4,791,625 |
| | | | |
|
Cash Equivalents 1.0% | | | | |
Scudder Cash Management QP Trust, 2.24% (b) (Cost $2,321,041) | | 2,321,041 | | 2,321,041 |
| | | | |
|
| | | | |
| | | % of Net Assets
| | Value ($)
|
Total Investment Portfolio (Cost $175,412,615) (a) | | 98.8 | | 227,774,283 |
| | | | |
|
Other Assets and Liabilities, Net | | 1.2 | | 2,795,917 |
| | | | |
|
Net Assets | | 100.0 | | 230,570,200 |
| | | | |
|
Notes to Scudder International Select Equity Portfolio of Investments
| * | Non-income producing security. |
| (a) | The cost for federal income tax purposes was $178,972,673. At December 31, 2004, net unrealized appreciation for all securities based on tax cost was $48,801,610. This consisted of aggregate gross unrealized appreciation for all securities in which there was an excess of value over tax cost of $49,317,375 and aggregate gross unrealized depreciation for all securities in which there was an excess of tax cost over value of $515,765. |
| (b) | Scudder Cash Management QP Trust is managed by Deutsche Investment Management Americas Inc. The rate shown is the annualized seven-day yield at period end. |
| (c) | Daily Assets Fund Institutional, an affiliated fund, is managed by Deutsche Asset Management, Inc. The rate shown is the annualized seven-day yield at period end. |
| (d) | All or a portion of these securities were on loan (see Notes to Financial Statements). The value of all securities loaned at December 31, 2004, amounted to $4,614,982, which is 2.0% of total net assets. |
| (e) | Represents collateral held in connection with securities lending. |
ADR: American Depositary Receipts
GDR: Global Depositary Receipts
144A: Security exempt from registration under Rule 144A of the Securities Act of 1933. These securities may be resold in transactions exempt from registration, normally to qualified institutional buyers.
The accompanying notes are an integral part of the financial statements.
Page 137 of 466
Financial Statements
Statement of Assets and Liabilities as of December 31, 2004
| | | | |
Assets | | | | |
Investments: | | | | |
Investments in securities, at value (cost $168,299,949) — including $4,614,982 of securities loaned | | $ | 220,661,617 | |
Investment in Daily Assets Fund Institutional (cost $4,791,625)* | | | 4,791,625 | |
Investment in Scudder Cash Management QP Trust (cost $2,321,041) | | | 2,321,041 | |
| | |
|
|
|
Total investments in securities, at value (cost $175,412,615) | | | 227,774,283 | |
| | |
|
|
|
Foreign currency, at value (cost $7,387,345) | | | 7,539,201 | |
Dividends receivable | | | 401,534 | |
Interest receivable | | | 12,042 | |
Receivable for Portfolio shares sold | | | 30,778 | |
Foreign taxes recoverable | | | 187,731 | |
Other assets | | | 6,336 | |
| | |
|
|
|
Total assets | | | 235,951,905 | |
| | |
|
|
|
Liabilities | | | | |
Payable for Portfolio shares redeemed | | | 321,835 | |
Payable upon return of securities loaned | | | 4,791,625 | |
Accrued management fee | | | 158,073 | |
Other accrued expenses and payables | | | 110,172 | |
| | |
|
|
|
Total liabilities | | | 5,381,705 | |
| | |
|
|
|
Net assets, at value | | $ | 230,570,200 | |
| | |
|
|
|
Net Assets | | | | |
Net assets consist of: | | | | |
Undistributed net investment income | | | 3,173,342 | |
Net unrealized appreciation (depreciation) on: | | | | |
Investments | | | 52,361,668 | |
Foreign currency related transactions | | | 203,574 | |
Accumulated net realized gain (loss) | | | (50,261,752 | ) |
Paid-in capital | | | 225,093,368 | |
| | |
|
|
|
Net assets, at value | | $ | 230,570,200 | |
| | |
|
|
|
Class A | | | | |
Net Asset Value, offering and redemption price per share ($183,974,883 ÷ 15,442,740 outstanding shares of beneficial interest, $.01 par value, unlimited number of shares authorized) | | $ | 11.91 | |
| | |
|
|
|
Class B | | | | |
Net Asset Value, offering and redemption price per share ($46,595,317 ÷ 3,923,204 outstanding shares of beneficial interest, $.01 par value, unlimited number of shares authorized) | | $ | 11.88 | |
| | |
|
|
|
Page 138 of 466
Statement of Operations for the year ended December 31, 2004
| | | | |
Investment Income | | | | |
Income: | | | | |
Dividends (net of foreign taxes withheld of $537,188) | | $ | 4,438,156 | |
Interest — Scudder Cash Management QP Trust | | | 25,694 | |
Securities lending income, including income from Daily Assets Fund Institutional | | | 136,674 | |
| | |
|
|
|
Total Income | | | 4,600,524 | |
| | |
|
|
|
Expenses: | | | | |
Management fee | | | 1,393,551 | |
Custodian fees | | | 146,550 | |
Distribution service fees (Class B) | | | 78,650 | |
Record keeping fees (Class B) | | | 39,095 | |
Auditing | | | 61,780 | |
Legal | | | 22,220 | |
Trustees’ fees and expenses | | | 7,780 | |
Reports to shareholders | | | 27,484 | |
Other | | | 8,912 | |
| | |
|
|
|
Total expenses, before expense reduction | | | 1,786,022 | |
| | |
|
|
|
Expense reduction | | | (2,084 | ) |
| | |
|
|
|
Total expenses, after expense reduction | | | 1,783,938 | |
| | |
|
|
|
Net investment income (loss) | | | 2,816,586 | |
| | |
|
|
|
Realized and Unrealized Gain (Loss) on Investment Transactions | | | | |
Net realized gain (loss) from: | | | | |
Investments | | | 10,217,608 | |
Foreign currency related transactions | | | 436,300 | |
| | | | 10,653,908 | |
Net unrealized appreciation (depreciation) during the period on: | | | | |
Investments | | | 20,416,088 | |
Foreign currency related transactions | | | 98,838 | |
| | | | 20,514,926 | |
| | |
|
|
|
Net gain (loss) on investment transactions | | | 31,168,834 | |
| | |
|
|
|
Net increase (decrease) in net assets resulting from operations | | $ | 33,985,420 | |
| | |
|
|
|
The accompanying notes are an integral part of the financial statements.
Page 139 of 466
| * | Represents collateral on securities loaned. |
| | | | | | | | |
| Statement of Changes in Net Assets | | | | | | | | |
| | | Years Ended December 31,
| |
Increase (Decrease) in Net Assets
| | 2004
| | | 2003
| |
Operations: | | | | | | | | |
Net investment income (loss) | | $ | 2,816,586 | | | $ | 1,470,136 | |
Net realized gain (loss) on investment transactions | | | 10,653,908 | | | | (2,277,480 | ) |
Net unrealized appreciation (depreciation) on investment transactions during the period | | | 20,514,926 | | | | 36,999,340 | |
Net increase (decrease) in net assets resulting from operations | | | 33,985,420 | | | | 36,191,996 | |
Distributions to shareholders from: | | | | | | | | |
Net investment income | | | | | | | | |
Class A | | | (1,616,136 | ) | | | (1,518,587 | ) |
Class B | | | (162,336 | ) | | | (31,424 | ) |
Portfolio share transactions: | | | | | | | | |
| | |
Class A | | | | | | | | |
Proceeds from shares sold | | | 40,441,379 | | | | 34,706,923 | |
Reinvestment of distributions | | | 1,616,136 | | | | 1,518,587 | |
Cost of shares redeemed | | | (30,593,940 | ) | | | (40,601,242 | ) |
Net increase (decrease) in net assets from Class A share transactions | | | 11,463,575 | | | | (4,375,732 | ) |
| | |
Class B | | | | | | | | |
Proceeds from shares sold | | | 25,663,873 | | | | 16,228,216 | |
Reinvestment of distributions | | | 162,336 | | | | 31,424 | |
Cost of shares redeemed | | | (3,432,245 | ) | | | (2,025,107 | ) |
Net increase (decrease) in net assets from Class B share transactions | | | 22,393,964 | | | | 14,234,533 | |
Increase (decrease) in net assets | | | 66,064,487 | | | | 44,500,786 | |
Net assets at beginning of period | | | 164,505,713 | | | | 120,004,927 | |
| | |
|
|
| |
|
|
|
Net assets at end of period (including undistributed net investment income of $3,173,342 and $1,698,928, respectively) | | $ | 230,570,200 | | | $ | 164,505,713 | |
| | |
|
|
| |
|
|
|
Other Information | | | | | | | | |
Class A | | | | | | | | |
Shares outstanding at beginning of period | | | 14,404,846 | | | | 15,029,877 | |
Shares sold | | | 3,811,740 | | | | 4,153,733 | |
Shares issued to shareholders in reinvestment of distributions | | | 154,506 | | | | 216,015 | |
Shares redeemed | | | (2,928,352 | ) | | | (4,994,779 | ) |
Net increase (decrease) in Portfolio shares | | | 1,037,894 | | | | (625,031 | ) |
| | |
|
|
| |
|
|
|
Shares outstanding at end of period | | | 15,442,740 | | | | 14,404,846 | |
| | |
|
|
| |
|
|
|
Class B | | | | | | | | |
Shares outstanding at beginning of period | | | 1,760,419 | | | | 48,435 | |
Shares sold | | | 2,466,794 | | | | 1,925,484 | |
Shares issued to shareholders in reinvestment of distributions | | | 15,520 | | | | 4,470 | |
Shares redeemed | | | (319,529 | ) | | | (217,970 | ) |
Net increase (decrease) in Portfolio shares | | | 2,162,785 | | | | 1,711,984 | |
| | |
|
|
| |
|
|
|
Shares outstanding at end of period | | | 3,923,204 | | | | 1,760,419 | |
| | |
|
|
| |
|
|
|
The accompanying notes are an integral part of the financial statements.
Page 140 of 466
Financial Highlights
Class A
| | | | | | | | | | | | | | | | | | | | |
Years Ended December 31,
| | 2004
| | | 2003
| | | 2002
| | | 2001
| | | 2000a
| |
| Selected Per Share Data | | | | | | | | | | | | | | | | | | | | |
Net asset value, beginning of period | | $ | 10.18 | | | $ | 7.96 | | | $ | 9.24 | | | $ | 14.73 | | | $ | 21.45 | |
| | |
|
|
| |
|
|
| |
|
|
| |
|
|
| |
|
|
|
Income (loss) from investment operations: | | | | | | | | | | | | | | | | | | | | |
Net investment income (loss)b | | | .17 | | | | .10 | | | | .12 | | | | .05 | | | | .08 | |
Net realized and unrealized gain (loss) on investment transactions | | | 1.67 | | | | 2.23 | | | | (1.36 | ) | | | (3.46 | ) | | | (3.90 | ) |
Total from investment operations | | | 1.84 | | | | 2.33 | | | | (1.24 | ) | | | (3.41 | ) | | | (3.82 | ) |
Less distributions from: | | | | | | | | | | | | | | | | | | | | |
Net investment income | | | (.11 | ) | | | (.11 | ) | | | (.04 | ) | | | (.10 | ) | | | — | |
Net realized gains on investment transactions | | | — | | | | — | | | | — | | | | (1.98 | ) | | | (2.90 | ) |
Total distributions | | | (.11 | ) | | | (.11 | ) | | | (.04 | ) | | | (2.08 | ) | | | (2.90 | ) |
| | |
|
|
| |
|
|
| |
|
|
| |
|
|
| |
|
|
|
Net asset value, end of period | | $ | 11.91 | | | $ | 10.18 | | | $ | 7.96 | | | $ | 9.24 | | | $ | 14.73 | |
| | |
|
|
| |
|
|
| |
|
|
| |
|
|
| |
|
|
|
Total Return (%) | | | 18.25 | | | | 29.83 | | | | (13.48 | ) | | | (24.43 | ) | | | (20.49 | ) |
| Ratios to Average Net Assets and Supplemental Data | | | | | | | | | | | | | | | | | | | | |
Net assets, end of period ($ millions) | | | 184 | | | | 147 | �� | | | 120 | | | | 121 | | | | 179 | |
Ratio of expenses (%) | | | .89 | | | | .94 | | | | .85 | | | | .92 | | | | .84 | |
Ratio of net investment income (loss) (%) | | | 1.58 | | | | 1.17 | | | | 1.46 | | | | .44 | | | | .47 | |
Portfolio turnover rate (%) | | | 88 | | | | 139 | | | | 190 | | | | 145 | | | | 87 | |
| a | On June 18, 2001, the Portfolio implemented a 1 for 10 reverse stock split. Per share information, for the period prior to December 31, 2001, has been restated to reflect the effect of the split. Shareholders received 1 share for every 10 shares owned and net asset value per share increased correspondingly. |
| b | Based on average shares outstanding during the period. |
Page 141 of 466
Class B
| | | | | | | | | | | | |
Years Ended December 31,
| | 2004
| | | 2003
| | | 2002a
| |
Selected Per Share Data | | | | | | | | | | | | |
Net asset value, beginning of period | | $ | 10.15 | | | $ | 7.94 | | | $ | 8.98 | |
| | |
|
|
| |
|
|
| |
|
|
|
Income (loss) from investment operations: | | | | | | | | | | | | |
Net investment income (loss)b | | | .13 | | | | .06 | | | | .02 | |
Net realized and unrealized gain (loss) on investment transactions | | | 1.67 | | | | 2.24 | | | | (1.06 | ) |
Total from investment operations | | | 1.80 | | | | 2.30 | | | | (1.04 | ) |
Less distributions from: | | | | | | | | | | | | |
Net investment income | | | (.07 | ) | | | (.09 | ) | | | — | |
Total distributions | | | (.07 | ) | | | (.09 | ) | | | — | |
| | |
|
|
| |
|
|
| |
|
|
|
Net asset value, end of period | | $ | 11.88 | | | $ | 10.15 | | | $ | 7.94 | |
| | |
|
|
| |
|
|
| |
|
|
|
Total Return (%) | | | 17.84 | | | | 29.42 | | | | (11.58 | )** |
| Ratios to Average Net Assets and Supplemental Data | | | | | | | | | | | | |
Net assets, end of period ($ millions) | | | 47 | | | | 18 | | | | .4 | |
Ratio of expenses (%) | | | 1.28 | | | | 1.33 | | | | 1.11 | * |
Ratio of net investment income (loss) (%) | | | 1.19 | | | | .78 | | | | .54 | * |
Portfolio turnover rate (%) | | | 88 | | | | 139 | | | | 190 | |
| a | For the period July 1, 2002 (commencement of operations of Class B shares) to December 31, 2002. |
| b | Based on average shares outstanding during the period. |
Performance Summary December 31, 2004
Scudder Large Cap Value Portfolio
All performance shown is historical, assumes reinvestment of all dividends and capital gains, and does not guarantee future results. Investment return and principal value fluctuate with changing market conditions so that, when redeemed, shares may be worth more or less then their original cost. Current performance may be lower or higher than the performance data quoted. Please visit scudder.com for the product’s most recent month-end performance. Performance doesn’t reflect charges and fees (“contract charges”) associated with the separate account that invests in the Portfolio or any variable life insurance policy or variable annuity contract for which the Portfolio is an investment option. These charges and fees will reduce returns.
The Portfolio is subject to stock market risk. It focuses its investments on certain economic sectors, thereby increasing its vulnerability to any single economic, political or regulatory development. This may result in greater share price volatility. Please read this Portfolio’s prospectus for specific details regarding its investments and risk profile.
| | |
| Growth of an Assumed $10,000 Investment in Scudder Large Cap Value Portfolio from 5/1/1996 to 12/31/2004 |
|
¨ Scudder Large Cap Value Portfolio — Class A |
| |
¨ Russell 1000 Value Index | | |
 | | The Russell 1000 Value Index is an unmanaged index, which consists of those stocks in the Russell 1000 Index with lower price-to-book ratios and lower forecasted-growth values. Index returns assume reinvested dividends and, unlike Portfolio returns, do not reflect any fees or expenses. It is not possible to invest directly into an index. |
Yearly periods ended December 31 | | |
| | | | | | | | | | | | | | | | | | |
| Comparative Results | | | | | | | | | | | | | | |
Scudder Large Cap Value Portfolio
| | | | 1-Year
| | | 3-Year
| | | 5-Year
| | | Life of
Portfolio*
| |
Class A | | Growth of $10,000 | | $ | 11,007 | | | $ | 12,408 | | | $ | 14,678 | | | $ | 24,051 | |
| | | Average annual total return | | | 10.07 | % | | | 7.46 | % | | | 7.98 | % | | | 10.65 | % |
Russell 1000 Value Index | | Growth of $10,000 | | $ | 11,649 | | | $ | 12,796 | | | $ | 12,929 | | | $ | 24,879 | |
| | | Average annual total return | | | 16.49 | % | | | 8.57 | % | | | 5.27 | % | | | 11.09 | % |
| | | | | |
Scudder Large Cap Value Portfolio
| | | | | | | | | | 1-Year
| | | Life of Class**
| |
Class B | | Growth of $10,000 | | | | | | | | | | $ | 10,965 | | | $ | 12,746 | |
| | | Average annual total return | | | | | | | | | | | 9.65 | % | | | 10.18 | % |
Russell 1000 Value Index | | Growth of $10,000 | | | | | | | | | | $ | 11,649 | | | $ | 13,438 | |
| | | Average annual total return | | | | | | | | | | | 16.49 | % | | | 12.55 | % |
The growth of $10,000 is cumulative.
| * | The Portfolio commenced operations on May 1, 1996. Index returns begin April 30, 1996. |
| ** | The Portfolio commenced offering Class B shares on July 1, 2002. Index returns begin June 30, 2002. |
Page 142 of 466
Information About Your Portfolio’s Expenses
Scudder Large Cap Value Portfolio
As an investor of the Portfolio, you incur two types of costs: ongoing expenses and transaction costs. Ongoing expenses include management fees, distribution and service (12b-1) fees and other Portfolio expenses. Examples of transaction costs include sales charges (loads), redemption fees and account maintenance fees, which are not shown in this section. The following tables are intended to help you understand your ongoing expenses (in dollars) of investing in the Portfolio and to help you compare these expenses with the ongoing expenses of investing in other mutual funds. In the most recent six-month period, the Portfolio limited these expenses; had it not done so, expenses would have been higher. The tables are based on an investment of $1,000 made at the beginning of the six-month period ended December 31, 2004.
The tables illustrate your Portfolio’s expenses in two ways:
Actual Portfolio Return. This helps you estimate the actual dollar amount of ongoing expenses (but not transaction costs) paid on a $1,000 investment in the Portfolio using the Portfolio’s actual return during the period. To estimate the expenses you paid over the period, simply divide your account value by $1,000 (for example, an $8,600 account value divided by $1,000 = 8.6), then multiply the result by the number in the “Expenses Paid per $1,000” line under the share class you hold.
Hypothetical 5% Portfolio Return. This helps you to compare your Portfolio’s ongoing expenses (but not transaction costs) with those of other mutual funds using the Portfolio’s actual expense ratio and a hypothetical rate of return of 5% per year before expenses. Examples using a 5% hypothetical Portfolio return may be found in the shareholder reports of other mutual funds. The hypothetical account values and expenses may not be used to estimate the actual ending account balance or expenses you paid for the period.
Please note that the expenses shown in these tables are meant to highlight your ongoing expenses only and do not reflect any transaction costs. The “Expenses Paid per $1,000” line of the tables is useful in comparing ongoing expenses only and will not help you determine the relative total expense of owning different funds. If these transaction costs had been included, your costs would have been higher.
| | | | | | |
| Expenses and Value of a $1,000 Investment for the six months ended December 31, 2004 | | | | |
| | |
Actual Portfolio Return
| | Class A
| | Class B
|
Beginning Account Value 7/1/04 | | $ | 1,000.00 | | $ | 1,000.00 |
Ending Account Value 12/31/04 | | $ | 1,073.40 | | $ | 1,071.30 |
Expenses Paid per $1,000* | | $ | 4.17 | | $ | 6.10 |
| | |
Hypothetical 5% Portfolio Return
| | Class A
| | Class B
|
Beginning Account Value 7/1/04 | | $ | 1,000.00 | | $ | 1,000.00 |
Ending Account Value 12/31/04 | | $ | 1,021.18 | | $ | 1,019.31 |
Expenses Paid per $1,000* | | $ | 4.06 | | $ | 5.95 |
| * | Expenses are equal to the Portfolio’s annualized expense ratio for each share class, multiplied by the average account value over the period, multiplied by the number of days in the most recent six-month period, then divided by 365. |
Page 143 of 466
| | | | | | |
Annualized Expense Ratios
| | Class A
| | | Class B
| |
Scudder Variable Series II — Scudder Large Cap Value Portfolio | | .8 | 0% | | 1.1 | 7% |
For more information, please refer to the Portfolio’s prospectus.
Management Summary December 31, 2004
Scudder Large Cap Value Portfolio
Scudder Large Cap Value Portfolio (Class A shares, unadjusted for contract charges) posted a total return of 10.07% for the 12-month period ended December 31, 2004. By comparison the Russell 1000 Value Index returned 16.49%, while the broad market, as measured by the Standard & Poor’s 500 (S&P 500), gained 10.88%.
We attribute the variance between our return and that of the Russell 1000 Value Index to the portfolio’s high-quality stocks, which typically fall under the larger market capitalizations within the index. These were precisely the stocks that underperformed within the Russell 1000 Value Index, while stocks with smaller market caps and lower-quality ratings rallied. However, our strategy, we believe, provides an opportunity to add value over the long term.
The portfolio benefited from its underweight position and stock selection in consumer discretionary stocks, which helped relative performance as investors moved away from these typically economically-sensitive stocks. An overweight position in materials also helped as this sector posted relatively strong returns.
An overweight in information technology hurt performance as some investors sold on the belief that the solid economy and capital expenditure trends might reverse in the near term. An overweight position in health care — primarily pharmaceutical stocks — also hurt performance as these stocks struggled when some major drugs were recalled due to health concerns.
We’re pleased with the portfolio, which comprises solid companies with projected earnings growth that is faster than that of the market, valuations that are lower than the market’s and current dividend income that is materially higher.
Thomas F. Sassi
Lead Manager
Steve Scrudato
Manager
Page 144 of 466
Deutsche Investment Management Americas Inc.
All performance shown is historical, assumes reinvestment of all dividends and capital gains, and does not guarantee future results. Investment return and principal value fluctuate with changing market conditions so that, when redeemed, shares may be worth more or less then their original cost. Current performance may be lower or higher than the performance data quoted. Please visit scudder.com for the product’s most recent month-end performance. Performance doesn’t reflect charges and fees (“contract charges”) associated with the separate account that invests in the portfolio or any variable life insurance policy or variable annuity contract for which the portfolio is an investment option. These charges and fees will reduce returns.
Risk Considerations
The portfolio is subject to stock market risk. It focuses its investments on certain economic sectors, thereby increasing its vulnerability to any single economic, political or regulatory development. This may result in greater share price volatility. Please read this portfolio’s prospectus for specific details regarding its investments and risk profile.
The Russell 1000 Value Index is an unmanaged index, which consists of those stocks in the Russell 1000 Index with lower price-to-book ratios and lower forecasted-growth values.
The Standard & Poor’s (S&P) 500 Index is a capitalization-weighted index of 500 stocks. The index is designed to measure performance of the broad domestic economy through changes in the aggregate market value of 500 stocks representing all major industries.
Index returns assume reinvestment of all distributions and do not reflect fees or expenses. It is not possible to invest directly into an index.
Portfolio management market commentary is as of December 31, 2004, and may not come to pass. This information is subject to change at any time based on market and other conditions.
Portfolio Summary
Scudder Large Cap Value Portfolio
| | | | | | |
Asset Allocation (Excludes Securities Lending Collateral)
| | 12/31/04
| | | 12/31/03
| |
Common Stocks | | 99 | % | | 94 | % |
Cash Equivalents | | 1 | % | | 6 | % |
| | |
|
| |
|
|
| | | 100 | % | | 100 | % |
| | |
|
| |
|
|
| | | | | | |
Sector Diversification (Excludes Cash Equivalents and Securities Lending Collateral)
| | 12/31/04
| | | 12/31/03
| |
Financials | | 31 | % | | 32 | % |
Information Technology | | 15 | % | | 12 | % |
Health Care | | 11 | % | | 14 | % |
Industrials | | 11 | % | | 12 | % |
Consumer Discretionary | | 9 | % | | 6 | % |
Energy | | 7 | % | | 8 | % |
Consumer Staples | | 7 | % | | 5 | % |
Materials | | 7 | % | | 8 | % |
Telecommunication Services | | 1 | % | | 2 | % |
Utilities | | 1 | % | | 1 | % |
| | |
|
| |
|
|
| | | 100 | % | | 100 | % |
| | |
|
| |
|
|
Asset allocation and sector diversification are subject to change.
Page 145 of 466
For more complete details about the Portfolio’s investment portfolio, see page 26. A quarterly Fact Sheet is available upon request. Information concerning portfolio holdings of the Portfolio as of month end will be posted to scudder.com on the 15th of the following month.
Following the Portfolio’s fiscal first and third quarter-end, a complete portfolio holdings listing is filed with the SEC on Form N-Q. The form will be available on the SEC’s Web site at www.sec.gov, and it also may be reviewed and copied at the SEC’s Public Reference Room in Washington, D.C. Information on the operation of the SEC’s Public Reference Room may be obtained by calling (800) SEC-0330.
Investment Portfolio December 31, 2004
Scudder Large Cap Value Portfolio
| | | | |
| | | Shares
| | Value ($)
|
Common Stocks 98.6% | | | | |
Consumer Discretionary 9.1% | | | | |
Hotels Restaurants & Leisure 1.1% | | | | |
McDonald’s Corp. | | 108,400 | | 3,475,304 |
| | | | |
|
Multiline Retail 3.1% | | | | |
Family Dollar Stores, Inc. | | 178,300 | | 5,568,309 |
The May Department Stores Co.(c) | | 142,200 | | 4,180,680 |
| | | | |
|
| | | | | 9,748,989 |
| | | | |
|
Specialty Retail 4.9% | | | | |
Limited Brands | | 182,100 | | 4,191,942 |
Lowe’s Companies, Inc. | | 116,700 | | 6,720,753 |
Sherwin-Williams Co. | | 99,000 | | 4,418,370 |
| | | | |
|
| | | | | 15,331,065 |
| | | | |
|
Consumer Staples 6.8% | | | | |
Food Products 5.1% | | | | |
ConAgra Foods, Inc. | | 140,500 | | 4,137,725 |
General Mills, Inc. | | 135,000 | | 6,710,850 |
Sara Lee Corp. | | 214,200 | | 5,170,788 |
| | | | |
|
| | | | | 16,019,363 |
| | | | |
|
Household Products 1.7% | | | | |
Kimberly-Clark Corp. | | 80,000 | | 5,264,800 |
| | | | |
|
Energy 7.3% | | | | |
Oil & Gas | | | | |
BP PLC (ADR) | | 61,344 | | 3,582,489 |
ChevronTexaco Corp. | | 55,100 | | 2,893,301 |
ConocoPhillips | | 25,000 | | 2,170,750 |
ExxonMobil Corp. | | 184,000 | | 9,431,840 |
Royal Dutch Petroleum Co. (NY Shares) | | 86,000 | | 4,934,680 |
| | | | |
|
| | | | | 23,013,060 |
| | | | |
|
Page 146 of 466
| | | | |
Financials 30.1% | | | | |
Banks 15.1% | | | | |
AmSouth Bancorp. | | 179,300 | | 4,643,870 |
Bank of America Corp. | | 229,226 | | 10,771,330 |
BB&T Corp. | | 74,600 | | 3,136,930 |
National City Corp. | | 133,500 | | 5,012,925 |
PNC Financial Services Group | | 144,200 | | 8,282,848 |
SunTrust Banks, Inc. (c) | | 51,400 | | 3,797,432 |
US Bancorp. | | 177,600 | | 5,562,432 |
Wachovia Corp. | | 118,500 | | 6,233,100 |
| | | | |
|
| | | | | 47,440,867 |
| | | | |
|
Capital Markets 4.2% | | | | |
Bear Stearns Companies, Inc. | | 42,400 | | 4,337,944 |
Merrill Lynch & Co., Inc. | | 96,700 | | 5,779,759 |
Morgan Stanley | | 55,000 | | 3,053,600 |
| | | | |
|
| | | | | 13,171,303 |
| | | | |
|
Diversified Financial Services 8.9% | | | | |
Citigroup, Inc. | | 234,700 | | 11,307,846 |
Fannie Mae | | 43,400 | | 3,090,514 |
Freddie Mac | | 44,400 | | 3,272,280 |
| | |
| | | Shares
| | Value ($)
|
JPMorgan Chase & Co. | | 264,700 | | 10,325,947 |
| | | | |
|
| | | | | 27,996,587 |
| | | | |
|
Insurance 1.9% | | | | |
Allstate Corp. | | 31,100 | | 1,608,492 |
American International Group, Inc. | | 68,800 | | 4,518,096 |
| | | | |
|
| | | | | 6,126,588 |
| | | | |
|
Health Care 11.3% | | | | |
Health Care Equipment & Supplies 2.7% | | | | |
Baxter International, Inc. | | 219,500 | | 7,581,530 |
Waters Corp.* | | 16,600 | | 776,714 |
| | | | |
|
| | | | | 8,358,244 |
| | | | |
|
Pharmaceuticals 8.6% | | | | |
Abbott Laboratories | | 121,100 | | 5,649,315 |
Bristol-Myers Squibb Co. | | 289,900 | | 7,427,238 |
Johnson & Johnson | | 71,700 | | 4,547,214 |
Pfizer, Inc. | | 161,900 | | 4,353,491 |
Wyeth | | 119,000 | | 5,068,210 |
| | | | |
|
| | | | | 27,045,468 |
| | | | |
|
Industrials 10.8% | | | | |
Aerospace & Defense 2.4% | | | | |
Honeywell International, Inc. | | 215,700 | | 7,637,937 |
| | | | |
|
Commercial Services & Supplies 2.0% | | | | |
Avery Dennison Corp. | | 75,500 | | 4,527,735 |
Pitney Bowes, Inc. | | 35,400 | | 1,638,312 |
| | | | |
|
| | | | | 6,166,047 |
| | | | |
|
Page 147 of 466
| | | | |
Electrical Equipment 1.1% | | | | |
Emerson Electric Co. | | 48,200 | | 3,378,820 |
| | | | |
|
Industrial Conglomerates 5.3% | | | | |
General Electric Co. | | 296,500 | | 10,822,250 |
Textron, Inc. | | 81,600 | | 6,022,080 |
| | | | |
|
| | | | | 16,844,330 |
| | | | |
|
Information Technology 14.8% | | | | |
Communications Equipment 1.8% | | | | |
Nokia Oyj (ADR) | | 360,500 | | 5,649,035 |
| | | | |
|
Computers & Peripherals 3.6% | | | | |
Hewlett-Packard Co. | | 253,797 | | 5,322,123 |
International Business Machines Corp. | | 60,800 | | 5,993,664 |
| | | | |
|
| | | | | 11,315,787 |
| | | | |
|
IT Consulting & Services 2.3% | | | | |
Automatic Data Processing, Inc. | | 165,700 | | 7,348,795 |
| | | | |
|
Semiconductors & Semiconductor Equipment 5.5% | | | | |
Applied Materials, Inc.* | | 271,000 | | 4,634,100 |
Intel Corp. (c) | | 332,800 | | 7,784,192 |
Texas Instruments, Inc. | | 200,400 | | 4,933,848 |
| | | | |
|
| | | | | 17,352,140 |
| | | | |
|
Software 1.6% | | | | |
Microsoft Corp. | | 188,900 | | 5,045,519 |
| | | | |
|
| | |
| | | Shares
| | Value ($)
|
Materials 6.7% | | | | |
Chemicals 2.7% | | | | |
Air Products & Chemicals, Inc. | | 107,400 | | 6,225,978 |
Dow Chemical Co. | | 45,100 | | 2,232,901 |
| | | | |
|
| | | | | 8,458,879 |
| | | | |
|
Containers & Packaging 2.4% | | | | |
Sonoco Products Co. | | 249,200 | | 7,388,780 |
| | | | |
|
Metals & Mining 1.6% | | | | |
Alcoa, Inc. | | 162,800 | | 5,115,176 |
| | | | |
|
Telecommunication Services 0.9% | | | | |
Diversified Telecommunication Services | | | | |
SBC Communications, Inc. | | 114,000 | | 2,937,780 |
| | | | |
|
Utilities 0.8% | | | | |
Electric Utilities | | | | |
Progress Energy, Inc. | | 53,300 | | 2,411,292 |
| | | | |
|
Total Common Stocks (Cost $259,732,207) | | | | 310,041,955 |
| | | | |
|
Page 148 of 466
| | | | |
| | | Shares
| | Value ($)
|
Securities Lending Collateral 2.9% | | | | |
Daily Assets Fund Institutional, 2.25% (d) (e) (Cost $9,143,450) | | 9,143,450 | | 9,143,450 |
| | | | |
|
Cash Equivalents 1.1% | | | | |
Scudder Cash Management QP Trust, 2.24% (b) (Cost $3,407,148) | | 3,407,148 | | 3,407,148 |
| | | | |
|
| | | | | | |
| | | % of Net Assets
| | | Value ($)
| |
Total Investment Portfolio (Cost $272,282,805) (a) | | 102.6 | | | 322,592,553 | |
| | | | | |
|
|
Other Assets and Liabilities, Net | | (2.6 | ) | | (8,269,795 | ) |
| | | | | |
|
|
Net Assets | | 100.0 | | | 314,322,758 | |
| | | | | |
|
|
Notes to Scudder Large Cap Value Portfolio of Investments
| * | Non-income producing security. |
| (a) | The cost for federal income tax purposes was $274,462,734. At December 31, 2004, net realized appreciation for all securities based on tax cost was $48,129,819. This consisted of aggregate gross unrealized appreciation for all securities in which there was an excess of value over tax cost of $53,855,821 and aggregate gross unrealized depreciation for all securities in which there was an excess of tax cost over value of $5,726,002. |
| (b) | Scudder Cash Management QP Trust is managed by Deutsche Investment Management Americas Inc. The rate shown is the annualized seven-day yield at period end. |
| (c) | All or a portion of these securities were on loan (see Notes to Financial Statements). The value of all securities loaned at December 31, 2004 amounted to $8,940,036, which is 2.8% of net assets. |
| (d) | Daily Assets Fund Institutional, an affiliated fund, is also managed by Deutsche Asset Management, Inc. The rate shown is the annualized seven-day yield at period end. |
| (e) | Represents collateral held in connection with securities lending. |
ADR: American Depositary Receipts
The accompanying notes are an integral part of the financial statements.
Page 149 of 466
Financial Statements
| | | | |
| Statement of Assets and Liabilities as of December 31, 2004 | | | | |
| |
Assets | | | | |
Investments: | | | | |
Investments in securities, at value (cost $259,732,207) — including $8,940,036 of securities loaned | | $ | 310,041,955 | |
Investment in Daily Assets Fund Institutional (cost $9,143,450)* | | | 9,143,450 | |
Investment in Scudder Cash Management QP Trust (cost $3,407,148) | | | 3,407,148 | |
| | |
|
|
|
Total investments in securities, at value (cost $272,282,805) | | | 322,592,553 | |
| | |
|
|
|
Cash | | | 121,117 | |
Receivable for investments sold | | | 1,165,433 | |
Dividends receivable | | | 724,356 | |
Interest receivable | | | 14,821 | |
Receivable for Portfolio shares sold | | | 66,955 | |
Other assets | | | 8,824 | |
| | |
|
|
|
Total assets | | | 324,694,059 | |
| | |
|
|
|
Liabilities | | | | |
Payable for investments purchased | | | 741,948 | |
Payable upon return of securities loaned | | | 9,143,450 | |
Payable for Portfolio shares redeemed | | | 197,898 | |
Accrued management fee | | | 207,442 | |
Other accrued expenses and payables | | | 80,563 | |
| | |
|
|
|
Total liabilities | | | 10,371,301 | |
| | |
|
|
|
Net assets, at value | | $ | 314,322,758 | |
| | |
|
|
|
Net Assets | | | | |
Net assets consist of: | | | | |
Undistributed net investment income | | $ | 5,206,284 | |
Net unrealized appreciation (depreciation) on investments | | | 50,309,748 | |
Accumulated net realized gain (loss) | | | (26,565,978 | ) |
Paid-in capital | | | 285,372,704 | |
| | |
|
|
|
Net assets, at value | | $ | 314,322,758 | |
| | |
|
|
|
Class A | | | | |
Net Asset Value, offering and redemption price per share ($273,951,365 ÷ 17,350,180 outstanding shares of beneficial interest, $.01 par value, unlimited number of shares authorized) | | $ | 15.79 | |
| | |
|
|
|
Class B | | | | |
Net Asset Value, offering and redemption price per share ($40,371,393 ÷ 2,560,016 outstanding shares of beneficial interest, $.01 par value, unlimited number of shares authorized) | | $ | 15.77 | |
| | |
|
|
|
Page 150 of 466
| | | | |
| Statement of Operations for the year ended December 31, 2004 | | | | |
| |
Investment Income | | | | |
Income: | | | | |
Dividends (net of foreign taxes withheld of $27,291) | | $ | 7,627,184 | |
Interest — Scudder Cash Management QP Trust | | | 170,328 | |
Securities lending income, including income from Daily Assets Fund Institutional | | | 10,990 | |
Total Income | | | 7,808,502 | |
Expenses: | | | | |
Management fee | | | 2,219,930 | |
Custodian fees | | | 20,665 | |
Distribution service fees (Class B) | | | 81,071 | |
Record keeping fees (Class B) | | | 40,979 | |
Auditing | | | 53,447 | |
Legal | | | 18,839 | |
Reports to shareholders | | | 45,575 | |
Other | | | 7,225 | |
Total expenses, before expense reductions | | | 2,487,731 | |
Expense reductions | | | (3,034 | ) |
Total expenses, after expense reductions | | | 2,484,697 | |
| | |
|
|
|
Net investment income (loss) | | | 5,323,805 | |
| | |
|
|
|
Realized and Unrealized Gain (Loss) on Investment Transactions | | | | |
Net realized gain (loss) from investments | | | 13,617,082 | |
Net unrealized appreciation (depreciation) during the period on investments | | | 9,876,005 | |
| | |
|
|
|
Net gain (loss) on investment transactions | | | 23,493,087 | |
| | |
|
|
|
Net increase (decrease) in net assets resulting from operations | | $ | 28,816,892 | |
| | |
|
|
|
The accompanying notes are an integral part of the financial statements.
| * | Represents collateral on securities loaned. |
Statement of Changes in Net Assets
| | | | | | | | |
Increase (Decrease) in Net Assets
| | Years Ended December 31,
| |
| | 2004
| | | 2003
| |
Operations: | | | | | | | | |
Net investment income (loss) | | $ | 5,323,805 | | | $ | 4,449,706 | |
Net realized gain (loss) on investment transactions | | | 13,617,082 | | | | (2,062,532 | ) |
Net unrealized appreciation (depreciation) on investment transactions during the period | | | 9,876,005 | | | | 64,744,276 | |
Net increase (decrease) in net assets resulting from operations | | | 28,816,892 | | | | 67,131,450 | |
Distributions to shareholders from: | | | | | | | | |
Net investment income | | | (4,099,698 | ) | | | (4,338,949 | ) |
Class A | | | | | | | | |
Class B | | | (305,336 | ) | | | (34,467 | ) |
Portfolio share transactions: | | | | | | | | |
| | |
Class A | | | | | | | | |
Proceeds from shares sold | | | 26,091,725 | | | | 21,484,093 | |
Reinvestment of distributions | | | 4,099,698 | | | | 4,338,949 | |
Cost of shares redeemed | | | (40,278,155 | ) | | | (38,394,030 | ) |
Net increase (decrease) in net assets from Class A share transactions | | | (10,086,732 | ) | | | (12,570,988 | ) |
| | |
Class B | | | | | | | | |
Proceeds from shares sold | | | 22,917,145 | | | | 15,038,872 | |
Reinvestment of distributions | | | 305,336 | | | | 34,467 | |
Cost of shares redeemed | | | (3,736,209 | ) | | | (130,010 | ) |
Net increase (decrease) in net assets from Class B share transactions | | | 19,486,272 | | | | 14,943,329 | |
Increase (decrease) in net assets | | | 33,811,398 | | | | 65,130,375 | |
Net assets at beginning of period | | | 280,511,360 | | | | 215,380,985 | |
| | |
|
|
| |
|
|
|
Net assets at end of period (including undistributed net investment income of $5,206,284 and $4,287,513, respectively) | | $ | 314,322,758 | | | $ | 280,511,360 | |
| | |
|
|
| |
|
|
|
Page 151 of 466
| | | | | | |
Other Information | | | | | | |
| | |
Class A | | | | | | |
Shares outstanding at beginning of period | | 18,033,776 | | | 19,122,645 | |
Shares sold | | 1,766,310 | | | 1,748,402 | |
Shares issued to shareholders in reinvestment of distributions | | 282,738 | | | 417,608 | |
Shares redeemed | | (2,732,644 | ) | | (3,254,879 | ) |
Net increase (decrease) in Portfolio shares | | (683,596 | ) | | (1,088,869 | ) |
| | |
|
| |
|
|
Shares outstanding at end of period | | 17,350,180 | | | 18,033,776 | |
| | |
|
| |
|
|
Class B | | | | | | |
Shares outstanding at beginning of period | | 1,221,656 | | | 44,927 | |
Shares sold | | 1,563,652 | | | 1,182,972 | |
Shares issued to shareholders in reinvestment of distributions | | 21,029 | | | 3,314 | |
Shares redeemed | | (246,321 | ) | | (9,557 | ) |
Net increase (decrease) in Portfolio shares | | 1,338,360 | | | 1,176,729 | |
| | |
|
| |
|
|
Shares outstanding at end of period | | 2,560,016 | | | 1,221,656 | |
| | |
|
| |
|
|
The accompanying notes are an integral part of the financial statements.
Financial Highlights
Class A
| | | | | | | | | | | | | | | | | | | | |
Years Ended December 31,
| | 2004
| | | 2003
| | | 2002
| | | 2001
| | | 2000a
| |
Selected Per Share Data | | | | | | | | | | | | | | | | | | | | |
Net asset value, beginning of period | | $ | 14.57 | | | $ | 11.24 | | | $ | 13.40 | | | $ | 13.40 | | | $ | 14.70 | |
| | |
|
|
| |
|
|
| |
|
|
| |
|
|
| |
|
|
|
Income (loss) from investment operations: | | | | | | | | | | | | | | | | | | | | |
Net investment income (loss)b | | | .27 | | | | .24 | | | | .23 | | | | .23 | | | | .30 | |
Net realized and unrealized gain (loss) on investment transactions | | | 1.18 | | | | 3.33 | | | | (2.20 | ) | | | .01 | | | | 1.40 | |
Total from investment operations | | | 1.45 | | | | 3.57 | | | | (1.97 | ) | | | .24 | | | | 1.70 | |
Less distributions from: | | | | | | | | | | | | | | | | | | | | |
Net investment income | | | (.23 | ) | | | (.24 | ) | | | (.19 | ) | | | (.24 | ) | | | (.40 | ) |
Net realized gains on investment transactions | | | — | | | | — | | | | — | | | | — | | | | (2.60 | ) |
| | |
|
|
| |
|
|
| |
|
|
| |
|
|
| |
|
|
|
Total distributions | | | (.23 | ) | | | (.24 | ) | | | (.19 | ) | | | (.24 | ) | | | (3.00 | ) |
| | |
|
|
| |
|
|
| |
|
|
| |
|
|
| |
|
|
|
Net asset value, end of period | | $ | 15.79 | | | $ | 14.57 | | | $ | 11.24 | | | $ | 13.40 | | | $ | 13.40 | |
| | |
|
|
| |
|
|
| |
|
|
| |
|
|
| |
|
|
|
Total Return (%) | | | 10.07 | | | | 32.60 | | | | (14.98 | ) | | | 1.87 | | | | 16.13 | |
| | |
|
|
| |
|
|
| |
|
|
| |
|
|
| |
|
|
|
Ratios to Average Net Assets and Supplemental Data | | | | | | | | | | | | | | | | | | | | |
Net assets, end of period ($ millions) | | | 274 | | | | 263 | | | | 215 | | | | 257 | | | | 219 | |
Ratio of expenses (%) | | | .80 | | | | .80 | | | | .79 | | | | .79 | | | | .80 | |
Ratio of net investment income (loss) (%) | | | 1.84 | | | | 1.94 | | | | 1.84 | | | | 1.75 | | | | 2.55 | |
Portfolio turnover rate (%) | | | 40 | | | | 58 | | | | 84 | | | | 72 | | | | 56 | |
| a | On June 18, 2001, the Portfolio implemented a 1 for 10 reverse stock split. Per share information, for the period prior to December 31, 2001, has been restated to reflect the effect of the split. Shareholders received 1 share for every 10 shares owned and net asset value per share increased correspondingly. |
Page 152 of 466
| b | Based on average shares outstanding during the period. |
Class B
| | | | | | | | | | | | |
Years Ended December 31,
| | 2004
| | | 2003
| | | 2002a
| |
Selected Per Share Data | | | | | | | | | | | | |
Net asset value, beginning of period | | $ | 14.55 | | | $ | 11.23 | | | $ | 12.77 | |
| | |
|
|
| |
|
|
| |
|
|
|
Income (loss) from investment operations: | | | | | | | | | | | | |
Net investment income (loss)b | | | .22 | | | | .18 | | | | .15 | |
Net realized and unrealized gain (loss) on investment transactions | | | 1.17 | | | | 3.35 | | | | (1.69 | ) |
| | |
|
|
| |
|
|
| |
|
|
|
Total from investment operations | | | 1.39 | | | | 3.53 | | | | (1.54 | ) |
| | |
|
|
| |
|
|
| |
|
|
|
Less distributions from: | | | | | | | | | | | | |
Net investment income | | | (.17 | ) | | | (.21 | ) | | | — | |
| | |
|
|
| |
|
|
| |
|
|
|
Net asset value, end of period | | $ | 15.77 | | | $ | 14.55 | | | $ | 11.23 | |
| | |
|
|
| |
|
|
| |
|
|
|
Total Return (%) | | | 9.65 | | | | 32.19 | | | | (12.06 | )** |
| | |
|
|
| |
|
|
| |
|
|
|
Ratios to Average Net Assets and Supplemental Data | | | | | | | | | | | | |
Net assets, end of period ($ millions) | | | 40 | | | | 18 | | | | .5 | |
Ratio of expenses (%) | | | 1.18 | | | | 1.19 | | | | 1.04 | * |
Ratio of net investment income (loss) (%) | | | 1.46 | | | | 1.55 | | | | 2.74 | * |
Portfolio turnover rate (%) | | | 40 | | | | 58 | | | | 84 | ** |
| a | For the period July 1, 2002 (commencement of operations of Class B shares) to December 31, 2002. |
| b | Based on average shares outstanding during the period. |
Information About Your Portfolio’s Expenses
Scudder Mercury Large Cap Core Portfolio
As an investor of the Portfolio, you incur two types of costs: ongoing expenses and transaction costs. Ongoing expenses include management fees, distribution and service (12b-1) fees and other Portfolio expenses. Examples of transaction costs include sales charges (loads), redemption fees and account maintenance fees, which are not shown in this section. The following tables are intended to help you understand your ongoing expenses (in dollars) of investing in the Portfolio and to help you compare these expenses with the ongoing expenses of investing in other mutual funds. In the most recent six-month period, the Portfolio limited these expenses; had it not done so, expenses would have
Page 153 of 466
been higher. The tables are based on an investment of $1,000 made at the beginning of the period (November 15, 2004) ended December 31, 2004.
The tables illustrate your Portfolio’s expenses in two ways:
Actual Portfolio Return. This helps you estimate the actual dollar amount of ongoing expenses (but not transaction costs) paid on a $1,000 investment in the Portfolio using the Portfolio’s actual return during the period. To estimate the expenses you paid over the period, simply divide your account value by $1,000 (for example, an $8,600 account value divided by $1,000 = 8.6), then multiply the result by the number in the “Expenses Paid per $1,000” line under the share class you hold.
Hypothetical 5% Portfolio Return. This helps you to compare your Portfolio’s ongoing expenses (but not transaction costs) with those of other mutual funds using the Portfolio’s actual expense ratio and a hypothetical rate of return of 5% per year before expenses. Examples using a 5% hypothetical Portfolio return may be found in the shareholder reports of other mutual funds. The hypothetical account values and expenses may not be used to estimate the actual ending account balance or expenses you paid for the period.
Please note that the expenses shown in these tables are meant to highlight your ongoing expenses only and do not reflect any transaction costs. The “Expenses Paid per $1,000” line of the tables is useful in comparing ongoing expenses only and will not help you determine the relative total expense of owning different funds. If these transaction costs had been included, your costs would have been higher.
Expenses and Value of a $1,000 Investment for the period ended December 31, 2004
| | | | | | |
Actual Portfolio Return
| | Class A
| | Class B
|
Beginning Account Value 11/15/04 | | $ | 1,000.00 | | $ | 1,000.00 |
Ending Account Value 12/31/04 | | $ | 1,039.00 | | $ | 1,039.00 |
Expenses Paid per $1,000* | | $ | 1.28 | | $ | 1.54 |
| | |
Hypothetical 5% Portfolio Return
| | Class A
| | Class B
|
Beginning Account Value 11/15/04 | | $ | 1,000.00 | | $ | 1,000.00 |
Ending Account Value 12/31/04 | | $ | 1,005.05 | | $ | 1,004.79 |
Expenses Paid per $1,000* | | $ | 1.26 | | $ | 1.51 |
| * | Expenses are equal to the Portfolio’s annualized expense ratio for each share class, multiplied by the average account value over the period, multiplied by the number of days since the commencement of the class (November 15, 2004), then divided by 365. |
| | | | | | |
Annualized Expense Ratios
| | Class A
| | | Class B
| |
Scudder Variable Series II — Scudder Mercury Large Cap Core Portfolio | | 1.12 | % | | 1.11 | % |
For more information, please refer to the Portfolio’s prospectus.
Management Summary December 31, 2004
Scudder Mercury Large Cap Core Portfolio
The portfolio gained 3.90% (Class A shares, unadjusted for contract charges) from its date of inception, November 15, 2004, through December 31, 2004, while its benchmark, the Russell 1000 Index, returned 3.01% for the same period.
Page 154 of 466
Security selection in the consumer discretionary sector detracted from the relative return. President Bush’s re-election in November sparked a rally in nearly all sectors. The more notable run-ups were among health-care providers and insurers, fueled by the perception that the Bush administration — compared to a possible Kerry presidency — would foster a more favorable regulatory environment. As a result, the portfolio’s overweight in health care benefited performance. The fund’s overweight in consumer discretionary and absence of positions in telecommunication services also proved beneficial.
Only three of the portfolio’s 10 largest holdings contributed positively to its relative performance during the period: Prudential Financial, Inc., Motorola, Inc. and General Electric Co. Our position in Pfizer, Inc. had a slightly negative effect on the comparative performance, while the relative returns of Costco Wholesale Corp., Microsoft Corp., ConocoPhillips, Exxon Mobil Corp., ChevronTexaco Corp. and Johnson & Johnson were virtually flat.
The portfolio currently emphasizes a pro-cyclical approach to the economy because we believe that, for now, economic and earnings growth will be reasonably strong. Accordingly, the portfolio’s largest overweights versus the benchmarks are IT, consumer discretionary, materials and energy, while the largest underweights are telecommunication services, consumer staples and financial services.
Bob Doll, CFA, CPA
Lead Portfolio Manager
Tasos Bouloutas Brenda Sklar
Dan Hansen Gregory Brunk
Portfolio Managers
Fund Asset Management L.P., Subadvisor to the Portfolio
All performance shown is historical, assumes reinvestment of all dividends and capital gains, and does not guarantee future results. Investment return and principal value fluctuate with changing market conditions so that, when redeemed, shares may be worth more or less then their original cost. Current performance may be lower or higher than the performance data quoted. Please visit scudder.com for the product’s most recent month-end performance. Performance doesn’t reflect charges and fees (“contract charges”) associated with the separate account that invests in the portfolio or any variable life insurance policy or variable annuity contract for which the portfolio is an investment option. These charges and fees will reduce returns.
Returns during part or all of the periods shown reflect a fee waiver and/or expense reimbursement. Without this waiver/reimbursement, returns would have been lower.
Risk Considerations
The portfolio is subject to stock market risk. It focuses its investments on certain economic sectors, thereby increasing its vulnerability to any single economic, political or regulatory development. This may result in greater share price volatility. Please read this portfolio’s prospectus for specific details regarding its investments and risk profile.
The Russell 1000 Index is an unmanaged capitalization-weighted price-only index composed of the largest-capitalized United States companies whose common stocks are traded in the US. This larger capitalization, market-oriented index is highly correlated with the S&P 500 Index. Index returns assume reinvestment of all distributions and do not reflect fees or expenses. It is not possible to invest directly into an index.
Portfolio management market commentary is as of December 31, 2004, and may not come to pass. This information is subject to change at any time based on market and other conditions.
Page 155 of 466
Portfolio Summary
Scudder Mercury Large Cap Core Portfolio
| | | |
Asset Allocation
| | 12/31/04
| |
Common Stocks | | 99 | % |
Cash Equivalents | | 1 | % |
| | |
|
|
| | | 100 | % |
| | |
|
|
| | | |
Sector Diversification (Excludes Cash Equivalents)
| | 12/31/04
| |
Information Technology | | 24 | % |
Consumer Discretionary | | 18 | % |
Health Care | | 12 | % |
Financials | | 12 | % |
Energy | | 11 | % |
Industrials | | 8 | % |
Materials | | 8 | % |
Consumer Staples | | 4 | % |
Utilities | | 3 | % |
| | |
|
|
| | | 100 | % |
| | |
|
|
Asset allocation and sector diversification are subject to change.
For more complete details about the Portfolio’s investment portfolio, see page 36. A quarterly Fact Sheet is available upon request. Information concerning portfolio holdings of the Portfolio as of month end will be posted to scudder.com on the 15th of the following month.
Following the Portfolio’s fiscal first and third quarter-end, a complete portfolio holdings listing is filed with the SEC on Form N-Q. The form will be available on the SEC’s Web site at www.sec.gov, and it also may be reviewed and copied at the SEC’s Public Reference Room in Washington, D.C. Information on the operation of the SEC’s Public Reference Room may be obtained by calling (800) SEC-0330.
Investment Portfolio December 31, 2004
Scudder Mercury Large Cap Core Portfolio
| | | | |
| | | Shares
| | Value ($)
|
Common Stocks 96.1% | | | | |
Consumer Discretionary 17.6% | | | | |
Hotels Restaurants & Leisure 1.0% | | | | |
McDonald’s Corp. | | 490 | | 15,709 |
| | | | |
|
Household Durables 3.6% | | | | |
Page 156 of 466
| | | | |
Black & Decker Corp. | | 130 | | 11,483 |
Harman International Industries, Inc. | | 120 | | 15,240 |
NVR, Inc.* | | 20 | | 15,388 |
The Stanley Works | | 285 | | 13,962 |
| | | | |
|
| | | | | 56,073 |
| | | | |
|
Leisure Equipment & Products 0.9% | | | | |
Eastman Kodak Co. | | 435 | | 14,029 |
| | | | |
|
Media 0.5% | | | | |
Getty Images, Inc.* | | 115 | | 7,918 |
| | | | |
|
Multiline Retail 2.9% | | | | |
Dillard’s, Inc. “A” | | 475 | | 12,763 |
J.C. Penny Co., Inc. | | 405 | | 16,767 |
Nordstrom, Inc. | | 350 | | 16,356 |
| | | | |
|
| | | | | 45,886 |
| | | | |
|
Specialty Retail 8.7% | | | | |
Abercrombie & Fitch Co. “A” | | 335 | | 15,728 |
American Eagle Outfitters, Inc. | | 350 | | 16,485 |
Circuit City Stores, Inc. | | 880 | | 13,763 |
Claire’s Stores, Inc. | | 245 | | 5,206 |
Limited Brands | | 655 | | 15,078 |
Michaels Stores, Inc. | | 370 | | 11,089 |
PETsMART, Inc. | | 390 | | 13,857 |
Staples, Inc. | | 510 | | 17,192 |
The Gap, Inc. | | 625 | | 13,200 |
Urban Outfitters, Inc.* | | 320 | | 14,208 |
| | | | |
|
| | | | | 135,806 |
| | | | |
|
Consumer Staples 3.4% | | | | |
Food & Staples Retailing 1.3% | | | | |
Costco Wholesale Corp. | | 365 | | 17,670 |
Wal-Mart Stores, Inc. | | 35 | | 2,377 |
| | | | |
|
| | | | | 20,047 |
| | | | |
|
Food Products 1.9% | | | | |
Archer-Daniels-Midland Co. | | 740 | | 16,509 |
Tyson Foods, Inc. “A” | | 740 | | 13,616 |
| | | | |
|
| | | | | 30,125 |
| | | | |
|
Household Products 0.2% | | | | |
Procter & Gamble Co. | | 55 | | 3,029 |
| | | | |
|
Energy 11.1% | | | | |
Oil & Gas | | | | |
Amerada Hess Corp. | | 170 | | 14,005 |
Anadarko Petroleum Corp. | | 115 | | 7,453 |
Ashland, Inc. | | 170 | | 9,925 |
Burlington Resources, Inc. | | 400 | | 17,400 |
ChevronTexaco Corp. | | 560 | | 29,406 |
ConocoPhillips | | 260 | | 22,576 |
Devon Energy Corp. | | 85 | | 3,308 |
Page 157 of 466
| | | | |
ExxonMobil Corp. | | 525 | | 26,911 |
Occidental Petroleum Corp. | | 165 | | 9,629 |
| | |
| | | Shares
| | Value ($)
|
Sunoco, Inc. | | 185 | | 15,116 |
Valero Energy Corp. | | 370 | | 16,798 |
| | | | |
|
| | | | | 172,527 |
| | | | |
|
Financials 11.1% | | | | |
Banks 0.6% | | | | |
Bank of America Corp. | | 190 | | 8,928 |
| | | | |
|
Capital Markets 0.5% | | | | |
E*TRADE Financial Corp.* | | 530 | | 7,924 |
| | | | |
|
Diversified Financial Services 1.7% | | | | |
Citigroup, Inc. | | 335 | | 16,140 |
Countrywide Financial Corp. | | 180 | | 6,662 |
JPMorgan Chase & Co. | | 85 | | 3,316 |
| | | | |
|
| | | | | 26,118 |
| | | | |
|
Insurance 8.3% | | | | |
Allstate Corp. | | 305 | | 15,775 |
American International Group, Inc. | | 65 | | 4,268 |
Chubb Corp. | | 215 | | 16,533 |
Hartford Financial Services Group, Inc. | | 70 | | 4,852 |
Lincoln National Corp. | | 325 | | 15,171 |
Loews Corp. | | 215 | | 15,114 |
MetLife, Inc. | | 105 | | 4,254 |
Prudential Financial, Inc. | | 365 | | 20,060 |
Safeco Corp. | | 305 | | 15,933 |
UnumProvident Corp. | | 740 | | 13,276 |
W.R. Berkley Corp. | | 105 | | 4,953 |
| | | | |
|
| | | | | 130,189 |
| | | | |
|
Health Care 11.7% | | | | |
Health Care Equipment & Supplies 0.8% | | | | |
Bausch & Lomb, Inc. | | 35 | | 2,256 |
Becton, Dickinson & Co. | | 185 | | 10,508 |
| | | | |
|
| | | | | 12,764 |
| | | | |
|
Health Care Providers & Services 5.1% | | | | |
Aetna, Inc. | | 135 | | 16,841 |
CIGNA Corp. | | 200 | | 16,314 |
Humana, Inc.* | | 540 | | 16,033 |
Laboratory Corp. of America Holdings* | | 300 | | 14,946 |
PacifiCare Health Systems, Inc.* | | 275 | | 15,543 |
| | | | |
|
| | | | | 79,677 |
| | | | |
|
Pharmaceuticals 5.8% | | | | |
Celgene Corp.* | | 475 | | 12,602 |
Johnson & Johnson | | 605 | | 38,369 |
Pfizer, Inc. | | 1,445 | | 38,856 |
| | | | |
|
| | | | | 89,827 |
| | | | |
|
Page 158 of 466
| | | | |
Industrials 7.6% | | | | |
Aerospace & Defense 1.2% | | | | |
Boeing Co. | | 140 | | 7,248 |
General Dynamics Corp. | | 80 | | 8,368 |
Goodrich Corp. | | 100 | | 3,264 |
| | | | |
|
| | | | | 18,880 |
| | | | |
|
Air Freight & Logistics 0.8% | | | | |
FedEx Corp. | | 45 | | 4,432 |
Ryder System, Inc. | | 170 | | 8,121 |
| | | | |
|
| | | | | 12,553 |
| | | | |
|
| | |
| | | Shares
| | Value ($)
|
Commercial Services & Supplies 0.0% | | | | |
ITT Educational Services, Inc.* | | 15 | | 718 |
| | | | |
|
Electrical Equipment 1.1% | | | | |
Rockwell Automation, Inc. | | 340 | | 16,847 |
| | | | |
|
Industrial Conglomerates 2.1% | | | | |
General Electric Co. | | 920 | | 33,580 |
| | | | |
|
Machinery 1.2% | | | | |
Cummins, Inc. | | 190 | | 15,920 |
Graco, Inc. | | 70 | | 2,614 |
| | | | |
|
| | | | | 18,534 |
| | | | |
|
Road & Rail 1.2% | | | | |
CNF, Inc. | | 35 | | 1,754 |
Norfolk Southern Corp. | | 455 | | 16,466 |
| | | | |
|
| | | | | 18,220 |
| | | | |
|
Information Technology 23.1% | | | | |
Communications Equipment 3.8% | | | | |
Cisco Systems, Inc.* | | 120 | | 2,316 |
Harris Corp. | | 100 | | 6,179 |
Lucent Technologies, Inc.* | | 4,005 | | 15,059 |
Motorola, Inc. | | 1,175 | | 20,210 |
Tellabs, Inc.* | | 1,795 | | 15,419 |
| | | | |
|
| | | | | 59,183 |
| | | | |
|
Computers & Peripherals 4.5% | | | | |
Apple Computer, Inc.* | | 280 | | 18,032 |
Dell, Inc.* | | 325 | | 13,695 |
Hewlett-Packard Co. | | 840 | | 17,615 |
International Business Machines Corp. | | 55 | | 5,422 |
NCR Corp.* | | 220 | | 15,231 |
| | | | |
|
| | | | | 69,995 |
| | | | |
|
Electronic Equipment & Instruments 0.4% | | | | |
Tech Data Corp.* | | 135 | | 6,129 |
| | | | |
|
IT Consulting & Services 3.4% | | | | |
Affiliated Computer Services, Inc. “A”* | | 255 | | 15,348 |
Page 159 of 466
| | | | |
CheckFree Corp.* | | 375 | | 14,280 |
Computer Sciences Corp.* | | 100 | | 5,637 |
Electronic Data Systems Corp. | | 295 | | 6,815 |
Sabre Holdings Corp. | | 455 | | 10,083 |
| | | | |
|
| | | | | 52,163 |
| | | | |
|
Office Electronics 1.1% | | | | |
Xerox Corp.* | | 1,040 | | 17,690 |
| | | | |
|
Semiconductors & Semiconductor Equipment 1.7% | | | | |
Cree, Inc.* | | 355 | | 14,228 |
Intel Corp. | | 215 | | 5,029 |
Microchip Technology, Inc. | | 275 | | 7,332 |
| | | | |
|
| | | | | 26,589 |
| | | | |
|
| | |
| | | Shares
| | Value ($)
|
Software 8.2% | | | | |
Adobe Systems, Inc. | | 255 | | 15,999 |
Autodesk, Inc. | | 420 | | 15,939 |
BMC Software, Inc.* | | 550 | | 10,230 |
McAfee, Inc.* | | 475 | | 13,742 |
Microsoft Corp. | | 640 | | 17,094 |
Oracle Corp.* | | 1,580 | | 21,677 |
Symantec Corp.* | | 690 | | 17,774 |
TIBCO Software, Inc.* | | 1,185 | | 15,808 |
| | | | |
|
| | | | | 128,263 |
| | | | |
|
Materials 7.4% | | | | |
Chemicals 2.0% | | | | |
Eastman Chemical Co. | | 280 | | 16,164 |
Lyondell Chemical Co. | | 540 | | 15,617 |
| | | | |
|
| | | | | 31,781 |
| | | | |
|
Containers & Packaging 0.7% | | | | |
Ball Corp. | | 270 | | 11,875 |
| | | | |
|
Metals & Mining 3.1% | | | | |
Nucor Corp. | | 315 | | 16,487 |
Phelps Dodge Corp. | | 155 | | 15,332 |
United States Steel Corp. | | 300 | | 16,144 |
| | | | |
|
| | | | | 47,963 |
| | | | |
|
Paper & Forest Products 1.6% | | | | |
Georgia-Pacific Corp. | | 420 | | 15,742 |
MeadWestvaco Corp. | | 255 | | 8,642 |
| | | | |
|
| | | | | 24,384 |
| | | | |
|
Utilities 3.1% | | | | |
Electric Utilities 2.3% | | | | |
Edison International | | 455 | | 14,574 |
Northeast Utilities | | 255 | | 4,807 |
TXU Corp. | | 240 | | 15,494 |
| | | | |
|
| | | | | 34,875 |
| | | | |
|
Page 160 of 466
| | | | |
Multi-Utilities 0.7% | | | | |
Dynegy, Inc. “A”* | | 2,405 | | 11,112 |
| | | | |
|
Multi-Utilities & Unregulated Power 0.1% | | | | |
Reliant Energy, Inc.* | | 135 | | 1,843 |
| | | | |
|
Total Common Stocks (Cost $1,455,979) | | | | 1,499,753 |
| | | | |
|
| | |
Cash Equivalents 0.6% | | | | |
Scudder Cash Management QP Trust, 2.24% (b) (Cost $8,787) | | 8,787 | | 8,787 |
| | | | |
|
| | |
| | | % of Net Assets
| | Value ($)
|
Total Investment Portfolio (Cost $1,464,766) (a) | | 96.7 | | 1,508,540 |
| | | | |
|
Other Assets and Liabilities | | 3.3 | | 51,678 |
| | | | |
|
Net Assets | | 100.0 | | 1,560,218 |
| | | | |
|
Notes to Scudder Mercury Large Cap Core Portfolio of Investments
| * | Non-income producing security. |
| (a) | The cost for federal income tax purposes was $1,465,343. At December 31, 2004, net realized appreciation for all securities based on tax cost was $43,197. This consisted of aggregate gross unrealized appreciation for all securities in which there was an excess of value over tax cost of $58,142 and aggregate gross unrealized depreciation for all securities in which there was an excess of tax cost over value of $14,945. |
| (b) | Scudder Cash Management QP Trust is managed by Deutsche Investment Management Americas Inc. The rate shown is the annualized seven-day yield at period end. |
The accompanying notes are an integral part of the financial statements.
Financial Statements
Statement of Assets and Liabilities
as of December 31, 2004
| | | |
Assets | | | |
Investments: | | | |
Investments in securities, at value (cost $1,455,979) | | $ | 1,499,753 |
Investment in Scudder Cash Management QP Trust (cost $8,787) | | | 8,787 |
| | |
|
|
Total investments in securities, at value (cost $1,464,766) | | | 1,508,540 |
| | |
|
|
Cash | | | 10,000 |
Receivable for investments sold | | | 18,490 |
Dividends receivable | | | 1,899 |
Interest receivable | | | 145 |
Receivable for Portfolio shares sold | | | 57,632 |
Due from Advisor | | | 26,619 |
| | |
|
|
Total assets | | | 1,623,325 |
| | |
|
|
Liabilities | | | |
Payable for investments purchased | | | 35,321 |
Payable for Portfolio shares redeemed | | | 158 |
Other accrued expenses and payables | | | 27,628 |
| | |
|
|
Page 161 of 466
| | | |
Total liabilities | | | 63,107 |
| | |
|
|
Net assets, at value | | $ | 1,560,218 |
| | |
|
|
Net Assets | | | |
Net assets consist of: | | | |
Undistributed net investment income | | $ | 2,481 |
Net unrealized appreciation (depreciation) on investments | | | 43,774 |
Accumulated net realized gain (loss) | | | 6,729 |
Paid-in capital | | | 1,507,234 |
| | |
|
|
Net assets, at value | | $ | 1,560,218 |
| | |
|
|
| |
Class A | | | |
Net Asset Value, offering and redemption price per share ($519,469 ÷ 50,000 outstanding shares of beneficial interest, $.01 par value, unlimited number of shares authorized) | | $ | 10.39 |
| | |
|
|
| |
Class B | | | |
Net Asset Value, offering and redemption price per share ($1,040,749 ÷ 100,195 outstanding shares of beneficial interest, $.01 par value, unlimited number of shares authorized) | | $ | 10.39 |
| | |
|
|
Statement of Operations
for the period ended December 31, 2004
| | | | |
Investment Income | | | | |
Income: | | | | |
Dividends | | $ | 2,722 | |
Interest — Scudder Cash Management QP Trust | | | 255 | |
| | |
|
|
|
Total Income | | | 2,977 | |
| | |
|
|
|
Expenses: | | | | |
Management fee | | | 1,398 | |
Custodian and accounting fees | | | 5,952 | |
Distribution service fees (Class B) | | | 229 | |
Record keeping fees (Class B) | | | 137 | |
Auditing | | | 24,011 | |
Trustees’ fees and expenses | | | 138 | |
Legal | | | 322 | |
Reports to shareholders | | | 1,012 | |
Offering cost | | | 1,242 | |
Other | | | 360 | |
| | |
|
|
|
Total expenses, before expense reductions | | | 34,801 | |
| | |
|
|
|
Expense reductions | | | (33,063 | ) |
| | |
|
|
|
Total expenses, after expense reductions | | | 1,738 | |
| | |
|
|
|
Net investment income (loss) | | | 1,239 | |
| | |
|
|
|
Realized and Unrealized Gain (Loss) on Investment Transactions | | | | |
Net realized gain (loss) from investments | | | 6,729 | |
Net unrealized appreciation (depreciation) during the period on investments | | | 43,774 | |
| | |
|
|
|
Net gain (loss) on investment transactions | | | 50,503 | |
| | |
|
|
|
Net increase (decrease) in net assets resulting from operations | | $ | 51,742 | |
| | |
|
|
|
The accompanying notes are an integral part of the financial statements.
Page 162 of 466
Statement of Changes in Net Assets
| | | | |
Increase (Decrease) in Net Assets
| | Period Ended
December 31, 2004a
| |
Operations: | | | | |
Net investment income (loss) | | $ | 1,239 | |
Net realized gain (loss) on investment transactions | | | 6,729 | |
Net unrealized appreciation (depreciation) on investment transactions during the period | | | 43,774 | |
Net increase (decrease) in net assets resulting from operations | | | 51,742 | |
Portfolio share transactions: | | | | |
Class A | | | | |
Proceeds from shares sold | | | 499,964 | |
Net increase (decrease) in net assets from Class A share transactions | | | 499,964 | |
Class B | | | | |
Proceeds from shares sold | | | 1,008,929 | |
Cost of shares redeemed | | | (417 | ) |
Net increase (decrease) in net assets from Class B share transactions | | | 1,008,512 | |
Increase (decrease) in net assets | | | 1,508,476 | |
Net assets at beginning of period | | | — | |
| | |
|
|
|
Net assets at end of period (including undistributed net investment income of 2,481) | | $ | 1,560,218 | |
| | |
|
|
|
Other Information | | | | |
| |
Class A | | | | |
Shares outstanding at beginning of period | | | — | |
Shares sold | | | 50,000 | |
Net increase (decrease) in Portfolio shares | | | 50,000 | |
| | |
|
|
|
Shares outstanding at end of period | | | 50,000 | |
| | |
|
|
|
| |
Class B | | | | |
Shares outstanding at beginning of period | | | — | |
Shares sold | | | 100,236 | |
Shares redeemed | | | (41 | ) |
Net increase (decrease) in Portfolio shares | | | 100,195 | |
| | |
|
|
|
Shares outstanding at end of period | | | 100,195 | |
| | |
|
|
|
| a | For the period from November 15, 2004 (commencement of operations) to December 31, 2004. |
The accompanying notes are an integral part of the financial statements.
Page 163 of 466
Financial Highlights
Class A
| | | | |
| | | 2004a
| |
Selected Per Share Data | | | | |
Net asset value, beginning of period | | $ | 10.00 | |
| | |
|
|
|
Income (loss) from investment operations: | | | | |
Net investment income (loss)b | | | .01 | |
Net realized and unrealized gain (loss) on investment transactions | | | .38 | |
| | |
|
|
|
Total from investment operations | | | .39 | |
| | |
|
|
|
Net asset value, end of period | | $ | 10.39 | |
| | |
|
|
|
Total Return (%)c | | | 3.90 | ** |
| | |
|
|
|
Ratios to Average Net Assets and Supplemental Data | | | | |
Net assets, end of period ($ millions) | | | 1 | |
Ratio of expenses before expense reductions (%) | | | 22.15 | * |
Ratio of expenses after expense reductions (%) | | | 1.12 | * |
Ratio of net investment income (loss) (%) | | | .79 | * |
Portfolio turnover rate (%) | | | 104 | * |
| a | For the period from November 15, 2004 (commencement of operations) to December 31, 2004. |
| b | Based on average shares outstanding during the period. |
| c | Total returns would have been lower had certain expenses not been reduced. |
Class B
| | | | |
| | | 2004a
| |
Selected Per Share Data | | | | |
Net asset value, beginning of period | | $ | 10.00 | |
| | |
|
|
|
Income (loss) from investment operations: | | | | |
Net investment income (loss)b | | | .01 | |
Net realized and unrealized gain (loss) on investment transactions | | | .38 | |
| | |
|
|
|
Total from investment operations | | | .39 | |
| | |
|
|
|
Net asset value, end of period | | $ | 10.39 | |
| | |
|
|
|
Total Return (%)c | | | 3.90 | ** |
| | |
|
|
|
Ratios to Average Net Assets and Supplemental Data | | | | |
Net assets, end of period ($ millions) | | | 1 | |
Ratio of expenses before expense reductions (%) | | | 22.55 | * |
Ratio of expenses after expense reductions (%) | | | 1.11 | * |
Ratio of net investment income (loss) (%) | | | .80 | * |
Portfolio turnover rate (%) | | | 104 | * |
| a | For the period from November 15, 2004 (commencement of operations) to December 31, 2004. |
Page 164 of 466
| b | Based on average shares outstanding during the period. |
| c | Total returns would have been lower had certain expenses not been reduced. |
Performance Summary December 31, 2004
Scudder Money Market Portfolio
Performance is historical, assumes reinvestment of all dividends and capital gains, and does not guarantee future results. Current performance may be higher or lower than the performance quoted. Please visit scudder.com for the product’s most recent month-end performance. Performance doesn’t reflect charges and fees (“contract charges”) associated with the separate account that invests in the Portfolio or any variable life insurance policy or variable annuity contract for which the Portfolio is an investment option. These charges and fees will reduce returns. The yield quotation more closely reflects the current earnings of the Portfolio than the total return quotation.
| | | | | | |
| Portfolio’s Class A Shares Yield | | | | | | |
| | | 7-day
current yield
| | | 7-day
compounded
effective yield
| |
December 31, 2004 | | 1.62 | % | | 1.63 | % |
December 31, 2003 | | .76 | % | | .77 | % |
| | | | | | |
| Portfolio’s Class B Shares Yield | | | | | | |
| | | 7-day
current yield
| | | 7-day
compounded
effective yield
| |
December 31, 2004 | | 1.24 | % | | 1.25 | % |
December 31, 2003 | | .35 | % | | .35 | % |
Yields are historical, will fluctuate and do not guarantee future performance. The 7-day current yield refers to the income paid by the portfolio over a 7-day period expressed as an annual percentage rate of the fund’s shares outstanding. The 7-day compounded effective yield is the annualized yield based on the most recent 7 days of interest earnings with all income reinvested.
Information About Your Portfolio’s Expenses
Scudder Money Market Portfolio
As an investor of the Portfolio, you incur two types of costs: ongoing expenses and transaction costs. Ongoing expenses include management fees, distribution and service (12b-1) fees and
Page 165 of 466
other Portfolio expenses. Examples of transaction costs include sales charges (loads), redemption fees and account maintenance fees, which are not shown in this section. The following tables are intended to help you understand your ongoing expenses (in dollars) of investing in the Portfolio and to help you compare these expenses with the ongoing expenses of investing in other mutual funds. The tables are based on an investment of $1,000 made at the beginning of the six-month period ended December 31, 2004.
The tables illustrate your Portfolio’s expenses in two ways:
Actual Portfolio Return. This helps you estimate the actual dollar amount of ongoing expenses (but not transaction costs) paid on a $1,000 investment in the Portfolio using the Portfolio’s actual return during the period. To estimate the expenses you paid over the period, simply divide your account value by $1,000 (for example, an $8,600 account value divided by $1,000 = 8.6), then multiply the result by the number in the “Expenses Paid per $1,000” line under the share class you hold.
Hypothetical 5% Portfolio Return. This helps you to compare your Portfolio’s ongoing expenses (but not transaction costs) with those of other mutual funds using the Portfolio’s actual expense ratio and a hypothetical rate of return of 5% per year before expenses. Examples using a 5% hypothetical Portfolio return may be found in the shareholder reports of other mutual funds. The hypothetical account values and expenses may not be used to estimate the actual ending account balance or expenses you paid for the period.
Please note that the expenses shown in these table is meant to highlight your ongoing expenses only and do not reflect any transaction costs. The “Expenses Paid per $1,000” line of the tables is useful in comparing ongoing expenses only and will not help you determine the relative total expense of owning different funds. If these transaction costs had been included, your costs would have been higher.
Expenses and Value of a $1,000 Investment for the six months ended December 31, 2004
| | | | | | |
Actual Portfolio Return
| | Class A
| | Class B
|
Beginning Account Value 7/1/04 | | $ | 1,000.00 | | $ | 1,000.00 |
Ending Account Value 12/31/04 | | $ | 1,005.70 | | $ | 1,003.80 |
Expenses Paid per $1,000* | | $ | 2.85 | | $ | 4.73 |
| | |
Hypothetical 5% Portfolio Return
| | Class A
| | Class B
|
Beginning Account Value 7/1/04 | | $ | 1,000.00 | | $ | 1,000.00 |
Ending Account Value 12/31/04 | | $ | 1,022.37 | | $ | 1,020.48 |
Expenses Paid per $1,000* | | $ | 2.87 | | $ | 4.77 |
| * | Expenses are equal to the Portfolio’s annualized expense ratio for each share class, multiplied by the average account value over the period, multiplied by the number of days in the most recent six-month period, then divided by 365. |
| | | | | | |
Annualized Expense Ratios
| | Class A
| | | Class B
| |
Scudder Variable Series II — Scudder Money Market Portfolio | | .56 | % | | .94 | % |
For more information, please refer to the Portfolio’s prospectus.
Page 166 of 466
Management Summary December 31, 2004
Scudder Money Market Portfolio
As economic recovery gained some momentum during the first quarter of 2004, the market turned its attention to the persistent lack of job creation, and the one-year LIBOR declined from 1.60% at the start of the year to 1.35% by the end of March. In early April, however, fixed income markets experienced a dramatic turnaround as the government reported that the economy had created more than 300,000 new jobs. In reaction, the Fed enacted its “measured pace” policy of gradually raising short-term interest rates at its five Federal Open Market Committee meetings from June through December 2004. In the second half of the year, the economy showed resiliency in the face of sharply rising oil prices, proving to many that the recovery had gained a firm foothold. In light of this renewed confidence — and continued job growth — at the close of the year LIBOR rose to 3.10%, its highest level since March 2002.
During the 12-month period ended December 31, 2004, the portfolio provided a total return of 0.91% (Class A shares, unadjusted for contract charges) compared with the 0.85% average return for funds in the Lipper Variable Money Market Funds category for the same period, according to Lipper Inc. Please see the following page for standardized performance as of December 31, 2004.
In the second quarter, one-year money market rates rose sharply in response to concerns that the Fed would raise short-term interest rates aggressively over the next 12 to 24 months. Our strategy was to substantially decrease the portfolio’s average maturity to reduce risk, limiting our purchases to three-month maturity issues and shorter. During this period, we also increased the fund’s allocation in floating-rate securities. Our decision to increase our allocation in this sector helped performance during the period. Going forward, we will continue our insistence on the highest credit quality within the portfolio and maintain our conservative investment strategies and standards.
A group of investment professionals is responsible for the day-to-day management of the portfolio. These investment professionals have a broad range of experience managing money market funds.
Deutsche Investment Management Americas Inc.
Performance is historical, assumes reinvestment of all dividends, and does not guarantee future results. Current performance may be higher or lower than the performance quoted. Please visit scudder.com for the product’s most recent month-end performance. Performance doesn’t reflect charges and fees (“contract charges”) associated with the separate account that invests in the portfolio or any variable life insurance policy or variable annuity contract for which the portfolio is an investment option. These charges and fees will reduce returns. The yield quotation more closely reflects the current earnings of the fund than the total return quotation.
Risk Considerations
An investment in this portfolio is not insured or guaranteed by the Federal Deposit Insurance Corporation or by any other government agency. Although the portfolio seeks to preserve the value of your investment at $1.00 per share, it is possible to lose money by investing in the portfolio. Please read this portfolio’s prospectus for specific details regarding its investment and risk profile.
LIBOR, the London Interbank Offered Rate, is the most widely used benchmark or reference rate for short-term interest rates. LIBOR is the rate of interest at which banks borrow funds from other banks, in large volume, in the international market.
The Lipper Variable Money Market Funds category includes funds that invest in high-quality financial instruments rated in the top two grades with dollar-weighted average maturities of less than 90 days and that intend to keep a constant net asset value. It is not possible to invest directly in a Lipper category.
Portfolio management market commentary is as of December 31, 2004, and may not come to pass. This information is subject to change at any time based on market and other conditions.
Page 167 of 466
Portfolio Summary
Scudder Money Market Portfolio
| | | | | | |
Asset Allocation
| | 12/31/04
| | | 12/31/03
| |
Commercial Paper | | 41 | % | | 29 | % |
Floating Rate Notes | | 20 | % | | 37 | % |
Certificates of Deposit and Bank Notes | | 12 | % | | 13 | % |
US Government Sponsored Agencies+ | | 11 | % | | 14 | % |
Repurchase Agreements | | 8 | % | | 5 | % |
Funding Agreement | | 3 | % | | — | |
Promissory Notes | | 3 | % | | — | |
Short-Term Notes | | 2 | % | | 1 | % |
Asset Backed | | — | | | 1 | % |
| | |
|
| |
|
|
| | | 100 | % | | 100 | % |
| | |
|
| |
|
|
| + | Not backed by the full faith and credit of the US Government |
| | | | |
Weighted Average Maturity*
| | | | |
Scudder Variable Series II — Money Market Portfolio | | 30 days | | 59 days |
First Tier Money Fund Average | | 36 days | | 52 days |
| * | The Funds are compared to their respective iMoneyNet category: Category includes only non-government retail funds that are not holding any second tier securities. Portfolio Holdings of First Tier funds include U.S. Treasury, U.S. Other, Repos, Time Deposits, Domestic Bank Obligations, Foreign Bank Obligations, First Tier CP, Floating Rate Notes and Asset backed Commercial Paper. |
Asset allocation is subject to change.
For more complete details about the Portfolios’ holdings, see page 47. A quarterly Fact Sheet is available upon request. Information concerning portfolio holdings of the Portfolio as of month end will be posted to scudder.com on the 15th of the following month.
Following the Portfolio’s fiscal first and third quarter-end, a complete portfolio holdings listing is filed with the SEC on Form N-Q. The form will be available on the SEC’s Web site at www.sec.gov, and it also may be reviewed and copied at the SEC’s Public Reference Room in Washington, D.C. Information on the operation of the SEC’s Public Reference Room may be obtained by calling (800) SEC-0330.
Page 168 of 466
|
| Investment Portfolio December 31, 2004 |
Scudder Money Market Portfolio
| | | | |
| | | Principal
Amount ($)
| | Value ($)
|
Certificates of Deposit and Bank Notes 12.2% | | | | |
HBOS Treasury Services PLC, 2.06%, 1/26/2005 | | 10,000,000 | | 10,000,000 |
Nordea Bank Finland PLC, 2.36%, 2/2/2005 | | 9,000,000 | | 9,000,080 |
Societe Generale: | | | | |
1.185%, 1/4/2005 | | 5,000,000 | | 5,000,000 |
2.32%, 2/2/2005 | | 6,000,000 | | 6,000,000 |
Toronto Dominion Bank, 2.505%, 5/27/2005 | | 6,000,000 | | 6,000,120 |
| | | | |
|
Total Certificates of Deposit and Bank Notes (Cost $36,000,200) | | | | 36,000,200 |
| | | | |
|
Commercial Paper 40.8% | | | | |
British Transco Capital, Inc., 2.31%**, 2/1/2005 | | 3,000,000 | | 2,994,032 |
Cancara Asset Securitization LLC: | | | | |
2.04%**, 1/20/2005 | | 5,000,000 | | 4,994,617 |
2.37%**, 1/24/2005 | | 6,000,000 | | 5,990,915 |
CC (USA), Inc.: | | | | |
2.0%**, 1/7/2005 | | 7,000,000 | | 6,997,667 |
2.05%**, 1/25/2005 | | 9,000,000 | | 8,987,700 |
Charta LLC, 2.34%**, 1/24/2005 | | 12,000,000 | | 11,982,060 |
CIT Group, Inc.: | | | | |
2.0%**, 1/4/2005 | | 2,000,000 | | 1,999,667 |
2.32%**, 1/31/2005 | | 3,000,000 | | 2,994,200 |
2.37%**, 4/4/2005 | | 3,000,000 | | 2,981,710 |
Dorada Finance, Inc.: | | | | |
2.01%**, 1/10/2005 | | 7,000,000 | | 6,996,483 |
2.39%**, 3/8/2005 | | 4,000,000 | | 3,982,473 |
General Electric Capital Corp., 1.88%**, 2/1/2005 | | 4,000,000 | | 3,993,524 |
Giro Funding US Corp.: | | | | |
2.02%**, 1/14/2005 | | 2,000,000 | | 1,998,541 |
2.37%**, 1/28/2005 | | 3,000,000 | | 2,994,668 |
Greyhawk Funding LLC, 2.04%**, 1/19/2005 | | 8,000,000 | | 7,991,840 |
K2 (USA) LLC: | | | | |
1.87%**, 2/18/2005 | | 4,000,000 | | 3,990,027 |
1.9%**, 2/18/2005 | | 6,000,000 | | 5,984,800 |
2.06%**, 1/24/2005 | | 5,000,000 | | 4,993,419 |
Lake Constance Funding LLC, 2.04%**, 1/21/2005 | | 5,000,000 | | 4,994,333 |
Perry Global Funding LLC, Series A, 2.06%**, 1/24/2005 | | 7,000,000 | | 6,990,787 |
Prudential PLC, 2.02%**, 1/7/2005 | | 9,000,000 | | 8,996,970 |
Swedish National Housing Finance Corp., 2.28%**, 1/31/2005 | | 6,000,000 | | 5,988,600 |
| | | | |
|
Total Commercial Paper (Cost $119,819,033) | | | | 119,819,033 |
| | | | |
|
| | |
| | | Principal
Amount ($)
| | Value ($)
|
Floating Rate Notes* 19.7% | | | | |
Credit Suisse First Boston, 2.46%, 9/9/2005 | | 7,000,000 | | 7,001,127 |
Depfa Bank PLC, 1.86%, 9/15/2005 | | 4,000,000 | | 4,000,000 |
HSBC Finance Corp., 2.41%, 8/18/2005 | | 12,000,000 | | 12,009,977 |
International Business Machines Corp., 2.07%, 12/8/2005 | | 3,000,000 | | 2,999,355 |
Merrill Lynch & Co., Inc., 2.708%, 1/14/2005 | | 18,000,000 | | 18,002,186 |
Page 169 of 466
| | | | |
Morgan Stanley: | | | | |
2.33%, 2/18/2005 | | 10,000,000 | | 10,000,000 |
2.35%, 4/19/2005 | | 4,000,000 | | 4,000,000 |
| | | | |
|
Total Floating Rate Notes (Cost $58,012,645) | | | | 58,012,645 |
| | | | |
|
Short-Term Notes 2.4% | | | | |
American General Finance Corp., 7.45%, 1/15/2005 (Cost $7,016,460) | | 7,000,000 | | 7,016,460 |
| | | | |
|
US Government Sponsored Agencies+ 11.1% | | | | |
Federal Home Loan Bank, 1.5%, 3/8/2005 | | 5,000,000 | | 5,000,000 |
Federal Home Loan Mortgage Corp.: | | | | |
1.5%, 2/14/2005 | | 5,000,000 | | 5,000,000 |
2.0%*, 10/7/2005 | | 10,000,000 | | 10,000,000 |
2.165%*, 11/7/2005 | | 5,000,000 | | 5,000,000 |
Federal National Mortgage Association: | | | | |
1.75%, 5/23/2005 | | 3,500,000 | | 3,500,000 |
1.835%**, 2/16/2005 | | 4,000,000 | | 3,990,621 |
| | | | |
|
Total US Government Sponsored Agencies (Cost $32,490,621) | | | | 32,490,621 |
| | | | |
|
Promissory Notes 3.4% | | | | |
Goldman Sachs Group, Inc., 2.463%*, 5/26/2005 (Cost $10,000,000) | | 10,000,000 | | 10,000,000 |
| | | | |
|
Funding Agreement 2.4% | | | | |
New York Life Insurance Co., Series A, 2.0%*, 9/20/2005 (Cost $7,000,000) | | 7,000,000 | | 7,000,000 |
| | | | |
|
| | | | |
| | | Principal
Amount ($)
| | Value ($)
|
Repurchase Agreements 7.9% | | | | |
Citigroup Global Markets, Inc., 2.3%, dated 12/31/2004, to be repurchased at $23,004,408 on 1/3/2005 (b) | | 23,000,000 | | 23,000,000 |
State Street Bank and Trust Co., 1.9%, dated 12/31/2004, to be repurchased at $293,046 on 1/3/2005 (c) | | 293,000 | | 293,000 |
| | | | |
|
Total Repurchase Agreements (Cost $23,293,000) | | | | 23,293,000 |
| | | | |
|
| | | | |
| | | % of Net Assets
| | Value ($)
|
Total Investment Portfolio (Cost $293,631,959) (a) | | 99.9 | | 293,631,959 |
| | | | |
|
Other Assets and Liabilities, Net | | 0.1 | | 354,525 |
| | | | |
|
Net Assets | | 100.0 | | 293,986,484 |
| | | | |
|
Notes to Scudder Money Market Portfolio of Investments
| * | Floating rate notes are securities whose yields vary with a designated market index or market rate, such as the coupon-equivalent of the US Treasury bill rate. These securities are shown at their current rate as of December 31, 2004. |
| ** | Annualized yield at time of purchase; not a coupon rate. |
| + | Not backed by the full faith and credit of the US Government. |
| (a) | Cost for federal income tax purposes was $293,631,959. |
Page 170 of 466
| | | | | | | | |
Principal Amount ($)
| | Security
| | Rate (%)
| | Maturity Date
| | Collateral Value ($)
|
| 20,945,000 | | Fannie Mae | | 6.25 | | 2/1/2011 | | 23,473,725 |
| 450,000 | | Federal Home Loan Bank | | 2.55 | | 2/28/2007 | | 446,748 |
| | | | | | | | |
|
| | | | | | | | | 23,920,473 |
| | | | | | | | |
|
| (c) | Collateralized by a $305,000 Federal National Mortgage Association, 4.50% maturing on 6/1/2018 with a value of $301,950. |
The accompanying notes are an integral part of the financial statements.
Financial Statements
Statement of Assets and Liabilities as of December 31, 2004
| | | | |
Assets | | | | |
Investments: | | | | |
Investments in securities, at amortized cost (cost $270,338,959) | | $ | 270,338,959 | |
Repurchase agreements, at amortized cost (cost $23,293,000) | | | 23,293,000 | |
| | |
|
|
|
Total investments in securities, at amortized cost (cost $293,631,959) | | | 293,631,959 | |
| | |
|
|
|
Cash | | | 136 | |
Receivable for Portfolio shares sold | | | 280,498 | |
Interest receivable | | | 588,785 | |
Other assets | | | 28,655 | |
| | |
|
|
|
Total assets | | | 294,530,033 | |
| | |
|
|
|
Liabilities | | | | |
Payable for Portfolio shares redeemed | | | 118,232 | |
Dividends payable | | | 197,762 | |
Accrued management fee | | | 115,328 | |
Other accrued expenses and payables | | | 112,227 | |
| | |
|
|
|
Total liabilities | | | 543,549 | |
| | |
|
|
|
Net assets, at value | | $ | 293,986,484 | |
| | |
|
|
|
Net Assets | | | | |
Net assets consist of: | | | | |
Accumulated distributions in excess of net investment income | | | (42,078 | ) |
Paid-in capital | | | 294,028,562 | |
| | |
|
|
|
Net assets, at value | | $ | 293,986,484 | |
| | |
|
|
|
Class A | | | | |
Net Asset Value, offering and redemption price per share ($241,274,286 ÷ 241,307,750 outstanding shares of beneficial interest, $.01 par value, unlimited number of shares authorized) | | $ | 1.00 | |
| | |
|
|
|
Class B | | | | |
Net Asset Value, offering and redemption price per share ($52,712,198 ÷ 52,717,331 outstanding shares of beneficial interest, $.01 par value, unlimited number of shares authorized) | | $ | 1.00 | |
| | |
|
|
|
Page 171 of 466
Statement of Operations for the year ended December 31, 2004
| | | | |
Investment Income | | | | |
Income: | | | | |
Interest | | $ | 5,271,765 | |
Expenses: | | | | |
Management fee | | | 1,840,343 | |
Custodian fees | | | 26,325 | |
Distribution service fees (Class B) | | | 157,184 | |
Record keeping fees (Class B) | | | 82,393 | |
Auditing | | | 34,485 | |
Legal | | | 22,588 | |
Trustees’ fee and expenses | | | 6,352 | |
Reports to shareholders | | | 54,350 | |
Other | | | 13,136 | |
| | |
|
|
|
Total expenses, before expense reductions | | | 2,237,156 | |
| | |
|
|
|
Expense reductions | | | (4,380 | ) |
| | |
|
|
|
Total expenses, after expense reductions | | | 2,232,776 | |
| | |
|
|
|
Net investment income | | | 3,038,989 | |
| | |
|
|
|
Net realized gain (loss) from investments | | | 3,830 | |
| | |
|
|
|
Net increase (decrease) in net assets resulting from operations | | $ | 3,042,819 | |
| | |
|
|
|
The accompanying notes are an integral part of the financial statements.
| | | | | | | | |
| Statement of Changes in Net Assets | | | | | | |
| | | Years Ended December 31,
| |
| | | 2004
| | | 2003
| |
| Increase (Decrease) in Net Assets | | | | | | | | |
Operations: | | | | | | | | |
Net investment income | | $ | 3,038,989 | | | $ | 3,494,967 | |
Net realized gain (loss) on investment transactions | | | 3,830 | | | | 41 | |
Net increase (decrease) in net assets resulting from operations | | | 3,042,819 | | | | 3,495,008 | |
Distributions to shareholders from: | | | | | | | | |
Net investment income | | | | | | | | |
Class A | | | (2,746,531 | ) | | | (3,404,574 | ) |
Class B | | | (313,926 | ) | | | (96,426 | ) |
Page 172 of 466
| | | | | | | | |
Portfolio share transactions: | | | | | | | | |
| | |
Class A | | | | | | | | |
Proceeds from shares sold | | | 220,350,001 | | | | 312,219,158 | |
Reinvestment of distributions | | | 2,679,083 | | | | 3,301,598 | |
Cost of shares redeemed | | | (308,224,544 | ) | | | (559,028,884 | ) |
Net increase (decrease) in net assets from Class A share transactions | | | (85,195,460 | ) | | | (243,508,128 | ) |
| | |
Class B | | | | | | | | |
Proceeds from shares sold | | | 69,563,948 | | | | 92,463,564 | |
Reinvestment of distributions | | | 295,489 | | | | 87,495 | |
Cost of shares redeemed | | | (83,569,264 | ) | | | (28,805,563 | ) |
Net increase (decrease) in net assets from Class B share transactions | | | (13,709,827 | ) | | | 63,745,496 | |
Increase (decrease) in net assets | | | (98,922,925 | ) | | | (179,768,624 | ) |
Net assets at beginning of period | | | 392,909,409 | | | | 572,678,033 | |
| | |
|
|
| |
|
|
|
Net assets at end of period (including accumulated distributions in excess of net investment income of $42,078 and $24,440, respectively) | | $ | 293,986,484 | | | $ | 392,909,409 | |
| | |
|
|
| |
|
|
|
Other Information | | | | | | | | |
| | |
Class A | | | | | | | | |
Shares outstanding at beginning of period | | | 326,503,210 | | | | 570,017,689 | |
Shares sold | | | 220,350,001 | | | | 312,219,158 | |
Shares issued to shareholders in reinvestment of distributions | | | 2,679,083 | | | | 3,301,598 | |
Shares redeemed | | | (308,224,544 | ) | | | (559,035,235 | ) |
Net increase (decrease) in Portfolio shares | | | (85,195,460 | ) | | | (243,514,479 | ) |
| | |
|
|
| |
|
|
|
Shares outstanding at end of period | | | 241,307,750 | | | | 326,503,210 | |
| | |
|
|
| |
|
|
|
| | |
Class B | | | | | | | | |
Shares outstanding at beginning of period | | | 66,427,158 | | | | 2,681,662 | |
Shares sold | | | 69,563,948 | | | | 92,463,564 | |
Shares issued to shareholders in reinvestment of distributions | | | 295,489 | | | | 87,495 | |
Shares redeemed | | | (83,569,264 | ) | | | (28,805,563 | ) |
Net increase (decrease) in Portfolio shares | | | (13,709,827 | ) | | | 63,745,496 | |
| | |
|
|
| |
|
|
|
Shares outstanding at end of period | | | 52,717,331 | | | | 66,427,158 | |
| | |
|
|
| |
|
|
|
The accompanying notes are an integral part of the financial statements.
Page 173 of 466
Financial Highlights
Class A
| | | | | | | | | | | | | | | | | | | | |
Years Ended December 31,
| | 2004
| | | 2003
| | | 2002
| | | 2001
| | | 2000
| |
Selected Per Share Data | | | | | | | | | | | | | | | | | | | | |
Net asset value, beginning of period | | $ | 1.000 | | | $ | 1.000 | | | $ | 1.000 | | | $ | 1.000 | | | $ | 1.000 | |
| | |
|
|
| |
|
|
| |
|
|
| |
|
|
| |
|
|
|
Income from investment operations: | | | | | | | | | | | | | | | | | | | | |
Net investment income | | | .009 | | | | .007 | | | | .013 | | | | .037 | | | | .059 | |
| | |
|
|
| |
|
|
| |
|
|
| |
|
|
| |
|
|
|
Total from investment operations | | | .009 | | | | .007 | | | | .013 | | | | .037 | | | | .059 | |
| | |
|
|
| |
|
|
| |
|
|
| |
|
|
| |
|
|
|
Less distributions from: | | | | | | | | | | | | | | | | | | | | |
Net investment income | | | (.009 | ) | | | (.007 | ) | | | (.013 | ) | | | (.037 | ) | | | (.059 | ) |
| | |
|
|
| |
|
|
| |
|
|
| |
|
|
| |
|
|
|
Net asset value, end of period | | $ | 1.000 | | | $ | 1.000 | | | $ | 1.000 | | | $ | 1.000 | | | $ | 1.000 | |
| | |
|
|
| |
|
|
| |
|
|
| |
|
|
| |
|
|
|
Total Return (%) | | | .91 | | | | .72 | | | | 1.35 | | | | 3.75 | | | | 6.10 | |
| | |
|
|
| |
|
|
| |
|
|
| |
|
|
| |
|
|
|
Ratios to Average Net Assets and Supplemental Data | | | | | | | | | | | | | | | | | | | | |
Net assets, end of period ($ millions) | | | 241 | | | | 326 | | | | 570 | | | | 671 | | | | 279 | |
Ratio of expenses (%) | | | .53 | | | | .54 | | | | .54 | | | | .55 | | | | .58 | |
Ratio of net investment income (%) | | | .88 | | | | .73 | | | | 1.35 | | | | 3.39 | | | | 5.94 | |
Class B
| | | | | | | | | | | | |
Years Ended December 31,
| | 2004
| | | 2003
| | | 2002a
| |
Selected Per Share Data | | | | | | | | | | | | |
Net asset value, beginning of period | | $ | 1.000 | | | $ | 1.000 | | | $ | 1.000 | |
| | |
|
|
| |
|
|
| |
|
|
|
Income from investment operations: | | | | | | | | | | | | |
Net investment income | | | .005 | | | | .004 | | | | .007 | |
| | |
|
|
| |
|
|
| |
|
|
|
Total from investment operations | | | .005 | | | | .004 | | | | .007 | |
| | |
|
|
| |
|
|
| |
|
|
|
Less distributions from: | | | | | | | | | | | | |
Net investment income | | | (.005 | ) | | | (.004 | ) | | | (.007 | ) |
| | |
|
|
| |
|
|
| |
|
|
|
Net asset value, end of period | | $ | 1.000 | | | $ | 1.000 | | | $ | 1.000 | |
| | |
|
|
| |
|
|
| |
|
|
|
Total Return (%) | | | .52 | | | | .42 | | | | .67 | ** |
| | |
|
|
| |
|
|
| |
|
|
|
Ratios to Average Net Assets and Supplemental Data | | | | | | | | | | | | |
Net assets, end of period ($ millions) | | | 53 | | | | 66 | | | | 3 | |
Ratio of expenses before expense reductions (%) | | | .91 | | | | .93 | | | | .79 | * |
Ratio of expenses after expense reductions (%) | | | .91 | | | | .92 | | | | .64 | * |
Ratio of net investment income (%) | | | .50 | | | | .35 | | | | 1.11 | * |
| a | For the period from July 1, 2002 (commencement of operations of Class B shares) to December 31, 2002. |
Performance Summary December 31, 2004
Scudder Small Cap Growth Portfolio
All performance shown is historical, assumes reinvestment of all dividends and capital gains, and does not guarantee future results. Investment return and principal value fluctuate with changing market conditions so that, when redeemed, shares may be worth more or less then their original cost. Current performance may be lower or higher than the performance data quoted. Please visit scudder.com for the product’s most recent month-end performance. Performance doesn’t reflect charges and fees (“contract charges”) associated with the separate account that invests in the Portfolio or any variable life insurance policy or variable annuity contract for which the Portfolio is an investment option. These charges and fees will reduce returns.
This Portfolio is subject to stock market risk, meaning stocks in the Portfolio may decline in value for extended periods of time due to the activities and financial prospects of individual companies, or due to general market and economic conditions. Additionally, stocks of small companies involve greater risk than securities of larger, more-established companies, as they often have limited product lines, markets or financial resources and may be subject to more erratic and abrupt market
Page 174 of 466
movements. Finally, derivatives may be more volatile and less liquid than traditional securities and the Portfolio could suffer losses on its derivatives positions. Please read this Portfolio’s prospectus for specific details regarding its investments and risk profile.
| | |
| Growth of an Assumed $10,000 Investment in Scudder Small Cap Growth Portfolio from 12/31/1994 to 12/31/2004 |
|
¨ Scudder Small Cap Growth Portfolio — Class A ¨ Russell 2000 Growth Index |
 | | The Russell 2000 Growth Index is an unmanaged index (with no defined investment objective) of those securities in the Russell 2000 Index with a higher price-to-book ratio and higher forecasted growth values. Index returns assume reinvested dividends and, unlike Portfolio returns, do not reflect any fees or expenses. It is not possible to invest directly into an index. |
Yearly periods ended December 31 | | |
Comparative Results
| | | | | | | | | | | | | | | | | | |
Scudder Small Cap Growth Portfolio
| | | | 1-Year
| | | 3-Year
| | | 5-Year
| | | 10-Year
| |
Class A | | Growth of $10,000 | | $ | 11,102 | | | $ | 9,821 | | | $ | 6,243 | | | $ | 22,226 | |
| | | Average annual total return | | | 11.02 | % | | | -.60 | % | | | -8.99 | % | | | 8.31 | % |
Russell 2000 Growth Index | | Growth of $10,000 | | $ | 11,431 | | | $ | 11,841 | | | $ | 8,338 | | | $ | 19,888 | |
| | | Average annual total return | | | 14.31 | % | | | 5.79 | % | | | -3.57 | % | | | 7.12 | % |
| | | | | |
Scudder Small Cap Growth Portfolio
| | | | | | | | | | 1-Year
| | | Life of Class*
| |
Class B | | Growth of $10,000 | | | | | | | | | | $ | 11,054 | | | $ | 13,291 | |
| | | Average annual total return | | | | | | | | | | | 10.54 | % | | | 12.04 | % |
Russell 2000 Growth Index | | Growth of $10,000 | | | | | | | | | | $ | 11,431 | | | $ | 14,326 | |
| | | Average annual total return | | | | | | | | | | | 14.31 | % | | | 15.47 | % |
The growth of $10,000 is cumulative.
| * | The Portfolio commenced offering Class B shares on July 1, 2002. Index returns begin June 30, 2002. |
Information About Your Portfolio’s Expenses
Scudder Small Cap Growth Portfolio
As an investor of the Portfolio, you incur two types of costs: ongoing expenses and transaction costs. Ongoing expenses include management fees, distribution and service (12b-1) fees and other Portfolio expenses. Examples of transaction costs include sales charges (loads), redemption fees and account maintenance fees, which are not shown in this section. The following tables are intended to help you understand your ongoing expenses (in dollars) of investing in the Portfolio and to help you compare these expenses with the ongoing expenses of investing in other mutual funds. In the most recent six-month period, the Portfolio limited these expenses; had it not done so, expenses would have been higher. The tables are based on an investment of $1,000 made at the beginning of the six-month period ended December 31, 2004.
The tables illustrate your Portfolio’s expenses in two ways:
Actual Portfolio Return. This helps you estimate the actual dollar amount of ongoing expenses (but not transaction costs) paid on a $1,000 investment in the Portfolio using the Portfolio’s actual return during the period. To estimate the expenses you paid over the period, simply divide your account value by
Page 175 of 466
$1,000 (for example, an $8,600 account value divided by $1,000 = 8.6), then multiply the result by the number in the “Expenses Paid per $1,000” line under the share class you hold.
Hypothetical 5% Portfolio Return. This helps you to compare your Portfolio’s ongoing expenses (but not transaction costs) with those of other mutual funds using the Portfolio’s actual expense ratio and a hypothetical rate of return of 5% per year before expenses. Examples using a 5% hypothetical Portfolio return may be found in the shareholder reports of other mutual funds. The hypothetical account values and expenses may not be used to estimate the actual ending account balance or expenses you paid for the period.
Please note that the expenses shown in these tables are meant to highlight your ongoing expenses only and do not reflect any transaction costs. The “Expenses Paid per $1,000” line of the tables is useful in comparing ongoing expenses only and will not help you determine the relative total expense of owning different funds. If these transaction costs had been included, your costs would have been higher.
Expenses and Value of a $1,000 Investment for the six months ended December 31, 2004
| | | | | | |
Actual Portfolio Return
| | Class A
| | Class B
|
Beginning Account Value 7/1/04 | | $ | 1,000.00 | | $ | 1,000.00 |
Ending Account Value 12/31/04 | | $ | 1,046.60 | | $ | 1,044.40 |
Expenses Paid per $1,000* | | $ | 3.73 | | $ | 5.66 |
| | |
Hypothetical 5% Portfolio Return
| | Class A
| | Class B
|
Beginning Account Value 7/1/04 | | $ | 1,000.00 | | $ | 1,000.00 |
Ending Account Value 12/31/04 | | $ | 1,021.56 | | $ | 1,019.67 |
Expenses Paid per $1,000* | | $ | 3.69 | | $ | 5.59 |
| * | Expenses are equal to the Portfolio’s annualized expense ratio for each share class, multiplied by the average account value over the period, multiplied by the number of days in the most recent six-month period, then divided by 365. |
| | | | | | |
Annualized Expense Ratios
| | Class A
| | | Class B
| |
Scudder Variable Series II — Scudder Small Cap Growth Portfolio | | .72 | % | | 1.10 | % |
For more information, please refer to the Portfolio’s prospectus.
Management Summary December 31, 2004
Scudder Small Cap Growth Portfolio
During 2004, the small-cap equity market outperformed the large-cap segment for the second consecutive year. However, the small, low-quality and high-beta companies that dominated market returns in 2003 continued their reversal as the larger-cap, higher-quality, and dividend-paying securities increasingly drew the attention of investors. In this environment, the portfolio produced an 11.02% total return (Class A shares, unadjusted for contract charges) over the 12-month period ended December 31, 2004, though it underperformed the 14.31% return of the Russell 2000 Growth Index. During the period, the market was able to weather a mixed-bag of labor reports, the insurgency in Iraq, a midyear spike in oil prices and the hotly contested presidential election.
Page 176 of 466
Stock selection contributed to performance over the 12-month period. Holdings within information technology and financials were the largest contributors. Stock selection within the consumer discretionary sector detracted from performance during the period. In terms of sector allocation, the portfolio’s overweight in information technology was the biggest driver of positive performance over the period, while an overweight in consumer discretionary was a significant detractor. However, our current view is that industry profit growth in technology is likely to slow, and we have decreased our overall weighting in technology based on this belief.
With underlying economic and market factors supportive of the equity markets, investors should continue to focus on those more profitable small-cap companies that report superior earnings. This should bode well for this segment of the stock market, despite rising interest rates, high energy costs and the weakening dollar. Based on this belief, we have increased or maintained our weighting across most sectors, with the exception of technology.
Samuel A. Dedio
Robert S. Janis
Co-Managers
Deutsche Investment Management Americas Inc.
All performance shown is historical, assumes reinvestment of all dividends and capital gains, and does not guarantee future results. Investment return and principal value fluctuate with changing market conditions so that, when redeemed, shares may be worth more or less then their original cost. Current performance may be lower or higher than the performance data quoted. Please visit scudder.com for the product’s most recent month-end performance. Performance doesn’t reflect charges and fees (“contract charges”) associated with the separate account that invests in the portfolio or any variable life insurance policy or variable annuity contract for which the portfolio is an investment option. These charges and fees will reduce returns.
Risk Considerations
This portfolio is subject to stock market risk, meaning stocks in the portfolio may decline in value for extended periods of time due to the activities and financial prospects of individual companies, or due to general market and economic conditions. Additionally, stocks of small companies involve greater risk than securities of larger, more-established companies, as they often have limited product lines, markets or financial resources and may be subject to more erratic and abrupt market movements. Finally, derivatives may be more volatile and less liquid than traditional securities and the portfolio could suffer losses on its derivatives positions. Please read this portfolio’s prospectus for specific details regarding its investments and risk profile.
The Russell 2000 Growth Index is an unmanaged index (with no defined investment objective) of those securities in the Russell 2000 Index with a higher price-to- book ratio and higher forecasted growth values. Index returns assume reinvested dividends and, unlike Portfolio returns, do not reflect any fees or expenses. It is not possible to invest directly into an index.
Portfolio management market commentary is as of December 31, 2004, and may not come to pass. This information is subject to change at any time based on market and other conditions.
Portfolio Summary
Scudder Small Cap Growth Portfolio
| | | | | | |
Asset Allocation (Excludes Security Lending Collateral)
| | 12/31/04
| | | 12/31/03
| |
Common Stocks | | 97 | % | | 97 | % |
Cash Equivalents | | 3 | % | | 3 | % |
| | |
|
| |
|
|
| | | 100 | % | | 100 | % |
| | |
|
| |
|
|
Page 177 of 466
| | | | | | |
Sector Diversification (Excludes Cash Equivalents and Security Lending Collateral)
| | 12/31/04
| | | 12/31/03
| |
Information Technology | | 29 | % | | 37 | % |
Health Care | | 24 | % | | 18 | % |
Consumer Discretionary | | 22 | % | | 16 | % |
Industrials | | 8 | % | | 9 | % |
Financials | | 8 | % | | 9 | % |
Consumer Staples | | 5 | % | | 5 | % |
Energy | | 3 | % | | 4 | % |
Materials | | 1 | % | | 2 | % |
| | |
|
| |
|
|
| | | 100 | % | | 100 | % |
| | |
|
| |
|
|
Asset allocation and sector diversification are subject to change.
For more complete details about the Portfolio’s investment portfolio, see page 7. A quarterly Fact Sheet is available upon request. Information concerning portfolio holdings of the Portfolio as of month end will be posted to scudder.com on the 15th of the following month.
Following the Portfolio’s fiscal first and third quarter-end, a complete portfolio holdings listing is filed with the SEC on Form N-Q. The form will be available on the SEC’s Web site at www.sec.gov, and it also may be reviewed and copied at the SEC’s Public Reference Room in Washington, D.C. Information on the operation of the SEC’s Public Reference Room may be obtained by calling (800) SEC-0330.
Investment Portfolio December 31, 2004
Scudder Small Cap Growth Portfolio
| | | | |
| | | Shares
| | Value ($)
|
Common Stocks 98.0% | | | | |
Consumer Discretionary 21.2% | | | | |
Hotels Restaurants & Leisure 8.9% | | | | |
Buffalo Wild Wings, Inc.* | | 80,900 | | 2,816,129 |
LIFE TIME FITNESS, Inc.* | | 121,400 | | 3,141,832 |
P.F. Chang’s China Bistro, Inc.* | | 89,500 | | 5,043,325 |
RARE Hospitality International, Inc.* | | 168,500 | | 5,368,410 |
Shuffle Master, Inc.* (d) | | 103,400 | | 4,870,140 |
| | | | |
|
| | | | | 21,239,836 |
| | | | |
|
Internet & Catalog Retail 1.2% | | | | |
Sharper Image Corp.* | | 143,700 | | 2,708,745 |
| | | | |
|
Media 2.2% | | | | |
Journal Register Co.* | | 143,800 | | 2,779,654 |
Lions Gate Entertainment Corp.* (d) | | 225,400 | | 2,393,748 |
| | | | |
|
| | | | | 5,173,402 |
| | | | |
|
Page 178 of 466
| | | | |
Specialty Retail 6.6% | | | | |
Aeropostale, Inc.* | | 178,900 | | 5,265,027 |
Hot Topic, Inc.* (d) | | 267,700 | | 4,601,763 |
Kenneth Cole Productions, Inc. “A” (d) | | 128,500 | | 3,965,510 |
New York & Co., Inc.* | | 117,900 | | 1,947,708 |
| | | | |
|
| | | | | 15,780,008 |
| | | | |
|
Textiles, Apparel & Luxury Goods 2.3% | | | | |
Gildan Activewear, Inc. “A” | | 90,900 | | 3,089,691 |
The Warnaco Group, Inc.* | | 114,300 | | 2,468,880 |
| | | | |
|
| | | | | 5,558,571 |
| | | | |
|
Consumer Staples 4.7% | | | | |
Food & Staples Retailing 2.4% | | | | |
United Natural Foods, Inc.* | | 185,200 | | 5,759,720 |
| | | | |
|
Household Products 2.3% | | | | |
Jarden Corp.* | | 123,300 | | 5,356,152 |
| | | | |
|
Energy 2.8% | | | | |
Oil & Gas | | | | |
Bill Barrett Corp.* | | 76,300 | | 2,440,837 |
Southwestern Energy Co.* | | 85,100 | | 4,313,719 |
| | | | |
|
| | | | | 6,754,556 |
| | | | |
|
Financials 7.8% | | | | |
Capital Markets 3.7% | | | | |
Jefferies Group, Inc. | | 88,300 | | 3,556,724 |
Piper Jaffray Companies, Inc.* | | 111,400 | | 5,341,630 |
| | | | |
|
| | | | | 8,898,354 |
| | | | |
|
Diversified Financial Services 2.7% | | | | |
Affiliated Managers Group, Inc.* (d) | | 95,050 | | 6,438,687 |
| | | | |
|
Insurance 1.4% | | | | |
KMG America Corp.* | | 289,400 | | 3,183,400 |
| | | | |
|
Health Care 23.7% | | | | |
Health Care Equipment & Supplies 6.5% | | | | |
Advanced Medical Optics, Inc.* (d) | | 115,600 | | 4,755,784 |
American Medical Systems Holdings, Inc.* | | 62,700 | | 2,621,487 |
ArthroCare Corp.* (d) | | 113,800 | | 3,648,428 |
| | |
| | | Shares
| | Value ($)
|
Wright Medical Group, Inc.* | | 152,300 | | 4,340,550 |
| | | | |
|
| | | | | 15,366,249 |
| | | | |
|
Health Care Providers & Services 14.0% | | | | |
American Healthways, Inc.* (d) | | 123,100 | | 4,067,224 |
AMERIGROUP Corp.* | | 93,300 | | 7,059,078 |
Beverly Enterprises, Inc.* | | 577,000 | | 5,279,550 |
Centene Corp.* | | 305,800 | | 8,669,430 |
United Surgical Partners International, Inc.* | | 120,400 | | 5,020,680 |
WellCare Health Plans, Inc.* | | 104,100 | | 3,383,250 |
| | | | |
|
| | | | | 33,479,212 |
| | | | |
|
Page 179 of 466
| | | | |
Pharmaceuticals 3.2% | | | | |
Able Laboratories, Inc.* | | 108,500 | | 2,468,375 |
Connetics Corp.* | | 212,500 | | 5,161,625 |
| | | | |
|
| | | | | 7,630,000 |
| | | | |
|
Industrials 8.5% | | | | |
Commercial Services & Supplies 1.3% | | | | |
CoStar Group, Inc.* | | 64,250 | | 2,967,065 |
| | | | |
|
Machinery 2.8% | | | | |
Joy Global, Inc. | | 90,000 | | 3,908,700 |
Watts Water Technologies, Inc. “A” | | 83,200 | | 2,682,368 |
| | | | |
|
| | | | | 6,591,068 |
| | | | |
|
Road & Rail 2.0% | | | | |
Heartland Express, Inc. | | 213,950 | | 4,807,457 |
| | | | |
|
Transportation Infrastructure 2.4% | | | | |
Overnite Corp. | | 156,000 | | 5,809,440 |
| | | | |
|
Information Technology 28.3% | | | | |
Communications Equipment 5.8% | | | | |
Avocent Corp.* | | 117,500 | | 4,761,100 |
CommScope, Inc.* (d) | | 186,600 | | 3,526,740 |
Foundry Networks, Inc.* | | 417,200 | | 5,490,352 |
| | | | |
|
| | | | | 13,778,192 |
| | | | |
|
Internet Software & Services 4.8% | | | | |
Audible, Inc.* | | 124,800 | | 3,251,040 |
Openwave Systems, Inc.* (d) | | 256,800 | | 3,970,128 |
Websense, Inc.* | | 85,400 | | 4,331,488 |
| | | | |
|
| | | | | 11,552,656 |
| | | | |
|
IT Consulting & Services 1.4% | | | | |
CSG Systems International, Inc.* | | 175,600 | | 3,283,720 |
| | | | |
|
Semiconductors & Semiconductor Equipment 8.4% | | | | |
AMIS Holdings, Inc.* | | 141,000 | | 2,329,320 |
Emulex Corp.* | | 271,200 | | 4,567,008 |
FormFactor, Inc.* | | 138,100 | | 3,748,034 |
Power Integrations, Inc.* | | 252,500 | | 4,994,450 |
Tessera Technologies, Inc.* | | 116,800 | | 4,346,128 |
| | | | |
|
| | | | | 19,984,940 |
| | | | |
|
Software 7.9% | | | | |
Hyperion Solutions Corp.* | | 130,300 | | 6,074,586 |
Kronos, Inc.* | | 84,500 | | 4,320,485 |
Macromedia, Inc.* | | 135,800 | | 4,226,096 |
THQ, Inc.* | | 190,000 | | 4,358,600 |
| | | | |
|
| | | | | 18,979,767 |
| | | | |
|
| | |
| | | Shares
| | Value ($)
|
Materials 1.0% | | | | |
Metals & Mining | | | | |
Foundation Coal Holdings, Inc.* (d) | | 106,000 | | 2,444,360 |
| | | | |
|
Total Common Stocks (Cost $187,273,102) | | | | 233,525,557 |
| | | | |
|
Page 180 of 466
| | | | | | |
Preferred Stocks 0.0% | | | | | | |
Convergent Networks, Inc. “D”* (c) | | 113,149 | | | 6,789 | |
fusionOne “D”* (c) | | 230,203 | | | 14,963 | |
Planetweb, Inc. “E”* (c) | | 137,868 | | | 0 | |
| | | | | |
|
|
Total Preferred Stocks (Cost $2,000,004) | | | | | 21,752 | |
| | | | | |
|
|
| | |
| | | Shares
| | | Value ($)
| |
Securities Lending Collateral 14.6% | | | | | | |
Daily Assets Fund Institutional, 2.25% (e) (f) (cost $34,889,150) | | 34,889,150 | | | 34,889,150 | |
| | | | | |
|
|
Cash Equivalents 2.6% | | | | | | |
Scudder Cash Management QP Trust, 2.24% (b) (Cost $6,200,320) | | 6,200,320 | | | 6,200,320 | |
| | | | | |
|
|
| | |
| | | % of Net Assets
| | | Value ($)
| |
Total Investment Portfolio (Cost $230,362,576) (a) | | 115.2 | | | 274,636,779 | |
| | | | | |
|
|
Other Assets and Liabilities, Net | | (15.2 | ) | | (36,230,915 | ) |
| | | | | |
|
|
Net Assets | | 100.0 | | | 238,405,864 | |
| | | | | |
|
|
Notes to Scudder Small Cap Growth Portfolio of Investments
| * | Non-income producing security. |
| (a) | The cost for federal income tax purposes was $230,362,576. At December 31, 2004, net unrealized appreciation for all securities based on tax cost was $44,274,203. This consisted of aggregate gross unrealized appreciation for all securities in which there was an excess of value over tax cost of $48,400,300 and aggregate gross unrealized depreciation for all securities in which there was an excess of tax cost over value of $4,126,097. |
| (b) | Scudder Cash Management QP Trust is managed by Deutsche Investment Management Americas Inc. The rate shown is the annualized seven-day yield at period end. |
| (c) | The Fund may purchase securities that are subject to legal or contractual restrictions on resale (“restricted securities”). Restricted securities are securities which have not been registered with the Securities and Exchange Commission under the Securities Act of 1933. The Fund may be unable to sell a restricted security and it may be more difficult to determine a market value for a restricted security. Moreover, if adverse market conditions were to develop during the period between the Fund’s decision to sell a restricted security and the point at which the Fund is permitted or able to sell such a security, the Fund might obtain a price less favorable than the price that prevailed when it decided to sell. This investment practice, therefore, could have the effect of increasing the level of illiquidity of the Fund. |
Schedule of Restricted Securities
| | | | | | | | |
Securities
| | Acquisition Dates
| | Acquisition Cost ($)
| | Value ($)
| | Value as % of Net Assets
|
Convergent Networks, Inc. “D” | | June 2003 | | — | | 6,789 | | .003 |
fusionOne “D” | | October 2000 | | 1,250,002 | | 14,963 | | .006 |
Planetweb, Inc. “E” | | September 2000 | | 750,002 | | — | | — |
| | | | | | |
| |
|
Total Restricted Securities | | | | | | 21,752 | | .009 |
| | | | | | |
| |
|
| (d) | All or a portion of these securities were on loan (see Notes to Financials Statements). The value of all securities loaned at December 31, 2004 amounted to $33,864,670, which is 14.2% of total net assets. |
| (e) | Daily Assets Fund Institutional, an affiliated fund, is managed by Deutsche Asset Management, Inc. The rate shown is the annualized seven-day yield at period end. |
| (f) | Represents collateral held in connection with securities lending. |
The accompanying notes are an integral part of the financial statements.
Page 181 of 466
Financial Statements
Statement of Assets and Liabilities as of December 31, 2004
| | | | |
Assets | | | | |
Investments: | | | | |
Investments in securities, at value (cost $189,273,106) — including $33,864,670 of securities loaned | | $ | 233,547,309 | |
Investment in Daily Assets Fund Institutional (cost $34,889,150)* | | | 34,889,150 | |
Investment in Scudder Cash Management QP Trust (cost $6,200,320) | | | 6,200,320 | |
| | |
|
|
|
Total investments in securities, at value (cost $230,362,576) | | | 274,636,779 | |
| | |
|
|
|
Cash | | | 10,000 | |
Receivable for investments sold | | | 109,972 | |
Dividends receivable | | | 4,279 | |
Interest receivable | | | 20,229 | |
Receivable for Portfolio shares sold | | | 29,855 | |
Other assets | | | 12,431 | |
| | |
|
|
|
Total assets | | | 274,823,545 | |
| | |
|
|
|
Liabilities | | | | |
Payable for investments purchased | | | 935,660 | |
Payable upon return of securities loaned | | | 34,889,150 | |
Payable for Portfolio shares redeemed | | | 375,462 | |
Accrued management fee | | | 133,718 | |
Other accrued expenses and payables | | | 83,691 | |
| | |
|
|
|
Total liabilities | | | 36,417,681 | |
| | |
|
|
|
Net assets, at value | | $ | 238,405,864 | |
| | |
|
|
|
Net Assets | | | | |
Net assets consist of: | | | | |
Accumulated net investment loss | | | (1,853 | ) |
Net unrealized appreciation (depreciation) on investments | | | 44,274,203 | |
Accumulated net realized gain (loss) | | | (136,503,455 | ) |
Paid-in capital | | | 330,636,969 | |
| | |
|
|
|
Net assets, at value | | $ | 238,405,864 | |
| | |
|
|
|
Class A | | | | |
Net Asset Value, offering and redemption price per share ($210,319,486 ÷ 16,708,714 outstanding shares of beneficial interest, $.01 par value, unlimited number of shares authorized) | | $ | 12.59 | |
| | |
|
|
|
Class B | | | | |
Net Asset Value, offering and redemption price per share ($28,086,378 ÷ 2,250,352 outstanding shares of beneficial interest, $.01 par value, unlimited number of shares authorized) | | $ | 12.48 | |
| | |
|
|
|
| * | Represents collateral on securities loaned. |
Page 182 of 466
Statement of Operations for the year ended December 31, 2004
| | | | |
Investment Income | | | | |
Income: | | | | |
Dividends | | $ | 296,329 | |
Securities lending income, including income from Daily Assets Fund Institutional | | | 105,683 | |
Interest — Scudder Cash Management QP Trust | | | 144,237 | |
| | |
|
|
|
Total Income | | | 546,249 | |
| | |
|
|
|
Expenses: | | | | |
Management fee | | | 1,466,445 | |
Custodian fees | | | 17,450 | |
Distribution service fees (Class B) | | | 55,527 | |
Record keeping fees (Class B) | | | 28,955 | |
Auditing | | | 59,383 | |
Legal | | | 16,820 | |
Reports to shareholders | | | 44,453 | |
Other | | | 3,178 | |
| | |
|
|
|
Total expenses, before expense reductions | | | 1,692,211 | |
| | |
|
|
|
Expense reductions | | | (2,584 | ) |
| | |
|
|
|
Total expenses, after expense reductions | | | 1,689,627 | |
| | |
|
|
|
Net investment income (loss) | | | (1,143,378 | ) |
| | |
|
|
|
Realized and Unrealized Gain (Loss) on Investment Transactions | | | | |
Net realized gain (loss) from investments | | | 9,898,921 | |
Net unrealized appreciation (depreciation) during the period on investments | | | 14,522,914 | |
| | |
|
|
|
Net gain (loss) on investment transactions | | | 24,421,835 | |
| | |
|
|
|
Net increase (decrease) in net assets resulting from operations | | $ | 23,278,457 | |
| | |
|
|
|
The accompanying notes are an integral part of the financial statements.
Statement of Changes in Net Assets
| | | | | | | | |
| | | Years Ended December 31,
| |
Increase (Decrease) in Net Assets
| | 2004
| | | 2003
| |
Operations: | | | | | | | | |
Net investment income (loss) | | $ | (1,143,378 | ) | | $ | (782,215 | ) |
Net realized gain (loss) on investment transactions | | | 9,898,921 | | | | 21,248,380 | |
Net unrealized appreciation (depreciation) on investment transactions during the period | | | 14,522,914 | | | | 31,300,241 | |
Net increase (decrease) in net assets resulting from operations | | | 23,278,457 | | | | 51,766,406 | |
Portfolio share transactions: | | | | | | | | |
| | |
Class A | | | | | | | | |
Proceeds from shares sold | | | 41,819,691 | | | | 46,393,822 | |
Page 183 of 466
| | | | | | | | |
Cost of shares redeemed | | | (62,320,969 | ) | | | (40,809,284 | ) |
Net increase (decrease) in net assets from Class A share transactions | | | (20,501,278 | ) | | | 5,584,538 | |
| | |
Class B | | | | | | | | |
Proceeds from shares sold | | | 11,462,792 | | | | 13,298,753 | |
Cost of shares redeemed | | | (1,207,862 | ) | | | (51,363 | ) |
Net increase (decrease) in net assets from Class B share transactions | | | 10,254,930 | | | | 13,247,390 | |
Increase (decrease) in net assets | | | 13,032,109 | | | | 70,598,334 | |
Net assets at beginning of period | | | 225,373,755 | | | | 154,775,421 | |
| | |
|
|
| |
|
|
|
Net assets at end of period (including accumulated net investment loss of $1,853 and $14,695, respectively) | | $ | 238,405,864 | | | $ | 225,373,755 | |
| | |
|
|
| |
|
|
|
Other Information | | | | | | | | |
| | |
Class A | | | | | | | | |
Shares outstanding at beginning of period | | | 18,522,593 | | | | 18,086,694 | |
Shares sold | | | 3,534,946 | | | | 4,700,650 | |
Shares redeemed | | | (5,348,825 | ) | | | (4,264,751 | ) |
Net increase (decrease) in Portfolio shares | | | (1,813,879 | ) | | | 435,899 | |
| | |
|
|
| |
|
|
|
Shares outstanding at end of period | | | 16,708,714 | | | | 18,522,593 | |
| | |
|
|
| |
|
|
|
| | |
Class B | | | | | | | | |
Shares outstanding at beginning of period | | | 1,358,975 | | | | 52,833 | |
Shares sold | | | 996,848 | | | | 1,310,980 | |
Shares redeemed | | | (105,471 | ) | | | (4,838 | ) |
Net increase (decrease) in Portfolio shares | | | 891,377 | | | | 1,306,142 | |
| | |
|
|
| |
|
|
|
Shares outstanding at end of period | | | 2,250,352 | | | | 1,358,975 | |
| | |
|
|
| |
|
|
|
The accompanying notes are an integral part of the financial statements.
Financial Highlights
Class A
| | | | | | | | | | | | | | | | | | | | |
Years Ended December 31,
| | 2004
| | | 2003
| | | 2002
| | | 2001
| | | 2000a
| |
Selected Per Share Data | | | | | | | | | | | | | | | | | | | | |
Net asset value, beginning of period | | $ | 11.34 | | | $ | 8.53 | | | $ | 12.80 | | | $ | 21.64 | | | $ | 26.54 | |
| | |
|
|
| |
|
|
| |
|
|
| |
|
|
| |
|
|
|
Income (loss) from investment operations: | | | | | | | | | | | | | | | | | | | | |
Net investment income (loss)b | | | (.05 | ) | | | (.04 | ) | | | (.02 | ) | | | (.02 | ) | | | (.09 | ) |
Net realized and unrealized gain (loss) on investment transactions | | | 1.30 | | | | 2.85 | | | | (4.25 | ) | | | (6.27 | ) | | | (2.01 | ) |
Total from investment operations | | | 1.25 | | | | 2.81 | | | | (4.27 | ) | | | (6.29 | ) | | | (2.10 | ) |
Less distributions from: | | | | | | | | | | | | | | | | | | | | |
Net realized gains on investment transactions | | | — | | | | — | | | | — | | | | (2.52 | ) | | | (2.80 | ) |
Return of capital | | | — | | | | — | | | | — | | | | (.03 | ) | | | — | |
| | |
|
|
| |
|
|
| |
|
|
| |
|
|
| |
|
|
|
Page 184 of 466
| | | | | | | | | | | | | | | | | | | | |
Total distributions | | | — | | | | — | | | | — | | | | (2.55 | ) | | | (2.80 | ) |
| | |
|
|
| |
|
|
| |
|
|
| |
|
|
| |
|
|
|
Net asset value, end of period | | $ | 12.59 | | | $ | 11.34 | | | $ | 8.53 | | | $ | 12.80 | | | $ | 21.64 | |
| | |
|
|
| |
|
|
| |
|
|
| |
|
|
| |
|
|
|
Total Return (%) | | | 11.02 | | | | 32.94 | | | | (33.36 | ) | | | (28.91 | ) | | | (10.71 | ) |
Ratios to Average Net Assets and Supplemental Data | | | | | | | | | | | | | | | | | | | | |
Net assets, end of period ($ millions) | | | 210 | | | | 210 | | | | 154 | | | | 232 | | | | 301 | |
Ratio of expenses (%) | | | .71 | | | | .69 | | | | .71 | | | | .68 | | | | .72 | |
Ratio of net investment income (loss) (%) | | | (.47 | ) | | | (.41 | ) | | | (.24 | ) | | | (.12 | ) | | | (.34 | ) |
Portfolio turnover rate (%) | | | 117 | | | | 123 | | | | 68 | | | | 143 | | | | 124 | |
| a | On June 18, 2001, the Portfolio implemented a 1 for 10 reverse stock split. Per share information, for the periods prior to December 31, 2001, has been restated to reflect the effect of the split. Shareholders received 1 share for every 10 shares owned and net asset value per share increased correspondingly. |
| b | Based on average shares outstanding during the period. |
Class B
| | | | | | | | | | | | |
Years Ended December 31,
| | 2004
| | | 2003
| | | 2002a
| |
Selected Per Share Data | | | | | | | | | | | | |
Net asset value, beginning of period | | $ | 11.29 | | | $ | 8.52 | | | $ | 9.39 | |
| | |
|
|
| |
|
|
| |
|
|
|
Income (loss) from investment operations: | | | | | | | | | | | | |
Net investment income (loss)b | | | (.10 | ) | | | (.09 | ) | | | (.02 | ) |
Net realized and unrealized gain (loss) on investment transactions | | | 1.29 | | | | 2.86 | | | | (.85 | ) |
| | |
|
|
| |
|
|
| |
|
|
|
Total from investment operations | | | 1.19 | | | | 2.77 | | | | (.87 | ) |
| | |
|
|
| |
|
|
| |
|
|
|
Net asset value, end of period | | $ | 12.48 | | | $ | 11.29 | | | $ | 8.52 | |
| | |
|
|
| |
|
|
| |
|
|
|
Total Return (%) | | | 10.54 | | | | 32.51 | | | | (9.27 | )** |
| | |
|
|
| |
|
|
| |
|
|
|
Ratios to Average Net Assets and Supplemental Data | | | | | | | | | | | | |
Net assets, end of period ($ millions) | | | 28 | | | | 15 | | | | .5 | |
Ratio of expenses before expense reduction (%) | | | 1.10 | | | | 1.08 | | | | .96 | * |
Ratio of expenses after expense reduction (%) | | | 1.09 | | | | 1.08 | | | | .96 | * |
Ratio of net investment income (loss) (%) | | | (.85 | ) | | | (.80 | ) | | | (.39 | )* |
Portfolio turnover rate (%) | | | 117 | | | | 123 | | | | 68 | |
| a | For the period July 1, 2002 (commencement of operations of Class B shares) to December 31, 2002. |
| b | Based on average shares outstanding during the period. |
Page 185 of 466
Performance Summary December 31, 2004
Scudder Strategic Income Portfolio
All performance shown is historical, assumes reinvestment of all dividends and capital gains, and does not guarantee future results. Investment return and principal value fluctuate with changing market conditions so that, when redeemed, shares may be worth more or less then their original cost. Current performance may be lower or higher than the performance data quoted. Please visit scudder.com for the product’s most recent month-end performance. Performance doesn’t reflect charges and fees (“contract charges”) associated with the separate account that invests in the Portfolio or any variable life insurance policy or variable annuity contract for which the Portfolio is an investment option. These charges and fees will reduce returns.
The Portfolio invests in individual bonds whose yields and market values fluctuate so that your investment may be worth more or less than its original cost. Additionally, investments by the Portfolio in lower-rated bonds present greater risk to principal and income than investments in higher-quality securities. Finally, investing in foreign securities presents certain unique risks not associated with domestic investments, such as currency fluctuation, political and economic changes and market risks. All of these factors may result in greater share price volatility. Please read this Portfolio’s prospectus for specific details regarding its investments and risk profile.
Growth of an Assumed $10,000 Investment in Scudder Strategic Income Portfolio from 5/1/1997 to 12/31/2004
| | |
¨ Scudder Strategic Income Portfolio — Class A ¨ Citigroup World Government Bond Index ¨ JP Morgan Emerging Markets Bond Plus Index ¨ Merrill Lynch High Yield Master Index ¨ Lehman Brothers US Treasury Index 
| | The Citigroup World Government Bond Index (formerly known as Salomon Smith Barney World Government Bond Index) is an unmanaged index comprised of government bonds from 18 developed countries (including the US) with maturities greater than one year. JP Morgan Emerging Markets Bond Plus Index is an unmanaged foreign securities index of US dollar- and other external-currency-denominated Brady bonds, loans, Eurobonds and local market debt instruments traded in emerging markets. The Merrill Lynch High Yield Master Index is an unmanaged index which tracks the performance of below investment grade US dollar- denominated corporate bonds publicly issued in the US domestic market. Lehman Brothers US Treasury Index is an unmanaged index reflecting the performance of all public obligations and does not focus on one particular segment of the Treasury market. Index returns assume reinvested dividends and, unlike Portfolio returns, do not reflect any fees or expenses. It is not possible to invest directly into an index. |
Yearly periods ended December 31
Comparative Results
| | | | | | | | | | | | | | | | | | |
Scudder Strategic Income Portfolio
| | | | 1-Year
| | | 3-Year
| | | 5-Year
| | | Life of Portfolio*
| |
Class A | | Growth of $10,000 | | $ | 10,860 | | | $ | 13,036 | | | $ | 14,070 | | | $ | 15,125 | |
| | | Average annual total return | | | 8.60 | % | | | 9.24 | % | | | 7.07 | % | | | 5.54 | % |
Citigroup World Government Bond Index | | Growth of $10,000 | | $ | 11,035 | | | $ | 15,152 | | | $ | 15,241 | | | $ | 17,746 | |
| | | Average annual total return | | | 10.35 | % | | | 14.86 | % | | | 8.79 | % | | | 7.77 | % |
JP Morgan Emerging Markets Bond Plus Index | | Growth of $10,000 | | $ | 11,177 | | | $ | 16,449 | | | $ | 18,876 | | | $ | 22,183 | |
| | | Average annual total return | | | 11.77 | % | | | 18.05 | % | | | 13.55 | % | | | 10.94 | % |
Merrill Lynch High Yield Master Index | | Growth of $10,000 | | $ | 11,076 | | | $ | 13,931 | | | $ | 14,234 | | | $ | 16,546 | |
| | | Average annual total return | | | 10.76 | % | | | 11.68 | % | | | 7.32 | % | | | 6.79 | % |
Lehman Brothers US Treasury Index | | Growth of $10,000 | | $ | 10,354 | | | $ | 11,834 | | | $ | 14,340 | | | $ | 16,753 | |
| | | Average annual total return | | | 3.54 | % | | | 5.77 | % | | | 7.48 | % | | | 6.96 | % |
The growth of $10,000 is cumulative.
Effective 5/1/2000 the Portfolio changed its investment objective.
| * | The Portfolio commenced operations on May 1, 1997. Index returns begin April 30, 1997. |
Page 186 of 466
| | | | | | | | | | |
Scudder Strategic Income Portfolio
| | | | 1-Year
| | | Life of Class*
| |
Class B | | Growth of $10,000 | | $ | 10,827 | | | $ | 11,149 | |
| | | Average annual total return | | | 8.27 | % | | | 6.73 | % |
Citigroup World Government Bond Index | | Growth of $10,000 | | $ | 11,035 | | | $ | 12,153 | |
| | | Average annual total return | | | 10.35 | % | | | 12.41 | % |
JP Morgan Emerging Markets Bond Plus Index | | Growth of $10,000 | | $ | 11,177 | | | $ | 12,597 | |
| | | Average annual total return | | | 11.77 | % | | | 14.80 | % |
Merrill Lynch High Yield Master Index | | Growth of $10,000 | | $ | 11,076 | | | $ | 12,481 | |
| | | Average annual total return | | | 10.76 | % | | | 14.22 | % |
Lehman Brothers US Treasury Index | | Growth of $10,000 | | $ | 10,354 | | | $ | 10,434 | |
| | | Average annual total return | | | 3.54 | % | | | 2.70 | % |
The growth of $10,000 is cumulative.
| * | The Portfolio commenced offering Class B shares on May 1, 2003. Index returns begin April 30, 2003. |
Information About Your Portfolio’s Expenses
Scudder Strategic Income Portfolio
As an investor of the Portfolio, you incur two types of costs: ongoing expenses and transaction costs. Ongoing expenses include management fees, distribution and service (12b-1) fees and other Portfolio expenses. In the most recent six-month period, the Portfolio limited these expenses; had it not done so, expenses would have been higher. Examples of transaction costs include sales charges (loads), redemption fees and account maintenance fees, which are not shown in this section. The following tables are intended to help you understand your ongoing expenses (in dollars) of investing in the Portfolio and to help you compare these expenses with the ongoing expenses of investing in other mutual funds. The tables are based on an investment of $1,000 made at the beginning of the six-month period ended December 31, 2004.
The tables illustrate your Portfolio’s expenses in two ways:
Actual Portfolio Return. This helps you estimate the actual dollar amount of ongoing expenses (but not transaction costs) paid on a $1,000 investment in the Portfolio using the Portfolio’s actual return during the period. To estimate the expenses you paid over the period, simply divide your account value by $1,000 (for example, an $8,600 account value divided by $1,000 = 8.6), then multiply the result by the number in the “Expenses Paid per $1,000” line under the share class you hold.
Hypothetical 5% Portfolio Return. This helps you to compare your Portfolio’s ongoing expenses (but not transaction costs) with those of other mutual funds using the Portfolio’s actual expense ratio and a hypothetical rate of return of 5% per year before expenses. Examples using a 5% hypothetical Portfolio return may be found in the shareholder reports of other mutual funds. The hypothetical account values and expenses may not be used to estimate the actual ending account balance or expenses you paid for the period.
Page 187 of 466
Please note that the expenses shown in these tables are meant to highlight your ongoing expenses only and do not reflect any transaction costs. The “Expenses Paid per $1,000” line of the tables is useful in comparing ongoing expenses only and will not help you determine the relative total expense of owning different funds. If these transaction costs had been included, your costs would have been higher.
Expenses and Value of a $1,000 Investment for the six months ended December 31, 2004
| | | | | | |
Actual Portfolio Return
| | Class A
| | Class B
|
Beginning Account Value 7/1/04 | | $ | 1,000.00 | | $ | 1,000.00 |
Ending Account Value 12/31/04 | | $ | 1,101.60 | | $ | 1,099.30 |
Expenses Paid per $1,000* | | $ | 4.47 | | $ | 6.40 |
| | |
Hypothetical 5% Portfolio Return
| | Class A
| | Class B
|
Beginning Account Value 7/1/04 | | $ | 1,000.00 | | $ | 1,000.00 |
Ending Account Value 12/31/04 | | $ | 1,020.95 | | $ | 1,019.11 |
Expenses Paid per $1,000* | | $ | 4.30 | | $ | 6.15 |
| * | Expenses are equal to the Portfolio’s annualized expense ratio for each share class, multiplied by the average account value over the period, multiplied by the number of days in the most recent six-month period, then divided by 365. |
| | | | | | |
Annualized Expense Ratios
| | Class A
| | | Class B
| |
Scudder Variable Series II — Scudder Strategic Income Portfolio | | .84 | % | | 1.21 | % |
For more information, please refer to the Portfolio’s prospectus.
Management Summary December 31, 2004
Scudder Strategic Income Portfolio
The past 12 months have been a positive environment for high-yield and emerging-markets bonds because there has been just enough economic recovery present to (1) keep the corporate balance sheets of high-yield issuers healthy and (2) to keep the “carry trade”* profitable for emerging-markets investors. For the 12-month period ended December 31, 2004, the portfolio posted an 8.60% total return (Class A shares, unadjusted for contract charges). This compares with the portfolio benchmarks’ returns of 11.77% for the JP Morgan Emerging Markets Bond Plus Index, 10.76% for the Merrill Lynch High Yield Master Index, 3.54% for the Lehman Brothers US Treasury Index and 10.35% for the Citigroup World Government Bond Index. Please see page 12 for standardized performance as of December 31, 2004.
For the period, we diversified and increased our exposure to the high-yield market through investments in individual high-yield bond issues. Previously, due to the smaller size of the portfolio, its high-yield bond exposure was made through a single high-yield bond which sought to track the returns of the high-yield market. During the period, we also increased our stake in emerging-markets securities, as we believed those securities were trading at attractive yields and the fundamentals of those countries were also attractive. We also reduced exposure to foreign bonds in order to fund the increases in high-yield and emerging-markets securities.
| * | A “carry trade” is where investors borrow short term and invest longer term in fixed-income investments such as emerging markets bonds to capture higher Yulos. |
Page 188 of 466
Jan C. Faller
Lead Manager
Andrew P. Cestone Brett Diment
Sean P. McCaffrey Edwin Gutierrez
Portfolio Managers Portfolio Managers
Deutsche Investment Management Americas Inc. Deutsche Asset Management Investment Services Ltd.
All performance shown is historical, assumes reinvestment of all dividends and capital gains, and does not guarantee future results. Investment return and principal value fluctuate with changing market conditions so that, when redeemed, shares may be worth more or less then their original cost. Current performance may be lower or higher than the performance data quoted. Please visit scudder.com for the product’s most recent month-end performance. Performance doesn’t reflect charges and fees (“contract charges”) associated with the separate account that invests in the portfolio or any variable life insurance policy or variable annuity contract for which the portfolio is an investment option. These charges and fees will reduce returns.
Risk Considerations
The portfolio invests in individual bonds whose yields and market values fluctuate so that your investment may be worth more or less than its original cost. Additionally, investments by the portfolio in lower-rated bonds present greater risk to principal and income than investments in higher-quality securities. Finally, investing in foreign securities presents certain unique risks not associated with domestic investments, such as currency fluctuation, political and economic changes and market risks. All of these factors may result in greater share price volatility. Please read this portfolio’s prospectus for specific details regarding its investments and risk profile.
The JP Morgan Emerging Markets Bond Plus Index is an unmanaged foreign securities index of US dollar and other external-currency-denominated Brady bonds, loans, Eurobonds and local market debt instruments traded in emerging markets.
The Merrill Lynch High Yield Master Index is an unmanaged index which tracks the performance of below-investment-grade US dollar-denominated corporate bonds publicly issued in the United States domestic market.
The Lehman Brothers US Treasury Index is an unmanaged index reflecting the performance of all public obligations and does not focus on one particular segment of the Treasury market.
The Citigroup World Government Bond Index (formerly known as Salomon Smith Barney World Government Bond Index) is an unmanaged index comprised of government bonds from 18 developed countries including the US with maturities greater than one year.
Index returns assume reinvestment of all distributions and do not reflect fees or expenses. It is not possible to invest directly into an index.
Portfolio management market commentary is as of December 31, 2004, and may not come to pass. This information is subject to change at any time based on market and other conditions.
Portfolio Summary
Scudder Strategic Income Portfolio
| | | | | | |
Asset Allocation (Excludes Securities Lending Collateral)
| | 12/31/04
| | | 12/31/03
| |
Corporate Bonds | | 40 | % | | 14 | % |
Foreign Bonds — US$ Denominated | | 21 | % | | 9 | % |
Foreign Bonds — Non US$ Denominated | | 19 | % | | 37 | % |
US Government Backed | | 13 | % | | 22 | % |
US Government Sponsored Agencies | | 4 | % | | 12 | % |
Cash Equivalents | | 2 | % | | 6 | % |
Other | | 1 | % | | — | |
| | |
|
| |
|
|
| | | 100 | % | | 100 | % |
| | |
|
| |
|
|
Page 189 of 466
| | | |
Quality (Excludes Securities Lending Collateral)
| | 12/31/04
| |
AAA* | | 30 | % |
AA | | 2 | % |
A | | 4 | % |
BBB | | 5 | % |
BB | | 16 | % |
B | | 31 | % |
CCC | | 6 | % |
Below CC | | 1 | % |
Not rated | | 5 | % |
| | |
|
|
| | | 100 | % |
| | |
|
|
| * | Includes cash equivalents |
| | | | |
Interest Rate Sensitivity
| | 12/31/04
| | 12/31/03
|
Average maturity | | 7.5 years | | 13.7 years |
Average duration | | 5.4 years | | 6.7 years |
Asset allocation, quality and interest rate sensitivity are subject to change.
The quality ratings represent the lower of Moody’s Investors Service, Inc. (“Moody’s”) or Standard & Poor’s Corporation (“S&P”) credit ratings. The ratings of Moody’s and S&P represent their opinions as to the quality of the securities they rate. Ratings are relative and subjective and are not absolute standards of quality.
The Fund’s credit quality does not remove market risk.
For more complete details about the Portfolio’s investment portfolio, see page 18. A quarterly Fact Sheet is available upon request. Information concerning portfolio holdings of the Portfolio as of month end will be posted to scudder.com on the 15th of the following month.
Following the Portfolio’s fiscal first and third quarter-end, a complete portfolio holdings listing is filed with the SEC on Form N-Q. The form will be available on the SEC’s Web site at www.sec.gov, and it also may be reviewed and copied at the SEC’s Public Reference Room in Washington, D.C. Information on the operation of the SEC’s Public Reference Room may be obtained by calling (800) SEC-0330.
Page 190 of 466
Investment Portfolio December 31, 2004
Scudder Strategic Income Portfolio
| | | | |
| | | Principal
Amount ($) (c)
| | Value ($)
|
Corporate Bonds 38.9% | | | | |
Consumer Discretionary 9.0% | | | | |
Adesa, Inc., 7.625%, 6/15/2012 | | 45,000 | | 47,475 |
AMC Entertainment, Inc., 8.0%, 3/1/2014 | | 105,000 | | 104,475 |
American Lawyer Media, Inc., Series B, 9.75%, 12/15/2007 | | 105,000 | | 106,181 |
Atlantic Broadband Finance LLC, 144A, 9.375%, 1/15/2014 | | 113,000 | | 109,328 |
Bally Total Fitness Holdings Corp., 10.5%, 7/15/2011 | | 100,000 | | 100,750 |
Cablevision Systems New York Group, 144A, 6.669%**, 4/1/2009 (e) | | 65,000 | | 68,900 |
Caesars Entertainment, Inc., 9.375%, 2/15/2007 | | 30,000 | | 33,075 |
Carrols Corp., 144A, 9.0%, 1/15/2013 | | 30,000 | | 31,050 |
Charter Communications Holdings LLC: | | | | |
Step-up Coupon, 0% to 5/15/2006, 11.75% to 5/15/2011 | | 250,000 | | 183,750 |
9.625%, 11/15/2009 (e) | | 155,000 | | 136,012 |
10.25%, 9/15/2010 (e) | | 325,000 | | 344,500 |
Cooper Standard Automotive, Inc., 144A, 8.375%, 12/15/2014 | | 40,000 | | 39,900 |
CSC Holdings, Inc., 7.875%, 12/15/2007 | | 100,000 | | 107,250 |
Dex Media East LLC/Financial, 12.125%, 11/15/2012 | | 371,000 | | 452,156 |
DIMON, Inc., Series B, 9.625%, 10/15/2011 | | 290,000 | | 317,550 |
Dura Operating Corp.: | | | | |
Series B, 8.625%, 4/15/2012 (e) | | 35,000 | | 36,400 |
Series B, 9.0%, 5/1/2009 EUR | | 15,000 | | 19,369 |
Series D, 9.0%, 5/1/2009 (e) | | 55,000 | | 54,450 |
EchoStar DBS Corp., 144A, 6.625%, 10/1/2014 | | 70,000 | | 70,875 |
EPL Intermediate, Inc., Step-up Coupon, 0% to 3/15/2009, 12.5% to 3/15/2010 | | 40,000 | | 26,200 |
Foot Locker, Inc., 8.5%, 1/15/2022 | | 45,000 | | 49,500 |
Friendly Ice Cream Corp., 8.375%, 6/15/2012 (e) | | 125,000 | | 122,656 |
General Motors Corp., 8.25%, 7/15/2023 | | 90,000 | | 93,750 |
Icon Health & Fitness, Inc., 11.25%, 4/1/2012 | | 85,000 | | 71,400 |
Interep National Radio Sales, Inc., Series B, 10.0%, 7/1/2008 (e) | | 80,000 | | 60,300 |
J Crew Intermediate LLC, Step-up Coupon, 0% to 11/15/2005, 16.0% to 5/15/2008 | | 83,326 | | 79,151 |
Jacobs Entertainment Co., 11.875%, 2/1/2009 | | 190,000 | | 214,700 |
Levi Strauss & Co.: | | | | |
7.0%, 11/1/2006 (e) | | 80,000 | | 84,000 |
12.25%, 12/15/2012 (e) | | 10,000 | | 11,125 |
Mediacom LLC, 9.5%, 1/15/2013 (e) | | 185,000 | | 185,694 |
MGM MIRAGE: | | | | |
8.375%, 2/1/2011 (e) | | 165,000 | | 186,038 |
9.75%, 6/1/2007 | | 30,000 | | 33,300 |
| | |
| | | Principal
Amount ($) (c)
| | Value ($)
|
Mothers Work, Inc., 11.25%, 8/1/2010 | | 45,000 | | 43,650 |
NCL Corp., 144A, 10.625%, 7/15/2014 | | 125,000 | | 125,000 |
Norcraft Holdings/Capital, Step-up Coupon, 0% to 9/1/2008, 9.75% to 9/1/2012 | | 95,000 | | 71,250 |
Paxson Communications Corp., 10.75%, 7/15/2008 (e) | | 75,000 | | 78,750 |
PEI Holding, Inc., 11.0%, 3/15/2010 | | 110,000 | | 128,150 |
Petro Stopping Centers, 9.0%, 2/15/2012 | | 160,000 | | 169,200 |
Pinnacle Entertainment, Inc., 8.75%, 10/1/2013 (e) | | 40,000 | | 43,300 |
Premier Entertainment Biloxi LLC/Finance, 10.75%, 2/1/2012 | | 80,000 | | 87,400 |
Page 191 of 466
| | | | |
PRIMEDIA, Inc.: | | | | |
7.665%**, 5/15/2010 | | 140,000 | | 148,400 |
8.875%, 5/15/2011 (e) | | 95,000 | | 100,462 |
Renaissance Media Group LLC, 10.0%, 4/15/2008 | | 85,000 | | 87,550 |
Rent-Way, Inc., 11.875%, 6/15/2010 | | 55,000 | | 61,944 |
Restaurant Co., 11.25%, 5/15/2008 | | 118,709 | | 120,193 |
Sbarro, Inc., 11.0%, 9/15/2009 (e) | | 75,000 | | 75,750 |
Schuler Homes, Inc., 10.5%, 7/15/2011 | | 105,000 | | 119,438 |
Simmons Bedding Co., 144A, Step-up Coupon, 0% to 12/15/2009, 10.0% to 12/15/2014 | | 105,000 | | 64,050 |
Sinclair Broadcast Group, Inc.: | | | | |
8.0%, 3/15/2012 | | 220,000 | | 233,750 |
8.75%, 12/15/2011 | | 135,000 | | 146,981 |
Sonic Automotive, Inc., Series B, 8.625%, 8/15/2013 | | 150,000 | | 159,938 |
Toys “R” Us, Inc.: | | | | |
7.375%, 10/15/2018 | | 210,000 | | 194,250 |
7.875%, 4/15/2013 (e) | | 60,000 | | 59,550 |
True Temper Sports, Inc., 8.375%, 9/15/2011 | | 60,000 | | 55,800 |
Trump Holdings & Funding, 12.625%, 3/15/2010* | | 75,000 | | 81,188 |
TRW Automotive, Inc.: | | | | |
11.0%, 2/15/2013 (e) | | 90,000 | | 108,450 |
11.75%, 2/15/2013 EUR | | 45,000 | | 74,623 |
United Auto Group, Inc., 9.625%, 3/15/2012 | | 90,000 | | 99,450 |
Venetian Casino Resort LLC, 11.0%, 6/15/2010 | | 105,000 | | 119,831 |
VICORP Restaurants, Inc., 10.5%, 4/15/2011 (e) | | 60,000 | | 60,300 |
Virgin River Casino Corp., 144A, 9.0%, 1/15/2012 | | 10,000 | | 10,400 |
Visteon Corp.: | | | | |
7.0%, 3/10/2014 (e) | | 95,000 | | 90,725 |
8.25%, 8/1/2010 (e) | | 75,000 | | 78,563 |
Wheeling Island Gaming, Inc., 10.125%, 12/15/2009 | | 85,000 | | 90,525 |
Williams Scotsman, Inc., 9.875%, 6/1/2007 (e) | | 170,000 | | 170,000 |
| | |
| | | Principal
Amount ($) (c)
| | Value ($)
|
Worldspan LP/WS Finance Corp., 9.625%, 6/15/2011 (e) | | 80,000 | | 79,600 |
Wynn Las Vegas LLC, 144A, 6.625%, 12/1/2014 | | 205,000 | | 202,950 |
XM Satellite Radio, Inc., Step-up Coupon, 0% to 12/31/2005, 14.0% to 12/31/2009 | | 106,321 | | 108,447 |
Young Broadcasting, Inc., 8.75%, 1/15/2014 (e) | | 135,000 | | 136,013 |
| | | | |
|
| | | | | 7,467,081 |
| | | | |
|
Consumer Staples 1.1% | | | | |
Church & Dwight Co., Inc., 144A, 6.0%, 12/15/2012 | | 55,000 | | 55,962 |
Duane Reade, Inc.: | | | | |
144A, 7.01%**, 12/15/2010 | | 40,000 | | 40,600 |
144A, 9.75%, 8/1/2011 (e) | | 105,000 | | 95,550 |
North Atlantic Holding, Inc., Step-up Coupon, 0% to 3/1/2008, 12.25% to 3/1/2014 | | 80,000 | | 32,800 |
Pierre Foods, Inc., 144A, 9.875%, 7/15/2012 | | 40,000 | | 41,400 |
Pinnacle Foods Holding Corp.: | | | | |
144A, 8.25%, 12/1/2013 | | 45,000 | | 42,863 |
144A, 8.25%, 12/1/2013 (e) | | 75,000 | | 71,437 |
Page 192 of 466
| | | | |
Prestige Brands, Inc., 144A, 9.25%, 4/15/2012 | | 25,000 | | 26,563 |
Revlon Consumer Products Corp., 9.0%, 11/1/2006 | | 100,000 | | 99,000 |
Rite Aid Corp., 11.25%, 7/1/2008 | | 130,000 | | 141,050 |
Standard Commercial Corp., 8.0%, 4/15/2012 | | 50,000 | | 51,375 |
Swift & Co., 12.5%, 1/1/2010 | | 85,000 | | 96,050 |
Wornick Co., 10.875%, 7/15/2011 | | 80,000 | | 86,800 |
| | | | |
|
| | | | | 881,450 |
| | | | |
|
Energy 2.1% | | | | |
Avista Corp., 9.75%, 6/1/2008 | | 140,000 | | 162,324 |
Chesapeake Energy Corp.: | | | | |
6.875%, 1/15/2016 | | 105,000 | | 109,987 |
9.0%, 8/15/2012 | | 55,000 | | 62,838 |
CITGO Petroleum Corp., 144A, 6.0%, 10/15/2011 | | 40,000 | | 39,800 |
Dynegy Holdings, Inc.: | | | | |
6.875%, 4/1/2011 (e) | | 20,000 | | 19,250 |
7.125%, 5/15/2018 (e) | | 105,000 | | 93,581 |
7.625%, 10/15/2026 | | 35,000 | | 30,406 |
144A, 9.875%, 7/15/2010 | | 115,000 | | 128,513 |
Edison Mission Energy, 7.73%, 6/15/2009 | | 200,000 | | 215,000 |
El Paso Production Holding Corp., 7.75%, 6/1/2013 | | 115,000 | | 120,463 |
Mission Resources Corp., 9.875%, 4/1/2011 | | 100,000 | | 106,750 |
Newpark Resources, Inc., Series B, 8.625%, 12/15/2007 | | 130,000 | | 131,950 |
Southern Natural Gas, 8.875%, 3/15/2010 | | 75,000 | | 84,000 |
Stone Energy Corp.: | | | | |
144A, 6.75%, 12/15/2014 | | 55,000 | | 54,863 |
8.25%, 12/15/2011 | | 130,000 | | 140,400 |
Williams Cos., Inc.: | | | | |
8.125%, 3/15/2012 (e) | | 130,000 | | 150,150 |
8.75%, 3/15/2032 | | 70,000 | | 80,412 |
| | | | |
|
| | | | | 1,730,687 |
| | | | |
|
| | |
| | | Principal
Amount ($) (c)
| | Value ($)
|
Financials 9.1% | | | | |
AAC Group Holding Corp., 144A, Step-up Coupon, 0% to 10/1/2008, 10.25% to 10/1/2012 | | 85,000 | | 57,163 |
Affinia Group, Inc., 144A, 9.0%, 11/30/2014 | | 155,000 | | 161,587 |
Ahold Finance USA, Inc., 6.25%, 5/1/2009 | | 65,000 | | 67,600 |
Alamosa Delaware, Inc., Step-up Coupon, 0% to 7/31/2005, 12.0% to 7/31/2009 | | 55,000 | | 59,675 |
AmeriCredit Corp., 9.25%, 5/1/2009 | | 200,000 | | 214,500 |
Atlantic Mutual Insurance Co., 144A, 8.15%, 2/15/2028 | | 40,000 | | 24,392 |
BF Saul (REIT), 7.5%, 3/1/2014 | | 145,000 | | 149,350 |
Dow Jones CDX: | | | | |
144A, Series 3-1, 7.75%, 12/29/2009 (e) | | 3,150,000 | | 3,238,593 |
144A, Series 3-3, 8.0%, 12/29/2009 | | 150,000 | | 153,844 |
E*TRADE Financial Corp., 144A, 8.0%, 6/15/2011 | | 165,000 | | 177,375 |
Farmers Insurance Exchange, 144A, 8.625%, 5/1/2024 | | 155,000 | | 182,832 |
FINOVA Group, Inc., 7.5%, 11/15/2009 | | 894,250 | | 438,182 |
Page 193 of 466
| | | | |
LNR Property Corp., 7.625%, 7/15/2013 | | 50,000 | | 56,750 |
Poster Financial Group, Inc., 8.75%, 12/1/2011 (e) | | 100,000 | | 102,750 |
PXRE Capital Trust I, 8.85%, 2/1/2027 | | 90,000 | | 90,000 |
Qwest Capital Funding, Inc., 6.5%, 11/15/2018 | | 95,000 | | 78,850 |
R.H. Donnelly Finance Corp. 10.875%, 12/15/2012 | | 45,000 | | 53,438 |
Radnor Holdings Corp., 11.0%, 3/15/2010 | | 100,000 | | 85,750 |
Tennessee Valley Authority, 6.79%, 5/23/2012 | | 1,500,000 | | 1,727,190 |
TIG Capital Holdings Trust, 144A, 8.597%, 1/15/2027 | | 130,000 | | 114,075 |
UAP Holdings Corp., 144A, Step-up Coupon, 0% to 1/15/2008, 10.75% to 7/15/2012 | | 55,000 | | 43,175 |
UGS Corp., 144A, 10.0%, 6/1/2012 | | 75,000 | | 85,313 |
Universal City Development, 11.75%, 4/1/2010 | | 150,000 | | 177,187 |
Universal City Florida Holding Co., 144A, 7.2%**, 5/1/2010 | | 40,000 | | 41,600 |
Venoco, Inc., 144A, 8.75%, 12/15/2011 | | 40,000 | | 41,200 |
| | | | |
|
| | | | | 7,622,371 |
| | | | |
|
Health Care 1.2% | | | | |
AmeriPath, Inc., 10.5%, 4/1/2013 (e) | | 70,000 | | 74,375 |
Cinacalcet Royalty Subordinated LLC, 8.0%, 3/30/2017 | | 95,000 | | 95,475 |
Curative Health Services, Inc., 10.75%, 5/1/2011 | | 60,000 | | 53,700 |
Encore Medical Corp., 144A, 9.75%, 10/1/2012 | | 50,000 | | 50,500 |
| | |
| | | Principal
Amount ($) (c)
| | Value ($)
|
Hanger Orthopedic Group, Inc., 10.375%, 2/15/2009 (e) | | 90,000 | | 92,925 |
HEALTHSOUTH Corp., 10.75%, 10/1/2008 (e) | | 140,000 | | 147,700 |
IDI Acquisition Corp., 144A, 10.75%, 12/15/2011 | | 30,000 | | 30,750 |
InSight Health Services Corp., Series B, 9.875%, 11/1/2011 (e) | | 65,000 | | 65,650 |
Interactive Health LLC, 144A, 7.25%, 4/1/2011 | | 70,000 | | 60,900 |
National Mentor, Inc., 144A, 9.625%, 12/1/2012 | | 15,000 | | 15,937 |
Tenet Healthcare Corp., 6.375%, 12/1/2011 (e) | | 350,000 | | 324,625 |
| | | | |
|
| | | | | 1,012,537 |
| | | | |
|
Industrials 5.1% | | | | |
Aavid Thermal Technologies, Inc., 12.75%, 2/1/2007 | | 90,000 | | 98,550 |
Allied Security Escrow Corp., 144A, 11.375%, 7/15/2011 | | 85,000 | | 88,825 |
Allied Waste North America, Inc., Series B, 5.75%, 2/15/2011 | | 270,000 | | 253,800 |
AMI Semiconductor, Inc., 10.75%, 2/1/2013 | | 30,000 | | 35,250 |
Avondale Mills, Inc.: | | | | |
144A, 9.0%**, 7/1/2012 | | 95,000 | | 85,500 |
10.25%, 7/1/2013 (e) | | 30,000 | | 24,300 |
Browning-Ferris Industries: | | | | |
7.4%, 9/15/2035 | | 70,000 | | 61,250 |
9.25%, 5/1/2021 | | 20,000 | | 21,300 |
Cenveo Corp., 7.875%, 12/1/2013 (e) | | 120,000 | | 111,600 |
Clean Harbors, Inc., 144A, 11.25%, 7/15/2012 | | 55,000 | | 61,600 |
Collins & Aikman Floor Cover, Series B, 9.75%, 2/15/2010 | | 179,000 | | 192,425 |
Collins & Aikman Products, 10.75%, 12/31/2011 (e) | | 105,000 | | 107,100 |
Congoleum Corp., 8.625%, 8/1/2008* | | 50,000 | | 50,500 |
Page 194 of 466
| | | | |
Continental Airlines, Inc., 8.0%, 12/15/2005 (e) | | 90,000 | | 87,750 |
Cornell Companies, Inc., 10.75%, 7/1/2012 | | 115,000 | | 122,906 |
Corrections Corp. of America, 9.875%, 5/1/2009 | | 95,000 | | 105,450 |
Dana Corp., 7.0%, 3/1/2029 (e) | | 125,000 | | 124,688 |
Delta Air Lines, Inc.: | | | | |
7.9%, 12/15/2009 (e) | | 45,000 | | 28,125 |
8.3%, 12/15/2029 (e) | | 60,000 | | 29,100 |
Eagle-Picher Industries, Inc., 9.75%, 9/1/2013 | | 20,000 | | 20,000 |
Erico International Corp., 8.875%, 3/1/2012 | | 75,000 | | 78,750 |
Evergreen International Aviation, Inc., 12.0%, 5/15/2010 | | 25,000 | | 18,938 |
Goodman Global Holding Co., Inc., 144A, 7.875%, 12/15/2012 | | 125,000 | | 123,750 |
Interface, Inc., “A”, 10.375%, 2/1/2010 | | 40,000 | | 46,000 |
ISP Chemco, Inc., Series B, 10.25%, 7/1/2011 | | 135,000 | | 152,550 |
Joy Global, Inc., Series B, 8.75%, 3/15/2012 | | 15,000 | | 16,800 |
| | |
| | | Principal Amount ($) (c)
| | Value ($)
|
Kansas City Southern: | | | | |
7.5%, 6/15/2009 | | 190,000 | | 199,500 |
9.5%, 10/1/2008 | | 105,000 | | 119,306 |
Kinetek, Inc., Series D, 10.75%, 11/15/2006 | | 180,000 | | 175,950 |
Laidlaw International, Inc., 10.75%, 6/15/2011 | | 100,000 | | 116,750 |
Millennium America, Inc.: | | | | |
7.625%, 11/15/2026 (e) | | 170,000 | | 167,450 |
9.25%, 6/15/2008 (e) | | 155,000 | | 176,312 |
Remington Arms Co., Inc., 10.5%, 2/1/2011 (e) | | 75,000 | | 72,375 |
Sea Containers Ltd., 10.5%, 5/15/2012 | | 50,000 | | 52,625 |
Securus Technologies, Inc., 144A, 11.0%, 9/1/2011 | | 95,000 | | 95,000 |
Ship Finance International Ltd., 8.5%, 12/15/2013 | | 110,000 | | 113,300 |
SPX Corp.: | | | | |
6.25%, 6/15/2011 (e) | | 35,000 | | 36,925 |
7.5%, 1/1/2013 | | 135,000 | | 146,475 |
Technical Olympic USA, Inc.: | | | | |
7.5%, 3/15/2011 | | 50,000 | | 50,375 |
10.375%, 7/1/2012 | | 105,000 | | 117,600 |
Texas Genco LLC, 144A, 6.875%, 12/15/2014 | | 105,000 | | 108,544 |
The Brickman Group, Ltd., Series B, 11.75%, 12/15/2009 | | 55,000 | | 64,350 |
Thermadyne Holdings Corp., 9.25%, 2/1/2014 (e) | | 70,000 | | 68,250 |
United Rentals North America, Inc.: | | | | |
6.5%, 2/15/2012 | | 100,000 | | 97,500 |
7.0%, 2/15/2014 (e) | | 80,000 | | 74,800 |
7.75%, 11/15/2013 (e) | | 50,000 | | 49,000 |
Westlake Chemical Corp., 8.75%, 7/15/2011 | | 13,000 | | 14,690 |
| | | | |
|
| | | | | 4,263,884 |
| | | | |
|
Information Technology 0.6% | | | | |
Activant Solutions, Inc., 10.5%, 6/15/2011 | | 90,000 | | 96,750 |
Itron, Inc., 144A, 7.75%, 5/15/2012 | | 65,000 | | 66,138 |
Page 195 of 466
| | | | |
Lucent Technologies, Inc.: | | | | |
6.45%, 3/15/2029 (e) | | 275,000 | | 248,875 |
7.25%, 7/15/2006 (e) | | 35,000 | | 36,575 |
Spheris, Inc., 144A, 11.0%, 12/15/2012 | | 50,000 | | 51,250 |
| | | | |
|
| | | | | 499,588 |
| | | | |
|
Materials 4.9% | | | | |
Aqua Chemical, Inc., 11.25%, 7/1/2008 | | 100,000 | | 80,000 |
ARCO Chemical Co., 9.8%, 2/1/2020 | | 430,000 | | 490,200 |
Associated Materials, Inc., Step-up Coupon, 0% to 3/1/2009, 11.25% to 3/1/2014 | | 235,000 | | 169,200 |
Caraustar Industries, Inc., 9.875%, 4/1/2011 (e) | | 90,000 | | 97,650 |
Constar International, Inc., 11.0%, 12/1/2012 (e) | | 110,000 | | 114,125 |
Dayton Superior Corp.: | | | | |
10.75%, 9/15/2008 | | 85,000 | | 90,950 |
13.0%, 6/15/2009 (e) | | 200,000 | | 208,000 |
| | |
| | | Principal Amount ($) (c)
| | Value ($)
|
GEO Specialty Chemicals, Inc., 10.125%, 8/1/2008* | | 65,000 | | 37,700 |
Georgia-Pacific Corp.: | | | | |
8.0%, 1/15/2024 | | 235,000 | | 272,600 |
9.375%, 2/1/2013 | | 115,000 | | 133,975 |
Hercules, Inc.: | | | | |
6.75%, 10/15/2029 | | 75,000 | | 77,437 |
11.125%, 11/15/2007 | | 105,000 | | 124,950 |
Hexcel Corp., 9.75%, 1/15/2009 | | 85,000 | | 88,400 |
Huntsman Advanced Materials, 144A, 11.0%, 7/15/2010 | | 115,000 | | 136,850 |
Huntsman International LLC: | | | | |
144A, 7.375%, 1/1/2015 (e) | | 40,000 | | 40,100 |
144A, 7.5%, 1/1/2015 EUR | | 15,000 | | 20,389 |
Huntsman LLC, 11.625%, 10/15/2010 | | 135,000 | | 159,637 |
IMC Global, Inc., 10.875%, 8/1/2013 (e) | | 10,000 | | 12,500 |
Intermet Corp., 9.75%, 6/15/2009* (e) | | 55,000 | | 26,950 |
International Steel Group, Inc., 6.5%, 4/15/2014 | | 190,000 | | 203,775 |
MMI Products, Inc., Series B, 11.25%, 4/15/2007 | | 85,000 | | 86,275 |
Neenah Corp.: | | | | |
144A, 11.0%, 9/30/2010 | | 160,000 | | 176,800 |
144A, 13.0%, 9/30/2013 | | 74,000 | | 75,850 |
Omnova Solutions, Inc., 11.25%, 6/1/2010 | | 135,000 | | 151,875 |
Owens-Brockway Glass Container, 8.25%, 5/15/2013 (e) | | 35,000 | | 38,500 |
Oxford Automotive, Inc., 144A, 12.0%, 10/15/2010* (e) | | 175,000 | | 110,250 |
Pliant Corp.: | | | | |
Step-up Coupon, 0% to 12/15/2006, 11.125% to 6/15/2009 | | 20,000 | | 18,475 |
11.125%, 9/1/2009 | | 120,000 | | 130,800 |
Portola Packaging, Inc., 8.25%, 2/1/2012 (e) | | 80,000 | | 63,200 |
Rockwood Specialties Group, Inc., 144A, 7.625%, 11/15/2014 EUR | | 140,000 | | 195,766 |
Sheffield Steel Corp., 144A, 11.375%, 8/15/2011 | | 55,000 | | 56,650 |
Page 196 of 466
| | | | |
TriMas Corp., 9.875%, 6/15/2012 | | 250,000 | | 265,000 |
United States Steel LLC: | | | | |
9.75%, 5/15/2010 | | 105,000 | | 119,700 |
10.75%, 8/1/2008 | | 15,000 | | 17,663 |
| | | | |
|
| | | | | 4,092,192 |
| | | | |
|
Telecommunication Services 4.0% | | | | |
AirGate PCS, Inc., 144A, 5.85%**, 10/15/2011 | | 45,000 | | 46,238 |
American Cellular Corp., Series B, 10.0%, 8/1/2011 | | 325,000 | | 278,687 |
American Tower Corp., 144A, 7.125%, 10/15/2012 | | 55,000 | | 56,238 |
AT&T Corp.: | | | | |
9.05%, 11/15/2011 | | 115,000 | | 132,394 |
9.75%, 11/15/2031 | | 110,000 | | 131,312 |
Cincinnati Bell, Inc., 8.375%, 1/15/2014 (e) | | 380,000 | | 384,750 |
Crown Castle International Corp., 9.375%, 8/1/2011 | | 60,000 | | 67,200 |
| | |
| | | Principal Amount ($) (c)
| | Value ($)
|
Dobson Cellular Systems, Inc., 144A, 6.96%**, 11/1/2011 | | 40,000 | | 41,400 |
Dobson Communications Corp., 8.875%, 10/1/2013 (e) | | 110,000 | | 77,275 |
GCI, Inc., 7.25%, 2/15/2014 | | 80,000 | | 80,000 |
Insight Midwest LP, 9.75%, 10/1/2009 (e) | | 50,000 | | 52,375 |
IWO Escrow Co., 144A, 6.32%**, 1/15/2012 | | 10,000 | | 10,075 |
LCI International, Inc., 7.25%, 6/15/2007 | | 140,000 | | 136,150 |
Level 3 Financing, Inc., 144A, 10.75%, 10/15/2011 (e) | | 50,000 | | 45,250 |
MCI, Inc., 8.735%, 5/1/2014 | | 280,000 | | 301,000 |
Nextel Communications, Inc., 5.95%, 3/15/2014 | | 65,000 | | 67,275 |
Nextel Partners, Inc., 8.125%, 7/1/2011 | | 85,000 | | 94,350 |
PanAmSat Corp., 144A, 9.0%, 8/15/2014 | | 185,000 | | 206,506 |
Qwest Corp., 7.25%, 9/15/2025 (e) | | 440,000 | | 427,900 |
Qwest Services Corp.: | | | | |
144A, 13.5%, 12/15/2004 | | 180,000 | | 216,450 |
144A, 14.0%, 12/15/2004 | | 120,000 | | 151,800 |
Rural Cellular Corp., 9.875%, 2/1/2010 (e) | | 75,000 | | 76,312 |
SBA Telecom, Inc., Step-up Coupon, 0% to 12/15/2007, 9.75% to 12/15/2011 | | 35,000 | | 29,488 |
Triton PCS, Inc., 8.5%, 6/1/2013 | | 65,000 | | 62,725 |
Ubiquitel Operating Co., 9.875%, 3/1/2011 (e) | | 20,000 | | 22,450 |
US Unwired, Inc., Series B, 10.0%, 6/15/2012 | | 105,000 | | 118,387 |
Western Wireless Corp., “A”, 9.25%, 7/15/2013 | | 15,000 | | 16,313 |
| | | | |
|
| | | | | 3,330,300 |
| | | | |
|
Utilities 1.8% | | | | |
AES Corp., 144A, 8.75%, 5/15/2013 | | 35,000 | | 39,769 |
Allegheny Energy Supply Co. LLC, 144A, 8.25%, 4/15/2012 (e) | | 65,000 | | 72,637 |
Aquila, Inc., 14.875%, 7/1/2012 | | 35,000 | | 49,044 |
Calpine Corp.: | | | | |
8.25%, 8/15/2005 (e) | | 90,000 | | 90,900 |
144A, 8.5%, 7/15/2010 (e) | | 140,000 | | 120,050 |
CMS Energy Corp., 8.5%, 4/15/2011 | | 15,000 | | 17,044 |
Page 197 of 466
| | | | |
DPL, Inc., 6.875%, 9/1/2011 | | 235,000 | | 256,651 |
Midwest Generation LLC, 8.75%, 5/1/2034 | | 50,000 | | 56,750 |
Mission Energy Holding Co., 13.5%, 7/15/2008 | | 15,000 | | 18,712 |
NorthWestern Corp., 144A, 5.875%, 11/1/2014 (e) | | 35,000 | | 35,804 |
NRG Energy, Inc., 144A, 8.0%, 12/15/2013 | | 340,000 | | 370,600 |
PSE&G Energy Holdings LLC: | �� | | | |
8.5%, 6/15/2011 | | 95,000 | | 108,419 |
10.0%, 10/1/2009 | | 110,000 | | 130,075 |
TNP Enterprises, Inc., Series B, 10.25%, 4/1/2010 | | 125,000 | | 133,438 |
| | | | |
|
| | | | | 1,499,893 |
| | | | |
|
Total Corporate Bonds (Cost $31,545,234) | | | | 32,399,983 |
| | | | |
|
| | |
| | | Principal Amount ($) (c)
| | Value ($)
|
Foreign Bonds — US$ Denominated 20.8% | | | | |
Consumer Discretionary 1.3% | | | | |
Advertising Directory Solutions, Inc., 144A, 9.25%, 11/15/2012 (e) | | 70,000 | | 73,500 |
Jafra Cosmetics International, Inc., 10.75%, 5/15/2011 | | 150,000 | | 169,500 |
Kabel Deutschland GmbH, 144A, 10.625%, 7/1/2014 | | 150,000 | | 172,500 |
Shaw Communications, Inc.: | | | | |
7.2%, 12/15/2011 (e) | | 20,000 | | 22,075 |
7.25%, 4/6/2011 (e) | | 75,000 | | 82,688 |
8.25%, 4/11/2010 | | 195,000 | | 221,812 |
Telenet Group Holding NV, 144A, Step-up Coupon, 0% to 12/15/2008, 11.5% to 6/15/2014 | | 150,000 | | 114,000 |
Vitro Envases Norteamerica SA, 144A, 10.75%, 7/23/2011 | | 55,000 | | 57,062 |
Vitro SA de CV, Series A, 144A, 11.75%, 11/1/2013 (e) | | 140,000 | | 135,450 |
| | | | |
|
| | | | | 1,048,587 |
| | | | |
|
Consumer Staples 0.5% | | | | |
Burns Philip Capital Property, Ltd., 10.75%, 2/15/2011 | | 90,000 | | 101,250 |
Fage Dairy Industry SA, 9.0%, 2/1/2007 | | 250,000 | | 251,250 |
Grupo Cosan SA, 144A, 9.0%, 11/1/2009 | | 30,000 | | 31,350 |
| | | | |
|
| | | | | 383,850 |
| | | | |
|
Energy 1.3% | | | | |
Gazprom OAO, 144A, 9.625%, 3/1/2013 | | 200,000 | | 236,000 |
Luscar Coal Ltd., 9.75%, 10/15/2011 | | 115,000 | | 130,525 |
Petroleum Geo-Services ASA, 10.0%, 11/5/2010 | | 405,005 | | 461,706 |
Petroliam Nasional Berhad: | | | | |
7.625%, 10/15/2026 | | 40,000 | | 48,676 |
7.75%, 8/15/2015 | | 80,000 | | 97,546 |
Secunda International Ltd., 144A, 9.76%**, 1/18/2005 | | 90,000 | | 88,200 |
| | | | |
|
| | | | | 1,062,653 |
| | | | |
|
Financials 0.7% | | | | |
Central Bank of Nigeria, Series WW, 6.25%, 11/15/2020 | | 250,000 | | 234,375 |
Conproca SA de CV, 12.0%, 6/16/2010 | | 100,000 | | 126,000 |
Eircom Funding, 8.25%, 8/15/2013 | | 95,000 | | 104,975 |
Mizuho Financial Group, 8.375%, 12/29/2049 | | 50,000 | | 54,795 |
New ASAT (Finance) Ltd., 144A, 9.25%, 2/1/2011 (e) | | 115,000 | | 104,363 |
| | | | |
|
| | | | | 624,508 |
| | | | |
|
Page 198 of 466
| | | | |
Health Care 0.1% | | | | |
Biovail Corp., 7.875%, 4/1/2010 | | 70,000 | | 72,450 |
Elan Financial PLC, 144A, 7.75%, 11/15/2011 | | 20,000 | | 21,300 |
| | | | |
|
| | | | | 93,750 |
| | | | |
|
| | |
| | | Principal Amount ($) (c)
| | Value ($)
|
Industrials 1.0% | | | | |
CP Ships Ltd., 10.375%, 7/15/2012 | | 110,000 | | 126,913 |
Grupo Transportacion Ferroviaria Mexicana SA de CV: | | | | |
10.25%, 6/15/2007 | | 235,000 | | 250,275 |
11.75%, 6/15/2009 | | 120,000 | | 122,250 |
12.5%, 6/15/2012 | | 105,000 | | 122,587 |
LeGrand SA, 8.5%, 2/15/2025 | | 100,000 | | 118,000 |
Stena AB: | | | | |
144A, 7.0%, 12/1/2016 | | 30,000 | | 29,700 |
9.625%, 12/1/2012 | | 35,000 | | 39,550 |
| | | | |
|
| | | | | 809,275 |
| | | | |
|
Information Technology 0.2% | | | | |
Flextronics International Ltd., 144A, 6.25%, 11/15/2014 | | 125,000 | | 123,750 |
Magnachip Semiconductor SA: | | | | |
144A, 6.875%, 12/15/2011 | | 40,000 | | 41,200 |
144A, 8.0%, 12/15/2014 | | 40,000 | | 41,700 |
| | | | |
|
| | | | | 206,650 |
| | | | |
|
Materials 1.7% | | | | |
Alrosa Finance SA, 144A, 8.875%, 11/17/2014 | | 100,000 | | 102,750 |
Avecia Group PLC, 11.0%, 7/1/2009 | | 245,000 | | 252,350 |
Cascades, Inc.: | | | | |
7.25%, 2/15/2013 | | 145,000 | | 153,700 |
144A, 7.25%, 2/15/2013 | | 10,000 | | 10,600 |
Citigroup (JSC Severstal), 144A, 9.25%, 4/19/2014 | | 100,000 | | 99,500 |
Citigroup Global (Severstal), 8.625%, 2/24/2009 | | 40,000 | | 40,164 |
Corp. Durango SA: | | | | |
13.125%, 8/1/2006* (e) | | 25,000 | | 16,875 |
144A, 13.75%, 7/15/2009* | | 40,000 | | 26,800 |
Crown Euro Holdings SA, 10.875%, 3/1/2013 | | 75,000 | | 88,687 |
ISPAT Inland ULC, 9.75%, 4/1/2014 | | 97,000 | | 119,795 |
Rhodia SA, 8.875%, 6/1/2011 (e) | | 100,000 | | 100,750 |
Sino-Forest Corp., 144A, 9.125%, 8/17/2011 | | 55,000 | | 60,088 |
Tembec Industries, Inc., 8.5%, 2/1/2011 (e) | | 375,000 | | 376,875 |
| | | | |
|
| | | | | 1,448,934 |
| | | | |
|
Sovereign Bonds 11.7% | | | | |
Aries Vermogensverwaltung GmbH, Series C, 144A, 9.6%, 10/25/2014 | | 250,000 | | 306,750 |
Dominican Republic: | | | | |
9.04%, 1/23/2013 | | 170,000 | | 142,375 |
144A, 9.04%, 1/23/2013 | | 45,000 | | 37,238 |
9.5%, 9/27/2006 | | 60,000 | | 56,400 |
Page 199 of 466
| | | | |
| | | Principal Amount ($) (c)
| | Value ($)
|
Federative Republic of Brazil: | | | | |
Floating Rate Note Debt Conversion Bond, LIBOR plus .8125%, Series 30YR, 3.063%**, 4/15/2005 | | 140,000 | | 128,800 |
Series 18YR, 3.125%**, 4/15/2005 | | 185,296 | | 176,494 |
8.875%, 10/14/2019 | | 130,000 | | 137,020 |
9.25%, 10/22/2010 | | 70,000 | | 78,260 |
11.0%, 8/17/2040 | | 500,000 | | 593,250 |
14.5%, 10/15/2009 | | 220,000 | | 293,348 |
Government of Ukraine, 7.65%, 6/11/2013 | | 430,000 | | 459,240 |
Republic of Argentina: | | | | |
9.75%, 9/19/2027* | | 590,000 | | 195,408 |
Series BGL4, 11.0%, 10/9/2006* | | 50,000 | | 17,375 |
11.375%, 3/15/2010* | | 905,000 | | 307,700 |
Series BGL5, 11.375%, 1/30/2017* | | 15,000 | | 5,100 |
11.75%, 4/7/2009* | | 120,000 | | 40,800 |
11.75%, 6/15/2015* | | 120,000 | | 40,500 |
12.375%, 2/21/2012* | | 200,000 | | 67,500 |
Republic of Bulgaria: | | | | |
Floating Rate Note Debt Conversion Bond, LIBOR plus .8125%, Series RIAB, 2.75%**, 1/28/2005 | | 68,250 | | 68,209 |
8.25%, 1/15/2015 | | 540,000 | | 678,996 |
Republic of Colombia: | | | | |
10.75%, 1/15/2013 | | 110,000 | | 131,450 |
11.755%, 2/25/2020 | | 110,000 | | 141,350 |
Republic of Ecuador, Step-up Coupon 8.0% to 8/15/2005, 9.0% to 8/15/2006, 10.0% to 8/15/2030 | | 480,000 | | 414,000 |
Republic of Philippines: | | | | |
9.375%, 1/18/2017 | | 460,000 | | 477,825 |
9.875%, 1/15/2019 | | 70,000 | | 71,750 |
Republic of Turkey: | | | | |
7.25%, 3/15/2015 (e) | | 60,000 | | 61,650 |
8.0%, 2/14/2034 | | 60,000 | | 62,250 |
9.0%, 6/30/2011 | | 40,000 | | 45,700 |
9.5%, 1/15/2014 | | 95,000 | | 112,100 |
11.0%, 1/14/2013 | | 210,000 | | 267,225 |
11.875%, 1/15/2030 | | 420,000 | | 604,800 |
12.375%, 6/15/2009 | | 280,000 | | 351,400 |
Republic of Uruguay, 7.875%, 1/15/2033 (PIK) | | 399 | | 354 |
Republic of Venezuela: | | | | |
3.09%**, 4/20/2011 | | 160,000 | | 145,600 |
8.5%, 10/8/2014 | | 130,000 | | 137,800 |
9.375%, 1/13/2034 | | 320,000 | | 338,560 |
10.75%, 9/19/2013 | | 270,000 | | 323,325 |
Russian Federation, Step-up Coupon, 5.0% to 3/31/2007, 7.5% to 3/31/2030 | | 795,000 | | 822,348 |
Russian Ministry of Finance: | | | | |
Series V, 3.0%, 5/14/2008 | | 100,000 | | 92,960 |
Page 200 of 466
| | | | |
Series VII, 3.0%, 5/14/2011 | | 40,000 | | 33,732 |
United Mexican States: | | | | |
6.625%, 3/3/2015 | | 250,000 | | 268,500 |
Series A, 7.5%, 4/8/2033 | | 210,000 | | 226,800 |
Series A, 8.0%, 9/24/2022 | | 50,000 | | 57,675 |
| | |
| | | Principal Amount ($) (c)
| | Value ($)
|
8.125%, 12/30/2019 | | 170,000 | | 199,495 |
8.3%, 8/15/2031 | | 240,000 | | 281,280 |
Series A, 9.875%, 2/1/2010 | | 220,000 | | 270,380 |
| | | | |
|
| | | | | 9,771,072 |
| | | | |
|
Telecommunication Services 2.1% | | | | |
Alestra SA de RL de CV, 8.0%, 6/30/2010 | | 20,000 | | 16,950 |
Axtel SA, 11.0%, 12/15/2013 | | 125,000 | | 134,687 |
Embratel, Series B, 11.0%, 12/15/2008 | | 85,000 | | 96,900 |
Global Crossing UK Finance, 144A, 10.75%, 12/15/2014 | | 100,000 | | 98,750 |
Grupo Iusacell SA de CV, Series B, 10.0%, 7/15/2004* | | 20,000 | | 15,400 |
Inmarsat Finance PLC, 7.625%, 6/30/2012 | | 100,000 | | 104,000 |
Innova S. de R.L., 9.375%, 9/19/2013 (e) | | 65,000 | | 73,938 |
INTELSAT, 6.5%, 11/1/2013 | | 120,000 | | 109,200 |
Millicom International Cellular SA, 144A, 10.0%, 12/1/2013 | | 200,000 | | 209,250 |
Mobifon Holdings BV, 12.5%, 7/31/2010 | | 135,000 | | 160,144 |
Mobile Telesystems Financial, 144A, 8.375%, 10/14/2010 | | 70,000 | | 71,400 |
Nortel Networks Corp., 6.875%, 9/1/2023 | | 225,000 | | 211,500 |
Nortel Networks Ltd., 6.125%, 2/15/2006 | | 350,000 | | 356,125 |
Rogers Wireless Communications, Inc., 6.375%, 3/1/2014 | | 75,000 | | 74,250 |
| | | | |
|
| | | | | 1,732,494 |
| | | | |
|
Utilities 0.2% | | | | |
Calpine Canada Energy Finance, 8.5%, 5/1/2008 (e) | | 230,000 | | 188,600 |
| | | | |
|
Total Foreign Bonds — US$ Denominated (Cost $16,198,231) | | | | 17,370,373 |
| | | | |
|
Foreign Bonds — Non US$ Denominated 18.9% | | | | |
Consumer Discretionary 0.1% | | | | |
Victoria Acquisition III BV, 144A, 7.875%, 10/1/2014 EUR | | 50,000 | | 68,302 |
| | | | |
|
Financials 3.7% | | | | |
KFW Bankengruppe, 5.0%, 7/4/2011 EUR | | 2,080,000 | | 3,108,550 |
| | | | |
|
Industrials 0.2% | | | | |
Grohe Holdings GmbH, 144A, 8.625%, 10/1/2014 EUR | | 100,000 | | 145,440 |
| | | | |
|
Materials 0.2% | | | | |
Huntsman International LLC, 10.125%, 7/1/2009 EUR | | 85,000 | | 121,602 |
Rhodia SA, 9.25%, 6/1/2011 EUR | | 70,000 | | 96,812 |
| | | | |
|
| | | | | 218,414 |
| | | | |
|
Sovereign Bonds 14.7% | | | | |
Aries Vermogensverwaltung GmbH, Series B, 7.75%, 10/25/2009 EUR | | 250,000 | | 385,075 |
Federal Republic of Germany, 6.25%, 1/4/2024 EUR | | 1,310,000 | | 2,276,270 |
Federative Republic of Brazil, 11.0%, 2/4/2010 EUR | | 110,000 | | 180,856 |
Page 201 of 466
| | | | |
| | | Principal Amount ($) (c)
| | Value ($)
|
Kingdom of Morocco, 1.918%, 1/5/2009 EUR | | 252,000 | | 247,275 |
Mexican Bonds: | | | | |
Series M-20, 8.0%, 12/7/2023 MXN | | 5,150,000 | | 360,828 |
Series MI-10, 8.0%, 12/19/2013 MXN | | 1,336,000 | | 106,753 |
Province of Ontario 1.875%, 1/25/2010 JPY | | 140,000,000 | | 1,450,427 |
Republic of Argentina: | | | | |
7.5%, 5/23/2049* EUR | | 201,939 | | 80,973 |
8.0%, 2/26/2008* EUR | | 160,000 | | 64,157 |
Series EMTN, 10.0%, 1/7/2049* EUR | | 80,000 | | 32,350 |
11.757%, 11/13/2026* EUR | | 46,016 | | 18,452 |
Republic of Colombia, 11.75%, 3/1/2010 COP | | 330,000,000 | | 143,790 |
Republic of Greece, 4.65%, 4/19/2007 EUR | | 2,105,000 | | 2,989,941 |
Republic of Romania, 8.5%, 5/8/2012 EUR | | 180,000 | | 312,511 |
Republic of Turkey: | | | | |
20.0%, 10/17/2007 TRL | | 176,000,000,000 | | 144,350 |
20.01%, 10/17/2007 TRL | | 178,735,000,000 | | 146,593 |
United Kingdom Treasury Bond, 4.75%, 9/7/2015 GBP | | 1,700,000 | | 3,315,206 |
| | | | |
|
| | | | | 12,255,807 |
| | | | |
|
Total Foreign Bonds — Non US$ Denominated (Cost $13,367,878) | | | | 15,796,513 |
| | | | |
|
US Government Backed 12.6% | | | | |
US Treasury Bond: | | | | |
5.375%, 2/15/2031 (e) (g) | | 540,000 | | 583,917 |
6.0%, 2/15/2026 (g) | | 275,000 | | 315,015 |
7.5%, 11/15/2016 | | 570,000 | | 728,420 |
8.5%, 2/15/2020 (g) | | 760,000 | | 1,072,609 |
10.375%, 11/15/2012 (e) (g) | | 3,350,000 | | 3,994,091 |
12.75%, 11/15/2010 | | 500,000 | | 542,129 |
US Treasury Note, 5.75%, 8/15/2010 (g) | | 3,000,000 | | 3,302,931 |
| | | | |
|
Total US Government Backed (Cost $10,363,769) | | | | 10,539,112 |
| | | | |
|
US Government Sponsered Agencies 3.6% | | | | |
Federal Home Loan Mortgage Corp.: | | | | |
2.875%, 9/15/2005 | | 500,000 | | 500,164 |
5.125%, 7/15/2012 | | 2,350,000 | | 2,470,611 |
| | | | |
|
Total US Government Sponsored Agencies (Cost $2,876,350) | | | | 2,970,775 |
| | | | |
|
Convertible Bond 0.2% | | | | |
DIMON, Inc., 6.25%, 3/31/2007 | | 135,000 | | 126,562 |
HIH Capital Ltd., 144A, Series DOM, 7.5%, 9/25/2006 | | 55,000 | | 54,450 |
| | | | |
|
Total Convertible Bond (Cost $182,157) | | | | 181,012 |
| | | | |
|
Page 202 of 466
| | | | |
| | | Shares
| | Value ($)
|
Preferred Stocks 0.2% | | | | |
Paxson Communications Corp., 14.25% (PIK) | | 17 | | 124,950 |
TNP Enterprises, Inc., 14.5%, “D”, (PIK) | | 560 | | 64,960 |
| | | | |
|
Total Preferred Stocks (Cost $220,199) | | | | 189,910 |
| | | | |
|
| | | | |
| | | Principal Amount ($)(c)
| | Value ($)
|
Loan Participation 0.1% | | | | |
Republic of Algeria, Floating Rate Debt Conversion Bond, LIBOR plus .8125%, 2.813%**, 3/4/2010 (Cost $111,247) | | 115,500 | | 114,345 |
| | | | |
|
| | | | |
| | | Shares
| | Value ($)
|
Warrants 0.0% | | | | |
Dayton Superior Corp., 144A* | | 10 | | 0 |
TravelCenters of America, Inc.* | | 20 | | 100 |
| | | | |
|
Total Warrants (Cost $100) | | | | 100 |
| | | | |
|
| | |
Other Investments 0.3% | | | | |
Hercules Trust II, (Bond Unit) (Cost $249,250) | | 310,000 | | 260,400 |
| | | | |
|
| | |
Securities Lending Collateral 22.9% | | | | |
Daily Assets Fund Institutional, 2.25% (d) (f) (Cost $19,149,101) | | 19,149,101 | | 19,149,101 |
| | | | |
|
| | |
Cash Equivalents 2.3% | | | | |
Scudder Cash Management QP Trust, 2.24% (b) (Cost $1,936,248) | | 1,936,248 | | 1,936,248 |
| | | | |
|
| | | | | | |
| | | % of Net Assets
| | | Value ($)
| |
Total Investment Portfolio (Cost $96,199,764) (a) | | 120.8 | | | 100,907,872 | |
| | | | | |
|
|
Other Assets and Liabilities, Net | | (20.8 | ) | | (17,400,185 | ) |
| | | | | |
|
|
Net Assets | | 100.0 | | | 83,507,687 | |
| | | | | |
|
|
Notes to Scudder Strategic Income Portfolio of Investments
| * | Non-income producing security. In the case of a bond, generally denotes that the issuer has defaulted on the payment of principal or interest. The following table represents bonds that are in default. |
| | | | | | | | | | | | | | |
Security
| | Coupon
| | Maturity Date
| | Principal Amount
| | Acquisition Cost
| | Value
|
Congoleum Corp. | | 8.625 | | 8/1/2008 | | 50,000 | | USD | | $ | 33,868 | | $ | 50,500 |
Corp. Durango SA: | | | | | | | | | | | | | | |
| | | 13.125 | | 8/1/2006 | | 25,000 | | USD | | | 12,719 | | | 16,875 |
| | | 13.75 | | 7/15/2009 | | 40,000 | | USD | | | 21,106 | | | 26,800 |
GEO Specialty Chemicals, Inc. | | 10.125 | | 8/1/2008 | | 65,000 | | USD | | | 19,825 | | | 37,700 |
Grupo Iusacell SA de CV | | 10 | | 12/29/2049 | | 20,000 | | USD | | | 13,175 | | | 15,400 |
Intermet Corp. | | 9.75 | | 6/15/2009 | | 55,000 | | USD | | | 22,550 | | | 26,950 |
Oxford Automotive, Inc. | | 12 | | 10/15/2010 | | 175,000 | | USD | | | 113,324 | | | 110,250 |
Page 203 of 466
| | | | | | | | | | | | | | |
Republic of Argentina: | | | | | | | | | | | | |
| | | 7.5 | | 5/23/2049 | | 201,939 | | EUR | | | 60,356 | | | 80,973 |
| | | 8 | | 2/26/2008 | | 160,000 | | EUR | | | 51,060 | | | 64,157 |
| | | 9.75 | | 9/19/2027 | | 590,000 | | USD | | | 156,710 | | | 195,408 |
| | | 10 | | 1/7/2049 | | 80,000 | | EUR | | | 24,761 | | | 32,350 |
| | | 11 | | 10/9/2006 | | 50,000 | | USD | | | 11,000 | | | 17,375 |
| | | 11.375 | | 3/15/2010 | | 905,000 | | USD | | | 269,445 | | | 307,700 |
| | | 11.375 | | 1/30/2017 | | 15,000 | | USD | | | 4,669 | | | 5,100 |
| | | 11.75 | | 4/7/2009 | | 120,000 | | USD | | | 38,513 | | | 40,800 |
| | | 11.75 | | 6/15/2005 | | 120,000 | | USD | | | 38,871 | | | 40,500 |
| | | 11.757 | | 6/15/2005 | | 46,016 | | EUR | | | 11,189 | | | 18,452 |
| | | 12.375 | | 2/21/2012 | | 200,000 | | USD | | | 63,750 | | | 67,500 |
Trump Holdings & Funding | | 12.625 | | 3/15/2010 | | 75,000 | | USD | | | 77,992 | | | 81,188 |
| | | | | | | | | | |
|
| |
|
|
| | | | | | | | | | | $ | 1,044,883 | | $ | 1,235,978 |
| | | | | | | | | | |
|
| |
|
|
| ** | Floating rate notes are securities whose yields vary with a designated market index or market rate, such as the coupon-equivalent of the US Treasury bill rate. These securities are shown at their current rate as of December 31, 2004. |
| (a) | The cost for federal income tax purposes was $96,374,723. At December 31, 2004, net unrealized appreciation for all securities based on tax cost was $4,533,149. This consisted of aggregate gross unrealized appreciation for all securities in which there was an excess of value over tax cost of $4,908,984 and aggregate gross unrealized depreciation for all securities in which there was an excess of tax cost over value of $375,835. |
| (b) | Scudder Cash Management QP Trust is managed by Deutsche Investment Management Americas Inc. The rate shown is the annualized seven-day yield at period end. |
| (c) | Principal amount stated in US dollars unless otherwise noted. |
| (d) | Daily Assets Fund Institutional, an affiliated fund, is managed by Deutsche Asset Management, Inc. The rate shown is the annualized seven-day yield at period end. |
| (e) | All or a portion of these securities were on loan (see Notes to Financial Statements). The value of securities loaned at December 31, 2004 amounted to $18,781,631, which is 22.5% of total net assets. |
| (f) | Represents collateral held in connection with securities lending. |
| (g) | At December 31, 2004, these securities have been segregated, in whole or in part, to cover initial margin requirements for open futures contracts. |
LIBOR: Represents the London InterBank Offered Rate
PIK: Denotes that all or a portion of income is paid in kind.
REIT: Real Estate Investment Trust
At December 31, 2004, open futures contracts purchased were as follows:
| | | | | | | | | | |
Futures
| | Expiration Date
| | Contracts
| | Aggregate Face Value ($)
| | Value ($)
| | Unrealized Appreciation/(Depreciation) ($)
|
10 year Canada Government Bond | | 3/21/2005 | | 43 | | 3,977,251 | | 4,025,272 | | 48,021 |
10 Year Germany Federal Rip Bond | | 3/8/2005 | | 21 | | 3,356,560 | | 3,385,062 | | 28,502 |
10 year Japanese Government Bond | | 3/10/2005 | | 5 | | 6,717,225 | | 6,751,244 | | 34,019 |
10 year US Treasury Note | | 3/21/2005 | | 22 | | 2,433,479 | | 2,462,625 | | 29,146 |
| | | | | | | | | | |
|
Total net unrealized appreciation | | | | | | | | | | 139,688 |
| | | | | | | | | | |
|
Page 204 of 466
At December 31, 2004, open futures contracts sold short were as follows:
| | | | | | | | | | | | | |
Futures
| | Expiration
Date
| | Contracts
| | Aggregate
Face Value ($)
| | | Value ($)
| | | Unrealized
Appreciation/
(Depreciation)
($)
| |
UK Treasury Bond | | 3/29/2005 | | 14 | | (2,980,247 | ) | | (2,998,579 | ) | | (18,332 | ) |
2 year US Treasury Note | | 3/31/2005 | | 34 | | (7,119,144 | ) | | (7,126,188 | ) | | (7,044 | ) |
5 year US Treasury Note | | 3/31/2005 | | 118 | | (12,868,415 | ) | | (12,924,688 | ) | | (56,273 | ) |
| | | | | | | | | | | | |
|
|
Total net unrealized depreciation | | | | | | | | | | | | (81,649 | ) |
| | | | | | | | | | | | |
|
|
144A: Security exempt from registration under Rule 144A of the Securities Act of 1933. These securities may be resold in transactions exempt from registrations, normally to qualified institutional buyers.
| | | | | | |
Currency Abbreviations
|
COP | | Colombian Peso | | EUR | | Euro |
GBP | | British Pounds | | JPY | | Japanese Yen |
MXN | | Mexican Peso | | TRL | | Turkish Lira |
The accompanying notes are an integral part of the financial statements.
Financial Statements
Statement of Assets and Liabilities as of December 31, 2004
| | | |
Assets | | | |
Investments: | | | |
Investments in securities, at value (cost $75,114,415) — including $18,781,631 of securities loaned | | $ | 79,822,523 |
Investment in Daily Assets Fund Institutional (cost $19,149,101)* | | | 19,149,101 |
Investment in Scudder Cash Management QP Trust (cost $1,936,248) | | | 1,936,248 |
| | |
|
|
Total investments in securities, at value (cost $96,199,764) | | | 100,907,872 |
| | |
|
|
Cash | | | 160,875 |
Foreign currency, at value (cost $554,845) | | | 557,867 |
Receivable for investments sold | | | 196,125 |
Interest receivable | | | 1,625,195 |
Receivable for Portfolio shares sold | | | 124,340 |
Receivable for daily variation margin on open futures contracts | | | 13,960 |
Unrealized appreciation on forward foreign currency exchange contracts | | | 258,057 |
Other assets | | | 3,087 |
| | |
|
|
Total assets | | | 103,847,378 |
| | |
|
|
Liabilities | | | |
Payable for investments purchased | | | 218,024 |
Payable upon return of securities loaned | | | 19,149,101 |
Payable for Portfolio shares redeemed | | | 4,722 |
Unrealized depreciation on forward foreign currency exchange contracts | | | 837,337 |
Net payable on closed forward foreign currency exchange contracts | | | 16,888 |
Accrued management fee | | | 39,845 |
Other accrued expenses and payables | | | 73,774 |
| | |
|
|
Total liabilities | | | 20,339,691 |
| | |
|
|
Page 205 of 466
| | | | |
Net assets, at value | | $ | 83,507,687 | |
| | |
|
|
|
Net Assets | | | | |
Net assets consist of: | | | | |
Undistributed net investment income | | | 7,007,553 | |
Net unrealized appreciation (depreciation) on: | | | | |
Investments | | | 4,708,108 | |
Foreign currency related transactions | | | (601,642 | ) |
Futures | | | 58,039 | |
Accumulated net realized gain (loss) | | | (199,809 | ) |
Paid-in capital | | | 72,535,438 | |
| | |
|
|
|
Net assets, at value | | $ | 83,507,687 | |
| | |
|
|
|
Class A Shares | | | | |
Net asset value, offering and redemption price per share ($62,098,917 ÷ 5,069,464 shares outstanding shares of beneficial interest, $.01 par value, unlimited number of shares authorized) | | $ | 12.25 | |
| | |
|
|
|
Class B Shares | | | | |
Net asset value, offering and redemption price per share ($21,408,770 ÷ 1,758,421 shares outstanding shares of beneficial interest, $.01 par value, unlimited number of shares authorized) | | $ | 12.17 | |
| | |
|
|
|
| * | Represents collateral on securities loaned. |
Statement of Operations for the year ended December 31, 2004
| | | | |
Investment Income | | | | |
Income: | | | | |
Dividends (net of foreign taxes withheld of $2,689) | | $ | 34,413 | |
Interest | | | 4,278,030 | |
Interest — Scudder Cash Management QP Trust | | | 35,277 | |
Securities lending income, including income from Daily Assets Fund Institutional | | | 20,278 | |
| | |
|
|
|
Total Income | | | 4,367,998 | |
| | |
|
|
|
Expenses: | | | | |
Management fee | | | 487,494 | |
Custodian fees | | | 56,035 | |
Distribution service fees (Class B) | | | 39,636 | |
Record keeping fees (Class B) | | | 18,869 | |
Auditing | | | 54,998 | |
Legal | | | 15,015 | |
Trustees’ fees and expenses | | | 385 | |
Reports to shareholders | | | 13,136 | |
Other | | | 4,204 | |
| | |
|
|
|
Total expenses, before expense reductions | | | 689,772 | |
| | |
|
|
|
Expense reductions | | | (2,017 | ) |
| | |
|
|
|
Page 206 of 466
| | | | |
Total expenses, after expense reductions | | | 687,755 | |
| | |
|
|
|
Net investment income | | | 3,680,243 | |
| | |
|
|
|
Realized and Unrealized Gain (Loss) on Investment Transactions | | | | |
Net realized gain (loss) from: | | | | |
Investments | | | 2,947,088 | |
Futures | | | (15,609 | ) |
Written options | | | 266,667 | |
Foreign currency related transactions | | | (915,344 | ) |
| | | | 2,282,802 | |
Net unrealized appreciation (depreciation) during the period on: | | | | |
Investments | | | 62,129 | |
Futures | | | 52,237 | |
Written options | | | (13,130 | ) |
Foreign currency related transactions | | | 288,862 | |
| | | | 390,098 | |
| | |
|
|
|
Net gain (loss) on investment transactions | | | 2,672,900 | |
| | |
|
|
|
Net increase (decrease) in net assets resulting from operations | | $ | 6,353,143 | |
| | |
|
|
|
The accompanying notes are an integral part of the financial statements.
Statement of Changes in Net Assets
| | | | | | | | |
| | | Years Ended December 31,
| |
Increase (Decrease) in Net Assets
| | 2004
| | | 2003
| |
Operations: | | | | | | | | |
Net investment income | | $ | 3,680,243 | | | $ | 2,379,002 | |
Net realized gain (loss) on investment transactions | | | 2,282,802 | | | | 1,464,156 | |
Net unrealized appreciation (depreciation) on investment transactions during the period | | | 390,098 | | | | 869,023 | |
Net increase (decrease) in net assets resulting from operations | | | 6,353,143 | | | | 4,712,181 | |
Distributions to shareholders from: | | | | | | | | |
Net investment income | | | | | | | | |
Class A | | | — | | | | (853,600 | ) |
Net realized gains | | | | | | | | |
Class A | | | (2,822,807 | ) | | | (28,838 | ) |
Class B | | | (547,427 | ) | | | — | |
Page 207 of 466
| | | | | | | | |
Portfolio share transactions: | | | | | | | | |
| | |
Class A | | | | | | | | |
Proceeds from shares sold | | | 13,206,141 | | | | 39,373,917 | |
Reinvestment of distributions | | | 2,822,807 | | | | 882,438 | |
Cost of shares redeemed | | | (17,995,166 | ) | | | (41,393,653 | ) |
Net increase (decrease) in net assets from Class A share transactions | | | (1,966,218 | ) | | | (1,137,298 | ) |
| | |
Class B | | | | | | | | |
Proceeds from shares sold | | | 13,821,690 | | | | 8,762,505 | |
Reinvestment of distributions | | | 547,427 | | | | — | |
Cost of shares redeemed | | | (2,371,956 | ) | | | (662,224 | ) |
Net increase (decrease) in net assets from Class B share transactions | | | 11,997,161 | | | | 8,100,281 | |
Increase (decrease) in net assets | | | 13,013,852 | | | | 10,792,726 | |
Net assets at beginning of period | | | 70,493,835 | | | | 59,701,109 | |
| | |
|
|
| |
|
|
|
Net assets at end of period (including undistributed net investment income of $7,007,553 and $964,888, respectively) | | $ | 83,507,687 | | | $ | 70,493,835 | |
| | |
|
|
| |
|
|
|
Other Information | | | | | | | | |
Class A | | | | | | | | |
Shares outstanding at beginning of period | | | 5,264,429 | | | | 5,379,967 | |
Shares sold | | | 1,130,086 | | | | 3,451,262 | |
Shares issued to shareholders in reinvestment of distributions | | | 247,832 | | | | 78,789 | |
Shares redeemed | | | (1,572,883 | ) | | | (3,645,589 | ) |
Net increase (decrease) in Portfolio shares | | | (194,965 | ) | | | (115,538 | ) |
| | |
|
|
| |
|
|
|
Shares outstanding at end of period | | | 5,069,464 | | | | 5,264,429 | |
| | |
|
|
| |
|
|
|
Class B | | | | | | | | |
Shares outstanding at beginning of period | | | 701,718 | | | | — | |
Shares sold | | | 1,213,237 | | | | 759,236 | |
Shares issued to shareholders in reinvestment of distributions | | | 48,231 | | | | — | |
Shares redeemed | | | (204,765 | ) | | | (57,518 | ) |
Net increase (decrease) in Portfolio shares | | | 1,056,703 | | | | 701,718 | |
| | |
|
|
| |
|
|
|
Shares outstanding at end of period | | | 1,758,421 | | | | 701,718 | |
| | |
|
|
| |
|
|
|
The accompanying notes are an integral part of the financial statements.
Page 208 of 466
Financial Highlights
Class A
| | | | | | | | | | | | | | | | | | | | |
Years Ended December 31,
| | 2004
| | | 2003
| | | 2002
| | | 2001a
| | | 2000b
| |
Selected Per Share Data | | | | | | | | | | | | | | | | | | | | |
Net asset value, beginning of period | | $ | 11.82 | | | $ | 11.10 | | | $ | 10.27 | | | $ | 9.86 | | | $ | 9.86 | |
| | |
|
|
| |
|
|
| |
|
|
| |
|
|
| |
|
|
|
Income (loss) from investment operations: | | | | | | | | | | | | | | | | | | | | |
Net investment incomec | | | .58 | | | | .41 | | | | .45 | | | | .48 | | | | .51 | |
Net realized and unrealized gain (loss) on investment transactions | | | .39 | | | | .47 | | | | .68 | | | | .03 | | | | (.26 | ) |
| | |
|
|
| |
|
|
| |
|
|
| |
|
|
| |
|
|
|
Total from investment operations | | | .97 | | | | .88 | | | | 1.13 | | | | .51 | | | | .25 | |
| | |
|
|
| |
|
|
| |
|
|
| |
|
|
| |
|
|
|
Less distributions from: | | | | | | | | | | | | | | | | | | | | |
Net investment income | | | — | | | | (.15 | ) | | | (.30 | ) | | | (.10 | ) | | | (.25 | ) |
Net realized gains on investment transactions | | | (.54 | ) | | | (.01 | ) | | | — | | | | — | | | | — | |
| | |
|
|
| |
|
|
| |
|
|
| |
|
|
| |
|
|
|
Total distributions | | | (.54 | ) | | | (.16 | ) | | | (.30 | ) | | | (.10 | ) | | | (.25 | ) |
| | |
|
|
| |
|
|
| |
|
|
| |
|
|
| |
|
|
|
Net asset value, end of period | | $ | 12.25 | | | $ | 11.82 | | | $ | 11.10 | | | $ | 10.27 | | | $ | 9.86 | |
| | |
|
|
| |
|
|
| |
|
|
| |
|
|
| |
|
|
|
Total Return (%) | | | 8.60 | | | | 7.85 | | | | 11.30 | | | | 5.23 | | | | 2.57 | |
| | |
|
|
| |
|
|
| |
|
|
| |
|
|
| |
|
|
|
Ratios to Average Net Assets and Supplemental Data | | | | | | | | | | | | | | | | | | | | |
Net assets, end of period ($ millions) | | | 62 | | | | 62 | | | | 60 | | | | 21 | | | | 9 | |
Ratio of expenses before expense reductions (%) | | | .84 | | | | .83 | | | | .73 | | | | .66 | | | | 1.14 | |
Ratio of expenses after expense reductions (%) | | | .84 | | | | .83 | | | | .73 | | | | .65 | | | | 1.10 | |
Ratio of net investment income (%) | | | 4.99 | | | | 3.60 | | | | 4.26 | | | | 4.76 | | | | 5.26 | |
Portfolio turnover rate (%) | | | 210 | | | | 160 | | | | 65 | | | | 27 | | | | 154 | |
| a | As required, effective January 1, 2001, the Portfolio has adopted the provisions of the AICPA Audit and Accounting Guide for Investment Companies and began amortizing premium on debt securities. In addition, paydowns on mortgage-backed securities which were included in realized gain/loss on investment transactions prior to January 1, 2001 are included as interest income. The effect of this change for the year ended December 31, 2001 was to decrease net investment income per share by $.04, increase net realized and unrealized gains and losses per share by $.04 and decrease the ratio of net investment income to average net assets from 5.16% to 4.76%. Per share, ratios and supplemental data for periods prior to January 1, 2001 have not been restated to reflect this change in presentation. |
| b | On June 18, 2001, the Portfolio implemented a 1 for 10 reverse stock split. Per share information, for the periods prior to December 31, 2001, has been restated to reflect the effect of the split. Shareholders received 1 share for every 10 shares owned and net asset value per share increased correspondingly. |
| c | Based on average shares outstanding during the period. |
Class B
| | | | | | | | |
| | | 2004
| | | 2003a
| |
Selected Per Share Data | | | | | | | | |
Net asset value, beginning of period | | $ | 11.78 | | | $ | 11.44 | |
| | |
|
|
| |
|
|
|
Income (loss) from investment operations: | | | | | | | | |
Net investment incomeb | | | .53 | | | | .17 | |
Net realized and unrealized gain (loss) on investment transactions | | | .40 | | | | .17 | |
| | |
|
|
| |
|
|
|
Total from investment operations | | | .93 | | | | .34 | |
| | |
|
|
| |
|
|
|
Less distributions from: | | | | | | | | |
Net realized gains on investment transactions | | | (.54 | ) | | | — | |
| | |
|
|
| |
|
|
|
Net asset value, end of period | | $ | 12.17 | | | $ | 11.78 | |
| | |
|
|
| |
|
|
|
Total Return (%) | | | 8.27 | | | | 2.97 | ** |
| | |
|
|
| |
|
|
|
Ratios to Average Net Assets and Supplemental Data | | | | | | | | |
Net assets, end of period ($ millions) | | | 21 | | | | 8 | |
Ratio of expenses (%) | | | 1.22 | | | | 1.26 | * |
Ratio of net investment income (%) | | | 4.61 | | | | 1.80 | * |
Portfolio turnover rate (%) | | | 210 | | | | 160 | |
| a | For the period from May 1, 2003 (commencement of operations of Class B shares) to December 31, 2003. |
Page 209 of 466
| b | Based on average shares outstanding during the period. |
Performance Summary December 31, 2004
Scudder Technology Growth Portfolio
All performance shown is historical, assumes reinvestment of all dividends and capital gains, and does not guarantee future results. Investment return and principal value fluctuate with changing market conditions so that, when redeemed, shares may be worth more or less then their original cost. Current performance may be lower or higher than the performance data quoted. Please visit scudder.com for the product’s most recent month-end performance. Performance doesn’t reflect charges and fees (“contract charges”) associated with the separate account that invests in the Portfolio or any variable life insurance policy or variable annuity contract for which the Portfolio is an investment option. These charges and fees will reduce returns.
Investments by the Portfolio in small companies present greater risk of loss than investments in larger, more established companies. Concentration of the Portfolio’s investment in technology stocks may present a greater risk than investments in a more diversified Portfolio. Investments by the Portfolio in emerging technology companies present greater risk than investments in more-established technology companies. This Portfolio is non-diversified and can take larger positions in fewer companies, increasing its overall potential risk. Please read this Portfolio’s prospectus for specific details regarding its investments and risk profile.
| | |
| Growth of an Assumed $10,000 Investment in Scudder Technology Growth Portfolio from 5/1/1999 to 12/31/2004 |
| |
| ¨ Scudder Technology Growth Portfolio — Class A | | |
| |
| ¨ Goldman Sachs Technology Index | | |
| |
| ¨ Russell 1000 Growth Index | | |
 | | The Goldman Sachs Technology Index is a modified capitalization-weighted index composed of companies involved in the technology industry. The Russell 1000 Growth Index is an unmanaged index composed of common stocks of larger US companies with higher price-to-book ratios and higher forecasted growth values. Index returns assume reinvested dividends and, unlike Portfolio returns, do not reflect any fees or expenses. It is not possible to invest directly into an index. |
Comparative Results
| | | | | | | | | | | | | | | | | | |
Scudder Technology Growth Portfolio
| | | | 1-Year
| | | 3-Year
| | | 5-Year
| | | Life of Portfolio*
| |
Class A | | Growth of $10,000 | | $ | 10,192 | | | $ | 9,635 | | | $ | 5,109 | | | $ | 9,079 | |
| | | Average annual total return | | | 1.92 | % | | | -1.23 | % | | | -12.57 | % | | | -1.69 | % |
Goldman Sachs Technology Index | | Growth of $10,000 | | $ | 10,291 | | | $ | 9,477 | | | $ | 4,207 | | | $ | 6,948 | |
| | | Average annual total return | | | 2.91 | % | | | -1.77 | % | | | -15.90 | % | | | -6.22 | % |
Russell 1000 Growth Index | | Growth of $10,000 | | $ | 10,630 | | | $ | 9,946 | | | $ | 6,140 | | | $ | 7,678 | |
| | | Average annual total return | | | 6.30 | % | | | -.18 | % | | | -9.29 | % | | | -4.56 | % |
| | | | | |
Scudder Technology Growth Portfolio
| | | | | | | | | | 1-Year
| | | Life of Class**
| |
Class B | | Growth of $10,000 | | | | | | | | | | $ | 10,148 | | | $ | 14,130 | |
| | | Average annual total return | | | | | | | | | | | 1.48 | % | | | 14.81 | % |
Goldman Sachs Technology Index | | Growth of $10,000 | | | | | | | | | | $ | 10,291 | | | $ | 14,144 | |
| | | Average annual total return | | | | | | | | | | | 2.91 | % | | | 14.81 | % |
Russell 1000 Growth Index | | Growth of $10,000 | | | | | | | | | | $ | 10,630 | | | $ | 12,555 | |
| | | Average annual total return | | | | | | | | | | | 6.30 | % | | | 9.53 | % |
The growth of $10,000 is cumulative.
| * | The Portfolio commenced operations on May 1, 1999. Index returns begin April 30, 1999. Total returns would have been lower for the Life of Portfolio period for Class A shares if the Portfolio’s expenses were not maintained. |
Page 210 of 466
| ** | The Portfolio commenced offering Class B shares on July 1, 2002. Index returns begin June 30, 2002. |
Information About Your Portfolio’s Expenses
Scudder Technology Growth Portfolio
As an investor of the Portfolio, you incur two types of costs: ongoing expenses and transaction costs. Ongoing expenses include management fees, distribution and service (12b-1) fees and other Portfolio expenses. Examples of transaction costs include sales charges (loads), redemption fees and account maintenance fees, which are not shown in this section. The following tables are intended to help you understand your ongoing expenses (in dollars) of investing in the Portfolio and to help you compare these expenses with the ongoing expenses of investing in other mutual funds. In the most recent six-month period, Class B shares of the Portfolio limited these expenses; had it not done so, expenses would have been higher. The tables are based on an investment of $1,000 made at the beginning of the six-month period ended December 31, 2004.
The tables illustrate your Portfolio’s expenses in two ways:
Actual Portfolio Return. This helps you estimate the actual dollar amount of ongoing expenses (but not transaction costs) paid on a $1,000 investment in the Portfolio using the Portfolio’s actual return during the period. To estimate the expenses you paid over the period, simply divide your account value by $1,000 (for example, an $8,600 account value divided by $1,000 = 8.6), then multiply the result by the number in the “Expenses Paid per $1,000” line under the share class you hold.
Hypothetical 5% Portfolio Return. This helps you to compare your Portfolio’s ongoing expenses (but not transaction costs) with those of other mutual funds using the Portfolio’s actual expense ratio and a hypothetical rate of return of 5% per year before expenses. Examples using a 5% hypothetical Portfolio return may be found in the shareholder reports of other mutual funds. The hypothetical account values and expenses may not be used to estimate the actual ending account balance or expenses you paid for the period.
Please note that the expenses shown in these tables are meant to highlight your ongoing expenses only and do not reflect any transaction costs. The “Expenses Paid per $1,000” line of the tables is useful in comparing ongoing expenses only and will not help you determine the relative total expense of owning different funds. If these transaction costs had been included, your costs would have been higher.
| | | | | | |
| Expenses and Value of a $1,000 Investment for the six months ended December 31, 2004 | | | | | | |
Actual Portfolio Return
| | Class A
| | Class B
|
Beginning Account Value 7/1/04 | | $ | 1,000.00 | | $ | 1,000.00 |
Ending Account Value 12/31/04 | | $ | 1,018.10 | | $ | 1,015.90 |
Expenses Paid per $1,000* | | $ | 4.27 | | $ | 6.18 |
| | |
Hypothetical 5% Portfolio Return
| | Class A
| | Class B
|
Beginning Account Value 7/1/04 | | $ | 1,000.00 | | $ | 1,000.00 |
Ending Account Value 12/31/04 | | $ | 1,020.97 | | $ | 1,019.08 |
Expenses Paid per $1,000* | | $ | 4.28 | | $ | 6.19 |
| * | Expenses are equal to the Portfolio’s annualized expense ratio for each share class, multiplied by the average account value over the period, multiplied by the number of days in the most recent six-month period, then divided by 365. |
Page 211 of 466
| | | | | | |
Annualized Expense Ratios
| | Class A
| | | Class B
| |
Scudder Variable Series II — Scudder Technology Growth Portfolio | | .84 | % | | 1.22 | % |
For more information, please refer to the Portfolio’s prospectus.
Management Summary December 31, 2004
Scudder Technology Growth Portfolio
Technology was the worst-performing sector in the US stock market during 2004. The portfolio returned 1.92% for the year ended December 31, 2004 (Class A shares, unadjusted for contract charges) compared with a return of 2.91% for the Goldman Sachs Technology Index and 6.30% for the Russell 1000 Growth Index. Performance was helped by our stock selection within software and communications equipment, but weak selection in semiconductors and our decision not to hold Apple Computer — one of the best-performing stocks in the tech sector — detracted.
The portfolio is overweight in communications equipment, a fast-growing area where we favor Qualcomm, Inc. (3.4% of total net assets as of December 31, 2004) and Research in Motion Ltd. (2.2% of total net assets). We are maintaining the portfolio’s overweight position in software, but we have reduced the portfolio’s risk profile by taking profits in some of its higher-beta* positions and boosting its weighting in Microsoft Corp. (8.1%). We are less enthusiastic on the prospects for hardware and equipment stocks, many of which have become commodity-oriented companies subject to pricing pressure and intense competition. The portfolio is also underweight in semiconductors — after being overweight in the group for much of the year — as well as Internet stocks, where we believe valuations are generally unattractive. Here, the portfolio owns only Yahoo!, Inc. (1.7%) and eBay, Inc. (2.3%). Within services, where the portfolio is underweight, it holds what we believe are higher-quality stocks such as Paychex, Inc. (2.2%) and Affiliated Computer Services, Inc. (1.5%). The portfolio also held an above-average weighting in cash at year-end to help ensure that we have the resources available to take advantage of any weakness in the broader market.
Overall, we are positive in the outlook for the tech sector, and the portfolio’s positioning reflects this. While earnings are indeed likely to slow in 2005, the environment should be generally favorable. We estimate that tech spending will rise in the neighborhood of 8% while earnings climb 10% to 15%. We believe the profit growth within the technology sector is likely to be higher than that for the market as a whole in 2005. This would mark a continuation of the trend that has been in place for the last 50 years, during which the tech sector has grown at twice the rate of the economy overall. Despite this favorable backdrop, market expectations are modest with respect to next year. This means there is less room for disappointment and more room for upside surprises. In this basis, we have positioned the portfolio in a more aggressive fashion in order to take advantage of a potential upward move in the group over the next six to 12 months.
| * | Beta is a historical measure of a fund’s sensitivity to benchmark movements. A fund with a beta great than one is more volatile than its benchmark index. A fund with a beta less than one is less volatile than its benchmark index. |
Page 212 of 466
Ian Link Anne Meisner
Lead Manager Portfolio Manager
Deutsche Investment Management Americas Inc.
All performance shown is historical, assumes reinvestment of all dividends and capital gains, and does not guarantee future results. Investment return and principal value fluctuate with changing market conditions so that, when redeemed, shares may be worth more or less then their original cost. Current performance may be lower or higher than the performance data quoted. Please visit scudder.com for the product’s most recent month-end performance. Performance doesn’t reflect charges and fees (“contract charges”) associated with the separate account that invests in the portfolio or any variable life insurance policy or variable annuity contract for which the portfolio is an investment option. These charges and fees will reduce returns.
Risk Considerations
Investments by the portfolio in small companies present greater risk of loss than investments in larger, more established companies. Concentration of the portfolio’s investment in technology stocks may present a greater risk than investments in a more diversified portfolio. Investments by the portfolio in emerging technology companies present greater risk than investments in more established technology companies. This portfolio is non-diversified and can take larger positions in fewer companies, increasing its overall potential risk. Please read this portfolio’s prospectus for specific details regarding its investments and risk profile.
The Goldman Sachs Technology Index is an unmanaged, capitalization-weighted index based on a universe of technology-related stocks. Index returns assume reinvestment of all distributions and do not reflect fees or expenses. It is not possible to invest directly into an index.
The Russell 1000 Growth Index is an unmanaged index composed of common stocks of larger US companies with higher price-to-book ratios and higher forecasted growth values. Index returns assume reinvestment of all distributions and do not reflect fees or expenses. It is not possible to invest directly into an index.
Portfolio management market commentary is as of December 31, 2004, and may not come to pass. This information is subject to change at any time based on market and other conditions.
Portfolio Summary
Scudder Technology Growth Portfolio
| | | | | | |
Asset Allocation (Excludes Securities Lending Collateral)
| | 12/31/04
| | | 12/31/03
| |
Common Stocks | | 91 | % | | 100 | % |
Cash Equivalents | | 9 | % | | — | |
| | |
|
| |
|
|
| | | 100 | % | | 100 | % |
| | |
|
| |
|
|
| | | | | | |
Sector Diversification (Excludes Cash Equivalents and Securities Lending Collateral)
| | 12/31/04
| | | 12/31/03
| |
Information Technology | | 96 | % | | 94 | % |
Consumer Discretionary | | 3 | % | | 5 | % |
Health Care | | 1 | % | | — | |
Telecommunication Services | | — | | | 1 | % |
| | |
|
| |
|
|
| | | 100 | % | | 100 | % |
| | |
|
| |
|
|
Asset allocation and sector diversification are subject to change.
For more complete details about the Portfolio’s investment portfolio, see page 36. A quarterly Fact Sheet is available upon request. Information concerning portfolio holdings of the Portfolio as of month end will be posted to scudder.com on the 15th of the following month.
Page 213 of 466
Following the Portfolio’s fiscal first and third quarter-end, a complete portfolio holdings listing is filed with the SEC on Form N-Q. The form will be available on the SEC’s Web site at www.sec.gov, and it also may be reviewed and copied at the SEC’s Public Reference Room in Washington, D.C. Information on the operation of the SEC’s Public Reference Room may be obtained by calling (800) SEC-0330.
Investment Portfolio December 31, 2004
Scudder Technology Growth Portfolio
| | | | |
| | | Shares
| | Value ($)
|
Common Stocks 91.5% | | | | |
Consumer Discretionary 2.3% | | | | |
Internet & Catalog Retail | | | | |
eBay, Inc.* | | 49,300 | | 5,732,604 |
| | | | |
|
Health Care 0.9% | | | | |
Health Care Equipment & Supplies | | | | |
Waters Corp.* | | 48,100 | | 2,250,599 |
| | | | |
|
Information Technology 88.3% | | | | |
Communications Equipment 17.0% | | | | |
Avocent Corp.* | | 97,000 | | 3,930,440 |
Cisco Systems, Inc.* | | 441,600 | | 8,522,880 |
Comverse Technologies, Inc.* | | 54,800 | | 1,339,860 |
Corning, Inc.* | | 398,100 | | 4,685,637 |
LG Electronics, Inc.* | | 39,400 | | 2,439,664 |
Motorola, Inc. | | 497,084 | | 8,549,845 |
QUALCOMM, Inc. | | 198,816 | | 8,429,798 |
Scientific-Atlanta, Inc. | | 125,000 | | 4,126,250 |
| | | | |
|
| | | | | 42,024,374 |
| | | | |
|
Computers & Peripherals 18.0% | | | | |
ATI Technologies, Inc.* (d) | | 185,700 | | 3,600,723 |
Dell, Inc.* | | 85,175 | | 3,589,275 |
EMC Corp.* | | 882,300 | | 13,119,801 |
Hewlett-Packard Co. | | 123,652 | | 2,592,982 |
International Business Machines Corp. | | 53,700 | | 5,293,746 |
Lexmark International, Inc. “A”* | | 51,125 | | 4,345,625 |
QLogic Corp.* | | 87,700 | | 3,221,221 |
Quanta Computer, Inc. | | 1,771,053 | | 3,185,548 |
Research In Motion Ltd.* | | 65,200 | | 5,373,784 |
| | | | |
|
| | | | | 44,322,705 |
| | | | |
|
Page 214 of 466
| | | | |
Electronic Equipment & Instruments 3.8% | | | | |
Agilent Technologies, Inc.* | | 103,022 | | 2,482,830 |
Flextronics International Ltd.* | | 293,800 | | 4,060,316 |
Tektronix, Inc. | | 90,800 | | 2,743,068 |
| | | | |
|
| | | | | 9,286,214 |
| | | | |
|
Internet Software & Services 3.2% | | | | |
Check Point Software Technologies Ltd.* | | 154,400 | | 3,802,872 |
Yahoo!, Inc.* | | 110,900 | | 4,178,712 |
| | | | |
|
| | | | | 7,981,584 |
| | | | |
|
IT Consulting & Services 6.5% | | | | |
Accenture Ltd. “A”* | | 163,900 | | 4,425,300 |
Affiliated Computer Services, Inc. “A”* | | 59,500 | | 3,581,305 |
Convergys Corp.* | | 164,800 | | 2,470,352 |
Paychex, Inc. | | 160,008 | | 5,453,073 |
| | | | |
|
| | | | | 15,930,030 |
| | | | |
|
| | |
| | | Shares
| | Value ($)
|
Semiconductors & Semiconductor Equipment 18.1% | | | | |
Agere Systems, Inc. “B”* | | 351,100 | | 473,985 |
Altera Corp.* | | 120,200 | | 2,488,140 |
ASML Holding NV* (d) | | 92,737 | | 1,475,446 |
Broadcom Corp. “A”* | | 146,658 | | 4,734,120 |
Cypress Semiconductor Corp.* (d) | | 342,400 | | 4,016,352 |
Intel Corp. | | 384,389 | | 8,990,859 |
Linear Technology Corp. | | 66,940 | | 2,594,594 |
Maxim Integrated Products, Inc. | | 81,937 | | 3,473,309 |
Microchip Technology, Inc. (d) | | 126,100 | | 3,361,826 |
National Semiconductor Corp. | | 338,700 | | 6,079,665 |
Samsung Electronics Co., Ltd. | �� | 5,770 | | 2,510,998 |
Xilinx, Inc. | | 153,000 | | 4,536,450 |
| | | | |
|
| | | | | 44,735,744 |
| | | | |
|
Software 21.7% | | | | |
Amdocs Ltd.* | | 80,600 | | 2,115,750 |
BEA Systems, Inc.* (d) | | 499,858 | | 4,428,742 |
Electronic Arts, Inc.* | | 24,200 | | 1,492,656 |
Intuit, Inc.* | | 75,813 | | 3,336,530 |
Mercury Interactive Corp.* | | 41,600 | | 1,894,880 |
Microsoft Corp. | | 744,446 | | 19,884,152 |
Oracle Corp.* | | 795,500 | | 10,914,260 |
TIBCO Software, Inc.* | | 215,600 | | 2,876,104 |
VERITAS Software Corp.* | | 224,856 | | 6,419,640 |
| | | | |
|
| | | | | 53,362,714 |
| | | | |
|
Total Common Stocks (Cost $187,696,941) | | | | 225,626,568 |
| | | | |
|
Securities Lending Collateral 2.3% | | | | |
Daily Assets Fund Institutional, 2.25%(c)(e) (Cost $5,561,905) | | 5,561,905 | | 5,561,905 |
| | | | |
|
Cash Equivalents 9.0% | | | | |
Scudder Cash Management QP Trust, 2.24% (b) (Cost $22,140,384) | | 22,140,384 | | 22,140,384 |
| | | | |
|
Page 215 of 466
| | | | | | |
| | | % of Net Assets
| | | Value ($)
| |
Total Investment Portfolio (Cost $215,399,230) (a) | | 102.8 | | | 253,328,857 | |
| | | | | |
|
|
Other Assets and Liabilities | | (2.8 | ) | | (6,895,317 | ) |
| | | | | |
|
|
Net Assets | | 100.0 | | | 246,433,540 | |
| | | | | |
|
|
Notes to Scudder Technology Growth Portfolio
| * | Non-income producing security. |
| (a) | The cost for federal income tax purposes was $239,836,561. At December 31, 2004, net unrealized appreciation for all securities based on tax cost was $13,492,296. This consisted of aggregate gross unrealized appreciation for all securities in which there was an excess of value over tax cost of $30,153,678 and aggregate gross unrealized depreciation for all securities in which there was an excess of tax cost over value of $16,661,382. |
| (b) | Scudder Cash Management QP Trust is managed by Deutsche Investment Management Americas Inc. The rate shown is the annualized seven-day yield at period end. |
| (c) | Daily Assets Fund Institutional, an affiliated Fund, is managed by Deutsche Asset Management, Inc. The rate shown is the seven-day yield at period end. |
| (d) | All or a portion of these securities were on loan (see Notes to Financial Statements). The value of all securities loaned at December 31, 2004 amounted to $5,445,750 which is 2.2% of total net assets. |
| (e) | Represents collateral held in connection with securities lending. |
At December 31, 2004, open written options were as follows:
| | | | | | | | |
Written Options
| | Contracts
| | Expiration Date
| | Strike Price
| | Value ($)
|
Call Options | | | | | | | | |
eBay, Inc. | | 80 | | 1/22/2005 | | 115.00 | | 36,000 |
Mercury Interactive Corp. | | 416 | | 1/22/2005 | | 47.50 | | 33,280 |
TIBCO Software, Inc. | | 433 | | 2/19/2005 | | 12.50 | | 67,115 |
VERITAS Software Corp. | | 903 | | 1/22/2005 | | 30.00 | | 54,180 |
Put Options | | | | | | | | |
Electronic Arts, Inc. | | 242 | | 1/22/2005 | | 57.50 | | 15,730 |
| | | | | | | | |
|
Total outstanding written options (Premiums received $332,731) | | | | | | | | 206,305 |
| | | | | | | | |
|
The accompanying notes are an integral part of the financial statements.
Page 216 of 466
Financial Statements
Statement of Assets and Liabilities as of December 31, 2004
| | | | |
Assets | | | | |
Investments: | | | | |
Investments in securities, at value (cost $187,696,941) — including $5,445,750 of securities loaned | | $ | 225,626,568 | |
Investment in Daily Assets Fund Institutional (cost $5,561,905)* | | | 5,561,905 | |
Investment in Scudder Cash Management QP Trust (cost $22,140,384) | | | 22,140,384 | |
| | |
|
|
|
Total investments in securities, at value (cost $215,399,230) | | | 253,328,857 | |
| | |
|
|
|
Cash | | | 27,131 | |
Foreign currency, at value (cost $104,015) | | | 111,288 | |
Receivable for investments sold | | | 352,259 | |
Dividends receivable | | | 120,147 | |
Interest receivable | | | 35,459 | |
Receivable for Portfolio shares sold | | | 517,044 | |
Foreign taxes recoverable | | | 274 | |
Other assets | | | 7,272 | |
| | |
|
|
|
Total assets | | | 254,499,731 | |
| | |
|
|
|
Liabilities | | | | |
Payable for investments purchased | | | 1,851,702 | |
Payable for Portfolio shares redeemed | | | 190,668 | |
Payable upon return of securities loaned | | | 5,561,905 | |
Written options, at value (premiums received $332,731) | | | 206,305 | |
Accrued management fee | | | 154,431 | |
Other accrued expenses and payables | | | 101,180 | |
| | |
|
|
|
Total liabilities | | | 8,066,191 | |
| | |
|
|
|
Net assets, at value | | $ | 246,433,540 | |
| | |
|
|
|
Net Assets | | | | |
Net assets consist of: | | | | |
Undistributed net investment income | | $ | 950,616 | |
Net unrealized appreciation (depreciation) on: | | | | |
Investments | | | 37,929,627 | |
Written options | | | 126,426 | |
Foreign currency related transactions | | | 7,714 | |
Accumulated net realized gain (loss) | | | (284,804,711 | ) |
Paid-in capital | | | 492,223,868 | |
| | |
|
|
|
Net assets, at value | | $ | 246,433,540 | |
| | |
|
|
|
Class A | | | | |
Net Asset Value, offering and redemption price per share ($230,078,244 ÷ 25,536,462 outstanding shares of beneficial interest, $.01 par value, unlimited number of shares authorized) | | $ | 9.01 | |
| | |
|
|
|
Class B | | | | |
Net Asset Value, offering and redemption price per share ($16,355,296 ÷ 1,832,122 outstanding shares of beneficial interest, $.01 par value, unlimited number of shares authorized) | | $ | 8.93 | |
| | |
|
|
|
| * | Represents collateral on securities loaned. |
Page 217 of 466
Statement of Operations for the year ended December 31, 2004
| | | | |
Investment Income | | | | |
Income: | | | | |
Dividends (net of foreign taxes withheld of $42,228) | | $ | 2,956,147 | |
Interest — Scudder Cash Management QP Trust | | | 113,602 | |
Securities lending income, including income from Daily Assets Fund Institutional | | | 12,349 | |
| | |
|
|
|
Total Income | | | 3,082,098 | |
| | |
|
|
|
Expenses: | | | | |
Management fee | | | 1,826,919 | |
Custodian and accounting fees | | | 97,218 | |
Distribution service fees (Class B) | | | 34,701 | |
Record keeping fees (Class B) | | | 18,084 | |
Auditing | | | 37,107 | |
Legal | | | 14,160 | |
Trustees’ fees and expenses | | | 6,806 | |
Reports to shareholders | | | 26,613 | |
Other | | | 20,030 | |
| | |
|
|
|
Total expenses, before expense reductions | | | 2,081,638 | |
| | |
|
|
|
Expense reductions | | | (2,610 | ) |
| | |
|
|
|
Total expenses, after expense reductions | | | 2,079,028 | |
| | |
|
|
|
Net investment income (loss) | | | 1,003,070 | |
| | |
|
|
|
Realized and Unrealized Gain (Loss) on Investment Transactions | | | | |
Net realized gain (loss) from: | | | | |
Investments | | | 12,475,351 | |
Written options | | | 2,227,923 | |
Foreign currency related transactions | | | (12,526 | ) |
| | | | 14,690,748 | |
Net unrealized appreciation (depreciation) during the period on: | | | | |
Investments | | | (13,058,442 | ) |
Written options | | | 126,426 | |
Foreign currency related transactions | | | 7,714 | |
| | | | (12,924,302 | ) |
| | |
|
|
|
Net gain (loss) on investment transactions | | | 1,766,446 | |
| | |
|
|
|
Net increase (decrease) in net assets resulting from operations | | $ | 2,769,516 | |
| | |
|
|
|
The accompanying notes are an integral part of the financial statements.
Page 218 of 466
Statement of Changes in Net Assets
| | | | | | | | |
| | | Years Ended December 31,
| |
| | | 2004
| | | 2003
| |
Increase (Decrease) in Net Assets | | | | | | | | |
Operations: | | | | | | | | |
Net investment income (loss) | | $ | 1,003,070 | | | $ | (1,109,123 | ) |
Net realized gain (loss) | | | 14,690,748 | | | | (64,854,046 | ) |
Net unrealized appreciation (depreciation) on investment transactions during the period | | | (12,924,302 | ) | | | 148,935,889 | |
Net increase (decrease) in net assets resulting from operations | | | 2,769,516 | | | | 82,972,720 | |
Portfolio share transactions: | | | | | | | | |
| | |
Class A | | | | | | | | |
Proceeds from shares sold | | | 32,575,554 | | | | 51,551,950 | |
Cost of shares redeemed | | | (61,621,741 | ) | | | (94,728,478 | ) |
Net increase (decrease) in net assets from Class A share transactions | | | (29,046,187 | ) | | | (43,176,528 | ) |
| | |
Class B | | | | | | | | |
Proceeds from shares sold | | | 7,002,084 | | | | 9,021,390 | |
Cost of shares redeemed | | | (1,720,967 | ) | | | (349,231 | ) |
Net increase (decrease) in net assets from Class B share transactions | | | 5,281,117 | | | | 8,672,159 | |
Increase (decrease) in net assets | | | (20,995,554 | ) | | | 48,468,351 | |
Net assets at beginning of period | | | 267,429,094 | | | | 218,960,743 | |
| | |
|
|
| |
|
|
|
Net assets at end of period (including undistributed net investment income and accumulated net investment loss of $950,616 and $2,800, respectively) | | $ | 246,433,540 | | | $ | 267,429,094 | |
| | |
|
|
| |
|
|
|
Other Information | | | | | | | | |
| | |
Class A | | | | | | | | |
Shares outstanding at beginning of period | | | 29,035,542 | | | | 36,318,161 | |
Shares sold | | | 3,753,123 | | | | 7,017,960 | |
Shares redeemed | | | (7,252,203 | ) | | | (14,300,579 | ) |
Net increase (decrease) in Portfolio shares | | | (3,499,080 | ) | | | (7,282,619 | ) |
| | |
|
|
| |
|
|
|
Shares outstanding at end of period | | | 25,536,462 | | | | 29,035,542 | |
| | |
|
|
| |
|
|
|
| | |
Class B | | | | | | | | |
Shares outstanding at beginning of period | | | 1,217,540 | | | | 51,379 | |
Shares sold | | | 821,254 | | | | 1,206,790 | |
Shares redeemed | | | (206,672 | ) | | | (40,629 | ) |
Net increase (decrease) in Portfolio shares | | | 614,582 | | | | 1,166,161 | |
| | |
|
|
| |
|
|
|
Shares outstanding at end of period | | | 1,832,122 | | | | 1,217,540 | |
| | |
|
|
| |
|
|
|
The accompanying notes are an integral part of the financial statements.
Page 219 of 466
Financial Highlights
Class A
| | | | | | | | | | | | | | | | | | | |
Years Ended December 31,
| | 2004
| | 2003
| | | 2002
| | | 2001
| | | 2000a
| |
Selected Per Share Data | | | | | | | | | | | | | | | | | | | |
Net asset value, beginning of period | | $ | 8.84 | | $ | 6.02 | | | $ | 9.36 | | | $ | 13.87 | | | $ | 17.77 | |
| | |
|
| |
|
|
| |
|
|
| |
|
|
| |
|
|
|
Income (loss) from investment operations: | | | | | | | | | | | | | | | | | | | |
Net investment income (loss)b | | | .04 | | | (.04 | ) | | | (.03 | ) | | | .01 | | | | .04 | |
Net realized and unrealized gain (loss) on investment transactions | | | .13 | | | 2.86 | | | | (3.30 | ) | | | (4.50 | ) | | | (3.84 | ) |
Total from investment operations | | | .17 | | | 2.82 | | | | (3.33 | ) | | | (4.49 | ) | | | (3.80 | ) |
Less distributions from: | | | | | | | | | | | | | | | | | | | |
Net investment income | | | — | | | — | | | | (.01 | ) | | | (.02 | ) | | | — | |
Net realized gains on investment transactions | | | — | | | — | | | | — | | | | — | | | | (.10 | ) |
| | |
|
| |
|
|
| |
|
|
| |
|
|
| |
|
|
|
Total distributions | | | — | | | — | | | | (.01 | ) | | | (.02 | ) | | | (.10 | ) |
| | |
|
| |
|
|
| |
|
|
| |
|
|
| |
|
|
|
Net asset value, end of period | | $ | 9.01 | | $ | 8.84 | | | $ | 6.02 | | | $ | 9.36 | | | $ | 13.87 | |
| | |
|
| |
|
|
| |
|
|
| |
|
|
| |
|
|
|
Total Return (%) | | | 1.92 | | | 46.84 | | | | (35.52 | ) | | | (32.39 | ) | | | (21.57 | ) |
| | |
|
| |
|
|
| |
|
|
| |
|
|
| |
|
|
|
Ratios to Average Net Assets and Supplemental Data | | | | | | | | | | | | | | | | | | | |
Net assets, end of period ($ millions) | | | 230 | | | 257 | | | | 219 | | | | 351 | | | | 270 | |
Ratio of expenses (%) | | | .83 | | | .86 | | | | .80 | | | | .81 | | | | .82 | |
Ratio of net investment income (loss) (%) | | | .43 | | | (.50 | ) | | | (.37 | ) | | | .12 | | | | .21 | |
Portfolio turnover rate (%) | | | 112 | | | 66 | | | | 64 | | | | 56 | | | | 107 | |
| a | On June 18, 2001, the Portfolio implemented a 1 for 10 reverse stock split. Per share information, for the periods prior to December 31, 2001, has been restated to reflect the effect of the split. Shareholders received 1 share for every 10 shares owned and net asset value per share increased correspondingly. |
| b | Based on average shares outstanding during the period. |
Class B
| | | | | | | | | | | |
Years Ended December 31,
| | 2004
| | 2003
| | | 2002a
| |
Selected Per Share Data | | | | | | | | | | | |
Net asset value, beginning of period | | $ | 8.80 | | $ | 6.01 | | | $ | 6.32 | |
| | |
|
| |
|
|
| |
|
|
|
Income (loss) from investment operations: | | | | | | | | | | | |
Net investment income (loss)b | | | .01 | | | (.07 | ) | | | (.02 | ) |
Net realized and unrealized gain (loss) on investment transactions | | | .12 | | | 2.86 | | | | (.29 | ) |
| | |
|
| |
|
|
| |
|
|
|
Total from investment operations | | | .13 | | | 2.79 | | | | (.31 | ) |
| | |
|
| |
|
|
| |
|
|
|
Net asset value, end of period | | $ | 8.93 | | $ | 8.80 | | | $ | 6.01 | |
| | |
|
| |
|
|
| |
|
|
|
Total Return (%) | | | 1.48 | | | 46.42 | | | | (4.75 | )** |
| | |
|
| |
|
|
| |
|
|
|
Ratios to Average Net Assets and Supplemental Data | | | | | | | | | | | |
Net assets, end of period ($ millions) | | | 16 | | | 11 | | | | .3 | |
Ratio of expenses before expense reductions (%) | | | 1.22 | | | 1.25 | | | | 1.06 | * |
Ratio of expenses after expense reductions (%) | | | 1.21 | | | 1.25 | | | | 1.06 | * |
Ratio of net investment income (loss) (%) | | | .05 | | | (.89 | ) | | | (.79 | )* |
Portfolio turnover rate (%) | | | 112 | | | 66 | | | | 64 | |
| a | For the period from July 1, 2002 (commencement of operations of Class B shares) to December 31, 2002. |
| b | Based on average shares outstanding during the period. |
Page 220 of 466
Information About Your Portfolio’s Expenses
Scudder Templeton Foreign Value Portfolio
As an investor of the Portfolio, you incur two types of costs: ongoing expenses and transaction costs. Ongoing expenses include management fees, distribution and service (12b-1) fees and other Portfolio expenses. Examples of transaction costs include sales charges (loads), redemption fees and account maintenance fees, which are not shown in this section. The following tables are intended to help you understand your ongoing expenses (in dollars) of investing in the Portfolio and to help you compare these expenses with the ongoing expenses of investing in other mutual funds. In the most recent six-month period, the Portfolio limited these expenses; had it not done so, expenses would have been higher. The tables are based on an investment of $1,000 made at the beginning of the period (November 15, 2004) ended December 31, 2004.
The tables illustrate your Portfolio’s expenses in two ways:
Actual Portfolio Return. This helps you estimate the actual dollar amount of ongoing expenses (but not transaction costs) paid on a $1,000 investment in the Portfolio using the Portfolio’s actual return during the period. To estimate the expenses you paid over the period, simply divide your account value by $1,000 (for example, an $8,600 account value divided by $1,000 = 8.6), then multiply the result by the number in the “Expenses Paid per $1,000” line under the share class you hold.
Hypothetical 5% Portfolio Return. This helps you to compare your Portfolio’s ongoing expenses (but not transaction costs) with those of other mutual funds using the Portfolio’s actual expense ratio and a hypothetical rate of return of 5% per year before expenses. Examples using a 5% hypothetical Portfolio return may be found in the shareholder reports of other mutual funds. The hypothetical account values and expenses may not be used to estimate the actual ending account balance or expenses you paid for the period.
Please note that the expenses shown in these tables are meant to highlight your ongoing expenses only and do not reflect any transaction costs. The “Expenses Paid per $1,000” line of the tables is useful in comparing ongoing expenses only and will not help you determine the relative total expense of owning different funds. If these transaction costs had been included, your costs would have been higher.
Expenses and Value of a $1,000 Investment for the period ended December 31, 2004
| | | | | | |
Actual Portfolio Return
| | Class A
| | Class B
|
Beginning Account Value 11/15/04 | | $ | 1,000.00 | | $ | 1,000.00 |
Ending Account Value 12/31/04 | | $ | 1,056.00 | | $ | 1,056.00 |
Expenses Paid per $1,000* | | $ | 1.47 | | $ | 1.73 |
| | |
Hypothetical 5% Portfolio Return
| | Class A
| | Class B
|
Beginning Account Value 11/15/04 | | $ | 1,000.00 | | $ | 1,000.00 |
Ending Account Value 12/31/04 | | $ | 1,004.87 | | $ | 1,004.62 |
Expenses Paid per $1,000* | | $ | 1.43 | | $ | 1.69 |
| * | Expenses are equal to the Portfolio’s annualized expense ratio for each share class, multiplied by the average account value over the period, multiplied by the number of days since the commencement of the class (November 15, 2004), then divided by 365. |
Page 221 of 466
| | | | | | |
Annualized Expense Ratios
| | Class A
| | | Class B
| |
Scudder Variable Series II — Scudder Templeton Foreign Value Portfolio | | 1.14 | % | | 1.34 | % |
For more information, please refer to the Portfolio’s prospectus.
Management Summary December 31, 2004
Scudder Templeton Foreign Value Portfolio
Global equity markets ended 2004 on a positive note. They registered the second consecutive year of strong gains, after three years of declines. In the fourth quarter, a broad-based rally in global markets changed the pattern of relatively flat returns that characterized the earlier part of 2004. Increasing energy prices had impacted the outlook for global inflation and corporate profit growth for most of the past year. However, investors saw hope of stabilization. In addition, investor sentiment improved because the previously feared hard landing in the Chinese economy appeared unlikely and the US presidential election ended without incident. These factors contributed to the year-end rally.
Against this macroeconomic background, the portfolio posted a return of 5.6% (Class A shares, unadjusted for contract charges) for the period since inception (November 15, 2004) to December 31, 2004 versus the MSCI AC World ex US Index return of 6.1%. The portfolio benefited from strong stock selection in energy and healthcare sectors, with contributors to return in these sectors including Repsol YPF, SA in Spain, ENI SpA in Italy and GlaxoSmithKline in the United Kingdom. On the contrary, stock selection lagged in telecommunication services and industrials sectors during the period. Weak performers included BAE Systems and Rolls-Royce Group in the United Kingdom.
In summary, we believe the economic and corporate framework has remained positive for global equity markets. However, at this stage in the economic cycle (the current recovery is about three and a half years old) it should not be surprising to see a pause. At Templeton our investment focus has always centered on individual companies and longer-term returns. We are confident that regardless of the macroeconomic climate we might encounter in 2005, we should continue to find “bargain” securities. This has been our experience for more than sixty years.
Antonio Docal, CFA
Lead Portfolio Manager
Templeton Investment Counsel LLC, Subadvisor to the Portfolio
All performance shown is historical, assumes reinvestment of all dividends and capital gains, and does not guarantee future results. Investment return and principal value fluctuate with changing market conditions so that, when redeemed, shares may be worth more or less than their original cost. Current performance may be lower or higher than the performance data quoted. Please visit scudder.com for the product’s most recent month-end performance. Performance doesn’t reflect charges and fees (“contract charges”) associated with the separate account that invests in the portfolio or any variable life insurance policy or variable annuity contract for which the portfolio is an investment option. These charges and fees will reduce returns.
Returns during part or all of the periods shown reflect a fee waiver and/or expense reimbursement. Without this waiver/reimbursement, returns would have been lower.
Page 222 of 466
Risk Considerations
The portfolio is subject to stock market and equity risks, meaning stocks in the portfolio may decline in value for extended periods of time due to the activities and financial prospects of individual companies, or due to general market and economic conditions. Please read this portfolio’s prospectus for specific details regarding its investments and risk profile.
The MSCI ACWI (All Country World Index) World ex US IndexSM is a free float-adjusted market capitalization index that is designed to measure equity market performance in the global developed and emerging markets. As of December 2003 the MSCI ACWI ex US consisted of the following 48 developed and emerging market country indices: Argentina, Australia, Austria, Belgium, Brazil, Canada, Chile, China, Colombia, Czech Republic, Denmark, Egypt, Finland, France, Germany, Greece, Hong Kong, Hungary, India, Indonesia, Ireland, Israel, Italy, Japan, Jordan, Korea, Malaysia, Mexico, Morocco, Netherlands, New Zealand, Norway, Pakistan, Peru, Philippines, Poland, Portugal, Russia, Singapore Free, South Africa, Spain, Sweden, Switzerland, Taiwan, Thailand, Turkey, the United Kingdom, and Venezuela. The index is calculated using closing local market prices and converts to US dollars using the London close foreign exchange rates. Index returns assume reinvestment of all distributions and do not reflect fees or expenses. It is not possible to invest directly into an index.
Portfolio management market commentary is as of December 31, 2004, and may not come to pass. This information is subject to change at any time based on market and other conditions.
Portfolio Summary
Scudder Templeton Foreign Value Portfolio
| | | |
Asset Allocation
| | 12/31/04
| |
Common Stocks | | 95 | % |
Cash Equivalents | | 5 | % |
| | |
|
|
| | | 100 | % |
| | |
|
|
| | | |
Sector Diversification (Excludes Cash Equivalents)
| | 12/31/04
| |
Financials | | 23 | % |
Industrials | | 14 | % |
Consumer Discretionary | | 13 | % |
Materials | | 11 | % |
Telecommunication Services | | 10 | % |
Energy | | 7 | % |
Information Technology | | 6 | % |
Health Care | | 6 | % |
Utilities | | 5 | % |
Consumer Staples | | 5 | % |
| | |
|
|
| | | 100 | % |
| | |
|
|
| | | |
Geographical (Excludes Cash Equivalents)
| | 12/31/04
| |
Europe (excluding United Kingdom) | | 44 | % |
United kingdom | | 24 | % |
Japan | | 11 | % |
Pacific Basin | | 10 | % |
Latin America | | 2 | % |
Australia | | 3 | % |
Other | | 6 | % |
| | |
|
|
| | | 100 | % |
| | |
|
|
Page 223 of 466
Asset allocation, sector diversification and geographical are subject to change.
For more complete details about the Portfolio’s investment portfolio, see page 45. A quarterly Fact Sheet is available upon request. Information concerning portfolio holdings of the Portfolio as of month end will be posted to scudder.com on the 15th of the following month.
Following the Portfolio’s fiscal first and third quarter-end, a complete portfolio holdings listing is filed with the SEC on Form N-Q. The form will be available on the SEC’s Web site at www.sec.gov, and it also may be reviewed and copied at the SEC’s Public Reference Room in Washington, D.C. Information on the operation of the SEC’s Public Reference Room may be obtained by calling (800) SEC-0330.
Investment Portfolio December 31, 2004
Scudder Templeton Foreign Value Portfolio
| | | | |
| | | Shares
| | Value ($)
|
Common Stocks 94.3% | | | | |
Australia 3.0% | | | | |
Alumina Ltd. | | 8,590 | | 39,998 |
AMP Ltd. | | 9,130 | | 51,960 |
National Australia Bank Ltd. | | 3,410 | | 77,039 |
| | | | |
|
(Cost $160,468) | | | | 168,997 |
| | | | |
|
Bermuda 1.0% | | | | |
ACE Ltd. (Cost $49,604) | | 1,280 | | 54,720 |
| | | | |
|
Brazil 1.3% | | | | |
Companhia Vale do Rio Doce (ADR) | | 1,230 | | 29,988 |
Empresa Brasiliera de Aeronautica SA (ADR) | | 1,330 | | 44,475 |
| | | | |
|
(Cost $62,913) | | | | 74,463 |
| | | | |
|
Canada 1.8% | | | | |
Alcan, Inc. | | 970 | | 47,603 |
BCE, Inc. | | 2,090 | | 50,447 |
| | | | |
|
(Cost $100,222) | | | | 98,050 |
| | | | |
|
Cayman Island 0.9% | | | | |
XL Capital Ltd. “A” (Cost $50,432) | | 670 | | 52,025 |
| | | | |
|
Denmark 0.4% | | | | |
ISS AS (Cost $24,943) | | 430 | | 24,004 |
| | | | |
|
Finland 2.4% | | | | |
Stora Enso Oyj | | 4,510 | | 68,885 |
UPM-Kymmene Oyj | | 2,980 | | 66,267 |
| | | | |
|
(Cost $129,302) | | | | 135,152 |
| | | | |
|
France 6.2% | | | | |
Accor SA | | 580 | | 25,393 |
Axa | | 2,150 | | 53,129 |
Page 224 of 466
| | | | |
Compagnie Generale des Etablissements Michelin “B” | | 640 | | 41,052 |
Sanofi-Aventis | | 1,020 | | 81,522 |
Suez SA | | 1,620 | | 43,203 |
Total SA | | 290 | | 63,345 |
Valeo SA | | 900 | | 37,678 |
| | | | |
|
(Cost $324,155) | | | | 345,322 |
| | | | |
|
Germany 6.9% | | | | |
BASF AG | | 1,350 | | 97,254 |
Bayer AG | | 2,010 | | 68,138 |
Deutsche Post AG | | 3,940 | | 90,507 |
E.ON AG | | 900 | | 82,036 |
Volkswagen AG | | 990 | | 44,878 |
| | | | |
|
(Cost $354,100) | | | | 382,813 |
| | | | |
|
Hong Kong 2.7% | | | | |
Cheung Kong (Holdings) Ltd. | | 6,000 | | 60,018 |
Hutchison Whampoa Ltd. | | 5,000 | | 46,798 |
Swire Pacific Ltd. “A” | | 5,000 | | 41,813 |
| | | | |
|
(Cost $132,553) | | | | 148,629 |
| | | | |
|
Israel 1.0% | | | | |
Check Point Software Technologies Ltd. (Cost $49,704) | | 2,160 | | 53,201 |
| | | | |
|
| | |
| | | Shares
| | Value ($)
|
Italy 2.4% | | | | |
Eni SpA | | 3,120 | | 78,117 |
Riunione Adriatica di Sicurta SpA | | 2,360 | | 53,378 |
| | | | |
|
(Cost $123,973) | | | | 131,495 |
| | | | |
|
Japan 10.2% | | | | |
East Japan Railway Co. | | 12 | | 66,751 |
Fuji Photo Film Co., Ltd. | | 1,100 | | 40,148 |
Hitachi Ltd. | | 8,000 | | 55,431 |
KDDI Corp. | | 6 | | 32,322 |
NEC Corp. | | 7,000 | | 43,515 |
Nintendo Co., Ltd. | | 400 | | 50,239 |
Nippon Telegraph & Telephone Corp. | | 14 | | 62,848 |
Nomura Holdings, Inc. | | 3,000 | | 43,740 |
Olympus Corp. | | 1,000 | | 21,323 |
Sompo Japan Insurance, Inc. | | 5,000 | | 50,942 |
Sony Corp. | | 1,700 | | 65,697 |
Takeda Chemical Industries, Ltd. | | 700 | | 35,249 |
| | | | |
|
(Cost $536,587) | | | | 568,205 |
| | | | |
|
Korea 4.7% | | | | |
Kookmin Bank (ADR) | | 990 | | 38,689 |
Korea Electric Power Corp. (ADR) | | 2,050 | | 27,142 |
POSCO (ADR) | | 610 | | 27,163 |
Samsung Electronics Co., Ltd. (GDR), 144A | | 530 | | 116,070 |
Page 225 of 466
| | | | |
SK Telecom Co., Ltd. (ADR) | | 2,250 | | 50,063 |
| | | | |
|
(Cost $246,948) | | | | 259,127 |
| | | | |
|
Mexico 1.0% | | | | |
Telefonos de Mexico SA de CV “L”, (ADR) (Cost $49,754) | | 1,380 | | 52,882 |
| | | | |
|
Netherlands 7.1% | | | | |
Akzo Nobel NV | | 1,550 | | 66,112 |
ING Groep NV | | 3,210 | | 97,125 |
Koninklijke (Royal) Philips Electronics NV | | 2,940 | | 77,966 |
Reed Elsevier NV | | 2,720 | | 37,082 |
Unilever NV | | 1,000 | | 67,052 |
Wolters Kluwer NV | | 2,520 | | 50,592 |
| | | | |
|
(Cost $372,976) | | | | 395,929 |
| | | | |
|
Norway 1.5% | | | | |
Norske Skogindustrier ASA | | 1,450 | | 31,362 |
Telenor ASA | | 5,800 | | 52,670 |
| | | | |
|
(Cost $78,387) | | | | 84,032 |
| | | | |
|
Portugal 1.0% | | | | |
Portugal Telecom SGPS SA (Registered) (Cost $49,550) | | 4,280 | | 52,940 |
| | | | |
|
Singapore 0.9% | | | | |
DBS Group Holdings Ltd. (Cost $49,727) | | 5,000 | | 49,314 |
| | | | |
|
Spain 5.3% | | | | |
Banco Popular Espanol SA | | 850 | | 56,035 |
Endesa SA | | 1,170 | | 27,496 |
Iberdrola SA | | 2,210 | | 56,174 |
| | |
| | | Shares
| | Value ($)
|
Repsolf YPF SA | | 3,310 | | 86,203 |
Telefonica SA (ADR)* | | 1,230 | | 69,495 |
| | | | |
|
(Cost $259,579) | | | | 295,403 |
| | | | |
|
Sweden 4.7% | | | | |
Atlas Copco AB “A” | | 1,130 | | 51,013 |
Nordea Bank AB | | 9,450 | | 95,276 |
Securitas AB “B” | | 3,940 | | 67,590 |
Volvo AB “B” | | 1,240 | | 49,168 |
| | | | |
|
(Cost $247,891) | | | | 263,047 |
| | | | |
|
Switzerland 4.0% | | | | |
Lonza Group AG (Registered) | | 690 | | 38,836 |
Nestle SA (Registered) | | 240 | | 62,791 |
Swiss Re (Registered) | | 740 | | 52,778 |
UBS AG (Registered) | | 780 | | 65,406 |
| | | | |
|
(Cost $211,475) | | | | 219,811 |
| | | | |
|
Taiwan 1.5% | | | | |
Chunghwa Telecom Co., Ltd. (ADR) | | 1,920 | | 40,416 |
Compal Electronics, Inc. (GDR), 144A | | 8,540 | | 42,444 |
| | | | |
|
(Cost $80,647) | | | | 82,860 |
| | | | |
|
Page 226 of 466
| | | | |
United Kingdom 22.4% | | | | |
Alliance Unichem PLC | | 3,000 | | 43,457 |
BAE Systems PLC | | 13,350 | | 59,079 |
Boots Group PLC | | 4,050 | | 50,969 |
BP PLC | | 7,550 | | 73,636 |
British Airways PLC* | | 8,840 | | 39,884 |
British Sky Broadcasting Group PLC | | 6,080 | | 65,602 |
Cadbury Schweppes PLC | | 6,720 | | 62,574 |
| | |
| | | Shares
| | Value ($)
|
Compass Group PLC | | 11,220 | | 53,046 |
GKN PLC | | 5,680 | | 25,790 |
GlaxoSmithKline PLC | | 2,850 | | 66,865 |
HSBC Holdings PLC | | 2,800 | | 47,911 |
Lloyds TSB Group PLC | | 7,740 | | 70,288 |
National Grid Transco PLC | | 4,370 | | 41,614 |
Pearson PLC | | 4,210 | | 50,800 |
Rentokil Initial PLC | | 23,320 | | 66,151 |
Rolls-Royce Group PLC | | 12,680 | | 60,131 |
Royal Bank of Scotland Group PLC | | 2,900 | | 97,546 |
Shell Transport & Trading Co., PLC | | 7,610 | | 64,870 |
Shire Pharmaceuticals Group PLC* | | 5,080 | | 53,350 |
Smiths Group PLC | | 3,460 | | 54,604 |
Vodafone Group PLC | | 23,780 | | 64,488 |
Yell Group PLC | | 3,260 | | 27,539 |
| | | | |
|
(Cost $1,190,667) | | | | 1,240,194 |
| | | | |
|
Total Common Stocks (Cost $4,936,557) | | | | 5,232,615 |
| | | | |
|
Cash Equivalents 4.8% | | | | |
Scudder Cash Management QP Trust, 2.24% (b) (Cost $267,785) | | 267,785 | | 267,785 |
| | | | |
|
| | |
| | | % of Net Assets
| | Value ($)
|
Total Investment Portfolio (Cost $5,204,342) (a) | | 99.1 | | 5,500,400 |
| | |
| |
|
Other Assets and Liabilities | | 0.9 | | 47,473 |
| | |
| |
|
Net Assets | | 100.0 | | 5,547,873 |
| | |
| |
|
Notes to Scudder Templeton Foreign Value Portfolio
| * | Non-income producing security. |
| (a) | The cost for federal income tax purposes was $5,207,475. At December 31, 2004, net unrealized appreciation for all securities based on tax cost was $292,925. This consisted of aggregate gross unrealized appreciation for all securities in which there was an excess of value over tax cost of $307,528 and aggregate gross unrealized depreciation for all securities in which there was an excess of tax cost over value of $14,603. |
| (b) | Scudder Cash Management QP Trust is managed by Deutsche Investment Management Americas Inc. The rate shown is the annualized seven-day yield at period end. |
ADR: American Depositary Receipts
Page 227 of 466
GDR: Global Depositary Receipts
144A: Security exempt from registration under Rule 144A of the Securities Act of 1933. These securities may be resold in transactions exempt from registration, normally to qualified institutional buyers.
The accompanying notes are an integral part of the financial statements.
Financial Statements
Statement of Assets and Liabilities
as of December 31, 2004
| | | | |
Assets | | | | |
Investments: | | | | |
Investments in securities, at value (cost $4,936,557) | | $ | 5,232,615 | |
Scudder Cash Management QP Trust (cost $267,785) | | | 267,785 | |
| | |
|
|
|
Total investments in securities, at value (cost $5,204,342) | | | 5,500,400 | |
| | |
|
|
|
Dividends receivable | | | 7,793 | |
Interest receivable | | | 256 | |
Receivable for Portfolio shares sold | | | 64,072 | |
Foreign taxes recoverable | | | 95 | |
Due from Advisor | | | 26,114 | |
| | |
|
|
|
Total assets | | | 5,598,730 | |
| | |
|
|
|
Liabilities | | | | |
Due to custodian bank | | | 16,116 | |
Payable for investments purchased | | | 5,685 | |
Other accrued expenses and payables | | | 29,056 | |
| | |
|
|
|
Total liabilities | | | 50,857 | |
| | |
|
|
|
Net assets, at value | | $ | 5,547,873 | |
| | |
|
|
|
Net Assets | | | | |
Net assets consist of: | | | | |
Accumulated net investment loss | | | (3,133 | ) |
Net unrealized appreciation (depreciation) on: | | | | |
Investments | | | 296,058 | |
Foreign currency related transactions | | | 28 | |
Paid-in capital | | | 5,254,920 | |
| | |
|
|
|
Net assets, at value | | $ | 5,547,873 | |
| | |
|
|
|
Class A | | | | |
| |
Net Asset Value, offering and redemption price per share ($2,641,026 ÷ 250,000 outstanding shares of beneficial interest, $.01 par value, unlimited number of shares authorized) | | $ | 10.56 | |
| | |
|
|
|
Class B | | | | |
| |
Net Asset Value, offering and redemption price per share ($2,906,847 ÷ 275,227 outstanding shares of beneficial interest, $.01 par value, unlimited number of shares authorized) | | $ | 10.56 | |
| | |
|
|
|
Page 228 of 466
Statement of Operations
for the period ended December 31, 2004
| | | | |
Investment Income
| | | |
Income: | | | | |
Dividends (net of foreign taxes withheld of $1,216) | | $ | 8,310 | |
Interest — Scudder Cash Management QP Trust | | | 1,905 | |
| | |
|
|
|
Total Income | | | 10,215 | |
| | |
|
|
|
Expenses: | | | | |
Management fee | | | 6,260 | |
Custodian and accounting fees | | | 14,490 | |
Distribution service fees (Class B) | | | 846 | |
Record keeping fees (Class B) | | | 507 | |
Auditing | | | 24,015 | |
Legal | | | 828 | |
Trustees’ fees and expenses | | | 180 | |
Reports to shareholders | | | 1,012 | |
Offering cost | | | 1,150 | |
Other | | | 720 | |
| | |
|
|
|
Total expenses, before expense reductions | | | 50,008 | |
| | |
|
|
|
Expense reductions | | | (41,813 | ) |
| | |
|
|
|
Total expenses, after expense reductions | | | 8,195 | |
| | |
|
|
|
Net investment income (loss) | | | 2,020 | |
| | |
|
|
|
Realized and Unrealized Gain (Loss) on Investment Transactions | | | | |
Net realized gain (loss) from foreign currency related transactions | | | (8,340 | ) |
Net unrealized appreciation (depreciation) during the period on: | | | | |
Investments | | | 296,058 | |
Foreign currency related transactions | | | 28 | |
| | | | 296,086 | |
| | |
|
|
|
Net gain (loss) on investment transactions | | | 287,746 | |
| | |
|
|
|
Net increase (decrease) in net assets resulting from operations | | $ | 289,766 | |
| | |
|
|
|
The accompanying notes are an integral part of the financial statements.
| | | | |
| Statement of Changes in Net Assets | | | | |
| |
Increase (Decrease) in Net Assets
| | Period Ended
December 31, 2004a
| |
Operations: | | | | |
Net investment income (loss) | | $ | 2,020 | |
Net realized gain (loss) on investment transactions | | | (8,340 | ) |
Net unrealized appreciation (depreciation) on investment transactions during the period | | | 296,086 | |
Net increase (decrease) in net assets resulting from operations | | | 289,766 | |
Page 229 of 466
| | | | |
Portfolio share transactions: | | | | |
| |
Class A | | | | |
Proceeds from shares sold | | | 2,500,000 | |
Net increase (decrease) in net assets from Class A share transactions | | | 2,500,000 | |
| |
Class B | | | | |
Proceeds from shares sold | | | 2,758,419 | |
Cost of shares redeemed | | | (312 | ) |
Net increase (decrease) in net assets from Class B share transactions | | | 2,758,107 | |
Increase (decrease) in net assets | | | 5,547,873 | |
Net assets at beginning of period | | | — | |
| | |
|
|
|
Net assets at end of period (including accumulated net investment loss of $3,133) | | $ | 5,547,873 | |
| | |
|
|
|
Other Information | | | | |
| |
Class A | | | | |
Shares outstanding at beginning of period | | | — | |
Shares sold | | | 250,000 | |
Net increase in Portfolio shares | | | 250,000 | |
| | |
|
|
|
Shares outstanding at end of period | | | 250,000 | |
| | |
|
|
|
| |
Class B | | | | |
Shares outstanding at beginning of period | | | — | |
Shares sold | | | 275,257 | |
Shares redeemed | | | (30 | ) |
Net increase in Portfolio shares | | | 275,227 | |
| | |
|
|
|
Shares outstanding at end of period | | | 275,227 | |
| | |
|
|
|
| a | For the period from November 15, 2004 (commencement of operations) to December 31, 2004. |
The accompanying notes are an integral part of the financial statements.
Page 230 of 466
Financial Highlights
Class A
| | | | |
| | | 2004a
| |
Selected Per Share Data | | | | |
Net asset value, beginning of period | | $ | 10.00 | |
| | |
|
|
|
Income (loss) from investment operations: | | | | |
Net investment income (loss)b | | | .01 | |
Net realized and unrealized gain (loss) on investment transactions | | | .55 | |
| | |
|
|
|
Total from investment operations | | | .56 | |
| | |
|
|
|
Net asset value, end of period | | $ | 10.56 | |
| | |
|
|
|
Total Return (%)c | | | 5.60 | ** |
| | |
|
|
|
Ratios to Average Net Assets and Supplemental Data | | | | |
Net assets, end of period ($ millions) | | | 3 | |
Ratio of expenses before expense reductions (%) | | | 7.34 | * |
Ratio of expenses after expense reductions (%) | | | 1.14 | * |
Ratio of net investment income (loss) (%) | | | .41 | * |
Portfolio turnover rate (%) | | | — | |
| a | For the period from November 15, 2004 (commencement of operations) to December 31, 2004. |
| b | Based on average shares outstanding during the period. |
| c | Total return would have been lower had certain expenses not been reduced. |
Class B
| | | | |
| | | 2004a
| |
Selected Per Share Data | | | | |
Net asset value, beginning of period | | $ | 10.00 | |
| | |
|
|
|
Income (loss) from investment operations: | | | | |
Net investment income (loss)b | | | — | |
Net realized and unrealized gain (loss) on investment transactions | | | .56 | |
| | |
|
|
|
Total from investment operations | | | .56 | |
| | |
|
|
|
Net asset value, end of period | | $ | 10.56 | |
| | |
|
|
|
Total Return (%)c | | | 5.60 | ** |
| | |
|
|
|
Ratios to Average Net Assets and Supplemental Data | | | | |
Net assets, end of period ($ millions) | | | 3 | |
Ratio of expenses before expense reductions (%) | | | 7.74 | * |
Ratio of expenses after expense reductions (%) | | | 1.34 | * |
Ratio of net investment income (loss) (%) | | | .21 | * |
Portfolio turnover rate (%) | | | — | |
| a | For the period from November 15, 2004 (commencement of operations) to December 31, 2004. |
| b | Based on average shares outstanding during the period. |
| c | Total return would have been lower had certain expenses not been reduced. |
Page 231 of 466
Performance Summary December 31, 2004
Scudder Total Return Portfolio
All performance shown is historical, assumes reinvestment of all dividends and capital gains, and does not guarantee future results. Investment return and principal value fluctuate with changing market conditions so that, when redeemed, shares may be worth more or less then their original cost. Current performance may be lower or higher than the performance data quoted. Please visit scudder.com for the product’s most recent month-end performance. Performance doesn’t reflect charges and fees (“contract charges”) associated with the separate account that invests in the Portfolio or any variable life insurance policy or variable annuity contract for which the Portfolio is an investment option. These charges and fees will reduce returns.
The Portfolio is subject to stock market risk, meaning stocks in the Portfolio may decline in value for extended periods of time due to the activities and financial prospects of individual companies, or due to general market and economic conditions. The Portfolio also invests in individual bonds whose yields and market values fluctuate so that your investment may be worth more or less than its original cost. Please read this Portfolio’s prospectus for specific details regarding its investments and risk profile.
Growth of an Assumed $10,000 Investment in Scudder Total Return Portfolio from 12/31/1994 to 12/31/2004
| | |
¨ Scudder Total Return Portfolio — Class A ¨ S&P 500 Index ¨ Lehman Brothers Aggregate Bond Index | | |
| |
 | | The Standard & Poor’s (S&P) 500 Index is a capitalization-weighted index of 500 stocks. The index is designed to measure performance of the broad domestic economy through changes in the aggregate market value of 500 stocks representing all major industries. The Lehman Brothers Aggregate Bond Index is an unmanaged market value-weighted measure of treasury issues, agency issues, corporate and issues and mortgage securities. |
| |
| | | Index returns assume reinvested dividends and, unlike Portfolio returns, do not reflect any fees or expenses. It is not possible to invest directly into an index. |
Yearly periods ended December 31
Comparative Results
| | | | | | | | | | | | | | | | | | |
Scudder Total Return Portfolio
| | | | 1-Year
| | | 3-Year
| | | 5-Year
| | | 10-Year
| |
Class A | | Growth of $10,000 | | $ | 10,664 | | | $ | 10,684 | | | $ | 9,769 | | | $ | 22,787 | |
| | | Average annual total return | | | 6.64 | % | | | 2.23 | % | | | -.47 | % | | | 8.58 | % |
S&P 500 Index | | Growth of $10,000 | | $ | 11,088 | | | $ | 11,115 | | | $ | 8,902 | | | $ | 31,258 | |
| | | Average annual total return | | | 10.88 | % | | | 3.59 | % | | | -2.30 | % | | | 12.07 | % |
Lehman Brothers Aggregate Bond Index | | Growth of $10,000 | | $ | 10,434 | | | $ | 11,976 | | | $ | 14,497 | | | $ | 21,038 | |
| | | Average annual total return | | | 4.34 | % | | | 6.19 | % | | | 7.71 | % | �� | | 7.72 | % |
| | | | | |
Scudder Total Return Portfolio
| | | | | | | | | | 1-Year
| | | Life of
Class*
| |
Class B | | Growth of $10,000 | | | | | | | | | | $ | 10,626 | | | $ | 11,977 | |
| | | Average annual total return | | | | | | | | | | | 6.26 | % | | | 7.47 | % |
S&P 500 Index | | Growth of $10,000 | | | | | | | | | | $ | 11,088 | | | $ | 12,800 | |
| | | Average annual total return | | | | | | | | | | | 10.88 | % | | | 10.38 | % |
Lehman Brothers Aggregate Bond Index | | Growth of $10,000 | | | | | | | | | | $ | 10,434 | | | $ | 11,539 | |
| | | Average annual total return | | | | | | | | | | | 4.34 | % | | | 5.89 | % |
The growth of $10,000 is cumulative.
| * | The Portfolio commenced offering Class B shares on July 1, 2002. Index returns begin June 30, 2002. |
Page 232 of 466
Information About Your Portfolio’s Expenses
Scudder Total Return Portfolio
As an investor of the Portfolio, you incur two types of costs: ongoing expenses and transaction costs. Ongoing expenses include management fees, distribution and service (12b-1) fees and other Portfolio expenses. Examples of transaction costs include sales charges (loads), redemption fees and account maintenance fees, which are not shown in this section. The following tables are intended to help you understand your ongoing expenses (in dollars) of investing in the Portfolio and to help you compare these expenses with the ongoing expenses of investing in other mutual funds. The tables are based on an investment of $1,000 made at the beginning of the six-month period ended December 31, 2004.
The tables illustrate your Portfolio’s expenses in two ways:
Actual Portfolio Return. This helps you estimate the actual dollar amount of ongoing expenses (but not transaction costs) paid on a $1,000 investment in the Portfolio using the Portfolio’s actual return during the period. To estimate the expenses you paid over the period, simply divide your account value by $1,000 (for example, an $8,600 account value divided by $1,000 = 8.6), then multiply the result by the number in the “Expenses Paid per $1,000” line under the share class you hold.
Hypothetical 5% Portfolio Return. This helps you to compare your Portfolio’s ongoing expenses (but not transaction costs) with those of other mutual funds using the Portfolio’s actual expense ratio and a hypothetical rate of return of 5% per year before expenses. Examples using a 5% hypothetical Portfolio return may be found in the shareholder reports of other mutual funds. The hypothetical account values and expenses may not be used to estimate the actual ending account balance or expenses you paid for the period.
Please note that the expenses shown in these tables are meant to highlight your ongoing expenses only and do not reflect any transaction costs. The “Expenses Paid per $1,000” line of the tables is useful in comparing ongoing expenses only and will not help you determine the relative total expense of owning different funds. If these transaction costs had been included, your costs would have been higher.
Expenses and Value of a $1,000 Investment for the six months ended December 31, 2004
| | | | | | |
Actual Portfolio Return
| | Class A
| | Class B
|
Beginning Account Value 7/1/04 | | $ | 1,000.00 | | $ | 1,000.00 |
Ending Account Value 12/31/04 | | $ | 1,044.80 | | $ | 1,043.00 |
Expenses Paid per $1,000* | | $ | 2.97 | | $ | 4.91 |
| | |
Hypothetical 5% Portfolio Return
| | Class A
| | Class B
|
Beginning Account Value 7/1/04 | | $ | 1,000.00 | | $ | 1,000.00 |
Ending Account Value 12/31/04 | | $ | 1,022.23 | | $ | 1,020.33 |
Expenses Paid per $1,000* | | $ | 2.93 | | $ | 4.85 |
| * | Expenses are equal to the Portfolio’s annualized expense ratio for each share class, multiplied by the average account value over the period, multiplied by the number of days in the most recent six-month period, then divided by 365. |
Page 233 of 466
| | | | | | |
Annualized Expense Ratios
| | Class A
| | | Class B
| |
Scudder Variable Series II — Scudder Total Return Portfolio | | .58 | % | | .96 | % |
For more information, please refer to the Portfolio’s prospectus.
Management Summary December 31, 2004
Scudder Total Return Portfolio
In order to efficiently access the type of returns that Scudder Total Return Portfolio investors expect, we have broadened the investment universe for this portfolio. In the past, the portfolio’s investment strategy consisted of a rather simple combination of US large-capitalization growth stocks and core US bonds. The Board approved broadening the investment universe to include US large-cap value stocks, US small-cap stocks, high-yield bonds, international bonds and emerging-market bonds. The asset-allocation mix will be determined by the portfolio management team on a monthly basis. In support, the Advanced Research and Quantitative Strategies group at Deutsche Asset Management will process the portfolio through a quantitatively based risk management model. The model will seek to manage risk, keeping it at a modest level across the underlying strategies.
Stocks and bonds both generated positive returns in 2004. In the equity market, strong corporate earnings helped small caps outperform large caps, while value outpaced growth. Bonds produced a higher return than would typically be expected given that the Federal Reserve raised interest rates from 1.00% to 2.25% during the year. Longer-term bonds outperformed shorter-term paper, while corporate issues bested Treasuries. Against this backdrop, the portfolio returned 6.64% (Class A shares, unadjusted for contract charges) for the 12-month period ended December 31, 2004. Its benchmarks, the S&P 500 index and the Lehman Brothers Aggregate Bond Index (LBAB), returned 10.88% and 4.34%, respectively, for the same period.
An overweight in energy, along with good selection within the group, was beneficial. Here, we continue to favor equipment and service companies. In fixed income, positions in corporates, international bonds and asset-backed securities added value amid an environment in which investors were thirsty for yield.
In the equity portion of the portfolio, weak stock selection and an overweight in information technology made the largest negative contribution to performance during the year. The portfolio’s current positioning within technology emphasizes consistent earners over cyclical companies, reflecting our view that industry profit growth is likely to slow. We also decreased our overall weighting in technology based on this belief. Selections within financials, where the portfolio is underweight in insurance and overweight in market-sensitive companies, also detracted. High levels of consumer debt and the current rising interest rate environment threatens the performance of many financial services companies and has led us to reduce our exposure to the financial sectors. Looking ahead, we will continue to focus on higher-quality growth stocks and fundamentally sound, reasonably value fixed-income securities.
Julie M. Van Cleave J. Christopher Gagnier
Andrew P. Cestone Brett Diment
Thomas F. Sassi Arnim S. Holzer
Portfolio Managers
Deutsche Investment Management Americas Inc.
Page 234 of 466
All performance shown is historical, assumes reinvestment of all dividends and capital gains, and does not guarantee future results. Investment return and principal value fluctuate with changing market conditions so that, when redeemed, shares may be worth more or less then their original cost. Current performance may be lower or higher than the performance data quoted. Please visit scudder.com for the product’s most recent month-end performance. Performance doesn’t reflect charges and fees (“contract charges”) associated with the separate account that invests in the portfolio or any variable life insurance policy or variable annuity contract for which the portfolio is an investment option. These charges and fees will reduce returns.
Risk Considerations
The portfolio is subject to stock market risk, meaning stocks in the portfolio may decline in value for extended periods of time due to the activities and financial prospects of individual companies, or due to general market and economic conditions. The portfolio also invests in individual bonds whose yields and market values fluctuate so that your investment may be worth more or less than its original cost. Please read this portfolio’s prospectus for specific details regarding its investments and risk profile.
The Standard & Poor’s (S&P) 500 Index is a capitalization-weighted index of 500 stocks. The index is designed to measure performance of the broad domestic economy through changes in the aggregate market value of 500 stocks representing all major industries.
The Lehman Brothers Aggregate Bond Index is an unmanaged market value-weighted measure of treasury issues, agency issues, corporate and issues and mortgage securities.
Index returns assume reinvested dividends and, unlike Portfolio returns, do not reflect any fees or expenses. It is not possible to invest directly into an index.
Portfolio management market commentary is as of December 31, 2004, and may not come to pass. This information is subject to change at any time based on market and other conditions.
Portfolio Summary
Scudder Total Return Portfolio
| | | | | | |
Asset Allocation (Excludes Securities Lending Collateral)
| | 12/31/04
| | | 12/31/03
| |
Common Stocks | | 60 | % | | 61 | % |
Corporate Bonds | | 11 | % | | 10 | % |
Collateralized Mortgage Obligations | | 7 | % | | 10 | % |
Foreign Bonds — US$ Denominated | | 5 | % | | 3 | % |
US Government Backed | | 4 | % | | 3 | % |
Asset Backed | | 3 | % | | 4 | % |
Cash Equivalents | | 3 | % | | 2 | % |
Municipal Investments | | 2 | % | | 2 | % |
Commercial and Non-Agency Mortgage Backed Securities | | 2 | % | | — | |
US Government Agency Sponsored Pass-Throughs | | 1 | % | | 1 | % |
Government National Mortgage Association | | 1 | % | | — | |
Foreign Bonds — Non US$ Denominated | | 1 | % | | — | |
Government Sponsored Agencies | | — | | | 4 | % |
| | |
|
| |
|
|
| | | 100 | % | | 100 | % |
| | |
|
| |
|
|
| | | | | | |
Sector Diversification (Excludes Cash Equivalents and Securities Lending Collateral)
| | 12/31/04
| | | 12/31/03
| |
Financials | | 19 | % | | 11 | % |
Information Technology | | 19 | % | | 26 | % |
Health Care | | 16 | % | | 22 | % |
Page 235 of 466
| | | | | | |
Consumer Discretionary | | 12 | % | | 14 | % |
Industrials | | 11 | % | | 8 | % |
Energy | | 9 | % | | 6 | % |
Consumer Staples | | 8 | % | | 11 | % |
Materials | | 4 | % | | 1 | % |
Telecommunication Services | | 1 | % | | 1 | % |
Utilities | | 1 | % | | — | |
| | |
|
| |
|
|
| | | 100 | % | | 100 | % |
| | |
|
| |
|
|
Asset allocation and sector diversification are subject to change.
For more complete details about the Portfolio’s investment portfolio, see page 56. A quarterly Fact Sheet is available upon request. Information concerning portfolio holdings of the Portfolio as of month end will be posted to scudder.com on the 15th of the following month.
Following the Portfolio’s fiscal first and third quarter-end, a complete portfolio holdings listing is filed with the SEC on Form N-Q. The form will be available on the SEC’s Web site at www.sec.gov, and it also may be reviewed and copied at the SEC’s Public Reference Room in Washington, D.C. Information on the operation of the SEC’s Public Reference Room may be obtained by calling (800) SEC-0330.
Investment Portfolio December 31, 2004
Scudder Total Return Portfolio
| | | | |
| | | Shares
| | Value ($)
|
Common Stocks 60.0% | | | | |
Consumer Discretionary 7.3% | | | | |
Auto Components 0.0% | | | | |
Tenneco Automotive, Inc.,* | | 17,700 | | 305,148 |
| | | | |
|
Automobiles 0.5% | | | | |
Harley-Davidson, Inc. | | 43,400 | | 2,636,550 |
Monaco Coach Corp. | | 16,400 | | 337,348 |
| | | | |
|
| | | | | 2,973,898 |
| | | | |
|
Distributors 0.0% | | | | |
Handleman Co. | | 2,200 | | 47,256 |
| | | | |
|
Hotels Restaurants & Leisure 1.2% | | | | |
Alliance Gaming Corp.* | | 28,300 | | 390,823 |
Ameristar Casinos, Inc. | | 7,600 | | 327,636 |
California Pizza Kitchen, Inc.* | | 15,200 | | 349,600 |
CEC Entertainment, Inc.* | | 12,100 | | 483,637 |
International Game Technology | | 53,300 | | 1,832,454 |
Landry’s Restaurants, Inc. | | 13,800 | | 401,028 |
McDonald’s Corp. | | 59,900 | | 1,920,394 |
Page 236 of 466
| | | | |
YUM! Brands, Inc. | | 40,000 | | 1,887,200 |
| | | | |
|
| | | | | 7,592,772 |
| | | | |
|
Household Durables 0.1% | | | | |
American Woodmark Corp. | | 3,100 | | 135,408 |
Fortune Brands, Inc. | | 7,300 | | 563,414 |
| | | | |
|
| | | | | 698,822 |
| | | | |
|
Internet & Catalog Retail 0.3% | | | | |
eBay, Inc.* | | 16,800 | | 1,953,504 |
J. Jill Group, Inc.* | | 14,900 | | 221,861 |
| | | | |
|
| | | | | 2,175,365 |
| | | | |
|
Leisure Equipment & Products 0.1% | | | | |
Arctic Cat, Inc. | | 7,200 | | 190,944 |
RC2 Corp.* | | 11,300 | | 368,380 |
| | | | |
|
| | | | | 559,324 |
| | | | |
|
Media 1.3% | | | | |
aQuantive Inc.* | | 7,400 | | 66,156 |
Comcast Corp. “A”* | | 45,600 | | 1,497,504 |
McGraw-Hill Companies, Inc. | | 24,600 | | 2,251,884 |
Mediacom Communications Corp. “A”* | | 25,400 | | 158,750 |
Omnicom Group, Inc. | | 28,800 | | 2,428,416 |
Reader’s Digest Association, Inc. | | 32,600 | | 453,466 |
Salem Communications Corp. “A”* | | 2,400 | | 59,880 |
Viacom, Inc. “B” | | 41,439 | | 1,507,965 |
| | | | |
|
| | | | | 8,424,021 |
| | | | |
|
Multiline Retail 1.4% | | | | |
Family Dollar Stores, Inc. | | 95,900 | | 2,994,957 |
Kirkland’s, Inc.* | | 3,700 | | 45,473 |
Kohl’s Corp.* | | 15,500 | | 762,135 |
May Department Stores Co. | | 81,600 | | 2,399,040 |
Target Corp. | | 68,600 | | 3,562,398 |
| | | | |
|
| | | | | 9,764,003 |
| | | | |
|
Specialty Retail 2.2% | | | | |
Aeropostale, Inc.* | | 9,500 | | 279,585 |
Bed Bath & Beyond, Inc.* | | 13,300 | | 529,739 |
| | |
| | | Shares
| | Value ($)
|
Cato Corp. “A” | | 14,800 | | 426,536 |
Charlotte Russe Holding, Inc.* | | 23,100 | | 233,310 |
Charming Shoppes, Inc.* | | 33,500 | | 313,895 |
Dick’s Sporting Goods, Inc.* | | 2,300 | | 80,845 |
GameStop Corp.* | | 2,400 | | 53,664 |
Home Depot, Inc. | | 11,500 | | 491,510 |
Limited Brands | | 98,500 | | 2,267,470 |
Lowe’s Companies, Inc. | | 87,700 | | 5,050,643 |
Sherwin-Williams Co. | | 58,500 | | 2,610,855 |
Page 237 of 466
| | | | |
Stage Stores, Inc.* | | 2,800 | | 116,256 |
Staples, Inc. | | 35,900 | | 1,210,189 |
Stein Mart, Inc.* | | 17,800 | | 303,668 |
Too, Inc.* | | 14,700 | | 359,562 |
Trans World Entertainment Corp.* | | 4,600 | | 57,362 |
| | | | |
|
| | | | | 14,385,089 |
| | | | |
|
Textiles, Apparel & Luxury Goods 0.2% | | | | |
Cherokee, Inc. | | 600 | | 21,168 |
Guess?, Inc.* | | 21,000 | | 263,550 |
Phillips-Van Heusen Corp. | | 1,600 | | 43,200 |
Skechers USA, Inc. “A”* | | 23,200 | | 300,672 |
Wolverine World Wide, Inc. | | 15,300 | | 480,726 |
| | | | |
|
| | | | | 1,109,316 |
| | | | |
|
Consumer Staples 5.0% | | | | |
Beverages 0.6% | | | | |
Boston Beer Co., Inc. “A”* | | 4,800 | | 102,096 |
PepsiCo, Inc. | | 72,720 | | 3,795,984 |
| | | | |
|
| | | | | 3,898,080 |
| | | | |
|
Food & Staples Retailing 1.1% | | | | |
Nash-Finch Co. | | 6,600 | | 249,216 |
Pantry, Inc.* | | 12,700 | | 382,143 |
Wal-Mart Stores, Inc. | | 89,100 | | 4,706,262 |
Walgreen Co. | | 49,800 | | 1,910,826 |
| | | | |
|
| | | | | 7,248,447 |
| | | | |
|
Food Products 2.0% | | | | |
ConAgra Foods, Inc. | | 99,200 | | 2,921,440 |
Dean Foods Co.* | | 12,700 | | 418,465 |
General Mills, Inc. | | 73,400 | | 3,648,714 |
Hershey Foods Corp. | | 21,800 | | 1,210,772 |
Kellogg Co. | | 29,200 | | 1,304,072 |
Lance, Inc. | | 21,800 | | 414,854 |
Sara Lee Corp. | | 120,100 | | 2,899,214 |
| | | | |
|
| | | | | 12,817,531 |
| | | | |
|
Household Products 1.3% | | | | |
Colgate-Palmolive Co. | | 25,700 | | 1,314,812 |
Hooker Furniture Corp. | | 8,300 | | 188,410 |
Kimberly-Clark Corp. | | 54,000 | | 3,553,740 |
Procter & Gamble Co. | | 66,300 | | 3,651,804 |
| | | | |
|
| | | | | 8,708,766 |
| | | | |
|
Personal Products 0.0% | | | | |
Elizabeth Arden, Inc.* | | 12,600 | | 299,124 |
| | | | |
|
Energy 5.2% | | | | |
Energy Equipment & Services 1.2% | | | | |
Baker Hughes, Inc. | | 45,100 | | 1,924,417 |
Cal Dive International, Inc.* | | 10,400 | | 423,800 |
Page 238 of 466
| | | | |
| | | Shares
| | Value ($)
|
Nabors Industries Ltd.* | | 36,800 | | 1,887,472 |
Offshore Logistics, Inc.* | | 1,000 | | 32,470 |
Schlumberger Ltd. | | 33,300 | | 2,229,435 |
Transocean, Inc.* | | 21,800 | | 924,102 |
| | | | |
|
| | | | | 7,421,696 |
| | | | |
|
Oil & Gas 4.0% | | | | |
BP PLC (ADR) | | 34,500 | | 2,014,800 |
Burlington Resources, Inc. | | 45,400 | | 1,974,900 |
Callon Petroleum Co.* | | 9,800 | | 141,708 |
ChevronTexaco Corp. | | 45,700 | | 2,399,707 |
Cimarex Energy Co.* | | 12,200 | | 462,380 |
Comstock Resources, Inc.* | | 18,400 | | 405,720 |
ConocoPhillips | | 44,900 | | 3,898,667 |
Devon Energy Corp. | | 56,200 | | 2,187,304 |
EOG Resources, Inc. | | 27,800 | | 1,983,808 |
ExxonMobil Corp. | | 98,600 | | 5,054,236 |
Houston Exploration Co.* | | 8,500 | | 478,635 |
Meridian Resource Corp.* | | 27,500 | | 166,375 |
Overseas Shipholding Group, Inc. | | 8,200 | | 452,640 |
Remington Oil & Gas Corp.* | | 15,500 | | 422,375 |
Royal Dutch Petroleum Co. (NY Shares) | | 45,000 | | 2,582,100 |
Southwestern Energy Co.* | | 10,400 | | 527,176 |
Tesoro Petroleum Corp.* | | 11,200 | | 356,832 |
Vintage Petroleum, Inc. | | 17,000 | | 385,730 |
Whiting Petroleum Corp.* | | 14,200 | | 429,550 |
| | | | |
|
| | | | | 26,324,643 |
| | | | |
|
Financials 11.6% | | | | |
Banks 4.8% | | | | |
AmSouth Bancorp. | | 63,900 | | 1,655,010 |
BancFirst Corp. | | 400 | | 31,592 |
Bank of America Corp. | | 173,200 | | 8,138,668 |
Banner Corp. | | 4,900 | | 152,831 |
BB&T Corp. | | 44,700 | | 1,879,635 |
Capital Bancorp., Ltd. | | 500 | | 17,610 |
Central Pacific Financial Corp. | | 500 | | 18,085 |
Citizens Banking Corp. | | 2,700 | | 92,745 |
CoBiz, Inc. | | 1,200 | | 24,360 |
Columbia Banking Systems, Inc. | | 3,100 | | 77,469 |
Community Bank System, Inc. | | 2,500 | | 70,625 |
CVB Financial Corp. | | 9,000 | | 239,040 |
Dime Community Bancshares | | 2,200 | | 39,402 |
Downey Financial Corp. | | 4,500 | | 256,500 |
Fidelity Bancshares, Inc. | | 4,700 | | 200,972 |
First BanCorp. | | 9,300 | | 590,643 |
Page 239 of 466
| | | | |
First Community Bancorp. | | 2,400 | | 102,480 |
FirstFed Financial Corp.* | | 9,200 | | 477,204 |
Frontier Financial Corp. | | 1,600 | | 61,776 |
Hanmi Financial Corp. | | 7,900 | | 283,926 |
Harbor Florida Bancshares, Inc. | | 6,600 | | 228,426 |
Independent Bank Corp. | | 1,400 | | 47,250 |
Integra Bank Corp. | | 2,200 | | 50,842 |
MBT Financial Corp. | | 1,300 | | 30,251 |
National City Corp. | | 53,500 | | 2,008,925 |
National Penn Bancshares, Inc. | | 800 | | 22,160 |
Pacific Capital Bancorp. | | 1,100 | | 37,389 |
PNC Financial Services Group | | 71,300 | | 4,095,472 |
Prosperity Bancshares, Inc. | | 2,000 | | 58,420 |
| | |
| | | Shares
| | Value ($)
|
Provident Bankshares Corp. | | 3,000 | | 109,110 |
Republic Bancorp, Inc. “A” | | 1,200 | | 30,840 |
Republic Bancorp., Inc. | | 19,500 | | 297,960 |
Silicon Valley Bancshares* | | 11,400 | | 510,948 |
Southwest Bancorporation of Texas, Inc. | | 3,100 | | 72,199 |
Sterling Bancshares, Inc. | | 16,900 | | 241,163 |
Sterling Financial Corp.* | | 3,700 | | 145,262 |
SunTrust Banks, Inc. | | 27,100 | | 2,002,148 |
Texas Capital Bancshares, Inc.* | | 2,300 | | 49,726 |
TierOne Corp. | | 3,500 | | 86,975 |
Trustmark Corp. | | 5,800 | | 180,206 |
Umpqua Holdings Corp. | | 3,300 | | 83,193 |
United Community Banks, Inc. | | 1,000 | | 26,930 |
US Bancorp. | | 88,900 | | 2,784,348 |
Wachovia Corp. | | 64,000 | | 3,366,400 |
WesBanco, Inc. | | 3,100 | | 99,107 |
Westamerica Bancorp. | | 6,400 | | 373,184 |
WSFS Financial Corp. | | 3,800 | | 229,216 |
| | | | |
|
| | | | | 31,678,623 |
| | | | |
|
Capital Markets 1.3% | | | | |
Bear Stearns Companies, Inc. | | 21,400 | | 2,189,434 |
Goldman Sachs Group, Inc. | | 8,200 | | 853,128 |
Investment Technology Group, Inc.* | | 8,000 | | 160,000 |
Lehman Brothers Holdings, Inc. | | 10,600 | | 927,288 |
Merrill Lynch & Co., Inc. | | 46,500 | | 2,779,305 |
Morgan Stanley | | 28,100 | | 1,560,112 |
| | | | |
|
| | | | | 8,469,267 |
| | | | |
|
Consumer Finance 0.6% | | | | |
American Express Co. | | 64,800 | | 3,652,776 |
| | | | |
|
Page 240 of 466
| | | | |
Diversified Financial Services 2.9% | | | | |
Accredited Home Lenders Holding Co.* | | 8,400 | | 417,312 |
ASTA Funding, Inc. | | 5,000 | | 134,200 |
Bank Mutual Corp. | | 3,100 | | 37,727 |
Chemical Financial Corp. | | 2,200 | | 94,424 |
Citigroup, Inc. | | 184,299 | | 8,879,526 |
F.N.B. Corp. | | 4,100 | | 83,476 |
Fannie Mae | | 32,500 | | 2,314,325 |
Freddie Mac | | 30,400 | | 2,240,480 |
JPMorgan Chase & Co. | | 118,300 | | 4,614,883 |
| | | | |
|
| | | | | 18,816,353 |
| | | | |
|
Insurance 1.3% | | | | |
AFLAC, Inc. | | 39,600 | | 1,577,664 |
Allstate Corp. | | 48,600 | | 2,513,592 |
American International Group, Inc. | | 56,737 | | 3,725,919 |
American Physicians Capital, Inc.* | | 1,000 | | 36,020 |
Commerce Group, Inc. | | 3,100 | | 189,224 |
FPIC Insurance Group, Inc.* | | 3,200 | | 113,216 |
Navigators Group, Inc.* | | 1,900 | | 57,209 |
UICI | | 4,700 | | 159,330 |
Zenith National Insurance Corp. | | 10,000 | | 498,400 |
| | | | |
|
| | | | | 8,870,574 |
| | | | |
|
Real Estate 0.7% | | | | |
American Financial Realty Trust (REIT) | | 6,400 | | 103,552 |
Amli Residential Properties Trust (REIT) | | 4,700 | | 150,400 |
| | |
| | | Shares
| | Value ($)
|
Bedford Property Investors, Inc. (REIT) | | 2,600 | | 73,866 |
CarrrAmerica Realty Corp. (REIT) | | 7,000 | | 231,000 |
Colonial Properties Trust (REIT) | | 2,400 | | 94,248 |
Commercial Net Lease Realty (REIT) | | 7,200 | | 148,320 |
Cornerstone Realty Income Trust, Inc. (REIT) | | 4,900 | | 48,902 |
Corporate Office Properties Trust (REIT) | | 6,700 | | 196,645 |
Cousins Properties, Inc. (REIT) | | 4,600 | | 139,242 |
EastGroup Properties, Inc. (REIT) | | 1,800 | | 68,976 |
Essex Property Trust, Inc. (REIT) | | 2,900 | | 243,020 |
FelCor Lodging Trust, Inc. (REIT)* | | 9,300 | | 136,245 |
Gables Residential Trust (REIT) | | 5,100 | | 182,529 |
Glenborough Realty Trust, Inc. (REIT) | | 3,600 | | 76,608 |
Glimcher Realty Trust (REIT) | | 3,200 | | 88,672 |
Healthcare Realty Trust, Inc. (REIT) | | 5,900 | | 240,130 |
Heritage Property Investment Trust (REIT) | | 4,700 | | 150,823 |
Highwoods Properties, Inc. (REIT) | | 8,100 | | 224,370 |
Jones Lang Lasalle, Inc.* | | 1,000 | | 37,410 |
Kilroy Realty Corp. (REIT) | | 4,300 | | 183,825 |
Kramont Realty Trust (REIT) | | 1,000 | | 23,400 |
Page 241 of 466
| | | | |
Lexington Corporate Properties Trust (REIT) | | 8,400 | | 189,672 |
LTC Properties, Inc. (REIT) | | 1,300 | | 25,883 |
Nationwide Health Properties, Inc. (REIT) | | 9,500 | | 225,625 |
Newcastle Investment Corp. (REIT) | | 6,100 | | 193,858 |
OMEGA Healthcare Investors, Inc. (REIT) | | 2,500 | | 29,500 |
Parkway Properties, Inc. (REIT) | | 3,100 | | 157,325 |
Prentiss Properties Trust (REIT) | | 2,600 | | 99,320 |
Senior Housing Properties Trust (REIT) | | 9,700 | | 183,718 |
Sun Communities, Inc. (REIT) | | 4,100 | | 165,025 |
Town & Country Trust (REIT) | | 1,200 | | 33,156 |
Trammell Crow Co.* | | 3,200 | | 57,952 |
Urstadt Biddle Properties, Inc. (REIT) | | 1,200 | | 20,460 |
Washington Real Estate Investment Trust (REIT) | | 6,200 | | 209,994 |
| | | | |
|
| | | | | 4,433,671 |
| | | | |
|
Health Care 9.8% | | | | |
Biotechnology 1.4% | | | | |
Amgen, Inc.* | | 14,100 | | 904,515 |
Biogen Idec, Inc.* | | 24,900 | | 1,658,589 |
deCODE genetics, Inc.* | | 11,900 | | 92,939 |
Enzon Pharmaceuticals, Inc.* | | 19,300 | | 264,796 |
Genentech, Inc.* | | 70,500 | | 3,838,020 |
Gilead Sciences, Inc.* | | 63,000 | | 2,204,370 |
Regeneron Pharmaceuticals, Inc.* | | 13,200 | | 121,572 |
Third Wave Technologies* | | 24,300 | | 208,980 |
| | | | |
|
| | | | | 9,293,781 |
| | | | |
|
Health Care Equipment & Supplies 2.4% | | | | |
Align Technology, Inc.* | | 19,600 | | 210,700 |
Alliance Imaging, Inc.* | | 9,300 | | 104,625 |
Baxter International, Inc. | | 154,600 | | 5,339,884 |
Biosite, Inc.* | | 5,100 | | 313,854 |
Boston Scientific Corp.* | | 44,000 | | 1,564,200 |
C.R. Bard, Inc. | | 17,600 | | 1,126,048 |
| | |
| | | Shares
| | Value ($)
|
Closure Medical Corp.* | | 5,900 | | 115,050 |
Haemonetics Corp.* | | 11,500 | | 416,415 |
Hospira, Inc.* | | 6,450 | | 216,075 |
Medtronic, Inc. | | 44,300 | | 2,200,381 |
Palomar Medical Technologies, Inc.* | | 5,000 | | 130,350 |
PolyMedica Corp. | | 8,700 | | 324,423 |
VISX, Inc.* | | 7,009 | | 181,323 |
Waters Corp.* | | 17,800 | | 832,862 |
Zimmer Holdings, Inc.* | | 36,300 | | 2,908,356 |
| | | | |
|
| | | | | 15,984,546 |
| | | | |
|
Page 242 of 466
| | | | |
Health Care Providers & Services 1.2% | | | | |
Allscripts Healthcare Solutions, Inc.* | | 10,500 | | 112,035 |
Amedisys, Inc. “L”* | | 10,600 | | 343,334 |
Centene Corp.* | | 13,600 | | 385,560 |
Cerner Corp.* | | 6,000 | | 319,020 |
Chemed Corp. | | 6,000 | | 402,660 |
Genesis HealthCare Corp.* | | 1,100 | | 38,533 |
Healthcare Service Group, Inc. | | 1,800 | | 37,512 |
IDX Systems Corp.* | | 9,800 | | 337,708 |
Lifeline Systems, Inc.* | | 2,800 | | 72,128 |
MedCath Corp.* | | 8,600 | | 211,904 |
Merge Technologies, Inc.* | | 6,500 | | 144,625 |
Option Care, Inc. | | 16,500 | | 283,635 |
PDI, Inc.* | | 7,700 | | 171,556 |
RehabCare Group, Inc.* | | 5,200 | | 145,548 |
Res-Care, Inc.* | | 20,500 | | 312,010 |
SFBC International, Inc.* | | 7,800 | | 308,100 |
UnitedHealth Group, Inc. | | 47,100 | | 4,146,213 |
| | | | |
|
| | | | | 7,772,081 |
| | | | |
|
Pharmaceuticals 4.8% | | | | |
Abbott Laboratories | | 129,600 | | 6,045,840 |
Alpharma, Inc. “A” | | 16,900 | | 286,455 |
Bone Care International, Inc.* | | 2,300 | | 64,055 |
Bristol-Myers Squibb Co. | | 160,400 | | 4,109,448 |
Connetics Corp.* | | 12,700 | | 308,483 |
Eli Lilly & Co. | | 20,800 | | 1,180,400 |
First Horizon Pharmaceutical Corp.* | | 7,600 | | 173,964 |
Johnson & Johnson | | 129,666 | | 8,223,417 |
Kos Pharmaceuticals, Inc.* | | 5,700 | | 214,548 |
Noven Pharmaceuticals, Inc.* | | 13,400 | | 228,604 |
Perrigo Co. | | 20,300 | | 350,581 |
Pfizer, Inc. | | 226,475 | | 6,089,913 |
POZEN, Inc.* | | 22,100 | | 160,667 |
Rigel Pharmaceuticals, Inc.* | | 7,500 | | 183,150 |
United Therapeutics Corp.* | | 8,900 | | 401,835 |
USANA Health Sciences, Inc.* | | 1,400 | | 47,880 |
Valeant Pharmaceuticals International | | 13,600 | | 358,360 |
Wyeth | | 65,300 | | 2,781,127 |
| | | | |
|
| | | | | 31,208,727 |
| | | | |
|
Industrials 6.7% | | | | |
Aerospace & Defense 1.2% | | | | |
DRS Technologies, Inc.* | | 1,800 | | 76,878 |
HEICO Corp. | | 5,600 | | 126,504 |
Honeywell International, Inc. | | 117,000 | | 4,142,970 |
Teledyne Technologies, Inc.* | | 4,500 | | 132,435 |
United Technologies Corp. | | 34,000 | | 3,513,900 |
| | | | |
|
| | | | | 7,992,687 |
| | | | |
|
Page 243 of 466
| | | | |
| | | Shares
| | Value ($)
|
Air Freight & Logistics 0.4% | | | | |
FedEx Corp. | | 22,500 | | 2,216,025 |
| | | | |
|
Airlines 0.1% | | | | |
Frontier Airlines, Inc.* | | 19,200 | | 219,072 |
Pinnacle Airlines Corp.* | | 20,500 | | 285,770 |
| | | | |
|
| | | | | 504,842 |
| | | | |
|
Commercial Services & Supplies 1.1% | | | | |
Avery Dennison Corp. | | 38,400 | | 2,302,848 |
Brady Corp. “A” | | 4,000 | | 250,280 |
Bright Horizons Family Solutions, Inc.* | | 500 | | 32,380 |
Coinstar, Inc.* | | 11,800 | | 316,594 |
Duratek, Inc.* | | 6,700 | | 166,897 |
Electro Rent Corp. | | 1,800 | | 25,614 |
Euronet Worldwide, Inc.* | | 10,900 | | 283,618 |
Heidrick & Struggles International, Inc.* | | 2,500 | | 85,675 |
Navigant Consulting, Inc.* | | 13,500 | | 359,100 |
NCO Group, Inc.* | | 11,500 | | 297,275 |
NuCo2, Inc.* | | 13,700 | | 304,003 |
Pitney Bowes, Inc. | | 48,200 | | 2,230,696 |
Stewart Enterprises, Inc. “A”* | | 19,100 | | 133,509 |
TeleTech Holdings, Inc.* | | 25,200 | | 244,188 |
Ventiv Health, Inc.* | | 9,800 | | 199,136 |
| | | | |
|
| | | | | 7,231,813 |
| | | | |
|
Construction & Engineering 0.1% | | | | |
Dycom Industries, Inc.* | | 12,500 | | 381,500 |
Perini Corp.* | | 20,100 | | 335,469 |
| | | | |
|
| | | | | 716,969 |
| | | | |
|
Electrical Equipment 0.5% | | | | |
Artesyn Technologies, Inc.* | | 22,700 | | 256,510 |
Emerson Electric Co. | | 37,800 | | 2,649,780 |
| | | | |
|
| | | | | 2,906,290 |
| | | | |
|
Industrial Conglomerates 2.5% | | | | |
3M Co. | | 17,800 | | 1,460,846 |
Blout International, Inc.* | | 2,300 | | 40,066 |
General Electric Co. | | 328,900 | | 12,004,850 |
Textron, Inc. | | 39,700 | | 2,929,860 |
Tredegar Corp. | | 5,600 | | 113,176 |
| | | | |
|
| | | | | 16,548,798 |
| | | | |
|
Machinery 0.5% | | | | |
Actuant Corp. “A”* | | 5,800 | | 302,470 |
Astec Industries, Inc.* | | 17,500 | | 301,175 |
Caterpillar, Inc. | | 10,100 | | 984,851 |
Kennametal, Inc. | | 10,500 | | 522,585 |
Page 244 of 466
| | | | |
Sauer-Danfoss, Inc. | | 4,600 | | 100,326 |
Terex Corp.* | | 10,100 | | 481,265 |
The Manitowoc Co., Inc. | | 10,600 | | 399,090 |
Wabash National Corp.* | | 11,300 | | 304,309 |
Wabtec Corp. | | 2,200 | | 46,904 |
| | | | |
|
| | | | | 3,442,975 |
| | | | |
|
Marine 0.1% | | | | |
Kirby Corp.* | | 11,300 | | 501,494 |
| | | | |
|
Road & Rail 0.1% | | | | |
Knight Transportation, Inc. | | 16,400 | | 406,720 |
Old Dominion Freight Line, Inc.* | | 13,000 | | 452,400 |
| | | | |
|
| | | | | 859,120 |
| | | | |
|
| | |
| | | Shares
| | Value ($)
|
Trading Companies & Distributors 0.1% | | | | |
United Rentals, Inc.* | | 15,800 | | 298,620 |
WESCO International, Inc.* | | 10,400 | | 308,256 |
| | | | |
|
| | | | | 606,876 |
| | | | |
|
Information Technology 11.1% | | | | |
Communications Equipment 1.3% | | | | |
Aspect Communications Corp.* | | 16,400 | | 182,696 |
Cisco Systems, Inc.* | | 142,900 | | 2,757,970 |
CommScope, Inc.* | | 16,200 | | 306,180 |
Digi International, Inc.* | | 2,800 | | 48,132 |
Nokia Oyj (ADR) | | 180,100 | | 2,822,167 |
QUALCOMM, Inc. | | 60,000 | | 2,544,000 |
| | | | |
|
| | | | | 8,661,145 |
| | | | |
|
Computers & Peripherals 2.3% | | | | |
Dell, Inc.* | | 35,400 | | 1,491,756 |
EMC Corp.* | | 208,000 | | 3,092,960 |
Hewlett-Packard Co. | | 137,700 | | 2,887,569 |
Intergraph Corp.* | | 14,100 | | 379,713 |
International Business Machines Corp. | | 67,700 | | 6,673,866 |
Komag, Inc.* | | 15,800 | | 296,724 |
Tyler Technologies, Inc.* | | 10,500 | | 87,780 |
| | | | |
|
| | | | | 14,910,368 |
| | | | |
|
Electronic Equipment & Instruments 0.2% | | | | |
Agilysys, Inc. | | 15,600 | | 267,384 |
BEI Technologies, Inc. | | 9,300 | | 287,184 |
Keithley Instruments, Inc. | | 3,300 | | 65,010 |
LeCroy Corp.* | | 14,900 | | 347,766 |
Rofin-Sinar Technologies, Inc.* | | 8,600 | | 365,070 |
X-Rite, Inc. | | 12,000 | | 192,120 |
| | | | |
|
| | | | | 1,524,534 |
| | | | |
|
Page 245 of 466
| | | | |
Internet Software & Services 0.2% | | | | |
Digital River, Inc.* | | 5,600 | | 233,016 |
DoubleClick, Inc.* | | 23,700 | | 184,386 |
EarthLink, Inc.* | | 20,100 | | 231,552 |
eSPEED, Inc. “A”* | | 14,600 | | 180,602 |
F5 Networks, Inc.* | | 4,900 | | 238,728 |
InfoSpace, Inc.* | | 3,700 | | 175,935 |
S1 Corp.* | | 3,500 | | 31,710 |
| | | | |
|
| | | | | 1,275,929 |
| | | | |
|
IT Consulting & Services 1.2% | | | | |
Accenture Ltd. “A”* | | 58,800 | | 1,587,600 |
Automatic Data Processing, Inc. | | 70,700 | | 3,135,545 |
CSG Systems International, Inc.* | | 15,900 | | 297,330 |
eFunds Corp.* | | 7,200 | | 172,872 |
Fiserv, Inc.* | | 54,300 | | 2,182,317 |
Paychex, Inc. | | 22,300 | | 759,984 |
Sapient Corp.* | | 18,400 | | 145,544 |
| | | | |
|
| | | | | 8,281,192 |
| | | | |
|
Semiconductors & Semiconductor Equipment 2.8% | | | | |
ADE Corp.* | | 10,200 | | 190,944 |
Applied Materials, Inc.* | | 142,100 | | 2,429,910 |
Axcelis Technologies, Inc.* | | 33,700 | | 273,981 |
Diodes, Inc.* | | 11,300 | | 255,719 |
Integrated Device Technology, Inc.* | | 23,400 | | 270,504 |
Intel Corp. | | 321,200 | | 7,512,868 |
| | |
| | | Shares
| | Value ($)
|
Kulicke & Soffa Industries, Inc.* | | 21,200 | | 182,744 |
Linear Technology Corp. | | 48,600 | | 1,883,736 |
LTX Corp.* | | 24,300 | | 186,867 |
Micrel, Inc.* | | 21,300 | | 234,726 |
Microsemi Corp.* | | 15,900 | | 276,024 |
OmniVision Technologies, Inc.* | | 12,400 | | 227,540 |
Photronics, Inc.* | | 14,200 | | 234,300 |
Silicon Image, Inc.* | | 14,900 | | 245,254 |
Siliconix, Inc.* | | 1,600 | | 58,384 |
Standard Microsystems Corp.* | | 11,600 | | 206,828 |
Supertex, Inc.* | | 900 | | 19,530 |
Texas Instruments, Inc. | | 140,400 | | 3,456,648 |
| | | | |
|
| | | | | 18,146,507 |
| | | | |
|
Software 3.1% | | | | |
Adobe Systems, Inc. | | 8,400 | | 527,016 |
Ansoft Corp.* | | 11,500 | | 232,300 |
Aspen Technology, Inc.* | | 24,000 | | 149,040 |
Borland Software Corp.* | | 24,400 | | 284,992 |
Electronic Arts, Inc.* | | 40,700 | | 2,510,376 |
Page 246 of 466
| | | | |
Embarcadero Technologies, Inc.* | | 24,200 | | 227,722 |
Epicor Software Corp.* | | 19,000 | | 267,710 |
EPIQ Systems, Inc.* | | 14,800 | | 216,672 |
FactSet Research Systems, Inc. | | 1,800 | | 105,192 |
Internet Security Systems, Inc.* | | 7,800 | | 181,350 |
Interwoven, Inc.* | | 15,200 | | 165,376 |
Intuit, Inc.* | | 24,200 | | 1,065,042 |
Kronos, Inc.* | | 7,300 | | 373,249 |
Macrovision Corp.* | | 6,700 | | 172,324 |
Microsoft Corp. | | 369,200 | | 9,861,332 |
MicroStrategy, Inc.* | | 22 | | 1,326 |
Oracle Corp.* | | 102,700 | | 1,409,044 |
Quest Software, Inc.* | | 2,200 | | 35,090 |
SeaChange International, Inc.* | | 11,900 | | 207,536 |
Sonic Solutions* | | 14,700 | | 329,868 |
SS&C Technologies, Inc. | | 11,000 | | 227,150 |
Symantec Corp.* | | 57,600 | | 1,483,776 |
| | | | |
|
| | | | | 20,033,483 |
| | | | |
|
Materials 2.4% | | | | |
Chemicals 1.2% | | | | |
Air Products & Chemicals, Inc. | | 47,700 | | 2,765,169 |
Albermarle Corp. | | 1,400 | | 54,194 |
Compass Minerals International, Inc. | | 15,700 | | 380,411 |
Dow Chemical Co. | | 28,900 | | 1,430,839 |
Ecolab, Inc. | | 40,800 | | 1,433,304 |
FMC Corp.* | | 9,700 | | 468,510 |
Georgia Gulf Corp. | | 9,100 | | 453,180 |
Octel Corp. | | 15,200 | | 316,312 |
Terra Industries, Inc.* | | 33,200 | | 294,816 |
W.R. Grace & Co.* | | 17,800 | | 242,258 |
| | | | |
|
| | | | | 7,838,993 |
| | | | |
|
Containers & Packaging 0.4% | | | | |
Silgan Holdings, Inc. | | 2,100 | | 128,016 |
Sonoco Products Co. | | 79,200 | | 2,348,280 |
| | | | |
|
| | | | | 2,476,296 |
| | | | |
|
| | |
| | | Shares
| | Value ($)
|
Metals & Mining 0.7% | | | | |
Alcoa, Inc. | | 94,700 | | 2,975,474 |
Century Aluminum Co.* | | 12,700 | | 333,502 |
Hecla Mining Co.* | | 34,000 | | 198,220 |
Oregon Steel Mills, Inc.* | | 16,100 | | 326,669 |
Quanex Corp. | | 6,800 | | 466,276 |
Steel Dynamics, Inc. | | 7,000 | | 265,160 |
| | | | |
|
| | | | | 4,565,301 |
| | | | |
|
Page 247 of 466
| | | | |
Paper & Forest Products 0.1% | | | | |
Buckeye Technologies, Inc.* | | 4,600 | | 59,846 |
Deltic Timber Corp. | | 1,600 | | 67,920 |
Pope & Talbot, Inc. | | 8,800 | | 150,568 |
Potlatch Corp. | | 10,700 | | 541,206 |
| | | | |
|
| | | | | 819,540 |
| | | | |
|
Telecommunication Services 0.5% | | | | |
Diversified Telecommunication Services 0.4% | | | | |
CT Communications, Inc. | | 9,100 | | 111,930 |
General Communication, Inc. “A”* | | 24,900 | | 274,896 |
North Pittsburgh Systems, Inc. | | 2,800 | | 69,244 |
PTEK Holdings, Inc.* | | 24,300 | | 260,253 |
SBC Communications, Inc. | | 60,700 | | 1,564,239 |
Verizon Communications, Inc. | | 14,000 | | 567,140 |
| | | | |
|
| | | | | 2,847,702 |
| | | | |
|
Wireless Telecommunication Services 0.1% | | | | |
Alamosa Holdings, Inc.* | | 14,200 | | 177,074 |
Centennial Communications Corp.* | | 23,300 | | 184,769 |
| | | | |
|
| | | | | 361,843 |
| | | | |
|
Utilities 0.4% | | | | |
Electric Utilities 0.3% | | | | |
PNM Resources, Inc. | | 15,800 | | 399,582 |
Progress Energy, Inc. | | 28,900 | | 1,307,436 |
| | | | |
|
| | | | | 1,707,018 |
| | | | |
|
Gas Utilities 0.0% | | | | |
| | | | | |
Southern Union Co.* | | 2,800 | | 67,144 |
| | | | |
|
Multi-Utilities 0.1% | | | | |
| | | | | |
Energen Corp. | | 10,200 | | 601,290 |
| | | | |
|
Total Common Stocks (Cost $328,259,805) | | | | 392,579,874 |
| | | | |
|
Warrants 0.0% | | | | |
MircoStrategy, Inc.* | | 96 | | 9 |
TravelCenters of America, Inc.* | | 40 | | 200 |
| | | | |
|
Total Warrants (Cost $200) | | | | 209 |
| | | | |
|
Preferred Stocks 0.1% | | | | |
Paxson Communications Corp. (PIK) | | 27 | | 198,450 |
TNP Enterprises, Inc., 14.5% “D” (PIK) | | 530 | | 61,480 |
| | | | |
|
Total Preferred Stocks (Cost $268,141) | | | | 259,930 |
| | | | |
|
Page 248 of 466
| | | | |
| | | Principal Amount ($)(f)
| | Value ($)
|
Convertible Bonds 0.0% | | | | |
DIMON, Inc., 6.25%, 3/31/2007 | | 70,000 | | 65,625 |
HIH Capital Ltd., 144A, Series DOM, 7.5%, 9/25/2006 | | 50,000 | | 49,500 |
| | | | |
|
Total Convertible Bonds (Cost $114,979) | | | | 115,125 |
| | | | |
|
Corporate Bonds 11.2% | | | | |
Consumer Discretionary 1.9% | | | | |
Adesa, Inc., 7.625%, 6/15/2012 | | 55,000 | | 58,025 |
AMC Entertainment, Inc., 8.0%, 3/1/2014 | | 145,000 | | 144,275 |
American Lawyer Media, Inc., Series B, 9.75%, 12/15/2007 | | 170,000 | | 171,913 |
Atlantic Broadband Finance LLC, 144A, 9.375%, 1/15/2014 | | 175,000 | | 169,312 |
Auburn Hills Trust, 12.375%, 5/1/2020 | | 83,000 | | 130,183 |
Bally Total Fitness Holdings Corp., 10.5%, 7/15/2011 | | 155,000 | | 156,163 |
Cablevision Systems New York Group, 144A, 6.669%**, 4/1/2009 | | 105,000 | | 111,300 |
Caesars Entertainment, Inc., 9.375%, 2/15/2007 | | 55,000 | | 60,638 |
Carrols Corp., 144A, 9.0%, 1/15/2013 | | 50,000 | | 51,750 |
Charter Communications Holdings LLC: | | | | |
Step-up Coupon, 0% to 5/15/2006, 11.75% to 5/15/2011 | | 380,000 | | 279,300 |
9.625%, 11/15/2009 | | 285,000 | | 250,087 |
10.25%, 9/15/2010 | | 500,000 | | 530,000 |
Cooper Standard Automotive, Inc., 144A, 8.375%, 12/15/2014 | | 65,000 | | 64,838 |
CSC Holdings, Inc., 7.875%, 12/15/2007 | | 80,000 | | 85,800 |
DaimlerChrysler NA Holdings Corp., 4.75%, 1/15/2008 | | 600,000 | | 612,811 |
Dex Media East LLC/Financial, 12.125%, 11/15/2012 | | 568,000 | | 692,250 |
DIMON, Inc., Series B, 9.625%, 10/15/2011 | | 305,000 | | 333,975 |
Dura Operating Corp.: | | | | |
Series B, 8.625%, 4/15/2012 | | 45,000 | | 46,800 |
Series B, 9.0%, 5/1/2009 EUR | | 25,000 | | 32,282 |
Series D, 9.0%, 5/1/2009 | | 90,000 | | 89,100 |
EchoStar DBS Corp., 144A, 6.625%, 10/1/2014 | | 115,000 | | 116,438 |
Foot Locker, Inc., 8.5%, 1/15/2022 | | 70,000 | | 77,000 |
Friendly Ice Cream Corp., 8.375%, 6/15/2012 | | 205,000 | | 201,156 |
General Motors Corp., 8.25%, 7/15/2023 | | 140,000 | | 145,834 |
Icon Health & Fitness, Inc., 11.25%, 4/1/2012 | | 140,000 | | 117,600 |
Interep National Radio Sales, Inc., Series B, 10.0%, 7/1/2008 | | 125,000 | | 94,219 |
J Crew Intermediate LLC, Step-up Coupon, 0% to 11/15/2005, 16.0% to 5/15/2008 | | 34,889 | | 33,141 |
Jacobs Entertainment Co., 11.875%, 2/1/2009 | | 300,000 | | 339,000 |
Levi Strauss & Co.: | | | | |
7.0%, 11/1/2006 | | 130,000 | | 136,500 |
12.25%, 12/15/2012 | | 15,000 | | 16,688 |
Mediacom LLC, 9.5%, 1/15/2013 | | 295,000 | | 296,106 |
| | |
| | | Principal Amount ($)(f)
| | Value ($)
|
MGM MIRAGE: | | | | |
8.375%, 2/1/2011 | | 260,000 | | 293,150 |
9.75%, 6/1/2007 | | 40,000 | | 44,400 |
Mothers Work, Inc., 11.25%, 8/1/2010 | | 80,000 | | 77,600 |
NCL Corp., 144A, 10.625%, 7/15/2014 | | 190,000 | | 190,000 |
Paxson Communications Corp., 10.75%, 7/15/2008 | | 120,000 | | 126,000 |
Page 249 of 466
| | | | |
PEI Holding, Inc., 11.0%, 3/15/2010 | | 170,000 | | 198,050 |
Petro Stopping Centers, 9.0%, 2/15/2012 | | 250,000 | | 264,375 |
Pinnacle Entertainment, Inc., 8.75%, 10/1/2013 | | 60,000 | | 64,950 |
Premier Entertainment Biloxi LLC/Finance, 10.75%, 2/1/2012 | | 50,000 | | 54,625 |
PRIMEDIA, Inc.: | | | | |
7.665%**, 5/15/2010 | | 225,000 | | 238,500 |
8.875%, 5/15/2011 | | 145,000 | | 153,337 |
Rent-Way, Inc., 11.875%, 6/15/2010 | | 50,000 | | 56,313 |
Restaurant Co., 1.0%, 5/15/2008 | | 199,779 | | 202,276 |
Schuler Homes, Inc., 10.5%, 7/15/2011 | | 175,000 | | 199,062 |
Simmons Bedding Co., 144A, Step-up Coupon, 0% to 12/15/2009, 10.0% to 12/15/2014 | | 165,000 | | 100,650 |
Sinclair Broadcast Group, Inc.: | | | | |
8.0%, 3/15/2012 | | 155,000 | | 164,688 |
8.75%, 12/15/2011 | | 410,000 | | 446,387 |
Sonic Automotive, Inc., Series B, 8.625%, 8/15/2013 | | 245,000 | | 261,231 |
Tele-Communications, Inc. “A”, 9.875%, 6/15/2022 | | 670,000 | | 951,119 |
Toys “R” Us, Inc.: | | | | |
7.375%, 10/15/2018 | | 355,000 | | 328,375 |
7.875%, 4/15/2013 | | 65,000 | | 64,512 |
True Temper Sports, Inc., 8.375%, 9/15/2011 | | 95,000 | | 88,350 |
Trump Holdings & Funding, 12.625%, 3/15/2010* | | 120,000 | | 129,900 |
TRW Automotive, Inc., 11.0%, 2/15/2013 | | 210,000 | | 253,050 |
United Auto Group, Inc., 9.625%, 3/15/2012 | | 140,000 | | 154,700 |
Venetian Casino Resort LLC, 11.0%, 6/15/2010 | | 160,000 | | 182,600 |
VICORP Restaurants, Inc., 10.5%, 4/15/2011 | | 90,000 | | 90,450 |
Virgin River Casino Corp., 144A, 9.0%, 1/15/2012 | | 15,000 | | 15,600 |
Visteon Corp.: | | | | |
7.0%, 3/10/2014 | | 190,000 | | 181,450 |
8.25%, 8/1/2010 | | 90,000 | | 94,275 |
Wheeling Island Gaming, Inc., 10.125%, 12/15/2009 | | 130,000 | | 138,450 |
Williams Scotsman, Inc., 9.875%, 6/1/2007 | | 270,000 | | 270,000 |
Worldspan LP/WS Finance Corp., 9.625%, 6/15/2011 | | 120,000 | | 119,400 |
Wynn Las Vegas LLC, 144A, 6.625%, 12/1/2014 | | 320,000 | | 316,800 |
XM Satellite Radio, Inc., Step-up Coupon, 0% to 12/31/2005, 14.0% to 12/31/2009 | | 165,000 | | 168,300 |
| | |
| | | Principal Amount ($)(f)
| | Value ($)
|
Young Broadcasting, Inc., 8.75%, 1/15/2014 | | 210,000 | | 211,575 |
| | | | |
|
| | | | | 12,538,984 |
| | | | |
|
Consumer Staples 0.2% | | | | |
Agrilink Foods, Inc., 11.875%, 11/1/2008 | | 15,000 | | 15,619 |
Church & Dwight Co., Inc., 144A, 6.0%, 12/15/2012 | | 85,000 | | 86,487 |
Duane Reade, Inc.: | | | | |
144A, 1.0%**, 12/15/2010 | | 70,000 | | 71,050 |
144A, 9.75%, 8/1/2011 | | 175,000 | | 159,250 |
North Atlantic Holding, Inc., Step-up Coupon, 0% to 3/1/2008, 12.25% to 3/1/2014 | | 70,000 | | 28,700 |
Pierre Foods, Inc., 144A, 9.875%, 7/15/2012 | | 35,000 | | 36,225 |
Page 250 of 466
| | | | |
Pinnacle Foods Holding Corp., 144A, 8.25%, 12/1/2013 | | 195,000 | | 185,737 |
Prestige Brands, Inc., 144A, 9.25%, 4/15/2012 | | 15,000 | | 15,938 |
Revlon Consumer Products Corp., 9.0%, 11/1/2006 | | 160,000 | | 158,400 |
Rite Aid Corp., 11.25%, 7/1/2008 | | 30,000 | | 32,550 |
Standard Commercial Corp., 8.0%, 4/15/2012 | | 80,000 | | 82,200 |
Swift & Co., 12.5%, 1/1/2010 | | 150,000 | | 169,500 |
Wornick Co., 10.875%, 7/15/2011 | | 65,000 | | 70,525 |
| | | | |
|
| | | | | 1,112,181 |
| | | | |
|
Energy 0.7% | | | | |
Avista Corp., 9.75%, 6/1/2008 | | 115,000 | | 133,338 |
CenterPoint Energy Resources Corp., Series B, 7.875%, 4/1/2013 | | 345,000 | | 410,064 |
Chesapeake Energy Corp.: | | | | |
6.875%, 1/15/2016 | | 100,000 | | 104,750 |
9.0%, 8/15/2012 | | 140,000 | | 159,950 |
CITGO Petroleum Corp., 144A, 6.0%, 10/15/2011 | | 60,000 | | 59,700 |
Dynegy Holdings, Inc.: | | | | |
6.875%, 4/1/2011 | | 15,000 | | 14,438 |
7.125%, 5/15/2018 | | 215,000 | | 191,619 |
7.625%, 10/15/2026 | | 55,000 | | 47,781 |
144A, 9.875%, 7/15/2010 | | 185,000 | | 206,737 |
Edison Mission Energy, 7.73%, 6/15/2009 | | 410,000 | | 440,750 |
El Paso Production Holding Corp., 7.75%, 6/1/2013 | | 175,000 | | 183,312 |
Enterprise Products Operating LP, 7.5%, 2/1/2011 | | 793,000 | | 899,099 |
Mission Resources Corp., 9.875%, 4/1/2011 | | 155,000 | | 165,463 |
Newpark Resources, Inc., Series B, 8.625%, 12/15/2007 | | 195,000 | | 197,925 |
NGC Corp. Capital Trust, 8.316%, 6/1/2027 | | 100,000 | | 84,875 |
Pemex Project Funding Master Trust, 144A, 3.79%, 6/15/2010** | | 805,000 | | 825,930 |
Southern Natural Gas, 8.875%, 3/15/2010 | | 105,000 | | 117,600 |
Stone Energy Corp.: | | | | |
144A, 6.75%, 12/15/2014 | | 90,000 | | 89,775 |
8.25%, 12/15/2011 | | 215,000 | | 232,200 |
Williams Cos., Inc.: | | | | |
8.125%, 3/15/2012 | | 215,000 | | 248,325 |
| | |
| | | Principal
Amount ($)(f)
| | Value ($)
|
8.75%, 3/15/2032 | | 100,000 | | 114,875 |
| | | | |
|
| | | | | 4,928,506 |
| | | | |
|
Financials 3.4% | | | | |
AAC Group Holding Corp., 144A, Step-up Coupon, 0% to 10/1/2008, 10.25% to 10/1/2012 | | 130,000 | | 87,425 |
Affinia Group, Inc., 144A, 9.0%, 11/30/2014 | | 235,000 | | 244,987 |
Ahold Finance USA, Inc., 6.25%, 5/1/2009 | | 105,000 | | 109,200 |
American General Finance Corp., Series H, 4.0%, 3/15/2011 | | 1,774,000 | | 1,720,434 |
AmeriCredit Corp., 9.25%, 5/1/2009 | | 235,000 | | 252,037 |
BF Saul (REIT), 7.5%, 3/1/2014 | | 145,000 | | 149,350 |
Capital One Bank, 4.875%, 5/15/2008 | | 70,000 | | 71,891 |
Page 251 of 466
| | | | |
Dow Jones CDX: | | | | |
144A, Series 3-1, 7.75%, 12/29/2009 | | 955,000 | | 981,859 |
144A, Series 3-3, 8.0%, 12/29/2009 | | 2,065,000 | | 2,117,916 |
E*TRADE Financial Corp., 144A, 8.0%, 6/15/2011 | | 250,000 | | 268,750 |
Farmers Insurance Exchange, 144A, 8.625%, 5/1/2024 | | 255,000 | | 300,788 |
FINOVA Group, Inc., 7.5%, 11/15/2009 | | 1,390,650 | | 681,418 |
Ford Motor Credit Co.: | | | | |
5.8%, 1/12/2009 | | 792,000 | | 809,536 |
6.875%, 2/1/2006 | | 2,293,000 | | 2,362,249 |
General Motors Acceptance Corp.: | | | | |
6.75%, 1/15/2006 | | 3,910,000 | | 4,011,191 |
6.875%, 9/15/2011 | | 305,000 | | 312,562 |
Goldman Sachs Group, Inc., 4.75%, 7/15/2013 | | 745,000 | | 737,204 |
HSBC Bank USA, 5.875%, 11/1/2034 | | 550,000 | | 556,929 |
JPMorgan Chase & Co., 5.125%, 9/15/2014 | | 570,000 | | 573,739 |
LNR Property Corp., 7.625%, 7/15/2013 | | 75,000 | | 85,125 |
Morgan Stanley, 4.0%, 1/15/2010 | | 676,000 | | 668,321 |
Poster Financial Group, Inc., 8.75%, 12/1/2011 | | 160,000 | | 164,400 |
PXRE Capital Trust I, 8.85%, 2/1/2027 | | 140,000 | | 140,000 |
Qwest Capital Funding, Inc., 6.5%, 11/15/2018 | | 150,000 | | 124,500 |
R.H. Donnelly Finance Corp., 10.875%, 12/15/2012 | | 65,000 | | 77,188 |
Radnor Holdings Corp., 11.0%, 3/15/2010 | | 70,000 | | 60,025 |
RAM Holdings Ltd., 144A, 6.875%, 4/1/2024 | | 1,500,000 | | 1,473,135 |
Republic New York Corp., 5.875%, 10/15/2008 | | 985,000 | | 1,048,414 |
Thornburg Mortgage, Inc., 8.0%, 5/15/2013 | | 45,000 | | 47,813 |
TIG Capital Holdings Trust, 144A, 8.597%, 1/15/2027 | | 185,000 | | 162,337 |
UGS Corp., 144A, 10.0%, 6/1/2012 | | 115,000 | | 130,813 |
Universal City Development, 11.75%, 4/1/2010 | | 180,000 | | 212,625 |
Universal City Florida Holding Co., 144A, 7.2%**, 5/1/2010 | | 65,000 | | 67,600 |
Venoco, Inc., 144A, 8.75%, 12/15/2011 | | 70,000 | | 72,100 |
| | |
| | | Principal
Amount ($)(f)
| | Value ($)
|
Wells Fargo & Co., 4.2%, 1/15/2010 | | 1,118,000 | | 1,122,544 |
| | | | |
|
| | | | | 22,006,405 |
| | | | |
|
Health Care 0.7% | | | | |
AmeriPath, Inc., 10.5%, 4/1/2013 | | 110,000 | | 116,875 |
AmerisourceBergen Corp., 7.25%, 11/15/2012 | | 11,000 | | 12,293 |
Cinacalcet Royalty Subordinated LLC, 8.0%, 3/30/2017 | | 145,000 | | 145,725 |
Curative Health Services, Inc., 10.75%, 5/1/2011 | | 95,000 | | 85,025 |
Encore Medical Corp., 144A, 9.75%, 10/1/2012 | | 85,000 | | 85,850 |
Hanger Orthopedic Group, Inc., 10.375%, 2/15/2009 | | 145,000 | | 149,713 |
Health Care Service Corp., 144A, 7.75%, 6/15/2011 | | 2,695,000 | | 3,153,155 |
HEALTHSOUTH Corp., 10.75%, 10/1/2008 | | 230,000 | | 242,650 |
IDI Acquisition Corp., 144A, 10.75%, 12/15/2011 | | 50,000 | | 51,250 |
InSight Health Services Corp., Series B, 9.875%, 11/1/2011 | | 105,000 | | 106,050 |
Interactive Health LLC, 144A, 7.75%, 4/1/2011 | | 105,000 | | 91,350 |
Page 252 of 466
| | | | |
National Mentor, Inc., 144A, 9.625%, 12/1/2012 | | 20,000 | | 21,250 |
Tenet Healthcare Corp., 6.375%, 12/1/2011 | | 555,000 | | 514,762 |
| | | | |
|
| | | | | 4,775,948 |
| | | | |
|
Industrials 1.0% | | | | |
Aavid Thermal Technologies, Inc., 12.75%, 2/1/2007 | | 140,000 | | 153,300 |
Allied Security Escrow Corp., 144A, 11.375%, 7/15/2011 | | 135,000 | | 141,075 |
Allied Waste North America, Inc., Series B, 5.75%, 2/15/2011 | | 575,000 | | 540,500 |
AMI Semiconductor, Inc., 10.75%, 2/1/2013 | | 45,000 | | 52,875 |
Avondale Mills, Inc., 144A, 9.00%**, 7/1/2012 | | 30,000 | | 27,000 |
BAE System 2001 Asset Trust “B”, Series 2001, 144A, 7.156%, 12/15/2011 | | 309,509 | | 335,952 |
Browning-Ferris Industries: | | | | |
7.4%, 9/15/2035 | | 70,000 | | 61,250 |
9.25%, 5/1/2021 | | 15,000 | | 15,975 |
Cenveo Corp., 7.875%, 12/1/2013 | | 185,000 | | 172,050 |
Clean Harbors, Inc., 144A, 11.25%, 7/15/2012 | | 30,000 | | 33,600 |
Collins & Aikman Floor Cover, Series B, 9.75%, 2/15/2010 | | 260,000 | | 279,500 |
Collins & Aikman Products, 10.75%, 12/31/2011 | | 165,000 | | 168,300 |
Continental Airlines, Inc. “B”, 8.0%, 12/15/2005 | | 140,000 | | 136,500 |
Cornell Companies, Inc., 10.75%, 7/1/2012 | | 185,000 | | 197,719 |
Corrections Corp. of America, 9.875%, 5/1/2009 | | 150,000 | | 166,500 |
Dana Corp., 7.0%, 3/1/2029 | | 210,000 | | 209,475 |
Eagle-Picher Industries, Inc., 9.75%, 9/1/2013 | | 30,000 | | 30,000 |
Erico International Corp., 8.875%, 3/1/2012 | | 120,000 | | 126,000 |
| | |
| | | Principal
Amount ($)(f)
| | Value ($)
|
Evergreen International Aviation, Inc., 12.0%, 5/15/2010 | | 40,000 | | 30,300 |
Goodman Global Holding Co., Inc., 144A, 7.875%, 12/15/2012 | | 205,000 | | 202,950 |
Interface, Inc., 10.375%, 2/1/2010 | | 60,000 | | 69,000 |
ISP Chemco, Inc., Series B, 10.25%, 7/1/2011 | | 230,000 | | 259,900 |
Kansas City Southern: | | | | |
7.5%, 6/15/2009 | | 370,000 | | 388,500 |
9.5%, 10/1/2008 | | 100,000 | | 113,625 |
Kinetek, Inc., Series D, 10.75%, 11/15/2006 | | 260,000 | | 254,150 |
Laidlaw International, Inc., 10.75%, 6/15/2011 | | 70,000 | | 81,725 |
Millennium America, Inc.: | | | | |
7.625%, 11/15/2026 | | 270,000 | | 265,950 |
9.25%, 6/15/2008 | | 190,000 | | 216,125 |
Remington Arms Co., Inc., 10.5%, 2/1/2011 | | 125,000 | | 120,625 |
Sea Containers Ltd., 10.5%, 5/15/2012 | | 45,000 | | 47,362 |
Securus Technologies, Inc., 144A, 11.0%, 9/1/2011 | | 145,000 | | 145,000 |
Ship Finance International Ltd., 8.5%, 12/15/2013 | | 175,000 | | 180,250 |
SPX Corp.: | | | | |
6.25%, 6/15/2011 | | 55,000 | | 58,025 |
7.5%, 1/1/2013 | | 210,000 | | 227,850 |
Technical Olympic USA, Inc.: | | | | |
7.5%, 3/15/2011 | | 70,000 | | 70,525 |
Page 253 of 466
| | | | |
10.375%, 7/1/2012 | | 160,000 | | 179,200 |
Texas Genco LLC, 144A, 6.875%, 12/15/2014 | | 170,000 | | 175,737 |
The Brickman Group, Ltd., Series B, 11.75%, 12/15/2009 | | 60,000 | | 70,200 |
United Rentals North America, Inc.: | | | | |
6.5%, 2/15/2012 | | 155,000 | | 151,125 |
7.0%, 2/15/2014 | | 120,000 | | 112,200 |
7.75%, 11/15/2013 | | 80,000 | | 78,400 |
Westlake Chemical Corp., 8.75%, 7/15/2011 | | 16,000 | | 18,080 |
| | | | |
|
| | | | | 6,364,375 |
| | | | |
|
Information Technology 0.1% | | | | |
Activant Solutions, Inc., 10.5%, 6/15/2011 | | 150,000 | | 161,250 |
Itron, Inc., 144A, 7.75%, 5/15/2012 | | 105,000 | | 106,837 |
Lucent Technologies, Inc., 6.45%, 3/15/2029 | | 425,000 | | 384,625 |
Spheris, Inc., 144A, 11.0%, 12/15/2012 | | 85,000 | | 87,125 |
| | | | |
|
| | | | | 739,837 |
| | | | |
|
Materials 0.9% | | | | |
Aqua Chemical, Inc., 11.25%, 7/1/2008 | | 155,000 | | 124,000 |
ARCO Chemical Co., 9.8%, 2/1/2020 | | 685,000 | | 780,900 |
Associated Materials, Inc., Step-up Coupon, 0% to 3/01/2009, 11.25% to 3/01/2014 | | 375,000 | | 270,000 |
Caraustar Industries, Inc., 9.875%, 4/1/2011 | | 140,000 | | 151,900 |
Constar International, Inc., 11.0%, 12/1/2012 | | 170,000 | | 176,375 |
| | |
| | | Principal
Amount ($)(f)
| | Value ($)
|
Dayton Superior Corp.: | | | | |
10.75%, 9/15/2008 | | 145,000 | | 155,150 |
13.0%, 6/15/2009 | | 325,000 | | 338,000 |
Georgia-Pacific Corp.: | | | | |
8.0%, 1/15/2024 | | 365,000 | | 423,400 |
9.375%, 2/1/2013 | | 185,000 | | 215,525 |
Hercules, Inc.: | | | | |
6.75%, 10/15/2029 | | 115,000 | | 118,738 |
11.125%, 11/15/2007 | | 85,000 | | 101,150 |
Huntsman Advanced Materials, 144A, 11.0%, 7/15/2010 | | 100,000 | | 119,000 |
Huntsman International LLC: | | | | |
144A, 7.375%, 1/1/2015 | | 50,000 | | 50,125 |
144A, 7.5%, 1/1/2015 EUR | | 30,000 | | 40,777 |
Huntsman LLC, 11.625%, 10/15/2010 | | 200,000 | | 236,500 |
IMC Global, Inc., 10.875%, 8/1/2013 | | 35,000 | | 43,750 |
Intermet Corp., 9.75%, 6/15/2009* | | 55,000 | | 26,950 |
International Steel Group, Inc., 6.5%, 4/15/2014 | | 295,000 | | 316,387 |
MMI Products, Inc., Series B, 11.25%, 4/15/2007 | | 130,000 | | 131,950 |
Neenah Corp., 144A, 11.0%, 9/30/2010 | | 250,000 | | 276,250 |
Omnova Solutions, Inc., 11.25%, 6/1/2010 | | 210,000 | | 236,250 |
Owens-Brockway Glass Container, 8.25%, 5/15/2013 | | 55,000 | | 60,500 |
Oxford Automotive, Inc., 144A, 12.0%, 10/15/2010* | | 30,000 | | 18,900 |
Page 254 of 466
| | | | |
Pliant Corp.: | | | | |
Step-up Coupon, 0.% to 12/15/2006, 11.125% to 6/15/2009 | | 25,000 | | 23,094 |
11.125%, 9/1/2009 | | 180,000 | | 196,200 |
Portola Packaging, Inc., 8.25%, 2/1/2012 | | 120,000 | | 94,800 |
Rockwood Specialties Group, Inc., 144A, 7.625%, 11/15/2014 | | 220,000 | | 307,632 |
Sheffield Steel Corp., 144A, 11.375%, 8/15/2011 | | 85,000 | | 87,550 |
TriMas Corp., 9.875%, 6/15/2012 | | 385,000 | | 408,100 |
United States Steel LLC: | | | | |
9.75%, 5/15/2010 | | 133,000 | | 151,620 |
10.75%, 8/1/2008 | | 60,000 | | 70,650 |
| | | | |
|
| | | | | 5,752,123 |
| | | | |
|
Telecommunication Services 1.0% | | | | |
American Cellular Corp., Series B, 10.0%, 8/1/2011 | | 505,000 | | 433,037 |
American Tower Corp., 144A, 7.125%, 10/15/2012 | | 85,000 | | 86,913 |
AT&T Corp.: | | | | |
9.05%, 11/15/2011 | | 175,000 | | 201,469 |
9.75%, 11/15/2031 | | 170,000 | | 202,937 |
Bell Atlantic New Jersey, Inc., Series A, 5.875%, 1/17/2012 | | 825,000 | | 876,534 |
BellSouth Corp., 5.2%, 9/15/2014 | | 610,000 | | 621,725 |
Cincinnati Bell, Inc., 8.375%, 1/15/2014 | | 580,000 | | 587,250 |
Dobson Cellular Systems, Inc., 144A, 6.96%**, 11/1/2011 | | 35,000 | | 36,225 |
Dobson Communications Corp., 8.875%, 10/1/2013 | | 165,000 | | 115,912 |
GCI, Inc., 7.25%, 2/15/2014 | | 120,000 | | 120,000 |
| | |
| | | Principal
Amount ($)(f)
| | Value ($)
|
Insight Midwest LP, 9.75%, 10/1/2009 | | 35,000 | | 36,663 |
IWO Escrow Co., 144A, 6.32%**, 1/15/2012 | | 15,000 | | 15,113 |
LCI International, Inc., 7.25%, 6/15/2007 | | 220,000 | | 213,950 |
Level 3 Financing, Inc., 144A, 10.75%, 10/15/2011 | | 85,000 | | 76,925 |
MCI, Inc., 8.735%, 5/1/2014 | | 560,000 | | 602,000 |
Nextel Communications, Inc., 5.95%, 3/15/2014 | | 105,000 | | 108,675 |
Nextel Partners, Inc., 8.125%, 7/1/2011 | | 130,000 | | 144,300 |
Northern Telecom Capital, 7.875%, 6/15/2026 | | 60,000 | | 59,400 |
PanAmSat Corp., 144A, 9.0%, 8/15/2014 | | 300,000 | | 334,875 |
Qwest Corp.: | | | | |
7.25%, 9/15/2025 | | 480,000 | | 466,800 |
144A, 7.875%, 9/1/2011 | | 180,000 | | 195,300 |
Qwest Services Corp.: | | | | |
144A, 14.0%, 12/15/2010 | | 70,000 | | 84,175 |
144A, 14.5%, 12/15/2014 | | 430,000 | | 543,950 |
Rural Cellular Corp., 9.875%, 2/1/2010 | | 120,000 | | 122,100 |
SBA Telecom, Inc., Step-up Coupon, 0% to 12/15/2007, 9.75% to 12/15/2011 | | 55,000 | | 46,338 |
Triton PCS, Inc., 8.5%, 6/1/2013 | | 35,000 | | 33,775 |
Ubiquitel Operating Co., 9.875%, 3/1/2011 | | 25,000 | | 28,063 |
US Unwired, Inc., Series B, 10.0%, 6/15/2012 | | 170,000 | | 191,675 |
Page 255 of 466
| | | | |
Western Wireless Corp., 9.25%, 7/15/2013 | | 30,000 | | 32,625 |
| | | | |
|
| | | | | 6,618,704 |
| | | | |
|
Utilities 1.3% | | | | |
AES Corp., 144A, 8.75%, 5/15/2013 | | 35,000 | | 39,769 |
Allegheny Energy Supply Co. LLC, 144A, 8.25%, 4/15/2012 | | 75,000 | | 83,813 |
Calpine Corp.: | | | | |
8.25%, 8/15/2005 | | 144,000 | | 145,440 |
144A, 8.5%, 7/15/2010 | | 215,000 | | 184,362 |
CMS Energy Corp., 8.5%, 4/15/2011 | | 20,000 | | 22,725 |
Consumers Energy Co.: | | | | |
Series F, 4.0%, 5/15/2010 | | 1,245,000 | | 1,222,849 |
144A, 5.0%, 2/15/2012 | | 975,000 | | 992,519 |
DPL, Inc., 6.875%, 9/1/2011 | | 280,000 | | 305,797 |
Midwest Generation LLC, 8.75%, 5/1/2034 | | 80,000 | | 90,800 |
NorthWestern Corp., 144A, 5.875%, 11/1/2014 | | 55,000 | | 56,263 |
NRG Energy, Inc., 144A, 8.0%, 12/15/2013 | | 525,000 | | 572,250 |
Pedernales Electric Cooperative, Series 02-A, 144A, 6.202%, 11/15/2032 | | 1,050,000 | | 1,129,674 |
Progress Energy, Inc., 6.75%, 3/1/2006 | | 1,275,000 | | 1,323,011 |
PSE&G Energy Holdings LLC: | | | | |
8.5%, 6/15/2011 | | 155,000 | | 176,894 |
10.0%, 10/1/2009 | | 165,000 | | 195,112 |
TNP Enterprises, Inc., Series B, 10.25%, 4/1/2010 | | 85,000 | | 90,738 |
| | |
| | | Principal
Amount ($)(f)
| | Value ($)
|
Xcel Energy, Inc., 7.0%, 12/1/2010 | | 1,780,000 | | 2,006,469 |
| | | | | 8,638,485 |
| | | | |
|
Total Corporate Bonds (Cost $72,042,402) | | | | 73,475,548 |
| | | | |
|
Foreign Bonds — US$ Denominated 5.3% | | | | |
Consumer Discretionary 0.2% | | | | |
Advertising Directory Solutions, Inc., 144A, 9.25%, 11/15/2012 | | 110,000 | | 115,500 |
Jafra Cosmetics International, Inc., 10.75%, 5/15/2011 | | 235,000 | | 265,550 |
Kabel Deutschland GmbH, 144A, 10.625%, 7/1/2014 | | 245,000 | | 281,750 |
Shaw Communications, Inc.: | | | | |
7.25%, 4/6/2011 | | 60,000 | | 66,150 |
8.25%, 4/11/2010 | | 415,000 | | 472,062 |
Vicap SA, 11.375%, 5/15/2007 | | 25,000 | | 25,313 |
Vitro Envases Norteamerica SA, 144A, 10.75%, 7/23/2011 | | 85,000 | | 88,188 |
Vitro SA de CV, Series A, 144A, 11.75%, 11/1/2013 | | 200,000 | | 193,500 |
| | | | |
|
| | | | | 1,508,013 |
| | | | |
|
Consumer Staples 0.1% | | | | |
Burns Philip Capital Property Ltd., 10.75%, 2/15/2011 | | 140,000 | | 157,500 |
Fage Dairy Industry SA, 9.0%, 2/1/2007 | | 230,000 | | 231,150 |
Grupo Cosan SA, 144A, 9.0%, 11/1/2009 | | 50,000 | | 52,250 |
| | | | |
|
| | | | | 440,900 |
| | | | |
|
Page 256 of 466
| | | | |
Energy 0.3% | | | | |
Gazprom OAO, 144A, 9.625%, 3/1/2013 | | 300,000 | | 354,000 |
Luscar Coal Ltd., 9.75%, 10/15/2011 | | 105,000 | | 119,175 |
Petroleos Mexicanos, Series P, 9.5%, 9/15/2027 | | 450,000 | | 567,000 |
Petroleum Geo-Services ASA, 10.0%, 11/5/2010 | | 624,002 | | 711,362 |
Secunda International Ltd., 144A, 9.76%**, 9/1/2012 | | 140,000 | | 137,200 |
| | | | |
|
| | | | | 1,888,737 |
| | | | |
|
Financials 1.9% | | | | |
Arcel Finance Ltd., 144A, 5.984%, 2/1/2009 | | 954,930 | | 986,261 |
Conproca SA de CV, 12.0%, 6/16/2010 | | 100,000 | | 126,000 |
Deutsche Telekom International Finance BV: | | | | |
8.5%, 6/15/2010 | | 240,000 | | 285,930 |
8.75%, 6/15/2030 | | 1,149,000 | | 1,517,206 |
Eircom Funding, 8.25%, 8/15/2013 | | 155,000 | | 171,275 |
Endurance Specialty Holdings Ltd., 7.0%, 7/15/2034 | | 195,000 | | 200,791 |
Mantis Reef Ltd., 144A, 4.692%, 11/14/2008 | | 1,115,000 | | 1,118,255 |
Mizuho Financial Group, 8.375%, 12/29/2049 | | 1,865,000 | | 2,043,853 |
New ASAT (Finance) Ltd., 144A, 9.25%, 2/1/2011 | | 175,000 | | 158,813 |
QBE Insurance Group Ltd., 144A, 5.647%**, 7/1/2023 | | 1,155,000 | | 1,134,412 |
| | |
| | | Principal Amount ($)(f)
| | Value ($)
|
Royal Bank of Scotland Group PLC, Series 3, 7.816%, 11/29/2049 | | 1,045,000 | | 1,086,640 |
Westfield Capital Corp., 144A, 4.375%, 11/15/2010 | | 3,475,000 | | 3,436,987 |
| | | | |
|
| | | | | 12,266,423 |
| | | | |
|
Health Care 0.0% | | | | |
Biovail Corp., 7.875%, 4/1/2010 | | 110,000 | | 113,850 |
Elan Financial PLC, 144A, 7.75%, 11/15/2011 | | 30,000 | | 31,950 |
| | | | |
|
| | | | | 145,800 |
| | | | |
|
Industrials 0.3% | | | | |
CP Ships Ltd., 10.375%, 7/15/2012 | | 170,000 | | 196,137 |
Grupo Transportacion Ferroviaria Mexicana SA de CV: | | | | |
10.25%, 6/15/2007 | | 235,000 | | 250,275 |
11.75%, 6/15/2009 | | 85,000 | | 86,594 |
12.5%, 6/15/2012 | | 98,000 | | 114,415 |
LeGrand SA, 8.5%, 2/15/2025 | | 130,000 | | 153,400 |
Stena AB: | | | | |
144A, 7.0%, 12/1/2016 | | 55,000 | | 54,450 |
9.625%, 12/1/2012 | | 95,000 | | 107,350 |
Tyco International Group SA: | | | | |
6.875%, 1/15/2029 | | 481,000 | | 550,991 |
7.0%, 6/15/2028 | | 484,000 | | 562,716 |
| | | | |
|
| | | | | 2,076,328 |
| | | | |
|
Information Technology 0.1% | | | | |
Flextronics International Ltd., 144A, 6.25%, 11/15/2014 | | 190,000 | | 188,100 |
Magnachip Semiconductor SA: | | | | |
Page 257 of 466
| | | | |
144A, 6.875%, 12/15/2011 | | 70,000 | | 72,100 |
144A, 8.0%, 12/15/2014 | | 65,000 | | 67,763 |
| | | | |
|
| | | | | 327,963 |
| | | | |
|
Materials 1.0% | | | | |
Alrosa Finance SA, 144A, 8.875%, 11/17/2014 | | 125,000 | | 128,438 |
Avecia Group PLC, 11.0%, 7/1/2009 | | 385,000 | | 396,550 |
Cascades, Inc.: | | | | |
7.25%, 2/15/2013 | | 225,000 | | 238,500 |
144A, 7.25%, 2/15/2013 | | 10,000 | | 10,600 |
Celulosa Arauco y Constitucion SA, 7.75%, 9/13/2011 | | 435,000 | | 504,480 |
Citigroup (JSC Severstal), 144A, 9.25%, 4/19/2014 | | 200,000 | | 199,000 |
Citigroup Global (Severstal), 8.625%, 2/24/2009 | | 24,000 | | 24,098 |
Crown Euro Holdings SA, 10.875%, 3/1/2013 | | 125,000 | | 147,812 |
ISPAT Inland ULC, 9.75%, 4/1/2014 | | 150,000 | | 185,250 |
Rhodia SA, 8.875%, 6/1/2011 | | 150,000 | | 151,125 |
Sappi Papier Holding AG, 144A, 6.75%, 6/15/2012 | | 1,735,000 | | 1,927,774 |
Sino-Forest Corp., 144A, 9.125%, 8/17/2011 | | 85,000 | | 92,863 |
Sociedad Concesionaria Autopista Central, 144A, 6.223%, 12/15/2026 | | 2,015,000 | | 2,114,460 |
Tembec Industries, Inc., 8.5%, 2/1/2011 | | 620,000 | | 623,100 |
| | | | |
|
| | | | | 6,744,050 |
| | | | |
|
| | |
| | | Principal Amount ($)(f)
| | Value ($)
|
Sovereign Bonds 0.9% | | | | |
Dominican Republic, 9.04%, 1/23/2013 | | 100,000 | | 83,750 |
Federative Republic of Brazil: | | | | |
8.875%, 10/14/2019 | | 215,000 | | 226,610 |
9.25%, 10/22/2010 | | 280,000 | | 313,040 |
11.0%, 8/17/2040 | | 310,000 | | 367,815 |
Government of Ukraine, 7.65%, 6/11/2013 | | 300,000 | | 320,400 |
Republic of Argentina: | | | | |
Series BGLO, 8.375%, 12/20/2049* | | 595,000 | | 193,375 |
11.75%, 4/7/2009* | | 515,000 | | 175,100 |
11.75%, 6/15/2015* | | 475,000 | | 160,312 |
Republic of Bulgaria, 8.25%, 1/15/2015 | | 300,000 | | 377,220 |
Republic of Colombia: | | | | |
10.75%, 1/15/2013 | | 50,000 | | 59,750 |
11.75%, 2/25/2020 | | 40,000 | | 51,400 |
Republic of Ecuador, Step-up Coupon 8.0% to 8/15/2005, 9.0% to 8/15/2006, 10.0% to 8/15/2030 | | 170,000 | | 146,625 |
Republic of Philippines, 9.375%, 1/18/2017 | | 270,000 | | 280,463 |
Republic of Turkey: | | | | |
7.25%, 3/15/2015 | | 135,000 | | 138,712 |
9.0%, 6/30/2011 | | 20,000 | | 22,850 |
9.5%, 1/15/2014 | | 45,000 | | 53,100 |
11.75%, 6/15/2010 | | 300,000 | | 376,500 |
11.875%, 1/15/2030 | | 260,000 | | 374,400 |
Page 258 of 466
| | | | |
Republic of Venezuela: | | | | |
9.25%, 9/15/2027 | | 140,000 | | 147,700 |
10.75%, 9/19/2013 | | 270,000 | | 323,325 |
Russian Federation: | | | | |
Step-up Coupon, 5.0% to 3/31/2007, 7.5% to 3/31/2030 | | 400,000 | | 413,760 |
11.0%, 7/24/2018 | | 230,000 | | 321,586 |
Russian Ministry of Finance, Series VII, 3.0%, 5/14/2011 | | 60,000 | | 50,598 |
United Mexican States: | | | | |
Series A, 6.75%, 9/27/2034 | | 375,000 | | 370,312 |
8.375%, 1/14/2011 | | 125,000 | | 146,813 |
11.375%, 9/15/2016 | | 270,000 | | 398,520 |
| | | | |
|
| | | | | 5,894,036 |
| | | | |
|
Telecommunication Services 0.5% | | | | |
Alestra SA de RL de CV, 8.0%, 6/30/2010 | | 35,000 | | 29,663 |
America Movil SA de CV, 144A, 5.75%, 1/15/2015 | | 790,000 | | 788,198 |
Axtel SA, 11.0%, 12/15/2013 | | 200,000 | | 215,500 |
Embratel, Series B, 11.0%, 12/15/2008 | | 145,000 | | 165,300 |
Esprit Telecom Group PLC, 11.5%, 12/15/2007* | | 630,000 | | 63 |
Global Crossing UK Finance, 144A, 10.75%, 12/15/2014 | | 160,000 | | 158,000 |
Inmarsat Finance PLC, 7.625%, 6/30/2012 | | 160,000 | | 166,400 |
Innova S. de R.L., 9.375%, 9/19/2013 | | 100,000 | | 113,750 |
INTELSAT, 6.5%, 11/1/2013 | | 200,000 | | 182,000 |
Millicom International Cellular SA, 144A, 10.0%, 12/1/2013 | | 315,000 | | 329,569 |
Mobifon Holdings BV, 12.5%, 7/31/2010 | | 65,000 | | 77,106 |
| | |
| | | Principal Amount ($)(f)
| | Value ($)
|
Mobile Telesystems Financial, 144A, 8.375%, 10/14/2010 | | 110,000 | | 112,200 |
Nortel Networks Corp., 6.875%, 9/1/2023 | | 260,000 | | 244,400 |
Nortel Networks Ltd., 6.125%, 2/15/2006 | | 580,000 | | 590,150 |
Rogers Wireless Communications, Inc., 6.375%, 3/1/2014 | | 115,000 | | 113,850 |
| | | | |
|
| | | | | 3,286,149 |
| | | | |
|
Utilities 0.0% | | | | |
Calpine Canada Energy Finance, 8.5%, 5/1/2008 | | 345,000 | | 282,900 |
| | | | |
|
Total Foreign Bonds — US$ Denominated (Cost $34,707,820) | | | | 34,861,299 |
| | | | |
|
Foreign Bonds — Non US$ Denominated 0.7% | | | | |
Consumer Discretionary 0.0% | | | | |
Victoria Acquisition III BV, 144A, 7.875%, 10/1/2014 EUR | | 80,000 | | 109,284 |
| | | | |
|
Industrials 0.1% | | | | |
Grohe Holdings GmbH, 144A, 8.625%, 10/1/2014 EUR | | 185,000 | | 269,063 |
| | | | |
|
Materials 0.0% | | | | |
Rhodia SA, 9.25%, 6/1/2011 EUR | | 115,000 | | 159,049 |
| | | | |
|
Sovereign Bonds 0.6% | | | | |
Mexican Bonds: | | | | |
Series M-20, 8.0%, 12/7/2023 MXN | | 2,750,000 | | 192,675 |
Page 259 of 466
| | | | |
Series MI-10, 8.0%, 12/19/2013 MXN | | 44,797,000 | | 3,579,500 |
Republic of Argentina: | | | | |
Series FEB, 11.0%, 2/26/2008* EUR | | 80,000 | | 31,806 |
Step-up Coupon, 8.25% to 7/16/2006, 9.0% to 7/6/2010* EUR | | 180,000 | | 71,565 |
Republic of Colombia, 11.75%, 3/1/2010 COP | | 131,000,000 | | 57,081 |
Republic of Romania, 5.75%, 7/2/2010 EUR | | 110,000 | | 163,318 |
| | | | |
|
| | | | | 4,095,945 |
| | | | |
|
Total Foreign Bonds — Non US$ Denominated (Cost $4,469,099) | | | | 4,633,341 |
| | | | |
|
Asset Backed 2.9% | | | | |
Automobile Receivables 0.2% | | | | |
Daimler Chrysler Auto Trust “A4”, Series 2002-A, 4.49%, 10/6/2008 | | 672,000 | | 676,146 |
MMCA Automobile Trust: | | | | |
“A4”, Series 2002-4, 3.05%, 11/16/2009 | | 700,000 | | 697,937 |
“B”, Series 2002-1, 5.37%, 1/15/2010 | | 327,711 | | 331,095 |
| | | | |
|
| | | | | 1,705,178 |
| | | | |
|
| | |
| | | Principal Amount ($)(f)
| | Value ($)
|
Home Equity Loans 2.4% | | | | |
Argent NIM Trust “A”, Series 2004-WN2, 144A, 4.55%, 4/25/2034 | | 396,093 | | 396,861 |
Countrywide Asset-Backed Certificates, “N1”, Series 2004-2N, 144A, 5.0%, 2/25/2035 | | 639,347 | | 636,189 |
Countrywide Home Equity Loan Trust: | | | | |
Series 2004-C, 2.32%**, 1/15/2034 | | 1,352,885 | | 1,350,007 |
“2A”, Series 2004-D, 2.35%**, 6/15/2029 | | 1,651,283 | | 1,651,282 |
Countrywide Home Loan: | | | | |
“A16”, Series 2002-36, 5.25%, 1/25/2033 | | 250,507 | | 250,389 |
“1A6”, Series 2003-1, 5.5%, 3/25/2033 | | 352,932 | | 353,882 |
Long Beach Asset Holdings Corp., “N1”, Seies 2004-2, 144A, 4.94%, 6/25/2034 | | 1,640,741 | | 1,636,639 |
Master Alternative Loan Trust, “5A1”, Series 2005-1, 5.5%, 1/1/2019 (c) | | 1,290,000 | | 1,326,886 |
Merrill Lynch Mortgage Investors, Inc., “A2B”, Series 2004-HE2, 2.798%**, 8/25/2035 | | 1,840,000 | | 1,841,291 |
Park Place Securities NIM Trust: | | | | |
“A”, Series 2004-MHQ1, 144A, 2.487%, 12/25/2034 | | 1,293,605 | | 1,293,605 |
“C”, Series 2004-MHQ1, 144A, 4.458%, 12/25/2034 | | 1,445,000 | | 1,445,000 |
Park Place Securities Trust, “B”, Series 2004-WHQ1, 144A, 3.483%, 9/25/2034 | | 1,555,000 | | 1,552,667 |
Residential Asset Securities Corp., “AI6”, Series 2000-KS1, 7.905%, 2/25/2031 | | 1,741,772 | | 1,814,561 |
| | | | |
|
| | | | | 15,549,259 |
| | | | |
|
Industrials 0.3% | | | | |
Delta Air Lines, Inc., “G-2”, Series 2002-1, 6.417%, 7/2/2012 | | 868,000 | | 906,126 |
Northwest Airlines, “G”, Series 1999-3, 7.935%, 4/1/2019 | | 804,126 | | 880,155 |
| | | | |
|
| | | | | 1,786,281 |
| | | | |
|
Total Asset Backed (Cost $19,104,253) | | | | 19,040,718 |
| | | | |
|
Page 260 of 466
| | | | |
US Government Agency Sponsored Pass-Throughs 1.0% | | | | |
Federal National Mortgage Association: | | | | |
5.0% with various maturities from 6/1/2018 until 3/1/2034 | | 3,965,751 | | 3,965,028 |
6.0%, 11/1/2017 | | 818,371 | | 859,089 |
6.5% with various maturities from 5/1/2017 until 9/1/2034 | | 1,503,946 | | 1,579,834 |
8.0%, 9/1/2015 | | 304,995 | | 324,394 |
| | | | |
|
Total US Government Agency Sponsored Pass-Throughs (cost $6,728,364) | | | | 6,728,345 |
| | | | |
|
US Government Backed 3.4% | | | | |
US Treasury Bill, 1.56%**, 1/20/2005 (e) | | 30,000 | | 29,975 |
| | |
| | | Principal
Amount ($)(f)
| | Value ($)
|
US Treasury Bond: | | | | |
6.0%, 2/15/2026 | | 6,507,000 | | 7,453,820 |
7.25%, 5/15/2016 | | 3,396,000 | | 4,250,838 |
7.5%, 11/15/2016 | | 240,000 | | 306,703 |
US Treasury Note: | | | | |
3.25%, 1/15/2009 | | 9,449,000 | | 9,367,058 |
4.25%, 11/15/2013 | | 970,000 | | 976,101 |
| | | | |
|
Total US Government Backed (Cost $21,765,475) | | | | 22,384,495 |
| | | | |
|
Commercial and Non-Agency Mortgage-Backed Securities 2.3% | | | | |
Bank of America Mortgage Securities, “2A6”, Series 2004-G, 4.657%**, 8/25/2034 | | 2,275,000 | | 2,308,576 |
Bank of America-First Union Commercial Mortgage, Inc., “A1”, Series 2001-3, 4.89%, 4/11/2037 | | 753,626 | | 770,617 |
Citigroup Mortgage Loan Trust, Inc., “1CB2”, Series 2004-NCM2, 6.75%, 8/25/2034 | | 249,145 | | 259,655 |
Countrywide Alternative Loan Trust, “1A1”, Series 2004-J1, 6.0%, 2/25/2034 | | 552,355 | | 559,991 |
Countrywide Home Loans, “A5”, Series 2002-27, 5.5%, 12/25/2032 | | 631,480 | | 631,825 |
First Union-Lehman Brothers Commercial Mortgage, “A3”, Series 1997-C1, 7.38%, 4/18/2029 | | 1,639,701 | | 1,744,730 |
Master Adjustable Rate Mortgages Trust, “9A2”, Series 2004-5, 4.88%**, 6/25/2032 | | 1,200,000 | | 1,203,475 |
Master Alternative Loan Trust: | | | | |
“3A1”, Series 2004-5, 6.5%, 6/25/2034 | | 319,168 | | 332,234 |
“8A1”, Series 2004-3, 7.0%, 4/25/2034 | | 621,960 | | 649,753 |
Master Asset Securitization Trust, “8A1”, Series 2003-6, 5.5%, 7/25/2033 | | 1,107,927 | | 1,116,929 |
Mortgage Capital Funding, Inc., “A3”, Series 1997-MC1, 7.288%, 7/20/2027 | | 1,152,161 | | 1,191,259 |
Residential Asset Securities Corp., “AI”, Series 2003-KS9, 4.71%, 3/25/2033 | | 1,845,000 | | 1,874,116 |
Structured Asset Securities Corp., “2A1”, Series 2003-1, 6.0%, 2/25/2018 | | 105,819 | | 109,787 |
Wachovia Bank Commercial Mortgage Trust, “A5”, Series 2004-C11, 5.215%, 1/15/2041 | | 1,097,000 | | 1,129,422 |
Washington Mutual Mortgage Securities Corp.: | | | | |
“A7, Series 2004-AR9, 4.267%, 8/25/2034 | | 1,098,000 | | 1,098,865 |
“4A1”, Series 2002-S7, 4.5%, 11/25/2032 | | 204,173 | | 204,567 |
| | | | |
|
Total Commercial and Non-Agency Mortgage-Backed Securities (Cost $15,222,370) | | | | 15,185,801 |
| | | | |
|
Collateralized Mortgage Obligations 7.1% | | | | |
Fannie Mae, “A1”, Series 2002-93, 6.5%, 3/25/2032 | | 479,385 | | 497,038 |
Page 261 of 466
| | | | |
| | | Principal
Amount ($)(f)
| | Value ($)
|
Fannie Mae Grantor Trust: | | | | |
“1A3”, Series 2004-T2, 7.0%, 11/25/2043 | | 562,651 | | 596,233 |
“A2”, Series 2002-T16, 7.0%, 7/25/2042 | | 1,315,416 | | 1,393,927 |
Fannie Mae Whole Loan: | | | | |
“3A2B”, Series 2003-W10, 3.056%, 7/25/2037 | | 1,250,000 | | 1,240,246 |
“1A3”, Series 2004-W1, 4.49%, 11/25/2043 | | 1,195,000 | | 1,200,508 |
“2A”, Series 2002-W1, 7.5%, 2/25/2042 | | 866,549 | | 925,744 |
“5A”, Series 2004-W2, 7.5%, 3/25/2044 | | 1,718,056 | | 1,839,049 |
Federal Home Loan Mortgage Corp.: | | | | |
“PV”, Series 2726, 3.5%, 4/15/2026 | | 1,645,000 | | 1,640,101 |
“QC”, Series 2694, 3.5%, 9/15/2020 | | 1,900,000 | | 1,888,295 |
“NB”, Series 2750, 4.0%, 12/15/2022 | | 1,558,000 | | 1,555,936 |
“ME”, Series 2691, 4.5%, 4/15/2032 | | 3,040,000 | | 2,908,995 |
“PE”, Series 2727, 4.5%, 7/15/2032 | | 1,250,000 | | 1,191,966 |
“QH”, Series 2694, 4.5%, 3/15/2032 | | 2,990,000 | | 2,880,253 |
“PE”, Series 2777, 5.0%, 4/15/2033 | | 2,365,000 | | 2,348,994 |
“PQ”, Series 2844, 5.0%, 5/15/2023 | | 2,220,000 | | 2,287,088 |
“QC”, Series 2836, 5.0%, 9/15/2022 | | 2,220,000 | | 2,279,616 |
“TE”, Series 2780, 5.0%, 1/15/2033 | | 1,685,000 | | 1,675,349 |
“PE”, Series 2512, 5.5%, 2/15/2022 | | 420,000 | | 436,118 |
“BD”, Series 2453, 6.0%, 5/15/2017 | | 2,250,000 | | 2,347,692 |
Federal National Mortgage Association: | | | | |
“NE”, Series 2004-52, 4.5%, 7/25/2033 | | 1,118,000 | | 1,062,241 |
“QG”, Series 2004-29, 4.5%, 12/25/2032 | | 1,245,000 | | 1,183,932 |
“WB”, Series 2003-106, 4.5%, 10/25/2015 | | 1,870,000 | | 1,897,847 |
“A2”, Series 2002-W10, 4.7%, 8/25/2042 | | 13,886 | | 13,874 |
“KY”, Series 2002-55, 4.75%, 4/25/2028 | | 138,093 | | 137,873 |
“1A3”, Series 2003-W19, 4.783%, 11/25/2033 | | 1,175,000 | | 1,181,965 |
“PD”, Series 2002-31, 6.0%, 11/25/2021 | | 6,500,000 | | 6,721,396 |
“PM”, Series 2001-60, 6.0%, 3/25/2030 | | 555,004 | | 562,179 |
“HM”, Series 2002-36, 6.5%, 12/25/2029 | | 111,715 | | 113,051 |
FHLMC Structured Pass-Through Securities, “3A”, Series T-58, 7.0%, 9/25/2043 | | 871,147 | | 922,327 |
Government National Mortgage Association, “PD”, Series 2004-30, 5.0%, 2/20/2033 | | 1,115,000 | | 1,109,851 |
| | | | |
|
Total Collateralized Mortgage Obligations (Cost $45,449,574) | | | | 46,039,684 |
| | | | |
|
| | | Principal
Amount ($)(f)
| | Value ($)
|
Municipal Investments 1.9% | | | | |
Broward County, FL, Airport Revenue, Airport Systems Revenue, Series J-2, 6.13%, 10/1/2007 (d) | | 1,000,000 | | 1,062,080 |
Illinois, Higher Education Revenue, Educational Facilities Authority, Series C, 7.1%, 7/1/2012 (d) | | 1,000,000 | | 1,156,040 |
Mashantucket, CT, Special Assessment Revenue, Western Pequot Tribe Special Revenue, Series A, 144A, 6.57%, 9/1/2013 (d) | | 1,285,000 | | 1,410,030 |
New York, General Obligation, Environmental Facilities Corp., Series B, 4.95%, 1/1/2013 (d) | | 1,895,000 | | 1,933,260 |
Ohio, Sales & Special Tax Revenue, 7.6%, 10/1/2016 (d) | | 1,000,000 | | 1,081,940 |
Page 262 of 466
| | | | |
Passaic County, NJ, County General Obligation, 5.0%, 2/15/2017 (d) | | 1,735,000 | | 1,727,886 |
Texas, American Campus Properties Student Housing Financing Ltd, 6.125%, 8/1/2023 (d) | | 1,040,000 | | 1,109,857 |
Union County, NJ, Improvement Authority, Student Loan Revenue, 5.29%, 4/1/2018 (d) | | 1,185,000 | | 1,208,807 |
Washington, Industrial Development Revenue, 3.5%, 10/1/2010 (d) | | 1,840,000 | | 1,766,529 |
| | | | |
|
Total Municipal Investments (Cost $12,310,926) | | | | 12,456,429 |
| | | | |
|
Government National Mortgage Association 0.4% | | | | |
Government National Mortgage Association: | | | | |
5.0%, 9/20/2033 | | 1,053,108 | | 1,054,020 |
6.0%, 7/20/2034 | | 1,637,251 | | 1,696,008 |
| | | | |
|
Total Government National Mortgage Association (Cost $2,727,906) | | | | 2,750,028 |
| | | | |
|
| | | | |
| | | Shares
| | Value ($)
|
Other Investments 0.1% | | | | |
Hercules Trust II (Bond Unit) (Cost $398,781) | | 510,000 | | 428,400 |
| | | | |
|
Exchange Traded Fund 0.1% | | | | |
Semiconductor HOLDRs Trust (Cost $843,677) | | 24,200 | | 807,312 |
| | | | |
|
Cash Equivalents 3.2% | | | | |
Scudder Cash Management QP Trust, 2.24% (b) (Cost $21,146,078) | | 21,146,078 | | 21,146,078 |
| | | | |
|
| | | | |
| | | % of Net Assets
| | Value ($)
|
Total Investment Portfolio (Cost $585,559,850) (a) | | 99.7 | | 652,892,616 |
| | | | |
|
Other Assets and Liabilities, Net | | 0.3 | | 1,657,614 |
| | | | |
|
Net Assets | | 100.0 | | 654,550,230 |
| | | | |
|
Notes to Scudder Total Return Portfolio of Investments
| * | Non-income producing security. In the case of a bond, generally denotes that the issuer has defaulted on the payment of principal or interest. The following table represents bonds that are in default. |
| | | | | | | | | | | | | | |
Security
| | Coupon
| | Maturity
Date
| | Principal Amount
| | Acqusition
Cost
| | Value
|
Esprit Telecom Group PLC | | 11.5 | | 12/15/2007 | | 630,000 | | USD | | $ | 640,458 | | $ | 63 |
Intermet Corp. | | 9.75 | | 6/15/2009 | | 55,000 | | USD | | | 22,550 | | | 26,950 |
Oxford Automotive, Inc. | | 12 | | 10/15/2010 | | 30,000 | | USD | | | 14,325 | | | 18,900 |
Republic of Argentina: | | | | | | | | | | | | | | |
| | | 8.375 | | 12/20/2049 | | 595,000 | | USD | | | 189,508 | | | 193,375 |
| | | 9 | | 7/6/2010 | | 180,000 | | EUR | | | 70,101 | | | 71,565 |
| | | 11 | | 2/26/2008 | | 80,000 | | EUR | | | 31,417 | | | 31,806 |
| | | 11.75 | | 4/7/2009 | | 515,000 | | USD | | | 170,525 | | | 175,100 |
| | | 11.75 | | 6/15/2015 | | 475,000 | | USD | | | 157,766 | | | 160,312 |
Trump Holdings & Funding | | 12.625 | | 3/15/2010 | | 120,000 | | USD | | | 130,500 | | | 129,900 |
| | | | | | | | | | |
|
| |
|
|
| | | | | | | | | | | $ | 1,427,150 | | $ | 807,971 |
| | | | | | | | | | |
|
| |
|
|
| ** | Floating rate notes are securities whose yields vary with a designed market value, such as the coupon-equivalent of the US Treasury Bill rate. These securities are shown at their current rate as of December 31, 2004. |
Page 263 of 466
| (a) | The cost for federal income tax purposes was $592,425,338. At December 31, 2004, net unrealized appreciation for all securities based on tax cost was $60,467,278. This consisted of aggregate gross unrealized appreciation for all securities in which there was an excess of value over tax cost of $68,448,883 and aggregate gross unrealized depreciation for all securities in which there was an excess of tax cost over value of $7,981,605. |
| (b) | Scudder Cash Management QP Trust is managed by Deutsche Investment Management Americas Inc. The rate shown is the annualized seven-day yield at period end. |
| (c) | When-issued of forward delivery security (see Notes to Financial Statements). |
| (d) | Bond is insured by one of these companies: |
| | | | |
Insurance Coverage
| | As a % of
Total Investment Portfolio
|
AMBAC | | AMBAC Assurance Corp. | | 0.5 |
FGIC | | Financial Guaranty Insurance Company | | 0.3 |
FSA | | Financial Security Assurance | | 0.7 |
MBIA | | Municipal Bond Investors Assurance | | 0.4 |
| (e) | At December 31, 2004, this security has been pledged to cover, in whole or part, initial margin requirements for open future contracts. |
| | | | | | | | | | | |
Futures
| | Expiration
Date
| | Contracts
| | Aggregate
Face Value ($)
| | Value ($)
| | Unrealized
Depreciation ($)
| |
Russell 2000 | | 3/17/2005 | | 2 | | 655,784 | | 653,950 | | (1,834 | ) |
| (f) | Principal amount stated in US dollars unless otherwise noted. |
144A: Security exempt from registration under Rule 144A of the Securities Act of 1933. These securities may be resold in transactions exempt from registrations, normally to qualified institutional buyers.
ADR: American Depositary Receipts
PIK: Denotes that all or a portion of the income is paid in kind.
REIT: Real Estate Investment Trust
HOLDRs: Holding Company Depositary Receipts
Included in the portfolio are investments in mortgage or asset-backed securities which are interests in separate pools of mortgages or assets. Effective maturities of these investments may be shorter than stated maturities due to prepayments. Some separate investments in the Federal Home Loan Mortgage Corp. and the Federal National Mortgage Association and the Government National Mortgage Association issues which have similar coupon rates have been aggregated for presentation purposes in the investment portfolio.
| | |
Currency Abbreviations
|
COP | | Colombian Peso |
EUR | | Euro |
MXN | | Mexican Peso |
The accompanying notes are an integral part of the financial statements.
Page 264 of 466
Financial Statements
Statement of Assets and Liabilities as of December 31, 2004
| | | | |
Assets | | | | |
Investments: | | | | |
Investments in securities, at value (cost $564,413,772) | | $ | 631,746,538 | |
Investment in Scudder Cash Management QP Trust (cost $21,146,078) | | | 21,146,078 | |
| | |
|
|
|
Total investments in securities, at value (cost $585,559,850) | | | 652,892,616 | |
| | |
|
|
|
Cash | | | 39,710 | |
Foreign currency, at value (cost $39,896) | | | 40,789 | |
Receivable for investments sold | | | 1,340,611 | |
Dividends receivable | | | 578,618 | |
Interest receivable | | | 2,976,490 | |
Receivable for Portfolio shares sold | | | 16,775 | |
Unrealized appreciation on forward foreign currency exchange contracts | | | 127,902 | |
Receivable for daily variation margin on open futures contracts | | | 450 | |
Foreign taxes recoverable | | | 2,988 | |
Other assets | | | 17,537 | |
| | |
|
|
|
Total assets | | | 658,034,486 | |
| | |
|
|
|
Liabilities | | | | |
Payable for investments purchased | | | 496,312 | |
Payable for when-issued and forward delivery securities | | | 1,332,798 | |
Payable for Portfolio shares redeemed | | | 984,908 | |
Unrealized depreciation on forward foreign currency exchange contracts | | | 227,351 | |
Net payable on closed forward foreign currency exchange contracts | | | 5,293 | |
Accrued management fee | | | 319,427 | |
Other accrued expenses and payables | | | 118,167 | |
| | |
|
|
|
Total liabilities | | | 3,484,256 | |
| | |
|
|
|
Net assets, at value | | $ | 654,550,230 | |
| | |
|
|
|
Net Assets | | | | |
Net assets consist of: | | | | |
Undistributed net investment income | | | 13,460,556 | |
Net unrealized appreciation (depreciation) on: | | | | |
Investments | | | 67,332,766 | |
Futures | | | (1,834 | ) |
Foreign currency related transactions | | | (94,375 | ) |
Accumulated net realized gain (loss) | | | (83,333,181 | ) |
Paid-in capital | | | 657,186,298 | |
| | |
|
|
|
Net assets, at value | | $ | 654,550,230 | |
| | |
|
|
|
Class A | | | | |
Net Asset Value, offering and redemption price per share ($621,557,263 ÷ 27,789,320 outstanding shares of beneficial interest, $.01 par value, unlimited number of shares authorized) | | $ | 22.37 | |
| | |
|
|
|
Class B | | | | |
Net Asset Value, offering and redemption price per share ($32,992,967 ÷ 1,477,597 outstanding shares of beneficial interest, $.01 par value, unlimited number of shares authorized) | | $ | 22.33 | |
| | |
|
|
|
Page 265 of 466
Statement of Operations for the year ended December 31, 2004
| | | | |
Investment Income | | | | |
Income: | | | | |
Dividends (net of foreign taxes withheld of $112) | | $ | 5,902,441 | |
Interest | | | 12,315,633 | |
Interest — Scudder Cash Management QP Trust | | | 244,726 | |
Securities lending income, including income from Daily Assets Fund Institutional | | | 372 | |
Total Income | | | 18,463,172 | |
Expenses: | | | | |
Management fee | | | 3,670,402 | |
Custodian fees | | | 39,230 | |
Distribution service fees (Class B) | | | 66,432 | |
Record keeping fees (Class B) | | | 34,972 | |
Auditing | | | 22,235 | |
Legal | | | 25,057 | |
Trustees’ fees and expenses | | | 26,175 | |
Reports to shareholders | | | 105,061 | |
Other | | | 33,337 | |
Total expenses, before expense reductions | | | 4,022,901 | |
Expense reductions | | | (6,817 | ) |
Total expenses, after expense reductions | | | 4,016,084 | |
| | |
|
|
|
Net investment income (loss) | | | 14,447,088 | |
| | |
|
|
|
| |
Realized and Unrealized Gain (Loss) on Investment Transactions | | | | |
Net realized gain (loss) from: | | | | |
Investments | | | 39,747,609 | |
Futures | | | 176,115 | |
Foreign currency related transactions | | | (11,382 | ) |
| | |
|
|
|
| | | | 39,912,342 | |
| | |
|
|
|
Net unrealized appreciation (depreciation) during the period on: | | | | |
Investments | | | (12,074,667 | ) |
Futures | | | (1,834 | ) |
Foreign currency related transactions | | | (94,879 | ) |
| | | | (12,171,380 | ) |
| | |
|
|
|
Net gain (loss) on investment transactions | | | 27,740,962 | |
| | |
|
|
|
Net increase (decrease) in net assets resulting from operations | | $ | 42,188,050 | |
| | |
|
|
|
The accompanying notes are an integral part of the financial statements.
Page 266 of 466
Statement of Changes in Net Assets
| | | | | | | | |
Increase (Decrease) in Net Assets
| | Years Ended December 31,
| |
| | 2004
| | | 2003
| |
Operations: | | | | | | | | |
Net investment income (loss) | | $ | 14,447,088 | | | $ | 12,222,026 | |
Net realized gain (loss) on investment transactions | | | 39,912,342 | | | | (15,813,854 | ) |
Net unrealized appreciation (depreciation) on investment and foreign currency transactions during the period | | | (12,171,380 | ) | | | 112,165,816 | |
Net increase (decrease) in net assets resulting from operations | | | 42,188,050 | | | | 108,573,988 | |
Distributions to shareholders from: | | | | | | | | |
Net investment income | | | | | | | | |
Class A | | | (10,706,370 | ) | | | (19,941,338 | ) |
Class B | | | (287,648 | ) | | | (91,069 | ) |
Portfolio share transactions: | | | | | | | | |
Class A | | | | | | | | |
Proceeds from shares sold | | | 8,149,762 | | | | 10,694,541 | |
Reinvestment of distributions | | | 10,706,370 | | | | 19,941,338 | |
Cost of shares redeemed | | | (94,301,996 | ) | | | (90,416,600 | ) |
Net increase (decrease) in net assets from Class A share transactions | | | (75,445,864 | ) | | | (59,780,721 | ) |
Class B | | | | | | | | |
Proceeds from shares sold | | | 12,535,568 | | | | 19,711,965 | |
Reinvestment of distributions | | | 287,648 | | | | 91,069 | |
Cost of shares redeemed | | | (2,353,690 | ) | | | (1,167,522 | ) |
Net increase (decrease) in net assets from Class B share transactions | | | 10,469,526 | | | | 18,635,512 | |
Increase (decrease) in net assets | | | (33,782,306 | ) | | | 47,396,372 | |
Net assets at beginning of period | | | 688,332,536 | | | | 640,936,164 | |
| | |
|
|
| |
|
|
|
Net assets at end of period (including undistributed net investment income of $13,460,556 and $10,239,991, respectively) | | $ | 654,550,230 | | | $ | 688,332,536 | |
| | |
|
|
| |
|
|
|
Other Information | | | | | | | | |
| | |
Class A | | | | | | | | |
Shares outstanding at beginning of period | | | 31,305,397 | | | | 34,306,666 | |
Shares sold | | | 380,053 | | | | 549,966 | |
Shares issued to shareholders in reinvestment of distributions | | | 499,597 | | | | 1,101,123 | |
Shares redeemed | | | (4,395,727 | ) | | | (4,652,358 | ) |
Net increase (decrease) in Portfolio shares | | | (3,516,077 | ) | | | (3,001,269 | ) |
| | |
|
|
| |
|
|
|
Shares outstanding at end of period | | | 27,789,320 | | | | 31,305,397 | |
| | |
|
|
| |
|
|
|
Class B | | | | | | | | |
Shares outstanding at beginning of period | | | 988,869 | | | | 43,090 | |
Shares sold | | | 584,945 | | | | 999,072 | |
Shares issued to shareholders in reinvestment of distributions | | | 13,398 | | | | 5,023 | |
Shares redeemed | | | (109,615 | ) | | | (58,316 | ) |
Net increase (decrease) in Portfolio shares | | | 488,728 | | | | 945,779 | |
| | |
|
|
| |
|
|
|
Shares outstanding at end of period | | | 1,477,597 | | | | 988,869 | |
| | |
|
|
| |
|
|
|
The accompanying notes are an integral part of the financial statements.
Page 267 of 466
Financial Highlights
Class A
| | | | | | | | | | | | | | | | | | | | |
Years Ended December 31,
| | 2004
| | | 2003
| | | 2002
| | | 2001a
| | | 2000b
| |
Selected Per Share Data | | | | | | | | | | | | | | | | | | | | |
Net asset value, beginning of period | | $ | 21.32 | | | $ | 18.66 | | | $ | 22.57 | | | $ | 25.91 | | | $ | 28.82 | |
| | |
|
|
| |
|
|
| |
|
|
| |
|
|
| |
|
|
|
Income (loss) from investment operations: | | | | | | | | | | | | | | | | | | | | |
Net investment income (loss)c | | | .47 | | | | .37 | | | | .47 | | | | .61 | | | | .74 | |
Net realized and unrealized gain (loss) on investment transactions | | | .93 | | | | 2.90 | | | | (3.81 | ) | | | (2.20 | ) | | | (1.40 | ) |
| | |
|
|
| |
|
|
| |
|
|
| |
|
|
| |
|
|
|
Total from investment operations | | | 1.40 | | | | 3.27 | | | | (3.34 | ) | | | (1.59 | ) | | | (.66 | ) |
| | |
|
|
| |
|
|
| |
|
|
| |
|
|
| |
|
|
|
Less distributions from: | | | | | | | | | | | | | | | | | | | | |
Net investment income | | | (.35 | ) | | | (.61 | ) | | | (.57 | ) | | | (.80 | ) | | | (.90 | ) |
Net realized gains on investment transactions | | | — | | | | — | | | | — | | | | (.95 | ) | | | (1.35 | ) |
| | |
|
|
| |
|
|
| |
|
|
| |
|
|
| |
|
|
|
Total distributions | | | (.35 | ) | | | (.61 | ) | | | (.57 | ) | | | (1.75 | ) | | | (2.25 | ) |
| | |
|
|
| |
|
|
| |
|
|
| |
|
|
| |
|
|
|
Net asset value, end of period | | $ | 22.37 | | | $ | 21.32 | | | $ | 18.66 | | | $ | 22.57 | | | $ | 25.91 | |
| | |
|
|
| |
|
|
| |
|
|
| |
|
|
| |
|
|
|
Total Return (%) | | | 6.64 | | | | 18.10 | | | | (15.17 | ) | | | (6.09 | ) | | | (2.63 | ) |
| | |
|
|
| |
|
|
| |
|
|
| |
|
|
| |
|
|
|
Ratios to Average Net Assets and Supplemental Data | | | | | | | | | | | | | | | | | | | | |
Net assets, end of period ($ millions) | | | 622 | | | | 667 | | | | 640 | | | | 861 | | | | 851 | |
Ratio of expenses (%) | | | .59 | | | | .59 | | | | .58 | | | | .58 | | | | .61 | |
Ratio of net investment income (loss) (%) | | | 2.18 | | | | 1.88 | | | | 2.32 | | | | 2.63 | | | | 2.75 | |
Portfolio turnover rate (%) | | | 131 | d | | | 102 | d | | | 140 | | | | 115 | | | | 107 | |
| a | As required, effective January 1, 2001, the Portfolio adopted the provisions of the AICPA Audit and Accounting Guide for Investment Companies and began amortizing premium on debt securities. In addition, paydowns on mortgage-backed securities which were included in realized gain/loss on investment transactions prior to January 1, 2001 were included as interest income. The effect of this change for the year ended December 31, 2001 was to decrease net investment income per share by $.03, increase net realized and unrealized gains and losses per share by $.03 and decrease the ratio of net investment income to average net assets from 2.76% to 2.63%. Per share, ratios and supplemental data for periods prior to January 1, 2001 were not restated to reflect this change in presentation. |
| b | On June 18, 2001, the Portfolio implemented a 1 for 10 reverse stock split. Per share information, for the period prior to December 31, 2001, has been restated to reflect the effect of the split. Shareholders received 1 share for every 10 shares owned and net asset value per share increased correspondingly. |
| c | Based on average shares outstanding during the period. |
| d | The portfolio turnover rate including mortgage dollar roll transactions was 140% and 108% for the periods ended December 31, 2004 and December 31, 2003, respectively. |
Page 268 of 466
Class B
| | | | | | | | | | | | |
Years Ended December 31,
| | 2004
| | | 2003
| | | 2002a
| |
Selected Per Share Data | | | | | | | | | | | | |
Net asset value, beginning of period | | $ | 21.28 | | | $ | 18.64 | | | $ | 19.46 | |
| | |
|
|
| |
|
|
| |
|
|
|
Income (loss) from investment operations: | | | | | | | | | | | | |
Net investment income (loss)b | | | .39 | | | | .28 | | | | .18 | |
Net realized and unrealized gain (loss) on investment transactions | | | .92 | | | | 2.92 | | | | (1.00 | ) |
| | |
|
|
| |
|
|
| |
|
|
|
Total from investment operations | | | 1.31 | | | | 3.20 | | | | (.82 | ) |
| | |
|
|
| |
|
|
| |
|
|
|
Less distributions from: | | | | | | | | | | | | |
Net investment income | | | (.26 | ) | | | (.56 | ) | | | — | |
| | |
|
|
| |
|
|
| |
|
|
|
Net asset value, end of period | | $ | 22.33 | | | $ | 21.28 | | | $ | 18.64 | |
| | |
|
|
| |
|
|
| |
|
|
|
Total Return (%) | | | 6.26 | | | | 17.66 | | | | (4.21 | )** |
| | |
|
|
| |
|
|
| |
|
|
|
Ratios to Average Net Assets and Supplemental Data | | | | | | | | | | | | |
Net assets, end of period ($ millions) | | | 33 | | | | 21 | | | | .8 | |
Ratio of expenses (%) | | | .97 | | | | .99 | | | | .86 | * |
Ratio of net investment income (loss) (%) | | | 1.80 | | | | 1.48 | | | | 1.96 | * |
Portfolio turnover rate (%) | | | 131c | | | | 102c | | | | 140 | |
| a | For the period July 1, 2002 (commencement of operations of Class B shares) to December 31, 2002. |
| b | Based on average shares outstanding during the period. |
| c | The portfolio turnover rate including mortgage dollar roll transactions was 140% and 108% for the periods ended December 31, 2004 and December 31, 2003, respectively. |
Performance Summary December 31, 2004
SVS Davis Venture Value Portfolio
All performance shown is historical, assumes reinvestment of all dividends and capital gains, and does not guarantee future results. Investment return and principal value fluctuate with changing market conditions so that, when redeemed, shares may be worth more or less then their original cost. Current performance may be lower or higher than the performance data quoted. Please visit scudder.com for the product’s most recent month-end performance. Performance doesn’t reflect charges and fees (“contract charges”) associated with the separate account that invests in the Portfolio or any variable life insurance policy or variable annuity contract for which the Portfolio is an investment option. These charges and fees will reduce returns.
The Portfolio is subject to stock market and equity risks, meaning stocks in the Portfolio may decline in value for extended periods of time due to the activities and financial prospects of individual companies, or due to general market and economic conditions. Please read this Portfolio’s prospectus for specific details regarding its investments and risk profile.
Page 269 of 466
| | |
Growth of an Assumed $10,000 Investment in SVS Davis Venture Value Portfolio from 5/1/2001 to 12/31/2004 |
¨ SVS Davis Venture Value Portfolio — Class A ¨ Russell 1000 Value Index | | |
| |
 | | Russell 1000 Value Index is an unmanaged index, which consists of those stocks in the Russell 1000 Index with lower price-to-book ratios and lower forecasted-growth values. Index returns assume reinvested dividends and, unlike Portfolio returns, do not reflect any fees or expenses. It is not possible to invest directly into an index. |
| | | | | | | | | | | | | | |
Comparative Results | | | | | | | | | | | | | | |
| | | | |
SVS Davis Venture Value Portfolio
| | | | 1-Year
| | | 3-Year
| | | Life of Portfolio*
| |
Class A | | Growth of $10,000 | | $ | 11,183 | | | $ | 12,227 | | | $ | 11,616 | |
| | | Average annual total return | | | 11.83 | % | | | 6.93 | % | | | 4.17 | % |
Russell 1000 Value Index | | Growth of $10,000 | | $ | 11,649 | | | $ | 12,796 | | | $ | 12,233 | |
| | | Average annual total return | | | 16.49 | % | | | 8.57 | % | | | 5.65 | % |
| | | | |
SVS Davis Venture Value Portfolio
| | | | | | | 1-Year
| | | Life of Class**
| |
Class B | | Growth of $10,000 | | | | | | $ | 11,142 | | | $ | 13,505 | |
| | | Average annual total return | | | | | | | 11.42 | % | | | 12.76 | % |
Russell 1000 Value Index | | Growth of $10,000 | | | | | | $ | 11,649 | | | $ | 13,438 | |
| | | Average annual total return | | | | | | | 16.49 | % | | | 12.55 | % |
The growth of $10,000 is cumulative.
| * | The Portfolio commenced operations on May 1, 2001. Index returns begin April 30, 2001. |
| ** | The Portfolio commenced offering Class B shares on July 1, 2002. Index returns begin June 30, 2002. |
Information About Your Portfolio’s Expenses
SVS Davis Venture Value Portfolio
As an investor of the Portfolio, you incur two types of costs: ongoing expenses and transaction costs. Ongoing expenses include management fees, distribution and service (12b-1) fees and other Portfolio expenses. Examples of transaction costs include sales charges (loads), redemption fees and account maintenance fees, which are not shown in this section. The following tables are intended to help you understand your ongoing expenses (in dollars) of investing in the Portfolio and to help you compare these expenses with the ongoing expenses of investing in other mutual funds. The tables are based on an investment of $1,000 made at the beginning of the six-month period ended December 31, 2004.
The tables illustrate your Portfolio’s expenses in two ways:
Actual Portfolio Return. This helps you estimate the actual dollar amount of ongoing expenses (but not transaction costs) paid on a $1,000 investment in the Portfolio using the Portfolio’s actual return during the period. To estimate the expenses you paid over the period, simply divide your account value by $1,000 (for example, an $8,600 account value divided by $1,000 = 8.6), then multiply the result by the number in the “Expenses Paid per $1,000” line under the share class you hold.
Hypothetical 5% Portfolio Return. This helps you to compare your Portfolio’s ongoing expenses (but not transaction costs) with those of other mutual funds using the Portfolio’s actual expense ratio and a hypothetical rate of return of 5% per year before expenses. Examples using a 5% hypothetical Portfolio
Page 270 of 466
return may be found in the shareholder reports of other mutual funds. The hypothetical account values and expenses may not be used to estimate the actual ending account balance or expenses you paid for the period.
Please note that the expenses shown in these tables are meant to highlight your ongoing expenses only and do not reflect any transaction costs. The “Expenses Paid per $1,000” line of the tables is useful in comparing ongoing expenses only and will not help you determine the relative total expense of owning different funds. If these transaction costs had been included, your costs would have been higher.
| | | | | | |
| Expenses and Value of a $1,000 Investment for the six months ended December 31, 2004 |
| | |
Actual Portfolio Return
| | Class A
| | Class B
|
Beginning Account Value 7/1/04 | | $ | 1,000.00 | | $ | 1,000.00 |
Ending Account Value 12/31/04 | | $ | 1,071.90 | | $ | 1,070.00 |
Expenses Paid per $1,000* | | $ | 5.32 | | $ | 7.33 |
| | |
Hypothetical 5% Portfolio Return
| | Class A
| | Class B
|
Beginning Account Value 7/1/04 | | $ | 1,000.00 | | $ | 1,000.00 |
Ending Account Value 12/31/04 | | $ | 1,020.07 | | $ | 1,018.12 |
Expenses Paid per $1,000* | | $ | 5.18 | | $ | 7.15 |
| * | Expenses are equal to the Portfolio’s annualized expense ratio for each share class, multiplied by the average account value over the period, multiplied by the number of days in the most recent six-month period, then divided by 365. |
| | | | | | |
Annualized Expense Ratios
| | Class A
| | | Class B
| |
Scudder Variable Series II — SVS Davis Venture Value Portfolio | | 1.02 | % | | 1.40 | % |
For more information, please refer to the Portfolio’s prospectus.
Management Summary December 31, 2004
SVS Davis Venture Value Portfolio
For the year ended December 31, 2004, the portfolio returned 11.83% (Class A shares, unadjusted for contract charges), compared with its benchmark, the Russell 1000 Value Index, which returned 16.49%. Looking at large US stocks in 2004, value outperformed growth, with the Russell 1000 Value Index beating its counterpart 16.49% to 6.30%. This trend benefited the portfolio with its value focus.
Important contributors to and detractors from the portfolio’s performance relative to the S&P 500 index over the course of the year include:
All of the portfolio’s consumer staples holdings performed well, including Altria Group, Inc. and Costco Wholesale Corp.
Whereas in 2003 the portfolio’s large financial services holdings were the most important contributors to strong performance, in 2004 the portfolio’s financial service holdings trailed the S&P 500 by a small margin. Although American Express Co., CenterPoint Properties Corp., Golden West Financial Corp. and Loews Corp. turned in strong performances, other financial holdings turned in weaker performances, including Fifth Third Bancorp, Transatlantic Holdings, Inc. and Marsh & McLennan Companies, Inc. (down since being purchased in June).
Page 271 of 466
In general, information technology companies underperformed the broader market in 2004. The portfolio benefited by having only limited exposure to information technology companies.
Other positive contributors to performance included Tyco International Ltd., an industrials company, and ConocoPhillips, an energy company. Other notable detractors from performance included Rentokil Initial PLC, an industrial company, down since being acquired in January, and health care companies Pfizer (no longer held) and Eli Lilly & Co.
Christopher C. Davis
Kenneth Charles Feinberg
Co-Managers
Davis Selected Advisers, L.P., Subadvisor to the Portfolio
All performance shown is historical, assumes reinvestment of all dividends and capital gains, and does not guarantee future results. Investment return and principal value fluctuate with changing market conditions so that, when redeemed, shares may be worth more or less then their original cost. Current performance may be lower or higher than the performance data quoted. Please visit scudder.com for the product’s most recent month-end performance. Performance doesn’t reflect charges and fees (“contract charges”) associated with the separate account that invests in the portfolio or any variable life insurance policy or variable annuity contract for which the portfolio is an investment option. These charges and fees will reduce returns.
Risk Considerations
The portfolio is subject to stock market and equity risks, meaning stocks in the portfolio may decline in value for extended periods of time due to the activities and financial prospects of individual companies, or due to general market and economic conditions. Please read this portfolio’s prospectus for specific details regarding its investments and risk profile.
Russell 1000 Value Index is an unmanaged index, which consists of those stocks in the Russell 1000 Index with lower price-to-book ratios and lower forecasted-growth values. Index returns assume reinvestment of all distributions and do not reflect fees or expenses. It is not possible to invest directly into an index.
The Standard & Poor’s (S&P) 500 Index is a capitalization-weighted index of 500 stocks. The index is designed to measure performance of the broad domestic economy through changes in the aggregate market value of 500 stocks representing all major industries. Index returns assume reinvestment of all distributions and do not reflect fees or expenses. It is not possible to invest directly into an index.
Portfolio management market commentary is as of December 31, 2004, and may not come to pass. This information is subject to change at any time based on market and other conditions.
In this report Davis Selected Advisers makes candid statements and observations regarding economic and market conditions; however, there is no guarantee that these statements, opinions or forecasts will prove to be correct. All investments involve some degree of risk, and there can be no assurance that the investment strategies will be successful. Market values will vary so that an investor may experience a gain or a loss.
Portfolio Summary
SVS Davis Venture Value Portfolio
| | | | | | |
Asset Allocation (Excludes Securities Lending Collateral)
| | 12/31/04
| | | 12/31/03
| |
Common Stocks | | 94 | % | | 93 | % |
Cash Equivalents | | 6 | % | | 7 | % |
| | |
|
| |
|
|
| | | 100 | % | | 100 | % |
| | |
|
| |
|
|
Page 272 of 466
| | | | | | |
Sector Diversification (Excludes Cash Equivalents and Securities Lending Collateral)
| | 12/31/04
| | | 12/31/03
| |
Financials | | 50 | % | | 55 | % |
Consumer Staples | | 12 | % | | 13 | % |
Industrials | | 9 | % | | 8 | % |
Energy | | 9 | % | | 7 | % |
Consumer Discretionary | | 7 | % | | 4 | % |
Materials | | 5 | % | | 5 | % |
Health Care | | 4 | % | | 5 | % |
Information Technology | | 3 | % | | 3 | % |
Telecommunication Services | | 1 | % | | — | |
| | |
|
| |
|
|
| | | 100 | % | | 100 | % |
| | |
|
| |
|
|
Asset allocation and sector diversification are subject to change.
For more complete details about the Portfolio’s investment portfolio, see page 7. A quarterly Fact Sheet is available upon request. Information concerning portfolio holdings of the Portfolio as of month end will be posted to scudder.com on the 15th of the following month.
Following the Portfolio’s fiscal first and third quarter-end, a complete portfolio holdings listing is filed with the SEC on Form N-Q. The form will be available on the SEC’s Web site at www.sec.gov, and it also may be reviewed and copied at the SEC’s Public Reference Room in Washington, D.C. Information on the operation of the SEC’s Public Reference Room may be obtained by calling (800) SEC-0330.
Investment Portfolio December 31, 2004
SVS Davis Venture Value Portfolio
| | | | |
| | | Shares
| | Value ($)
|
Common Stocks 94.0% | | | | |
Consumer Discretionary 7.0% | | | | |
Household Durables 0.0% | | | | |
Hunter Douglas NV | | 900 | | 48,016 |
| | | | |
|
Internet & Catalog Retail 0.6% | | | | |
IAC/InterActiveCorp.* (d) | | 67,800 | | 1,872,636 |
| | | | |
|
Media 5.6% | | | | |
Comcast Corp. “A”* | | 361,200 | | 11,861,808 |
Gannett Co., Inc. | | 21,000 | | 1,715,700 |
Lagardere S.C.A. | | 54,700 | | 3,948,036 |
WPP Group PLC (ADR) (d) | | 20,700 | | 1,131,255 |
| | | | |
|
| | | | | 18,656,799 |
| | | | |
|
Page 273 of 466
| | | | |
Specialty Retail 0.8% | | | | |
AutoZone, Inc.* | | 31,400 | | 2,867,134 |
| | | | |
|
Consumer Staples 11.7% | | | | |
Beverages 2.3% | | | | |
Diageo PLC (ADR) | | 83,300 | | 4,821,404 |
Heineken Holding NV “A” | | 95,600 | | 2,891,260 |
| | | | |
|
| | | | | 7,712,664 |
| | | | |
|
Food & Staples Retailing 3.2% | | | | |
Costco Wholesale Corp. | | 216,700 | | 10,490,447 |
| | | | |
|
Food Products 0.9% | | | | |
Hershey Foods Corp. | | 55,600 | | 3,088,024 |
| | | | |
|
Tobacco 5.3% | | | | |
Altria Group, Inc. | | 290,600 | | 17,755,660 |
| | | | |
|
Energy 8.4% | | | | |
Energy Equipment & Services 0.7% | | | | |
Transocean, Inc.* | | 53,600 | | 2,272,104 |
| | | | |
|
Oil & Gas 7.7% | | | | |
ConocoPhillips | | 88,660 | | 7,698,348 |
Devon Energy Corp. | | 165,600 | | 6,445,152 |
EOG Resources, Inc. | | 70,400 | | 5,023,744 |
Occidental Petroleum Corp. | | 116,300 | | 6,787,268 |
| | | | |
|
| | | | | 25,954,512 |
| | | | |
|
Financials 47.1% | | | | |
Banks 12.1% | | | | |
Fifth Third Bancorp. (d) | | 86,500 | | 4,089,720 |
Golden West Financial Corp. | | 153,800 | | 9,446,396 |
HSBC Holdings PLC | | 631,210 | | 10,652,259 |
Lloyds TSB Group PLC (ADR) (d) | | 77,800 | | 2,862,262 |
Takefuji Corp. | | 37,900 | | 2,563,160 |
Wells Fargo & Co. | | 172,600 | | 10,727,090 |
| | | | |
|
| | | | | 40,340,887 |
| | | | |
|
Capital Markets 1.0% | | | | |
Morgan Stanley | | 47,500 | | 2,637,200 |
State Street Corp. | | 15,500 | | 761,360 |
| | | | |
|
| | | | | 3,398,560 |
| | | | |
|
| | |
| | | Shares
| | Value ($)
|
Consumer Finance 7.3% | | | | |
American Express Co. | | 407,100 | | 22,948,226 |
Providian Financial Corp.* | | 91,500 | | 1,507,005 |
| | | | |
|
| | | | | 24,455,231 |
| | | | |
|
Diversified Financial Services 7.9% | | | | |
Citigroup, Inc. | | 216,700 | | 10,440,606 |
JPMorgan Chase & Co. | | 269,484 | | 10,512,571 |
Moody’s Corp. | | 48,200 | | 4,186,170 |
Principal Financial Group, Inc. | | 30,300 | | 1,240,482 |
| | | | |
|
| | | | | 26,379,829 |
| | | | |
|
Page 274 of 466
| | | | |
Insurance 17.1% | | | | |
American International Group, Inc. | | 228,700 | | 15,018,729 |
Aon Corp. (d) | | 96,800 | | 2,309,648 |
Berkshire Hathaway, Inc. “B”* | | 5,005 | | 14,694,680 |
Chubb Corp. | | 13,100 | | 1,007,390 |
Loews Corp. | | 89,100 | | 6,263,730 |
Markel Corp.* | | 900 | | 327,600 |
Marsh & McLennan Companies, Inc. | | 107,900 | | 3,549,910 |
Progressive Corp. | | 104,300 | | 8,848,812 |
Sun Life Financial, Inc. (d) | | 18,200 | | 610,428 |
Transatlantic Holdings, Inc. | | 71,437 | | 4,416,950 |
| | | | |
|
| | | | | 57,047,877 |
| | | | |
|
Real Estate 1.7% | | | | |
CenterPoint Properties Corp. (REIT) | | 121,600 | | 5,823,424 |
| | | | |
|
Health Care 4.0% | | | | |
Health Care Providers & Services 2.6% | | | | |
Cardinal Health, Inc. | | 75,500 | | 4,390,325 |
HCA, Inc. | | 109,200 | | 4,363,632 |
| | | | |
|
| | | | | 8,753,957 |
| | | | |
|
Pharmaceuticals 1.4% | | | | |
Eli Lilly & Co. | | 55,700 | | 3,160,975 |
Novartis AG (Registered) | | 28,500 | | 1,436,153 |
| | | | |
|
| | | | | 4,597,128 |
| | | | |
|
Industrials 8.5% | | | | |
Air Freight & Logistics 0.8% | | | | |
United Parcel Service, Inc. “B” | | 32,800 | | 2,803,088 |
| | | | |
|
Commercial Services & Supplies 3.8% | | | | |
D&B Corp.* | | 49,900 | | 2,976,535 |
H&R Block, Inc. | | 106,300 | | 5,208,700 |
Iron Mountain, Inc.* | | 102,700 | | 3,131,323 |
Rentokil Initial PLC | | 446,600 | | 1,266,850 |
| | | | |
|
| | | | | 12,583,408 |
| | | | |
|
Industrial Conglomerates 3.9% | | | | |
Tyco International Ltd. | | 364,462 | | 13,025,872 |
| | | | |
|
Information Technology 2.7% | | | | |
Communications Equipment 0.3% | | | | |
Nokia Oyj (ADR) | | 62,600 | | 980,942 |
| | | | |
|
Computers & Peripherals 1.4% | | | | |
Lexmark International, Inc. “A”* | | 53,400 | | 4,539,000 |
| | | | |
|
Software 1.0% | | | | |
Microsoft Corp. | | 127,700 | | 3,410,867 |
| | | | |
|
Page 275 of 466
| | | | |
| | | Shares
| | Value ($)
|
Materials 4.1% | | | | |
Construction Materials 1.3% | | | | |
Martin Marietta Materials, Inc. | | 42,500 | | 2,280,550 |
Vulcan Materials Co. | | 42,400 | | 2,315,464 |
| | | | |
|
| | | | | 4,596,014 |
| | | | |
|
Containers & Packaging 2.8% | | | | |
Sealed Air Corp.* | | 174,700 | | 9,306,269 |
| | | | |
|
Telecommunication Services 0.5% | | | | |
Wireless Telecommunication Services | | | | |
SK Telecom Co., Ltd. (ADR) (d) | | 71,600 | | 1,593,100 |
| | | | |
|
Total Common Stocks (Cost $248,054,008) | | | | 314,353,449 |
| | | | |
|
| | |
| | | Shares
| | Value ($)
|
Securities Lending Collateral 3.1% | | | | |
Daily Assets Fund Institutional, 2.25% (c) (e) (Cost $10,435,680) | | 10,435,680 | | 10,435,680 |
| | | | |
|
Cash Equivalents 6.1% | | | | |
Scudder Cash Management QP Trust, 2.24% (b) (Cost $20,428,223) | | 20,428,223 | | 20,428,223 |
| | | | | | |
| | | % of Net Assets
| | | Value ($)
| |
Total Investment Portfolio (Cost $278,917,911) (a) | | 103.2 | | | 345,217,352 | |
| | | | | |
|
|
Other Assets and Liabilities, Net | | (3.2 | ) | | (10,679,504 | ) |
| | | | | |
|
|
Net Assets | | 100.0 | | | 334,537,848 | |
| | | | | |
|
|
Notes to SVS Davis Venture Value Portfolio of Investments
| * | Non-income producing security. |
| (a) | The cost for federal income tax purposes was $279,729,834. At December 31, 2004, net unrealized appreciation for all securities based on tax cost was $65,487,518. This consisted of aggregate gross unrealized appreciation for all securities in which there was an excess of value over tax cost of $69,049,069 and aggregate gross unrealized depreciation for all securities in which there was an excess of tax cost over value of $3,561,551. |
| (b) | Scudder Cash Management QP Trust is managed by Deutsche Investment Management Americas Inc. The rate shown is the annualized seven-day yield at period end. |
| (c) | Daily Assets Fund Institutional, an affiliated fund, is managed by Deutsche Asset Management, Inc. The rate shown is the annualized seven-day yield at period end. |
| (d) | All or a portion of these securities were on loan (see Notes to Financials Statements). The value of all securities loaned at December 31, 2004 amounted to $10,214,640, which is 3.1% of total net assets. |
| (e) | Represents collateral held in connection with securities lending. |
| ADR: | American Depositary Receipt |
| REIT: | Real Estate Investment Trust |
The accompanying notes are an integral part of the financial statements.
Page 276 of 466
Financial Statements
Statement of Assets and Liabilities as of December 31, 2004
| | | | |
Assets | | | | |
Investments: | | | | |
Investments in securities, at value (cost $248,054,008) — including $10,214,640 of securities loaned | | $ | 314,353,449 | |
Investment in Daily Assets Fund Institutional (cost $10,435,680)* | | | 10,435,680 | |
Investment in Scudder Cash Management QP Trust (cost $20,428,223) | | | 20,428,223 | |
| | |
|
|
|
Total investments in securities, at value (cost $278,917,911) | | | 345,217,352 | |
| | |
|
|
|
Cash | | | 13,265 | |
Foreign currency, at value (cost $161,215) | | | 171,550 | |
Dividends receivable | | | 496,277 | |
Interest receivable | | | 35,289 | |
Receivable for Portfolio shares sold | | | 106,501 | |
Foreign taxes recoverable | | | 4,518 | |
Other assets | | | 11,523 | |
| | |
|
|
|
Total assets | | | 346,056,275 | |
| | |
|
|
|
Liabilities | | | | |
Payable for investments purchased | | | 620,008 | |
Payable upon return of securities loaned | | | 10,435,680 | |
Payable for Portfolio shares redeemed | | | 63,713 | |
Accrued management fee | | | 264,732 | |
Other accrued expenses and payables | | | 134,294 | |
| | |
|
|
|
Total liabilities | | | 11,518,427 | |
| | |
|
|
|
Net assets, at value | | $ | 334,537,848 | |
| | |
|
|
|
Net Assets | | | | |
Net assets consist of: | | | | |
Undistributed net investment income | | | 1,834,272 | |
Net unrealized appreciation (depreciation) on: | | | | |
Investments | | | 66,299,441 | |
Foreign currency related transactions | | | 10,800 | |
Accumulated net realized gain (loss) | | | (7,976,396 | ) |
Paid-in capital | | | 274,369,731 | |
| | |
|
|
|
Net assets, at value | | $ | 334,537,848 | |
| | |
|
|
|
Class A | | | | |
Net Asset Value, offering and redemption price per share ($268,490,495 ÷ 23,386,408 outstanding shares of beneficial interest, $.01 par value, unlimited number of shares authorized) | | $ | 11.48 | |
| | |
|
|
|
Class B | | | | |
Net Asset Value, offering and redemption price per share ($66,047,353 ÷ 5,765,180 outstanding shares of beneficial interest, $.01 par value, unlimited number of shares authorized) | | $ | 11.46 | |
| | |
|
|
|
| * | Represents collateral on securities loaned. |
Page 277 of 466
Statement of Operations for the year ended December 31, 2004
| | | | |
Investment Income | | | | |
Income: | | | | |
Dividends (net of foreign taxes withheld of $116,150) | | $ | 4,881,133 | |
Interest — Scudder Cash Management QP Trust | | | 266,599 | |
Securities lending income, including income from Daily Assets Fund Institutional | | | 19,265 | |
| | |
|
|
|
Total Income | | | 5,166,997 | |
| | |
|
|
|
Expenses: | | | | |
Management fee | | | 2,725,496 | |
Custodian and accounting fees | | | 130,028 | |
Distribution service fees (Class B) | | | 121,863 | |
Record keeping fees (Class B) | | | 61,763 | |
Auditing | | | 73,419 | |
Legal | | | 38,402 | |
Trustee’s fees and expenses | | | 4,000 | |
Reports to shareholders | | | 54,191 | |
Registration fees | | | 63 | |
Other | | | 5,924 | |
| | |
|
|
|
Total expenses, before expense reductions | | | 3,215,149 | |
| | |
|
|
|
Expense reductions | | | (3,045 | ) |
| | |
|
|
|
Total expenses, after expense reductions | | | 3,212,104 | |
| | |
|
|
|
Net investment income (loss) | | | 1,954,893 | |
| | |
|
|
|
Realized and Unrealized Gain (Loss) on Investment Transactions | | | | |
Net realized gain (loss) from: | | | | |
Investments | | | (1,151,700 | ) |
Foreign currency related transactions | | | (6,282 | ) |
| | | | (1,157,982 | ) |
Net unrealized appreciation (depreciation) during the period on: | | | | |
Investments | | | 32,675,903 | |
Foreign currency related transactions | | | 10,800 | |
| | | | 32,686,703 | |
| | |
|
|
|
Net gain (loss) on investment transactions | | | 31,528,721 | |
| | |
|
|
|
Net increase (decrease) in net assets resulting from operations | | $ | 33,483,614 | |
| | |
|
|
|
The accompanying notes are an integral part of the financial statements.
Page 278 of 466
Statement of Changes in Net Assets
| | | | | | | | |
| | | Years Ended December 31,
| |
Increase (Decrease) in Net Assets
| | 2004
| | | 2003
| |
Operations: | | | | | | | | |
Net investment income (loss) | | $ | 1,954,893 | | | $ | 1,171,027 | |
Net realized gain (loss) on investment transactions | | | (1,157,982 | ) | | | (1,944,206 | ) |
Net unrealized appreciation (depreciation) on investment transactions during the period | | | 32,686,703 | | | | 53,830,899 | |
Net increase (decrease) in net assets resulting from operations | | | 33,483,614 | | | | 53,057,720 | |
Distributions to shareholders from: | | | | | | | | |
Net investment income | | | | | | | | |
Class A | | | (1,002,743 | ) | | | (926,268 | ) |
Class B | | | (15,708 | ) | | | (13,751 | ) |
Portfolio share transactions: | | | | | | | | |
| | |
Class A | | | | | | | | |
Proceeds from shares sold | | | 39,970,621 | | | | 27,361,668 | |
Reinvestment of distributions | | | 1,002,743 | | | | 926,268 | |
Cost of shares redeemed | | | (19,163,185 | ) | | | (15,951,017 | ) |
Net increase (decrease) in net assets from Class A share transactions | | | 21,810,179 | | | | 12,336,919 | |
| | |
Class B | | | | | | | | |
Proceeds from shares sold | | | 32,936,634 | | | | 24,216,184 | |
Reinvestment of distributions | | | 15,708 | | | | 13,751 | |
Cost of shares redeemed | | | (2,151,840 | ) | | | (50,102 | ) |
Net increase (decrease) in net assets from Class B share transactions | | | 30,800,502 | | | | 24,179,833 | |
Increase (decrease) in net assets | | | 85,075,844 | | | | 88,634,453 | |
Net assets at beginning of period | | | 249,462,004 | | | | 160,827,551 | |
| | |
|
|
| |
|
|
|
Net assets at end of period (including undistributed net investment income of $1,834,272 and $964,815, respectively) | | $ | 334,537,848 | | | $ | 249,462,004 | |
| | |
|
|
| |
|
|
|
Other Information | | | | | | | | |
| | |
Class A | | | | | | | | |
Shares outstanding at beginning of period | | | 21,351,155 | | | | 20,031,383 | |
Shares sold | | | 3,746,952 | | | | 3,122,880 | |
Shares issued to shareholder in reinvestment of distributions | | | 93,978 | | | | 122,360 | |
Shares redeemed | | | (1,805,677 | ) | | | (1,925,468 | ) |
Net increase (decrease) in Portfolio shares | | | 2,035,253 | | | | 1,319,772 | |
| | |
|
|
| |
|
|
|
Shares outstanding at end of period | | | 23,386,408 | | | | 21,351,155 | |
| | |
|
|
| |
|
|
|
Class B | | | | | | | | |
Shares outstanding at beginning of period | | | 2,848,268 | | | | 100,387 | |
Shares sold | | | 3,116,302 | | | | 2,751,475 | |
Shares issued to shareholder in reinvestment of distributions | | | 1,471 | | | | 1,817 | |
Shares redeemed | | | (200,861 | ) | | | (5,411 | ) |
Net increase (decrease) in Portfolio shares | | | 2,916,912 | | | | 2,747,881 | |
| | |
|
|
| |
|
|
|
Shares outstanding at end of period | | | 5,765,180 | | | | 2,848,268 | |
| | |
|
|
| |
|
|
|
The accompanying notes are an integral part of the financial statements.
Page 279 of 466
Financial Highlights
Class A
| | | | | | | | | | | | | | | | |
Years Ended December 31,
| | 2004
| | | 2003
| | | 2002
| | | 2001a
| |
Selected Per Share Data | | | | | | | | | | | | | | | | |
Net asset value, beginning of period | | $ | 10.31 | | | $ | 7.99 | | | $ | 9.50 | | | $ | 10.00 | |
| | |
|
|
| |
|
|
| |
|
|
| |
|
|
|
Income (loss) from investment operations: | | | | | | | | | | | | | | | | |
Net investment income (loss)b | | | .08 | | | | .06 | | | | .05 | | | | .03 | |
Net realized and unrealized gain (loss) on investment transactions | | | 1.14 | | | | 2.31 | | | | (1.55 | ) | | | (.53 | ) |
| | |
|
|
| |
|
|
| |
|
|
| |
|
|
|
Total from investment operations | | | 1.22 | | | | 2.37 | | | | (1.50 | ) | | | (.50 | ) |
| | |
|
|
| |
|
|
| |
|
|
| |
|
|
|
Less distributions from: | | | | | | | | | | | | | | | | |
Net investment income | | | (.05 | ) | | | (.05 | ) | | | (.01 | ) | | | — | |
| | |
|
|
| |
|
|
| |
|
|
| |
|
|
|
Net asset value, end of period | | $ | 11.48 | | | $ | 10.31 | | | $ | 7.99 | | | $ | 9.50 | |
| | |
|
|
| |
|
|
| |
|
|
| |
|
|
|
Total Return (%) | | | 11.83 | | | | 29.84 | | | | (15.79 | ) | | | (5.00 | )** |
| | |
|
|
| |
|
|
| |
|
|
| |
|
|
|
Ratios to Average Net Assets and Supplemental Data | | | | | | | | | | | | | | | | |
Net assets, end of period ($ millions) | | | 268 | | | | 220 | | | | 160 | | | | 109 | |
Ratio of expenses (%) | | | 1.05 | | | | 1.01 | | | | 1.02 | | | | 1.09 | * |
Ratio of net investment income (loss) (%) | | | .74 | | | | .62 | | | | .62 | | | | .48 | * |
Portfolio turnover rate (%) | | | 3 | | | | 7 | | | | 22 | | | | 15 | * |
| a | For the period from May 1, 2001 (commencement of operations) to December 31, 2001. |
| b | Based on average shares outstanding during the period. |
Page 280 of 466
Class B
| | | | | | | | | | | | |
Years Ended December 31,
| | 2004
| | | 2003
| | | 2002a
| |
Selected Per Share Data | | | | | | | | | | | | |
Net asset value, beginning of period | | $ | 10.29 | | | $ | 7.98 | | | $ | 8.52 | |
| | |
|
|
| |
|
|
| |
|
|
|
Income (loss) from investment operations: | | | | | | | | | | | | |
Net investment income (loss)b | | | .04 | | | | .02 | | | | .04 | |
Net realized and unrealized gain (loss) on investment transactions | | | 1.13 | | | | 2.32 | | | | (.58 | ) |
| | |
|
|
| |
|
|
| |
|
|
|
Total from investment operations | | | 1.17 | | | | 2.34 | | | | (.54 | ) |
| | |
|
|
| |
|
|
| |
|
|
|
Less distributions from: | | | | | | | | | | | | |
Net investment income | | | — | *** | | | (.03 | ) | | | — | |
Net asset value, end of period | | $ | 11.46 | | | $ | 10.29 | | | $ | 7.98 | |
| | |
|
|
| |
|
|
| |
|
|
|
Total Return (%) | | | 11.42 | | | | 29.42 | | | | (6.34 | )** |
| | |
|
|
| |
|
|
| |
|
|
|
Ratios to Average Net Assets and Supplemental Data | |
Net assets, end of period ($ millions) | | | 66 | | | | 29 | | | | .8 | |
Ratio of expenses (%) | | | 1.44 | | | | 1.40 | | | | 1.27 | * |
Ratio of net investment income (loss) (%) | | | .36 | | | | .23 | | | | 1.06 | * |
Portfolio turnover rate (%) | | | 3 | | | | 7 | | | | 22 | |
| a | For the period July 1, 2002 (commencement of operations of Class B shares) to December 31, 2002. |
| b | Based on average shares outstanding during the period. |
| *** | Amount is less than $.005. |
Performance Summary December 31, 2004
SVS Dreman Financial Services Portfolio
All performance shown is historical, assumes reinvestment of all dividends and capital gains, and does not guarantee future results. Investment return and principal value fluctuate with changing market conditions so that, when redeemed, shares may be worth more or less then their original cost. Current performance may be lower or higher than the performance data quoted. Please visit scudder.com for the product’s most recent month-end performance. Performance doesn’t reflect charges and fees (“contract charges”) associated with the separate account that invests in the Portfolio or any variable life insurance policy or variable annuity contract for which the Portfolio is an investment option. These charges and fees will reduce returns.
This Portfolio is subject to stock market risk. It may focus its investments on certain economic sectors, thereby increasing its vulnerability to any single economic, political or regulatory development. This may result in greater share price volatility. Additionally, this Portfolio is non-diversified and can take larger positions in fewer companies, increasing its overall potential risk. Please read this Portfolio’s prospectus for specific details regarding its investments and risk profile.
Page 281 of 466
| | |
| Growth of an Assumed $10,000 Investment in SVS Dreman Financial Services Portfolio from 5/4/1998 to 12/31/2004 |
|
¨ SVS Dreman Financial Services Portfolio — Class A |
| |
¨ S&P 500 Index | | |
|
¨ S&P Financial Index |
| |
 | | The Standard & Poor’s (S&P) Financial Index is an unmanaged index generally representative of the financial stock market. The Standard & Poor’s (S&P) 500 Index is a capitalization-weighted index of 500 stocks designed to measure performance of the broad domestic economy through changes in the aggregate market value of 500 stocks representing all major industries. Index returns assume reinvested dividends and, unlike Portfolio returns, do not reflect any fees or expenses. It is not possible to invest directly into an index. |
Yearly periods ended December 31
Comparative Results
| | | | | | | | | | | | | | | | | | |
SVS Dreman Financial Services Portfolio
| | | | 1-Year
| | | 3-Year
| | | 5-Year
| | | Life of Portfolio*
| |
Class A | | Growth of $10,000 | | $ | 11,200 | | | $ | 13,130 | | | $ | 15,870 | | | $ | 14,735 | |
| | | Average annual total return | | | 12.00 | % | | | 9.50 | % | | | 9.68 | % | | | 5.99 | % |
S&P 500 Index | | Growth of $10,000 | | $ | 11,088 | | | $ | 11,115 | | | $ | 8,902 | | | $ | 12,038 | |
| | | Average annual total return | | | 10.88 | % | | | 3.59 | % | | | -2.30 | % | | | 2.82 | % |
S&P Financial Index | | Growth of $10,000 | | $ | 11,089 | | | $ | 12,403 | | | $ | 14,195 | | | $ | 14,420 | |
| | | Average annual total return | | | 10.89 | % | | | 7.44 | % | | | 7.26 | % | | | 5.64 | % |
| | | | | |
SVS Dreman Financial Services Portfolio
| | | | | | | | | | 1-Year
| | | Life of Class**
| |
Class B | | Growth of $10,000 | | | | | | | | | | $ | 11,150 | | | $ | 13,177 | |
| | | Average annual total return | | | | | | | | | | | 11.50 | % | | | 11.65 | % |
S&P 500 Index | | Growth of $10,000 | | | | | | | | | | $ | 11,088 | | | $ | 12,800 | |
| | | Average annual total return | | | | | | | | | | | 10.88 | % | | | 10.38 | % |
S&P Financial Index | | Growth of $10,000 | | | | | | | | | | $ | 11,089 | | | $ | 12,953 | |
| | | Average annual total return | | | | | | | | | | | 10.89 | % | | | 10.90 | % |
The growth of $10,000 is cumulative.
| * | The Portfolio commenced operations on May 4, 1998. Index returns begin April 30, 1998. Total returns would have been lower for the 5-Year and Life of Portfolio periods for Class A shares if the Portfolio’s expenses were not maintained. |
| ** | The Portfolio commenced offering Class B shares on July 1, 2002. Index returns begin June 30, 2002. |
Information About Your Portfolio’s Expenses
SVS Dreman Financial Services Portfolio
As an investor of the Portfolio, you incur two types of costs: ongoing expenses and transaction costs. Ongoing expenses include management fees, distribution and service (12b-1) fees and other Portfolio expenses. Examples of transaction costs include sales charges (loads), redemption fees and account maintenance fees, which are not shown in this section. The following tables are intended to help you understand your ongoing expenses (in dollars) of investing in the Portfolio and to help you compare these expenses with the ongoing expenses of investing in other mutual funds. The tables are based on an investment of $1,000 made at the beginning of the six-month period ended December 31, 2004.
The tables illustrate your Portfolio’s expenses in two ways:
Actual Portfolio Return. This helps you estimate the actual dollar amount of ongoing expenses (but not transaction costs) paid on a $1,000 investment in the Portfolio using the Portfolio’s actual return during the period. To estimate the expenses you paid over the period, simply divide your account value by $1,000 (for example, an $8,600 account value divided by $1,000 = 8.6), then multiply the result by the number in the “Expenses Paid per $1,000” line under the share class you hold.
Hypothetical 5% Portfolio Return. This helps you to compare your Portfolio’s ongoing expenses (but not transaction costs) with those of other mutual funds using the Portfolio’s actual expense ratio and a
Page 282 of 466
hypothetical rate of return of 5% per year before expenses. Examples using a 5% hypothetical Portfolio return may be found in the shareholder reports of other mutual funds. The hypothetical account values and expenses may not be used to estimate the actual ending account balance or expenses you paid for the period.
Please note that the expenses shown in these tables are meant to highlight your ongoing expenses only and do not reflect any transaction costs. The “Expenses Paid per $1,000” line of the tables is useful in comparing ongoing expenses only and will not help you determine the relative total expense of owning different funds. If these transaction costs had been included, your costs would have been higher.
Expenses and Value of a $1,000 Investment for the six months ended December 31, 2004
| | | | | | |
Actual Portfolio Return
| | Class A
| | Class B
|
Beginning Account Value 7/1/04 | | $ | 1,000.00 | | $ | 1,000.00 |
Ending Account Value 12/31/04 | | $ | 1,098.50 | | $ | 1,096.10 |
Expenses Paid per $1,000* | | $ | 4.45 | | $ | 6.43 |
| | |
Hypothetical 5% Portfolio Return
| | Class A
| | Class B
|
Beginning Account Value 7/1/04 | | $ | 1,000.00 | | $ | 1,000.00 |
Ending Account Value 12/31/04 | | $ | 1,020.82 | | $ | 1,018.93 |
Expenses Paid per $1,000* | | $ | 4.29 | | $ | 6.19 |
| * | Expenses are equal to the Portfolio’s annualized expense ratio for each share class, multiplied by the average account value over the period, multiplied by the number of days in the most recent six-month period, then divided by 365. |
| | | | | | |
Annualized Expense Ratios
| | Class A
| | | Class B
| |
Scudder Variable Series II — SVS Dreman Financial Services Portfolio | | .85 | % | | 1.22 | % |
For more information, please refer to the Portfolio’s prospectus.
Management Summary December 31, 2004
SVS Dreman Financial Services Portfolio
Financial stocks posted strong gains in 2004, keeping pace with the broader stock market. The portfolio (Class A shares, unadjusted for contract charges) posted a total return of 12.00%, outperforming the 10.88% return of its benchmark, the Standard & Poor’s 500, for the year ended December 31, 2004.
Individual stock selection proved more important than sub-sector positioning during the fiscal period ended December 31, 2004. The portfolio’s top performers all were among its 10 largest holdings, including Bank of America Corp., American Express Co. and Freddie Mac. Bank of America rebounded steadily from temporary lows sustained after the company’s ultimately successful bid to acquire FleetBoston at a substantial premium was announced in October 2003. American Express Co., benefited from increased customer credit card spending, higher balances and improved travel sales. Mortgage giant Freddie Mac, continued to recover from losses suffered after an investigation into the company’s accounting practices was launched nearly two years ago. To date, no evidence of illegal action of any kind has been found.
Page 283 of 466
Other portfolio holdings, unfortunately, did not fare as well. Mortgage provider Fannie Mae declined when its accounting practices came under investigation and were deemed improper by the SEC. Citigroup also suffered when, after a breach of securities regulations, it was forced to shut down its private banking business in Japan. We are disappointed by these events. However, the issuers have taken steps to address this situation and we expect the stocks to recover as the controversies abate.
We thank you for your continued investment. We will remain true to our contrarian philosophy of investing, in hopes of adding more value for shareholders over time.
David N. Dreman F. James Hutchinson
Lead Manager Portfolio Manager
Dreman Value Management, L.L.C., Subadvisor to the Portfolio
All performance shown is historical, assumes reinvestment of all dividends and capital gains, and does not guarantee future results. Investment return and principal value fluctuate with changing market conditions so that, when redeemed, shares may be worth more or less then their original cost. Current performance may be lower or higher than the performance data quoted. Please visit scudder.com for the product’s most recent month-end performance. Performance doesn’t reflect charges and fees (“contract charges”) associated with the separate account that invests in the portfolio or any variable life insurance policy or variable annuity contract for which the portfolio is an investment option. These charges and fees will reduce returns.
Risk Considerations
This portfolio is subject to stock market risk. It may focus its investments on certain economic sectors, thereby increasing its vulnerability to any single economic, political or regulatory development. This may result in greater share price volatility. Additionally, this portfolio is non-diversified and can take larger positions in fewer companies, increasing its overall potential risk. Please read this portfolio’s prospectus for specific details regarding its investments and risk profile.
The Standard & Poor’s (S&P) Financial Index is an unmanaged index generally representative of the financial stock market. The Standard & Poor’s (S&P) 500 Index is a capitalization-weighted index of 500 stocks designed to measure performance of the broad domestic economy through changes in the aggregate market value of 500 stocks representing all major industries.
Index returns assume reinvested dividends and, unlike Portfolio returns, do not reflect any fees or expenses. It is not possible to invest directly into an index.
Portfolio management market commentary is as of December 31, 2004, and may not come to pass. This information is subject to change at any time based on market and other conditions.
Portfolio Summary
SVS Dreman Financial Services Portfolio
| | | | | | |
Asset Allocation (Excludes Securities Lending Collateral)
| | 12/31/04
| | | 12/31/03
| |
Common Stocks | | 100 | % | | 96 | % |
Cash Equivalents | | — | | | 4 | % |
| | |
|
| |
|
|
| | | 100 | % | | 100 | % |
| | |
|
| |
|
|
| | | | | | |
Sector Diversification (Excludes Cash Equivalents and Securities Lending Collateral)
| | 12/31/04
| | | 12/31/03
| |
Banks | | 45 | % | | 46 | % |
Diversified Financial Services | | 28 | % | | 30 | % |
Insurance | | 13 | % | | 18 | % |
Capital Markets | | 9 | % | | 2 | % |
Consumer Finance | | 5 | % | | 4 | % |
| | |
|
| |
|
|
| �� | | 100 | % | | 100 | % |
| | |
|
| |
|
|
Page 284 of 466
Asset allocation and sector diversification are subject to change.
For more complete details about the Portfolio’s investment portfolio, see page 17. A quarterly Fact Sheet is available upon request. Information concerning portfolio holdings of the Portfolio as of month end will be posted to scudder.com on the 15th of the following month.
Following the Portfolio’s fiscal first and third quarter-end, a complete portfolio holdings listing is filed with the SEC on Form N-Q. The form will be available on the SEC’s Web site at www.sec.gov, and it also may be reviewed and copied at the SEC’s Public Reference Room in Washington, D.C. Information on the operation of the SEC’s Public Reference Room may be obtained by calling (800) SEC-0330.
Investment Portfolio December 31, 2004
SVS Dreman Financial Services Portfolio
| | | | |
| | | Shares
| | Value ($)
|
Common Stocks 99.9% | | | | |
Financials 99.9% | | | | |
Banks 44.7% | | | | |
Bank of America Corp. | | 276,120 | | 12,974,879 |
Banknorth Group, Inc. | | 52,511 | | 1,921,903 |
Golden West Financial Corp. | | 35,500 | | 2,180,410 |
Independence Community Bank Corp. | | 15,800 | | 672,764 |
KeyCorp | | 188,055 | | 6,375,064 |
Mercantile Bankshares Corp. | | 40,500 | | 2,114,100 |
National Bank of Canada | | 152,350 | | 6,301,770 |
National City Corp. | | 59,631 | | 2,239,144 |
PNC Financial Services Group | | 64,740 | | 3,718,666 |
Popular, Inc. | | 98,000 | | 2,825,340 |
Regions Financial Corp. | | 80,172 | | 2,853,321 |
Sovereign Bancorp, Inc. | | 120,875 | | 2,725,731 |
Sterling Financial Corp.* | | 1,034 | | 40,595 |
US Bancorp | | 190,120 | | 5,954,558 |
Wachovia Corp. | | 86,140 | | 4,530,964 |
Washington Mutual, Inc. | | 284,932 | | 12,046,925 |
Wells Fargo & Co. | | 48,610 | | 3,021,112 |
| | | | |
|
| | | | | 72,497,246 |
| | | | |
|
Capital Markets 8.6% | | | | |
Bear Stearns Companies, Inc. | | 20,640 | | 2,111,678 |
Franklin Resources, Inc. | | 20,910 | | 1,456,382 |
Page 285 of 466
| | | | |
Goldman Sachs Group, Inc. | | 19,700 | | 2,049,588 |
Lehman Brothers Holdings, Inc. | | 20,700 | | 1,810,836 |
Merrill Lynch & Co., Inc. | | 54,550 | | 3,260,453 |
Morgan Stanley | | 57,980 | | 3,219,050 |
Piper Jaffray Companies, Inc.* | | 1,842 | | 88,324 |
| | | | |
|
| | | | | 13,996,311 |
| | | | |
|
Consumer Finance 5.1% | | | | |
American Express Co. | | 116,450 | | 6,564,286 |
SLM Corp. | | 30,230 | | 1,613,980 |
| | | | |
|
| | | | | 8,178,266 |
| | | | |
|
| | |
| | | Shares
| | Value ($)
|
Diversified Financial Services 28.2% | | | | |
Allied Capital Corp. (d) | | 77,495 | | 2,002,471 |
CIT Group, Inc. | | 54,390 | | 2,492,150 |
Citigroup, Inc. | | 137,300 | | 6,615,114 |
Fannie Mae | | 136,480 | | 9,718,741 |
Freddie Mac | | 249,305 | | 18,373,778 |
JPMorgan Chase & Co. | | 165,024 | | 6,437,586 |
| | | | |
|
| | | | | 45,639,840 |
| | | | |
|
Insurance 13.2% | | | | |
Allstate Corp. | | 39,595 | | 2,047,855 |
American International Group, Inc. | | 233,173 | | 15,312,471 |
Chubb Corp. | | 23,030 | | 1,771,007 |
Prudential Financial, Inc. | | 18,390 | | 1,010,714 |
St. Paul Travelers Companies, Inc. | | 32,705 | | 1,212,374 |
| | | | |
|
| | | | | 21,354,421 |
| | | | |
|
Real Estate 0.1% | | | | |
Government Properties Trust, Inc. (REIT) | | 22,800 | | 224,808 |
| | | | |
|
Total Common Stocks (Cost $121,124,627) | | | | 161,890,892 |
| | | | |
|
Securities Lending Collateral 1.1% | | | | |
Daily Assets Fund Institutional, 2.25% (c) (e) (Cost $1,834,875) | | 1,834,875 | | 1,834,875 |
| | | | |
|
Cash Equivalents 0.2% | | | | |
Scudder Cash Management QP Trust, 2.24% (b) (Cost $360,509) | | 360,509 | | 360,509 |
| | | | |
|
| | | | | | |
| | | % of Net
Assets
| | | Value ($)
| |
Total Investment Portfolio (Cost $123,320,011) (a) | | 101.2 | | | 164,086,276 | |
| | | | | |
|
|
Other Assets and Liabilities, Net | | (1.2 | ) | | (1,939,904 | ) |
| | | | | |
|
|
Net Assets | | 100.0 | | | 162,146,372 | |
| | | | | |
|
|
Page 286 of 466
Notes to SVS Dreman Financial Services Portfolio of Investments
| * | Non-income producing security. |
| (a) | The cost for federal income tax purposes was $123,969,302. At December 31, 2004, net unrealized appreciation for all securities based on tax cost was $40,116,974. This consisted of aggregate gross unrealized appreciation for all securities in which there was an excess of value over tax cost of $42,366,596 and aggregate gross unrealized depreciation for all securities in which there was an excess of tax cost over value of $2,249,622. |
| (b) | Scudder Cash Management QP Trust is managed by Deutsche Investment Management Americas Inc. The rate shown is the annualized seven-day yield at period end. |
| (c) | Daily Assets Fund Institutional, an affiliated fund, is managed by Deutsche Asset Management, Inc. The rate shown is the annualized seven-day yield at period end. |
| (d) | A portion of this security was on loan. The value of the security loaned at December 31, 2004 amounted to $1,806,216, which is 1.1% of net assets. |
| (e) | Represents collateral held in connection with securities lending. |
REIT: Real Estate Investment Trust
The accompanying notes are an integral part of the financial statements.
Financial Statements
Statement of Assets and Liabilities as of December 31, 2004
| | | |
Assets | | | |
Investments: | | | |
Investments in securities, at value (cost $121,124,627) — including $1,806,216 of securities loaned | | $ | 161,890,892 |
Investment in Daily Assets Fund Institutional (cost $1,834,875)* | | | 1,834,875 |
Investment in Scudder Cash Management QP Trust (cost $360,509) | | | 360,509 |
| | |
|
|
Total investments in securities, at value (cost $123,320,011) | | | 164,086,276 |
| | |
|
|
Cash | | | 10,000 |
Dividends receivable | | | 143,670 |
Interest receivable | | | 12,760 |
Receivable for Portfolio shares sold | | | 25,266 |
Other assets | | | 10,882 |
| | |
|
|
Total assets | | | 164,288,854 |
| | |
|
|
Liabilities | | | |
Payable for Portfolio shares redeemed | | | 133,197 |
Payable upon return of securities loaned | | | 1,834,875 |
Accrued management fee | | | 99,842 |
Other accrued expenses and payables | | | 74,568 |
| | |
|
|
Total liabilities | | | 2,142,482 |
| | |
|
|
Net assets, at value | | $ | 162,146,372 |
| | |
|
|
Net Assets | | | |
Net assets consist of: | | | |
Undistributed net investment income | | | 2,663,849 |
Net unrealized appreciation (depreciation) on: | | | |
Investments | | | 40,766,265 |
Page 287 of 466
| | | | |
Foreign currency related transactions | | | 1,558 | |
Accumulated net realized gain (loss) | | | (6,301,571 | ) |
Paid-in capital | | | 125,016,271 | |
| | |
|
|
|
Net assets, at value | | $ | 162,146,372 | |
| | |
|
|
|
Class A | | | | |
Net Asset Value, offering and redemption price per share ($144,759,973 ÷ 10,645,952 outstanding shares of beneficial interest, $.01 par value, unlimited number of shares authorized) | | $ | 13.60 | |
| | |
|
|
|
Class B | | | | |
Net Asset Value, offering and redemption price per share ($17,386,399 ÷ 1,281,273 outstanding shares of beneficial interest, $.01 par value, unlimited number of shares authorized) | | $ | 13.57 | |
| | |
|
|
|
| * | Represents collateral on securities loaned. |
Statement of Operations for the year ended December 31, 2004
| | | | |
| Investment Income | | | | |
| |
Income: | | | | |
Dividends (net of foreign taxes withheld of $33,086) | | $ | 4,022,501 | |
Interest — Scudder Cash Management QP Trust | | | 23,032 | |
Securities lending income, including income from Daily Assets Fund Institutional | | | 60,833 | |
| | |
|
|
|
Total Income | | | 4,106,366 | |
| | |
|
|
|
Expenses: | | | | |
Management fee | | | 1,170,409 | |
Custodian and accounting fees | | | 68,365 | |
Distribution service fees (Class B) | | | 34,738 | |
Record keeping fees (Class B) | | | 18,000 | |
Auditing | | | 41,320 | |
Legal | | | 19,946 | |
Trustees’ fees and expenses | | | 636 | |
Reports to shareholders | | | 17,773 | |
| | |
|
|
|
Total expenses, before expense reductions | | | 1,371,187 | |
| | |
|
|
|
Expense reductions | | | (1,896 | ) |
| | |
|
|
|
Total expenses, after expense reductions | | | 1,369,291 | |
| | |
|
|
|
Net investment income (loss) | | | 2,737,075 | |
| | |
|
|
|
Realized and Unrealized Gain (Loss) on Investment Transactions | | | | |
Net realized gain (loss) from: | | | | |
Investments | | | 1,312,903 | |
Foreign currency related transactions | | | 913 | |
| | | | 1,313,816 | |
Net unrealized appreciation (depreciation) during the period on: | | | | |
Investments | | | 13,544,585 | |
Foreign currency related transactions | | | 971 | |
| | | | 13,545,556 | |
| | |
|
|
|
Net gain (loss) on investment transactions | | | 14,859,372 | |
| | |
|
|
|
Net increase (decrease) in net assets resulting from operations | | $ | 17,596,447 | |
| | |
|
|
|
The accompanying notes are an integral part of the financial statements.
Page 288 of 466
Statement of Changes in Net Assets
| | | | | | | | |
| | | Years Ended December 31,
| |
Increase (Decrease) in Net Assets
| | 2004
| | | 2003
| |
Operations: | | | | | | | | |
Net investment income (loss) | | $ | 2,737,075 | | | $ | 2,369,818 | |
Net realized gain (loss) on investment transactions | | | 1,313,816 | | | | (2,049,136 | ) |
Net unrealized appreciation (depreciation) on investment transactions during the period | | | 13,545,556 | | | | 32,205,547 | |
Net increase (decrease) in net assets resulting from operations | | | 17,596,447 | | | | 32,526,229 | |
Distributions to shareholders from: | | | | | | | | |
Net investment income | | | | | | | | |
Class A | | | (2,233,509 | ) | | | (1,844,106 | ) |
Class B | | | (138,571 | ) | | | (20,489 | ) |
Portfolio share transactions: | | | | | | | | |
| | |
Class A | | | | | | | | |
Proceeds from shares sold | | | 9,238,024 | | | | 11,621,806 | |
Reinvestment of distributions | | | 2,233,509 | | | | 1,844,106 | |
Cost of shares redeemed | | | (23,157,778 | ) | | | (20,443,301 | ) |
Net increase (decrease) in net assets from Class A share transactions | | | (11,686,245 | ) | | | (6,977,389 | ) |
| | |
Class B | | | | | | | | |
Proceeds from shares sold | | | 7,389,810 | | | | 8,184,393 | |
Reinvestment of distributions | | | 138,571 | | | | 20,489 | |
Cost of shares redeemed | | | (1,105,504 | ) | | | (298,889 | ) |
Net increase (decrease) in net assets from Class B share transactions | | | 6,422,877 | | | | 7,905,993 | |
Increase (decrease) in net assets | | | 9,960,999 | | | | 31,590,238 | |
Net assets at beginning of period | | | 152,185,373 | | | | 120,595,135 | |
| | |
|
|
| |
|
|
|
Net assets at end of period (including undistributed net investment income of $2,663,849 and $2,297,941, respectively) | | $ | 162,146,372 | | | $ | 152,185,373 | |
| | |
|
|
| |
|
|
|
Other Information | | | | | | | | |
| | |
Class A | | | | | | | | |
Shares outstanding at beginning of period | | | 11,569,224 | | | | 12,274,256 | |
Shares sold | | | 730,584 | | | | 1,078,203 | |
Shares issued to shareholders in reinvestment of distributions | | | 176,982 | | | | 200,228 | |
Shares redeemed | | | (1,830,838 | ) | | | (1,983,463 | ) |
Net increase (decrease) in Portfolio shares | | | (923,272 | ) | | | (705,032 | ) |
| | |
|
|
| |
|
|
|
Shares outstanding at end of period | | | 10,645,952 | | | | 11,569,224 | |
| | |
|
|
| |
|
|
|
Class B | | | | | | | | |
Shares outstanding at beginning of period | | | 771,080 | | | | 39,762 | |
Shares sold | | | 586,845 | | | | 755,394 | |
Shares issued to shareholders in reinvestment of distributions | | | 10,971 | | | | 2,225 | |
Shares redeemed | | | (87,623 | ) | | | (26,301 | ) |
Net increase (decrease) in Portfolio shares | | | 510,193 | | | | 731,318 | |
| | |
|
|
| |
|
|
|
Shares outstanding at end of period | | | 1,281,273 | | | | 771,080 | |
| | |
|
|
| |
|
|
|
The accompanying notes are an integral part of the financial statements.
Page 289 of 466
Financial Highlights
Class A
| | | | | | | | | | | | | | | | | | | | |
Years Ended December 31,
| | 2004
| | | 2003
| | | 2002
| | | 2001
| | | 2000a
| |
Selected Per Share Data | | | | | | | | | | | | | | | | | | | | |
Net asset value, beginning of period | | $ | 12.33 | | | $ | 9.79 | | | $ | 10.78 | | | $ | 11.53 | | | $ | 9.24 | |
| | |
|
|
| |
|
|
| |
|
|
| |
|
|
| |
|
|
|
Income (loss) from investment operations: | | | | | | | | | | | | | | | | | | | | |
Net investment income (loss)b | | | .23 | | | | .20 | | | | .15 | | | | .14 | | | | .19 | |
Net realized and unrealized gain (loss) on investment transactions | | | 1.23 | | | | 2.50 | | | | (1.06 | ) | | | (.71 | ) | | | 2.27 | |
| | |
|
|
| |
|
|
| |
|
|
| |
|
|
| |
|
|
|
Total from investment operations | | | 1.46 | | | | 2.70 | | | | (.91 | ) | | | (.57 | ) | | | 2.46 | |
| | |
|
|
| |
|
|
| |
|
|
| |
|
|
| |
|
|
|
Less distributions from: | | | | | | | | | | | | | | | | | | | | |
Net investment income | | | (.20 | ) | | | (.16 | ) | | | (.08 | ) | | | (.13 | ) | | | (.15 | ) |
Net realized gains on investment transactions | | | — | | | | — | | | | — | | | | (.05 | ) | | | (.02 | ) |
Total distributions | | | (.20 | ) | | | (.16 | ) | | | (.08 | ) | | | (.18 | ) | | | (.17 | ) |
| | |
|
|
| |
|
|
| |
|
|
| |
|
|
| |
|
|
|
Net asset value, end of period | | $ | 13.60 | | | $ | 12.33 | | | $ | 9.79 | | | $ | 10.78 | | | $ | 11.53 | |
| | |
|
|
| |
|
|
| |
|
|
| |
|
|
| |
|
|
|
Total Return (%) | | | 12.00 | | | | 28.13 | | | | (8.51 | ) | | | (4.86 | ) | | | 27.04 | c |
| | |
|
|
| |
|
|
| |
|
|
| |
|
|
| |
|
|
|
Ratios to Average Net Assets and Supplemental Data | | | | | | | | | | | | | | | | | | | | |
Net assets, end of period ($ millions) | | | 145 | | | | 143 | | | | 120 | | | | 117 | | | | 66 | |
Ratio of expenses before expense reductions (%) | | | .84 | | | | .86 | | | | .83 | | | | .86 | | | | .91 | |
Ratio of expenses after expense reductions (%) | | | .84 | | | | .86 | | | | .83 | | | | .86 | | | | .89 | |
Ratio of net investment income (loss) (%) | | | 1.79 | | | | 1.84 | | | | 1.44 | | | | 1.31 | | | | 2.01 | |
Portfolio turnover rate (%) | | | 8 | | | | 7 | | | | 13 | | | | 22 | | | | 13 | |
| a | On June 18, 2001, the Portfolio implemented a 1 for 10 reverse stock split. Share information, for the period prior to December 31, 2001, has been restated to reflect the effect of the split. Shareholders received 1 share for every 10 shares owned and net asset value per share increased correspondingly. |
Page 290 of 466
| b | Based on average shares outstanding during the period. |
| c | Total return would have been lower had certain expenses not been reduced. |
Class B
| | | | | | | | | | | | |
Years Ended December 31,
| | 2004
| | | 2003
| | | 2002a
| |
Selected Per Share Data | | | | | | | | | | | | |
Net asset value, beginning of period | | $ | 12.31 | | | $ | 9.78 | | | $ | 10.57 | |
| | |
|
|
| |
|
|
| |
|
|
|
Income (loss) from investment operations: | | | | | | | | | | | | |
Net investment income (loss)b | | | .18 | | | | .14 | | | | .06 | |
Net realized and unrealized gain (loss) on investment transactions | | | 1.22 | | | | 2.53 | | | | (.85 | ) |
| | |
|
|
| |
|
|
| |
|
|
|
Total from investment operations | | | 1.40 | | | | 2.67 | | | | (.79 | ) |
| | |
|
|
| |
|
|
| |
|
|
|
Less distributions from: | | | | | | | | | | | | |
Net investment income | | | (.14 | ) | | | (.14 | ) | | | — | |
| | |
|
|
| |
|
|
| |
|
|
|
Net asset value, end of period | | $ | 13.57 | | | $ | 12.31 | | | $ | 9.78 | |
| | |
|
|
| |
|
|
| |
|
|
|
Total Return (%) | | | 11.50 | | | | 27.73 | | | | (7.47 | )** |
Ratios to Average Net Assets and Supplemental Data | | | | | | | | | | | | |
Net assets, end of period ($ millions) | | | 17 | | | | 9 | | | | .4 | |
Ratio of expenses (%) | | | 1.22 | | | | 1.25 | | | | 1.08 | * |
Ratio of net investment income (loss) (%) | | | 1.41 | | | | 1.45 | | | | 1.33 | * |
Portfolio turnover rate (%) | | | 8 | | | | 7 | | | | 13 | |
| a | For the period from July 1, 2002 (commencement of operations of Class B shares) to December 31, 2002. |
| b | Based on average shares outstanding during the period. |
Performance Summary December 31, 2004
SVS Dreman High Return Equity Portfolio
All performance shown is historical, assumes reinvestment of all dividends and capital gains, and does not guarantee future results. Investment return and principal value fluctuate with changing market conditions so that, when redeemed, shares may be worth more or less then their original cost. Current performance may be lower or higher than the performance data quoted. Please visit scudder.com for the product’s most recent month-end performance. Performance doesn’t reflect charges and fees (“contract charges”) associated with the separate account that invests in the Portfolio or any variable life insurance policy or variable annuity contract for which the Portfolio is an investment option. These charges and fees will reduce returns.
The Portfolio may focus its investments on certain economic sectors, thereby increasing its vulnerability to any single economic, political or regulatory development. This may result in greater share price volatility. Please read this Portfolio’s prospectus for specific details regarding its investments and risk profile.
Page 291 of 466
Growth of an Assumed $10,000 Investment in SVS Dreman High Return Equity Portfolio from 5/4/1998 to 12/31/2004
| | |
¨ SVS Dreman High Return Equity Portfolio — Class A ¨ S&P 500 Index |
| |
 | | The Standard & Poor’s (S&P) 500 Index is a capitalization-weighted index of 500 stocks. The index is designed to measure performance of the broad domestic economy through changes in the aggregate market value of 500 stocks representing all major industries. Index returns assume reinvested dividends and, unlike Portfolio returns, do not reflect any fees or expenses. It is not possible to invest directly into an index. |
Yearly periods ended December 31 | | |
Comparative Results
| | | | | | | | | | | | | | | | | | |
SVS Dreman High Return Equity Portfolio
| | | | 1-Year
| | | 3-Year
| | | 5-Year
| | | Life of Portfolio*
| |
Class A | | Growth of $10,000 | | $ | 11,395 | | | $ | 12,333 | | | $ | 16,369 | | | $ | 14,958 | |
| | | Average annual total return | | | 13.95 | % | | | 7.24 | % | | | 10.36 | % | | | 6.23 | % |
S&P 500 Index | | Growth of $10,000 | | $ | 11,088 | | | $ | 11,115 | | | $ | 8,902 | | | $ | 12,038 | |
| | | Average annual total return | | | 10.88 | % | | | 3.59 | % | | | -2.30 | % | | | 2.82 | % |
| | | | | |
SVS Dreman High Return Equity Portfolio
| | | | | | | | | | 1-Year
| | | Life of Class**
| |
Class B | | Growth of $10,000 | | | | | | | | | | $ | 11,353 | | | $ | 13,660 | |
| | | Average annual total return | | | | | | | | | | | 13.53 | % | | | 13.27 | % |
S&P 500 Index | | Growth of $10,000 | | | | | | | | | | $ | 11,088 | | | $ | 12,800 | |
| | | Average annual total return | | | | | | | | | | | 10.88 | % | | | 10.38 | % |
The growth of $10,000 is cumulative.
| * | The Portfolio commenced operations on May 4, 1998. Index returns begin April 30, 1998. |
| ** | The Portfolio commenced offering Class B shares on July 1, 2002. Index returns begin June 30, 2002. |
Information About Your Portfolio’s Expenses
SVS Dreman High Return Equity Portfolio
As an investor of the Portfolio, you incur two types of costs: ongoing expenses and transaction costs. Ongoing expenses include management fees, distribution and service (12b-1) fees and other Portfolio expenses. Examples of transaction costs include sales charges (loads), redemption fees and account maintenance fees, which are not shown in this section. The following tables are intended to help you understand your ongoing expenses (in dollars) of investing in the Portfolio and to help you compare these expenses with the ongoing expenses of investing in other mutual funds. In the most recent six-month period, the Portfolio limited these expenses; had it not done so, expenses would have been higher. The tables are based on an investment of $1,000 made at the beginning of the six-month period ended December 31, 2004.
The tables illustrate your Portfolio’s expenses in two ways:
Actual Portfolio Return. This helps you estimate the actual dollar amount of ongoing expenses (but not transaction costs) paid on a $1,000 investment in the Portfolio using the Portfolio’s actual return during the period. To estimate the expenses you paid over the period, simply divide your account value by $1,000 (for example, an $8,600 account value divided by $1,000 = 8.6), then multiply the result by the
Page 292 of 466
number in the “Expenses Paid per $1,000” line under the share class you hold.
Hypothetical 5% Portfolio Return. This helps you to compare your Portfolio’s ongoing expenses (but not transaction costs) with those of other mutual funds using the Portfolio’s actual expense ratio and a hypothetical rate of return of 5% per year before expenses. Examples using a 5% hypothetical Portfolio return may be found in the shareholder reports of other mutual funds. The hypothetical account values and expenses may not be used to estimate the actual ending account balance or expenses you paid for the period.
Please note that the expenses shown in these tables are meant to highlight your ongoing expenses only and do not reflect any transaction costs. The “Expenses Paid per $1,000” line of the tables is useful in comparing ongoing expenses only and will not help you determine the relative total expense of owning different funds. If these transaction costs had been included, your costs would have been higher.
Expenses and Value of a $1,000 Investment for the six months ended December 31, 2004
| | | | | | |
Actual Portfolio Return
| | Class A
| | Class B
|
Beginning Account Value 7/1/04 | | $ | 1,000.00 | | $ | 1,000.00 |
Ending Account Value 12/31/04 | | $ | 1,108.70 | | $ | 1,106.90 |
Expenses Paid per $1,000* | | $ | 4.19 | | $ | 6.18 |
| | |
Hypothetical 5% Portfolio Return
| | Class A
| | Class B
|
Beginning Account Value 7/1/04 | | $ | 1,000.00 | | $ | 1,000.00 |
Ending Account Value 12/31/04 | | $ | 1,021.09 | | $ | 1,019.20 |
Expenses Paid per $1,000* | | $ | 4.02 | | $ | 5.93 |
| * | Expenses are equal to the Portfolio’s annualized expense ratio for each share class, multiplied by the average account value over the period, multiplied by the number of days in the most recent six-month period, then divided by 365. |
| | | | | | |
Annualized Expense Ratios
| | Class A
| | | Class B
| |
Scudder Variable Series II — SVS Dreman High Return Equity Portfolio | | .79 | % | | 1.17 | % |
For more information, please refer to the Portfolio’s prospectus.
Management Summary December 31, 2004
SVS Dreman High Return Equity Portfolio
We are pleased to announce that the portfolio (Class A shares, unadjusted for contract changes) posted a total return of 13.95% for the 12-month period ended December 31, 2004. The Class A shares of the portfolio also outperformed the 10.88% return of its benchmark, the Standard & Poor’s 500 Index. The portfolio also outperformed the S&P 500 in the three- and five-year periods ended December 31, 2004.
The portfolio’s two heaviest overweight positions relative to the benchmark S&P 500 — energy and tobacco companies — proved most advantageous. The strongest performance came from energy stocks, which were driven by historically high oil and natural gas prices. Among individual energy holdings, Transocean, Inc. a drilling company and diversified energy giants ConocoPhillips and Chevron Texaco Corp. were the largest gainers. In tobacco, increased sales and aggressive cost-cutting measures helped bolster profits of Reynolds American Inc., whose subsidiary R.J. Reynolds Tobacco Co. is one of the
Page 293 of 466
largest producers and marketers of cigarettes. Smokeless tobacco giant UST, Inc. benefited from increased sales and higher selling prices, which helped the company grow earnings beyond estimates. In order to lock in profits, we pared back the portfolio’s position in these stocks as they appreciated.
Financial and pharmaceutical stocks were the most troublesome for the portfolio this year. Merck & Co., Inc. declined dramatically after pulling its osteoarthritis drug, Vioxx from pharmacy shelves when a study linked the medication to a higher incidence of stroke and heart attack. Mortgage provider Fannie Mae declined when its accounting practices came under investigation and were deemed improper by the SEC. While we’re disappointed in the events that led to the declines in these holdings, we believe they are temporary setbacks. We continue to hold both stocks.
We’re pleased with the portfolio’s composition and believe it offers a great deal of value in the coming year. We thank you for your investment and look forward to continuing to serve your needs.
David N. Dreman
F. James Hutchinson
Co-Managers
Dreman Value Management L.L.C., Subadvisor to the Portfolio
All performance shown is historical, assumes reinvestment of all dividends and capital gains, and does not guarantee future results. Investment return and principal value fluctuate with changing market conditions so that, when redeemed, shares may be worth more or less then their original cost. Current performance may be lower or higher than the performance data quoted. Please visit scudder.com for the product’s most recent month-end performance. Performance doesn’t reflect charges and fees (“contract charges”) associated with the separate account that invests in the portfolio or any variable life insurance policy or variable annuity contract for which the portfolio is an investment option. These charges and fees will reduce returns.
Risk Considerations
The portfolio may focus its investments on certain economic sectors, thereby increasing its vulnerability to any single economic, political or regulatory development. This may result in greater share price volatility. Please read this portfolio’s prospectus for specific details regarding its investments and risk profile.
TPortfolio management market commentary is as of December 31, 2004, and may not come to pass. This information is subject to change at any time based on market and other conditions.he Standard & Poor’s (S&P) 500 Index is a capitalization-weighted index of 500 stocks. The index is designed to measure performance of the broad domestic economy through changes in the aggregate market value of 500 stocks representing all major industries. Index returns assume reinvestment of all distributions and do not reflect fees or expenses. It is not possible to invest directly into an index.
Portfolio Summary
SVS Dreman High Return Equity Portfolio
| | | | | | |
Asset Allocation (Excludes Securities Lending Collateral)
| | 12/31/04
| | | 12/31/03
| |
Common Stocks | | 92 | % | | 90 | % |
Cash Equivalents | | 8 | % | | 10 | % |
| | |
|
| |
|
|
| | | 100 | % | | 100 | % |
| | |
|
| |
|
|
Page 294 of 466
| | | | | | |
Sector Diversification (Excludes Cash Equivalents and Securities Lending Collateral)
| | 12/31/04
| | | 12/31/03
| |
Financials | | 34 | % | | 32 | % |
Consumer Staples | | 21 | % | | 21 | % |
Health Care | | 17 | % | | 16 | % |
Energy | | 14 | % | | 10 | % |
Consumer Discretionary | | 8 | % | | 11 | % |
Industrials | | 3 | % | | 4 | % |
Information Technology | | 3 | % | | 5 | % |
Utilities | | — | | | 1 | % |
| | |
|
| |
|
|
| | | 100 | % | | 100 | % |
| | |
|
| |
|
|
Asset allocation and sector diversification are subject to change.
For more complete details about the Portfolio’s investment portfolio, see page 27. A quarterly Fact Sheet is available upon request. Information concerning portfolio holdings of the Portfolio as of month end will be posted to scudder.com on the 15th of the following month.
Following the Portfolio’s fiscal first and third quarter-end, a complete portfolio holdings listing is filed with the SEC on Form N-Q. The form will be available on the SEC’s Web site at www.sec.gov, and it also may be reviewed and copied at the SEC’s Public Reference Room in Washington, D.C. Information on the operation of the SEC’s Public Reference Room may be obtained by calling (800) SEC-0330.
Investment Portfolio December 31, 2004
SVS Dreman High Return Equity Portfolio
| | | | |
| | | Shares
| | Value ($)
|
Common Stocks 91.6% | | | | |
Consumer Discretionary 7.1% | | | | |
Automobiles 0.6% | | | | |
Ford Motor Co. | | 345,000 | | 5,050,800 |
| | | | |
|
Multiline Retail 0.9% | | | | |
Federated Department Stores, Inc. | | 129,505 | | 7,484,094 |
| | | | |
|
Specialty Retail 5.6% | | | | |
Best Buy Co., Inc. | | 47,225 | | 2,806,109 |
Borders Group, Inc. | | 712,900 | | 18,107,660 |
Home Depot, Inc. | | 388,455 | | 16,602,567 |
Staples, Inc. | | 334,165 | | 11,264,702 |
| | | | |
|
| | | | | 48,781,038 |
| | | | |
|
Consumer Staples 19.4% | | | | |
Food & Staples Retailing 0.5% | | | | |
Safeway, Inc.* | | 232,650 | | 4,592,511 |
| | | | |
|
Tobacco 18.9% | | | | |
Altria Group, Inc. | | 1,349,420 | | 82,449,562 |
Imperial Tobacco Group (ADR) | | 95,145 | | 5,256,761 |
Reynolds American, Inc. (c) | | 298,073 | | 23,428,538 |
Page 295 of 466
| | | | |
Universal Corp. | | 266,570 | | 12,752,709 |
UST, Inc. | | 816,640 | | 39,288,550 |
| | | | |
|
| | | | | 163,176,120 |
| | | | |
|
Energy 12.6% | | | | |
Energy Equipment & Services 0.7% | | | | |
Transocean, Inc.* | | 154,200 | | 6,536,538 |
| | | | |
|
Oil & Gas 11.9% | | | | |
Apache Corp. | | 8,200 | | 414,674 |
Burlington Resources, Inc. | | 6,400 | | 278,400 |
Chevron Texaco Corp. | | 562,860 | | 29,555,779 |
ConocoPhillips | | 465,823 | | 40,447,411 |
Devon Energy Corp. | | 306,250 | | 11,919,250 |
El Paso Corp. | | 846,510 | | 8,803,704 |
EnCana Corp. | | 31,800 | | 1,814,508 |
Kerr-McGee Corp. | | 120,300 | | 6,952,137 |
Occidental Petroleum Corp. | | 44,279 | | 2,584,122 |
| | | | |
|
| | | | | 102,769,985 |
| | | | |
|
Financials 30.9% | | | | |
Banks 13.0% | | | | |
Bank of America Corp. | | 521,636 | | 24,511,676 |
KeyCorp | | 335,280 | | 11,365,992 |
PNC Financial Services Group | | 236,014 | | 13,556,644 |
Sovereign Bancorp, Inc. | | 501,910 | | 11,318,070 |
US Bancorp | | 265,700 | | 8,321,724 |
Wachovia Corp. | | 140,000 | | 7,364,000 |
Washington Mutual, Inc. | | 854,175 | | 36,114,519 |
| | | | |
|
| | | | | 112,552,625 |
| | | | |
|
Capital Markets 0.0% | | | | |
Piper Jaffray Companies, Inc.* | | 2,657 | | 127,403 |
| | | | |
|
Diversified Financial Services 15.0% | | | | |
CIT Group, Inc. | | 89,100 | | 4,082,562 |
Fannie Mae | | 652,073 | | 46,434,118 |
Freddie Mac | | 1,000,341 | | 73,725,132 |
JPMorgan Chase & Co. | | 132,864 | | 5,183,025 |
| | | | |
|
| | | | | 129,424,837 |
| | | | |
|
| | |
| | | Shares
| | Value ($)
|
Insurance 2.9% | | | | |
American International Group, Inc. | | 331,300 | | 21,756,471 |
St. Paul Travelers Companies, Inc. | | 98,405 | | 3,647,874 |
| | | | |
|
| | | | | 25,404,345 |
| | | | |
|
Health Care 15.9% | | | | |
Health Care Equipment & Supplies 1.0% | | | | |
Becton, Dickinson & Co. | | 145,055 | | 8,239,124 |
| | | | |
|
Health Care Providers & Services 8.8% | | | | |
AmerisourceBergen Corp. | | 218,000 | | 12,792,240 |
Page 296 of 466
| | | | |
Cardinal Health, Inc. | | 119,400 | | 6,943,110 |
HCA, Inc. | | 296,200 | | 11,836,152 |
Laboratory Corp. of America Holdings* | | 343,075 | | 17,091,996 |
Medco Health Solutions, Inc.* | | 316,434 | | 13,163,654 |
Quest Diagnostics, Inc. | | 145,550 | | 13,907,303 |
| | | | |
|
| | | | | 75,734,455 |
| | | | |
|
Pharmaceuticals 6.1% | | | | |
Bristol-Myers Squibb Co. | | 875,560 | | 22,431,847 |
Merck & Co., Inc. | | 360,195 | | 11,576,667 |
Pfizer, Inc. | | 479,530 | | 12,894,562 |
Schering-Plough Corp. | | 134,905 | | 2,816,817 |
Wyeth | | 75,775 | | 3,227,257 |
| | | | |
|
| | | | | 52,947,150 |
| | | | |
|
Industrials 2.6% | | | | |
Industrial Conglomerates | | | | |
General Electric Co. | | 209,350 | | 7,641,275 |
Tyco International Ltd. | | 415,005 | | 14,832,279 |
| | | | |
|
| | | | | 22,473,554 |
| | | | |
|
Information Technology 3.1% | | | | |
IT Consulting & Services | | | | |
Electronic Data Systems Corp. | | 1,147,840 | | 26,515,104 |
| | | | |
|
Utilities 0.0% | | | | |
Gas Utilities | | | | |
NiSource, Inc. | | 5,303 | | 120,802 |
| | | | |
|
Total Common Stocks (Cost $637,942,324) | | | | 791,930,485 |
| | | | |
|
Securities Lending Collateral 2.3% | | | | |
Daily Assets Fund Institutional, 2.25% (d) (e) (Cost $19,806,450) | | 19,806,450 | | 19,806,450 |
| | | | |
|
Cash Equivalents 8.0% | | | | |
Scudder Cash Management QP Trust, 2.24% (b) (Cost $68,968,040) | | 68,968,040 | | 68,968,040 |
| | | | |
|
| | | | | | |
| | | % of
Net Assets
| | | Value ($)
| |
Total Investment Portfolio (Cost $726,716,814) (a) | | 101.9 | | | 880,704,975 | |
| | | | | |
|
|
Other Assets and Liabilities, Net | | (1.9 | ) | | (16,463,874 | ) |
| | | | | |
|
|
Net Assets | | 100.0 | | | 864,241,101 | |
| | | | | |
|
|
Notes to SVS Dreman High Return Equity Portfolio of Investments
| * | Non-income producing security. |
| (a) | The cost for federal income tax purposes was $727,953,999. At December 31, 2004, net unrealized appreciation for all securities based on tax cost was $152,750,976. This consisted of aggregate gross unrealized appreciation for all securities in which there was an excess of value over tax cost of $194,020,894 and aggregate gross unrealized depreciation for all securities in which there was an excess of tax cost over value of $41,269,918. |
| (b) | Scudder Cash Management QP Trust is also managed by Deutsche Investment Management Americas Inc. The rate shown is the annualized seven-day yield at period end. |
| (c) | A portion of this security was on loan (see Notes to Financial Statements). The value of the security loaned at December 31, 2004 amounted to $19,352,752, which is 2.2% of net assets. |
Page 297 of 466
| (d) | Daily Assets Fund Institutional, an affiliated fund, is managed by Deutsche Asset Management, Inc. The rate shown is the annualized seven-day yield at period end. |
| (e) | Represents collateral held in connection with securities lending. |
At December 31, 2004, open futures contracts purchased were as follows:
| | | | | | | | | | |
Futures
| | Expiration
Date
| | Contracts
| | Aggregated
Face Value ($)
| | Value ($)
| | Net Unrealized
Appreciation
(Depreciation) ($)
|
S&P 500 Index Future | | 3/17/2005 | | 121 | | 35,911,288 | | 36,714,425 | | 803,137 |
ADR: American Depositary Receipts
The accompanying notes are an integral part of the financial statements.
Financial Statements
Statement of Assets and Liabilities as of December 31, 2004
| | | | |
Assets | | | | |
Investments: | | | | |
Investments in securities, at value (cost $637,942,324) — including $19,352,752 of securities loaned | | $ | 791,930,485 | |
Investment in Daily Assets Fund Institutional (cost $19,806,450)* | | | 19,806,450 | |
Investment in Scudder Cash Management QP Trust (cost $68,968,040) | | | 68,968,040 | |
| | |
|
|
|
Total investments in securities, at value (cost $726,716,814) | | | 880,704,975 | |
| | |
|
|
|
Cash | | | 7,297 | |
Margin deposit | | | 3,000,000 | |
Dividends receivable | | | 1,722,982 | |
Interest receivable | | | 123,092 | |
Receivable for Portfolio shares sold | | | 109,312 | |
Other assets | | | 24,681 | |
| | |
|
|
|
Total assets | | | 885,692,339 | |
| | |
|
|
|
Liabilities | | | | |
Payable for Portfolio shares redeemed | | | 876,789 | |
Payable upon return of securities loaned | | | 19,806,450 | |
Payable for daily variation margin on open futures contracts | | | 30,250 | |
Accrued management fee | | | 512,877 | |
Other accrued expenses and payables | | | 224,872 | |
| | |
|
|
|
Total liabilities | | | 21,451,238 | |
| | |
|
|
|
Net assets, at value | | $ | 864,241,101 | |
| | |
|
|
|
Net Assets | | | | |
Net assets consist of: | | | | |
Undistributed net investment income | | | 14,597,599 | |
Net unrealized appreciation (depreciation) on: | | | | |
Investments | | | 153,988,161 | |
Futures | | | 803,137 | |
Accumulated net realized gain (loss) | | | (21,350,049 | ) |
Paid-in capital | | | 716,202,253 | |
| | |
|
|
|
Net assets, at value | | $ | 864,241,101 | |
| | |
|
|
|
Class A | | | | |
Net Asset Value, offering and redemption price per share ($746,974,983 ÷ 59,052,129 outstanding shares of beneficial interest, $.01 par value, unlimited number of shares authorized) | | $ | 12.65 | |
| | |
|
|
|
Class B | | | | |
Net Asset Value, offering and redemption price per share ($117,266,118 ÷ 9,286,484 outstanding shares of beneficial interest, $.01 par value, unlimited number of shares authorized) | | $ | 12.63 | |
| | |
|
|
|
| * | Represents collateral on securities loaned. |
Page 298 of 466
Statement of Operations for the year ended December 31, 2004
| | | | |
Investment Income | | | | |
Income: | | | | |
Dividends (net of foreign taxes withheld of $18,050) | | $ | 20,328,943 | |
Interest — Scudder Cash Management QP Trust | | | 955,273 | |
Securities lending income, including income from Daily Assets Fund Institutional | | | 11,345 | |
| | |
|
|
|
Total Income | | | 21,295,561 | |
| | |
|
|
|
Expenses: | | | | |
Management fee | | | 5,664,121 | |
Custodian and accounting fees | | | 168,365 | |
Distribution service fees (Class B) | | | 230,719 | |
Record keeping fees (Class B) | | | 121,434 | |
Auditing | | | 41,147 | |
Legal | | | 17,553 | |
Trustees’ fees and expenses | | | 12,577 | |
Reports to shareholders | | | 137,634 | |
Registration fees | | | 610 | |
Other | | | 26,773 | |
| | |
|
|
|
Total expenses, before expense reductions | | | 6,420,933 | |
| | |
|
|
|
Expense reductions | | | (6,809 | ) |
| | |
|
|
|
Total expenses, after expense reductions | | | 6,414,124 | |
| | |
|
|
|
Net investment income (loss) | | | 14,881,437 | |
| | |
|
|
|
Realized and Unrealized Gain (Loss) on Investment Transactions | | | | |
Net realized gain (loss) from: | | | | |
Investments | | | 6,959,277 | |
Futures | | | 4,188,252 | |
| | | | 11,147,529 | |
Net unrealized appreciation (depreciation) during the period on: | | | | |
Investments | | | 80,273,108 | |
Futures | | | (1,410,615 | ) |
| | | | 78,862,493 | |
| | |
|
|
|
Net gain (loss) on investment transactions | | | 90,010,022 | |
| | |
|
|
|
Net increase (decrease) in net assets resulting from operations | | $ | 104,891,459 | |
| | |
|
|
|
The accompanying notes are an integral part of the financial statements.
Page 299 of 466
Statement of Changes in Net Assets
| | | | | | | | |
| | | Years Ended December 31,
| |
Increase (Decrease) in Net Assets
| | 2004
| | | 2003
| |
Operations: | | | | | | | | |
Net investment income (loss) | | $ | 14,881,437 | | | $ | 12,351,057 | |
Net realized gain (loss) on investment transactions | | | 11,147,529 | | | | 10,010,852 | |
Net unrealized appreciation (depreciation) on investment transactions during the period | | | 78,862,493 | | | | 149,662,562 | |
Net increase (decrease) in net assets resulting from operations | | | 104,891,459 | | | | 172,024,471 | |
Distributions to shareholders from: | | | | | | | | |
Net investment income | | | | | | | | |
Class A | | | (11,297,007 | ) | | | (11,229,274 | ) |
Class B | | | (1,021,598 | ) | | | (193,827 | ) |
Portfolio share transactions: | | | | | | | | |
| | |
Class A | | | | | | | | |
Proceeds from shares sold | | | 38,718,500 | | | | 51,591,121 | |
Reinvestment of distributions | | | 11,297,007 | | | | 11,229,274 | |
Cost of shares redeemed | | | (55,620,546 | ) | | | (50,121,722 | ) |
Net increase (decrease) in net assets from Class A share transactions | | | (5,605,039 | ) | | | 12,698,673 | |
| | |
Class B | | | | | | | | |
Proceeds from shares sold | | | 42,816,407 | | | | 52,862,147 | |
Reinvestment of distributions | | | 1,021,598 | | | | 193,827 | |
Cost of shares redeemed | | | (4,506,330 | ) | | | (584,554 | ) |
Net increase (decrease) in net assets from Class B share transactions | | | 39,331,675 | | | | 52,471,420 | |
Increase (decrease) in net assets | | | 126,299,490 | | | | 225,771,463 | |
Net assets at beginning of period | | | 737,941,611 | | | | 512,170,148 | |
| | |
|
|
| |
|
|
|
Net assets at end of period (including undistributed net investment income of $14,597,599 and $12,034,767, respectively) | | $ | 864,241,101 | | | $ | 737,941,611 | |
| | |
|
|
| |
|
|
|
Page 300 of 466
| | | | | | |
Other Information | | | | | | |
| | |
Class A | | | | | | |
Shares outstanding at beginning of period | | 59,527,655 | | | 58,214,359 | |
Shares sold | | 3,370,933 | | | 5,422,760 | |
Shares issued to shareholders in reinvestment of distributions | | 1,011,370 | | | 1,398,415 | |
Shares redeemed | | (4,857,829 | ) | | (5,507,879 | ) |
Net increase (decrease) in Portfolio shares | | (475,526 | ) | | 1,313,296 | |
| | |
|
| |
|
|
Shares outstanding at end of period | | 59,052,129 | | | 59,527,655 | |
| | |
|
| |
|
|
| | |
Class B | | | | | | |
Shares outstanding at beginning of period | | 5,819,055 | | | 251,123 | |
Shares sold | | 3,763,080 | | | 5,599,747 | |
Shares issued to shareholders in reinvestment of distributions | | 91,377 | | | 24,108 | |
Shares redeemed | | (387,028 | ) | | (55,923 | ) |
Net increase (decrease) in Portfolio shares | | 3,467,429 | | | 5,567,932 | |
| | |
|
| |
|
|
Shares outstanding at end of period | | 9,286,484 | | | 5,819,055 | |
| | |
|
| |
|
|
The accompanying notes are an integral part of the financial statements.
Financial Highlights
Class A
| | | | | | | | | | | | | | | | | | | | |
Years Ended December 31,
| | 2004
| | | 2003
| | | 2002
| | | 2001
| | | 2000a
| |
Selected Per Share Data | | | | | | | | | | | | | | | | | | | | |
Net asset value, beginning of period | | $ | 11.29 | | | $ | 8.76 | | | $ | 10.81 | | | $ | 10.77 | | | $ | 8.96 | |
| | |
|
|
| |
|
|
| |
|
|
| |
|
|
| |
|
|
|
Income (loss) from investment operations: | | | | | | | | | | | | | | | | | | | | |
Net investment income (loss)b | | | .23 | | | | .20 | | | | .21 | | | | .19 | | | | .26 | |
Net realized and unrealized gain (loss) on investment transactions | | | 1.32 | | | | 2.53 | | | | (2.13 | ) | | | (.01 | ) | | | 2.25 | |
| | |
|
|
| |
|
|
| |
|
|
| |
|
|
| |
|
|
|
Total from investment operations | | | 1.55 | | | | 2.73 | | | | (1.92 | ) | | | .18 | | | | 2.51 | |
| | |
|
|
| |
|
|
| |
|
|
| |
|
|
| |
|
|
|
Less distributions from: | | | | | | | | | | | | | | | | | | | | |
Net investment income | | | (.19 | ) | | | (.20 | ) | | | (.09 | ) | | | (.14 | ) | | | (.20 | ) |
Net realized gains on investment transactions | | | — | | | | — | | | | (.04 | ) | | | — | | | | (.50 | ) |
| | |
|
|
| |
|
|
| |
|
|
| |
|
|
| |
|
|
|
Total distributions | | | (.19 | ) | | | (.20 | ) | | | (.13 | ) | | | (.14 | ) | | | (.70 | ) |
| | |
|
|
| |
|
|
| |
|
|
| |
|
|
| |
|
|
|
Net asset value, end of period | | $ | 12.65 | | | $ | 11.29 | | | $ | 8.76 | | | $ | 10.81 | | | $ | 10.77 | |
| | |
|
|
| |
|
|
| |
|
|
| |
|
|
| |
|
|
|
Total Return (%) | | | 13.95 | | | | 32.04 | | | | (18.03 | ) | | | 1.69 | | �� | | 30.52 | |
| | |
|
|
| |
|
|
| |
|
|
| |
|
|
| |
|
|
|
Ratios to Average Net Assets and Supplemental Data | | | | | | | | | | | | | | | | | | | | |
Net assets, end of period ($ millions) | | | 747 | | | | 672 | | | | 510 | | | | 443 | | | | 168 | |
Ratio of expenses before expense reductions (%) | | | .78 | | | | .79 | | | | .79 | | | | .82 | | | | .85 | |
Ratio of expenses after expense reductions (%) | | | .78 | | | | .79 | | | | .79 | | | | .82 | | | | .84 | |
Ratio of net investment income (loss) (%) | | | 1.96 | | | | 2.14 | | | | 2.21 | | | | 1.78 | | | | 2.85 | |
Portfolio turnover rate (%) | | | 9 | | | | 18 | | | | 17 | | | | 16 | | | | 37 | |
| a | On June 18, 2001, the Portfolio implemented a 1 for 10 reverse stock split. Per share information, for the period prior to December 31, 2001, has been restated to reflect the effect of the split. Shareholders received 1 share for every 10 shares owned and net asset value per share increased correspondingly. |
Page 301 of 466
| b | Based on average shares outstanding during the period. |
Class B
| | | | | | | | | | | | |
Years Ended December 31,
| | 2004
| | | 2003
| | | 2002a
| |
Selected Per Share Data | | | | | | | | | | | | |
Net asset value, beginning of period | | $ | 11.27 | | | $ | 8.75 | | | $ | 9.57 | |
| | |
|
|
| |
|
|
| |
|
|
|
Income (loss) from investment operations: | | | | | | | | | | | | |
Net investment income (loss)b | | | .18 | | | | .16 | | | | .18 | |
Net realized and unrealized gain (loss) on investment transactions | | | 1.33 | | | | 2.53 | | | | (1.00 | ) |
| | |
|
|
| |
|
|
| |
|
|
|
Total from investment operations | | | 1.51 | | | | 2.69 | | | | (.82 | ) |
| | |
|
|
| |
|
|
| |
|
|
|
Less distributions from: | | | | | | | | | | | | |
Net investment income | | | (.15 | ) | | | (.17 | ) | | | — | |
| | |
|
|
| |
|
|
| |
|
|
|
Net asset value, end of period | | $ | 12.63 | | | $ | 11.27 | | | $ | 8.75 | |
| | |
|
|
| |
|
|
| |
|
|
|
Total Return (%) | | | 13.53 | | | | 31.60 | | | | (8.57 | )** |
| | |
|
|
| |
|
|
| |
|
|
|
Ratios to Average Net Assets and Supplemental Data | | | | | | | | | | | | |
Net assets, end of period ($ millions) | | | 117 | | | | 66 | | | | 2 | |
Ratio of expenses (%) | | | 1.16 | | | | 1.18 | | | | 1.05 | * |
Ratio of net investment income (loss) (%) | | | 1.58 | | | | 1.75 | | | | 4.30 | * |
Portfolio turnover rate (%) | | | 9 | | | | 18 | | | | 17 | |
| a | For the period from July 1, 2002 (commencement of operations of Class B shares) to December 31, 2002. |
| b | Based on average shares outstanding during the period. |
Performance Summary December 31, 2004
SVS Dreman Small Cap Value Portfolio
All performance shown is historical, assumes reinvestment of all dividends and capital gains, and does not guarantee future results. Investment return and principal value fluctuate with changing market conditions so that, when redeemed, shares may be worth more or less then their original cost. Current performance may be lower or higher than the performance data quoted. Please visit scudder.com for the product’s most recent month-end performance. Performance doesn’t reflect charges and fees (“contract charges”) associated with the separate account that invests in the Portfolio or any variable life insurance policy or variable annuity contract for which the Portfolio is an investment option. These charges and fees will reduce returns.
This Portfolio is subject to stock market risk. Stocks of small companies involve greater risk, as they often have limited product lines, markets or financial resources and may be exposed to more erratic and abrupt market movements than securities of larger, more-established companies. This may result in greater share price volatility. Please read this Portfolio’s prospectus for specific details regarding its investments and risk profile.
Page 302 of 466
| | |
| Growth of an Assumed $10,000 Investment in SVS Dreman Small Cap Value Portfolio from 5/1/1996 to 12/31/2004 |
|
¨ SVS Dreman Small Cap Value Portfolio — Class A ¨ Russell 2000 Value Index |
| |
| | The Russell 2000 Value Index is an unmanaged index which measures the performance of those Russell 2000 companies with lower price-to-book ratios and lower forecasted growth values. Index returns assume reinvested dividends and, unlike Portfolio returns, do not reflect any fees or expenses. It is not possible to invest directly into an index. |
| |
Yearly periods ended December 31 | | |
Comparative Results
| | | | | | | | | | | | | | | | | | |
SVS Dreman Small Cap Value Portfolio
| | | | 1-Year
| | | 3-Year
| | | 5-Year
| | | Life of Portfolio*
| |
Class A | | Growth of $10,000 | | $ | 12,603 | | | $ | 15,868 | | | $ | 19,428 | | | $ | 21,978 | |
| | | Average annual total return | | | 26.03 | % | | | 16.64 | % | | | 14.20 | % | | | 9.51 | % |
Russell 2000 Value Index | | Growth of $10,000 | | $ | 12,225 | | | $ | 15,812 | | | $ | 22,144 | | | $ | 30,438 | |
| | | Average annual total return | | | 22.25 | % | | | 16.50 | % | | | 17.23 | % | | | 13.70 | % |
| | | | | |
SVS Dreman Small Cap Value Portfolio
| | | | | | | | | | 1-Year
| | | Life of Class**
| |
Class B | | Growth of $10,000 | | | | | | | | | | $ | 12,552 | | | $ | 14,945 | |
| | | Average annual total return | | | | | | | | | | | 25.52 | % | | | 17.42 | % |
Russell 2000 Value Index | | Growth of $10,000 | | | | | | | | | | $ | 12,225 | | | $ | 14,742 | |
| | | Average annual total return | | | | | | | | | | | 22.25 | % | | | 16.79 | % |
The growth of $10,000 is cumulative.
| * | The Portfolio commenced operations on May 1, 1996. Index returns begin April 30, 1996. |
| ** | The Portfolio commenced offering Class B shares on July 1, 2002. Index returns begin June 30, 2002. |
Information About Your Portfolio’s Expenses
SVS Dreman Small Cap Value Portfolio
As an investor of the Portfolio, you incur two types of costs: ongoing expenses and transaction costs. Ongoing expenses include management fees, distribution and service (12b-1) fees and other Portfolio expenses. Examples of transaction costs include sales charges (loads), redemption fees and account maintenance fees, which are not shown in this section. The following tables are intended to help you understand your ongoing expenses (in dollars) of investing in the Portfolio and to help you compare these expenses with the ongoing expenses of investing in other mutual funds. The tables are based on an investment of $1,000 made at the beginning of the six-month period ended December 31, 2004.
The tables illustrate your Portfolio’s expenses in two ways:
Actual Portfolio Return. This helps you estimate the actual dollar amount of ongoing expenses (but not transaction costs) paid on a $1,000 investment in the Portfolio using the Portfolio’s actual return during the period. To estimate the expenses you paid over the period, simply divide your account value by $1,000 (for example, an $8,600 account value divided by $1,000 = 8.6), then multiply the result by the number in the “Expenses Paid per $1,000” line under the share class you hold.
Page 303 of 466
Hypothetical 5% Portfolio Return. This helps you to compare your Portfolio’s ongoing expenses (but not transaction costs) with those of other mutual funds using the Portfolio’s actual expense ratio and a hypothetical rate of return of 5% per year before expenses. Examples using a 5% hypothetical Portfolio return may be found in the shareholder reports of other mutual funds. The hypothetical account values and expenses may not be used to estimate the actual ending account balance or expenses you paid for the period.
Please note that the expenses shown in these tables are meant to highlight your ongoing expenses only and do not reflect any transaction costs. The “Expenses Paid per $1,000” line of the tables is useful in comparing ongoing expenses only and will not help you determine the relative total expense of owning different funds. If these transaction costs had been included, your costs would have been higher.
Expenses and Value of a $1,000 Investment for the six months ended December 31, 2004
| | | | | | |
Actual Portfolio Return
| | Class A
| | Class B
|
Beginning Account Value 7/1/04 | | $ | 1,000.00 | | $ | 1,000.00 |
Ending Account Value 12/31/04 | | $ | 1,142.40 | | $ | 1,140.70 |
Expenses Paid per $1,000* | | $ | 4.19 | | $ | 6.19 |
| | |
Hypothetical 5% Portfolio Return
| | Class A
| | Class B
|
Beginning Account Value 7/1/04 | | $ | 1,000.00 | | $ | 1,000.00 |
Ending Account Value 12/31/04 | | $ | 1,021.29 | | $ | 1,019.29 |
Expenses Paid per $1,000* | | $ | 3.96 | | $ | 5.83 |
| * | Expenses are equal to the Portfolio’s annualized expense ratio for each share class, multiplied by the average account value over the period, multiplied by the number of days in the most recent six-month period, then divided by 365. |
| | | | | | |
Annualized Expense Ratios
| | Class A
| | | Class B
| |
Scudder Variable Series II — SVS II Dreman Small Cap Value Portfolio | | .78 | % | | 1.15 | % |
For more information, please refer to the Portfolio’s prospectus.
Management Summary December 31, 2004
SVS Dreman Small Cap Value Portfolio
The portfolio benefited from a market that continued to favor small capitalization stocks over their large cap counterparts and value- over growth-style investing. The Russell 2000 Value Index, generally a measure of the small cap value universe and the fund’s benchmark, gained 22.25% for the year ended November 30, 2004.1 This compares with the Russell 1000 Value Index, generally a measure of the large cap value universe, which rose 16.49%; and the Russell 2000 Growth Index, generally a measure of the small cap growth universe, which advanced 10.83%, also for the period.2 The portfolio (Class A shares, unadjusted for contract charges) outperformed all of those indices, by posting a total return of 26.03% in 2004.
The portfolio’s overweight position in energy, which climbed along with crude oil and natural gas prices, was a significant contributor. Strong performance came from Ultra Petroleum Corp., an independent producer of oil and gas that soared on the news of a major discovery of natural gas on one of its properties. The portfolio also benefited from its investment in merchant energy company Reliant Energy, Inc.
Page 304 of 466
In 2004, the portfolio sustained only small losses in individual stocks. Stillwater Mining Co. is a metals and mining stock that trades like commodities. Its performance is closely tied to the health of the economy, making earnings volatile. A significant decline in the price of the commodities prompted the portfolio to take a small loss in the position as we eliminated the stock from the portfolio. Parallel Petroleum Corp. is engaged in the production of oil and natural gas. The fund held a small position in the stock, which it sold at a small loss in order to focus on other names in the energy space with greater potential.
David N. Dreman
Nelson Woodard
Co-Managers
Dreman Value Management, L.L.C., Subadvisor to the Portfolio
All performance shown is historical, assumes reinvestment of all dividends and capital gains, and does not guarantee future results. Investment return and principal value fluctuate with changing market conditions so that, when redeemed, shares may be worth more or less then their original cost. Current performance may be lower or higher than the performance data quoted. Please visit scudder.com for the product’s most recent month-end performance. Performance doesn’t reflect charges and fees (“contract charges”) associated with the separate account that invests in the portfolio or any variable life insurance policy or variable annuity contract for which the portfolio is an investment option. These charges and fees will reduce returns.
Risk Considerations
This portfolio is subject to stock market risk. Stocks of small companies involve greater risk than securities of larger, more-established companies, as they often have limited product lines, markets or financial resources and may be exposed to more erratic and abrupt market movements. This may result in greater share price volatility. Please read this portfolio’s prospectus for specific details regarding its investments and risk profile.
| 1 | The Russell 2000 Value Index is an unmanaged index that measures the performance of those Russell 2000 companies with lower price-to-book (P/B) ratios and lower forecasted growth values. P/B is equal to a stock’s market capitalization divided by its book value. (This ratio compares the market’s valuation of a company to the value of that company as indicated on its financial statements.) |
| 2 | The Russell 1000 Value Index is an unmanaged index, which consists of those stocks in the Russell 1000 Index with lower price-to-book (P/B) ratios and lower forecasted-growth values. The Russell 2000 Growth Index is an unmanaged index that measures the performance of those Russell 2000 companies with higher price-to-book (P/B) ratios and higher forecasted growth values. P/B is equal to a stock’s market capitalization divided by its book value. (This ratio compares the market’s valuation of a company to the value of that company as indicated on its financial statements.) |
Index returns assume reinvested dividends and, unlike portfolio returns, do not reflect any fees or expenses. It is not possible to invest directly into an index.
Portfolio management market commentary is as of December 31, 2004, and may not come to pass. This information is subject to change at any time based on market and other conditions.
Page 305 of 466
Portfolio Summary
SVS Dreman Small Cap Value Portfolio
| | | | | | |
Asset Allocation
| | 12/31/04
| | | 12/31/03
| |
Common Stocks | | 95 | % | | 96 | % |
Cash Equivalents | | 3 | % | | 3 | % |
Corporate Bonds | | 1 | % | | — | |
Closed-End Investment Company | | 1 | % | | — | |
Exchange Traded Funds | | — | | | 1 | % |
| | |
|
| |
|
|
| | | 100 | % | | 100 | % |
| | |
|
| |
|
|
| | | | | | |
Sector Diversification (Excludes Cash Equivalents)
| | 12/31/04
| | | 12/31/03
| |
Financials | | 28 | % | | 36 | % |
Industrials | | 21 | % | | 18 | % |
Health Care | | 10 | % | | 8 | % |
Materials | | 10 | % | | 1 | % |
Utilities | | 8 | % | | 5 | % |
Energy | | 7 | % | | 10 | % |
Consumer Discretionary | | 6 | % | | 13 | % |
Information Technology | | 5 | % | | 3 | % |
Consumer Staples | | 5 | % | | 6 | % |
| | |
|
| |
|
|
| | | 100 | % | | 100 | % |
| | |
|
| |
|
|
Asset allocation and sector diversification are subject to change.
For more complete details about the Portfolio’s investment portfolio, see page 37. A quarterly Fact Sheet is available upon request. Information concerning portfolio holdings of the Portfolio as of month end will be posted to scudder.com on the 15th of the following month.
Following the Portfolio’s fiscal first and third quarter-end, a complete portfolio holdings listing is filed with the SEC on Form N-Q. The form will be available on the SEC’s Web site at www.sec.gov, and it also may be reviewed and copied at the SEC’s Public Reference Room in Washington, D.C. Information on the operation of the SEC’s Public Reference Room may be obtained by calling (800) SEC-0330.
Investment Portfolio December 31, 2004
SVS Dreman Small Cap Value Portfolio
| | | | |
| | | Shares
| | Value ($)
|
Common Stocks 94.2% | | | | |
Consumer Discretionary 5.8% | | | | |
Auto Components 0.2% | | | | |
Noble International Ltd. | | 48,000 | | 978,720 |
| | | | |
|
Hotels Restaurants & Leisure 1.9% | | | | |
Alliance Gaming Corp.* | | 353,200 | | 4,877,692 |
Bluegreen Corp.* | | 40,700 | | 807,081 |
CBRL Group, Inc. | | 74,300 | | 3,109,455 |
Navigant International, Inc.* | | 114,100 | | 1,388,597 |
| | | | |
|
| | | | | 10,182,825 |
| | | | |
|
Page 306 of 466
| | | | |
Household Durables 0.3% | | | | |
Standard Pacific Corp. | | 20,200 | | 1,295,628 |
| | | | |
|
Leisure Equipment & Products 0.7% | | | | |
Lakes Entertainment, Inc.* | | 237,800 | | 3,873,762 |
| | | | |
|
Specialty Retail 1.9% | | | | |
Borders Group, Inc. | | 90,600 | | 2,301,240 |
Linens ‘N Things, Inc.* | | 99,800 | | 2,475,040 |
Mettler-Toledo International, Inc.* | | 105,900 | | 5,433,729 |
| | | | |
|
| | | | | 10,210,009 |
| | | | |
|
Textiles, Apparel & Luxury Goods 0.8% | | | | |
Phillips-Van Heusen Corp. | | 167,336 | | 4,518,072 |
| | | | |
|
Consumer Staples 4.4% | | | | |
Food & Drug Retailing 0.7% | | | | |
B&G Foods, Inc.* | | 265,600 | | 3,978,688 |
| | | | |
|
Food Products 1.9% | | | | |
Chiquita Brands International, Inc.* | | 203,000 | | 4,478,180 |
Ralcorp Holdings, Inc. | | 129,700 | | 5,438,321 |
| | | | |
|
| | | | | 9,916,501 |
| | | | |
|
Personal Products 1.0% | | | | |
Helen of Troy Ltd.* | | 157,100 | | 5,280,131 |
| | | | |
|
Tobacco 0.8% | | | | |
Universal Corp. | | 47,500 | | 2,272,400 |
Vector Group Ltd. | | 126,176 | | 2,098,307 |
| | | | |
|
| | | | | 4,370,707 |
| | | | |
|
Energy 6.3% | | | | |
Energy Equipment & Services 3.2% | | | | |
Atwood Oceanics, Inc.* | | 46,200 | | 2,407,020 |
Grant Prideco, Inc.* | | 175,800 | | 3,524,790 |
Grey Wolf, Inc.* | | 116,000 | | 611,320 |
Offshore Logistics, Inc.* | | 74,500 | | 2,419,015 |
Oil States International, Inc.* | | 156,800 | | 3,024,672 |
Patterson-UTI Energy, Inc. | | 168,300 | | 3,273,435 |
Superior Energy Services, Inc.* | | 151,700 | | 2,337,697 |
| | | | |
|
| | | | | 17,597,949 |
| | | | |
|
Oil & Gas 3.1% | | | | |
ATP Oil & Gas Corp.* | | 128,300 | | 2,383,814 |
Denbury Resources, Inc.* | | 99,400 | | 2,728,530 |
Energy Partners Ltd.* | | 84,600 | | 1,714,842 |
Global Industries, Inc.* | | 307,800 | | 2,551,662 |
| | |
| | | Shares
| | Value ($)
|
Magnum Hunter Resources, Inc.* | | 75,300 | | 971,370 |
Penn Virginia Corp. | | 59,300 | | 2,405,801 |
Pioneer Drilling Co.* | | 375,500 | | 3,788,795 |
| | | | |
|
| | | | | 16,544,814 |
| | | | |
|
Page 307 of 466
| | | | |
Financials 26.6% | | | | |
Banks 8.1% | | | | |
BankAtlantic Bancorp., Inc. “A” | | 83,450 | | 1,660,655 |
Capital Bancorp., Ltd. | | 39,900 | | 1,405,278 |
Centennial Bank Holdings, Inc.* | | 400,000 | | 4,200,000 |
Center Financial Corp. | | 118,200 | | 2,366,364 |
FirstFed Financial Corp.* | | 23,850 | | 1,237,100 |
Glacier Bancorp., Inc. | | 58,156 | | 1,979,630 |
Greater Bay Bancorp. | | 108,100 | | 3,013,828 |
Independence Community Bank Corp. | | 66,500 | | 2,831,570 |
IndyMac Bancorp., Inc. | | 66,850 | | 2,302,983 |
International Bancshares Corp. | | 53,148 | | 2,092,968 |
NewAlliance Bancshares, Inc. | | 78,100 | | 1,194,930 |
Oriental Finance Group, Inc. | | 57,640 | | 1,631,788 |
PFF Bancorp., Inc. | | 66,100 | | 3,062,413 |
Provident Bankshares Corp. | | 97,550 | | 3,547,894 |
R & G Financial Corp. “B” | | 119,800 | | 4,657,824 |
S&T Bancorp, Inc. | | 26,300 | | 991,247 |
Sterling Financial Corp. | | 74,682 | | 2,932,015 |
Webster Financial Corp. | | 43,200 | | 2,187,648 |
| | | | |
|
| | | | | 43,296,135 |
| | | | |
|
Diversified Financial Services 2.1% | | | | |
ACE Cash Express, Inc.* | | 105,400 | | 3,126,164 |
CMET Finance Holdings, Inc.* | | 7,200 | | 648,000 |
JER Investment Trust, Inc. 144A* | | 149,900 | | 2,263,490 |
Peoples Choice Financial Corp. | | 229,900 | | 2,299,000 |
Prospect Energy Corp. | | 254,500 | | 3,054,000 |
| | | | |
|
| | | | | 11,390,654 |
| | | | |
|
Insurance 5.5% | | | | |
Ceres Group, Inc.* | | 259,390 | | 1,338,452 |
Endurance Specialty Holdings Ltd. | | 100,900 | | 3,450,780 |
Meadowbrook Insurance Group, Inc.* | | 476,500 | | 2,377,735 |
PMA Capital Corp. “A”* | | 139,200 | | 1,440,720 |
ProCentury Corp. | | 336,700 | | 4,175,080 |
PXRE Group Ltd. | | 18,600 | | 468,906 |
Scottish Re Group Ltd. | | 251,300 | | 6,508,670 |
Selective Insurance Group, Inc. | | 125,700 | | 5,560,968 |
Specialty Underwriters’ Alliance, Inc.* | | 269,500 | | 2,560,250 |
Tower Group, Inc. | | 146,300 | | 1,755,600 |
| | | | |
|
| | | | | 29,637,161 |
| | | | |
|
Real Estate 10.9% | | | | |
Aames Investment Corp. (REIT)* | | 221,900 | | 2,374,330 |
Capital Lease Funding, Inc. (REIT) | | 232,300 | | 2,903,750 |
Feldman Mall Properties, Inc. (REIT)* | | 76,500 | | 995,265 |
Fieldstone Investment Corp. (REIT) | | 386,700 | | 6,500,427 |
Highland Hospitality Corp. (REIT) | | 62,500 | | 702,500 |
Page 308 of 466
| | | | |
KKR Financial Corp. (REIT) 144A | | 982,300 | | 10,314,150 |
Medical Properties of America (REIT) | | 109,300 | | 1,120,325 |
| | |
| | | Shares
| | Value ($)
|
Newcastle Investment Corp. (REIT) | | 266,200 | | 8,459,836 |
Novastar Financial, Inc. (REIT) | | 289,800 | | 14,345,100 |
Provident Senior Living Trust (REIT) 144A | | 392,800 | | 6,284,800 |
Saxon Capital, Inc. (REIT) | | 66,900 | | 1,604,931 |
Thomas Properties Group, Inc.* | | 250,000 | | 3,185,000 |
| | | | |
|
| | | | | 58,790,414 |
| | | | |
|
Health Care 9.6% | | | | |
Biotechnology 2.6% | | | | |
Axonyx, Inc.* | | 471,100 | | 2,920,820 |
Charles River Laboratories International, Inc.* | | 142,400 | | 6,551,824 |
Ciphergen Biosystems, Inc. | | 28,500 | | 122,550 |
Serologicals Corp.* | | 200,200 | | 4,428,424 |
| | | | |
|
| | | | | 14,023,618 |
| | | | |
|
Health Care Equipment & Supplies 1.2% | | | | |
Fisher Scientific International, Inc.* | | 49,560 | | 3,091,553 |
Zoll Medical Corp.* | | 92,500 | | 3,182,000 |
| | | | |
|
| | | | | 6,273,553 |
| | | | |
|
Health Care Providers & Services 4.3% | | | | |
Accredo Health, Inc.* | | 109,800 | | 3,043,656 |
Allied Healthcare International, Inc.* | | 439,000 | | 2,414,500 |
LabOne, Inc.* | | 87,500 | | 2,803,500 |
Odyssey Healthcare, Inc.* | | 255,200 | | 3,491,136 |
Pediatrix Medical Group, Inc.* | | 42,600 | | 2,728,530 |
Province Healthcare Co.* | | 190,400 | | 4,255,440 |
TLC Vision Corp.* | | 103,500 | | 1,079,505 |
Triad Hospitals, Inc.* | | 89,300 | | 3,322,853 |
| | | | |
|
| | | | | 23,139,120 |
| | | | |
|
Pharmaceuticals 1.5% | | | | |
King Pharmaceuticals, Inc.* | | 173,200 | | 2,147,680 |
Par Pharmaceutical Cos., Inc.* | | 150,500 | | 6,227,690 |
| | | | |
|
| | | | | 8,375,370 |
| | | | |
|
Industrials 20.5% | | | | |
Aerospace & Defense 5.3% | | | | |
CAE, Inc. | | 595,600 | | 2,531,300 |
Curtiss-Wright Corp. | | 52,200 | | 2,996,802 |
DRS Technologies, Inc.* | | 81,200 | | 3,468,052 |
GenCorp, Inc. | | 193,000 | | 3,584,010 |
Herley Industries, Inc.* | | 141,800 | | 2,884,212 |
Precision Castparts Corp. | | 107,000 | | 7,027,760 |
Triumph Group, Inc.* | | 68,000 | | 2,686,000 |
United Defense Industries, Inc.* | | 66,100 | | 3,123,225 |
| | | | |
|
| | | | | 28,301,361 |
| | | | |
|
Page 309 of 466
| | | | |
Building Products 1.7% | | | | |
Levitt Corp. “A” | | 169,500 | | 5,181,615 |
NCI Building Systems, Inc.* | | 60,900 | | 2,283,750 |
York International Corp. | | 52,000 | | 1,796,080 |
| | | | |
|
| | | | | 9,261,445 |
| | | | |
|
Commercial Services & Supplies 2.4% | | | | |
Consolidated Graphics, Inc.* | | 63,900 | | 2,933,010 |
Duratek, Inc.* | | 115,100 | | 2,867,141 |
John H. Harland Co. | | 59,500 | | 2,147,950 |
Nobel Learning Communities, Inc.* | | 40,900 | | 307,977 |
| | |
| | | Shares
| | Value ($)
|
WCA Waste Corp.* | | 467,800 | | 4,888,510 |
| | | | |
|
| | | | | 13,144,588 |
| | | | |
|
Construction & Engineering 2.7% | | | | |
EMCOR Group, Inc.* | | 78,200 | | 3,533,076 |
Infrasource Services, Inc.* | | 305,300 | | 3,968,900 |
URS Corp.* | | 217,000 | | 6,965,700 |
| | | | |
|
| | | | | 14,467,676 |
| | | | |
|
Electrical Equipment 1.7% | | | | |
General Cable Corp.* | | 447,700 | | 6,200,645 |
Genlyte Group, Inc.* | | 31,800 | | 2,724,624 |
| | | | |
|
| | | | | 8,925,269 |
| | | | |
|
Machinery 3.0% | | | | |
AGCO Corp.* | | 125,600 | | 2,749,384 |
Albany International Corp. “A” | | 72,500 | | 2,549,100 |
Briggs & Stratton Corp. | | 52,600 | | 2,187,108 |
Harsco Corp. | | 44,400 | | 2,474,856 |
Oshkosh Truck Corp. | | 51,400 | | 3,514,732 |
Valmont Industries | | 112,400 | | 2,822,364 |
| | | | |
|
| | | | | 16,297,544 |
| | | | |
|
Marine 0.9% | | | | |
GulfMark Offshore, Inc.* | | 39,100 | | 870,757 |
Hornbeck Offshore Services, Inc.* | | 57,700 | | 1,113,610 |
OMI Corp. | | 63,600 | | 1,071,660 |
Tsakos Energy Navigation Ltd. | | 51,300 | | 1,836,027 |
| | | | |
|
| | | | | 4,892,054 |
| | | | |
|
Road & Rail 2.4% | | | | |
Genesee & Wyoming, Inc.* | | 114,950 | | 3,233,543 |
Laidlaw International, Inc.* | | 186,400 | | 3,988,960 |
RailAmerica, Inc.* | | 168,100 | | 2,193,705 |
Yellow Roadway Corp.* | | 58,207 | | 3,242,712 |
| | | | |
|
| | | | | 12,658,920 |
| | | | |
|
Page 310 of 466
| | | | |
Trading Companies Distributors 0.4% | | | | |
WESCO International, Inc.* | | 76,600 | | 2,270,424 |
| | | | |
|
Information Technology 4.6% | | | | |
Communications Equipment 0.7% | | | | |
PC-Tel, Inc.* | | 280,300 | | 2,222,779 |
SpectraLink Corp. | | 80,600 | | 1,142,908 |
| | | | |
|
| | | | | 3,365,687 |
| | | | |
|
Computers & Peripherals 1.7% | | | | |
Applied Films Corp.* | | 98,100 | | 2,115,036 |
Covansys Corp.* | | 95,800 | | 1,465,740 |
CyberGuard Corp.* | | 234,400 | | 1,476,720 |
Komag, Inc.* | | 114,200 | | 2,144,676 |
Stratasys, Inc.* | | 59,100 | | 1,983,396 |
| | | | |
|
| | | | | 9,185,568 |
| | | | |
|
Electronic Equipment & Instruments 1.3% | | | | |
KEMET Corp.* | | 59,200 | | 529,840 |
Scansource, Inc.* | | 40,900 | | 2,542,344 |
Vishay Intertechnology, Inc.* | | 264,000 | | 3,965,280 |
| | | | |
|
| | | | | 7,037,464 |
| | | | |
|
IT Consulting & Services 0.6% | | | | |
BISYS Group, Inc.* | | 91,200 | | 1,500,240 |
CACI International, Inc. “A”* | | 26,800 | | 1,825,884 |
| | | | |
|
| | | | | 3,326,124 |
| | | | |
|
| | |
| | | Shares
| | Value ($)
|
Semiconductors & Semiconductor Equipment 0.3% | | | | |
MKS Instruments, Inc.* | | 90,500 | | 1,678,775 |
| | | | |
|
Materials 9.1% | | | | |
Chemicals 2.0% | | | | |
Georgia Gulf Corp. | | 50,700 | | 2,524,860 |
NOVA Chemicals Corp. | | 70,400 | | 3,329,920 |
Sensient Technologies Corp. | | 200,100 | | 4,800,399 |
| | | | |
|
| | | | | 10,655,179 |
| | | | |
|
Construction Materials 1.9% | | | | |
Florida Rock Industries, Inc. | | 73,695 | | 4,387,063 |
Headwaters, Inc.* | | 211,600 | | 6,030,600 |
| | | | |
|
| | | | | 10,417,663 |
| | | | |
|
Metals & Mining 5.2% | | | | |
AK Steel Holding Corp.* | | 258,100 | | 3,734,707 |
Aleris International, Inc.* | | 133,800 | | 2,263,896 |
Cleveland-Cliffs, Inc. | | 62,100 | | 6,449,706 |
Metal Management, Inc. | | 176,000 | | 4,729,120 |
Pan American Silver Corp.* | | 202,500 | | 3,235,950 |
Steel Technologies, Inc. | | 76,600 | | 2,107,266 |
Uranium Resources, Inc.* | | 1,020,400 | | 739,790 |
Wheaton River Minerals Ltd.* | | 706,200 | | 2,302,212 |
Worthington Industries, Inc. | | 107,000 | | 2,095,060 |
| | | | |
|
| | | | | 27,657,707 |
| | | | |
|
Page 311 of 466
| | | | |
Utilities 7.3% | | | | |
Electric Utilities 2.4% | | | | |
Allegheny Energy, Inc.* | | 181,700 | | 3,581,307 |
Ormat Technologies, Inc.* | | 124,600 | | 2,028,488 |
Sierra Pacific Resources* | | 210,600 | | 2,211,300 |
TECO Energy, Inc. | | 129,500 | | 1,986,530 |
WPS Resources Corp. | | 65,000 | | 3,247,400 |
| | | | |
|
| | | | | 13,055,025 |
| | | | |
|
Gas Utilities 1.5% | | | | |
Southern Union Co.* | | 341,500 | | 8,189,170 |
Multi-Utilities 1.4% | | | | |
CMS Energy Corp.* | | 315,100 | | 3,292,795 |
| | |
| | | Shares
| | Value ($)
|
ONEOK, Inc. | | 146,000 | | 4,149,320 |
| | | | |
|
| | | | | 7,442,115 |
| | | | |
|
Multi-Utilities & Unregulated Power 2.0% | | | | |
Reliant Energy, Inc.* | | 779,600 | | 10,641,540 |
| | | | |
|
Total Common Stocks (Cost $383,239,005) | | | | 506,545,129 |
| | | | |
|
| | | | |
| | | Principal
Amount ($)
| | Value ($)
|
Corporate Bonds 0.8% | | | | |
Utilities | | | | |
Mirant Corp. 144A, 7.9%, 7/15/2009* (Cost $3,522,500) | | 6,000,000 | | 4,470,000 |
| | | | |
| | | Shares
| | Value ($)
|
Convertible Preferred Stocks 0.3% | | | | |
Energy | | | | |
Petrohawk Energy Corp., Series B (Cost $1,650,750) | | 21,300 | | 1,656,075 |
| | | | |
|
Closed-End Investment Company 0.7% | | | | |
Tortoise Energy Infrastructure Corp. (Cost $3,584,863) | | 143,236 | | 3,930,396 |
| | | | |
|
Cash Equivalents 3.3% | | | | |
Scudder Cash Management QP Trust, 2.24% (b) (Cost $17,642,655) | | 17,642,655 | | 17,642,655 |
| | | | |
|
| | | | |
| | | % of Net Assets
| | Value ($)
|
Total Investment Portfolio (Cost $409,639,773) (a) | | 99.3 | | 534,244,255 |
Other Assets and Liabilities, Net | | 0.7 | | 3,364,510 |
Net Assets | | 100.0 | | 537,608,765 |
| | | | |
|
Notes to SVS Dreman Small Cap Value Portfolio of Investments
| * | Non-income producing security. In the case of a bond, generally denotes that the issuer has defaulted on the payment of principal or interest or has filed for bankruptcy. |
Page 312 of 466
| | | | | | | | | | | | | | |
Security
| | Coupon
| | Maturity Date
| | Principal Amount
| | Acquisition Cost
| | Value
|
Mirant Corp. | | 7.9 | | 7/15/2009 | | USD | | 6,000,000 | | $ | 3,522,500 | | $ | 4,470,000 |
| (a) | The cost for federal income tax purposes was $409,796,640. At December 31, 2004, net unrealized appreciation for all securities based on tax cost was $124,447,615. This consisted of aggregate gross unrealized appreciation for all securities in which there was an excess of value over tax cost of $127,387,394 and aggregate gross unrealized depreciation for all securities in which there was an excess of tax cost over value of $2,939,779. |
| (b) | Scudder Cash Management QP Trust is managed by Deutsche Investment Management Americas Inc. The rate shown is the annualized seven-day yield at period end. |
144A: Security exempt from registration under Rule 144A of the Securities Act of 1933. These securities may be resold in transactions exempt from registration, normally to qualified institutional buyers.
REIT: Real Estate Investment Trust
The accompanying notes are an integral part of the financial statements.
Financial Statements
Statement of Assets and Liabilities as of December 31, 2004
| | | |
Assets | | | |
Investments: | | | |
Investments in securities, at value (cost $391,997,118) | | $ | 516,601,600 |
Investment in Scudder Cash Management QP Trust (cost $17,642,655) | | | 17,642,655 |
| | |
|
|
Total investments in securities, at value (cost $409,639,773) | | | 534,244,255 |
| | |
|
|
Receivable for investments sold | | | 12,567,786 |
Dividends receivable | | | 1,454,630 |
Interest receivable | | | 38,412 |
Receivable for Portfolio shares sold | | | 67,817 |
Other assets | | | 13,625 |
| | |
|
|
Total assets | | | 548,386,525 |
| | |
|
|
Liabilities | | | |
Due to custodian bank | | | 1,030,803 |
Payable for investments purchased | | | 8,574,285 |
Payable for Portfolio shares redeemed | | | 742,149 |
Accrued management fee | | | 329,048 |
Other accrued expenses and payables | | | 101,475 |
| | |
|
|
Total liabilities | | | 10,777,760 |
| | |
|
|
Net assets, at value | | $ | 537,608,765 |
| | |
|
|
Page 313 of 466
| | | | |
Net Assets | | | | |
Net assets consist of: | | | | |
Undistributed net investment income (loss) | | | 3,681,177 | |
Net unrealized appreciation (depreciation) on: | | | | |
Investments | | | 124,604,482 | |
Foreign currency related transactions | | | (68 | ) |
Accumulated net realized gain (loss) | | | 46,974,310 | |
Paid-in capital | | | 362,348,864 | |
| | |
|
|
|
Net assets, at value | | $ | 537,608,765 | |
| | |
|
|
|
Class A | | | | |
Net Asset Value, offering and redemption price per share ($466,945,435 ÷ 23,288,245 outstanding shares of beneficial interest, $.01 par value, unlimited number of shares authorized) | | $ | 20.05 | |
| | |
|
|
|
Class B | | | | |
Net Asset Value, offering and redemption price per share ($70,663,330 ÷ 3,531,644 outstanding shares of beneficial interest, $.01 par value, unlimited number of shares authorized) | | $ | 20.01 | |
| | |
|
|
|
Statement of Operations for the year ended December 31, 2004
Investment Income
| | | | |
Income: | | | | |
Dividends (net of foreign taxes withheld of $17,277) | | $ | 7,432,575 | |
Interest — Scudder Cash Management QP Trust | | | 273,301 | |
| | |
|
|
|
Total Income | | | 7,705,876 | |
| | |
|
|
|
Expenses: | | | | |
Management fee | | | 3,317,899 | |
Custodian fees | | | 27,459 | |
Distribution service fees (Class B) | | | 128,313 | |
Record keeping fees (Class B) | | | 65,640 | |
Auditing | | | 42,161 | |
Legal | | | 21,003 | |
Trustees’ fees and expenses | | | 4,562 | |
Reports to shareholders | | | 57,119 | |
Other | | | 14,070 | |
| | |
|
|
|
Total expenses, before expense reductions | | | 3,678,226 | |
| | |
|
|
|
Expense reductions | | | (6,710 | ) |
| | |
|
|
|
Total expenses, after expense reductions | | | 3,671,516 | |
| | |
|
|
|
Net investment income (loss) | | | 4,034,360 | |
| | |
|
|
|
Realized and Unrealized Gain (Loss) on Investment Transactions | |
Net realized gain (loss) from: | | | | |
Investments | | | 63,111,613 | |
Foreign currency related transactions | | | 406 | |
| | | | 63,112,019 | |
Net unrealized appreciation (depreciation) during the period on: | | | | |
Investments | | | 38,865,035 | |
Foreign currency related transactions | | | (68 | ) |
| | | | 38,864,967 | |
| | |
|
|
|
Net gain (loss) on investment transactions | | | 101,976,986 | |
| | |
|
|
|
Net increase (decrease) in net assets resulting from operations | | $ | 106,011,346 | |
| | |
|
|
|
The accompanying notes are an integral part of the financial statements.
Page 314 of 466
Statement of Changes in Net Assets
| | | | | | | | |
| | | Years Ended December 31,
| |
Increase (Decrease) in Net Assets
| | 2004
| | | 2003
| |
Operations: | | | | | | | | |
Net investment income (loss) | | $ | 4,034,360 | | | $ | 4,178,048 | |
Net realized gain (loss) on investment transactions | | | 63,112,019 | | | | (4,032,299 | ) |
Net unrealized appreciation (depreciation) on investment transactions during the period | | | 38,864,967 | | | | 106,909,012 | |
Net increase (decrease) in net assets resulting from operations | | | 106,011,346 | | | | 107,054,761 | |
Distributions to shareholders from: | | | | | | | | |
Net investment income | | | | | | | | |
Class A | | | (3,405,170 | ) | | | (2,962,485 | ) |
Class B | | | (212,277 | ) | | | (46,780 | ) |
Net realized gains | | | | | | | | |
Class A | | | — | | | | (3,977,032 | ) |
Class B | | | — | | | | (77,506 | ) |
Portfolio share transactions: | | | | | | | | |
| | |
Class A | | | | | | | | |
Proceeds from shares sold | | | 64,900,813 | | | | 59,877,343 | |
Reinvestment of distributions | | | 3,405,170 | | | | 6,939,517 | |
Cost of shares redeemed | | | (45,290,684 | ) | | | (56,654,673 | ) |
Net increase (decrease) in net assets from Class A share transactions | | | 23,015,299 | | | | 10,162,187 | |
| | |
Class B | | | | | | | | |
Proceeds from shares sold | | | 29,315,151 | | | | 24,979,856 | |
Reinvestment of distributions | | | 212,277 | | | | 124,286 | |
Cost of shares redeemed | | | (3,011,503 | ) | | | (824,618 | ) |
Net increase (decrease) in net assets from Class B share transactions | | | 26,515,925 | | | | 24,279,524 | |
Increase (decrease) in net assets | | | 151,925,123 | | | | 134,432,669 | |
Net assets at beginning of period | | | 385,683,642 | | | | 251,250,973 | |
| | |
|
|
| |
|
|
|
Net assets at end of period (including undistributed net investment income of $3,681,177 and $3,552,152, respectively) | | $ | 537,608,765 | | | $ | 385,683,642 | |
| | |
|
|
| |
|
|
|
Page 315 of 466
Other Information
| | | | | | |
Class A | | | | | | |
Shares outstanding at beginning of period | | 22,038,819 | | | 21,449,028 | |
Shares sold | | 3,660,918 | | | 4,545,529 | |
Shares issued to shareholders in reinvestment of distributions | | 197,059 | | | 650,376 | |
Shares redeemed | | (2,608,551 | ) | | (4,606,114 | ) |
Net increase (decrease) in Portfolio shares | | 1,249,426 | | | 589,791 | |
| | |
|
| |
|
|
Shares outstanding at end of period | | 23,288,245 | | | 22,038,819 | |
| | |
|
| |
|
|
Class B | | | | | | |
Shares outstanding at beginning of period | | 1,977,912 | | | 98,769 | |
Shares sold | | 1,706,542 | | | 1,921,031 | |
Shares issued to shareholders in reinvestment of distributions | | 12,277 | | | 11,637 | |
Shares redeemed | | (165,087 | ) | | (53,525 | ) |
Net increase (decrease) in Portfolio shares | | 1,553,732 | | | 1,879,143 | |
| | |
|
| |
|
|
Shares outstanding at end of period | | 3,531,644 | | | 1,977,912 | |
| | |
|
| |
|
|
The accompanying notes are an integral part of the financial statements.
Financial Highlights
Class A
| | | | | | | | | | | | | | | | | | | |
Years Ended December 31,
| | 2004
| | | 2003
| | | 2002
| | | 2001
| | 2000a
| |
Selected Per Share Data | | | | | | | | | | | | | | | | | | | |
Net asset value, beginning of period | | $ | 16.06 | | | $ | 11.66 | | | $ | 13.21 | | | $ | 11.23 | | $ | 10.85 | |
| | |
|
|
| |
|
|
| |
|
|
| |
|
| |
|
|
|
Income (loss) from investment operations: | | | | | | | | | | | | | | | | | | | |
Net investment income (loss)b | | | .17 | | | | .19 | | | | .17 | | | | .09 | | | .02 | |
Net realized and unrealized gain (loss) on investment transactions | | | 3.98 | | | | 4.55 | | | | (1.67 | ) | | | 1.89 | | | .42 | |
Total from investment operations | | | 4.15 | | | | 4.74 | | | | (1.50 | ) | | | 1.98 | | | .44 | |
Less distributions from: | | | | | | | | | | | | | | | | | | | |
Net investment income | | | (.16 | ) | | | (.15 | ) | | | (.05 | ) | | | — | | | (.06 | ) |
Net realized gains on investment transactions | | | — | | | | (.19 | ) | | | — | | | | — | | | — | |
| | |
|
|
| |
|
|
| |
|
|
| |
|
| |
|
|
|
Total distributions | | | (.16 | ) | | | (.34 | ) | | | (.05 | ) | | | — | | | (.06 | ) |
| | |
|
|
| |
|
|
| |
|
|
| |
|
| |
|
|
|
Net asset value, end of period | | $ | 20.05 | | | $ | 16.06 | | | $ | 11.66 | | | $ | 13.21 | | $ | 11.23 | |
| | |
|
|
| |
|
|
| |
|
|
| |
|
| |
|
|
|
Total Return (%) | | | 26.03 | | | | 42.15 | | | | (11.43 | ) | | | 17.63 | | | 4.05 | |
| | |
|
|
| |
|
|
| |
|
|
| |
|
| |
|
|
|
Ratios to Average Net Assets and Supplemental Data | | | | | | | | | | | | | | | | | | | |
Net assets, end of period ($ millions) | | | 467 | | | | 354 | | | | 250 | | | | 194 | | | 84 | |
Ratio of expenses (%) | | | .79 | | | | .80 | | | | .81 | | | | .79 | | | .82 | |
Ratio of net investment income (loss) (%) | | | .96 | | | | 1.46 | | | | 1.28 | | | | .77 | | | .15 | |
Portfolio turnover rate (%) | | | 73 | | | | 71 | | | | 86 | | | | 57 | | | 36 | |
| a | On June 18, 2001, the Portfolio implemented 1 for 10 reverse stock split. Per share information, for the period prior to December 31, 2001, has been restated to reflect the effect of the split. Shareholders received 1 share for every 10 shares owned and net asset value per share increased correspondingly. |
Page 316 of 466
| b | Based on average shares outstanding during the period. |
Class B
| | | | | | | | | | | | |
Years Ended December 31,
| | 2004
| | | 2003
| | | 2002a
| |
Selected Per Share Data | | | | | | | | | | | | |
Net asset value, beginning of period | | $ | 16.03 | | | $ | 11.65 | | | $ | 13.86 | |
| | |
|
|
| |
|
|
| |
|
|
|
Income (loss) from investment operations: | | | | | | | | | | | | |
Net investment income (loss)b | | | .10 | | | | .13 | | | | .17 | |
Net realized and unrealized gain (loss) on investment transactions | | | 3.97 | | | | 4.56 | | | | (2.38 | ) |
| | |
|
|
| |
|
|
| |
|
|
|
Total from investment operations | | | 4.07 | | | | 4.69 | | | | (2.21 | ) |
| | |
|
|
| |
|
|
| |
|
|
|
Less distributions from: | | | | | | | | | | | | |
Net investment income | | | (.09 | ) | | | (.12 | ) | | | — | |
Net realized gains on investment transactions | | | — | | | | (.19 | ) | | | — | |
| | |
|
|
| |
|
|
| |
|
|
|
Total distributions | | | (.09 | ) | | | (.31 | ) | | | — | |
| | |
|
|
| |
|
|
| |
|
|
|
Net asset value, end of period | | $ | 20.01 | | | $ | 16.03 | | | $ | 11.65 | |
| | |
|
|
| |
|
|
| |
|
|
|
Total Return (%) | | | 25.52 | | | | 41.65 | | | | (15.95 | )** |
| | |
|
|
| |
|
|
| |
|
|
|
Ratios to Average Net Assets and Supplemental Data | | | | | | | | | | | | |
Net assets, end of period ($ millions) | | | 71 | | | | 32 | | | | 1 | |
Ratio of expenses (%) | | | 1.16 | | | | 1.19 | | | | 1.06 | * |
Ratio of net investment income (loss) (%) | | | .59 | | | | 1.07 | | | | 3.01 | * |
Portfolio turnover rate (%) | | | 73 | | | | 71 | | | | 86 | |
| a | For the period from July 1, 2002 (commencement of operations of Class B shares) to December 31, 2003. |
| b | Based on average shares outstanding during the period. |
Performance Summary December 31, 2004
SVS Eagle Focused Large Cap Growth Portfolio
All performance shown is historical, assumes reinvestment of all dividends and capital gains, and does not guarantee future results. Investment return and principal value fluctuate with changing market conditions so that, when redeemed, shares may be worth more or less then their original cost. Current performance may be lower or higher than the performance data quoted. Please visit scudder.com for the product’s most recent month-end performance. Performance doesn’t reflect charges and fees (“contract charges”) associated with the separate account that invests in the Portfolio or any variable life insurance policy or variable annuity contract for which the Portfolio is an investment option. These charges and fees will reduce returns.
Page 317 of 466
This Portfolio is subject to stock market risk, meaning stocks in the Portfolio may decline in value for extended periods of time due to the activities and financial prospects of individual companies, or due to general market and economic conditions. Please see this Portfolio’s prospectus for specific details regarding its investments and risk profile.
| | |
| Growth of an Assumed $10,000 Investment in SVS Eagle Focused Large Cap Growth Portfolio from 10/29/1999 to 12/31/2004 |
|
¨ SVS Eagle Focused Large Cap Growth Portfolio — Class A ¨ Russell 1000 Growth Index |
| |
| | The Russell 1000 Growth Index is an unmanaged index composed of common stocks of larger US companies with higher price-to-book ratios and higher forecasted growth values. Index returns assume reinvested dividends and, unlike Portfolio returns, do not reflect any fees or expenses. It is not possible to invest directly into an index. |
| |
Yearly periods ended December 31 | | |
Comparative Results
| | | | | | | | | | | | | | | | | | |
SVS Eagle Focused Large Cap Growth Portfolio
| | | | 1-Year
| | | 3-Year
| | | 5-Year
| | | Life of Portfolio*
| |
Class A | | Growth of $10,000 | | $ | 10,185 | | | $ | 9,282 | | | $ | 7,013 | | | $ | 9,005 | |
| | | Average annual total return | | | 1.85 | % | | | -2.45 | % | | | -6.85 | % | | | -2.01 | % |
Russell 1000 Growth Index | | Growth of $10,000 | | $ | 10,630 | | | $ | 9,946 | | | $ | 6,140 | | | $ | 7,145 | |
| | | Average annual total return | | | 6.30 | % | | | -.18 | % | | | -9.29 | % | | | -6.30 | % |
| | | | | |
SVS Eagle Focused Large Cap Growth Portfolio
| | | | | | | | | | 1-Year
| | | Life of Class**
| |
Class B | | Growth of $10,000 | | | | | | | | | | $ | 10,151 | | | $ | 11,459 | |
| | | Average annual total return | | | | | | | | | | | 1.51 | % | | | 5.59 | % |
Russell 1000 Growth Index | | Growth of $10,000 | | | | | | | | | | $ | 10,630 | | | $ | 12,555 | |
| | | Average annual total return | | | | | | | | | | | 6.30 | % | | | 9.53 | % |
The growth of $10,000 is cumulative.
| * | The Portfolio commenced operations on October 29, 1999. Index returns begin October 31, 1999. Total returns would have been lower for the 5-Year and Life of Portfolio periods for Class A shares if the Portfolio’s expenses were not maintained. |
| ** | The Portfolio commenced offering Class B shares on July 1, 2002. Index returns begin June 30, 2002. |
Information About Your Portfolio’s Expenses
SVS Eagle Focused Large Cap Growth Portfolio
As an investor of the Portfolio, you incur two types of costs: ongoing expenses and transaction costs. Ongoing expenses include management fees, distribution and service (12b-1) fees and other Portfolio expenses. Examples of transaction costs include sales charges (loads), redemption fees and account maintenance fees, which are not shown in this section. The following tables are intended to help you understand your ongoing expenses (in dollars) of investing in the Portfolio and to help you compare these expenses with the ongoing expenses of investing in other mutual funds. In the most recent six-month period, the Portfolio limited these expenses; had it not done so, expenses would have been higher. In the most recent six-month period, the Portfolio limited these expenses; had it not done so, expenses would have been higher. The tables are based on an investment of $1,000 made at the beginning of the six-month period ended December 31, 2004.
The tables illustrate your Portfolio’s expenses in two ways:
Actual Portfolio Return. This helps you estimate the actual dollar amount of ongoing expenses (but not transaction costs) paid on a $1,000 investment in the Portfolio using the Portfolio’s actual return during
Page 318 of 466
the period. To estimate the expenses you paid over the period, simply divide your account value by $1,000 (for example, an $8,600 account value divided by $1,000 = 8.6), then multiply the result by the number in the “Expenses Paid per $1,000” line under the share class you hold.
Hypothetical 5% Portfolio Return. This helps you to compare your Portfolio’s ongoing expenses (but not transaction costs) with those of other mutual funds using the Portfolio’s actual expense ratio and a hypothetical rate of return of 5% per year before expenses. Examples using a 5% hypothetical Portfolio return may be found in the shareholder reports of other mutual funds. The hypothetical account values and expenses may not be used to estimate the actual ending account balance or expenses you paid for the period.
Please note that the expenses shown in these tables are meant to highlight your ongoing expenses only and do not reflect any transaction costs. The “Expenses Paid per $1,000” line of the tables is useful in comparing ongoing expenses only and will not help you determine the relative total expense of owning different funds. If these transaction costs had been included, your costs would have been higher.
| | | | | | |
Expenses and Value of a $1,000 Investment for the six months ended December 31, 2004 | | | | | | |
| | |
Actual Portfolio Return
| | Class A
| | Class B
|
Beginning Account Value 7/1/04 | | $ | 1,000.00 | | $ | 1,000.00 |
Ending Account Value 12/31/04 | | $ | 1,026.90 | | $ | 1,024.70 |
Expenses Paid per $1,000* | | $ | 5.15 | | $ | 7.04 |
| | |
Hypothetical 5% Portfolio Return
| | Class A
| | Class B
|
Beginning Account Value 7/1/04 | | $ | 1,000.00 | | $ | 1,000.00 |
Ending Account Value 12/31/04 | | $ | 1,020.12 | | $ | 1,018.25 |
Expenses Paid per $1,000* | | $ | 5.14 | | $ | 7.02 |
| * | Expenses are equal to the Portfolio’s annualized expense ratio for each share class, multiplied by the average account value over the period, multiplied by the number of days in the most recent six-month period, then divided by 365. |
| | | | | | |
Annualized Expense Ratios
| | Class A
| | | Class B
| |
Scudder Variable Series II — SVS Eagle Focused Large Cap Growth Portfolio | | 1.01 | % | | 1.38 | % |
For more information, please refer to the Portfolio’s prospectus.
Management Summary December 31, 2004
SVS Eagle Focused Large Cap Growth Portfolio
The portfolio was up 1.85% (Class A shares, unadjusted for contract charges) for the 12-month period ended December 31, 2004 while the benchmark Russell 1000 Growth Index was up 6.30%. The portfolio’s relative underperformance for the year was attributable primarily to an overweighting in poorly performing semiconductor and media stocks. Fairchild Semiconductor International, Inc. and Intel Corp. were a drag on performance, as the semiconductor industry saw strong year-over-year revenue growth but lagging stock prices. In other areas of technology, Dell, Inc. and Microsoft Corp. were positive contributors to relative performance. In the consumer discretionary sector, positive contributions from eBay, Inc., Yahoo!, Inc. and Harrah’s Entertainment, Inc. were not enough to overcome losses in Coca-Cola Co. and media companies Viacom, Inc. and Clear Channel
Page 319 of 466
Communications*. During the year, advertising dollars continued to migrate from traditional media companies (cable, newspapers, radio and television) to nontraditional media companies, which were more adept at leveraging the Internet, such as eBay. We strategically shifted assets out of traditional and into nontraditional media names. On the positive side, strength in financial services was led by CheckFree Corp., which benefited from strong reported earnings and increasing traction in sales of its financial products. Caremark Rx, Inc. and Genzyme Corp. bolstered the solid performance of the portfolio’s health care holdings, as both companies improved their growth prospects via smart acquisitions. The global economy looks poised for what we expect will be continued and solid expansion in 2005, though the balance between inflation and growth remains a risk. We believe that solid top-line growth and high stable profit margins should drive earnings growth over the next year.
Ashi Parikh
Duane Eatherly
Portfolio Managers
Eagle Asset Management, Inc., Subadvisor to the Portfolio
All performance shown is historical, assumes reinvestment of all dividends and capital gains, and does not guarantee future results. Investment return and principal value fluctuate with changing market conditions so that, when redeemed, shares may be worth more or less then their original cost. Current performance may be lower or higher than the performance data quoted. Please visit scudder.com for the product’s most recent month-end performance. Performance doesn’t reflect charges and fees (“contract charges”) associated with the separate account that invests in the portfolio or any variable life insurance policy or variable annuity contract for which the portfolio is an investment option. These charges and fees will reduce returns.
Risk Considerations
This portfolio is subject to stock market risk, meaning stocks in the portfolio may decline in value for extended periods of time due to the activities and financial prospects of individual companies, or due to general market and economic conditions. Please see this portfolio’s prospectus for specific details regarding its investments and risk profile.
The Russell 1000 Growth Index is an unmanaged index composed of common stocks of larger US companies with higher price-to-book ratios and higher forecasted growth values. Index returns assume reinvested dividends and, unlike Portfolio returns, do not reflect any fees or expenses. It is not possible to invest directly into an index.
| * | Not held in the portfolio at the end of the reporting period. |
Portfolio management market commentary is as of December 31, 2004, and may not come to pass. This information is subject to change at any time based on market and other conditions.
Portfolio Summary
SVS Eagle Focused Large Cap Growth Portfolio
| | | | | | |
Asset Allocation
| | 12/31/04
| | | 12/31/03
| |
Common Stocks | | 98 | % | | 99 | % |
Cash Equivalents | | 2 | % | | 1 | % |
| | |
|
| |
|
|
| | | 100 | % | | 100 | % |
| | |
|
| |
|
|
Page 320 of 466
| | | | | | |
Sector Diversification (Excludes Cash Equivalents)
| | 12/31/04
| | | 12/31/03
| |
Information Technology | | 41 | % | | 39 | % |
Consumer Discretionary | | 23 | % | | 23 | % |
Health Care | | 17 | % | | 15 | % |
Consumer Staples | | 7 | % | | 3 | % |
Financials | | 6 | % | | 11 | % |
Industrials | | 6 | % | | 9 | % |
| | |
|
| |
|
|
| | | 100 | % | | 100 | % |
| | |
|
| |
|
|
Asset allocation and sector diversification are subject to change.
For more complete details about the Portfolio’s investment portfolio, see page 49. A quarterly Fact Sheet is available upon request. Information concerning portfolio holdings of the Portfolio as of month-end will be posted to scudder.com on the 15th of the following month.
Following the Portfolio’s fiscal first and third quarter-end, a complete portfolio holdings listing is filed with the SEC on Form N-Q. The form will be available on the SEC’s Web site at www.sec.gov, and it also may be reviewed and copied at the SEC’s Public Reference Room in Washington, D.C. Information on the operation of the SEC’s Public Reference Room may be obtained by calling (800) SEC-0330.
Investment Portfolio December 31, 2004
SVS Eagle Focused Large Cap Growth Portfolio
| | | | |
| | | Shares
| | Value ($)
|
Common Stocks 97.8% | | | | |
Consumer Discretionary 22.0% | | | | |
Hotels Restaurants & Leisure 5.6% | | | | |
Harrah’s Entertainment, Inc. | | 51,050 | | 3,414,734 |
McDonald’s Corp. | | 100,200 | | 3,212,412 |
| | | | |
|
| | | | | 6,627,146 |
| | | | |
|
Internet & Catalog Retail 4.3% | | | | |
| | | | | |
eBay, Inc.* | | 43,900 | | 5,104,692 |
| | | | |
|
Media 8.2% | | | | |
Comcast Corp. “A”* | | 56,200 | | 1,845,608 |
EchoStar Communications Corp. “A” | | 74,750 | | 2,484,690 |
Time Warner, Inc.* | | 108,700 | | 2,113,128 |
Viacom, Inc. “B” | | 46,700 | | 1,699,413 |
Walt Disney Co. | | 58,100 | | 1,615,180 |
| | | | |
|
| | | | | 9,758,019 |
| | | | |
|
Multiline Retail 2.0% | | | | |
Target Corp. | | 46,200 | | 2,399,166 |
| | | | |
|
Specialty Retail 1.8% | | | | |
Home Depot, Inc. | | 50,725 | | 2,167,987 |
| | | | |
|
Page 321 of 466
| | | | |
Consumer Staples 6.5% | | | | |
Beverages 3.0% | | | | |
Coca-Cola Co. | | 84,900 | | 3,534,387 |
| | | | |
|
Food & Drug Retailing 3.5% | | | | |
Wal-Mart Stores, Inc. | | 78,900 | | 4,167,498 |
| | | | |
|
Financials 6.2% | | | | |
Capital Markets 1.9% | | | | |
Goldman Sachs Group, Inc. | | 22,100 | | 2,299,284 |
| | | | |
|
Diversified Financial Services 2.0% | | | | |
Citigroup, Inc. | | 48,466 | | 2,335,092 |
| | | | |
|
Insurance 2.3% | | | | |
American International Group, Inc. | | 42,250 | | 2,774,557 |
| | | | |
|
Health Care 16.3% | | | | |
Biotechnology 2.2% | | | | |
Genzyme Corp.* | | 45,600 | | 2,647,992 |
| | | | |
|
Health Care Equipment & Supplies 2.0% | | | | |
Zimmer Holdings, Inc.* | | 29,950 | | 2,399,594 |
| | | | |
|
Health Care Providers & Services 2.5% | | | | |
Caremark Rx, Inc.* | | 73,450 | | 2,896,134 |
| | | | |
|
Pharmaceuticals 9.6% | | | | |
Abbott Laboratories | | 43,200 | | 2,015,280 |
Allergan, Inc. | | 24,100 | | 1,953,787 |
Johnson & Johnson | | 48,000 | | 3,044,160 |
Pfizer, Inc. | | 162,200 | | 4,361,558 |
| | | | |
|
| | | | | 11,374,785 |
| | | | |
|
| | |
| | | Shares
| | Value ($)
|
Industrials 6.4% | | | | |
Electrical Equipment 2.5% | | | | |
Emerson Electric Co. | | 41,600 | | 2,916,160 |
| | | | |
|
Industrial Conglomerates 3.9% | | | | |
General Electric Co. | | 127,250 | | 4,644,625 |
| | | | |
|
Information Technology 40.4% | | | | |
Communications Equipment 4.5% | | | | |
Cisco Systems, Inc.* | | 188,500 | | 3,638,050 |
Nokia Oyj (ADR) | | 110,900 | | 1,737,803 |
| | | | |
|
| | | | | 5,375,853 |
| | | | |
|
Computers & Peripherals 7.1% | | | | |
Dell, Inc.* | | 154,650 | | 6,516,951 |
EMC Corp.* | | 128,300 | | 1,907,821 |
| | | | |
|
| | | | | 8,424,772 |
| | | | |
|
Electronic Equipment & Instruments 2.6% | | | | |
Symbol Technologies, Inc. | | 176,900 | | 3,060,370 |
| | | | |
|
Internet Software & Services 2.9% | | | | |
Yahoo!, Inc.* | | 91,450 | | 3,445,836 |
| | | | |
|
Page 322 of 466
| | | | |
IT Consulting & Services 3.0% | | | | |
CheckFree Corp.* | | 40,250 | | 1,532,720 |
First Data Corp. | | 47,950 | | 2,039,793 |
| | | | |
|
| | | | | 3,572,513 |
| | | | |
|
Semiconductors & Semiconductor Equipment 13.2% | | | | |
Broadcom Corp. “A”* | | 121,200 | | 3,912,336 |
Fairchild Semiconductor International, Inc.* | | 88,400 | | 1,437,384 |
Intel Corp. | | 144,250 | | 3,374,007 |
Maxim Integrated Products, Inc. | | 56,600 | | 2,399,274 |
National Semiconductor Corp.* | | 125,500 | | 2,252,725 |
Texas Instruments, Inc. | | 89,650 | | 2,207,183 |
| | | | |
|
| | | | | 15,582,909 |
| | | | |
|
Software 7.1% | | | | |
Microsoft Corp. | | 219,100 | | 5,852,161 |
Symantec Corp.* | | 97,100 | | 2,501,296 |
| | | | |
|
| | | | | 8,353,457 |
| | | | |
|
Total Common Stocks (Cost $101,267,812) | | | | 115,862,828 |
| | | | |
|
Cash Equivalents 2.6% | | | | |
Scudder Cash Management QP Trust, 2.24% (b) (Cost $3,050,051) | | 3,050,051 | | 3,050,051 |
| | | | |
|
| | | | | | |
| | | % of Net Assets
| | | Value ($)
| |
Total Investment Portfolio (Cost $104,317,863) (a) | | 100.4 | | | 118,912,879 | |
| | | | | |
|
|
Other Assets and Liabilities, Net | | (0.4 | ) | | (499,845 | ) |
| | | | | |
|
|
Net Assets | | 100.0 | | | 118,413,034 | |
| | | | | |
|
|
Notes to SVS Eagle Focused Large Cap Growth Portfolio of Investments
| * | Non-income producing security. |
| (a) | The cost for federal income tax purposes was $107,342,716. At December 31, 2004, net unrealized appreciation for all securities based on tax cost was $11,570,163. This consisted of aggregate gross unrealized appreciation for all securities in which there was an excess of value over tax cost of $14,639,514 and aggregate gross unrealized depreciation for all securities in which there was an excess of tax cost over value of $3,069,351. |
| (b) | Scudder Cash Management QP Trust is managed by Deutsche Investment Management Americas Inc. The rate shown is the annualized seven-day yield at period end. |
ADR: American Depositary Receipts
The accompanying notes are an integral part of the financial statements.
Page 323 of 466
Financial Statements
Statement of Assets and Liabilities as of December 31, 2004
| | | | |
Assets | | | | |
Investments: | | | | |
Investments in securities, at value (cost $101,267,812) | | $ | 115,862,828 | |
Investment in Scudder Cash Management QP Trust (cost $3,050,051) | | | 3,050,051 | |
| | |
|
|
|
Total investments in securities, at value (cost $104,317,863) | | | 118,912,879 | |
| | |
|
|
|
Dividends receivable | | | 66,118 | |
Interest receivable | | | 4,031 | |
Receivable for investments sold | | | 1,376,012 | |
Receivable for Portfolio shares sold | | | 36,708 | |
Other assets | | | 4,231 | |
| | |
|
|
|
Total assets | | | 120,399,979 | |
| | |
|
|
|
Liabilities | | | | |
Payable for Portfolio shares redeemed | | | 97,405 | |
Payable for investments purchased | | | 1,723,549 | |
Accrued management fee | | | 75,993 | |
Other accrued expenses and payables | | | 89,998 | |
| | |
|
|
|
Total liabilities | | | 1,986,945 | |
| | |
|
|
|
Net assets, at value | | $ | 118,413,034 | |
| | |
|
|
|
Net Assets | | | | |
Net assets consist of: | | | | |
Undistributed net investment income | | | 404,661 | |
Net unrealized appreciation (depreciation) on investments | | | 14,595,016 | |
Accumulated net realized gain (loss) | | | (26,027,743 | ) |
Paid-in capital | | | 129,441,100 | |
| | |
|
|
|
Net assets, at value | | $ | 118,413,034 | |
| | |
|
|
|
Class A | | | | |
Net Asset Value, offering and redemption price per share ($87,519,374 ÷ 9,955,815 outstanding shares of beneficial interest, $.01 par value, unlimited number of shares authorized) | | $ | 8.79 | |
| | |
|
|
|
Class B | | | | |
Net Asset Value, offering and redemption price per share ($30,893,660 ÷ 3,544,097 outstanding shares of beneficial interest, $.01 par value, unlimited number of shares authorized) | | $ | 8.72 | |
| | |
|
|
|
Statement of Operations for the year ended December 31, 2004
| | | | |
Investment Income | | | | |
Income: | | | | |
Dividends | | $ | 1,576,944 | |
Securities lending income, including income from Daily Assets Fund Institutional | | | 1,104 | |
Interest — Scudder Cash Management QP Trust | | | 35,449 | |
| | |
|
|
|
Total Income | | | 1,613,497 | |
| | |
|
|
|
Expenses: | | | | |
Management fee | | | 945,157 | |
Custodian and accounting fees | | | 82,602 | |
Distribution service fees (Class B) | | | 60,991 | |
Record keeping fees (Class B) | | | 31,879 | |
Auditing | | | 53,771 | |
Legal | | | 14,279 | |
Trustees’ fees and expenses | | | 1,913 | |
Reports to shareholders | | | 13,378 | |
Other | | | 6,345 | |
| | |
|
|
|
Total expenses, before expense reductions | | | 1,210,315 | |
| | |
|
|
|
Expense reductions | | | (1,550 | ) |
| | |
|
|
|
Total expenses, after expense reductions | | | 1,208,765 | |
| | |
|
|
|
Net investment income (loss) | | | 404,732 | |
| | |
|
|
|
Realized and Unrealized Gain (Loss) on Investment Transactions | | | | |
Net realized gain (loss) from investments | | | (164,658 | ) |
Net unrealized appreciation (depreciation) during the period on investments | | | 2,143,613 | |
| | |
|
|
|
Net gain (loss) on investment transactions | | | 1,978,955 | |
| | |
|
|
|
Net increase (decrease) in net assets resulting from operations | | $ | 2,383,687 | |
| | |
|
|
|
The accompanying notes are an integral part of the financial statements.
Page 324 of 466
Statement of Changes in Net Assets
| | | | | | | | |
| | | Years Ended December 31,
| |
| | | 2004
| | | 2003
| |
Increase (Decrease) in Net Assets | | | | | | | | |
Operations: | | | | | | | | |
Net investment income (loss) | | $ | 404,732 | | | $ | (51,955 | ) |
Net realized gain (loss) on investment transactions | | | (164,658 | ) | | | 2,310,457 | |
Net unrealized appreciation (depreciation) on investment transactions during the period | | | 2,143,613 | | | | 16,392,143 | |
Net increase (decrease) in net assets resulting from operations | | | 2,383,687 | | | | 18,650,645 | |
Portfolio share transactions: | | | | | | | | |
| | |
Class A | | | | | | | | |
Proceeds from shares sold | | | 12,090,841 | | | | 13,012,448 | |
Cost of shares redeemed | | | (9,834,816 | ) | | | (8,293,606 | ) |
Net increase (decrease) in net assets from Class A share transactions | | | 2,256,025 | | | | 4,718,842 | |
| | |
Class B | | | | | | | | |
Proceeds from shares sold | | | 17,731,434 | | | | 12,484,580 | |
Cost of shares redeemed | | | (2,263,054 | ) | | | (113,785 | ) |
Net increase (decrease) in net assets from Class B share transactions | | | 15,468,380 | | | | 12,370,795 | |
Increase (decrease) in net assets | | | 20,108,092 | | | | 35,740,282 | |
Net assets at beginning of period | | | 98,304,942 | | | | 62,564,660 | |
| | |
|
|
| |
|
|
|
Net assets at end of period (including undistributed net investment income and accumulated net investment loss of $404,661 and $71, respectively) | | $ | 118,413,034 | | | $ | 98,304,942 | |
| | |
|
|
| |
|
|
|
Other Information | | | | | | | | |
| | |
Class A | | | | | | | | |
Shares outstanding at beginning of period | | | 9,695,116 | | | | 9,100,995 | |
Shares sold | | | 1,445,596 | | | | 1,735,087 | |
Shares redeemed | | | (1,184,897 | ) | | | (1,140,966 | ) |
Net increase (decrease) in Portfolio shares | | | 260,699 | | | | 594,121 | |
| | |
|
|
| |
|
|
|
Shares outstanding at end of period | | | 9,955,815 | | | | 9,695,116 | |
| | |
|
|
| |
|
|
|
| | |
Class B | | | | | | | | |
Shares outstanding at beginning of period | | | 1,703,581 | | | | 77,032 | |
Shares sold | | | 2,112,493 | | | | 1,642,289 | |
Shares redeemed | | | (271,977 | ) | | | (15,740 | ) |
Net increase (decrease) in Portfolio shares | | | 1,840,516 | | | | 1,626,549 | |
| | |
|
|
| |
|
|
|
Shares outstanding at end of period | | | 3,544,097 | | | | 1,703,581 | |
| | |
|
|
| |
|
|
|
The accompanying notes are an integral part of the financial statements.
Page 325 of 466
Financial Highlights
Class A
| | | | | | | | | | | | | | | | | | | |
Years Ended December 31,
| | 2004
| | 2003
| | | 2002
| | | 2001
| | | 2000a
| |
Selected Per Share Data | | | | | | | | | | | | | | | | | | | |
Net asset value, beginning of period | | $ | 8.63 | | | 6.82 | | | $ | 9.46 | | | $ | 11.40 | | | $ | 12.84 | |
| | |
|
| |
|
|
| |
|
|
| |
|
|
| |
|
|
|
Income (loss) from investment operations: | | | | | | | | | | | | | | | | | | | |
Net investment income (loss)b | | | .04 | | | — | * | | | (.01 | ) | | | (.02 | ) | | | (.05 | ) |
Net realized and unrealized gain (loss) on investment transactions | | | .12 | | | 1.81 | | | | (2.63 | ) | | | (1.92 | ) | | | (1.04 | ) |
| | |
|
| |
|
|
| |
|
|
| |
|
|
| |
|
|
|
Total from investment operations | | | .16 | | | 1.81 | | | | (2.64 | ) | | | (1.94 | ) | | | (1.09 | ) |
| | |
|
| |
|
|
| |
|
|
| |
|
|
| |
|
|
|
Less distributions from: | | | | | | | | | | | | | | | | | | | |
Net realized gains on investment transactions | | | — | | | — | | | | — | | | | — | | | | (.35 | ) |
| | |
|
| |
|
|
| |
|
|
| |
|
|
| |
|
|
|
Net asset value, end of period | | $ | 8.79 | | $ | 8.63 | | | $ | 6.82 | | | $ | 9.46 | | | $ | 11.40 | |
| | |
|
| |
|
|
| |
|
|
| |
|
|
| |
|
|
|
Total Return (%) | | | 1.85 | | | 26.54 | | | | (27.91 | ) | | | (17.02 | ) | | | (9.02 | )c |
Ratios to Average Net Assets and Supplemental Data | | | | | | | | | | | | | | | | | | | |
Net assets, end of period ($ millions) | | | 88 | | | 84 | | | | 62 | | | | 60 | | | | 28 | |
Ratio of expenses before expense reductions (%) | | | 1.05 | | | 1.10 | | | | 1.03 | | | | 1.13 | | | | 1.33 | |
Ratio of expenses after expense reductions (%) | | | 1.04 | | | 1.10 | | | | 1.03 | | | | 1.11 | | | | 1.02 | |
Ratio of net investment income (loss) (%) | | | .47 | | | (.04 | ) | | | (.08 | ) | | | (.21 | ) | | | (.37 | ) |
Portfolio turnover rate (%) | | | 90 | | | 143 | | | | 123 | | | | 98 | | | | 323 | |
| a | On June 18, 2001, the Portfolio implemented a 1 for 10 reverse stock split. Per share information, for the period prior to December 31, 2001, has been restated to reflect the effect of the split. Shareholders received 1 share for every 10 shares owned and net asset value per share increased correspondingly. |
| b | Based on average shares outstanding during the period. |
| c | Total return would have been lower had certain expenses not been reduced. |
| * | Amount is less than $.005. |
Page 326 of 466
Class B
| | | | | | | | | | | |
Years Ended December 31,
| | 2004
| | 2003
| | | 2002a
| |
Selected Per Share Data | | | | | | | | | | | |
Net asset value, beginning of period | | $ | 8.59 | | $ | 6.81 | | | $ | 7.61 | |
| | |
|
| |
|
|
| |
|
|
|
Income (loss) from investment operations: | | | | | | | | | | | |
Net investment income (loss)b | | | .01 | | | (.04 | ) | | | .01 | |
Net realized and unrealized gain (loss) on investment transactions | | | .12 | | | 1.82 | | | | (.81 | ) |
| | |
|
| |
|
|
| |
|
|
|
Total from investment operations | | | .13 | | | 1.78 | | | | (.80 | ) |
| | |
|
| |
|
|
| |
|
|
|
Net asset value, end of period | | $ | 8.72 | | $ | 8.59 | | | $ | 6.81 | |
| | |
|
| |
|
|
| |
|
|
|
Total Return (%) | | | 1.51 | | | 26.14 | | | | (10.51 | )** |
Ratios to Average Net Assets and Supplemental Data | | | | | | | | | | | |
Net assets, end of period ($ millions) | | | 31 | | | 15 | | | | .5 | |
Ratio of expenses (%) | | | 1.42 | | | 1.49 | | | | 1.30 | * |
Ratio of net investment income (loss) (%) | | | .09 | | | (.43 | ) | | | .21 | * |
Portfolio turnover rate (%) | | | 90 | | | 143 | | | | 123 | |
| a | For the period July 1, 2002 (commencement of operations of Class B shares) to December 31, 2002. |
| b | Based on average shares outstanding during the period. |
Performance Summary December 31, 2004
SVS Focus Value+Growth Portfolio
All performance shown is historical, assumes reinvestment of all dividends and capital gains, and does not guarantee future results. Investment return and principal value fluctuate with changing market conditions so that, when redeemed, shares may be worth more or less then their original cost. Current performance may be lower or higher than the performance data quoted. Please visit scudder.com for the product’s most recent month-end performance. Performance doesn’t reflect charges and fees (“contract charges”) associated with the separate account that invests in the Portfolio or any variable life insurance policy or variable annuity contract for which the Portfolio is an investment option. These charges and fees will reduce returns.
This Portfolio is subject to stock market risk. It is non-diversified and can take larger positions in fewer companies, increasing its overall potential risk. Please read this Portfolio’s prospectus for specific details regarding its investments and risk profile.
| | |
| Growth of an Assumed $10,000 Investment in SVS Focus Value+Growth Portfolio from 5/1/1996 to 12/31/2004 |
|
¨ SVS Focus Value+Growth Portfolio — Class A |
| |
| ¨ S&P 500 Index | | |
| |
| | The Standard & Poor’s (S&P) 500 Index is a capitalization-weighted index of 500 stocks. The index is designed to measure performance of the broad domestic economy through changes in the aggregate market value of 500 stocks representing all major industries. Index returns assume reinvested dividends and, unlike Portfolio returns, do not reflect any fees or expenses. It is not possible to invest directly into an index. |
Yearly periods ended December 31 |
Page 327 of 466
Comparative Results
| | | | | | | | | | | | | | | | | | |
SVS Focus Value+Growth Portfolio
| | | | 1-Year
| | | 3-Year
| | | 5-Year
| | | Life of Portfolio*
| |
Class A | | Growth of $10,000 | | $ | 11,116 | | | $ | 10,946 | | | $ | 9,009 | | | $ | 18,139 | |
| | | Average annual total return | | | 11.16 | % | | | 3.06 | % | | | -2.06 | % | | | 7.11 | % |
S&P 500 Index | | Growth of $10,000 | | $ | 11,088 | | | $ | 11,115 | | | $ | 8,902 | | | $ | 21,250 | |
| | | Average annual total return | | | 10.88 | % | | | 3.59 | % | | | -2.30 | % | | | 9.09 | % |
| | | | | |
SVS Focus Value+Growth Portfolio
| | | | | | | | | | 1-Year
| | | Life of Class**
| |
Class B | | Growth of $10,000 | | | | | | | | | | $ | 11,082 | | | $ | 13,155 | |
| | | Average annual total return | | | | | | | | | | | 10.82 | % | | | 11.58 | % |
S&P 500 Index | | Growth of $10,000 | | | | | | | | | | $ | 11,088 | | | $ | 12,800 | |
| | | Average annual total return | | | | | | | | | | | 10.88 | % | | | 10.38 | % |
The growth of $10,000 is cumulative.
| * | The Portfolio commenced operations on May 1, 1996. Index returns begin April 30, 1996. |
| ** | The Portfolio commenced offering Class B shares on July 1, 2002. Index returns begin June 30, 2002. |
Information About Your Portfolio’s Expenses
SVS Focus Value+Growth Portfolio
As an investor of the Portfolio, you incur two types of costs: ongoing expenses and transaction costs. Ongoing expenses include management fees, distribution and service (12b-1) fees and other Portfolio expenses. Examples of transaction costs include sales charges (loads), redemption fees and account maintenance fees, which are not shown in this section. The following tables are intended to help you understand your ongoing expenses (in dollars) of investing in the Portfolio and to help you compare these expenses with the ongoing expenses of investing in other mutual funds. The tables are based on an investment of $1,000 made at the beginning of the six-month period ended December 31, 2004.
The tables illustrate your Portfolio’s expenses in two ways:
Actual Portfolio Return. This helps you estimate the actual dollar amount of ongoing expenses (but not transaction costs) paid on a $1,000 investment in the Portfolio using the Portfolio’s actual return during the period. To estimate the expenses you paid over the period, simply divide your account value by $1,000 (for example, an $8,600 account value divided by $1,000 = 8.6), then multiply the result by the number in the “Expenses Paid per $1,000” line under the share class you hold.
Hypothetical 5% Portfolio Return. This helps you to compare your Portfolio’s ongoing expenses (but not transaction costs) with those of other mutual funds using the Portfolio’s actual expense ratio and a hypothetical rate of return of 5% per year before expenses. Examples using a 5% hypothetical Portfolio return may be found in the shareholder reports of other mutual funds. The hypothetical account values
Page 328 of 466
and expenses may not be used to estimate the actual ending account balance or expenses you paid for the period.
Please note that the expenses shown in these tables are meant to highlight your ongoing expenses only and do not reflect any transaction costs. The “Expenses Paid per $1,000” line of the tables is useful in comparing ongoing expenses only and will not help you determine the relative total expense of owning different funds. If these transaction costs had been included, your costs would have been higher.
Expenses and Value of a $1,000 Investment for the six months ended December 31, 2004
| | | | | | |
Actual Portfolio Return
| | Class A
| | Class B
|
Beginning Account Value 7/1/04 | | $ | 1,000.00 | | $ | 1,000.00 |
Ending Account Value 12/31/04 | | $ | 1,089.50 | | $ | 1,088.00 |
Expenses Paid per $1,000* | | $ | 4.24 | | $ | 6.23 |
| | |
Hypothetical 5% Portfolio Return
| | Class A
| | Class B
|
Beginning Account Value 7/1/04 | | $ | 1,000.00 | | $ | 1,000.00 |
Ending Account Value 12/31/04 | | $ | 1,021.14 | | $ | 1,019.24 |
Expenses Paid per $1,000* | | $ | 4.11 | | $ | 6.03 |
| * | Expenses are equal to the Portfolio’s annualized expense ratio for each share class, multiplied by the average account value over the period, multiplied by the number of days in the most recent six-month period, then divided by 365. |
| | | | | | |
Annualized Expense Ratios
| | Class A
| | | Class B
| |
Scudder Variable Series II — SVS Focus Value+Growth Portfolio | | .81 | % | | 1.18 | % |
For more information, please refer to the Portfolio’s prospectus.
Management Summary December 31, 2004
SVS Focus Value+Growth Portfolio
We are pleased to announce that in the 12-month period ended December 31, 2004 the portfolio (Class A shares, unadjusted for contract charges) posted a total return 11.16%, versus a 10.88% return by the S&P 500 index.
The period proved difficult for the portfolio’s value holdings. In a highly concentrated portfolio, such as this, severe losses among core holdings can be very damaging. In this case, gains in the portfolio’s largest position — Freddie Mac — and of top-10 holdings, including UST, Inc. and Altria Group, Inc. were not enough to offset losses sustained by Fannie Mae and Pfizer, Inc. which faced scrutiny during the period. Mortgage provider Fannie Mae declined when its accounting practices came under investigation and were deemed improper by the SEC. Pfizer, Inc. plummeted after clinical studies suggested that osteoarthritis drug, Celebrex, might increase the cardiovascular risks when taken in large doses. While we’re disappointed in the events that led to the declines in these holdings, we believe they are temporary setbacks. We continue to hold both stocks.
The portfolio’s growth sleeve performed well with every sector posting positive returns for the year. Consumer discretionary stocks made the greatest contribution to overall performance. Among them was top-10 holding eBay, Inc., a provider of online auction services, which continued to benefit from market
Page 329 of 466
dominance and valuable brand recognition. Starbucks Corp. also aided performance with revenues and unit sales growth that exceeded expectations. Within the energy area, BJ Services Co.*, rose in tandem with historically high oil prices and increased demand for drilling services. While the sleeve’s technology sector advanced, several semiconductor stocks — Intel* and Texas Instruments* — produced negative returns as demand for semiconductors slowed, leading to inventory surpluses.
David N. Dreman Spiros Segalas
F. James Hutchinson Kathleen McCarragher
Co-Managers Co-Managers
Dreman Value Management L.L.C. Jennison Associates LLC
(Subadvisor for the Value portion of the Portfolio) (Subadvisor for the Growth portion of the Portfolio)
| * | This holding was not held in the portfolio at the end of the reporting period. |
All performance shown is historical, assumes reinvestment of all dividends and capital gains, and does not guarantee future results. Investment return and principal value fluctuate with changing market conditions so that, when redeemed, shares may be worth more or less then their original cost. Current performance may be lower or higher than the performance data quoted. Please visit scudder.com for the product’s most recent month-end performance. Performance doesn’t reflect charges and fees (“contract charges”) associated with the separate account that invests in the portfolio or any variable life insurance policy or variable annuity contract for which the portfolio is an investment option. These charges and fees will reduce returns.
Risk Considerations
This portfolio is subject to stock market risk. It is nondiversified and can take larger positions in fewer companies, increasing its overall potential risk. Please read this portfolio’s prospectus for specific details regarding its investments and risk profile.
The Standard & Poor’s (S&P) 500 Index is a capitalization-weighted index of 500 stocks. The index is designed to measure performance of the broad domestic economy through changes in the aggregate market value of 500 stocks representing all major industries. Index returns assume reinvested dividends and, unlike Portfolio returns, do not reflect any fees or expenses. It is not possible to invest directly into an index.
Portfolio management market commentary is as of December 31, 2004, and may not come to pass. This information is subject to change at any time based on market and other conditions.
Portfolio Summary
SVS Focus Value+Growth Portfolio
| | | | | | |
Asset Allocation
| | 12/31/04
| | | 12/31/03
| |
Common Stocks | | 99 | % | | 96 | % |
Cash Equivalents | | 1 | % | | 4 | % |
| | |
|
| |
|
|
| | | 100 | % | | 100 | % |
| | |
|
| |
|
|
| | | | | | |
Sector Diversification (Excludes Cash Equivalents)
| | 12/31/04
| | | 12/31/03
| |
Financials | | 28 | % | | 30 | % |
Information Technology | | 21 | % | | 20 | % |
Health Care | | 16 | % | | 15 | % |
Consumer Staples | | 14 | % | | 8 | % |
Consumer Discretionary | | 12 | % | | 18 | % |
Industrials | | 4 | % | | 3 | % |
Energy | | 3 | % | | 5 | % |
Telecommunication Services | | 2 | % | | — | |
Utilities | | — | | | 1 | % |
| | |
|
| |
|
|
| | | 100 | % | | 100 | % |
| | |
|
| |
|
|
Page 330 of 466
Asset allocation and sector diversification are subject to change.
For more complete details about the Portfolio’s investment portfolio, see page 7. A quarterly Fact Sheet is available upon request. Information concerning portfolio holdings of the Portfolio as of month end will be posted to scudder.com on the 15th of the following month.
Following the Portfolio’s fiscal first and third quarter-end, a complete portfolio holdings listing is filed with the SEC on Form N-Q. The form will be available on the SEC’s Web site at www.sec.gov, and it also may be reviewed and copied at the SEC’s Public Reference Room in Washington, D.C. Information on the operation of the SEC’s Public Reference Room may be obtained by calling (800) SEC-0330.
Investment Portfolio December 31, 2004
SVS Focus Value+Growth Portfolio
| | | | |
| | | Shares
| | Value ($)
|
Common Stocks 98.8% | | | | |
Consumer Discretionary 12.4% | | | | |
Hotels Restaurants & Leisure 2.9% | | | | |
Starbucks Corp.* | | 58,000 | | 3,616,880 |
| | | | |
|
Internet & Catalog Retail 3.7% | | | | |
eBay, Inc.* | | 40,100 | | 4,662,828 |
| | | | |
|
Multiline Retail 2.8% | | | | |
Target Corp. | | 67,000 | | 3,479,310 |
| | | | |
|
Specialty Retail 3.0% | | | | |
Borders Group, Inc. | | 31,250 | | 793,750 |
Home Depot, Inc. | | 52,165 | | 2,229,532 |
Staples, Inc. | | 23,340 | | 786,792 |
| | | | |
|
| | | | | 3,810,074 |
| | | | |
|
Consumer Staples 14.3% | | | | |
Food & Drug Retailing 2.3% | | | | |
Whole Foods Market, Inc. | | 30,200 | | 2,879,570 |
| | | | |
|
Personal Products 2.4% | | | | |
Estee Lauder Companies, Inc. “A” | | 67,200 | | 3,075,744 |
| | | | |
|
Tobacco 9.6% | | | | |
Altria Group, Inc. | | 111,100 | | 6,788,210 |
Reynolds American, Inc. | | 8,825 | | 693,645 |
UST, Inc. | | 94,920 | | 4,566,601 |
| | | | |
|
| | | | | 12,048,456 |
| | | | |
|
Page 331 of 466
| | | | |
Energy 3.2% | | | | |
Oil & Gas | | | | |
Apache Corp. | | 1,200 | | 60,684 |
Burlington Resources, Inc. | | 900 | | 39,150 |
ChevronTexaco Corp. | | 12,150 | | 637,996 |
ConocoPhillips | | 1,300 | | 112,879 |
Devon Energy Corp. | | 46,690 | | 1,817,175 |
EnCana Corp. | | 4,400 | | 251,064 |
Kerr-McGee Corp. | | 16,350 | | 944,866 |
Occidental Petroleum Corp. | | 3,099 | | 180,858 |
| | | | |
|
| | | | | 4,044,672 |
| | | | |
|
Financials 27.7% | �� | | | |
Banks 7.1% | | | | |
Bank of America Corp. | | 48,420 | | 2,275,256 |
PNC Financial Services Group | | 17,510 | | 1,005,774 |
Sovereign Bancorp, Inc. | | 48,810 | | 1,100,666 |
US Bancorp. | | 28,700 | | 898,884 |
Washington Mutual, Inc. | | 85,251 | | 3,604,412 |
| | | | |
|
| | | | | 8,884,992 |
| | | | |
|
Capital Markets 2.8% | | | | |
Merrill Lynch & Co., Inc. | | 59,300 | | 3,544,361 |
| | | | |
|
Consumer Finance 2.6% | | | | |
American Express Co. | | 59,300 | | 3,342,741 |
| | | | |
|
Diversified Financial Services 14.0% | | | | |
Fannie Mae | | 85,050 | | 6,056,410 |
Freddie Mac | | 112,150 | | 8,265,455 |
JPMorgan Chase & Co. | | 86,500 | | 3,374,365 |
| | | | |
|
| | | | | 17,696,230 |
| | | | |
|
| | |
| | | Shares
| | Value ($)
|
Insurance 1.2% | | | | |
American International Group, Inc. | | 22,500 | | 1,477,575 |
| | | | |
|
Health Care 15.4% | | | | |
Biotechnology 4.7% | | | | |
Genentech, Inc.* | | 74,800 | | 4,072,112 |
Gilead Sciences, Inc.* | | 53,600 | | 1,875,464 |
| | | | |
|
| | | | | 5,947,576 |
| | | | |
|
Health Care Equipment & Supplies 0.5% | | | | |
Becton, Dickinson & Co. | | 10,675 | | 606,340 |
| | | | |
|
Health Care Providers & Services 4.1% | | | | |
AmerisourceBergen Corp. | | 15,050 | | 883,134 |
Cardinal Health, Inc. | | 5,750 | | 334,363 |
HCA, Inc. | | 20,875 | | 834,165 |
Laboratory Corp. of America Holdings* | | 23,890 | | 1,190,200 |
Medco Health Solutions, Inc.* | | 22,062 | | 917,779 |
Quest Diagnostics, Inc. | | 10,720 | | 1,024,296 |
| | | | |
|
| | | | | 5,183,937 |
| | | | |
|
Page 332 of 466
| | | | |
Pharmaceuticals 6.1% | | | | |
Bristol Myers Squibb Co. | | 55,170 | | 1,413,455 |
Eli Lilly & Co. | | 35,600 | | 2,020,300 |
Merck & Co., Inc. | | 46,900 | | 1,507,366 |
Pfizer, Inc. | | 94,500 | | 2,541,105 |
Wyeth | | 5,525 | | 235,310 |
| | | | |
|
| | | | | 7,717,536 |
| | | | |
|
Industrials 3.7% | | | | |
Industrial Conglomerates 3.7% | | | | |
General Electric Co. | | 101,200 | | 3,693,800 |
Tyco International Ltd. | | 25,850 | | 923,879 |
| | | | |
|
| | | | | 4,617,679 |
| | | | |
|
Information Technology 20.5% | | | | |
Computers & Peripherals 2.8% | | | | |
Apple Computer, Inc.* | | 54,800 | | 3,529,120 |
| | | | |
|
Electronic Equipment & Instruments 2.4% | | | | |
Agilent Technologies, Inc.* | | 126,700 | | 3,053,470 |
| | | | |
|
Internet Software & Services 6.0% | | | | |
Google, Inc. “A”* | | 18,700 | | 3,610,970 |
Yahoo!, Inc.* | | 104,000 | | 3,918,720 |
| | | | |
|
| | | | | 7,529,690 |
| | | | |
|
IT Consulting & Services 1.5% | | | | |
Electronic Data Systems Corp. | | 82,525 | | 1,906,328 |
| | | | |
|
Semiconductors & Semiconductor Equipment 2.0% | | | | |
Marvell Technology Group Ltd.* | | 71,100 | | 2,521,917 |
| | | | |
|
Software 5.8% | | | | |
Electronic Arts, Inc.* | | 63,700 | | 3,929,016 |
Microsoft Corp. | | 123,300 | | 3,293,343 |
| | | | |
|
| | | | | 7,222,359 |
| | | | |
|
Telecommunication Services 1.6% | | | | |
Wireless Telecommunication Services | | | | |
Nextel Communications, Inc. “A”* | | 67,000 | | 2,010,000 |
| | | | |
|
Total Common Stocks (Cost $103,076,220) | | | | 124,409,385 |
| | | | |
|
| | |
| | | Shares
| | Value ($)
|
Cash Equivalents 1.0% | | | | |
Scudder Cash Management QP Trust, 2.24% (b) (Cost $1,256,952) | | 1,256,952 | | 1,256,952 |
| | | | |
|
| | | | |
| | | % of
Net Assets
| | Value ($)
|
Total Investment Portfolio (Cost $104,333,172) (a) | | 99.8 | | 125,666,337 |
| | | | |
|
Other Assets and Liabilities, Net | | 0.2 | | 229,302 |
| | | | |
|
Net Assets | | 100.0 | | 125,895,639 |
| | | | |
|
Notes to SVS Focus Value+Growth Portfolio of Investments
| * | Non-income producing security. |
Page 333 of 466
| (a) | The cost for federal income tax purposes was $104,426,153. At December 31, 2004, net unrealized appreciation for all securities based on tax cost was $21,240,184. This consisted of aggregate gross unrealized appreciation for all securities in which there was an excess of value over tax cost of $24,483,278 and aggregate gross unrealized depreciation for all securities in which there was an excess of tax cost over value of $3,243,094. |
| (b) | Scudder Cash Management QP Trust is managed by Deutsche Investment Management Americas Inc. The rate shown is the annualized seven-day yield at period end. |
The accompanying notes are an integral part of the financial statements.
Financial Statements
Statement of Assets and Liabilities as of December 31, 2004
| | | | |
Assets | | | | |
Investments: | | | | |
Investments in securities, at value (cost $103,076,220) | | $ | 124,409,385 | |
Investment in Scudder Cash Management QP Trust (cost $1,256,952) | | | 1,256,952 | |
| | |
|
|
|
Total investments in securities, at value (cost $104,333,172) | | | 125,666,337 | |
| | |
|
|
|
Cash | | | 79,047 | |
Receivable for investments sold | | | 316,809 | |
Dividends receivable | | | 152,268 | |
Interest receivable | | | 2,706 | |
Other assets | | | 3,721 | |
| | |
|
|
|
Total assets | | | 126,220,888 | |
| | |
|
|
|
Liabilities | | | | |
Payable for Portfolio shares redeemed | | | 188,679 | |
Accrued management fee | | | 83,203 | |
Other accrued expenses and payables | | | 53,367 | |
| | |
|
|
|
Total liabilities | | | 325,249 | |
| | |
|
|
|
Net assets, at value | | $ | 125,895,639 | |
| | |
|
|
|
Net Assets | | | | |
Net assets consist of: | | | | |
Undistributed net investment income | | | 1,316,360 | |
Net unrealized appreciation (depreciation) on investments | | | 21,333,165 | |
Accumulated net realized gain (loss) | | | (29,983,699 | ) |
Paid-in capital | | | 133,229,813 | |
| | |
|
|
|
Net assets, at value | | $ | 125,895,639 | |
| | |
|
|
|
Class A | | | | |
Net Asset Value, offering and redemption price per share ($114,746,163 ÷ 8,194,607 outstanding shares of beneficial interest, $.01 par value, unlimited number of shares authorized) | | $ | 14.00 | |
| | |
|
|
|
Class B | | | | |
Net Asset Value, offering and redemption price per share ($11,149,476 ÷ 798,374 outstanding shares of beneficial interest, $.01 par value, unlimited number of shares authorized) | | $ | 13.97 | |
| | |
|
|
|
Page 334 of 466
Statement of Operations for the year ended December 31, 2004
| | | | |
Investment Income | | | | |
Income: | | | | |
Dividends (net of foreign taxes withheld of $66) | | $ | 2,355,322 | |
Interest — Scudder Cash Management QP Trust | | | 28,530 | |
Securities lending income, including income from Daily Assets Fund Institutional | | | 213 | |
| | |
|
|
|
Total Income | | | 2,384,065 | |
| | |
|
|
|
Expenses: | | | | |
Management fee | | | 918,970 | |
Custodian fees | | | 15,016 | |
Distribution service fees (Class B) | | | 22,563 | |
Record keeping fees (Class B) | | | 12,161 | |
Auditing | | | 40,476 | |
Legal | | | 3,682 | |
Reports to shareholders | | | 10,424 | |
Other | | | 1,341 | |
| | |
|
|
|
Total expenses, before expense reductions | | | 1,024,633 | |
| | |
|
|
|
Expense reductions | | | (1,623 | ) |
| | |
|
|
|
Total expenses, after expense reductions | | | 1,023,010 | |
| | |
|
|
|
Net investment income (loss) | | | 1,361,055 | |
| | |
|
|
|
Realized and Unrealized Gain (Loss) on Investment Transactions | | | | |
Net realized gain (loss) from: | | | | |
Investments | | | 4,306,873 | |
Futures | | | 116,366 | |
| | | | 4,423,239 | |
Net unrealized appreciation (depreciation) during the period on: | | | | |
Investments | | | 6,929,650 | |
Futures | | | (64,159 | ) |
| | |
|
|
|
| | | | 6,865,491 | |
| | |
|
|
|
Net gain (loss) on investment transactions | | | 11,288,730 | |
| | |
|
|
|
Net increase (decrease) in net assets resulting from operations | | $ | 12,649,785 | |
| | |
|
|
|
The accompanying notes are an integral part of the financial statements.
Page 335 of 466
Statement of Changes in Net Assets
| | | | | | | | |
| | | Years Ended December 31,
| |
| | | 2004
| | | 2003
| |
Increase (Decrease) in Net Assets | | | | | | | | |
Operations: | | | | | | | | |
Net investment income (loss) | | $ | 1,361,055 | | | $ | 1,010,016 | |
Net realized gain (loss) on investment transactions | | | 4,423,239 | | | | (762,388 | ) |
Net unrealized appreciation (depreciation) on investment transactions during the period | | | 6,865,491 | | | | 30,764,910 | |
Net increase (decrease) in net assets resulting from operations | | | 12,649,785 | | | | 31,012,538 | |
Distributions to shareholders from: | | | | | | | | |
Net investment income | | | | | | | | |
Class A | | | (964,388 | ) | | | (861,563 | ) |
Class B | | | (34,623 | ) | | | (12,687 | ) |
Portfolio share transactions: | | | | | | | | |
| | |
Class A | | | | | | | | |
Proceeds from shares sold | | | 6,603,416 | | | | 11,072,613 | |
Reinvestment of distributions | | | 964,388 | | | | 861,563 | |
Cost of shares redeemed | | | (24,197,037 | ) | | | (17,513,556 | ) |
Net increase (decrease) in net assets from Class A share transactions | | | (16,629,233 | ) | | | (5,579,380 | ) |
| | |
Class B | | | | | | | | |
Proceeds from shares sold | | | 4,462,355 | | | | 5,121,184 | |
Reinvestment of distributions | | | 34,623 | | | | 12,687 | |
Cost of shares redeemed | | | (675,725 | ) | | | (406,433 | ) |
Net increase (decrease) in net assets from Class B share transactions | | | 3,821,253 | | | | 4,727,438 | |
Increase (decrease) in net assets | | | (1,157,206 | ) | | | 29,286,346 | |
Net assets at beginning of period | | | 127,052,845 | | | | 97,766,499 | |
| | |
|
|
| |
|
|
|
Net assets at end of period (including undistributed net investment income of $1,316,360 and $954,315, respectively) | | $ | 125,895,639 | | | $ | 127,052,845 | |
| | |
|
|
| |
|
|
|
Other Information | | | | | | | | |
| | |
Class A | | | | | | | | |
Shares outstanding at beginning of period | | | 9,513,858 | | | | 10,089,997 | |
Shares sold | | | 516,151 | | | | 983,070 | |
Shares issued to shareholders in reinvestment of distributions | | | 76,791 | | | | 93,142 | |
Shares redeemed | | | (1,912,193 | ) | | | (1,652,351 | ) |
Net increase (decrease) in Portfolio shares | | | (1,319,251 | ) | | | (576,139 | ) |
| | |
|
|
| |
|
|
|
Shares outstanding at end of period | | | 8,194,607 | | | | 9,513,858 | |
| | |
|
|
| |
|
|
|
| | |
Class B | | | | | | | | |
Shares outstanding at beginning of period | | | 495,365 | | | | 39,304 | |
Shares sold | | | 352,824 | | | | 491,329 | |
Shares issued to shareholders in reinvestment of distributions | | | 2,757 | | | | 1,372 | |
Shares redeemed | | | (52,572 | ) | | | (36,640 | ) |
Net increase (decrease) in Portfolio shares | | | 303,009 | | | | 456,061 | |
| | |
|
|
| |
|
|
|
Shares outstanding at end of period | | | 798,374 | | | | 495,365 | |
| | |
|
|
| |
|
|
|
The accompanying notes are an integral part of the financial statements.
Page 336 of 466
Financial Highlights
Class A
| | | | | | | | | | | | | | | | | | | | |
Years Ended December 31,
| | 2004
| | | 2003
| | | 2002
| | | 2001
| | | 2000a
| |
Selected Per Share Data | | | | | | | | | | | | | | | | | | | | |
Net asset value, beginning of period | | $ | 12.70 | | | $ | 9.65 | | | $ | 13.08 | | | $ | 16.55 | | | $ | 18.96 | |
| | |
|
|
| |
|
|
| |
|
|
| |
|
|
| |
|
|
|
Income (loss) from investment operations: | | | | | | | | | | | | | | | | | | | | |
Net investment income (loss)b | | | .14 | | | | .10 | | | | .08 | | | | .09 | | | | .12 | |
Net realized and unrealized gain (loss) on investment transactions | | | 1.27 | | | | 3.04 | | | | (3.45 | ) | | | (2.41 | ) | | | (.73 | ) |
| | |
|
|
| |
|
|
| |
|
|
| |
|
|
| |
|
|
|
Total from investment operations | | | 1.41 | | | | 3.14 | | | | (3.37 | ) | | | (2.32 | ) | | | (.61 | ) |
| | |
|
|
| |
|
|
| |
|
|
| |
|
|
| |
|
|
|
Less distributions from: | | | | | | | | | | | | | | | | | | | | |
Net investment income | | | (.11 | ) | | | (.09 | ) | | | (.06 | ) | | | (.10 | ) | | | (.10 | ) |
Net realized gains on investment transactions | | | — | | | | — | | | | — | | | | (1.05 | ) | | | (1.70 | ) |
| | |
|
|
| |
|
|
| |
|
|
| |
|
|
| |
|
|
|
Total distributions | | | (.11 | ) | | | (.09 | ) | | | (.06 | ) | | | (1.15 | ) | | | (1.80 | ) |
| | |
|
|
| |
|
|
| |
|
|
| |
|
|
| |
|
|
|
Net asset value, end of period | | $ | 14.00 | | | $ | 12.70 | | | $ | 9.65 | | | $ | 13.08 | | | $ | 16.55 | |
| | |
|
|
| |
|
|
| |
|
|
| |
|
|
| |
|
|
|
Total Return (%) | | | 11.16 | | | | 32.87c | | | | (25.89 | ) | | | (14.35 | ) | | | (3.90 | ) |
| | |
|
|
| |
|
|
| |
|
|
| |
|
|
| |
|
|
|
Ratios to Average Net Assets and Supplemental Data | | | | | | | | | | | | | | | | | | | | |
Net assets, end of period ($ millions) | | | 115 | | | | 121 | | | | 97 | | | | 140 | | | | 153 | |
Ratio of expenses before expense reductions (%) | | | .81 | | | | .85 | | | | .81 | | | | .79 | | | | .81 | |
Ratio of expenses after expense reductions (%) | | | .81 | | | | .84 | | | | .81 | | | | .79 | | | | .81 | |
Ratio of net investment income (loss) (%) | | | 1.14 | | | | .96 | | | | .73 | | | | .64 | | | | .66 | |
Portfolio turnover rate (%) | | | 68 | | | | 82 | | | | 109 | | | | 180 | | | | 39 | |
| a | On June 18, 2001, the Portfolio implemented a 1 for 10 reverse stock split. Per share information, for the period prior to June 30, 2001, has been restated to reflect the effect of the split. Shareholders received 1 share for every 10 shares owned and net asset value per share increased correspondingly. |
| b | Based on average shares outstanding during the period. |
| c | Total returns would have been lower had certain expenses not been reduced. |
Page 337 of 466
Class B
| | | | | | | | | | | | |
Years Ended December 31,
| | 2004
| | | 2003
| | | 2002a
| |
Selected Per Share Data | | | | | | | | | | | | |
Net asset value, beginning of period | | $ | 12.66 | | | $ | 9.63 | | | $ | 10.74 | |
| | |
|
|
| |
|
|
| |
|
|
|
Income (loss) from investment operations: | | | | | | | | | | | | |
Net investment income (loss)b | | | .10 | | | | .05 | | | | .08 | |
Net realized and unrealized gain (loss) on investment transactions | | | 1.26 | | | | 3.04 | | | | (1.19 | ) |
| | |
|
|
| |
|
|
| |
|
|
|
Total from investment operations | | | 1.36 | | | | 3.09 | | | | (1.11 | ) |
| | |
|
|
| |
|
|
| |
|
|
|
Less distributions from: | | | | | | | | | | | | |
Net investment income | | | (.05 | ) | | | (.06 | ) | | | — | |
| | |
|
|
| |
|
|
| |
|
|
|
Net asset value, end of period | | $ | 13.97 | | | $ | 12.66 | | | $ | 9.63 | |
| | |
|
|
| |
|
|
| |
|
|
|
Total Return (%) | | | 10.82 | | | | 32.39c | | | | (10.34 | )** |
| | |
|
|
| |
|
|
| |
|
|
|
Ratios to Average Net Assets and Supplemental Data | | | | | | | | | | | | |
Net assets, end of period ($ millions) | | | 11 | | | | 6 | | | | .4 | |
Ratio of expenses before expense reductions (%) | | | 1.19 | | | | 1.25 | | | | 1.06 | * |
Ratio of expenses after expense reductions (%) | | | 1.19 | | | | 1.24 | | | | 1.06 | * |
Ratio of net investment income (loss) (%) | | | .76 | | | | .56 | | | | 1.64 | * |
Portfolio turnover rate (%) | | | 68 | | | | 82 | | | | 109 | |
| a | For the period July 1, 2002 (commencement of operations of Class B shares) to December 31, 2002. |
| b | Based on average shares outstanding during the period. |
| c | Total returns would have been lower had certain expenses not been reduced. |
Performance Summary December 31, 2004
SVS Index 500 Portfolio
All performance shown is historical, assumes reinvestment of all dividends and capital gains, and does not guarantee future results. Investment return and principal value fluctuate with changing market conditions so that, when redeemed, shares may be worth more or less then their original cost. Current performance may be lower or higher than the performance data quoted. Please visit scudder.com for the product’s most recent month-end performance. Performance doesn’t reflect charges and fees (“contract charges”) associated with the separate account that invests in the Portfolio or any variable life insurance policy or variable annuity contract for which the Portfolio is an investment option. These charges and fees will reduce returns.
This Portfolio is subject to stock market risk, meaning stocks in the Portfolio may decline in value for extended periods of time due to the activities and financial prospects of individual companies, or due to general market and economic conditions. Additionally, derivatives may be more volatile and less liquid than traditional securities and the Portfolio could suffer losses on its derivatives positions. Please read this Portfolio’s prospectus for specific details regarding its investments and risk profile.
Growth of an Assumed $10,000 Investment in SVS Index 500 Portfolio from 9/1/1999 to 12/31/2004
| | |
¨ SVS Index 500 Portfolio — Class A ¨ S&P 500 Index | | |
| |
| | The Standard & Poor’s (S&P) 500 Index is a capitalization-weighted index of 500 stocks. The index is designed to measure performance of the broad domestic economy through changes in the aggregate market value of 500 stocks representing all major industries. Index returns assume reinvested dividends and, unlike Portfolio returns, do not reflect any fees or expenses. It is not possible to invest directly into an index. |
Yearly periods ended December 31 | | |
Page 338 of 466
| | | | | | | | | | | | | | | | | | |
| Comparative Results | | | | | | | | | | | | | | | | | | |
| | | | | |
SVS Index 500 Portfolio
| | | | 1-Year
| | | 3-Year
| | | 5-Year
| | | Life of Portfolio*
| |
Class A | | Growth of $10,000 | | $ | 11,038 | | | $ | 10,966 | | | $ | 8,687 | | | $ | 9,517 | |
| | | Average annual total return | | | 10.38 | % | | | 3.12 | % | | | -2.78 | % | | | -.92 | % |
S&P 500 Index | | Growth of $10,000 | | $ | 11,088 | | | $ | 11,115 | | | $ | 8,902 | | | $ | 9,947 | |
| | | Average annual total return | | | 10.88 | % | | | 3.59 | % | | | -2.30 | % | | | -.10 | % |
| | | | | |
SVS Index 500 Portfolio
| | | | | | | | | | 1-Year
| | | Life of Class**
| |
Class B | | Growth of $10,000 | | | | | | | | | | $ | 10,998 | | | $ | 12,824 | |
| | | Average annual total return | | | | | | | | | | | 9.98 | % | | | 10.45 | % |
S&P 500 Index | | Growth of $10,000 | | | | | | | | | | $ | 11,088 | | | $ | 12,800 | |
| | | Average annual total return | | | | | | | | | | | 10.88 | % | | | 10.38 | % |
The growth of $10,000 is cumulative.
| * | The Portfolio commenced operations on September 1, 1999. Index returns begin August 31, 1999. Total returns would have been lower for the 3-Year and Life of Portfolio periods for Class A shares if the Portfolio’s expenses were not maintained. |
| ** | The Portfolio commenced offering Class B shares on July 1, 2002. Index returns begin June 30, 2002. |
Information About Your Portfolio’s Expenses
SVS Index 500 Portfolio
As an investor of the Portfolio, you incur two types of costs: ongoing expenses and transaction costs. Ongoing expenses include management fees, distribution and service (12b-1) fees and other Portfolio expenses. Examples of transaction costs include sales charges (loads), redemption fees and account maintenance fees, which are not shown in this section. The following tables are intended to help you understand your ongoing expenses (in dollars) of investing in the Portfolio and to help you compare these expenses with the ongoing expenses of investing in other mutual funds. In the most recent six-month period, Class B shares of the Portfolio limited these expenses; had it not done so, expenses would have been higher. The tables are based on an investment of $1,000 made at the beginning of the six-month period ended December 31, 2004.
The tables illustrate your Portfolio’s expenses in two ways:
Actual Portfolio Return. This helps you estimate the actual dollar amount of ongoing expenses (but not transaction costs) paid on a $1,000 investment in the Portfolio using the Portfolio’s actual return during the period. To estimate the expenses you paid over the period, simply divide your account value by $1,000 (for example, an $8,600 account value divided by $1,000 = 8.6), then multiply the result by the number in the “Expenses Paid per $1,000” line under the share class you hold.
Hypothetical 5% Portfolio Return. This helps you to compare your Portfolio’s ongoing expenses (but not transaction costs) with those of other mutual funds using the Portfolio’s actual expense ratio and a hypothetical rate of return of 5% per year before expenses. Examples using a 5% hypothetical Portfolio return may be found in the shareholder reports of other mutual funds. The hypothetical account values and expenses may not be used to estimate the actual ending account balance or expenses you paid for the period.
Page 339 of 466
Please note that the expenses shown in these tables are meant to highlight your ongoing expenses only and do not reflect any transaction costs. The “Expenses Paid per $1,000” line of the tables is useful in comparing ongoing expenses only and will not help you determine the relative total expense of owning different funds. If these transaction costs had been included, your costs would have been higher.
Expenses and Value of a $1,000 Investment for the six months ended December 31, 2004
| | | | | | |
Actual Portfolio Return
| | Class A
| | Class B
|
Beginning Account Value 7/1/04 | | $ | 1,000.00 | | $ | 1,000.00 |
Ending Account Value 12/31/04 | | $ | 1,070.40 | | $ | 1,068.20 |
Expenses Paid per $1,000* | | $ | 1.91 | | $ | 3.73 |
| | |
Hypothetical 5% Portfolio Return
| | Class A
| | Class B
|
Beginning Account Value 7/1/04 | | $ | 1,000.00 | | $ | 1,000.00 |
Ending Account Value 12/31/04 | | $ | 1,023.29 | | $ | 1,021.53 |
Expenses Paid per $1,000* | | $ | 1.87 | | $ | 3.65 |
| * | Expenses are equal to the Portfolio’s annualized expense ratio for each share class, multiplied by the average account value over the period, multiplied by the number of days in the most recent six-month period, then divided by 365. |
| | | | | | |
Annualized Expense Ratios
| | Class A
| | | Class B
| |
Scudder Variable Series II — SVS Index 500 Portfolio | | .37 | % | | .72 | % |
For more information, please refer to the Portfolio’s prospectus.
Management Summary December 31, 2004
SVS Index 500 Portfolio
For the 12-month period ended December 31, 2004, the portfolio produced a total return of 10.38% (Class A shares, unadjusted for contract charges). The Standard & Poor’s 500 (S&P 500) index concluded 2004 with a 10.88% return, which included a strong fourth quarter finish of 9.23%. Value stocks outpaced growth stocks both during the fourth quarter and year. During the quarter, the S&P 500 Barra Value index rose 9.93% versus 8.51% for the S&P 500 Barra Growth index.1 For the year, value stocks (+15.71%) outperformed growth stocks (+6.13%) by 958 basis points. As has been the case throughout the year, returns increased as market capitalization decreased. The small- and mid-cap segments continued their buoyant pace during the quarter with the S&P MidCap 400 up 12.16% and the S&P SmallCap 600 increasing by 13.00%.2 This year, the performance differential across capitalization segments was even more pronounced. The S&P MidCap 400 index increased by 16.48%, while the S&P SmallCap 600 index increased by 22.68%.
The US economy rallied again in the fourth quarter, continuing the 13-quarter economic expansion. Stock prices, which hit a low in October 2002, have recovered over the past nine quarters. Economic growth, changing from a consumption-driven trend to one that is driven by business and business investment, grew slightly above the 3.5 to 4 cent per share trend. At year end, corporate executives remain cautiously optimistic that inflation would remain under control, with core Consumer Price Index (an inflationary indicator that measures the change in the cost of a fixed basket of products and services) running at about 2.3%, and that the Federal Reserve Board would continue its measured pace of rate increases. The dollar, on a trade-weighted basis, is probably going to continue to decline, but the
Page 340 of 466
willingness of overseas investors to own our assets is still high. Our returns on capital and profitability remain superior to what’s happening in Europe and Japan.
All S&P 500 index sectors generated positive results for the year with the energy sector increasing the sharpest at 31.54%. Other strong-performing sectors for the year included utilities, telecomm services and industrials, which advanced by 24.28%, 19.85% and 18.03%, respectively. Information technology and health care dampened the index’s return advancing by only 2.54% and 1.67% for the year.
The Portfolio Management Team
Northern Trust Investments, N.A., Subadvisor to the Portfolio
All performance shown is historical, assumes reinvestment of all dividends and capital gains, and does not guarantee future results. Investment return and principal value fluctuate with changing market conditions so that, when redeemed, shares may be worth more or less then their original cost. Current performance may be lower or higher than the performance data quoted. Please visit scudder.com for the product’s most recent month-end performance. Performance doesn’t reflect charges and fees (“contract charges”) associated with the separate account that invests in the portfolio or any variable life insurance policy or variable annuity contract for which the portfolio is an investment option. These charges and fees will reduce returns.
Risk Considerations
The portfolio may not be able to mirror the S&P 500 index closely enough to track its performance for several reasons, including the portfolio’s cost to buy and sell securities, as well as the flow of money into and out of the portfolio. This portfolio is subject to stock market risk, meaning stocks in the portfolio may decline in value for extended periods of time due to the activities and financial prospects of individual companies, or due to general market and economic conditions. Additionally, derivatives may be more volatile and less liquid than traditional securities and the portfolio could suffer losses on its derivatives positions. Please read this portfolio’s prospectus for specific details regarding its investments and risk profile.
The Standard & Poor’s (S&P) 500 index is a capitalization-weighted index of 500 stocks. The index is designed to measure performance of the broad domestic economy through changes in the aggregate market value of 500 stocks representing all major industries. Index returns assume reinvestment of all distributions and do not reflect fees or expenses. It is not possible to invest directly into an index.
| 1 | S&P 500 Barra Value index is an unmanaged, capitalization-weighted index of all the stock in the S&P 500 index that have low price-to-book ratios. The S&P 500 Barra Growth index is an unmanaged, capitalization-weighted index of all the stocks in the S&P 500 index that have high price-to-book ratios. |
| 2 | S&P MidCap 400 index is an unmanaged index that tracks the stock movement of 400 mid-sized US companies. |
S&P SmallCap 600 index is an unmanaged index that tracks the stock movement of 600 small-cap US companies.
Portfolio management market commentary is as of December 31, 2004, and may not come to pass. This information is subject to change at any time based on market and other conditions.
Portfolio Summary
SVS Index 500 Portfolio
| | | | | | |
Asset Allocation (Excludes Securities Lending Collateral)
| | 12/31/04
| | | 12/31/03
| |
Common Stocks | | 99 | % | | 98 | % |
Cash Equivalents | | 1 | % | | 2 | % |
| | |
|
| |
|
|
| | | 100 | % | | 100 | % |
| | |
|
| |
|
|
Page 341 of 466
| | | | | | |
Sector Diversification (Excludes Cash Equivalents and Securities Lending Collateral)
| | 12/31/04
| | | 12/31/03
| |
Financials | | 21 | % | | 21 | % |
Information Technology | | 16 | % | | 18 | % |
Health Care | | 13 | % | | 13 | % |
Consumer Discretionary | | 12 | % | | 11 | % |
Industrials | | 12 | % | | 11 | % |
Consumer Staples | | 10 | % | | 11 | % |
Energy | | 7 | % | | 6 | % |
Telecommunication Services | | 3 | % | | 3 | % |
Materials | | 3 | % | | 3 | % |
Utilities | | 3 | % | | 3 | % |
| | |
|
| |
|
|
| | | 100 | % | | 100 | % |
| | |
|
| |
|
|
Asset allocation and sector diversification are subject to change.
For more complete details about the Portfolio’s investment portfolio, see page 18. A quarterly Fact Sheet is available upon request. Information concerning portfolio holdings of the Portfolio as of month end will be posted to scudder.com on the 15th of the following month.
Following the Portfolio’s fiscal first and third quarter-end, a complete portfolio holdings listing is filed with the SEC on Form N-Q. The form will be available on the SEC’s Web site at www.sec.gov, and it also may be reviewed and copied at the SEC’s Public Reference Room in Washington, D.C. Information on the operation of the SEC’s Public Reference Room may be obtained by calling (800) SEC-0330.
Investment Portfolio December 31, 2004
SVS Index 500 Portfolio
| | | | |
| | | Shares
| | Value ($)
|
Common Stocks 98.4% | | | | |
Consumer Discretionary 11.7% | | | | |
Auto Components 0.2% | | | | |
Cooper Tire & Rubber Co. | | 2,449 | | 52,776 |
Dana Corp. | | 5,357 | | 92,837 |
Delphi Corp. | | 18,383 | | 165,815 |
Goodyear Tire & Rubber Co.* | | 6,957 | | 101,989 |
Johnson Controls, Inc. | | 6,906 | | 438,117 |
Visteon Corp. | | 3,894 | | 38,044 |
| | | | |
|
| | | | | 889,578 |
| | | | |
|
Automobiles 0.6% | | | | |
Ford Motor Co. | | 64,203 | | 939,932 |
General Motors Corp. | | 19,491 | | 780,810 |
Harley-Davidson, Inc. | | 10,535 | | 640,001 |
| | | | |
|
| | | | | 2,360,743 |
| | | | |
|
Page 342 of 466
| | | | |
Distributors 0.1% | | | | |
Genuine Parts Co. | | 5,509 | | 242,727 |
| | | | |
|
Hotels Restaurants & Leisure 1.5% | | | | |
Carnival Corp. | | 22,491 | | 1,296,156 |
Darden Restaurants, Inc. | | 5,275 | | 146,328 |
Harrah’s Entertainment, Inc. | | 4,319 | | 288,898 |
Hilton Hotels Corp. | | 13,040 | | 296,530 |
International Game Technology | | 11,497 | | 395,267 |
Marriott International, Inc. “A” | | 7,817 | | 492,315 |
McDonald’s Corp. | | 44,906 | | 1,439,686 |
Starbucks Corp.* | | 14,333 | | 893,806 |
Starwood Hotels & Resorts Worldwide, Inc. | | 6,846 | | 399,806 |
Wendy’s International, Inc. | | 3,611 | | 141,768 |
YUM! Brands, Inc. | | 9,849 | | 464,676 |
| | | | |
|
| | | | | 6,255,236 |
| | | | |
|
Household Durables 0.5% | | | | |
Black & Decker Corp. | | 2,694 | | 237,961 |
Centex Corp. | | 4,056 | | 241,656 |
Fortune Brands, Inc. | | 5,187 | | 400,333 |
KB Home | | 1,769 | | 184,684 |
Leggett & Platt, Inc. | | 6,357 | | 180,729 |
Maytag Corp. | | 3,229 | | 68,132 |
Newell Rubbermaid, Inc. | | 9,046 | | 218,823 |
Pulte Homes, Inc. | | 4,196 | | 267,705 |
Snap-On, Inc. | | 1,893 | | 65,043 |
The Stanley Works | | 2,719 | | 133,204 |
Whirlpool Corp. | | 2,314 | | 160,152 |
| | | | |
|
| | | | | 2,158,422 |
| | | | |
|
Internet & Catalog Retail 0.7% | | | | |
eBay, Inc.* | | 23,235 | | 2,701,766 |
| | | | |
|
Leisure Equipment & Products 0.2% | | | | |
Brunswick Corp. | | 3,575 | | 176,962 |
Eastman Kodak Co. | | 10,459 | | 337,303 |
Hasbro, Inc. | | 5,527 | | 107,113 |
Mattel, Inc. | | 14,553 | | 283,638 |
| | | | |
|
| | | | | 905,016 |
| | | | |
|
Media 3.9% | | | | |
Clear Channel Communications, Inc. | | 20,659 | | 691,870 |
Comcast Corp. “A”* | | 77,777 | | 2,588,419 |
| | |
| | | Shares
| | Value ($)
|
Dow Jones & Co., Inc. | | 2,720 | | 117,123 |
Gannett Co., Inc. | | 8,946 | | 730,888 |
Interpublic Group of Companies, Inc.* | | 13,697 | | 183,540 |
Knight-Ridder, Inc. | | 3,034 | | 203,096 |
McGraw-Hill Companies, Inc. | | 6,869 | | 628,788 |
Meredith Corp. | | 1,700 | | 92,140 |
New York Times Co. “A” | | 4,882 | | 199,186 |
News Corp. “A” | | 91,400 | | 1,705,524 |
Omnicom Group, Inc. | | 6,782 | | 571,858 |
Time Warner, Inc.* | | 159,460 | | 3,099,902 |
Tribune Co. | | 10,806 | | 455,365 |
Univision Communications, Inc. “A”* | | 11,205 | | 327,970 |
Viacom, Inc. “B” | | 59,709 | | 2,172,810 |
Walt Disney Co. | | 70,937 | | 1,972,049 |
| | | | |
|
| | | | | 15,740,528 |
| | | | |
|
Page 343 of 466
| | | | |
Multiline Retail 1.1% | | | | |
Big Lots, Inc.* | | 3,692 | | 44,784 |
Dillard’s, Inc. “A” | | 3,351 | | 90,041 |
Dollar General Corp. | | 12,247 | | 254,370 |
Family Dollar Stores, Inc. | | 5,679 | | 177,355 |
Federated Department Stores, Inc. | | 6,209 | | 358,818 |
J.C. Penny Co., Inc. | | 9,683 | | 400,876 |
Kohl’s Corp.* | | 11,781 | | 579,272 |
May Department Stores Co. | | 10,737 | | 315,668 |
Nordstrom, Inc. | | 4,524 | | 211,407 |
Sears, Roebuck & Co. | | 7,001 | | 357,261 |
Target Corp. | | 31,811 | | 1,651,945 |
| | | | |
|
| | | | | 4,441,797 |
| | | | |
|
Specialty Retail 2.4% | | | | |
AutoNation, Inc.* | | 8,500 | | 163,285 |
AutoZone, Inc.* | | 2,742 | | 250,372 |
Bed Bath & Beyond, Inc.* | | 10,776 | | 429,208 |
Best Buy Co., Inc. | | 10,997 | | 653,442 |
Circuit City Stores, Inc. | | 7,630 | | 119,333 |
Home Depot, Inc. | | 76,433 | | 3,266,746 |
Limited Brands | | 14,021 | | 322,763 |
Lowe’s Companies, Inc. | | 27,536 | | 1,585,798 |
Office Depot, Inc.* | | 9,903 | | 171,916 |
OfficeMax, Inc. | | 3,441 | | 107,979 |
RadioShack Corp. | | 5,270 | | 173,278 |
Sherwin-Williams Co. | | 4,770 | | 212,885 |
Staples, Inc. | | 18,026 | | 607,657 |
The Gap, Inc. | | 30,825 | | 651,024 |
Tiffany & Co. | | 4,600 | | 147,062 |
TJX Companies, Inc. | | 17,493 | | 439,599 |
Toys “R” Us, Inc.* | | 8,117 | | 166,155 |
| | | | |
|
| | | | | 9,468,502 |
| | | | |
|
Textiles, Apparel & Luxury Goods 0.5% | | | | |
Coach, Inc.* | | 6,500 | | 366,600 |
Jones Apparel Group, Inc. | | 4,166 | | 152,351 |
Liz Claiborne, Inc. | | 3,766 | | 158,963 |
NIKE, Inc. “B” | | 9,063 | | 821,923 |
Reebok International Ltd. | | 2,518 | | 110,792 |
VF Corp. | | 4,121 | | 228,221 |
| | | | |
|
| | | | | 1,838,850 |
| | | | |
|
Page 344 of 466
| | | | |
| | | Shares
| | Value ($)
|
Consumer Staples 10.3% | | | | |
Beverages 2.2% | | | | |
Adolph Coors Co. “B” | | 1,535 | | 116,153 |
Anheuser-Busch Companies, Inc. | | 28,190 | | 1,430,079 |
Brown-Forman Corp. “B” | | 3,780 | | 184,010 |
Coca-Cola Co. | | 84,204 | | 3,505,413 |
Coca-Cola Enterprises, Inc. | | 16,834 | | 350,989 |
Pepsi Bottling Group, Inc. | | 9,100 | | 246,064 |
PepsiCo, Inc. | | 59,478 | | 3,104,752 |
| | | | |
|
| | | | | 8,937,460 |
| | | | |
|
Food & Staples Retailing 3.1% | | | | |
Albertsons, Inc. | | 12,891 | | 307,837 |
Costco Wholesale Corp. | | 16,694 | | 808,157 |
CVS Corp. | | 14,096 | | 635,307 |
Kroger Co.* | | 26,149 | | 458,653 |
Safeway, Inc.* | | 14,637 | | 288,934 |
SUPERVALU, Inc. | | 4,270 | | 147,400 |
Sysco Corp. | | 22,826 | | 871,268 |
Wal-Mart Stores, Inc. | | 147,874 | | 7,810,705 |
Walgreen Co. | | 35,891 | | 1,377,138 |
| | | | |
|
| | | | | 12,705,399 |
| | | | |
|
Food Products 1.3% | | | | |
Archer-Daniels-Midland Co. | | 23,716 | | 529,104 |
Campbell Soup Co. | | 13,499 | | 403,485 |
ConAgra Foods, Inc. | | 17,361 | | 511,282 |
General Mills, Inc. | | 13,616 | | 676,851 |
H.J. Heinz Co. | | 12,190 | | 475,288 |
Hershey Foods Corp. | | 8,478 | | 470,868 |
Kellogg Co. | | 15,093 | | 674,054 |
McCormick & Co, Inc. | | 4,500 | | 173,700 |
Sara Lee Corp. | | 28,428 | | 686,252 |
William Wrigley Jr. Co. | | 7,470 | | 516,849 |
| | | | |
|
| | | | | 5,117,733 |
| | | | |
|
Household Products 1.8% | | | | |
Clorox Co. | | 5,230 | | 308,204 |
Colgate-Palmolive Co. | | 18,820 | | 962,831 |
Kimberly-Clark Corp. | | 17,669 | | 1,162,797 |
Procter & Gamble Co. | | 88,342 | | 4,865,877 |
| | | | |
|
| | | | | 7,299,709 |
| | | | |
|
Page 345 of 466
| | | | |
Personal Products 0.6% | | | | |
Alberto-Culver Co. “B” | | 3,050 | | 148,139 |
Avon Products, Inc. | | 15,982 | | 618,503 |
Gillette Co. | | 35,192 | | 1,575,898 |
| | | | |
|
| | | | | 2,342,540 |
| | | | |
|
Tobacco 1.3% | | | | |
Altria Group, Inc. | | 71,547 | | 4,371,522 |
Reynolds American, Inc. | | 5,245 | | 412,257 |
UST, Inc. | | 6,211 | | 298,811 |
| | | | |
|
| | | | | 5,082,590 |
| | | | |
|
Energy 7.0% | | | | |
Energy Equipment & Services 0.9% | | | | |
Baker Hughes, Inc. | | 12,449 | | 531,199 |
BJ Services Co. | | 6,069 | | 282,451 |
Halliburton Co. | | 15,007 | | 588,875 |
Nabors Industries Ltd.* | | 4,998 | | 256,347 |
Noble Corp.* | | 4,440 | | 220,846 |
Rowan Companies, Inc.* | | 4,409 | | 114,193 |
| | |
| | | Shares
| | Value ($)
|
Schlumberger Ltd. | | 20,544 | | 1,375,421 |
Transocean, Inc.* | | 11,124 | | 471,546 |
| | | | |
|
| | | | | 3,840,878 |
| | | | |
|
Oil & Gas 6.1% | | | | |
Amerada Hess Corp. | | 2,950 | | 243,021 |
Anadarko Petroleum Corp. | | 8,327 | | 539,673 |
Apache Corp. | | 10,997 | | 556,118 |
Ashland, Inc. | | 2,315 | | 135,150 |
Burlington Resources, Inc. | | 14,196 | | 617,526 |
ChevronTexaco Corp. | | 73,802 | | 3,875,343 |
ConocoPhillips | | 24,347 | | 2,114,050 |
Devon Energy Corp. | | 17,572 | | 683,902 |
El Paso Corp. | | 21,441 | | 222,987 |
EOG Resources, Inc. | | 3,939 | | 281,087 |
ExxonMobil Corp. | | 225,486 | | 11,558,412 |
Kerr-McGee Corp. | | 4,970 | | 287,216 |
Kinder Morgan, Inc. | | 4,064 | | 297,200 |
Marathon Oil Corp. | | 12,523 | | 470,990 |
Occidental Petroleum Corp. | | 14,311 | | 835,190 |
Sunoco, Inc. | | 2,808 | | 229,442 |
Unocal Corp. | | 9,808 | | 424,098 |
Valero Energy Corp. | | 8,600 | | 390,440 |
Williams Companies, Inc. | | 20,143 | | 328,130 |
XTO Energy, Inc. | | 9,100 | | 321,958 |
| | | | |
|
| | | | | 24,411,933 |
| | | | |
|
Page 346 of 466
| | | | |
Financials 20.3% | | | | |
Banks 6.4% | | | | |
AmSouth Bancorp. | | 11,645 | | 301,605 |
Bank of America Corp. | | 140,908 | | 6,621,267 |
BB&T Corp. | | 18,759 | | 788,816 |
Comerica, Inc. | | 6,346 | | 387,233 |
Compass Bancshares, Inc. | | 3,700 | | 180,079 |
Fifth Third Bancorp. | | 20,291 | | 959,358 |
First Horizon National Corp. | | 4,143 | | 178,605 |
Golden West Financial Corp. | | 10,906 | | 669,847 |
Huntington Bancshares, Inc. | | 9,010 | | 223,268 |
KeyCorp. | | 14,818 | | 502,330 |
M&T Bank Corp. | | 3,897 | | 420,252 |
Marshall & Ilsley Corp. | | 7,300 | | 322,660 |
National City Corp. | | 24,503 | | 920,088 |
North Fork Bancorp., Inc. | | 16,200 | | 467,370 |
PNC Financial Services Group | | 10,280 | | 590,483 |
Regions Financial Corp. | | 15,287 | | 544,064 |
Sovereign Bancorp, Inc. | | 10,967 | | 247,306 |
SunTrust Banks, Inc. | | 13,349 | | 986,224 |
Synovus Financial Corp. | | 10,082 | | 288,144 |
US Bancorp. | | 66,411 | | 2,079,992 |
Wachovia Corp. | | 56,560 | | 2,975,056 |
Washington Mutual, Inc. | | 30,177 | | 1,275,884 |
Wells Fargo & Co. | | 58,813 | | 3,655,228 |
Zions Bancorp. | | 3,565 | | 242,527 |
| | | | |
|
| | | | | 25,827,686 |
| | | | |
|
Capital Markets 2.8% | | | | |
Bank of New York Co., Inc. | | 28,087 | | 938,668 |
Bear Stearns Companies, Inc. | | 3,400 | | 347,854 |
Charles Schwab Corp. | | 48,497 | | 580,024 |
E*TRADE Financial Corp.* | | 12,000 | | 179,400 |
Federated Investors, Inc. “B” | | 3,500 | | 106,400 |
Franklin Resources, Inc. | | 9,012 | | 627,686 |
| | |
| | | Shares
| | Value ($)
|
Goldman Sachs Group, Inc. | | 16,795 | | 1,747,352 |
Janus Capital Group, Inc. | | 7,856 | | 132,059 |
Lehman Brothers Holdings, Inc. | | 9,383 | | 820,825 |
Mellon Financial Corp. | | 15,773 | | 490,698 |
Merrill Lynch & Co., Inc. | | 32,662 | | 1,952,208 |
Morgan Stanley | | 38,802 | | 2,154,287 |
Northern Trust Corp. | | 7,049 | | 342,440 |
State Street Corp. | | 12,153 | | 596,955 |
T. Rowe Price Group, Inc. | | 4,731 | | 294,268 |
| | | | |
|
| | | | | 11,311,124 |
| | | | |
|
Page 347 of 466
| | | | |
Consumer Finance 1.4% | | | | |
American Express Co. | | 44,623 | | 2,515,399 |
Capital One Financial Corp. | | 8,273 | | 696,669 |
MBNA Corp. | | 45,213 | | 1,274,554 |
Providian Financial Corp.* | | 9,714 | | 159,990 |
SLM Corp. | | 15,425 | | 823,541 |
| | | | |
|
| | | | | 5,470,153 |
| | | | |
|
Diversified Financial Services 5.0% | | | | |
CIT Group, Inc. | | 7,300 | | 334,486 |
Citigroup, Inc. | | 181,277 | | 8,733,926 |
Countrywide Financial Corp. | | 19,948 | | 738,275 |
Fannie Mae | | 33,718 | | 2,401,059 |
Freddie Mac | | 24,487 | | 1,804,692 |
JPMorgan Chase & Co. | | 124,058 | | 4,839,503 |
MGIC Investment Corp. | | 3,177 | | 218,927 |
Moody’s Corp. | | 5,252 | | 456,136 |
Principal Financial Group, Inc. | | 10,200 | | 417,588 |
| | | | |
|
| | | | | 19,944,592 |
| | | | |
|
Insurance 4.2% | | | | |
ACE Ltd. | | 9,500 | | 406,125 |
AFLAC, Inc. | | 17,900 | | 713,136 |
Allstate Corp. | | 24,749 | | 1,280,018 |
Ambac Financial Group, Inc. | | 3,586 | | 294,518 |
American International Group, Inc. | | 90,855 | | 5,966,448 |
Aon Corp. | | 10,283 | | 245,352 |
Chubb Corp. | | 6,864 | | 527,842 |
Cincinnati Financial Corp. | | 5,335 | | 236,127 |
Hartford Financial Services Group, Inc. | | 10,388 | | 719,992 |
Jefferson-Pilot Corp. | | 5,273 | | 273,985 |
Lincoln National Corp. | | 6,146 | | 286,895 |
Loews Corp. | | 6,730 | | 473,119 |
Marsh & McLennan Companies, Inc. | | 18,571 | | 610,986 |
MBIA, Inc. | | 5,264 | | 333,106 |
MetLife, Inc. | | 26,745 | | 1,083,440 |
Progressive Corp. | | 7,026 | | 596,086 |
Prudential Financial, Inc. | | 18,490 | | 1,016,210 |
Safeco Corp. | | 4,843 | | 252,998 |
St. Paul Travelers Companies, Inc. | | 23,271 | | 862,656 |
Torchmark Corp. | | 3,589 | | 205,076 |
UnumProvident Corp. | | 9,316 | | 167,129 |
XL Capital Ltd. “A” | | 4,841 | | 375,904 |
| | | | |
|
| | | | | 16,927,148 |
| | | | |
|
Real Estate 0.5% | | | | |
Apartment Investment & Management Co. “A” (REIT) | | 3,900 | | 150,306 |
Archstone-Smith Trust (REIT) | | 6,100 | | 233,630 |
Equity Office Properties Trust (REIT) | | 15,129 | | 440,556 |
Equity Residential (REIT) | | 9,300 | | 336,474 |
Page 348 of 466
| | | | |
| | | Shares
| | Value ($)
|
Plum Creek Timber Co., Inc. (REIT) | | 5,800 | | 222,952 |
ProLogis (REIT) | | 5,700 | | 246,981 |
Simon Property Group, Inc. (REIT) | | 8,168 | | 528,225 |
| | | | |
|
| | | | | 2,159,124 |
| | | | |
|
Health Care 12.5% | | | | |
Biotechnology 1.3% | | | | |
Amgen, Inc.* | | 44,201 | | 2,835,494 |
Applera Corp. — Applied Biosystems Group | | 6,641 | | 138,864 |
Biogen Idec, Inc.* | | 11,807 | | 786,464 |
Chiron Corp.* | | 6,860 | | 228,644 |
Genzyme Corp.* | | 8,047 | | 467,289 |
Gilead Sciences, Inc.* | | 14,784 | | 517,292 |
MedImmune, Inc.* | | 9,045 | | 245,210 |
| | | | |
|
| | | | | 5,219,257 |
| | | | |
|
Health Care Equipment & Supplies 2.2% | | | | |
Bausch & Lomb, Inc. | | 1,782 | | 114,868 |
Baxter International, Inc. | | 21,651 | | 747,826 |
Becton, Dickinson & Co. | | 9,288 | | 527,558 |
Biomet, Inc. | | 9,153 | | 397,149 |
Boston Scientific Corp.* | | 29,616 | | 1,052,849 |
C.R. Bard, Inc. | | 3,416 | | 218,556 |
Fisher Scientific International, Inc.* | | 4,100 | | 255,758 |
Guidant Corp. | | 10,934 | | 788,341 |
Hospira, Inc.* | | 5,139 | | 172,157 |
Medtronic, Inc. | | 42,320 | | 2,102,034 |
Millipore Corp.* | | 1,631 | | 81,240 |
PerkinElmer, Inc. | | 4,220 | | 94,908 |
St. Jude Medical, Inc.* | | 12,124 | | 508,359 |
Stryker Corp. | | 14,456 | | 697,502 |
Thermo Electron Corp.* | | 6,105 | | 184,310 |
Waters Corp.* | | 3,900 | | 182,481 |
Zimmer Holdings, Inc.* | | 8,644 | | 692,557 |
| | | | |
|
| | | | | 8,818,453 |
| | | | |
|
Health Care Providers & Services 2.2% | | | | |
Aetna, Inc. | | 5,150 | | 642,463 |
AmerisourceBergen Corp. | | 3,744 | | 219,698 |
Cardinal Health, Inc. | | 14,969 | | 870,447 |
Caremark Rx, Inc.* | | 15,843 | | 624,689 |
CIGNA Corp. | | 4,645 | | 378,893 |
Express Scripts, Inc.* | | 2,905 | | 222,058 |
HCA, Inc. | | 14,547 | | 581,298 |
Health Management Associates, Inc. “A” | | 9,079 | | 206,275 |
Humana, Inc.* | | 6,142 | | 182,356 |
IMS Health, Inc. | | 7,716 | | 179,088 |
Laboratory Corp. of America Holdings* | | 4,800 | | 239,136 |
Page 349 of 466
| | | | |
Manor Care, Inc. | | 2,838 | | 100,550 |
McKesson Corp. | | 9,678 | | 304,470 |
Medco Health Solutions, Inc.* | | 9,925 | | 412,880 |
Quest Diagnostics, Inc. | | 3,391 | | 324,010 |
Tenet Healthcare Corp.* | | 15,222 | | 167,138 |
UnitedHealth Group, Inc. | | 22,896 | | 2,015,535 |
WellPoint Health Networks, Inc.* | | 10,328 | | 1,187,720 |
| | | | |
|
| | | | | 8,858,704 |
| | | | |
|
Pharmaceuticals 6.8% | | | | |
Abbott Laboratories | | 54,995 | | 2,565,517 |
Allergan, Inc. | | 4,736 | | 383,948 |
| | |
| | | Shares
| | Value ($)
|
Bristol-Myers Squibb Co. | | 69,041 | | 1,768,830 |
Eli Lilly & Co. (e) | | 39,275 | | 2,228,856 |
Forest Laboratories, Inc.* | | 12,540 | | 562,544 |
Johnson & Johnson | | 103,606 | | 6,570,693 |
King Pharmaceuticals, Inc.* | | 8,965 | | 111,166 |
Merck & Co., Inc. | | 77,275 | | 2,483,618 |
Mylan Laboratories, Inc. (e) | | 9,800 | | 173,264 |
Pfizer, Inc. | | 263,128 | | 7,075,512 |
Schering-Plough Corp. | | 51,983 | | 1,085,405 |
Watson Pharmaceuticals, Inc.* | | 4,059 | | 133,176 |
Wyeth | | 46,568 | | 1,983,331 |
| | | | |
|
| | | | | 27,125,860 |
| | | | |
|
Industrials 11.6% | | | | |
Aerospace & Defense 2.0% | | | | |
Boeing Co. | | 29,760 | | 1,540,675 |
General Dynamics Corp. | | 6,876 | | 719,230 |
Goodrich Corp. | | 3,932 | | 128,340 |
Honeywell International, Inc. | | 30,103 | | 1,065,947 |
L-3 Communications Holdings, Inc. | | 3,700 | | 270,988 |
Lockheed Martin Corp. | | 15,622 | | 867,802 |
Northrop Grumman Corp. | | 12,818 | | 696,786 |
Raytheon Co. | | 16,426 | | 637,822 |
Rockwell Collins, Inc. | | 5,856 | | 230,961 |
United Technologies Corp. | | 18,219 | | 1,882,934 |
| | | | |
|
| | | | | 8,041,485 |
| | | | |
|
Air Freight & Logistics 1.1% | | | | |
FedEx Corp. | | 10,265 | | 1,011,000 |
Ryder System, Inc. | | 2,652 | | 126,686 |
United Parcel Service, Inc. “B” | | 39,411 | | 3,368,064 |
| | | | |
|
| | | | | 4,505,750 |
| | | | |
|
Airlines 0.1% | | | | |
Delta Air Lines, Inc.* (e) | | 5,870 | | 43,908 |
Southwest Airlines Co. | | 27,247 | | 443,581 |
| | | | |
|
| | | | | 487,489 |
| | | | |
|
Page 350 of 466
| | | | |
Building Products 0.2% | | | | |
American Standard Companies, Inc.* | | 7,289 | | 301,181 |
Masco Corp. | | 16,216 | | 592,371 |
| | | | |
|
| | | | | 893,552 |
| | | | |
|
Commercial Services & Supplies 1.0% | | | | |
Allied Waste Industries, Inc.* | | 11,039 | | 102,442 |
Apollo Group, Inc. “A”* | | 6,611 | | 533,574 |
Avery Dennison Corp. | | 3,615 | | 216,792 |
Cendant Corp. | | 37,581 | | 878,644 |
Cintas Corp. | | 5,764 | | 252,809 |
Equifax, Inc. | | 4,524 | | 127,124 |
H&R Block, Inc. | | 5,778 | | 283,122 |
Monster Worldwide, Inc.* | | 4,533 | | 152,490 |
Pitney Bowes, Inc. | | 7,591 | | 351,311 |
R.R. Donnelley & Sons Co. | | 7,164 | | 252,818 |
Robert Half International, Inc. | | 5,600 | | 164,808 |
Waste Management, Inc. | | 20,485 | | 613,321 |
| | | | |
|
| | | | | 3,929,255 |
| | | | |
|
Construction & Engineering 0.1% | | | | |
Fluor Corp. | | 2,725 | | 148,540 |
| | | | |
|
Electrical Equipment 0.4% | | | | |
American Power Conversion Corp. | | 7,514 | | 160,800 |
Cooper Industries, Ltd. “A” | | 3,051 | | 207,132 |
| | |
| | | Shares
| | Value ($)
|
Emerson Electric Co. | | 14,963 | | 1,048,906 |
Power-One, Inc.* | | 2,782 | | 24,816 |
Rockwell Automation, Inc. | | 6,108 | | 302,651 |
| | | | |
|
| | | | | 1,744,305 |
| | | | |
|
Industrial Conglomerates 4.6% | | | | |
3M Co. | | 26,986 | | 2,214,741 |
General Electric Co. | | 369,601 | | 13,490,436 |
Textron, Inc. | | 4,982 | | 367,672 |
Tyco International Ltd. | | 69,934 | | 2,499,441 |
| | | | |
|
| | | | | 18,572,290 |
| | | | |
|
Machinery 1.5% | | | | |
Caterpillar, Inc. | | 11,950 | | 1,165,244 |
Cummins, Inc. | | 1,702 | | 142,611 |
Danaher Corp. | | 10,646 | | 611,187 |
Deere & Co. | | 8,750 | | 651,000 |
Dover Corp. | | 7,035 | | 295,048 |
Eaton Corp. | | 5,542 | | 401,019 |
Illinois Tool Works, Inc. | | 10,677 | | 989,544 |
Ingersoll-Rand Co. “A” | | 6,335 | | 508,700 |
ITT Industries, Inc. | | 3,473 | | 293,295 |
Page 351 of 466
| | | | |
Navistar International Corp.* | | 2,271 | | 99,879 |
PACCAR, Inc. | | 6,386 | | 513,945 |
Pall Corp. | | 3,953 | | 114,439 |
Parker-Hannifin Corp. | | 4,098 | | 310,383 |
| | | | |
|
| | | | | 6,096,294 |
| | | | |
|
Road & Rail 0.5% | | | | |
Burlington Northern Santa Fe Corp. | | 13,515 | | 639,395 |
CSX Corp. | | 7,001 | | 280,600 |
Norfolk Southern Corp. | | 13,585 | | 491,641 |
Union Pacific Corp. | | 8,957 | | 602,358 |
| | | | |
|
| | | | | 2,013,994 |
| | | | |
|
Trading Companies & Distributors 0.1% | | | | |
W.W. Grainger, Inc. | | 2,974 | | 198,128 |
| | | | |
|
Information Technology 15.8% | | | | |
Communications Equipment 2.7% | | | | |
ADC Telecommunications, Inc.* | | 31,308 | | 83,905 |
Andrew Corp.* | | 6,180 | | 84,233 |
Avaya, Inc.* | | 15,715 | | 270,298 |
CIENA Corp.* | | 22,277 | | 74,405 |
Cisco Systems, Inc.* | | 230,632 | | 4,451,198 |
Comverse Technologies, Inc.* | | 7,308 | | 178,681 |
Corning, Inc.* | | 49,647 | | 584,345 |
JDS Uniphase Corp.* | | 52,034 | | 164,948 |
Lucent Technologies, Inc.* | | 157,488 | | 592,155 |
Motorola, Inc. | | 84,565 | | 1,454,518 |
QUALCOMM, Inc. | | 57,138 | | 2,422,651 |
Scientific-Atlanta, Inc. | | 5,668 | | 187,101 |
Tellabs, Inc.* | | 17,477 | | 150,127 |
| | | | |
|
| | | | | 10,698,565 |
| | | | |
|
Computers & Peripherals 3.9% | | | | |
Apple Computer, Inc.* | | 13,967 | | 899,475 |
Dell, Inc.* | | 87,046 | | 3,668,118 |
EMC Corp.* | | 85,224 | | 1,267,281 |
Gateway, Inc.* | | 11,777 | | 70,780 |
Hewlett-Packard Co. | | 106,253 | | 2,228,125 |
International Business Machines Corp. | | 58,035 | | 5,721,090 |
Lexmark International, Inc. “A”* | | 4,536 | | 385,560 |
| | |
| | | Shares
| | Value ($)
|
NCR Corp.* | | 3,094 | | 214,198 |
Network Appliance, Inc.* | | 12,814 | | 425,681 |
QLogic Corp.* | | 3,509 | | 128,886 |
Sun Microsystems, Inc.* | | 119,166 | | 641,113 |
| | | | |
|
| | | | | 15,650,307 |
| | | | |
|
Electronic Equipment & Instruments 0.3% | | | | |
Agilent Technologies, Inc.* | | 17,471 | | 421,051 |
Page 352 of 466
| | | | |
Jabil Circuit, Inc.* | | 6,581 | | 168,342 |
Molex, Inc. | | 6,191 | | 185,730 |
Sanmina-SCI Corp.* | | 19,217 | | 162,768 |
Solectron Corp.* | | 31,507 | | 167,932 |
Symbol Technologies, Inc. | | 7,650 | | 132,345 |
Tektronix, Inc. | | 2,824 | | 85,313 |
| | | | |
|
| | | | | 1,323,481 |
| | | | |
|
Internet Software & Services 0.5% | | | | |
Yahoo!, Inc.* | | 48,444 | | 1,825,370 |
| | | | |
|
IT Consulting & Services 1.1% | | | | |
Affiliated Computer Services, Inc. “A”* | | 4,500 | | 270,855 |
Automatic Data Processing, Inc. | | 20,908 | | 927,270 |
Computer Sciences Corp.* | | 6,523 | | 367,701 |
Convergys Corp.* | | 4,747 | | 71,158 |
Electronic Data Systems Corp. | | 17,253 | | 398,544 |
First Data Corp. | | 29,635 | | 1,260,673 |
Fiserv, Inc.* | | 7,141 | | 286,997 |
Paychex, Inc. | | 13,451 | | 458,410 |
Sabre Holdings Corp. | | 4,362 | | 96,662 |
SunGard Data Systems, Inc.* | | 9,499 | | 269,107 |
Unisys Corp.* | | 10,880 | | 110,758 |
| | | | |
|
| | | | | 4,518,135 |
| | | | |
|
Office Electronics 0.1% | | | | |
Xerox Corp.* | | 34,217 | | 582,031 |
| | | | |
|
Semiconductors & Semiconductor Equipment 3.0% | | | | |
Advanced Micro Devices, Inc.* | | 13,913 | | 306,364 |
Altera Corp.* | | 13,465 | | 278,726 |
Analog Devices, Inc. | | 12,662 | | 467,481 |
Applied Materials, Inc.* | | 58,625 | | 1,002,488 |
Applied Micro Circuits Corp.* | | 12,600 | | 53,046 |
Broadcom Corp. “A”* | | 11,277 | | 364,022 |
Freescale Semiconductor, Inc.* | | 13,837 | | 254,047 |
Intel Corp. | | 221,945 | | 5,191,294 |
KLA-Tencor Corp.* | | 7,086 | | 330,066 |
Linear Technology Corp. | | 11,041 | | 427,949 |
LSI Logic Corp.* | | 12,513 | | 68,571 |
Maxim Integrated Products, Inc. | | 11,147 | | 472,521 |
Micron Technology, Inc.* | | 20,014 | | 247,173 |
National Semiconductor Corp.* | | 12,434 | | 223,190 |
Novellus Systems, Inc.* | | 5,532 | | 154,288 |
NVIDIA Corp.* | | 6,307 | | 148,593 |
PMC-Sierra, Inc.* | | 6,855 | | 77,119 |
Teradyne, Inc.* | | 7,305 | | 124,696 |
Texas Instruments, Inc. | | 59,957 | | 1,476,141 |
Xilinx, Inc. | | 11,811 | | 350,196 |
| | | | |
|
| | | | | 12,017,971 |
| | | | |
|
Page 353 of 466
| | | | |
Software 4.2% | | | | |
Adobe Systems, Inc. | | 8,538 | | 535,674 |
Autodesk, Inc. | | 8,248 | | 313,012 |
BMC Software, Inc.* | | 7,308 | | 135,929 |
Citrix Systems, Inc.* | | 6,498 | | 159,396 |
| | |
| | | Shares
| | Value ($)
|
Computer Associates International, Inc. | | 20,052 | | 622,815 |
Compuware Corp.* | | 12,246 | | 79,232 |
Electronic Arts, Inc.* | | 10,746 | | 662,813 |
Intuit, Inc.* | | 6,937 | | 305,297 |
Mercury Interactive Corp.* | | 3,183 | | 144,986 |
Microsoft Corp. | | 380,162 | | 10,154,127 |
Novell, Inc.* | | 14,416 | | 97,308 |
Oracle Corp.* | | 178,469 | | 2,448,595 |
Parametric Technology Corp.* | | 7,591 | | 44,711 |
Siebel Systems, Inc.* | | 17,915 | | 188,107 |
Symantec Corp.* | | 21,574 | | 555,746 |
VERITAS Software Corp.* | | 14,686 | | 419,285 |
| | | | |
|
| | | | | 16,867,033 |
| | | | |
|
Materials 3.1% | | | | |
Chemicals 1.7% | | | | |
Air Products & Chemicals, Inc. | | 8,264 | | 479,064 |
Dow Chemical Co. | | 33,595 | | 1,663,289 |
E.I. du Pont de Nemours & Co. | | 35,350 | | 1,733,918 |
Eastman Chemical Co. | | 2,537 | | 146,461 |
Ecolab, Inc. | | 8,486 | | 298,113 |
Engelhard Corp. | | 4,300 | | 131,881 |
Great Lakes Chemical Corp. | | 1,700 | | 48,433 |
Hercules, Inc.* | | 3,707 | | 55,049 |
International Flavors & Fragrances, Inc. | | 3,111 | | 133,275 |
Monsanto Co. | | 9,558 | | 530,947 |
PPG Industries, Inc. | | 6,205 | | 422,933 |
Praxair, Inc. | | 11,263 | | 497,261 |
Rohm & Haas Co. | | 7,252 | | 320,756 |
Sigma-Aldrich Corp. | | 2,820 | | 170,497 |
| | | | |
|
| | | | | 6,631,877 |
| | | | |
|
Construction Materials 0.0% | | | | |
Vulcan Materials Co. | | 3,410 | | 186,220 |
| | | | |
|
Containers & Packaging 0.2% | | | | |
Ball Corp. | | 3,800 | | 167,124 |
Bemis Co., Inc. | | 3,512 | | 102,164 |
Pactiv Corp.* | | 4,998 | | 126,399 |
Sealed Air Corp.* | | 2,695 | | 143,563 |
Temple-Inland, Inc. | | 1,768 | | 120,931 |
| | | | |
|
| | | | | 660,181 |
| | | | |
|
Page 354 of 466
| | | | |
Metals & Mining 0.7% | | | | |
Alcoa, Inc. | | 30,467 | | 957,273 |
Allegheny Technologies, Inc. | | 3,667 | | 79,464 |
Freeport-McMoRan Copper & Gold, Inc. “B” | | 6,109 | | 233,547 |
Newmont Mining Corp. | | 16,011 | | 711,048 |
Nucor Corp. | | 5,502 | | 287,975 |
Phelps Dodge Corp. | | 3,377 | | 334,053 |
United States Steel Corp. | | 3,959 | | 202,899 |
| | | | |
|
| | | | | 2,806,259 |
| | | | |
|
Paper & Forest Products 0.5% | | | | |
Georgia-Pacific Corp. | | 8,402 | | 314,907 |
International Paper Co. | | 17,090 | | 717,780 |
Louisiana-Pacific Corp. | | 4,297 | | 114,902 |
MeadWestvaco Corp. | | 6,593 | | 223,436 |
Weyerhaeuser Co. | | 8,699 | | 584,747 |
| | | | |
|
| | | | | 1,955,772 |
| | | | |
|
| | |
| | | Shares
| | Value ($)
|
Telecommunication Services 3.2% | | | | |
Diversified Telecommunication Services 2.9% | | | | |
ALLTEL Corp. | | 10,137 | | 595,650 |
AT&T Corp. | | 28,336 | | 540,084 |
BellSouth Corp. | | 64,564 | | 1,794,234 |
CenturyTel, Inc. | | 5,224 | | 185,295 |
Citizens Communications Co. | | 12,500 | | 172,375 |
Qwest Communications International, Inc.* | | 60,085 | | 266,778 |
SBC Communications, Inc. | | 116,106 | | 2,992,052 |
Sprint Corp. | | 52,266 | | 1,298,810 |
Verizon Communications, Inc. | | 96,385 | | 3,904,556 |
| | | | |
|
| | | | | 11,749,834 |
| | | | |
|
Wireless Telecommunication Services 0.3% | | | | |
Nextel Communications, Inc. “A”* | | 38,843 | | 1,165,290 |
| | | | |
|
Utilities 2.9% | | | | |
Electric Utilities 2.0% | | | | |
Allegheny Energy, Inc.* | | 4,410 | | 86,921 |
Ameren Corp. | | 6,269 | | 314,328 |
American Electric Power Co. | | 13,784 | | 473,343 |
CenterPoint Energy, Inc. | | 10,121 | | 114,367 |
Cinergy Corp. | | 5,749 | | 239,331 |
Consolidated Edison, Inc. | | 7,722 | | 337,838 |
DTE Energy Co. | | 5,757 | | 248,299 |
Edison International | | 11,867 | | 380,100 |
Entergy Corp. | | 8,356 | | 564,782 |
Exelon Corp. | | 23,600 | | 1,040,052 |
FirstEnergy Corp. | | 11,970 | | 472,935 |
FPL Group, Inc. | | 6,747 | | 504,338 |
Page 355 of 466
| | | | |
PG&E Corp.* | | 14,726 | | 490,081 |
Pinnacle West Capital Corp. | | 3,008 | | 133,585 |
PPL Corp. | | 6,179 | | 329,217 |
Progress Energy, Inc. | | 7,923 | | 358,437 |
Southern Co. | | 26,317 | | 882,146 |
TECO Energy, Inc. | | 5,400 | | 82,836 |
TXU Corp. | | 8,524 | | 550,309 |
Xcel Energy, Inc. | | 13,087 | | 238,183 |
| | | | |
|
| | | | | 7,841,428 |
| | | | |
|
| | |
| | | Shares
| | Value ($)
|
Gas Utilities 0.1% | | | | |
KeySpan Corp. | | 5,532 | | 218,237 |
Nicor, Inc. | | 1,506 | | 55,632 |
NiSource, Inc. | | 10,100 | | 230,078 |
Peoples Energy Corp. | | 1,128 | | 49,576 |
| | | | |
|
| | | | | 553,523 |
| | | | |
|
Multi-Utilities 0.8% | | | | |
AES Corp.* | | 21,871 | | 298,977 |
Calpine Corp.* | | 20,401 | | 80,380 |
CMS Energy Corp.* | | 6,256 | | 65,375 |
Constellation Energy Group, Inc. | | 5,710 | | 249,584 |
Dominion Resources, Inc. | | 12,045 | | 815,928 |
Duke Energy Corp. | | 34,431 | | 872,137 |
Dynegy, Inc. “A”* | | 12,553 | | 57,995 |
Public Service Enterprise Group, Inc. | | 8,755 | | 453,247 |
Sempra Energy | | 8,687 | | 318,639 |
| | | | |
|
| | | | | 3,212,262 |
| | | | |
|
Total Common Stocks (Cost $342,635,917) | | | | 395,280,129 |
| | | | |
|
US Government Backed 0.2% | | | | |
US Treasury Bill, 2.18%**, 3/24/2005 (c) (Cost $726,442) | | 730,000 | | 726,442 |
| | | | |
|
Securities Lending Collateral 0.2% | | | | |
Daily Assets Fund Institutional, 2.25% (d) (f) (Cost $962,450) | | 962,450 | | 962,450 |
| | | | |
|
Cash Equivalents 1.2% | | | | |
Scudder Cash Management QP Trust, 2.24% (b) (Cost $4,677,217) | | 4,677,217 | | 4,677,217 |
| | | | |
|
| | | | | | |
| | | % of Net Assets
| | | Value ($)
| |
Total Investment Portfolio (Cost $349,002,026) (a) | | 100.0 | | | 401,646,238 | |
| | | | | |
|
|
Other Assets and Liabilities, Net | | (0.0 | ) | | (136,536 | ) |
| | | | | |
|
|
Net Assets | | 100.0 | | | 401,509,702 | |
| | | | | |
|
|
Notes to SVS Index 500 Portfolio of Investments
| * | Non-income producing security. |
Page 356 of 466
| ** | Annualized yield at time of purchase; not a coupon rate. |
| (a) | The cost for federal income tax purposes was $374,533,283. At December 31, 2004, net unrealized appreciation for all securities based on tax cost was $27,112,955. This consisted of aggregate gross unrealized appreciation for all securities in which there was an excess of value over tax cost of $65,853,112 and aggregate gross unrealized depreciation for all securities in which there was an excess of tax cost over value of $38,740,157. |
| (b) | Scudder Cash Management QP Trust is managed by Deutsche Investment Management Americas Inc. The rate shown is the annualized seven-day yield at period end. |
| (c) | At December 31, 2004, this security, in part or in whole, has been segregated to cover initial margin requirements for open futures contracts. |
| (d) | Daily Assets Fund Institutional, an affiliated fund, is managed by Deutsche Asset Management, Inc. The rate shown is the annualized seven-day yield at period end. |
| (e) | All or a portion of these securities were on loan (see Notes to Financial Statements). The value of all securities loaned at December 31, 2004 amounted to $932,230, which is 0.2% of total net assets. |
| (f) | Represents collateral held in connection with securities lending. |
REIT: Real Estate Investment Trust
At December 31, 2004, open futures contracts purchased were as follows:
| | | | | | | | | | |
Futures
| | Expiration
Date
| | Contracts
| | Aggregated
Face
Value ($)
| | Value ($)
| | Net Unrealized
Appreciation
(Depreciation) ($)
|
S&P 500 | | 3/17/2005 | | 21 | | 6,215,901 | | 6,371,925 | | 156,024 |
The accompanying notes are an integral part of the financial statements.
Financial Statements
Statement of Assets and Liabilities as of December 31, 2004
| | | |
Assets | | | |
Investments: | | | |
Investments in securities, at value (cost $343,362,359) — including $932,230 of securities loaned | | $ | 396,006,571 |
Investment in Daily Assets Fund Institutional (cost $962,450)* | | | 962,450 |
Investment in Scudder Cash Management QP Trust (cost $4,677,217) | | | 4,677,217 |
| | |
|
|
Total investments in securities, at value (cost $349,002,026) | | | 401,646,238 |
| | |
|
|
Receivable for investments sold | | | 348,365 |
Dividends receivable | | | 510,329 |
Interest receivable | | | 14,892 |
Receivable for Portfolio shares sold | | | 181,626 |
Other assets | | | 11,965 |
| | |
|
|
Total assets | | | 402,713,415 |
| | |
|
|
Liabilities | | | |
Payable upon return of securities loaned | | | 962,450 |
Payable for Portfolio shares redeemed | | | 24,580 |
Payable for daily variation margin on open futures contracts | | | 16,282 |
Accrued management fee | | | 60,072 |
Page 357 of 466
| | | | |
Other accrued expenses and payables | | | 140,329 | |
| | |
|
|
|
Total liabilities | | | 1,203,713 | |
| | |
|
|
|
Net assets, at value | | $ | 401,509,702 | |
| | |
|
|
|
Net Assets | | | | |
Net assets consist of: | | | | |
Undistributed net investment income | | | 5,567,259 | |
Net unrealized appreciation (depreciation) on: | | | | |
Investments | | | 52,644,212 | |
Futures | | | 156,024 | |
Accumulated net realized gain (loss) | | | (46,088,532 | ) |
Paid-in capital | | | 389,230,739 | |
| | |
|
|
|
Net assets, at value | | $ | 401,509,702 | |
| | |
|
|
|
Class A | | | | |
Net Asset Value, offering and redemption price per share ($332,957,896 ÷ 36,513,515 outstanding shares of beneficial interest, $.01 par value, unlimited number of shares authorized) | | $ | 9.12 | |
| | |
|
|
|
Class B | | | | |
Net Asset Value, offering and redemption price per share ($68,551,806 ÷ 7,543,430 outstanding shares of beneficial interest, $.01 par value, unlimited number of shares authorized) | | $ | 9.09 | |
| | |
|
|
|
| * | Represents collateral on securities loaned. |
Statement of Operations for the year ended December 31, 2004
| | | |
Investment Income | | | |
Income: | | | |
Dividends | | $ | 7,322,952 |
Interest | | | 7,694 |
Interest — Scudder Cash Management QP Trust | | | 81,741 |
Securities lending income, including income from Daily Assets Fund Institutional | | | 3,534 |
| | |
|
|
Total Income | | | 7,415,921 |
| | |
|
|
Expenses: | | | |
Management fee | | | 1,145,237 |
Custodian and accounting fees | | | 169,405 |
Distribution service fees (Class B) | | | 128,429 |
Record keeping fees (Class B) | | | 67,396 |
Auditing | | | 47,500 |
Legal | | | 22,815 |
Trustees’ fees and expenses | | | 6,150 |
Reports to shareholders | | | 43,270 |
Registration fees | | | 760 |
Other | | | 47,303 |
| | |
|
|
Total expenses, before expense reductions | | | 1,678,265 |
| | |
|
|
Page 358 of 466
| | | | |
Expense reductions | | | (9,101 | ) |
| | |
|
|
|
Total expenses, after expense reductions | | | 1,669,164 | |
| | |
|
|
|
Net investment income (loss) | | | 5,746,757 | |
| | |
|
|
|
Realized and Unrealized Gain (Loss) on Investment Transactions | | | | |
Net realized gain (loss) from: | | | | |
Investments | | | (11,480,105 | ) |
Futures | | | 843,542 | |
| | |
|
|
|
| | | | (10,636,563 | ) |
| | |
|
|
|
Net unrealized appreciation (depreciation) during the period on: | | | | |
Investments | | | 41,973,365 | |
Futures | | | (14,332 | ) |
| | |
|
|
|
| | | | 41,959,033 | |
| | |
|
|
|
Net gain (loss) on investment transactions | | | 31,322,470 | |
| | |
|
|
|
Net increase (decrease) in net assets resulting from operations | | $ | 37,069,227 | |
| | |
|
|
|
The accompanying notes are an integral part of the financial statements.
Statement of Changes in Net Assets
| | | | | | | | |
| | | Years Ended December 31,
| |
Increase (Decrease) in Net Assets
| | 2004
| | | 2003
| |
Operations: | | | | | | | | |
Net investment income (loss) | | $ | 5,746,757 | | | $ | 3,524,386 | |
Net realized gain (loss) on investment transactions | | | (10,636,563 | ) | | | (12,180,785 | ) |
Net unrealized appreciation (depreciation) on investment transactions during the period | | | 41,959,033 | | | | 79,217,419 | |
Net increase (decrease) in net assets resulting from operations | | | 37,069,227 | | | | 70,561,020 | |
Distributions to shareholders from: | | | | | | | | |
Net investment income | | | | | | | | |
Class A | | | (3,148,196 | ) | | | (2,840,811 | ) |
Class B | | | (262,259 | ) | | | (39,707 | ) |
Portfolio share transactions: | | | | | | | | |
| | |
Class A | | | | | | | | |
Proceeds from shares sold | | | 58,800,030 | | | | 64,041,270 | |
Reinvestment of distributions | | | 3,148,196 | | | | 2,840,811 | |
Cost of shares redeemed | | | (65,809,853 | ) | | | (54,166,484 | ) |
Net increase (decrease) in net assets from Class A share transactions | | | (3,861,627 | ) | | | 12,715,597 | |
Page 359 of 466
| | | | | | | | |
| | |
Class B | | | | | | | | |
Proceeds from shares sold | | | 43,175,923 | | | | 30,974,956 | |
Reinvestment of distributions | | | 262,259 | | | | 39,707 | |
Cost of shares redeemed | | | (13,817,023 | ) | | | (3,018,857 | ) |
Net increase (decrease) in net assets from Class B share transactions | | | 29,621,159 | | | | 27,995,806 | |
| | |
|
|
| |
|
|
|
Increase (decrease) in net assets | | | 59,418,304 | | | | 108,391,905 | |
| | |
|
|
| |
|
|
|
Net assets at beginning of period | | | 342,091,398 | | | | 233,699,493 | |
| | |
|
|
| |
|
|
|
Net assets at end of period (including undistributed net investment income of $5,567,259 and $3,279,886, respectively) | | $ | 401,509,702 | | | $ | 342,091,398 | |
| | |
|
|
| |
|
|
|
Other Information | | | | | | | | |
| | |
Class A | | | | | | | | |
Shares outstanding at beginning of period | | | 36,967,597 | | | | 35,202,430 | |
Shares sold | | | 6,987,566 | | | | 8,891,513 | |
Shares issued to shareholders in reinvestment of distributions | | | 375,232 | | | | 450,208 | |
Shares redeemed | | | (7,816,880 | ) | | | (7,576,554 | ) |
Net increase (decrease) in Portfolio shares | | | (454,082 | ) | | | 1,765,167 | |
| | |
|
|
| |
|
|
|
Shares outstanding at end of period | | | 36,513,515 | | | | 36,967,597 | |
| | |
|
|
| |
|
|
|
| | |
Class B | | | | | | | | |
Shares outstanding at beginning of period | | | 4,013,326 | | | | 175,906 | |
Shares sold | | | 5,136,505 | | | | 4,214,305 | |
Shares issued to shareholders in reinvestment of distributions | | | 31,296 | | | | 6,293 | |
Shares redeemed | | | (1,637,697 | ) | | | (383,178 | ) |
Net increase (decrease) in Portfolio shares | | | 3,530,104 | | | | 3,837,420 | |
| | |
|
|
| |
|
|
|
Shares outstanding at end of period | | | 7,543,430 | | | | 4,013,326 | |
| | |
|
|
| |
|
|
|
The accompanying notes are an integral part of the financial statements.
Financial Highlights
Class A
| | | | | | | | | | | | | | | | | | | | |
Years Ended December 31,
| | 2004
| | | 2003
| | | 2002
| | | 2001
| | | 2000a
| |
Selected Per Share Data | | | | | | | | | | | | | | | | | | | | |
Net asset value, beginning of period | | $ | 8.35 | | | $ | 6.61 | | | $ | 8.55 | | | $ | 9.78 | | | $ | 10.96 | |
| | |
|
|
| |
|
|
| |
|
|
| |
|
|
| |
|
|
|
Income (loss) from investment operations: | | | | | | | | | | | | | | | | | | | | |
Net investment income (loss)b | | | .14 | | | | .09 | | | | .09 | | | | .08 | | | | .10 | |
Net realized and unrealized gain (loss) on investment transactions | | | .72 | | | | 1.73 | | | | (1.99 | ) | | | (1.26 | ) | | | (1.18 | ) |
| | |
|
|
| |
|
|
| |
|
|
| |
|
|
| |
|
|
|
Total from investment operations | | | .86 | | | | 1.82 | | | | (1.90 | ) | | | (1.18 | ) | | | (1.08 | ) |
| | |
|
|
| |
|
|
| |
|
|
| |
|
|
| |
|
|
|
Less distributions from: | | | | | | | | | | | | | | | | | | | | |
Net investment income | | | (.09 | ) | | | (.08 | ) | | | (.04 | ) | | | (.05 | ) | | | (.05 | ) |
Net realized gains on investment transactions | | | — | | | | — | | | | — | | | | — | | | | (.05 | ) |
Total distributions | | | (.09 | ) | | | (.08 | ) | | | (.04 | ) | | | (.05 | ) | | | (.10 | ) |
Net asset value, end of period | | $ | 9.12 | | | $ | 8.35 | | | $ | 6.61 | | | $ | 8.55 | | | $ | 9.78 | |
| | |
|
|
| |
|
|
| |
|
|
| |
|
|
| |
|
|
|
Total Return (%) | | | 10.38 | | | | 27.93 | | | | (22.34 | ) | | | (12.05 | )c | | | (9.93 | )c |
| | |
|
|
| |
|
|
| |
|
|
| |
|
|
| |
|
|
|
Ratios to Average Net Assets and Supplemental Data | | | | | | | | | | | | | | | | | | | | |
Net assets, end of period ($ millions) | | | 333 | | | | 309 | | | | 233 | | | | 219 | | | | 102 | |
Ratio of expenses before expense reductions (%) | | | .41 | | | | .49 | | | | .48 | | | | .65 | | | | .88 | |
Ratio of expenses after expense reductions (%) | | | .41 | | | | .49 | | | | .48 | | | | .55 | | | | .54 | |
Ratio of net investment income (loss) (%) | | | 1.64 | | | | 1.31 | | | | 1.16 | | | | .88 | | | | .90 | |
Portfolio turnover rate (%) | | | 13 | | | | 8 | | | | 6 | | | | 13 | | | | 20 | |
| a. | On June 18, 2001, the Portfolio implemented a 1 for 10 reverse stock split. Share information, for the periods prior to December 31, 2001, has been restated to reflect the effect of the split. Shareholders received 1 share for every 10 shares owned and net asset value per share increased correspondingly. |
Page 360 of 466
| b | Based on average shares outstanding during the period. |
| c | Total return would have been lower had certain expenses not been reduced. |
Class B
| | | | | | | | | | | | |
Years Ended December 31,
| | 2004
| | | 2003
| | | 2002a
| |
Selected Per Share Data | | | | | | | | | | | | |
Net asset value, beginning of period | | $ | 8.32 | | | $ | 6.59 | | | $ | 7.21 | |
| | |
|
|
| |
|
|
| |
|
|
|
Income (loss) from investment operations: | | | | | | | | | | | | |
Net investment income (loss)b | | | .11 | | | | .06 | | | | .05 | |
Net realized and unrealized gain (loss) on investment transactions | | | .72 | | | | 1.74 | | | | (.67 | ) |
| | |
|
|
| |
|
|
| |
|
|
|
Total from investment operations | | | .83 | | | | 1.80 | | | | (.62 | ) |
| | |
|
|
| |
|
|
| |
|
|
|
Less distributions from: | | | | | | | | | | | | |
Net investment income | | | (.06 | ) | | | (.07 | ) | | | — | |
| | |
|
|
| |
|
|
| |
|
|
|
Net asset value, end of period | | $ | 9.09 | | | $ | 8.32 | | | $ | 6.59 | |
| | |
|
|
| |
|
|
| |
|
|
|
Total Return (%) | | | 9.98 | c | | | 27.57 | | | | (8.60 | )** |
| | |
|
|
| |
|
|
| |
|
|
|
Ratios to Average Net Assets and Supplemental Data | | | | | | | | | | | | |
Net assets, end of period ($ millions) | | | 69 | | | | 33 | | | | 1 | |
Ratio of expenses before expense reductions (%) | | | .79 | | | | .88 | | | | .69 | * |
Ratio of expenses after expense reductions (%) | | | .78 | | | | .88 | | | | .69 | * |
Ratio of net investment income (loss) (%) | | | 1.28 | | | | .92 | | | | 1.42 | * |
Portfolio turnover rate (%) | | | 13 | | | | 8 | | | | 6 | |
| a | For the period July 1, 2002 (commencement of operations of Class B shares) to December 31, 2002. |
| b | Based on average shares outstanding during the period. |
| c | Total return would have been lower had certain expenses not been reduced. |
Page 361 of 466
Performance Summary December 31, 2004
SVS INVESCO Dynamic Growth Portfolio
All performance shown is historical, assumes reinvestment of all dividends and capital gains, and does not guarantee future results. Investment return and principal value fluctuate with changing market conditions so that, when redeemed, shares may be worth more or less then their original cost. Current performance may be lower or higher than the performance data quoted. Please visit scudder.com for the product’s most recent month-end performance. Performance doesn’t reflect charges and fees (“contract charges”) associated with the separate account that invests in the Portfolio or any variable life insurance policy or variable annuity contract for which the Portfolio is an investment option. These charges and fees will reduce returns.
Stocks of medium-sized companies involve greater risk as they often have limited product lines, markets, or financial resources and may be sensitive to erratic and abrupt market movements more so than securities of larger, more-established companies. Additionally, the Portfolio may also focus its investments on certain industry sectors, thereby increasing its vulnerability to any single industry or regulatory development. All of these factors may result in greater share price volatility. Please read this Portfolio’s prospectus for specific details regarding its investments and risk profile.
The investment advisor has agreed to either limit, waive or reduce certain fees temporarily for this Portfolio; see the prospectus for complete details. Without such limits, waivers or reductions, the performance figures for this Portfolio would be lower.
Growth of an Assumed $10,000 Investment in SVS INVESCO Dynamic Growth Portfolio from 5/1/2001 to 12/31/2004
| | |
¨ SVS INVESCO Dynamic Growth Portfolio — Class A ¨ Russell Midcap Growth Index |
| |
 | | The Russell MidCap Growth Index is an unmanaged index composed of common stocks of midcap companies with higher price-to-book ratios and higher forecasted growth values. Index returns assume reinvested dividends and, unlike Portfolio returns, do not reflect any fees or expenses. It is not possible to invest directly into an index. |
Yearly periods ended December 31
Comparative Results
| | | | | | | | | | | | | | |
SVS INVESCO Dynamic Growth Portfolio
| | | | 1-Year
| | | 3-Year
| | | Life of Portfolio*
| |
| Class A | | Growth of $10,000 | | $ | 11,201 | | | $ | 10,489 | | | $ | 9,230 | |
| | | Average annual total return | | | 12.01 | % | | | 1.60 | % | | | -2.16 | % |
| Russell Midcap Growth Index | | Growth of $10,000 | | $ | 11,548 | | | $ | 11,964 | | | $ | 10,930 | |
| | | Average annual total return | | | 15.48 | % | | | 6.16 | % | | | 2.45 | % |
| | | | |
SVS INVESCO Dynamic Growth Portfolio
| | | | | | | 1-Year
| | | Life of Class**
| |
| Class B | | Growth of $10,000 | | | | | | $ | 11,145 | | | $ | 14,055 | |
| | | Average annual total return | | | | | | | 11.45 | % | | | 14.57 | % |
| Russell Midcap Growth Index | | Growth of $10,000 | | | | | | $ | 11,548 | | | $ | 14,900 | |
| | | Average annual total return | | | | | | | 15.48 | % | | | 17.29 | % |
The growth of $10,000 is cumulative.
| * | The Portfolio commenced operations on May 1, 2001. Index returns begin April 30, 2001. |
| ** | The Portfolio commenced offering Class B shares on July 1, 2002. Index returns begin June 30, 2002. |
Page 362 of 466
Information About Your Portfolio’s Expenses
SVS INVESCO Dynamic Growth Portfolio
As an investor of the Portfolio, you incur two types of costs: ongoing expenses and transaction costs. Ongoing expenses include management fees, distribution and service (12b-1) fees and other Portfolio expenses. Examples of transaction costs include sales charges (loads), redemption fees and account maintenance fees, which are not shown in this section. The following tables are intended to help you understand your ongoing expenses (in dollars) of investing in the Portfolio and to help you compare these expenses with the ongoing expenses of investing in other mutual funds. In the most recent six-month period, the Portfolio limited these expenses; had it not done so, expenses would have been higher. The tables are based on an investment of $1,000 made at the beginning of the six-month period ended December 31, 2004.
The tables illustrate your Portfolio’s expenses in two ways:
Actual Portfolio Return. This helps you estimate the actual dollar amount of ongoing expenses (but not transaction costs) paid on a $1,000 investment in the Portfolio using the Portfolio’s actual return during the period. To estimate the expenses you paid over the period, simply divide your account value by $1,000 (for example, an $8,600 account value divided by $1,000 = 8.6), then multiply the result by the number in the “Expenses Paid per $1,000” line under the share class you hold.
Hypothetical 5% Portfolio Return. This helps you to compare your Portfolio’s ongoing expenses (but not transaction costs) with those of other mutual funds using the Portfolio’s actual expense ratio and a hypothetical rate of return of 5% per year before expenses. Examples using a 5% hypothetical Portfolio return may be found in the shareholder reports of other mutual funds. The hypothetical account values and expenses may not be used to estimate the actual ending account balance or expenses you paid for the period.
Please note that the expenses shown in these tables are meant to highlight your ongoing expenses only and do not reflect any transaction costs. The “Expenses Paid per $1,000” line of the tables is useful in comparing ongoing expenses only and will not help you determine the relative total expense of owning different funds. If these transaction costs had been included, your costs would have been higher.
Expenses and Value of a $1,000 Investment for the six months ended December 31, 2004
| | | | | | |
Actual Portfolio Return
| | Class A
| | Class B
|
Beginning Account Value 7/1/04 | | $ | 1,000.00 | | $ | 1,000.00 |
Ending Account Value 12/31/04 | | $ | 1,082.10 | | $ | 1,079.00 |
Expenses Paid per $1,000* | | $ | 6.80 | | $ | 8.88 |
| | |
Hypothetical 5% Portfolio Return
| | Class A
| | Class B
|
Beginning Account Value 7/1/04 | | $ | 1,000.00 | | $ | 1,000.00 |
Ending Account Value 12/31/04 | | $ | 1,018.68 | | $ | 1,016.66 |
Expenses Paid per $1,000* | | $ | 6.59 | | $ | 8.62 |
| * | Expenses are equal to the Portfolio’s annualized expense ratio for each share class, multiplied by the average account value over the period, multiplied by the number of days in the most recent six-month period, then divided by 365. |
| | | | | | |
Annualized Expense Ratios
| | Class A
| | | Class B
| |
Scudder Variable Series II — SVS INVESCO Dynamic Growth Portfolio | | 1.30 | % | | 1.70 | % |
For more information, please refer to the Portfolio’s prospectus.
Page 363 of 466
Management Summary December 31, 2004
SVS INVESCO Dynamic Growth Portfolio
In the period ending December 31, 2004, SVS INVESCO Dynamic Growth Portfolio underperformed the 15.48% return of the Russell Midcap Growth Index, but still posted a solid gain for the year of 12.01% (Class A shares, unadjusted for contract charges). During 2004, the managers reduced the total number of holdings in the portfolio, but took steps to diversify the holdings across sectors. Specifically, the portfolio managers decreased exposure to the information technology sector, and added to their positions in the energy, industrials, materials and telecommunications sectors. By the end of the year, the portfolio held overweight positions in the financials, energy, telecommunications and materials sectors. It held underweight positions in the consumer discretionary, staples, health care and information technology sectors relative to the Russell Midcap Growth Index.
Stock selection in the information technology sector was the largest detractor from the portfolio’s relative performance. Within the IT sector, the semiconductor stocks, in particular, detracted from the portfolio, as this was the worst-performing industry group in 2004. Stock selection and an underweight position in the health care sector also detracted from relative performance during the year. Stock selection in the industrials sector positively contributed to performance relative to the Russell Midcap Growth Index in 2004. Telecommunications holdings also boosted the portfolio’s performance as shares of wireless telecommunications services companies posted solid gains.
Going forward, the portfolio management team will continue to utilize fundamental analysis to identify stocks with sustainable growth characteristics and attractive valuations. The managers will balance their high-quality core growth holdings with earnings momentum stocks that may have strong near-term prospects for appreciation. The portfolio should be well positioned to benefit from the current economic climate.
Paul J. Rasplicka Michael Chapman
Lead Manager Manager
INVESCO Institutional (N.A.), Inc., Subadvisor to the Portfolio
All performance shown is historical, assumes reinvestment of all dividends and capital gains, and does not guarantee future results. Investment return and principal value fluctuate with changing market conditions so that, when redeemed, shares may be worth more or less then their original cost. Current performance may be lower or higher than the performance data quoted. Please visit scudder.com for the product’s most recent month-end performance. Performance doesn’t reflect charges and fees (“contract charges”) associated with the separate account that invests in the portfolio or any variable life insurance policy or variable annuity contract for which the portfolio is an investment option. These charges and fees will reduce returns.
Returns during part or all of the periods shown reflect a fee waiver and/or expense reimbursement. Without this waiver/reimbursement, returns would have been lower.
Risk Considerations
Stocks of medium-sized companies involve greater risk as they often have limited product lines, markets, or financial resources and may be sensitive to erratic and abrupt market movements more so than securities of larger, more-established companies. Additionally, the portfolio may also focus its investments on certain industry sectors, thereby increasing its vulnerability to any single industry or regulatory development. All of these factors may result in greater share price volatility. Please read this portfolio’s prospectus for specific details regarding its investments and risk profile.
The Russell Midcap Growth Index is an unmanaged index composed of common stocks of midcap companies with higher price-to-book ratios and higher forecasted growth values. Index returns assume reinvested dividends and, unlike Portfolio returns, do not reflect any fees or expenses. It is not possible to invest directly into an index.
Page 364 of 466
Portfolio management market commentary is as of December 31, 2004, and may not come to pass. This information is subject to change at any time based on market and other conditions.
Portfolio Summary
SVS INVESCO Dynamic Growth Portfolio
| | | | | | |
Asset Allocation (Excludes Securities Lending Collateral)
| | 12/31/04
| | | 12/31/03
| |
Common Stocks | | 94 | % | | 95 | % |
Cash Equivalents | | 5 | % | | 4 | % |
Exchange Traded Fund | | 1 | % | | 1 | % |
| | |
|
| |
|
|
| | | 100 | % | | 100 | % |
| | |
|
| |
|
|
| | | | | | |
Sector Diversification (Excludes Cash Equivalents and Securities Lending Collateral)
| | 12/31/04
| | | 12/31/03
| |
Information Technology | | 22 | % | | 33 | % |
Consumer Discretionary | | 21 | % | | 21 | % |
Health Care | | 17 | % | | 17 | % |
Industrials | | 16 | % | | 13 | % |
Financials | | 11 | % | | 7 | % |
Energy | | 6 | % | | 4 | % |
Materials | | 3 | % | | 2 | % |
Telecommunication Services | | 3 | % | | 2 | % |
Consumer Staples | | 1 | % | | 1 | % |
| | |
|
| |
|
|
| | | 100 | % | | 100 | % |
| | |
|
| |
|
|
Asset allocation and sector diversification are subject to change.
For more complete details about the Portfolio’s investment portfolio, see page 33. A quarterly Fact Sheet is available upon request. Information concerning portfolio holdings of the Portfolio as of month end will be posted to scudder.com on the 15th of the following month.
Following the Portfolio’s fiscal first and third quarter-end, a complete portfolio holdings listing is filed with the SEC on Form N-Q. The form will be available on the SEC’s Web site at www.sec.gov, and it also may be reviewed and copied at the SEC’s Public Reference Room in Washington, D.C. Information on the operation of the SEC’s Public Reference Room may be obtained by calling (800) SEC-0330.
Page 365 of 466
Investment Portfolio December 31, 2004
SVS INVESCO Dynamic Growth Portfolio
| | | | |
| | | Shares
| | Value ($)
|
Common Stocks 94.6% | | | | |
Consumer Discretionary 19.5% | | | | |
Hotels Restaurants & Leisure 6.2% | | | | |
Hilton Hotels Corp. | | 33,100 | | 752,694 |
Royal Caribbean Cruises Ltd. (e) | | 11,800 | | 642,392 |
Starwood Hotels & Resorts Worldwide, Inc. | | 11,800 | | 689,120 |
Station Casinos, Inc. | | 9,700 | | 530,396 |
| | | | |
|
| | | | | 2,614,602 |
| | | | |
|
Household Durables 1.9% | | | | |
Garmin Ltd. (e) | | 5,100 | | 310,284 |
Pulte Homes, Inc. | | 7,200 | | 459,360 |
| | | | |
|
| | | | | 769,644 |
| | | | |
|
Media 2.1% | | | | |
Omnicom Group, Inc. | | 5,100 | | 430,032 |
The E.W. Scripps Co. “A” | | 9,300 | | 449,004 |
| | | | |
|
| | | | | 879,036 |
| | | | |
|
Multiline Retail 2.0% | | | | |
Dollar General Corp. (e) | | 20,700 | | 429,939 |
Kohl’s Corp.* | | 8,600 | | 422,862 |
| | | | |
|
| | | | | 852,801 |
| | | | |
|
Specialty Retail 4.5% | | | | |
Abercrombie & Fitch Co. “A” | | 10,200 | | 478,890 |
Advance Auto Parts, Inc.* | | 9,500 | | 414,960 |
Ross Stores, Inc. | | 15,300 | | 441,711 |
Staples, Inc. | | 16,900 | | 569,699 |
| | | | |
|
| | | | | 1,905,260 |
| | | | |
|
Textiles, Apparel & Luxury Goods 2.8% | | | | |
Coach, Inc.* | | 9,400 | | 530,160 |
Polo Ralph Lauren Corp. | | 15,400 | | 656,040 |
| | | | |
|
| | | | | 1,186,200 |
| | | | |
|
Consumer Staples 0.9% | | | | |
Food & Staples Retailing | | | | |
BJ’s Wholesale Club, Inc.* | | 13,400 | | 390,342 |
| | | | |
|
Energy 5.5% | | | | |
Energy Equipment & Services 2.1% | | | | |
Halliburton Co. | | 10,900 | | 427,716 |
Smith International, Inc.* | | 8,100 | | 440,721 |
| | | | |
|
| | | | | 868,437 |
| | | | |
|
Oil & Gas 3.4% | | | | |
Apache Corp. | | 2 | | 101 |
Murphy Oil Corp. | | 5,300 | | 426,385 |
Talisman Energy, Inc. | | 15,700 | | 423,272 |
Williams Companies, Inc. | | 37,200 | | 605,988 |
| | | | |
|
| | | | | 1,455,746 |
| | | | |
|
Page 366 of 466
| | | | |
Financials 10.7% | | | | |
Banks 1.0% | | | | |
Zions Bancorp. | | 6,100 | | 414,983 |
| | | | |
|
Capital Markets 3.4% | | | | |
Investors Financial Services Corp. | | 8,500 | | 424,830 |
Legg Mason, Inc. | | 7,750 | | 567,765 |
| | |
| | | Shares
| | Value ($)
|
T. Rowe Price Group, Inc. | | 7,600 | | 472,720 |
| | | | |
|
| | | | | 1,465,315 |
| | | | |
|
Diversified Financial Services 1.7% | | | | |
CapitalSource, Inc.* (e) | | 16,400 | | 420,988 |
Moody’s Corp. | | 3,400 | | 295,290 |
| | | | |
|
| | | | | 716,278 |
| | | | |
|
Insurance 1.1% | | | | |
Quanta Capital Holdings Ltd.* (e) | | 4,700 | | 43,334 |
Willis Group Holdings Ltd. | | 10,100 | | 415,817 |
| | | | |
|
| | | | | 459,151 |
| | | | |
|
Real Estate 3.5% | | | | |
Aames Investment Corp. (REIT) (e) | | 37,700 | | 403,390 |
CB Richard Ellis Group, Inc. “A”* | | 14,200 | | 476,410 |
New Century Financial Corp. (REIT) | | 9,300 | | 594,363 |
| | | | |
|
| | | | | 1,474,163 |
| | | | |
|
Health Care 16.1% | | | | |
Biotechnology 2.7% | | | | |
Genzyme Corp.* | | 6,300 | | 365,841 |
Gilead Sciences, Inc.* | | 8,800 | | 307,912 |
Invitrogen Corp.* | | 3,600 | | 241,668 |
Martek Biosciences Corp.* | | 4,400 | | 225,280 |
| | | | |
|
| | | | | 1,140,701 |
| | | | |
|
Health Care Equipment & Supplies 5.0% | | | | |
Cooper Companies, Inc. | | 6,100 | | 430,599 |
INAMED Corp.* | | 5,300 | | 335,225 |
Kinetic Concepts, Inc.* | | 6,900 | | 526,470 |
Nobel Biocare Holding AG | | 1,900 | | 344,209 |
Waters Corp.* | | 9,600 | | 449,184 |
| | | | |
|
| | | | | 2,085,687 |
| | | | |
|
Health Care Providers & Services 4.9% | | | | |
Aetna, Inc. | | 3,900 | | 486,525 |
Caremark Rx, Inc.* | | 16,629 | | 655,682 |
Express Scripts, Inc.* | | 5,700 | | 435,708 |
Henry Schein, Inc.* | | 6,900 | | 480,516 |
| | | | |
|
| | | | | 2,058,431 |
| | | | |
|
Pharmaceuticals 3.5% | | | | |
MGI Pharma, Inc.* | | 11,800 | | 330,518 |
Shire Pharmaceuticals Group PLC (ADR) (e) | | 21,400 | | 683,730 |
Valeant Pharmaceuticals International (e) | | 17,900 | | 471,665 |
| | | | |
|
| | | | | 1,485,913 |
| | | | |
|
Page 367 of 466
| | | | |
Industrials 14.9% | | | | |
Air Freight & Couriers 0.9% | | | | |
C.H. Robinson Worldwide, Inc. | | 6,500 | | 360,880 |
| | | | |
|
Commercial Services & Supplies 8.4% | | | | |
Apollo Group, Inc. “A”* | | 2,440 | | 196,932 |
Career Education Corp.* | | 12,300 | | 492,000 |
Cintas Corp. | | 8,900 | | 390,354 |
Corrections Corp. of America* | | 12,500 | | 505,625 |
Iron Mountain, Inc.* | | 14,500 | | 442,105 |
Manpower, Inc. | | 14,300 | | 690,690 |
Republic Services, Inc. | | 14,300 | | 479,622 |
Stericycle, Inc.* | | 7,700 | | 353,815 |
| | | | |
|
| | | | | 3,551,143 |
| | | | |
|
| | |
| | | Shares
| | Value ($)
|
Construction & Engineering 0.7% | | | | |
Chicago Bridge & Iron Co., NV (New York Shares) (ADR) (e) | | 7,100 | | 284,000 |
| | | | |
|
Electrical Equipment 0.7% | | | | |
Cooper Industries, Ltd. “A” | | 4,000 | | 271,560 |
| | | | |
|
Machinery 2.9% | | | | |
Eaton Corp. | | 6,600 | | 477,576 |
Ingersoll-Rand Co. “A” | | 6,300 | | 505,890 |
PACCAR, Inc. | | 3,050 | | 245,464 |
| | | | |
|
| | | | | 1,228,930 |
| | | | |
|
Trading Companies & Distributors 1.0% | | | | |
Fastenal Co. (e) | | 7,100 | | 437,076 |
| | | | |
|
Transportation Infrastructure 0.3% | | | | |
Sirva, Inc.* | | 7,200 | | 138,384 |
| | | | |
|
Information Technology 20.9% | | | | |
Communications Equipment 4.6% | | | | |
Avaya, Inc.* | | 38,500 | | 662,200 |
Comverse Technologies, Inc.* | | 20,800 | | 508,560 |
Corning, Inc.* | | 24,700 | | 290,719 |
Juniper Networks, Inc.* | | 8,563 | | 232,828 |
Scientific-Atlanta, Inc. | | 7,800 | | 257,478 |
| | | | |
|
| | | | | 1,951,785 |
| | | | |
|
Computers & Peripherals 0.9% | | | | |
Storage Technology Corp.* | | 12,300 | | 388,803 |
| | | | |
|
Electronic Equipment & Instruments 1.8% | | | | |
Amphenol Corp. “A”* | | 14,100 | | 518,034 |
CDW Corp. | | 3,250 | | 215,638 |
| | | | |
|
| | | | | 733,672 |
| | | | |
|
Internet Software & Services 2.2% | | | | |
Ask Jeeves, Inc.* (e) | | 7,900 | | 211,325 |
VeriSign, Inc.* | | 21,500 | | 720,680 |
| | | | |
|
| | | | | 932,005 |
| | | | |
|
Page 368 of 466
| | | | |
IT Consulting & Services 1.9% | | | | |
Alliance Data Systems Corp.* | | 10,500 | | 498,540 |
DST Systems, Inc.* | | 6,100 | | 317,932 |
| | | | |
|
| | | | | 816,472 |
| | | | |
|
Office Electronics 0.6% | | | | |
Zebra Technologies Corp. “A”* | | 4,500 | | 253,260 |
| | | | |
|
Semiconductors & Semiconductor Equipment 4.6% | | | | |
Altera Corp.* | | 14,933 | | 309,113 |
KLA-Tencor Corp.* | | 5,200 | | 242,216 |
Microchip Technology, Inc. | | 16,450 | | 438,557 |
National Semiconductor Corp.* | | 27,800 | | 499,010 |
| | |
| | | Shares
| | Value ($)
|
Novellus Systems, Inc.* | | 16,500 | | 460,185 |
| | | | |
|
| | | | | 1,949,081 |
| | | | |
|
Software 4.3% | | | | |
Amdocs Ltd.* | | 19,800 | | 519,750 |
Intuit, Inc.* | | 9,100 | | 400,491 |
Mercury Interactive Corp.* | | 5,900 | | 268,745 |
NAVTEQ Corp.* | | 4,600 | | 213,256 |
Novell, Inc.* | | 60,000 | | 405,000 |
| | | | |
|
| | | | | 1,807,242 |
| | | | |
|
Materials 3.1% | | | | |
Chemicals | | | | |
Ecolab, Inc. | | 7,000 | | 245,910 |
Nalco Holding Co.* | | 17,800 | | 347,456 |
Praxair, Inc. | | 4,800 | | 211,920 |
Rohm & Haas Co. | | 11,300 | | 499,799 |
| | | | |
|
| | | | | 1,305,085 |
| | | | |
|
Telecommunication Services 3.0% | | | | |
Wireless Telecommunication Services | | | | |
American Towers, Inc. “A”* (e) | | 29,900 | | 550,160 |
Nextel Partners, Inc. “A”* (e) | | 23,100 | | 451,372 |
SpectraSite, Inc.* | | 4,800 | | 277,920 |
| | | | |
|
| | | | | 1,279,452 |
| | | | |
|
Total Common Stocks (Cost $31,384,062) | | | | 39,911,520 |
| | | | |
|
Exchange Traded Fund 0.9% | | | | |
iShares Nasdaq Biotechnology Index Fund* (Cost $344,887) | | 5,100 | | 384,540 |
| | | | |
|
Securities Lending Collateral 7.6% | | | | |
Daily Assets Fund Institutional, 2.25% (c) (d) (Cost $3,190,356) | | 3,190,356 | | 3,190,356 |
| | | | |
|
Cash Equivalents 5.5% | | | | |
Scudder Cash Management QP Trust, 2.24% (b) (Cost $2,313,714) | | 2,313,714 | | 2,313,714 |
| | | | |
|
Page 369 of 466
| | | | | | |
| | | % of Net Assets
| | | Value ($)
| |
Total Investment Portfolio (Cost $37,233,019) (a) | | 108.6 | | | 45,800,130 | |
| | | | | |
|
|
Other Assets and Liabilities, Net | | (8.6 | ) | | (3,606,223 | ) |
| | | | | |
|
|
Net Assets | | 100.0 | | | 42,193,907 | |
| | | | | |
|
|
Notes to SVS INVESCO Dynamic Growth Portfolio of Investments
| * | Non-income producing security. |
| (a) | The cost for federal income tax purposes was $37,333,270. At December 31, 2004, net unrealized appreciation for all securities based on tax cost was $8,466,860. This consisted of aggregate gross unrealized appreciation for all securities in which there was an excess of value over tax cost of $8,776,811 and aggregate gross unrealized depreciation for all securities in which there was an excess of tax cost over value of $309,951. |
| (b) | Scudder Cash Management QP Trust is managed by Deutsche Investment Management Americas Inc. The rate shown is the annualized seven-day yield at period end. |
| (c) | Daily Assets Fund Institutional, an affiliated fund, is managed by Deutsche Asset Management, Inc. The rate shown is the annualized seven-day yield at period end. |
| (d) | Represents collateral held in connection with securities lending. |
| (e) | All or a portion of these securities were on loan (see Notes to Financial Statements). The value of all securities loaned at December 31, 2004, amounted to $3,119,338, which is 7.4% of net assets. |
REIT: Real Estate Investment Trust
ADR: American Depositary Receipts
The accompanying notes are an integral part of the financial statements.
Financial Statements
Statement of Assets and Liabilities as of December 31, 2004
| | | |
Assets | | | |
Investments: | | | |
Investments in securities, at value (cost $31,728,949) — including $3,119,338 of securities loaned | | $ | 40,296,060 |
Investment in Daily Assets Fund Institutional (cost $3,190,356)* | | | 3,190,356 |
Investment in Scudder Cash Management QP Trust (cost $2,313,714) | | | 2,313,714 |
| | |
|
|
Total investments in securities, at value (cost $37,233,019) | | | 45,800,130 |
| | |
|
|
Cash | | | 11,559 |
Receivable for investments sold | | | 121,840 |
Dividends receivable | | | 32,938 |
Interest receivable | | | 8,145 |
Receivable for Portfolio shares sold | | | 7,338 |
Foreign taxes recoverable | | | 593 |
Other assets | | | 1,399 |
| | |
|
|
Total assets | | | 45,983,942 |
| | |
|
|
Page 370 of 466
| | | | |
Liabilities | | | | |
Payable for investments purchased | | | 499,773 | |
Payable upon return of securities loaned | | | 3,190,356 | |
Payable for Portfolio shares redeemed | | | 29,116 | |
Other accrued expenses and payables | | | 70,790 | |
Total liabilities | | | 3,790,035 | |
| | |
|
|
|
Net assets, at value | | $ | 42,193,907 | |
| | |
|
|
|
Net Assets | | | | |
Net assets consist of: | | | | |
Accumulated net investment loss | | | (213 | ) |
Net unrealized appreciation (depreciation) on: Investments | | | 8,567,111 | |
Foreign currency related transactions | | | 40 | |
Accumulated net realized gain (loss) | | | (2,797,169 | ) |
Paid-in capital | | | 36,424,138 | |
| | |
|
|
|
Net assets, at value | | $ | 42,193,907 | |
| | |
|
|
|
Class A | | | | |
Net Asset Value, offering and redemption price per share ($34,929,103 ÷ 3,784,410 outstanding shares of beneficial interest, $.01 par value, unlimited number of shares authorized) | | $ | 9.23 | |
| | |
|
|
|
Class B | | | | |
Net Asset Value, offering and redemption price per share ($7,264,804 ÷ 793,650 outstanding shares of beneficial interest, $.01 par value, unlimited number of shares authorized) | | $ | 9.15 | |
| | |
|
|
|
| * | Represents collateral on securities loaned. |
Statement of Operations for the year ended December 31, 2004
| | | | |
Investment Income | | | | |
Income: | | | | |
Dividends (net of foreign taxes withheld of $1,704) | | $ | 191,259 | |
Interest — Scudder Cash Management QP Trust | | | 28,345 | |
Securities lending income, including income from Daily Assets Fund Institutional | | | 11,252 | |
| | |
|
|
|
Total Income | | | 230,856 | |
| | |
|
|
|
Expenses: | | | | |
Management fee | | | 389,667 | |
Custodian and accounting fees | | | 112,196 | |
Distribution service fees (Class B) | | | 14,375 | |
Record keeping fees (Class B) | | | 7,766 | |
Auditing | | | 44,886 | |
Legal | | | 20,749 | |
Trustees’ fees and expenses | | | 939 | |
Reports to shareholders | | | 5,761 | |
Other | | | 2,942 | |
| | |
|
|
|
Total expenses, before expense reductions | | | 599,281 | |
| | |
|
|
|
Expense reductions | | | (69,866 | ) |
| | |
|
|
|
Total expenses, after expense reductions | | | 529,415 | |
| | |
|
|
|
Net investment income (loss) | | | (298,559 | ) |
| | |
|
|
|
Realized and Unrealized Gain (Loss) on Investment Transactions | | | | |
Net realized gain (loss) from: | | | | |
Investments | | | 4,623,604 | |
Foreign currency related transactions | | | 19,597 | |
| | | | 4,643,201 | |
Net unrealized appreciation (depreciation) during the period on: | | | | |
Investments | | | 85,635 | |
Foreign currency related transactions | | | 37 | |
| | | | 85,672 | |
| | |
|
|
|
Net gain (loss) on investment transactions | | | 4,728,873 | |
| | |
|
|
|
Net increase (decrease) in net assets resulting from operations | | $ | 4,430,314 | |
| | |
|
|
|
The accompanying notes are an integral part of the financial statements.
Page 371 of 466
Statement of Changes in Net Assets
| | | | | | | | |
| | | Years Ended December 31,
| |
Increase (Decrease) in Net Assets
| | 2004
| | | 2003
| |
Operations: | | | | | | | | |
Net investment income (loss) | | $ | (298,559 | ) | | $ | (267,890 | ) |
Net realized gain (loss) on investment transactions | | | 4,643,201 | | | | 787,660 | |
Net unrealized appreciation (depreciation) on investment transactions during the period | | | 85,672 | | | | 8,947,748 | |
Net increase (decrease) in net assets resulting from operations | | | 4,430,314 | | | | 9,467,518 | |
Portfolio share transactions: | | | | | | | | |
| | |
Class A | | | | | | | | |
Proceeds from shares sold | | | 4,190,288 | | | | 4,799,111 | |
Cost of shares redeemed | | | (7,454,938 | ) | | | (4,360,153 | ) |
Net increase (decrease) in net assets from Class A share transactions | | | (3,264,650 | ) | | | 438,958 | |
| | |
Class B | | | | | | | | |
Proceeds from shares sold | | | 3,116,161 | | | | 3,887,012 | |
Cost of shares redeemed | | | (1,201,557 | ) | | | (110,618 | ) |
Net increase (decrease) in net assets from Class B share transactions | | | 1,914,604 | | | | 3,776,394 | |
Page 372 of 466
| | | | | | | | |
Increase (decrease) in net assets | | | 3,080,268 | | | | 13,682,870 | |
Net assets at beginning of period | | | 39,113,639 | | | | 25,430,769 | |
| | |
|
|
| |
|
|
|
Net assets at end of period (including accumulated net investment loss of $213 and $208, respectively) | | $ | 42,193,907 | | | $ | 39,113,639 | |
| | |
|
|
| |
|
|
|
Other Information | | | | | | | | |
| | |
Class A | | | | | | | | |
Shares outstanding at beginning of period | | | 4,185,184 | | | | 4,165,073 | |
Shares sold | | | 493,942 | | | | 671,597 | |
Shares redeemed | | | (894,716 | ) | | | (651,486 | ) |
Net increase (decrease) in Portfolio shares | | | (400,774 | ) | | | 20,111 | |
| | |
|
|
| |
|
|
|
Shares outstanding at end of period | | | 3,784,410 | | | | 4,185,184 | |
| | |
|
|
| |
|
|
|
| | |
Class B | | | | | | | | |
Shares outstanding at beginning of period | | | 562,802 | | | | 15,737 | |
Shares sold | | | 370,510 | | | | 562,002 | |
Shares redeemed | | | (139,662 | ) | | | (14,937 | ) |
Net increase (decrease) in Portfolio shares | | | 230,848 | | | | 547,065 | |
| | |
|
|
| |
|
|
|
Shares outstanding at end of period | | | 793,650 | | | | 562,802 | |
| | |
|
|
| |
|
|
|
The accompanying notes are an integral part of the financial statements.
Financial Highlights
Class A
| | | | | | | | | | | | | | | | |
Years Ended December 31,
| | 2004
| | | 2003
| | | 2002
| | | 2001a
| |
Selected Per Share Data | | | | | | | | | | | | | | | | |
Net asset value, beginning of period | | $ | 8.24 | | | $ | 6.08 | | | $ | 8.80 | | | $ | 10.00 | |
| | |
|
|
| |
|
|
| |
|
|
| |
|
|
|
Income (loss) from investment operations: | | | | | | | | | | | | | | | | |
Net investment income (loss)b | | | (.06 | ) | | | (.06 | ) | | | (.05 | ) | | | (.02 | ) |
Net realized and unrealized gain (loss) on investment transactions | | | 1.05 | | | | 2.22 | | | | (2.67 | ) | | | (1.18 | ) |
| | |
|
|
| |
|
|
| |
|
|
| |
|
|
|
Total from investment operations | | | .99 | | | | 2.16 | | | | (2.72 | ) | | | (1.20 | ) |
| | |
|
|
| |
|
|
| |
|
|
| |
|
|
|
Net asset value, end of period | | $ | 9.23 | | | $ | 8.24 | | | $ | 6.08 | | | $ | 8.80 | |
| | |
|
|
| |
|
|
| |
|
|
| |
|
|
|
Total Return (%) | | | 12.01 | c | | | 35.53 | c | | | (30.91 | ) | | | (12.00 | )c** |
| | |
|
|
| |
|
|
| |
|
|
| |
|
|
|
Ratios to Average Net Assets and Supplemental Data | | | | | | | | | | | | | | | | |
Net assets, end of period ($ millions) | | | 35 | | | | 34 | | | | 25 | | | | 23 | |
Ratio of expenses before expense reductions (%) | | | 1.48 | | | | 1.46 | | | | 1.14 | | | | 1.97 | * |
Ratio of expenses after expense reductions (%) | | | 1.30 | | | | 1.30 | | | | 1.14 | | | | 1.30 | * |
Ratio of net investment income (loss) (%) | | | (.71 | ) | | | (.85 | ) | | | (.71 | ) | | | (.40 | )* |
Portfolio turnover rate (%) | | | 133 | | | | 115 | | | | 79 | | | | 40 | * |
| a | For the period from May 1, 2001 (commencement of operations) to December 31, 2001. |
Page 373 of 466
| b | Based on average shares outstanding during the period. |
| c | Total return would have been lower had certain expenses not been reduced. |
Class B
| | | | | | | | | | | | |
Years Ended December 31,
| | 2004
| | | 2003
| | | 2002a
| |
Selected Per Share Data | | | | | | | | | | | | |
Net asset value, beginning of period | | $ | 8.21 | | | $ | 6.07 | | | $ | 6.51 | |
| | |
|
|
| |
|
|
| |
|
|
|
Income (loss) from investment operations: | | | | | | | | | | | | |
Net investment income (loss)b | | | (.09 | ) | | | (.09 | ) | | | (.03 | ) |
Net realized and unrealized gain (loss) on investment transactions | | | 1.03 | | | | 2.23 | | | | (.41 | ) |
| | |
|
|
| |
|
|
| |
|
|
|
Total from investment operations | | | .94 | | | | 2.14 | | | | (.44 | ) |
| | |
|
|
| |
|
|
| |
|
|
|
Net asset value, end of period | | $ | 9.15 | | | $ | 8.21 | | | $ | 6.07 | |
| | |
|
|
| |
|
|
| |
|
|
|
Total Return (%) | | | 11.45c | | | | 35.26c | | | | (6.76 | )** |
| | |
|
|
| |
|
|
| |
|
|
|
Ratios to Average Net Assets and Supplemental Data | | | | | | | | | | | | |
Net assets, end of period ($ millions) | | | 7 | | | | 5 | | | | .1 | |
Ratio of expenses before expense reductions (%) | | | 1.88 | | | | 1.85 | | | | 1.40 | * |
Ratio of expenses after expense reductions (%) | | | 1.70 | | | | 1.69 | | | | 1.40 | * |
Ratio of net investment income (loss) (%) | | | (1.11 | ) | | | (1.24 | ) | | | (.82 | )* |
Portfolio turnover rate (%) | | | 133 | | | | 115 | | | | 79 | |
| a | For the period July 1, 2002 (commencement of operations of Class B shares) to December 31, 2002. |
| b | Based on average shares outstanding during the period. |
| c | Total return would have been lower had certain expenses not been reduced. |
Performance Summary December 31, 2004
SVS Janus Growth and Income Portfolio
All performance shown is historical, assumes reinvestment of all dividends and capital gains, and does not guarantee future results. Investment return and principal value fluctuate with changing market conditions so that, when redeemed, shares may be worth more or less then their original cost. Current performance may be lower or higher than the performance data quoted. Please visit scudder.com for the product’s most recent month-end performance. Performance doesn’t reflect charges and fees (“contract charges”) associated with the separate account that invests in the Portfolio or any variable life insurance policy or variable annuity contract for which the Portfolio is an investment option. These charges and fees will reduce returns.
Page 374 of 466
The Portfolio is subject to stock market risk, meaning stocks in the Portfolio may decline in value for extended periods of time due to the activities and financial prospects of individual companies, or due to general market and economic conditions. The Portfolio also invests in individual bonds whose yields and market values fluctuate so that your investment may be worth more or less than its original cost. Please read this Portfolio’s prospectus for specific details regarding its investments and risk profile.
Growth of an Assumed $10,000 Investment in SVS Janus Growth and Income Portfolio from 10/29/1999 to 12/31/2004
| | |
¨ SVS Janus Growth and Income Portfolio — Class A ¨ Russell 1000 Growth Index | | |
| |
| | The Russell 1000 Growth Index is an unmanaged index composed of common stocks of larger US companies with higher price-to-book ratios and higher forecasted growth values. Index returns assume reinvested dividends and, unlike Portfolio returns, do not reflect any fees or expenses. It is not possible to invest directly into an index. |
Comparative Results
| | | | | | | | | | | | | | | | | | |
SVS Janus Growth and Income Portfolio
| | | | 1-Year
| | | 3-Year
| | | 5-Year
| | | Life of Portfolio*
| |
Class A | | Growth of $10,000 | | $ | 11,151 | | | $ | 11,064 | | | $ | 8,815 | | | $ | 10,131 | |
| | | Average annual total return | | | 11.51 | % | | | 3.43 | % | | | -2.49 | % | | | .25 | % |
Russell 1000 Growth Index | | Growth of $10,000 | | $ | 10,630 | | | $ | 9,946 | | | $ | 6,140 | | | $ | 7,145 | |
| | | Average annual total return | | | 6.30 | % | | | -.18 | % | | | -9.29 | % | | | -6.30 | % |
| | | | | |
SVS Janus Growth and Income Portfolio
| | | | | | | | | | 1-Year
| | | Life of Class**
| |
Class B | | Growth of $10,000 | | | | | | | | | | $ | 11,109 | | | $ | 12,402 | |
| | | Average annual total return | | | | | | | | | | | 11.09 | % | | | 8.98 | % |
Russell 1000 Growth Index | | Growth of $10,000 | | | | | | | | | | $ | 10,630 | | | $ | 12,555 | |
| | | Average annual total return | | | | | | | | | | | 6.30 | % | | | 9.53 | % |
The growth of $10,000 is cumulative.
| * | The Portfolio commenced operations October 29, 1999. Index returns begin October 31, 1999. Total returns would have been lower for the Life of Portfolio period for Class A shares if the Portfolio’s expenses were not maintained. |
| ** | The Portfolio commenced offering Class B shares on July 1, 2002. Index returns begin June 30, 2002. |
Information About Your Portfolio’s Expenses
SVS Janus Growth and Income Portfolio
As an investor of the Portfolio, you incur two types of costs: ongoing expenses and transaction costs. Ongoing expenses include management fees, distribution and service (12b-1) fees and other Portfolio expenses. Examples of transaction costs include sales charges (loads), redemption fees and account maintenance fees, which are not shown in this section. The following tables are intended to help you understand your ongoing expenses (in dollars) of investing in the Portfolio and to help you compare these expenses with the ongoing expenses of investing in other mutual funds. The tables are based on an investment of $1,000 made at the beginning of the six-month period ended December 31, 2004.
Page 375 of 466
The tables illustrate your Portfolio’s expenses in two ways:
Actual Portfolio Return. This helps you estimate the actual dollar amount of ongoing expenses (but not transaction costs) paid on a $1,000 investment in the Portfolio using the Portfolio’s actual return during the period. To estimate the expenses you paid over the period, simply divide your account value by $1,000 (for example, an $8,600 account value divided by $1,000 = 8.6), then multiply the result by the number in the “Expenses Paid per $1,000” line under the share class you hold.
Hypothetical 5% Portfolio Return. This helps you to compare your Portfolio’s ongoing expenses (but not transaction costs) with those of other mutual funds using the Portfolio’s actual expense ratio and a hypothetical rate of return of 5% per year before expenses. Examples using a 5% hypothetical Portfolio return may be found in the shareholder reports of other mutual funds. The hypothetical account values and expenses may not be used to estimate the actual ending account balance or expenses you paid for the period.
Please note that the expenses shown in these tables are meant to highlight your ongoing expenses only and do not reflect any transaction costs. The “Expenses Paid per $1,000” line of the tables is useful in comparing ongoing expenses only and will not help you determine the relative total expense of owning different funds. If these transaction costs had been included, your costs would have been higher.
Expenses and Value of a $1,000 Investment for the six months ended December 31, 2004
| | | | | | |
Actual Portfolio Return
| | Class A
| | Class B
|
Beginning Account Value 7/1/04 | | $ | 1,000.00 | | $ | 1,000.00 |
Ending Account Value 12/31/04 | | $ | 1,089.30 | | $ | 1,087.50 |
Expenses Paid per $1,000* | | $ | 5.49 | | $ | 7.45 |
| | |
Hypothetical 5% Portfolio Return
| | Class A
| | Class B
|
Beginning Account Value 7/1/04 | | $ | 1,000.00 | | $ | 1,000.00 |
Ending Account Value 12/31/04 | | $ | 1,019.95 | | $ | 1,018.07 |
Expenses Paid per $1,000* | | $ | 5.31 | | $ | 7.20 |
| * | Expenses are equal to the Portfolio’s annualized expense ratio for each share class, multiplied by the average account value over the period, multiplied by the number of days in the most recent six-month period, then divided by 365. |
| | | | | | |
Annualized Expense Ratios
| | Class A
| | | Class B
| |
Scudder Variable Series II — SVS Janus Growth and Income Portfolio | | 1.04 | % | | 1.42 | % |
For more information, please refer to the Portfolio’s prospectus.
Management Summary December 31, 2004
SVS Janus Growth and Income Portfolio
SVS Janus Growth and Income Portfolio gained 11.51% (Class A shares, unadjusted for contract charges) for the fiscal year ended December 31, 2004, outperforming its benchmark, the Russell 1000 Growth Index, which returned 6.30% during the period. This performance owed its largest gains to the strong returns of a number of well-chosen health care stocks in the portfolio, in large part United Health Group, Inc. and Aetna, Inc. These HMOs are important holdings in the portfolio because their earnings outlook should benefit from several important trends such as membership growth. Both companies have above-average earnings growth prospects while trading at below-average valuations. Another strong contributor to the portfolio’s performance was oil giant ExxonMobil Corp. The company’s share price has followed the increase of its earnings in the current high oil price environment.
Page 376 of 466
On the flip side, weak results posted by Samsung Electronics Co. and Texas Instruments, Inc. detracted from performance. Samsung Electronics is the second-largest semiconductor company in the world. Despite continued strength in its memory products, this Korean company’s shares declined along with the broader technology industry due to concerns relating to the future profitability of the handset and flat-panel businesses. Portfolio management believes that Samsung’s valuation is unsustainably cheap given the company’s world-class status and maintains the portfolio’s position. Texas Instruments is also a leading semiconductor company and has strong market positions in several subsectors. The stock has been a disappointing performer due to investor concerns regarding the sustainability of the semiconductor cycle upswing and specific weakness in the wireless business. Management believes that Texas Instrument’s overall business fundamentals are solid and that the company is positioned to deliver steady revenue growth for the next few quarters. For these reasons, the stock remains in the portfolio.
Minyoung Sohn
Portfolio Manager, Janus Capital Management LLC, Subadvisor to the Portfolio
All performance shown is historical, assumes reinvestment of all dividends and capital gains, and does not guarantee future results. Investment return and principal value fluctuate with changing market conditions so that, when redeemed, shares may be worth more or less then their original cost. Current performance may be lower or higher than the performance data quoted. Please visit scudder.com for the product’s most recent month-end performance. Performance doesn’t reflect charges and fees (“contract charges”) associated with the separate account that invests in the portfolio or any variable life insurance policy or variable annuity contract for which the portfolio is an investment option. These charges and fees will reduce returns.
Risk Considerations
The portfolio is subject to stock market risk, meaning stocks in the portfolio may decline in value for extended periods of time due to the activities and financial prospects of individual companies, or due to general market and economic conditions. The portfolio also invests in individual bonds whose yields and market values fluctuate so that your investment may be worth more or less than its original cost. Please read this portfolio’s prospectus for specific details regarding its investments and risk profile.
The Russell 1000 Growth Index is an unmanaged index composed of common stocks of larger US companies with higher price-to-book ratios and higher forecasted growth values. Index returns assume reinvested dividends and, unlike Portfolio returns, do not reflect any fees or expenses. It is not possible to invest directly into an index.
Portfolio management market commentary is as of December 31, 2004, and may not come to pass. This information is subject to change at any time based on market and other conditions.
Portfolio Summary
SVS Janus Growth and Income Portfolio
| | | | | | |
Asset Allocation (Excludes Securities Lending Collateral)
| | 12/31/04
| | | 12/31/03
| |
Common Stocks | | 95 | % | | 91 | % |
Preferred Stocks | | 3 | % | | 1 | % |
Cash Equivalents | | 2 | % | | 6 | % |
Corporate Bonds | | — | | | 1 | % |
Convertible Preferred Stocks | | — | | | 1 | % |
| | |
|
| |
|
|
| | | 100 | % | | 100 | % |
| | |
|
| |
|
|
Page 377 of 466
| | | | | | |
Sector Diversification (Excludes Cash Equivalents and Securities Lending Collateral)
| | 12/31/04
| | | 12/31/03
| |
Information Technology | | 24 | % | | 20 | % |
Consumer Discretionary | | 18 | % | | 21 | % |
Health Care | | 15 | % | | 13 | % |
Industrials | | 14 | % | | 15 | % |
Financials | | 12 | % | | 18 | % |
Energy | | 9 | % | | 5 | % |
Consumer Staples | | 8 | % | | 6 | % |
Utilities | | — | | | 1 | % |
Materials | | — | | | 1 | % |
| | |
|
| |
|
|
| | | 100 | % | | 100 | % |
| | |
|
| |
|
|
Asset allocation and sector diversification are subject to change.
For more complete details about the Portfolio’s investment portfolio, see page 44. A quarterly Fact Sheet is available upon request. Information concerning portfolio holdings of the Portfolio as of month-end will be posted to scudder.com on the 15th of the following month.
Following the Portfolio’s fiscal first and third quarter-end, a complete portfolio holdings listing is filed with the SEC on Form N-Q. The form will be available on the SEC’s Web site at www.sec.gov, and it also may be reviewed and copied at the SEC’s Public Reference Room in Washington, D.C. Information on the operation of the SEC’s Public Reference Room may be obtained by calling (800) SEC-0330.
Investment Portfolio December 31, 2004
SVS Janus Growth and Income Portfolio
| | | | |
| | | Shares
| | Value ($)
|
Common Stocks 94.9% | | | | |
Consumer Discretionary 17.1% | | | | |
Hotels Restaurants & Leisure 1.2% | | | | |
Four Seasons Hotels Ltd. (e) | | 32,475 | | 2,656,130 |
| | | | |
|
Household Durables 1.8% | | | | |
Harman International Industries, Inc. | | 16,260 | | 2,065,020 |
NVR, Inc.* | | 2,290 | | 1,761,926 |
| | | | |
|
| | | | | 3,826,946 |
| | | | |
|
Internet & Catalog Retail 0.4% | | | | |
Amazon.com, Inc.* | | 20,305 | | 899,308 |
| | | | |
|
Leisure Equipment & Products 1.1% | | | | |
Marvel Enterprises, Inc.* (e) | | 116,007 | | 2,375,823 |
| | | | |
|
Media 9.0% | | | | |
British Sky Broadcasting Group PLC | | 444,341 | | 4,794,371 |
Page 378 of 466
| | | | |
Clear Channel Communications, Inc. | | 111,255 | | 3,725,930 |
Comcast Corp. Special “A”* | | 98,970 | | 3,250,175 |
Lamar Advertising Co.* | | 39,700 | | 1,698,366 |
Time Warner, Inc.* | | 206,195 | | 4,008,431 |
Viacom, Inc. “B” | | 47,700 | | 1,735,803 |
| | | | |
|
| | | | | 19,213,076 |
| | | | |
|
Multiline Retail 0.8% | | | | |
Kohl’s Corp.* | | 34,685 | | 1,705,462 |
| | | | |
|
Specialty Retail 2.8% | | | | |
Best Buy Co., Inc. | | 56,710 | | 3,369,708 |
PETsMART, Inc. | | 71,525 | | 2,541,284 |
| | | | |
|
| | | | | 5,910,992 |
| | | | |
|
Consumer Staples 8.1% | | | | |
Beverages 2.0% | | | | |
Coca-Cola Co. | | 17,210 | | 716,452 |
PepsiCo, Inc. | | 66,577 | | 3,475,320 |
| | | | |
|
| | | | | 4,191,772 |
| | | | |
|
Food & Staples Retailing 0.8% | | | | |
Kroger Co.* | | 17,340 | | 304,143 |
Sysco Corp. | | 38,140 | | 1,455,804 |
| | | | |
|
| | | | | 1,759,947 |
| | | | |
|
Food Products 0.6% | | | | |
Dean Foods Co.* | | 34,670 | | 1,142,377 |
| | | | |
|
Household Products 2.6% | | | | |
Colgate-Palmolive Co. | | 20,780 | | 1,063,105 |
Procter & Gamble Co. | | 81,175 | | 4,471,119 |
| | | | |
|
| | | | | 5,534,224 |
| | | | |
|
Personal Products 1.1% | | | | |
Avon Products, Inc. | | 62,415 | | 2,415,460 |
| | | | |
|
Tobacco 1.0% | | | | |
Altria Group, Inc. | | 35,080 | | 2,143,388 |
| | | | |
|
Energy 8.7% | | | | |
Oil & Gas | | | | |
EnCana Corp. | | 53,989 | | 3,080,612 |
ExxonMobil Corp. | | 156,275 | | 8,010,657 |
Kinder Morgan, Inc. | | 27,250 | | 1,992,793 |
| | |
| | | Shares
| | Value ($)
|
Petro-Canada | | 41,372 | | 2,112,194 |
Suncor Energy, Inc. | | 96,348 | | 3,409,552 |
| | | | |
|
| | | | | 18,605,808 |
| | | | |
|
Financials 11.0% | | | | |
Banks 1.9% | | | | |
Fifth Third Bancorp. | | 17,335 | | 819,599 |
US Bancorp. | | 103,242 | | 3,233,539 |
| | | | |
|
| | | | | 4,053,138 |
| | | | |
|
Page 379 of 466
| | | | |
Capital Markets 0.9% | | | | |
Goldman Sachs Group, Inc. | | 17,745 | | 1,846,190 |
| | | | |
|
Consumer Finance 0.4% | | | | |
Providian Financial Corp.* | | 48,075 | | 791,795 |
| | | | |
|
Diversified Financial Services 6.6% | | | | |
Citigroup, Inc. | | 150,623 | | 7,257,016 |
Countrywide Financial Corp. | | 88,494 | | 3,275,163 |
JPMorgan Chase & Co. | | 94,670 | | 3,693,077 |
| | | | |
|
| | | | | 14,225,256 |
| | | | |
|
Insurance 1.2% | | | | |
American International Group, Inc. | | 39,870 | | 2,618,263 |
| | | | |
|
Health Care 14.1% | | | | |
Biotechnology 0.4% | | | | |
Neurocrine Biosciences, Inc.* (e) | | 17,420 | | 858,806 |
| | | | |
|
Health Care Equipment & Supplies 1.9% | | | | |
Align Technology, Inc.* (e) | | 102,325 | | 1,099,994 |
Medtronic, Inc. | | 58,610 | | 2,911,159 |
| | | | |
|
| | | | | 4,011,153 |
| | | | |
|
Health Care Providers & Services 7.1% | | | | |
Aetna, Inc. | | 31,940 | | 3,984,515 |
Caremark Rx, Inc.* | | 118,485 | | 4,671,864 |
UnitedHealth Group, Inc. | | 74,085 | | 6,521,702 |
| | | | |
|
| | | | | 15,178,081 |
| | | | |
|
Pharmaceuticals 4.7% | | | | |
Eli Lilly & Co. | | 34,675 | | 1,967,806 |
Roche Holding AG | | 50,408 | | 5,802,838 |
Sanofi-Aventis | | 28,600 | | 2,285,823 |
| | | | |
|
| | | | | 10,056,467 |
| | | | |
|
Industrials 13.1% | | | | |
Aerospace & Defense 1.2% | | | | |
Honeywell International, Inc. | | 69,110 | | 2,447,185 |
| | | | |
|
Electrical Equipment 1.6% | | | | |
Rockwell Automation, Inc. | | 70,705 | | 3,503,433 |
| | | | |
|
Industrial Conglomerates 9.1% | | | | |
3M Co. | | 33,935 | | 2,785,045 |
General Electric Co. | | 92,400 | | 3,372,600 |
Smiths Group PLC | | 127,661 | | 2,014,694 |
Tyco International Ltd. | | 313,820 | | 11,215,927 |
| | | | |
|
| | | | | 19,388,266 |
| | | | |
|
Road & Rail 1.2% | | | | |
Canadian National Railway Co. | | 42,637 | | 2,611,516 |
| | | | |
|
Page 380 of 466
| | | | |
| | | Shares
| | Value ($)
|
Information Technology 22.8% | | | | |
Communications Equipment 2.7% | | | | |
Cisco Systems, Inc.* | | 220,045 | | 4,246,869 |
Nokia Oyj (ADR) | | 93,535 | | 1,465,693 |
| | | | |
|
| | | | | 5,712,562 |
| | | | |
|
Computers & Peripherals 1.8% | | | | |
Dell, Inc.* | | 41,875 | | 1,764,612 |
International Business Machines Corp. | | 22,310 | | 2,199,320 |
| | | | |
|
| | | | | 3,963,932 |
| | | | |
|
Electronic Equipment & Instruments 2.6% | | | | |
Samsung Electronics Co., Ltd. (GDR), 144A | | 25,065 | | 5,489,235 |
| | | | |
|
Internet Software & Services 1.8% | | | | |
EarthLink, Inc.* | | 76,255 | | 878,458 |
Yahoo!, Inc.* | | 81,905 | | 3,086,180 |
| | | | |
|
| | | | | 3,964,638 |
| | | | |
|
Semiconductors & Semiconductor Equipment 8.6% | | | | |
Advanced Micro Devices, Inc.* (e) | | 372,035 | | 8,192,211 |
Linear Technology Corp. | | 78,145 | | 3,028,900 |
Maxim Integrated Products, Inc. | | 83,840 | | 3,553,977 |
Texas Instruments, Inc. | | 145,190 | | 3,574,578 |
| | | | |
|
| | | | | 18,349,666 |
| | | | |
|
Software 5.3% | | | | |
Computer Associates International, Inc. | | 58,910 | | 1,829,745 |
Electronic Arts, Inc.* | | 53,520 | | 3,301,114 |
Macromedia, Inc.* | | 20,800 | | 647,296 |
Microsoft Corp. | | 181,250 | | 4,841,187 |
Oracle Corp.* | | 50,545 | | 693,477 |
| | | | |
|
| | | | | 11,312,819 |
| | | | |
|
Total Common Stocks (Cost $160,717,419) | | | | 202,763,114 |
| | | | |
|
| | |
| | | Principal
Amount ($)
| | Value ($)
|
Convertible Bond 0.1% | | | | |
Lamar Advertising Co., 2.875%, 12/31/2010 (Cost $175,000) | | 175,000 | | 192,955 |
| | | | |
|
| | |
| | | Shares
| | Value ($)
|
Preferred Stocks 0.7% | | | | |
Porsche AG* (Cost $697,147) | | 2,476 | | 1,580,103 |
| | | | |
|
Convertible Preferred Stocks 2.3% | | | | |
Amerada Hess Corp., 7.0% | | 20,700 | | 1,530,765 |
Goldman Sachs Group, Inc., 6.25%, Series B | | 35,200 | | 876,199 |
Goldman Sachs Group, Inc., 8.125%, Series B | | 24,215 | | 911,283 |
Lehman Brothers Holdings, Inc., 6.25%, Series GIS | | 13,850 | | 373,950 |
XL Capital Ltd., 6.5% | | 43,500 | | 1,107,075 |
| | | | |
|
Total Convertible Preferred Stocks (Cost $4,422,909) | | | | 4,799,272 |
| | | | |
|
Page 381 of 466
| | | | | | |
Securities Lending Collateral 5.9% | | | | | | |
Daily Assets Fund Institutional, 2.25% (c) (d) (Cost $12,640,857) | | 12,640,857 | | | 12,640,857 | |
| | | | | |
|
|
Cash Equivalents 1.7% | | | | | | |
Scudder Cash Management QP Trust, 2.24% (b) (Cost $3,634,814) | | 3,634,814 | | | 3,634,814 | |
| | | | | |
|
|
| | |
| | | % of Net Assets
| | | Value ($)
| |
Total Investment Portfolio (Cost $182,288,146) (a) | | 105.6 | | | 225,611,115 | |
| | | | | |
|
|
Other Assets and Liabilities, Net | | (5.6 | ) | | (11,939,776 | ) |
| | | | | |
|
|
Net Assets | | 100.0 | | | 213,671,339 | |
| | | | | |
|
|
Notes to SVS Janus Growth and Income Portfolio of Investments
| * | Non-income producing security. In the case of a bond, generally denotes that the issuer has defaulted on the payment of principal or interest or has filed for bankruptcy. |
| (a) | The cost for federal income tax purposes was $183,985,755. At December 31, 2004, net unrealized appreciation for all securities based on tax cost was $41,625,360. This consisted of aggregate gross unrealized appreciation for all securities in which there was an excess of value over tax cost of $44,069,377 and aggregate gross unrealized depreciation for all securities in which there was an excess of tax cost over value of $2,444,017. |
| (b) | Scudder Cash Management QP Trust is managed by Deutsche Investment Management Americas Inc. The rate shown is the annualized seven-day yield at period end. |
| (c) | Daily Assets Fund Institutional, an affiliated fund, is managed by Deutsche Asset Management, Inc. The rate shown is the annualized seven-day yield at period end. |
| (d) | Represents collateral held in connection with securities lending. |
| (e) | All or a portion of these securities were on loan (see Notes to Financial Statements). The value of all securities loaned at December 31, 2004 amounted to $12,356,745, which is 5.8% of total net assets. |
ADR: American Depositary Receipts
GDR: Global Depositary Receipts
144A: Security exempt from registration under Rule 144A of the Securities Act of 1933. These securities may be resold in transactions exempt from registrations, normally to qualified institutional buyers.
The accompanying notes are an integral part of the financial statements.
Page 382 of 466
Financial Statements
Statement of Assets and Liabilities as of December 31, 2004
| | | | |
Assets | | | | |
Investments: | | | | |
Investments in securities, at value (cost $166,012,475) — including $12,356,745 of securities loaned | | $ | 209,335,444 | |
Investment in Daily Assets Fund Institutional (cost $12,640,857)* | | | 12,640,857 | |
Investment in Scudder Cash Management QP Trust (cost $3,634,814) | | | 3,634,814 | |
| | |
|
|
|
Total investments in securities, at value (cost $182,288,146) | | | 225,611,115 | |
| | |
|
|
|
Cash | | | 10,000 | |
Foreign currency, at value (cost $177,625) | | | 185,365 | |
Receivable for investments sold | | | 102,172 | |
Dividends receivable | | | 224,660 | |
Interest receivable | | | 9,365 | |
Receivable for Portfolio shares sold | | | 2,478 | |
Due from broker | | | 868,000 | |
Foreign taxes recoverable | | | 737 | |
Other assets | | | 12,562 | |
| | |
|
|
|
Total assets | | | 227,026,454 | |
| | |
|
|
|
Liabilities | | | | |
Unrealized depreciation on forward foreign currency exchange contracts | | | 303,575 | |
Net payable on closed forward foreign currency exchange contracts | | | 45,768 | |
Payable for Portfolio shares redeemed | | | 90,701 | |
Payable upon return of securities loaned | | | 12,640,857 | |
Accrued management fee | | | 165,699 | |
Other accrued expenses and payables | | | 108,515 | |
Total liabilities | | | 13,355,115 | |
| | |
|
|
|
Net assets, at value | | $ | 213,671,339 | |
| | |
|
|
|
Net Assets | | | | |
Net assets consist of: | | | | |
Undistributed net investment income | | | 618,144 | |
Net unrealized appreciation (depreciation) on: | | | | |
Investments | | | 43,322,969 | |
Foreign currency related transactions | | | (295,654 | ) |
Accumulated net realized gain (loss) | | | (51,052,155 | ) |
Paid-in capital | | | 221,078,035 | |
| | |
|
|
|
Net assets, at value | | $ | 213,671,339 | |
| | |
|
|
|
Class A | | | | |
Net Asset Value, offering and redemption price per share ($186,581,095 ÷ 18,888,001 outstanding shares of beneficial interest, $.01 par value, unlimited number of shares authorized) | | $ | 9.88 | |
| | |
|
|
|
Class B | | | | |
Net Asset Value, offering and redemption price per share ($27,090,244 ÷ 2,758,937 outstanding shares of beneficial interest, $.01 par value, unlimited number of shares authorized) | | $ | 9.82 | |
| | |
|
|
|
| * | Represents collateral on securities loaned. |
Page 383 of 466
Statement of Operations for the year ended December 31, 2004
| | | | |
Investment Income | | | | |
Income: | | | | |
Dividends (net of foreign taxes withheld of $52,164) | | $ | 2,650,927 | |
Interest | | | 67,361 | |
Interest — Scudder Cash Management QP Trust | | | 80,209 | |
Securities lending income, including income from Daily Assets Fund Institutional | | | 17,553 | |
| | |
|
|
|
Total Income | | | 2,816,050 | |
| | |
|
|
|
Expenses: | | | | |
Management fee | | | 1,912,915 | |
Custodian and accounting fees | | | 97,919 | |
Distribution service fees (Class B) | | | 53,141 | |
Record keeping fees (Class B) | | | 27,962 | |
Auditing | | | 43,423 | |
Legal | | | 51,620 | |
Trustees’ fees and expenses | | | 1,962 | |
Reports to shareholders | | | 20,850 | |
Other | | | 7,291 | |
| | |
|
|
|
Total expenses, before expense reductions | | | 2,217,083 | |
| | |
|
|
|
Expense reductions | | | (2,269 | ) |
| | |
|
|
|
Total expenses, after expense reductions | | | 2,214,814 | |
| | |
|
|
|
Net investment income (loss) | | | 601,236 | |
| | |
|
|
|
Realized and Unrealized Gain (Loss) on Investment Transactions | | | | |
Net realized gain (loss) from: | | | | |
Investments | | | 9,015,350 | |
Foreign currency related transactions | | | (218,840 | ) |
| | | | 8,796,510 | |
Net unrealized appreciation (depreciation) during the period on: | | | | |
Investments | | | 12,788,925 | |
Foreign currency related transactions | | | (60,746 | ) |
| | | | 12,728,179 | |
| | |
|
|
|
Net gain (loss) on investment transactions | | | 21,524,689 | |
| | |
|
|
|
Net increase (decrease) in net assets resulting from operations | | $ | 22,125,925 | |
| | |
|
|
|
The accompanying notes are an integral part of the financial statements.
Page 384 of 466
Statement of Changes in Net Assets
| | | | | | | | |
| | | Years Ended December 31,
| |
| | | 2004
| | | 2003
| |
Increase (Decrease) in Net Assets | | | | | | | | |
Operations: | | | | | | | | |
Net investment income (loss) | | $ | 601,236 | | | $ | 694,308 | |
Net realized gain (loss) on investment transactions | | | 8,796,510 | | | | (6,450,874 | ) |
Net unrealized appreciation (depreciation) on investment transactions during the period | | | 12,728,179 | | | | 46,205,428 | |
Net increase (decrease) in net assets resulting from operations | | | 22,125,925 | | | | 40,448,862 | |
Distributions to shareholders from: | | | | | | | | |
Net investment income | | | | | | | | |
Class A | | | — | | | | (1,260,686 | ) |
Class B | | | — | | | | (10,289 | ) |
Portfolio share transactions: | | | | | | | | |
| | |
Class A | | | | | | | | |
Proceeds from shares sold | | | 6,502,623 | | | | 34,880,490 | |
Reinvestment of distributions | | | — | | | | 1,260,686 | |
Cost of shares redeemed | | | (28,062,645 | ) | | | (52,309,879 | ) |
| | |
|
|
| |
|
|
|
Net increase (decrease) in net assets from Class A share transactions | | | (21,560,022 | ) | | | (16,168,703 | ) |
| | |
|
|
| |
|
|
|
| | |
Class B | | | | | | | | |
Proceeds from shares sold | | | 11,312,331 | | | | 15,708,908 | |
Reinvestment of distributions | | | — | | | | 10,289 | |
Cost of shares redeemed | | | (1,739,333 | ) | | | (3,045,507 | ) |
Net increase (decrease) in net assets from Class B share transactions | | | 9,572,998 | | | | 12,673,690 | |
Increase (decrease) in net assets | | | 10,138,901 | | | | 35,682,874 | |
| | |
|
|
| |
|
|
|
Net assets at beginning of period | | | 203,532,438 | | | | 167,849,564 | |
| | |
|
|
| |
|
|
|
Net assets at end of period (including undistributed net investment income of $618,144 and $235,748, respectively) | | $ | 213,671,339 | | | $ | 203,532,438 | |
| | |
|
|
| |
|
|
|
Other Information | | | | | | | | |
| | |
Class A | | | | | | | | |
Shares outstanding at beginning of period | | | 21,296,089 | | | | 23,312,732 | |
Shares sold | | | 722,385 | | | | 4,876,864 | |
Shares issued to shareholders in reinvestment of distributions | | | — | | | | 180,614 | |
Shares redeemed | | | (3,130,473 | ) | | | (7,074,121 | ) |
Net increase (decrease) in Portfolio shares | | | (2,408,088 | ) | | | (2,016,643 | ) |
| | |
|
|
| |
|
|
|
Shares outstanding at end of period | | | 18,888,001 | | | | 21,296,089 | |
| | |
|
|
| |
|
|
|
Class B | | | | | | | | |
Shares outstanding at beginning of period | | | 1,676,008 | | | | 53,142 | |
Shares sold | | | 1,276,437 | | | | 2,051,610 | |
Shares issued to shareholders in reinvestment of distributions | | | — | | | | 1,472 | |
Shares redeemed | | | (193,508 | ) | | | (430,216 | ) |
Net increase (decrease) in Portfolio shares | | | 1,082,929 | | | | 1,622,866 | |
| | |
|
|
| |
|
|
|
Shares outstanding at end of period | | | 2,758,937 | | | | 1,676,008 | |
| | |
|
|
| |
|
|
|
The accompanying notes are an integral part of the financial statements.
Page 385 of 466
Financial Highlights
Class A
| | | | | | | | | | | | | | | | | | | |
Years Ended December 31,
| | 2004
| | 2003
| | | 2002***
| | | 2001a
| | | 2000b
| |
| | | | | | | | (Restated) | | | | | | | |
Selected Per Share Data | | | | | | | | | | | | | | | | | | | |
Net asset value, beginning of period | | $ | 8.86 | | $ | 7.18 | | | $ | 9.05 | | | $ | 10.40 | | | $ | 11.49 | |
| | |
|
| |
|
|
| |
|
|
| |
|
|
| |
|
|
|
Income (loss) from investment operations: | | | | | | | | | | | | | | | | | | | |
Net investment income (loss)c | | | .03 | | | .03 | | | | .04 | | | | .08 | | | | .12 | |
Net realized and unrealized gain (loss) on investment transactions | | | .99 | | | 1.71 | | | | (1.86 | ) | | | (1.36 | ) | | | (1.16 | ) |
| | |
|
| |
|
|
| |
|
|
| |
|
|
| |
|
|
|
Total from investment operations | | | 1.02 | | | 1.74 | | | | (1.82 | ) | | | (1.28 | ) | | | (1.04 | ) |
| | |
|
| |
|
|
| |
|
|
| |
|
|
| |
|
|
|
Less distributions from: | | | | | | | | | | | | | | | | | | | |
Net investment income | | | — | | | (.06 | ) | | | (.05 | ) | | | (.07 | ) | | | — | |
Net realized gains on investment transactions | | | — | | | — | | | | — | | | | — | | | | (.05 | ) |
| | |
|
| |
|
|
| |
|
|
| |
|
|
| |
|
|
|
Total distributions | | | — | | | (.06 | ) | | | (.05 | ) | | | (.07 | ) | | | (.05 | ) |
| | |
|
| |
|
|
| |
|
|
| |
|
|
| |
|
|
|
Net asset value, end of period | | $ | 9.88 | | $ | 8.86 | | | $ | 7.18 | | | $ | 9.05 | | | $ | 10.40 | |
| | |
|
| |
|
|
| |
|
|
| |
|
|
| |
|
|
|
Total Return (%) | | | 11.51 | | | 24.37 | | | | (20.22 | ) | | | (12.28 | ) | | | (9.18 | )d |
| | |
|
| |
|
|
| |
|
|
| |
|
|
| |
|
|
|
Ratios to Average Net Assets and Supplemental Data | | | | | | | | | | | | | | | | | | | |
Net assets, end of period ($ millions) | | | 187 | | | 189 | | | | 167 | | | | 179 | | | | 104 | |
Ratio of expenses before expense reductions (%) | | | 1.06 | | | 1.07 | | | | 1.04 | | | | 1.05 | | | | 1.10 | |
Ratio of expenses after expense reductions (%) | | | 1.06 | | | 1.07 | | | | 1.04 | | | | 1.05 | | | | 1.01 | |
Ratio of net investment income (loss) (%) | | | .34 | | | .40 | | | | .54 | | | | .90 | | | | 1.07 | |
Portfolio turnover rate (%) | | | 52 | | | 46 | | | | 57 | | | | 48 | | | | 39 | |
| a | As required, effective January 1, 2001, the Portfolio has adopted the provisions of the AICPA Audit and Accounting Guide for Investment Companies and began amortizing premium on debt securities. The effect of this change for the year ended December 31, 2001 was to decrease net investment income by $.01, increase net realized and unrealized gains and losses by $.01 and decrease the ratio of net investment income to average net assets from .92% to .90%. Per share, ratios and supplemental data for periods prior to January 1, 2001 have not been restated to reflect this change in presentation. |
| b | On June 18, 2001, the Portfolio implemented a 1 for 10 reverse stock split. Per share information, for the period prior to December 31, 2001, has been restated to reflect the effect of the split. Shareholders received 1 share for every 10 shares owned and net asset value per share increased correspondingly. |
| c | Based on average shares outstanding during the period. |
| d | Total return would have been lower had certain expenses not been reduced. |
| *** | Subsequent to December 31, 2002, these numbers have been restated to reflect an adjustment to the value of a security as of December 31, 2002. The effect of this adjustment for the year ended December 31, 2002 was to increase the net asset value per share by $0.03. The total return was also adjusted from -20.56% to -20.22% in accordance with this change. |
Page 386 of 466
Class B
| | | | | | | | | | | | |
Years Ended December 31,
| | 2004
| | | 2003
| | | 2002a***
| |
| | | | | | | | | (Restated) | |
Selected Per Share Data | | | | | | | | | | | | |
Net asset value, beginning of period | | $ | 8.84 | | | $ | 7.17 | | | $ | 7.96 | |
| | |
|
|
| |
|
|
| |
|
|
|
Income (loss) from investment operations: | | | | | | | | | | | | |
Net investment income (loss)b | | | (.01 | ) | | | — | c | | | .02 | |
Net realized and unrealized gain (loss) on investment transactions | | | .99 | | | | 1.71 | | | | (.81 | ) |
| | |
|
|
| |
|
|
| |
|
|
|
Total from investment operations | | | .98 | | | | 1.71 | | | | (.79 | ) |
| | |
|
|
| |
|
|
| |
|
|
|
Less distributions from: | | | | | | | | | | | | |
Net investment income | | | — | | | | (.04 | ) | | | — | |
| | |
|
|
| |
|
|
| |
|
|
|
Net asset value, end of period | | $ | 9.82 | | | $ | 8.84 | | | $ | 7.17 | |
| | |
|
|
| |
|
|
| |
|
|
|
Total Return (%) | | | 11.09 | | | | 23.94 | | | | (9.92 | )** |
| | |
|
|
| |
|
|
| |
|
|
|
Ratios to Average Net Assets and Supplemental Data | | | | | | | | | | | | |
Net assets, end of period ($ millions) | | | 27 | | | | 15 | | | | .4 | |
Ratio of expenses (%) | | | 1.44 | | | | 1.47 | | | | 1.29 | * |
Ratio of net investment income (loss) (%) | | | (.04 | ) | | | (.01 | ) | | | .48 | * |
Portfolio turnover rate (%) | | | 52 | | | | 46 | | | | 57 | |
| a | For the period July 1, 2002 (commencement of operations of Class B shares) to December 31, 2002. |
| b | Based on average shares outstanding during the period. |
| c | Amount is less than $.005 per share. |
| *** | Subsequent to December 31, 2002, these numbers have been restated to reflect an adjustment to the value of a security as of December 31, 2002. The effect of this adjustment for the year ended December 31, 2002 was to increase the net asset value per share by $0.03. The total return was also adjusted from -10.30% to -9.92% in accordance with this change. |
Performance Summary December 31, 2004
SVS Janus Growth Opportunities Portfolio
All performance shown is historical, assumes reinvestment of all dividends and capital gains, and does not guarantee future results. Investment return and principal value fluctuate with changing market conditions so that, when redeemed, shares may be worth more or less then their original cost. Current performance may be lower or higher than the performance data quoted. Please visit scudder.com for the product’s most recent month-end performance. Performance doesn’t reflect charges and fees (“contract charges”) associated with the separate account that invests in the Portfolio or any variable life insurance policy or variable annuity contract for which the Portfolio is an investment option. These charges and fees will reduce returns.
Portfolios that emphasize investments in smaller companies may experience greater price volatility. This Portfolio may at times have significant exposure to certain industry groups, which may react similarly to market developments (resulting in greater price volatility). The Portfolio also may have significant exposure to foreign markets (which include risks such as currency fluctuation and political uncertainty). Please read this Portfolio’s prospectus for specific details regarding its investments and risk profile.
| | |
| Growth of an Assumed $10,000 Investment in SVS Janus Growth Opportunities Portfolio from 10/29/1999 to 12/31/2004 |
|
¨ SVS Janus Growth Opportunities Portfolio — Class A ¨ Russell 1000 Growth Index |
| |
| | The Russell 1000 Growth Index is an unmanaged index composed of common stocks of larger US companies with higher price-to-book ratios and higher forecasted growth values. Index returns assume reinvested dividends and, unlike Portfolio returns, do not reflect any fees or expenses. It is not possible to invest directly into an index. |
Yearly periods ended December 31 | | |
Page 387 of 466
Comparative Results
| | | | | | | | | | | | | | | | | | |
SVS Janus Growth Opportunities Portfolio
| | | | 1-Year
| | | 3-Year
| | | 5-Year
| | | Life of
Portfolio*
| |
Class A | | Growth of $10,000 | | $ | 11,257 | | | $ | 9,898 | | | $ | 6,691 | | | $ | 7,790 | |
| | | Average annual total return | | | 12.57 | % | | | -.34 | % | | | -7.72 | % | | | -4.71 | % |
Russell 1000 Growth Index | | Growth of $10,000 | | $ | 10,630 | | | $ | 9,946 | | | $ | 6,140 | | | $ | 7,145 | |
| | | Average annual total return | | | 6.30 | % | | | -.18 | % | | | -9.29 | % | | | -6.30 | % |
| | | | | |
SVS Janus Growth Opportunities Portfolio
| | | | | | | | | | 1-Year
| | | Life of
Class**
| |
Class B | | Growth of $10,000 | | | | | | | | | | $ | 11,221 | | | $ | 13,152 | |
| | | Average annual total return | | | | | | | | | | | 12.21 | % | | | 11.57 | % |
Russell 1000 Growth Index | | Growth of $10,000 | | | | | | | | | | $ | 10,630 | | | $ | 12,555 | |
| | | Average annual total return | | | | | | | | | | | 6.30 | % | | | 9.53 | % |
The growth of $10,000 is cumulative.
| * | The Portfolio commenced operations on October 29, 1999. Index returns begin on October 31, 1999. Total returns would have been lower for the 5-Year and Life of Portfolio periods for Class A shares if the Portfolio’s expenses were not maintained. |
| ** | The Portfolio commenced offering Class B shares on July 1, 2002. Index returns begin June 30, 2002. |
Information About Your Portfolio’s Expenses
SVS Janus Growth Opportunities Portfolio
As an investor of the Portfolio, you incur two types of costs: ongoing expenses and transaction costs. Ongoing expenses include management fees, distribution and service (12b-1) fees and other Portfolio expenses. Examples of transaction costs include sales charges (loads), redemption fees and account maintenance fees, which are not shown in this section. The following tables are intended to help you understand your ongoing expenses (in dollars) of investing in the Portfolio and to help you compare these expenses with the ongoing expenses of investing in other mutual funds. The tables are based on an investment of $1,000 made at the beginning of the six-month period ended December 31, 2004.
The tables illustrate your Portfolio’s expenses in two ways:
Actual Portfolio Return. This helps you estimate the actual dollar amount of ongoing expenses (but not transaction costs) paid on a $1,000 investment in the Portfolio using the Portfolio’s actual return during the period. To estimate the expenses you paid over the period, simply divide your account value by $1,000 (for example, an $8,600 account value divided by $1,000 = 8.6), then multiply the result by the number in the “Expenses Paid per $1,000” line under the share class you hold.
Hypothetical 5% Portfolio Return. This helps you to compare your Portfolio’s ongoing expenses (but not transaction costs) with those of other mutual funds using the Portfolio’s actual expense ratio and a hypothetical rate of return of 5% per year before expenses. Examples using a 5% hypothetical Portfolio return may be found in the shareholder reports of other mutual funds. The hypothetical account values and expenses may not be used to estimate the actual ending account balance or expenses you paid for the period.
Page 388 of 466
Please note that the expenses shown in these tables are meant to highlight your ongoing expenses only and do not reflect any transaction costs. The “Expenses Paid per $1,000” line of the tables is useful in comparing ongoing expenses only and will not help you determine the relative total expense of owning different funds. If these transaction costs had been included, your costs would have been higher.
Expenses and Value of a $1,000 Investment for the six months ended December 31, 2004
| | | | | | |
Actual Portfolio Return
| | Class A
| | Class B
|
Beginning Account Value 7/1/04 | | $ | 1,000.00 | | $ | 1,000.00 |
Ending Account Value 12/31/04 | | $ | 1,078.90 | | $ | 1,078.20 |
Expenses Paid per $1,000* | | $ | 5.62 | | $ | 7.65 |
| | |
Hypothetical 5% Portfolio Return
| | Class A
| | Class B
|
Beginning Account Value 7/1/04 | | $ | 1,000.00 | | $ | 1,000.00 |
Ending Account Value 12/31/04 | | $ | 1,019.66 | | $ | 1,017.71 |
Expenses Paid per $1,000* | | $ | 5.46 | | $ | 7.42 |
| * | Expenses are equal to the Portfolio’s annualized expense ratio for each share class, multiplied by the average account value over the period, multiplied by the number of days in the most recent six-month period, then divided by 365. |
| | | | | | |
Annualized Expense Ratios
| | Class A
| | | Class B
| |
Scudder Variable Series II — SVS Janus Growth Opportunities Portfolio | | 1.08 | % | | 1.47 | % |
For more information, please refer to the Portfolio’s prospectus.
Management Summary December 31, 2004
SVS Janus Growth Opportunities Portfolio
The portfolio gained 12.57% (Class A shares, unadjusted for contract charges) for the fiscal year ended December 31, 2004, outperforming its benchmark, the Russell 1000 Growth Index, which returned 6.30% during the period.
Among the portfolio’s strongest contributors was package shipper FedEx Corp., which continued to fire on all cylinders despite the wild gyrations in the price of fuel and minimal expansion in its domestic unit.
Internet services leader Yahoo!, Inc. was also a top contributor. Although the initial public offering for search engine developer Google attracted much of the on-line world’s attention in the second half of the year, I remained encouraged by Yahoo’s positioning.
On the negative side, investor discomfort with the computer chip industry pulled down capital equipment maker Applied Materials, Inc. during the period. Although Applied Materials is one of the premier companies in the semiconductor equipment sector, I reduced the portfolio’s stake in the company, redeploying assets from the sale in other, more attractive investment opportunities.
Page 389 of 466
The market’s somewhat pessimistic tone about the entire tech sector also pulled down holdings such as Cisco Systems, Inc. Cisco’s stock took a particularly hard hit during the third quarter when the networking gear manufacturer offered conservative earnings guidance. Management may be seeing some weakness at the margins, but I believe the company is being cautious instead of hinting at a flaw in its business model and therefore I maintained a reduced the portfolio’s position in the stock.
Detractors also included the large drug maker Pfizer, which we liquidated from the portfolio amid concerns over slowing revenue growth, legislative attacks and patent challenges.
Marc Pinto
Portfolio Manager, Janus Capital Management LLC, Subadvisor to the Portfolio
All performance shown is historical, assumes reinvestment of all dividends and capital gains, and does not guarantee future results. Investment return and principal value fluctuate with changing market conditions so that, when redeemed, shares may be worth more or less then their original cost. Current performance may be lower or higher than the performance data quoted. Please visit scudder.com for the product’s most recent month-end performance. Performance doesn’t reflect charges and fees (“contract charges”) associated with the separate account that invests in the portfolio or any variable life insurance policy or variable annuity contract for which the portfolio is an investment option. These charges and fees will reduce returns.
Risk Considerations
This portfolio is subject to stock market risk. The portfolio may at times have significant exposure to certain industry groups, which may react similarly to market developments (resulting in greater price volatility). The portfolio also may have significant exposure to foreign markets (which include risks such as currency fluctuation and political uncertainty). Please read this portfolio’s prospectus for specific details regarding its investments and risk profile.
The Russell 1000 Growth Index is an unmanaged index composed of common stocks of larger US companies with higher price-to-book ratios and higher forecasted growth values. Index returns assume reinvested dividends and, unlike portfolio returns, do not reflect any fees or expenses. It is not possible to invest directly into an index.
Portfolio management market commentary is as of December 31, 2004, and may not come to pass. This information is subject to change at any time based on market and other conditions.
Portfolio Summary
SVS Janus Growth Opportunities Portfolio
| | | | | | |
Asset Allocation
| | 12/31/04
| | | 12/31/03
| |
Common Stocks | | 96 | % | | 98 | % |
Cash Equivalents | | 4 | % | | 2 | % |
| | |
|
| |
|
|
| | | 100 | % | | 100 | % |
| | |
|
| |
|
|
| | | | | | |
Sector Diversification (Excludes Cash Equivalents)
| | 12/31/04
| | | 12/31/03
| |
Information Technology | | 25 | % | | 34 | % |
Health Care | | 21 | % | | 17 | % |
Consumer Discretionary | | 20 | % | | 18 | % |
Industrials | | 13 | % | | 6 | % |
Financials | | 10 | % | | 17 | % |
Energy | | 5 | % | | 4 | % |
Consumer Staples | | 4 | % | | 4 | % |
Materials | | 2 | % | | — | |
| | |
|
| |
|
|
| | | 100 | % | | 100 | % |
| | |
|
| |
|
|
Page 390 of 466
Asset allocation and sector diversification are subject to change.
For more complete details about the Portfolio’s investment portfolio, see page 55. A quarterly Fact Sheet is available upon request. Information concerning portfolio holdings of the Portfolio as of month end will be posted to scudder.com on the 15th of the following month.
Following the Portfolio’s fiscal first and third quarter-end, a complete portfolio holdings listing is filed with the SEC on Form N-Q. The form will be available on the SEC’s Web site at www.sec.gov, and it also may be reviewed and copied at the SEC’s Public Reference Room in Washington, D.C. Information on the operation of the SEC’s Public Reference Room may be obtained by calling (800) SEC-0330.
Investment Portfolio December 31, 2004
SVS Janus Growth Opportunities Portfolio
| | | | |
| | | Shares
| | Value ($)
|
Common Stocks 95.9% | | | | |
Consumer Discretionary 19.4% | | | | |
Hotels Restaurants & Leisure 5.6% | | | | |
Hilton Hotels Corp. | | 104,295 | | 2,371,668 |
McDonald’s Corp. | | 75,910 | | 2,433,675 |
Royal Caribbean Cruises Ltd. | | 55,905 | | 3,043,468 |
| | | | |
|
| | | | | 7,848,811 |
| | | | |
|
Media 3.9% | | | | |
Gemstar-TV Guide International, Inc.* | | 178,190 | | 1,054,885 |
Liberty Media Corp. “A”* | | 109,543 | | 1,202,782 |
Time Warner, Inc.* | | 163,150 | | 3,171,636 |
| | | | |
|
| | | | | 5,429,303 |
| | | | |
|
Multiline Retail 1.7% | | | | |
Target Corp. | | 46,760 | | 2,428,247 |
| | | | |
|
Specialty Retail 6.4% | | | | |
Best Buy Co., Inc. | | 46,335 | | 2,753,226 |
Home Depot, Inc. | | 89,940 | | 3,844,035 |
Staples, Inc. | | 73,070 | | 2,463,190 |
| | | | |
|
| | | | | 9,060,451 |
| | | | |
|
Textiles, Apparel & Luxury Goods 1.8% | | | | |
NIKE, Inc. “B” | | 27,350 | | 2,480,371 |
| | | | |
|
Consumer Staples 4.0% | | | | |
Beverages 1.5% | | | | |
PepsiCo, Inc. | | 39,530 | | 2,063,466 |
| | | | |
|
Page 391 of 466
| | | | |
Household Products 2.5% | | | | |
Procter & Gamble Co. | | 64,005 | | 3,525,396 |
| | | | |
|
Energy 4.2% | | | | |
Energy Equipment & Services 1.3% | | | | |
Halliburton Co. | | 46,965 | | 1,842,907 |
| | | | |
|
Oil & Gas 2.9% | | | | |
ExxonMobil Corp. | | 80,725 | | 4,137,963 |
| | | | |
|
Financials 10.0% | | | | |
Capital Markets 1.8% | | | | |
Morgan Stanley | | 45,180 | | 2,508,393 |
| | | | |
|
Consumer Finance 4.6% | | | | |
American Express Co. | | 78,055 | | 4,399,960 |
SLM Corp. | | 37,200 | | 1,986,108 |
| | | | |
|
| | | | | 6,386,068 |
| | | | |
|
Diversified Financial Services 1.3% | | | | |
Countrywide Financial Corp. | | 51,160 | | 1,893,432 |
| | | | |
|
Insurance 2.3% | | | | |
Allstate Corp. | | 15,665 | | 810,194 |
American International Group, Inc. | | 36,670 | | 2,408,119 |
| | | | |
|
| | | | | 3,218,313 |
| | | | |
|
| | |
| | | Shares
| | Value ($)
|
Health Care 19.7% | | | | |
Biotechnology 5.5% | | | | |
Amgen, Inc.* | | 29,635 | | 1,901,086 |
Genentech, Inc.* | | 106,350 | | 5,789,694 |
| | | | |
|
| | | | | 7,690,780 |
| | | | |
|
Health Care Equipment & Supplies 4.5% | | | | |
Biomet, Inc. | | 43,495 | | 1,887,248 |
Medtronic, Inc. | | 89,760 | | 4,458,379 |
| | | | |
|
| | | | | 6,345,627 |
| | | | |
|
Health Care Providers & Services 6.5% | | | | |
Caremark Rx, Inc.* | | 61,140 | | 2,410,750 |
UnitedHealth Group, Inc. | | 75,165 | | 6,616,775 |
| | | | |
|
| | | | | 9,027,525 |
| | | | |
|
Pharmaceuticals 3.2% | | | | |
Eli Lilly & Co. | | 13,115 | | 744,276 |
Sanofi-Aventis (ADR) | | 94,720 | | 3,793,536 |
| | | | |
|
| | | | | 4,537,812 |
| | | | |
|
Industrials 12.4% | | | | |
Aerospace & Defense 0.7% | | | | |
Raytheon Co. | | 26,435 | | 1,026,471 |
| | | | |
|
Air Freight & Logistics 4.6% | | | | |
FedEx Corp. | | 65,065 | | 6,408,252 |
| | | | |
|
Page 392 of 466
| | | | |
Commercial Services & Supplies 2.0% | | | | |
Apollo Group, Inc. “A”* | | 34,060 | | 2,748,982 |
| | | | |
|
Industrial Conglomerates 5.1% | | | | |
General Electric Co. | | 99,335 | | 3,625,728 |
Tyco International Ltd. | | 100,045 | | 3,575,608 |
| | | | |
|
| | | | | 7,201,336 |
| | | | |
|
Information Technology 24.4% | | | | |
Communications Equipment 5.1% | | | | |
Cisco Systems, Inc.* | | 140,145 | | 2,704,799 |
Motorola, Inc. | | 256,810 | | 4,417,132 |
| | | | |
|
| | | | | 7,121,931 |
| | | | |
|
Computers & Peripherals 4.1% | | | | |
Dell, Inc.* | | 45,600 | | 1,921,584 |
Lexmark International, Inc.* | | 45,360 | | 3,855,600 |
| | | | |
|
| | | | | 5,777,184 |
| | | | |
|
Electronic Equipment & Instruments 1.3% | | | | |
Samsung Electronics Co., Ltd. (GDR), 144A | | 8,255 | | 1,807,845 |
| | | | |
|
Internet Software & Services 3.7% | | | | |
Yahoo!, Inc.* | | 137,530 | | 5,182,130 |
| | | | |
|
Semiconductors & Semiconductor Equipment 4.9% | | | | |
Applied Materials, Inc.* | | 79,615 | | 1,361,416 |
Freescale Semiconductor, Inc. “B”* | | 28,355 | | 520,598 |
Texas Instruments, Inc. | | 204,245 | | 5,028,512 |
| | | | |
|
| | | | | 6,910,526 |
| | | | |
|
| | |
| | | Shares
| | Value ($)
|
Software 5.3% | | | | |
Intuit, Inc.* | | 29,045 | | 1,278,270 |
Microsoft Corp. | | 229,260 | | 6,123,535 |
| | | | |
|
| | | | | 7,401,805 |
| | | | |
|
Materials 1.8% | | | | |
Metals & Mining | | | | |
Rio Tinto PLC (ADR) | | 21,085 | | 2,513,543 |
| | | | |
|
Total Common Stocks (Cost $108,687,462) | | | | 134,524,870 |
| | | | |
|
| | |
| | | Shares
| | Value ($)
|
Cash Equivalents 4.2% | | | | |
Scudder Cash Management QP Trust, 2.24% (b) (Cost $5,926,269) | | 5,926,269 | | 5,926,269 |
| | | | |
|
| | | | | | |
| | | % of Net Assets
| | | Value ($)
| |
Total Investment Portfolio (Cost $114,613,731) (a) | | 100.1 | | | 140,451,139 | |
| | | | | |
|
|
Other Assets and Liabilities, Net | | (0.1 | ) | | (197,001 | ) |
| | | | | |
|
|
Net Assets | | 100.0 | | | 140,254,138 | |
| | | | | |
|
|
Notes to SVS Janus Growth Opportunities Portfolio of Investments
| * | Non-income producing security. |
Page 393 of 466
| (a) | The cost for federal income tax purposes was $115,485,699. At December 31, 2004, net unrealized appreciation for all securities based on tax cost was $24,965,440. This consisted of aggregate gross unrealized appreciation for all securities in which there was an excess of value over tax cost of $26,327,500 and aggregate gross unrealized depreciation for all securities in which there was an excess of tax cost over value of $1,362,060. |
| (b) | Scudder Cash Management QP Trust is managed by Deutsche Investment Management Americas Inc. The rate shown is the annualized seven-day yield at period end. |
ADR: American Depositary Receipts
GDR: Global Depositary Receipts
144A: Security exempt from registration under Rule 144A of the Securities Act of 1933. These securities may be resold in transactions exempt from registrations, normally to qualified institutional buyers.
The accompanying notes are an integral part of the financial statements.
Financial Statements
Statement of Assets and Liabilities as of December 31, 2004
| | | | |
Assets | | | | |
Investments: | | | | |
Investments in securities, at value (cost $108,687,462) | | $ | 134,524,870 | |
Investments in Scudder Cash Management QP Trust (cost $5,926,269) | | | 5,926,269 | |
| | |
|
|
|
Total investments in securities, at value (cost $114,613,731) | | | 140,451,139 | |
| | |
|
|
|
Receivable for Portfolio shares sold | | | 730 | |
Dividends receivable | | | 86,876 | |
Interest receivable | | | 9,917 | |
Other assets | | | 4,402 | |
| | |
|
|
|
Total assets | | | 140,553,064 | |
| | |
|
|
|
Liabilities | | | | |
Accrued management fee | | | 111,015 | |
Payable for Portfolio shares redeemed | | | 97,087 | |
Other accrued expenses and payables | | | 90,824 | |
| | |
|
|
|
Total liabilities | | | 298,926 | |
| | |
|
|
|
Net assets, at value | | $ | 140,254,138 | |
| | |
|
|
|
Net Assets | | | | |
Net assets consist of: | | | | |
Undistributed net investment income | | | 390,216 | |
Net unrealized appreciation (depreciation) on investments | | | 25,837,408 | |
Accumulated net realized gain (loss) | | | (94,273,346 | ) |
Paid-in capital | | | 208,299,860 | |
| | |
|
|
|
Net assets, at value | | $ | 140,254,138 | |
| | |
|
|
|
Class A | | | | |
Net Asset Value, offering and redemption price per share ($131,904,867 ÷ 16,930,734 outstanding shares of beneficial interest, $.01 par value, unlimited number of shares authorized) | | $ | 7.79 | |
| | |
|
|
|
Class B | | | | |
Net Asset Value, offering and redemption price per share ($8,349,271 ÷ 1,081,562 outstanding shares of beneficial interest, $.01 par value, unlimited number of shares authorized) | | $ | 7.72 | |
| | |
|
|
|
Page 394 of 466
Statement of Operations for the year ended December 31, 2004
| | | | |
Investment Income | | | | |
Income: | | | | |
Dividends (net of foreign taxes withheld of $22,429) | | $ | 1,777,664 | |
Interest — Scudder Cash Management QP Trust | | | 62,780 | |
Securities lending income, including income from Daily Assets Fund Institutional | | | 18,197 | |
| | |
|
|
|
Total Income | | | 1,858,641 | |
| | |
|
|
|
Expenses: | | | | |
Management fee | | | 1,285,655 | |
Custodian and accounting fees | | | 74,542 | |
Distribution service fees (Class B) | | | 17,186 | |
Record keeping fees (Class B) | | | 9,344 | |
Auditing | | | 50,258 | |
Legal | | | 4,592 | |
Trustees’ fees and expenses | | | 5,629 | |
Reports to shareholder | | | 6,741 | |
Registration fees | | | 6,565 | |
Other | | | 9,019 | |
| | |
|
|
|
Total expenses, before expense reductions | | | 1,469,531 | |
| | |
|
|
|
Expense reduction | | | (1,728 | ) |
| | |
|
|
|
Total expenses, after expense reduction | | | 1,467,803 | |
| | |
|
|
|
Net investment income (loss) | | | 390,838 | |
| | |
|
|
|
Realized and Unrealized Gain (Loss) on Investment Transactions | | | | |
Net realized gain (loss) from investments | | | 2,198,797 | |
Net unrealized appreciation (depreciation) during the period on investments | | | 13,452,735 | |
| | |
|
|
|
Net gain (loss) on investment transactions | | | 15,651,532 | |
| | |
|
|
|
Net increase (decrease) in net assets resulting from operations | | $ | 16,042,370 | |
| | |
|
|
|
The accompanying notes are an integral part of the financial statements.
Page 395 of 466
| | | | | | | | |
Statement of Changes in Net Assets | | | | | | | | |
| | | Years Ended December 31,
| |
| | | 2004
| | | 2003
| |
Increase (Decrease) in Net Assets | | | | | | | | |
Operations: | | | | | | | | |
Net investment income (loss) | | $ | 390,838 | | | $ | (226,725 | ) |
Net realized gain (loss) on investment transactions | | | 2,198,797 | | | | (16,015,858 | ) |
Net unrealized appreciation (depreciation) on investment transactions during the period | | | 13,452,735 | | | | 46,344,783 | |
Net increase (decrease) in net assets resulting from operations | | | 16,042,370 | | | | 30,102,200 | |
Portfolio share transactions: | | | | | | | | |
| | |
Class A | | | | | | | | |
Proceeds from shares sold | | | 2,971,778 | | | | 7,945,670 | |
Cost of shares redeemed | | | (18,214,445 | ) | | | (22,894,437 | ) |
Net increase (decrease) in net assets from Class A share transactions | | | (15,242,667 | ) | | | (14,948,767 | ) |
| | |
Class B | | | | | | | | |
Proceeds from shares sold | | | 2,248,669 | | | | 5,021,617 | |
Cost of shares redeemed | | | (382,089 | ) | | | (370,373 | ) |
Net increase (decrease) in net assets from Class B share transactions | | | 1,866,580 | | | | 4,651,244 | |
Increase (decrease) in net assets | | | 2,666,283 | | | | 19,804,677 | |
Net assets at beginning of period | | | 137,587,855 | | | | 117,783,178 | |
| | |
|
|
| |
|
|
|
Net assets at end of period (including undistributed net investment income and accumulated net investment loss of $390,216 and $622, respectively) | | $ | 140,254,138 | | | $ | 137,587,855 | |
| | |
|
|
| |
|
|
|
Other Information | | | | | | | | |
| | |
Class A | | | | | | | | |
Shares outstanding at beginning of period | | | 19,085,611 | | | | 21,572,540 | |
Shares sold | | | 413,736 | | | | 1,334,121 | |
Shares redeemed | | | (2,568,613 | ) | | | (3,821,050 | ) |
Net increase (decrease) in Portfolio shares | | | (2,154,877 | ) | | | (2,486,929 | ) |
| | |
|
|
| |
|
|
|
Shares outstanding at end of period | | | 16,930,734 | | | | 19,085,611 | |
| | |
|
|
| |
|
|
|
| | |
Class B | | | | | | | | |
Shares outstanding at beginning of period | | | 812,791 | | | | 31,870 | |
Shares sold | | | 322,383 | | | | 838,111 | |
Shares redeemed | | | (53,612 | ) | | | (57,190 | ) |
Net increase (decrease) in Portfolio shares | | | 268,771 | | | | 780,921 | |
| | |
|
|
| |
|
|
|
Shares outstanding at end of period | | | 1,081,562 | | | | 812,791 | |
| | |
|
|
| |
|
|
|
The accompanying notes are an integral part of the financial statements.
Page 396 of 466
Financial Highlights
Class A
| | | | | | | | | | | | | | | | | | | |
Years Ended December 31,
| | 2004
| | 2003
| | | 2002
| | | 2001
| | | 2000a
| |
Selected Per Share Data | | | | | | | | | | | | | | | | | | | |
Net asset value, beginning of period | | $ | 6.92 | | $ | 5.45 | | | $ | 7.86 | | | $ | 10.31 | | | $ | 11.64 | |
| | |
|
| |
|
|
| |
|
|
| |
|
|
| |
|
|
|
Income (loss) from investment operations: | | | | | | | | | | | | | | | | | | | |
Net investment income (loss)b | | | .02 | | | (.01 | ) | | | (.01 | ) | | | (.03 | ) | | | (.02 | ) |
Net realized and unrealized gain (loss) on investment transactions | | | .85 | | | 1.48 | | | | (2.40 | ) | | | (2.42 | ) | | | (1.31 | ) |
| | |
|
| |
|
|
| |
|
|
| |
|
|
| |
|
|
|
Total from investment operations | | | .87 | | | 1.47 | | | | (2.41 | ) | | | (2.45 | ) | | | (1.33 | ) |
| | |
|
| |
|
|
| |
|
|
| |
|
|
| |
|
|
|
Net asset value, end of period | | $ | 7.79 | | $ | 6.92 | | | $ | 5.45 | | | $ | 7.86 | | | $ | 10.31 | |
| | |
|
| |
|
|
| |
|
|
| |
|
|
| |
|
|
|
Total Return (%) | | | 12.57 | | | 26.97 | | | | (30.53 | ) | | | (23.76 | ) | | | (11.42 | )c |
| | |
|
| |
|
|
| |
|
|
| |
|
|
| |
|
|
|
Ratios to Average Net Assets and Supplemental Data | | | | | | | | | | | | | | | | | | | |
Net assets, end of period ($ millions) | | | 132 | | | 132 | | | | 118 | | | | 164 | | | | 139 | |
Ratio of expenses before expense reductions (%) | | | 1.06 | | | 1.07 | | | | 1.01 | | | | 1.11 | | | | 1.06 | |
Ratio of expenses after expense reductions (%) | | | 1.06 | | | 1.07 | | | | 1.01 | | | | 1.10 | | | | 1.01 | |
Ratio of net investment income (loss) (%) | | | .31 | | | (.17 | ) | | | (.10 | ) | | | (.31 | ) | | | (.20 | ) |
Portfolio turnover rate (%) | | | 58 | | | 50 | | | | 48 | | | | 34 | | | | 14 | |
| a | On June 18, 2001, the Portfolio implemented a 1 for 10 reverse stock split. Share and per share information, for the period prior to December 31, 2001, have been restated to reflect the effect of the split. Shareholders received 1 share for every 10 shares owned and net asset value per share increased correspondingly. |
| b | Based on average shares outstanding during the period. |
| c | Total return would have been lower had certain expenses not been reduced. |
Class B
| | | | | | | | | | | | |
Years Ended December 31,
| | 2004
| | | 2003
| | | 2002a
| |
Selected Per Share Data | | | | | | | | | | | | |
Net asset value, beginning of period | | $ | 6.88 | | | $ | 5.44 | | | $ | 5.87 | |
| | |
|
|
| |
|
|
| |
|
|
|
Income (loss) from investment operations: | | | | | | | | | | | | |
Net investment income (loss)b | | | (.01 | ) | | | (.04 | ) | | | (.01 | ) |
Net realized and unrealized gain (loss) on investment transactions | | | .85 | | | | 1.48 | | | | (.42 | ) |
| | |
|
|
| |
|
|
| |
|
|
|
Total from investment operations | | | .84 | | | | 1.44 | | | | (.43 | ) |
| | |
|
|
| |
|
|
| |
|
|
|
Net asset value, end of period | | $ | 7.72 | | | $ | 6.88 | | | $ | 5.44 | |
| | |
|
|
| |
|
|
| |
|
|
|
Total Return (%) | | | 12.21 | | | | 26.47 | | | | (7.33 | )** |
| | |
|
|
| |
|
|
| |
|
|
|
Ratios to Average Net Assets and Supplemental Data | | | | | | | | | | | | |
Net assets, end of period ($ millions) | | | 8 | | | | 6 | | | | .2 | |
Ratio of expenses (%) | | | 1.45 | | | | 1.46 | | | | 1.29 | * |
Ratio of net investment income (loss) (%) | | | (.08 | ) | | | (.56 | ) | | | (.49 | )* |
Portfolio turnover rate (%) | | | 58 | | | | 50 | | | | 48 | |
| a | For the period July 1, 2002 (commencement of operations of Class B shares) to December 31, 2002. |
| b | Based on average shares outstanding during the period. |
Page 397 of 466
Performance Summary December 31, 2004
SVS MFS Strategic Value Portfolio
All performance shown is historical, assumes reinvestment of all dividends and capital gains, and does not guarantee future results. Investment return and principal value fluctuate with changing market conditions so that, when redeemed, shares may be worth more or less then their original cost. Current performance may be lower or higher than the performance data quoted. Please visit scudder.com for the product’s most recent month-end performance. Performance doesn’t reflect charges and fees (“contract charges”) associated with the separate account that invests in the Portfolio or any variable life insurance policy or variable annuity contract for which the Portfolio is an investment option. These charges and fees will reduce returns.
The Portfolio is subject to stock market and equity risks, meaning stocks in the Portfolio may decline in value for extended periods of time due to the activities and financial prospects of individual companies, or due to general market and economic conditions. Please read this Portfolio’s prospectus for specific details regarding its investments and risk profile.
The investment advisor has agreed to either limit, waive or reduce certain fees, temporarily for this Portfolio; see the prospectus for complete details. Without such limits, waivers or reductions, the performance figures for this Portfolio would be lower.
Growth of an Assumed $10,000 Investment in SVS MFS Strategic Value Portfolio from 5/1/2002 to 12/31/2004
| | |
¨ SVS MFS Strategic Value Portfolio — Class A ¨ Russell 1000 Value Index |
| |
 | | Russell 1000 Value Index is an unmanaged index, which consists of those stocks in the Russell 1000 Index with lower price-to-book ratios and lower forecasted-growth values. Index returns assume reinvested dividends and, unlike Portfolio returns, do not reflect any fees or expenses. It is not possible to invest directly into an index. |
Comparative Results
| | | | | | | | | | |
SVS MFS Strategic Value Portfolio
| | | | 1-Year
| | | Life of Portfolio*
| |
Class A | | Growth of $10,000 | | $ | 11,782 | | | $ | 12,125 | |
| | | Average annual total return | | | 17.82 | % | | | 7.48 | % |
Russell 1000 Value Index | | Growth of $10,000 | | $ | 11,649 | | | $ | 12,730 | |
| | | Average annual total return | | | 16.49 | % | | | 9.47 | % |
| | | |
SVS MFS Strategic Value Portfolio
| | | | 1-Year
| | | Life of Class**
| |
Class B | | Growth of $10,000 | | $ | 11,740 | | | $ | 13,471 | |
| | | Average annual total return | | | 17.40 | % | | | 12.64 | % |
Russell 1000 Value Index | | Growth of $10,000 | | $ | 11,649 | | | $ | 13,438 | |
| | | Average annual total return | | | 16.49 | % | | | 12.55 | % |
The growth of $10,000 is cumulative.
| * | The Portfolio commenced operations on May 1, 2002. Index returns begin April 30, 2002. |
| ** | The Portfolio commenced offering Class B shares on July 1, 2002. Index returns begin June 30, 2002. |
Page 398 of 466
Information About Your Portfolio’s Expenses
SVS MFS Strategic Value Portfolio
As an investor of the Portfolio, you incur two types of costs: ongoing expenses and transaction costs. Ongoing expenses include management fees, distribution and service (12b-1) fees and other Portfolio expenses. Examples of transaction costs include sales charges (loads), redemption fees and account maintenance fees, which are not shown in this section. The following tables are intended to help you understand your ongoing expenses (in dollars) of investing in the Portfolio and to help you compare these expenses with the ongoing expenses of investing in other mutual funds. In the most recent period, the Portfolio limited these expenses; had it not done so, expenses would have been higher. The tables are based on an investment of $1,000 made at the beginning of the six-month period ended December 31, 2004.
The tables illustrate your Portfolio’s expenses in two ways:
Actual Portfolio Return. This helps you estimate the actual dollar amount of ongoing expenses (but not transaction costs) paid on a $1,000 investment in the Portfolio using the Portfolio’s actual return during the period. To estimate the expenses you paid over the period, simply divide your account value by $1,000 (for example, an $8,600 account value divided by $1,000 = 8.6), then multiply the result by the number in the “Expenses Paid per $1,000” line under the share class you hold.
Hypothetical 5% Portfolio Return. This helps you to compare your Portfolio’s ongoing expenses (but not transaction costs) with those of other mutual funds using the Portfolio’s actual expense ratio and a hypothetical rate of return of 5% per year before expenses. Examples using a 5% hypothetical Portfolio return may be found in the shareholder reports of other mutual funds. The hypothetical account values and expenses may not be used to estimate the actual ending account balance or expenses you paid for the period.
Please note that the expenses shown in these tables are meant to highlight your ongoing expenses only and do not reflect any transaction costs. The “Expenses Paid per $1,000” line of the tables is useful in comparing ongoing expenses only and will not help you determine the relative total expense of owning different funds. If these transaction costs had been included, your costs would have been higher.
Expenses and Value of a $1,000 Investment
for the six months ended December 31, 2004
| | | | | | |
Actual Portfolio Return
| | Class A
| | Class B
|
Beginning Account Value 7/1/04 | | $ | 1,000.00 | | $ | 1,000.00 |
Ending Account Value 12/31/04 | | $ | 1,111.10 | | $ | 1,109.30 |
Expenses Paid per $1,000* | | $ | 6.06 | | $ | 7.95 |
| | |
Hypothetical 5% Portfolio Return
| | Class A
| | Class B
|
Beginning Account Value 7/1/04 | | $ | 1,000.00 | | $ | 1,000.00 |
Ending Account Value 12/31/04 | | $ | 1,019.47 | | $ | 1,017.67 |
Expenses Paid per $1,000* | | $ | 5.79 | | $ | 7.60 |
| * | Expenses are equal to the Portfolio’s annualized expense ratio for each share class, multiplied by the average account value over the period, multiplied by the number of days in the most recent six-month period, then divided by 365. |
| | | | | | |
Annualized Expense Ratios
| | Class A
| | | Class B
| |
Scudder Variable Series II — SVS MFS Strategic Value Portfolio | | 1.14 | % | | 1.49 | % |
For more information, please refer to the Portfolio’s prospectus.
Page 399 of 466
Management Summary December 31, 2004
SVS MFS Strategic Value Portfolio
For stock investors, 2004 was a bumpy ride with a smooth finish. Improved corporate spending and earnings growth helped drive solid stock gains in 2004. The portfolio provided a total return of 17.82% (Class A shares, unadjusted for contract charges). This compares with a return of 16.49% over the same period for its benchmark, the Russell 1000 Value Index.
The portfolio’s utilities and communications, materials, and energy sectors were the strongest contributors to relative performance. Within the utilities and telecommunications sector, AT&T Wireless Services* was the portfolio’s strongest relative performer. Texas utility TXU* also provided strong returns. We have since sold these issues from the portfolio to lock in profits. Within the materials sector, packaging products company Owens-Illinois posted strong gains as did Brazilian mining company Companhia Vale Do Rio Doce (ADR). Oil service stocks Noble Corp., GlobalSantaFe Corp. and BJ Services Co. rallied with the energy sector as oil and natural gas prices rose to historical levels.
Stock selection within the leisure and retail sectors held back performance. In leisure, the portfolio’s position in media giant Viacom, Inc. was the single biggest detractor. This declined in tandem with lower than anticipated advertising spending in the period. In retail, poor performance from Rite Aid Corp. was the primary detractor to performance during the period. Other individual issues that detracted from performance were pharmaceutical company Merck & Co., Inc., which suffered from a drug recall, and managed care company Tenet Healthcare Corp. Within the telecommunications area, Nortel Networks Corp.*, a global maker of telecommunications equipment, held back performance.
Kenneth J. Enright
Portfolio Manager
Massachusetts Financial Services Company, Subadvisor to the Portfolio
All performance shown is historical, assumes reinvestment of all dividends and capital gains, and does not guarantee future results. Investment return and principal value fluctuate with changing market conditions so that, when redeemed, shares may be worth more or less than their original cost. Current performance may be lower or higher than the performance data quoted. Please visit scudder.com for the product’s most recent month-end performance. Performance doesn’t reflect charges and fees (“contract charges”) associated with the separate account that invests in the portfolio or any variable life insurance policy or variable annuity contract for which the portfolio is an investment option. These charges and fees will reduce returns.
Returns during part or all of the periods shown reflect a fee waiver and/or expense reimbursement. Without this waiver/reimbursement, returns would have been lower.
Risk Considerations
The portfolio is subject to stock market and equity risks, meaning stocks in the portfolio may decline in value for extended periods of time due to the activities and financial prospects of individual companies, or due to general market and economic conditions. Please read this portfolio’s prospectus for specific details regarding its investments and risk profile.
Russell 1000 Value Index is an unmanaged index which consists of those stocks in the Russell 1000 Index with lower price-to-book ratios and lower forecasted- growth values. Index returns assume the reinvestment of dividends and, unlike portfolio returns, do not reflect any fees or expenses. It is not possible to invest directly into an index.
| * | These securities were not held in the portfolio at the end of the reporting period. |
Page 400 of 466
Portfolio management market commentary is as of December 31, 2004, and may not come to pass. This information is subject to change at any time based on market and other conditions.
Portfolio Summary
SVS MFS Strategic Value Portfolio
| | | | | | |
Asset Allocation (Excludes Securities Lending Collateral)
| | 12/31/04
| | | 12/31/03
| |
Common Stocks | | 97 | % | | 95 | % |
Cash Equivalents | | 3 | % | | 5 | % |
| | |
|
| |
|
|
| | | 100 | % | | 100 | % |
| | |
|
| |
|
|
| | | | | | |
Sector Diversification (Excludes Cash Equivalents and Securities Lending Collateral)
| | 12/31/04
| | | 12/31/03
| |
Financials | | 21 | % | | 19 | % |
Health Care | | 14 | % | | 14 | % |
Consumer Discretionary | | 14 | % | | 14 | % |
Telecommunication Services | | 12 | % | | 14 | % |
Information Technology | | 11 | % | | 3 | % |
Energy | | 8 | % | | 13 | % |
Materials | | 8 | % | | 8 | % |
Industrials | | 6 | % | | 5 | % |
Consumer Staples | | 4 | % | | 5 | % |
Utilities | | 2 | % | | 5 | % |
| | |
|
| |
|
|
| | | 100 | % | | 100 | % |
| | |
|
| |
|
|
Asset allocation and sector diversification are subject to change.
For more complete details about the Portfolio’s investment portfolio, see page 7. A quarterly Fact Sheet is available upon request. Information concerning portfolio holdings of the Portfolio as of month end will be posted to scudder.com on the 15th of the following month.
Following the Portfolio’s fiscal first and third quarter-end, a complete portfolio holdings listing is filed with the SEC on Form N-Q. The form will be available on the SEC’s Web site at www.sec.gov, and it also may be reviewed and copied at the SEC’s Public Reference Room in Washington, D.C. Information on the operation of the SEC’s Public Reference Room may be obtained by calling (800) SEC-0330.
Page 401 of 466
Investment Portfolio December 31, 2004
SVS MFS Strategic Value Portfolio
| | | | |
| | | Shares
| | Value ($)
|
Common Stocks 98.0% | | | | |
Consumer Discretionary 13.9% | | | | |
Leisure Equipment & Products 1.3% | | | | |
Mattel, Inc. | | 34,020 | | 663,050 |
| | | | |
|
Media 9.9% | | | | |
Comcast Corp. “A”* | | 49,210 | | 1,616,056 |
Interpublic Group of Companies, Inc.* | | 23,520 | | 315,168 |
Viacom, Inc. “B” | | 49,625 | | 1,805,854 |
Walt Disney Co. | | 40,180 | | 1,117,004 |
| | | | |
|
| | | | | 4,854,082 |
| | | | |
|
Specialty Retail 2.7% | | | | |
Home Depot, Inc. | | 13,100 | | 559,894 |
The Gap, Inc. | | 36,990 | | 781,229 |
| | | | |
|
| | | | | 1,341,123 |
| | | | |
|
Consumer Staples 3.7% | | | | |
Beverages 0.9% | | | | |
PepsiCo, Inc. | | 8,660 | | 452,052 |
| | | | |
|
Food & Staples Retailing 1.0% | | | | |
Rite Aid Corp.* | | 130,690 | | 478,325 |
| | | | |
|
Food Products 1.8% | | | | |
General Mills, Inc. | | 17,470 | | 868,434 |
| | | | |
|
Energy 8.1% | | | | |
Energy Equipment & Services 6.7% | | | | |
BJ Services Co. | | 10,940 | | 509,148 |
Cooper Cameron Corp.* | | 14,730 | | 792,621 |
GlobalSantaFe Corp. | | 32,330 | | 1,070,446 |
Noble Corp.* | | 18,860 | | 938,097 |
| | | | |
|
| | | | | 3,310,312 |
| | | | |
|
Oil & Gas 1.4% | | | | |
Devon Energy Corp. | | 17,460 | | 679,543 |
| | | | |
|
Financials 20.7% | | | | |
Banks 3.4% | | | | |
Bank of America Corp. | | 14,188 | | 666,694 |
PNC Financial Services Group | | 17,120 | | 983,373 |
| | | | |
|
| | | | | 1,650,067 |
| | | | |
|
Capital Markets 4.6% | | | | |
Mellon Financial Corp. | | 37,920 | | 1,179,691 |
Merrill Lynch & Co., Inc. | | 18,550 | | 1,108,734 |
| | | | |
|
| | | | | 2,288,425 |
| | | | |
|
Consumer Finance 0.5% | | | | |
MBNA Corp. | | 9,490 | | 267,523 |
| | | | |
|
Diversified Financial Services 5.9% | | | | |
Freddie Mac | | 15,940 | | 1,174,778 |
JPMorgan Chase & Co. | | 44,030 | | 1,717,610 |
| | | | |
|
| | | | | 2,892,388 |
| | | | |
|
Page 402 of 466
| | | | |
Insurance 6.3% | | | | |
Allstate Corp. | | 22,500 | | 1,163,700 |
Conseco, Inc.* | | 54,760 | | 1,092,462 |
| | |
| | | Shares
| | Value ($)
|
Hartford Financial Services Group, Inc. | | 12,480 | | 864,989 |
| | | | |
|
| | | | | 3,121,151 |
| | | | |
|
Health Care 14.3% | | | | |
Biotechnology 0.9% | | | | |
MedImmune, Inc.* | | 15,760 | | 427,253 |
| | | | |
|
Health Care Providers & Services 2.8% | | | | |
Apria Healthcare Group, Inc.* | | 19,640 | | 647,138 |
Tenet Healthcare Corp.* | | 69,260 | | 760,475 |
| | | | |
|
| | | | | 1,407,613 |
| | | | |
|
Pharmaceuticals 10.6% | | | | |
Abbott Laboratories | | 16,180 | | 754,797 |
Johnson & Johnson | | 19,110 | | 1,211,956 |
Merck & Co., Inc. | | 54,330 | | 1,746,166 |
Wyeth | | 35,640 | | 1,517,908 |
| | | | |
|
| | | | | 5,230,827 |
| | | | |
|
Industrials 5.7% | | | | |
Aerospace & Defense 2.6% | | | | |
Lockheed Martin Corp. | | 22,980 | | 1,276,539 |
| | | | |
|
Airlines 0.5% | | | | |
Southwest Airlines Co. | | 16,480 | | 268,294 |
| | | | |
|
Industrial Conglomerates 2.6% | | | | |
General Electric Co. | | 32,490 | | 1,185,885 |
Tyco International Ltd. | | 2,020 | | 72,195 |
| | | | |
|
| | | | | 1,258,080 |
| | | | |
|
Information Technology 10.6% | | | | |
Communications Equipment 6.5% | | | | |
Nokia Oyj (ADR) | | 104,960 | | 1,644,723 |
Nortel Networks Corp.* | | 449,810 | | 1,569,837 |
| | | | |
|
| | | | | 3,214,560 |
| | | | |
|
Software 4.1% | | | | |
Computer Associates International, Inc. | | 25,820 | | 801,969 |
Microsoft Corp. | | 44,590 | | 1,190,999 |
| | | | |
|
| | | | | 1,992,968 |
| | | | |
|
Materials 7.7% | | | | |
Chemicals 1.1% | | | | |
E.I. du Pont de Nemours & Co. | | 11,490 | | 563,585 |
| | | | |
|
Containers & Packaging 3.8% | | | | |
Owens-Illinois, Inc.* | | 68,360 | | 1,548,354 |
Smurfit-Stone Container Corp.* | | 16,900 | | 315,692 |
| | | | |
|
| | | | | 1,864,046 |
| | | | |
|
Metals & Mining 1.2% | | | | |
Companhia Vale do Rio Doce (ADR) | | 19,740 | | 572,657 |
| | | | |
|
Page 403 of 466
| | | | |
Paper & Forest Products 1.6% | | | | |
Bowater, Inc. | | 18,440 | | 810,807 |
| | | | |
|
Telecommunication Services 11.5% | | | | |
Diversified Telecommunication Services 9.3% | | | | |
Sprint Corp. | | 98,170 | | 2,439,524 |
Verizon Communications, Inc. | | 53,260 | | 2,157,563 |
| | | | |
|
| | | | | 4,597,087 |
| | | | |
|
| | |
| | | Shares
| | Value ($)
|
Wireless Telecommunication Services 2.2% | | | | |
Vodafone Group PLC (ADR) | | 38,479 | | 1,053,555 |
| | | | |
|
Utilities 1.8% | | | | |
Multi-Utilities | | | | |
Calpine Corp.* (d) | | 218,150 | | 859,511 |
| | | | |
|
Total Common Stocks (Cost $42,406,825) | | | | 48,263,857 |
| | | | |
|
Daily Assets Fund Institutional, 2.25% (c) (e) (Cost $900,000) | | 900,000 | | 900,000 |
| | | | |
|
| | |
| | | Shares
| | Value ($)
|
Scudder Cash Management QP Trust, 2.24% (b) (Cost $1,510,711) | | 1,510,711 | | 1,510,711 |
| | | | |
|
| | | | | | |
| | | % of Net Assets
| | | Value ($)
| |
Total Investment Portfolio (Cost $44,817,536) (a) | | 102.9 | | | 50,674,568 | |
| | | | | |
|
|
Other Assets and Liabilities, Net | | (2.9 | ) | | (1,408,430 | ) |
| | | | | |
|
|
Net Assets | | 100.0 | | | 49,266,138 | |
| | | | | |
|
|
Notes to SVS MFS Strategic Value Portfolio of Investments
| * | Non-income producing security. |
| (a) | The cost for federal income tax purposes was $44,925,927. At December 31, 2004, net unrealized appreciation for all securities based on tax cost was $5,748,641. This consisted of aggregate gross unrealized appreciation for all securities in which there was an excess of value over tax cost of $6,420,135 and aggregate gross unrealized depreciation for all securities in which there was an excess of tax cost over value of $671,494. |
| (b) | Scudder Cash Management QP Trust is managed by Deutsche Investment Management Americas Inc. The rate shown is the annualized seven-day yield at period end. |
| (c) | Daily Assets Fund Institutional, an affiliated fund, is managed by Deutsche Asset Management, Inc. The rate shown is the annualized seven-day yield at period end. |
| (d) | All or a portion of these securities were on loan (see Notes to Financials Statements). The value of all securities loaned at December 31, 2004 amounted to $709,200, which is 1.4% of total net assets. |
| (e) | Represents collateral held in connection with securities lending. |
ADR: American Depositary Receipt
The accompanying notes are an integral part of the financial statements.
Page 404 of 466
Financial Statements
Statement of Assets and Liabilities as of December 31, 2004
| | | |
Assets |
Investments: | | | |
Investments in securities, at value (cost $42,406,825) — including $709,200 of securities loaned | | $ | 48,263,857 |
Investment in Daily Assets Fund Institutional (cost $900,000)* | | | 900,000 |
Investment in Scudder Cash Management QP Trust (cost $1,510,711) | | | 1,510,711 |
| | |
|
|
Total investments in securities, at value (cost $44,817,536) | | | 50,674,568 |
| | |
|
|
Cash | | | 10,000 |
Receivable for investments sold | | | 23,482 |
Dividends receivable | | | 73,977 |
Interest receivable | | | 2,072 |
Receivable for Portfolio shares sold | | | 22,689 |
Due from Advisor | | | 9,753 |
Other assets | | | 1,471 |
| | |
|
|
Total assets | | | 50,818,012 |
| | |
|
|
Liabilities |
Payable for investments purchased | | | 499,077 |
Payable upon return of securities loaned | | | 900,000 |
Payable for Portfolio shares redeemed | | | 106,169 |
Other accrued expenses and payables | | | 46,628 |
| | |
|
|
Total liabilities | | | 1,551,874 |
| | |
|
|
Net assets, at value | | $ | 49,266,138 |
| | |
|
|
Net Assets |
Net assets consist of: | | | |
Undistributed net investment income | | | 250,729 |
Net unrealized appreciation (depreciation) on investments | | | 5,857,032 |
Accumulated net realized gain (loss) | | | 2,256,840 |
Paid-in capital | | | 40,901,537 |
| | |
|
|
Net assets, at value | | $ | 49,266,138 |
| | |
|
|
Class A | | | |
Net Asset Value, offering and redemption price per share ($15,264,785 ÷ 1,271,678 outstanding shares of beneficial interest, $.01 par value, unlimited number of shares authorized) | | $ | 12.00 |
| | |
|
|
Class B | | | |
Net Asset Value, offering and redemption price per share ($34,001,353 ÷ 2,837,941 outstanding shares of beneficial interest, $.01 par value, unlimited number of shares authorized) | | $ | 11.98 |
| | |
|
|
| * | Represents collateral on securities loaned. |
Page 405 of 466
Statement of Operations for the year ended December 31, 2004
| | | | |
Investment Income | | | | |
Income: | | | | |
Dividends (net of foreign taxes withheld of $2,193) | | $ | 701,158 | |
Interest — Scudder Cash Management QP Trust | | | 16,929 | |
Securities lending income, including income from Daily Assets Fund Institutional | | | 5,687 | |
| | |
|
|
|
Total Income | | | 723,774 | |
| | |
|
|
|
Expenses: | | | | |
Management fee | | | 313,713 | |
Custodian and accounting fees | | | 100,482 | |
Distribution service fees (Class B) | | | 59,488 | |
Record keeping fees (Class B) | | | 30,143 | |
Auditing | | | 38,625 | |
Legal | | | 13,508 | |
Trustees’ fees and expenses | | | 691 | |
Other | | | 1,536 | |
| | |
|
|
|
Total expenses, before expense reductions | | | 558,186 | |
| | |
|
|
|
Expense reductions | | | (90,177 | ) |
| | |
|
|
|
Total expenses, after expense reductions | | | 468,009 | |
| | |
|
|
|
Net investment income (loss) | | | 255,765 | |
| | |
|
|
|
Realized and Unrealized Gain (Loss) on Investment Transactions | | | | |
Net realized gain (loss) from: | | | | |
Investments | | | 2,454,847 | |
Net unrealized appreciation (depreciation) during the period on investments | | | 3,679,166 | |
| | |
|
|
|
Net gain (loss) on investment transactions | | | 6,134,013 | |
| | |
|
|
|
Net increase (decrease) in net assets resulting from operations | | $ | 6,389,778 | |
| | |
|
|
|
The accompanying notes are an integral part of the financial statements.
Page 406 of 466
Statement of Changes in Net Assets
| | | | | | | | |
| | | Years Ended December 31,
| |
Increase (Decrease) in Net Assets
| | 2004
| | | 2003
| |
Operations: | | | | | | | | |
Net investment income (loss) | | $ | 255,765 | | | $ | 49,544 | |
Net realized gain (loss) | | | 2,454,847 | | | | 173,186 | |
Net unrealized appreciation (depreciation) on investment transactions during the period | | | 3,679,166 | | | | 2,553,196 | |
Net increase (decrease) in net assets resulting from operations | | | 6,389,778 | | | | 2,775,926 | |
Distributions to shareholders from: | | | | | | | | |
Net investment income: | | | | | | | | |
Class A | | | (35,768 | ) | | | (20,827 | ) |
Class B | | | (15,246 | ) | | | (4,093 | ) |
Net realized gains: | | | | | | | | |
Class A | | | (4,650 | ) | | | — | |
Class B | | | (10,656 | ) | | | — | |
Portfolio share transactions: | | | | | | | | |
| | |
Class A | | | | | | | | |
Proceeds from shares sold | | | 7,917,703 | | | | 1,854,390 | |
Reinvestment of distributions | | | 40,418 | | | | 20,827 | |
Cost of shares redeemed | | | (1,562,312 | ) | | | (694,321 | ) |
| | |
|
|
| |
|
|
|
Net increase (decrease) in net assets from Class A share transactions | | | 6,395,809 | | | | 1,180,896 | |
| | |
|
|
| |
|
|
|
Class B | | | | | | | | |
Proceeds from shares sold | | | 18,488,884 | | | | 10,810,720 | |
Reinvestment of distributions | | | 25,902 | | | | 4,093 | |
Cost of shares redeemed | | | (1,646,414 | ) | | | (26,887 | ) |
Net increase (decrease) in net assets from Class B share transactions | | | 16,868,372 | | | | 10,787,926 | |
Increase (decrease) in net assets | | | 29,587,639 | | | | 14,719,828 | |
| | |
|
|
| |
|
|
|
Net assets at beginning of period | | | 19,678,499 | | | | 4,958,671 | |
| | |
|
|
| |
|
|
|
Net assets at end of period (including undistributed net investment income of $250,729 and $45,978, respectively) | | $ | 49,266,138 | | | $ | 19,678,499 | |
| | |
|
|
| |
|
|
|
Other Information | | | | | | | | |
| | |
Class A | | | | | | | | |
Shares outstanding at beginning of period | | | 688,664 | | | | 568,433 | |
Shares sold | | | 725,099 | | | | 201,550 | |
Shares issued to shareholders in reinvestment of distributions | | | 3,864 | | | | 2,726 | |
Shares redeemed | | | (145,949 | ) | | | (84,045 | ) |
Net increase in Portfolio shares | | | 583,014 | | | | 120,231 | |
| | |
|
|
| |
|
|
|
Shares outstanding at end of period | | | 1,271,678 | | | | 688,664 | |
| | |
|
|
| |
|
|
|
Class B | | | | | | | | |
Shares outstanding at beginning of period | | | 1,236,034 | | | | 42,038 | |
Shares sold | | | 1,749,677 | | | | 1,196,368 | |
Shares issued to shareholders in reinvestment of distributions | | | 2,474 | | | | 536 | |
Shares redeemed | | | (150,244 | ) | | | (2,908 | ) |
Net increase in Portfolio shares | | | 1,601,907 | | | | 1,193,996 | |
| | |
|
|
| |
|
|
|
Shares outstanding at end of period | | | 2,837,941 | | | | 1,236,034 | |
| | |
|
|
| |
|
|
|
The accompanying notes are an integral part of the financial statements.
Page 407 of 466
Financial Highlights
Class A
| | | | | | | | | | | | |
Year Ended December 31,
| | 2004
| | | 2003
| | | 2002a
| |
Selected Per Share Data | | | | | | | | | | | | |
Net asset value, beginning of period | | $ | 10.24 | | | $ | 8.12 | | | $ | 10.00 | |
| | |
|
|
| |
|
|
| |
|
|
|
Income (loss) from investment operations: | | | | | | | | | | | | |
Net investment income (loss)b | | | .11 | | | | .06 | | | | .05 | |
Net realized and unrealized gain (loss) on investment transactions | | | 1.71 | | | | 2.10 | | | | (1.93 | ) |
| | |
|
|
| |
|
|
| |
|
|
|
Total from investment operations | | | 1.82 | | | | 2.16 | | | | (1.88 | ) |
| | |
|
|
| |
|
|
| |
|
|
|
Less distributions from: | | | | | | | | | | | | |
Net investment income | | | (.05 | ) | | | (.04 | ) | | | — | |
Net realized gains | | | (.01 | ) | | | — | | | | — | |
| | |
|
|
| |
|
|
| |
|
|
|
Total distributions | | | (.06 | ) | | | (.04 | ) | | | — | |
| | |
|
|
| |
|
|
| |
|
|
|
Net asset value, end of period | | $ | 12.00 | | | $ | 10.24 | | | $ | 8.12 | |
| | |
|
|
| |
|
|
| |
|
|
|
Total Return (%)c | | | 17.82 | | | | 26.74 | | | | (18.80 | )** |
| | |
|
|
| |
|
|
| |
|
|
|
Ratios to Average Net Assets and Supplemental Data | | | | | | | | | | | | |
Net assets, end of period ($ millions) | | | 15 | | | | 7 | | | | 5 | |
Ratio of expenses before expense reductions (%) | | | 1.42 | | | | 1.93 | | | | 2.71 | * |
Ratio of expenses after expense reductions (%) | | | 1.14 | | | | 1.15 | | | | 1.15 | * |
Ratio of net investment income (loss) (%) | | | 1.05 | | | | .67 | | | | .82 | * |
Portfolio turnover rate (%) | | | 54 | | | | 40 | | | | 7 | |
| a | For the period from May 1, 2002 (commencement of operations) to December 31, 2002. |
| b | Based on average shares outstanding during the period. |
| c | Total return would have been lower had certain expenses not been reduced. |
Class B
| | | | | | | | | | | | |
Year Ended December 31,
| | 2004
| | | 2003
| | | 2002a
| |
Selected Per Share Data | | | | | | | | | | | | |
Net asset value, beginning of period | | $ | 10.22 | | | $ | 8.11 | | | $ | 8.93 | |
| | |
|
|
| |
|
|
| |
|
|
|
Income (loss) from investment operations: | | | | | | | | | | | | |
Net investment income (loss)b | | | .07 | | | | .02 | | | | .04 | |
Net realized and unrealized gain (loss) on investment transactions | | | 1.71 | | | | 2.11 | | | | (.86 | ) |
| | |
|
|
| |
|
|
| |
|
|
|
Total from investment operations | | | 1.78 | | | | 2.13 | | | | (.82 | ) |
| | |
|
|
| |
|
|
| |
|
|
|
Less distributions from: | | | | | | | | | | | | |
Net investment income | | | (.01 | ) | | | (.02 | ) | | | — | |
Net realized gains | | | (.01 | ) | | | — | | | | — | |
| | |
|
|
| |
|
|
| |
|
|
|
Total distributions | | | (.02 | ) | | | (.02 | ) | | | — | |
| | |
|
|
| |
|
|
| |
|
|
|
Page 408 of 466
| | | | | | | | | | |
Net asset value, end of period | | $ | 11.98 | | $ | 10.22 | | $ | 8.11 | |
| | |
|
| |
|
| |
|
|
|
Total Return (%)c | | | 17.40 | | | 26.35 | | | (9.18 | )** |
| | |
|
| |
|
| |
|
|
|
Ratios to Average Net Assets and Supplemental Data | | | | | | | | | | |
Net assets, end of period ($ millions) | | | 34 | | | 13 | | | .3 | |
Ratio of expenses before expense reductions (%) | | | 1.79 | | | 2.32 | | | 2.96 | * |
Ratio of expenses after expense reductions (%) | | | 1.52 | | | 1.54 | | | 1.40 | * |
Ratio of net investment income (loss) (%) | | | .67 | | | .28 | | | .87 | * |
Portfolio turnover rate (%) | | | 54 | | | 40 | | | 7 | |
| a | For the period from July 1, 2002 (commencement of operations of Class B shares) to December 31, 2002. |
| b | Based on average shares outstanding during the period. |
| c | Total return would have been lower had certain expenses not been reduced. |
Performance Summary December 31, 2004
SVS Oak Strategic Equity Portfolio
All performance shown is historical, assumes reinvestment of all dividends and capital gains, and does not guarantee future results. Investment return and principal value fluctuate with changing market conditions so that, when redeemed, shares may be worth more or less then their original cost. Current performance may be lower or higher than the performance data quoted. Please visit scudder.com for the product’s most recent month-end performance. Performance doesn’t reflect charges and fees (“contract charges”) associated with the separate account that invests in the Portfolio or any variable life insurance policy or variable annuity contract for which the Portfolio is an investment option. These charges and fees will reduce returns.
The Portfolio may concentrate investments in specific sectors, which creates special risk considerations. Please read this Portfolio’s prospectus for specific details regarding its investments and risk profile.
| | |
| Growth of an Assumed $10,000 Investment in SVS Oak Strategic Equity Portfolio from 5/1/2001 to 12/31/2004 |
|
| ¨ SVS Oak Strategic Equity Portfolio — Class A |
|
| ¨ Russell 1000 Growth Index |
 | | The Russell 1000 Growth Index is an unmanaged index which consists of those stocks in the Russell 1000 Index with higher price-to-book ratios and higher forecasted growth values. Index returns assume reinvested dividends and, unlike Portfolio returns, do not reflect any fees or expenses. It is not possible to invest directly into an index. |
| | | | | | | | | | | | | | |
| Comparative Results | |
| | | | |
SVS Oak Strategic Equity Portfolio
| | | | 1-Year
| | | 3-Year
| | | Life of Portfolio*
| |
| Class A | | Growth of $10,000 | | $ | 10,131 | | | $ | 9,145 | | | $ | 6,950 | |
| | | Average annual total return | | | 1.31 | % | | | -2.94 | % | | | -9.44 | % |
| Russell 1000 Growth Index | | Growth of $10,000 | | $ | 10,630 | | | $ | 9,946 | | | $ | 8,883 | |
| | | Average annual total return | | | 6.30 | % | | | -.18 | % | | | -3.18 | % |
| | | | |
SVS Oak Strategic Equity Portfolio
| | | | | | | 1-Year
| | | Life of Class**
| |
| Class B | | Growth of $10,000 | | | | | | $ | 10,088 | | | $ | 13,671 | |
| | | Average annual total return | | | | | | | .88 | % | | | 13.31 | % |
| Russell 1000 Growth Index | | Growth of $10,000 | | | | | | $ | 10,630 | | | $ | 12,555 | |
| | | | | | | | | | | | | | | |
| | | Average annual total return | | | | | | | 6.30 | % | | | 9.53 | % |
| | | | | | | | | | | | | | | |
Page 409 of 466
The growth of $10,000 is cumulative.
| * | The Portfolio commenced operations on May 1, 2001. Index returns begin April 30, 2001. Total returns would have been lower for the 3-Year Life of Portfolio period for Class A shares if the Portfolio’s expenses were not maintained. |
| ** | The Portfolio commenced offering Class B shares on July 1, 2002. Index returns begin June 30, 2002. |
Information About Your Portfolio’s Expenses
SVS Oak Strategic Equity Portfolio
As an investor of the Portfolio, you incur two types of costs: ongoing expenses and transaction costs. Ongoing expenses include management fees, distribution and service (12b-1) fees and other Portfolio expenses. Examples of transaction costs include sales charges (loads), redemption fees and account maintenance fees, which are not shown in this section. The following tables are intended to help you understand your ongoing expenses (in dollars) of investing in the Portfolio and to help you compare these expenses with the ongoing expenses of investing in other mutual funds. In the most recent six-month period, the Portfolio limited these expenses; had it not done so, expenses would have been higher. The tables are based on an investment of $1,000 made at the beginning of the six-month period ended December 31, 2004.
The tables illustrate your Portfolio’s expenses in two ways:
Actual Portfolio Return. This helps you estimate the actual dollar amount of ongoing expenses (but not transaction costs) paid on a $1,000 investment in the Portfolio using the Portfolio’s actual return during the period. To estimate the expenses you paid over the period, simply divide your account value by $1,000 (for example, an $8,600 account value divided by $1,000 = 8.6), then multiply the result by the number in the “Expenses Paid per $1,000” line under the share class you hold.
Hypothetical 5% Portfolio Return. This helps you to compare your Portfolio’s ongoing expenses (but not transaction costs) with those of other mutual funds using the Portfolio’s actual expense ratio and a hypothetical rate of return of 5% per year before expenses. Examples using a 5% hypothetical Portfolio return may be found in the shareholder reports of other mutual funds. The hypothetical account values and expenses may not be used to estimate the actual ending account balance or expenses you paid for the period.
Please note that the expenses shown in these tables are meant to highlight your ongoing expenses only and do not reflect any transaction costs. The “Expenses Paid per $1,000” line of the tables is useful in comparing ongoing expenses only and will not help you determine the relative total expense of owning different funds. If these transaction costs had been included, your costs would have been higher.
Expenses and Value of a $1,000 Investment for the six months ended December 31, 2004
| | | | | | |
Actual Portfolio Return
| | Class A
| | Class B
|
Beginning Account Value 7/1/04 | | $ | 1,000.00 | | $ | 1,000.00 |
Ending Account Value 12/31/04 | | $ | 1,019.10 | | $ | 1,016.20 |
Expenses Paid per $1,000* | | $ | 5.77 | | $ | 7.67 |
Page 410 of 466
| | | | | | |
| | |
Hypothetical 5% Portfolio Return
| | Class A
| | Class B
|
Beginning Account Value 7/1/04 | | $ | 1,000.00 | | $ | 1,000.00 |
Ending Account Value 12/31/04 | | $ | 1,019.49 | | $ | 1,017.59 |
Expenses Paid per $1,000* | | $ | 5.77 | | $ | 7.68 |
| * | Expenses are equal to the Portfolio’s annualized expense ratio for each share class, multiplied by the average account value over the period, multiplied by the number of days in the most recent six-month period, then divided by 365. |
| | | | | | |
Annualized Expense Ratios
| | Class A
| | | Class B
| |
Scudder Variable Series II — SVS Oak Strategic Equity Portfolio | | 1.13 | % | | 1.51 | % |
For more information, please refer to the Portfolio’s prospectus.
Management Summary December 31, 2004
SVS Oak Strategic Equity Portfolio
Whereas the portfolio returned 1.31% (Class A shares, unadjusted for sales charges), its benchmark, the Russell 1000 Growth Index, returned 6.30% for the 12-month period ended December 31, 2004. The portfolio underperformed in 2004 due to its lack of exposure to the energy, materials and industrial sectors. These sectors benefited from the sharp rise in commodity prices that typically occurs in the early stages of an economic recovery. Oak Associates does not manage the portfolio in relationship to a benchmark and, therefore, did not have exposure to these groups. Oak has avoided these sectors as we believe their performance is tied to the short-term reinflation of commodities — which is inconsistent with our three-to-five year investment time horizon.
The relative performance disparity was also exacerbated by the portfolio’s overweight in information technology compared with the benchmark Russell 1000 Growth Index. Within information technology, semiconductor stocks in particular weighed on performance as companies such as PMC-Sierra, Intersil and Xilinx* suffered from inventory surplus concerns following a robust 2003. Storage software vendor Veritas Software* also hampered performance after the company reported weak second-quarter sales during the third quarter. This announcement was not well received following recent management turnover in the company and concerns regarding management’s credibility. Veritas was ultimately sold from the portfolio.
Despite being underweight in health care compared with the benchmark, weakness in Cardinal Health* caused the portfolio’s health care weighting to underperform the benchmark. Cardinal, a drug distribution company, has struggled not only with meeting earnings forecasts, but also with the transition to a fee-for-service business model. Pfizer, Inc., along with other large pharmaceutical companies, suffered when the Food and Drug Administration raised a red flag on the Cox-2 class of arthritis drugs.
On a positive note, on-line auctioneer eBay, Inc. helped offset the weaknesses in technology and health care by propelling the portfolio’s consumer discretionary sector performance significantly higher than that of the benchmark.
Page 411 of 466
James D. Oelschlager
Portfolio Manager
Oak Associates, Ltd., Subadvisor to the Portfolio
All performance shown is historical, assumes reinvestment of all dividends and capital gains, and does not guarantee future results. Investment return and principal value fluctuate with changing market conditions so that, when redeemed, shares may be worth more or less than their original cost. Current performance may be lower or higher than the performance data quoted. Please visit scudder.com for the product’s most recent month-end performance. Performance doesn’t reflect charges and fees (“contract charges”) associated with the separate account that invests in the portfolio or any variable life insurance policy or variable annuity contract for which the portfolio is an investment option. These charges and fees will reduce returns.
Risk Considerations
The portfolio may concentrate investments in specific sectors, which creates special risk considerations. Please read this portfolio’s prospectus for specific details regarding its investments and risk profile.
The Russell 1000 Growth Index is an unmanaged, capitalization-weighted index which consists of those securities in the Russell 1000 Index with higher price-to-book ratios and higher forecasted growth values. Index returns assume reinvestment of all distributions and do not reflect fees or expenses. It is not possible to invest directly into an index.
| * | This security was not held in the portfolio at the end of the reporting period. |
Portfolio management market commentary is as of December 31, 2004, and may not come to pass. This information is subject to change at any time based on market and other conditions.
Portfolio Summary
SVS Oak Strategic Equity Portfolio
| | | | | | |
Asset Allocation (Excludes Securities Lending Collateral)
| | 12/31/04
| | | 12/31/03
| |
Common Stocks | | 99 | % | | 97 | % |
Cash Equivalents | | 1 | % | | 3 | % |
| | |
|
| |
|
|
| | | 100 | % | | 100 | % |
| | |
|
| |
|
|
| | | | | | |
Sector Diversification (Excludes Cash Equivalents and Securities Lending Collateral)
| | 12/31/04
| | | 12/31/03
| |
Information Technology | | 56 | % | | 56 | % |
Health Care | | 15 | % | | 18 | % |
Financials | | 14 | % | | 21 | % |
Consumer Discretionary | | 9 | % | | 5 | % |
Industrials | | 6 | % | | — | |
| | |
|
| |
|
|
| | | 100 | % | | 100 | % |
| | |
|
| |
|
|
Asset allocation and sector diversification are subject to change.
For more complete details about the Portfolio’s investment portfolio, see page 17. A quarterly Fact Sheet is available upon request. Information concerning portfolio holdings of the Portfolio as of month end will be posted to scudder.com on the 15th of the following month.
Page 412 of 466
Following the Portfolio’s fiscal first and third quarter-end, a complete portfolio holdings listing is filed with the SEC on Form N-Q. The form will be available on the SEC’s Web site at www.sec.gov, and it also may be reviewed and copied at the SEC’s Public Reference Room in Washington, D.C. Information on the operation of the SEC’s Public Reference Room may be obtained by calling (800) SEC-0330.
Investment Portfolio December 31, 2004
SVS Oak Strategic Equity Portfolio
| | | | |
| | | Shares
| | Value ($)
|
Common Stocks 99.5% | | | | |
Consumer Discretionary 9.1% | | | | |
Household Durables 2.2% | | | | |
Common Stocks 99.5% | | | | |
Harman International Industries, Inc. | | 16,000 | | 2,032,000 |
| | | | |
|
Internet & Catalog Retail 6.9% | | | | |
eBay, Inc.* | | 55,500 | | 6,453,540 |
| | | | |
|
Financials 14.2% | | | | |
Capital Markets 5.8% | | | | |
Charles Schwab Corp. | | 451,400 | | 5,398,744 |
| | | | |
|
Consumer Finance 4.5% | | | | |
MBNA Corp. | | 147,300 | | 4,152,387 |
| | | | |
|
Diversified Financial Services 3.9% | | | | |
Citigroup, Inc. | | 74,000 | | 3,565,320 |
| | | | |
|
Health Care 15.0% | | | | |
Biotechnology 6.6% | | | | |
Affymetrix, Inc.* (e) | | 57,000 | | 2,083,350 |
Amgen, Inc.* | | 63,000 | | 4,041,450 |
| | | | |
|
| | | | | 6,124,800 |
| | | | |
|
Health Care Equipment & Supplies 4.8% | | | | |
Medtronic, Inc. | | 89,600 | | 4,450,432 |
| | | | |
|
Pharmaceuticals 3.6% | | | | |
Pfizer, Inc. | | 123,100 | | 3,310,159 |
| | | | |
|
Industrials 5.8% | | | | |
Air Freight & Logistics 4.0% | | | | |
United Parcel Service, Inc. “B” | | 43,000 | | 3,674,780 |
| | | | |
|
Electrical Equipment 1.8% | | | | |
Rockwell Automation, Inc. | | 34,000 | | 1,684,700 |
| | | | |
|
Information Technology 55.4% | | | | |
Communications Equipment 11.6% | | | | |
Cisco Systems, Inc.* | | 174,600 | | 3,369,780 |
Juniper Networks, Inc.* | | 145,300 | | 3,950,707 |
QUALCOMM, Inc.* | | 80,000 | | 3,392,000 |
| | | | |
|
| | | | | 10,712,487 |
| | | | |
|
Page 413 of 466
| | | | |
| | | Shares
| | Value ($)
|
Computers & Peripherals 12.0% | | | | |
Avid Technology, Inc.* | | 33,000 | | 2,037,750 |
Dell, Inc.* | | 111,600 | | 4,702,824 |
EMC Corp.* | | 292,600 | | 4,350,962 |
| | | | |
|
| | | | | 11,091,536 |
| | | | |
|
Electronic Equipment & Instruments 2.3% | | | | |
Symbol Technologies, Inc. | | 124,000 | | 2,145,200 |
| | | | |
|
IT Consulting & Services 5.1% | | | | |
Cognizant Technology Solutions Corp. “A”* | | 110,600 | | 4,681,698 |
| | | | |
|
Semiconductors & Semiconductor Equipment 11.8% | | | | |
Applied Materials, Inc.* | | 206,700 | | 3,534,570 |
Linear Technology Corp. | | 102,400 | | 3,969,024 |
Maxim Integrated Products, Inc. | | 81,650 | | 3,461,143 |
| | | | |
|
| | | | | 10,964,737 |
| | | | |
|
Software 12.6% | | | | |
Electronic Arts, Inc.* | | 70,000 | | 4,317,600 |
Microsoft Corp. | | 157,300 | | 4,201,484 |
Symantec Corp.* | | 122,000 | | 3,142,720 |
| | | | |
|
| | | | | 11,661,804 |
| | | | |
|
Total Common Stocks (Cost $79,704,014) | | | | 92,104,324 |
| | | | |
|
Securities Lending Collateral 2.1% | | | | |
Daily Assets Fund Institutional, 2.25% (c)(d) (Cost $1,936,575) | | 1,936,575 | | 1,936,575 |
| | | | |
|
Cash Equivalents 0.7% | | | | |
Scudder Cash Management QP Trust, 2.24% (b) (Cost $621,021) | | 621,021 | | 621,021 |
| | | | |
|
| | | | | | |
| | | % of Net Assets
| | | Value ($)
| |
Total Investment Portfolio (Cost $82,261,610) (a) | | 102.3 | | | 94,661,920 | |
| | | | | |
|
|
Other Assets and Liabilities, Net | | (2.3 | ) | | (2,150,741 | ) |
| | | | | |
|
|
Net Assets | | 100.0 | | | 92,511,179 | |
| | | | | |
|
|
Notes to SVS Oak Strategic Equity Portfolio of Investments
| * | Non-income producing security. |
| (a) | The cost for federal income tax purposes was $82,256,010. At December 31, 2004, net unrealized appreciation for all securities based on tax cost was $12,405,910. This consisted of aggregate gross unrealized appreciation for all securities in which there was an excess of value over tax cost of $14,706,981 and aggregate gross unrealized depreciation for all securities in which there was an excess of tax cost over value of $2,301,071. |
| (b) | Scudder Cash Management QP Trust is managed by Deutsche Investment Management Americas Inc. The rate shown is the annualized seven-day yield at period end. |
| (c) | Daily Assets Fund Institutional, an affiliated fund, is managed by Deutsche Asset Management, Inc. The rate shown is the annualized seven-day yield at period end. |
Page 414 of 466
| (d) | Represents collateral held in connection with securities lending. |
| (e) | All or a portion of these securities were on loan (see Notes to Financial Statements). The value of all securities loaned at December 31, 2004 amounted to $1,875,015, which is 2.0% of net assets. |
The accompanying notes are an integral part of the financial statements.
Financial Statements
Statement of Assets and Liabilities
as of December 31, 2004
| | | | |
Assets | |
Investments: | |
Investments in securities, at value (cost $79,704,014) — including $1,875,015 of securities loaned | | $ | 92,104,324 | |
Investment in Daily Assets Fund Institutional (cost $1,936,575)* | | | 1,936,575 | |
Investment in Scudder Cash Management QP Trust (cost $621,021) | | | 621,021 | |
| | |
|
|
|
Total investments in securities, at value (cost $82,261,610) | | | 94,661,920 | |
| | |
|
|
|
Receivable for investments sold | | | 3,976 | |
Dividends receivable | | | 35,316 | |
Interest receivable | | | 1,622 | |
Other assets | | | 3,746 | |
| | |
|
|
|
Total assets | | | 94,706,580 | |
| | |
|
|
|
Liabilities | |
Payable for Portfolio shares redeemed | | | 109,757 | |
Payable upon return of securities loaned | | | 1,936,575 | |
Accrued management fee | | | 77,588 | |
Other accrued expenses and payables | | | 71,481 | |
Total liabilities | | | 2,195,401 | |
| | |
|
|
|
Net assets, at value | | $ | 92,511,179 | |
| | |
|
|
|
Net Assets | |
Net assets consist of: | |
Undistributed net investment income | | | 3,260 | |
Net unrealized appreciation (depreciation) on investments | | | 12,400,310 | |
Accumulated net realized gain (loss) | | | (10,928,202 | ) |
Paid-in capital | | | 91,035,811 | |
| | |
|
|
|
Net assets, at value | | $ | 92,511,179 | |
| | |
|
|
|
Class A | | | | |
Net Asset Value, offering and redemption price per share ($70,860,416 ÷ 10,189,476 outstanding shares of beneficial interest, $.01 par value, unlimited number of shares authorized) | | $ | 6.95 | |
| | |
|
|
|
Class B | | | | |
Net Asset Value, offering and redemption price per share ($21,650,763 ÷ 3,140,946 outstanding shares of beneficial interest, $.01 par value, unlimited number of shares authorized) | | $ | 6.89 | |
| | |
|
|
|
| * | Represents collateral on securities loaned. |
Page 415 of 466
Statement of Operations
for the year ended December 31, 2004
| | | | |
Investment Income | | | | |
Income: | | | | |
Dividends | | $ | 1,030,386 | |
Interest — Scudder Cash Management QP Trust | | | 30,418 | |
Securities lending income, including income from Daily Assets Fund Institutional | | | 4,504 | |
| | |
|
|
|
Total Income | | | 1,065,308 | |
| | |
|
|
|
Expenses: | | | | |
Management fee | | | 854,061 | |
Custodian and accounting fees | | | 64,244 | |
Distribution service fees (Class B) | | | 42,282 | |
Record keeping fees (Class B) | | | 21,848 | |
Auditing | | | 44,604 | |
Legal | | | 14,366 | |
Trustees’ fees and expenses | | | 1,596 | |
Reports to shareholders | | | 9,176 | |
Other | | | 5,381 | |
| | |
|
|
|
Total expenses, before expense reductions | | | 1,057,558 | |
| | |
|
|
|
Expense reductions | | | (1,365 | ) |
| | |
|
|
|
Total expenses, after expense reductions | | | 1,056,193 | |
| | |
|
|
|
Net investment income (loss) | | | 9,115 | |
| | |
|
|
|
Realized and Unrealized Gain (Loss) on Investment Transactions | | | | |
Net realized gain (loss) from investments | | | (429,310 | ) |
Net unrealized appreciation (depreciation) during the period on investments | | | 935,994 | |
| | |
|
|
|
Net gain (loss) on investment transactions | | | 506,684 | |
| | |
|
|
|
Net increase (decrease) in net assets resulting from operations | | $ | 515,799 | |
| | |
|
|
|
The accompanying notes are an integral part of the financial statements.
Statement of Changes in Net Assets
| | | | | | | | |
| | | Years Ended December 31,
| |
Increase (Decrease) in Net Assets
| | 2004
| | | 2003
| |
Operations: | | | | | | | | |
Net investment income (loss) | | $ | 9,115 | | | $ | (303,416 | ) |
Net realized gain (loss) on investment transactions | | | (429,310 | ) | | | (4,050,440 | ) |
Net unrealized appreciation (depreciation) on investment transactions during the period | | | 935,994 | | | | 27,866,046 | |
Net increase (decrease) in net assets resulting from operations | | | 515,799 | | | | 23,512,190 | |
Page 416 of 466
| | | | | | | | |
Portfolio share transactions: | | | | | | | | |
| | |
Class A | | | | | | | | |
Proceeds from shares sold | | | 11,773,909 | | | | 23,109,017 | |
Cost of shares redeemed | | | (16,798,283 | ) | | | (9,960,954 | ) |
Net increase (decrease) in net assets from Class A share transactions | | | (5,024,374 | ) | | | 13,148,063 | |
| | |
Class B | | | | | | | | |
Proceeds from shares sold | | | 12,325,908 | | | | 8,766,882 | |
Cost of shares redeemed | | | (1,539,908 | ) | | | (230,435 | ) |
Net increase (decrease) in net assets from Class B share transactions | | | 10,786,000 | | | | 8,536,447 | |
Increase (decrease) in net assets | | | 6,277,425 | | | | 45,196,700 | |
Net assets at beginning of period | | | 86,233,754 | | | | 41,037,054 | |
| | |
|
|
| |
|
|
|
Net assets at end of period (including undistributed net investment income and accumulated net investment loss of $3,260 and $255, respectively) | | $ | 92,511,179 | | | $ | 86,233,754 | |
| | |
|
|
| |
|
|
|
Other Information | | | | | | | | |
| | |
Class A | | | | | | | | |
Shares outstanding at beginning of period | | | 11,043,224 | | | | 8,877,415 | |
Shares sold | | | 1,718,999 | | | | 3,930,253 | |
Shares redeemed | | | (2,572,747 | ) | | | (1,764,444 | ) |
Net increase (decrease) in Portfolio shares | | | (853,748 | ) | | | 2,165,809 | |
| | |
|
|
| |
|
|
|
Shares outstanding at end of period | | | 10,189,476 | | | | 11,043,224 | |
| | |
|
|
| |
|
|
|
Class B | | | | | | | | |
Shares outstanding at beginning of period | | | 1,533,571 | | | | 77,050 | |
Shares sold | | | 1,851,499 | | | | 1,494,172 | |
Shares redeemed | | | (244,124 | ) | | | (37,651 | ) |
Net increase (decrease) in Portfolio shares | | | 1,607,375 | | | | 1,456,521 | |
| | |
|
|
| |
|
|
|
Shares outstanding at end of period | | | 3,140,946 | | | | 1,533,571 | |
| | |
|
|
| |
|
|
|
The accompanying notes are an integral part of the financial statements.
Financial Highlights
Class A
| | | | | | | | | | | | | | | |
Years Ended December 31,
| | 2004
| | 2003
| | | 2002
| | | 2001a
| |
Selected Per Share Data | | | | | | | | | | | | | | | |
Net asset value, beginning of period | | $ | 6.86 | | $ | 4.58 | | | $ | 7.60 | | | $ | 10.00 | |
| | |
|
| |
|
|
| |
|
|
| |
|
|
|
Income (loss) from investment operations: | | | | | | | | | | | | | | | |
Net investment income (loss)b | | | .01 | | | (.03 | ) | | | (.02 | ) | | | (.02 | ) |
Net realized and unrealized gain (loss) on investment transactions | | | .08 | | | 2.31 | | | | (3.00 | ) | | | (2.38 | ) |
| | |
|
| |
|
|
| |
|
|
| |
|
|
|
Total from investment operations | | | .09 | | | 2.28 | | | | (3.02 | ) | | | (2.40 | ) |
| | |
|
| |
|
|
| |
|
|
| |
|
|
|
Page 417 of 466
| | | | | | | | | | | | | | | |
Net asset value, end of period | | $ | 6.95 | | $ | 6.86 | | | $ | 4.58 | | | $ | 7.60 | |
| | |
|
| |
|
|
| |
|
|
| |
|
|
|
Total Return (%) | | | 1.31 | | | 49.78 | | | | (39.74 | ) | | | (24.00 | )c** |
| | |
|
| |
|
|
| |
|
|
| |
|
|
|
Ratios to Average Net Assets and Supplemental Data | | | | | | | | | | | | | | | |
Net assets, end of period ($ millions) | | | 71 | | | 76 | | | | 41 | | | | 44 | |
Ratio of expenses before expense reductions (%) | | | 1.10 | | | 1.13 | | | | .96 | | | | 1.44 | * |
Ratio of expenses after expense reductions (%) | | | 1.10 | | | 1.13 | | | | .96 | | | | 1.15 | * |
Ratio of net investment income (loss) (%) | | | .08 | | | (.48 | ) | | | (.30 | ) | | | (.43 | )* |
Portfolio turnover rate (%) | | | 39 | | | 6 | | | | 16 | | | | 3 | * |
| a | For the period from May 1, 2001 (commencement of operations) to December 31, 2001. |
| b | Based on average shares outstanding during the period. |
| c | Total return would have been lower had certain expenses not been reduced. |
Class B
| | | | | | | | | | | | |
Years Ended December 31,
| | 2004
| | | 2003
| | | 2002a
| |
Selected Per Share Data | | | | | | | | | | | | |
Net asset value, beginning of period | | $ | 6.83 | | | $ | 4.58 | | | $ | 5.04 | |
| | |
|
|
| |
|
|
| |
|
|
|
Income (loss) from investment operations: | | | | | | | | | | | | |
Net investment income (loss)b | | | (.02 | ) | | | (.06 | ) | | | (.02 | ) |
Net realized and unrealized gain (loss) on investment transactions | | | .08 | | | | 2.31 | | | | (.44 | ) |
| | |
|
|
| |
|
|
| |
|
|
|
Total from investment operations | | | .06 | | | | 2.25 | | | | (.46 | ) |
| | |
|
|
| |
|
|
| |
|
|
|
Net asset value, end of period | | $ | 6.89 | | | $ | 6.83 | | | $ | 4.58 | |
| | |
|
|
| |
|
|
| |
|
|
|
Total Return (%) | | | .88 | | | | 49.13 | | | | (9.13 | )** |
| | |
|
|
| |
|
|
| |
|
|
|
Ratios to Average Net Assets and Supplemental Data | | | | | | | | | | | | |
Net assets, end of period ($ millions) | | | 22 | | | | 10 | | | | .4 | |
Ratio of expenses (%) | | | 1.49 | | | | 1.52 | | | | 1.21 | * |
Ratio of net investment income (loss) (%) | | | (.20 | ) | | | (.87 | ) | | | (.68 | )* |
Portfolio turnover rate (%) | | | 39 | | | | 6 | | | | 16 | |
| a | For the period July 1, 2002 (commencement of operations of Class B shares) to December 31, 2002. |
| b | Based on average shares outstanding during the period. |
Page 418 of 466
Performance Summary December 31, 2004
SVS Turner Mid Cap Growth Portfolio
All performance shown is historical, assumes reinvestment of all dividends and capital gains, and does not guarantee future results. Investment return and principal value fluctuate with changing market conditions so that, when redeemed, shares may be worth more or less then their original cost. Current performance may be lower or higher than the performance data quoted. Please visit scudder.com for the product’s most recent month-end performance. Performance doesn’t reflect charges and fees (“contract charges”) associated with the separate account that invests in the Portfolio or any variable life insurance policy or variable annuity contract for which the Portfolio is an investment option. These charges and fees will reduce returns.
Stocks of medium-sized companies involve greater than securities of larger, more-established companies risk, as they often have limited product lines, markets or financial resources and may be subject to more erratic and abrupt market movements. Please read this Portfolio’s prospectus for specific details regarding its investments and risk profile.
Growth of an Assumed $10,000 Investment in SVS Turner Mid Cap Growth Portfolio from 5/1/2001 to 12/31/2004
¨ SVS Turner Mid Cap Growth Portfolio — Class A
¨ Russell Midcap Growth Index
Russell Midcap Growth Index is an unmanaged index composed of common stocks of midcap companies with higher price-to-book ratios and higher forecasted growth values. Index returns assume reinvested dividends and, unlike Portfolio returns, do not reflect any fees or expenses. It is not possible to invest directly into an index.
Comparative Results
| | | | | | | | | | | | | | |
SVS Turner Mid Cap Growth Portfolio
| | | | 1-Year
| | | 3-Year
| | | Life of Portfolio*
| |
Class A | | Growth of $10,000 | | $ | 11,104 | | | $ | 11,166 | | | $ | 9,860 | |
| | | Average annual total return | | | 11.04 | % | | | 3.75 | % | | | -.38 | % |
Russell Midcap Growth Index | | Growth of $10,000 | | $ | 11,548 | | | $ | 11,964 | | | $ | 10,930 | |
| | | Average annual total return | | | 15.48 | % | | | 6.16 | % | | | 2.45 | % |
| | | | |
SVS Turner Mid Cap Growth Portfolio
| | | | | | | 1-Year
| | | Life of Class**
| |
Class B | | Growth of $10,000 | | | | | | $ | 11,063 | | | $ | 14,818 | |
| | | Average annual total return | | | | | | | 10.63 | % | | | 17.02 | % |
Russell Midcap Growth Index | | Growth of $10,000 | | | | | | $ | 11,548 | | | $ | 14,900 | |
| | | Average annual total return | | | | | | | 15.48 | % | | | 17.29 | % |
The growth of $10,000 is cumulative.
| * | The Portfolio commenced operations on May 1, 2001. Index returns begin April 30, 2001. Total returns would have been lower for the 3-Year and Life of Portfolio period for Class A shares if the Portfolio’s expenses were not maintained. |
| ** | The Portfolio commenced offering Class B shares on July 1, 2002. Index returns begin June 30, 2002. |
Information About Your Portfolio’s Expenses
SVS Turner Mid Cap Growth Portfolio
As an investor of the Portfolio, you incur two types of costs: ongoing expenses and transaction costs. Ongoing expenses include management fees, distribution and service (12b-1) fees and other Portfolio expenses. Examples of transaction costs include sales charges (loads), redemption fees and account maintenance fees, which are not shown in this section. The following tables are intended to
Page 419 of 466
help you understand your ongoing expenses (in dollars) of investing in the Portfolio and to help you compare these expenses with the ongoing expenses of investing in other mutual funds. The tables are based on an investment of $1,000 made at the beginning of the six-month period ended December 31, 2004.
The tables illustrate your Portfolio’s expenses in two ways:
Actual Portfolio Return. This helps you estimate the actual dollar amount of ongoing expenses (but not transaction costs) paid on a $1,000 investment in the Portfolio using the Portfolio’s actual return during the period. To estimate the expenses you paid over the period, simply divide your account value by $1,000 (for example, an $8,600 account value divided by $1,000 = 8.6), then multiply the result by the number in the “Expenses Paid per $1,000” line under the share class you hold.
Hypothetical 5% Portfolio Return. This helps you to compare your Portfolio’s ongoing expenses (but not transaction costs) with those of other mutual funds using the Portfolio’s actual expense ratio and a hypothetical rate of return of 5% per year before expenses. Examples using a 5% hypothetical Portfolio return may be found in the shareholder reports of other mutual funds. The hypothetical account values and expenses may not be used to estimate the actual ending account balance or expenses you paid for the period.
Please note that the expenses shown in these tables are meant to highlight your ongoing expenses only and do not reflect any transaction costs. The “Expenses Paid per $1,000” line of the tables is useful in comparing ongoing expenses only and will not help you determine the relative total expense of owning different funds. If these transaction costs had been included, your costs would have been higher.
Expenses and Value of a $1,000 Investment for the six months ended December 31, 2004
| | | | | | |
Actual Portfolio Return
| | Class A
| | Class B
|
Beginning Account Value 7/1/04 | | $ | 1,000.00 | | $ | 1,000.00 |
Ending Account Value 12/31/04 | | $ | 1,081.10 | | $ | 1,079.50 |
Expenses Paid per $1,000* | | $ | 5.67 | | $ | 7.52 |
| | |
Hypothetical 5% Portfolio Return
| | Class A
| | Class B
|
Beginning Account Value 7/1/04 | | $ | 1,000.00 | | $ | 1,000.00 |
Ending Account Value 12/31/04 | | $ | 1,019.75 | | $ | 1,017.97 |
Expenses Paid per $1,000* | | $ | 5.50 | | $ | 7.30 |
| * | Expenses are equal to the Portfolio’s annualized expense ratio for each share class, multiplied by the average account value over the period, multiplied by the number of days in the most recent six-month period, then divided by 365. |
| | | | | | |
Annualized Expense Ratios
| | Class A
| | | Class B
| |
Scudder Variable Series II — SVS Turner Mid Cap Growth Portfolio | | 1.08 | % | | 1.43 | % |
For more information, please refer to the Portfolio’s prospectus.
Page 420 of 466
Management Summary December 31, 2004
SVS Turner Mid Cap Growth Portfolio
For the 12-month period ended December 31, 2004, the portfolio recorded a gain of 11.04% (Class A shares, unadjusted for contract charges), versus the 15.48% gain posted by the Russell Midcap Growth Index. Four of the portfolio’s 10 sector positions beat their corresponding index sectors. Contributing the most to performance were growth-oriented holdings in the technology sector. Stocks that added value included VeriSign, Inc. and Monster Worldwide, Inc. The portfolio’s holdings in the health care sector detracted the most from performance.
The stock market ended the period with a strong finishing kick. We think much of the gains for 2004 can be credited to better-than-expected earnings. Also driving results was a positive change in investor psychology. Early in the year, investors were notably fretful about several issues: the global war on terror, rising oil prices, the Federal Reserve Board’s hiking of short-term interest rates, the presidential campaign and mixed economic signals, among others. However, as oil prices stabilized, as the Fed’s five rate hikes proved temperate, as the US election proceeded with few snags and as economic news on balance remained favorable, bearishness gradually morphed into bullishness, and money flowed into stocks.
We think that a combination of moderate economic growth, low inflation, modest interest rates, reasonable equity valuations, corporate America’s cash hoard of $1 trillion available for acquisitions and share buybacks, and steadily rising corporate profits should benefit the stock market in 2005.
Christopher K. McHugh
William C. McVail
Robert E. Turner
Co-Managers
Turner Investment Partners, Inc., Subadvisor to the Portfolio
All performance shown is historical, assumes reinvestment of all dividends and capital gains, and does not guarantee future results. Investment return and principal value fluctuate with changing market conditions so that, when redeemed, shares may be worth more or less than their original cost. Current performance may be lower or higher than the performance data quoted. Please visit scudder.com for the product’s most recent month-end performance. Performance doesn’t reflect charges and fees (“contract charges”) associated with the separate account that invests in the portfolio or any variable life insurance policy or variable annuity contract for which the portfolio is an investment option. These charges and fees will reduce returns.
Risk Considerations
Stocks of medium-sized companies involve greater risks than securities of larger, more-established companies, as they often have limited product lines, markets or financial resources and may be subject to more erratic and abrupt market movements. Please read this portfolio’s prospectus for specific details regarding its investments and risk profile.
Russell Midcap Growth Index is an unmanaged index composed of common stocks of midcap companies with higher price-to-book ratios and higher forecasted growth values. Index returns assume reinvested dividends and, unlike portfolio returns, do not reflect any fees or expenses. It is not possible to invest directly into an index.
Portfolio management market commentary is as of December 31, 2004, and may not come to pass. This information is subject to change at any time based on market and other conditions.
Page 421 of 466
Portfolio Summary
SVS Turner Mid Cap Growth Portfolio
| | | | | | |
Asset Allocation (Excludes Securities Lending Collateral)
| | 12/31/04
| | | 12/31/03
| |
Common Stocks | | 99 | % | | 97 | % |
Cash Equivalents | | 1 | % | | 3 | % |
| | |
|
| |
|
|
| | | 100 | % | | 100 | % |
| | |
|
| |
|
|
| | | | | | |
Sector Diversification (Excludes Cash Equivalents and Securities Lending Collateral)
| | 12/31/04
| | | 12/31/03
| |
Information Technology | | 31 | % | | 33 | % |
Health Care | | 19 | % | | 20 | % |
Consumer Discretionary | | 18 | % | | 16 | % |
Industrials | | 11 | % | | 11 | % |
Financials | | 9 | % | | 8 | % |
Energy | | 5 | % | | 3 | % |
Materials | | 3 | % | | 4 | % |
Telecommunication Services | | 2 | % | | 2 | % |
Consumer Staples | | 2 | % | | 2 | % |
Utilities | | — | | | 1 | % |
| | |
|
| |
|
|
| | | 100 | % | | 100 | % |
| | |
|
| |
|
|
Asset allocation and sector diversification are subject to change.
For more complete details about the Portfolio’s investment portfolio, see page 26. A quarterly Fact Sheet is available upon request. Information concerning portfolio holdings of the Portfolio as of month end will be posted to scudder.com on the 15th of the following month.
Following the Portfolio’s fiscal first and third quarter-end, a complete portfolio holdings listing is filed with the SEC on Form N-Q. The form will be available on the SEC’s Web site at www.sec.gov, and it also may be reviewed and copied at the SEC’s Public Reference Room in Washington, D.C. Information on the operation of the SEC’s Public Reference Room may be obtained by calling (800) SEC-0330.
Investment Portfolio December 31, 2004
SVS Turner Mid Cap Growth Portfolio
| | | | |
| | | Shares
| | Value ($)
|
Common Stocks 99.5% | | | | |
Consumer Discretionary 18.0% | | | | |
Hotels Restaurants & Leisure 8.4% | | | | |
Marriott International, Inc. “A” | | 35,390 | | 2,228,862 |
MGM MIRAGE* | | 19,610 | | 1,426,431 |
P.F. Chang’s China Bistro, Inc.* (e) | | 12,310 | | 693,669 |
Scientific Games Corp. “A”* | | 37,170 | | 886,133 |
Page 422 of 466
| | | | |
Starwood Hotels & Resorts Worldwide, Inc. | | 19,710 | | 1,151,064 |
Station Casinos, Inc. | | 23,840 | | 1,303,571 |
WMS Industries, Inc.* (e) | | 30,940 | | 1,037,728 |
Wynn Resorts Ltd.* (e) | | 15,670 | | 1,048,636 |
YUM! Brands, Inc. | | 42,970 | | 2,027,325 |
| | | | |
|
| | | | | 11,803,419 |
| | | | |
|
Household Durables 0.5% | | | | |
Harman International Industries, Inc. | | 5,370 | | 681,990 |
| | | | |
|
Internet & Catalog Retail 0.5% | | | | |
Overstock.com, Inc.* (e) | | 10,910 | | 752,790 |
| | | | |
|
Media 1.1% | | | | |
DreamWorks Animation SKG, Inc. “A”* | | 23,900 | | 896,489 |
Sirius Satellite Radio, Inc.* (e) | | 79,900 | | 611,235 |
| | | | |
|
| | | | | 1,507,724 |
| | | | |
|
Specialty Retail 5.6% | | | | |
American Eagle Outfitters, Inc. | | 15,960 | | 751,716 |
Bed Bath & Beyond, Inc.* | | 48,010 | | 1,912,238 |
Chico’s FAS, Inc.* | | 36,720 | | 1,671,862 |
RadioShack Corp. | | 32,080 | | 1,054,790 |
Urban Outfitters, Inc.* | | 23,530 | | 1,044,732 |
Williams-Sonoma, Inc.* | | 42,350 | | 1,483,944 |
| | | | |
|
| | | | | 7,919,282 |
| | | | |
|
Textiles, Apparel & Luxury Goods 1.9% | | | | |
Coach, Inc.* | | 48,860 | | 2,755,704 |
| | | | |
|
Consumer Staples 2.4% | | | | |
Beverages 0.5% | | | | |
Constellation Brands, Inc. “A”* | | 14,860 | | 691,139 |
| | | | |
|
Food & Staples Retailing 0.5% | | | | |
Whole Foods Market, Inc. | | 7,630 | | 727,520 |
| | | | |
|
Food Products 0.7% | | | | |
McCormick & Co, Inc. | | 24,620 | | 950,332 |
| | | | |
|
Household Products 0.7% | | | | |
Clorox Co. | | 16,690 | | 983,542 |
| | | | |
|
Energy 4.7% | | | | |
Energy Equipment & Services 2.2% | | | | |
BJ Services Co. | | 15,180 | | 706,477 |
Grant Prideco, Inc.* | | 31,470 | | 630,973 |
Smith International, Inc.* | | 12,960 | | 705,154 |
Transocean, Inc.* | | 25,340 | | 1,074,163 |
| | | | |
|
| | | | | 3,116,767 |
| | | | |
|
| | |
| | | Shares
| | Value ($)
|
Oil & Gas 2.5% | | | | |
Ashland, Inc. | | 14,710 | | 858,770 |
Range Resources Corp. (e) | | 47,570 | | 973,282 |
Page 423 of 466
| | | | |
Ultra Petroleum Corp.* | | 7,890 | | 379,746 |
XTO Energy, Inc. | | 36,942 | | 1,307,008 |
| | | | |
|
| | | | | 3,518,806 |
| | | | |
|
Financials 8.6% | | | | |
Banks 2.5% | | | | |
City National Corp. | | 11,300 | | 798,345 |
Silicon Valley Bancshares* (e) | | 17,100 | | 766,422 |
Sovereign Bancorp, Inc. | | 42,950 | | 968,523 |
UCBH Holdings, Inc. | | 23,120 | | 1,059,358 |
| | | | |
|
| | | | | 3,592,648 |
| | | | |
|
Capital Markets 4.0% | | | | |
Bear Stearns Companies, Inc. | | 6,220 | | 636,368 |
E*TRADE Financial Corp.* | | 116,650 | | 1,743,917 |
Northern Trust Corp. | | 17,360 | | 843,349 |
SEI Investments Co. | | 14,490 | | 607,566 |
T. Rowe Price Group, Inc. | | 28,220 | | 1,755,284 |
| | | | |
|
| | | | | 5,586,484 |
| | | | |
|
Diversified Financial Services 2.1% | | | | |
Affiliated Managers Group, Inc.* (e) | | 18,824 | | 1,275,138 |
Ameritrade Holding Corp.* | | 55,350 | | 787,077 |
Doral Financial Corp. | | 17,580 | | 865,815 |
| | | | |
|
| | | | | 2,928,030 |
| | | | |
|
Health Care 19.0% | | | | |
Biotechnology 3.0% | | | | |
Eyetech Pharmaceuticals, Inc.* (e) | | 15,800 | | 718,900 |
Genzyme Corp.* | | 27,950 | | 1,623,057 |
MedImmune, Inc.* | | 25,730 | | 697,540 |
Neurocrine Biosciences, Inc.* (e) | | 23,520 | | 1,159,536 |
| | | | |
|
| | | | | 4,199,033 |
| | | | |
|
Health Care Equipment & Supplies 8.2% | | | | |
Bausch & Lomb, Inc. | | 23,370 | | 1,506,430 |
Biomet, Inc. | | 31,610 | | 1,371,558 |
C.R. Bard, Inc. | | 31,700 | | 2,028,166 |
Cooper Companies, Inc. (e) | | 14,930 | | 1,053,909 |
Dade Behring Holdings, Inc.* | | 12,860 | | 720,160 |
Fisher Scientific International, Inc.* | | 32,180 | | 2,007,388 |
INAMED Corp.* | | 24,500 | | 1,549,625 |
Waters Corp.* | | 26,980 | | 1,262,394 |
| | | | |
|
| | | | | 11,499,630 |
| | | | |
|
Health Care Providers & Services 5.4% | | | | |
AMERIGROUP Corp.* | | 9,550 | | 722,553 |
Laboratory Corp. of America Holdings* | | 20,720 | | 1,032,271 |
Manor Care, Inc. | | 20,410 | | 723,126 |
Medco Health Solutions, Inc.* | | 19,820 | | 824,512 |
PacifiCare Health Systems, Inc.* | | 21,260 | | 1,201,615 |
Patterson Companies, Inc.* (e) | | 24,420 | | 1,059,584 |
WellPoint, Inc.* | | 18,330 | | 2,107,950 |
| | | | |
|
| | | | | 7,671,611 |
| | | | |
|
Page 424 of 466
| | | | |
| | |
| | | Shares
| | Value ($)
|
Pharmaceuticals 2.4% | | | | |
Elan Corp. PLC (ADR)* (e) | | 24,970 | | 680,432 |
Medicines Co.* (e) | | 27,780 | | 800,064 |
MGI Pharma, Inc.* (e) | | 38,680 | | 1,083,427 |
Sepracor, Inc.* (e) | | 14,400 | | 854,928 |
| | | | |
|
| | | | | 3,418,851 |
| | | | |
|
Industrials 10.6% | | | | |
Air Freight & Couriers 0.7% | | | | |
Expeditors International of Washington, Inc. | | 18,690 | | 1,044,397 |
| | | | |
|
Airlines 1.1% | | | | |
Southwest Airlines Co. | | 96,870 | | 1,577,044 |
| | | | |
|
Building Products 0.7% | | | | |
American Standard Companies, Inc.* | | 23,430 | | 968,128 |
| | | | |
|
Commercial Services & Supplies 3.2% | | | | |
ChoicePoint, Inc.* | | 21,660 | | 996,143 |
Monster Worldwide, Inc.* | | 61,860 | | 2,080,971 |
Robert Half International, Inc. | | 48,810 | | 1,436,478 |
| | | | |
|
| | | | | 4,513,592 |
| | | | |
|
Electrical Equipment 2.0% | | | | |
Rockwell Automation, Inc. | | 33,830 | | 1,676,276 |
Roper Industries, Inc. | | 18,750 | | 1,139,438 |
| | | | |
|
| | | | | 2,815,714 |
| | | | |
|
Machinery 1.5% | | | | |
Eaton Corp. | | 10,130 | | 733,007 |
Pentair, Inc. | | 31,660 | | 1,379,109 |
| | | | |
|
| | | | | 2,112,116 |
| | | | |
|
Marine 0.7% | | | | |
Teekay Shipping Corp. (e) | | 21,570 | | 908,313 |
| | | | |
|
Road & Rail 0.7% | | | | |
Yellow Roadway Corp.* | | 16,750 | | 933,142 |
| | | | |
|
Information Technology 31.1% | | | | |
Communications Equipment 5.2% | | | | |
Comverse Technologies, Inc.* | | 73,400 | | 1,794,630 |
Juniper Networks, Inc.* (e) | | 113,330 | | 3,081,443 |
Polycom, Inc.* | | 73,880 | | 1,722,881 |
Sonus Networks, Inc.* (e) | | 127,700 | | 731,721 |
| | | | |
|
| | | | | 7,330,675 |
| | | | |
|
Computers & Peripherals 2.6% | | | | |
Apple Computer, Inc.* | | 36,850 | | 2,373,140 |
Avid Technology, Inc.* | | 21,360 | | 1,318,980 |
| | | | |
|
| | | | | 3,692,120 |
| | | | |
|
Page 425 of 466
| | | | |
Electronic Equipment & Instruments 3.2% | | | | |
Benchmark Electronics, Inc.* | | 23,310 | | 794,871 |
CDW Corp. | | 20,760 | | 1,377,426 |
Cogent, Inc.* (e) | | 21,820 | | 720,060 |
Sanmina-SCI Corp.* | | 186,920 | | 1,583,213 |
| | | | |
|
| | | | | 4,475,570 |
| | | | |
|
Internet Software & Services 4.3% | | | | |
Ask Jeeves, Inc.* (e) | | 39,470 | | 1,055,822 |
CNET Networks, Inc.* (e) | | 101,320 | | 1,137,824 |
| | |
| | | Shares
| | Value ($)
|
F5 Networks, Inc.* (e) | | 34,010 | | 1,656,967 |
VeriSign, Inc.* | | 64,430 | | 2,159,694 |
| | | | |
|
| | | | | 6,010,307 |
| | | | |
|
IT Consulting & Services 4.6% | | | | |
Alliance Data Systems Corp.* | | 26,290 | | 1,248,249 |
Ariba, Inc.* (e) | | 60,430 | | 1,003,138 |
CheckFree Corp.* | | 32,710 | | 1,245,597 |
Cognizant Technology Solutions Corp. “A”* | | 30,300 | | 1,282,599 |
Fiserv, Inc.* | | 14,460 | | 581,147 |
Global Payments, Inc. (e) | | 17,920 | | 1,049,037 |
| | | | |
|
| | | | | 6,409,767 |
| | | | |
|
Semiconductors & Semiconductor Equipment 6.9% | | | | |
Advanced Micro Devices, Inc.* | | 67,230 | | 1,480,405 |
Cymer, Inc.* (e) | | 39,190 | | 1,157,673 |
KLA-Tencor Corp.* | | 33,680 | | 1,568,814 |
Lam Research Corp.* | | 65,910 | | 1,905,458 |
Marvell Technology Group Ltd.* | | 49,750 | | 1,764,632 |
PMC-Sierra, Inc.* | | 169,760 | | 1,909,800 |
| | | | |
|
| | | | | 9,786,782 |
| | | | |
|
Software 4.3% | | | | |
Amdocs Ltd.* | | 33,280 | | 873,600 |
Citrix Systems, Inc.* | | 41,610 | | 1,020,693 |
Macromedia, Inc.* | | 34,730 | | 1,080,798 |
McAfee, Inc.* | | 50,020 | | 1,447,079 |
TIBCO Software, Inc.* | | 122,740 | | 1,637,351 |
| | | | |
|
| | | | | 6,059,521 |
| | | | |
|
Materials 2.6% | | | | |
Chemicals 1.2% | | | | |
Eastman Chemical Co. (e) | | 11,780 | | 680,059 |
Lyondell Chemical Co. | | 34,030 | | 984,148 |
| | | | |
|
| | | | | 1,664,207 |
| | | | |
|
Metals & Mining 1.4% | | | | |
AK Steel Holding Corp.* (e) | | 55,560 | | 803,953 |
Allegheny Technologies, Inc. | | 32,140 | | 696,474 |
Page 426 of 466
| | | | |
Peabody Energy Corp. | | 7,020 | | 567,988 |
| | | | |
|
| | | | | 2,068,415 |
| | | | |
|
Telecommunication Services 2.5% | | | | |
Wireless Telecommunication Services | | | | |
Alamosa Holdings, Inc.* (e) | | 59,630 | | 743,586 |
American Tower, Inc. “A”* | | 41,040 | | 755,136 |
NII Holdings, Inc.* (e) | | 20,640 | | 979,368 |
Western Wireless Corp. “A”* | | 35,070 | | 1,027,551 |
| | | | |
|
| | | | | 3,505,641 |
| | | | |
|
Total Common Stocks (Cost $110,101,433) | | | | 140,180,753 |
| | | | |
|
Securities Lending Collateral 15.1% | | | | |
Daily Assets Fund Institutional, 2.25% (c) (d) (Cost $21,183,207) | | 21,183,207 | | 21,183,207 |
| | | | |
|
| | |
| | | Shares
| | Value ($)
|
Cash Equivalents 0.7% | | | | |
Scudder Cash Management QP Trust, 2.24% (b) (Cost $1,025,473) | | 1,025,473 | | 1,025,473 |
| | | | |
|
| | | | | | |
| | | % of Net Assets
| | | Value ($)
| |
Total Investment Portfolio (Cost $132,310,113) (a) | | 115.3 | | | 162,389,433 | |
| | | | | |
|
|
Other Assets and Liabilities, Net | | (15.3 | ) | | (21,504,076 | ) |
| | | | | |
|
|
Net Assets | | 100.0 | | | 140,885,357 | |
| | | | | |
|
|
Notes to SVS Turner Mid Cap Growth Portfolio of Investments
| * | Non-income producing security. |
| (a) | The cost for federal income tax purposes was $132,689,192. At December 31, 2004, net unrealized appreciation for all securities based on tax cost was $29,700,241. This consisted of aggregate gross unrealized appreciation for all securities in which there was an excess of value over tax cost of $30,177,447 and aggregate gross unrealized depreciation for all securities in which there was an excess of tax cost over value of $477,206. |
| (b) | Scudder Cash Management QP Trust is managed by Deutsche Investment Management Americas Inc. The rate shown is the annualized seven-day yield at period end. |
| (c) | Daily Assets Fund Institutional, an affiliated fund, is managed by Deutsche Asset Management, Inc. The rate shown is the annualized seven-day yield at period end. |
| (d) | Represents collateral held in connection with securities lending. |
| (e) | All or a portion of these securities were on loan (see Notes to Financial Statements). The value of all securities loaned at December 31, 2004 amounted to $20,716,371, which is 14.7% of net assets. |
ADR: American Depositary Receipt
The accompanying notes are an integral part of the financial statements.
Page 427 of 466
Financial Statements
Statement of Assets and Liabilities as of December 31, 2004
| | | | |
Assets | | | | |
Investments: | | | | |
Investments in securities, at value (cost $110,101,433) — including $20,716,371 of securities on loan | | $ | 140,180,753 | |
Investment in Daily Assets Fund Institutional (cost $21,183,207)* | | | 21,183,207 | |
Investment in Scudder Cash Management QP Trust (cost $1,025,473) | | | 1,025,473 | |
| | |
|
|
|
Total Investments in securities, at value (cost $132,310,113) | | | 162,389,433 | |
| | |
|
|
|
Dividends receivable | | | 49,568 | |
Interest receivable | | | 6,144 | |
Receivable for Portfolio shares sold | | | 34,471 | |
Other assets | | | 3,872 | |
| | |
|
|
|
Total assets | | | 162,483,488 | |
| | |
|
|
|
Liabilities | | | | |
Payable upon return of securities loaned | | | 21,183,207 | |
Payable for investments purchased | | | 151,354 | |
Payable for Portfolio shares redeemed | | | 49,510 | |
Accrued management fee | | | 121,563 | |
Other accrued expenses and payables | | | 92,497 | |
| | |
|
|
|
Total liabilities | | | 21,598,131 | |
| | |
|
|
|
Net assets, at value | | $ | 140,885,357 | |
| | |
|
|
|
Net Assets | | | | |
Net assets consist of: | | | | |
Accumulated net investment loss | | | (301 | ) |
Net unrealized appreciation (depreciation) on investments | | | 30,079,320 | |
Accumulated net realized gain (loss) | | | (4,149,095 | ) |
Paid-in capital | | | 114,955,433 | |
| | |
|
|
|
Net assets, at value | | $ | 140,885,357 | |
| | |
|
|
|
Class A | | | | |
Net Asset Value, offering and redemption price per share ($117,554,535 ÷ 11,918,058 outstanding shares of beneficial interest, $.01 par value, unlimited number of shares authorized) | | $ | 9.86 | |
| | |
|
|
|
Class B | | | | |
Net Asset Value, offering and redemption price per share ($23,330,822 ÷ 2,386,654 outstanding shares of beneficial interest, $.01 par value, unlimited number of shares authorized) | | $ | 9.78 | |
| | |
|
|
|
| * | Represents collateral on securities loaned. |
Page 428 of 466
Statement of Operations for the year ended December 31, 2004
Investment Income
| | | | |
Income: | | | | |
Dividends (net of foreign taxes withheld of $483) | | $ | 409,768 | |
Interest — Scudder Cash Management QP Trust | | | 38,767 | |
Securities lending income, including income from Daily Assets Fund Institutional | | | 26,862 | |
| | |
|
|
|
Total Income | | | 475,397 | |
| | |
|
|
|
Expenses: | | | | |
Management fee | | | 1,295,883 | |
Custodian and accounting fees | | | 119,636 | |
Distribution service fees (Class B) | | | 46,764 | |
Record keeping fees (Class B) | | | 24,766 | |
Auditing | | | 74,545 | |
Legal | | | 20,386 | |
Trustees’ fees and expenses | | | 2,194 | |
Reports to shareholders | | | 21,943 | |
Other | | | 9,751 | |
Total expenses, before expense reductions | | | 1,615,868 | |
Expense reductions | | | (1,685 | ) |
Total expenses, after expense reductions | | | 1,614,183 | |
| | |
|
|
|
Net investment income (loss) | | | (1,138,786 | ) |
| | |
|
|
|
Realized and Unrealized Gain (Loss) on Investment Transactions | | | | |
Net realized gain (loss) from investments | | | 10,201,612 | |
Net unrealized appreciation (depreciation) during the period on investments | | | 4,371,388 | |
| | |
|
|
|
Net gain (loss) on investment transactions | | | 14,573,000 | |
| | |
|
|
|
Net increase (decrease) in net assets resulting from operations | | $ | 13,434,214 | |
| | |
|
|
|
The accompanying notes are an integral part of the financial statements.
Statement of Changes in Net Assets
| | | | | | | | |
| | | Years Ended December 31,
| |
Increase (Decrease) in Net Assets
| | 2004
| | | 2003
| |
Operations: | | | | | | | | |
Net investment income (loss) | | $ | (1,138,786 | ) | | $ | (800,151 | ) |
Net realized gain (loss) on investment transactions | | | 10,201,612 | | | | 10,584,885 | |
Net unrealized appreciation (depreciation) on investment transactions during the period | | | 4,371,388 | | | | 23,791,384 | |
Net increase (decrease) in net assets resulting from operations | | | 13,434,214 | | | | 33,576,118 | |
Portfolio share transactions: | | | | | | | | |
Class A | | | | | | | | |
Proceeds from shares sold | | | 14,595,440 | | | | 23,691,008 | |
Cost of shares redeemed | | | (17,916,695 | ) | | | (6,045,865 | ) |
Net increase (decrease) in net assets from Class A share transactions | | | (3,321,255 | ) | | | 17,645,143 | |
Page 429 of 466
| | | | | | | | |
Class B | | | | | | | | |
Proceeds from shares sold | | | 9,964,790 | | | | 11,019,067 | |
Cost of shares redeemed | | | (2,100,980 | ) | | | (720,077 | ) |
Net increase (decrease) in net assets from Class B share transactions | | | 7,863,810 | | | | 10,298,990 | |
Increase (decrease) in net assets | | | 17,976,769 | | | | 61,520,251 | |
Net assets at beginning of period | | | 122,908,588 | | | | 61,388,337 | |
| | |
|
|
| |
|
|
|
Net assets at end of period (including accumulated net investment loss of $301 and $281, respectively) | | $ | 140,885,357 | | | $ | 122,908,588 | |
| | |
|
|
| |
|
|
|
Other Information | | | | | | | | |
| | |
Class A | | | | | | | | |
Shares outstanding at beginning of period | | | 12,352,137 | | | | 10,171,623 | |
Shares sold | | | 1,622,749 | | | | 3,071,391 | |
Shares redeemed | | | (2,056,828 | ) | | | (890,877 | ) |
| | |
|
|
| |
|
|
|
Net increase (decrease) in Portfolio shares | | | (434,079 | ) | | | 2,180,514 | |
| | |
|
|
| |
|
|
|
Shares outstanding at end of period | | | 11,918,058 | | | | 12,352,137 | |
| | |
Class B | | | | | | | | |
Shares outstanding at beginning of period | | | 1,499,883 | | | | 96,707 | |
Shares sold | | | 1,126,297 | | | | 1,496,481 | |
Shares redeemed | | | (239,526 | ) | | | (93,305 | ) |
Net increase (decrease) in Portfolio shares | | | 886,771 | | | | 1,403,176 | |
| | |
|
|
| |
|
|
|
Shares outstanding at end of period | | | 2,386,654 | | | | 1,499,883 | |
| | |
|
|
| |
|
|
|
The accompanying notes are an integral part of the financial statements.
Financial Highlights
Class A
| | | | | | | | | | | | | | | | |
Years Ended December 31,
| | 2004
| | | 2003
| | | 2002
| | | 2001a
| |
Selected Per Share Data | | | | | | | | | | | | | | | | |
Net asset value, beginning of period | | $ | 8.88 | | | $ | 5.98 | | | $ | 8.82 | | | $ | 10.00 | |
| | |
|
|
| |
|
|
| |
|
|
| |
|
|
|
Income (loss) from investment operations: | | | | | | | | | | | | | | | | |
Net investment income (loss)b | | | (.07 | ) | | | (.06 | ) | | | (.06 | ) | | | (.04 | ) |
Net realized and unrealized gain (loss) on investment transactions | | | 1.05 | | | | 2.96 | | | | (2.78 | ) | | | (1.14 | ) |
| | |
|
|
| |
|
|
| |
|
|
| |
|
|
|
Total from investment operations | | | .98 | | | | 2.90 | | | | (2.84 | ) | | | (1.18 | ) |
| | |
|
|
| |
|
|
| |
|
|
| |
|
|
|
Net asset value, end of period | | $ | 9.86 | | | $ | 8.88 | | | $ | 5.98 | | | $ | 8.82 | |
| | |
|
|
| |
|
|
| |
|
|
| |
|
|
|
Total Return (%) | | | 11.04 | | | | 48.49 | | | | (32.20 | ) | | | (11.80 | )c** |
| | |
|
|
| |
|
|
| |
|
|
| |
|
|
|
Ratios to Average Net Assets and Supplemental Data | | | | | | | | | | | | | | | | |
Net assets, end of period ($ millions) | | | 118 | | | | 110 | | | | 61 | | | | 48 | |
Ratio of expenses before expense reductions (%) | | | 1.19 | | | | 1.18 | | | | 1.13 | | | | 1.82 | * |
Ratio of expenses after expense reductions (%) | | | 1.19 | | | | 1.18 | | | | 1.13 | | | | 1.30 | * |
Ratio of net investment income (loss) (%) | | | (.82 | ) | | | (.90 | ) | | | (.82 | ) | | | (.76 | )* |
Portfolio turnover rate (%) | | | 174 | | | | 155 | | | | 225 | | | | 205 | * |
Page 430 of 466
| a | For the period from May 1, 2001 (commencement of operations) to December 31, 2001. |
| b | Based on average shares outstanding during the period. |
| c | Total return would have been lower had certain expenses not been reduced. |
Class B
| | | | | | | | | | | | |
Years Ended December 31,
| | 2004
| | | 2003
| | | 2002a
| |
Selected Per Share Data | | | | | | | | | | | | |
Net asset value, beginning of period | | $ | 8.84 | | | $ | 5.97 | | | $ | 6.60 | |
| | |
|
|
| |
|
|
| |
|
|
|
Income (loss) from investment operations: | | | | | | | | | | | | |
Net investment income (loss)b | | | (.10 | ) | | | (.09 | ) | | | (.02 | ) |
Net realized and unrealized gain (loss) on investment transactions | | | 1.04 | | | | 2.96 | | | | (.61 | ) |
| | |
|
|
| |
|
|
| |
|
|
|
Total from investment operations | | | .94 | | | | 2.87 | | | | (.63 | ) |
| | |
|
|
| |
|
|
| |
|
|
|
Net asset value, end of period | | $ | 9.78 | | | $ | 8.84 | | | $ | 5.97 | |
| | |
|
|
| |
|
|
| |
|
|
|
Total Return (%) | | | 10.63 | | | | 48.07 | | | | (9.55 | )** |
| | |
|
|
| |
|
|
| |
|
|
|
Ratios to Average Net Assets and Supplemental Data | | | | | | | | | | | | |
Net assets, end of period ($ millions) | | | 23 | | | | 13 | | | | .6 | |
Ratio of expenses (%) | | | 1.56 | | | | 1.57 | | | | 1.38 | * |
Ratio of net investment income (loss) (%) | | | (1.19 | ) | | | (1.29 | ) | | | (.81 | )* |
Portfolio turnover rate (%) | | | 174 | | | | 155 | | | | 225 | |
| a | For the period July 1, 2002 (commencement of operations of Class B shares) to December 31, 2002. |
| b | Based on an average shares outstanding during the period. |
Notes to Financial Statements
A. Significant Accounting Policies
Scudder Variable Series II (the “Trust”) is registered under the Investment Company Act of 1940, as amended (the “1940 Act”), as an open-end, diversified management investment company organized as a Massachusetts business trust. The Trust offers thirty-three portfolios (the “portfolio(s)”). During the period, Scudder Government Securities Portfolio changed its name to Scudder Government & Agency Securities Portfolio and Scudder Contrarian Value Portfolio changed its name to Scudder Large Cap
Page 431 of 466
Value Portfolio. Effective August 16, 2004, four portfolios commenced operations; Scudder Conservative Income Strategy Portfolio, Scudder Growth & Income Strategy Portfolio, Scudder Growth Strategy Portfolio and Scudder Income & Growth Strategy Portfolio. All four of the Portfolios invest primarily in existing Scudder Portfolios (“Underlying Portfolios”). Each Underlying Portfolio’s accounting policies and investment holdings are outlined in the Underlying Portfolio’s financials statements and are available upon request. Effective November 15, 2004, two portfolios commenced operations; Scudder Mercury Large Cap Core Portfolio and Scudder Templeton Foreign Value Portfolio.
Multiple Classes of Shares of Beneficial Interest. The Trust offers two classes of shares (Class A shares and Class B shares) except Scudder Conservative Income Strategy Portfolio, Scudder Growth & Income Strategy Portfolio, Scudder Growth Strategy Portfolio and Scudder Income & Growth Strategy Portfolio, which offer Class B shares only. Sales of Class B shares are subject to record keeping fees up to 0.15% and Rule 12b-1 fees under the 1940 Act equal to an annual rate of 0.25%, of the average daily net assets of the Class B shares of the applicable Portfolio. Class A shares are not subject to such fees.
Investment income, realized and unrealized gains and losses, and certain portfolio-level expenses and expense reductions, if any, are borne pro rata on the basis of relative net assets by the holders of all classes of shares except that each class bears certain expenses unique to that class (including the applicable 12b-1 fee and record keeping fee). Differences in class-level expenses may result in payment of different per share dividends by class. All shares have equal rights with respect to voting subject to class-specific arrangements.
The Trust’s financial statements are prepared in accordance with accounting principles generally accepted in the United States of America which require the use of management estimates. Actual results could differ from those estimates. The policies described below are followed consistently by the Trust in the preparation of its financial statements.
Security Valuation. Investments in securities and Underlying Portfolios are stated at value determined as of the close of regular trading on the New York Stock Exchange on each day the exchange is open for trading. Equity securities are valued at the most recent sale price or official closing price reported on the exchange (US or foreign) or over-the-counter market on which the security is traded most extensively. Securities for which no sales are reported are valued at the calculated mean between the most recent bid and asked quotations on the relevant market or, if a mean cannot be determined, at the most recent bid quotation.
Debt securities are valued by independent pricing services approved by the Trustees of the Portfolios. If the pricing services are unable to provide valuations, the securities are valued at the most recent bid quotation or evaluated price, as applicable, obtained from a broker-dealer. Such services may use various pricing techniques which take into account appropriate factors such as yield, quality, coupon rate, maturity, type of issue, trading characteristics and other data, as well as broker quotes.
Money market instruments purchased with an original or remaining maturity of sixty days or less, maturing at par, are valued at amortized cost. Investments in open-end investment companies and Scudder Cash Management QP Trust are valued at their net asset value each business day.
Investments in the Underlying Portfolios are valued at the net asset value per share of each class of the Underlying Portfolios as of the close of regular trading on the New York Stock Exchange on each day the exchange is open for trading.
Securities and other assets for which market quotations are not readily available or for which the above
Page 432 of 466
valuation procedures are deemed not to reflect fair value are valued in a manner that is intended to reflect their fair value as determined in accordance with procedures approved by the Trustees. The Portfolios may use a fair valuation model to value international equity securities in order to adjust for events which may occur between the close of the foreign exchanges and the close of the New York Stock Exchange.
Foreign Currency Translations. The books and records of the Trust are maintained in US dollars. Investment securities and other assets and liabilities denominated in a foreign currency are translated into US dollars at the prevailing exchange rates at period end. Purchases and sales of investment securities, income and expenses are translated into US dollars at the prevailing exchange rates on the respective dates of the transactions.
Net realized and unrealized gains and losses on foreign currency transactions represent net gains and losses between trade and settlement dates on securities transactions, the disposition of forward foreign currency exchange contracts and foreign currencies and the difference between the amount of net investment income accrued and the US dollar amount actually received. That portion of both realized and unrealized gains and losses on investments that results from fluctuations in foreign currency exchange rates is not separately disclosed but is included with net realized and unrealized gains and losses on investment securities.
Repurchase Agreements. The portfolios may enter into repurchase agreements with certain banks and broker/dealers whereby the portfolios, through their custodian or sub-custodian bank, receive delivery of the underlying securities, the amount of which at the time of purchase and each subsequent business day is required to be maintained at such a level that the value is equal to at least the principal amount of the repurchase price plus accrued interest. The custodian bank holds the collateral in a separate account until the agreement matures. If the value of the securities falls below the principal amount of the repurchase agreement plus accrued interest, the financial institution deposits additional collateral by the following business day. If the financial institution either fails to deposit the required additional collateral or fails to repurchase the securities as agreed, the portfolios have the right to sell the securities and recover any resulting loss from the financial institution. If the financial institution enters into bankruptcy, the portfolios’ claims on the collateral may be subject to legal proceedings.
Securities Lending. Each portfolio, except Scudder Money Market Portfolio, SVS Dreman Small Cap Value Portfolio, Scudder Conservative Income Strategy Portfolio, Scudder Growth & Income Strategy Portfolio, Scudder Growth Strategy Portfolio, Scudder Income & Growth Strategy Portfolio, Scudder Mercury Large Cap Core Portfolio and Scudder Templeton Foreign Value Portfolio, may lend securities to financial institutions. The portfolios retain beneficial ownership of the securities they have loaned and continue to receive interest and dividends paid by the securities and to participate in any changes in their market value. The portfolio requires the borrowers of the securities to maintain collateral with the portfolio consisting of liquid, unencumbered assets having a value at least equal to the value of the securities loaned. The portfolio may invest the cash collateral into a joint trading account in an affiliated money market fund pursuant to Exemptive Orders issued by the SEC. The portfolios receive compensation for lending their securities either in the form of fees or by earning interest on invested cash collateral net fees paid to a lending agent. Either the portfolios or the borrower may terminate the loan. The portfolios are subject to all investment risks associated with the value of any cash collateral received, including, but not limited to, interest rate, credit and liquidity risk associated with such investments.
Options. An option contract is a contract in which the writer of the option grants the buyer of the option the right to purchase from (call option), or sell to (put option), the writer a designated instrument at a specified price within a specified period of time. Certain options, including options on indices, will
Page 433 of 466
require cash settlement by the portfolio if the option is exercised. The portfolios may enter into option contracts in order to hedge against potential adverse price movements in the value of portfolio assets; as a temporary substitute for selling selected investments; to lock in the purchase price of a security or currency which it expects to purchase in the near future; as a temporary substitute for purchasing selected investments; and to enhance potential gain.
The liability representing the portfolio’s obligation under an exchange traded written option or investment in a purchased option is valued at the last sale price or, in the absence of a sale, the mean between the closing bid and asked prices or at the most recent asked price (bid for purchased options) if no bid and asked price are available. Over-the-counter written or purchased options are valued using dealer-supplied quotations. Gain or loss is recognized when the option contract expires or is closed.
If the portfolio writes a covered call option, the portfolio foregoes, in exchange for the premium, the opportunity to profit during the option period from an increase in the market value of the underlying security above the exercise price. If the portfolio writes a put option it accepts the risk of a decline in the value of the underlying security below the exercise price. Over-the-counter options have the risk of the potential inability of counterparties to meet the terms of their contracts. The portfolio’s maximum exposure to purchased options is limited to the premium initially paid. In addition, certain risks may arise upon entering into option contracts including the risk that an illiquid secondary market will limit the portfolio’s ability to close out an option contract prior to the expiration date and that a change in the value of the option contract may not correlate exactly with changes in the value of the securities or currencies hedged.
Futures Contracts. A futures contract is an agreement between a buyer or seller and an established futures exchange or its clearinghouse in which the buyer or seller agrees to take or make a delivery of a specific amount of a financial instrument at a specified price on a specific date (settlement date). The portfolios may enter into futures contracts as a hedge against anticipated interest rate, currency or equity market changes and for duration management, risk management and return enhancement purposes.
Upon entering into a futures contract, the portfolio is required to deposit with a financial intermediary an amount (“initial margin”) equal to a certain percentage of the face value indicated in the futures contract. Subsequent payments (“variation margin”) are made or received by the portfolio dependent upon the daily fluctuations in the value of the underlying security and are recorded for financial reporting purposes as unrealized gains or losses by the portfolio. When entering into a closing transaction, the portfolio will realize a gain or loss equal to the difference between the value of the futures contract to sell and the futures contract to buy. Futures contracts are valued at the most recent settlement price.
Certain risks may arise upon entering into futures contracts, including the risk that an illiquid secondary market will limit the portfolio’s ability to close out a futures contract prior to the settlement date and that a change in the value of a futures contract may not correlate exactly with the changes in the value of the securities or currencies hedged. When utilizing futures contracts to hedge, the portfolio gives up the opportunity to profit from favorable price movements in the hedged positions during the term of the contract.
Forward Foreign Currency Exchange Contracts. A forward foreign currency exchange contract (forward currency contract) is a commitment to purchase or sell a foreign currency at the settlement date at a negotiated rate. The portfolios may enter into forward currency contracts in order to hedge its exposure to changes in foreign currency exchange rates on its foreign currency denominated portfolio holdings and to facilitate transactions in foreign currency denominated securities.
Page 434 of 466
Forward currency contracts are valued at the prevailing forward exchange rate of the underlying currencies and unrealized gain (loss) is recorded daily. Sales and purchases of forward currency contracts having the same settlement date and broker are offset and any gain (loss) is realized on the date of offset; otherwise, gain (loss) is realized on settlement date. Realized and unrealized gains and losses which represent the difference between the value of a forward currency contract to buy and a forward currency contract to sell are included in net realized and unrealized gain (loss) from foreign currency related transactions.
Certain risks may arise upon entering into forward currency contracts from the potential inability of counterparties to meet the terms of their contracts. Additionally, when utilizing forward currency contracts to hedge, the portfolio gives up the opportunity to profit from favorable exchange rate movements during the term of the contract.
Mortgage Dollar Rolls. The Scudder Fixed Income Portfolio, Scudder Government & Agency Securities Portfolio and Scudder Total Return Portfolio entered into mortgage dollar rolls in which each portfolio sells to a bank or broker/dealer (the “counterparty”) mortgage-backed securities for delivery in the current month and simultaneously contracts to repurchase similar, but not identical, securities on a fixed date. The counterparty receives all principal and interest payments, including prepayments, made on the security while it is the holder. Each portfolio receives compensation as consideration for entering into the commitment to repurchase. The compensation is paid in the form of a lower price for the security upon its repurchase, or alternatively, a fee. Mortgage dollar rolls may be renewed with a new sale and repurchase price and a cash settlement made at each renewal without physical delivery of the securities subject to the contract.
Mortgage dollar rolls may be treated for purposes of the 1940 Act as borrowings by each portfolio because they involve the sale of a security coupled with an agreement to repurchase. A mortgage dollar roll involves costs to each portfolio. For example, while each portfolio receives compensation as consideration for agreeing to repurchase the security, each portfolio forgoes the right to receive all principal and interest payments while the counterparty holds the security. These payments to the counterparty may exceed the compensation received by each portfolio, thereby effectively charging each portfolio interest on its borrowings. Further, although each portfolio can estimate the amount of expected principal prepayment over the term of the mortgage dollar roll, a variation in the actual amount of prepayment could increase or decrease the cost of each portfolio’s borrowing.
Certain risks may arise upon entering into mortgage dollar rolls from the potential inability of counterparties to meet the terms of their commitments. Additionally, the value of such securities may change adversely before each portfolio is able to repurchase them. There can be no assurance that each portfolio’s use of the cash that it receives from a mortgage dollar roll will provide a return that exceeds its borrowing costs.
When-Issued/Delayed Delivery Securities. Several of the portfolios may purchase securities with delivery or payment to occur at a later date beyond the normal settlement period. At the time the portfolio enters into a commitment to purchase a security, the transaction is recorded and the value of the security is reflected in the net asset value. The price of such security and the date when the security will be delivered and paid for are fixed at the time the transaction is negotiated. The value of the security may vary with market fluctuations. No interest accrues to the portfolio until payment takes place. At the time the portfolio enters into this type of transaction it is required to segregate cash or other liquid assets at least equal to the amount of the commitment.
Certain risks may arise upon entering into when-issued or delayed delivery securities from the potential inability of counterparties to meet the terms of their contracts or if the issuer does not issue the securities
Page 435 of 466
due to political, economic, or other factors. Additionally, losses may arise due to changes in the value of the underlying securities.
Federal Income Taxes. The portfolios’ policy is to comply with the requirements of the Internal Revenue Code, as amended, which are applicable to regulated investment companies and to distribute all of its taxable and tax-exempt income to its shareholders. Accordingly, the portfolios paid no federal income taxes and no federal income tax provision was required.
At December 31, 2004, the following portfolios had an approximate net tax basis capital loss carryforward which may be applied against any realized net taxable capital gains of each succeeding year until fully utilized or until the following expiration dates, whichever occurs first:
| | | | |
Portfolio
| | Capital Loss
Carryforward ($)
| | Expiration
Date
|
Scudder Aggressive Growth Portfolio | | 662,000 | | 12/31/2008 |
| | | 5,489,000 | | 12/31/2009 |
| | | 8,989,000 | | 12/31/2010 |
| | | 23,998,000 | | 12/31/2011 |
Scudder Blue Chip Portfolio | | 16,525,000 | | 12/31/2010 |
Scudder Global Blue Chip Portfolio | | 2,280,000 | | 12/31/2010 |
| | | 2,456,000 | | 12/31/2011 |
Scudder Growth Portfolio* | | 127,000 | | 12/31/2007 |
| | | 94,269,000 | | 12/31/2009 |
| | | 39,544,000 | | 12/31/2010 |
| | | 24,621,000 | | 12/31/2011 |
| | | 2,184,000 | | 12/31/2012 |
Scudder High Income Portfolio | | 4,823,000 | | 12/31/2007 |
| | | 16,114,000 | | 13/31/2008 |
| | | 22,935,000 | | 12/31/2009 |
| | | 55,108,000 | | 12/31/2010 |
| | | 13,877,000 | | 12/31/2011 |
Scudder International Select Equity Portfolio* | | 1,217,000 | | 12/31/2008 |
| | | 23,867,000 | | 12/31/2009 |
| | | 20,015,000 | | 12/31/2010 |
| | | 4,400,000 | | 12/31/2011 |
Scudder Large Cap Value Portfolio | | 6,183,000 | | 12/31/2008 |
| | | 11,765,000 | | 12/31/2010 |
| | | 6,438,000 | | 12/31/2011 |
Scudder Small Cap Growth Portfolio | | 73,835,000 | | 12/31/2009 |
| | | 62,668,000 | | 12/31/2010 |
Scudder Technology Growth Portfolio | | 1,211,000 | | 12/31/2008 |
| | | 94,141,000 | | 12/31/2009 |
| | | 93,499,000 | | 12/31/2010 |
| | | 71,516,000 | | 12/31/2011 |
Scudder Total Return Portfolio | | 21,387,000 | | 12/31/2009 |
| | | 8,813,000 | | 12/31/2010 |
| | | 46,269,000 | | 12/31/2011 |
Page 436 of 466
| | | | |
SVS Davis Venture Value Portfolio | | 127,000 | | 12/31/2009 |
| | | 4,386,000 | | 12/31/2010 |
| | | 1,390,000 | | 12/31/2011 |
| | | 1,088,000 | | 12/31/2012 |
SVS Dreman Financial Services Portfolio | | 743,000 | | 12/31/2009 |
| | | 2,479,000 | | 12/31/2010 |
| | | 2,101,000 | | 12/31/2011 |
SVS Dreman High Return Equity Portfolio | | 11,267,000 | | 12/31/2010 |
| | | 8,043,000 | | 12/31/2011 |
SVS Eagle Focused Large Cap Growth Portfolio | | 1,336,000 | | 12/31/2008 |
| | | 7,024,000 | | 12/31/2009 |
| | | 13,889,000 | | 12/31/2010 |
| | | 334,000 | | 12/31/2011 |
| | | 124,000 | | 12/31/2012 |
SVS Focus Value+Growth Portfolio | | 7,136,000 | | 12/31/2009 |
| | | 15,209,000 | | 12/31/2010 |
| | | 7,546,000 | | 12/31/2011 |
SVS Index 500 Portfolio | | 448,000 | | 12/31/2008 |
| | | 3,267,000 | | 12/31/2009 |
| | | 9,116,000 | | 12/31/2010 |
| | | 3,518,000 | | 12/21/2011 |
| | | 4,052,000 | | 12/31/2012 |
SVS INVESCO Dynamic Growth Portfolio | | 2,320,000 | | 12/31/2010 |
| | | 377,000 | | 12/31/2011 |
SVS Janus Growth and Income Portfolio | | 12,514,000 | | 12/31/2009 |
| | | 29,907,000 | | 12/31/2010 |
| | | 6,934,000 | | 12/31/2011 |
SVS Janus Growth Opportunities Portfolio | | 130,000 | | 12/31/2008 |
| | | 31,299,000 | | 12/31/2009 |
| | | 42,499,00 | | 12/31/2010 |
| | | 19,473,000 | | 12/31/2011 |
SVS Oak Strategic Equity Portfolio | | 322,000 | | 12/31/2009 |
| | | 4,401,000 | | 12/31/2010 |
| | | 2,522,000 | | 12/31/2011 |
| | | 3,689,000 | | 12/31/2012 |
SVS Turner Mid Cap Growth Portfolio | | 3,770,000 | | 12/31/2010 |
| * | Certain of these losses may be subject to limitations under Section 381-383 of the Internal Revenue Code. |
For the period from November 1, 2004 through December 31, 2004, the following portfolios incurred approximate net realized capital losses as follows:
| | |
Portfolio
| | Net Realized Capital Loss ($)
|
Scudder Aggressive Growth Portfolio | | 12,000 |
Scudder Fixed Income Portfolio | | 827,000 |
Scudder Strategic Income Portfolio | | 266,000 |
SVS Davis Venture Value Portfolio | | 576,000 |
SVS Dreman Financial Services Portfolio | | 330,000 |
SVS Eagle Focused Large Cap Growth Portfolio | | 297,000 |
Page 437 of 466
As permitted by tax regulations, the portfolios intend to elect to defer these losses and treat them as arising in the fiscal year ended December 31, 2005.
Distribution of Income and Gains. Distributions of net investment income, if any, for all portfolios except the Scudder Money Market Portfolio, are made annually. Net realized gains from investment transactions, in excess of available capital loss carryforwards, would be taxable to the portfolio if not distributed and, therefore, will be distributed to shareholders at least annually. All of the net investment income of the Scudder Money Market Portfolio is declared as a daily dividend and is distributed to shareholders monthly.
The timing and characterization of certain income and capital gains distributions are determined annually in accordance with federal tax regulations which may differ from accounting principles generally accepted in the United States of America. As a result, net investment income (loss) and net realized gain (loss) on investment transactions for a reporting period may differ significantly from distributions during such period. Accordingly, a portfolio may periodically make reclassifications among certain of its capital accounts without impacting the net asset value of the portfolio.
At December 31, 2004, the portfolios’ components of distributable earnings on a tax basis were as follows:
| | | | | | | | | |
Portfolio
| | Undistributed ordinary
income ($)
| | Undistributed net long-term
capital gains ($)
| | Capital loss
carryforwards ($)
| | | Unrealized appreciation
(depreciation) on
investments ($)
|
Scudder Aggressive Growth Portfolio | | — | | — | | (39,138,000 | ) | | 10,247,249 |
Scudder Blue Chip Portfolio | | 2,788,284 | | — | | (16,525,000 | ) | | 34,300,956 |
Scudder Conservative Income Strategy Portfolio | | 4,048 | | — | | — | | | 27,404 |
Scudder Fixed Income Portfolio | | 10,899,530 | | 1,340,182 | | — | | | 1,355,749 |
Scudder Global Blue Chip Portfolio | | 176,419 | | — | | (4,736,000 | ) | | 12,789,938 |
Scudder Government & Agency Securities Portfolio | | 13,236,546 | | 22,888 | | — | | | 2,026,301 |
Scudder Growth Portfolio | | 2,087,025 | | — | | (160,745,000 | ) | | 68,325,507 |
Scudder Growth & Income Strategy Portfolio | | 58,128 | | — | | — | | | 1,456,478 |
Scudder Growth Strategy Portfolio | | 93,109 | | — | | — | | | 2,077,035 |
Scudder High Income Portfolio | | 33,524,911 | | — | | (112,857,000 | ) | | 7,159,791 |
Scudder Income & Growth Strategy Portfolio | | 33,651 | | — | | — | | | 434,561 |
Scudder International Select Equity Portfolio | | 5,970,853 | | — | | (49,499,000 | ) | | 48,801,610 |
Scudder Large Cap Value Portfolio | | 5,207,536 | | — | | (24,386,000 | ) | | 48,129,819 |
Scudder Mercury Large Cap Core Portfolio | | 9,786 | | — | | — | | | 43,197 |
Scudder Small Cap Growth Portfolio | | — | | — | | (136,503,000 | ) | | 44,274,203 |
Scudder Strategic Income Portfolio | | 6,443,449 | | 200,018 | | — | | | 4,533,149 |
Scudder Technology Growth Portfolio | | 950,788 | | — | | (260,367,000 | ) | | 13,492,296 |
Scudder Templeton Foreign Value Portfolio | | — | | — | | — | | | 292,925 |
Scudder Total Return Portfolio | | 13,347,018 | | — | | (76,469,000 | ) | | 60,467,278 |
SVS Davis Venture Value Portfolio | | 2,236,932 | | — | | (6,991,000 | ) | | 65,487,518 |
SVS Dreman Financial Services Portfolio | | 2,664,080 | | — | | (5,323,000 | ) | | 40,116,974 |
SVS Dreman High Return Equity Portfolio | | 14,598,035 | | — | | (19,310,000 | ) | | 152,750,976 |
SVS Dreman Small Cap Value Portfolio | | 3,681,177 | | 47,131,177 | | — | | | 124,447,615 |
SVS Eagle Focused Large Cap Growth Portfolio | | 405,384 | | — | | (22,707,000 | ) | | 11,570,163 |
SVS Focus Value+Growth Portfolio | | 1,317,035 | | — | | (29,891,000 | ) | | 21,240,184 |
SVS Index 500 Portfolio | | 5,567,565 | | — | | (20,401,000 | ) | | 27,112,955 |
SVS INVESCO Dynamic Growth Portfolio | | — | | — | | (2,697,000 | ) | | 8,466,860 |
SVS Janus Growth and Income Portfolio | | 314,797 | | — | | (49,355,000 | ) | | 41,625,360 |
SVS Janus Growth Opportunities Portfolio | | 390,282 | | — | | (93,401,000 | ) | | 24,965,440 |
SVS MFS Strategic Value Portfolio | | 1,318,985 | | 1,296,975 | | — | | | 5,748,641 |
SVS Oak Strategic Equity Portfolio | | 3,530 | | — | | (10,934,000 | ) | | 12,405,910 |
SVS Turner Mid Cap Growth Portfolio | | — | | — | | (3,770,000 | ) | | 29,700,241 |
Page 438 of 466
In addition, the tax character of distributions paid by the portfolios is summarized as follows:
| | | | | | | | |
| | | Distributions from ordinary income ($)* Years Ended December 31,
| | Distributions from long-term capital gains ($) Years Ended December 31,
|
Portfolio
| | 2004
| | 2003
| | 2004
| | 2003
|
Scudder Blue Chip Portfolio | | 1,683,204 | | 1,361,345 | | — | | — |
Scudder Fixed Income Portfolio | | 11,368,699 | | 7,994,594 | | 1,643,431 | | — |
Scudder Global Blue Chip Portfolio | | 744,211 | | 165,879 | | — | | — |
Scudder Government & Agency Securities Portfolio | | 12,782,714 | | 24,354,482 | | — | | 649,165 |
Scudder Growth Portfolio | | 815,090 | | 328,128 | | — | | — |
Scudder High Income Portfolio | | 32,409,504 | | 30,333,486 | | — | | — |
Scudder International Select Equity Portfolio | | 1,778,472 | | 1,550,011 | | — | | — |
Scudder Large Cap Value Portfolio | | 4,405,034 | | 4,373,416 | | — | | — |
Scudder Money Market Portfolio | | 3,060,457 | | 3,501,000 | | — | | — |
Scudder Strategic Income Portfolio | | 2,582,795 | | 853,600 | | 787,439 | | 28,838 |
Scudder Total Return Portfolio | | 10,994,018 | | 20,032,407 | | — | | — |
SVS Davis Venture Value Portfolio | | 1,018,451 | | 940,019 | | — | | — |
SVS Dreman Financial Services Portfolio | | 2,372,080 | | 1,864,595 | | — | | — |
SVS Dreman High Return Equity Portfolio | | 12,318,605 | | 11,423,101 | | — | | — |
SVS Dreman Small Cap Value Portfolio | | 3,617,447 | | 3,009,265 | | — | | 4,054,538 |
SVS Focus Value+Growth Portfolio | | 999,011 | | 874,250 | | — | | — |
SVS Index 500 Portfolio | | 3,410,455 | | 2,880,518 | | — | | — |
SVS Janus Growth and Income Portfolio | | — | | 1,270,975 | | — | | — |
SVS MFS Strategic Value Portfolio | | 51,014 | | 24,920 | | 15,306 | | — |
| * | For tax purposes short-term capital gains distributions are considered ordinary income distributions. |
Page 439 of 466
Expenses. Expenses arising in connection with a specific portfolio are allocated to that portfolio. Trust expenses are allocated between the portfolios in proportion to their relative net assets.
Offering Costs. Offering costs for Scudder Conservative Income Strategy Portfolio, Scudder Growth & Income Strategy Portfolio, Scudder Growth Strategy Portfolio, Scudder Income & Growth Strategy Portfolio, Scudder Mercury Large Cap Core Portfolio and Scudder Templeton Foreign Value Portfolio were paid in connection with the offering of shares and are being amortized over one year.
Other. Investment transactions are accounted for on a trade date plus one basis for daily net asset value calculations. However, for financial reporting purposes, investment transactions are reported on trade date. Interest income is recorded on the accrual basis. Dividend income is recorded on the ex-dividend date net of foreign withholding taxes. Certain dividends from foreign securities may be recorded subsequent to the ex-dividend date as soon as the portfolio is informed of such dividends. Realized gains and losses from investment transactions are recorded on an identified cost basis. All discounts and premiums are accreted/amortized for both tax and financial reporting purposes for all portfolios, with the exception of securities in default of principal. Distributions of income and capital gains from the Underlying Portfolios are recorded on the ex-dividend date.
B. Investment Transactions
During the year ended December 31, 2004, purchases and sales of investment transactions (excluding short-term investments) were as follows:
| | | | |
Portfolio
| | Purchases ($)
| | Proceeds from Sales ($)
|
Scudder Aggressive Growth Portfolio | | 56,789,175 | | 59,781,369 |
Scudder Blue Chip Portfolio | | 693,404,785 | | 674,933,893 |
Scudder Conservative Income Strategy Portfolio | | 1,700,769 | | 94,822 |
Scudder Fixed Income Portfolio excluding US Treasury Obligations and mortgage dollar roll transactions | | 271,840,232 | | 214,976,219 |
US Treasury Obligations | | 286,946,849 | | 263,430,754 |
mortgage dollar roll transactions | | 50,004,606 | | 47,982,413 |
Scudder Global Blue Chip Portfolio | | 52,353,407 | | 51,823,610 |
Scudder Government & Agency Securities Portfolio | | | | |
excluding US Treasury Obligations and mortgage dollar roll transactions | | 673,022,650 | | 805,435,745 |
US Treasury Obligations | | 105,802,607 | | 95,188,060 |
mortgage dollar roll transactions | | 570,221,935 | | 515,802,279 |
Scudder Growth Portfolio | | 64,326,283 | | 92,035,576 |
Scudder Growth Strategy Portfolio | | 45,244,077 | | 1,372,875 |
Scudder Growth & Income Strategy Portfolio | | 37,028,786 | | 1,002,585 |
Scudder High Income Portfolio excluding US Treasury Obligations | | 656,002,457 | | 668,430,471 |
Page 440 of 466
| | | | |
US Treasury Obligations | | 13,697,036 | | 17,043,490 |
Scudder Income & Growth Strategy Portfolio | | 13,349,817 | | 569,463 |
Scudder International Select Equity Portfolio | | 188,827,851 | | 159,628,994 |
Scudder Large Cap Value Portfolio | | 134,634,281 | | 114,648,636 |
Scudder Mercury Large Cap Core Portfolio | | 1,594,336 | | 145,086 |
Scudder Small Cap Growth Portfolio | | 253,177,444 | | 261,463,174 |
Scudder Strategic Income Portfolio | | 158,913,262 | | 147,241,324 |
Scudder Technology Growth Portfolio | | 265,414,116 | | 304,666,293 |
Scudder Templeton Foreign Value Portfolio | | 4,936,557 | | — |
Scudder Total Return Portfolio excluding US Treasury Obligations and mortgage dollar roll transactions | | 558,022,325 | | 631,645,604 |
US Treasury Obligations | | 297,525,532 | | 296,723,105 |
mortgage dollar roll transactions | | 58,904,675 | | 59,144,410 |
SVS Davis Venture Value Portfolio | | 59,128,954 | | 7,649,794 |
SVS Dreman Financial Services Portfolio | | 13,829,335 | | 12,419,066 |
SVS Dreman High Return Equity Portfolio | | 105,373,436 | | 65,563,122 |
SVS Dreman Small Cap Value Portfolio | | 354,408,253 | | 313,377,535 |
SVS Eagle Focused Large Cap Growth Portfolio | | 109,257,505 | | 92,542,429 |
SVS Focus Value+Growth Portfolio | | 81,980,488 | | 90,750,723 |
SVS Index 500 Portfolio | | 74,492,688 | | 46,904,835 |
SVS INVESCO Dynamic Growth Portfolio | | 49,541,484 | | 51,766,862 |
SVS Janus Growth and Income Portfolio | | 101,170,464 | | 103,002,488 |
SVS Janus Growth Opportunities Portfolio | | 75,487,064 | | 91,418,044 |
SVS MFS Strategic Value Portfolio | | 40,368,565 | | 17,271,398 |
SVS Oak Strategic Equity Portfolio | | 41,120,897 | | 34,530,403 |
SVS Turner Mid Cap Growth Portfolio | | 227,449,318 | | 221,371,183 |
For the year ended December 31, 2004, transactions for written options were as follows for the Scudder Strategic Income Portfolio:
| | | | | | |
| | | Contract Amounts
| | | Premium ($)
| |
Beginning of period | | 49,656 | | | 13,199 | |
Written | | 10,267,865 | | | 322,408 | |
Closed | | (10,317,521 | ) | | (335,607 | ) |
End of period | | — | | | — | |
For the year ended December 31, 2004, transactions for written options were as follows for the Scudder Technology Growth Portfolio:
| | | | | | |
| | | Contract Amounts
| | | Premium ($)
| |
Beginning of period | | — | | | — | |
Written | | 26,839 | | | 3,395,007 | |
Closed | | (10,806 | ) | | (1,623,411 | ) |
Exercised | | (8,174 | ) | | (970,465 | ) |
Expired | | (5,785 | ) | | (468,400 | ) |
| | |
|
| |
|
|
End of period | | 2,074 | | | 332,731 | |
| | |
|
| |
|
|
Page 441 of 466
C. Related Parties
Management Agreement. Under the Management Agreement with Deutsche Investment Management Americas Inc. (“DeIM” or the “Advisor”), an indirect, wholly owned subsidiary of Deutsche Bank AG, the Advisor directs the investments of the portfolios in accordance with its investment objectives, policies and restrictions. The Advisor determines the securities, instruments and other contracts relating to investments to be purchased, sold or entered into by the portfolios. In addition to portfolio management services, the Advisor provides certain administrative services in accordance with the Management Agreement. Accordingly, for the year ended December 31, 2004, the fees pursuant to the Management Agreement were equivalent to the annual effective rates shown below of the portfolios’ average daily net assets:
| | | |
Portfolio
| | Annual Management Fee Rate
| |
Scudder Blue Chip Portfolio | | 0.65 | % |
Scudder Fixed Income Portfolio | | 0.60 | % |
Scudder Government & Agency Securities Portfolio | | 0.55 | % |
Scudder Growth Portfolio | | 0.60 | % |
Scudder High Income Portfolio | | 0.60 | % |
Scudder International Select Equity Portfolio | | 0.75 | % |
Scudder Large Cap Value Portfolio | | 0.75 | % |
Scudder Small Cap Growth Portfolio | | 0.65 | % |
Scudder Strategic Income Portfolio | | 0.65 | % |
Scudder Total Return Portfolio | | 0.55 | % |
SVS Dreman Small Cap Value Portfolio | | 0.75 | % |
SVS Focus Value+Growth Portfolio | | 0.75 | % |
For the period January 1, 2004 through September 30, 2004, the Scudder Money Market Portfolio paid a monthly investment management fee of 0.50%, based on the average daily net assets of the portfolio.
Effective October 1, 2004, the Scudder Money Market Portfolio pays a monthly investment management fee, based on the average daily net assets of the portfolio, computed and accrued daily and payable monthly, of 1/12 of the annual rates shown below:
| | | |
Average Daily Net Assets of the Portfolio
| | Annual Management Fee Rate
| |
$0-$215 million | | 0.500 | % |
next $335 million | | 0.375 | % |
next $250 million | | 0.300 | % |
over $800 million | | 0.250 | % |
Accordingly, for the year ended December 31, 2004, the fee pursuant to the Management Agreement was equivalent to the annual effective rate of 0.49% of the Scudder Money Market Portfolio’s average daily net assets.
Page 442 of 466
The Scudder Aggressive Growth Portfolio, Scudder Technology Growth Portfolio, SVS Dreman Financial Services Portfolio and SVS Dreman High Return Equity Portfolio each pay a monthly investment management fee, based on the average daily net assets of the portfolio, computed and accrued daily and payable monthly, of 1/12 of the annual rates shown below:
| | | |
Average Daily Net Assets of the Portfolio
| | Annual Management Fee Rate
| |
$0-$250 million | | 0.75 | % |
next $750 million | | 0.72 | % |
next $1.5 billion | | 0.70 | % |
next $2.5 billion | | 0.68 | % |
next $2.5 billion | | 0.65 | % |
next $2.5 billion | | 0.64 | % |
next $2.5 billion | | 0.63 | % |
over $12.5 billion | | 0.62 | % |
For the year ended December 31, 2004, the Advisor agreed to limit its fees and reimburse expenses of each class of the Scudder Aggressive Growth Portfolio to the extent necessary to maintain the annual expenses of Class A at 0.95% and Class B at 1.35%. For the year ended December 31, 2004, the Advisor waived $42,450 of management fees.
Accordingly, for the year ended December 31, 2004, the fees pursuant to the Management Agreement were equivalent to the annual effective rates shown below of the portfolios’ average daily net assets:
| | | |
Portfolio
| | Effective Rate
| |
Scudder Aggressive Growth Portfolio | | 0.68 | % |
Scudder Technology Growth Portfolio | | 0.75 | % |
SVS Dreman Financial Services Portfolio | | 0.75 | % |
SVS Dreman High Return Equity Portfolio | | 0.73 | % |
SVS INVESCO Dynamic Growth Portfolio and SVS Turner Mid Cap Growth Portfolio each pay a monthly investment management fee, based on the average daily net assets of the portfolio, computed and accrued daily and payable monthly, of 1/12 of the annual rates shown below:
| | | |
Average Daily Net Assets of the Portfolio
| | Annual Management Fee Rate
| |
$0-$250 million | | 1.000 | % |
next $250 million | | 0.975 | % |
next $500 million | | 0.950 | % |
next $1.5 billion | | 0.925 | % |
Over $2.5 billion | | 0.900 | % |
For the year ended December 31, 2004, the Advisor agreed to limit its fees and reimburse expenses of each class of the SVS INVESCO Dynamic Growth Portfolio to the extent necessary to maintain the annual expenses of Class A at 1.30% and Class B at 1.70%. For the year ended December 31, 2004, the Advisor waived $68,858 of management fees.
Accordingly, for the year ended December 31, 2004, the fees pursuant to the Management Agreement were equivalent to the annual effective rates shown below of the portfolios’ average daily net assets:
| | | |
Portfolio
| | Effective Rate
| |
SVS INVESCO Dynamic Growth Portfolio | | 0.82 | % |
SVS Turner Mid Cap Growth Portfolio | | 1.00 | % |
Page 443 of 466
SVS Davis Venture Value Portfolio, SVS Janus Growth and Income Portfolio, SVS Janus Growth Opportunities Portfolio and SVS Oak Strategic Equity Portfolio each pay a monthly investment management fee, based on the average daily net assets of the portfolio, computed and accrued daily and payable monthly, of 1/12 of the annual rates shown below:
| | | |
Average Daily Net Assets of the Portfolio
| | Annual Management Fee Rate
| |
$0-$250 million | | 0.950 | % |
next $250 million | | 0.925 | % |
next $500 million | | 0.900 | % |
next $1.5 billion | | 0.875 | % |
Over $2.5 billion | | 0.850 | % |
For the period January 1, 2004 through September 30, 2004, the SVS Eagle Focused Large Cap Growth Portfolio paid a monthly investment management fee, based on the average daily net assets of the portfolio, computed and accrued daily and payable monthly, of 1/12 of the annual rates shown below:
| | | |
Average Daily Net Assets of the Portfolio
| | Annual Management Fee Rate
| |
$0-$250 million | | 0.950 | % |
next $250 million | | 0.925 | % |
next $500 million | | 0.900 | % |
next $1.5 billion | | 0.875 | % |
Over $2.5 billion | | 0.850 | % |
Effective October 1, 2004 through October 1, 2005, the SVS Eagle Focused Large Cap Growth Portfolio pays a monthly investment management fee, based on the average daily net assets of the portfolio, computed and accrued daily and payable monthly, of 1/12 of the annual rate shown below:
| | | |
Average Daily Net Assets of the Portfolio
| | Annual Management Fee Rate
| |
SVS Eagle Focused Large Cap Growth Portfolio | | 0.700 | % |
Accordingly, for the year ended December 31, 2004, the fees pursuant to the Management Agreement were equivalent to the annual effective rates shown below of the portfolios’ average daily net assets:
| | | |
Portfolio
| | Effective Rate
| |
SVS Davis Venture Value Portfolio | | 0.95 | % |
SVS Eagle Focused Large Cap Growth Portfolio | | 0.88 | % |
SVS Janus Growth and Income Portfolio | | 0.95 | % |
SVS Janus Growth Opportunities Portfolio | | 0.95 | % |
SVS Oak Strategic Equity Portfolio | | 0.95 | % |
Page 444 of 466
For the period January 1, 2004 through September 30, 2004, the SVS Index 500 Portfolio paid a monthly investment management fee, based on the average daily net assets of the portfolio, computed and accrued daily and payable monthly, of 1/12 of the annual rates shown below:
| | | |
Average Daily Net Assets of the Portfolio
| | Annual
Management
Fee Rate
| |
$0-$250 million | | 0.370 | % |
next $250 million | | 0.330 | % |
next $500 million | | 0.310 | % |
next $1.5 billion | | 0.295 | % |
Over $2.5 billion | | 0.270 | % |
Effective October 1, 2004, the SVS Index 500 Portfolio pays a monthly investment management fee, based on the average daily net assets of the portfolio, computed and accrued daily and payable monthly, of 1/12 of the annual rate shown below:
| | | |
Average Daily Net Assets of the Portfolio
| | Annual
Management
Fee Rate
| |
SVS Index 500 Portfolio | | 0.200 | % |
Accordingly, for the year ended December 31, 2004, the fee pursuant to the Management Agreement was equivalent to an annual effective rate of 0.32% of SVS Index 500 Portfolio’s average daily net assets.
For the year ended December 31, 2004, the Advisor agreed to limit its fees and reimburse expenses of each class of the SVS Index 500 Portfolio to the extent necessary to maintain the annual expenses of Class A at 0.55% and Class B at 0.95%. Effective October 1, 2004 through September 30, 2005, the Advisor agreed to limit its fees and reimburse expenses of the SVS Index 500 Portfolio to the extent necessary to maintain the annual expenses of Class A at 0.377% and Class B at 0.627% (excluding certain expenses such as extraordinary expenses, taxes, brokerage, interest and fund accounting outsourcing fee savings). Accordingly, for the year ended December 31, 2004, the Advisor waived $5,655 of other expenses.
The Scudder Global Blue Chip Portfolio pays a monthly investment management fee, based on the average daily net assets of the portfolio, computed and accrued daily and payable monthly, of 1/12 of the annual rates shown below:
| | | |
Average Daily Net Assets of the Portfolio
| | Annual
Management
Fee Rate
| |
$0-$250 million | | 1.00 | % |
next $500 million | | 0.95 | % |
next $750 million | | 0.90 | % |
next $1.5 billion | | 0.85 | % |
Over $3 billion | | 0.80 | % |
Accordingly, for the year ended December 31, 2004, the fee pursuant to the Management Agreement was equivalent to an annual effective rate of 1.00% of Scudder Global Blue Chip Portfolio’s average daily net assets.
The SVS MFS Strategic Value Portfolio pays a monthly investment management fee, based on the average daily net assets of the portfolio, computed and accrued daily and payable monthly, of 1/12 of the annual rates shown below:
| | | |
Average Daily Net Assets of the Portfolio
| | Annual
Management
Fee Rate
| |
$0-$250 million | | 0.950 | % |
next $250 million | | 0.925 | % |
next $500 million | | 0.900 | % |
next $500 million | | 0.825 | % |
next $1 billion | | 0.800 | % |
Over $2.5 billion | | 0.775 | % |
Page 445 of 466
For the year ended December 31, 2004, the Advisor agreed to limit its fees and reimburse expenses of each class of the SVS MFS Strategic Value Portfolio to the extent necessary to maintain the annualized expenses of Class A at 1.15% and Class B at 1.55%. Accordingly, for the year ended December 31, 2004, the Advisor waived $89,208 of management fee and the fees pursuant to the Management Agreement were equivalent to an annual effective rate of 0.68% of the Portfolio’s average daily net assets.
The Scudder Mercury Large Cap Core Portfolio pays a monthly investment management fee based on the average daily net assets of the portfolio, computed and accrued daily and payable monthly, of 1/12 of the annual rates shown below:
| | | |
Average Daily Net Assets of the Portfolio
| | Annual
Management
Fee Rate
| |
$0-$250 million | | 0.900 | % |
next $250 million | | 0.850 | % |
next $500 million | | 0.800 | % |
next $1 billion | | 0.750 | % |
next $500 million | | 0.700 | % |
Over $2.5 billion | | 0.650 | % |
For the year ended December 31, 2004, the Advisor agreed to limit its fees and reimburse expenses of each class of the Scudder Mercury Large Cap Core Portfolio to the extent necessary to maintain the annualized expenses of Class A at 1.00% and Class B at 1.20%. For the year ended December 31, 2004, the Advisor waived $1,398 of management fees.
Accordingly, for the year ended December 31, 2004 the fee pursuant to the Management Agreement was equivalent to an annual effective rate of 0.90% of Scudder Mercury Large Cap Core Portfolio’s average daily net assets.
In addition, for the period ended December 31, 2004, the Advisor waived $26,726 of other expenses.
The Scudder Templeton Foreign Value Portfolio pays a monthly investment management fee based on the average daily net assets of the portfolio, computed and accrued daily and payable monthly, of 1/12 of the annual rates shown below:
| | | |
Average Daily Net Assets of the Portfolio
| | Annual
Management
Fee Rate
| |
$0-$250 million | | 0.950 | % |
next $250 million | | 0.900 | % |
next $500 million | | 0.850 | % |
next $1 billion | | 0.750 | % |
next $500 million | | 0.700 | % |
Over $2.5 billion | | 0.650 | % |
Page 446 of 466
For the year ended December 31, 2004, the Advisor agreed to limit its fees and reimburse expenses of each class of the Scudder Templeton Foreign Value Portfolio to the extent necessary to maintain the annualized expenses of Class A at 1.14% and Class B at 1.34%. For the year ended December 31, 2004, the Advisor waived $6,260 of management fees.
Accordingly, for the year ended December 31, 2004, the fee pursuant to the Management Agreement was equivalent to an annual effective rate of 0.00% of Scudder Templeton Foreign Value Portfolio’s average daily net assets.
In addition, for the period ended December 31, 2004, the Advisor waived $26,622 of other expenses.
The Scudder Conservative Income Strategy Portfolio, Scudder Growth & Income Strategy Portfolio, Scudder Growth Strategy Portfolio and Scudder Income & Growth Strategy Portfolio pays a monthly investment management fee based on the average daily net assets of the portfolio, computed and accrued daily and payable monthly, of 1/12 of the annual rates shown below:
| | | |
Average Daily Net Assets of the Portfolio
| | Annual
Management
Fee Rate
| |
$0-$500 million | | 0.150 | % |
next $500 million | | 0.140 | % |
next $500 million | | 0.130 | % |
next $1 billion | | 0.120 | % |
Over $2.5 billion | | 0.110 | % |
For the year ended December 31, 2004, the Advisor agreed to limit its fees and reimburse expenses of Class B of the Scudder Conservative Income Strategy Portfolio, Scudder Growth & Income Strategy Portfolio, Scudder Growth Strategy Portfolio and Scudder Income & Growth Strategy Portfolio to the extent necessary to maintain the annualized expenses of Class B at 0.75%, 0.75%, 0.75% and 0.75%, respectively. For the year ended December 31, 2004, the Advisor waived $363, $9,387, $11,104 and $3,818 of management fees, respectively.
Accordingly, for the year ended December 31, 2004, the fee pursuant to the Management Agreement was equivalent to an annualized effective rate of 0.00%, 0.00%, 0.00% and 0.00% of Scudder Conservative Income Strategy Portfolio’s, Scudder Growth & Income Strategy Portfolio’s, Scudder Growth Strategy Portfolio’s and Scudder Income & Growth Strategy Portfolio’s average daily net assets, respectively.
In addition, for the year ended December 31, 2004, the Advisor waived $28,805, $9,381, $11,097 and $15,697 of other expenses for Scudder Conservative Income Strategy Portfolio, Scudder Growth & Income Strategy Portfolio, Scudder Growth Strategy Portfolio and Scudder Income & Growth Strategy Portfolio.
The Scudder Conservative Income Strategy Portfolio, Scudder Growth & Income Strategy Portfolio, Scudder Growth Strategy Portfolio and Scudder Income & Growth Strategy Portfolio do not invest in the Underlying Portfolios for the purpose of exercising management or control; however, investments within the set limits may represent a significant portion of an Underlying Portfolio. At December 31, 2004, the Scudder Portfolios held the following percentage of the Underlying Portfolios’ outstanding shares as follows:
| | | |
Portfolio
| | Scudder SVSII
Fixed Income
Portfolio
| |
Scudder Growth & Income Strategy Portfolio | | 6 | % |
Page 447 of 466
| | | |
Portfolio
| | Scudder VIT
Real Estate
Portfolio
| |
Scudder Growth & Income Strategy Portfolio | | 35 | % |
Scudder Growth Strategy Portfolio | | 55 | % |
Scudder Income & Growth Strategy Portfolio | | 10 | % |
| | | |
Portfolio
| | Scudder SVSII
MFS Strategic
Value Portfolio
| |
Scudder Growth & Income Strategy Portfolio | | 6 | % |
Scudder Growth Strategy Portfolio | | 9 | % |
Deutsche Asset Management Investment Services Limited (“DeAMIS”) serves as sub-advisor to the Scudder International Select Equity, Scudder Strategic Income and Scudder Total Return Portfolios and is paid by the Advisor for its services.
Dreman Value Management, L.L.C. serves as sub-advisor to the SVS Dreman Financial Services, SVS Dreman High Return Equity and SVS Dreman Small Cap Value Portfolios and is paid by the Advisor for its services.
INVESCO Institutional (N.A.) Inc. serves as sub-advisor to the SVS INVESCO Dynamic Growth Portfolio and is paid by the Advisor for its services.
Eagle Asset Management, Inc. serves as sub-advisor to the SVS Eagle Focused Large Cap Growth Portfolio and is paid by the Advisor for its services.
Janus Capital Management, L.L.C., formerly Janus Capital Corporation, serves as sub-advisor to the SVS Janus Growth and Income and SVS Janus Growth Opportunities Portfolios and is paid by the Advisor for its services.
Turner Investment Partners, Inc. serves as sub-advisor to the SVS Turner Mid Cap Growth Portfolio and is paid by the Advisor for its services.
Oak Associates, Ltd. serves as sub-advisor to the SVS Oak Strategic Equity Portfolio and is paid by the Advisor for its services.
Davis Selected Advisers, L.P., serves as sub-advisor to the SVS Davis Venture Value Portfolio and is paid by the Advisor for its services.
Jennison Associates, L.L.C. serves as sub-advisor to the “growth” portion and Dreman Value Management, L.L.C. serves as sub-advisor to the “value” portion of the of the SVS Focus Value+Growth Portfolio and are paid by the Advisor for their services.
Massachusetts Financial Services Company (“MFS”) serves as sub-advisor to the SVS MFS Strategic Value Portfolio and is paid by the Advisor for its services.
Northern Trust Investments, N.A. (“NTI”) serves as sub-advisor to SVS Index 500 Portfolio and is paid by the Advisor for its services.
Fund Asset Management, L.P., a division of Merrill Lynch Investment Managers (“MLIM”), serves as sub-advisor to the Scudder Mercury Large Cap Core Portfolio and is paid by the Advisor for its services.
Templeton Investment Counsel L.L.C. serves as sub-advisor to the Scudder Templeton Foreign Value Portfolio and is paid by the Advisor for its services.
Page 448 of 466
The portfolios paid insurance premiums to an unaffiliated insurance broker in 2002 and 2003. This broker in turn paid a portion of its commissions to an affiliate of the Advisor, which performed certain insurance brokerage services for the broker. The Advisor has agreed to reimburse the portfolios in 2005 for the portion of commissions (plus interest) paid to the affiliate of the Advisor attributable to the premiums paid by the portfolios. The amounts for 2002 and 2003 are as follows:
| | | | |
Portfolio
| | Amount ($)
|
| | 2002
| | 2003
|
Scudder Aggressive Growth Portfolio | | 15 | | 17 |
Scudder Blue Chip Portfolio | | 64 | | 74 |
Scudder Fixed Income Portfolio | | 76 | | 80 |
Scudder Global Blue Chip Portfolio | | 15 | | 16 |
Scudder Government & Agency Securities Portfolio | | 187 | | 136 |
Scudder Growth Portfolio | | 90 | | 95 |
Scudder High Income Portfolio | | 104 | | 121 |
Scudder International Select Equity Portfolio | | 33 | | 44 |
Scudder Large Cap Value Portfolio | | 78 | | 75 |
Scudder Money Market Portfolio | | 223 | | 162 |
Scudder Small Cap Growth Portfolio | | 54 | | 64 |
Scudder Strategic Income Portfolio | | 19 | | 20 |
Scudder Technology Growth Portfolio | | 69 | | 73 |
Scudder Total Return Portfolio | | 243 | | 211 |
SVS Davis Venture Value Portfolio | | 55 | | 66 |
SVS Dreman Financial Services Portfolio | | 42 | | 43 |
SVS Dreman High Return Equity Portfolio | | 172 | | 198 |
SVS Dreman Small Cap Value Portfolio | | 94 | | 100 |
SVS Eagle Focused Large Cap Growth Portfolio | | 22 | | 27 |
SVS Focus Value+Growth Portfolio | | 35 | | 35 |
SVS Index 500 Portfolio | | 80 | | 94 |
SVS INVESCO Dynamic Growth Portfolio | | 8 | | 11 |
SVS Janus Growth & Income Portfolio | | 60 | | 59 |
SVS Janus Growth Opportunities Portfolio | | 42 | | 41 |
SVS MFS Strategic Value Portfolio | | 1 | | 4 |
SVS Oak Strategic Equity Portfolio | | 13 | | 22 |
SVS Turner Mid Cap Growth Portfolio | | 21 | | 32 |
Page 449 of 466
Service Provider Fees. Scudder Fund Accounting Corporation (“SFAC”), a subsidiary of the Advisor, is responsible for determining the daily net asset value per share and maintaining the portfolio and general accounting records of each portfolio. In turn, SFAC has delegated certain fund accounting functions to a third-party service provider. For the year ended December 31, 2004, SFAC received the following fee for its services for the following portfolios:
| | | | | | |
Portfolio
| | Total Aggregated ($)
| | Waived ($)
| | Unpaid at December 31, 2004 ($)
|
Scudder Aggressive Growth Portfolio | | 72,186 | | — | | 15,331 |
Scudder Conservative Income Strategy Portfolio | | 20,294 | | 20,294 | | — |
Scudder Global Blue Chip Portfolio | | 100,052 | | — | | 21,687 |
Scudder Growth & Income Strategy Portfolio | | 29,605 | | 14,851 | | 2,500 |
Scudder Growth Strategy Portfolio | | 29,606 | | 5,922 | | 11,219 |
Scudder Income & Growth Strategy Portfolio | | 29,606 | | 29,606 | | — |
Scudder Mercury Large Cap Core Portfolio | | 4,692 | | 4,692 | | — |
Scudder Technology Growth Portfolio | | 71,164 | | — | | 19,519 |
Scudder Templeton Foreign Value Portfolio | | 8,188 | | 8,188 | | — |
SVS Davis Venture Value Portfolio | | 88,473 | | — | | 20,793 |
SVS Dreman Financial Services Portfolio | | 59,176 | | — | | 13,557 |
SVS Dreman High Return Equity Portfolio | | 133,714 | | — | | 30,357 |
SVS Eagle Focused Large Cap Growth Portfolio | | 71,185 | | — | | 17,799 |
SVS Index 500 Portfolio | | 137,196 | | — | | 42,099 |
SVS INVESCO Dynamic Growth Portfolio | | 98,193 | | — | | 24,100 |
SVS Janus Growth and Income Portfolio | | 73,094 | | — | | 18,002 |
SVS Janus Growth Opportunities Portfolio | | 64,004 | | — | | 14,898 |
SVS MFS Strategic Value Portfolio | | 84,107 | | — | | — |
SVS Oak Strategic Equity Portfolio | | 58,218 | | — | | 13,091 |
SVS Turner Mid Cap Growth Portfolio | | 99,561 | | — | | 21,798 |
Distribution Service Agreement. Under the Distribution Service Agreement, in accordance with Rule 12b-1 under the 1940 Act, SISC, receives a fee (“Distribution Service Fee”) of 0.25% of average daily net assets of Class B shares. For the year ended December 31, 2004, the Distribution Service Fee was as follows:
| | | | | | |
Portfolio
| | Total Aggregated ($)
| | Waived ($)
| | Unpaid at December 31, 2004 ($)
|
Scudder Aggressive Growth Portfolio | | 12,985 | | — | | 1,331 |
Scudder Blue Chip Portfolio | | 67,530 | | — | | 7,396 |
Scudder Conservative Income Strategy Portfolio | | 604 | | 604 | | — |
Scudder Fixed Income Portfolio | | 175,814 | | — | | 16,456 |
Scudder Global Blue Chip Portfolio | | 23,461 | | — | | 2,556 |
Scudder Government & Agency Securities Portfolio | | 112,953 | | — | | 10,300 |
Scudder Growth Portfolio | | 29,642 | | — | | 3,276 |
Scudder Growth & Income Strategy Portfolio | | 15,635 | | 15,635 | | — |
Scudder Growth Strategy Portfolio | | 18,496 | | 18,496 | | — |
Scudder High Income Portfolio | | 116,895 | | — | | 11,765 |
Scudder Income & Growth Strategy Portfolio | | 6,354 | | 6,354 | | — |
Scudder International Select Equity Portfolio | | 78,650 | | — | | 9,313 |
Scudder Large Cap Value Portfolio | | 81,071 | | — | | 8,287 |
Scudder Mercury Large Cap Core Portfolio | | 229 | | 229 | | — |
Scudder Money Market Portfolio | | 157,184 | | — | | 11,738 |
Scudder Small Cap Growth Portfolio | | 55,527 | | — | | 5,777 |
Scudder Strategic Income Portfolio | | 39,636 | | — | | 3,876 |
Scudder Technology Growth Portfolio | | 34,701 | | — | | 3,348 |
Scudder Templeton Foreign Value Portfolio | | 846 | | 743 | | — |
Scudder Total Return Portfolio | | 66,432 | | — | | 6,595 |
SVS Davis Venture Value Portfolio | | 121,863 | | — | | 13,276 |
SVS Dreman Financial Services Portfolio | | 34,738 | | — | | 3,504 |
SVS Dreman High Return Equity Portfolio | | 230,719 | | — | | 23,607 |
SVS Dreman Small Cap Value Portfolio | | 128,313 | | — | | 13,939 |
SVS Eagle Focused Large Cap Growth Portfolio | | 60,991 | | — | | 6,510 |
SVS Focus Value+Growth Portfolio | | 22,563 | | — | | 2,275 |
SVS Index 500 Portfolio | | 128,429 | | — | | 14,996 |
SVS INVESCO Dynamic Growth Portfolio | | 14,375 | | — | | 1,359 |
SVS Janus Growth and Income Portfolio | | 53,141 | | — | | 5,521 |
SVS Janus Growth Opportunities Portfolio | | 17,186 | | — | | 1,709 |
SVS MFS Strategic Value Portfolio | | 59,488 | | — | | — |
SVS Oak Strategic Equity Portfolio | | 42,282 | | — | | 4,373 |
SVS Turner Mid Cap Growth Portfolio | | 46,764 | | — | | 4,752 |
Page 450 of 466
Trustees’ Fees and Expenses. The portfolios pay each Trustee not affiliated with the Advisor retainer fees plus specified amounts for attended board and committee meetings.
Scudder Cash Management QP Trust. Pursuant to an Exemptive Order issued by the SEC, the portfolios may invest in the Scudder Cash Management QP Trust (the “QP Trust”) and other affiliated funds managed by the Advisor. The QP Trust seeks to provide as high a level of current income as is consistent with the preservation of capital and the maintenance of liquidity. The QP Trust does not pay the Advisor a management fee for the affiliated funds’ investments in the QP Trust.
D. Investing in High Yield Securities
Investing in high yield securities may involve greater risks and considerations not typically associated with investing in US Government bonds and other high quality fixed-income securities. These securities are non-investment grade securities, often referred to as “junk bonds.” Economic downturns may disrupt the high yield market and impaired the ability of issuers to repay principal and interest. Also, an increase in interest rates would likely have an adverse impact on the value of such obligations. Moreover, high yield securities may be less liquid due to the extent that there is no established retail secondary market and because of a decline in the value of such securities.
E. Investing in Emerging Markets
Investing in emerging markets may involve special risks and considerations not typically associated with investing in the United States of America. These risks include revaluation of currencies, high rates of inflation, repatriation restrictions on income and capital, and future adverse political, social and economic developments. Moreover, securities issued in these markets may be less liquid, subject to government ownership controls, delayed settlements and their prices more volatile than those of comparable securities in the United States of America.
Page 451 of 466
F. Expense Reductions
For the year ended December 31, 2004, the Advisor agreed to reimburse the Portfolios which represents a portion of the fee savings expected to be realized by the Advisor related to the outsourcing by the Advisor of certain administrative services to an unaffiliated service provider in the following amounts:
| | |
Portfolio
| | Amount ($)
|
Scudder Aggressive Growth Portfolio | | 1,090 |
Scudder Blue Chip Portfolio | | 2,838 |
Scudder Fixed Income Portfolio | | 2,780 |
Scudder Global Blue Chip Portfolio | | 1,159 |
Scudder Government & Agency Securities Portfolio | | 3,370 |
Scudder Growth Portfolio | | 3,025 |
Scudder High Income Portfolio | | 3,853 |
Scudder Income & Growth Strategy Portfolio | | 1,273 |
Scudder International Select Equity Portfolio | | 2,084 |
Scudder Large Cap Value Portfolio | | 3,005 |
Scudder Money Market Portfolio | | 3,903 |
Scudder Small Cap Growth Portfolio | | 2,359 |
Scudder Strategic Income Portfolio | | 1,248 |
Scudder Technology Growth Portfolio | | 2,420 |
Scudder Total Return Portfolio | | 5,835 |
SVS Davis Venture Value Portfolio | | 2,965 |
SVS Dreman Financial Services Portfolio | | 1,865 |
SVS Dreman High Return Equity Portfolio | | 6,773 |
SVS Dreman Small Cap Value Portfolio | | 4,133 |
SVS Eagle Focused Large Cap Growth Portfolio | | 1,493 |
SVS Focus Value+Growth Portfolio | | 1,595 |
SVS Index 500 Portfolio | | 3,377 |
SVS INVESCO Dynamic Growth Portfolio | | 951 |
SVS Janus Growth and Income Portfolio | | 2,213 |
SVS Janus Growth Opportunities Portfolio | | 1,698 |
SVS MFS Strategic Value Portfolio | | 941 |
SVS Oak Strategic Equity Portfolio | | 1,351 |
SVS Turner Mid Cap Growth Portfolio | | 1,633 |
In addition, the portfolios have entered into arrangements with their custodian whereby credits realized as a result of uninvested cash balances were used to reduce a portion of the portfolios’ expenses. During the year ended December 31, 2004, the portfolios’ custodian fees were reduced under these arrangements as follows:
| | |
Portfolio
| | Amount ($)
|
Scudder Aggressive Growth Portfolio | | 228 |
Scudder Blue Chip Portfolio | | 96 |
Scudder Fixed Income Portfolio | | 1,290 |
Scudder Government & Agency Securities Portfolio | | 607 |
Scudder Growth Portfolio | | 18 |
Scudder High Income Portfolio | | 5,056 |
Scudder Large Cap Value Portfolio | | 29 |
Scudder Mercury Large Cap Core Portfolio | | 18 |
Scudder Money Market Portfolio | | 477 |
Scudder Small Cap Growth Portfolio | | 225 |
Scudder Strategic Income Portfolio | | 769 |
Page 452 of 466
| | |
Scudder Technology Growth Portfolio | | 190 |
Scudder Total Return Portfolio | | 982 |
SVS Davis Venture Value Portfolio | | 80 |
SVS Dreman Financial Services Portfolio | | 31 |
SVS Dreman High Return Equity Portfolio | | 36 |
SVS Dreman Small Cap Value Portfolio | | 2,577 |
SVS Eagle Focused Large Cap Growth Portfolio | | 57 |
SVS Focus Value+Growth Portfolio | | 28 |
SVS Index 500 Portfolio | | 69 |
SVS INVESCO Dynamic Growth Portfolio | | 57 |
SVS Janus Growth and Income Portfolio | | 56 |
SVS Janus Growth Opportunities Portfolio | | 30 |
SVS MFS Strategic Value Portfolio | | 28 |
SVS Oak Strategic Equity Portfolio | | 14 |
SVS Turner Mid Cap Growth Portfolio | | 52 |
G. Forward Foreign Currency Exchange Contracts
As of December 31, 2004, the following portfolios had entered into the following forward foreign currency exchange contracts resulting in the following:
| | | | | | | | | | | | |
| Scudder High Income Portfolio | | | | | | | | | | | | |
| | | |
Contracts to Deliver
| | In Exchange For
| | Settlement Date
| | Unrealized
Depreciation (US$)
| |
EUR | | 2,228,993 | | USD | | 2,735,509 | | 3/9/2005 | | $ | (296,355 | ) |
EUR | | 988,923 | | USD | | 1,277,535 | | 3/9/2005 | | | (67,593 | ) |
EUR | | 4,836,637 | | USD | | 6,107,888 | | 3/9/2005 | | | (470,879 | ) |
EUR | | 155,813 | | USD | | 207,473 | | 5/27/2005 | | | (4,773 | ) |
MXN | | 14,499,776 | | USD | | 1,240,211 | | 3/9/2005 | | | (45,005 | ) |
| | | | | | | | | | |
|
|
|
Total unrealized depreciation | | | | | | | | | | $ | (884,605 | ) |
| | | | | | | | | | |
|
|
|
| | | | | | | | | | | |
| Scudder Strategic Income Portfolio | | | | | | | | | |
| | | |
Contracts to Deliver
| | In Exchange For
| | Settlement Date
| | Unrealized
Appreciation (US$)
|
USD | | 184,193 | | EUR | | 146,000 | | 1/25/2005 | | $ | 14,290 |
USD | | 294,869 | | EUR | | 396,257 | | 1/27/2005 | | | 4,616 |
USD | | 92,053 | | EUR | | 73,000 | | 1/27/2005 | | | 7,190 |
USD | | 170,883 | | EUR | | 134,000 | | 1/27/2005 | | | 11,289 |
USD | | 159,960 | | EUR | | 120,000 | | 1/27/2005 | | | 3,179 |
USD | | 137,120 | | MXN | | 1,560,000 | | 1/27/2005 | | | 2,161 |
USD | | 130,000 | | RUB | | 3,711,500 | | 1/27/2005 | | | 3,934 |
USD | | 110,000 | | TRL | | 177,760,000,000 | | 1/27/2005 | | | 67,760 |
USD | | 100,000 | | TRL | | 149,800,000,000 | | 1/27/2005 | | | 49,800 |
USD | | 121,954 | | TRL | | 180,794,000,000 | | 1/27/2005 | | | 58,839 |
USD | | 130,000 | | TWD | | 4,192,500 | | 1/27/2005 | | | 2,456 |
USD | | 115,192 | | ARS | | 345,000 | | 1/27/2005 | | | 1,460 |
USD | | 235,000 | | BRL | | 716,162 | | 1/28/2005 | | | 31,083 |
| | | | | | | | | | |
|
|
Total unrealized appreciation | | | | | | | | | | $ | 258,057 |
| | | | | | | | | | |
|
|
Page 453 of 466
| | | | | | | | | | | | |
Contracts to Deliver
| | In Exchange For
| | Settlement Date
| | Unrealized
Depreciation (US$)
| |
EUR | | 1,839,002 | | USD | | 2,256,455 | | 1/21/2005 | | $ | (243,560 | ) |
EUR | | 823,877 | | USD | | 1,099,999 | | 1/21/2005 | | | (19,855 | ) |
GBP | | 1,019,863 | | USD | | 1,810,257 | | 1/21/2005 | | | (144,887 | ) |
EUR | | 1,400,000 | | USD | | 1,766,100 | | 1/27/2005 | | | (137,193 | ) |
EUR | | 110,000 | | USD | | 140,307 | | 1/27/2005 | | | (9,237 | ) |
EUR | | 37,590 | | USD | | 50,000 | | 1/27/2005 | | | (1,103 | ) |
MXN | | 1,144,040 | | USD | | 97,982 | | 1/27/2005 | | | (4,161 | ) |
MXN | | 1,799,920 | | USD | | 160,000 | | 1/27/2005 | �� | | (702 | ) |
MXN | | 2,928,328 | | USD | | 260,000 | | 1/27/2005 | | | (1,449 | ) |
TRL | | 330,594,000,000 | | USD | | 211,851 | | 1/27/2005 | | | (118,743 | ) |
TRL | | 177,760,000,000 | | USD | | 109,256 | | 1/27/2005 | | | (68,504 | ) |
BRL | | 384,670 | | USD | | 130,000 | | 1/28/2005 | | | (12,920 | ) |
BRL | | 331,492 | | USD | | 119,113 | | 1/28/2005 | | | (4,049 | ) |
EUR | | 139,576 | | USD | | 171,293 | | 3/9/2005 | | | (18,558 | ) |
EUR | | 19,412 | | USD | | 23,799 | | 3/9/2005 | | | (2,605 | ) |
EUR | | 52,001 | | USD | | 63,129 | | 3/9/2005 | | | (7,602 | ) |
EUR | | 51,657 | | USD | | 63,616 | | 3/9/2005 | | | (6,648 | ) |
EUR | | 51,667 | | USD | | 64,042 | | 3/9/2005 | | | (6,235 | ) |
EUR | | 56,094 | | USD | | 68,996 | | 3/9/2005 | | | (7,303 | ) |
EUR | | 22,386 | | USD | | 28,456 | | 3/9/2005 | | | (1,994 | ) |
EUR | | 54,251 | | USD | | 69,108 | | 3/9/2005 | | | (4,683 | ) |
EUR | | 14,880 | | USD | | 19,140 | | 3/9/2005 | | | (1,099 | ) |
EUR | | 115,504 | | USD | | 149,213 | | 3/9/2005 | | | (7,895 | ) |
EUR | | 21,379 | | USD | | 27,870 | | 3/9/2005 | | | (1,210 | ) |
EUR | | 15,341 | | USD | | 20,370 | | 3/9/2005 | | | (497 | ) |
EUR | | 13,174 | | USD | | 17,730 | | 3/9/2005 | | | (190 | ) |
MXN | | 1,111,737 | | USD | | 94,907 | | 3/9/2005 | | | (3,634 | ) |
MXN | | 78,094 | | USD | | 6,622 | | 3/9/2005 | | | (300 | ) |
MXN | | 85,204 | | USD | | 7,508 | | 3/9/2005 | | | (44 | ) |
EUR | | 15,582 | | USD | | 20,748 | | 5/27/2005 | | | (477 | ) |
| | | | | | | | | | |
|
|
|
Total unrealized depreciation | | | | | | | | | | $ | (837,337 | ) |
| | | | | | | | | | |
|
|
|
| | | | | | | | | | | |
| Scudder Total Return Portfolio | | | | | | | | | | | |
Contracts to Deliver
| | In Exchange For
| | Settlement Date
| | Unrealized
Appreciation (US$)
|
AUD | | 760,000 | | NZD | | 834,998 | | 1/27/2005 | | $ | 3,475 |
NZD | | 853,230 | | AUD | | 798,000 | | 1/27/2005 | | | 18,700 |
EUR | | 469,000 | | USD | | 623,796 | | 1/27/2005 | | | 13,808 |
USD | | 1,861,234 | | JPY | | 191,400,000 | | 1/27/2005 | | | 10,181 |
USD | | 623,110 | | JPY | | 65,100,000 | | 1/27/2005 | | | 13,406 |
AUD | | 760,000 | | NZD | | 834,998 | | 1/27/2005 | | | 3,307 |
USD | | 1,236,436 | | SEK | | 8,500,000 | | 1/27/2005 | | | 42,955 |
EUR | | 469,856 | | SEK | | 4,210,000 | | 1/27/2005 | | | 7,652 |
USD | | 614,292 | | TWD | | 19,900,000 | | 1/27/2005 | | | 14,418 |
| | | | | | | | | | |
|
|
Total unrealized appreciation | | | | | | | | | | $ | 127,902 |
| | | | | | | | | | |
|
|
Page 454 of 466
| | | | | | | | | | | | |
Contracts to Deliver
| | In Exchange For
| | Settlement Date
| | Unrealized
Depreciation (US$)
| |
NZD | | 2,619,711 | | AUD | | 2,365,000 | | 1/27/2005 | | $ | (1,813 | ) |
EUR | | 147,700 | | USD | | 194,392 | | 1/27/2005 | | | (6,406 | ) |
EUR | | 45,108 | | USD | | 60,000 | | 1/27/2005 | | | (1,324 | ) |
EUR | | 469,859 | | SEK | | 4,210,000 | | 1/27/2005 | | | (12,744 | ) |
EUR | | 460,000 | | USD | | 611,101 | | 1/27/2005 | | | (14,267 | ) |
GBP | | 330,000 | | USD | | 610,566 | | 1/27/2005 | | | (21,798 | ) |
JPY | | 64,000,000 | | USD | | 621,661 | | 1/27/2005 | | | (4,099 | ) |
MXN | | 2,294,000 | | USD | | 201,502 | | 1/27/2005 | | | (3,313 | ) |
NZD | | 2,619,710 | | AUD | | 2,365,000 | | 1/27/2005 | | | (34,648 | ) |
NZD | | 853,230 | | AUD | | 798,000 | | 1/27/2005 | | | (8,889 | ) |
EUR | | 231,151 | | USD | | 298,612 | | 3/9/2005 | | | (15,799 | ) |
EUR | | 442,689 | | USD | | 574,818 | | 3/9/2005 | | | (27,325 | ) |
EUR | | 20,520 | | USD | | 26,168 | | 3/9/2005 | | | (1,744 | ) |
MXN | | 26,990,237 | | USD | | 2,319,945 | | 3/9/2005 | | | (72,386 | ) |
EUR | | 25,969 | | USD | | 34,579 | | 5/27/2005 | | | (796 | ) |
| | | | | | | | | | |
|
|
|
Total unrealized depreciation | | | | | | $ | (227,351 | ) |
| | | | | | | | | | |
|
|
|
SVS Janus Growth and Income Portfolio
| | | | | | | | | | | | |
Contracts to Deliver
| | In Exchange For
| | Settlement Date
| | Unrealized
Depreciation (US$)
| |
CHF | | 800,000 | | USD | | 641,849 | | 4/15/2005 | | $ | (65,587 | ) |
CHF | | 925,000 | | USD | | 735,996 | | 4/15/2005 | | | (81,977 | ) |
CHF | | 180,000 | | USD | | 154,089 | | 4/15/2005 | | | (5,083 | ) |
EUR | | 915,000 | | USD | | 1,126,914 | | 4/15/2005 | | | (118,433 | ) |
EUR | | 325,000 | | USD | | 409,841 | | 4/15/2005 | | | (32,495 | ) |
| | | | | | | | | | |
|
|
|
Total unrealized depreciation | | $ | (303,575 | ) |
| | | | | | | | | | |
|
|
|
Currency Abbreviations:
| | |
ARS | | Argentine Peso |
BRL | | Brazilian Real |
CHF | | Swiss Franc |
EUR | | Euro |
GBP | | British Pound |
AUD | | Australian Dollar |
TWD | | Taiwanese Dollar |
| JPY | | Japanese Yen |
| MXN | | Mexican Peso |
| RUB | | Russian Ruble |
| TRL | | Turkish Lira |
| USD | | United States Dollar |
| SEK | | Swedish Krona |
| NZD | | New Zealand Dollar |
H. Ownership of the Portfolios
At December 31, 2004, the beneficial ownership in the portfolios was as follows:
Scudder Aggressive Growth Portfolio: Two Participating Insurance Companies were owners of record of 10% or more of the total outstanding Class A shares of the Portfolio, each owning 64% and 32%. Two Participating Insurance Companies were owners of record of 10% or more of the total outstanding Class B shares of the Portfolio, each owning 86% and 14%.
Scudder Blue Chip Portfolio: Two Participating Insurance Companies were owners of record of 10% or more of the total outstanding Class A shares of the Portfolio, each owning 54% and 38%. Two Participating Insurance Companies were owners of record of 10% or more of the total outstanding Class B shares of the Portfolio, each owning 82% and 18%.
Page 455 of 466
Scudder Conservative Income Strategy Portfolio: Two Participating Insurance Companies were owners of record of 10% or more of the total outstanding Class B shares of the Portfolio, each owning 53% and 42%.
Scudder Fixed Income Portfolio: Two Participating Insurance Companies were owners of record of 10% or more of the total outstanding Class A shares of the Portfolio, each owning 40% and 38%. One Participating Insurance Company was the owner of record of 10% or more of the total outstanding Class B shares of the Portfolio, owning 85%.
Scudder Global Blue Chip Portfolio: Two Participating Insurance Companies were owners of record of 10% or more of the total outstanding Class A shares of the Portfolio, each owning 57% and 41%. Two Participating Insurance Companies were owners of record of 10% or more of the total outstanding Class B shares of the Portfolio, each owning 74% and 26%.
Scudder Government & Agency Securities Portfolio: Three Participating Insurance Companies were owners of record of 10% or more of the total outstanding Class A shares of the Portfolio, each owning 43%, 31% and 19%. One Participating Insurance Company was the owner of record of 10% or more of the total outstanding Class B shares of the Portfolio, owning 89%.
Scudder Growth Portfolio: Three Participating Insurance Companies were owners of record of 10% or more of the total outstanding Class A shares of the Portfolio, each owning 47%, 28% and 21%. Two Participating Insurance Companies were owners of record of 10% or more of the total outstanding Class B shares of the Portfolio, each owning 83% and 16%.
Scudder Growth & Income Strategy Portfolio: Two Participating Insurance Companies were owners of record of 10% or more of the total outstanding Class B shares of the Portfolio, each owning 80% and 21%.
Scudder Growth Strategy Portfolio: Two Participating Insurance Companies were owners of record of 10% or more of the total outstanding Class B shares of the Portfolio, each owning 84% and 16%.
Scudder High Income Portfolio: Three Participating Insurance Companies were owners of record of 10% or more of the total outstanding Class A shares of the Portfolio, each owning 38%, 32% and 27%. Two Participating Insurance Companies were owners of record of 10% or more of the total outstanding Class B shares of the Portfolio, each owning 84% and 16%.
Scudder Income & Growth Strategy Portfolio: Two Participating Insurance Companies were owners of record of 10% or more of the total outstanding Class B shares of the Portfolio, each owning 70% and 30%.
Scudder International Select Equity Portfolio: Three Participating Insurance Companies were owners of record of 10% or more of the total outstanding Class A shares of the Portfolio, each owning 38%, 30% and 29%. Two Participating Insurance Companies were owners of record of 10% or more of the total outstanding Class B shares of the Portfolio, each owning 67% and 33%.
Scudder Large Cap Value Portfolio: Three Participating Insurance Companies were owners of record of 10% or more of the total outstanding Class A shares of the Portfolio, each owning 43%, 37% and 17%. Two Participating Insurance Companies were owners of record of 10% or more of the total outstanding Class B shares of the Portfolio, each owning 84% and 16%.
Page 456 of 466
Scudder Mercury Large Cap Core Portfolio: One Participating Insurance Company was the owner of record of 10% or more of the total outstanding Class A shares of the Portfolio, owning 100%. Two Participating Insurance Companies were owners of record of 10% or more of the total outstanding Class B shares of the Portfolio, each owning 53% and 47%.
Scudder Money Market Portfolio: Three Participating Insurance Companies were owners of record of 10% or more of the total outstanding Class A shares of the Portfolio, each owning 41%, 35% and 22%. Two Participating Insurance Companies were owners of record of 10% or more of the total outstanding Class B shares of the Portfolio, each owning 61% and 34%.
Scudder Small Cap Growth Portfolio: Three Participating Insurance Companies were owners of record of 10% or more of the total outstanding Class A shares of the Portfolio, each owning 42%, 28% and 26%. One Participating Insurance Company was the owner of record of 10% or more of the total outstanding Class B shares of the Portfolio, owning 87%.
Scudder Strategic Income Portfolio: Two Participating Insurance Companies were owners of record of 10% or more of the total outstanding Class A shares of the Portfolio, each owning 48% and 48%. Two Participating Insurance Companies were owners of record of 10% or more of the outstanding Class B shares of the Portfolio, each owning 72% and 28%.
Scudder Technology Growth Portfolio: Two Participating Insurance Companies were owners of record of 10% or more of the total outstanding Class A shares of the Portfolio, each owning 60% and 35%. Two Participating Insurance Companies were owners of record of 10% or more of the total outstanding Class B shares of the Portfolio, each owning 83% and 16%.
Scudder Templeton Foreign Value Portfolio: One Participating Insurance Company was owner of record of 10% or more of the total outstanding Class A shares of the Portfolio, owning 100%. One Participating Insurance Company was the owner of record of 10% or more of the total outstanding Class B shares of the Portfolio, owning 93%.
Scudder Total Return Portfolio: Three Participating Insurance Companies were owners of record of 10% or more of the total outstanding Class A shares of the Portfolio, each owning 48%, 32% and 19%. Two Participating Insurance Companies were owners of record of 10% or more of the total outstanding Class B shares of the Portfolio, each owning 80% and 19%.
SVS Davis Venture Value Portfolio: Two Participating Insurance Companies were owners of record of 10% or more of the total outstanding Class A shares of the Portfolio, each owning 75% and 24%. Two Participating Insurance Companies were owners of record of 10% or more of the total outstanding Class B shares of the Portfolio, each owning 77% and 22%.
SVS Dreman Financial Services Portfolio: Two Participating Insurance Companies were owners of record of 10% or more of the total outstanding Class A shares of the Portfolio, each owning 55% and 42%. Two Participating Insurance Companies were owners of record of 10% or more of the total outstanding Class B shares of the Portfolio, each owning 81% and 19%.
SVS Dreman High Return Equity Portfolio: Two Participating Insurance Companies were owners of record of 10% or more of the total outstanding Class A shares of the Portfolio, each owning 67% and 29%. Two Participating Insurance Companies were owners of record of 10% or more of the total outstanding Class B shares of the Portfolio, each owning 87% and 12%.
Page 457 of 466
SVS Dreman Small Cap Value Portfolio: Three Participating Insurance Companies were owners of record of 10% or more of the total outstanding Class A shares of the Portfolio, each owning 55%, 30% and 13%. Two Participating Insurance Companies were owners of record of 10% or more of the total outstanding Class B shares of the Portfolio, each owning 81% and 15%.
SVS Eagle Focused Large Cap Growth Portfolio: Two Participating Insurance Companies were owners of record of 10% or more of the total outstanding Class A shares of the Portfolio, each owning 68% and 26%. One Participating Insurance Company was the owner of record of 10% or more of the total outstanding Class B shares of the Portfolio, owning 88%.
SVS Focus Value+Growth Portfolio: Three Participating Insurance Companies were owners of record of 10% or more of the total outstanding Class A shares of the Portfolio, each owning 50%, 34% and 14%. Two Participating Insurance Companies were owners of record of 10% or more of the total outstanding Class B shares of the Portfolio, each owning 89% and 11%.
SVS Index 500 Portfolio: Two Participating Insurance Companies were owners of record of 10% or more of the total outstanding Class A shares of the Portfolio, each owning 67% and 31%. Two Participating Insurance Companies were owners of record of 10% or more of the total outstanding Class B shares of the Portfolio, each owning 85% and 15%.
SVS INVESCO Dynamic Growth Portfolio: Two Participating Insurance Companies were owners of record of 10% or more of the total outstanding Class A shares of the Portfolio, each owning 80% and 20%. One Participating Insurance Company was the owner of record of 10% or more of the total outstanding Class B shares of the Portfolio, owning 91%.
SVS Janus Growth and Income Portfolio: Two Participating Insurance Companies were owners of record of 10% or more of the total outstanding Class A shares of the Portfolio, each owning 69% and 30%. Two Participating Insurance Companies were owners of record of 10% or more of the total outstanding Class B shares of the Portfolio, each owning 86% and 14%.
SVS Janus Growth Opportunities Portfolio: Two Participating Insurance Companies were owners of record of 10% or more of the total outstanding Class A shares of the Portfolio, each owning 69% and 31%. One Participating Insurance Company was the owner of record of 10% or more of the total outstanding Class B shares of the Portfolio, owning 92%.
SVS MFS Strategic Value Portfolio: Two Participating Insurance Companies were owners of record of 10% or more of the total outstanding Class A shares of the Portfolio, each owning 60% and 20%. Two Participating Insurance Companies were owners of record of 10% or more of the total outstanding Class B shares of the Portfolio, each owning 87% and 13%.
SVS Oak Strategic Equity Portfolio: Two Participating Insurance Companies were owners of record of 10% or more of the total outstanding Class A shares of the Portfolio, each owning 80% and 20%. Two Participating Insurance Companies were owners of record of 10% or more of the total outstanding Class B shares of the Portfolio, each owning 84% and 11%.
SVS Turner Mid Cap Growth Portfolio: Two Participating Insurance Companies were owners of record of 10% or more of the total outstanding Class A shares of the Portfolio, owning 81% and 19%. Two Participating Insurance Companies were owners of record of 10% or more of the total outstanding Class B shares of the Portfolio, each owning 85% and 15%.
Page 458 of 466
I. Line of Credit
The Trust and several other affiliated funds (the “Participants”) share in a $1.25 billion revolving credit facility administered by J.P. Morgan Chase Bank for temporary or emergency purposes, including the meeting of redemption requests that otherwise might require the untimely disposition of securities. The Participants are charged an annual commitment fee which is allocated, based upon net assets, among each of the Participants. Interest is calculated at the Federal Funds Rate plus 0.5 percent. The facility borrowing limit for each portfolio is as follows:
| | | |
Portfolio
| | Facility
Borrowing Limit
| |
Scudder Aggressive Growth Portfolio | | 33 | % |
Scudder Blue Chip Portfolio | | 33 | % |
Scudder Fixed Income Portfolio | | 33 | % |
Scudder Global Blue Chip Portfolio | | 33 | % |
Scudder Government & Agency Securities Portfolio | | 33 | % |
Scudder Growth Portfolio | | 33 | % |
Scudder High Income Portfolio | | 33 | % |
Scudder International Select Equity Portfolio | | 33 | % |
Scudder Large Cap Value Portfolio | | 33 | % |
Scudder Money Market Portfolio | | 33 | % |
Scudder Small Cap Growth Portfolio | | 33 | % |
Scudder Strategic Income Portfolio | | 33 | % |
Scudder Technology Growth Portfolio | | 5 | % |
Scudder Total Return Portfolio | | 33 | % |
SVS Davis Venture Value Portfolio | | 33 | % |
SVS Dreman Financial Services Portfolio | | 33 | % |
SVS Dreman High Return Equity Portfolio | | 33 | % |
SVS Dreman Small Cap Value Portfolio | | 33 | % |
SVS Eagle Focused Large Cap Growth Portfolio | | 33 | % |
SVS Focus Value+Growth Portfolio | | 33 | % |
SVS Index 500 Portfolio | | 33 | % |
SVS INVESCO Dynamic Growth Portfolio | | 33 | % |
SVS Janus Growth and Income Portfolio | | 33 | % |
SVS Janus Growth Opportunities Portfolio | | 33 | % |
SVS MFS Strategic Value Portfolio | | 33 | % |
SVS Oak Strategic Equity Portfolio | | 33 | % |
SVS Turner Mid Cap Growth Portfolio | | 33 | % |
J. Regulatory Matters and Litigation
Since at least July 2003, federal, state and industry regulators have been conducting ongoing inquiries and investigations (“inquiries”) into the mutual fund industry, and have requested information from numerous mutual fund companies, including Scudder Investments. It is not possible to determine what the outcome of these inquiries will be or what the effect, if any, would be on the funds or their advisors. Publicity about mutual fund practices arising from these industry-wide inquiries serves as the general basis of a number of private lawsuits against the Scudder funds. These lawsuits, which previously have been reported in the press, involve purported class action and derivative lawsuits, making various
Page 459 of 466
allegations and naming as defendants various persons, including certain Scudder funds, the funds’ investment advisors and their affiliates, certain individuals, including in some cases fund Trustees/Directors, officers, and other parties. Each Scudder fund’s investment advisor has agreed to indemnify the applicable Scudder funds in connection with these lawsuits, or other lawsuits or regulatory actions that may be filed making allegations similar to these lawsuits regarding market timing, revenue sharing, fund valuation or other subjects arising from or related to the pending inquiries. Based on currently available information, the funds’ investment advisors believe the likelihood that the pending lawsuits will have a material adverse financial impact on a Scudder fund is remote and such actions are not likely to materially affect their ability to perform under their investment management agreements with the Scudder funds.
K. Payments Made by Affiliates
During the year ended December 31, 2004, the Advisor fully reimbursed the Government and Agency Securities Portfolio $2,420 for losses incurred in violation of investment restrictions.
L. Fund Mergers
On January 20, 2005, the Board of the following Acquired Portfolios approved, in principle, the merger of the Acquiring Portfolio into the Acquired Portfolio, a Scudder fund managed by the same portfolio management team.
Completion of the merger is subject to a number of conditions, including final approval by the Portfolio’s Board and approval by the shareholders of the Portfolio at a shareholder meeting expected to be held within approximately the next five months.
| | |
Acquired Portfolios
| | Acquiring Portfolios
|
SVS Focus Value+Growth Portfolio | | SVSI Growth and Income Portfolio |
Scudder Growth Portfolio | | SVSI Capital Growth Portfolio |
Report of Independent Registered Public Accounting Firm
To the Shareholders and Board of Trustees of Scudder Variable Series II:
We have audited the accompanying statements of assets and liabilities, including the portfolios of investments, of Scudder Variable Series II (the “Trust”) comprising the Scudder Aggressive Growth, Scudder Blue Chip, Scudder Conservative Income Strategy, Scudder Fixed Income, Scudder Global Blue Chip, Scudder Government & Agency Securities (formerly, Scudder Government Securities), Scudder Growth, Scudder Growth & Income Strategy, Scudder Growth Strategy, Scudder High Income, Scudder Income & Growth Strategy, Scudder International Select Equity, Scudder Large Cap Value (formerly, Scudder Contrarian Value), Scudder Mercury Large Cap Core, Scudder Money Market, Scudder Small Cap Growth, Scudder Strategic Income, Scudder Technology Growth, Scudder Templeton Foreign Value, Scudder Total Return, SVS Davis Venture Value, SVS Dreman Financial Services, SVS Dreman High Return Equity, SVS Dreman Small Cap Value, SVS Eagle Focused Large Cap Growth, SVS Focus Value+Growth, SVS Index 500, SVS INVESCO Dynamic Growth, SVS Janus Growth and Income, SVS Janus Growth Opportunities, SVS MFS Strategic Value, SVS Oak Strategic Equity, and SVS Turner Mid Cap Growth Portfolios (collectively, the “portfolios”) as of December 31, 2004,
Page 460 of 466
and the related statements of operations, the statements of changes in net assets and the financial highlights for each of the periods indicated therein. These financial statements and financial highlights are the responsibility of the Trust’s management. Our responsibility is to express an opinion on these financial statements and financial highlights based on our audits.
We conducted our audits in accordance with the standards of the Public Company Accounting Oversight Board (United States). Those standards require that we plan and perform the audit to obtain reasonable assurance about whether the financial statements and financial highlights are free of material misstatement. An audit includes consideration of internal control over financial reporting as a basis for designing audit procedures that are appropriate in the circumstances, but not for the purpose of expressing an opinion on the effectiveness of the Fund’s internal control over financial reporting. Accordingly, we express no such opinion. An audit also includes examining, on a test basis, evidence supporting the amounts and disclosures in the financial statements and financial highlights, assessing the accounting principles used and significant estimates made by management, as well as evaluating the overall financial statement presentation. Our procedures included confirmation of securities owned as of December 31, 2004, by correspondence with the custodian and brokers or by other appropriate auditing procedures where replies from brokers were not received. We believe that our audits provide a reasonable basis for our opinion.
In our opinion, the financial statements and financial highlights referred to above present fairly, in all material respects, the financial position of each of the portfolios of the Scudder Variable Series II at December 31, 2004, and the results of their operations, the changes in their net assets and their financial highlights for each of the periods indicated therein, in conformity with U.S. generally accepted accounting principles.
Boston, Massachusetts
February 15, 2005
Tax Information (Unaudited)
The following portfolios paid distributions from net long-term capital gains during the year ended December 31, 2004 as follows:
| | | | |
Portfolio
| | Distribution Per Share ($)
| | % Representing 15% Rate Gains
|
Scudder Fixed Income Portfolio | | .08 | | 100 |
Scudder Strategic Income Portfolio | | .013 | | 100 |
SVS MFS Strategic Value Portfolio | | .004 | | 100 |
The following portfolios designated as capital gain dividends for its year ended December 31, 2004:
| | | | |
Portfolio
| | Capital Gain ($)
| | % Representing 15% Rate Gains
|
Scudder Fixed Income Portfolio | | 1,470,000 | | 100 |
Scudder Government & Agency Securities Portfolio | | 30,000 | | 100 |
Scudder Strategic Income Portfolio | | 270,000 | | 100 |
SVS Dreman Small Cap Value Portfolio | | 51,844,000 | | 100 |
SVS MFS Strategic Value Portfolio | | 1,427,000 | | 100 |
Page 461 of 466
For corporate shareholders, the following percentage of income dividends paid during the following portfolios’ fiscal year ended December 31, 2004 qualified for the dividends received deduction:
| | |
Portfolio
| | %
|
Scudder Blue Chip Portfolio | | 100 |
Scudder Global Blue Chip Portfolio | | 46 |
Scudder Growth Portfolio | | 100 |
Scudder Large Cap Value Portfolio | | 100 |
Scudder Total Return Portfolio | | 53 |
SVS Davis Venture Value Portfolio | | 100 |
SVS Dreman Financial Services Portfolio | | 100 |
SVS Dreman High Return Equity Portfolio | | 100 |
SVS Dreman Small Cap Value Portfolio | | 100 |
SVS Focus Value+Growth Portfolio | | 100 |
SVS Index 500 Portfolio | | 100 |
SVS MFS Strategic Value Portfolio | | 100 |
Scudder International Select Equity Portfolio paid foreign taxes of $537,188 and earned $3,892,991 of foreign source income during the year ended December 31, 2004. Pursuant to Section 853 of the Internal Revenue Code, Scudder International Select Equity Portfolio designates $0.03 per share as foreign taxes paid and $0.20 per share as income earned from foreign sources for the year ended December 31, 2004.
Please consult a tax advisor if you have questions about federal or state income tax laws, or on how to prepare your tax returns. If you have specific questions about your account, please call (800) 621-1048.
Proxy Voting
A description of the Trust’s policies and procedures for voting proxies for portfolio securities and information about how the Trust voted proxies related to its portfolio securities during the 12-month period ended June 30 is available on our Web site — scudder.com (type “proxy voting” in the search field) — or on the SEC’s Web site — www.sec.gov. To obtain a written copy of the Trust’s policies and procedures without charge, upon request, call us toll free at (800) 621-1048.
Trustees and Officers
The following table presents certain information regarding the Trustees and Officers of the Trust as of December 31, 2004. Each individual’s age is set forth in parentheses after his or her name. Unless otherwise noted, (i) each individual has engaged in the principal occupation(s) noted in the table for at least the most recent five years, although not necessarily in the same capacity, and (ii) the address of each individual is c/o Deutsche Asset Management, 222 South Riverside Plaza, Chicago, Illinois, 60606. Each Trustee’s term of office extends until the next shareholder’s meeting called for the purpose of electing Trustees and until the election and qualification of a successor, or until such Trustee sooner dies, resigns, retires or is removed as provided in the governing documents of the Trust.
Page 462 of 466
Independent Trustees
| | | | |
Name, Year of Birth, Position(s)
Held with the Fund and Length of
Time Served1
| | Principal Occupation(s) During Past 5 Years and Other Directorships Held
| | Number of
Funds in
Fund
Complex
Overseen
|
Shirley D. Peterson (1941) Chairman, 2004-present Trustee, 1995-present | | Retired; formerly, President, Hood College (1995-2000); prior thereto, Partner, Steptoe & Johnson (law firm); Commissioner, Internal Revenue Service; Assistant Attorney General (Tax), US Department of Justice. Directorships: Federal Mogul Corp. (supplier of automotive components and subsystems); AK Steel (steel production); Goodyear Tire & Rubber Co. (April 2004-present) ; Champion Enterprises, Inc. (manufactured home building); Trustee, Bryn Mawr College. Former Directorship: Bethlehem Steel Corp. | | 86 |
| | |
John W. Ballantine (1946) Trustee, 1999-present | | Retired; formerly, Executive Vice President and Chief Risk Management Officer, First Chicago NBD Corporation/The First National Bank of Chicago (1996-1998); Executive Vice President and Head of International Banking (1995-1996). Directorships: First Oak Brook Bancshares, Inc.; Oak Brook Bank; American Healthways, Inc. (provider of disease and care management services); Portland General Electric (utility company) | | 86 |
| | |
Lewis A. Burnham (1933) Trustee, 1977-present | | Retired; formerly, Director of Management Consulting, McNulty & Company (1990-1998); prior thereto, Executive Vice President, Anchor Glass Container Corporation | | 86 |
| | |
Donald L. Dunaway (1937) Trustee, 1980-present | | Retired; formerly, Executive Vice President, A.O. Smith Corporation (diversified manufacturer) (1963-1994) | | 86 |
| | |
James R. Edgar (1946) Trustee, 1999-present | | Distinguished Fellow, University of Illinois, Institute of Government and Public Affairs (1999-present); formerly, Governor, State of Illinois (1991-1999). Directorships: Kemper Insurance Companies; John B. Sanfilippo & Son, Inc. (processor/packager/marketer of nuts, snacks and candy products); Horizon Group Properties, Inc.; Youbet.com (online wagering platform); Alberto-Culver Company (manufactures, distributes and markets health and beauty care products) | | 86 |
| | |
Paul K. Freeman (1950) Trustee, 2002-present | | President, Cook Street Holdings (consulting); Senior Visiting Research Scholar, Graduate School of International Studies, University of Denver; Consultant, World Bank/Inter-American Development Bank; formerly, Project Leader, International Institute for Applied Systems Analysis (1998-2001); Chief Executive Officer, The Eric Group, Inc. (environmental insurance) (1986-1998) | | 86 |
| | |
Robert B. Hoffman (1936) Trustee, 1981-present | | Retired; formerly, Chairman, Harnischfeger Industries, Inc. (machinery for the mining and paper industries) (1999-2000); prior thereto, Vice Chairman and Chief Financial Officer, Monsanto Company (agricultural, pharmaceutical and nutritional/food products) (1994-1999). Directorships: RCP Advisors, LLC (a private equity investment advisory firm) | | 86 |
| | |
William McClayton (1945) Trustee, 2004-present | | Managing Director of Finance and Administration, DiamondCluster International, Inc. (global management consulting firm) (2001-present); formerly, Partner, Arthur Andersen LLP (1986-2001). Formerly: Trustee, Ravinia Festival; Board of Managers, YMCA of Metropolitan Chicago | | 86 |
| | |
Robert H. Wadsworth (1940) Trustee, 2004-present | | President, Robert H. Wadsworth Associates, Inc. (consulting firm) (May 1983-present). Formerly, President and Trustee, Trust for Investment Managers (registered investment company) (April 1999-June 2002); President, Investment Company Administration, L.L.C. (January 1992*-July 2001); President, Treasurer and Director, First Fund Distributors, Inc. (June 1990-January 2002); Vice President, Professionally Managed Portfolios (May 1991-January 2002) and Advisors Series Trust (October 1996-January 2002) (registered investment companies). * Inception date of the corporation which was the predecessor to the L.L.C. | | 145 |
| | |
John G. Weithers (1933) Trustee, 1993-present | | Retired; formerly, Chairman of the Board and Chief Executive Officer, Chicago Stock Exchange. Directorships: Federal Life Insurance Company; Chairman of the Members of the Corporation and Trustee, DePaul University; formerly, International Federation of Stock Exchanges; Records Management Systems | | 86 |
Page 463 of 466
Interested Trustee and Officers2
| | | | |
Name, Year of Birth, Position(s)
Held with the Fund and Length of
Time Served1
| | Principal Occupation(s) During Past 5 Years and Other Directorships Held
| | Number of
Funds in
Fund
Complex
Overseen
|
William N. Shiebler3 (1942) Trustee, 2004-present | | Chief Executive Officer in the Americas for Deutsche Asset Management (“DeAM”) and a member of the DeAM Global Executive Committee (since 2002); Vice Chairman of Putnam Investments, Inc. (1999); Director and Senior Managing Director of Putnam Investments, Inc. and President, Chief Executive Officer, and Director of Putnam Mutual Funds Inc. (1990-1999) | | 137 |
| | |
Julian F. Sluyters4 (1960) President and Chief Executive Officer, 2004-present | | Managing Director, Deutsche Asset Management (since May 2004); President and Chief Executive Officer of The Germany Fund, Inc., The New Germany Fund, Inc., The Central Europe and Russia Fund, Inc., The Brazil Fund, Inc., The Korea Fund, Inc., Scudder Global High Income Fund, Inc. and Scudder New Asia Fund, Inc. (since May 2004); President and Chief Executive Officer, UBS Fund Services (2001-2003); Chief Administrative Officer (1998-2001) and Senior Vice President and Director of Mutual Fund Operations (1991-1998) UBS Global Asset Management | | n/a |
| | |
Philip J. Collora (1945) Vice President and Assistant Secretary, 1986-present | | Director, Deutsche Asset Management | | n/a |
| | |
Kenneth Murphy5 (1963) Vice President, 2002-present | | Vice President, Deutsche Asset Management (2000-present); formerly, Director, John Hancock Signature Services (1992-2000) | | n/a |
| | |
Paul H. Schubert4 (1963) Chief Financial Officer, 2004-present | | Managing Director, Deutsche Asset Management (since July 2004); formerly, Executive Director, Head of Mutual Fund Services and Treasurer for UBS Family of Funds at UBS Global Asset Management (1994-2004) | | n/a |
| | |
Charles A. Rizzo5 (1957) Treasurer, 2002-present | | Managing Director, Deutsche Asset Management (since April 2004); formerly, Director, Deutsche Asset Management (April 2000-March 2004); Vice President and Department Head, BT Alex. Brown Incorporated (now Deutsche Bank Securities Inc.) (1998-1999); Senior Manager, Coopers & Lybrand L.L.P. (now PricewaterhouseCoopers LLP) (1993-1998) | | n/a |
| | |
John Millette5 (1962) Secretary, 2001-present | | Director, Deutsche Asset Management | | n/a |
| | |
Lisa Hertz4 (1970) Assistant Secretary, 2003-present | | Assistant Vice President, Deutsche Asset Management | | n/a |
| | |
Daniel O. Hirsch6 (1954) Assistant Secretary, 2002-present | | Managing Director, Deutsche Asset Management (2002-present) and Director, Deutsche Global Funds Ltd. (2002-present); formerly, Director, Deutsche Asset Management (1999-2002); Principal, BT Alex. Brown Incorporated (now Deutsche Bank Securities Inc.) (1998-1999); Assistant General Counsel, United States Securities and Exchange Commission (1993-1998) | | n/a |
| | |
Caroline Pearson5 (1962) Assistant Secretary, 1998-present | | Managing Director, Deutsche Asset Management | | n/a |
| | |
Kevin M. Gay5 (1959) Assistant Treasurer, 2004-present | | Vice President, Deutsche Asset Management | | n/a |
| | |
Salvatore Schiavone5 (1965) Assistant Treasurer, 2003-present | | Director, Deutsche Asset Management | | n/a |
| | |
Kathleen Sullivan D’Eramo5 (1957) Assistant Treasurer, 2003-present | | Director, Deutsche Asset Management | | n/a |
| | |
Philip Gallo4 (1962) Chief Compliance Officer, 2004-present | | Managing Director, Deutsche Asset Management (2003-present); formerly, Co-Head of Goldman Sachs Asset Management Legal (1994-2003) | | n/a |
| 1 | Length of time served represents the date that each Trustee was first elected to the common board of Trustees which oversees a number of investment companies, including the fund, managed by the Advisor. For the Officers of the fund, the length of time served represents the date that each Officer was first elected to serve as an Officer of any fund overseen by the aforementioned common board of Trustees. |
Page 464 of 466
| 2 | As a result of their respective positions held with the Advisor, these individuals are considered “interested persons” of the Advisor within the meaning of the 1940 Act. Interested persons receive no compensation from the fund. |
| 3 | Address: 280 Park Avenue, New York, New York |
| 4 | Address: 345 Park Avenue, New York, New York |
| 5 | Address: Two International Place, Boston, Massachusetts |
| 6 | Address: One South Street, Baltimore, Maryland |
The fund’s Statement of Additional Information (“SAI”) includes additional information about the Trustees. The SAI is available, without charge, upon request. If you would like to request a copy of the SAI, you may do so by calling the following toll-free number: 1-800-621-1048.
About the Fund’s Advisor
Scudder Investments is part of Deutsche Asset Management, which is the marketing name in the US for the asset management activities of Deutsche Bank AG, Deutsche Investment Management Americas Inc., Deutsche Asset Management Inc., Deutsche Asset Management Investment Services Ltd., Deutsche Bank Trust Company Americas and Scudder Trust Company.
An investment in the Money Market Portfolio is not insured or guaranteed by the Federal Deposit Insurance Corporation or any other government agency. Although the Money Market Portfolio seeks to preserve the value of your investment at $1.00 per share, it is possible to lose money by investing in the Portfolio.
The views expressed in this report reflect those of the portfolio managers only through the end of the period of the report as stated on the cover. The managers’ views are subject to change at any time based on market and other conditions and should not be construed as a recommendation.
Scudder Distributors, Inc.
222 South Riverside Plaza
Chicago, IL 60606
(800) 778-1482
This information must be preceded or accompanied by a current prospectus.
Portfolio changes should not be considered recommendations for action by individual investors.
Page 465 of 466
Printed on recycled paper.
SVS2-2 (2/28/05) 35972
Form A
Printed in the U.S.A.
Page 466 of 466
Scudder Variable Series I
Annual Report to Shareholders
December 31, 2004
Contents
Performance Summary, Information About Your Portfolio’s Expenses, Management Summary, Investment Portfolio, Financial Statements and Financial Highlights for:
This report must be preceded or accompanied by a prospectus. To obtain a prospectus, call (800) 778-1482 or your financial representative. We advise you to consider the product’s objectives, risks, charges and expenses carefully before investing. The prospectus contains this and other important information about the investment product. Please read the prospectus carefully before you invest.
NOT FDIC/NCUA INSURED NO BANK GUARANTEE MAY LOSE VALUE
Investments in variable portfolios involve risk. Some portfolios have more risk than others. These include portfolios that allow exposure to or otherwise concentrate investments in certain sectors, geographic regions, security types, market capitalization or foreign securities (e.g., political or economic instability, which can be accentuated in Emerging Market countries). Please read the prospectus for specific details regarding a portfolio’s investments and risk profile.
2
Information About Your Portfolio’s Expenses
Money Market Portfolio
As an investor of the Portfolio, you incur two types of costs: ongoing expenses and transaction costs. Ongoing expenses include management fees and other Portfolio expenses. Examples of transaction costs include sales charges (loads), redemption fees and account maintenance fees, which are not shown in this section. The following tables are intended to help you understand your ongoing expenses (in dollars) of investing in the Portfolio and to help you compare these expenses with the ongoing expenses of investing in other mutual funds. The tables are based on an investment of $1,000 made at the beginning of the six-month period ended December 31, 2004.
The tables illustrate your Portfolio’s expenses in two ways:
Actual Portfolio Return. This helps you estimate the actual dollar amount of ongoing expenses (but not transaction costs) paid on a $1,000 investment in the Portfolio using the Portfolio’s actual return during the period. To estimate the expenses you paid over the period, simply divide your account value by $1,000 (for example, an $8,600 account value divided by $1,000 = 8.6), then multiply the result by the number in the “Expenses Paid per $1,000” line under the share class you hold.
Hypothetical 5% Portfolio Return. This helps you to compare your Portfolio’s ongoing expenses (but not transaction costs) with those of other mutual funds using the Portfolio’s actual expense ratio and a hypothetical rate of return of 5% per year before expenses. Examples using a 5% hypothetical portfolio return may be found in the shareholder reports of other mutual funds. The hypothetical account values and expenses may not be used to estimate the actual ending account balance or expenses you paid for the period.
Please note that the expenses shown in these tables are meant to highlight your ongoing expenses only and do not reflect any transaction costs. The “Expenses Paid per $1,000” line of the tables is useful in comparing ongoing expenses only and will not help you determine the relative total expense of owning different funds. If these transaction costs had been included, your costs would have been higher.
Expenses and Value of a $1,000 Investment for the six months ended December 31, 2004
| | | |
Actual Portfolio Return | | | |
Beginning Account Value 7/1/04 | | $ | 1,000.00 |
Ending Account Value 12/31/04 | | $ | 1,006.00 |
Expenses Paid per $1,000* | | $ | 2.74 |
| |
Hypothetical 5% Portfolio Return | | | |
Beginning Account Value 7/1/04 | | $ | 1,000.00 |
Ending Account Value 12/31/04 | | $ | 1,022.48 |
Expenses Paid per $1,000* | | $ | 2.76 |
| * | Expenses are equal to the Portfolio’s annualized expense ratio for each share class, multiplied by the average account value over the period, multiplied by the number of days in the most recent six-month period, then divided by 365. |
| | | |
| Annualized Expense Ratios | | | |
Scudder Variable Series I — Money Market Portfolio | | .54 | % |
For more information, please refer to the Portfolio’s prospectus.
3
Management Summary December 31, 2004
Money Market Portfolio
As economic recovery gained some momentum during the first quarter of 2004, the market turned its attention to the persistent lack of job creation, and the one-year LIBOR declined from 1.60% at the start of the year to 1.35% by the end of March. In early April, however, fixed income markets experienced a dramatic turnaround as the government reported that the economy had created more than 300,000 new jobs. In reaction, the Fed enacted its “measured pace” policy of gradually raising short-term interest rates at its five Federal Open Market Committee (FOMC) meetings from June through December 2004. In the second half of the year, the economy showed resiliency in the face of sharply rising oil prices, proving to many that the recovery had gained a firm foothold. In light of this renewed confidence — and continued job growth — at the close of the year LIBOR rose to 3.10%, its highest level since March 2002.
During the 12-month period ended December 31, 2004, the portfolio provided a total return of 0.90% compared with the 0.78% average return for funds in the Lipper Money Market Funds category for the same period, according to Lipper Inc.
In the second quarter, one-year money market rates rose sharply in response to concerns that the Federal Reserve (the Fed) would raise short-term interest rates aggressively over the next 12 to 24 months. Our strategy was to substantially decrease the portfolio’s average maturity to reduce risk, limiting our purchases to three-month maturity issues and shorter. During this period, we also increased the portfolio’s allocation in floating-rate securities (increasing commercial paper from 23% to 42% in 2003 and 2004, respectively.) Our decision to increase our allocation in this sector helped performance during the period. Going forward, we will continue our insistence on the highest credit quality within the portfolio and maintain our conservative investment strategies and standards.
A group of investment professionals is responsible for the day-to-day management of the portfolio. These investment professionals have a broad range of experience managing money market funds.
Deutsche Investment Management Americas Inc.
All performance shown is historical, assumes reinvestment of all dividends, and does not guarantee future results. Current performance may be lower or higher than the performance data quoted. Please visit scudder.com for the product’s most recent month-end performance. The yield quotation more closely reflects the current earnings of the portfolio than the total return quotation. Performance doesn’t reflect charges and fees (“contract charges”) associated with the separate account that invests in the portfolio or any variable life insurance policy or variable annuity contract for which the portfolio is an investment option. These charges and fees will reduce returns.
Risk Considerations
An investment in this portfolio is not insured or guaranteed by the Federal Deposit Insurance Corporation or by any other government agency. Although the portfolio seeks to preserve the value of your investment at $1.00 per share, it is possible to lose money by investing in the portfolio. Please read this portfolio’s prospectus for specific details regarding its investments and risk profile.
LIBOR, the London Interbank Offered Rate, is the most widely used benchmark or reference rate for short-term interest rates. LIBOR is the rate of interest at which banks borrow funds from other banks, in large volume, in the international market.
The Lipper Money Market Funds category includes funds that invest in high-quality financial instruments rated in the top two grades with dollar-weighted average maturities of less than 90 days and that intend to keep a constant net asset value. It is not possible to invest directly in a Lipper category.
Portfolio management market commentary is as of December 31, 2004, and may not come to pass. This information is subject to change at any time based on market and other conditions.
4
Portfolio Summary
Money Market Portfolio
| | | | | | |
Asset Allocation
| | 12/31/04
| | | 12/31/03
| |
Commercial Paper | | 42 | % | | 23 | % |
Floating Rate Notes | | 21 | % | | 31 | % |
Repurchase Agreements | | 13 | % | | 5 | % |
US Government Sponsored Agencies+ | | 13 | % | | 20 | % |
Certificates of Deposit and Bank Notes | | 9 | % | | 14 | % |
Promissory Notes | | 2 | % | | — | |
Short-Term Notes | | — | | | 7 | % |
| | |
|
| |
|
|
| | | 100 | % | | 100 | % |
| | |
|
| |
|
|
| + | Not backed by the full faith and credit of the US Government |
Weighted Average Maturity
| | | | |
Scudder Variable Series I — Money Market Portfolio | | 28 days | | 68 days |
First Tier Money Fund Average* | | 36 days | | 58 days |
| * | The Portfolio is compared to its iMoneyNet category: the First Tier Money Fund Average consists of all non-institutional taxable money market funds investing in only first tier (highest rating) securities. Category includes only non-government retail funds that also are not holding any second tier securities. Portfolio Holdings of First Tier funds include US Treasury, US Other, Repos, Time Deposits, Domestic Bank Obligations, Foreign Bank Obligations, First Tier CP, Floating Rate Notes and Asset Backed Commercial Paper. |
Asset allocation is subject to change. For more complete details about the Portfolios’ holdings, see page 7. A quarterly Fact Sheet is available upon request. Information concerning portfolio holdings of the Portfolio as of month-end will be posted to scudder.com on the 15th of the following month. Please call 1-800-778-1482.
Following the Portfolio’s fiscal first and third quarter-end, a complete portfolio holdings listing is filed with the SEC on Form N-Q. The form will be available on the SEC’s Web site at www.sec.gov, and it also may be reviewed and copied at the SEC’s Public Reference Room in Washington, D.C. Information on the operation of the SEC’s Public Reference Room may be obtained by calling (800) SEC-0330.
5
Investment Portfolio as of December 31, 2004
Money Market Portfolio
| | | | | | |
| | | Principal Amount ($)
| | | Value ($)
| |
Certificates of Deposit and Bank Notes 9.1% | | | | | | |
Nordea Bank Finland PLC, 2.36%, 2/2/2005 | | 2,000,000 | | | 2,000,018 | |
Societe Generale, 1.185%, 1/4/2005 | | 2,000,000 | | | 2,000,000 | |
Toronto Dominion Bank, 2.505%, 5/27/2005 | | 1,000,000 | | | 1,000,020 | |
| | | | | |
|
|
Total Certificates of Deposit and Bank Notes
(Cost $5,000,038) | | | | | 5,000,038 | |
| | | | | |
|
|
Commercial Paper 42.9% | | | | | | |
Alliance & Leicester PLC, 2.46%**, 3/7/2005 | | 1,000,000 | | | 995,577 | |
Barclays US Funding LLC, 2.26%**, 2/14/2005 | | 2,000,000 | | | 1,994,500 | |
CC (USA), Inc., 1.94%**, 2/28/2005 | | 2,000,000 | | | 1,993,781 | |
CRC Funding LLC, 2.34%**, 1/3/2005 | | 2,000,000 | | | 1,999,740 | |
Dorada Finance, Inc.: | | | | | | |
1.93%**, 1/14/2005 | | 1,000,000 | | | 999,303 | |
2.0%**, 1/7/2005 | | 1,500,000 | | | 1,499,500 | |
Genworth Financial, Inc., 2.38%**, 2/8/2005 | | 2,000,000 | | | 1,994,997 | |
Giro Funding US Corp.: | | | | | | |
2.36%**, 1/24/2005 | | 1,000,000 | | | 998,492 | |
2.36%**, 2/2/2005 | | 1,000,000 | | | 997,911 | |
Greyhawk Funding LLC, 2.04%**, 1/19/2005 | | 2,000,000 | | | 1,997,960 | |
K2 (USA) LLC: | | | | | | |
1.94%**, 2/28/2005 | | 1,000,000 | | | 996,890 | |
2.02%**, 2/28/2005 | | 1,000,000 | | | 996,762 | |
Perry Global Funding LLC, Series A, 2.06%**, 1/24/2005 | | 1,000,000 | | | 998,684 | |
Prudential PLC, 2.02%**, 1/7/2005 | | 1,000,000 | | | 999,663 | |
Swedish National Housing Finance Corp., 2.28%**, 1/31/2005 | | 1,000,000 | | | 998,100 | |
Toyota Motor Credit Corp., 2.36%**, 2/4/2005 | | 2,000,000 | | | 1,995,561 | |
WestPac Capital Corp., 2.34%**, 1/19/2005 | | 1,000,000 | | | 998,830 | |
| | | | | |
|
|
Total Commercial Paper
(Cost $23,456,251) | | | | | 23,456,251 | |
| | | | | |
|
|
Floating Rate Notes* 21.9% | | | | | | |
American Honda Finance Corp.: | | | | | | |
2.42%, 1/18/2005 | | 1,000,000 | | | 1,000,185 | |
2.45%, 1/24/2005 | | 1,000,000 | | | 1,000,249 | |
Canadian Imperial Bank of Commerce, 2.01%, 6/8/2005 | | 1,000,000 | | | 999,907 | |
Credit Suisse First Boston, 2.46%, 9/9/2005 | | 2,000,000 | | | 2,000,322 | |
| | |
| | | Principal
Amount ($)
| | | Value ($)
| |
General Electric Co., 1.22%, 10/24/2005 | | 1,000,000 | | | 1,000,430 | |
Lehman Brothers Holdings, Inc., 2.1%, 4/21/2005 | | 2,000,000 | | | 2,000,000 | |
Merrill Lynch & Co., Inc., 2.708%, 1/14/2005 | | 1,000,000 | | | 1,000,121 | |
Morgan Stanley, 2.33%, 2/18/2005 | | 1,000,000 | | | 1,000,000 | |
Tango Finance Corp., 2.37%, 3/22/2005 | | 2,000,000 | | | 1,999,978 | |
| | | | | |
|
|
Total Floating Rate Notes*
(Cost $12,001,192) | | | | | 12,001,192 | |
| | | | | |
|
|
Promissory Notes 1.8% | | | | | | |
Goldman Sachs Group, Inc., 2.4%*, 5/26/2005
(Cost $1,000,000) | | 1,000,000 | | | 1,000,000 | |
| | | | | |
|
|
US Government Sponsored Agencies 12.8% | | | | | | |
Federal Home Loan Bank, 1.5%, 3/8/2005 | | 500,000 | | | 500,000 | |
Federal Home Loan Mortgage Corp.: | | | | | | |
1.315%**, 1/11/2005 | | 1,000,000 | | | 999,635 | |
2.0%*, 10/7/2005 | | 4,000,000 | | | 4,000,000 | |
Federal National Mortgage Association: | | | | | | |
1.75%, 5/23/2005 | | 500,000 | | | 500,000 | |
2.56%**, 4/4/2005 | | 1,000,000 | | | 993,671 | |
| | | | | |
|
|
Total US Government Sponsored Agencies
(Cost $6,993,306) | | | | | 6,993,306 | |
| | | | | |
|
|
Repurchase Agreements 13.2% | | | | | | |
Citigroup Global Markets, Inc., 2.3%, dated 12/31/2004, to be repurchased at $6,001,150 on 1/3/2005 (b) | | 6,000,000 | | | 6,000,000 | |
State Street Bank and Trust Co., 1.9%, dated 12/31/2004, to be repurchased at $1,209,191 on 1/3/2005 (c) | | 1,209,000 | | | 1,209,000 | |
| | | | | |
|
|
Total Repurchase Agreements
(Cost $7,209,000) | | | | | 7,209,000 | |
| | | | | |
|
|
| | |
| | | % of Net
Assets
| | | Value ($)
| |
Total Investment Portfolio
(Cost $55,659,787) (a) | | 101.7 | | | 55,659,787 | |
| | |
Other Assets and Liabilities, Net | | (1.7 | ) | | (944,301 | ) |
| | |
|
| |
|
|
Net Assets | | 100.0 | | | 54,715,486 | |
| | |
|
| |
|
|
| * | Floating rate notes are securities whose yields vary with a designated market index or market rate, such as the coupon-equivalent of the US Treasury bill rate. These securities are shown at their current rate as of December 31, 2004. |
| ** | Annualized yield at time of purchase; not a coupon rate. |
| (a) | Cost for federal income tax purposes was $55,659,787. |
| (b) | Collateralized by a $5,995,000 Federal National Mortgage Association, 4.25%, maturing on 5/15/2009 with a value of $6,124,975 and a $305,000 US Treasury Note, 2.50%, maturing on 10/31/2006 with a value of $303,296. |
| (c) | Collateralized by a $1,250,000 Federal National Mortgage Association, 4.50%, maturing on 5/1/2019 with a value of $1,237,500. |
At December 31, 2004, the Money Market Portfolio had a net tax basis capital loss carryforward of approximately $2,640 which may be applied against any realized net taxable capital gains of each succeeding year until fully utilized or until December 31, 2009, whichever occurs first.
The accompanying notes are an integral part of the financial statements.
6
Financial Statements
Money Market Portfolio
| | | | |
Statement of Assets and Liabilities as of December 31, 2004 | | | | |
| |
Assets | | | | |
Investments: | | | | |
| |
Investments in securities, at amortized cost | | $ | 48,450,787 | |
Repurchase agreements, at amortized cost | | | 7,209,000 | |
Total investments in securities, at amortized cost | | | 55,659,787 | |
Cash | | | 81 | |
Interest receivable | | | 72,246 | |
Receivable for Portfolio shares sold | | | 33,616 | |
Other assets | | | 2,298 | |
| | |
|
|
|
Total assets | | | 55,768,028 | |
| | |
|
|
|
Liabilities | | | | |
Payable for investments purchased | | | 993,671 | |
Payable for Portfolio shares redeemed | | | 1,046 | |
Accrued management fee | | | 17,819 | |
Other accrued expenses and payables | | | 40,006 | |
| | |
|
|
|
Total liabilities | | | 1,052,542 | |
| | |
|
|
|
Net assets, at value | | $ | 54,715,486 | |
| | |
|
|
|
Net Assets | | | | |
Net assets consist of: | | | | |
| |
Undistributed net investment income | | | 3,677 | |
Accumulated net realized gain (loss) | | | (2,642 | ) |
Paid-in capital | | | 54,714,451 | |
| | |
|
|
|
Net assets, at value | | $ | 54,715,486 | |
| | |
|
|
|
Net Asset Value, offering and redemption price per share ($54,715,486 ÷ 54,705,614 outstanding shares of beneficial interest, $.01 par value, unlimited number of shares authorized) | | $ | 1.00 | |
| | |
|
|
|
7
Statement of Operations for the year ended December 31, 2004
| | | | |
Investment Income | | | | |
Income: | | | | |
| |
Interest | | $ | 871,545 | |
Expenses: | | | | |
| |
Management fee | | | 227,056 | |
Custodian fees | | | 15,416 | |
Accounting fees | | | 36,796 | |
Auditing | | | 14,320 | |
Legal | | | 14,020 | |
Trustees’ fees and expenses | | | 6,440 | |
Reports to shareholders | | | 10,465 | |
Other | | | 4,587 | |
| | |
|
|
|
Total expenses, before expense reductions | | | 329,100 | |
Expense reductions | | | (1,588 | ) |
| | |
|
|
|
Total expenses, after expense reductions | | | 327,512 | |
| | |
|
|
|
Net investment income | | | 544,033 | |
| | |
|
|
|
Net realized gain (loss) from investments | | | 1,745 | |
| | |
|
|
|
Net increase (decrease) in net assets resulting from operations | �� | $ | 545,778 | |
| | |
|
|
|
The accompanying notes are an integral part of the financial statements.
8
Statement of Changes in Net Assets
| | | | | | | | |
Increase (Decrease) in Net Assets
| | Years Ended December 31,
| |
| | 2004
| | | 2003
| |
Operations: | | | | | | | | |
| | |
Net investment income | | $ | 544,033 | | | $ | 704,805 | |
Net realized gain (loss) on investment transactions | | | 1,745 | | | | 637 | |
| | |
|
|
| |
|
|
|
Net increase (decrease) in net assets resulting from operations | | | 545,778 | | | | 705,442 | |
| | |
|
|
| |
|
|
|
Distributions to shareholders from net investment income | | | (540,356 | ) | | | (706,913 | ) |
Portfolio share transactions: | | | | | | | | |
| | |
Proceeds from shares sold | | | 32,931,943 | | | | 51,053,448 | |
Reinvestment of distributions | | | 540,356 | | | | 706,913 | |
Cost of shares redeemed | | | (48,506,966 | ) | | | (83,121,288 | ) |
Net increase (decrease) in net assets from Portfolio share transactions | | | (15,034,667 | ) | | | (31,360,927 | ) |
Increase (decrease) in net assets | | | (15,029,245 | ) | | | (31,362,398 | ) |
| | |
|
|
| |
|
|
|
Net assets at beginning of period | | | 69,744,731 | | | | 101,107,129 | |
| | |
|
|
| |
|
|
|
Net assets at end of period (including undistributed net investment income of $3,677 and $0, respectively) | | $ | 54,715,486 | | | $ | 69,744,731 | |
| | |
|
|
| |
|
|
|
Other Information | | | | | | | | |
Shares outstanding at beginning of period | | | 69,740,281 | | | | 101,101,208 | |
Shares sold | | | 32,931,943 | | | | 51,053,448 | |
Shares issued to shareholders in reinvestment of distributions | | | 540,356 | | | | 706,913 | |
Shares redeemed | | | (48,506,966 | ) | | | (83,121,288 | ) |
Net increase (decrease) in Portfolio shares | | | (15,034,667 | ) | | | (31,360,927 | ) |
| | |
|
|
| |
|
|
|
Shares outstanding at end of period | | | 54,705,614 | | | | 69,740,281 | |
| | |
|
|
| |
|
|
|
The accompanying notes are an integral part of the financial statements.
9
Financial Highlights
Money Market Portfolio
| | | | | | | | | | | | | | | | | | | | |
Years Ended December 31,
| | 2004
| | | 2003
| | | 2002
| | | 2001
| | | 2000
| |
Selected Per Share Data | | | | | | | | | | | | | | | | | | | | |
Net asset value, beginning of period | | $ | 1.00 | | | $ | 1.00 | | | $ | 1.00 | | | $ | 1.00 | | | $ | 1.00 | |
| | |
|
|
| |
|
|
| |
|
|
| |
|
|
| |
|
|
|
Income from investment operations: | | | | | | | | | | | | | | | | | | | | |
Net investment income | | | .009 | | | | .008 | | | | .015 | | | | .038 | | | | .060 | |
Less distributions from: | | | | | | | | | | | | | | | | | | | | |
Net investment income | | | (.009 | ) | | | (.008 | ) | | | (.015 | ) | | | (.038 | ) | | | (.060 | ) |
| | |
|
|
| |
|
|
| |
|
|
| |
|
|
| |
|
|
|
Net asset value, end of period | | $ | 1.00 | | | $ | 1.00 | | | $ | 1.00 | | | $ | 1.00 | | | $ | 1.00 | |
| | |
|
|
| |
|
|
| |
|
|
| |
|
|
| |
|
|
|
Total Return (%) | | | .90 | | | | .82 | | | | 1.49 | | | | 3.88 | | | | 6.21 | |
| | |
|
|
| |
|
|
| |
|
|
| |
|
|
| |
|
|
|
Ratios to Average Net Assets and Supplemental Data | | | | | | | | | | | | | | | | | | | | |
Net assets, end of period ($ millions) | | | 55 | | | | 70 | | | | 101 | | | | 139 | | | | 121 | |
Ratio of expenses before expense reductions (%) | | | .53 | | | | .48 | | | | .43 | | | | .46 | a | | | .46 | |
Ratio of expenses after expense reductions (%) | | | .53 | | | | .48 | | | | .43 | | | | .45 | a | | | .46 | |
Ratio of net investment income (%) | | | .89 | | | | .83 | | | | 1.49 | | | | 3.77 | | | | 6.00 | |
| a | The ratios of expenses excluding costs incurred in connection with a fund complex reorganization before and after expense reductions were .45% and .45%, respectively. |
10
Performance Summary December 31, 2004
Bond Portfolio
All performance shown is historical, assumes reinvestment of all dividends and capital gains, and does not guarantee future results. Investment return and principal value fluctuate with changing market conditions so that, when redeemed, shares may be worth more or less then their original cost. Current performance may be lower or higher than the performance data quoted. Please visit scudder.com for the product’s most recent month-end performance. Performance doesn’t reflect charges and fees (“contract charges”) associated with the separate account that invests in the portfolio or any variable life insurance policy or variable annuity contract for which the portfolio is an investment option. These charges and fees will reduce returns.
Investments by the portfolio in lower-rated bonds present greater risk to principal and income than investments in higher-quality securities. This portfolio invests in individual bonds whose yields and market values fluctuate so that your investment may be worth more or less than its original cost. Additionally, investing in foreign securities presents certain unique risks not associated with domestic investments, such as currency fluctuation and changes in political/economic conditions and market risks. All of these factors may result in greater share price volatility. Please see this portfolio’s prospectus for specific details regarding its investments and risk profile.
Growth of an Assumed $10,000 Investment
| ¨ | Bond Portfolio — Class A |
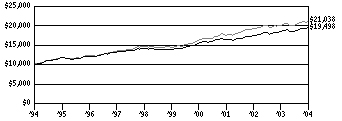
|
| The Lehman Brothers Aggregate Bond (LBAB) Index is an unmanaged, market value-weighted measure of Treasury issues, agency issues, corporate bond issues and mortgage securities. Index returns assume the reinvestment of dividends and, unlike Portfolio returns, do not reflect any fees or expenses. It is not possible to invest directly into an index. |
|
| |
Comparative Results (as of December 31, 2004)
| | | | | | | | | | | | | | | | |
Bond Portfolio
| | 1-Year
| | | 3-Year
| | | 5-Year
| | | 10-Year
| |
Class A | | | | | | | | | | | | | | | | |
Growth of $10,000 | | $ | 10,538 | | | $ | 11,919 | | | $ | 13,934 | | | $ | 19,498 | |
Average annual total return | | | 5.38 | % | | | 6.03 | % | | | 6.86 | % | | | 6.90 | % |
| | | | |
LBAB Index | | | | | | | | | | | | | | | | |
Growth of $10,000 | | $ | 10,434 | | | $ | 11,976 | | | $ | 14,497 | | | $ | 21,038 | |
Average annual total return | | | 4.34 | % | | | 6.19 | % | | | 7.71 | % | | | 7.72 | % |
The growth of $10,000 is cumulative.
11
Information About Your Portfolio’s Expenses
Bond Portfolio
As an investor of the Portfolio, you incur two types of costs: ongoing expenses and transaction costs. Ongoing expenses include management fees and other Portfolio expenses. Examples of transaction costs include sales charges (loads), redemption fees and account maintenance fees, which are not shown in this section. The following tables are intended to help you understand your ongoing expenses (in dollars) of investing in the Portfolio and to help you compare these expenses with the ongoing expenses of investing in other mutual funds. The tables are based on an investment of $1,000 made at the beginning of the six-month period ended December 31, 2004.
The tables illustrate your Portfolio’s expenses in two ways:
Actual Portfolio Return. This helps you estimate the actual dollar amount of ongoing expenses (but not transaction costs) paid on a $1,000 investment in the Portfolio using the Portfolio’s actual return during the period. To estimate the expenses you paid over the period, simply divide your account value by $1,000 (for example, an $8,600 account value divided by $1,000 = 8.6), then multiply the result by the number in the “Expenses Paid per $1,000” line under the share class you hold.
Hypothetical 5% Portfolio Return. This helps you to compare your Portfolio’s ongoing expenses (but not transaction costs) with those of other mutual funds using the Portfolio’s actual expense ratio and a hypothetical rate of return of 5% per year before expenses. Examples using a 5% hypothetical portfolio return may be found in the shareholder reports of other mutual funds. The hypothetical account values and expenses may not be used to estimate the actual ending account balance or expenses you paid for the period.
Please note that the expenses shown in these tables are meant to highlight your ongoing expenses only and do not reflect any transaction costs. The “Expenses Paid per $1,000” line of the tables is useful in comparing ongoing expenses only and will not help you determine the relative total expense of owning different funds. If these transaction costs had been included, your costs would have been higher.
Expenses and Value of a $1,000 Investment for the six months ended December 31, 2004
| | | |
| | | Class A
|
Actual Portfolio Return | | | |
Beginning Account Value 7/1/04 | | $ | 1,000.00 |
Ending Account Value 12/31/04 | | $ | 1,048.50 |
Expenses Paid per $1,000* | | $ | 3.27 |
| |
| | | Class A
|
Hypothetical 5% Portfolio Return | | | |
Beginning Account Value 7/1/04 | | $ | 1,000.00 |
Ending Account Value 12/31/04 | | $ | 1,022.01 |
Expenses Paid per $1,000* | | $ | 3.23 |
| * | Expenses are equal to the Portfolio’s annualized expense ratio for each share class, multiplied by the average account value over the period, multiplied by the number of days in the most recent six-month period, then divided by 365. |
| | | |
| | | Class A
| |
Annualized Expense Ratios | | | |
Scudder Variable Series — Bond Portfolio | | .63 | % |
For more information, please refer to the Portfolio’s prospectus.
12
Management Summary December 31, 2004
Bond Portfolio
Although delayed on mixed economic data, the Federal Open Market Committee (the FOMC) finally embarked on a “measured” pace of monetary policy tightening at midyear that included five separate 25 basis point (“bps” — a basis point is one hundredth of a percentage point) increases. The federal funds rate finished the year 125 bps higher at 2.25%. The yield curve flattened in response to the Fed policy coupled with moderate employment growth and the perception that inflation will not accelerate too quickly. The 2-year Treasury yield rose 125 bps, in line with the Fed, while the 10-year Treasury yield circuitously finished the year at 4.22% — down only 3 bps from where it started. Against this backdrop, the portfolio returned 5.38% (Class A shares, unadjusted for contract charges) for the year, outpacing the 4.34% return of its benchmark, the Lehman Brothers Aggregate Bond Index. Please see page 12 for standardized performance as of December 31, 2004.
All non-Treasury sectors significantly outperformed similar duration Treasury issues during the year. Credit, the best performing sector, benefited from excellent fundamentals, continued demand for yield and low volatility. Our allocations to high-yield and emerging-markets debt made the largest positive contributions to relative performance as both sectors significantly outperformed investment-grade bonds for the year. Our security selection within credit was also a positive contributor to performance. Our mortgage holdings emphasized securities that are less prepayment sensitive than the pass-through issues that comprise the index. On balance, our activities in the mortgage sector contributed to performance, despite declining volatility. The remaining high-quality sectors — asset-backed securities and commercial mortgage-backed securities — generated solid returns as valuations improved. International bonds also added to results, while currency exposure on balance was a slight drag on performance.
Gary W. Bartlett J. Christopher Gagnier Stephen Ilott Catharine Peppiatt
Warren S. Davis Daniel R. Taylor Paul Lambert Bruce Rodio
Thomas J. Flaherty Andrew P. Cestone William T. Lissenden Ian Winship
Timothy C. Vile Brett Diment
Co-Lead Managers Portfolio Managers
All performance shown is historical, assumes reinvestment of all dividends and capital gains, and does not guarantee future results. Investment return and principal value fluctuate with changing market conditions so that, when redeemed, shares may be worth more or less then their original cost. Current performance may be lower or higher than the performance data quoted. Please visit scudder.com for the product’s most recent month-end performance. Performance doesn’t reflect charges and fees (“contract charges”) associated with the separate account that invests in the portfolio or any variable life insurance policy or variable annuity contract for which the portfolio is an investment option. These charges and fees will reduce returns.
Risk Considerations
Investments by the portfolio in lower-rated bonds present greater risk to principal and income than investments in higher-quality securities. This portfolio invests in individual bonds whose yields and market values fluctuate so that your investment may be worth more or less than its original cost. Additionally, investing in foreign securities presents certain unique risks not associated with domestic investments, such as currency fluctuation and changes in political/economic conditions and market risks. All of these factors may result in greater share price volatility. Please see this portfolio’s prospectus for specific details regarding its investments and risk profile.
The Lehman Brothers Aggregate Bond (LBAB) Index is an unmanaged, market-value-weighted measure of Treasury issues, agency issues, corporate bond issues and mortgage securities. Index returns assume the reinvestment of dividends and, unlike portfolio returns, do not reflect any fees or expenses. It is not possible to invest directly into an index.
Portfolio management market commentary is as of December 31, 2004, and may not come to pass. This information is subject to change at any time based on market and other conditions.
13
Portfolio Summary
Bond Portfolio
Asset Allocation (Excludes Securities Lending Collateral)
| | | | | | |
| | | 12/31/04
| | | 12/31/03
| |
Collateralized Mortgage Obligations | | 23 | % | | 18 | % |
Corporate Bonds | | 21 | % | | 25 | % |
US Government Backed | | 15 | % | | 12 | % |
Foreign Bonds — US$ Denominated | | 9 | % | | 7 | % |
Commercial and Non-Agency Mortgage-Backed Securities | | 8 | % | | — | |
Asset Backed | | 6 | % | | 8 | % |
US Government Agency Sponsored Pass-Throughs | | 6 | % | | 21 | % |
Foreign Bonds — Non US$ Denominated | | 5 | % | | — | |
Municipal Investments | | 4 | % | | 4 | % |
Cash Equivalents | | 2 | % | | 5 | % |
Government National Mortgage Association | | 1 | % | | — | |
| | |
|
| |
|
|
| | | 100 | % | | 100 | % |
| | |
|
| |
|
|
| | |
Quality (Excludes Securities Lending Collateral) | | | | | | |
| | |
| | | 12/31/04
| | | 12/31/03
| |
US Government & Treasury Obligations | | 45 | % | | 47 | % |
AAA* | | 21 | % | | 21 | % |
AA | | 4 | % | | 4 | % |
A | | 9 | % | | 9 | % |
BBB | | 13 | % | | 12 | % |
BB or Below | | 8 | % | | 7 | % |
| | |
|
| |
|
|
| | | 100 | % | | 100 | % |
| | |
|
| |
|
|
| | |
Effective Maturity (Excludes Cash Equivalents and Securities Lending Collateral) | | | | | | |
| | |
| | | 12/31/04
| | | 12/31/03
| |
Under 1 year | | 7 | % | | 6 | % |
1 < 5 years | | 48 | % | | 50 | % |
5 < 8 years | | 45 | % | | 44 | % |
| | |
|
| |
|
|
| | | 100 | % | | 100 | % |
| | |
|
| |
|
|
| * | Category includes cash equivalents |
Asset allocation, quality and effective maturity are subject to change.
The quality ratings represent the lower of Moody’s Investors Services, Inc. (“Moody’s”) or Standard & Poor’s Corporation (“S&P”) credit ratings. The ratings of Moody’s and S&P represent their opinions as to the quality of the securities they rate. Ratings are relative and subjective and are not absolute standards of quality. The Portfolio’s credit quality does not remove market risk.
For more complete details about the Portfolio’s investment portfolio, see page 16. A quarterly Fact Sheet is available upon request. Information concerning portfolio holdings of the Portfolio as of month-end will be posted to scudder.com on the 15th of the following month. Please call 1-800-778-1482.
Following the Portfolio’s fiscal first and third quarter-end, a complete portfolio holdings listing is filed with the SEC on Form N-Q. The form will be available on the SEC’s Web site at www.sec.gov, and it also may be reviewed and copied at the SEC’s Public Reference Room in Washington, D.C. Information on the operation of the SEC’s Public Reference Room may be obtained by calling (800) SEC-0330.
14
Investment Portfolio as of December 31, 2004
Bond Portfolio
| | | | |
| | | Principal
Amount
($)(h)
| | Value ($)
|
Corporate Bonds 20.3% | | | | |
| | |
Consumer Discretionary 2.0% | | | | |
Adesa, Inc., 7.625%, 6/15/2012 | | 25,000 | | 26,375 |
Auburn Hills Trust, 12.375%, 5/1/2020 | | 70,000 | | 109,793 |
Bally Total Fitness Holdings Corp., 10.5%, 7/15/2011 | | 30,000 | | 30,225 |
Cablevision Systems New York Group, 144A, 6.669%*, 4/1/2009 (e) | | 35,000 | | 37,100 |
Caesars Entertainment, Inc., 9.375%, 2/15/2007 | | 30,000 | | 33,075 |
Carrols Corp., 144A, 9.0%, 1/15/2013 | | 10,000 | | 10,350 |
Comcast Cable Communications Holdings, Inc., 8.375%, 3/15/2013 | | 513,000 | | 632,578 |
Comcast MO of Delaware, Inc., 9.0%, 9/1/2008 | | 400,000 | | 467,251 |
Cooper Standard Automotive, Inc., 144A, 8.375%, 12/15/2014 | | 15,000 | | 14,963 |
CSC Holdings, Inc., 7.875%, 12/15/2007 | | 40,000 | | 42,900 |
DaimlerChrysler NA Holdings Corp., 4.75%, 1/15/2008 | | 345,000 | | 352,366 |
Dex Media East LLC/Financial, 12.125%, 11/15/2012 | | 119,000 | | 145,031 |
DIMON, Inc.: | | | | |
7.75%, 6/1/2013 | | 15,000 | | 15,750 |
Series B, 9.625%, 10/15/2011 | | 90,000 | | 98,550 |
Dura Operating Corp.: | | | | |
Series B, 8.625%, 4/15/2012 (e) | | 20,000 | | 20,800 |
Series D, 9.0%, 5/1/2009 (e) | | 25,000 | | 24,750 |
EchoStar DBS Corp., 144A, 6.625%, 10/1/2014 | | 35,000 | | 35,438 |
Foot Locker, Inc., 8.5%, 1/15/2022 | | 25,000 | | 27,500 |
Friendly Ice Cream Corp., 8.375%, 6/15/2012 (e) | | 45,000 | | 44,156 |
General Motors Corp.: | | | | |
8.25%, 7/15/2023 | | 40,000 | | 41,667 |
8.375%, 7/15/2033 | | 70,000 | | 72,526 |
Jacobs Entertainment Co., 11.875%, 2/1/2009 | | 70,000 | | 79,100 |
Mediacom LLC, 9.5%, 1/15/2013 (e) | | 55,000 | | 55,206 |
MGM MIRAGE: | | | | |
8.375%, 2/1/2011 (e) | | 60,000 | | 67,650 |
9.75%, 6/1/2007 | | 10,000 | | 11,100 |
NCL Corp., “A”, 144A, 10.625%, 7/15/2014 | | 40,000 | | 40,000 |
PEI Holding, Inc., 11.0%, 3/15/2010 | | 45,000 | | 52,425 |
Petro Stopping Centers, 9.0%, 2/15/2012 | | 60,000 | | 63,450 |
Premier Entertainment Biloxi LLC/Finance, 10.75%, 2/1/2012 | | 30,000 | | 32,775 |
PRIMEDIA, Inc.: | | | | |
7.665%*, 5/15/2010 | | 50,000 | | 53,000 |
8.875%, 5/15/2011 (e) | | 35,000 | | 37,013 |
Rent-Way, Inc., 11.875%, 6/15/2010 | | 20,000 | | 22,525 |
Restaurant Co., 11.25%, 5/15/2008 | | 37,640 | | 38,110 |
Schuler Homes, Inc., 10.5%, 7/15/2011 | | 50,000 | | 56,875 |
Sinclair Broadcast Group, Inc.: | | | | |
8.0%, 3/15/2012 | | 80,000 | | 85,000 |
8.75%, 12/15/2011 | | 35,000 | | 38,106 |
Sonic Automotive, Inc., Series B, 8.625%, 8/15/2013 | | 60,000 | | 63,975 |
Toys “R” Us, Inc.: | | | | |
7.375%, 10/15/2018 | | 75,000 | | 69,375 |
7.875%, 4/15/2013 (e) | | 35,000 | | 34,737 |
TRW Automotive, Inc., 11.0%, 2/15/2013 (e) | | 55,000 | | 66,275 |
United Auto Group, Inc., 9.625%, 3/15/2012 | | 40,000 | | 44,200 |
Venetian Casino Resort LLC, 11.0%, 6/15/2010 | | 45,000 | | 51,356 |
VICORP Restaurants, Inc., 10.5%, 4/15/2011 (e) | | 20,000 | | 20,100 |
Visteon Corp.: | | | | |
7.0%, 3/10/2014 (e) | | 30,000 | | 28,650 |
8.25%, 8/1/2010 (e) | | 35,000 | | 36,663 |
Wheeling Island Gaming, Inc., 10.125%, 12/15/2009 | | 35,000 | | 37,275 |
Williams Scotsman, Inc., 9.875%, 6/1/2007 (e) | | 60,000 | | 60,000 |
Worldspan LP/WS Finance Corp., 9.625%, 6/15/2011 (e) | | 30,000 | | 29,850 |
Wynn Las Vegas LLC, 144A, 6.625%, 12/1/2014 | | 70,000 | | 69,300 |
| | | | |
|
| | | | | 3,627,235 |
| | | | |
|
Consumer Staples 0.1% | | | | |
Agrilink Foods, Inc., 11.875%, 11/1/2008 | | 12,000 | | 12,495 |
Church & Dwight Co., Inc., 144A, 6.0%, 12/15/2012 | | 30,000 | | 30,525 |
Duane Reade, Inc., 144A, 7.01%*, 12/15/2010 | | 10,000 | | 10,150 |
Pierre Foods, Inc., 144A, 9.875%, 7/15/2012 | | 15,000 | | 15,525 |
Pinnacle Foods Holding Corp.: | | | | |
144A, 8.25%, 12/1/2013 | | 10,000 | | 9,525 |
144A, 8.25%, 12/1/2013 (e) | | 35,000 | | 33,338 |
Standard Commercial Corp., 8.0%, 4/15/2012 | | 30,000 | | 30,825 |
Swift & Co., 12.5%, 1/1/2010 (e) | | 35,000 | | 39,550 |
Wornick Co., 10.875%, 7/15/2011 | | 30,000 | | 32,550 |
| | | | |
|
| | | | | 214,483 |
| | | | |
|
Energy 2.1% | | | | |
Avista Corp., 9.75%, 6/1/2008 | | 55,000 | | 63,770 |
CenterPoint Energy Resources Corp., Series B, 7.875%, 4/1/2013 | | 420,000 | | 499,208 |
Chesapeake Energy Corp.: | | | | |
6.875%, 1/15/2016 | | 30,000 | | 31,425 |
9.0%, 8/15/2012 | | 30,000 | | 34,275 |
CITGO Petroleum Corp., 144A, 6.0%, 10/15/2011 | | 25,000 | | 24,875 |
Dynegy Holdings, Inc., 144A, 9.875%, 7/15/2010 | | 45,000 | | 50,288 |
Edison Mission Energy, 7.73%, 6/15/2009 | | 100,000 | | 107,500 |
El Paso Production Holding Corp., 7.75%, 6/1/2013 | | 35,000 | | 36,663 |
15
| | | | |
| | | Principal
Amount
($)(h)
| | Value ($)
|
Enterprise Products Operating LP, 7.5%, 2/1/2011 | | 239,000 | | 270,977 |
Newpark Resources, Inc., Series B, 8.625%, 12/15/2007 | | 45,000 | | 45,675 |
PC Financial Partnership, 5.0%, 11/15/2014 | | 825,000 | | 821,966 |
Pemex Project Funding Master Trust, 144A, 3.18%*, 6/15/2010 (e) | | 550,000 | | 564,300 |
Southern Natural Gas, 8.875%, 3/15/2010 | | 30,000 | | 33,600 |
Stone Energy Corp.: | | | | |
144A, 6.75%, 12/15/2014 | | 15,000 | | 14,962 |
8.25%, 12/15/2011 | | 55,000 | | 59,400 |
Tri-State Generation & Transmission Association, 144A, 6.04%, 1/31/2018 | | 880,000 | | 929,702 |
Williams Cos., Inc.: | | | | |
8.125%, 3/15/2012 (e) | | 55,000 | | 63,525 |
8.75%, 3/15/2032 | | 35,000 | | 40,206 |
| | | | |
|
| | | | | 3,692,317 |
| | | | |
|
Financials 8.4% | | | | |
Ahold Finance USA, Inc., 6.25%, 5/1/2009 | | 35,000 | | 36,400 |
American General Finance Corp., 2.75%, 6/15/2008 | | 1,145,000 | | 1,100,837 |
AmeriCredit Corp., 9.25%, 5/1/2009 | | 75,000 | | 80,437 |
BF Saul Real Estate Investment Trust, 7.5%, 3/1/2014 | | 55,000 | | 56,650 |
Capital One Bank, 4.875%, 5/15/2008 | | 55,000 | | 56,486 |
Downey Financial Corp., 6.5%, 7/1/2014 | | 745,000 | | 775,478 |
Duke Capital LLC: | | | | |
4.302%, 5/18/2006 | | 817,000 | | 826,861 |
6.25%, 2/15/2013 (e) | | 235,000 | | 253,984 |
E*TRADE Financial Corp., 144A, 8.0%, 6/15/2011 | | 60,000 | | 64,500 |
Farmers Insurance Exchange, 144A, 8.625%, 5/1/2024 | | 50,000 | | 58,978 |
Ford Motor Credit Co.: | | | | |
5.8%, 1/12/2009 | | 399,000 | | 407,834 |
6.875%, 2/1/2006 | | 2,789,000 | | 2,873,228 |
General Electric Capital Corp., 2.8%, 1/15/2007 | | 1,150,000 | | 1,134,742 |
General Motors Acceptance Corp., 6.875%, 9/15/2011 | | 792,000 | | 811,636 |
Goldman Sachs Group, Inc., 4.75%, 7/15/2013 | | 515,000 | | 509,611 |
HSBC Bank USA, 5.875%, 11/1/2034 | | 250,000 | | 253,149 |
Merrill Lynch & Co., Inc., Series C, Notes, 5.0%, 1/15/2015 | | 650,000 | | 647,453 |
Morgan Stanley, 4.0%, 1/15/2010 (e) | | 509,000 | | 503,218 |
North Front Pass-Through Trust, 144A, 5.01%*, 12/15/2024 | | 750,000 | | 762,686 |
OMX Timber Finance Investments LLC, “A1”, 144A, 5.42%*, 1/29/2020 | | 795,000 | | 791,200 |
Pennsylvania Mutual Life Insurance Co., 144A, 6.65%, 6/15/2034 | | 505,000 | | 544,904 |
Poster Financial Group, Inc., 8.75%, 12/1/2011 (e) | | 45,000 | | 46,237 |
PXRE Capital Trust I, 8.85%, 2/1/2027 | | 40,000 | | 40,000 |
R.H. Donnelly Finance Corp., 10.875%, 12/15/2012 | | 25,000 | | 29,688 |
RAM Holdings Ltd., 144A, 6.875%, 4/1/2024 | | 1,115,000 | | 1,095,030 |
Thornburg Mortgage, Inc., 8.0%, 5/15/2013 | | 25,000 | | 26,563 |
TIG Capital Holdings Trust, 144A, 8.597%, 1/15/2027 | | 40,000 | | 35,100 |
UGS Corp., 144A, 10.0%, 6/1/2012 | | 35,000 | | 39,812 |
Universal City Development, 11.75%, 4/1/2010 | | 55,000 | | 64,969 |
Universal City Florida Holding Co., 144A, 7.2%*, 5/1/2010 | | 10,000 | | 10,400 |
Wells Fargo & Co., 4.2%, 1/15/2010 | | 937,000 | | 940,808 |
| | | | |
|
| | | | | 14,878,879 |
| | | | |
|
Health Care 0.2% | | | | |
AmerisourceBergen Corp., 7.25%, 11/15/2012 | | 15,000 | | 16,762 |
Cinacalcet Royalty Subordinated LLC, 144A, 8.0%, 3/30/2017 | | 35,000 | | 35,175 |
Curative Health Services, Inc., 10.75%, 5/1/2011 | | 10,000 | | 8,950 |
Hanger Orthopedic Group, Inc., 10.375%, 2/15/2009 (e) | | 30,000 | | 30,975 |
HEALTHSOUTH Corp., 10.75%, 10/1/2008 (e) | | 50,000 | | 52,750 |
InSight Health Services Corp., Series B, 9.875%, 11/1/2011 (e) | | 25,000 | | 25,250 |
Interactive Health LLC, 144A, 7.25%, 4/1/2011 | | 30,000 | | 26,100 |
National Mentor, Inc., 144A, 9.625%, 12/1/2012 | | 10,000 | | 10,625 |
Tenet Healthcare Corp., 6.375%, 12/1/2011 | | 110,000 | | 102,025 |
| | | | |
|
| | | | | 308,612 |
| | | | |
|
Industrials 2.2% | | | | |
Allied Waste North America, Inc., Series B, 5.75%, 2/15/2011 | | 125,000 | | 117,500 |
America West Airlines, Inc., Series 99-1, 7.93%, 1/2/2019 | | 512,891 | | 557,933 |
AMI Semiconductor, Inc., 10.75%, 2/1/2013 | | 25,000 | | 29,375 |
BAE System 2001 Asset Trust, “B”, Series 2001, 144A, 7.156%, 12/15/2011 | | 720,714 | | 782,287 |
Browning-Ferris Industries: | | | | |
7.4%, 9/15/2035 | | 20,000 | | 17,500 |
9.25%, 5/1/2021 | | 10,000 | | 10,650 |
Cenveo Corp., 7.875%, 12/1/2013 (e) | | 40,000 | | 37,200 |
Clean Harbors, Inc., 144A, 11.25%, 7/15/2012 | | 20,000 | | 22,400 |
Collins & Aikman Floor Cover, Series B, 9.75%, 2/15/2010 | | 65,000 | | 69,875 |
Collins & Aikman Products, 10.75%, 12/31/2011 (e) | | 35,000 | | 35,700 |
Cornell Companies, Inc., 10.75%, 7/1/2012 | | 40,000 | | 42,750 |
Corrections Corp. of America, 9.875%, 5/1/2009 | | 50,000 | | 55,500 |
Dana Corp., 7.0%, 3/1/2029 (e) | | 55,000 | | 54,863 |
Eagle-Picher Industries, Inc., 9.75%, 9/1/2013 | | 10,000 | | 10,000 |
16
| | | | |
| | | Principal
Amount
($)(h)
| | Value ($)
|
Erico International Corp., 8.875%, 3/1/2012 | | 35,000 | | 36,750 |
ISP Chemco, Inc., Series B, 10.25%, 7/1/2011 | | 55,000 | | 62,150 |
Kansas City Southern, 7.5%, 6/15/2009 | | 105,000 | | 110,250 |
Laidlaw International, Inc., 10.75%, 6/15/2011 | | 35,000 | | 40,863 |
Millennium America, Inc.: | | | | |
7.625%, 11/15/2026 (e) | | 60,000 | | 59,100 |
9.25%, 6/15/2008 | | 55,000 | | 62,562 |
Northwest Airlines Corp., Series 02-1, 6.264%, 11/20/2021 | | 1,246,632 | | 1,284,442 |
Sea Containers Ltd., 10.5%, 5/15/2012 | | 20,000 | | 21,050 |
Securus Technologies, Inc., 144A, 11.0%, 9/1/2011 | | 35,000 | | 35,000 |
Ship Finance International Ltd., 8.5%, 12/15/2013 | | 40,000 | | 41,200 |
SPX Corp.: | | | | |
6.25%, 6/15/2011 (e) | | 15,000 | | 15,825 |
7.5%, 1/1/2013 | | 50,000 | | 54,250 |
Technical Olympic USA, Inc.: | | | | |
7.5%, 3/15/2011 | | 20,000 | | 20,150 |
10.375%, 7/1/2012 | | 40,000 | | 44,800 |
Texas Genco LLC, 144A, 6.875%, 12/15/2014 | | 40,000 | | 41,350 |
The Brickman Group, Ltd., Series B, 11.75%, 12/15/2009 | | 25,000 | | 29,250 |
United Rentals North America, Inc.: | | | | |
6.5%, 2/15/2012 | | 45,000 | | 43,875 |
7.0%, 2/15/2014 (e) | | 35,000 | | 32,725 |
7.75%, 11/15/2013 (e) | | 30,000 | | 29,400 |
Westlake Chemical Corp., 8.75%, 7/15/2011 | | 19,000 | | 21,470 |
| | | | |
|
| | | | | 3,929,995 |
| | | | |
|
Information Technology 0.1% | | | | |
Activant Solutions, Inc., 10.5%, 6/15/2011 | | 35,000 | | 37,625 |
Itron, Inc., 144A, 7.75%, 5/15/2012 | | 35,000 | | 35,613 |
Lucent Technologies, Inc., 6.45%, 3/15/2029 (e) | | 100,000 | | 90,500 |
| | | | |
|
| | | | | 163,738 |
| | | | |
|
Materials 1.8% | | | | |
ARCO Chemical Co., 9.8%, 2/1/2020 | | 135,000 | | 153,900 |
Caraustar Industries, Inc., 9.875%, 4/1/2011 (e) | | 20,000 | | 21,700 |
Dayton Superior Corp., 10.75%, 9/15/2008 | | 50,000 | | 53,500 |
Georgia-Pacific Corp.: | | | | |
8.0%, 1/15/2024 | | 85,000 | | 98,600 |
9.375%, 2/1/2013 | | 50,000 | | 58,250 |
Hercules, Inc.: | | | | |
6.75%, 10/15/2029 | | 35,000 | | 36,138 |
11.125%, 11/15/2007 | | 25,000 | | 29,750 |
Huntsman Advanced Materials, 144A, 11.0%, 7/15/2010 | | 45,000 | | 53,550 |
Huntsman LLC, 11.625%, 10/15/2010 | | 50,000 | | 59,125 |
IMC Global, Inc., 10.875%, 8/1/2013 | | 20,000 | | 25,000 |
International Steel Group, Inc., 6.5%, 4/15/2014 | | 75,000 | | 80,438 |
Lubrizol Corp.: | | | | |
4.625%, 10/1/2009 | | 1,050,000 | | 1,048,380 |
6.5%, 10/1/2034 (e) | | 404,000 | | 411,456 |
Omnova Solutions, Inc., 11.25%, 6/1/2010 | | 50,000 | | 56,250 |
Owens-Brockway Glass Container, 8.25%, 5/15/2013 | | 25,000 | | 27,500 |
Pliant Corp.: | | | | |
Step-up Coupon, 0% to 12/15/2006, 11.125% to 6/15/2009 | | 15,000 | | 13,856 |
11.125%, 9/1/2009 | | 40,000 | | 43,600 |
Sheffield Steel Corp., 144A, 11.375%, 8/15/2011 | | 25,000 | | 25,750 |
TriMas Corp., 9.875%, 6/15/2012 | | 85,000 | | 90,100 |
United States Steel LLC, 9.75%, 5/15/2010 | | 45,000 | | 51,300 |
Weyerhaeuser Co.: | | | | |
6.875%, 12/15/2033 (e) | | 200,000 | | 223,899 |
7.125%, 7/15/2023 | | 100,000 | | 113,258 |
7.375%, 3/15/2032 | | 280,000 | | 332,037 |
| | | | |
|
| | | | | 3,107,337 |
| | | | |
|
Telecommunication Services 1.1% | | | | |
AT&T Corp.: | | | | |
7.3%, 11/15/2011 | | 45,000 | | 51,806 |
9.75%, 11/15/2031 | | 45,000 | | 53,719 |
Bell Atlantic New Jersey, Inc., Series A, 5.875%, 1/17/2012 | | 530,000 | | 563,107 |
BellSouth Corp., 5.2%, 9/15/2014 | | 505,000 | | 514,707 |
Cincinnati Bell, Inc., 8.375%, 1/15/2014 (e) | | 115,000 | | 116,437 |
Dobson Cellular Systems, Inc., 144A, 6.96%*, 11/1/2011 | | 15,000 | | 15,525 |
GCI, Inc., 7.25%, 2/15/2014 | | 40,000 | | 40,000 |
Insight Midwest LP, 9.75%, 10/1/2009 (e) | | 25,000 | | 26,188 |
MCI, Inc., 8.735%, 5/1/2014 | | 115,000 | | 123,625 |
Nextel Communications, Inc., 5.95%, 3/15/2014 | | 35,000 | | 36,225 |
Nextel Partners, Inc., 8.125%, 7/1/2011 | | 40,000 | | 44,400 |
Northern Telecom Capital, 7.875%, 6/15/2026 | | 35,000 | | 34,650 |
PanAmSat Corp., 144A, 9.0%, 8/15/2014 | | 65,000 | | 72,556 |
Qwest Corp.: | | | | |
7.25%, 9/15/2025 (e) | | 260,000 | | 252,850 |
144A, 7.875%, 9/1/2011 | | 10,000 | | 10,850 |
| | | | |
|
| | | | | 1,956,645 |
| | | | |
|
Utilities 2.3% | | | | |
AES Corp., 144A, 8.75%, 5/15/2013 | | 20,000 | | 22,725 |
Allegheny Energy Supply Co. LLC, 144A, 8.25%, 4/15/2012 (e) | | 35,000 | | 39,113 |
CMS Energy Corp., 8.5%, 4/15/2011 | | 20,000 | | 22,725 |
Consumers Energy Co., Series F, 4.0%, 5/15/2010 | | 980,000 | | 962,564 |
DPL, Inc., 6.875%, 9/1/2011 | | 85,000 | | 92,831 |
Midwest Generation LLC, 8.75%, 5/1/2034 | | 25,000 | | 28,375 |
17
| | | | |
| | | Principal
Amount
($)(h)
| | Value ($)
|
NorthWestern Corp., 144A, 5.875%, 11/1/2014 (e) | | 30,000 | | 30,689 |
NRG Energy, Inc., 144A, 8.0%, 12/15/2013 | | 115,000 | | 125,350 |
Progress Energy, Inc., 6.75%, 3/1/2006 | | 1,400,000 | | 1,452,718 |
PSE&G Energy Holdings LLC: | | | | |
8.5%, 6/15/2011 | | 40,000 | | 45,650 |
10.0%, 10/1/2009 | | 35,000 | | 41,387 |
TNP Enterprises, Inc., Series B, 10.25%, 4/1/2010 | | 55,000 | | 58,713 |
Xcel Energy, Inc., 7.0%, 12/1/2010 | | 1,040,000 | | 1,172,319 |
| | | | |
|
| | | | | 4,095,159 |
| | | | |
|
Total Corporate Bonds
(Cost $35,450,984) | | | | 35,974,400 |
| | | | |
|
Foreign Bonds — US$ Denominated 9.3% | | | | |
| | |
Consumer Discretionary 0.2% | | | | |
Grupo Posadas SA de CV, 144A, Series A, 8.75%, 10/4/2011 | | 10,000 | | 10,675 |
Jafra Cosmetics International, Inc., 10.75%, 5/15/2011 | | 60,000 | | 67,800 |
Kabel Deutschland GmbH, 144A, 10.625%, 7/1/2014 | | 55,000 | | 63,250 |
Shaw Communications, Inc.: | | | | |
7.25%, 4/6/2011 (e) | | 30,000 | | 33,075 |
8.25%, 4/11/2010 | | 70,000 | | 79,625 |
Vicap SA, 11.375%, 5/15/2007 | | 10,000 | | 10,125 |
Vitro Envases Norteamerica SA, 144A, 10.75%, 7/23/2011 | | 25,000 | | 25,937 |
Vitro SA de CV, Series A, 144A, 11.75%, 11/1/2013 (e) | | 25,000 | | 24,188 |
| | | | |
|
| | | | | 314,675 |
| | | | |
|
Consumer Staples 0.1% | | | | |
Burns Philp Capital Property, Ltd., 10.75%, 2/15/2011 | | 35,000 | | 39,375 |
Fage Dairy Industry SA, 9.0%, 2/1/2007 | | 155,000 | | 155,775 |
Grupo Cosan SA, 144A, 9.0%, 11/1/2009 | | 20,000 | | 20,900 |
| | | | |
|
| | | | | 216,050 |
| | | | |
|
Energy 0.2% | | | | |
Gazprom OAO, 144A, 9.625%, 3/1/2013 | | 100,000 | | 118,000 |
Luscar Coal Ltd., 9.75%, 10/15/2011 | | 50,000 | | 56,750 |
Petroleum Geo-Services ASA, 10.0%, 11/5/2010 | | 131,001 | | 149,341 |
Secunda International Ltd., 144A, 9.76%*, 9/1/2012 | | 30,000 | | 29,400 |
| | | | |
|
| | | | | 353,491 |
| | | | |
|
Financials 4.2% | | | | |
Deutsche Telekom International Finance BV: | | | | |
8.5%, 6/15/2010 | | 165,000 | | 196,577 |
8.75%, 6/15/2030 | | 540,000 | | 713,047 |
Eircom Funding, 8.25%, 8/15/2013 | | 50,000 | | 55,250 |
Endurance Specialty Holdings Ltd., 7.0%, 7/15/2034 | | 135,000 | | 139,009 |
HSBC Capital Funding LP, 144A, 4.61%, 12/29/2049 | | 590,000 | | 569,507 |
Korea First Bank, 144A, 5.75%*, 3/10/2013 | | 267,000 | | 277,675 |
Mantis Reef Ltd., 144A, 4.692%, 11/14/2008 | | 1,530,000 | | 1,534,466 |
Mizuho Financial Group (Cayman), 8.375%, 12/29/2049 | | 1,260,000 | | 1,380,834 |
New ASAT (Finance) Ltd., 144A, 9.25%, 2/1/2011 | | 35,000 | | 31,763 |
Westfield Capital Corp., 144A, 4.375%, 11/15/2010 | | 2,470,000 | | 2,442,981 |
| | | | |
|
| | | | | 7,341,109 |
| | | | |
|
Health Care 0.0% | | | | |
Biovail Corp., 7.875%, 4/1/2010 (e) | | 35,000 | | 36,225 |
Elan Financial PLC, 144A, 7.75%, 11/15/2011 | | 15,000 | | 15,975 |
| | | | |
|
| | | | | 52,200 |
| | | | |
|
Industrials 1.0% | | | | |
CP Ships Ltd., 10.375%, 7/15/2012 | | 45,000 | | 51,919 |
Grupo Transportacion Ferroviaria Mexicana SA de CV: | | | | |
10.25%, 6/15/2007 | | 75,000 | | 79,875 |
11.75%, 6/15/2009 | | 50,000 | | 50,938 |
12.5%, 6/15/2012 | | 45,000 | | 52,537 |
LeGrand SA, 8.5%, 2/15/2025 | | 45,000 | | 53,100 |
Stena AB: | | | | |
144A, 7.0%, 12/1/2016 | | 25,000 | | 24,750 |
9.625%, 12/1/2012 | | 25,000 | | 28,250 |
Tyco International Group SA: | | | | |
6.75%, 2/15/2011 | | 516,000 | | 578,327 |
6.875%, 1/15/2029 | | 556,000 | | 636,904 |
7.0%, 6/15/2028 | | 194,000 | | 225,551 |
| | | | |
|
| | | | | 1,782,151 |
| | | | |
|
Information Technology 0.0% | | | | |
Flextronics International Ltd., 144A, 6.25%, 11/15/2014 | | 50,000 | | 49,500 |
Magnachip Semiconductor SA: | | | | |
144A, 6.875%, 12/15/2011 | | 10,000 | | 10,300 |
144A, 8.0%, 12/15/2014 | | 10,000 | | 10,425 |
| | | | |
|
| | | | | 70,225 |
| | | | |
|
Materials 1.5% | | | | |
Alrosa Finance SA, 144A, 8.875%, 11/17/2014 | | 30,000 | | 30,825 |
Cascades, Inc., 7.25%, 2/15/2013 | | 55,000 | | 58,300 |
Citigroup (JSC Severstal), 144A, 9.25%, 4/19/2014 | | 100,000 | | 99,500 |
Crown Euro Holdings SA, 10.875%, 3/1/2013 | | 35,000 | | 41,387 |
ISPAT Inland ULC, 9.75%, 4/1/2014 | | 39,000 | | 48,165 |
Sappi Papier Holding AG, 144A, 7.5%, 6/15/2032 | | 674,000 | | 784,458 |
Sino-Forest Corp., 144A, 9.125%, 8/17/2011 | | 25,000 | | 27,313 |
Sociedad Concesionaria Autopista Central, 144A, 6.223%, 12/15/2026 | | 1,365,000 | | 1,432,376 |
Tembec Industries, Inc., 8.5%, 2/1/2011 (e) | | 125,000 | | 125,625 |
| | | | |
|
| | | | | 2,647,949 |
| | | | |
|
18
| | | | |
| | | Principal
Amount
($)(h)
| | Value ($)
|
Sovereign Bonds 1.2% | | | | |
Aries Vermogensverwaltung GmbH, Series C, 9.6%, 10/25/2014 | | 250,000 | | 306,750 |
Federative Republic of Brazil: | | | | |
8.875%, 10/14/2019 | | 45,000 | | 47,430 |
11.0%, 8/17/2040 | | 130,000 | | 154,245 |
Government of Ukraine, 7.65%, 6/11/2013 | | 100,000 | | 106,800 |
Republic of Bulgaria, 8.25%, 1/15/2015 | | 310,000 | | 389,794 |
Republic of Turkey: | | | | |
7.25%, 3/15/2015 | | 30,000 | | 30,825 |
9.0%, 6/30/2011 | | 15,000 | | 17,138 |
9.5%, 1/15/2014 | | 15,000 | | 17,700 |
11.75%, 6/15/2010 | | 70,000 | | 87,850 |
11.875%, 1/15/2030 | | 40,000 | | 57,600 |
Russian Federation, Step-up Coupon, 5.0% to 3/31/2007, 7.5% to 3/31/2030 | | 70,000 | | 72,408 |
Russian Ministry of Finance, Series VII, 3.0%, 5/14/2011 | | 130,000 | | 109,629 |
United Mexican States: | | | | |
Series A, 6.75%, 9/27/2034 (e) | | 570,000 | | 562,875 |
8.375%, 1/14/2011 (e) | | 90,000 | | 105,705 |
| | | | |
|
| | | | | 2,066,749 |
| | | | |
|
Telecommunication Services 0.9% | | | | |
America Movil SA de CV: | | | | |
Series L, 5.5%, 3/1/2014 | | 420,000 | | 414,920 |
144A, 5.75%, 1/15/2015 | | 200,000 | | 199,544 |
Axtel SA, 11.0%, 12/15/2013 | | 45,000 | | 48,488 |
Embratel, Series B, 11.0%, 12/15/2008 | | 35,000 | | 39,900 |
Inmarsat Finance PLC, 7.625%, 6/30/2012 | | 40,000 | | 41,600 |
Innova S. de R.L., 9.375%, 9/19/2013 (e) | | 30,000 | | 34,125 |
INTELSAT, 6.5%, 11/1/2013 | | 40,000 | | 36,400 |
Millicom International Cellular SA, 144A, 10.0%, 12/1/2013 | | 65,000 | | 68,006 |
Mobifon Holdings BV, 12.5%, 7/31/2010 | | 35,000 | | 41,519 |
Mobile Telesystems Financial, 144A, 8.375%, 10/14/2010 | | 35,000 | | 35,700 |
Nortel Networks Corp., 6.875%, 9/1/2023 | | 40,000 | | 37,600 |
Nortel Networks Ltd., 6.125%, 2/15/2006 | | 125,000 | | 127,187 |
Rogers Wireless Communications, Inc., 6.375%, 3/1/2014 | | 35,000 | | 34,650 |
Telecom Italia Capital, 144A, 4.95%, 9/30/2014 | | 455,000 | | 445,781 |
| | | | |
|
| | | | | 1,605,420 |
| | | | |
|
Total Foreign Bonds — US$ Denominated
(Cost $15,968,646) | | | | 16,450,019 |
| | | | |
|
19
| | | | |
| | | Principal
Amount ($)(h)
| | Value ($)
|
Foreign Bonds — Non US$ Denominated 5.5% | | | | |
| | |
Sovereign Bonds 5.5% | | | | |
Federal Republic of Germany, 144A, 3.25%, 4/17/2009 EUR | | 4,270,000 | | 5,872,954 |
Mexican Bonds: | | | | |
Series M-20, 8.0%, 12/7/2023 MXN | | 6,080,000 | | 425,987 |
Series MI-10, 8.0%, 12/19/2013 MXN | | 34,301,500 | | 2,740,858 |
Republic of Colombia, 11.75%, 3/1/2010 COP | | 190,000,000 | | 82,788 |
Republic of Romania, 8.5%, 5/8/2012 EUR | | 100,000 | | 173,617 |
Republic of Uruguay, 17.75%, 2/4/2006 UYU | | 9,700,000 | | 386,439 |
| | | | |
|
Total Foreign Bonds — Non US$ Denominated
(Cost $8,733,810) | | | | 9,682,643 |
| | | | |
|
Asset Backed 6.3% | | | | |
| | |
Automobile Receivables 1.5% | | | | |
MMCA Automobile Trust: | | | | |
“A4”, Series 2002-3, 3.57%, 8/17/2009 | | 375,000 | | 375,738 |
“A4”, Series 2002-2, 4.3%, 3/15/2010 | | 1,915,027 | | 1,921,978 |
“B”, Series 2002-1, 5.37%, 1/15/2010 | | 236,900 | | 239,346 |
| | | | |
|
| | | | | 2,537,062 |
| | | | |
|
Home Equity Loans 4.8% | | | | |
Countrywide Home Equity Loan Trust: | | | | |
Series 2004-C, 2.62%*, 1/15/2034 | | 642,247 | | 640,881 |
“2A”, Series 2004-E, 2.66%*, 6/15/2029 | | 1,142,564 | | 1,141,768 |
Master Alternative Loan Trust, “5A1”, Series 2005-1, 5.5%, 1/1/2019 (i) | | 1,325,000 | | 1,362,887 |
Merrill Lynch Mortgage Investors, Inc., “A2B”, Series 2004-HE2, 2.8%*, 8/25/2035 | | 520,000 | | 520,365 |
Novastar NIM Trust, Series 2004-N1, 144A, 4.458%, 2/26/2034 | | 352,350 | | 352,881 |
Park Place Securities NIM Trust: | | | | |
“A”, Series 2004-MHQ1, 144A, 2.487%, 12/25/2034 | | 698,547 | | 698,547 |
“A”, Series 2004-WHQ-1, 144A, 2.53%, 9/25/2034 | | 678,198 | | 676,502 |
Renaissance NIM Trust, “NOTE”, Series 2004-C, 144A, 4.458%, 12/25/2034 | | 940,349 | | 940,349 |
Residential Asset Mortgage Products, Inc., “A3”, Series 2003-RZ4, 3.38%, 2/25/2030 | | 805,000 | | 801,880 |
Residential Asset Securities Corp., “AI6”, Series 2000-KS1, 7.905%, 2/25/2031 | | 1,360,109 | | 1,416,948 |
| | | | |
|
| | | | | 8,553,008 |
| | | | |
|
Total Asset Backed
(Cost $11,188,425) | | | | 11,090,070 |
| | | | |
|
20
| | | | |
| | | Principal
Amount
($)(h)
| | Value ($)
|
Convertible Bond 0.0% | | | | |
DIMON, Inc., 6.25%, 3/31/2007 | | 50,000 | | 46,875 |
HIH Capital Ltd., 144A, Series DOM, 7.5%, 9/25/2006 | | 10,000 | | 9,900 |
| | | | |
|
Total Convertible Bond
(Cost $56,996) | | | | 56,775 |
| | | | |
|
US Government Agency Sponsored Pass-Throughs 5.9% | | | | |
Federal Home Loan Mortgage Corp.: | | | | |
5.0%, 7/1/2018 | | 704,202 | | 715,710 |
5.5% with various maturities from 11/15/2016 until 8/1/2024 (i) | | 1,614,125 | | 1,667,523 |
Federal National Mortgage Association: | | | | |
4.5%, 12/1/2018 | | 282,671 | | 282,407 |
5.0%, 3/1/2034 | | 1,119,071 | | 1,112,507 |
5.5%, 7/1/2033 | | 773,023 | | 785,454 |
6.0% with various maturities from 11/1/2017 until 10/1/2034 (c) | | 2,047,648 | | 2,126,223 |
6.31%, 6/1/2008 | | 1,700,000 | | 1,808,089 |
6.5% with various maturities from 3/1/2017 until 9/1/2034 | | 1,739,900 | | 1,833,116 |
8.0%, 9/1/2015 | | 85,491 | | 90,928 |
| | | | |
|
Total US Government Agency Sponsored Pass-Throughs
(Cost $10,334,007) | | | | 10,421,957 |
| | | | |
|
Commercial and Non-Agency Mortgage-Backed Securities 8.4% | | | | |
Banc of America Commercial Mortgage, Inc., “A5”, Series 2004-3, 5.036%*, 6/10/2039 | | 1,450,000 | | 1,518,433 |
Bank of America Mortgage Securities, “2A6”, Series 2004-F, 4.18%*, 7/25/2034 | | 1,180,000 | | 1,174,114 |
Bank of America-First Union Commercial Mortgage, Inc., “A1”, Series 2001-3, 4.89%, 4/11/2037 | | 728,365 | | 744,786 |
Chase Commercial Mortgage Securities Corp., Series 1996-2, 6.9%, 11/19/2028 | | 645,776 | | 667,644 |
Citigroup Mortgage Loan Trust, Inc.: | | | | |
“1CB2”, Series 2004-NCM2, 6.75%, 8/25/2034 | | 1,379,196 | | 1,437,377 |
“IOWA3”, Series 2004-NCM1, 6.75%, 7/25/2034 | | 817,997 | | 857,619 |
GMAC Commercial Mortgage Securities, Inc., “A3”, Series 1997-C1, 6.869%, 7/15/2029 | | 1,361,501 | | 1,440,392 |
Master Alternative Loan Trust: | | | | |
“3A1”, Series 2004-5, 6.5%, 6/25/2034 | | 142,786 | | 148,631 |
“8A1”, Series 2004-3, 7.0%, 4/25/2034 | | 422,415 | | 441,291 |
Master Asset Securitization Trust, “8A1”, Series 2003-6, 5.5%, 7/25/2033 | | 869,711 | | 876,778 |
Residential Asset Securitization Trust, “A1”, Series 2003-A11, 4.25%, 11/25/2033 | | 928,608 | | 930,593 |
Structured Asset Securities Corp., “2A1”, Series 2003-1, 6.0%, 2/25/2018 | | 25,653 | | 26,615 |
Wachovia Bank Commercial Mortgage Trust, “A5”, Series 2004-C11, 5.215%, 1/15/2041 | | 1,450,000 | | 1,492,855 |
Washington Mutual: | | | | |
“A6”, Series 2004-AR7, 3.957%*, 7/25/2034 | | 740,000 | | 731,238 |
“2A1”, Series 2002-S8, 4.5%, 1/25/2018 | | 410,394 | | 411,890 |
Washington Mutual Mortgage Securities Corp., “A7”, Series 2004-AR9, 4.276%, 8/25/2034 | | 737,000 | | 737,581 |
Wells Fargo Mortgage Backed Securities Trust: | | | | |
“1A1”, Series 2003-6, 5.0%, 6/25/2018 | | 1,087,954 | | 1,097,473 |
“1A3”, Series 2002-18, 6.0%, 12/25/2032 | | 161,437 | | 162,523 |
| | | | |
|
Total Commercial and Non-Agency Mortgage-Backed Securities
(Cost $14,957,674) | | | | 14,897,833 |
| | | | |
|
Collateralized Mortgage Obligations 22.2% | | | | |
Fannie Mae Whole Loan, “5A”, Series 2004-W2, 7.5%, 3/25/2044 | | 1,146,668 | | 1,227,422 |
Federal Home Loan Mortgage Corp.: | | | | |
“AU”, Series 2759, 3.5%, 5/15/2019 | | 844,000 | | 841,677 |
“PA”, Series 2786, 3.5%, 10/15/2010 | | 823,000 | | 825,023 |
“QC”, Series 2694, 3.5%, 9/15/2020 | | 1,690,000 | | 1,679,588 |
��LB”, Series 2755, 4.0%, 9/15/2023 | | 1,130,000 | | 1,132,007 |
“LC”, Series 2682, 4.5%, 7/15/2032 | | 1,200,000 | | 1,159,487 |
“PE”, Series 2727, 4.5%, 7/15/2032 | | 830,000 | | 791,465 |
“QH”, Series 2694, 4.5%, 3/15/2032 | | 1,700,000 | | 1,637,602 |
“1A2B”, Series T-48, 4.688%, 7/25/2022 | | 117,532 | | 117,538 |
“EG”, Series 2836, 5.0%, 12/15/2032 | | 1,580,000 | | 1,566,654 |
“JD”, Series 2778, 5.0%, 12/15/2032 | | 710,000 | | 705,564 |
“NE”, Series 2802, 5.0%, 2/15/2033 | | 1,580,000 | | 1,572,301 |
“OL”, Series 2840, 5.0%, 11/15/2022 | | 1,335,000 | | 1,370,850 |
“PD”, Series 2783, 5.0%, 1/15/2033 | | 761,000 | | 754,670 |
“PD”, Series 2844, 5.0%, 12/15/2032 | | 1,580,000 | | 1,563,717 |
“PE”, Series 2721, 5.0%, 1/15/2023 | | 2,425,000 | | 2,398,878 |
“PQ”, Series 2844, 5.0%, 5/15/2023 | | 1,236,000 | | 1,273,352 |
“TE”, Class 2764, 5.0%, 10/15/2032 | | 790,000 | | 782,496 |
“TE”, Series 2780, 5.0%, 1/15/2033 | | 1,150,000 | | 1,143,413 |
21
| | | | | | |
| | | Principal
Amount
($)(h)
| | | Value ($)
| |
“CH”, Series 2390, 5.5%, 12/15/2016 | | 200,000 | | | 207,407 | |
“GD”, Series 2497, 5.5%, 7/15/2014 | | 554,877 | | | 558,146 | |
“MC”, Series 2394, 6.0%, 12/15/2016 | | 1,420,000 | | | 1,487,689 | |
“Z”, Series 2173, 6.5%, 7/15/2029 | | 1,008,680 | | | 1,058,849 | |
“3A”, Series T-41, 7.5%, 7/25/2032 | | 1,500,674 | | | 1,599,815 | |
Federal National Mortgage Association: | | | | | | |
“A2”, Series 2003-63, 2.34%, 7/25/2044 | | 232,512 | | | 231,929 | |
“WB”, Series 2003-106, 4.5%, 10/25/2015 | | 1,290,000 | | | 1,309,210 | |
“A2”, Series 2002-W10, 4.7%, 8/25/2042 | | 6,943 | | | 6,937 | |
“2A3”, Series 2003-W15, 4.71%, 8/25/2043 | | 1,569,155 | | | 1,572,949 | |
“A2”, Series 2002-60, 4.75%, 2/25/2044 | | 44,895 | | | 44,817 | |
“KH”, Series 2003-92, 5.0%, 3/25/2032 | | 790,000 | | | 781,363 | |
“MC”, Series 2002-56, 5.5%, 9/25/2017 | | 675,634 | | | 695,580 | |
“OG”, Series 2001-69, 5.5%, 12/25/2016 | | 750,000 | | | 774,805 | |
“PG”, Series 2002-3, 5.5%, 2/25/2017 | | 500,000 | | | 514,082 | |
“QC”, Series 2002-11, 5.5%, 3/25/2017 | | 290,000 | | | 301,546 | |
“MG”, Series 2002-2, 6.0%, 2/25/2017 | | 1,430,000 | | | 1,483,965 | |
“PM”, Series 2001-60, 6.0%, 3/25/2030 | | 371,816 | | | 376,623 | |
“VD”, Series 2002-56, 6.0%, 4/25/2020 | | 162,737 | | | 165,537 | |
“2A”, Series 2003-W8, 7.0%, 10/25/2042 | | 543,500 | | | 573,374 | |
“A2”, Series 2002-T19, Grantor Trust, 7.0%, 7/25/2042 | | 400,112 | | | 423,992 | |
“A2”, Series 2002-T4, 7.0%, 12/25/2041 | | 1,185,609 | | | 1,256,372 | |
“ZQ”, Series G92-9, 7.0%, 12/25/2021 | | 340,292 | | | 350,405 | |
FHLMC Structured Pass-Through Securities, “1A2”, Series T-59, 7.0%, 10/25/2043 | | 572,716 | | | 606,363 | |
Government National Mortgage Association, “KA”, Series 2002-5, 6.0%, 8/16/2026 | | 410,278 | | | 412,400 | |
| | | | | |
|
|
Total Collateralized Mortgage Obligations
(Cost $39,290,299) | | | | | 39,337,859 | |
| | | | | |
|
|
Municipal Investments 4.2% | | | | | | |
Hoboken, NJ, Core City General Obligation, 6.5%, 4/1/2026 (d) | | 1,900,000 | | | 2,166,532 | |
Illinois, State General Obligation, 4.95%, 6/1/2023 | | 1,025,000 | | | 996,003 | |
Jicarilla, NM, Sales & Special Tax Revenue, Apache Nation Revenue, 5.2%, 12/1/2013 | | 670,000 | | | 686,931 | |
Trenton, NJ, Core City General Obligation, School District General Obligation Revenue, 4.7%, 4/1/2013 (d) | | 745,000 | | | 742,683 | |
Union County, NJ, Improvement Authority, Student Loan Revenue, 5.29%, 4/1/2018 (d) | | 940,000 | | | 958,885 | |
Virgin Islands, Port Authority Revenue, Marine Revenue, Series B, 5.08%, 9/1/2013 (d) | | 1,420,000 | | | 1,450,757 | |
Washington, Industrial Development Revenue, Economic Development Financial Authority, CSC Taco LLC Project, Series A, 3.8%, 10/1/2011 (d) | | 550,000 | | | 531,256 | |
| | | | | |
|
|
Total Municipal Investments
(Cost $7,270,612) | | | | | 7,533,047 | |
| | | | | |
|
|
Government National Mortgage Association 0.9% | | | | | | |
Government National Mortgage Association: | | | | | | |
6.0% with various maturities from 1/15/2034 until 6/20/2034 | | 268,912 | | | 278,900 | |
6.5%, 11/20/2033 | | 496,935 | | | 523,399 | |
7.0%, 9/20/2034 | | 736,905 | | | 780,576 | |
| | | | | |
|
|
Total Government National Mortgage Association
(Cost $1,585,321) | | | | | 1,582,875 | |
| | | | | |
|
|
US Government Backed 14.8% | | | | | | |
US Treasury Bond: | | | | | | |
6.0%, 2/15/2026 (e) | | 3,591,000 | | | 4,113,519 | |
7.25%, 5/15/2016 (e) | | 1,223,000 | | | 1,530,852 | |
7.5%, 11/15/2016 | | 1,130,000 | | | 1,444,061 | |
US Treasury Note: | | | | | | |
1.5%, 3/31/2006 (e) | | 5,154,000 | | | 5,069,845 | |
3.0%, 2/15/2008 | | 700,000 | | | 694,285 | |
3.25%, 1/15/2009 (e) | | 9,553,000 | | | 9,470,156 | |
4.25%, 11/15/2013 (e) | | 1,822,000 | | | 1,833,459 | |
5.0%, 2/15/2011 | | 940,000 | | | 999,962 | |
5.75%, 8/15/2010 | | 970,000 | | | 1,067,948 | |
| | | | | |
|
|
Total US Government Backed
(Cost $26,500,531) | | | | | 26,224,087 | |
| | | | | |
|
|
| | |
| | | Shares
| | | Value ($)
| |
Preferred Stocks 0.0% | | | | | | |
TNP Enterprises, Inc., 14.5%, “D”, (PIK) (Cost $51,163) | | 420 | | | 48,720 | |
| | | | | |
|
|
Other Investments 0.0% | | | | | | |
Hercules Trust II, (Common Stock Unit) (Cost $70,487) | | 105,000 | | | 88,200 | |
| | | | | |
|
|
Securities Lending Collateral 13.6% | | | | | | |
Daily Assets Fund Institutional, 2.25% (f) (g) (Cost $24,171,724) | | 24,171,724 | | | 24,171,724 | |
| | | | | |
|
|
Cash Equivalents 2.0% | | | | | | |
Scudder Cash Management QP Trust, 2.24% (b) (Cost $3,493,227) | | 3,493,227 | | | 3,493,227 | |
| | | | | |
|
|
| | |
| | | % of Net Assets
| | | Value ($)
| |
Total Investment Portfolio
(Cost $199,123,906) (a) | | 113.4 | | | 201,053,436 | |
| | |
Other Assets and Liabilities, Net | | (13.4 | ) | | (23,794,751 | ) |
| | |
|
| |
|
|
Net Assets | | 100.0 | | | 177,258,685 | |
| | |
|
| |
|
|
| * | Floating rate notes are securities whose yields vary with a designated market index or market rate, such as the coupon-equivalent of the US Treasury bill rate. These securities are shown at their current rate as of December 31, 2004. |
| (a) | The cost for federal income tax purposes was $199,152,730. At December 31, 2004, net unrealized appreciation for all securities based on tax cost was $1,900,706. This consisted of aggregate gross unrealized appreciation for all securities in which there was an excess of value over tax cost of $3,130,256 and aggregate gross unrealized depreciation for all securities in which there was an excess of tax cost over value of $1,229,550. |
| (b) | Scudder Cash Management QP Trust is managed by Deutsche Investment Management Americas Inc. The rate shown is the annualized seven-day yield at period end. |
| (c) | Mortgage dollar rolls included. |
| (d) | Bond is insured by one of these companies: |
| | | | |
Insurance Coverage
| | As a % of Total Investment Portfolio
|
FGIC | | Financial Guaranty Insurance Company | | .4 |
FSA | | Financial Security Assurance | | 1.2 |
MBIA | | Municipal Bond Investors Assurance | | 1.3 |
| (e) | All or a portion of these securities were on loan (see Notes to Financial Statements). The value of all securities loaned at December 31, 2004 amounted to $24,128,735, which is 13.6% of total net assets. |
| (f) | Daily Assets Fund Institutional, an affiliated fund, is managed by Deutsche Asset Management, Inc. The rate shown is the annualized seven-day yield at period end. |
| (g) | Represents collateral held in connection with securities lending. |
| (h) | Principal amount stated in US dollars unless otherwise noted. |
| (i) | When-issued or forward delivery pools included. |
144A: Security exempt from registration under 144A of the Securities Act of 1933. These securities may be resold in transactions exempt from registration, normally to qualified institutional buyers.
PIK: Denotes that interest or dividend is paid in kind.
Currency Abbreviation
| | |
| COP | | Colombian Peso |
| EUR | | Euro |
| MXN | | Mexican Peso |
| UYU | | Uruguayan Peso |
Included in the portfolio are investments in mortgage or asset-backed securities which are interests in separate pools of mortgages or assets. Effective maturities of these investments may be shorter than stated maturities due to prepayments. Some separate investments in the Government National Mortgage Association, Federal Home Loan Mortgage Corp. and the Federal National Mortgage Association issues which have similar coupon rates have been aggregated for presentation purposes in the investment portfolio.
Purchases and sales of investment securities (excluding US Treasury obligations, short-term investments and mortgage dollar roll transactions) for the year ended December 31, 2004, aggregated $187,851,853 and $191,907,506, respectively. Purchases and sales of US Treasury obligations aggregated $188,700,750 and $184,790,282, respectively. Purchases and sales of mortgage dollar roll transactions aggregated $37,038,064 and $37,155,672, respectively.
The accompanying notes are an integral part of the financial statements.
22
Financial Statements
Bond Portfolio
Statement of Assets and Liabilities as of December 31, 2004
| | | | |
Assets | | | | |
Investments: | | | | |
| |
Investments in securities, at value — including $24,128,735 of securities loaned (cost $171,458,955) | | $ | 173,388,485 | |
Investment in Daily Assets Fund Institutional (cost $24,171,724)* | | | 24,171,724 | |
Investment in Scudder Cash Management QP Trust (cost $3,493,227) | | | 3,493,227 | |
Total investment in securities, at value (cost $199,123,906) | | | 201,053,436 | |
Foreign currency, at value (cost $404,124) | | | 414,180 | |
Receivable for investments sold | | | 1,309,131 | |
Interest receivable | | | 2,000,586 | |
Receivable for Portfolio shares sold | | | 164,253 | |
Unrealized appreciation on forward foreign currency exchange contracts | | | 257,731 | |
Net receivable on closed forward currency contracts | | | 4,669 | |
Other assets | | | 6,209 | |
| | |
|
|
|
Total assets | | | 205,210,195 | |
| | |
|
|
|
Liabilities | | | | |
Due to custodian bank | | | 271,297 | |
Payable for investments purchased | | | 13,982 | |
Payable upon return of securities loaned | | | 24,171,724 | |
Payable for when-issued and forward delivery securities | | | 1,817,192 | |
Payable for investments purchased — mortgage dollar rolls | | | 451,587 | |
Deferred mortgage dollar roll income | | | 407 | |
Payable for Portfolio shares redeemed | | | 17,855 | |
Unrealized depreciation on forward foreign currency exchange contracts | | | 1,057,730 | |
Accrued management fee | | | 70,083 | |
Other accrued expenses and payables | | | 79,653 | |
| | |
|
|
|
Total liabilities | | | 27,951,510 | |
| | |
|
|
|
Net assets, at value | | $ | 177,258,685 | |
| | |
|
|
|
Net Assets | | | | |
Net assets consist of: | | | | |
| |
Undistributed net investment income | | | 7,130,843 | |
Net unrealized appreciation (depreciation) on: | | | | |
| |
Investments | | | 1,929,530 | |
Foreign currency related transactions | | | (754,176 | ) |
Accumulated net realized gain (loss) | | | 1,523,294 | |
Paid-in capital | | | 167,429,194 | |
| | |
|
|
|
Net assets, at value | | $ | 177,258,685 | |
| | |
|
|
|
Net Asset Value, offering and redemption price per share ($177,258,685 ÷ 24,873,210 outstanding shares of beneficial interest, no par value, unlimited number of shares authorized) | | $ | 7.13 | |
| | |
|
|
|
| * | Represents collateral on securities loaned. |
23
Statement of Operations for the year ended December 31, 2004
| | | | |
Investment Income | | | | |
Income: | | | | |
| |
Interest | | $ | 7,991,148 | |
Interest — Scudder Cash Management QP Trust | | | 105,452 | |
Securities lending income, including income from Daily Assets Fund Institutional | | | 19,908 | |
Dividends | | | 39,163 | |
Mortgage dollar roll income | | | 148,693 | |
| | |
|
|
|
Total Income | | | 8,304,364 | |
| | |
|
|
|
Expenses: | | | | |
| |
Management fee | | | 825,230 | |
Custodian fees | | | 35,673 | |
Accounting fees | | | 119,718 | |
Auditing | | | 37,363 | |
Legal | | | 7,128 | |
Trustees’ fees and expenses | | | 8,263 | |
Reports to shareholders | | | 2,772 | |
Other | | | 6,781 | |
| | |
|
|
|
Total expenses, before expense reductions | | | 1,042,928 | |
| | |
|
|
|
Expense reductions | | | (3,201 | ) |
Total expenses, after expense reductions | | | 1,039,727 | |
| | |
|
|
|
Net investment income | | | 7,264,637 | |
| | |
|
|
|
Realized and Unrealized Gain (Loss) on Investment Transactions | | | | |
Net realized gain (loss) from: | | | | |
| |
Investments | | | 1,939,057 | |
Foreign currency related transactions | | | (30,996 | ) |
| | |
|
|
|
| | | | 1,908,061 | |
| | |
|
|
|
Net unrealized appreciation (depreciation) on: | | | | |
| |
Investments | | | 653,610 | |
Foreign currency related transactions | | | (754,176 | ) |
| | |
|
|
|
| | | | (100,566 | ) |
| | |
|
|
|
Net gain (loss) on investment transactions | | | 1,807,495 | |
| | |
|
|
|
Net increase (decrease) in net assets resulting from operations | | $ | 9,072,132 | |
| | |
|
|
|
The accompanying notes are an integral part of the financial statements.
24
Statement of Changes in Net Assets
| | | | | | | | |
Increase (Decrease) in Net Assets
| | Years Ended December 31,
| |
| | 2004
| | | 2003
| |
Operations: | | | | | | | | |
| | |
Net investment income | | $ | 7,264,637 | | | $ | 6,917,302 | |
Net realized gain (loss) on investment transactions | | | 1,908,061 | | | | 5,463,498 | |
Net unrealized appreciation (depreciation) on investment transactions during the period | | | (100,566 | ) | | | (3,270,064 | ) |
Net increase (decrease) in net assets resulting from operations | | | 9,072,132 | | | | 9,110,736 | |
Distributions to shareholders from: | | | | | | | | |
| | |
Net investment income | | | (6,665,081 | ) | | | (7,871,344 | ) |
Portfolio share transactions: | | | | | | | | |
| | |
Proceeds from shares sold | | | 30,276,293 | | | | 59,930,372 | |
Reinvestment of distributions | | | 6,665,081 | | | | 7,871,344 | |
Cost of shares redeemed | | | (38,484,371 | ) | | | (57,702,076 | ) |
Net increase (decrease) in net assets from Portfolio share transactions | | | (1,542,997 | ) | | | 10,099,640 | |
| | |
|
|
| |
|
|
|
Increase (decrease) in net assets | | | 864,054 | | | | 11,339,032 | |
| | |
|
|
| |
|
|
|
Net assets at beginning of period | | | 176,394,631 | | | | 165,055,599 | |
| | |
|
|
| |
|
|
|
Net assets at end of period (including undistributed net investment income of $7,130,843 and $6,528,461, respectively) | | $ | 177,258,685 | | | $ | 176,394,631 | |
| | |
|
|
| |
|
|
|
Other Information | | | | | | | | |
Shares outstanding at beginning of period | | | 25,068,858 | | | | 23,649,490 | |
Shares sold | | | 4,299,192 | | | | 8,565,994 | |
Shares issued to shareholders in reinvestment of distributions | | | 981,603 | | | | 1,150,780 | |
Shares redeemed | | | (5,476,443 | ) | | | (8,297,406 | ) |
Net increase (decrease) in Portfolio shares | | | (195,648 | ) | | | 1,419,368 | |
| | |
|
|
| |
|
|
|
Shares outstanding at end of period | | | 24,873,210 | | | | 25,068,858 | |
| | |
|
|
| |
|
|
|
The accompanying notes are an integral part of the financial statements.
25
Financial Highlights
Bond Portfolio
| | | | | | | | | | | | | | | | | | | | |
Years Ended December 31,
| | 2004
| | | 2003
| | | 2002
| | | 2001a
| | | 2000
| |
Selected Per Share Data | | | | | | | | | | | | | | | | | | | | |
Net asset value, beginning of period | | $ | 7.04 | | | $ | 6.98 | | | $ | 6.89 | | | $ | 6.78 | | | $ | 6.49 | |
| | |
|
|
| |
|
|
| |
|
|
| |
|
|
| |
|
|
|
Income (loss) from investment operations: | | | | | | | | | | | | | | | | | | | | |
Net investment incomeb | | | .29 | | | | .26 | | | | .34 | | | | .38 | | | | .42 | |
Net realized and unrealized gain (loss) on investment transactions | | | .08 | | | | .09 | | | | .17 | | | | .00 | c | | | .23 | |
| | |
|
|
| |
|
|
| |
|
|
| |
|
|
| |
|
|
|
Total from investment operations | | | .37 | | | | .35 | | | | .51 | | | | .38 | | | | .65 | |
| | |
|
|
| |
|
|
| |
|
|
| |
|
|
| |
|
|
|
Less distributions from: | | | | | | | | | | | | | | | | | | | | |
| | | | | |
Net investment income | | | (.28 | ) | | | (.29 | ) | | | (.42 | ) | | | (.27 | ) | | | (.36 | ) |
| | |
|
|
| |
|
|
| |
|
|
| |
|
|
| |
|
|
|
Net asset value, end of period | | $ | 7.13 | | | $ | 7.04 | | | $ | 6.98 | | | $ | 6.89 | | | $ | 6.78 | |
| | |
|
|
| |
|
|
| |
|
|
| |
|
|
| |
|
|
|
Total Return (%) | | | 5.38 | | | | 5.06 | | | | 7.66 | | | | 5.75 | | | | 10.56 | |
| | |
|
|
| |
|
|
| |
|
|
| |
|
|
| |
|
|
|
Ratios to Average Net Assets and Supplemental Data | | | | | | | | | | | | | | | | | | | | |
Net assets, end of period ($ millions) | | | 177 | | | | 176 | | | | 165 | | | | 182 | | | | 102 | |
Ratio of expenses before expense reductions (%) | | | .60 | | | | .58 | | | | .55 | | | | .58 | d | | | .58 | |
Ratio of expenses after expense reductions (%) | | | .60 | | | | .58 | | | | .55 | | | | .57 | d | | | .58 | |
Ratio of net investment income (%) | | | 4.18 | | | | 3.78 | | | | 5.03 | | | | 5.47 | | | | 6.55 | |
Portfolio turnover rate (%) | | | 223 | e | | | 242 | e | | | 262 | e | | | 169 | e | | | 288 | |
| a | As required, effective January 1, 2001, the Portfolio adopted the provisions of the AICPA Audit and Accounting Guide for Investment Companies and began amortizing premium on debt securities. In addition, paydowns on mortgage-backed securities which were included in realized gain/loss on investment transactions prior to January 1, 2001 are included as interest income. The effect of this change for the year ended December 31, 2001 was to decrease net investment income by $.02, increase net realized and unrealized gains and losses per share by $.02, and decrease the ratio of net investment income to average net assets from 5.74% to 5.47%. Per share data and ratios for periods prior to January 1, 2001 have not been restated to reflect this change in presentation. |
| b | Based on average shares outstanding during the period. |
| c | The amount of net realized and unrealized gain shown for a share outstanding for the year ended December 31, 2001 does not correspond with the aggregate net loss on investments for the period due to the timing of sales and repurchases of Portfolio shares in relation to fluctuating market values of the investments of the Portfolio. |
| d | The ratios of operating expenses excluding costs incurred in connection with a fund complex reorganization before and after expense reductions were .57% and .57%, respectively. |
| e | The portfolio turnover rate including mortgage dollar roll transactions was 245%, 286%, 276% and 193% for the years ended December 31, 2004, December 31, 2003, December 31, 2002 and December 31, 2001, respectively. |
26
Performance Summary December 31, 2004
Balanced Portfolio
All performance shown is historical, assumes reinvestment of all dividends and capital gains, and does not guarantee future results. Investment return and principal value fluctuate with changing market conditions so that, when redeemed, shares may be worth more or less then their original cost. Current performance may be lower or higher than the performance data quoted. Please visit scudder.com for the product’s most recent month-end performance. Performance doesn’t reflect charges and fees (“contract charges”) associated with the separate account that invests in the portfolio or any variable life insurance policy or variable annuity contract for which the portfolio is an investment option. These charges and fees will reduce returns.
The Portfolio is subject to stock market risk, meaning stocks in the Portfolio may decline in value for extended periods of time due to the activities and financial prospects of individual companies, or due to general market and economic conditions. Additionally, the Portfolio invests in individual bonds whose yields and market values fluctuate so that your investment may be worth more or less than its original cost. Please read this Portfolio’s prospectus for specific details regarding its investments and risk profile.
Growth of an Assumed $10,000 Investment
| | |
¨ Balanced Portfolio — Class A* ¨ S&P 500 Index ¨ LBAB Index ¨ Russell 1000 Growth Index | | The Standard & Poor’s (S&P) 500 Index is a capitalization-weighted index of 500 stocks. The index is designed to measure performance of the broad domestic economy through changes in the aggregate market value of 500 stocks representing all major industries. The Lehman Brothers Aggregate Bond (LBAB) Index is an unmanaged, market value-weighted measure of Treasury issues, agency issues, corporate bond issues and mortgage securities. The Russell 1000 Growth Index is an unmanaged capitalization-weighted index containing those securities in the Russell 1000 Index with higher price-to-book ratios and higher forecasted growth values. Index returns assume the reinvestment of dividends and, unlike Portfolio returns, do not reflect any fees or expenses. It is not possible to invest directly into an index. |
| | | |
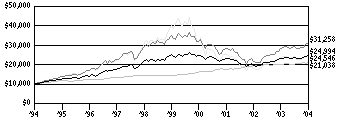
Yearly periods ended December 31
Comparative Results (as of December 31, 2004)
| | | | | | | | | | | | | | | | |
Balanced Portfolio
| | 1-Year
| | | 3-Year
| | | 5-Year
| | | 10-Year*
| |
Class A | | | | | | | | | | | | | | | | |
Growth of $10,000 | | $ | 10,648 | | | $ | 10,665 | | | $ | 9,816 | | | $ | 24,546 | |
Average annual total return | | | 6.48 | % | | | 2.17 | % | | | -.37 | % | | | 9.40 | % |
| | | | |
S&P 500 Index | | | | | | | | | | | | | | | | |
Growth of $10,000 | | $ | 11,088 | | | $ | 11,115 | | | $ | 8,902 | | | $ | 31,258 | |
Average annual total return | | | 10.88 | % | | | 3.59 | % | | | -2.30 | % | | | 12.07 | % |
| | | | |
LBAB Index | | | | | | | | | | | | | | | | |
Growth of $10,000 | | $ | 10,434 | | | $ | 11,976 | | | $ | 14,497 | | | $ | 21,038 | |
Average annual total return | | | 4.34 | % | | | 6.19 | % | | | 7.71 | % | | | 7.72 | % |
| | | | |
Russell 1000 Growth Index | | | | | | | | | | | | | | | | |
Growth of $10,000 | | $ | 10,630 | | | $ | 9,946 | | | $ | 6,140 | | | $ | 24,994 | |
Average annual total return | | | 6.30 | % | | | -.18 | % | | | -9.29 | % | | | 9.59 | % |
The growth of $10,000 is cumulative.
| * | Total returns for the 10-year period would have been lower if the Portfolio’s expenses were not maintained. |
27
Information About Your Portfolio’s Expenses
Balanced Portfolio
As an investor of the Portfolio, you incur two types of costs: ongoing expenses and transaction costs. Ongoing expenses include management fees and other Portfolio expenses. Examples of transaction costs include sales charges (loads), redemption fees and account maintenance fees, which are not shown in this section. The following tables are intended to help you understand your ongoing expenses (in dollars) of investing in the Portfolio and to help you compare these expenses with the ongoing expenses of investing in other mutual funds. The tables are based on an investment of $1,000 made at the beginning of the six-month period ended December 31, 2004.
The tables illustrate your Portfolio’s expenses in two ways:
Actual Portfolio Return. This helps you estimate the actual dollar amount of ongoing expenses (but not transaction costs) paid on a $1,000 investment in the Portfolio using the Portfolio’s actual return during the period. To estimate the expenses you paid over the period, simply divide your account value by $1,000 (for example, an $8,600 account value divided by $1,000 = 8.6), then multiply the result by the number in the “Expenses Paid per $1,000” line under the share class you hold.
Hypothetical 5% Portfolio Return. This helps you to compare your Portfolio’s ongoing expenses (but not transaction costs) with those of other mutual funds using the Portfolio’s actual expense ratio and a hypothetical rate of return of 5% per year before expenses. Examples using a 5% hypothetical portfolio return may be found in the shareholder reports of other mutual funds. The hypothetical account values and expenses may not be used to estimate the actual ending account balance or expenses you paid for the period.
Please note that the expenses shown in these tables are meant to highlight your ongoing expenses only and do not reflect any transaction costs. The “Expenses Paid per $1,000” line of the tables is useful in comparing ongoing expenses only and will not help you determine the relative total expense of owning different funds. If these transaction costs had been included, your costs would have been higher.
Expenses and Value of a $1,000 Investment for the six months ended December 31, 2004
| | | |
| | | Class A
|
Actual Portfolio Return | | | |
Beginning Account Value 7/1/04 | | $ | 1,000.00 |
Ending Account Value 12/31/04 | | $ | 1,041.90 |
Expenses Paid per $1,000* | | $ | 3.24 |
| |
| | | Class A
|
Hypothetical 5% Portfolio Return | | | |
Beginning Account Value 7/1/04 | | $ | 1,000.00 |
Ending Account Value 12/31/04 | | $ | 1,022.03 |
Expenses Paid per $1,000* | | $ | 3.21 |
| * | Expenses are equal to the Portfolio’s annualized expense ratio for each share class, multiplied by the average account value over the period, multiplied by the number of days in the most recent six-month period, then divided by 365. |
| | | |
| | | Class A
| |
Annualized Expense Ratios | | | |
Scudder Variable Series I — Balanced Portfolio | | .63 | % |
For more information, please refer to the Portfolio’s prospectus.
28
Management Summary December 31, 2004
Balanced Portfolio
Stocks and bonds both generated positive returns in 2004. In the equity market, strong corporate earnings helped small caps outperform large caps, while value outpaced growth. Bonds produced a higher return than would typically be expected given that the Federal Reserve (the Fed) raised interest rates from 1.00% to 2.25% during the year. Longer-term bonds outperformed shorter-term paper, while corporate issues bested Treasuries. Against this backdrop, the portfolio returned 6.48% (Class A shares, unadjusted for contract charges). Its benchmarks, the S&P 500 Index and Lehman Brothers Aggregate Bond (LBAB) Index, returned 10.88% and 4.34%, respectively.
An overweight in energy, along with good selection within the group, was beneficial. Here, we continue to favor equipment and service companies. In addition, performance was helped significantly by our selections within health care, where we have emphasized biotechnology and medical equipment companies while maintaining an underweight in the weak pharmaceuticals industry. In fixed income, positions in corporates, international bonds and asset-backed securities added value amid an environment in which investors were thirsty for yield.
In the equity portion of the portfolio, weak stock selection and an overweight in information technology made the largest negative contribution to performance during the year. Our current positioning within technology emphasizes consistent earners over cyclical companies, reflecting our view that industry profit growth is likely to slow. Selections within financials, where the portfolio is underweight in insurance and overweight in market-sensitive companies, also detracted. Looking ahead, we will continue to focus on higher-quality growth stocks and fundamentally sound, reasonably valued fixed-income securities.
Julie M. Van Cleave Thomas F. Sassi J. Christopher Gagnier
Andrew P. Cestone Arnim S. Holzer Brett Diment
Portfolio Managers
All performance shown is historical, assumes reinvestment of all dividends and capital gains, and does not guarantee future results. Investment return and principal value fluctuate with changing market conditions so that, when redeemed, shares may be worth more or less then their original cost. Current performance may be lower or higher than the performance data quoted. Please visit scudder.com for the product’s most recent month-end performance. Performance doesn’t reflect charges and fees (“contract charges”) associated with the separate account that invests in the portfolio or any variable life insurance policy or variable annuity contract for which the portfolio is an investment option. These charges and fees will reduce returns.
Risk Considerations
The portfolio is subject to stock market risk, meaning stocks in the portfolio may decline in value for extended periods of time due to the activities and financial prospects of individual companies, or due to general market and economic conditions. Additionally, the portfolio invests in individual bonds whose yields and market values fluctuate so that your investment may be worth more or less than its original cost. Please read this portfolio’s prospectus for specific details regarding its investments and risk profile.
The Standard & Poor’s 500 (S&P 500) Index is a capitalization-weighted index of 500 stocks. The index is designed to measure performance of the broad domestic economy through changes in the aggregate market value of 500 stocks representing all major industries.
The Lehman Brothers Aggregate Bond (LBAB) Index is an unmanaged, market-value-weighted measure of Treasury issues, agency issues, corporate bond issues and mortgage securities.
Index returns assume the reinvestment of dividends and, unlike portfolio returns, do not reflect any fees or expenses. It is not possible to invest directly into an index.
Portfolio management market commentary is as of December 31, 2004, and may not come to pass. This information is subject to change at any time based on market and other conditions.
29
Portfolio Summary
Balanced Portfolio
Asset Allocation (Excludes Securities Lending Collateral)
| | | | | | |
| | | 12/31/04
| | | 12/31/03
| |
Common Stocks | | 60 | % | | 62 | % |
Fixed Income Holdings | | 37 | % | | 35 | % |
Cash Equivalents | | 3 | % | | 3 | % |
| | |
|
| |
|
|
| | | 100 | % | | 100 | % |
| | |
|
| |
|
|
Fixed Income Holdings (As a Percentage of Long Term Fixed Income Holdings)
| | | | | | |
| | | 12/31/04
| | | 12/31/03
| |
Diversification | | | | | | |
Corporate Bonds | | 30 | % | | 24 | % |
Collateralized Mortgage Obligations | | 17 | % | | 24 | % |
Foreign Bonds — US$ Denominated | | 14 | % | | 7 | % |
US Government Backed | | 11 | % | | 10 | % |
Asset Backed | | 7 | % | | 11 | % |
Commercial and Non-Agency Mortgage-Backed Securities | | 6 | % | | — | |
Municipal Investments | | 5 | % | | 5 | % |
US Government Agency Sponsored Pass-Throughs | | 5 | % | | 18 | % |
Government National Mortgage Association | | 3 | % | | 1 | % |
Foreign Bonds — Non US$ Denominated | | 2 | % | | — | |
| | |
|
| |
|
|
| | | 100 | % | | 100 | % |
| | |
|
| |
|
|
| | |
| Quality | | | | | | |
| | |
| | | 12/31/04
| | | 12/31/03
| |
US Government Backed and US Government Sponsored Agencies | | 36 | % | | 42 | % |
AAA* | | 36 | % | | 29 | % |
AA | | 4 | % | | 4 | % |
A | | 9 | % | | 12 | % |
BBB | | 15 | % | | 13 | % |
| | |
|
| |
|
|
| | | 100 | % | | 100 | % |
| | |
|
| |
|
|
Weighted Average Quality | | AA | | | AAA | + |
| | |
Equity Holdings (As a Percentage of Equity Holdings) | | | | | | |
| | |
| | | 12/31/04
| | | 12/31/03
| |
Sector Diversification | | | | | | |
Financials | | 19 | % | | 11 | % |
Information Technology | | 18 | % | | 26 | % |
Health Care | | 16 | % | | 22 | % |
Consumer Discretionary | | 12 | % | | 14 | % |
Industrials | | 11 | % | | 7 | % |
Consumer Staples | | 9 | % | | 11 | % |
Energy | | 9 | % | | 7 | % |
Materials | | 4 | % | | 1 | % |
Telecommunication Services | | 1 | % | | 1 | % |
Utilities | | 1 | % | | — | |
| | |
|
| |
|
|
| | | 100 | % | | 100 | % |
| | |
|
| |
|
|
| * | Category includes cash equivalents. |
Asset allocation, quality and holdings are subject to change.
The quality ratings represent the lower of Moody’s Investors Services, Inc. (“Moody’s”) or Standard & Poor’s Corporation (“S&P”) credit ratings. The ratings of Moody’s and S&P represent their opinions as to the quality of the securities they rate. Ratings are relative and subjective and are not absolute standards of quality. The Portfolio’s credit quality does not remove market risk.
For more complete details about the Portfolios’s investment portfolio, see page 32. A quarterly Fact Sheet is available upon request. Information concerning portfolio holdings of the Portfolio as of month-end will be posted to scudder.com on the 15th of the following month. Please call 1-800-778-1482.
Following the Portfolio’s fiscal first and third quarter-end, a complete portfolio holdings listing is filed with the SEC on Form N-Q. The form will be available on the SEC’s Web site at www.sec.gov, and it also may be reviewed and copied at the SEC’s Public Reference Room in Washington, D.C. Information on the operation of the SEC’s Public Reference Room may be obtained by calling (800) SEC-0330.
30
Investment Portfolio as of December 31, 2004
Balanced Portfolio
| | | | |
| | | Shares
| | Value ($)
|
Common Stocks 59.8% | | | | |
| | |
Consumer Discretionary 7.2% | | | | |
| | |
Auto Components 0.1% | | | | |
Goodyear Tire & Rubber Co.* | | 5,500 | | 80,630 |
Tenneco Automotive, Inc.,* | | 2,800 | | 48,272 |
| | | | |
|
| | | | | 128,902 |
| | | | |
|
Automobiles 0.5% | | | | |
Harley-Davidson, Inc. | | 8,700 | | 528,525 |
Monaco Coach Corp. | | 3,300 | | 67,881 |
| | | | |
|
| | | | | 596,406 |
| | | | |
|
Hotels Restaurants & Leisure 1.1% | | | | |
Alliance Gaming Corp.* | | 5,600 | | 77,336 |
Ameristar Casinos, Inc. | | 1,500 | | 64,665 |
California Pizza Kitchen, Inc.* | | 3,100 | | 71,300 |
CEC Entertainment, Inc.* | | 2,400 | | 95,928 |
International Game Technology | | 10,500 | | 360,990 |
Jack in the Box, Inc.* | | 200 | | 7,374 |
McDonald’s Corp. | | 12,000 | | 384,720 |
YUM! Brands, Inc. | | 8,000 | | 377,440 |
| | | | |
|
| | | | | 1,439,753 |
| | | | |
|
Household Durables 0.1% | | | | |
American Woodmark Corp. | | 500 | | 21,840 |
Fortune Brands, Inc. | | 1,500 | | 115,770 |
| | | | |
|
| | | | | 137,610 |
| | | | |
|
Internet & Catalog Retail 0.3% | | | | |
eBay, Inc.* | | 3,300 | | 383,724 |
| | | | |
|
Leisure Equipment & Products 0.0% | | | | |
Arctic Cat, Inc. | | 2,200 | | 58,344 |
RC2 Corp.* | | 100 | | 3,260 |
| | | | |
|
| | | | | 61,604 |
| | | | |
|
Media 1.3% | | | | |
Comcast Corp., “A”* | | 9,100 | | 298,844 |
McGraw-Hill Companies, Inc. | | 4,900 | | 448,546 |
Mediacom Communications Corp., “A”* | | 7,700 | | 48,125 |
Omnicom Group, Inc. | | 5,700 | | 480,624 |
Reader’s Digest Association, Inc. | | 3,200 | | 44,512 |
Salem Communications Corp., “A”* | | 1,200 | | 29,940 |
Viacom, Inc., “B” | | 8,270 | | 300,945 |
| | | | |
|
| | | | | 1,651,536 |
| | | | |
|
Multiline Retail 1.5% | | | | |
Family Dollar Stores, Inc. | | 19,300 | | 602,739 |
Kirkland’s, Inc.* | | 2,400 | | 29,496 |
Kohl’s Corp.* | | 3,100 | | 152,427 |
May Department Stores Co. | | 16,400 | | 482,160 |
Target Corp. | | 13,600 | | 706,248 |
| | | | |
|
| | | | | 1,973,070 |
| | | | |
|
Specialty Retail 2.3% | | | | |
Aeropostale, Inc.* | | 1,900 | | 55,917 |
Bed Bath & Beyond, Inc.* | | 2,700 | | 107,541 |
Cato Corp., “A” | | 3,000 | | 86,460 |
Charlotte Russe Holding, Inc.* | | 4,400 | | 44,440 |
Charming Shoppes, Inc.* | | 7,400 | | 69,338 |
Home Depot, Inc. | | 2,300 | | 98,302 |
Limited Brands | | 19,800 | | 455,796 |
Lowe’s Companies, Inc. | | 17,600 | | 1,013,584 |
Sherwin-Williams Co. | | 11,800 | | 526,634 |
Stage Stores, Inc.* | | 1,500 | | 62,280 |
Staples, Inc. | | 7,100 | | 239,341 |
Stein Mart, Inc.* | | 3,700 | | 63,122 |
Too, Inc.* | | 3,000 | | 73,380 |
Trans World Entertainment Corp.* | | 4,200 | | 52,374 |
| | | | |
|
| | | | | 2,948,509 |
| | | | |
|
Textiles, Apparel & Luxury Goods 0.1% | | | | |
Guess?, Inc.* | | 4,000 | | 50,200 |
Skechers USA, Inc., “A”* | | 4,700 | | 60,912 |
| | | | |
|
| | | | | 111,112 |
| | | | |
|
Consumer Staples 5.0% | | | | |
| | |
Beverages 0.6% | | | | |
Boston Beer Co., Inc., “A”* | | 2,400 | | 51,048 |
PepsiCo, Inc. | | 14,360 | | 749,592 |
| | | | |
|
| | | | | 800,640 |
| | | | |
|
Food & Staples Retailing 1.1% | | | | |
Casey’s General Stores, Inc. | | 3,100 | | 56,265 |
Nash-Finch Co. | | 1,300 | | 49,088 |
Pantry, Inc.* | | 2,600 | | 78,234 |
Wal-Mart Stores, Inc. | | 17,600 | | 929,632 |
Walgreen Co. | | 9,800 | | 376,026 |
| | | | |
|
| | | | | 1,489,245 |
| | | | |
|
Food Products 1.9% | | | | |
ConAgra Foods, Inc. | | 19,900 | | 586,055 |
Dean Foods Co.* | | 2,500 | | 82,375 |
General Mills, Inc. | | 14,800 | | 735,708 |
Hershey Foods Corp. | | 4,300 | | 238,822 |
Kellogg Co. | | 5,800 | | 259,028 |
Lance, Inc. | | 800 | | 15,224 |
Sara Lee Corp. | | 24,200 | | 584,188 |
| | | | |
|
| | | | | 2,501,400 |
| | | | |
|
Household Products 1.3% | | | | |
Colgate-Palmolive Co. | | 5,100 | | 260,916 |
Kimberly-Clark Corp. | | 10,800 | | 710,748 |
Procter & Gamble Co. | | 13,100 | | 721,548 |
| | | | |
|
| | | | | 1,693,212 |
| | | | |
|
Personal Products 0.1% | | | | |
Elizabeth Arden, Inc.* | | 2,500 | | 59,350 |
| | | | |
|
Energy 5.1% | | | | |
| | |
Energy Equipment & Services 1.1% | | | | |
Baker Hughes, Inc. | | 9,000 | | 384,030 |
Cal Dive International, Inc.* | | 2,100 | | 85,575 |
Nabors Industries Ltd.* | | 7,300 | | 374,417 |
Schlumberger Ltd. | | 6,600 | | 441,870 |
Transocean, Inc.* | | 4,300 | | 182,277 |
| | | | |
|
| | | | | 1,468,169 |
| | | | |
|
Oil & Gas 4.0% | | | | |
BP PLC, (ADR) | | 6,900 | | 402,960 |
Burlington Resources, Inc. | | 9,200 | | 400,200 |
31
| | | | |
| | | Shares
| | Value ($)
|
Callon Petroleum Co.* | | 3,300 | | 47,718 |
ChevronTexaco Corp. | | 9,200 | | 483,092 |
Cimarex Energy Co.* | | 2,000 | | 75,800 |
Comstock Resources, Inc.* | | 3,700 | | 81,585 |
ConocoPhillips | | 9,000 | | 781,470 |
Devon Energy Corp. | | 11,000 | | 428,120 |
EOG Resources, Inc. | | 5,600 | | 399,616 |
ExxonMobil Corp. | | 19,800 | | 1,014,948 |
Houston Exploration Co.* | | 1,700 | | 95,727 |
Overseas Shipholding Group, Inc. | | 1,600 | | 88,320 |
Remington Oil & Gas Corp.* | | 3,200 | | 87,200 |
Royal Dutch Petroleum Co., (NY Shares) | | 9,000 | | 516,420 |
Southwestern Energy Co.* | | 1,300 | | 65,897 |
Tesoro Petroleum Corp.* | | 2,300 | | 73,278 |
Vintage Petroleum, Inc. | | 3,500 | | 79,415 |
Whiting Petroleum Corp.* | | 2,900 | | 87,725 |
| | | | |
|
| | | | | 5,209,491 |
| | | | |
|
Financials 11.6% | | | | |
| | |
Banks 4.9% | | | | |
AmSouth Bancorp. | | 12,800 | | 331,520 |
Bank of America Corp. | | 34,800 | | 1,635,252 |
Banner Corp. | | 2,900 | | 90,451 |
BB&T Corp. | | 9,000 | | 378,450 |
CVB Financial Corp. | | 3,900 | | 103,584 |
Fidelity Bancshares, Inc. | | 600 | | 25,656 |
First BanCorp. | | 1,800 | | 114,318 |
First Community Bancorp. | | 200 | | 8,540 |
FirstFed Financial Corp.* | | 2,000 | | 103,740 |
Frontier Financial Corp. | | 300 | | 11,583 |
Hanmi Financial Corp. | | 2,300 | | 82,662 |
Harbor Florida Bancshares, Inc. | | 2,300 | | 79,603 |
Integra Bank Corp. | | 400 | | 9,244 |
National City Corp. | | 10,800 | | 405,540 |
PNC Financial Services Group | | 14,300 | | 821,392 |
Provident Bankshares Corp. | | 600 | | 21,822 |
Republic Bancorp., Inc. | | 6,700 | | 102,376 |
Silicon Valley Bancshares* | | 2,300 | | 103,086 |
Sterling Bancshares, Inc. | | 4,500 | | 64,215 |
Sterling Financial Corp.* | | 2,500 | | 98,150 |
SunTrust Banks, Inc. | | 5,400 | | 398,952 |
TierOne Corp. | | 1,600 | | 39,760 |
Trustmark Corp. | | 1,200 | | 37,284 |
US Bancorp. | | 17,800 | | 557,496 |
Wachovia Corp. | | 12,900 | | 678,540 |
WesBanco, Inc. | | 1,400 | | 44,758 |
Westamerica Bancorp. | | 400 | | 23,324 |
| | | | |
|
| | | | | 6,371,298 |
| | | | |
|
Capital Markets 1.3% | | | | |
Bear Stearns Companies, Inc. | | 4,300 | | 439,933 |
Goldman Sachs Group, Inc. | | 1,600 | | 166,464 |
Investment Technology Group, Inc.* | | 3,500 | | 70,000 |
Lehman Brothers Holdings, Inc. | | 2,100 | | 183,708 |
Merrill Lynch & Co., Inc. | | 9,300 | | 555,861 |
Morgan Stanley | | 5,600 | | 310,912 |
| | | | |
|
| | | | | 1,726,878 |
| | | | |
|
Consumer Finance 0.6% | | | | |
American Express Co. | | 12,800 | | 721,536 |
| | | | |
|
| | |
Diversified Financial Services 2.8% | | | | |
Accredited Home Lenders Holding Co.* | | 1,600 | | 79,488 |
Citigroup, Inc. | | 36,733 | | 1,769,796 |
Fannie Mae | | 6,500 | | 462,865 |
Freddie Mac | | 6,100 | | 449,570 |
JPMorgan Chase & Co. | | 23,800 | | 928,438 |
| | | | |
|
| | | | | 3,690,157 |
| | | | |
|
Insurance 1.3% | | | | |
AFLAC, Inc. | | 7,900 | | 314,736 |
Allstate Corp. | | 9,800 | | 506,856 |
American International Group, Inc. | | 11,310 | | 742,728 |
Commerce Group, Inc. | | 1,000 | | 61,040 |
LandAmerica Financial Group, Inc. | | 400 | | 21,572 |
Navigators Group, Inc.* | | 900 | | 27,099 |
Zenith National Insurance Corp. | | 1,300 | | 64,792 |
| | | | |
|
| | | | | 1,738,823 |
| | | | |
|
Real Estate 0.7% | | | | |
American Financial Realty Trust (REIT) | | 3,000 | | 48,540 |
Amli Residential Properties Trust (REIT) | | 1,100 | | 35,200 |
CarrrAmerica Realty Corp. (REIT) | | 1,400 | | 46,200 |
Colonial Properties Trust (REIT) | | 100 | | 3,927 |
Commercial Net Lease Realty (REIT) | | 1,900 | | 39,140 |
Corporate Office Properties Trust, Inc. (REIT) | | 1,300 | | 38,155 |
Cousins Properties, Inc. (REIT) | | 1,100 | | 33,297 |
EastGroup Properties, Inc. (REIT) | | 400 | | 15,328 |
Essex Property Trust, Inc. (REIT) | | 600 | | 50,280 |
FelCor Lodging Trust, Inc. (REIT)* | | 2,700 | | 39,555 |
Gables Residential Trust (REIT) | | 1,000 | | 35,790 |
Glenborough Realty Trust, Inc. (REIT) | | 400 | | 8,512 |
Glimcher Realty Trust (REIT) | | 600 | | 16,626 |
Healthcare Realty Trust, Inc. (REIT) | | 1,200 | | 48,840 |
Heritage Property Investment Trust (REIT) | | 1,100 | | 35,299 |
Highwoods Properties, Inc. (REIT) | | 1,600 | | 44,320 |
Kilroy Realty Corp. (REIT) | | 600 | | 25,650 |
Lexington Corporate Properties Trust (REIT) | | 1,700 | | 38,386 |
Nationwide Health Properties, Inc. (REIT) | | 1,900 | | 45,125 |
Newcastle Investment Corp. (REIT) | | 1,200 | | 38,136 |
Novastar Financial, Inc. (REIT) | | 600 | | 29,700 |
Parkway Properties, Inc. (REIT) | | 500 | | 25,375 |
Senior Housing Properties Trust (REIT) | | 2,000 | | 37,880 |
Sun Communities, Inc. (REIT) | | 800 | | 32,200 |
Trammell Crow Co.* | | 1,900 | | 34,409 |
Washington Real Estate Investment Trust (REIT) | | 1,300 | | 44,031 |
| | | | |
|
| | | | | 889,901 |
| | | | |
|
32
| | | | |
| | | Shares
| | Value ($)
|
Health Care 9.8% | | | | |
| | |
Biotechnology 1.4% | | | | |
Amgen, Inc.* | | 2,800 | | 179,620 |
Biogen Idec, Inc.* | | 4,900 | | 326,389 |
deCODE genetics, Inc.* | | 800 | | 6,248 |
Enzon Pharmaceuticals, Inc.* | | 4,000 | | 54,880 |
Genentech, Inc.* | | 14,000 | | 762,160 |
Gilead Sciences, Inc.* | | 12,400 | | 433,876 |
Regeneron Pharmaceuticals, Inc.* | | 4,300 | | 39,603 |
Third Wave Technologies* | | 4,900 | | 42,140 |
| | | | |
|
| | | | | 1,844,916 |
| | | | |
|
Health Care Equipment & Supplies 2.4% | | | | |
Align Technology, Inc.* | | 3,900 | | 41,925 |
Baxter International, Inc. | | 31,000 | | 1,070,740 |
Biosite, Inc.* | | 1,000 | | 61,540 |
Boston Scientific Corp.* | | 8,800 | | 312,840 |
C.R. Bard, Inc. | | 3,500 | | 223,930 |
Haemonetics Corp.* | | 2,300 | | 83,283 |
Hospira, Inc.* | | 1,320 | | 44,220 |
Medtronic, Inc. | | 8,900 | | 442,063 |
Palomar Medical Technologies, Inc.* | | 800 | | 20,856 |
PolyMedica Corp. | | 1,700 | | 63,393 |
VISX, Inc.* | | 715 | | 18,497 |
Waters Corp.* | | 3,600 | | 168,444 |
Zimmer Holdings, Inc.* | | 7,200 | | 576,864 |
| | | | |
|
| | | | | 3,128,595 |
| | | | |
|
Health Care Providers & Services 1.2% | | | | |
Amedisys, Inc., “L”* | | 2,100 | | 68,019 |
Centene Corp.* | | 2,800 | | 79,380 |
Cerner Corp.* | | 1,300 | | 69,121 |
Chemed Corp. | | 1,200 | | 80,532 |
IDX Systems Corp.* | | 2,000 | | 68,920 |
Lifeline Systems, Inc.* | | 800 | | 20,608 |
MedCath Corp.* | | 3,000 | | 73,920 |
Merge Technologies, Inc.* | | 2,400 | | 53,400 |
Option Care, Inc. | | 3,300 | | 56,727 |
PDI, Inc.* | | 1,500 | | 33,420 |
RehabCare Group, Inc.* | | 1,000 | | 27,990 |
Res-Care, Inc.* | | 4,100 | | 62,402 |
SFBC International, Inc.* | | 1,600 | | 63,200 |
UnitedHealth Group, Inc. | | 9,400 | | 827,482 |
| | | | |
|
| | | | | 1,585,121 |
| | | | |
|
Pharmaceuticals 4.7% | | | | |
Abbott Laboratories | | 25,800 | | 1,203,570 |
Alpharma, Inc., “A” | | 3,400 | | 57,630 |
Bristol-Myers Squibb Co. | | 32,300 | | 827,526 |
Connetics Corp.* | | 2,600 | | 63,154 |
Eli Lilly & Co. | | 4,100 | | 232,675 |
First Horizon Pharmaceutical Corp.* | | 1,600 | | 36,624 |
Johnson & Johnson | | 25,616 | | 1,624,567 |
Kos Pharmaceuticals, Inc.* | | 1,100 | | 41,404 |
Noven Pharmaceuticals, Inc.* | | 2,500 | | 42,650 |
Perrigo Co. | | 4,100 | | 70,807 |
Pfizer, Inc. | | 45,150 | | 1,214,083 |
Pharmion Corp.* | | 600 | | 25,326 |
POZEN, Inc.* | | 4,900 | | 35,623 |
Rigel Pharmaceuticals, Inc.* | | 900 | | 21,978 |
United Therapeutics Corp.* | | 1,400 | | 63,210 |
Valeant Pharmaceuticals International | | 2,700 | | 71,145 |
Wyeth | | 13,100 | | 557,929 |
| | | | |
|
| | | | | 6,189,901 |
| | | | |
|
33
| | | | |
| | | Shares
| | Value ($)
|
Industrials 6.7% | | | | |
| | |
Aerospace & Defense 1.2% | | | | |
HEICO Corp. | | 3,400 | | 76,806 |
Honeywell International, Inc. | | 23,500 | | 832,135 |
United Technologies Corp. | | 6,800 | | 702,780 |
| | | | |
|
| | | | | 1,611,721 |
| | | | |
|
Air Freight & Logistics 0.3% | | | | |
FedEx Corp. | | 4,500 | | 443,205 |
| | | | |
|
Airlines 0.1% | | | | |
America West Holdings Corp., “B”* | | 7,800 | | 51,324 |
Frontier Airlines, Inc.* | | 3,800 | | 43,358 |
| | | | |
|
| | �� | | | 94,682 |
| | | | |
|
Commercial Services & Supplies 1.2% | | | | |
Avery Dennison Corp. | | 7,700 | | 461,769 |
Brady Corp. “A” | | 1,500 | | 93,855 |
Coinstar, Inc.* | | 2,400 | | 64,392 |
Duratek, Inc.* | | 3,000 | | 74,730 |
Euronet Worldwide, Inc.* | | 2,200 | | 57,244 |
Heidrick & Struggles International, Inc.* | | 800 | | 27,416 |
Navigant Consulting, Inc.* | | 2,700 | | 71,820 |
NCO Group, Inc.* | | 2,700 | | 69,795 |
NuCo2, Inc.* | | 3,000 | | 66,570 |
Pitney Bowes, Inc. | | 9,700 | | 448,916 |
Stewart Enterprises, Inc. “A”* | | 8,300 | | 58,017 |
TeleTech Holdings, Inc.* | | 5,100 | | 49,419 |
Ventiv Health, Inc.* | | 2,000 | | 40,640 |
| | | | |
|
| | | | | 1,584,583 |
| | | | |
|
Construction & Engineering 0.1% | | | | |
Dycom Industries, Inc.* | | 2,500 | | 76,300 |
Perini Corp.* | | 4,000 | | 66,760 |
| | | | |
|
| | | | | 143,060 |
| | | | |
|
Electrical Equipment 0.5% | | | | |
Artesyn Technologies, Inc.* | | 4,600 | | 51,980 |
Emerson Electric Co. | | 7,600 | | 532,760 |
| | | | |
|
| | | | | 584,740 |
| | | | |
|
Industrial Conglomerates 2.5% | | | | |
3M Co. | | 3,500 | | 287,245 |
General Electric Co. | | 65,600 | | 2,394,400 |
Textron, Inc. | | 8,000 | | 590,400 |
| | | | |
|
| | | | | 3,272,045 |
| | | | |
|
Machinery 0.5% | | | | |
Actuant Corp. “A”* | | 700 | | 36,505 |
Astec Industries, Inc.* | | 3,500 | | 60,235 |
Caterpillar, Inc. | | 2,000 | | 195,020 |
Kennametal, Inc. | | 2,100 | | 104,517 |
Sauer-Danfoss, Inc. | | 2,500 | | 54,525 |
Terex Corp.* | | 2,000 | | 95,300 |
The Manitowoc Co., Inc. | | 2,100 | | 79,065 |
Wabash National Corp.* | | 2,300 | | 61,939 |
| | | | |
|
| | | | | 687,106 |
| | | | |
|
Marine 0.1% | | | | |
Kirby Corp.* | | 2,300 | | 102,074 |
| | | | |
|
34
| | | | |
| | | Shares
| | Value ($)
|
Road & Rail 0.1% | | | | |
Knight Transportation, Inc. | | 3,300 | | 81,840 |
Old Dominion Freight Line, Inc.* | | 1,800 | | 62,640 |
| | | | |
|
| | | | | 144,480 |
| | | | |
|
Trading Companies & Distributors 0.1% | | | | |
United Rentals, Inc.* | | 3,200 | | 60,480 |
WESCO International, Inc.* | | 2,100 | | 62,244 |
| | | | |
|
| | | | | 122,724 |
| | | | |
|
Information Technology 11.0% | | | | |
| | |
Communications Equipment 1.3% | | | | |
Aspect Communications Corp.* | | 3,200 | | 35,648 |
Belden CDT, Inc. | | 1,800 | | 41,760 |
Cisco Systems, Inc.* | | 28,800 | | 555,840 |
CommScope, Inc.* | | 2,200 | | 41,580 |
Ditech Communications Corp.* | | 900 | | 13,455 |
Nokia Oyj, (ADR) | | 36,200 | | 567,254 |
QUALCOMM, Inc. | | 11,800 | | 500,320 |
| | | | |
|
| | | | | 1,755,857 |
| | | | |
|
Computers & Peripherals 2.3% | | | | |
Dell, Inc.* | | 7,000 | | 294,980 |
EMC Corp.* | | 41,200 | | 612,644 |
Hewlett-Packard Co. | | 27,700 | | 580,869 |
Intergraph Corp.* | | 2,200 | | 59,246 |
International Business Machines Corp. | | 13,500 | | 1,330,830 |
PalmOne, Inc.* | | 1,300 | | 41,015 |
Tyler Technologies, Inc.* | | 2,900 | | 24,244 |
| | | | |
|
| | | | | 2,943,828 |
| | | | |
|
Electronic Equipment & Instruments 0.3% | | | | |
Agilysys, Inc. | | 3,100 | | 53,134 |
BEI Technologies, Inc. | | 1,800 | | 55,584 |
LeCroy Corp.* | | 2,900 | | 67,686 |
Rofin-Sinar Technologies, Inc.* | | 1,700 | | 72,165 |
X-Rite, Inc. | | 4,600 | | 73,646 |
| | | | |
|
| | | | | 322,215 |
| | | | |
|
Internet Software & Services 0.2% | | | | |
Digital River, Inc.* | | 1,100 | | 45,771 |
DoubleClick, Inc.* | | 4,800 | | 37,344 |
EarthLink, Inc.* | | 3,500 | | 40,320 |
eSPEED, Inc. “A”* | | 2,900 | | 35,873 |
F5 Networks, Inc.* | | 1,000 | | 48,720 |
InfoSpace, Inc.* | | 800 | | 38,040 |
Openwave Systems, Inc.* | | 2,700 | | 41,742 |
| | | | |
|
| | | | | 287,810 |
| | | | |
|
IT Consulting & Services 1.2% | | | | |
Accenture Ltd., “A”* | | 11,600 | | 313,200 |
Automatic Data Processing, Inc. | | 14,200 | | 629,770 |
CSG Systems International, Inc.* | | 3,200 | | 59,840 |
Fiserv, Inc.* | | 10,800 | | 434,052 |
Paychex, Inc. | | 4,400 | | 149,952 |
Sapient Corp.* | | 3,700 | | 29,267 |
| | | | |
|
| | | | | 1,616,081 |
| | | | |
|
Office Electronics 0.0% | | | | |
CompX International, Inc. | | 300 | | 4,959 |
| | | | |
|
35
| | | | |
| | | Shares
| | Value ($)
|
Semiconductors & Semiconductor Equipment 2.7% | | | | |
ADE Corp.* | | 2,000 | | 37,440 |
Applied Materials, Inc.* | | 28,600 | | 489,060 |
Diodes, Inc.* | | 2,200 | | 49,786 |
Integrated Device Technology, Inc.* | | 4,500 | | 52,020 |
Intel Corp. | | 64,200 | | 1,501,638 |
Kulicke & Soffa Industries, Inc.* | | 4,200 | | 36,204 |
Linear Technology Corp. | | 9,600 | | 372,096 |
Micrel, Inc.* | | 4,100 | | 45,182 |
Microsemi Corp.* | | 3,200 | | 55,552 |
OmniVision Technologies, Inc.* | | 2,400 | | 44,040 |
Photronics, Inc.* | | 2,600 | | 42,900 |
Silicon Image, Inc.* | | 3,000 | | 49,380 |
Siliconix, Inc.* | | 1,100 | | 40,139 |
Standard Microsystems Corp.* | | 2,300 | | 41,009 |
Texas Instruments, Inc. | | 28,100 | | 691,822 |
| | | | |
|
| | | | | 3,548,268 |
| | | | |
|
Software 3.0% | | | | |
Adobe Systems, Inc. | | 1,700 | | 106,658 |
Ansoft Corp.* | | 2,700 | | 54,540 |
Aspen Technology, Inc.* | | 1,200 | | 7,452 |
Borland Software Corp.* | | 1,300 | | 15,184 |
Electronic Arts, Inc.* | | 8,100 | | 499,608 |
Embarcadero Technologies, Inc.* | | 4,900 | | 46,109 |
Epicor Software Corp.* | | 3,600 | | 50,724 |
EPIQ Systems, Inc.* | | 3,600 | | 52,704 |
Internet Security Systems, Inc.* | | 1,600 | | 37,200 |
Interwoven, Inc.* | | 2,100 | | 22,848 |
Intuit, Inc.* | | 4,800 | | 211,248 |
Kronos, Inc.* | | 1,500 | | 76,695 |
Macrovision Corp.* | | 2,400 | | 61,728 |
Microsoft Corp. | | 73,400 | | 1,960,514 |
Oracle Corp.* | | 20,300 | | 278,516 |
SeaChange International, Inc.* | | 2,400 | | 41,856 |
Sonic Solutions* | | 1,300 | | 29,172 |
SS&C Technologies, Inc. | | 2,200 | | 45,430 |
Symantec Corp.* | | 11,400 | | 293,664 |
| | | | |
|
| | | | | 3,891,850 |
| | | | |
|
Materials 2.5% | | | | |
| | |
Chemicals 1.2% | | | | |
Air Products & Chemicals, Inc. | | 9,600 | | 556,512 |
Compass Minerals International, Inc. | | 3,300 | | 79,959 |
Dow Chemical Co. | | 5,800 | | 287,158 |
Ecolab, Inc. | | 8,100 | | 284,553 |
FMC Corp.* | | 2,000 | | 96,600 |
Georgia Gulf Corp. | | 1,800 | | 89,640 |
Octel Corp. | | 3,200 | | 66,592 |
Terra Industries, Inc.* | | 6,700 | | 59,496 |
W.R. Grace & Co.* | | 3,600 | | 48,996 |
| | | | |
|
| | | | | 1,569,506 |
| | | | |
|
Containers & Packaging 0.5% | | | | |
Crown Holdings, Inc.* | | 2,800 | | 38,472 |
Silgan Holdings, Inc. | | 1,300 | | 79,248 |
Sonoco Products Co. | | 15,900 | | 471,435 |
| | | | |
|
| | | | | 589,155 |
| | | | |
|
Metals & Mining 0.7% | | | | |
Alcoa, Inc. | | 19,000 | | 596,980 |
Century Aluminum Co.* | | 2,400 | | 63,024 |
Hecla Mining Co.* | | 6,800 | | 39,644 |
Oregon Steel Mills, Inc.* | | 3,200 | | 64,928 |
Quanex Corp. | | 1,400 | | 95,998 |
Steel Dynamics, Inc. | | 1,600 | | 60,608 |
| | | | |
|
| | | | | 921,182 |
| | | | |
|
Paper & Forest Products 0.1% | | | | |
Potlatch Corp. | | 2,200 | | 111,276 |
| | | | |
|
Telecommunication Services 0.5% | | | | |
| | |
Diversified Telecommunication Services 0.4% | | | | |
CT Communications, Inc. | | 2,400 | | 29,520 |
General Communication, Inc. “A”* | | 5,000 | | 55,200 |
PTEK Holdings, Inc.* | | 4,700 | | 50,337 |
SBC Communications, Inc. | | 12,200 | | 314,394 |
Verizon Communications, Inc. | | 2,900 | | 117,479 |
| | | | |
|
| | | | | 566,930 |
| | | | |
|
Wireless Telecommunication Services 0.1% | | | | |
Alamosa Holdings, Inc.* | | 2,900 | | 36,163 |
Centennial Communications Corp.* | | 5,200 | | 41,236 |
| | | | |
|
| | | | | 77,399 |
| | | | |
|
Utilities 0.4% | | | | |
Electric Utilities 0.3% | | | | |
PNM Resources, Inc. | | 4,000 | | 101,160 |
Progress Energy, Inc. | | 5,800 | | 262,392 |
| | | | |
|
| | | | | 363,552 |
| | | | |
|
Multi-Utilities 0.1% | | | | |
Energen Corp. | | 2,100 | | 123,795 |
| | | | |
|
Total Common Stocks
(Cost $64,369,289) | | | | 78,024,942 |
| | | | |
|
Preferred Stocks 0.2% | | | | |
Farm Credit Bank of Texas, Series 1, 7.561% | | 165,000 | | 169,744 |
Paxson Communications Corp., 14.25%, (PIK) | | 5 | | 36,750 |
| | | | |
|
Total Preferred Stocks
(Cost $202,813) | | | | 206,494 |
| | | | |
|
36
| | | | |
| | | Principal
Amount
($) (h)
| | Value ($)
|
Corporate Bonds 11.1% | | | | |
| | |
Consumer Discretionary 1.9% | | | | |
AMC Entertainment, Inc., 8.0%, 3/1/2014 | | 30,000 | | 29,850 |
American Lawyer Media, Inc., Series B, 9.75%, 12/15/2007 | | 35,000 | | 35,394 |
Atlantic Broadband Finance LLC, 144A, 9.375%, 1/15/2014 | | 35,000 | | 33,863 |
Auburn Hills Trust, 12.375%, 5/1/2020 | | 48,000 | | 75,286 |
Bally Total Fitness Holdings Corp., 10.5%, 7/15/2011 | | 30,000 | | 30,225 |
Cablevision Systems New York Group, 144A, 6.669%**, 4/1/2009 | | 20,000 | | 21,200 |
Carrols Corp., 144A, 9.0%, 1/15/2013 | | 10,000 | | 10,350 |
Charter Communications Holdings LLC, Step-up Coupon, 0% to 5/15/2006, 11.75% to 5/15/2011 | | 75,000 | | 55,125 |
9.625%, 11/15/2009 | | 65,000 | | 57,037 |
10.25%, 9/15/2010 | | 100,000 | | 106,000 |
Comcast Cable Communications Holdings, Inc., 8.375%, 3/15/2013 | | 100,000 | | 123,310 |
Comcast MO of Delaware, Inc., 9.0%, 9/1/2008 | | 150,000 | | 175,219 |
Cooper Standard Automotive, Inc., 144A, 8.375%, 12/15/2014 | | 15,000 | | 14,963 |
Dex Media East LLC/Financial, 12.125%, 11/15/2012 | | 115,000 | | 140,156 |
DIMON, Inc., Series B, 9.625%, 10/15/2011 | | 60,000 | | 65,700 |
Dura Operating Corp.: | | | | |
Series B, 8.625%, 4/15/2012 | | 10,000 | | 10,400 |
Series D, 9.0%, 5/1/2009 | | 15,000 | | 14,850 |
EchoStar DBS Corp., 144A, 6.625%, 10/1/2014 | | 25,000 | | 25,313 |
Foot Locker, Inc., 8.5%, 1/15/2022 | | 15,000 | | 16,500 |
Friendly Ice Cream Corp., 8.375%, 6/15/2012 | | 45,000 | | 44,156 |
General Motors Corp.: | | | | |
8.25%, 7/15/2023 | | 30,000 | | 31,250 |
8.375%, 7/15/2033 | | 15,000 | | 15,541 |
Icon Health & Fitness, Inc., 11.25%, 4/1/2012 | | 30,000 | | 25,200 |
Interep National Radio Sales, Inc., Series B, 10.0%, 7/1/2008 | | 25,000 | | 18,844 |
J Crew Intermediate LLC, Step-up Coupon, 0% to 11/15/2005, 16.0% to 5/15/2008 | | 6,461 | | 6,137 |
Jacobs Entertainment Co., 11.875%, 2/1/2009 | | 60,000 | | 67,800 |
Levi Strauss & Co., 7.0%, 11/1/2006 | | 25,000 | | 26,250 |
Mediacom LLC, 9.5%, 1/15/2013 | | 60,000 | | 60,225 |
MGM MIRAGE: | | | | |
8.375%, 2/1/2011 | | 55,000 | | 62,012 |
9.75%, 6/1/2007 | | 10,000 | | 11,100 |
Mothers Work, Inc., 11.25%, 8/1/2010 | | 15,000 | | 14,550 |
NCL Corp., 144A, 10.625%, 7/15/2014 | | 40,000 | | 40,000 |
Paxson Communications Corp., 10.75%, 7/15/2008 | | 25,000 | | 26,250 |
PEI Holding, Inc., 11.0%, 3/15/2010 | | 35,000 | | 40,775 |
Petro Stopping Centers, 9.0%, 2/15/2012 | | 50,000 | | 52,875 |
Pinnacle Entertainment, Inc., 8.75%, 10/1/2013 | | 10,000 | | 10,825 |
PRIMEDIA, Inc.: | | | | |
7.665%**, 5/15/2010 | | 45,000 | | 47,700 |
8.875%, 5/15/2011 | | 30,000 | | 31,725 |
Restaurant Co., 11.25%, 5/15/2008 | | 37,640 | | 38,110 |
Schuler Homes, Inc., 10.5%, 7/15/2011 | | 35,000 | | 39,813 |
Simmons Bedding Co., 144A, Step-up Coupon, 0% to 12/15/2009, 10.0% to 12/15/2014 | | 35,000 | | 21,350 |
Sinclair Broadcast Group, Inc., 8.75%, 12/15/2011 | | 115,000 | | 125,206 |
Sonic Automotive, Inc., Series B, 8.625%, 8/15/2013 | | 45,000 | | 47,981 |
Toys “R” Us, Inc., 7.375%, 10/15/2018 | | 85,000 | | 78,625 |
37
| | | | |
| | | Principal
Amount ($) (h)
| | Value ($)
|
True Temper Sports, Inc., 8.375%, 9/15/2011 | | 20,000 | | 18,600 |
Trump Holdings & Funding, 11.625%, 3/15/2010* | | 25,000 | | 27,063 |
TRW Automotive, Inc., 11.0%, 2/15/2013 | | 40,000 | | 48,200 |
United Auto Group, Inc., 9.625%, 3/15/2012 | | 30,000 | | 33,150 |
Venetian Casino Resort LLC, 11.0%, 6/15/2010 | | 30,000 | | 34,238 |
VICORP Restaurants, Inc., 10.5%, 4/15/2011 | | 20,000 | | 20,100 |
Visteon Corp., 7.0%, 3/10/2014 | | 60,000 | | 57,300 |
Wheeling Island Gaming, Inc., 10.125%, 12/15/2009 | | 25,000 | | 26,625 |
Williams Scotsman, Inc., 9.875%, 6/1/2007 | | 55,000 | | 55,000 |
Worldspan LP/WS Finance Corp., 9.625%, 6/15/2011 | | 25,000 | | 24,875 |
Wynn Las Vegas LLC, 144A, 6.625%, 12/1/2014 | | 65,000 | | 64,350 |
XM Satellite Radio, Inc., Step-up Coupon, 0% to 12/31/2005, 14.0% to 12/31/2009 | | 35,000 | | 35,700 |
Young Broadcasting, Inc., 8.75%, 1/15/2014 | | 40,000 | | 40,300 |
| | | | |
|
| | | | | 2,510,542 |
| | | | |
|
Consumer Staples 0.2% | | | | |
Church & Dwight Co., Inc., 144A, 6.0%, 12/15/2012 | | 15,000 | | 15,263 |
Duane Reade, Inc.: | | | | |
144A, 7.01%**, 12/15/2010 | | 15,000 | | 15,225 |
144A, 9.75%, 8/1/2011 | | 35,000 | | 31,850 |
North Atlantic Holding, Inc., Step-up Coupon, 0% to 3/1/2008, 12.25% to 3/1/2014 | | 15,000 | | 6,150 |
Pinnacle Foods Holding Corp., 144A, 8.25%, 12/1/2013 | | 45,000 | | 42,862 |
Revlon Consumer Products Corp., 9.0%, 11/1/2006 | | 30,000 | | 29,700 |
Standard Commercial Corp., 8.0%, 4/15/2012 | | 15,000 | | 15,413 |
Swift & Co., 12.5%, 1/1/2010 | | 30,000 | | 33,900 |
| | | | |
|
| | | | | 190,363 |
| | | | |
|
Energy 0.8% | | | | |
CenterPoint Energy Resources Corp., Series B, 7.875%, 4/1/2013 | | 120,000 | | 142,631 |
Chesapeake Energy Corp.: | | | | |
6.875%, 1/15/2016 | | 15,000 | | 15,713 |
9.0%, 8/15/2012 | | 35,000 | | 39,987 |
CITGO Petroleum Corp., 144A, 6.0%, 10/15/2011 | | 10,000 | | 9,950 |
Dynegy Holdings, Inc.: | | | | |
6.875%, 4/1/2011 | | 10,000 | | 9,625 |
7.125%, 5/15/2018 | | 35,000 | | 31,194 |
7.625%, 10/15/2026 | | 10,000 | | 8,687 |
144A, 9.875%, 7/15/2010 | | 40,000 | | 44,700 |
Edison Mission Energy, 7.73%, 6/15/2009 | | 100,000 | | 107,500 |
El Paso Production Holding Corp., 7.75%, 6/1/2013 | | 35,000 | | 36,663 |
Enterprise Products Operating LP, 7.5%, 2/1/2011 | | 164,000 | | 185,942 |
Mission Resources Corp., 9.875%, 4/1/2011 | | 30,000 | | 32,025 |
Newpark Resources, Inc., Series B, 8.625%, 12/15/2007 | | 40,000 | | 40,600 |
Pemex Project Funding Master Trust, 144A, 3.79%**, 6/15/2010 | | 165,000 | | 169,290 |
Southern Natural Gas, 8.875%, 3/15/2010 | | 15,000 | | 16,800 |
Stone Energy Corp.: | | | | |
144A, 6.75%, 12/15/2014 | | 20,000 | | 19,950 |
8.25%, 12/15/2011 | | 45,000 | | 48,600 |
Williams Cos., Inc.: | | | | |
8.125%, 3/15/2012 | | 45,000 | | 51,975 |
8.75%, 3/15/2032 | | 20,000 | | 22,975 |
| | | | |
|
| | | | | 1,034,807 |
| | | | |
|
Financials 3.5% | | | | |
AAC Group Holding Corp., 144A, Step-up Coupon, 0% to 10/1/2008, 10.25% to 10/1/2012 | | 30,000 | | 20,175 |
Affinia Group, Inc., 144A, 9.0%, 11/30/2014 | | 50,000 | | 52,125 |
American General Institutional Capital, 144A, 8.125%, 3/15/2046 | | 230,000 | | 301,028 |
AmeriCredit Corp., 9.25%, 5/1/2009 | | 10,000 | | 10,725 |
BF Saul Real Estate Investment Trust, 7.5%, 3/1/2014 | | 10,000 | | 10,300 |
Dow Jones CDX: | | | | |
144A, Series 3-1, 7.75%, 12/29/2009 | | 410,000 | | 421,531 |
144A, Series 3-3, 8.0%, 12/29/2009 | | 850,000 | | 871,781 |
E*TRADE Financial Corp., 144A, 8.0%, 6/15/2011 | | 50,000 | | 53,750 |
Farmers Insurance Exchange, 144A, 8.625%, 5/1/2024 | | 50,000 | | 58,978 |
FINOVA Group, Inc., 7.5%, 11/15/2009 | | 281,050 | | 137,714 |
Ford Motor Credit Co.: | | | | |
5.8%, 1/12/2009 | | 197,000 | | 201,362 |
6.875%, 2/1/2006 | | 160,000 | | 164,832 |
General Motors Acceptance Corp., 6.75%, 1/15/2006 | | 930,000 | | 954,068 |
Goldman Sachs Group, Inc., 4.75%, 7/15/2013 | | 155,000 | | 153,378 |
JPMorgan Chase & Co., 5.125%, 9/15/2014 | | 115,000 | | 115,754 |
LNR Property Corp., 7.625%, 7/15/2013 | | 15,000 | | 17,025 |
Poster Financial Group, Inc., 8.75%, 12/1/2011 | | 35,000 | | 35,962 |
PXRE Capital Trust I, 8.85%, 2/1/2027 | | 30,000 | | 30,000 |
Qwest Capital Funding, Inc., 6.5%, 11/15/2018 | | 30,000 | | 24,900 |
R.H. Donnelly Finance Corp., 10.875%, 12/15/2012 | | 15,000 | | 17,813 |
Radnor Holdings Corp., 11.0%, 3/15/2010 | | 20,000 | | 17,150 |
RAM Holdings Ltd., 144A, 6.875%, 4/1/2024 | | 345,000 | | 338,821 |
Republic New York Corp., 5.875%, 10/15/2008 | | 195,000 | | 207,554 |
TIG Capital Holdings Trust, 144A, 8.597%, 1/15/2027 | | 35,000 | | 30,713 |
UGS Corp., 144A, 10.0%, 6/1/2012 | | 25,000 | | 28,438 |
38
| | | | |
| | | Principal
Amount ($) (h)
| | Value ($)
|
Universal City Development, 11.75%, 4/1/2010 | | 20,000 | | 23,625 |
Universal City Florida Holding Co., 144A, 7.2%**, 5/1/2010 | | 15,000 | | 15,600 |
Venoco, Inc., 144A, 8.75%, 12/15/2011 | | 15,000 | | 15,450 |
Wells Fargo & Co., 4.2%, 1/15/2010 | | 236,000 | | 236,959 |
| | | | |
|
| | | | | 4,567,511 |
| | | | |
|
Health Care 0.2% | | | | |
AmeriPath, Inc., 10.5%, 4/1/2013 | | 20,000 | | 21,250 |
Cinacalcet Royalty Subordinated LLC, 8.0%, 3/30/2017 | | 30,000 | | 30,150 |
Curative Health Services, Inc., 10.75%, 5/1/2011 | | 20,000 | | 17,900 |
Encore Medical Corp., 144A, 9.75%, 10/1/2012 | | 20,000 | | 20,200 |
Hanger Orthopedic Group, Inc., 10.375%, 2/15/2009 | | 30,000 | | 30,975 |
HEALTHSOUTH Corp., 10.75%, 10/1/2008 | | 45,000 | | 47,475 |
IDI Acquisition Corp., 144A, 10.75%, 12/15/2011 | | 10,000 | | 10,250 |
InSight Health Services Corp., Series B, 9.875%, 11/1/2011 | | 20,000 | | 20,200 |
Interactive Health LLC, 144A, 7.25%, 4/1/2011 | | 20,000 | | 17,400 |
Tenet Healthcare Corp., 6.375%, 12/1/2011 | | 110,000 | | 102,025 |
| | | | |
|
| | | | | 317,825 |
| | | | |
|
Industrials 1.1% | | | | |
Aavid Thermal Technologies, Inc., 12.75%, 2/1/2007 | | 30,000 | | 32,850 |
Allied Security Escrow Corp., 144A, 11.375%, 7/15/2011 | | 25,000 | | 26,125 |
Allied Waste North America, Inc., Series B, 5.75%, 2/15/2011 | | 120,000 | | 112,800 |
AMI Semiconductor, Inc., 10.75%, 2/1/2013 | | 10,000 | | 11,750 |
Avondale Mills, Inc., 144A, 9.00%, 7/1/2012 | | 10,000 | | 9,000 |
BAE System 2001 Asset Trust, “B”, Series 2001, 144A, 7.156%, 12/15/2011 | | 194,549 | | 211,170 |
Browning-Ferris Industries, 7.4%, 9/15/2035 | | 15,000 | | 13,125 |
Cenveo Corp., 7.875%, 12/1/2013 | | 35,000 | | 32,550 |
Collins & Aikman Floor Cover, Series B, 9.75%, 2/15/2010 | | 55,000 | | 59,125 |
Collins & Aikman Products, 10.75%, 12/31/2011 | | 35,000 | | 35,700 |
Continental Airlines, Inc., “B”, 8.0%, 12/15/2005 | | 25,000 | | 24,375 |
Cornell Companies, Inc., 10.75%, 7/1/2012 | | 40,000 | | 42,750 |
Corrections Corp. of America, 9.875%, 5/1/2009 | | 30,000 | | 33,300 |
Dana Corp., 7.0%, 3/1/2029 | | 40,000 | | 39,900 |
Eagle-Picher Industries, Inc., 9.75%, 9/1/2013 | | 10,000 | | 10,000 |
Erico International Corp., 8.875%, 3/1/2012 | | 25,000 | | 26,250 |
Evergreen International Aviation, Inc., 12.0%, 5/15/2010 | | 10,000 | | 7,575 |
Goodman Global Holding Co., Inc., 144A, 7.875%, 12/15/2012 | | 40,000 | | 39,600 |
Interface, Inc., 10.375%, 2/1/2010 | | 10,000 | | 11,500 |
ISP Chemco, Inc., Series B, 10.25%, 7/1/2011 | | 45,000 | | 50,850 |
Kansas City Southern, 7.5%, 6/15/2009 | | 95,000 | | 99,750 |
Kinetek, Inc., Series D, 10.75%, 11/15/2006 | | 55,000 | | 53,762 |
Laidlaw International, Inc., 10.75%, 6/15/2011 | | 10,000 | | 11,675 |
Millennium America, Inc.: | | | | |
7.625%, 11/15/2026 | | 55,000 | | 54,175 |
9.25%, 6/15/2008 | | 40,000 | | 45,500 |
Remington Arms Co., Inc., 10.5%, 2/1/2011 | | 25,000 | | 24,125 |
Securus Technologies, Inc., 144A, 11.0%, 9/1/2011 | | 30,000 | | 30,000 |
Ship Finance International Ltd., 8.5%, 12/15/2013 | | 35,000 | | 36,050 |
SPX Corp.: | | | | |
6.25%, 6/15/2011 | | 15,000 | | 15,825 |
7.5%, 1/1/2013 | | 40,000 | | 43,400 |
Technical Olympic USA, Inc., 10.375%, 7/1/2012 | | 30,000 | | 33,600 |
Texas Genco LLC, 144A, 6.875%, 12/15/2014 | | 35,000 | | 36,181 |
United Rentals North America, Inc.: | | | | |
6.5%, 2/15/2012 | | 30,000 | | 29,250 |
7.0%, 2/15/2014 | | 25,000 | | 23,375 |
7.75%, 11/15/2013 | | 15,000 | | 14,700 |
| | | | |
|
| | | | | 1,381,663 |
| | | | |
|
Information Technology 0.1% | | | | |
Activant Solutions, Inc., 10.5%, 6/15/2011 | | 30,000 | | 32,250 |
Itron, Inc., 144A, 7.75%, 5/15/2012 | | 20,000 | | 20,350 |
Lucent Technologies, Inc., 6.45%, 3/15/2029 | | 85,000 | | 76,925 |
Spheris, Inc., 144A, 11.0%, 12/15/2012 | | 15,000 | | 15,375 |
| | | | |
|
| | | | | 144,900 |
| | | | |
|
Materials 0.9% | | | | |
Aqua Chemical, Inc., 11.25%, 7/1/2008 | | 30,000 | | 24,000 |
ARCO Chemical Co., 9.8%, 2/1/2020 | | 145,000 | | 165,300 |
Associated Materials, Inc., Step-up Coupon, 0% to 3/01/2009, 11.25% to 3/01/2014 | | 80,000 | | 57,600 |
Caraustar Industries, Inc., 9.875%, 4/1/2011 | | 30,000 | | 32,550 |
Constar International, Inc., 11.0%, 12/1/2012 | | 35,000 | | 36,313 |
Dayton Superior Corp.: | | | | |
10.75%, 9/15/2008 | | 30,000 | | 32,100 |
13.0%, 6/15/2009 | | 70,000 | | 72,800 |
Georgia-Pacific Corp.: | | | | |
8.0%, 1/15/2024 | | 75,000 | | 87,000 |
9.375%, 2/1/2013 | | 35,000 | | 40,775 |
Hercules, Inc.: | | | | |
6.75%, 10/15/2029 | | 25,000 | | 25,812 |
11.125%, 11/15/2007 | | 15,000 | | 17,850 |
Huntsman International LLC, 144A, 7.375%, 1/1/2015 | | 15,000 | | 15,038 |
Huntsman LLC, 11.625%, 10/15/2010 | | 40,000 | | 47,300 |
39
| | | | |
| | | Principal
Amount ($) (h)
| | Value ($)
|
Intermet Corp., 9.75%, 6/15/2009* | | 10,000 | | 4,900 |
International Steel Group, Inc., 6.5%, 4/15/2014 | | 60,000 | | 64,350 |
MMI Products, Inc., Series B, 11.25%, 4/15/2007 | | 25,000 | | 25,375 |
Neenah Corp., 144A, 11.0%, 9/30/2010 | | 50,000 | | 55,250 |
Omnova Solutions, Inc., 11.25%, 6/1/2010 | | 40,000 | | 45,000 |
Owens-Brockway Glass Container, 8.25%, 5/15/2013 | | 10,000 | | 11,000 |
Oxford Automotive, Inc., 144A, 12.0%, 10/15/2010* | | 10,000 | | 6,300 |
Pliant Corp., 11.125%, 9/1/2009 | | 35,000 | | 38,150 |
Portola Packaging, Inc., 8.25%, 2/1/2012 | | 25,000 | | 19,750 |
Rockwood Specialties Group, Inc., 144A, 7.625%, 11/15/2014 EUR | | 50,000 | | 69,916 |
Sheffield Steel Corp., 144A, 11.375%, 8/15/2011 | | 20,000 | | 20,600 |
TriMas Corp., 9.875%, 6/15/2012 | | 75,000 | | 79,500 |
United States Steel LLC: | | | | |
9.75%, 5/15/2010 | | 10,000 | | 11,400 |
10.75%, 8/1/2008 | | 30,000 | | 35,325 |
| | | | |
|
| | | | | 1,141,254 |
| | | | |
|
Telecommunication Services 1.2% | | | | |
American Cellular Corp., Series B, 10.0%, 8/1/2011 | | 100,000 | | 85,750 |
American Tower Corp., 144A, 7.125%, 10/15/2012 | | 15,000 | | 15,338 |
AT&T Corp.: | | | | |
9.05%, 11/15/2011 | | 35,000 | | 40,294 |
9.75%, 11/15/2031 | | 35,000 | | 41,781 |
Bell Atlantic New Jersey, Inc., Series A, 5.875%, 1/17/2012 | | 170,000 | | 180,619 |
BellSouth Corp., 5.2%, 9/15/2014 | | 125,000 | | 127,403 |
Cincinnati Bell, Inc., 8.375%, 1/15/2014 | | 120,000 | | 121,500 |
Dobson Communications Corp., 8.875%, 10/1/2013 | | 35,000 | | 24,588 |
GCI, Inc., 7.25%, 2/15/2014 | | 25,000 | | 25,000 |
LCI International, Inc., 7.25%, 6/15/2007 | | 45,000 | | 43,762 |
Level 3 Financing, Inc., 144A, 10.75%, 10/15/2011 | | 20,000 | | 18,100 |
MCI, Inc., 8.735%, 5/1/2014 | | 115,000 | | 123,625 |
Nextel Communications, Inc., 5.95%, 3/15/2014 | | 20,000 | | 20,700 |
Nextel Partners, Inc., 8.125%, 7/1/2011 | | 25,000 | | 27,750 |
PanAmSat Corp., 144A, 9.0%, 8/15/2014 | | 65,000 | | 72,556 |
Qwest Corp., 7.25%, 9/15/2025 | | 135,000 | | 131,287 |
Qwest Services Corp.: | | | | |
144A, 13.5%, 12/15/2010 | | 15,000 | | 18,037 |
144A, 14.0%, 12/15/2014 | | 85,000 | | 107,525 |
Rural Cellular Corp., 9.875%, 2/1/2010 | | 25,000 | | 25,438 |
SBA Telecom, Inc., Step-up Coupon, 0% to 12/15/2007, 9.75% to 12/15/2011 | | 10,000 | | 8,425 |
SBC Communications, Inc., 4.125%, 9/15/2009 | | 265,000 | | 264,516 |
Triton PCS, Inc., 8.5%, 6/1/2013 | | 10,000 | | 9,650 |
Ubiquitel Operating Co., 9.875%, 3/1/2011 | | 10,000 | | 11,225 |
US Unwired, Inc., Series B, 10.0%, 6/15/2012 | | 35,000 | | 39,463 |
Western Wireless Corp., 9.25%, 7/15/2013 | | 10,000 | | 10,875 |
| | | | |
|
| | | | | 1,595,207 |
| | | | |
|
Utilities 1.2% | | | | |
Calpine Corp.: | | | | |
8.25%, 8/15/2005 (d) | | 27,000 | | 27,270 |
144A, 8.5%, 7/15/2010 | | 45,000 | | 38,587 |
Consumers Energy Co., Series F, 4.0%, 5/15/2010 | | 345,000 | | 338,862 |
Dayton Power & Light Co., 144A, 5.125%, 10/1/2013 | | 180,000 | | 183,903 |
DPL, Inc., 6.875%, 9/1/2011 | | 60,000 | | 65,528 |
Midwest Generation LLC, 8.75%, 5/1/2034 | | 15,000 | | 17,025 |
NRG Energy, Inc., 144A, 8.0%, 12/15/2013 | | 105,000 | | 114,450 |
Pedernales Electric Cooperative, Series 02-A, 144A, 6.202%, 11/15/2032 | | 210,000 | | 225,935 |
Progress Energy, Inc., 6.75%, 3/1/2006 | | 220,000 | | 228,284 |
PSE&G Energy Holdings LLC: | | | | |
8.5%, 6/15/2011 | | 30,000 | | 34,238 |
10.0%, 10/1/2009 | | 35,000 | | 41,387 |
Xcel Energy, Inc., 7.0%, 12/1/2010 | | 245,000 | | 276,171 |
| | | | |
|
| | | | | 1,591,640 |
| | | | |
|
Total Corporate Bonds
(Cost $14,342,213) | | | | 14,475,712 |
| | | | |
|
Foreign Bonds — US$ Denominated 5.2% | | | | |
| | |
Consumer Discretionary 0.2% | | | | |
Advertising Directory Solutions, Inc., 144A, 9.25%, 11/15/2012 | | 20,000 | | 21,000 |
Jafra Cosmetics International, Inc., 10.75%, 5/15/2011 | | 50,000 | | 56,500 |
Kabel Deutschland GmbH, 144A, 10.625%, 7/1/2014 | | 45,000 | | 51,750 |
Shaw Communications, Inc., 8.25%, 4/11/2010 | | 100,000 | | 113,750 |
Vicap SA, 11.375%, 5/15/2007 | | 10,000 | | 10,125 |
Vitro Envases Norteamerica SA, 144A, 10.75%, 7/23/2011 | | 15,000 | | 15,563 |
Vitro SA de CV, Series A, 144A, 11.75%, 11/1/2013 | | 35,000 | | 33,862 |
| | | | |
|
| | | | | 302,550 |
| | | | |
|
Consumer Staples 0.0% | | | | |
Burns Philip Capital Property, Ltd., 10.75%, 2/15/2011 | | 30,000 | | 33,750 |
Grupo Cosan SA, 144A, 9.0%, 11/1/2009 | | 10,000 | | 10,450 |
| | | | |
|
| | | | | 44,200 |
| | | | |
|
Energy 0.3% | | | | |
Gazprom OAO, 144A, 9.625%, 3/1/2013 | | 100,000 | | 118,000 |
Luscar Coal Ltd., 9.75%, 10/15/2011 | | 10,000 | | 11,350 |
Petroleos Mexicanos, Series P, 9.5%, 9/15/2027 | | 90,000 | | 113,400 |
40
| | | | |
| | | Principal
Amount ($) (h)
| | Value ($)
|
Petroleum Geo-Services ASA, 10.0%, 11/5/2010 | | 125,000 | | 142,500 |
Secunda International Ltd., 144A, 9.76%**, 9/1/2012 | | 30,000 | | 29,400 |
| | | | |
|
| | | | | 414,650 |
| | | | |
|
Financials 1.4% | | | | |
Deutsche Telekom International Finance BV: | | | | |
8.5%, 6/15/2010 | | 50,000 | | 59,569 |
8.75%, 6/15/2030 | | 239,000 | | 315,589 |
Eircom Funding, 8.25%, 8/15/2013 | | 30,000 | | 33,150 |
Mantis Reef Ltd., 144A, 4.692%, 11/14/2008 | | 230,000 | | 230,671 |
Mizuho Financial Group, 8.375%, 12/29/2049 | | 350,000 | | 383,565 |
New ASAT (Finance) Ltd., 144A, 9.25%, 2/1/2011 | | 35,000 | | 31,763 |
QBE Insurance Group Ltd., 144A, 5.647%, 7/1/2023 | | 250,000 | | 245,544 |
Westfield Capital Corp.: | | | | |
144A, 4.375%, 11/15/2010 | | 40,000 | | 39,562 |
144A, 5.125%, 11/15/2014 | | 460,000 | | 457,790 |
| | | | |
|
| | | | | 1,797,203 |
| | | | |
|
Health Care 0.0% | | | | |
Biovail Corp., 7.875%, 4/1/2010 | | 20,000 | | 20,700 |
Elan Financial PLC, 144A, 7.75%, 11/15/2011 | | 10,000 | | 10,650 |
| | | | |
|
| | | | | 31,350 |
| | | | |
|
Industrials 0.3% | | | | |
CP Ships Ltd., 10.375%, 7/15/2012 | | 35,000 | | 40,381 |
Grupo Transportacion Ferroviaria Mexicana SA de CV: | | | | |
10.25%, 6/15/2007 | | 25,000 | | 26,625 |
12.5%, 6/15/2012 | | 15,000 | | 17,512 |
LeGrand SA, 8.5%, 2/15/2025 | | 20,000 | | 23,600 |
Stena AB: | | | | |
144A, 7.0%, 12/1/2016 | | 10,000 | | 9,900 |
9.625%, 12/1/2012 | | 20,000 | | 22,600 |
Tyco International Group SA: | | | | |
6.875%, 1/15/2029 | | 101,000 | | 115,697 |
7.0%, 6/15/2028 | | 69,000 | | 80,222 |
| | | | |
|
| | | | | 336,537 |
| | | | |
|
Information Technology 0.1% | | | | |
Flextronics International Ltd., 144A, 6.25%, 11/15/2014 | | 40,000 | | 39,600 |
Magnachip Semiconductor SA: | | | | |
144A, 6.875%, 12/15/2011 | | 15,000 | | 15,450 |
144A, 8.0%, 12/15/2014 | | 15,000 | | 15,638 |
| | | | |
|
| | | | | 70,688 |
| | | | |
|
Materials 1.5% | | | | |
Alrosa Finance SA, 144A, 8.875%, 11/17/2014 | | 20,000 | | 20,550 |
Avecia Group PLC, 11.0%, 7/1/2009 | | 80,000 | | 82,400 |
Cascades, Inc., 7.25%, 2/15/2013 | | 45,000 | | 47,700 |
Celulosa Arauco y Constitucion SA, 7.75%, 9/13/2011 | | 440,000 | | 510,279 |
Crown Euro Holdings SA, 10.875%, 3/1/2013 | | 25,000 | | 29,562 |
ISPAT Inland ULC, 9.75%, 4/1/2014 | | 29,000 | | 35,815 |
Rhodia SA, 8.875%, 6/1/2011 | | 30,000 | | 30,225 |
Sappi Papier Holding AG, 144A, 6.75%, 6/15/2012 | | 485,000 | | 538,888 |
Sino-Forest Corp., 144A, 9.125%, 8/17/2011 | | 20,000 | | 21,850 |
Sociedad Concesionaria Autopista Central, 144A, 6.223%, 12/15/2026 | | 435,000 | | 456,472 |
Tembec Industries, Inc., 8.5%, 2/1/2011 | | 130,000 | | 130,650 |
| | | | |
|
| | | | | 1,904,391 |
| | | | |
|
Sovereign Bonds 0.9% | | | | |
Dominican Republic, 9.04%, 1/23/2013 | | 20,000 | | 16,750 |
Federative Republic of Brazil: | | | | |
8.875%, 10/14/2019 | | 40,000 | | 42,160 |
9.25%, 10/22/2010 | | 60,000 | | 67,080 |
11.0%, 8/17/2040 | | 60,000 | | 71,190 |
Republic of Argentina: | | | | |
Series BGLO, 8.375%, 12/20/2049* | | 110,000 | | 35,750 |
11.75%, 4/7/2009* | | 120,000 | | 40,800 |
11.75%, 6/15/2015* | | 105,000 | | 35,437 |
Republic of Bulgaria, 8.25%, 1/15/2015 | | 60,000 | | 75,444 |
Republic of Colombia: | | | | |
10.75%, 1/15/2013 | | 10,000 | | 11,950 |
11.75%, 2/25/2020 | | 10,000 | | 12,850 |
Republic of Ecuador, Step-up Coupon 8.0% to 8/15/2005, 9.0% to 8/15/2006, 10.0% to 8/15/2030 | | 40,000 | | 34,500 |
Republic of Philippines, 9.375%, 1/18/2017 | | 50,000 | | 51,938 |
Republic of Turkey: | | | | |
7.25%, 3/15/2015 | | 45,000 | | 46,237 |
11.75%, 6/15/2010 | | 50,000 | | 62,750 |
11.875%, 1/15/2030 | | 60,000 | | 86,400 |
Republic of Venezuela: | | | | |
9.25%, 9/15/2027 | | 30,000 | | 31,650 |
10.75%, 9/19/2013 | | 40,000 | | 47,900 |
Russian Federation, Step-up Coupon, 5.0% to 3/31/2007, 7.5% to 3/31/2030 | | 80,000 | | 82,752 |
11.0%, 7/24/2018 | | 90,000 | | 125,838 |
United Mexican States: | | | | |
Series A, 6.75%, 9/27/2034 | | 80,000 | | 79,000 |
8.125%, 12/30/2019 | | 10,000 | | 11,735 |
11.375%, 9/15/2016 | | 60,000 | | 88,560 |
| | | | |
|
| | | | | 1,158,671 |
| | | | |
|
Telecommunication Services 0.5% | | | | |
Alestra SA de RL de CV, 8.0%, 6/30/2010 | | 10,000 | | 8,475 |
America Movil SA de CV, 144A, 5.75%, 1/15/2015 | | 195,000 | | 194,555 |
Axtel SA, 11.0%, 12/15/2013 | | 40,000 | | 43,100 |
Embratel, Series B, 11.0%, 12/15/2008 | | 30,000 | | 34,200 |
Global Crossing UK Finance, 144A, 10.75%, 12/15/2014 | | 30,000 | | 29,625 |
Inmarsat Finance PLC, 7.625%, 6/30/2012 | | 30,000 | | 31,200 |
Innova S. de R.L., 9.375%, 9/19/2013 | | 20,000 | | 22,750 |
41
| | | | |
| | | Principal
Amount ($) (h)
| | Value ($)
|
INTELSAT, 6.5%, 11/1/2013 | | 40,000 | | 36,400 |
Millicom International Cellular SA, 144A, 10.0%, 12/1/2013 | | 65,000 | | 68,006 |
Mobile Telesystems Financial, 144A, 8.375%, 10/14/2010 | | 20,000 | | 20,400 |
Nortel Networks Corp., 6.875%, 9/1/2023 | | 80,000 | | 75,200 |
Nortel Networks Ltd., 6.125%, 2/15/2006 | | 120,000 | | 122,100 |
Rogers Wireless Communications, Inc., 6.375%, 3/1/2014 | | 25,000 | | 24,750 |
| | | | |
|
| | | | | 710,761 |
| | | | |
|
Utilities 0.0% | | | | |
Calpine Canada Energy Finance, 8.5%, 5/1/2008 (d) | | 70,000 | | 57,400 |
| | | | |
|
Total Foreign Bonds — US$ Denominated
(Cost $6,689,629) | | | | 6,828,401 |
| | | | |
|
Foreign Bonds — Non US$ Denominated 0.7% | | | | |
| | |
Industrials 0.1% | | | | |
Grohe Holdings GmbH, 144A, 8.625%, 10/1/2014 EUR | | 50,000 | | 72,720 |
| | | | |
|
Materials 0.0% | | | | |
Rhodia SA, 9.25%, 6/1/2011 EUR | | 25,000 | | 34,576 |
| | | | |
|
Sovereign Bonds 0.6% | | | | |
Mexican Bonds: | | | | |
Series M-20, 8.0%, 12/7/2023 MXN | | 550,000 | | 38,535 |
Series MI-10, 8.0%, 12/19/2013 MXN | | 8,806,000 | | 703,642 |
Republic of Argentina, Step-up Coupon, 8.25% to 7/6/2006, 9.0% to 7/6/2010* EUR | | 50,000 | | 19,879 |
Series FEB, 8.0%, 2/26/2008* EUR | | 20,000 | | 7,952 |
Republic of Colombia, 11.75%, 3/1/2010 COP | | 26,000,000 | | 11,329 |
Republic of Romania, 5.75%, 7/2/2010 EUR | | 20,000 | | 29,694 |
| | | | |
|
| | | | | 811,031 |
| | | | |
|
Total Foreign Bonds — Non US$ Denominated
(Cost $887,170) | | | | 918,327 |
| | | | |
|
Asset Backed 2.5% | | | | |
| | |
Automobile Receivables 1.0% | | | | |
MMCA Automobile Trust: | | | | |
“A4”, Series 2002-3, 3.57%, 8/17/2009 | | 650,000 | | 651,280 |
“A4”, Series 2002-2, 4.3%, 3/15/2010 | | 511,987 | | 513,845 |
“B”, Series 2002-2, 4.67%, 3/15/2010 | | 75,452 | | 74,919 |
| | | | |
|
| | | | | 1,240,044 |
| | | | |
|
Home Equity Loans 1.1% | | | | |
Advanta Mortgage Loan Trust, “A6”, Series 2000-2, 7.72%, 3/25/2015 | | 311,747 | | 328,101 |
Argent NIM Trust, “A”, Series 2004-WN10, 144A, 4.212%, 11/25/2034 | | 224,523 | | 224,741 |
Centex Home Equity, “A6”, Series 2000-B, 7.97%, 7/25/2031 | | 389,481 | | 399,085 |
Countrywide Home Equity Loan Trust, “2A”, Series 2004-D, 2.65%**, 6/15/2029 | | 346,769 | | 346,769 |
Countrywide Home Loan, “A16”, Series 2002-36, 5.25%, 1/25/2033 | | 52,576 | | 52,551 |
Master Alternative Loan Trust, “5A1”, Series 2005-1, 5.5%, 1/1/2019 | | 30,000 | | 30,858 |
| | | | |
|
| | | | | 1,382,105 |
| | | | |
|
Manufactured Housing Receivables 0.4% | | | | |
Vanderbilt Acquisition Loan Trust, “A2”, Series 2002-1, 4.77%, 10/7/2018 | | 578,181 | | 583,349 |
| | | | |
|
Total Asset Backed
(Cost $3,236,227) | | | | 3,205,498 |
| | | | |
|
US Government Agency Sponsored Pass-Throughs 2.0% | | | | |
Federal National Mortgage Association: | | | | |
4.5%, 5/1/2033 (g) | | 130,000 | | 125,613 |
5.0%, 3/1/2034 | | 621,839 | | 618,192 |
5.5% with various maturities from 3/1/2033 until 5/1/2034 (g) | | 1,036,204 | | 1,052,244 |
6.0%, 11/1/2017 | | 169,461 | | 177,892 |
6.5%, 9/1/2034 | | 285,443 | | 299,441 |
7.13%, 1/1/2012 | | 195,898 | | 206,809 |
8.0%, 9/1/2015 | | 67,007 | | 71,268 |
| | | | |
|
Total US Government Agency Sponsored Pass-Throughs
(Cost $2,535,331) | | | | 2,551,459 |
| | | | |
|
Commercial and Non-Agency Mortgage-Backed Securities 2.2% | | | | |
Chase Commercial Mortgage Securities Corp., “A1”, Series 2000-1, 7.656%, 4/15/2032 | | 176,853 | | 182,102 |
Citigroup Mortgage Loan Trust, Inc., “1CB2”, Series 2004-NCM2, 6.75%, 8/25/2034 | | 347,023 | | 361,663 |
Countrywide Alternative Loan Trust, “1A1”, Series 2004-J1, 6.0%, 2/25/2034 | | 118,618 | | 120,257 |
Countrywide Home Loans, “A5”, Series 2002-27, 5.5%, 12/25/2032 | | 132,533 | | 132,605 |
DLJ Mortgage Acceptance Corp., “A1B”, Series 1997-CF2, 144A, 6.82%, 10/15/2030 | | 192,386 | | 204,564 |
GMAC Commercial Mortgage Securities, Inc., “A3”, Series 1997-C1, 6.869%, 7/15/2029 | | 241,227 | | 255,205 |
GS Mortgage Securities Corp. II, “C”, Series 1998-C1, 6.91%, 10/18/2030 | | 205,000 | | 224,359 |
Master Alternative Loan Trust, “3A1”, Series 2004-5, 6.5%, 6/25/2034 | | 62,994 | | 65,573 |
Master Asset Securitization Trust, “8A1”, Series 2003-6, 5.5%, 7/25/2033 | | 231,923 | | 233,807 |
42
| | | | |
| | | Principal
Amount ($) (h)
| | Value ($)
|
Merrill Lynch Mortgage Investors, Inc., “B”, Series 1999-C1, 7.71%, 11/15/2031 | | 220,000 | | 251,790 |
Structured Asset Securities Corp., “2A1”, Series 2003-1, 6.0%, 2/25/2018 | | 105,819 | | 109,787 |
TIAA Real Estate CDO Ltd., “A2”, Series 2001-C1A, 144A, 6.3%, 6/19/2021 | | 146,344 | | 155,323 |
Wachovia Bank Commercial Mortgage Trust, “A5”, Series 2004-C11, 5.215%, 1/15/2041 | | 289,000 | | 297,541 |
Washington Mutual Mortgage Securities Corp., “A7, Series 2004-AR9, 4.267%, 8/25/2034 | | 227,000 | | 227,179 |
| | | | |
|
Total Commercial and Non-Agency Mortgage-Backed Securities
(Cost $2,841,767) | | | | 2,821,755 |
| | | | |
|
Collateralized Mortgage Obligations 6.3% | | | | |
Fannie Mae, “C”, Series 1997-MS, 6.74%, 8/25/2007 | | 390,000 | | 417,009 |
Fannie Mae Grantor Trust: | | | | |
“1A3”, Series 2004-T2, 7.0%, 11/25/2043 | | 119,237 | | 126,354 |
“A2”, Series 2002-T16, 7.0%, 7/25/2042 | | 132,686 | | 140,605 |
Fannie Mae Whole Loan: | | | | |
“3A2B”, Series 2003-W10, 3.056%, 7/25/2037 | | 260,000 | | 257,971 |
“2A”, Series 2002-W1, 7.5%, 2/25/2042 | | 177,556 | | 189,685 |
“5A”, Series 2004-W2, 7.5%, 3/25/2044 | | 362,761 | | 388,308 |
Federal Home Loan Mortgage Corp.: | | | | |
“ME”, Series 2691, 4.5%, 4/15/2032 | | 285,000 | | 272,718 |
“PE”, Series 2727, 4.5%, 7/15/2032 | | 470,000 | | 448,179 |
“QH”, Series 2694, 4.5%, 3/15/2032 | | 595,000 | | 573,161 |
“BG”, Series 2640, 5.0%, 2/15/2032 | | 510,000 | | 511,929 |
“EG”, Series 2836, 5.0%, 12/15/2032 | | 455,000 | | 451,157 |
“JD”, Series 2778, 5.0%, 12/15/2032 | | 290,000 | | 288,188 |
“NE”, Series 2802, 5.0%, 2/15/2033 | | 460,000 | | 457,758 |
“H”, Series 2278, 6.5%, 1/15/2031 | | 92,535 | | 94,966 |
“Z”, Series 2173, 6.5%, 7/15/2029 | | 78,137 | | 82,024 |
Federal National Mortgage Association: | | | | |
“TU”, Series 2003-122, 4.0%, 5/25/2016 | | 350,000 | | 353,416 |
“A2”, Series 2002-W10, 4.7%, 8/25/2042 | | 5,097 | | 5,093 |
“1A3”, Series 2003-W18, 4.732%, 8/25/2043 | | 270,000 | | 271,302 |
“A2”, Series 2002-60, 4.75%, 2/25/2044 | | 30,529 | | 30,476 |
“KH”, Series 2003-92, 5.0%, 3/25/2032 | | 260,000 | | 257,157 |
“PD”, Series 2002-31, 6.0%, 11/25/2021 | | 1,300,000 | | 1,344,279 |
“PM”, Series 2001-60, 6.0%, 3/25/2030 | | 119,253 | | 120,795 |
“2A”, Series 2003-W8, 7.0%, 10/25/2042 | | 168,485 | | 177,746 |
FHLMC Structured Pass-Through Securities, “3A”, Series T-58, 7.0%, 9/25/2043 | | 183,399 | | 194,174 |
Government National Mortgage Association, “DH”, Series 2004-3, 3.75%, 2/20/2027 | | 810,000 | | 806,141 |
| | | | |
|
Total Collateralized Mortgage Obligations
(Cost $8,170,421) | | | | 8,260,591 |
| | | | |
|
Government National Mortgage Association 1.0% | | | | |
Government National Mortgage Association: | | | | |
5.0%, 9/20/2033 | | 223,786 | | 223,979 |
6.0% with various maturities from 7/20/2034 until 8/20/2034 | | 818,318 | | 847,685 |
6.5%, 4/20/2034 | | 287,983 | | 303,310 |
| | | | |
|
Total Government National Mortgage Association
(Cost $1,369,996) | | | | 1,374,974 |
| | | | |
|
Municipal Investments 1.8% | | | | |
Brockton, MA, Core City General Obligation, Economic Development, Series A, 6.45%, 5/1/2017 (f) | | 560,000 | | 622,658 |
Charlotte-Meckelberg, NC, Hospital Authority Health Care System Revenue, ETM, 5.0%, 8/1/2015 | | 510,000 | | 517,900 |
Hoboken, NJ, Core City General Obligation, Series B, 3.8%, 1/1/2008 (f) | | 270,000 | | 270,419 |
Jersey City, NJ, Water & Sewer Revenue, Municipal Utilities Authority, Water Revenue, Series B, 4.91%, 5/15/2015 (f) | | 385,000 | | 381,739 |
Jicarilla, NM, Sales & Special Tax Revenue, Apache Nation Revenue, 5.2%, 12/1/2013 | | 215,000 | | 220,433 |
Yazoo County, MS, Sales & Special Tax Revenue, Series B, 4.3%, 9/1/2010 (f) | | 355,000 | | 357,077 |
| | | | |
|
Total Municipal Investments
(Cost $2,285,380) | | | | 2,370,226 |
| | | | |
|
US Government Backed 3.9% | | | | |
US Treasury Bill, 1.583%**, 1/20/2005 (i) | | 25,000 | | 24,979 |
US Treasury Bond: | | | | |
6.0%, 2/15/2026 | | 1,355,000 | | 1,552,163 |
7.25%, 5/15/2016 | | 300,000 | | 375,516 |
7.5%, 11/15/2016 | | 20,000 | | 25,559 |
US Treasury Note: | | | | |
1.5%, 3/31/2006 | | 1,350,000 | | 1,327,957 |
3.25%, 1/15/2009 | | 1,751,000 | | 1,735,816 |
| | | | |
|
Total US Government Backed
(Cost $4,945,080) | | | | 5,041,990 |
| | | | |
|
43
| | | | | | |
| | | Principal
Amount ($) (h)
| | | Value ($)
| |
Convertible Bond 0.0% | | | | | | |
HIH Capital Ltd., 144A, Series DOM, 7.5%, 9/25/2006 (Cost $9,930) | | 10,000 | | | 9,900 | |
| | | | | |
|
|
| | |
| | | Shares
| | | Value ($)
| |
Warrants 0.0% | | | | | | |
TravelCenters of America, Inc.* (Cost $50) | | 10 | | | 50 | |
| | | | | |
|
|
Other Investments 0.1% | | | | | | |
Hercules Trust II, (Common Stock Unit) (Cost $87,375) | | 105,000 | | | 88,200 | |
| | | | | |
|
|
Exchange Traded Fund 0.1% | | | | | | |
Semiconductor HOLDRs Trust (Cost $167,341) | | 4,800 | | | 160,129 | |
| | | | | |
|
|
Securities Lending Collateral 0.1% | | | | | | |
Daily Assets Fund Institutional, 2.25% (c) (e) (Cost $79,425) | | 79,425 | | | 79,425 | |
| | | | | |
|
|
Cash Equivalents 3.0% | | | | | | |
Scudder Cash Management QP Trust, 2.24% (b) (Cost $3,967,120) | | 3,967,120 | | | 3,967,120 | |
| | | | | |
|
|
| | |
| | | % of Net
Assets
| | | Value ($)
| |
Total Investment Portfolio
(Cost $116,186,557) (a) | | 100.0 | | | 130,385,193 | |
| | |
Other Assets and Liabilities, Net | | (0.0 | ) | | (7,933 | ) |
| | |
|
| |
|
|
Net Assets | | 100.0 | | | 130,377,260 | |
| | |
|
| |
|
|
| * | Non-income producing security. In the case of a bond, generally denotes that the issuer has defaulted on the payment of principal or interest or has filed for bankruptcy. |
| | | | | | | | | | | | | | |
Security
| | Coupon
| | Maturity Date
| | Principal
| | Amount
| | Acqusition Cost
| | Value
|
Intermet Corp. | | 9.75 | | 6/15/2009 | | USD | | 10,000 | | $ | 4,100 | | $ | 4,900 |
Oxford Automotive, Inc. | | 12 | | 10/15/2010 | | USD | | 10,000 | | | 4,775 | | | 6,300 |
Republic of Argentina: | | | | | | | | | | | | | | |
| | | 8 | | 2/26/2008 | | EUR | | 20,000 | | | 7,854 | | | 7,952 |
| | | 8.375 | | 12/20/2049 | | USD | | 110,000 | | | 35,035 | | | 35,750 |
| | | 9 | | 7/6/2010 | | EUR | | 50,000 | | | 19,473 | | | 19,879 |
| | | 11.75 | | 4/7/2009 | | USD | | 120,000 | | | 39,700 | | | 40,800 |
| | | 11.75 | | 6/15/2015 | | USD | | 105,000 | | | 34,943 | | | 35,437 |
Trump Holdings & Funding | | 11.625 | | 3/15/2010 | | USD | | 25,000 | | | 27,188 | | | 27,063 |
| | | | | | | | | | |
|
| |
|
|
| | | | | | | | | | | $ | 173,068 | | $ | 178,081 |
| | | | | | | | | | |
|
| |
|
|
| ** | Floating rate notes are securities whose yields vary with a designated market index or market rate, such as the coupon-equivalent of the US Treasury bill rate. |
These securities are shown at their current rate as of December 31, 2004.
| (a) | The cost for federal income tax purposes was $117,635,311. At December 31, 2004, net unrealized appreciation for all securities based on tax cost was $12,749,882. This consisted of aggregate gross unrealized appreciation for all securities in which there was an excess of value over tax cost of $13,723,211 and aggregate gross unrealized depreciation for all securities in which there was an excess of tax cost over value of $973,329. |
| (b) | Scudder Cash Management QP Trust is managed by Deutsche Investment Management Americas Inc. The rate shown is the annualized seven-day yield at period end. |
| (c) | Daily Assets Fund Institutional, an affiliated fund, is managed by Deutsche Asset Management, Inc. The rate shown is the annualized seven-day yield at period end. |
| (d) | All or a portion of these securities were on loan (see Notes to Financial Statements). The value of all securities loaned at December 31, 2004 amounted to $77,541, which is 0.06% of total net assets. |
| (e) | Represents collateral held in connection with securities lending. |
| (f) | Bond is insured by one of these companies: |
| | | | |
Insurance Coverage
| | As a % of Total Investment Portfolio
|
AMBAC | | AMBAC Assurance Company | | .3 |
FGIC | | Financial Guaranty Insurance Company | | .7 |
MBIA | | Municipal Bond Investors Assurance | | .3 |
| (g) | Mortgage dollar rolls included. |
| (h) | Principal amount stated in US dollars unless otherwise noted. |
| (i) | At December 31, 2004, this security has been segregated, in whole or in part, to cover initial margin requirements for open futures contracts. |
At December 31, 2004, open futures contracts purchased were as follows:
| | | | | | | | | | | |
Futures
| | Expiration Date
| | Contracts
| | Aggregated Face Value ($)
| | Value ($)
| | Net Unrealized Depreciation (US$)
| |
Russell 2000 Index | | 3/18/2005 | | 8 | | 524,600 | | 523,200 | | (1,400 | ) |
ADR: American Depositary Receipts
REIT: Real Estate Investment Trust
ETM: Bonds bearing the description ETM (escrowed to maturity) are collateralized by US Treasury securities which are held in escrow and used to pay principal and interest on bonds so designated.
HOLDRs: Holding Company Depositary Receipts
144A: Security exempt from registration under 144A of the Securities Act of 1933. These securities may be resold in transactions exempt from registration, normally to qualified institutional buyers.
Currency Abbreviation
| | |
COP | | Colombian Peso |
EUR | | Euro |
MXN | | Mexican Peso |
Included in the portfolio are investments in mortgage or asset-backed securities which are interests in separate pools of mortgages or assets. Effective maturities of these investments may be shorter than stated maturities due to prepayments. Some separate investments in the Federal National Mortgage Association issues which have similar coupon rates have been aggregated for presentation purposes in the investment portfolio.
Purchases and sales of investment securities (excluding US Treasury obligations, short-term investments and mortgage dollar roll transactions) for the year ended December 31, 2004, aggregated $113,096,490 and $135,386,768, respectively. Purchases and sales of US Treasury obligations aggregated $57,017,681 and $56,906,029, respectively. Purchases and sales of mortgage dollar roll transactions aggregated $19,995,117 and $17,547,092, respectively.
At December 31, 2004, Balanced Portfolio had a net tax basis capital loss carryforward of approximately $15,900,000 which may be applied against any realized net taxable capital gains of each succeeding year until fully utilized or until December 31, 2009 ($5,500,000), December 31, 2010 ($500,000) and December 31, 2011 ($9,900,000), the respective expiration dates, whichever occurs first.
The accompanying notes are an integral part of the financial statements.
44
Financial Statements
Balanced Portfolio
Statement of Assets and Liabilities as of December 31, 2004
| | | | |
Assets | | | | |
Investments: | | | | |
Investments in securities, at value — including $77,541 of securities loaned (cost $112,140,012) | | $ | 126,338,648 | |
Investment in Scudder Cash Management QP Trust (cost $3,967,120) | | | 3,967,120 | |
Investment in Daily Assets Fund Institutional (Cost $79,425)* | | | 79,425 | |
| | |
|
|
|
Total investments in securities, at value (cost $116,186,557) | | | 130,385,193 | |
| | |
|
|
|
Cash | | | 180,441 | |
Foreign currency, at value (cost $46,251) | | | 46,726 | |
Receivable for investments sold | | | 640,613 | |
Dividends receivable | | | 116,345 | |
Interest receivable | | | 573,542 | |
Receivable for Portfolio shares sold | | | 3,427 | |
Receivable for daily variation margin on open futures contracts | | | 400 | |
Unrealized appreciation on forward foreign currency exchange contracts | | | 35,218 | |
Net receivable on closed forward foreign currency exchange contracts | | | 2,490 | |
Other assets | | | 5,838 | |
| | |
|
|
|
Total assets | | | 131,990,233 | |
| | |
|
|
|
Liabilities | |
Payable for investments purchased | | | 155,900 | |
Payable for investments purchased — mortgage dollar rolls | | | 648,338 | |
Payable upon return of securities loaned | | | 79,425 | |
Payable for Portfolio shares redeemed | | | 574,464 | |
Deferred mortgage dollar roll income | | | 738 | |
Unrealized depreciation on forward foreign currency exchange contracts | | | 49,361 | |
Accrued management fee | | | 48,125 | |
Other accrued expenses and payables | | | 56,622 | |
| | |
|
|
|
Total liabilities | | | 1,612,973 | |
| | |
|
|
|
Net assets, at value | | $ | 130,377,260 | |
| | |
|
|
|
Net Assets | | | | |
Net assets consist of: | | | | |
Undistributed net investment income | | | 2,546,822 | |
Net unrealized appreciation (depreciation) on investments | | | 14,198,636 | |
Futures | | | (1,400 | ) |
Foreign currency related transactions | | | (8,322 | ) |
Accumulated net realized gain (loss) | | | (17,298,622 | ) |
Paid-in capital | | | 130,940,146 | |
| | |
|
|
|
Net assets, at value | | $ | 130,377,260 | |
| | |
|
|
|
Net Asset Value, offering and redemption price per share ($130,377,260 ÷ 11,143,673 outstanding shares of beneficial interest, no par value, unlimited number of shares authorized) | | $ | 11.70 | |
| | |
|
|
|
| * | Represents collateral on securities loaned |
45
Statement of Operations for the year ended December 31, 2004
| | | | |
Investment Income | | | | |
Income: | | | | |
Dividends (net of foreign taxes withheld of $179) | | $ | 1,219,696 | |
Interest | | | 2,407,968 | |
Interest — Scudder Cash Management QP Trust | | | 5,768 | |
Securities lending income, including income from Daily Assets Fund Institutional | | | 11 | |
Mortgage dollar roll income | | | 63,357 | |
| | |
|
|
|
Total Income | | | 3,696,800 | |
| | |
|
|
|
Expenses: | | | | |
Management fee | | | 646,731 | |
Custodian fees | | | 24,310 | |
Accounting fees | | | 79,611 | |
Auditing | | | 32,580 | |
Legal | | | 12,830 | |
Trustees’ fees and expenses | | | 7,172 | |
Reports to shareholders | | | 14,160 | |
Other | | | 2,906 | |
| | |
|
|
|
Total expenses, before expense reductions | | | 820,300 | |
Expense reductions | | | (3,588 | ) |
| | |
|
|
|
Total expenses, after expense reductions | | | 816,712 | |
| | |
|
|
|
Net investment income | | | 2,880,088 | |
| | |
|
|
|
Realized and Unrealized Gain (Loss) on Investment Transactions | | | | |
Net realized gain (loss) from: | | | | |
Investments | | | 9,095,657 | |
Futures | | | 40,527 | |
Foreign currency related transactions | | | (21,844 | ) |
| | |
|
|
|
| | | | 9,114,340 | |
| | |
|
|
|
Net unrealized appreciation (depreciation) during the period on: | | | | |
Investments | | | (3,729,536 | ) |
Futures | | | (1,400 | ) |
Foreign currency related transactions | | | (8,322 | ) |
| | |
|
|
|
| | | | (3,739,258 | ) |
| | |
|
|
|
Net gain (loss) on investment transactions | | | 5,375,082 | |
| | |
|
|
|
Net increase (decrease) in net assets resulting from operations | | $ | 8,255,170 | |
| | |
|
|
|
The accompanying notes are an integral part of the financial statements.
46
Statement of Changes in Net Assets
| | | | | | | | |
| | | Years Ended December 31,
| |
Increase (Decrease) in Net Assets
| | 2004
| | | 2003
| |
Operations: | | | | | | | | |
| | |
Net investment income | | $ | 2,880,088 | | | $ | 2,459,491 | |
Net realized gain (loss) on investment transactions | | | 9,114,340 | | | | (3,387,044 | ) |
Net unrealized appreciation (depreciation) on investment transactions during the period | | | (3,739,258 | ) | | | 23,303,018 | |
Net increase (decrease) in net assets resulting from operations | | | 8,255,170 | | | | 22,375,465 | |
Distributions to shareholders from net investment income | | | (2,400,327 | ) | | | (3,267,657 | ) |
Portfolio share transactions: | | | | | | | | |
| | |
Proceeds from shares sold | | | 5,576,188 | | | | 10,385,277 | |
Reinvestment of distributions | | | 2,400,327 | | | | 3,267,657 | |
Cost of shares redeemed | | | (26,562,367 | ) | | | (20,040,448 | ) |
Net increase (decrease) in net assets from Portfolio share transactions | | | (18,585,852 | ) | | | (6,387,514 | ) |
Increase (decrease) in net assets | | | (12,731,009 | ) | | | 12,720,294 | |
Net assets at beginning of period | | | 143,108,269 | | | | 130,387,975 | |
| | |
|
|
| |
|
|
|
Net assets at end of period (including undistributed net investment income of $2,546,822 and $2,299,886, respectively) | | $ | 130,377,260 | | | $ | 143,108,269 | |
| | |
|
|
| |
|
|
|
Other Information | | | | | | | | |
Shares outstanding at beginning of period | | | 12,794,206 | | | | 13,419,812 | |
Shares sold | | | 494,906 | | | | 1,006,063 | |
Shares issued to shareholders in reinvestment of distributions | | | 216,636 | | | | 328,078 | |
Shares redeemed | | | (2,362,075 | ) | | | (1,959,747 | ) |
Net increase (decrease) in Portfolio shares | | | (1,650,533 | ) | | | (625,606 | ) |
| | |
|
|
| |
|
|
|
Shares outstanding at end of period | | | 11,143,673 | | | | 12,794,206 | |
| | |
|
|
| |
|
|
|
The accompanying notes are an integral part of the financial statements.
47
Financial Highlights
Balanced Portfolio
| | | | | | | | | | | | | | | | | | | | |
Years Ended December 31,
| | 2004
| | | 2003
| | | 2002
| | | 2001a
| | | 2000
| |
Selected Per Share Data | | | | | | | | | | | | | | | | | | | | |
Net asset value, beginning of period | | $ | 11.19 | | | $ | 9.72 | | | $ | 11.76 | | | $ | 13.39 | | | $ | 16.11 | |
| | |
|
|
| |
|
|
| |
|
|
| |
|
|
| |
|
|
|
Income (loss) from investment operations: | | | | | | | | | | | | | | | | | | | | |
Net investment incomeb | | | .24 | | | | .19 | | | | .23 | | | | .30 | | | | .34 | |
Net realized and unrealized gain (loss) on investment transactions | | | .46 | | | | 1.53 | | | | (1.97 | ) | | | (1.07 | ) | | | (.62 | ) |
| | |
|
|
| |
|
|
| |
|
|
| |
|
|
| |
|
|
|
Total from investment operations | | | .70 | | | | 1.72 | | | | (1.74 | ) | | | (.77 | ) | | | (.28 | ) |
| | |
|
|
| |
|
|
| |
|
|
| |
|
|
| |
|
|
|
Less distributions from: | | | | | | | | | | | | | | | | | | | | |
Net investment income | | | (.19 | ) | | | (.25 | ) | | | (.30 | ) | | | (.34 | ) | | | (.28 | ) |
Net realized gains on investment transactions | | | — | | | | — | | | | — | | | | (.52 | ) | | | (2.16 | ) |
| | |
|
|
| |
|
|
| |
|
|
| |
|
|
| |
|
|
|
Total distributions | | | (.19 | ) | | | (.25 | ) | | | (.30 | ) | | | (.86 | ) | | | (2.44 | ) |
| | |
|
|
| |
|
|
| |
|
|
| |
|
|
| |
|
|
|
Net asset value, end of period | | $ | 11.70 | | | $ | 11.19 | | | $ | 9.72 | | | $ | 11.76 | | | $ | 13.39 | |
| | |
|
|
| |
|
|
| |
|
|
| |
|
|
| |
|
|
|
Total Return (%) | | | 6.48 | | | | 17.94 | | | | (15.07 | ) | | | (6.06 | ) | | | (2.02 | ) |
| | |
|
|
| |
|
|
| |
|
|
| |
|
|
| |
|
|
|
Ratios to Average Net Assets and Supplemental Data | | | | | | | | | | | | | | | | | | | | |
Net assets, end of period ($ millions) | | | 130 | | | | 143 | | | | 130 | | | | 173 | | | | 190 | |
Ratio of expenses before expense reductions (%) | | | .60 | | | | .59 | | | | .56 | | | | .57 | c | | | .54 | |
Ratio of expense after expense reductions (%) | | | .60 | | | | .59 | | | | .56 | | | | .56 | c | | | .54 | |
Ratio of net investment income (%) | | | 2.12 | | | | 1.82 | | | | 2.19 | | | | 2.46 | | | | 2.41 | |
Portfolio turnover rate (%) | | | 138 | d | | | 99 | d | | | 141 | d | | | 100d | | | | 127 | |
| a | As required, effective January 1, 2001, the Portfolio adopted the provisions of the AICPA Audit and Accounting Guide for Investment Companies and began amortizing premium on debt securities. In addition, paydowns on mortgage-backed securities which were included in realized gain/loss on investment transactions prior to January 1, 2001 are included as interest income. The effect of this change for the year ended December 31, 2001 was to decrease net investment income per share by $.01, increase net realized and unrealized gain (loss) per share by $.01, and decrease the ratio of net investment income to average net assets from 2.56% to 2.46%. Per share data and ratios for periods prior to January 1, 2001 have not been restated to reflect this change in presentation. |
| b | Based on average shares outstanding during the period. |
| c | The ratios of operating expenses excluding costs incurred in connection with a fund complex reorganization before and after expense reductions were .56% and .56%, respectively. |
| d | The portfolio turnover rate including mortgage dollar roll transactions was 143%, 112%, 146% and 104% for the years ended December 31, 2004, December 31, 2003, December 31, 2002 and December 31, 2001, respectively. |
48
Performance Summary December 31, 2004
Growth and Income Portfolio
All performance shown is historical, assumes reinvestment of all dividends and capital gains, and does not guarantee future results. Investment return and principal value fluctuate with changing market conditions so that, when redeemed, shares may be worth more or less then their original cost. Current performance may be lower or higher than the performance data quoted. Please visit scudder.com for the product’s most recent month-end performance. Performance doesn’t reflect charges and fees (“contract charges”) associated with the separate account that invests in the portfolio or any variable life insurance policy or variable annuity contract for which the portfolio is an investment option. These charges and fees will reduce returns.
The Portfolio is subject to stock market risk, meaning stocks in the Portfolio may decline in value for extended periods of time due to the activities and financial prospects of individual companies, or due to general market and economic conditions. Please read this Portfolio’s prospectus for specific information regarding its investments and risk profile.
| | |
| Growth of an Assumed $10,000 Investment |
|
¨ Growth and Income Portfolio — Class A |
|
¨ S&P 500 Index |
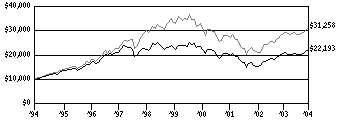
Yearly periods ended December 31
The Standard & Poor’s 500 (S&P 500) Index is a capitalization-weighted index of 500 stocks. The index is designed to measure performance of the broad domestic economy through changes in the aggregate market value of 500 stocks representing all major industries. Index returns assume the reinvestment of dividends and, unlike Portfolio returns, do not reflect any fees or expenses. It is not possible to invest directly into an index.
Comparative Results (as of December 31, 2004)
| | | | | | | | | | | | | | | | |
Growth and Income Portfolio
| | 1-Year
| | | 3-Year
| | | 5-Year
| | | 10-Year
| |
Class A | | | | | | | | | | | | | | | | |
Growth of $10,000 | | $ | 11,016 | | | $ | 10,733 | | | $ | 9,320 | | | $ | 22,193 | |
Average annual total return | | | 10.16 | % | | | 2.39 | % | | | -1.40 | % | | | 8.30 | % |
| | | | |
S&P 500 Index | | | | | | | | | | | | | | | | |
Growth of $10,000 | | $ | 11,088 | | | $ | 11,115 | | | $ | 8,902 | | | $ | 31,258 | |
Average annual total return | | | 10.88 | % | | | 3.59 | % | | | -2.30 | % | | | 12.07 | % |
| | | | |
Growth and Income Portfolio
| | 1-Year
| | | 3-Year
| | | 5-Year
| | | Life of Class*
| |
Class B | | | | | | | | | | | | | | | | |
Growth of $10,000 | | $ | 10,978 | | | $ | 10,641 | | | $ | 9,192 | | | $ | 12,742 | |
Average annual total return | | | 9.78 | % | | | 2.09 | % | | | -1.67 | % | | | 3.21 | % |
| | | | |
S&P 500 Index | | | | | | | | | | | | | | | | |
Growth of $10,000 | | $ | 11,088 | | | $ | 11,115 | | | $ | 8,902 | | | $ | 16,982 | |
Average annual total return | | | 10.88 | % | | | 3.59 | % | | | -2.30 | % | | | 7.15 | % |
The growth of $10,000 is cumulative.
| * | The Portfolio commenced selling Class B shares on May 1, 1997. Index returns begin April 30, 1997. |
49
Information About Your Portfolio’s Expenses
Growth and Income Portfolio
As an investor of the Portfolio, you incur two types of costs: ongoing expenses and transaction costs. Ongoing expenses include management fees, distribution and service (12b-1) fees and other Portfolio expenses. Examples of transaction costs include sales charges (loads), redemption fees and account maintenance fees, which are not shown in this section. The following tables are intended to help you understand your ongoing expenses (in dollars) of investing in the Portfolio and to help you compare these expenses with the ongoing expenses of investing in other mutual funds. The tables are based on an investment of $1,000 made at the beginning of the six-month period ended December 31, 2004.
The tables illustrate your Portfolio’s expenses in two ways:
Actual Portfolio Return. This helps you estimate the actual dollar amount of ongoing expenses (but not transaction costs) paid on a $1,000 investment in the Portfolio using the Portfolio’s actual return during the period. To estimate the expenses you paid over the period, simply divide your account value by $1,000 (for example, an $8,600 account value divided by $1,000 = 8.6), then multiply the result by the number in the “Expenses Paid per $1,000” line under the share class you hold.
Hypothetical 5% Portfolio Return. This helps you to compare your Portfolio’s ongoing expenses (but not transaction costs) with those of other mutual funds using the Portfolio’s actual expense ratio and a hypothetical rate of return of 5% per year before expenses. Examples using a 5% hypothetical portfolio return may be found in the shareholder reports of other mutual funds. The hypothetical account values and expenses may not be used to estimate the actual ending account balance or expenses you paid for the period.
Please note that the expenses shown in these tables are meant to highlight your ongoing expenses only and do not reflect any transaction costs. The “Expenses Paid per $1,000” line of the tables is useful in comparing ongoing expenses only and will not help you determine the relative total expense of owning different funds. If these transaction costs had been included, your costs would have been higher.
Expenses and Value of a $1,000 Investment for the six months ended December 31, 2004
| | | | | | |
| | | Class A
| | Class B
|
Actual Portfolio Return | | | | | | |
Beginning Account Value 7/1/04 | | $ | 1,000.00 | | $ | 1,000.00 |
Ending Account Value 12/31/04 | | $ | 1,067.80 | | $ | 1,065.70 |
Expenses Paid per $1,000* | | $ | 2.90 | | $ | 4.67 |
| | |
| | | Class A
| | Class B
|
Hypothetical 5% Portfolio Return | | | | | | |
Beginning Account Value 7/1/04 | | $ | 1,000.00 | | $ | 1,000.00 |
Ending Account Value 12/31/04 | | $ | 1,022.40 | | $ | 1,020.69 |
Expenses Paid per $1,000* | | $ | 2.84 | | $ | 4.56 |
| * | Expenses are equal to the Portfolio’s annualized expense ratio for each share class, multiplied by the average account value over the period, multiplied by the number of days in the most recent six-month period, then divided by 365. |
| | | | | | |
| | | Class A
| | | Class B
| |
Annualized Expense Ratios | | | | | | |
Scudder Variable Series I — Growth and Income Portfolio | | .56 | % | | .90 | % |
For more information, please refer to the Portfolio’s prospectus.
50
Management Summary December 31, 2004
Growth and Income Portfolio
Improved earnings, an increase in company mergers and post-presidential election sentiment all contributed to US stock-market gains in 2004. Despite a spike in oil prices in the second half of the year, which helped energy stocks substantially, all sectors managed to finish in positive territory.
The portfolio returned 10.16% for the year (Class A shares, unadjusted for contract charges), compared to a 10.88% return for the Standard & Poor’s 500 (S&P 500) Index. Telecommunications was the greatest positive contributor to relative performance, as AT&T Wireless Services* rallied on news of its takeover by Cingular. Health Care also added to the portfolio’s return. An underweight in pharmaceuticals proved beneficial in what was a difficult year for the industry. Further, holdings in health insurers and providers had strong returns in part on the sentiment that President Bush’s re-election would be a boom to the industry.
Careful stock selection among beverage and food companies added to return in consumer staples. A weakening dollar made the exports of US companies cheaper overseas, thus improving sales. Combined with strengthening company fundamentals, this helped the performance of the portfolio’s materials stocks.
The portfolio’s greatest weakness was in consumer discretionary. Despite a year that included the Olympic games and a presidential election, advertising profits remained soft, and the portfolio’s holdings among media stocks suffered as a result. Further dampening performance was a lack of meaningful exposure to the hotel and restaurant industry, which enjoyed a substantial rally over the year.
The portfolio remains positioned for anticipated growth in capital spending and a continued increase in company mergers. The managers remain focused on building a diversified portfolio, using a blend of valuation screens, fundamental research and risk analysis.
Gregory S. Adams Andrew Brudenell
Lead Portfolio Manager Portfolio Manager
| * | Not held in the portfolio at the end of the reporting period. |
All performance shown is historical, assumes reinvestment of all dividends and capital gains, and does not guarantee future results. Investment return and principal value fluctuate with changing market conditions so that, when redeemed, shares may be worth more or less then their original cost. Current performance may be lower or higher than the performance data quoted. Please visit scudder.com for the product’s most recent month-end performance. Performance doesn’t reflect charges and fees (“contract charges”) associated with the separate account that invests in the portfolio or any variable life insurance policy or variable annuity contract for which the portfolio is an investment option. These charges and fees will reduce returns.
Risk Considerations
The portfolio is subject to stock market risk, meaning stocks in the portfolio may decline in value for extended periods of time due to the activities and financial prospects of individual companies, or due to general market and economic conditions. Please read this portfolio’s prospectus for specific information regarding its investments and risk profile.
The Standard & Poor’s 500 (S&P 500) Index is a capitalization-weighted index of 500 stocks. The index is designed to measure performance of the broad domestic economy through changes in the aggregate market value of 500 stocks representing all major industries. Index returns assume the reinvestment of dividends and, unlike portfolio returns, do not reflect any fees or expenses. It is not possible to invest directly into an index.
Portfolio management market commentary is as of December 31, 2004, and may not come to pass. This information is subject to change at any time based on market and other conditions.
51
Portfolio Summary
Growth and Income Portfolio
| | | | | | |
Asset Allocation
| | 12/31/04
| | | 12/31/03
| |
Common Stocks | | 97 | % | | 97 | % |
Cash Equivalents | | 3 | % | | 3 | % |
| | |
|
| |
|
|
| | | 100 | % | | 100 | % |
| | |
|
| |
|
|
| | |
| Sector Diversification (Excludes Cash Equivalents) | | | | | | |
| | |
| | | 12/31/04
| | | 12/31/03
| |
Financials | | 18 | % | | 18 | % |
Information Technology | | 18 | % | | 20 | % |
Industrials | | 14 | % | | 13 | % |
Health Care | | 12 | % | | 14 | % |
Consumer Discretionary | | 11 | % | | 13 | % |
Consumer Staples | | 9 | % | | 8 | % |
Energy | | 8 | % | | 6 | % |
Materials | | 4 | % | | 2 | % |
Telecommunication Services | | 3 | % | | 4 | % |
Utilities | | 3 | % | | 2 | % |
| | |
|
| |
|
|
| | | 100 | % | | 100 | % |
| | |
|
| |
|
|
Asset allocation and sector diversification are subject to change.
For more complete details about the Portfolio’s investment portfolio, see page 53. A quarterly Fact Sheet is available upon request. Information concerning portfolio holdings of the Portfolio as of month-end will be posted to scudder.com on the 15th of the following month. Please call 1-800-778-1482.
Following the Portfolio’s fiscal first and third quarter-end, a complete portfolio holdings listing is filed with the SEC on Form N-Q. The form will be available on the SEC’s Web site at www.sec.gov, and it also may be reviewed and copied at the SEC’s Public Reference Room in Washington, D.C. Information on the operation of the SEC’s Public Reference Room may be obtained by calling (800) SEC-0330.
52
Investment Portfolio as of December 31, 2004
Growth and Income Portfolio
| | | | |
| | | Shares
| | Value ($)
|
Common Stocks 97.5% | | | | |
Consumer Discretionary 10.6% | | | | |
| | |
Hotels, Restaurants & Leisure 0.7% | | | | |
McDonald’s Corp. | | 45,000 | | 1,442,700 |
| | | | |
|
Media 5.2% | | | | |
Comcast Corp. “A”* | | 73,300 | | 2,407,172 |
Interpublic Group of Companies, Inc.* | | 104,600 | | 1,401,640 |
Time Warner, Inc.* | | 209,600 | | 4,074,624 |
Viacom, Inc. “B” | | 77,400 | | 2,816,586 |
| | | | |
|
| | | | | 10,700,022 |
| | | | |
|
Multiline Retail 2.0% | | | | |
Dollar General Corp. | | 64,500 | | 1,339,665 |
Target Corp. | | 53,200 | | 2,762,676 |
| | | | |
|
| | | | | 4,102,341 |
| | | | |
|
Specialty Retail 2.7% | | | | |
Sherwin-Williams Co. | | 48,400 | | 2,160,092 |
Staples, Inc. | | 48,300 | | 1,628,193 |
The Gap, Inc. | | 77,800 | | 1,643,136 |
| | | | |
|
| | | | | 5,431,421 |
| | | | |
|
Consumer Staples 8.3% | | | | |
| | |
Beverages 3.0% | | | | |
Anheuser-Busch Companies, Inc. | | 22,000 | | 1,116,060 |
Coca-Cola Co. | | 55,400 | | 2,306,302 |
PepsiCo, Inc. | | 53,400 | | 2,787,480 |
| | | | |
|
| | | | | 6,209,842 |
| | | | |
|
Food & Staples Retailing 1.8% | | | | |
Safeway, Inc.* | | 53,900 | | 1,063,986 |
Wal-Mart Stores, Inc. | | 49,200 | | 2,598,744 |
| | | | |
|
| | | | | 3,662,730 |
| | | | |
|
Food Products 1.6% | | | | |
General Mills, Inc. | | 30,900 | | 1,536,039 |
Hershey Foods Corp. | | 29,200 | | 1,621,768 |
| | | | |
|
| | | | | 3,157,807 |
| | | | |
|
Personal Products 0.9% | | | | |
Avon Products, Inc. | | 49,100 | | 1,900,170 |
| | | | |
|
Tobacco 1.0% | | | | |
Altria Group, Inc. | | 33,700 | | 2,059,070 |
| | | | |
|
Energy 7.7% | | | | |
| | |
Energy Equipment & Services 0.9% | | | | |
Baker Hughes, Inc. | | 43,400 | | 1,851,878 |
| | | | |
|
Oil & Gas 6.8% | | | | |
ChevronTexaco Corp. | | 49,500 | | 2,599,245 |
Devon Energy Corp. | | 40,200 | | 1,564,584 |
ExxonMobil Corp. | | 146,014 | | 7,484,678 |
Total SA (ADR) | | 20,090 | | 2,206,685 |
| | | | |
|
| | | | | 13,855,192 |
| | | | |
|
Financials 18.0% | | | | |
| | |
Banks 4.6% | | | | |
Bank of America Corp. | | 102,500 | | 4,816,475 |
US Bancorp. | | 54,600 | | 1,710,072 |
Wachovia Corp. | | 55,700 | | 2,929,820 |
| | | | �� |
|
| | | | | 9,456,367 |
| | | | |
|
Capital Markets 3.6% | | | | |
Lehman Brothers Holdings, Inc. | | 31,400 | | 2,746,872 |
Morgan Stanley | | 82,000 | | 4,552,640 |
| | | | |
|
| | | | | 7,299,512 |
| | | | |
|
Diversified Financial Services 5.9% | | | | |
CIT Group, Inc. | | 23,900 | | 1,095,098 |
Citigroup, Inc. | | 145,000 | | 6,986,100 |
Fannie Mae | | 20,700 | | 1,474,047 |
JPMorgan Chase & Co. | | 64,400 | | 2,512,244 |
| | | | |
|
| | | | | 12,067,489 |
| | | | |
|
Insurance 3.9% | | | | |
Ambac Financial Group, Inc. | | 21,100 | | 1,732,943 |
American International Group, Inc. | | 50,200 | | 3,296,634 |
Hartford Financial Services Group, Inc. | | 21,000 | | 1,455,510 |
MetLife, Inc. | | 37,800 | | 1,531,278 |
| | | | |
|
| | | | | 8,016,365 |
| | | | |
|
Health Care 11.7% | | | | |
| | |
Biotechnology 1.5% | | | | |
Amgen, Inc.* | | 49,400 | | 3,169,010 |
| | | | |
|
Health Care Equipment & Supplies 1.7% | | | | |
Biomet, Inc. | | 48,050 | | 2,084,889 |
Guidant Corp. | | 19,200 | | 1,384,320 |
| | | | |
|
| | | | | 3,469,209 |
| | | | |
|
Health Care Providers & Services 1.7% | | | | |
Caremark Rx, Inc.* | | 49,500 | | 1,951,785 |
WellPoint, Inc.* | | 12,700 | | 1,460,500 |
| | | | |
|
| | | | | 3,412,285 |
| | | | |
|
Pharmaceuticals 6.8% | | | | |
Allergan, Inc. | | 22,900 | | 1,856,503 |
Eli Lilly & Co. | | 22,000 | | 1,248,500 |
Johnson & Johnson | | 73,000 | | 4,629,660 |
Pfizer, Inc. | | 183,600 | | 4,937,004 |
Wyeth | | 28,900 | | 1,230,851 |
| | | | |
|
| | | | | 13,902,518 |
| | | | |
|
Industrials 13.7% | | | | |
| | |
Aerospace & Defense 3.6% | | | | |
Honeywell International, Inc. | | 81,600 | | 2,889,456 |
United Technologies Corp. | | 43,400 | | 4,485,390 |
| | | | |
|
| | | | | 7,374,846 |
| | | | |
|
Industrial Conglomerates 7.1% | | | | |
3M Co. | | 28,600 | | 2,347,202 |
General Electric Co. | | 238,500 | | 8,705,250 |
Tyco International Ltd. | | 94,400 | | 3,373,856 |
| | | | |
|
| | | | | 14,426,308 |
| | | | |
|
Machinery 3.0% | | | | |
Deere & Co. | | 33,800 | | 2,514,720 |
Parker-Hannifin Corp. | | 48,700 | | 3,688,538 |
| | | | |
|
| | | | | 6,203,258 |
| | | | |
|
53
| | | | | | |
| | | Shares
| | | Value ($)
| |
Information Technology 17.2% | | | | | | |
| | |
Communications Equipment 2.8% | | | | | | |
Cisco Systems, Inc.* | | 195,300 | | | 3,769,290 | |
Motorola, Inc. | | 109,800 | | | 1,888,560 | |
| | | | | |
|
|
| | | | | | 5,657,850 | |
| | | | | |
|
|
Computers & Peripherals 4.3% | | | | | | |
Dell, Inc.* | | 64,300 | | | 2,709,602 | |
EMC Corp.* | | 168,000 | | | 2,498,160 | |
International Business Machines Corp. | | 36,800 | | | 3,627,744 | |
| | | | | |
|
|
| | | | | | 8,835,506 | |
| | | | | |
|
|
Internet Software & Services 0.8% | | | | | | |
Yahoo!, Inc.* | | 44,400 | | | 1,672,992 | |
| | | | | |
|
|
IT Consulting & Services 0.9% | | | | | | |
Accenture Ltd. “A”* | | 65,900 | | | 1,779,300 | |
| | | | | |
|
|
Semiconductors & Semiconductor Equipment 2.2% | | | | | | |
Altera Corp.* | | 58,700 | | | 1,215,090 | |
Analog Devices, Inc. | | 31,600 | | | 1,166,672 | |
Texas Instruments, Inc. | | 85,500 | | | 2,105,010 | |
| | | | | |
|
|
| | | | | | 4,486,772 | |
| | | | | |
|
|
Software 6.2% | | | | | | |
Microsoft Corp. | | 276,600 | | | 7,387,986 | |
Oracle Corp.* | | 224,400 | | | 3,078,768 | |
Symantec Corp.* (c) | | 35,100 | | | 904,176 | |
VERITAS Software Corp.* | | 47,400 | | | 1,353,270 | |
| | | | | |
|
|
| | | | | | 12,724,200 | |
| | | | | |
|
|
Materials 4.0% | | | | | | |
| | |
Chemicals 2.1% | | | | | | |
E.I. du Pont de Nemours & Co. | | 34,800 | | | 1,706,940 | |
Monsanto Co. | | 49,400 | | | 2,744,170 | |
| | | | | |
|
|
| | | | | | 4,451,110 | |
| | | | | |
|
|
Metals & Mining 0.8% | | | | | | |
Alcoa, Inc. | | 51,200 | | | 1,608,704 | |
| | | | | |
|
|
Paper & Forest Products 1.1% | | | | | | |
Georgia-Pacific Corp. | | 59,300 | | | 2,222,564 | |
| | | | | |
|
|
Telecommunication Services 2.9% | | | | | | |
| | |
Diversified Telecommunication Services | | | | | | |
ALLTEL Corp. | | 25,500 | | | 1,498,380 | |
Sprint Corp. | | 72,600 | | | 1,804,110 | |
Verizon Communications, Inc. | | 67,672 | | | 2,741,393 | |
| | | | | |
|
|
| | | | | | 6,043,883 | |
| | | | | |
|
|
Utilities 3.4% | | | | | | |
| | |
Electric Utilities | | | | | | |
Entergy Corp. | | 14,800 | | | 1,000,332 | |
Exelon Corp. | | 72,800 | | | 3,208,296 | |
PG&E Corp.* | | 55,200 | | | 1,837,056 | |
TXU Corp. | | 15,500 | | | 1,000,680 | |
| | | | | |
|
|
| | | | | | 7,046,364 | |
| | | | | |
|
|
Total Common Stocks
(Cost $166,272,666) | | | | | 199,699,585 | |
| | | | | |
|
|
Cash Equivalents 3.5% | | | | | | |
Scudder Cash Management QP Trust, 2.24% (b) (Cost $7,131,937) | | 7,131,937 | | | 7,131,937 | |
| | | | | |
|
|
| | |
| | | % of Net Assets
| | | Value ($)
| |
Total Investment Portfolio
(Cost $173,404,603) (a) | | 101.0 | | | 206,831,522 | |
Other Assets and Liabilities, Net | | (1.0 | ) | | (2,087,106 | ) |
| | |
|
| |
|
|
Net Assets | | 100.0 | | | 204,744,416 | |
| | |
|
| |
|
|
| * | Non-income producing security. |
| (a) | The cost for federal income tax purposes was $175,275,234. At December 31, 2004, net unrealized appreciation for all securities based on tax cost was $31,556,288. This consisted of aggregate gross unrealized appreciation for all securities in which there was an excess of value over tax cost of $37,208,080 and aggregate gross unrealized depreciation for all securities in which there was an excess of tax cost over value of $5,651,792. |
| (b) | Scudder Cash Management QP Trust is managed by Deutsche Investment Management Americas Inc. The rate shown is the annualized seven-day yield at period end. |
| (c) | At December 31, 2004, this security has been segregated, in part or whole, to cover written options. |
| ADR: | American Depositary Receipts |
| | | | | | | | |
Covered Written Options
| | Contracts
| | Expiration Date
| | Strike Price ($)
| | Value ($)
|
Call Options | | | | | | | | |
| | | | |
Symantec Corp. | | 119 | | 1/22/2005 | | 35 | | 598 |
| | | | | | | | |
|
Total outstanding written options (Premiums received $9,684) | | | | | | | | 598 |
| | | | | | | | |
|
For the year ended December 31, 2004, transactions for written options were as follows for the Growth and Income Portfolio:
| | | | |
| | | Contract Amounts
| | Premium ($)
|
Beginning of period | | — | | — |
Written | | 119 | | 9,684 |
Closed | | — | | — |
Expired | | — | | — |
| | |
| |
|
End of period | | 119 | | 9,684 |
| | |
| |
|
Purchases and sales of investment securities (excluding short-term investments) for the year ended December 31, 2004, aggregated $66,302,161 and $59,631,263, respectively.
At December 31, 2004, the Growth and Income Portfolio had a net tax basis capital loss carryforward of approximately $35,930,000 which may be applied against any realized net taxable capital gains of each succeeding year until fully utilized or until December 31, 2009 ($6,650,000), December 31, 2010 ($22,250,000) and December 31, 2011 ($7,030,000), the respective expiration dates, whichever occurs first.
The accompanying notes are an integral part of the financial statements.
54
Financial Statements
Growth and Income Portfolio
Statement of Assets and Liabilities as of December 31, 2004
| | | | |
Assets | | | | |
Investments: | | | | |
| |
Investments in securities, at value (cost $166,272,666) | | $ | 199,699,585 | |
Investment in Scudder Cash Management QP Trust (cost $7,131,937) | | | 7,131,937 | |
| | |
|
|
|
Total investments in securities, at value
(cost $173,404,603) | | | 206,831,522 | |
| | |
|
|
|
Receivable for investments sold | | | 9,343 | |
Receivable for Portfolio shares sold | | | 511,646 | |
Dividends receivable | | | 167,786 | |
Interest receivable | | | 9,570 | |
Foreign taxes recoverable | | | 13,302 | |
Other assets | | | 9,422 | |
| | |
|
|
|
Total assets | | | 207,552,591 | |
| | |
|
|
|
Liabilities | | | | |
Due to custodian bank | | | 14,064 | |
Payable for investments purchased | | | 2,524,791 | |
Payable for Portfolio shares redeemed | | | 110,917 | |
Written options, at value (premiums received $9,684) | | | 598 | |
Accrued management fee | | | 84,449 | |
Other accrued expenses and payables | | | 73,356 | |
| | |
|
|
|
Total liabilities | | | 2,808,175 | |
| | |
|
|
|
Net assets, at value | | $ | 204,744,416 | |
| | |
|
|
|
Net Assets | | | | |
Net assets consist of: | | | | |
| |
Undistributed net investment income | | | 2,360,421 | |
Net unrealized appreciation (depreciation) on: | | | | |
Investments | | | 33,426,919 | |
Written options | | | 9,086 | |
Accumulated net realized gain (loss) | | | (37,797,191 | ) |
Paid-in capital | | | 206,745,181 | |
| | |
|
|
|
Net assets, at value | | $ | 204,744,416 | |
| | |
|
|
|
Class A | | | | |
| Net Asset Value, offering and redemption price per share ($171,673,086 ÷ 18,483,989 outstanding shares of beneficial interest, no par value, unlimited number of shares authorized) | | $ | 9.29 | |
Class B | | | | |
| |
| Net Asset Value, offering and redemption price per share ($33,071,330 ÷ 3,576,021 outstanding shares of beneficial interest, no par value, unlimited number of shares authorized) | | $ | 9.25 | |
55
| | | | |
| |
Statement of Operations for the year ended December 31, 2004 | | | | |
| |
Investment Income | | | | |
Income: | | | | |
| |
Dividends (net of foreign taxes withheld of $19,209) | | $ | 3,479,761 | |
Interest — Scudder Cash Management QP Trust | | | 61,489 | |
Securities lending income, including income from Daily Assets Fund Institutional | | | 7,768 | |
| | |
|
|
|
Total Income | | | 3,549,018 | |
| | |
|
|
|
Expenses: | | | | |
| |
Management fee | | | 870,770 | |
Custodian fees | | | 12,629 | |
Accounting fees | | | 66,951 | |
Distribution service fees (Class B) | | | 61,944 | |
Record keeping fees (Class B) | | | 20,075 | |
Auditing | | | 29,978 | |
Legal | | | 11,473 | |
Trustees’ fees and expenses | | | 8,557 | |
Reports to shareholders | | | 20,574 | |
Other | | | 9,536 | |
| | |
|
|
|
Total expenses, before expense reductions | | | 1,112,487 | |
Expense reductions | | | (2,403 | ) |
| | |
|
|
|
Total expenses, after expense reductions | | | 1,110,084 | |
| | |
|
|
|
Net investment income (loss) | | | 2,438,934 | |
| | |
|
|
|
| |
| Realized and Unrealized Gain (Loss) on Investment Transactions | | | | |
| |
Net realized gain (loss) from investments | | | 6,835,797 | |
Net unrealized appreciation (depreciation) during the period on: | | | | |
Investments | | | 8,942,547 | |
Written options | | | 9,086 | |
| | |
|
|
|
| | | | 8,951,633 | |
| | |
|
|
|
Net gain (loss) on investment transactions | | | 15,787,430 | |
| | |
|
|
|
Net increase (decrease) in net assets resulting from operations | | $ | 18,226,364 | |
| | |
|
|
|
The accompanying notes are an integral part of the financial statements.
56
Statement of Changes in Net Assets
| | | | | | | | |
| | | Years Ended December 31,
| |
Increase (Decrease) in Net Assets
| | 2004
| | | 2003
| |
Operations: | | | | | | | | |
| | |
Net investment income (loss) | | $ | 2,438,934 | | | $ | 1,355,887 | |
Net realized gain (loss) on investment transactions | | | 6,835,797 | | | | (2,190,678 | ) |
Net unrealized appreciation (depreciation) on investment transactions during the period | | | 8,951,633 | | | | 37,960,524 | |
| | |
|
|
| |
|
|
|
Net increase (decrease) in net assets resulting from operations | | | 18,226,364 | | | | 37,125,733 | |
| | |
|
|
| |
|
|
|
Distributions to shareholders from: | | | | | | | | |
| | |
Net investment income: | | | | | | | | |
| | |
Class A | | | (1,239,211 | ) | | | (1,476,002 | ) |
Class B | | | (112,919 | ) | | | (71,436 | ) |
| | |
Portfolio share transactions: | | | | | | | | |
| | |
Class A | | | | | | | | |
| | |
Proceeds from shares sold | | | 22,740,822 | | | | 16,861,930 | |
Reinvestment of distributions | | | 1,239,211 | | | | 1,476,002 | |
Cost of shares redeemed | | | (27,224,855 | ) | | | (25,120,246 | ) |
| | |
|
|
| |
|
|
|
Net increase (decrease) in net assets from Class A share transactions | | | (3,244,822 | ) | | | (6,782,314 | ) |
| | |
|
|
| |
|
|
|
Class B | | | | | | | | |
| | |
Proceeds from shares sold | | | 16,908,894 | | | | 9,818,320 | |
Reinvestment of distributions | | | 112,919 | | | | 71,436 | |
Cost of shares redeemed | | | (4,470,402 | ) | | | (1,439,484 | ) |
| | |
|
|
| |
|
|
|
Net increase (decrease) in net assets from Class B share transactions | | | 12,551,411 | | | | 8,450,272 | |
| | |
|
|
| |
|
|
|
Increase (decrease) in net assets | | | 26,180,823 | | | | 37,246,253 | |
Net assets at beginning of period | | | 178,563,593 | | | | 141,317,340 | |
| | |
|
|
| |
|
|
|
Net assets at end of period (including undistributed net investment income of $2,360,421 and $1,273,616, respectively) | | $ | 204,744,416 | | | $ | 178,563,593 | |
| | |
|
|
| |
|
|
|
Other Information | | | | | | | | |
Class A | | | | | | | | |
| | |
Shares outstanding at beginning of period | | | 18,896,518 | | | | 19,882,920 | |
Shares sold | | | 2,601,316 | | | | 2,314,339 | |
Shares issued to shareholders in reinvestment of distributions | | | 146,478 | | | | 208,181 | |
Shares redeemed | | | (3,160,323 | ) | | | (3,508,922 | ) |
Net increase (decrease) in Portfolio shares | | | (412,529 | ) | | | (986,402 | ) |
| | |
|
|
| |
|
|
|
Shares outstanding at end of period | | | 18,483,989 | | | | 18,896,518 | |
| | |
|
|
| |
|
|
|
Class B | | | | | | | | |
| | |
Shares outstanding at beginning of period | | | 2,114,110 | | | | 990,738 | |
Shares sold | | | 1,958,270 | | | | 1,308,947 | |
Shares issued to shareholders in reinvestment of distributions | | | 13,379 | | | | 10,104 | |
Shares redeemed | | | (509,738 | ) | | | (195,679 | ) |
| | |
|
|
| |
|
|
|
Net increase (decrease) in Portfolio shares | | | 1,461,911 | | | | 1,123,372 | |
| | |
|
|
| |
|
|
|
Shares outstanding at end of period | | | 3,576,021 | | | | 2,114,110 | |
| | |
|
|
| |
|
|
|
The accompanying notes are an integral part of the financial statements.
57
Financial Highlights
Growth and Income Portfolio
Class A
| | | | | | | | | | | | | | | | | | | | |
Years Ended December 31,
| | 2004
| | | 2003
| | | 2002
| | | 2001
| | | 2000
| |
Selected Per Share Data | | | | | | | | | | | | | | | | | | | | |
| | | | | |
Net asset value, beginning of period | | $ | 8.50 | | | $ | 6.77 | | | $ | 8.90 | | | $ | 10.38 | | | $ | 10.96 | |
| | |
|
|
| |
|
|
| |
|
|
| |
|
|
| |
|
|
|
| Income (loss) from investment operations: | | | | | | | | | | | | | | | | | | | | |
| | | | | |
Net investment incomea | | | .12 | | | | .07 | | | | .07 | | | | .09 | | | | .11 | |
Net realized and unrealized gain (loss) on investment transactions | | | .74 | | | | 1.74 | | | | (2.12 | ) | | | (1.23 | ) | | | (.33 | ) |
| | |
|
|
| |
|
|
| |
|
|
| |
|
|
| |
|
|
|
Total from investment operations | | | .86 | | | | 1.81 | | | | (2.05 | ) | | | (1.14 | ) | | | (.22 | ) |
| | |
|
|
| |
|
|
| |
|
|
| |
|
|
| |
|
|
|
Less distributions from: | | | | | | | | | | | | | | | | | | | | |
| | | | | |
Net investment income | | | (.07 | ) | | | (.08 | ) | | | (.08 | ) | | | (.12 | ) | | | (.15 | ) |
Net realized gains on investment transactions | | | — | | | | — | | | | — | | | | (.22 | ) | | | (.21 | ) |
| | |
|
|
| |
|
|
| |
|
|
| |
|
|
| |
|
|
|
Total distributions | | | (.07 | ) | | | (.08 | ) | | | (.08 | ) | | | (.34 | ) | | | (.36 | ) |
| | |
|
|
| |
|
|
| |
|
|
| |
|
|
| |
|
|
|
Net asset value, end of period | | $ | 9.29 | | | $ | 8.50 | | | $ | 6.77 | | | $ | 8.90 | | | $ | 10.38 | |
| | |
|
|
| |
|
|
| |
|
|
| |
|
|
| |
|
|
|
Total Return (%) | | | 10.16 | | | | 26.74 | | | | (23.13 | ) | | | (11.30 | ) | | | (2.10 | ) |
| | |
|
|
| |
|
|
| |
|
|
| |
|
|
| |
|
|
|
Ratios to Average Net Assets and Supplemental Data | | | | | | | | | | | | | | | | | | | | |
| | | | | |
Net assets, end of period ($ millions) | | | 172 | | | | 161 | | | | 135 | | | | 185 | | | | 185 | |
Ratio of expenses before expense reductions (%) | | | .56 | | | | .59 | | | | .57 | | | | .57 | b | | | .56 | |
Ratio of expenses after expense reductions (%) | | | .56 | | | | .59 | | | | .57 | | | | .56 | b | | | .56 | |
Ratio of net investment income (loss) (%) | | | 1.37 | | | | .91 | | | | .92 | | | | .94 | | | | 1.06 | |
Portfolio turnover rate (%) | | | 33 | | | | 37 | | | | 66 | | | | 67 | | | | 65 | |
| | | | | |
Class B | | | | | | | | | | | | | | | | | | | | |
| | | | | |
Years Ended December 31,
| | 2004
| | | 2003
| | | 2002
| | | 2001
| | | 2000
| |
Selected Per Share Data | | | | | | | | | | | | | | | | | | | | |
| | | | | |
Net asset value, beginning of period | | $ | 8.47 | | | $ | 6.75 | | | $ | 8.87 | | | $ | 10.35 | | | $ | 10.93 | |
| | |
|
|
| |
|
|
| |
|
|
| |
|
|
| |
|
|
|
Income (loss) from investment operations: | | | | | | | | | | | | | | | | | | | | |
| | | | | |
Net investment incomea | | | .09 | | | | .05 | | | | .05 | | | | .06 | | | | .09 | |
Net realized and unrealized gain (loss) on investment transactions | | | .73 | | | | 1.73 | | | | (2.12 | ) | | | (1.23 | ) | | | (.33 | ) |
| | |
|
|
| |
|
|
| |
|
|
| |
|
|
| |
|
|
|
Total from investment operations | | | .82 | | | | 1.78 | | | | (2.07 | ) | | | (1.17 | ) | | | (.24 | ) |
| | |
|
|
| |
|
|
| |
|
|
| |
|
|
| |
|
|
|
Less distributions from: | | | | | | | | | | | | | | | | | | | | |
| | | | | |
Net investment income | | | (.04 | ) | | | (.06 | ) | | | (.05 | ) | | | (.09 | ) | | | (.13 | ) |
Net realized gains on investment transactions | | | — | | | | — | | | | — | | | | (.22 | ) | | | (.21 | ) |
| | |
|
|
| |
|
|
| |
|
|
| |
|
|
| |
|
|
|
Total distributions | | | (.04 | ) | | | (.06 | ) | | | (.05 | ) | | | (.31 | ) | | | (.34 | ) |
| | |
|
|
| |
|
|
| |
|
|
| |
|
|
| |
|
|
|
Net asset value, end of period | | $ | 9.25 | | | $ | 8.47 | | | $ | 6.75 | | | $ | 8.87 | | | $ | 10.35 | |
| | |
|
|
| |
|
|
| |
|
|
| |
|
|
| |
|
|
|
Total Return (%) | | | 9.78 | | | | 26.55 | | | | (23.40 | ) | | | (11.56 | ) | | | (2.33 | ) |
| | |
|
|
| |
|
|
| |
|
|
| |
|
|
| |
|
|
|
Ratios to Average Net Assets and Supplemental Data | | | | | | | | | | | | | | | | | | | | |
| | | | | |
Net assets, end of period ($ millions) | | | 33 | | | | 18 | | | | 7 | | | | 10 | | | | 13 | |
Ratio of expenses before expense reductions (%) | | | .89 | | | | .85 | | | | .82 | | | | .82 | b | | | .81 | |
Ratio of expenses after expense reductions (%) | | | .89 | | | | .85 | | | | .82 | | | | .81 | b | | | .81 | |
Ratio of net investment income (loss) (%) | | | 1.04 | | | | .65 | | | | .67 | | | | .69 | | | | .81 | |
Portfolio turnover rate (%) | | | 33 | | | | 37 | | | | 66 | | | | 67 | | | | 65 | |
| a | Based on average shares outstanding during the period. |
| b | The ratios of operating expenses excluding costs incurred in connection with a fund complex reorganization before and after expense reductions were .56% and .56%,and .81% and .81% for Class A and Class B, respectively. |
The accompanying notes are an integral part of the financial statements.
58
Performance Summary December 31, 2004
Capital Growth Portfolio
All performance shown is historical, assumes reinvestment of all dividends and capital gains, and does not guarantee future results. Investment return and principal value fluctuate with changing market conditions so that, when redeemed, shares may be worth more or less then their original cost. Current performance may be lower or higher than the performance data quoted. Please visit scudder.com for the product’s most recent month-end performance. Performance doesn’t reflect charges and fees (“contract charges”) associated with the separate account that invests in the portfolio or any variable life insurance policy or variable annuity contract for which the portfolio is an investment option. These charges and fees will reduce returns.
The Portfolio is subject to stock market risk, meaning stocks in the Portfolio may decline in value for extended periods of time due to the activities and financial prospects of individual companies, or due to general market and economic conditions. Please read this Portfolio’s prospectus for specific details regarding its investments and risk profile.
| | |
Growth of an Assumed $10,000 Investment |
¨ Capital Growth Portfolio — Class A ¨ S&P 500 Index ¨ Russell 1000 Growth Index | | The Standard & Poor’s (S&P) 500 Index is a capitalization-weighted index of 500 stocks. The index is designed to measure performance of the broad domestic economy through changes in the aggregate market value of 500 stocks representing all major industries. The Russell 1000 Growth Index is an unmanaged capitalization- weighted index containing those securities in the Russell 1000 Index with higher price-to-book ratios and higher forecasted growth values. Index returns assume the reinvestment of dividends and, unlike Portfolio returns, do not reflect any fees or expenses. It is not possible to invest directly into an index. |
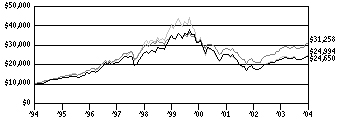
Yearly periods ended
Comparative Results (as of December 31, 2004)
| | | | | | | | | | | | | | | | |
Capital Growth Portfolio
| | 1-Year
| | | 3-Year
| | | 5-Year
| | | 10-Year
| |
Class A | | | | | | | | | | | | | | | | |
Growth of $10,000 | | $ | 10,799 | | | $ | 9,703 | | | $ | 7,050 | | | $ | 24,650 | |
Average annual total return | | | 7.99 | % | | | -1.00 | % | | | -6.75 | % | | | 9.44 | % |
| | | | |
S&P 500 Index | | | | | | | | | | | | | | | | |
Growth of $10,000 | | $ | 11,088 | | | $ | 11,115 | | | $ | 8,902 | | | $ | 31,258 | |
Average annual total return | | | 10.88 | % | | | 3.59 | % | | | -2.30 | % | | | 12.07 | % |
| | | | |
Russell 1000 Growth Index | | | | | | | | | | | | | | | | |
Growth of $10,000 | | $ | 10,630 | | | $ | 9,946 | | | $ | 6,140 | | | $ | 24,994 | |
Average annual total return | | | 6.30 | % | | | -.18 | % | | | -9.29 | % | | | 9.59 | % |
| | | | |
Capital Growth Portfolio
| | 1-Year
| | | 3-Year
| | | 5-Year
| | | Life of Class*
| |
Class B | | | | | | | | | | | | | | | | |
Growth of $10,000 | | $ | 10,756 | | | $ | 9,611 | | | $ | 6,941 | | | $ | 13,580 | |
Average annual total return | | | 7.56 | % | | | -1.31 | % | | | -7.04 | % | | | 4.09 | % |
| | | | |
S&P 500 Index | | | | | | | | | | | | | | | | |
Growth of $10,000 | | $ | 11,088 | | | $ | 11,115 | | | $ | 8,902 | | | $ | 16,007 | |
Average annual total return | | | 10.88 | % | | | 3.59 | % | | | -2.30 | % | | | 6.40 | % |
| | | | |
Russell 1000 Growth Index | | | | | | | | | | | | | | | | |
Growth of $10,000 | | $ | 10,630 | | | $ | 9,946 | | | $ | 6,140 | | | $ | 12,874 | |
Average annual total return | | | 6.30 | % | | | -.18 | % | | | -9.29 | % | | | 3.39 | % |
The growth of $10,000 is cumulative.
| * | The Portfolio commenced selling Class B shares on May 12, 1997. Index returns begin May 31, 1997. |
59
Information About Your Portfolio’s Expenses
Capital Growth Portfolio
As an investor of the Portfolio, you incur two types of costs: ongoing expenses and transaction costs. Ongoing expenses include management fees, distribution and service (12b-1) fees and other Portfolio expenses. Examples of transaction costs include sales charges (loads), redemption fees and account maintenance fees, which are not shown in this section. The following tables are intended to help you understand your ongoing expenses (in dollars) of investing in the Portfolio and to help you compare these expenses with the ongoing expenses of investing in other mutual funds. The tables are based on an investment of $1,000 made at the beginning of the six-month period ended December 31, 2004.
The tables illustrate your Portfolio’s expenses in two ways:
Actual Portfolio Return. This helps you estimate the actual dollar amount of ongoing expenses (but not transaction costs) paid on a $1,000 investment in the Portfolio using the Portfolio’s actual return during the period. To estimate the expenses you paid over the period, simply divide your account value by $1,000 (for example, an $8,600 account value divided by $1,000 = 8.6), then multiply the result by the number in the “Expenses Paid per $1,000” line under the share class you hold.
Hypothetical 5% Portfolio Return. This helps you to compare your Portfolio’s ongoing expenses (but not transaction costs) with those of other mutual funds using the Portfolio’s actual expense ratio and a hypothetical rate of return of 5% per year before expenses. Examples using a 5% hypothetical portfolio return may be found in the shareholder reports of other mutual funds. The hypothetical account values and expenses may not be used to estimate the actual ending account balance or expenses you paid for the period.
Please note that the expenses shown in these tables are meant to highlight your ongoing expenses only and do not reflect any transaction costs. The “Expenses Paid per $1,000” line of the tables is useful in comparing ongoing expenses only and will not help you determine the relative total expense of owning different funds. If these transaction costs had been included, your costs would have been higher.
Expenses and Value of a $1,000 Investment for the six months ended December 31, 2004
| | | | | | |
| | | Class A
| | Class B
|
Actual Portfolio Return | | | | | | |
Beginning Account Value 7/1/04 | | $ | 1,000.00 | | $ | 1,000.00 |
Ending Account Value 12/31/04 | | $ | 1,042.60 | | $ | 1,040.70 |
Expenses Paid per $1,000* | | $ | 2.62 | | $ | 4.53 |
| | |
| | | Class A
| | Class B
|
Hypothetical 5% Portfolio Return | | | | | | |
Beginning Account Value 7/1/04 | | $ | 1,000.00 | | $ | 1,000.00 |
Ending Account Value 12/31/04 | | $ | 1,022.64 | | $ | 1,020.76 |
Expenses Paid per $1,000* | | $ | 2.59 | | $ | 4.49 |
| * | Expenses are equal to the Portfolio’s annualized expense ratio for each share class, multiplied by the average account value over the period, multiplied by the number of days in the most recent six-month period, then divided by 365. |
| | | | | | |
| | | Class A
| | | Class B
| |
| Annualized Expense Ratios | | | | | | |
Scudder Variable Series I — Capital Growth Portfolio | | .51 | % | | .88 | % |
For more information, please refer to the Portfolio’s prospectus.
60
Management Summary December 31, 2004
Capital Growth Portfolio
Large-cap equities gained ground in 2004, as strong earnings results outweighed the various concerns that periodically rattled the market. The growth style lagged value by a substantial margin, due largely to the underperformance of the health care and technology sectors. In this environment, the portfolio returned 7.99% (Class A shares, unadjusted for contract charges), trailing the 10.88% return of the Standard & Poor’s 500 (S&P 500) index but outperforming the 6.30% return of the Russell 1000 Growth Index.
An overweight to the strong-performing energy sector was a distinct positive. We believe attractive long-term growth opportunities exist in the industry, particularly in the equipment and service area, independent of movements in the price of crude oil. Performance also was helped significantly by our selection within health care, where we emphasized biotechnology and medical equipment companies and held a corresponding underweight in the underperforming pharmaceuticals industry.
Poor stock selection within information technology was the largest detractor. Our positioning within technology emphasized consistent earners over more cyclical companies, given our view that industry profit growth is likely to slow. Selection within financials, where the portfolio is underweight in insurance and overweight in market-sensitive companies, also detracted.
Believing higher-quality growth companies are positioned for further outperformance versus lower-quality names, we remain dedicated to building a diversified, high-quality portfolio. In addition, we believe we can add significant value over the long-term by continuing to look for growth opportunities in nontraditional growth sectors, such as consumer staples.
Julie M. Van Cleave
Jack A. Zehner
Thomas J. Schmid
Portfolio Managers
All performance shown is historical, assumes reinvestment of all dividends and capital gains, and does not guarantee future results. Investment return and principal value fluctuate with changing market conditions so that, when redeemed, shares may be worth more or less then their original cost. Current performance may be lower or higher than the performance data quoted. Please visit scudder.com for the product’s most recent month-end performance. Performance doesn’t reflect charges and fees (“contract charges”) associated with the separate account that invests in the portfolio or any variable life insurance policy or variable annuity contract for which the portfolio is an investment option. These charges and fees will reduce returns.
Risk Considerations
The portfolio is subject to stock market risk, meaning stocks in the portfolio may decline in value for extended periods of time due to the activities and financial prospects of individual companies, or due to general market and economic conditions. Please read this portfolio’s prospectus for specific information regarding its investments and risk profile.
The Standard & Poor’s 500 (S&P 500) index is a capitalization-weighted index of 500 stocks. The index is designed to measure performance of the broad domestic economy through changes in the aggregate market value of 500 stocks representing all major industries.
The Russell 1000 Growth Index is an unmanaged, capitalization-weighted index containing those securities in the Russell 1000 Index with higher price-to-book ratios and higher forecasted growth values.
Index returns assume reinvestment of all distributions and do not reflect fees or expenses. It is not possible to invest directly in an index.
Portfolio management market commentary is as of December 31, 2004, and may not come to pass. This information is subject to change at any time based on market and other conditions.
61
Portfolio Summary
Capital Growth Portfolio
Asset Allocation (Excludes Securities Lending Collateral)
| | | | | | |
| | | 12/31/04
| | | 12/31/03
| |
Common Stocks | | 97 | % | | 97 | % |
Cash Equivalents | | 2 | % | | 3 | % |
Exchange Traded Fund | | 1 | % | | — | |
| | |
|
| |
|
|
| | | 100 | % | | 100 | % |
| | |
|
| |
|
|
| | |
| Sector Diversification (Excludes Cash Equivalents and Securities Lending Collateral) | | | | | | |
| | | 12/31/04
| | | 12/31/03
| |
Information Technology | | 23 | % | | 25 | % |
Health Care | | 21 | % | | 21 | % |
Consumer Discretionary | | 16 | % | | 16 | % |
Consumer Staples | | 11 | % | | 11 | % |
Energy | | 10 | % | | 7 | % |
Financials | | 9 | % | | 11 | % |
Industrials | | 8 | % | | 7 | % |
Telecommunication Services | | 1 | % | | 1 | % |
Materials | | 1 | % | | 1 | % |
| | |
|
| |
|
|
| | | 100 | % | | 100 | % |
| | |
|
| |
|
|
Asset allocation and sector diversification are subject to change.
For more complete details about the Portfolio's investment portfolio, see page 64. A quarterly Fact Sheet is available upon request. Information concerning portfolio holdings of the Portfolio as of month-end will be posted to scudder.com on the 15th of the following month. Please call 1-800-778-1482.
Following the Portfolio's fiscal first and third quarter-end, a complete portfolio holdings listing is filed with the SEC on Form N-Q. The form will be available on the SEC's Web site at www.sec.gov, and it also may be reviewed and copied at the SEC's Public Reference Room in Washington, D.C. Information on the operation of the SEC's Public Reference Room may be obtained by calling (800) SEC-0330.
62
Investment Portfolio as of December 31, 2004
Capital Growth Portfolio
| | | | |
| | | Shares
| | Value ($)
|
Common Stocks 97.6% | | | | |
| | |
Consumer Discretionary 15.2% | | | | |
| | |
Automobiles 1.6% | | | | |
Harley-Davidson, Inc. | | 186,200 | | 11,311,650 |
| | | | |
|
Hotels Restaurants & Leisure 2.2% | | | | |
International Game Technology | | 229,800 | | 7,900,524 |
YUM! Brands, Inc. | | 167,000 | | 7,879,060 |
| | | | |
|
| | | | | 15,779,584 |
| | | | |
|
Household Durables 0.3% | | | | |
Fortune Brands, Inc. | | 31,400 | | 2,423,452 |
| | | | |
|
Internet & Catalog Retail 1.2% | | | | |
eBay, Inc.* | | 73,100 | | 8,500,068 |
| | | | |
|
Media 4.4% | | | | |
Comcast Corp. “A”* | | 195,700 | | 6,426,788 |
McGraw-Hill Companies, Inc. | | 100,500 | | 9,199,770 |
Omnicom Group, Inc. | | 117,700 | | 9,924,464 |
Viacom, Inc. “B” | | 169,800 | | 6,179,022 |
| | | | |
|
| | | | | 31,730,044 |
| | | | |
|
Multiline Retail 2.6% | | | | |
Kohl’s Corp.* | | 66,900 | | 3,289,473 |
Target Corp. | | 298,700 | | 15,511,491 |
| | | | |
|
| | | | | 18,800,964 |
| | | | |
|
Specialty Retail 2.9% | | | | |
Bed Bath & Beyond, Inc.* | | 113,600 | | 4,524,688 |
Home Depot, Inc. | | 48,250 | | 2,062,205 |
Lowe’s Companies, Inc. | | 104,200 | | 6,000,878 |
Staples, Inc. | | 246,000 | | 8,292,660 |
| | | | |
|
| | | | | 20,880,431 |
| | | | |
|
Consumer Staples 11.0% | | | | |
| | |
Beverages 2.0% | | | | |
PepsiCo, Inc. | | 283,000 | | 14,772,600 |
| | | | |
|
Food & Staples Retailing 3.9% | | | | |
Wal-Mart Stores, Inc. | | 385,100 | | 20,340,982 |
Walgreen Co. | | 203,600 | | 7,812,132 |
| | | | |
|
| | | | | 28,153,114 |
| | | | |
|
Food Products 1.8% | | | | |
Dean Foods Co.* | | 54,700 | | 1,802,365 |
Hershey Foods Corp. | | 93,400 | | 5,187,436 |
Kellogg Co. | | 126,000 | | 5,627,160 |
| | | | |
|
| | | | | 12,616,961 |
| | | | |
|
Household Products 3.3% | | | | |
Colgate-Palmolive Co. | | 110,800 | | 5,668,528 |
Kimberly-Clark Corp. | | 53,700 | | 3,533,997 |
Procter & Gamble Co. | | 268,200 | | 14,772,456 |
| | | | |
|
| | | | | 23,974,981 |
| | | | |
|
Energy 10.0% | | | | |
Energy Equipment & Services 4.7% | | | | |
Baker Hughes, Inc. | | 188,100 | | 8,026,227 |
Nabors Industries Ltd.* | | 158,300 | | 8,119,207 |
63
| | | | |
| | | Shares
| | Value ($)
|
Schlumberger Ltd. | | 203,000 | | 13,590,850 |
Transocean, Inc.* | | 93,300 | | 3,954,987 |
| | | | |
|
| | | | | 33,691,271 |
| | | | |
|
Oil & Gas 5.3% | | | | |
ConocoPhillips | | 119,400 | | 10,367,502 |
Devon Energy Corp. | | 244,400 | | 9,512,048 |
EOG Resources, Inc. | | 262,300 | | 18,717,728 |
| | | | |
|
| | | | | 38,597,278 |
| | | | |
|
Financials 8.3% | | | | |
| | |
Banks 1.3% | | | | |
Bank of America Corp. | | 200,800 | | 9,435,592 |
| | | | |
|
Capital Markets 2.0% | | | | |
Goldman Sachs Group, Inc. | | 34,700 | | 3,610,188 |
Lehman Brothers Holdings, Inc. | | 45,000 | | 3,936,600 |
Morgan Stanley | | 122,300 | | 6,790,096 |
| | | | |
|
| | | | | 14,336,884 |
| | | | |
|
Consumer Finance 1.5% | | | | |
American Express Co. | | 189,400 | | 10,676,478 |
| | | | |
|
Diversified Financial Services 1.6% | | | | |
Citigroup, Inc. | | 247,333 | | 11,916,504 |
| | | | |
|
Insurance 1.9% | | | | |
AFLAC, Inc. | | 171,600 | | 6,836,544 |
American International Group, Inc. | | 105,702 | | 6,941,450 |
| | | | |
|
| | | | | 13,777,994 |
| | | | |
|
Health Care 20.9% | | | | |
| | |
Biotechnology 5.1% | | | | |
Amgen, Inc.* | | 60,900 | | 3,906,735 |
Biogen Idec, Inc.* | | 107,400 | | 7,153,914 |
Genentech, Inc.* (c) | | 303,900 | | 16,544,316 |
Gilead Sciences, Inc.* | | 254,400 | | 8,901,456 |
| | | | |
|
| | | | | 36,506,421 |
| | | | |
|
Health Care Equipment & Supplies 5.6% | | | | |
Baxter International, Inc. | | 173,800 | | 6,003,052 |
Boston Scientific Corp.* | | 189,800 | | 6,747,390 |
C.R. Bard, Inc. | | 75,200 | | 4,811,296 |
Hospira, Inc.* | | 27,540 | | 922,590 |
Medtronic, Inc. | | 189,300 | | 9,402,531 |
Zimmer Holdings, Inc.* | | 156,690 | | 12,554,003 |
| | | | |
|
| | | | | 40,440,862 |
| | | | |
|
Health Care Providers & Services 2.4% | | | | |
UnitedHealth Group, Inc. | | 196,700 | | 17,315,501 |
| | | | |
|
Pharmaceuticals 7.8% | | | | |
Abbott Laboratories | | 275,400 | | 12,847,410 |
Eli Lilly & Co. | | 89,800 | | 5,096,150 |
Johnson & Johnson | | 398,600 | | 25,279,212 |
Pfizer, Inc. | | 498,675 | | 13,409,371 |
| | | | |
|
| | | | | 56,632,143 |
| | | | |
|
Industrials 8.3% | | | | |
| | |
Aerospace & Defense 2.1% | | | | |
United Technologies Corp. | | 146,400 | | 15,130,440 |
| | | | |
|
64
| | | | |
| | | Shares
| | Value ($)
|
Air Freight & Logistics 1.3% | | | | |
FedEx Corp. | | 93,700 | | 9,228,513 |
| | | | |
|
Industrial Conglomerates 4.3% | | | | |
3M Co. | | 73,000 | | 5,991,110 |
General Electric Co. | | 688,100 | | 25,115,650 |
| | | | |
|
| | | | | 31,106,760 |
| | | | |
|
Machinery 0.6% | | | | |
Caterpillar, Inc. | | 43,100 | | 4,202,681 |
| | | | |
|
Information Technology 22.3% | | | | |
| | |
Communications Equipment 3.3% | | | | |
Cisco Systems, Inc.* | | 648,300 | | 12,512,190 |
QUALCOMM, Inc. | | 258,700 | | 10,968,880 |
| | | | |
|
| | | | | 23,481,070 |
| | | | |
|
Computers & Peripherals 4.5% | | | | |
Dell, Inc.* | | 153,500 | | 6,468,490 |
EMC Corp.* | | 868,100 | | 12,908,647 |
International Business Machines Corp. | | 134,900 | | 13,298,442 |
| | | | |
|
| | | | | 32,675,579 |
| | | | |
|
IT Consulting & Services 2.7% | | | | |
Accenture Ltd. “A”* | | 252,000 | | 6,804,000 |
Fiserv, Inc.* | | 234,400 | | 9,420,536 |
Paychex, Inc. | | 97,200 | | 3,312,576 |
| | | | |
|
| | | | | 19,537,112 |
| | | | |
|
Semiconductors & Semiconductor Equipment 3.7% | | | | |
Intel Corp. | | 617,200 | | 14,436,308 |
Linear Technology Corp. | | 207,100 | | 8,027,196 |
Texas Instruments, Inc. | | 169,200 | | 4,165,704 |
| | | | |
|
| | | | | 26,629,208 |
| | | | |
|
Software 8.1% | | | | |
Adobe Systems, Inc. | | 36,000 | | 2,258,640 |
Electronic Arts, Inc.* (c) | | 210,500 | | 12,983,640 |
Intuit, Inc.* | | 102,800 | | 4,524,228 |
Microsoft Corp. | | 992,300 | | 26,504,333 |
Oracle Corp.* | | 437,600 | | 6,003,872 |
Symantec Corp.* | | 246,600 | | 6,352,416 |
| | | | |
|
| | | | | 58,627,129 |
| | | | |
|
Materials 0.9% | | | | |
| | |
Chemicals | | | | |
Ecolab, Inc. | | 176,800 | | 6,210,984 |
| | | | |
|
Telecommunication Services 0.7% | | | | |
| | |
Diversified Telecommunication Services | | | | |
Verizon Communications, Inc. | | 122,500 | | 4,962,475 |
| | | | |
|
Total Common Stocks
(Cost $554,181,844) | | | | 704,062,728 |
| | | | |
|
Exchange Traded Fund 0.5% | | | | |
| Semiconductor HOLDRs Trust (Cost $3,643,152) | | 104,500 | | 3,486,120 |
| | | | |
|
Securities Lending Collateral 2.1% | | | | |
Daily Assets Fund Institutional, 2.25% (d) (e) (Cost $15,185,800) | | 15,185,800 | | 15,185,800 |
| | | | |
|
Cash Equivalents 1.9% | | | | |
Scudder Cash Management QP Trust, 2.24% (b) (Cost $14,082,441) | | 14,082,441 | | 14,082,441 |
| | | | |
|
65
| | | | | | |
| | | % of
Net Assets
| | | Value ($)
| |
Total Investment Portfolio
(Cost $587,093,237) (a) | | 102.1 | | | 736,817,089 | |
| | | | | |
|
|
Other Assets and Liabilities, Net | | (2.1 | ) | | (15,324,815 | ) |
| | |
|
| |
|
|
Net Assets | | 100.0 | | | 721,492,274 | |
| | |
|
| |
|
|
| * | Non-income producing security. |
| (a) | The cost for federal income tax purposes was $587,851,970. At December 31, 2004, net unrealized appreciation for all securities based on tax cost was $148,965,119. This consisted of aggregate gross unrealized appreciation for all securities in which there was an excess of value over tax cost of $169,717,580 and aggregate gross unrealized depreciation for all securities in which there was an excess of tax cost over value of $20,752,461. |
| (b) | Scudder Cash Management QP Trust is managed by Deutsche Investment Management Americas Inc. The rate shown is the annualized seven-day yield at period end. |
| (c) | All or a portion of these securities were on loan (see Notes to Financial Statements). The value of all securities loaned at December 31, 2004 amounted to $14,772,260, which is 2.0% of total net assets. |
| (d) | Daily Assets Fund Institutional, an affiliated fund, is managed by Deutsche Asset Management, Inc. The rate shown is the annualized seven-day yield at period end. |
| (e) | Represents collateral held in connection with securities lending. |
Purchases and sales of investment securities (excluding short-term investments) for the year ended December 31, 2004, aggregated $106,130,647 and $141,613,328, respectively.
At December 31, 2004, the Capital Growth Portfolio had a net tax basis capital loss carryforward of approximately $232,875,000 which may be applied against any realized net taxable capital gains of each succeeding year until fully utilized or until December 31, 2009 ($18,038,000), December 31, 2010 ($121,030,000), December 31, 2011 ($65,191,000) and December 31, 2012 ($28,616,000), the respective expiration dates, whichever occurs first.
In addition, from November 1, 2004 through December 31, 2004, the Portfolio incurred approximately $18,631,000 of net realized capital losses. As permitted by tax regulations, the Portfolio intends to elect to defer these losses and treat them as arising in the fiscal year ending December 31, 2005.
The accompanying notes are an integral part of the financial statements.
66
Financial Statements
Capital Growth Portfolio
| | | | |
| Statement of Assets and Liabilities as of December 31, 2004 | | | |
| |
| Assets | | | | |
Investments: | | | | |
Investments in securities, at value — including $14,772,260 of securities loaned (cost $557,824,996) | | $ | 707,548,848 | |
Investment in Daily Asset Fund Institutional (cost $15,185,800)* | | | 15,185,800 | |
Investment in Scudder Cash Management QP Trust (cost $14,082,441) | | | 14,082,441 | |
| | |
|
|
|
Total investments in securities, at value
(cost $587,093,237) | | | 736,817,089 | |
| | |
|
|
|
Dividends receivable | | | 541,545 | |
Interest receivable | | | 22,094 | |
Receivable for Portfolio shares sold | | | 40,563 | |
Other assets | | | 35,505 | |
| | |
|
|
|
Total assets | | | 737,456,796 | |
| | |
|
|
|
| Liabilities | | | | |
Payable upon return of securities loaned | | | 15,185,800 | |
Payable for Portfolio shares redeemed | | | 416,441 | |
Accrued management fee | | | 276,760 | |
Other accrued expenses and payables | | | 85,521 | |
| | |
|
|
|
Total liabilities | | | 15,964,522 | |
| | |
|
|
|
Net assets, at value | | $ | 721,492,274 | |
| | |
|
|
|
| Net Assets | | | | |
| |
Net assets consist of: | | | 6,697,719 | |
Undistributed net investment income | | | | |
Net unrealized appreciation (depreciation) on investments | | | 149,723,852 | |
Accumulated net realized gain (loss) | | | (252,264,595 | ) |
Paid-in capital | | | 817,335,298 | |
| | |
|
|
|
Net assets, at value | | $ | 721,492,274 | |
| | |
|
|
|
| Class A | | | | |
| |
| Net Asset Value, offering and redemption price per share ($698,047,691 ÷ 44,544,616 outstanding shares of beneficial interest, no par value, unlimited number of shares authorized) | | $ | 15.67 | |
| Class B | | | | |
| |
| Net Asset Value, offering and redemption price per share ($23,444,583 ÷ 1,503,725 outstanding shares of beneficial interest, no par value, unlimited number of shares authorized) | | $ | 15.59 | |
| * | Represents collateral on securities loaned. |
67
Statement of Operations for the year ended December 31, 2004
| | | | |
Investment Income | | | | |
Income: | | | | |
| |
Dividends | | $ | 10,311,847 | |
Interest — Scudder Cash Management QP Trust | | | 180,934 | |
Securities lending income, including income from Daily Assets Fund Institutional | | | 8,745 | |
| | |
|
|
|
Total Income | | | 10,501,526 | |
| | |
|
|
|
Expenses: | | | | |
| |
Management fee | | | 3,322,815 | |
Custodian fees | | | 39,209 | |
Accounting fees | | | 119,838 | |
Distribution service fees (Class B) | | | 49,709 | |
Record keeping fees (Class B) | | | 25,279 | |
Auditing | | | 33,075 | |
Legal | | | 3,996 | |
Trustees’ fees and expenses | | | 20,425 | |
Reports to shareholders | | | 24,165 | |
Other | | | 14,120 | |
| | |
|
|
|
Total expenses, before expense reductions | | | 3,652,631 | |
Expense reductions | | | (6,259 | ) |
| | |
|
|
|
| Total expenses, after expense reductions | | | 3,646,372 | |
| | |
|
|
|
Net investment income (loss) | | | 6,855,154 | |
| | |
|
|
|
Realized and Unrealized Gain (Loss) on Investment Transactions | | | | |
Net realized gain (loss) from investments | | | (47,247,081 | ) |
Net unrealized appreciation (depreciation) during the period on investments | | | 94,779,509 | |
| | |
|
|
|
Net gain (loss) on investment transactions | | | 47,532,428 | |
| | |
|
|
|
Net increase (decrease) in net assets resulting from operations | | $ | 54,387,582 | |
| | |
|
|
|
The accompanying notes are an integral part of the financial statements.
68
Statement of Changes in Net Assets
| | | | | | | | |
| | | Years Ended December 31,
| |
Increase (Decrease) in Net Assets
| | 2004
| | | 2003
| |
Operations: | | | | | | | | |
| | |
Net investment income (loss) | | $ | 6,855,154 | | | $ | 3,786,922 | |
Net realized gain (loss) on investment transactions | | | (47,247,081 | ) | | | (13,492,454 | ) |
Net unrealized appreciation (depreciation) on investment transactions during the period | | | 94,779,509 | | | | 159,146,770 | |
| | |
|
|
| |
|
|
|
Net increase (decrease) in net assets resulting from operations | | | 54,387,582 | | | | 149,441,238 | |
| | |
|
|
| |
|
|
|
Distributions to shareholders from: | | | | | | | | |
| | |
Net investment income: | | | | | | | | |
| | |
Class A | | | (3,764,724 | ) | | | (2,595,329 | ) |
Class B | | | (32,841 | ) | | | (8,219 | ) |
| | |
Portfolio share transactions: | | | | | | | | |
| | |
Class A | | | | | | | | |
| | |
Proceeds from shares sold | | | 32,110,324 | | | | 99,262,252 | |
Reinvestment of distributions | | | 3,764,724 | | | | 2,595,329 | |
Cost of shares redeemed | | | (92,227,827 | ) | | | (99,434,360 | ) |
Net increase (decrease) in net assets from Class A share transactions | | | (56,352,779 | ) | | | 2,423,221 | |
| | |
Class B | | | | | | | | |
| | |
Proceeds from shares sold | | | 8,550,042 | | | | 13,042,500 | |
Reinvestment of distributions | | | 32,841 | | | | 8,219 | |
Cost of shares redeemed | | | (1,806,233 | ) | | | (598,220 | ) |
Net increase (decrease) in net assets from Class B share transactions | | | 6,776,650 | | | | 12,452,499 | |
Increase (decrease) in net assets | | | 1,013,888 | | | | 161,713,410 | |
Net assets at beginning of period | | | 720,478,386 | | | | 558,764,976 | |
| | |
|
|
| |
|
|
|
Net assets at end of period (including undistributed net investment income of $6,697,719 and $3,640,130, respectively) | | $ | 721,492,274 | | | $ | 720,478,386 | |
| | |
|
|
| |
|
|
|
Other Information | | | | | | | | |
Class A | | | | | | | | |
Shares outstanding at beginning of period | | | 48,332,734 | | | | 48,337,865 | |
Shares sold | | | 2,172,282 | | | | 7,881,425 | |
Shares issued to shareholders in reinvestment of distributions | | | 255,928 | | | | 211,174 | |
Shares redeemed | | | (6,216,328 | ) | | | (8,097,730 | ) |
Net increase (decrease) in Portfolio shares | | | (3,788,118 | ) | | | (5,131 | ) |
Shares outstanding at end of period | | | 44,544,616 | | | | 48,332,734 | |
Class B | | | | | | | | |
Shares outstanding at beginning of period | | | 1,044,792 | | | | 77,608 | |
Shares sold | | | 579,183 | | | | 1,011,277 | |
Shares issued to shareholders in reinvestment of distributions | | | 2,239 | | | | 670 | |
Shares redeemed | | | (122,489 | ) | | | (44,763 | ) |
Net increase (decrease) in Portfolio shares | | | 458,933 | | | | 967,184 | |
| | |
|
|
| |
|
|
|
Shares outstanding at end of period | | | 1,503,725 | | | | 1,044,792 | |
| | |
|
|
| |
|
|
|
The accompanying notes are an integral part of the financial statements.
69
Financial Highlights
Capital Growth Portfolio
Class A
| | | | | | | | | | | | | | | | | | | | |
Years Ended December 31,
| | 2004
| | | 2003
| | | 2002
| | | 2001
| | | 2000
| |
Selected Per Share Data | | | | | | | | | | | | | | | | | | | | |
Net asset value, beginning of period | | $ | 14.59 | | | $ | 11.54 | | | $ | 16.36 | | | $ | 23.07 | | | $ | 29.13 | |
| | |
|
|
| |
|
|
| |
|
|
| |
|
|
| |
|
|
|
Income (loss) from investment operations: | | | | | | | | | | | | | | | | | | | | |
| | | | | |
Net investment incomea | | | .14 | | | | .08 | | | | .05 | | | | .05 | | | | .08 | |
Net realized and unrealized gain (loss) on investment transactions | | | 1.02 | | | | 3.03 | | | | (4.82 | ) | | | (4.21 | ) | | | (2.63 | ) |
| | |
|
|
| |
|
|
| |
|
|
| |
|
|
| |
|
|
|
Total from investment operations | | | 1.16 | | | | 3.11 | | | | (4.77 | ) | | | (4.16 | ) | | | (2.55 | ) |
| | |
|
|
| |
|
|
| |
|
|
| |
|
|
| |
|
|
|
Less distributions from: | | | | | | | | | | | | | | | | | | | | |
Net investment income | | | (.08 | ) | | | (.06 | ) | | | (.05 | ) | | | (.08 | ) | | | (.07 | ) |
Net realized gains on investment transactions | | | — | | | | — | | | | — | | | | (2.47 | ) | | | (3.44 | ) |
| | |
|
|
| |
|
|
| |
|
|
| |
|
|
| |
|
|
|
Total distributions | | | (.08 | ) | | | (.06 | ) | | | (.05 | ) | | | (2.55 | ) | | | (3.51 | ) |
| | |
|
|
| |
|
|
| |
|
|
| |
|
|
| |
|
|
|
Net asset value, end of period | | $ | 15.67 | | | $ | 14.59 | | | $ | 11.54 | | | $ | 16.36 | | | $ | 23.07 | |
| | |
|
|
| |
|
|
| |
|
|
| |
|
|
| |
|
|
|
Total Return (%) | | | 7.99 | | | | 26.89 | | | | (29.18 | ) | | | (19.36 | ) | | | (9.90 | ) |
| | |
|
|
| |
|
|
| |
|
|
| |
|
|
| |
|
|
|
Ratios to Average Net Assets and Supplemental Data | | | | | | | | | | | | | | | | | | | | |
| | | | | |
Net assets, end of period ($ millions) | | | 698 | | | | 705 | | | | 558 | | | | 866 | | | | 1,126 | |
Ratio of expenses before expense reductions (%) | | | .50 | | | | .51 | | | | .51 | | | | .52 | c | | | .49 | |
Ratio of expenses after expense reductions (%) | | | .50 | | | | .51 | | | | .51 | | | | .50 | c | | | .49 | |
Ratio of net investment income (loss) (%) | | | .98 | | | | .61 | | | | .38 | | | | .27 | | | | .30 | |
Portfolio turnover rate (%) | | | 15 | | | | 13 | | | | 25 | | | | 33 | | | | 55 | |
Class B
| | | | | | | | | | | | | | | | | | | | |
Years Ended December 31,
| | 2004
| | | 2003
| | | 2002
| | | 2001
| | | 2000
| |
Selected Per Share Data | | | | | | | | | | | | | | | | | | | | |
Net asset value, beginning of period | | $ | 14.52 | | | $ | 11.49 | | | $ | 16.29 | | | $ | 23.00 | | | $ | 29.05 | |
| | |
|
|
| |
|
|
| |
|
|
| |
|
|
| |
|
|
|
Income (loss) from investment operations: | | | | | | | | | | | | | | | | | | | | |
| | | | | |
Net investment incomea | | | .09 | | | | .03 | | | | .02 | | | | .00b | | | | .01 | |
Net realized and unrealized gain (loss) on investment transactions | | | 1.01 | | | | 3.02 | | | | (4.81 | ) | | | (4.21 | ) | | | (2.62 | ) |
| | |
|
|
| |
|
|
| |
|
|
| |
|
|
| |
|
|
|
Total from investment operations | | | 1.10 | | | | 3.05 | | | | (4.79 | ) | | | (4.21 | ) | | | (2.61 | ) |
| | |
|
|
| |
|
|
| |
|
|
| |
|
|
| |
|
|
|
Less distributions from: | | | | | | | | | | | | | | | | | | | | |
| | | | | |
Net investment income | | | (.03 | ) | | | (.02 | ) | | | (.01 | ) | | | (.03 | ) | | | — | |
Net realized gains on investment transactions | | | — | | | | — | | | | — | | | | (2.47 | ) | | | (3.44 | ) |
| | |
|
|
| |
|
|
| |
|
|
| |
|
|
| |
|
|
|
Total distributions | | | (.03 | ) | | | (.02 | ) | | | (.01 | ) | | | (2.50 | ) | | | (3.44 | ) |
| | |
|
|
| |
|
|
| |
|
|
| |
|
|
| |
|
|
|
Net asset value, end of period | | $ | 15.59 | | | $ | 14.52 | | | $ | 11.49 | | | $ | 16.29 | | | $ | 23.00 | |
| | |
|
|
| |
|
|
| |
|
|
| |
|
|
| |
|
|
|
Total Return (%) | | | 7.56 | | | | 26.51 | | | | (29.37 | ) | | | (19.64 | ) | | | (10.13 | ) |
| | |
|
|
| |
|
|
| |
|
|
| |
|
|
| |
|
|
|
Ratios to Average Net Assets and Supplemental Data | | | | | | | | | | | | | | | | | | | | |
Net assets, end of period ($ millions) | | | 23 | | | | 15 | | | | .89 | | | | .71 | | | | 1.16 | |
Ratio of expenses before expense reductions (%) | | | .88 | | | | .87 | | | | .76 | | | | .77 | c | | | .74 | |
Ratio of expenses after expense reductions (%) | | | .88 | | | | .87 | | | | .76 | | | | .75 | c | | | .74 | |
Ratio of net investment income (loss) (%) | | | .60 | | | | .25 | | | | .13 | | | | .02 | | | | .05 | |
Portfolio turnover rate (%) | | | 15 | | | | 13 | | | | 25 | | | | 33 | | | | 55 | |
| a | Based on average shares outstanding during the period. |
| b | Less than $.005 per share |
| c | The ratios of operating expenses excluding costs incurred in connection with a fund complex reorganization before and after expense reductions were .50% and .50%, and .75% and .75% for Class A and Class B, respectively. |
70
Performance Summary December 31, 2004
21st Century Growth Portfolio
All performance shown is historical, assumes reinvestment of all dividends and capital gains, and does not guarantee future results. Investment return and principal value fluctuate with changing market conditions so that, when redeemed, shares may be worth more or less then their original cost. Current performance may be lower or higher than the performance data quoted. Please visit scudder.com for the product’s most recent month-end performance. Performance doesn’t reflect charges and fees (“contract charges”) associated with the separate account that invests in the portfolio or any variable life insurance policy or variable annuity contract for which the portfolio is an investment option. These charges and fees will reduce returns.
This Portfolio is subject to stock market risk. Stocks of small companies involve greater risk, as they often have limited product lines, markets or financial resources and may be exposed to more erratic and abrupt market movements than securities of larger, more established companies. Please read this Portfolio’s prospectus for specific details regarding its investments and risk profile.
The investment advisor has agreed to either limit, waive or reduce certain fees temporarily for this Portfolio; see the prospectus for complete details. Without such limits, waivers or reductions, the performance figures for this Portfolio would be lower.
Growth of an Assumed $10,000 Investment
| ¨ | 21st Century Growth Portfolio — Class A* |
| ¨ | Russell 2000 Growth Index |
Yearly periods ended December 31
The Russell 2000 Growth Index measures the performance of those Russell 2000 companies with higher price-to-book ratios and higher forecasted growth values. Index returns assume the reinvestment of dividends and, unlike Portfolio returns, do not reflect any fees or expenses. It is not possible to invest directly into an index.
Comparative Results (as of December 31, 2004)
| | | | | | | | | | | | | | | | |
21st Century Growth Portfolio*
| | 1-Year
| | | 3-Year
| | | 5-Year
| | | Life of Portfolio
| |
Class A | | | | | | | | | | | | | | | | |
Growth of $10,000 | | $ | 11,086 | | | $ | 8,523 | | | $ | 5,075 | | | $ | 8,966 | |
Average annual total return | | | 10.86 | % | | | -5.19 | % | | | -12.69 | % | | | -1.91 | % |
| | | | |
Class B | | | | | | | | | | | | | | | | |
Growth of $10,000 | | $ | 11,059 | | | $ | 8,488 | | | $ | 5,013 | | | $ | 8,814 | |
Average annual total return | | | 10.59 | % | | | -5.32 | % | | | -12.90 | % | | | -2.20 | % |
| | | | |
Russell 2000 Growth Index | | | | | | | | | | | | | | | | |
Growth of $10,000 | | $ | 11,431 | | | $ | 11,841 | | | $ | 8,338 | | | $ | 11,150 | |
Average annual total return | | | 14.31 | % | | | 5.79 | % | | | -3.57 | % | | | 1.94 | % |
The growth of $10,000 is cumulative.
| * | The Portfolio commenced operations on May 3, 1999. Index returns begin April 30,1999. |
71
Information About Your Portfolio’s Expenses
21st Century Growth Portfolio
As an investor of the Portfolio, you incur two types of costs: ongoing expenses and transaction costs. Ongoing expenses include management fees and other Portfolio expenses. Examples of transaction costs include sales charges (loads), redemption fees and account maintenance fees, which are not shown in this section. The following tables are intended to help you understand your ongoing expenses (in dollars) of investing in the Portfolio and to help you compare these expenses with the ongoing expenses of investing in other mutual funds. In the most recent six-month period, the Portfolio limited these expenses; had it not done so, expenses would have been higher. The tables are based on an investment of $1,000 made at the beginning of the six-month period ended December 31, 2004.
The tables illustrate your Portfolio’s expenses in two ways:
Actual Portfolio Return. This helps you estimate the actual dollar amount of ongoing expenses (but not transaction costs) paid on a $1,000 investment in the Portfolio using the Portfolio’s actual return during the period. To estimate the expenses you paid over the period, simply divide your account value by $1,000 (for example, an $8,600 account value divided by $1,000 = 8.6), then multiply the result by the number in the “Expenses Paid per $1,000” line under the share class you hold.
Hypothetical 5% Portfolio Return. This helps you to compare your Portfolio’s ongoing expenses (but not transaction costs) with those of other mutual funds using the Portfolio’s actual expense ratio and a hypothetical rate of return of 5% per year before expenses. Examples using a 5% hypothetical portfolio return may be found in the shareholder reports of other mutual funds. The hypothetical account values and expenses may not be used to estimate the actual ending account balance or expenses you paid for the period.
Please note that the expenses shown in these tables are meant to highlight your ongoing expenses only and do not reflect any transaction costs. The “Expenses Paid per $1,000” line of the tables is useful in comparing ongoing expenses only and will not help you determine the relative total expense of owning different funds. If these transaction costs had been included, your costs would have been higher.
Expenses and Value of a $1,000 Investment for the six months ended December 31, 2004
| | | | | | |
| | | Class A
| | Class B
|
Actual Portfolio Return | | | | | | |
Beginning Account Value 7/1/04 | | $ | 1,000.00 | | $ | 1,000.00 |
Ending Account Value 12/31/04 | | $ | 1,045.30 | | $ | 1,046.10 |
Expenses Paid per $1,000* | | $ | 6.52 | | $ | 7.18 |
| | |
| | | Class A
| | Class B
|
Hypothetical 5% Portfolio Return | | | | | | |
Beginning Account Value 7/1/04 | | $ | 1,000.00 | | $ | 1,000.00 |
Ending Account Value 12/31/04 | | $ | 1,018.83 | | $ | 1,018.19 |
Expenses Paid per $1,000* | | $ | 6.44 | | $ | 7.08 |
| * | Expenses are equal to the Portfolio’s annualized expense ratio for each share class, multiplied by the average account value over the period, multiplied by the number of days in the most recent six-month period, then divided by 365. |
| | | | | | |
| | | Class A
| | | Class B
| |
Annualized Expense Ratios | | | | | | |
Scudder Variable Series I — 21st Century Growth Portfolio | | 1.26 | % | | 1.39 | % |
For more information, please refer to the Portfolio’s prospectus.
72
Management Summary December 31, 2004
21st Century Growth Portfolio
Small cap shares produced solid gains in 2004, outperforming both large- and mid-cap issues. Small, low-quality and richly valued companies, which investors had focused on during 2003, continued their reversal in 2004. By contrast, the investment environment favored quality companies with attractive valuations and strong fundamentals (management style, products, sales and earnings) — the type of companies that we favor over the long term. During the year, we found it encouraging that the market was able to weather a mixed bag of labor reports, the insurgency in Iraq, a mid-year spike in oil prices and the hotly contested presidential election. For the 12-month period ended December 31, 2004, the portfolio produced a 10.86% total return (Class A shares, unadjusted for contract charges), though it underperformed the 14.31% return of the Russell 2000 Growth Index.
Stock selection contributed to performance over the 12-month period. Holdings within information technology and financials were the largest contributors. Stock selection within the consumer discretionary sector detracted from performance during the period. In terms of sector allocation, our overweight in information technology was the biggest driver of positive performance over the period, while an overweight in consumer discretionary was a significant detractor.
With underlying economic and market factors supportive of the equity markets, investors should continue to focus on those more profitable small-cap companies that report superior earnings. This should bode well for this segment of the stock market, despite rising interest rates, high energy costs and the weakening dollar.
Samuel A. Dedio
Robert S. Janis
Co-Lead Portfolio Managers
All performance shown is historical, assumes reinvestment of all dividends and capital gains, and does not guarantee future results. Investment return and principal value fluctuate with changing market conditions so that, when redeemed, shares may be worth more or less then their original cost. Current performance may be lower or higher than the performance data quoted. Please visit scudder.com for the product’s most recent month-end performance. Performance doesn’t reflect charges and fees (“contract charges”) associated with the separate account that invests in the portfolio or any variable life insurance policy or variable annuity contract for which the portfolio is an investment option. These charges and fees will reduce returns.
73
Risk Considerations
This portfolio is subject to stock market risk. Stocks of small companies involve greater risk, as they often have limited product lines, markets or financial resources and may be exposed to more erratic and abrupt market movements than securities of larger, more established companies. Please read this portfolio’s prospectus for specific details regarding its investments and risk profile.
The Russell 2000 Growth Index is an unmanaged capitalization-weighted measure of 2,000 of the smallest capitalized US companies with higher price-to-book ratios and higher forecasted growth values. Index returns assume reinvested dividends and, unlike portfolio returns, do not reflect any fees or expenses. It is not possible to invest directly into an index.
Portfolio management market commentary is as of December 31, 2004, and may not come to pass. This information is subject to change at any time based on market and other conditions.
74
Portfolio Summary
21st Century Growth Portfolio
Asset Allocation (Excludes Securities Lending Collateral)
| | | | | | |
| | | 12/31/04
| | | 12/31/03
| |
Common Stocks | | 98 | % | | 96 | % |
Cash Equivalents | | 2 | % | | 4 | % |
| | |
|
| |
|
|
| | | 100 | % | | 100 | % |
| | |
|
| |
|
|
Sector Diversification (Excludes Cash Equivalents and Securities Lending Collateral) | | 12/31/04
| | | 12/31/03
| |
Information Technology | | 29 | % | | 36 | % |
Health Care | | 24 | % | | 18 | % |
Consumer Discretionary | | 21 | % | | 16 | % |
Industrials | | 9 | % | | 8 | % |
Financials | | 8 | % | | 9 | % |
Consumer Staples | | 5 | % | | 4 | % |
Energy | | 3 | % | | 4 | % |
Materials | | 1 | % | | 2 | % |
Other | | — | | | 3 | % |
| | |
|
| |
|
|
| | | 100 | % | | 100 | % |
| | |
|
| |
|
|
Asset allocation and sector diversification are subject to change.
For more complete details about the Portfolio’s investment portfolio, see page 74. A quarterly Fact Sheet is available upon request. Information concerning portfolio holdings of the Portfolio as of month-end will be posted to scudder.com on the 15th of the following month. Please call 1-800-778-1482.
Following the Portfolio’s fiscal first and third quarter-end, a complete portfolio holdings listing is filed with the SEC on Form N-Q. The form will be available on the SEC’s Web site at www.sec.gov, and it also may be reviewed and copied at the SEC’s Public Reference Room in Washington, D.C. Information on the operation of the SEC’s Public Reference Room may be obtained by calling (800) SEC-0330.
75
Investment Portfolio as of December 31, 2004
21st Century Growth Portfolio
| | | | |
| | | Shares
| | Value ($)
|
Common Stocks 98.5% | | | | |
| | |
Consumer Discretionary 21.1% | | | | |
| | |
Hotels Restaurants & Leisure 8.6% | | | | |
Buffalo Wild Wings, Inc.* | | 18,500 | | 643,985 |
Life Time Fitness, Inc.* | | 26,500 | | 685,820 |
P.F. Chang’s China Bistro, Inc.* | | 19,900 | | 1,121,365 |
RARE Hospitality International, Inc.* | | 36,650 | | 1,167,669 |
Shuffle Master, Inc.* (c) | | 22,600 | | 1,064,460 |
| | | | |
|
| | | | | 4,683,299 |
| | | | |
|
Internet & Catalog Retail 1.2% | | | | |
Sharper Image Corp.* | | 32,700 | | 616,395 |
| | | | |
|
Media 2.1% | | | | |
Journal Register Co.* | | 31,500 | | 608,895 |
Lions Gate Entertainment Corp.* | | 51,000 | | 541,620 |
| | | | |
|
| | | | | 1,150,515 |
| | | | |
|
Specialty Retail 6.8% | | | | |
Aeropostale, Inc.* | | 41,900 | | 1,233,117 |
Hot Topic, Inc.* | | 62,900 | | 1,081,251 |
Kenneth Cole Productions, Inc. “A” | | 30,100 | | 928,886 |
New York & Co., Inc.* | | 26,800 | | 442,736 |
| | | | |
|
| | | | | 3,685,990 |
| | | | |
|
Textiles, Apparel & Luxury Goods 2.4% | | | | |
Gildan Activewear, Inc. “A” | | 21,500 | | 730,785 |
The Warnaco Group, Inc.* | | 26,500 | | 572,400 |
| | | | |
|
| | | | | 1,303,185 |
| | | | |
|
Consumer Staples 4.7% | | | | |
| | |
Food & Staples Retailing 2.5% | | | | |
United Natural Foods, Inc.* | | 43,200 | | 1,343,520 |
Household Products 2.2% | | | | |
| | | | |
|
Jarden Corp.* | | 28,100 | | 1,220,664 |
| | | | |
|
Energy 2.9% | | | | |
| | |
Oil & Gas | | | | |
Bill Barrett Corp.* | | 17,800 | | 569,422 |
Southwestern Energy Co.* | | 19,600 | | 993,524 |
| | | | |
|
| | | | | 1,562,946 |
| | | | |
|
Financials 7.9% | | | | |
| | |
Capital Markets 3.7% | | | | |
Jefferies Group, Inc. | | 20,000 | | 805,600 |
Piper Jaffray Companies, Inc.* | | 25,300 | | 1,213,135 |
| | | | |
|
| | | | | 2,018,735 |
| | | | |
|
Diversified Financial Services 2.8% | | | | |
Affiliated Managers Group, Inc.* | | 22,050 | | 1,493,667 |
| | | | |
|
Insurance 1.4% | | | | |
KMG America Corp.* | | 67,700 | | 744,700 |
| | | | |
|
Health Care 23.9% | | | | |
| | |
Health Care Equipment & Supplies 6.5% | | | | |
Advanced Medical Optics, Inc.* | | 26,200 | | 1,077,868 |
American Medical Systems Holdings, Inc.* | | 14,300 | | 597,883 |
76
| | | | |
| | | Shares
| | Value ($)
|
ArthroCare Corp.* (c) | | 25,800 | | 827,148 |
Wright Medical Group, Inc.* | | 35,400 | | 1,008,900 |
| | | | |
|
| | | | | 3,511,799 |
| | | | |
|
Health Care Providers & Services 14.2% | | | | |
American Healthways, Inc.* (c) | | 28,200 | | 931,728 |
AMERIGROUP Corp.* | | 21,900 | | 1,656,954 |
Beverly Enterprises, Inc.* | | 131,200 | | 1,200,480 |
Centene Corp.* | | 70,500 | | 1,998,675 |
United Surgical Partners International, Inc.* | | 28,500 | | 1,188,450 |
WellCare Health Plans, Inc.* | | 23,500 | | 763,750 |
| | | | |
|
| | | | | 7,740,037 |
| | | | |
|
Pharmaceuticals 3.2% | | | | |
Able Laboratories, Inc.* | | 24,700 | | 561,925 |
Connetics Corp.* | | 47,900 | | 1,163,491 |
| | | | |
|
| | | | | 1,725,416 |
| | | | |
|
Industrials 8.5% | | | | |
| | |
Commercial Services & Supplies 1.3% | | | | |
CoStar Group, Inc.* | | 14,700 | | 678,846 |
| | | | |
|
Machinery 2.8% | | | | |
Joy Global, Inc. | | 20,700 | | 899,001 |
Watts Water Technologies, Inc. “A” | | 18,900 | | 609,336 |
| | | | |
|
| | | | | 1,508,337 |
| | | | |
|
Road & Rail 2.0% | | | | |
Heartland Express, Inc. | | 49,396 | | 1,109,928 |
| | | | |
|
Transportation Infrastructure 2.4% | | | | |
Overnite Corp. | | 35,400 | | 1,318,296 |
| | | | |
|
Information Technology 28.5% | | | | |
| | |
Communications Equipment 5.8% | | | | |
Avocent Corp.* | | 26,500 | | 1,073,780 |
CommScope, Inc.* | | 43,800 | | 827,820 |
Foundry Networks, Inc.* | | 93,700 | | 1,233,092 |
| | | | |
|
| | | | | 3,134,692 |
| | | | |
|
Internet Software & Services 4.9% | | | | |
Audible, Inc.* | | 28,900 | | 752,845 |
Openwave Systems, Inc.* | | 59,900 | | 926,054 |
Websense, Inc.* | | 19,200 | | 973,824 |
| | | | |
|
| | | | | 2,652,723 |
| | | | |
|
IT Consulting & Services 1.4% | | | | |
CSG Systems International, Inc.* | | 41,300 | | 772,310 |
| | | | |
|
Semiconductors & Semiconductor Equipment 8.4% | | | | |
AMIS Holdings, Inc.* | | 31,900 | | 526,988 |
Emulex Corp.* | | 63,200 | | 1,064,288 |
FormFactor, Inc.* | | 31,300 | | 849,482 |
Power Integrations, Inc.* | | 57,600 | | 1,139,328 |
Tessera Technologies, Inc.* | | 26,200 | | 974,902 |
| | | | |
|
| | | | | 4,554,988 |
| | | | |
|
Software 8.0% | | | | |
Hyperion Solutions Corp.* | | 30,300 | | 1,412,586 |
Kronos, Inc.* | | 19,300 | | 986,809 |
77
| | | | | | |
| | | Shares
| | | Value ($)
| |
Macromedia, Inc.* | | 30,500 | | | 949,160 | |
THQ, Inc.* | | 43,200 | | | 991,008 | |
| | | | | |
|
|
| | | | | | 4,339,563 | |
| | | | | |
|
|
Materials 1.0% | | | | | | |
| | |
Metals & Mining | | | | | | |
Foundation Coal Holdings, Inc.* | | 24,600 | | | 567,276 | |
| | | | | |
|
|
Total Common Stocks
(Cost $42,697,164) | | | | | 53,437,827 | |
| | | | | |
|
|
Securities Lending Collateral 3.7% | | | | | | |
Daily Assets Fund Institutional, 2.25% (d) (e)(Cost $2,002,125) | | 2,002,125 | | | 2,002,125 | |
| | | | | |
|
|
Cash Equivalents 1.9% | | | | | | |
Scudder Cash Management QP Trust, 2.24% (b) (Cost $1,064,599) | | 1,064,599 | | | 1,064,599 | |
| | | | | |
|
|
| | |
| | | % of Net Assets
| | | Value ($)
| |
Total Investment Portfolio
(Cost $45,763,888) (a) | | 104.1 | | | 56,504,551 | |
| | |
Other Assets and Liabilities, Net | | (4.1 | ) | | (2,248,632 | ) |
| | |
|
| |
|
|
Net Assets | | 100.0 | | | 54,255,919 | |
| | |
|
| |
|
|
| * | Non-income producing security. |
| (a) | The cost for federal income tax purposes was $45,793,968. At December 31, 2004, net unrealized appreciation for all securities based on tax cost was $10,710,583. This consisted of aggregate gross unrealized appreciation for all securities in which there was an excess of value over tax cost of $11,198,959 and aggregate gross unrealized depreciation for all securities in which there was an excess of tax cost over value of $488,376. |
| (b) | Scudder Cash Management QP Trust is managed by Deutsche Investment Management Americas Inc. The rate shown is the annualized seven-day yield at period end. |
| (c) | All or a portion on these securities were on loan (see Notes to Financial Statements). The value of all securities loaned at December 31, 2004 amounted to $1,955,970, which is 3.6% of total net assets. |
| (d) | Daily Assets Fund Institutional, an affiliated fund, is managed by Deutsche Asset Management, Inc. The rate shown is the annualized seven-day yield at period end. |
| (e) | Represents collateral held in connection with securities lending. |
Purchases and sales of investment securities (excluding short-term investments) for the year ended December 31, 2004, aggregated $60,255,923 and $63,922,829, respectively.
At December 31, 2004, the 21st Century Growth Portfolio had a net tax basis capital loss carryforward of approximately $25,411,000 which may be applied against any realized net taxable capital gains of each succeeding year until fully utilized or until December 31, 2009 ($12,036,000), December 31, 2010 ($9,220,000) and December 31, 2011 ($4,155,000), the respective expiration dates, whichever occurs first.
78
Financial Statements
21st Century Growth Portfolio
Statement of Assets and Liabilities as of December 31, 2004
| | | | |
Assets | | | | |
Investments: | | | | |
Investments in securities, at value — including $1,955,970 of securities loaned (cost $42,697,164) | | $ | 53,437,827 | |
Investment in Daily Assets Fund Institutional (cost $2,002,125)* | | | 2,002,125 | |
Investment in Scudder Cash Management QP Trust (cost $1,064,599) | | | 1,064,599 | |
| | |
|
|
|
Total investments in securities, at value
(cost $45,763,888) | | | 56,504,551 | |
| | |
|
|
|
Cash | | | 10,000 | |
Receivable for investments sold | | | 25,876 | |
Dividends receivable | | | 988 | |
Interest receivable | | | 2,899 | |
Receivable for Portfolio shares sold | | | 12,942 | |
Other assets | | | 2,149 | |
| | |
|
|
|
Total assets | | | 56,559,405 | |
| | |
|
|
|
Liabilities | | | | |
Payable upon return of securities loaned | | | 2,002,125 | |
Payable for investments purchased | | | 218,778 | |
Payable for Portfolio shares redeemed | | | 2,035 | |
Accrued management fee | | | 40,652 | |
Other accrued expenses and payables | | | 39,896 | |
| | |
|
|
|
Total liabilities | | | 2,303,486 | |
| | |
|
|
|
Net assets, at value | | $ | 54,255,919 | |
| | |
|
|
|
Net Assets | | | | |
Net assets consist of: | | | | |
Net unrealized appreciation (depreciation) on investments | | | 10,740,663 | |
Accumulated net realized gain (loss) | | | (25,440,630 | ) |
Paid-in capital | | | 68,955,886 | |
| | |
|
|
|
Net assets, at value | | $ | 54,255,919 | |
| | |
|
|
|
Net Asset Value | | | | |
Class A | | | | |
Net Asset Value, offering and redemption price per share ($45,913,804 ÷ 8,651,769 outstanding shares of beneficial interest, no par value, unlimited number of shares authorized) | | $ | 5.31 | |
Class B | | | | |
Net Asset Value, offering and redemption price per share ($8,342,115 ÷ 1,598,365 outstanding shares of beneficial interest, no par value, unlimited number of shares authorized) | | $ | 5.22 | |
| * | Represents collateral on securities loaned. |
79
Statement of Operations for the year ended December 31, 2004
| | | | |
Investment Income | | | | |
Income: | | | | |
| |
Dividends | | $ | 63,088 | |
Interest — Scudder Cash Management QP Trust | | | 33,476 | |
Securities lending income, including income from Daily Assets Fund Institutional | | | 28,833 | |
| | |
|
|
|
Total Income | | | 125,397 | |
| | |
|
|
|
Expenses: | | | | |
Management fee | | | 469,123 | |
Custodian fees | | | 12,863 | |
Accounting fees | | | 66,207 | |
Distribution service fees (Class B) | | | 20,042 | |
Record keeping fees (Class B) | | | 10,714 | |
Auditing | | | 20,397 | |
Legal | | | 8,686 | |
Trustees’ fees and expenses | | | 4,090 | |
Reports to shareholders | | | 6,452 | |
Other | | | 1,579 | |
| | |
|
|
|
Total expenses, before expense reductions | | | 620,153 | |
Expense reductions | | | (13,294 | ) |
| | |
|
|
|
Total expenses, after expense reductions | | | 606,859 | |
| | |
|
|
|
Net investment income (loss) | | | (481,462 | ) |
| | |
|
|
|
Realized and Unrealized Gain (Loss) on Investment Transactions | | | | |
Net realized gain (loss) from investments | | | 1,667,420 | |
Net unrealized appreciation (depreciation) during the period on investments | | | 4,003,558 | |
| | |
|
|
|
Net gain (loss) on investment transactions | | | 5,670,978 | |
| | |
|
|
|
Net increase (decrease) in net assets resulting from operations | | $ | 5,189,516 | |
| | |
|
|
|
The accompanying notes are an integral part of the financial statements.
80
Statement of Changes in Net Assets
| | | | | | | | |
| | | Years Ended December 31,
| |
Increase (Decrease) in Net Assets
| | 2004
| | | 2003
| |
Operations: | | | | | | | | |
| | |
Net investment income (loss) | | $ | (481,462 | ) | | $ | (393,294 | ) |
Net realized gain (loss) on investment transactions | | | 1,667,420 | | | | 940,146 | |
Net unrealized appreciation (depreciation) on investment transactions during the period | | | 4,003,558 | | | | 10,800,560 | |
| | |
|
|
| |
|
|
|
Net increase (decrease) in net assets resulting from operations | | | 5,189,516 | | | | 11,347,412 | |
| | |
|
|
| |
|
|
|
Portfolio share transactions: | | | | | | | | |
| | |
Class A | | | | | | | | |
Proceeds from shares sold | | | 8,657,825 | | | | 16,045,090 | |
Cost of shares redeemed | | | (14,689,797 | ) | | | (12,701,118 | ) |
| | |
|
|
| |
|
|
|
Net increase (decrease) in net assets from Class A share transactions | | | (6,031,972 | ) | | | 3,343,972 | |
| | |
|
|
| |
|
|
|
| | |
Class B | | | | | | | | |
Proceeds from shares sold | | | 4,534,980 | | | | 5,228,477 | |
Cost of shares redeemed | | | (2,898,118 | ) | | | (130,839 | ) |
| | |
|
|
| |
|
|
|
Net increase (decrease) in net assets from Class B share transactions | | | 1,636,862 | | | | 5,097,638 | |
| | |
|
|
| |
|
|
|
Increase (decrease) in net assets | | | 794,406 | | | | 19,789,022 | |
Net assets at beginning of period | | | 53,461,513 | | | | 33,672,491 | |
| | |
|
|
| |
|
|
|
Net assets at end of period | | $ | 54,255,919 | | | $ | 53,461,513 | |
| | |
|
|
| |
|
|
|
Other Information | | | | | | | | |
| | |
Class A | | | | | | | | |
Shares outstanding at beginning of period | | | 9,918,991 | | | | 9,153,467 | |
Shares sold | | | 1,746,788 | | | | 3,849,909 | |
Shares redeemed | | | (3,014,010 | ) | | | (3,084,385 | ) |
Net increase (decrease) in Portfolio shares | | | (1,267,222 | ) | | | 765,524 | |
| | |
|
|
| |
|
|
|
Shares outstanding at end of period | | | 8,651,769 | | | | 9,918,991 | |
| | |
|
|
| |
|
|
|
Class B | | | | | | | | |
Shares outstanding at beginning of period | | | 1,256,244 | | | | 44,351 | |
Shares sold | | | 924,996 | | | | 1,245,969 | |
Shares redeemed | | | (582,875 | ) | | | (34,076 | ) |
| | |
|
|
| |
|
|
|
Net increase (decrease) in Portfolio shares | | | 342,121 | | | | 1,211,893 | |
| | |
|
|
| |
|
|
|
Shares outstanding at end of period | | | 1,598,365 | | | | 1,256,244 | |
| | |
|
|
| |
|
|
|
The accompanying notes are an integral part of the financial statements.
81
Financial Highlights
21st Century Growth Portfolio
Class A
| | | | | | | | | | | | | | | | | | | | |
Years Ended December 31,
| | 2004
| | | 2003
| | | 2002
| | | 2001
| | | 2000
| |
Selected Per Share Data | | | | | | | | | | | | | | | | | | | | |
Net asset value, beginning of period | | $ | 4.79 | | | $ | 3.66 | | | $ | 6.23 | | | $ | 8.12 | | | $ | 10.55 | |
| | |
|
|
| |
|
|
| |
|
|
| |
|
|
| |
|
|
|
Income (loss) from investment operations: | | | | | | | | | | | | | | | | | | | | |
| | | | | |
Net investment income (loss)a | | | (.04 | ) | | | (.04 | ) | | | (.04 | ) | | | (.04 | ) | | | (.11 | ) |
Net realized and unrealized gain (loss) on investment transactions | | | .56 | | | | 1.17 | | | | (2.53 | ) | | | (1.85 | ) | | | (2.20 | ) |
| | |
|
|
| |
|
|
| |
|
|
| |
|
|
| |
|
|
|
Total from investment operations | | | .52 | | | | 1.13 | | | | (2.57 | ) | | | (1.89 | ) | | | (2.31 | ) |
| | |
|
|
| |
|
|
| |
|
|
| |
|
|
| |
|
|
|
Less distributions from: | | | | | | | | | | | | | | | | | | | | |
Net realized gains on investment transactions | | | — | | | | — | | | | — | | | | — | | | | (.12 | ) |
| | |
|
|
| |
|
|
| |
|
|
| |
|
|
| |
|
|
|
Net asset value, end of period | | $ | 5.31 | | | $ | 4.79 | | | $ | 3.66 | | | $ | 6.23 | | | $ | 8.12 | |
| | |
|
|
| |
|
|
| |
|
|
| |
|
|
| |
|
|
|
Total Return (%) | | | 10.86b | | | | 30.87 | | | | (41.25 | ) | | | (23.28 | )b | | | (22.39 | )b |
| | |
|
|
| |
|
|
| |
|
|
| |
|
|
| |
|
|
|
Ratios to Average Net Assets and Supplemental Data | | | | | | | | | | | | | | | | | | | | |
Net assets, end of period ($ millions) | | | 46 | | | | 48 | | | | 34 | | | | 45 | | | | 26 | |
Ratio of expenses before expense reductions (%) | | | 1.14 | | | | 1.19 | | | | 1.11 | | | | 1.17 | c | | | 1.35 | |
Ratio of expenses after expense reductions (%) | | | 1.14 | | | | 1.19 | | | | 1.11 | | | | 1.15 | c | | | 1.29 | |
Ratio of net investment income (loss) (%) | | | (.91 | ) | | | (.91 | ) | | | (.88 | ) | | | (.64 | ) | | | (1.06 | ) |
Portfolio turnover rate (%) | | | 117 | | | | 113 | | | | 72 | | | | 103 | | | | 109 | |
Class B
| | | | | | | | | | | | | | | | | | | | |
Years Ended December 31,
| | 2004
| | | 2003
| | | 2002
| | | 2001
| | | 2000
| |
Selected Per Share Data | | | | | | | | | | | | | | | | | | | | |
Net asset value, beginning of period | | $ | 4.72 | | | $ | 3.62 | | | $ | 6.15 | | | $ | 8.04 | | | $ | 10.51 | |
| | |
|
|
| |
|
|
| |
|
|
| |
|
|
| |
|
|
|
Income (loss) from investment operations: | | | | | | | | | | | | | | | | | | | | |
| | | | | |
Net investment income (loss)a | | | (.05 | ) | | | (.06 | ) | | | (.05 | ) | | | (.06 | ) | | | (.13 | ) |
Net realized and unrealized gain (loss) on investment transactions | | | .55 | | | | 1.16 | | | | (2.48 | ) | | | (1.83 | ) | | | (2.22 | ) |
| | |
|
|
| |
|
|
| |
|
|
| |
|
|
| |
|
|
|
Total from investment operations | | | .50 | | | | 1.10 | | | | (2.53 | ) | | | (1.89 | ) | | | (2.35 | ) |
| | |
|
|
| |
|
|
| |
|
|
| |
|
|
| |
|
|
|
Less distributions from: | | | | | | | | | | | | | | | | | | | | |
Net realized gains on investment transactions | | | — | | | | — | | | | — | | | | — | | | | (.12 | ) |
| | |
|
|
| |
|
|
| |
|
|
| |
|
|
| |
|
|
|
Net asset value, end of period | | $ | 5.22 | | | $ | 4.72 | | | $ | 3.62 | | | $ | 6.15 | | | $ | 8.04 | |
| | |
|
|
| |
|
|
| |
|
|
| |
|
|
| |
|
|
|
Total Return (%) | | | 10.59 | b | | | 30.39 | | | | (41.14 | ) | | | (23.51 | )b | | | (22.79 | )b |
| | |
|
|
| |
|
|
| |
|
|
| |
|
|
| |
|
|
|
Ratios to Average Net Assets and Supplemental Data | | | | | | | | | | | | | | | | | | | | |
Net assets, end of period ($ millions) | | | 8 | | | | 6 | | | | — | *** | | | — | *** | | | — | *** |
Ratio of expenses before expense reductions (%) | | | 1.53 | | | | 1.59 | | | | 1.36 | | | | 1.42 | c | | | 1.60 | |
Ratio of expenses after expense reductions (%) | | | 1.39 | | | | 1.59 | | | | 1.36 | | | | 1.40 | c | | | 1.54 | |
Ratio of net investment income (loss) (%) | | | (1.16 | ) | | | (1.31 | ) | | | (1.13 | ) | | | (.89 | ) | | | (1.31 | ) |
Portfolio turnover rate (%) | | | 117 | | | | 113 | | | | 72 | | | | 103 | | | | 109 | |
| a | Based on average shares outstanding during the period. |
| b | Total return would have been lower had certain expenses not been reduced. |
| c | The ratios of operating expenses excluding costs incurred in connection with a fund complex reorganization before and after expense reductions were 1.16% and 1.15%, and 1.41% and 1.40% for Class A and Class B, respectively. |
| *** | Net assets less than one million |
82
Performance Summary December 31, 2004
Global Discovery Portfolio
All performance shown is historical, assumes reinvestment of all dividends and capital gains, and does not guarantee future results. Investment return and principal value fluctuate with changing market conditions so that, when redeemed, shares may be worth more or less then their original cost. Current performance may be lower or higher than the performance data quoted. Please visit scudder.com for the product’s most recent month-end performance. Performance doesn’t reflect charges and fees (“contract charges”) associated with the separate account that invests in the portfolio or any variable life insurance policy or variable annuity contract for which the portfolio is an investment option. These charges and fees will reduce returns.
This portfolio is subject to stock market risk. Investing in foreign securities presents certain unique risks not associated with domestic investments, such as currency fluctuations, political and economic changes and market risks. Additionally, stocks of small-sized companies involve greater risk as they often have limited product lines, markets, or financial resources and may be sensitive to erratic and abrupt market movements more so than securities of larger, more-established companies. All of these factors may result in greater share price volatility. Please read this Portfolio’s prospectus for specific details regarding its investments and risk profile.
The investment advisor has agreed to either limit, waive or reduce certain fees temporarily for this Portfolio; see the prospectus for complete details. Without such limits, waivers or reductions, the performance figures for Class B for this Portfolio would be lower.
Growth of an Assumed $10,000 Investment
| ¨ | Global Discovery Portfolio — Class A* |
| ¨ | S&P/Citigroup World Equity EMI |
Yearly periods ended December 31
S&P/Citigroup World Equity Extended Market Index (formerly known as Salomon Smith Barney World Equity Extended Market Index) is an unmanaged small capitalization stock universe of 22 countries. Index returns assume the reinvestment of dividends and, unlike Portfolio returns, do not reflect any fees or expenses. It is not possible to invest directly into an index.
Comparative Results (as of December 31, 2004)
| | | | | | | | | | | | | | | | |
Global Discovery Portfolio
| | 1-Year
| | | 3-Year
| | | 5-Year
| | | Life of Portfolio*
| |
Class A | | | | | | | | | | | | | | | | |
Growth of $10,000 | | $ | 12,335 | | | $ | 14,733 | | | $ | 10,522 | | | $ | 24,098 | |
Average annual total return | | | 23.35 | % | | | 13.79 | % | | | 1.02 | % | | | 10.68 | % |
| | | | |
S&P/Citigroup World Equity EMI | | | | | | | | | | | | | | | | |
Growth of $10,000 | | $ | 12,353 | | | $ | 15,937 | | | $ | 14,517 | | | $ | 20,792 | |
Average annual total return | | | 23.53 | % | | | 16.81 | % | | | 7.74 | % | | | 8.81 | % |
| | | | |
Global Discovery Portfolio
| | 1-Year
| | | 3-Year
| | | 5-Year
| | | Life of Class**
| |
Class B | | | | | | | | | | | | | | | | |
Growth of $10,000 | | $ | 12,312 | | | $ | 14,640 | | | $ | 10,391 | | | $ | 22,801 | |
Average annual total return | | | 23.12 | % | | | 13.55 | % | | | .77 | % | | | 11.35 | % |
| | | | |
S&P/Citigroup World Equity EMI | | | | | | | | | | | | | | | | |
Growth of $10,000 | | $ | 12,353 | | | $ | 15,937 | | | $ | 14,517 | | | $ | 21,063 | |
Average annual total return | | | 23.53 | % | | | 16.81 | % | | | 7.74 | % | | | 10.20 | % |
The growth of $10,000 is cumulative.
| * | The Portfolio commenced operations on May 1,1996. Index returns begin April 30, 1996. Total returns for the Life of Portfolio period for Class A shares would have been lower if the Portfolio’s expenses were not maintained. |
| ** | The Portfolio commenced selling Class B shares on May 2, 1997. Index returns begin April 30, 1997. |
83
Information About Your Portfolio’s Expenses
Global Discovery Portfolio
As an investor of the Portfolio, you incur two types of costs: ongoing expenses and transaction costs. Ongoing expenses include management fees, distribution and service (12b-1) fees and other Portfolio expenses. Examples of transaction costs include sales charges (loads), redemption fees and account maintenance fees, which are not shown in this section. The following tables are intended to help you understand your ongoing expenses (in dollars) of investing in the Portfolio and to help you compare these expenses with the ongoing expenses of investing in other mutual funds. In the most recent six-month period, the Class B limited these expenses; had it not done so, expenses would have been higher. The tables are based on an investment of $1,000 made at the beginning of the six-month period ended December 31, 2004.
The tables illustrate your Portfolio’s expenses in two ways:
Actual Portfolio Return. This helps you estimate the actual dollar amount of ongoing expenses (but not transaction costs) paid on a $1,000 investment in the Portfolio using the Portfolio’s actual return during the period. To estimate the expenses you paid over the period, simply divide your account value by $1,000 (for example, an $8,600 account value divided by $1,000 = 8.6), then multiply the result by the number in the “Expenses Paid per $1,000” line under the share class you hold.
Hypothetical 5% Portfolio Return. This helps you to compare your Portfolio’s ongoing expenses (but not transaction costs) with those of other mutual funds using the Portfolio’s actual expense ratio and a hypothetical rate of return of 5% per year before expenses. Examples using a 5% hypothetical portfolio return may be found in the shareholder reports of other mutual funds. The hypothetical account values and expenses may not be used to estimate the actual ending account balance or expenses you paid for the period.
Please note that the expenses shown in these tables are meant to highlight your ongoing expenses only and do not reflect any transaction costs. The “Expenses Paid per $1,000” line of the tables is useful in comparing ongoing expenses only and will not help you determine the relative total expense of owning different funds. If these transaction costs had been included, your costs would have been higher.
Expenses and Value of a $1,000 Investment for the six months ended December 31, 2004
| | | | | | |
| | | Class A
| | Class B
|
Actual Portfolio Return | | | | | | |
Beginning Account Value 7/1/04 | | $ | 1,000.00 | | $ | 1,000.00 |
Ending Account Value 12/31/04 | | $ | 1,172.60 | | $ | 1,172.90 |
Expenses Paid per $1,000* | | $ | 6.49 | | $ | 7.13 |
| | |
| | | Class A
| | Class B
|
Hypothetical 5% Portfolio Return | | | | | | |
Beginning Account Value 7/1/04 | | $ | 1,000.00 | | $ | 1,000.00 |
Ending Account Value 12/31/04 | | $ | 1,019.23 | | $ | 1,018.64 |
Expenses Paid per $1,000* | | $ | 6.03 | | $ | 6.62 |
| * | Expenses are equal to the Portfolio’s annualized expense ratio for each share class, multiplied by the average account value over the period, multiplied by the number of days in the most recent six-month period, then divided by 365. |
| | | | | | |
| | | Class A
| | | Class B
| |
Annualized Expense Ratios | | | | | | |
Scudder Variable Series I — Global Discovery Portfolio | | 1.18 | % | | 1.30 | % |
For more information, please refer to the Portfolio’s prospectus.
84
Management Summary December 31, 2004
Global Discovery Portfolio
The portfolio delivered a robust absolute return of 23.35% (Class A shares, unadjusted for contract charges) in 2004, in line with the 23.53% return of the S&P/Citigroup World Equity Extended Market Index (EMI). The portfolio finished first among the twenty-eight comparable annuity portfolios in Lipper’s Global Growth category.
We added value through our stock selection, especially within financials. Here, the portfolio’s top performer was Anglo Irish Bank Corp. (5.36% of net assets as of December 31, 2004). Our selection was also favorable in the consumer discretionary group, where winners included Harman International (1.46%) and JC Decaux SA (1.38%). The primary detractor from performance was the portfolio’s sector allocations, where we were hurt by an overweight in technology and underweights in energy, industrials and materials. Stock selection in health care was also a negative.
Financials represent the portfolio’s largest sector weighting, although we have been actively trimming our largest positions in the group as they appreciate. We moved to an overweight in the consumer discretionary area, where recent additions include PF Chang’s China Bistro Inc. (1.05%) and Advanced Auto Parts, Inc. (1.40%). We also increased the portfolio’s weighting in industrials. Weightings in health care and technology were reduced during the year, and the portfolio remains underweight in materials and staples.
On a regional basis, Europe is proving to be the most fertile ground in which to find fast-growing, reasonably valued companies. The United States and the Pacific Rim are also home to a wealth of compelling opportunities, but we are less enthusiastic on valuations in the United States.
Joseph Axtell
Terrence S. Gray
Portfolio Managers
All performance shown is historical, assumes reinvestment of all dividends and capital gains, and does not guarantee future results. Investment return and principal value fluctuate with changing market conditions so that, when redeemed, shares may be worth more or less then their original cost. Current performance may be lower or higher than the performance data quoted. Please visit scudder.com for the product’s most recent month-end performance. Performance doesn’t reflect charges and fees (“contract charges”) associated with the separate account that invests in the portfolio or any variable life insurance policy or variable annuity contract for which the portfolio is an investment option. These charges and fees will reduce returns.
85
Risk Considerations
This portfolio is subject to stock market risk. Investing in foreign securities presents certain unique risks not associated with domestic investments, such as currency fluctuations, political and economic changes and market risks. Additionally, stocks of small-sized companies involve greater risk as they often have limited product lines, markets or financial resources and may be sensitive to erratic and abrupt market movements more so than securities of larger, more established companies. All of these factors may result in greater share price volatility. Please read this portfolio’s prospectus for specific details regarding its investments and risk profile.
The S&P/Citigroup World Equity Extended Market Index (Citigroup World Equity EMI), formerly Salomon Smith Barney World Equity Extended Market Index, is an unmanaged index of small-capitalization stocks within 22 countries around the globe. Index returns assume the reinvestment of dividends and, unlike portfolio returns, do not reflect any fees or expenses. It is not possible to invest directly into an index.
Portfolio management market commentary is as of December 31, 2004, and may not come to pass. This information is subject to change at any time based on market and other conditions.
86
Portfolio Summary
Global Discovery Portfolio
Asset Allocation (Excludes Securities Lending Collateral)
| | | | | | |
| | | 12/31/04
| | | 12/31/03
| |
Common Stocks and Warrants | | 94 | % | | 99 | % |
Cash Equivalents | | 6 | % | | 1 | % |
| | |
|
| |
|
|
| | | 100 | % | | 100 | % |
| | |
|
| |
|
|
Geographical Diversification (Excludes Cash Equivalents and Securities Lending Collateral)
| | | | | | |
| | | 12/31/04
| | | 12/31/03
| |
Europe | | 41 | % | | 38 | % |
United States | | 35 | % | | 39 | % |
Japan | | 7 | % | | 7 | % |
Pacific Basin | | 5 | % | | 5 | % |
United Kingdom | | 5 | % | | 6 | % |
Latin America | | 2 | % | | 2 | % |
Australia | | 2 | % | | 2 | % |
Canada | | 2 | % | | — | |
Other | | 1 | % | | 1 | % |
| | |
|
| |
|
|
| | | 100 | % | | 100 | % |
| | |
|
| |
|
|
Sector Diversification (Excludes Cash Equivalents and Securities Lending Collateral)
| | | | | | |
| | | 12/31/04
| | | 12/31/03
| |
Financials | | 25 | % | | 26 | % |
Consumer Discretionary | | 21 | % | | 17 | % |
Information Technology | | 16 | % | | 18 | % |
Industrials | | 15 | % | | 12 | % |
Health Care | | 12 | % | | 17 | % |
Materials | | 3 | % | | 3 | % |
Energy | | 3 | % | | 2 | % |
Utilities | | 2 | % | | 2 | % |
Consumer Staples | | 2 | % | | 1 | % |
Telecommunication Services | | 1 | % | | 2 | % |
| | |
|
| |
|
|
| | | 100 | % | | 100 | % |
| | |
|
| |
|
|
Asset allocation, geographical diversification and sector diversification are subject to change.
For more complete details about the Portfolio’s investment portfolio, see page 84. A quarterly Fact Sheet is available upon request. Information concerning portfolio holdings of the Portfolio as of month-end will be posted to scudder.com on the 15th of the following month. Please call 1-800-778-1482.
Following the Portfolio’s fiscal first and third quarter-end, a complete portfolio holdings listing is filed with the SEC on Form N-Q. The form will be available on the SEC’s Web site at www.sec.gov, and it also may be reviewed and copied at the SEC’s Public Reference Room in Washington, D.C. Information on the operation of the SEC’s Public Reference Room may be obtained by calling (800) SEC-0330.
87
Investment Portfolio as of December 31, 2004
Global Discovery Portfolio
| | | | |
| | | Shares
| | Value ($)
|
Common Stocks 94.1% | | | | |
| | |
Australia 1.8% | | | | |
Macquarie Bank Ltd. | | 80,811 | | 2,945,670 |
QBE Insurance Group Ltd. | | 127,194 | | 1,530,508 |
| | | | |
|
(Cost $1,766,478) | | | | 4,476,178 |
| | | | |
|
Austria 0.4% | | | | |
Wienerberger AG (Cost $654,342) | | 20,600 | | 984,219 |
| | | | |
|
Brazil 1.9% | | | | |
Aracruz Celulose SA “B” (ADR) | | 78,300 | | 2,951,910 |
Empresa Brasiliera de Aeronautica SA (Preferred) (ADR) | | 60,118 | | 2,010,346 |
| | | | |
|
(Cost $3,312,870) | | | | 4,962,256 |
| | | | |
|
Canada 1.8% | | | | |
ING Canada, Inc.* | | 59,500 | | 1,455,532 |
OPTI Canada, Inc.* | | 42,200 | | 684,343 |
ZENON Environmental, Inc.* | | 119,600 | | 2,340,792 |
| | | | |
|
(Cost $4,036,265) | | | | 4,480,667 |
| | | | |
|
Denmark 1.4% | | | | |
GN Store Nord A/S (GN Great Nordic) | | 211,900 | | 2,284,511 |
Group 4 Securicor PLC* (c) | | 445,260 | | 1,204,164 |
| | | | |
|
(Cost $3,093,093) | | | | 3,488,675 |
| | | | |
|
France 4.6% | | | | |
Autoroutes du Sud de la France | | 75,715 | | 3,807,877 |
Camaieu | | 22,075 | | 2,196,398 |
Flamel Technologies SA (ADR)* (c) | | 116,500 | | 2,270,585 |
JC Decaux SA* | | 121,075 | | 3,534,988 |
| | | | |
|
(Cost $7,173,306) | | | | 11,809,848 |
| | | | |
|
Germany 9.9% | | | | |
Deutsche Boerse AG (c) | | 85,403 | | 5,140,200 |
Fresenius Medical Care AG (c) | | 86,251 | | 6,941,582 |
Hypo Real Estate Holdings AG* | | 80,437 | | 3,334,686 |
Puma AG | | 17,625 | | 4,846,456 |
Rational AG | | 12,500 | | 1,163,178 |
Stada Arzneimittel AG (c) | | 96,096 | | 2,598,001 |
United Internet AG | | 50,955 | | 1,381,748 |
| | | | |
|
(Cost $13,937,107) | | | | 25,405,851 |
| | | | |
|
Greece 5.6% | | | | |
Alpha Bank AE | | 148,300 | | 5,172,459 |
Coca-Cola Hellenic Bottling Co. SA | | 98,100 | | 2,400,163 |
Germanos SA | | 64,100 | | 1,899,389 |
Greek Organization of Football Prognostics | | 106,200 | | 2,936,126 |
Titan Cement Co. | | 61,600 | | 1,825,309 |
| | | | |
|
(Cost $8,480,265) | | | | 14,233,446 |
| | | | |
|
Hong Kong 2.5% | | | | |
Kingboard Chemical Holdings Ltd. | | 1,078,400 | | 2,289,243 |
Midland Realty Holdings Ltd. | | 2,238,700 | | 1,267,292 |
Wing Hang Bank Ltd. | | 420,200 | | 2,946,325 |
| | | | |
|
(Cost $4,543,898) | | | | 6,502,860 |
| | | | |
|
India 0.5% | | | | |
Mahindra & Mahindra Ltd. (Cost $1,071,275) | | 96,300 | | 1,206,242 |
| | | | |
|
88
| | | | |
| | | Shares
| | Value ($)
|
Ireland 8.2% | | | | |
Anglo Irish Bank Corp., PLC | | 563,108 | | 13,700,738 |
ICON PLC (ADR)* | | 27,300 | | 1,055,145 |
Irish Continental Group PLC* | | 65,360 | | 1,017,225 |
Jurys Doyle Hotel Group PLC | | 231,150 | | 3,870,828 |
Ryanair Holdings PLC* | | 169,500 | | 1,209,562 |
| | | | |
|
(Cost $5,076,298) | | | | 20,853,498 |
| | | | |
|
Japan 6.5% | | | | |
AEON Credit Services Co., Ltd. | | 32,600 | | 2,427,423 |
AEON Mall Co., Ltd. | | 35,000 | | 2,489,997 |
JAFCO Co., Ltd. | | 21,500 | | 1,460,330 |
Matsui Securities Co., Ltd. (c) | | 46,800 | | 1,630,487 |
Nidec Corp. (c) | | 36,600 | | 4,461,149 |
Park24 Co., Ltd.* (c) | | 92,000 | | 1,651,996 |
Sumitomo Realty & Development Co., Ltd. | | 195,000 | | 2,542,402 |
| | | | |
|
(Cost $11,924,750) | | | | 16,663,784 |
| | | | |
|
Korea 0.7% | | | | |
Daewoo Shipbuilding & Marine Engineering Co., Ltd. | | 71,700 | | 1,066,634 |
Korea Information Service, Inc. | | 35,000 | | 666,055 |
| | | | |
|
(Cost $2,032,620) | | | | 1,732,689 |
| | | | |
|
Netherlands 3.7% | | | | |
Chicago Bridge & Iron Co., NV (New York Shares) (ADR) | | 51,800 | | 2,072,000 |
IHC Caland NV | | 54,485 | | 3,461,505 |
Vedior NV | | 247,258 | | 4,029,663 |
| | | | |
|
(Cost $6,474,444) | | | | 9,563,168 |
| | | | |
|
Norway 0.7% | | | | |
Tandberg ASA (c) (Cost $730,581) | | 147,200 | | 1,828,866 |
| | | | |
|
Russia 1.0% | | | | |
Mobile Telesystems (ADR) (Cost $504,171) | | 17,600 | | 2,437,776 |
| | | | |
|
Spain 1.5% | | | | |
ACS, Actividades de Construccion y Servicios SA | | 102,300 | | 2,336,061 |
Amadeus Global Travel Distribution SA “A” | | 154,700 | | 1,591,789 |
| | | | |
|
(Cost $2,346,013) | | | | 3,927,850 |
| | | | |
|
Sweden 1.0% | | | | |
Eniro AB | | 197,200 | | 2,017,877 |
Micronic Laser Systems AB* | | 60,700 | | 609,704 |
| | | | |
|
(Cost $1,891,931) | | | | 2,627,581 |
| | | | |
|
Switzerland 0.5% | | | | |
Micronas Semiconductor Holdings AG (Foreign Registered)* (Cost $1,028,882) | | 24,500 | | 1,201,192 |
| | | | |
|
Taiwan 1.5% | | | | |
Compal Electronics, Inc. | | 1,853,880 | | 1,854,465 |
Siliconware Precision Industries Co.* | | 2,547,600 | | 2,106,252 |
| | | | |
|
(Cost $4,479,402) | | | | 3,960,717 |
| | | | |
|
Thailand 0.7% | | | | |
Bangkok Bank PCL (Foreign Registered) (Cost $1,494,304) | | 597,300 | | 1,752,695 |
| | | | |
|
89
| | | | | | |
| | | Shares
| | | Value ($)
| |
United Kingdom 4.2% | | | | | | |
Aegis Group PLC | | 1,195,335 | | | 2,478,520 | |
ARM Holdings PLC (c) | | 738,941 | | | 1,567,657 | |
John Wood Group PLC | | 296,959 | | | 763,977 | |
Misys PLC | | 291,370 | | | 1,170,548 | |
Taylor Nelson Sofres PLC | | 574,840 | | | 2,494,218 | |
Viridian Group PLC | | 168,979 | | | 2,368,288 | |
| | | | | |
|
|
(Cost $11,563,963) | | | | | 10,843,208 | |
| | | | | |
|
|
United States 33.5% | | | | | | |
Advance Auto Parts, Inc.* | | 82,000 | | | 3,581,760 | |
Affiliated Computer Services, Inc. “A”* | | 32,200 | | | 1,938,118 | |
Allegheny Energy, Inc.* (c) | | 160,300 | | | 3,159,513 | |
Applied Micro Circuits Corp.* | | 231,700 | | | 975,457 | |
Caremark Rx, Inc.* | | 144,700 | | | 5,705,521 | |
Carter’s, Inc.* | | 63,200 | | | 2,148,168 | |
Celgene Corp.* (c) | | 82,600 | | | 2,191,378 | |
Diebold, Inc. | | 39,700 | | | 2,212,481 | |
EOG Resources, Inc. | | 31,500 | | | 2,247,840 | |
Fiserv, Inc.* | | 92,600 | | | 3,721,594 | |
Foundation Coal Holdings, Inc. | | 17,900 | | | 412,774 | |
FTI Consulting, Inc.* | | 82,950 | | | 1,747,756 | |
Gentex Corp. | | 49,500 | | | 1,832,490 | |
GTECH Holdings Corp. | | 143,800 | | | 3,731,610 | |
Harman International Industries, Inc. | | 41,900 | | | 5,321,300 | |
Harris Interactive, Inc.* | | 144,600 | | | 1,142,340 | |
Invitrogen Corp.* | | 37,400 | | | 2,510,662 | |
Joy Global, Inc. | | 34,700 | | | 1,507,021 | |
Kenneth Cole Productions, Inc. “A” | | 44,500 | | | 1,373,270 | |
Lam Research Corp.* | | 45,700 | | | 1,321,187 | |
LECG Corp.* | | 64,100 | | | 1,195,465 | |
Legg Mason, Inc. | | 104,450 | | | 7,652,007 | |
Mercury Interactive Corp.* | | 49,200 | | | 2,241,060 | |
New York & Co., Inc.* | | 106,200 | | | 1,754,424 | |
P.F. Chang’s China Bistro, Inc.* | | 47,600 | | | 2,682,260 | |
Par Pharmaceutical Cos., Inc.* | | 53,800 | | | 2,226,244 | |
Rowan Companies, Inc.* | | 43,400 | | | 1,124,060 | |
Spinnaker Exploration Co.* | | 28,800 | | | 1,010,016 | |
Symbol Technologies, Inc. | | 119,093 | | | 2,060,309 | |
The First Marblehead Corp.* | | 62,900 | | | 3,538,125 | |
Thoratec Corp.* | | 114,800 | | | 1,196,216 | |
THQ, Inc.* | | 120,300 | | | 2,759,682 | |
Waters Corp.* | | 64,400 | | | 3,013,276 | |
Zions Bancorp. | | 64,000 | | | 4,353,920 | |
| | | | | |
|
|
(Cost $61,248,619) | | | | | 85,589,304 | |
| | | | | |
|
|
Total Common Stocks
(Cost $158,864,877) | | | | | 240,532,570 | |
| | | | | |
|
|
Warrants 0.0% | | | | | | |
| | |
Hong Kong | | | | | | |
Kingboard Chemical Holdings Ltd.* (Cost $849) | | 91,640 | | | 48,928 | |
| | | | | |
|
|
Securities Lending Collateral 11.8% | | | | | | |
Daily Assets Fund Institutional, 2.25% (d) (e) (Cost $30,054,142) | | 30,054,142 | | | 30,054,142 | |
| | | | | |
|
|
Cash Equivalents 6.2% | | | | | | |
Scudder Cash Management QP Trust, 2.24% (b) (Cost $15,964,746) | | 15,964,746 | | | 15,964,746 | |
| | | | | |
|
|
| | |
| | | % of
Net Assets
| | | Value ($)
| |
Total Investment Portfolio
(Cost $204,884,614) (a) | | 112.1 | | | 286,600,386 | |
| | |
Other Assets and Liabilities, Net | | (12.1 | ) | | (30,914,007 | ) |
| | |
|
| |
|
|
Net Assets | | 100.0 | | | 255,686,379 | |
| | |
|
| |
|
|
| * | Non-income producing security. |
| (a) | The cost for federal income tax purposes was $206,593,228. At December 31, 2004, net unrealized appreciation for all securities based on tax cost was $80,007,158. This consisted of aggregate gross unrealized appreciation for all securities in which there was an excess of value over tax cost of $86,671,256 and aggregate gross unrealized depreciation for all securities in which there was an excess of tax cost over value of $6,664,098. |
| (b) | Scudder Cash Management QP Trust is managed by Deutsche Investment Management Americas Inc. The rate shown is the annualized seven-day yield at period end. |
| (c) | All or a portion of these securities were on loan (see Notes to Financial Statements). The value of all securities loaned at December 31, 2004 amounted to $28,669,428, which is 11.2% of total net assets. |
| (d) | Daily Assets Fund Institutional, an affiliated fund, is managed by Deutsche Asset Management, Inc. The rate shown is the annualized seven-day yield at period end. |
| (e) | Represents collateral held in connection with securities lending. |
ADR: American Depositary Receipt
Purchases and sales of investment securities (excluding short-term investments) for the year ended December 31, 2004, aggregated $49,763,481 and $50,081,920, respectively.
At December 31, 2004, the Global Discovery Portfolio had a net tax basis capital loss carryforward of approximately $42,800,000 which may be applied against any realized net taxable capital gains of each succeeding year until fully utilized or until December 31, 2009 ($11,900,000), December 31, 2010 ($25,700,000) and December 31, 2011 ($5,200,000), the respective expiration dates, whichever occurs first.
The accompanying notes are an integral part of the financial statements.
90
Financial Statements
Global Discovery Portfolio
Statement of Assets and Liabilities as of December 31, 2004
| | | | |
Assets | | | | |
Investments: | | | | |
| |
Investments in securities, at value — including $28,669,428 of securities loaned (cost $158,865,726) | | $ | 240,581,498 | |
Investment in Daily Assets Fund Institutional (cost $30,054,142)* | | | 30,054,142 | |
Investment in Scudder Cash Management QP Trust (cost $15,964,746) | | | 15,964,746 | |
| | |
|
|
|
Total investment in securities, at value
(cost $204,884,614) | | | 286,600,386 | |
| | |
|
|
|
Foreign currency, at value (cost $102,603) | | | 109,715 | |
Receivable for investments sold | | | 91,087 | |
Dividends receivable | | | 196,240 | |
Interest receivable | | | 36,393 | |
Receivable for Portfolio shares sold | | | 21,490 | |
Foreign taxes recoverable | | | 26,014 | |
Other assets | | | 6,703 | |
| | |
|
|
|
Total assets | | | 287,088,028 | |
| | |
|
|
|
Liabilities | | | | |
Payable upon return of securities loaned | | | 30,054,142 | |
Payable for Portfolio shares redeemed | | | 1,027,603 | |
Accrued management fee | | | 205,410 | |
Other accrued expenses and payables | | | 114,494 | |
| | |
|
|
|
Total liabilities | | | 31,401,649 | |
| | |
|
|
|
Net assets, at value | | $ | 255,686,379 | |
| | |
|
|
|
Net Assets | | | | |
Net assets consist of: | | | | |
Undistributed net investment income | | | 111,958 | |
Net unrealized appreciation (depreciation) on: | | | | |
Investments | | | 81,715,772 | |
Foreign currency related transactions | | | 10,545 | |
Accumulated net realized gain (loss) | | | (43,143,482 | ) |
Paid-in capital | | | 216,991,586 | |
| | |
|
|
|
Net assets, at value | | $ | 255,686,379 | |
| | |
|
|
|
Class A | | | | |
Net Asset Value, offering and redemption price per share ($232,068,523 ÷ 18,170,922 outstanding shares of beneficial interest, no par value, unlimited number of shares authorized) | | $ | 12.77 | |
Class B | | | | |
Net Asset Value, offering and redemption price per share ($23,617,856 ÷ 1,871,933 outstanding shares of beneficial interest, no par value, unlimited number of shares authorized) | | $ | 12.62 | |
91
| | | | |
Statement of Operations for the year ended December 31, 2004 | | | |
Investment Income | | | | |
Income: | | | | |
| |
Dividends (net of foreign taxes withheld of $202,585) | | $ | 2,472,313 | |
Interest — Scudder Cash Management QP Trust | | | 114,567 | |
Securities lending income, including income from Daily Assets Fund Institutional | | | 118,790 | |
| | |
|
|
|
Total Income | | | 2,705,670 | |
| | |
|
|
|
Expenses: | | | | |
Management fee | | | 2,073,565 | |
Custodian fees | | | 162,711 | |
Accounting fees | | | 180,569 | |
Distribution service fees (Class B) | | | 45,532 | |
Record keeping fee (Class B) | | | 14,005 | |
Auditing | | | 41,094 | |
Legal | | | 10,406 | |
Trustees’ fees and expenses | | | 8,209 | |
Reports to shareholders | | | 20,338 | |
Other | | | 14,336 | |
| | |
|
|
|
Total expenses, before expense reductions | | | 2,570,765 | |
Expense reductions | | | (25,216 | ) |
| | |
|
|
|
Total expenses, after expense reductions | | | 2,545,549 | |
| | |
|
|
|
Net investment income (loss) | | | 160,121 | |
| | |
|
|
|
Realized and Unrealized Gain (Loss) on Investment Transactions | | | | |
Net realized gain (loss) from: | | | | |
Investments | | | 13,187,068 | |
| |
Foreign currency related transactions | | | (4,997 | ) |
| | |
|
|
|
| | | | 13,182,071 | |
| | |
|
|
|
Net unrealized appreciation (depreciation) during the period on: | | | | |
| |
Investments | | | 33,488,353 | |
Foreign currency related transactions | | | (272 | ) |
| | | | 33,488,081 | |
| | |
|
|
|
Net gain (loss) on investment transactions | | | 46,670,152 | |
| | |
|
|
|
Net increase (decrease) in net assets resulting from operations | | $ | 46,830,273 | |
| | |
|
|
|
| * | Represents collateral on securities loaned. |
The accompanying notes are an integral part of the financial statements.
92
Statement of Changes in Net Assets
| | | | | | | | |
| | | Years Ended December 31,
| |
Increase (Decrease) in Net Assets
| | 2004
| | | 2003
| |
Operations: | | | | | | | | |
| | |
Net investment income (loss) | | $ | 160,121 | | | $ | 406,219 | |
Net realized gain (loss) on investment transactions | | | 13,182,071 | | | | (3,501,571 | ) |
Net unrealized appreciation (depreciation) on investment transactions during the period | | | 33,488,081 | | | | 65,108,493 | |
| | |
|
|
| |
|
|
|
Net increase (decrease) in net assets resulting from operations | | | 46,830,273 | | | | 62,013,141 | |
| | |
|
|
| |
|
|
|
Distributions to shareholders from: | | | | | | | | |
| | |
Net investment income: | | | | | | | | |
| | |
Class A | | | (501,729 | ) | | | (133,861 | ) |
| | |
Portfolio share transactions: | | | | | | | | |
| | |
Class A | | | | | | | | |
| | |
Proceeds from shares sold | | | 33,267,780 | | | | 36,495,865 | |
Reinvestment of distributions | | | 501,729 | | | | 133,861 | |
Cost of shares redeemed | | | (26,576,758 | ) | | | (33,146,972 | ) |
| | |
|
|
| |
|
|
|
Net increase (decrease) in net assets from Class A share transactions | | | 7,192,751 | | | | 3,482,754 | |
| | |
|
|
| |
|
|
|
Class B | | | | | | | | |
| | |
Proceeds from shares sold | | | 9,197,327 | | | | 6,497,655 | |
Cost of shares redeemed | | | (3,074,994 | ) | | | (1,234,627 | ) |
| | |
|
|
| |
|
|
|
Net increase (decrease) in net assets from Class B share transactions | | | 6,122,333 | | | | 5,263,028 | |
| | |
|
|
| |
|
|
|
Increase (decrease) in net assets | | | 59,643,628 | | | | 70,625,062 | |
Net assets at beginning of period | | | 196,042,751 | | | | 125,417,689 | |
| | |
|
|
| |
|
|
|
Net assets at end of period (including undistributed net investment income of $111,958 and $396,318, respectively) | | $ | 255,686,379 | | | $ | 196,042,751 | |
| | |
|
|
| |
|
|
|
Other Information | | | | | | | | |
| | |
Class A | | | | | | | | |
| | |
Shares outstanding at beginning of period | | | 17,610,512 | | | | 17,358,587 | |
Shares sold | | | 2,966,838 | | | | 4,275,233 | |
Shares issued to shareholders in reinvestment of distributions | | | 46,673 | | | | 18,413 | |
Shares redeemed | | | (2,453,101 | ) | | | (4,041,721 | ) |
Net increase (decrease) in Portfolio shares | | | 560,410 | | | | 251,925 | |
| | |
|
|
| |
|
|
|
Shares outstanding at end of period | | | 18,170,922 | | | | 17,610,512 | |
| | |
|
|
| |
|
|
|
Class B | | | | | | | | |
| | |
Shares outstanding at beginning of period | | | 1,289,405 | | | | 645,610 | |
Shares sold | | | 862,506 | | | | 796,263 | |
Shares redeemed | | | (279,978 | ) | | | (152,468 | ) |
| | |
|
|
| |
|
|
|
Net increase (decrease) in Portfolio shares | | | 582,528 | | | | 643,795 | |
| | |
|
|
| |
|
|
|
Shares outstanding at end of period | | | 1,871,933 | | | | 1,289,405 | |
| | |
|
|
| |
|
|
|
The accompanying notes are an integral part of the financial statements.
93
Financial Highlights
Global Discovery Portfolio
Class A
| | | | | | | | | | | | | | | | | | | | |
Years Ended December 31,
| | 2004
| | | 2003
| | | 2002
| | | 2001
| | | 2000
| |
Selected Per Share Data | | | | | | | | | | | | | | | | | | | | |
Net asset value, beginning of period | | $ | 10.38 | | | $ | 6.97 | | | $ | 8.70 | | | $ | 11.76 | | | $ | 13.18 | |
| | |
|
|
| |
|
|
| |
|
|
| |
|
|
| |
|
|
|
Income (loss) from investment operations: | | | | | | | | | | | | | | | | | | | | |
| | | | | |
Net investment income (loss)a | | | .01 | | | | .02 | | | | (.00 | )b | | | (.00 | )b | | | (.03 | ) |
Net realized and unrealized gain (loss) on investment transactions | | | 2.41 | | | | 3.40 | | | | (1.73 | ) | | | (2.87 | ) | | | (.62 | ) |
| | |
|
|
| |
|
|
| |
|
|
| |
|
|
| |
|
|
|
Total from investment operations | | | 2.42 | | | | 3.42 | | | | (1.73 | ) | | | (2.87 | ) | | | (.65 | ) |
| | |
|
|
| |
|
|
| |
|
|
| |
|
|
| |
|
|
|
Less distributions from: | | | | | | | | | | | | | | | | | | | | |
| | | | | |
Net investment income | | | (.03 | ) | | | (.01 | ) | | | — | | | | — | | | | (.11 | ) |
Net realized gains on investment transactions | | | — | | | | — | | | | — | | | | (.19 | ) | | | (.66 | ) |
| | |
|
|
| |
|
|
| |
|
|
| |
|
|
| |
|
|
|
Total distributions | | | (.03 | ) | | | (.01 | ) | | | — | | | | (.19 | ) | | | (.77 | ) |
| | |
|
|
| |
|
|
| |
|
|
| |
|
|
| |
|
|
|
Net asset value, end of period | | $ | 12.77 | | | $ | 10.38 | | | $ | 6.97 | | | $ | 8.70 | | | $ | 11.76 | |
| | |
|
|
| |
|
|
| |
|
|
| |
|
|
| |
|
|
|
Total Return (%) | | | 23.35 | | | | 49.09 | | | | (19.89 | ) | | | (24.59 | ) | | | (5.29 | ) |
| | |
|
|
| |
|
|
| |
|
|
| |
|
|
| |
|
|
|
Ratios to Average Net Assets and Supplemental Data | | | | | | | | | | | | | | | | | | | | |
Net assets, end of period ($ millions) | | | 232 | | | | 183 | | | | 121 | | | | 150 | | | | 159 | |
Ratio of expenses before expense reductions (%) | | | 1.18 | | | | 1.18 | | | | 1.19 | | | | 1.23 | c | | | 1.28 | |
Ratio of expenses after expense reductions (%) | | | 1.18 | | | | 1.18 | | | | 1.19 | | | | 1.22 | c | | | 1.28 | |
Ratio of net investment income (loss) (%) | | | .09 | | | | .28 | | | | (.03 | ) | | | .00 | d | | | (.25 | ) |
Portfolio turnover rate (%) | | | 24 | | | | 41 | | | | 47 | | | | 56 | | | | 66 | |
Class B
| | | | | | | | | | | | | | | | | | | |
Years Ended December 31,
| | 2004
| | | 2003
| | 2002
| | | 2001
| | | 2000
| |
Selected Per Share Data | | | | | | | | | | | | | | | | | | | |
Net asset value, beginning of period | | $ | 10.25 | | | $ | 6.89 | | $ | 8.62 | | | $ | 11.69 | | | $ | 13.11 | |
| | |
|
|
| |
|
| |
|
|
| |
|
|
| |
|
|
|
Income (loss) from investment operations: | | | | | | | | | | | | | | | | | | | |
| | | | | |
Net investment income (loss)a | | | (.01 | ) | | | .00b | | | (.02 | ) | | | (.02 | ) | | | (.07 | ) |
Net realized and unrealized gain (loss) on investment transactions | | | 2.38 | | | | 3.36 | | | (1.71 | ) | | | (2.86 | ) | | | (.61 | ) |
| | |
|
|
| |
|
| |
|
|
| |
|
|
| |
|
|
|
Total from investment operations | | | 2.37 | | | | 3.36 | | | (1.73 | ) | | | (2.88 | ) | | | (.68 | ) |
| | |
|
|
| |
|
| |
|
|
| |
|
|
| |
|
|
|
Less distributions from: | | | | | | | | | | | | | | | | | | | |
| | | | | |
Net investment income | | | — | | | | — | | | — | | | | — | | | | (.08 | ) |
Net realized gains on investment transactions | | | — | | | | — | | | — | | | | (.19 | ) | | | (.66 | ) |
| | |
|
|
| |
|
| |
|
|
| |
|
|
| |
|
|
|
Total distributions | | | — | | | | — | | | — | | | | (.19 | ) | | | (.74 | ) |
| | |
|
|
| |
|
| |
|
|
| |
|
|
| |
|
|
|
Net asset value, end of period | | $ | 12.62 | | | $ | 10.25 | | $ | 6.89 | | | $ | 8.62 | | | $ | 11.69 | |
| | |
|
|
| |
|
| |
|
|
| |
|
|
| |
|
|
|
Total Return (%) | | | 23.12 | e | | | 48.77 | | | (20.07 | ) | | | (24.96 | ) | | | (5.42 | ) |
| | |
|
|
| |
|
| |
|
|
| |
|
|
| |
|
|
|
Ratios to Average Net Assets and Supplemental Data | | | | | | | | | | | | | | | | | | | |
Net assets, end of period ($ millions) | | | 24 | | | | 13 | | | 4 | | | | 7 | | | | 11 | |
Ratio of expenses before expense reductions (%) | | | 1.52 | | | | 1.43 | | | 1.44 | | | | 1.48 | c | | | 1.53 | |
Ratio of expenses after expense reductions (%) | | | 1.39 | | | | 1.43 | | | 1.44 | | | | 1.47 | c | | | 1.53 | |
Ratio of net investment income (loss) (%) | | | (.12 | ) | | | .03 | | | (.28 | ) | | | (.25 | ) | | | (.52 | ) |
Portfolio turnover rate (%) | | | 24 | | | | 41 | | | 47 | | | | 56 | | | | 66 | |
| a | Based on average shares outstanding during the period. |
| b | Less than $.005 per share |
| c | The ratios of operating expenses excluding costs incurred in connection with a fund complex reorganization before and after expense reductions were 1.22% and 1.22%, and 1.47% and 1.47% for Class A and Class B, respectively. |
| e | Total return would have been less had certain expenses not been reduced. |
94
Performance Summary December 31, 2004
International Portfolio
All performance shown is historical, assumes reinvestment of all dividends and capital gains, and does not guarantee future results. Investment return and principal value fluctuate with changing market conditions so that, when redeemed, shares may be worth more or less then their original cost. Current performance may be lower or higher than the performance data quoted. Please visit scudder.com for the product’s most recent month-end performance. Performance doesn’t reflect charges and fees (“contract charges”) associated with the separate account that invests in the portfolio or any variable life insurance policy or variable annuity contract for which the portfolio is an investment option. These charges and fees will reduce returns.
This Portfolio is subject to stock market risk. Investing in foreign securities presents certain unique risks not associated with domestic investments, such as currency fluctuation, political and economic changes and market risks. This may result in greater share price volatility. Please read this Portfolio’s prospectus for specific details regarding its investments and risk profile.
The investment advisor has agreed to either limit, waive or reduce certain fees temporarily for this Portfolio; see the prospectus for complete details. Without such limits, waivers or reductions, the performance figures for Class B for this Portfolio would be lower.
Growth of an Assumed $10,000 Investment
| ¨ | International Portfolio — Class A |
| ¨ | MSCI EAFE® + Canada Index |

Yearly periods ended December 31
The Morgan Stanley Capital International (MSCI) Europe, Australasia, the Far East (EAFE®) + Canada Index is an unmanaged capitalization - weighted measure of stock markets in Europe, Australia, the Far East and Canada. Effective on July 12, 2004, MSCI EAFE Index replaced the MSCI EAFE + Canada Index as the portfolio’s benchmark index because the advisor believes it is more appropriate to measure the portfolio’s performance against the MSCI EAFE Index as it more accurately reflects the portfolio’s investment strategy. The index is calculated using closing local market prices and converts to US dollars using the London close foreign exchange rates. Index returns assume the reinvestment of dividends net of withholding tax and, unlike Portfolio returns, do not reflect any fees or expenses. It is not possible to invest directly into an index.
Comparative Results (as of December 31, 2004)
| | | | | | | | | | | | | | | | |
International Portfolio
| | 1-Year
| | | 3-Year
| | | 5-Year
| | | 10-Year
| |
Class A | | | | | | | | | | | | | | | | |
Growth of $10,000 | | $ | 11,653 | | | $ | 12,153 | | | $ | 6,579 | | | $ | 16,755 | |
Average annual total return | | | 16.53 | % | | | 6.72 | % | | | -8.03 | % | | | 5.30 | % |
| | | | |
MSCI EAFE® + Canada Index | | | | | | | | | | | | | | | | |
Growth of $10,000 | | $ | 12,038 | | | $ | 14,132 | | | $ | 9,623 | | | $ | 17,810 | |
Average annual total return | | | 20.38 | % | | | 12.22 | % | | | -.77 | % | | | 5.94 | % |
| | | | |
MSCI EAFE® Index | | | | | | | | | | | | | | | | |
Growth of $10,000 | | $ | 12,025 | | | $ | 14,008 | | | $ | 9,445 | | | $ | 17,273 | |
Average annual total return | | | 20.25 | % | | | 11.89 | % | | | -1.13 | % | | | 5.62 | % |
| | | | |
International Portfolio
| | 1-Year
| | | 3-Year
| | | 5-Year
| | | Life of Class*
| |
Class B | | | | | | | | | | | | | | | | |
Growth of $10,000 | | $ | 11,624 | | | $ | 12,063 | | | $ | 6,519 | | | $ | 12,160 | |
Average annual total return | | | 16.24 | % | | | 6.45 | % | | | -8.20 | % | | | 2.59 | % |
| | | | |
MSCI EAFE® + Canada Index | | | | | | | | | | | | | | | | |
Growth of $10,000 | | $ | 12,038 | | | $ | 14,132 | | | $ | 9,623 | | | $ | 14,161 | |
Average annual total return | | | 20.38 | % | | | 12.22 | % | | | -.77 | % | | | 4.70 | % |
| | | | |
MSCI EAFE® Index | | | | | | | | | | | | | | | | |
Growth of $10,000 | | $ | 12,025 | | | $ | 14,008 | | | $ | 9,445 | | | $ | 13,896 | |
Average annual total return | | | 20.25 | % | | | 11.89 | % | | | -1.13 | % | | | 4.43 | % |
The growth of $10,000 is cumulative.
| * | The Portfolio commenced selling Class B shares on May 8, 1997. Index returns begin May 31, 1997. |
95
Information About Your Portfolio’s Expenses
International Portfolio
As an investor of the Portfolio, you incur two types of costs: ongoing expenses and transaction costs. Ongoing expenses include management fees, distribution and service (12b-1) fees and other Portfolio expenses. Examples of transaction costs include sales charges (loads), redemption fees and account maintenance fees, which are not shown in this section. The following tables are intended to help you understand your ongoing expenses (in dollars) of investing in the Portfolio and to help you compare these expenses with the ongoing expenses of investing in other mutual funds. In the most recent six-month period, the Class B limited these expenses; had it not done so, expenses would have been higher. The tables are based on an investment of $1,000 made at the beginning of the six-month period ended December 31, 2004.
The tables illustrate your Portfolio’s expenses in two ways:
Actual Portfolio Return. This helps you estimate the actual dollar amount of ongoing expenses (but not transaction costs) paid on a $1,000 investment in the Portfolio using the Portfolio’s actual return during the period. To estimate the expenses you paid over the period, simply divide your account value by $1,000 (for example, an $8,600 account value divided by $1,000 = 8.6), then multiply the result by the number in the “Expenses Paid per $1,000” line under the share class you hold.
Hypothetical 5% Portfolio Return. This helps you to compare your Portfolio’s ongoing expenses (but not transaction costs) with those of other mutual funds using the Portfolio’s actual expense ratio and a hypothetical rate of return of 5% per year before expenses. Examples using a 5% hypothetical portfolio return may be found in the shareholder reports of other mutual funds. The hypothetical account values and expenses may not be used to estimate the actual ending account balance or expenses you paid for the period.
Please note that the expenses shown in these tables are meant to highlight your ongoing expenses only and do not reflect any transaction costs. The “Expenses Paid per $1,000” line of the tables is useful in comparing ongoing expenses only and will not help you determine the relative total expense of owning different funds. If these transaction costs had been included, your costs would have been higher.
Expenses and Value of a $1,000 Investment for the six months ended December 31, 2004
| | | | | | |
| | | Class A
| | Class B
|
Actual Portfolio Return | | | | | | |
Beginning Account Value 7/1/04 | | $ | 1,000.00 | | $ | 1,000.00 |
Ending Account Value 12/31/04 | | $ | 1,140.50 | | $ | 1,139.40 |
Expenses Paid per $1,000* | | $ | 5.73 | | $ | 7.37 |
| | |
| | | Class A
| | Class B
|
Hypothetical 5% Portfolio Return | | | | | | |
Beginning Account Value 7/1/04 | | $ | 1,000.00 | | $ | 1,000.00 |
Ending Account Value 12/31/04 | | $ | 1,019.85 | | $ | 1,018.31 |
Expenses Paid per $1,000* | | $ | 5.40 | | $ | 6.96 |
| * | Expenses are equal to the Portfolio’s annualized expense ratio for each share class, multiplied by the average account value over the period, multiplied by the number of days in the most recent six-month period, then divided by 365. |
| | | | | | |
| | | Class A
| | | Class B
| |
Annualized Expense Ratios | | | | | | |
Scudder Variable Series I — International Portfolio | | 1.06 | % | | 1.37 | % |
For more information, please refer to the Portfolio’s prospectus.
96
Management Summary December 31, 2004
International Portfolio
International equities delivered robust performance during 2004, as the continued strength in corporate earnings and worldwide economic growth provided a positive underpinning for the markets. Dollar-based investors gained an additional boost to returns from the rising value of foreign currencies in relation to the change to the US dollar. The portfolio produced a positive absolute return of 16.53% (Class A shares, unadjusted for contract charges), but lagged the 20.25% return of the MSCI EAFE Index.
Performance was helped by favorable stock selection within technology, where the stocks in the portfolio provided a return approximately three times that of the tech stocks in the benchmark. Returns were also helped considerably by the strong performance of our holdings in the materials sector, as stocks such as BHP Billiton PLC (1.7% of assets as of December 31), Companhia Vale do Rio Doce SA (1.3%), POSCO (0.5%) and Nippon Steel Corp. (1.4%) benefited from rising demand from China. Performance was hurt by our stock selection in the consumer discretionary area, where key detractors were Japanese stocks — such as Sharp Corp. (0.6%) and Nissan Motor Co., Ltd. (1.4%) — whose export revenues were hurt by the strength of the yen. Selection within health care also detracted, particularly a position in AstraZeneca PLC (1.2%).
We continue to emphasize companies whose pricing power will enable them to pass on rising input costs, which in turn will allow them to maintain their profit margins amid an environment of slow to moderate demand growth. In addition, we continue to look for opportunities to invest in companies positioned to capitalize on the rapid growth of Asian consumer spending.
Alex Tedder Matthias Knerr
Lead Manager Sangita Uberoi
Managers
All performance shown is historical, assumes reinvestment of all dividends and capital gains, and does not guarantee future results. Investment return and principal value fluctuate with changing market conditions so that, when redeemed, shares may be worth more or less then their original cost. Current performance may be lower or higher than the performance data quoted. Please visit scudder.com for the product’s most recent month-end performance. Performance doesn’t reflect charges and fees (“contract charges”) associated with the separate account that invests in the portfolio or any variable life insurance policy or variable annuity contract for which the portfolio is an investment option. These charges and fees will reduce returns.
97
Risk Considerations
This portfolio is subject to stock market risk. Investing in foreign securities presents certain unique risks not associated with domestic investments, such as currency fluctuation, political and economic changes and market risks. This may result in greater share price volatility. Please read this portfolio’s prospectus for specific details regarding its investments and risk profile.
Morgan Stanley Capital International (MSCI) Europe, Australia, Far East (EAFE) Index is an unmanaged capitalization-weighted measure of stock markets in Europe, Australia and the Far East. The index is calculated using closing local market prices and converts to US dollars using the London close foreign exchange rates.
Effective July 12, 2004, the Morgan Stanley Capital International (MSCI) Europe, Australasia, Far East (EAFE) Index replaced the MSCI EAFE & Canada Index as the portfolio’s benchmark index because the advisor believes it is more appropriate to measure the portfolio’s performance against the MSCI EAFE Index as it more accurately reflects the portfolio’s investment strategy. The index is calculated using closing local market prices and converts to US dollars using the London close foreign exchange rates. For the year ended December 31, 2004, the MSCI EAFE & Canada Index returned 20.38%.
Index returns assume the reinvestment of dividends and, unlike portfolio returns, do not reflect any fees or expenses. It is not possible to invest directly into an index.
Portfolio management market commentary is as of December 31, 2004, and may not come to pass. This information is subject to change at any time based on market and other conditions.
98
Portfolio Summary
International Portfolio
| | | | | | |
Asset Allocation (Excludes Securities Lending Collateral) | | | | | | |
| | |
| | | 12/31/04
| | | 12/31/03
| |
Common Stocks | | 100 | % | | 98 | % |
Preferred Stocks | | — | | | 1 | % |
Cash Equivalents | | — | | | 1 | % |
| | |
|
| |
|
|
| | | 100 | % | | 100 | % |
| | |
|
| |
|
|
| | |
Geographical Diversification (Excludes Cash Equivalents and Securities Lending Collateral) | | | | | | |
| | |
| | | 12/31/04
| | | 12/31/03
| |
Europe (excluding United Kingdom) | | 47 | % | | 49 | % |
Japan | | 23 | % | | 19 | % |
United Kingdom | | 21 | % | | 22 | % |
Pacific Basin | | 6 | % | | 6 | % |
Latin America | | 2 | % | | 2 | % |
Australia | | 1 | % | | 1 | % |
Africa | | — | | | 1 | % |
| | |
|
| |
|
|
| | | 100 | % | | 100 | % |
| | |
|
| |
|
|
| | |
Sector Diversification (Excludes Cash Equivalents and Securities Lending Collateral) | | | | | | |
| | |
| | | 12/31/04
| | | 12/31/03
| |
Financials | | 30 | % | | 28 | % |
Consumer Discretionary | | 13 | % | | 11 | % |
Energy | | 10 | % | | 8 | % |
Health Care | | 9 | % | | 9 | % |
Telecommunication Services | | 8 | % | | 10 | % |
Information Technology | | 7 | % | | 9 | % |
Industrials | | 7 | % | | 10 | % |
Materials | | 6 | % | | 7 | % |
Utilities | | 5 | % | | 3 | % |
Consumer Staples | | 5 | % | | 5 | % |
| | |
|
| |
|
|
| | | 100 | % | | 100 | % |
| | |
|
| |
|
|
Asset allocation, geographical diversification and sector diversification are subject to change.
For more complete details about the Portfolio’s investment portfolio, see page 95. A quarterly Fact Sheet is available upon request. Information concerning portfolio holdings of the Portfolio as of month-end will be posted to scudder.com on the 15th of the following month. Please call 1-800-778-1482.
Following the Portfolio’s fiscal first and third quarter-end, a complete portfolio holdings listing is filed with the SEC on Form N-Q. The form will be available on the SEC’s Web site at www.sec.gov, and it also may be reviewed and copied at the SEC’s Public Reference Room in Washington, D.C. Information on the operation of the SEC’s Public Reference Room may be obtained by calling (800) SEC-0330.
99
Investment Portfolio as of December 31, 2004
International Portfolio
| | | | |
| | | Shares
| | Value ($)
|
Common Stocks 98.4% | | | | |
| | |
Australia 1.4% | | | | |
Australia & New Zealand Banking Group Ltd. (Cost $6,304,217) | | 484,092 | | 7,813,487 |
| | | | |
|
Austria 1.1% | | | | |
Wienerberger AG (Cost $4,306,475) | | 129,371 | | 6,181,039 |
| | | | |
|
Brazil 1.7% | | | | |
Companhia Vale do Rio Doce SA (ADR) | | 245,006 | | 7,107,624 |
Petroleo Brasileiro SA (ADR) | | 70,000 | | 2,784,600 |
| | | | |
|
(Cost $4,918,652) | | | | 9,892,224 |
| | | | |
|
Finland 0.9% | | | | |
Nokia Oyj | | 187,357 | | 2,959,207 |
Nokia Oyj (ADR) | | 128,290 | | 2,010,304 |
| | | | |
|
(Cost $5,651,581) | | | | 4,969,511 |
| | | | |
|
France 8.1% | | | | |
BNP Paribas SA | | 125,370 | | 9,082,807 |
France Telecom SA | | 246,100 | | 8,148,696 |
PSA Peugeot Citroen | | 51,230 | | 3,251,925 |
Sanofi-Aventis | | 104,730 | | 8,370,428 |
Total SA (c) | | 79,513 | | 17,368,138 |
| | | | |
|
(Cost $32,498,394) | | | | 46,221,994 |
| | | | |
|
Germany 6.6% | | | | |
Adidas-Salomon AG | | 37,200 | | 6,004,485 |
E.ON AG (c) | | 145,706 | | 13,281,289 |
Hypo Real Estate Holdings AG* | | 179,000 | | 7,420,824 |
Metro AG (c) | | 116,850 | | 6,430,959 |
Siemens AG | | 51,470 | | 4,364,141 |
| | | | |
|
(Cost $27,300,444) | | | | 37,501,698 |
| | | | |
|
Greece 2.0% | | | | |
Alpha Bank AE | | 185,522 | | 6,470,701 |
Hellenic Telecommunications Organization SA | | 280,520 | | 5,040,743 |
| | | | |
|
(Cost $7,749,574) | | | | 11,511,444 |
| | | | |
|
Hong Kong 1.9% | | | | |
Esprit Holdings Ltd. | | 1,271,748 | | 7,690,012 |
Yue Yuen Industrial (Holdings) Ltd. | | 1,020,000 | | 2,801,729 |
| | | | |
|
(Cost $8,064,895) | | | | 10,491,741 |
| | | | |
|
Hungary 0.9% | | | | |
OTP Bank Rt (GDR) (Cost $1,828,875) | | 86,457 | | 5,273,877 |
| | | | |
|
India 1.4% | | | | |
ICICI Ltd. | | 454,102 | | 3,803,246 |
Reliance Industries Ltd. | | 345,000 | | 4,236,508 |
| | | | |
|
(Cost $7,289,137) | | | | 8,039,754 |
| | | | |
|
Indonesia 0.7% | | | | |
PT Telekomunikasi Indonesia (ADR) (Cost $3,985,984) | | 178,000 | | 3,741,560 |
| | | | |
|
100
| | | | |
| | | Shares
| | Value ($)
|
Italy 5.1% | | | | |
Banca Intesa SpA | | 1,567,400 | | 7,541,928 |
Enel SpA | | 348,738 | | 3,427,179 |
Eni SpA | | 465,920 | | 11,665,416 |
Terna SpA (c) | | 2,290,050 | | 6,567,902 |
| | | | |
|
(Cost $20,471,018) | | | | 29,202,425 |
| | | | |
|
Japan 22.6% | | | | |
Aiful Corp. | | 38,656 | | 4,251,519 |
Canon, Inc. | | 207,700 | | 11,208,949 |
Credit Saison Co., Ltd. | | 85,000 | | 3,094,076 |
Dai Nippon Printing Co., Ltd. | | 186,390 | | 2,990,389 |
Daito Trust Construction Co., Ltd. | | 67,700 | | 3,217,517 |
FANUC Ltd. | | 69,000 | | 4,511,564 |
Hoya Corp. | | 58,500 | | 6,605,299 |
Kirin Brewery Co., Ltd. | | 469,667 | | 4,624,710 |
Mitsubishi Corp. | | 877,000 | | 11,331,590 |
Mitsubishi Tokyo Financial Group, Inc. | | 636 | | 6,454,963 |
Mitsui Fudosan Co., Ltd. | | 473,000 | | 5,746,902 |
Mizuho Financial Group, Inc. | | 2,172 | | 10,937,367 |
Nippon Mining Holdings, Inc. | | 552,000 | | 2,596,506 |
Nippon Steel Corp. (c) | | 3,247,629 | | 7,955,059 |
Nissan Motor Co., Ltd. | | 694,157 | | 7,546,510 |
Sega Sammy Holdings, Inc. (c) | | 82,200 | | 4,516,307 |
Sharp Corp. | | 212,269 | | 3,465,659 |
Sony Corp. | | 131,016 | | 5,063,173 |
Toyota Motor Corp. | | 389,500 | | 15,850,639 |
Yamanouchi Pharmaceutical Co., Ltd. (c) | | 168,141 | | 6,547,112 |
| | | | |
|
(Cost $100,247,019) | | | | 128,515,810 |
| | | | |
|
Korea 1.3% | | | | |
POSCO | | 15,260 | | 2,756,588 |
Samsung Electronics Co., Ltd. | | 10,127 | | 4,407,084 |
| | | | |
|
(Cost $3,400,853) | | | | 7,163,672 |
| | | | |
|
Netherlands 3.2% | | | | |
ING Groep NV | | 435,928 | | 13,189,829 |
Koninklijke (Royal) Philips Electronics NV | | 189,230 | | 5,018,183 |
| | | | |
|
(Cost $13,202,393) | | | | 18,208,012 |
| | | | |
|
Norway 1.7% | | | | |
DNB NOR ASA | | 362,675 | | 3,577,858 |
Statoil ASA | | 374,188 | | 5,869,228 |
| | | | |
|
(Cost $7,576,649) | | | | 9,447,086 |
| | | | |
|
Russia 0.7% | | | | |
Gazprom “S” (ADR) (Cost $3,826,258) | | 105,800 | | 3,755,900 |
| | | | |
|
Singapore 0.8% | | | | |
DBS Group Holdings Ltd. (Cost $4,531,753) | | 465,000 | | 4,586,192 |
| | | | |
|
Spain 2.1% | | | | |
Telefonica SA (Cost $6,661,728) | | 625,100 | | 11,776,384 |
| | | | |
|
101
| | | | | | |
| | | Shares
| | | Value ($)
| |
Sweden 1.2% | | | | | | |
Telefonaktiebolaget LM Ericsson “B” (c)* (Cost $2,489,579) | | 2,129,537 | | | 6,793,599 | |
| | | | | |
|
|
Switzerland 10.7% | | | | | | |
Credit Suisse Group | | 162,200 | | | 6,818,363 | |
Nestle SA (Registered) | | 56,379 | | | 14,750,464 | |
Novartis AG (Registered) | | 152,475 | | | 7,683,421 | |
Roche Holding AG | | 96,990 | | | 11,165,237 | |
UBS AG (Registered) | | 173,897 | | | 14,581,900 | |
Zurich Financial Services AG* | | 35,700 | | | 5,952,616 | |
| | | | | |
|
|
(Cost $43,653,253) | | | | | 60,952,001 | |
| | | | | |
|
|
Taiwan 0.8% | | | | | | |
Hon Hai Precision Industry Co., Ltd. (Cost $3,876,796) | | 984,000 | | | 4,564,468 | |
| | | | | |
|
|
Thailand 0.6% | | | | | | |
Bangkok Bank PCL (Foreign Registered) (Cost $2,865,369) | | 1,107,165 | | | 3,248,824 | |
| | | | | |
|
|
United Kingdom 20.9% | | | | | | |
AstraZeneca PLC | | 188,576 | | | 6,839,075 | |
BAA PLC | | 434,555 | | | 4,872,329 | |
BHP Billiton PLC | | 840,230 | | | 9,848,336 | |
GlaxoSmithKline PLC | | 263,996 | | | 6,193,663 | |
HSBC Holdings PLC | | 872,587 | | | 14,725,722 | |
Imperial Tobacco Group PLC | | 297,000 | | | 8,136,908 | |
National Grid Transco PLC | | 639,270 | | | 6,087,584 | |
Prudential PLC | | 744,976 | | | 6,479,171 | |
Royal Bank of Scotland Group PLC | | 457,319 | | | 15,382,692 | |
Shell Transport & Trading Co., PLC | | 1,712,976 | | | 14,602,030 | |
Smith & Nephew PLC | | 457,137 | | | 4,677,918 | |
Vodafone Group PLC | | 5,909,062 | | | 16,024,556 | |
WPP Group PLC | | 459,800 | | | 5,058,277 | |
| | | | | |
|
|
(Cost $90,717,681) | | | | | 118,928,261 | |
| | | | | |
|
|
Total Common Stocks
(Cost $413,418,577) | | | | | 558,780,963 | |
| | | | | |
|
|
Securities Lending Collateral 9.2% | | | | | | |
Daily Assets Fund Institutional 2.25% (b)(d) (Cost $52,676,654) | | 52,676,654 | | | 52,676,654 | |
| | | | | |
|
|
| | |
| | | % of
Net Assets
| | | Value ($)
| |
Total Investment Portfolio
(Cost $466,095,231) (a) | | 107.6 | | | 611,457,617 | |
| | |
Other Assets and Liabilities, Net | | (7.6 | ) | | (43,437,058 | ) |
| | |
|
| |
|
|
Net Assets | | 100.0 | | | 568,020,559 | |
| | |
|
| |
|
|
| * | Non-income producing security. |
| (a) | The cost for federal income tax purposes was $471,674,698. At December 31, 2004, net unrealized appreciation for all securities based on tax cost was $139,782,919. This consisted of aggregate gross unrealized appreciation for all securities in which there was an excess of value over tax cost of $141,696,625 and aggregate gross unrealized depreciation for all securities in which there was an excess of tax cost over value of $1,913,706. |
| (b) | Daily Assets Fund Institutional, an affiliated fund, is managed by Deutsche Asset Management, Inc. The rate shown is the annualized seven-day yield at period end. |
| (c) | All or a portion of these securities were on loan (see Notes to Financial Statements). The value of all securities loaned at December 31, 2004 amounted to $50,136,838, which is 8.8% of total net assets. |
| (d) | Represents collateral held in connection with securities lending. |
ADR: American Depositary Receipts
GDR: Global Depositary Receipts
Purchases and sales of investment securities (excluding short-term investments) for the years ended December 31, 2004 aggregated $368,418,412 and $381,395,485, respectively.
At December 31, 2004, the International Portfolio had a net tax basis capital loss carryforward of approximately $221,457,000 which may be applied against any realized net taxable capital gains of each succeeding year until fully utilized or until December 31, 2009 ($102,131,000), December 31, 2010 (105,374,000) and December 31, 2011 ($13,952,000), the respective expiration dates, whichever occurs first.
The accompanying notes are an integral part of the financial statements.
102
Financial Statements
International Portfolio
Statement of Assets and Liabilities as of December 31, 2004
| | | | |
Assets | | | | |
Investments: | | | | |
| |
Investments in securities, at value — including $50,136,838 of securities loaned (cost $413,418,577) | | $ | 558,780,963 | |
Investment in Daily Assets Fund Institutional (cost $52,676,654)* | | | 52,676,654 | |
| | |
|
|
|
Total investments in securities, at value
(cost $466,095,231) | | | 611,457,617 | |
| | |
|
|
|
Cash | | | 1,210,298 | |
Foreign currency, at value (cost $8,293,061) | | | 8,446,568 | |
Receivable for investments sold | | | 4,697,386 | |
Dividends receivable | | | 814,462 | |
Interest receivable | | | 19,369 | |
Receivable for Portfolio shares sold | | | 148,257 | |
Foreign taxes recoverable | | | 320,265 | |
Other assets | | | 16,435 | |
| | |
|
|
|
Total assets | | | 627,130,657 | |
| | |
|
|
|
Liabilities | | | | |
Payable upon return of securities loaned | | | 52,676,654 | |
Payable for investments purchased | | | 1,134,458 | |
Payable for Portfolio shares redeemed | | | 4,698,481 | |
Accrued management fee | | | 401,748 | |
Other accrued expenses and payables | | | 198,757 | |
| | |
|
|
|
Total liabilities | | | 59,110,098 | |
| | |
|
|
|
Net assets, at value | | $ | 568,020,559 | |
| | |
|
|
|
Net Assets | | | | |
Net assets consist of: | | | | |
| |
Undistributed net investment income | | | 7,025,372 | |
| |
Net unrealized appreciation (depreciation) on: | | | | |
Investments | | | 145,362,386 | |
Foreign currency related transactions | | | 232,550 | |
Accumulated net realized gain (loss) | | | (224,951,671 | ) |
Paid-in capital | | | 640,351,922 | |
| | |
|
|
|
Net assets, at value | | $ | 568,020,559 | |
| | |
|
|
|
Net Asset Value | | | | |
Class A | | | | |
Net Asset Value, offering and redemption price per share ($532,944,733 ÷ 56,078,328 outstanding shares of beneficial interest, no par value, unlimited number of shares authorized) | | $ | 9.50 | |
| | | | | |
Class B | | | | |
Net Asset Value, offering and redemption price per share ($35,075,826 ÷ 3,699,485 outstanding shares of beneficial interest, no par value, unlimited number of shares authorized) | | $ | 9.48 | |
| | | | | |
| * | Represents collateral on securities loaned. |
103
Statement of Operations for the year ended December 31, 2004
| | | | |
| Investment Income | | | | |
Income: | | | | |
| |
Dividends (net of foreign taxes withheld of $1,225,430) | | $ | 10,321,390 | |
Interest | | | 147,796 | |
Interest — Scudder Cash Management QP Trust | | | 21,092 | |
Securities lending income, including income from Daily Assets Fund Institutional | | | 325,201 | |
| | |
|
|
|
Total Income | | | 10,815,479 | |
| | |
|
|
|
Expenses: | | | | |
| |
Management fee | | | 4,489,153 | |
Custodian fees | | | 378,957 | |
Accounting fees | | | 372,264 | |
Distribution service fees (Class B) | | | 70,912 | |
Record keeping fees (Class B) | | | 25,287 | |
Auditing | | | 43,570 | |
Legal | | | 10,558 | |
Trustees’ fees and expenses | | | 14,866 | |
Reports to shareholders | | | 34,648 | |
Other | | | 43,680 | |
| | |
|
|
|
Total expenses, before expense reductions | | | 5,483,895 | |
| | |
|
|
|
Expense reductions | | | (13,797 | ) |
Total expenses, after expense reductions | | | 5,470,098 | |
| | |
|
|
|
Net investment income (loss) | | | 5,345,381 | |
| | |
|
|
|
Realized and Unrealized Gain (Loss) on Investment Transactions | | | | |
Net realized gain (loss) from: | | | | |
| |
Investments (net of foreign taxes of $99,642) | | | 32,348,305 | |
Foreign currency related transactions | | | 2,033,411 | |
Net increase from payments by affiliates and net losses realized on the disposal of investments in violation of restrictions | | | — | |
| | |
|
|
|
| | | | 34,381,716 | |
| | |
|
|
|
Net unrealized appreciation (depreciation) during the period on: | | | | |
| |
Investments | | | 41,879,708 | |
Foreign currency related transactions | | | (5,542 | ) |
| | | | 41,874,166 | |
| | |
|
|
|
Net gain (loss) on investment transactions | | | 76,255,882 | |
| | |
|
|
|
Net increase (decrease) in net assets resulting from operations | | $ | 81,601,263 | |
| | |
|
|
|
The accompanying notes are an integral part of the financial statements.
104
Statement of Changes in Net Assets
| | | | | | | | |
| | | Years Ended December 31,
| |
Increase (Decrease) in Net Assets
| | 2004
| | | 2003
| |
Operations: | | | | | | | | |
| | |
Net investment income (loss) | | $ | 5,345,381 | | | $ | 5,716,911 | |
Net realized gain (loss) on investment transactions | | | 34,381,716 | | | | (4,157,550 | ) |
Net unrealized appreciation (depreciation) on investment transactions during the period | | | 41,874,166 | | | | 111,190,364 | |
| | |
|
|
| |
|
|
|
Net increase (decrease) in net assets resulting from operations | | | 81,601,263 | | | | 112,749,725 | |
| | |
|
|
| |
|
|
|
Distributions to shareholders from: | | | | | | | | |
| | |
Net investment income: | | | | | | | | |
| | |
Class A | | | (6,363,976 | ) | | | (3,294,533 | ) |
Class B | | | (312,686 | ) | | | (65,246 | ) |
Portfolio share transactions: | | | | | | | | |
| | |
Class A | | | | | | | | |
Proceeds from shares sold | | | 57,653,358 | | | | 144,783,011 | |
Reinvestment of distributions | | | 6,363,976 | | | | 3,294,533 | |
Cost of shares redeemed | | | (86,826,684 | ) | | | (179,951,683 | ) |
| | |
|
|
| |
|
|
|
Net increase (decrease) in net assets from Class A share transactions | | | (22,809,350 | ) | | | (31,874,139 | ) |
| | |
|
|
| |
|
|
|
| | |
Class B | | | | | | | | |
Proceeds from shares sold | | | 19,706,198 | | | | 13,693,862 | |
Reinvestment of distributions | | | 312,686 | | | | 65,246 | |
Cost of shares redeemed | | | (13,535,303 | ) | | | (1,831,157 | ) |
| | |
|
|
| |
|
|
|
Net increase (decrease) in net assets from Class B share transactions | | | 6,483,581 | | | | 11,927,951 | |
| | |
|
|
| |
|
|
|
Increase (decrease) in net assets | | | 58,598,832 | | | | 89,443,758 | |
Net assets at beginning of period | | | 509,421,727 | | | | 419,977,969 | |
| | |
|
|
| |
|
|
|
Net assets at end of period (including undistributed net investment income of $7,025,372 and $6,422,885, respectively) | | $ | 568,020,559 | | | $ | 509,421,727 | |
| | |
|
|
| |
|
|
|
Other Information | | | | | | | | |
| | |
Class A | | | | | | | | |
Shares outstanding at beginning of period | | | 58,747,179 | | | | 63,268,457 | |
Shares sold | | | 6,770,517 | | | | 21,527,511 | |
Shares issued to shareholders in reinvestment of distributions | | | 763,983 | | | | 522,046 | |
Shares redeemed | | | (10,203,351 | ) | | | (26,570,835 | ) |
Net increase (decrease) in Portfolio shares | | | (2,668,851 | ) | | | (4,521,278 | ) |
| | |
|
|
| |
|
|
|
Shares outstanding at end of period | | | 56,078,328 | | | | 58,747,179 | |
| | |
|
|
| |
|
|
|
| | |
Class B | | | | | | | | |
Shares outstanding at beginning of period | | | 2,910,661 | | | | 1,173,516 | |
Shares sold | | | 2,359,763 | | | | 1,976,109 | |
Shares issued to shareholders in reinvestment of distributions | | | 37,537 | | | | 10,356 | |
Shares redeemed | | | (1,608,476 | ) | | | (249,320 | ) |
| | |
|
|
| |
|
|
|
Net increase (decrease) in Portfolio shares | | | 788,824 | | | | 1,737,145 | |
| | |
|
|
| |
|
|
|
Shares outstanding at end of period | | | 3,699,485 | | | | 2,910,661 | |
| | |
|
|
| |
|
|
|
The accompanying notes are an integral part of the financial statements.
105
Financial Highlights
International Portfolio
Class A
| | | | | | | | | | | | | | | | | | | | |
Years Ended December 31,
| | 2004
| | | 2003
| | | 2002
| | | 2001
| | | 2000
| |
Selected Per Share Data | | | | | | | | | | | | | | | | | | | | |
Net asset value, beginning of period | | $ | 8.26 | | | $ | 6.52 | | | $ | 8.05 | | | $ | 14.26 | | | $ | 20.34 | |
| | |
|
|
| |
|
|
| |
|
|
| |
|
|
| |
|
|
|
Income (loss) from investment operations: | | | | | | | | | | | | | | | | | | | | |
| | | | | |
Net investment incomea | | | .09 | | | | .09 | | | | .05 | | | | .06 | | | | .08 | |
Net realized and unrealized gain (loss) on investment transactions | | | 1.26 | | | | 1.70 | | | | (1.52 | ) | | | (3.97 | ) | | | (4.24 | ) |
| | |
|
|
| |
|
|
| |
|
|
| |
|
|
| |
|
|
|
Total from investment operations | | | 1.35 | | | | 1.79 | | | | (1.47 | ) | | | (3.91 | ) | | | (4.16 | ) |
| | |
|
|
| |
|
|
| |
|
|
| |
|
|
| |
|
|
|
Less distributions from: | | | | | | | | | | | | | | | | | | | | |
| | | | | |
Net investment income | | | (.11 | ) | | | (.05 | ) | | | (.06 | ) | | | (.05 | ) | | | (.09 | ) |
Net realized gains on investment transactions | | | — | | | | — | | | | — | | | | (2.25 | ) | | | (1.83 | ) |
| | |
|
|
| |
|
|
| |
|
|
| |
|
|
| |
|
|
|
Total distributions | | | (.11 | ) | | | (.05 | ) | | | (.06 | ) | | | (2.30 | ) | | | (1.92 | ) |
| | |
|
|
| |
|
|
| |
|
|
| |
|
|
| |
|
|
|
Net asset value, end of period | | $ | 9.50 | | | $ | 8.26 | | | $ | 6.52 | | | $ | 8.05 | | | $ | 14.26 | |
| | |
|
|
| |
|
|
| |
|
|
| |
|
|
| |
|
|
|
Total Return (%) | | | 16.53 | | | | 27.75 | | | | (18.37 | ) | | | (30.86 | ) | | | (21.70 | ) |
| | |
|
|
| |
|
|
| |
|
|
| |
|
|
| |
|
|
|
Ratios to Average Net Assets and Supplemental Data | | | | | | | | | | | | | | | | | | | | |
Net assets, end of period ($ millions) | | | 533 | | | | 485 | | | | 412 | | | | 513 | | | | 720 | |
Ratio of expenses before expense reductions (%) | | | 1.04 | | | | 1.05 | | | | 1.03 | | | | 1.01 | b | | | .96 | |
Ratio of expenses after expense reductions (%) | | | 1.04 | | | | 1.05 | | | | 1.03 | | | | 1.00 | b | | | .96 | |
Ratio of net investment income (loss) (%) | | | 1.05 | | | | 1.32 | | | | .73 | | | | .64 | | | | .48 | |
Portfolio turnover rate (%) | | | 73 | | | | 119 | | | | 123 | | | | 105 | | | | 79 | |
Class B
| | | | | | | | | | | | | | | | | | | | |
Years Ended December 31,
| | 2004
| | | 2003
| | | 2002
| | | 2001
| | | 2000
| |
Selected Per Share Data | | | | | | | | | | | | | | | | | | | | |
Net asset value, beginning of period | | $ | 8.24 | | | $ | 6.50 | | | $ | 8.03 | | | $ | 14.19 | | | $ | 20.24 | |
| | |
|
|
| |
|
|
| |
|
|
| |
|
|
| |
|
|
|
Income (loss) from investment operations: | | | | | | | | | | | | | | | | | | | | |
| | | | | |
Net investment incomea | | | .06 | | | | .07 | | | | .04 | | | | .05 | | | | .04 | |
Net realized and unrealized gain (loss) on investment transactions | | | 1.27 | | | | 1.71 | | | | (1.53 | ) | | | (3.94 | ) | | | (4.22 | ) |
| | |
|
|
| |
|
|
| |
|
|
| |
|
|
| |
|
|
|
Total from investment operations | | | 1.33 | | | | 1.78 | | | | (1.49 | ) | | | (3.89 | ) | | | (4.18 | ) |
| | |
|
|
| |
|
|
| |
|
|
| |
|
|
| |
|
|
|
Less distributions from: | | | | | | | | | | | | | | | | | | | | |
| | | | | |
Net investment income | | | (.09 | ) | | | (.04 | ) | | | (.04 | ) | | | (.02 | ) | | | (.04 | ) |
Net realized gains on investment transactions | | | — | | | | — | | | | — | | | | (2.25 | ) | | | (1.83 | ) |
| | |
|
|
| |
|
|
| |
|
|
| |
|
|
| |
|
|
|
Total distributions | | | (.09 | ) | | | (.04 | ) | | | (.04 | ) | | | (2.27 | ) | | | (1.87 | ) |
| | |
|
|
| |
|
|
| |
|
|
| |
|
|
| |
|
|
|
Net asset value, end of period | | $ | 9.48 | | | $ | 8.24 | | | $ | 6.50 | | | $ | 8.03 | | | $ | 14.19 | |
| | |
|
|
| |
|
|
| |
|
|
| |
|
|
| |
|
|
|
Total Return (%) | | | 16.24 | c | | | 27.52 | | | | (18.62 | ) | | | (30.81 | ) | | | (21.89 | ) |
| | |
|
|
| |
|
|
| |
|
|
| |
|
|
| |
|
|
|
Ratios to Average Net Assets and Supplemental Data | | | | | | | | | | | | | | | | | | | | |
Net assets, end of period ($ millions) | | | 35 | | | | 24 | | | | 8 | | | | 3 | | | | .77 | |
Ratio of expenses before expense reductions (%) | | | 1.38 | | | | 1.32 | | | | 1.28 | | | | 1.26 | b | | | 1.21 | |
Ratio of expenses after expense reductions (%) | | | 1.35 | | | | 1.32 | | | | 1.28 | | | | 1.25 | b | | | 1.21 | |
Ratio of net investment income (loss) (%) | | | .74 | | | | 1.05 | | | | .48 | | | | .39 | | | | .23 | |
Portfolio turnover rate (%) | | | 73 | | | | 119 | | | | 123 | | | | 105 | | | | 79 | |
| a | Based on average shares outstanding during the period. |
| b | The ratios of operating expenses excluding costs incurred in connection with a fund complex reorganization before and after expense reductions were 1.00% and 1.00%, and 1.25% and 1.25% for Class A and Class B, respectively. |
| c | Total return would have been lower had certain expenses not been reduced. |
106
Performance Summary December 31, 2004
Health Sciences Portfolio
All performance shown is historical, assumes reinvestment of all dividends and capital gains, and does not guarantee future results. Investment return and principal value fluctuate with changing market conditions so that, when redeemed, shares may be worth more or less then their original cost. Current performance may be lower or higher than the performance data quoted. Please visit scudder.com for the product’s most recent month-end performance. Performance doesn’t reflect charges and fees (“contract charges”) associated with the separate account that invests in the portfolio or any variable life insurance policy or variable annuity contract for which the portfolio is an investment option. These charges and fees will reduce returns.
This portfolio is subject to stock market risk. The portfolio may focus its investments on certain industry sectors, thereby increasing its vulnerability to any single industry or regulatory development. All of these factors may result in greater share price volatility. Please read this portfolio’s prospectus for specific details regarding its investments and risk profile.
Growth of an Assumed $10,000 Investment
| ¨ | Health Sciences Portfolio — Class A* |
| ¨ | Goldman Sachs Healthcare Index |
The Standard & Poor’s 500 (S&P 500) Index is a capitalization-weighted index of 500 stocks. The index is designed to measure performance of the broad domestic economy through changes in the aggregate market value of 500 stocks representing all major industries. The Goldman Sachs Healthcare Index is a market capitalization-weighted index of 114 stocks designed to measure the performance of companies in the health care sector.
Index returns assume the reinvestment of dividends and, unlike Portfolio returns, do not reflect any fees or expenses. It is not possible to invest directly into an index.
Comparative Results (as of December 31, 2004)
| | | | | | | | | | | | |
Health Sciences Portfolio
| | 1-Year
| | | 3-Year
| | | Life of Portfolio*
| |
Class A | | | | | | | | | | | | |
Growth of $10,000 | | $ | 10,959 | | | $ | 11,268 | | | $ | 12,000 | |
Average annual total return | | | 9.59 | % | | | 4.06 | % | | | 5.10 | % |
| | | |
S&P 500 Index | | | | | | | | | | | | |
Growth of $10,000 | | $ | 11,088 | | | $ | 11,115 | | | $ | 10,310 | |
Average annual total return | | | 10.88 | % | | | 3.59 | % | | | .84 | % |
| | | |
Goldman Sachs Healthcare Index | | | | | | | | | | | | |
Growth of $10,000 | | $ | 10,627 | | | $ | 10,339 | | | $ | 10,590 | |
Average annual total return | | | 6.27 | % | | | 1.12 | % | | | 1.57 | % |
| | | |
Health Sciences Portfolio
| | 1-Year
| | | Life of Class**
| | | | |
Class B | | | | | | | | | | | | |
Growth of $10,000 | | $ | 10,917 | | | $ | 14,722 | | | | | |
Average annual total return | | | 9.17 | % | | | 16.71 | % | | | | |
| | | |
S&P 500 Index | | | | | | | | | | | | |
Growth of $10,000 | | $ | 11,088 | | | $ | 12,800 | | | | | |
Average annual total return | | | 10.88 | % | | | 10.38 | % | | | | |
| | | |
Goldman Sachs Healthcare Index | | | | | | | | | | | | |
Growth of $10,000 | | $ | 10,627 | | | $ | 12,678 | | | | | |
Average annual total return | | | 6.27 | % | | | 9.91 | % | | | | |
The growth of $10,000 is cumulative.
| * | The Portfolio commenced operations on May 1, 2001. Index returns begin April 30, 2001. Total returns would have been lower for the Life of Portfolio period for Class A shares if the Portfolio’s expenses were not maintained. |
| ** | The Portfolio commenced selling Class B shares on July 1, 2002. Index returns begin June 30, 2002. |
107
Information About Your Portfolio’s Expenses
Health Sciences Portfolio
As an investor of the Portfolio, you incur two types of costs: ongoing expenses and transaction costs. Ongoing expenses include management fees, distribution and service (12b-1) fees and other Portfolio expenses. Examples of transaction costs include sales charges (loads), redemption fees and account maintenance fees, which are not shown in this section. The following tables are intended to help you understand your ongoing expenses (in dollars) of investing in the Portfolio and to help you compare these expenses with the ongoing expenses of investing in other mutual funds. The tables are based on an investment of $1,000 made at the beginning of the six-month period ended December 31, 2004.
The tables illustrate your Portfolio’s expenses in two ways:
Actual Portfolio Return. This helps you estimate the actual dollar amount of ongoing expenses (but not transaction costs) paid on a $1,000 investment in the Portfolio using the Portfolio’s actual return during the period. To estimate the expenses you paid over the period, simply divide your account value by $1,000 (for example, an $8,600 account value divided by $1,000 = 8.6), then multiply the result by the number in the “Expenses Paid per $1,000” line under the share class you hold.
Hypothetical 5% Portfolio Return. This helps you to compare your Portfolio’s ongoing expenses (but not transaction costs) with those of other mutual funds using the Portfolio’s actual expense ratio and a hypothetical rate of return of 5% per year before expenses. Examples using a 5% hypothetical portfolio return may be found in the shareholder reports of other mutual funds. The hypothetical account values and expenses may not be used to estimate the actual ending account balance or expenses you paid for the period.
Please note that the expenses shown in these tables are meant to highlight your ongoing expenses only and do not reflect any transaction costs. The “Expenses Paid per $1,000” line of the tables is useful in comparing ongoing expenses only and will not help you determine the relative total expense of owning different funds. If these transaction costs had been included, your costs would have been higher.
Expenses and Value of a $1,000 Investment for the six months ended December 31, 2004
| | | | | | |
| | | Class A
| | Class B
|
Actual Portfolio Return | | | | | | |
Beginning Account Value 7/1/04 | | $ | 1,000.00 | | $ | 1,000.00 |
Ending Account Value 12/31/04 | | $ | 1,048.00 | | $ | 1,045.70 |
Expenses Paid per $1,000* | | $ | 4.53 | | $ | 6.47 |
| | |
| | | Class A
| | Class B
|
Hypothetical 5% Portfolio Return | | | | | | |
Beginning Account Value 7/1/04 | | $ | 1,000.00 | | $ | 1,000.00 |
Ending Account Value 12/31/04 | | $ | 1,020.78 | | $ | 1,018.88 |
Expenses Paid per $1,000* | | $ | 4.47 | | $ | 6.39 |
| * | Expenses are equal to the Portfolio’s annualized expense ratio for each share class, multiplied by the average account value over the period, multiplied by the number of days in the most recent six-month period, then divided by 365. |
| | | | | | |
| | | Class A
| | | Class B
| |
Annualized Expense Ratios | | | | | | |
Scudder Variable Series I — Health Sciences Portfolio | | .88 | % | | 1.26 | % |
For more information, please refer to the Portfolio’s prospectus.
108
Management Summary December 31, 2004
Health Sciences Portfolio
The health care sector slightly underperformed the broader market during 2004, as safety concerns about Merck & Co. Inc.’s pain medication Vioxx and Pfizer Inc.’s drug Celebrex led to substantial weakness in the two pharmaceutical giants. However, the rising market helped propel a number of individual stocks to double-digit returns, so diversification and stock selection were critical. In this environment, the portfolio provided a total return of 9.59% (Class A shares, unadjusted for contract charges). In comparison, the Standard & Poor’s 500 (S&P 500) Index returned 10.88% and the Goldman Sachs Healthcare Index returned 6.27%.
The portfolio generated strong performance within the service area during the period, where prescription benefit management companies such as Caremark Rx Inc. (2.90% of portfolio assets as of 12/31/04) produced strong gains. One of the portfolio’s most disappointing positions was Eli Lilly & Co. (0.86% of portfolio assets as of 12/31/04), where safety issues surfaced over the company’s major drug used to treat schizophrenia and bipolar disorder.
Although health care stocks experienced a difficult year, the industry should continue to benefit from increased demand from an aging global population and from new technologies and products that can treat illnesses more effectively and with fewer side effects. In addition, the re-election of President Bush and the Republican Congress should be favorable for health care stocks. We believe our focus on individual company research will enable us to build a portfolio of the most attractive companies within this dynamic and fast-growing industry.
James E. Fenger
Leefin Lai
Co-Managers
Thomas Bucher
Consultant to the Portfolio
All performance shown is historical, assumes reinvestment of all dividends and capital gains, and does not guarantee future results. Investment return and principal value fluctuate with changing market conditions so that, when redeemed, shares may be worth more or less then their original cost. Current performance may be lower or higher than the performance data quoted. Please visit scudder.com for the product’s most recent month-end performance. Performance doesn’t reflect charges and fees (“contract charges”) associated with the separate account that invests in the portfolio or any variable life insurance policy or variable annuity contract for which the portfolio is an investment option. These charges and fees will reduce returns.
Risk Considerations
This portfolio is subject to stock market risk. The portfolio may focus its investments on certain industry sectors, thereby increasing its vulnerability to any single industry or regulatory development. All of these factors may result in greater share price volatility. Please read this portfolio’s prospectus for specific details regarding its investments and risk profile.
The Standard & Poor’s 500 (S&P 500) Index is a capitalization-weighted index of 500 stocks. The index is designed to measure performance of the broad domestic economy through changes in the aggregate market value of 500 stocks representing all major industries.
The Goldman Sachs Healthcare Index is a market-capitalization-weighted index of 114 stocks designed to measure the performance of companies in the health care sector.
Index returns assume the reinvestment of dividends and, unlike portfolio returns, do not reflect any fees or expenses. It is not possible to invest directly into an index.
Portfolio management market commentary is as of December 31, 2004, and may not come to pass. This information is subject to change at any time based on market and other conditions.
109
Portfolio Summary
Health Sciences Portfolio
Asset Allocation (Excludes Securities Lending Collateral)
| | | | | | |
| | | 12/31/04
| | | 12/31/03
| |
Common Stocks | | 97 | % | | 96 | % |
Cash Equivalents | | 3 | % | | 4 | % |
| | |
|
| |
|
|
| | | 100 | % | | 100 | % |
| | |
|
| |
|
|
Industry Diversification (Excludes Cash Equivalents and Securities Lending Collateral)
| | | | | | |
| | | 12/31/04
| | | 12/31/03
| |
Pharmaceuticals | | 33 | % | | 38 | % |
Biotechnology | | 27 | % | | 25 | % |
Medical Supply & Specialty | | 17 | % | | 17 | % |
Health Care Services | | 16 | % | | 15 | % |
Hospital Management | | 4 | % | | 2 | % |
Life Sciences Equipment | | 3 | % | | 3 | % |
| | |
|
| |
|
|
| | | 100 | % | | 100 | % |
| | |
|
| |
|
|
Asset allocation and industry diversification are subject to change.
For more complete details about the Portfolio’s investment portfolio, see page 106. A quarterly Fact Sheet is available upon request. Information concerning portfolio holdings of the Portfolio as of month-end will be posted to scudder.com on the 15th of the following month. Please call 1-800-778-1482.
Following the Portfolio’s fiscal first and third quarter-end, a complete portfolio holdings listing is filed with the SEC on Form N-Q. The form will be available on the SEC’s Web site at www.sec.gov, and it also may be reviewed and copied at the SEC’s Public Reference Room in Washington, D.C. Information on the operation of the SEC’s Public Reference Room may be obtained by calling (800) SEC-0330.
110
Investment Portfolio as of December 31, 2004
Health Sciences Portfolio
| | | | |
| | | Shares
| | Value ($)
|
Common Stocks 96.8% | | | | |
| | |
Health Care 96.8% | | | | |
| | |
Biotechnology 26.6% | | | | |
Actelion Ltd.* | | 8,300 | | 852,555 |
Alkermes, Inc.* | | 40,900 | | 576,281 |
Amgen, Inc.* | | 87,350 | | 5,603,502 |
Amylin Pharmaceuticals, Inc.* | | 72,300 | | 1,688,928 |
Axonyx, Inc.* (c) | | 49,500 | | 306,900 |
Biogen Idec, Inc.* | | 22,820 | | 1,520,040 |
Celgene Corp.* | | 43,000 | | 1,140,790 |
Discovery Laboratories, Inc.* | | 77,500 | | 614,575 |
DOV Pharmaceutical, Inc.* (c) | | 57,000 | | 1,028,850 |
Encysive Pharmaceuticals, Inc.* | | 85,200 | | 846,036 |
Eyetech Pharmaceuticals, Inc.* | | 16,600 | | 755,300 |
Gen-Probe, Inc.* | | 27,800 | | 1,256,838 |
Genentech, Inc.* | | 37,000 | | 2,014,280 |
Genzyme Corp.* | | 49,900 | | 2,897,693 |
Gilead Sciences, Inc.* | | 86,200 | | 3,016,138 |
GPC Biotech AG (ADR)* (c) | | 60,512 | | 883,778 |
Incyte Corp.* | | 50,400 | | 503,496 |
Keryx Biopharmaceuticals, Inc.* | | 18,800 | | 217,516 |
MedImmune, Inc.* | | 36,900 | | 1,000,359 |
MGI Pharma, Inc.* | | 70,800 | | 1,983,108 |
Millennium Pharmaceuticals, Inc.* | | 110,100 | | 1,334,412 |
Myogen, Inc.* (c) | | 22,500 | | 181,575 |
Neurocrine Biosciences, Inc.* | | 21,900 | | 1,079,670 |
Onyx Pharmaceuticals, Inc.* | | 16,200 | | 524,718 |
OSI Pharmaceuticals, Inc.* | | 11,400 | | 853,290 |
Rigel Pharmaceuticals, Inc.* | | 49,000 | | 1,196,580 |
Telik, Inc.* | | 31,200 | | 597,168 |
| | | | |
|
| | | | | 34,474,376 |
| | | | |
|
Health Care Services 15.7% | | | | |
Aetna, Inc. | | 19,100 | | 2,382,725 |
Allscripts Healthcare Solutions, Inc.* | | 108,300 | | 1,155,561 |
Cardinal Health, Inc. | | 14,400 | | 837,360 |
Caremark Rx, Inc.* | | 96,900 | | 3,820,767 |
Covance, Inc.* | | 19,500 | | 755,625 |
Humana, Inc.* | | 39,100 | | 1,160,879 |
Medco Health Solutions, Inc.* | | 16,584 | | 689,894 |
PSS World Medical, Inc.* | | 59,500 | | 744,643 |
UnitedHealth Group, Inc. | | 54,000 | | 4,753,620 |
WellPoint, Inc.* | | 34,900 | | 4,013,500 |
| | | | |
|
| | | | | 20,314,574 |
| | | | |
|
Hospital Management 4.6% | | | | |
Community Health Systems, Inc.* | | 72,300 | | 2,015,724 |
Kindred Healthcare, Inc.* | | 55,500 | | 1,662,225 |
Manor Care, Inc. | | 29,300 | | 1,038,099 |
PacifiCare Health Systems, Inc.* | | 20,800 | | 1,175,616 |
| | | | |
|
| | | | | 5,891,664 |
| | | | |
|
Life Sciences Equipment 2.9% | | | | |
Charles River Laboratories International, Inc.* | | 45,200 | | 2,079,652 |
Invitrogen Corp.* | | 10,500 | | 704,865 |
PerkinElmer, Inc. | | 41,700 | | 937,833 |
| | | | |
|
| | | | | 3,722,350 |
| | | | |
|
111
| | | | |
| | | Shares
| | Value ($)
|
Medical Supply & Specialty 15.1% | | | | |
Advanced Medical Optics, Inc.* | | 17,100 | | 703,494 |
Beckman Coulter, Inc. | | 9,500 | | 636,405 |
Boston Scientific Corp.* | | 18,600 | | 661,230 |
C.R. Bard, Inc. | | 20,400 | | 1,305,192 |
Cytyc Corp.* | | 48,300 | | 1,331,631 |
Elekta AB “B”* | | 43,100 | | 1,242,009 |
Fisher Scientific International, Inc.* | | 43,100 | | 2,688,578 |
I-Flow Corp.* | | 33,600 | | 612,528 |
Kyphon, Inc.* | | 33,800 | | 870,688 |
Medtronic, Inc. | | 33,100 | | 1,644,077 |
Nobel Biocare Holding AG | | 10,600 | | 1,920,324 |
Smith & Nephew PLC | | 93,865 | | 960,528 |
St. Jude Medical, Inc.* | | 17,100 | | 717,003 |
Stryker Corp. | | 25,800 | | 1,244,850 |
Varian Medical Systems, Inc.* | | 22,800 | | 985,872 |
Zimmer Holdings, Inc.* | | 25,000 | | 2,003,000 |
| | | | |
|
| | | | | 19,527,409 |
| | | | |
|
Pharmaceuticals 31.9% | | | | |
Abbott Laboratories | | 83,500 | | 3,895,275 |
Alcon, Inc. | | 5,600 | | 451,360 |
Allergan, Inc. | | 19,500 | | 1,580,865 |
AstraZeneca PLC | | 28,468 | | 1,032,447 |
Barrier Therapeutics, Inc.* | | 37,500 | | 622,500 |
Elan Corp. PLC (ADR)* (c) | | 84,100 | | 2,291,725 |
Eli Lilly & Co. | | 19,900 | | 1,129,325 |
Eon Labs, Inc.* | | 20,300 | | 548,100 |
IVAX Corp.* | | 102,325 | | 1,618,781 |
Johnson & Johnson | | 20,200 | | 1,281,084 |
Medicis Pharmaceutical Corp. “A” | | 22,200 | | 779,442 |
Novartis AG (Registered) | | 73,576 | | 3,707,594 |
Pfizer, Inc. | | 87,040 | | 2,340,506 |
Pharmion Corp.* | | 19,800 | | 835,758 |
Roche Holding AG | | 26,398 | | 3,038,869 |
Sanofi-Aventis | | 24,250 | | 1,938,154 |
Schering-Plough Corp. | | 180,100 | | 3,760,488 |
Sepracor, Inc.* | | 21,100 | | 1,252,707 |
Teva Pharmaceutical Industries Ltd. (ADR) | | 32,100 | | 958,506 |
Valeant Pharmaceuticals International | | 43,000 | | 1,133,050 |
Watson Pharmaceuticals, Inc.* | | 20,700 | | 679,167 |
Wyeth | | 108,800 | | 4,633,792 |
Yamanouchi Pharmaceutical Co., Ltd. | | 44,000 | | 1,713,282 |
| | | | |
|
| | | | | 41,222,777 |
| | | | |
|
Total Common Stocks
(Cost $98,023,989) | | | | 125,153,150 |
| | | | |
|
Securities Lending Collateral 2.4% | | | | |
Daily Assets Fund Institutional, 2.25% (d) (e) (Cost $3,116,500) | | 3,116,500 | | 3,116,500 |
| | | | |
|
| | |
Cash Equivalents 2.6% | | | | |
Scudder Cash Management QP Trust, 2.24% (b) (Cost $3,396,350) | | 3,396,350 | | 3,396,350 |
| | | | |
|
| | | | | | |
| | | % of Net Assets
| | | Value ($)
| |
Total Investment Portfolio
(Cost $104,536,839) (a) | | 101.8 | | | 131,666,000 | |
Other Assets and Liabilities, Net | | (1.8 | ) | | (2,332,373 | ) |
| | |
|
| |
|
|
Net Assets | | 100.0 | | | 129,333,627 | |
| | |
|
| |
|
|
| * | Non-income producing security. |
| (a) | The cost for federal income tax purposes was $105,244,036. At December 31, 2004, net unrealized appreciation for all securities based on tax cost was $26,421,964. This consisted of aggregate gross unrealized appreciation for all securities in which there was an excess of value over tax cost of $27,654,224 and aggregate gross unrealized depreciation for all securities in which there was an excess of tax cost over value of $1,232,260. |
| (b) | Scudder Cash Management QP Trust is managed by Deutsche Investment Management Americas Inc. The rate shown is the annualized seven-day yield at period end. |
| (c) | All or a portion of these securities were on loan (see Notes to Financial Statements). The value of all securities loaned at December 31, 2004 amounted to $3,026,640, which is 2.3% of total net assets. |
| (d) | Daily Assets Fund Institutional, an affiliated fund, is managed by Deutsche Asset Management, Inc. The rate shown is the annualized seven-day yield at period end. |
| (e) | Represents collateral held in connection with securities lending. |
ADR: American Depositary Receipts
Purchases and sales of investment securities (excluding short-term investments) for the year ended December 31, 2004, aggregated $99,144,186 and $92,031,653, respectively.
At December 31, 2004, the Health Sciences Portfolio had a net tax basis capital loss carryforward of approximately $5,204,000 which may be applied against any realized net taxable capital gains of each succeeding year until fully utilized or until December 31, 2010 ($2,962,000) and December 31, 2011 ($2,242,000), the respective expiration dates, whichever occurs first.
The accompanying notes are an integral part of the financial statements.
112
Financial Statements
Health Sciences Portfolio
Statement of Assets and Liabilities as of December 31, 2004
| | | | |
Assets | | | | |
Investments: | | | | |
| |
Investments in securities, at value — including $3,026,640 of securities loaned (cost $98,023,989) | | $ | 125,153,150 | |
Investment in Daily Assets Fund Institutional (cost $3,116,500)* | | | 3,116,500 | |
Investment in Scudder Cash Management QP Trust (cost $3,396,350) | | | 3,396,350 | |
Total investments in securities, at value (cost $104,536,839) | | | 131,666,000 | |
Foreign currency, at value (cost $161,774) | | | 162,077 | |
Receivable for investments sold | | | 1,039,896 | |
Dividends receivable | | | 3,420 | |
Interest receivable | | | 6,711 | |
Receivable for Portfolio shares sold | | | 11,158 | |
Foreign taxes recoverable | | | 8,095 | |
Other assets | | | 5,609 | |
| | |
|
|
|
Total assets | | | 132,902,966 | |
| | |
|
|
|
Liabilities | | | | |
Payable upon return of securities loaned | | | 3,116,500 | |
Payable for investments purchased | | | 259,663 | |
Payable for Portfolio shares redeemed | | | 44,346 | |
Accrued management fee | | | 79,673 | |
Other accrued expenses and payables | | | 69,157 | |
| | |
|
|
|
Total liabilities | | | 3,569,339 | |
| | |
|
|
|
Net assets, at value | | $ | 129,333,627 | |
| | |
|
|
|
| Net Assets | | | | |
Net assets consist of: | | | | |
| |
Accumulated net investment loss | | | (283 | ) |
Net unrealized appreciation (depreciation) on: | | | | |
| |
Investments | | | 27,129,161 | |
Foreign currency related transactions | | | 1,126 | |
Accumulated net realized gain (loss) | | | (5,911,665 | ) |
Paid-in capital | | | 108,115,288 | |
| | |
|
|
|
Net assets, at value | | $ | 129,333,627 | |
| | |
|
|
|
| Net Asset Value | | | | |
| Class A | | | | |
Net Asset Value, offering and redemption price per share ($108,849,028 ÷ 9,070,686 outstanding shares of beneficial interest, no par value, unlimited number of shares authorized) | | $ | 12.00 | |
| Class B | | | | |
Net Asset Value, offering and redemption price per share ($20,484,599 ÷ 1,720,377 outstanding shares of beneficial interest, no par value, unlimited number of shares authorized) | | $ | 11.91 | |
| * | Represents collateral on securities loaned. |
113
| | | | |
Statement of Operations for the year ended December 31, 2004 | | | |
Investment Income | | | | |
Income: | | | | |
| |
Dividends (net of foreign taxes withheld of $24,700) | | $ | 657,189 | |
Interest — Scudder Cash Management QP Trust | | | 48,482 | |
Securities lending income, including income from Daily Assets Fund Institutional | | | 22,564 | |
| | |
|
|
|
Total Income | | | 728,235 | |
| | |
|
|
|
Expenses: | | | | |
| |
Management fee | | | 925,788 | |
Custodian fees | | | 28,505 | |
Accounting fees | | | 72,604 | |
Distribution service fees (Class B) | | | 40,385 | |
Record keeping fees (Class B) | | | 21,221 | |
Auditing | | | 33,939 | |
Trustees’ fees and expenses | | | 6,701 | |
Reports to shareholders | | | 20,587 | |
Other | | | 4,539 | |
| | |
|
|
|
Total expenses, before expense reductions | | | 1,154,269 | |
Expense reductions | | | (2,020 | ) |
| | |
|
|
|
Total expenses, after expense reductions | | | 1,152,249 | |
| | |
|
|
|
Net investment income (loss) | | | (424,014 | ) |
| | |
|
|
|
Realized and Unrealized Gain (Loss) on Investment Transactions | | | | |
Net realized gain (loss) from: | | | | |
| |
Investments | | | 5,598,324 | |
Foreign currency related transactions | | | (26,770 | ) |
| | |
|
|
|
| | | | 5,571,554 | |
| | |
|
|
|
Net unrealized appreciation (depreciation) during the period on: | | | | |
| |
Investments | | | 5,777,160 | |
Foreign currency related transactions | | | 321 | |
| | | | 5,777,481 | |
| | |
|
|
|
Net gain (loss) on investment transactions | | | 11,349,035 | |
| | |
|
|
|
Net increase (decrease) in net assets resulting from operations | | $ | 10,925,021 | |
| | |
|
|
|
The accompanying notes are an integral part of the financial statements.
114
Statement of Changes in Net Assets
| | | | | | | | |
| | | Years Ended December 31,
| |
Increase (Decrease) in Net Assets
| | 2004
| | | 2003
| |
Operations: | | | | | | | | |
| | |
Net investment income (loss) | | $ | (424,014 | ) | | $ | (234,147 | ) |
Net realized gain (loss) on investment transactions | | | 5,571,554 | | | | (1,611,899 | ) |
Net unrealized appreciation (depreciation) on investment transactions during the period | | | 5,777,481 | | | | 27,513,109 | |
| | |
|
|
| |
|
|
|
Net increase (decrease) in net assets resulting from operations | | | 10,925,021 | | | | 25,667,063 | |
| | |
|
|
| |
|
|
|
Portfolio share transactions: | | | | | | | | |
| | |
Class A | | | | | | | | |
Proceeds from shares sold | | | 14,603,543 | | | | 17,907,340 | |
Cost of shares redeemed | | | (16,500,791 | ) | | | (9,770,087 | ) |
| | |
|
|
| |
|
|
|
Net increase (decrease) in net assets from Class A share transactions | | | (1,897,248 | ) | | | 8,137,253 | |
| | |
|
|
| |
|
|
|
Class B | | | | | | | | |
Proceeds from shares sold | | | 9,015,887 | | | | 9,800,801 | |
Cost of shares redeemed | | | (1,312,710 | ) | | | (305,900 | ) |
| | |
|
|
| |
|
|
|
Net increase (decrease) in net assets from Class B share transactions | | | 7,703,177 | | | | 9,494,901 | |
| | |
|
|
| |
|
|
|
Increase (decrease) in net assets | | | 16,730,950 | | | | 43,299,217 | |
Net assets at beginning of period | | | 112,602,677 | | | | 69,303,460 | |
| | |
|
|
| |
|
|
|
Net assets at end of period (including accumulated net investment loss of $283 and $0, respectively) | | $ | 129,333,627 | | | $ | 112,602,677 | |
| | |
|
|
| |
|
|
|
Other Information | | | | | | | | |
Class A | | | | | | | | |
Shares outstanding at beginning of period | | | 9,253,001 | | | | 8,419,124 | |
Shares sold | | | 1,284,769 | | | | 1,933,592 | |
Shares redeemed | | | (1,467,084 | ) | | | (1,099,715 | ) |
Net increase (decrease) in Portfolio shares | | | (182,315 | ) | | | 833,877 | |
| | |
|
|
| |
|
|
|
Shares outstanding at end of period | | | 9,070,686 | | | | 9,253,001 | |
| | |
|
|
| |
|
|
|
Class B | | | | | | | | |
Shares outstanding at beginning of period | | | 1,034,876 | | | | 39,123 | |
Shares sold | | | 802,351 | | | | 1,024,680 | |
Shares redeemed | | | (116,850 | ) | | | (28,927 | ) |
Net increase (decrease) in Portfolio shares | | | 685,501 | | | | 995,753 | |
| | |
|
|
| |
|
|
|
Shares outstanding at end of period | | | 1,720,377 | | | | 1,034,876 | |
| | |
|
|
| |
|
|
|
The accompanying notes are an integral part of the financial statements.
115
Financial Highlights
Health Sciences Portfolio
Class A
| | | | | | | | | | | | | | | | |
Years Ended December 31,
| | 2004
| | | 2003
| | | 2002
| | | 2001a
| |
Selected Per Share Data | | | | | | | | | | | | | | | | |
Net asset value, beginning of period | | $ | 10.95 | | | $ | 8.19 | | | $ | 10.65 | | | $ | 10.00 | |
| | |
|
|
| |
|
|
| |
|
|
| |
|
|
|
Income (loss) from investment operations: | | | | | | | | | | | | | | | | |
| | | | |
Net investment income (loss)c | | | (.03 | ) | | | (.02 | ) | | | (.03 | ) | | | (.02 | ) |
Net realized and unrealized gain (loss) on investment transactions | | | 1.08 | | | | 2.78 | | | | (2.43 | ) | | | .67 | |
| | |
|
|
| |
|
|
| |
|
|
| |
|
|
|
Total from investment operations | | | 1.05 | | | | 2.76 | | | | (2.46 | ) | | | .65 | |
| | |
|
|
| |
|
|
| |
|
|
| |
|
|
|
Net asset value, end of period | | $ | 12.00 | | | $ | 10.95 | | | $ | 8.19 | | | $ | 10.65 | |
| | |
|
|
| |
|
|
| |
|
|
| |
|
|
|
Total Return (%) | | | 9.59 | | | | 33.70 | | | | (23.10 | ) | | | 6.50d | ** |
Ratios to Average Net Assets and Supplemental Data | | | | | | | | | | | | | | | | |
Net assets, end of period ($ millions) | | | 109 | | | | 101 | | | | 69 | | | | 56 | |
Ratio of expenses before expense reductions (%) | | | .88 | | | | .87 | | | | .91 | | | | 1.40 | * |
Ratio of expenses after expense reductions (%) | | | .88 | | | | .87 | | | | .91 | | | | .95 | * |
Ratio of net investment income (loss) (%) | | | (.29 | ) | | | (.24 | ) | | | (.38 | ) | | | (.25 | )* |
Portfolio turnover rate (%) | | | 77 | | | | 64 | | | | 53 | | | | 34 | * |
Class B
| | | | | | | | | | | | |
| | | 2004
| | | 2003
| | | 2002b
| |
Selected Per Share Data | | | | | | | | | | | | |
Net asset value, beginning of period | | $ | 10.91 | | | $ | 8.19 | | | $ | 8.09 | |
| | |
|
|
| |
|
|
| |
|
|
|
Income (loss) from investment operations: | | | | | | | | | | | | |
| | | |
Net investment income (loss)c | | | (.08 | ) | | | (.07 | ) | | | (.04 | ) |
Net realized and unrealized gain (loss) on investment transactions | | | 1.08 | | | | 2.79 | | | | .14 | |
| | |
|
|
| |
|
|
| |
|
|
|
Total from investment operations | | | 1.00 | | | | 2.72 | | | | .10 | |
| | |
|
|
| |
|
|
| |
|
|
|
Net asset value, end of period | | $ | 11.91 | | | $ | 10.91 | | | $ | 8.19 | |
| | |
|
|
| |
|
|
| |
|
|
|
Total Return (%) | | | 9.17 | | | | 33.21 | | | | 1.24 | ** |
Ratios to Average Net Assets and Supplemental Data | | | | | | | | | | | | |
Net assets, end of period ($ millions) | | | 20 | | | | 11 | | | | .3 | |
Ratio of expenses (%) | | | 1.27 | | | | 1.26 | | | | 1.16 | * |
Ratio of net investment income (loss) (%) | | | (.68 | ) | | | (.63 | ) | | | (.92 | )* |
Portfolio turnover rate (%) | | | 77 | | | | 64 | | | | 53 | |
| a | For the period May 1, 2001 (commencement of operations) to December 31, 2001. |
| b | For the period July 1, 2002 (commencement of operations of Class B shares) to December 31, 2002. |
| c | Based on average shares outstanding during the period. |
| d | Total return would have been lower had certain expenses not been reduced. |
116
Notes to Financial Statements
A. Significant Accounting Policies
Scudder Variable Series I (the “Series”) is registered under the Investment Company Act of 1940, as amended (the “1940 Act”), as an open-end, registered management investment company organized as a Massachusetts business trust. The Series consists of nine diversified portfolios: Money Market Portfolio, Bond Portfolio, Balanced Portfolio, Growth and Income Portfolio, Capital Growth Portfolio, 21st Century Growth Portfolio, Global Discovery Portfolio, International Portfolio and Health Sciences Portfolio (individually or collectively hereinafter referred to as a “Portfolio” or the “Portfolios”). The Series is intended to be the underlying investment vehicle for variable annuity contracts and variable life insurance policies to be offered by the separate accounts of certain life insurance companies (“Participating Insurance Companies”).
Multiple Classes of Shares of Beneficial Interest. The Series offers one class of shares for the Money Market Portfolio and two classes of shares (Class A shares and Class B shares) for each of the other Portfolios. Class B shares are subject to Rule 12b-1 distribution fees under the 1940 Act and record keeping fees equal to an annual rate of 0.25% and up to 0.15%, respectively, of the average daily net assets of the Class B shares of the applicable Portfolio. Class A shares are not subject to such fees. Class B shares for certain Portfolios have not been funded, and thus are not shown in these financial statements.
Investment income, realized and unrealized gains and losses, and certain portfolio-level expenses and expense reductions, if any, are borne pro rata on the basis of relative net assets by the holders of all classes of shares except that each class bears certain expenses unique to that class (including the applicable 12b-1 distribution fee and record keeping fees). Differences in class-level expenses may result in payment of different per share dividends by class. All shares have equal rights with respect to voting subject to class-specific arrangements.
The Series’ financial statements are prepared in accordance with accounting principles generally accepted in the United States of America, which require the use of management estimates. Actual results could differ from those estimates. The policies described below are followed consistently by the Series in the preparation of the financial statements for its Portfolios.
Security Valuation. The Money Market Portfolio values all securities utilizing the amortized cost method permitted in accordance with Rule 2a-7 under the 1940 Act and certain conditions therein. Under this method, which does not take into account unrealized capital gains or losses on securities, an instrument is initially valued at its cost and thereafter assumes a constant accretion/amortization to maturity of any discount or premium.
117
Securities in each of the remaining Portfolios are valued in the following manner:
Investments are stated at value determined as of the close of regular trading on the New York Stock Exchange on each day the exchange is open for trading. Equity securities are valued at the most recent sale price or official closing price reported on the exchange (US or foreign) or over-the-counter market on which the security is traded most extensively. Securities for which no sales are reported are valued at the calculated mean between the most recent bid and asked quotations on the relevant market or, if a mean cannot be determined, at the most recent bid quotation.
Debt securities are valued by independent pricing services approved by the Trustees of the Series. If the pricing services are unable to provide valuations, securities are valued at the most recent bid quotation or evaluated price, as applicable, obtained from a broker-dealer. Such services may use various pricing techniques which take into account appropriate factors such as yield, quality, coupon rate, maturity, type of issue, trading characteristics and other data, as well as broker quotes.
Money market instruments purchased with an original or remaining maturity of sixty days or less, maturing at par, are valued at amortized cost. Investments in open-end investment companies and Scudder Cash Management QP Trust are valued at their net asset value each business day.
Securities and other assets for which market quotations are not readily available or for which the above valuation procedures are deemed not to reflect fair value are valued in a manner that is intended to reflect their fair value as determined in accordance with procedures approved by the Trustees. The Series may use a fair valuation model to value international equity securities in order to adjust for events which may occur between the close of the foreign exchanges and the close of the New York Stock Exchange.
Securities Lending. Each Portfolio, except the Money Market Portfolio, may lend securities to financial institutions. The Portfolio retains beneficial ownership of the securities it has loaned and continues to receive interest and dividends paid by the securities and to participate in any changes in their market value. The Portfolio requires the borrowers of the securities to maintain collateral with the Portfolio consisting of liquid, unencumbered assets having a value at least equal to the value of the securities loaned. The Portfolio may invest the cash collateral into a joint trading account in an affiliated money market fund pursuant to an Exemptive Order issued by the SEC. The Portfolio receives compensation for lending its securities either in the form of fees or by earning interest on invested cash collateral net of fees paid to a lending agent. Either the Portfolio or the borrower may terminate the loan. The Portfolio is subject to all investment risks associated with the value of any cash collateral received, including, but not limited to, interest rate credit and liquidity risk associated with such investments. During the year ended December 31, 2004, the Bond Portfolio, Balanced Portfolio, Growth and Income Portfolio, Capital Growth Portfolio, 21st Century Growth Portfolio, Global Discovery Portfolio, International Portfolio and Health Sciences Portfolio loaned securities.
Options. An option contract is a contract in which the writer of the option grants the buyer of the option the right to purchase from (call option), or sell to (put option), the writer a designated instrument at a specified price within a specified period of time. Certain options, including options on indices, will require cash settlement by the Portfolio if the option is exercised. Each Portfolio, except for Money Market Portfolio, may enter into option contracts in order to hedge against potential adverse price movements in the value of portfolio assets; as a temporary substitute for selling selected investments; to lock in the purchase price of a security or currency which it expects to purchase in the near future; as a temporary substitute for purchasing selected investments; and to enhance potential gain.
118
The liability representing the Portfolio’s obligation under an exchange traded written option or investment in a purchased option is valued at the last sale price or, in the absence of a sale, the mean between the closing bid and asked prices or at the most recent asked price (bid for purchased options) if no bid and asked prices are available. Over-the-counter written or purchased options are valued using dealer supplied quotations. Gain or loss is recognized when the option contract expires or is closed.
If the Portfolio writes a covered call option, the Portfolio foregoes, in exchange for the premium, the opportunity to profit during the option period from an increase in the market value of the underlying security above the exercise price. If the Portfolio writes a put option it accepts the risk of a decline in the market value of the underlying security below the exercise price. Over-the-counter options have the risk of the potential inability of counterparties to meet the terms of their contracts. The Portfolio’s maximum exposure to purchased options is limited to the premium initially paid. In addition, certain risks may arise upon entering into option contracts including the risk that an illiquid secondary market will limit the Portfolio’s ability to close out an option contract prior to the expiration date and that a change in the value of the option contract may not correlate exactly with changes in the value of the securities or currencies hedged.
Foreign Currency Translations. The books and records of the Portfolios are maintained in US dollars. Investment securities and other assets and liabilities denominated in a foreign currency are translated into US dollars at the prevailing exchange rates at period end. Purchases and sales of investment securities, income and expenses are translated into US dollars at the prevailing exchange rates on the respective dates of the transactions.
Net realized and unrealized gains and losses on foreign currency transactions represent net gains and losses between trade and settlement dates on securities transactions, the disposition of forward foreign currency exchange contracts and foreign currencies, and the difference between the amount of net investment income accrued and the US dollar amount actually received. That portion of both realized and unrealized gains and losses on investments that results from fluctuations in foreign currency exchange rates is not separately disclosed but is included with net realized and unrealized gains and losses on investment securities.
Repurchase Agreements. Each Portfolio may enter into repurchase agreements with certain banks and broker/dealers whereby the Portfolio, through its custodian or sub-custodian bank, receives delivery of the underlying securities, the amount of which at the time of purchase and each subsequent business day is required to be maintained at such a level that the value is equal to at least the principal amount of the repurchase price plus accrued interest. The custodial bank holds the collateral in a separate account until the agreement matures. If the value of the securities falls below the principal amount of the repurchase agreement plus accrued interest, the financial institution deposits additional collateral by the following business day. If the financial institution either fails to deposit the required additional collateral or fails to repurchase the securities as agreed, the Portfolio has the right to sell the securities and recover any resulting loss from the financial institution. If the financial institution enters into bankruptcy, the Portfolio’s claims on the collateral may be subject to legal proceedings.
Forward Foreign Currency Exchange Contracts. A forward foreign currency exchange contract (forward currency contract) is a commitment to purchase or sell a foreign currency at the settlement date at a negotiated rate. The Portfolios may enter into forward currency contracts in order to hedge their exposure to changes in foreign currency exchange rates on their foreign currency denominated portfolio holdings and to facilitate transactions in foreign currency denominated securities.
Forward currency contracts are valued at the prevailing forward exchange rate of the underlying currencies and unrealized gain (loss) is recorded daily. Sales and purchases of forward currency
119
contracts having the same settlement date and broker are offset and any gain (loss) is realized on the date of offset; otherwise, gain (loss) is realized on settlement date. Realized and unrealized gains and losses which represent the difference between the value of a forward currency contract to buy and a forward currency contract to sell are included in net realized and unrealized gain (loss) from foreign currency related transactions.
Certain risks may arise upon entering into forward currency contracts from the potential inability of counterparties to meet the terms of their contracts. Additionally, when utilizing forward currency contracts to hedge, the Portfolio gives up the opportunity to profit from favorable exchange rate movements during the term of the contract.
Bond Portfolio, Balanced Portfolio, Global Discovery Portfolio and International Portfolio each entered into forward foreign currency exchange contracts during the year ended December 31, 2004.
Mortgage Dollar Rolls. Bond Portfolio and Balanced Portfolio may enter into mortgage dollar rolls in which the Portfolio sells mortgage-backed securities for delivery in the current month and simultaneously contracts to repurchase similar, but not identical, securities on a fixed date. The Portfolio receives compensation as consideration for entering into the commitment to repurchase. The compensation is paid in the form of a lower price for the security upon its repurchase or, alternatively, a fee. Mortgage dollar rolls may be renewed with a new sale and repurchase price and a cash settlement made at each renewal without physical delivery of the securities subject to the contract.
Certain risks may arise upon entering into mortgage dollar rolls from the potential inability of counterparties to meet the terms of their commitments. Additionally, the value of such securities may change adversely before the Portfolio is able to repurchase them.
At the time the Portfolio enters into this type of transaction it is required to segregate cash or other liquid assets at least equal to the amount of the commitment.
The Bond Portfolio and Balanced Portfolio entered into mortgage dollar rolls during the year ended December 31, 2004.
When-Issued/Delayed Delivery Securities. Each Portfolio may purchase securities with delivery or payment to occur at a later date beyond the normal settlement period. At the time a Portfolio enters into a commitment to purchase a security, the transaction is recorded and the value of the security is reflected in the net asset value. The price of such security and the date when the security will be delivered and paid for are fixed at the time the transaction is negotiated. The value of the security may vary with market fluctuations. No interest accrues to the Portfolio until payment takes place. At the time the Portfolio enters into this type of transaction it is required to segregate cash or other liquid assets at least equal to the amount of the commitment.
Certain risks may arise upon entering into when-issued or delayed delivery securities from the potential inability of counterparties to meet the terms of their contracts or if the issuer does not issue the securities due to political, economic, or other factors. Additionally, losses may arise due to changes in the value of the underlying securities.
Taxes. Each Portfolio is treated as a separate taxpayer as provided for in the Internal Revenue Code, as amended. It is each Portfolio’s policy to comply with the requirements of the Internal Revenue Code, which are applicable to regulated investment companies, and to distribute all of its taxable income to the separate accounts of the Participating Insurance Companies which hold its shares. Accordingly, the Portfolios paid no federal income taxes and no federal income tax provision was required.
120
Additionally, based on the Series’ understanding of the tax rules and rates related to income, gains and transactions for the foreign jurisdictions in which each Portfolio invests, the Series will provide for foreign taxes, and where appropriate, deferred foreign taxes.
Distribution of Income and Gains. Net investment income of Money Market Portfolio is declared as a daily dividend and is distributed to shareholders monthly. All other Portfolios will declare and distribute dividends from their net investment income, if any, in April, although additional distributions may be made if necessary. Net realized gains from investment transactions, in excess of available capital loss carryforwards, would be taxable to each Portfolio if not distributed, and, therefore, will be distributed to shareholders at least annually.
The timing and characterization of certain income and capital gains distributions are determined annually in accordance with federal tax regulations which may differ from accounting principles generally accepted in the United States of America. These differences primarily relate to investments in forward foreign currency exchange contracts, passive foreign investment companies, post October loss deferrals, non-taxable distributions and certain securities sold at a loss. As a result, net investment income (loss) and net realized gain (loss) on investment transactions for a reporting period may differ significantly from distributions during such period. Accordingly, each Portfolio may periodically make reclassifications among certain of its capital accounts without impacting the net asset value of the Portfolio.
At December 31, 2004, the Portfolios’ components of distributable earnings (accumulated losses) on a tax-basis are as follows:
| | | | | | | | | |
Portfolio
| | Undistributed Ordinary
Income ($)*
| | Undistributed Net Long-Term
Capital Gains ($)
| | Capital Loss Carryforwards ($)
| | | Net Unrealized Gain (Loss)
on Investments ($)
|
Money Market Portfolio | | 3,677 | | — | | (2,640 | ) | | — |
Bond Portfolio | | 6,852,582 | | 990,607 | | — | | | 1,900,706 |
Balanced Portfolio | | 2,547,560 | | — | | (15,900,000 | ) | | 12,749,882 |
Growth and Income Portfolio | | 2,360,421 | | — | | (35,930,000 | ) | | 31,556,288 |
Capital Growth Portfolio | | 6,697,719 | | — | | (232,875,000 | ) | | 148,965,119 |
21st Century Growth Portfolio | | — | | — | | (25,411,000 | ) | | 10,710,583 |
Global Discovery Portfolio | | 1,417,370 | | — | | (42,800,000 | ) | | 80,007,158 |
International Portfolio | | 9,108,896 | | — | | (221,457,000 | ) | | 139,782,919 |
Health Sciences Portfolio | | — | | — | | (5,204,000 | ) | | 26,421,964 |
In addition, the tax character of distributions paid by the Portfolios are summarized as follows:
| | | | | | | | |
Portfolio
| | Distributions from Ordinary Income ($)* Years Ended December 31,
| | Distributions from Long-Term Capital Gains ($) Years Ended December 31,
|
| | 2004
| | 2003
| | 2004
| | 2003
|
Money Market Portfolio | | 540,356 | | 706,913 | | — | | — |
Bond Portfolio | | 6,665,081 | | 7,871,344 | | — | | — |
Balanced Portfolio | | 2,400,327 | | 3,267,657 | | — | | — |
Growth and Income Portfolio | | 1,352,130 | | 1,547,438 | | — | | — |
Capital Growth Portfolio | | 3,797,565 | | 2,603,548 | | — | | — |
21st Century Growth Portfolio | | — | | — | | — | | — |
Global Discovery Portfolio | | 501,729 | | 133,861 | | — | | — |
International Portfolio | | 6,676,662 | | 3,359,779 | | — | | — |
Health Sciences Portfolio | | — | | — | | — | | — |
| * | For tax purposes short-term capital gains distributions are considered ordinary income distributions. |
121
Expenses. Each Portfolio is charged for those expenses which are directly attributable to it, such as management fees and custodian fees, while other expenses, such as reports to shareholders and legal fees, are allocated among the Portfolios.
Other. For the Money Market Portfolio, investment transactions are accounted for on trade date. For all other Portfolios, investment transactions are accounted for on a trade date plus one basis for daily net asset value calculations. However, for financial reporting purposes, investment transactions are reported on trade date. Interest income is recorded on the accrual basis. Dividend income is recorded on the ex-dividend date net of foreign withholding taxes. Certain dividends from foreign securities may be recorded subsequent to the ex-dividend date as soon as the Portfolio is informed of such dividends. Realized gains and losses from investment transactions are recorded on an identified cost basis. All discounts and premiums are accreted/amortized for both tax and financial reporting purposes.
B. Related Parties
Under the Management Agreement with Deutsche Investment Management Americas Inc. (“DeIM” or the “Advisor”), an indirect, wholly owned subsidiary of Deutsche Bank AG, the Advisor directs the investments of the Portfolios in accordance with their investment objectives, policies and restrictions. The Advisor determines the securities, instruments and other contracts relating to investments to be purchased, sold or entered into by the Portfolios. In addition to portfolio management services, the Advisor provides certain administrative services in accordance with the Management Agreement.
Under the Series’ management agreement with the Advisor, the Portfolios pay a monthly investment management fee, based on the average daily net assets of each Portfolio, payable monthly, at the annual rates shown below:
| | | |
Portfolio
| | Annual
Management
Fee Rate
| |
Money Market Portfolio | | 0.370 | % |
Bond Portfolio | | 0.475 | % |
Balanced Portfolio | | 0.475 | % |
Growth and Income Portfolio | | 0.475 | % |
21st Century Growth Portfolio | | 0.875 | % |
Global Discovery Portfolio | | 0.975 | % |
Deutsche Asset Management Investment Services Ltd. (“DeAMIS”), an affiliate of the Advisor, serves as subadvisor with respect to the investment and reinvestment of assets in Bond Portfolio and Balanced Portfolio. The Advisor compensates DeAMIS out of the management fee it receives from Bond Portfolio and Balanced Portfolio.
122
For the period May 1, 2004 through April 30, 2005, the Advisor and certain of its subsidiaries have agreed to limit their fees and reimburse expenses of each class of the 21st Century Growth Portfolio and Global Discovery Portfolio to the extent necessary to maintain the annualized expenses of Class A at 1.50% and Class B at 1.75% for 21st Century Growth Portfolio and Class A at 1.25% and Class B at 1.65% for Global Discovery Portfolio.
Capital Growth Portfolio pays the Advisor a graduated investment management fee, based on the average daily net assets of the Portfolio, payable monthly, at the annual rates shown below:
| | | |
Average Daily Net Assets of the Portfolio
| | Annual
Management
Fee Rate
| |
first $500 million | | 0.475 | % |
next $500 million | | 0.450 | % |
over $1 billion | | 0.425 | % |
For the year ended December 31, 2004, the Capital Growth Portfolio incurred a management fee equivalent to an annualized effective rate of 0.468% of the Portfolio’s average daily net assets.
International Portfolio pays the Advisor a graduated investment management fee, based on the average daily net assets of the Portfolio, payable monthly, at the annual rates shown below:
| | | |
Average Daily Net Assets of the Portfolio
| | Annual
Management
Fee Rate
| |
first $500 million | | 0.875 | % |
over $500 million | | 0.725 | % |
For the year ended December 31, 2004, International Portfolio incurred a management fee equivalent to an annualized effective rate of 0.87% of the Portfolio’s average daily net assets. DeAMIS serves as subadvisor with respect to the investment and reinvestment of assets in the International Portfolio. The Advisor compensates DeAMIS out of the management fee it receives from the International Portfolio.
The Health Sciences Portfolio pays the Advisor a graduated investment management fee, based on the average daily net assets of the Portfolio, payable monthly, at the annual rates shown below:
| | | |
Average Daily Net Assets of the Portfolio
| | Annual
Management
Fee Rate
| |
first $250 million | | 0.750 | % |
next $750 million | | 0.725 | % |
next $1.5 billion | | 0.700 | % |
next $2.5 billion | | 0.680 | % |
next $2.5 billion | | 0.650 | % |
next $2.5 billion | | 0.640 | % |
next $2.5 billion | | 0.630 | % |
over $12.5 billion | | 0.620 | % |
For the year ended December 31, 2004, Health Sciences Portfolio incurred a management fee equivalent to an annualized effective rate of 0.750% of the Portfolio’s average daily net assets.
For the period May 1, 2004 through April 30, 2005, the Advisor and certain of its subsidiaries have agreed to limit their fees and reimburse expenses of each class of the Health Sciences Portfolio to the extent necessary to maintain the annualized expenses of Class A at 0.95% and Class B at 1.35%.
123
In addition, for the period September 1, 2004 through December 31, 2004, the Advisor agreed to waive a portion of its fee to the extent necessary to maintain the operating expenses of each class as follows:
| | | |
Portfolio
| | | |
21st Century Growth Portfolio Class A | | 1.25 | % |
21st Century Growth Portfolio Class B | | 1.25 | % |
Global Discovery Portfolio Class A | | 1.24 | % |
Global Discovery Portfolio Class B | | 1.24 | % |
Balanced Portfolio Class A | | 1.00 | % |
Bond Portfolio Class A | | .71 | % |
Capital Growth Portfolio Class A | | 1.08 | % |
Capital Growth Portfolio Class B | | 1.08 | % |
Growth and Income Portfolio Class A | | 1.09 | % |
Growth and Income Portfolio Class B | | 1.09 | % |
International Portfolio Class A | | 1.37 | % |
International Portfolio Class B | | 1.37 | % |
Money Market Portfolio | | .68 | % |
Under this arrangement, the Advisor reimbursed 21st Century Growth Portfolio, Global Discovery Portfolio and International Portfolio $11,805, $22,685 and $9,159, respectively, for expenses.
The Portfolios paid insurance premiums to an unaffiliated insurance broker in 2002 and 2003. This broker in turn paid a portion of its commissions to an affiliate of the Advisor, which performed certain insurance brokerage services for the broker. The Advisor has agreed to reimburse the Portfolios in 2005 for the portion of commissions (plus interest) paid to the affiliate of the Advisor attributable to the premiums paid by the Portfolios. The amounts for 2002 and 2003 are as follows:
| | | | |
Portfolio
| | Amount ($)
|
| | 2002
| | 2003
|
Money Market Portfolio | | 45 | | 26 |
Bond Portfolio | | 58 | | 58 |
Balanced Portfolio | | 48 | | 44 |
Growth and Income Portfolio | | 51 | | 50 |
Capital Growth Portfolio | | 201 | | 209 |
21st Century Growth Portfolio | | 12 | | 15 |
Global Discovery Portfolio | | 45 | | 53 |
International Portfolio | | 150 | | 143 |
Health Sciences Portfolio | | 25 | | 31 |
The Trustees authorized the Series on behalf of each Portfolio to pay Scudder Fund Accounting Corporation, a subsidiary of the Advisor, for determining the daily net asset value per share and maintaining the portfolio and general accounting records of the Series. Scudder Investments Service Company, an affiliate of the Advisor, is the transfer and dividend-paying agent of the Series. These affiliated entities have in turn entered into various agreements with third-party service providers to provide these services.
Scudder Distributors, Inc. (“SDI”), also an affiliate of the Advisor, is the Series’ Distributor. In
124
accordance with the Master Distribution Plan, SDI receives 12b-1 fees of 0.25% of average daily net assets of Class B shares. Pursuant to the Master Distribution Plan, SDI remits these fees to the Participating Insurance Companies for various costs incurred or paid by these companies in connection with marketing and distribution of Class B shares. These fees are detailed in each Portfolio’s Statement of Operations.
The Portfolios pay each Trustee not affiliated with the Advisor retainer fees plus specified amounts for attended board and committee meetings. Allocated Trustees’ fees and expenses for each Portfolio for the year ended December 31, 2004 are detailed in each Portfolio’s Statement of Operations.
Scudder Cash Management QP Trust. Pursuant to an Exemptive Order issued by the SEC, the Series may invest in the Scudder Cash Management QP Trust (the ``QP Trust”), and other affiliated funds managed by the Advisor. The QP Trust seeks to provide as high a level of current income as is consistent with the preservation of capital and the maintenance of liquidity. The QP Trust does not pay the Advisor a management fee for the affiliated funds’ investments in the QP Trust.
C. Expense Reductions
For the year ended December 31, 2004, the Advisor agreed to reimburse the Portfolios, which represents a portion of the fee savings expected to be realized by the Advisor related to the outsourcing by the Advisor of certain administrative services to an unaffiliated service provider as follows:
| | |
Portfolio
| | Amount ($)
|
Money Market Portfolio | | 1,507 |
Bond Portfolio | | 2,313 |
Balanced Portfolio | | 2,027 |
Growth and Income Portfolio | | 2,376 |
Capital Growth Portfolio | | 6,130 |
21st Century Growth Portfolio | | 1,447 |
Global Discovery Portfolio | | 2,531 |
International Portfolio | | 4,638 |
Health Sciences Portfolio | | 1,941 |
In addition, Money Market Portfolio, Bond Portfolio, Balanced Portfolio, Growth and Income Portfolio, Capital Growth Portfolio, 21st Century Growth Portfolio and Health Sciences Portfolio have entered into an arrangement with their custodian whereby credits realized as a result of uninvested cash balances are used to reduce a portion of the Portfolios’ expenses. During the year ended December 31, 2004, the custodian fees were reduced as follows:
| | |
Portfolio
| | Custody Credits ($)
|
Money Market Portfolio | | 81 |
Bond Portfolio | | 888 |
Balanced Portfolio | | 1,561 |
Growth and Income Portfolio | | 27 |
Capital Growth Portfolio | | 129 |
21st Century Growth Portfolio | | 42 |
Health Sciences Portfolio | | 79 |
125
D. Forward Foreign Currency Exchange Contracts
As of December 31, 2004, the following Portfolios had entered into the following forward foreign currency exchange contracts resulting in the following:
Bond Portfolio
| | | | | | | | | | | |
Contracts to Deliver
| | In Exchange For
| | Settlement Date
| | Unrealized Appreciation (US$)
| |
USD | | 1,328,055 | | AUD | | 1,767,911 | | 3/9/2005 | | 50,322 | |
USD | | 145,000 | | BRL | | 441,888 | | 1/28/2005 | | 19,179 | |
USD | | 1,926,037 | | EUR | | 1,476,874 | | 1/14/2005 | | 81,591 | |
USD | | 30,000 | | EUR | | 23,751 | | 1/28/2005 | | 2,289 | |
GBP | | 229,990 | | USD | | 442,685 | | 3/9/2005 | | 3,028 | |
USD | | 80,000 | | IDR | | 747,680,000 | | 1/27/2005 | | 479 | |
USD | | 70,000 | | INR | | 3,118,500 | | 1/27/2005 | | 1,596 | |
USD | | 441,250 | | INR | | 19,748,144 | | 3/9/2005 | | 11,017 | |
USD | | 881,204 | | JPY | | 91,383,498 | | 3/9/2005 | | 14,886 | |
USD | | 156,511 | | MXN | | 1,780,000 | | 1/27/2005 | | 2,413 | |
USD | | 60,000 | | MXN | | 690,480 | | 1/27/2005 | | 1,648 | |
USD | | 74,000 | | RUB | | 2,112,700 | | 1/27/2005 | | 2,240 | |
USD | | 882,500 | | RUB | | 24,815,900 | | 3/9/2005 | | 14,761 | |
USD | | 1,328,055 | | SEK | | 8,929,178 | | 3/9/2005 | | 16,695 | |
USD | | 70,000 | | TRL | | 113,120,000,000 | | 1/27/2005 | | 12,583 | |
USD | | 60,000 | | TRL | | 89,880,000,000 | | 1/27/2005 | | 5,617 | |
USD | | 70,000 | | TRL | | 103,773,110,000 | | 1/27/2005 | | 5,759 | |
| | | |
Contracts to Deliver
| | In Exchange For
| | Settlement Date
| | Unrealized Appreciation (US$)
| |
USD | | 70,000 | | TWD | | 2,244,900 | | 1/27/2005 | | 924 | |
USD | | 441,250 | | TWD | | 14,274,438 | | 3/9/2005 | | 10,704 | |
| | | | | | | | | | |
|
|
Total unrealized appreciation | | | | | | | | 257,731 | |
| | | | | | | | | | |
|
|
| | | |
Contracts to Deliver
| | In Exchange For
| | Settlement Date
| | Unrealized Depreciation (US$)
| |
BRL | | 236,720 | | USD | | 80,000 | | 1/28/2005 | | (7,951 | ) |
BRL | | 205,168 | | USD | | 73,722 | | 1/28/2005 | | (2,506 | ) |
EUR | | 4,380,162 | | USD | | 5,271,524 | | 1/14/2005 | | (682,767 | ) |
EUR | | 1,456,110 | | USD | | 1,791,015 | | 1/14/2005 | | (188,387 | ) |
EUR | | 438,000 | | USD | | 553,098 | | 1/27/2005 | | (42,361 | ) |
EUR | | 15,036 | | USD | | 20,000 | | 1/27/2005 | | (441 | ) |
EUR | | 665,492 | | USD | | 885,370 | | 3/9/2005 | | (19,828 | ) |
MXN | | 2,137,405 | | USD | | 190,000 | | 1/27/2005 | | (834 | ) |
MXN | | 3,770,000 | | USD | | 324,734 | | 1/27/2005 | | (11,863 | ) |
MXN | | 1,689,420 | | USD | | 150,000 | | 1/27/2005 | | (836 | ) |
MXN | | 20,513,595 | | USD | | 1,751,203 | | 3/9/2005 | | (67,058 | ) |
NZD | | 1,884,033 | | USD | | 1,328,055 | | 3/9/2005 | | (22,220 | ) |
TRL | | 95,960,000,000 | | USD | | 61,758 | | 1/27/2005 | | (8,297 | ) |
USD | | 50,000 | | UAH | | 280,000 | | 9/15/2005 | | (2,381 | ) |
| | | | | | | | | | |
|
|
Total unrealized depreciation | | | | | | | | (1,057,730 | ) |
| | | | | | | | | | |
|
|
126
Balanced Portfolio
| | | | | | | | | | | |
Contracts to Deliver
| | In Exchange For
| | Settlement Date
| | Unrealized Appreciation (US$)
| |
USD | | 125,424 | | EUR | | 94,300 | | 1/27/2005 | | 2,776 | |
USD | | 122,330 | | INR | | 5,460,000 | | 1/27/2005 | | 3,123 | |
USD | | 374,386 | | JPY | | 38,500,000 | | 1/27/2005 | | 2,048 | |
AUD | | 160,000 | | NZD | | 175,789 | | 1/27/2005 | | 995 | |
AUD | | 160,000 | | NZD | | 175,789 | | 1/27/2005 | | 433 | |
USD | | 125,388 | | JPY | | 13,100,000 | | 1/27/2005 | | 2,698 | |
USD | | 123,167 | | TWD | | 3,990,000 | | 1/27/2005 | | 2,891 | |
AUD | | 160,000 | | NZD | | 171,074 | | 1/27/2005 | | 4,949 | |
USD | | 247,071 | | RUB | | 6,960,000 | | 1/27/2005 | | 4,090 | |
USD | | 247,287 | | SEK | | 1,700,000 | | 1/27/2005 | | 8,591 | |
EUR | | 94,418 | | SEK | | 846,000 | | 1/27/2005 | | 2,624 | |
| | | | | | | | | | |
|
|
Total unrealized appreciation | | 35,218 | |
| | | | | | | | | | |
|
|
| | | |
Contracts to Deliver
| | In Exchange For
| | Settlement Date
| | Unrealized Depreciation (US$)
| |
NZD | | 526,158 | | AUD | | 475,000 | | 1/27/2005 | | (364 | ) |
NZD | | 526,158 | | AUD | | 475,000 | | 1/27/2005 | | (6,959 | ) |
NZD | | 171,074 | | AUD | | 160,000 | | 1/27/2005 | | (2,982 | ) |
EUR | | 94,418 | | SEK | | 846,000 | | 1/27/2005 | | (3,648 | ) |
EUR | | 75,000 | | USD | | 98,710 | | 1/27/2005 | | (3,252 | ) |
EUR | | 93,000 | | USD | | 123,549 | | 1/27/2005 | | (2,884 | ) |
EUR | | 52,510 | | USD | | 67,835 | | 3/9/2005 | | (3,589 | ) |
EUR | | 54,622 | | USD | | 70,431 | | 3/9/2005 | | (61 | ) |
EUR | | 54,751 | | USD | | 70,906 | | 3/9/2005 | | (3,566 | ) |
EUR | | 7,700 | | USD | | 10,048 | | 3/9/2005 | | (426 | ) |
EUR | | 5,114 | | USD | | 6,790 | | 3/9/2005 | | (166 | ) |
| | | |
Contracts to Deliver
| | In Exchange For
| | Settlement Date
| | Unrealized Depreciation (US$)
| |
EUR | | 16,034 | | USD | | 20,902 | | 3/9/2005 | | (907 | ) |
GBP | | 67,000 | | USD | | 123,963 | | 1/27/2005 | | (4,426 | ) |
JPY | | 13,000,000 | | USD | | 126,275 | | 1/27/2005 | | (833 | ) |
MXN | | 460,000 | | USD | | 40,406 | | 1/27/2005 | | (664 | ) |
MXN | | 20,000,751 | | USD | | 1,719,164 | | 3/9/2005 | | (14,634 | ) |
| | | | | | | | | | |
|
|
Total unrealized depreciation | | (49,361 | ) |
| | | | | | | | | | |
|
|
Currency Abbreviations
| | | | | | | | | | |
| AUD | | Australian Dollar | | INR | | Indian Rupee | | SEK | | Swedish Krona |
| BRL | | Brazilian Real | | JPY | | Japanese Yen | | TRL | | Turkish Lira |
| EUR | | Euro | | MXN | | Mexican Peso | | TWD | | Taiwan Dollar |
| GBP | | British Pounds | | NZD | | New Zealand Dollar | | UAH | | Ukraine Hryvna |
| IDR | | Indonesian Rupiah | | RUB | | Russian Ruble | | USD | | United States Dollar |
127
E. Ownership of the Portfolios
At the end of the period, the beneficial ownership in the Portfolios was as follows:
Money Market Portfolio: Two Participating Insurance Companies were owners of record of 10% or more of the total outstanding shares of the Portfolio, each owning 49% and 15%, respectively.
Bond Portfolio: Three Participating Insurance Companies were owners of record of 10% or more of the total outstanding shares of the Portfolio, each owning 32%, 25% and 11%, respectively.
Balanced Portfolio: Three Participating Insurance Companies were owners of record of 10% or more of the total outstanding shares of the Portfolio, each owning 41%, 34% and 15%, respectively.
Growth and Income Portfolio: Three Participating Insurance Companies were owners of record of 10% or more of the total outstanding Class A shares of the Portfolio, each owning 29%, 21% and 20%, respectively. Four Participating Insurance Companies were owners of record of 60%, 17%, 12% and 10%, respectively, of the total outstanding Class B shares of the Portfolio.
Capital Growth Portfolio: Three Participating Insurance Companies were owners of record of 10% or more of the total outstanding Class A shares of the Portfolio, each owning 44%, 16% and 12%, respectively. One Participating Insurance Company was owner of record of 85% of the total outstanding Class B shares of the Portfolio.
21st Century Growth Portfolio: Three Participating Insurance Companies were owners of record of 10% or more of the total outstanding Class A shares of the Portfolio, each owning 63%, 21% and 13%, respectively. One Participating Insurance Company was owner of record of 89% of the total outstanding Class B shares of the Portfolio.
Global Discovery Portfolio: Three Participating Insurance Companies were owners of record of 10% or more of the total outstanding Class A shares of the Portfolio, each owning 54%, 22% and 11%, respectively. Two Participating Insurance Companies were owners of record of 65% and 22%, respectively, of the total outstanding Class B shares of the Portfolio.
International Portfolio: Three Participating Insurance Companies were owners of record of 10% or more of the total outstanding Class A shares of the Portfolio, each owning 22%, 18% and 14%, respectively. One Participating Insurance Company was owner of record of 86% of the total outstanding Class B shares of the Portfolio.
Health Sciences Portfolio: Two Participating Insurance Companies were owners of record of 10% or more of the total outstanding Class A shares of the Portfolio, each owning 76% and 23%, respectively. One Participating Insurance Company was owner of record of 83% of the total outstanding Class B shares of the Portfolio.
F. Line of Credit
The Series and several other affiliated funds (the “Participants”) share in a $1.25 billion revolving credit facility administered by J.P. Morgan Chase Bank for temporary or emergency purposes, including the meeting of redemption requests that otherwise might require the untimely disposition of securities. The Participants are charged an annual commitment fee which is allocated, based upon net assets, among each of the Participants. Interest is calculated at the Federal Funds Rate plus 0.5 percent. Each Portfolio may borrow up to a maximum of 33 percent of its net assets under the agreement.
128
G. Regulatory Matters and Litigation
Since at least July 2003, federal, state and industry regulators have been conducting ongoing inquiries and investigations (“inquiries”) into the mutual fund industry, and have requested information from numerous mutual fund companies, including Scudder Investments. It is not possible to determine what the outcome of these inquiries will be or what the effect, if any, would be on the funds or their advisors. Publicity about mutual fund practices arising from these industry-wide inquiries serves as the general basis of a number of private lawsuits against the Scudder funds. These lawsuits, which previously have been reported in the press, involve purported class action and derivative lawsuits, making various allegations and naming as defendants various persons, including certain Scudder funds, the funds’ investment advisors and their affiliates, certain individuals, including in some cases fund Trustees/Directors, officers, and other parties. Each Scudder fund’s investment advisor has agreed to indemnify the applicable Scudder funds in connection with these lawsuits, or other lawsuits or regulatory actions that may be filed making allegations similar to these lawsuits regarding market timing, revenue sharing, fund valuation or other subjects arising from or related to the pending inquiries. Based on currently available information, the funds’ investment advisors believe the likelihood that the pending lawsuits will have a material adverse financial impact on a Scudder fund is remote and such actions are not likely to materially affect their ability to perform under their investment management agreements with the Scudder funds.
H. Fund Mergers
On December 13, 2004, the Board of Scudder Variable Series I (the “Series”) approved, in principle, the merger of Balanced Portfolio into Scudder Total Return Portfolio and 21st Century Growth Portfolio into Scudder Small Cap Growth Portfolio, Scudder portfolios managed by the same portfolio management team.
Completion of the mergers are subject to a number of conditions, including final approval by the Series’ Board and approval by the shareholders of the Balanced Portfolio and the 21st Century Growth Portfolio at their respective shareholder meetings expected to be held within approximately the next four months.
I. Payments Made by Affiliates
During the year ended December 31, 2004, the Advisor fully reimbursed International Portfolio $1,083 for losses incurred in violation of investment restrictions.
129
Report of Independent Registered Public Accounting Firm
To the Trustees and Shareholders of Scudder Variable Series I:
In our opinion, the accompanying statements of assets and liabilities, including the investment portfolios, and the related statements of operations and of changes in net assets and the financial highlights present fairly, in all material respects, the financial position of the nine Portfolios (identified in Note A) of Scudder Variable Series I (the “Series”) at December 31, 2004 and the results of each of their operations, the changes in each of their net assets, and the financial highlights for the periods indicated therein, in conformity with accounting principles generally accepted in the United States of America. These financial statements and financial highlights (hereafter referred to as “financial statements”) are the responsibility of the Series’ management; our responsibility is to express an opinion on these financial statements based on our audits. We conducted our audits of these financial statements in accordance with the standards of the Public Company Accounting Oversight Board (United States). Those standards require that we plan and perform the audit to obtain reasonable assurance about whether the financial statements are free of material misstatement. An audit includes examining, on a test basis, evidence supporting the amounts and disclosures in the financial statements, assessing the accounting principles used and significant estimates made by management, and evaluating the overall financial statement presentation. We believe that our audits, which included confirmation of securities at December 31, 2004 by correspondence with the custodians and brokers, provide a reasonable basis for our opinion.
PricewaterhouseCoopers LLP
Boston, Massachusetts
February 14, 2005
130
Tax Information (Unaudited)
Pursuant to Section 852 of the Internal Revenue Code, the Bond Portfolio designates approximately $1,100,000 as capital gain dividends for its year ended December 31, 2004, of which 100% represents 15% rate gains.
Pursuant to Section 854 of the Internal Revenue Code, the percentages of income dividends paid in calendar year 2004 which qualify for the dividends received deduction are as follows: Balanced Portfolio 50%, Growth and Income Portfolio 100%, Capital Growth Portfolio 100% and Global Discovery Portfolio 60%.
International Portfolio paid foreign taxes of $1,330,532 and earned $7,639,065 of foreign source income during the year ended December 31, 2004. Pursuant to Section 853 of the Internal Revenue Code, International Portfolio designates $.03 per share as foreign taxes paid and $.13 per share as income earned from foreign sources for the year ended December 31, 2004.
Global Discovery Portfolio paid foreign taxes of $202,861 and earned $946,697 of foreign source income during the year ended December 31, 2004. Pursuant to Section 853 of the Internal Revenue Code, Global Discovery Portfolio designates $.02 per share as foreign taxes paid and $.05 per share as income earned from foreign sources for the year ended December 31, 2004.
Please consult a tax advisor if you have questions about federal or state income tax laws, or on how to prepare your tax returns. If you have specific questions about your account, please call 1-800-SCUDDER.
Proxy Voting
A description of the series’ policies and procedures for voting proxies for portfolio securities and information about how the series voted proxies related to its portfolio securities during the 12-month period ended June 30 is available on our Web site — scudder.com (type “proxy voting” in the search field) — or on the SEC’s Web site — www.sec.gov. To obtain a written copy of the series’ policies and procedures without charge, upon request, call us toll free at (800) 621-1048.
131
Trustees and Officers
The following table presents certain information regarding the Trustees and Officers of the fund as of December 31, 2004. Each individual’s year of birth is set forth in parentheses after his or her name. Unless otherwise noted, (i) each individual has engaged in the principal occupation(s) noted in the table for at least the most recent five years, although not necessarily in the same capacity, and (ii) the address of each Trustee is c/o Dawn-Marie Driscoll, PO Box 100176, Cape Coral, FL 33904. Unless otherwise indicated, the address of each Officer is Two International Place, Boston, Massachusetts 02110. The term of office for each Trustee is until the next meeting of shareholders called for the purpose of electing Trustees and until the election and qualification of a successor, or until such Trustee sooner dies, resigns, retires or is removed as provided in the governing documents of the fund. Because the fund does not hold an annual meeting of shareholders, each Trustee will hold office for an indeterminate period. The Trustees of the Trust may also serve in similar capacities with other funds in the fund complex.
Independent Trustees
| | | | |
Name, Year of Birth, Position(s) Held with the Fund and Length of Time Served1
| | Principal Occupation(s) During Past 5 Years and Other Directorships Held
| | Number of
Funds in Fund
Complex
Overseen
|
Dawn-Marie Driscoll (1946) Chairman, 2004-present Trustee, 1987-present | | President, Driscoll Associates (consulting firm); Executive Fellow, Center for Business Ethics, Bentley College; formerly, Partner, Palmer & Dodge (1988-1990); Vice President of Corporate Affairs and General Counsel, Filene’s (1978-1988). Directorships: CRS Technology (technology service company); Advisory Board, Center for Business Ethics, Bentley College; Board of Governors, Investment Company Institute; former Chairman, ICI Directors Services Committee | | 46 |
| | |
Henry P. Becton, Jr. (1943) Trustee, 1990-present | | President, WGBH Educational Foundation. Directorships: Becton Dickinson and Company (medical technology company); The A.H. Belo Company (media company); Concord Academy; Boston Museum of Science; Public Radio International. Former Directorships: American Public Television; New England Aquarium; Mass Corporation for Educational Telecommunications; Committee for Economic Development; Public Broadcasting Service | | 46 |
| | |
Keith R. Fox (1954) Trustee, 1996-present | | Managing Partner, Exeter Capital Partners (private equity funds). Directorships: Facts on File (school and library publisher); Progressive Holding Corporation (kitchen importer and distributor); Cloverleaf Transportation Inc. (trucking); K-Media, Inc. (broadcasting); Natural History, Inc. (magazine publisher); National Association of Small Business Investment Companies (trade association) | | 46 |
| | |
Louis E. Levy (1932) Trustee, 2002-present | | Retired. Formerly, Chairman of the Quality Control Inquiry Committee, American Institute of Certified Public Accountants (1992-1998); Partner, KPMG LLP (1958-1990). Directorships: Household International (banking and finance); ISI Family of Funds (registered investment companies; 4 funds overseen) | | 46 |
| | |
Jean Gleason Stromberg (1943) Trustee, 1999-present | | Retired. Formerly, Consultant (1997-2001); Director, US General Accounting Office (1996-1997); Partner, Fulbright & Jaworski, L.L.P. (law firm) (1978-1996). Directorships: The William and Flora Hewlett Foundation; Service Source, Inc. | | 46 |
| | |
Jean C. Tempel (1943) Trustee, 1994-present | | Managing Partner, First Light Capital (venture capital group) (2000-present); formerly, Special Limited Partner, TL Ventures (venture capital fund) (1996-1998); General Partner, TL Ventures (1994-1996); President and Chief Operating Officer, Safeguard Scientifics, Inc. (public technology business incubator company) (1991-1993). Directorships: Sonesta International Hotels, Inc.; Aberdeen Group (technology research); United Way of Mass Bay; The Commonwealth Institute (supports women entrepreneurs). Trusteeships: Connecticut College, Vice Chair of Board, Chair, Finance Committee; Northeastern University, Vice Chair of Finance Committee, Chair, Funds and Endowment Committee | | 46 |
| | |
Carl W. Vogt (1936) Trustee, 2002-present | | Senior Partner, Fulbright & Jaworski, L.L.P. (law firm); formerly, President (interim) of Williams College (1999-2000); President, certain funds in the Deutsche Asset Management Family of Funds (formerly, Flag Investors Family of Funds) (registered investment companies) (1999-2000). Directorships: Yellow Corporation (trucking); American Science & Engineering (x-ray detection equipment); ISI Family of Funds (registered investment companies, 4 funds overseen); National Railroad Passenger Corporation (Amtrak); formerly, Chairman and Member, National Transportation Safety Board | | 46 |
132
Officers2
| | |
Name, Year of Birth,
Position(s) Held with the Fund and Length of Time Served1
| | Principal Occupation(s) During Past 5 Years and Other Directorships Held
|
Julian F. Sluyters3 (1960) President and Chief Executive Officer, 2004-present | | Managing Director, Deutsche Asset Management (since May 2004); President and Chief Executive Officer of The Germany Fund, Inc., The New Germany Fund, Inc., The Central Europe and Russia Fund, Inc., The Brazil Fund, Inc., The Korea Fund, Inc., Scudder Global High Income Fund, Inc. and Scudder New Asia Fund, Inc. (since May 2004); President and Chief Executive Officer, UBS Fund Services (2001-2003); Chief Administrative Officer (1998-2001) and Senior Vice President and Director of Mutual Fund Operations (1991-1998) UBS Global Asset Management |
| |
John Millette (1962) Vice President and Secretary, 1999-present | | Director, Deutsche Asset Management |
| |
Kenneth Murphy (1963) Vice President, 2002-present | | Vice President, Deutsche Asset Management (2000-present); formerly, Director, John Hancock Signature Services (1992-2000) |
| |
Paul H. Schubert3 (1963) Chief Financial Officer, 2004-present | | Managing Director, Deutsche Asset Management (since July 2004); formerly, Executive Director, Head of Mutual Fund Services and Treasurer for UBS Family of Funds at UBS Global Asset Management (1994-2004) |
| |
Charles A. Rizzo (1957) Treasurer, 2002-present | | Managing Director, Deutsche Asset Management (since April 2004); formerly, Director, Deutsche Asset Management (April 2000-March 2004); Vice President and Department Head, BT Alex. Brown Incorporated (now Deutsche Bank Securities Inc.) (1998-1999); Senior Manager, Coopers & Lybrand L.L.P. (now PricewaterhouseCoopers LLP) (1993-1998) |
| |
Lisa Hertz3 (1970) Assistant Secretary, 2003-present | | Assistant Vice President, Deutsche Asset Management |
| |
Daniel O. Hirsch4 (1954) Assistant Secretary, 2002-present | | Managing Director, Deutsche Asset Management (2002-present) and Director, Deutsche Global Funds Ltd. (2002-present); formerly, Director, Deutsche Asset Management (1999-2002); Principal, BT Alex. Brown Incorporated (now Deutsche Bank Securities Inc.) (1998-1999); Assistant General Counsel, United States Securities and Exchange Commission (1993-1998) |
| |
Caroline Pearson (1962) Assistant Secretary, 1997-present | | Managing Director, Deutsche Asset Management |
| |
Kevin M. Gay (1959) Assistant Treasurer, 2004-present | | Vice President, Deutsche Asset Management |
| |
Salvatore Schiavone (1965) Assistant Treasurer, 2003-present | | Director, Deutsche Asset Management |
| |
Kathleen Sullivan D’Eramo (1957) Assistant Treasurer, 2003-present | | Director, Deutsche Asset Management |
| |
Philip Gallo3 (1962) Chief Compliance Officer, 2004-present | | Managing Director, Deutsche Asset Management (2003-present); formerly, Co-Head of Goldman Sachs Asset Management Legal (1994-2003) |
| 1 | Length of time served represents the date that each Trustee was first elected to the common board of Trustees which oversees a number of investment companies, including the fund, managed by the Advisor. For the Officers of the fund, the length of time served represents the date that each Officer was first elected to serve as an Officer of any fund overseen by the aforementioned common board of Trustees. |
| 2 | As a result of their respective positions held with the Advisor, these individuals are considered “interested persons” of the Advisor within the meaning of the 1940 Act. Interested persons receive no compensation from the funds. |
| 3 | Address: 345 Park Avenue, New York, New York |
| 4 | Address: One South Street, Baltimore, Maryland |
The fund’s Statement of Additional Information (“SAI”) includes additional information about the Trustees. The SAI is available, without charge, upon request. If you would like to request a copy of the SAI, you may do so by calling the following toll-free number: 1-800-SCUDDER.
133
Notes
134
Notes
135
Notes
136
About the Series’ Advisor
Scudder Investments is part of Deutsche Asset Management, which is the marketing name in the US for the asset management activities of Deutsche Bank AG, Deutsche Investment Management Americas Inc., Deutsche Asset Management Inc., Deutsche Asset Management Investment Services Ltd., Deutsche Bank Trust Company Americas and Scudder Trust Company.
An investment in the Money Market Portfolio is not insured or guaranteed by the Federal Deposit Insurance Corporation or any other government agency. Although the Money Market Portfolio seeks to preserve the value of your investment at $1.00 per share, it is possible to lose money by investing in the Portfolio.
The views expressed in this report reflect those of the portfolio managers only through the end of the period of the report as stated on the cover. The managers’ views are subject to change at any time based on market and other conditions and should not be construed as a recommendation.
137
SCUDDER VARIABLE SERIES II
PART C – OTHER INFORMATION
| Item 15. | Indemnification. |
Article VIII of the Registrant’s Amended and Restated Agreement and Declaration of Trust (Exhibit (1)(a) hereto, which is incorporated herein by reference) provides in effect that the Registrant will indemnify its officers and trustees under certain circumstances. However, in accordance with Section 17(h) and 17(i) of the Investment Company Act of 1940 and its own terms, said Article of the Amended and Restated Agreement and Declaration of Trust does not protect any person against any liability to the Registrant or its shareholders to which such Trustee would otherwise be subject by reason of willful misfeasance, bad faith, gross negligence, or reckless disregard of the duties involved in the conduct of his or her office.
Each of the trustees who is not an “interested person” (as defined under the Investment Company Act of 1940) of Registrant (a “Non-interested Trustee”) has entered into an indemnification agreement with Registrant, which agreement provides that the Registrant shall indemnify the Non-interested Trustee against certain liabilities which such Trustee may incur while acting in the capacity as a trustee, officer or employee of the Registrant to the fullest extent permitted by law, now or in the future, and requires indemnification and advancement of expenses unless prohibited by law. The indemnification agreement cannot be altered without the consent of the Non-interested Trustee and is not affected by amendment of the Amended and Restated Agreement and Declaration of Trust. In addition, the indemnification agreement adopts certain presumptions and procedures which may make the process of indemnification and advancement of expenses more timely, efficient and certain. In accordance with Section 17(h) of the Investment Company Act of 1940, the indemnification agreement does not protect a Non-interested Trustee against any liability to the Registrant or its shareholders to which such Trustee would otherwise be subject by reason of willful misfeasance, bad faith, gross negligence, or reckless disregard of the duties involved in the conduct of his or her office.
The Registrant has purchased insurance policies insuring its officers and trustees against certain liabilities which such officers and trustees may incur while acting in such capacities and providing reimbursement to the Registrant for sums which it may be permitted or required to pay to its officers and trustees by way of indemnification against such liabilities, subject to certain deductibles.
On April 5, 2002, Zurich Scudder Investments, Inc. (“Scudder”), the investment adviser, now known as Deutsche Investment Management Americas Inc. (“DeIM”), was acquired by Deutsche Bank AG, not including certain U.K. Operations (the “Transaction”). In connection with the Trustees’ evaluation of the Transaction, Deutsche Bank agreed to indemnify, defend and hold harmless Registrant and the trustees who were not “interested persons” of Scudder, Deutsche Bank or Registrant (the “Independent Trustees”) for and against any liability and claims and expenses based upon or arising from, whether in whole or in part, or directly or indirectly, any untrue statement or alleged untrue statement of a material fact made to the Independent Trustees by Deutsche Bank in connection with the Independent Trustees’ consideration of the Transaction, or any omission or alleged omission of a material fact necessary in order to make statements made, in light of the circumstances under which they were made, not misleading.
C-1
DeIM, the investment advisor, has agreed, subject to applicable law and regulation, to indemnify and hold harmless the Registrant against any loss, damage, liability and expense, including, without limitation, the advancement and payment, as incurred, of reasonable fees and expenses of counsel (including counsel to the Registrant and counsel to the Non-interested Trustees) and consultants, whether retained by the Registrant or the Non-interested Trustees, and other customary costs and expenses incurred by the Registrant in connection with any litigation or regulatory action related to possible improper market timing or other improper trading activity or possible improper marketing and sales activity in the Registrant (“Private Litigation and Enforcement Actions.”). In the event that this indemnification is unavailable to the Registrant for any reason, then DeIM has agreed to contribute to the amount paid or payable by the Registrant as a result of any loss, damage, liability or expense in such proportion as is appropriate to reflect the relative fault of DeIM and the Registrant with respect to the matters which resulted in such loss, damage, liability or expense, as well as any other relevant equitable considerations; provided; however, if no final determination is made in such action or proceeding as to the relative fault of DeIM and the Registrant, then DeIM shall pay the entire amount of such loss, damage, liability or expense.
In recognition of its undertaking to indemnify the Registrant, DeIM has also agreed, subject to applicable law and regulation, to indemnify and hold harmless each of the Non-interested Trustees against any and all loss, damage, liability and expense, including without limitation the advancement and payment as incurred of reasonable fees and expenses of counsel and consultants, and other customary costs and expenses incurred by the Non-interested Trustees, arising from the Private Litigation and Enforcement, including without limitation:
| 1. | all reasonable legal and other expenses incurred by the Non-interested Trustees in connection with the Private Litigation and Enforcement Actions, and any actions that may be threatened or commenced in the future by any person (including any governmental authority), arising from or similar to the matters alleged in the Private Litigation and Enforcement Actions, including without limitation expenses related to the defense of, service as a witness in, or monitoring of such proceedings or actions; |
| 2. | all liabilities and expenses incurred by any Non-interested Trustee in connection with any judgment resulting from, or settlement of, any such proceeding, action or matter; |
| 3. | any loss or expense incurred by any Non-interested Trustee as a result of the denial of, or dispute about, any insurance claim under, or actual or purported rescission or termination of, any policy of insurance arranged by DeIM (or by a representative of DeIM acting as such, acting as a representative of the Registrant or of the Non-interested Trustee or acting otherwise) for the benefit of the Non-interested Trustee, to the extent that such denial, dispute or rescission is based in whole or in part upon any alleged misrepresentation made in the application for such policy or any other alleged improper conduct on the part of DeIM, any of its corporate affiliates, or any of their directors, officers or employees; |
| 4. | any loss or expense incurred by any Non-interested Trustee, whether or not such loss or expense is otherwise covered under the terms of a policy of insurance, but for which the Non-interested Trustee is unable to obtain advancement of expenses or indemnification under that policy of insurance, due to the exhaustion of policy limits which is due in whole or in part to DeIM or any affiliates thereof having received advancement of expenses or indemnification under that policy for or with respect to a matter which is the subject of the indemnification agreement; provided, however, the total amount which DeIM will be obligated to pay under this provision for all loss or expense, will not exceed the amount that DeIM and any of its affiliate actually receive under that policy or insurance for or with respect to a matter which is the subject of the indemnification agreement; and |
| 5. | all liabilities and expenses incurred by any Non-interested Trustee in connection with any proceeding or action to enforce his or her rights under the agreement, unless DeIM prevails on the merits of any such dispute in a final, nonappealable court order. |
C-2
DeIM is not required to pay costs or expenses or provide indemnification to or for any individual Non-interested Trustee (i) with respect to any particular proceeding or action as to which the Board of the Registrant has determined that such Non-interested Trustee ultimately will not be entitled to indemnification with respect thereto, or (ii) for any liability of the Non-interested Trustee to the Registrant or its shareholders to which such Non-interested Trustee would otherwise be subject by reason of willful misfeasance, bad faith, gross negligence, or reckless disregard of the Non-interested Trustee’s duties as a Trustee of the Registrant as determined in a final adjudication in such proceeding or action. In addition, to the extent that DeIM has paid costs or expenses under the agreement to any individual Non-interested Trustee with respect to a particular proceeding or action, and there is a final adjudication in such proceeding or action of the Non-interested Trustee’s liability to the Registrant or its shareholders by reason of willful misfeasance, bad faith, gross negligence, or reckless disregard of the Non-interested Trustee’s duties as a Trustee of the Registrant, such Non-interested Trustee has undertaken to repay such costs or expenses to DeIM.
| | | | |
Exhibit 1 | | (a) | | Amended and Restated Agreement and Declaration of Trust, dated April 24, 1998. (Incorporated by reference to Post-Effective Amendment No. 22 to the Registration Statement, filed April 28, 1998.) |
| | |
| | | (b) | | Certificate of Amendment of Declaration of Trust, dated March 31, 1999. (Incorporated by reference to Post-Effective Amendment No. 24 to the Registration Statement, filed on April 29, 1999.) |
| | |
| | | (c) | | Amended and Restated Establishment and Designation of Series of Shares of Beneficial Interest dated March 31, 1999. (Incorporated by reference to Post-Effective Amendment No. 27 to the Registration Statement, filed on September 1, 1999.) |
| | |
| | | (d) | | Amended and Restated Establishment and Designation of Series of Shares of Beneficial Interest dated July 14, 1999. (Incorporated by reference to Post-Effective Amendment No. 27 to the Registration Statement, filed on September 1, 1999.) |
| | |
| | | (e) | | Amended and Restated Establishment and Designation of Series of Shares of Beneficial Interest dated September 29, 1999. (Incorporated by reference to Post-Effective Amendment No. 29 to the Registration Statement, filed on October 29, 1999.) |
| | |
| | | (f) | | Redesignation of Series dated May 1, 2000. (Incorporated by reference to Post-Effective Amendment No. 32 to the Registration Statement, filed on May 1, 2000.) |
| | |
| | | (g) | | Amended and Restated Establishment and Designation of Series of Shares of Beneficial Interest dated January 24, 2001. (Incorporated by reference to Post-Effective Amendment No. 33 to the Registration Statement, filed on February 15, 2001.) |
| | |
| | | (h) | | Amended and Restated Establishment and Designation of Series of Shares of Beneficial Interest dated March 28, 2001. (Incorporated by reference to Post-Effective Amendment No. 36 to the Registration Statement, filed on May 1, 2002.) |
| | |
| | | (i) | | Redesignation of Series dated November 29, 2000. (Incorporated by reference to Post-Effective Amendment No. 33 to the Registration Statement, filed on February 15, 2001.) |
| | |
| | | (j) | | Amended and Restated Establishment and Designation of Series of Shares of Beneficial Interest dated March 20, 2002. (Incorporated by reference to Post-Effective Amendment No. 36 to the Registration Statement, filed on May 1, 2002.) |
C-3
| | | | |
| | | (k) | | Certificate of Amendment of Declaration of Trust, dated November 29, 2000. (Incorporated by reference to Post-Effective Amendment No. 33 to the Registration Statement, filed on February 15, 2001.) |
| | |
| | | (l) | | Redesignation of Series for SVS Dreman Small Cap Value Portfolio, dated January 15, 2002. (Incorporated by reference to Post-Effective Amendment No. 35 to the Registration statement, filed on February 13, 2002.) |
| | |
| | | (m) | | Establishment and Designation of Series of Shares of Beneficial Interest for SVS MFS Strategic Value Portfolio dated March 20, 2002. (Incorporated by reference to Post-Effective Amendment No. 36 to the Registration Statement, filed on May 1, 2002.) |
| | |
| | | (n) | | Establishment and Designation of Class of Shares of Beneficial Interest dated November 28, 2001. (Incorporated by reference to Post-Effective Amendment No. 36 to the Registration Statement, filed on May 1, 2002.) |
| | |
| | | (o) | | Amended and Restated Establishment and Designation of Series of Shares of Beneficial Interest, dated January 15, 2003. (Incorporated by reference to Post-Effective Amendment No. 38 to the Registration Statement, filed on February 28, 2003.) |
| | |
| | | (p) | | Establishment and Designation of Classes of Shares of Beneficial Interest, No Par Value Going Forth, dated January 15, 2003. (Incorporated by reference to Post-Effective Amendment No. 38 to the Registration Statement, filed on February 28, 2003.) |
| | |
| | | (q) | | Redesignation of Series of Shares of Beneficial Interest as Scudder High Income Portfolio, dated September 2002. (Incorporated by reference to Post-Effective Amendment No. 39 to the Registration Statement, filed on April 30, 2003.) |
| | |
| | | (r) | | Establishment and Designation of Classes of Shares of Beneficial Interest, as Scudder Strategic Income Portfolio, dated January 15, 2003. (Incorporated by reference to Post-Effective Amendment No. 39 to the Registration Statement, filed on April 30, 2003.) |
| | |
| | | (s) | | Redesignation of Series of Shares of Beneficial Interest as Scudder Fixed Income Portfolio, dated January 15, 2003. (Incorporated by reference to Post-Effective Amendment No. 39 to the Registration Statement, filed on April 30, 2003.) |
| | |
| | | (t) | | Amended and Restated Establishment and Designation of Classes of Series of Shares of Beneficial Interest dated March 17, 2004. (Incorporated by reference to Post-Effective Amendment No. 45 to the Registration Statement, filed on April 1, 2004.) |
| | |
| | | (u) | | Redesignation of Series as Scudder Government & Agency Securities Portfolio, dated March 17, 2004. (Incorporated by reference to Post-Effective Amendment No. 54 to the Registration Statement, filed on November 15, 2004.) |
| | |
| Exhibit 2 | | (a) | | By-laws. (Incorporated by reference to Post-Effective Amendment No. 14 to the Registration Statement, filed on April 27, 1995.) |
| | |
| | | (b) | | Amended By-laws dated November 30, 2000. (Incorporated by reference to Post-Effective Amendment No. 36 to the Registration Statement, filed on May 1, 2002.) |
| | |
| Exhibit 3 | | | | Not Applicable. |
C-4
| | | | |
| Exhibit 4 | | | | Form of Agreement and Plan of Reorganization is filed herein as Exhibit A to Part A of this Registration Statement on Form N-14. |
| | |
| Exhibit 5 | | | | Text of Share Certificate. (Incorporated by reference to Post-Effective Amendment No. 14 to the Registration Statement, filed on April 27, 1995.) |
| | |
| Exhibit 6 | | (a) | | Investment Management Agreement between the Registrant, on behalf of Scudder Aggressive Growth Portfolio and Deutsche Investment Management Americas Inc. dated April 5, 2002. (Incorporated by reference to Post-Effective Amendment No. 36 to the Registration Statement, filed on May 1, 2002.) |
| | |
| | | (b) | | Investment Management Agreement between the Registrant, on behalf of Scudder Blue Chip Portfolio and Deutsche Investment Management Americas Inc. dated April 5, 2002. (Incorporated by reference to Post-Effective Amendment No. 36 to the Registration Statement, filed on May 1, 2002.) |
| | |
| | | (c) | | Investment Management Agreement between the Registrant, on behalf of Scudder Contrarian Value Portfolio and Deutsche Investment Management Americas Inc. dated April 5, 2002. (Incorporated by reference to Post-Effective Amendment No. 36 to the Registration Statement, filed on May 1, 2002.) |
| | |
| | | (d) | | Investment Management Agreement between the Registrant, on behalf of Scudder Global Blue Chip Portfolio and Deutsche Investment Management Americas Inc. dated April 5, 2002. (Incorporated by reference to Post-Effective Amendment No. 36 to the Registration Statement, filed on May 1, 2002.) |
| | |
| | | (e) | | Investment Management Agreement between the Registrant, on behalf of Scudder Government Securities Portfolio and Deutsche Investment Management Americas Inc. dated April 5, 2002. (Incorporated by reference to Post-Effective Amendment No. 36 to the Registration Statement, filed on May 1, 2002.) |
| | |
| | | (f) | | Investment Management Agreement between the Registrant, on behalf of Scudder Growth Portfolio and Deutsche Investment Management Americas Inc. dated April 5, 2002. (Incorporated by reference to Post-Effective Amendment No. 36 to the Registration Statement, filed on May 1, 2002.) |
| | |
| | | (g) | | Investment Management Agreement between the Registrant, on behalf of Scudder High Yield Portfolio and Deutsche Investment Management Americas Inc. dated April 5, 2002. (Incorporated by reference to Post-Effective Amendment No. 36 to the Registration Statement, filed on May 1, 2002.) |
| | |
| | | (h) | | Investment Management Agreement between the Registrant, on behalf of Scudder International Research Portfolio and Deutsche Investment Management Americas Inc. dated April 5, 2002. (Incorporated by reference to Post-Effective Amendment No. 36 to the Registration Statement, filed on May 1, 2002.) |
| | |
| | | (i) | | Investment Management Agreement between the Registrant, on behalf of Scudder Investment Grade Bond Portfolio and Deutsche Investment Management Americas Inc. dated April 5, 2002. (Incorporated by reference to Post-Effective Amendment No. 36 to the Registration Statement, filed on May 1, 2002.) |
| | |
| | | (j) | | Investment Management Agreement between the Registrant, on behalf of Scudder Money Market Portfolio and Deutsche Investment Management Americas Inc. dated April 5, 2002. (Incorporated by reference to Post-Effective Amendment No. 36 to the Registration Statement, filed on May 1, 2002.) |
C-5
| | | | |
| | | (k) | | Investment Management Agreement between the Registrant, on behalf of Scudder New Europe Portfolio and Deutsche Investment Management Americas Inc. dated April 5, 2002. (Incorporated by reference to Post-Effective Amendment No. 36 to the Registration Statement, filed on May 1, 2002.) |
| | |
| | | (l) | | Investment Management Agreement between the Registrant, on behalf of Scudder Small Cap Growth Portfolio and Deutsche Investment Management Americas Inc. dated April 5, 2002. (Incorporated by reference to Post-Effective Amendment No. 36 to the Registration Statement, filed on May 1, 2002.) |
| | |
| | | (m) | | Investment Management Agreement between the Registrant, on behalf of Scudder Strategic Income Portfolio and Deutsche Investment Management Americas Inc. dated April 5, 2002. (Incorporated by reference to Post-Effective Amendment No. 36 to the Registration Statement, filed on May 1, 2002.) |
| | |
| | | (n) | | Investment Management Agreement between the Registrant, on behalf of Scudder Technology Growth Portfolio and Deutsche Investment Management Americas Inc. dated April 5, 2002. (Incorporated by reference to Post-Effective Amendment No. 36 to the Registration Statement, filed on May 1, 2002.) |
| | |
| | | (o) | | Investment Management Agreement between the Registrant, on behalf of Scudder Total Return Portfolio and Deutsche Investment Management Americas Inc. dated April 5, 2002. (Incorporated by reference to Post-Effective Amendment No. 36 to the Registration Statement, filed on May 1, 2002.) |
| | |
| | | (p) | | Investment Management Agreement between the Registrant, on behalf of SVS Venture Value Portfolio and Deutsche Investment Management Americas Inc. dated April 5, 2002. (Incorporated by reference to Post-Effective Amendment No. 36 to the Registration Statement, filed on May 1, 2002.) |
| | |
| | | (q) | | Investment Management Agreement between the Registrant, on behalf of SVS Dreman Financial Services Portfolio and Deutsche Investment Management Americas Inc. dated April 5, 2002. (Incorporated by reference to Post-Effective Amendment No. 36 to the Registration Statement, filed on May 1, 2002.) |
| | |
| | | (r) | | Investment Management Agreement between the Registrant, on behalf of SVS Dreman High Return Equity Portfolio and Deutsche Investment Management Americas Inc. dated April 5, 2002. (Incorporated by reference to Post-Effective Amendment No. 36 to the Registration Statement, filed on May 1, 2002.) |
| | |
| | | (s) | | Investment Management Agreement between the Registrant, on behalf of Scudder Small Cap Growth Value Portfolio and Deutsche Investment Management Americas Inc. dated April 5, 2002. (Incorporated by reference to Post-Effective Amendment No. 36 to the Registration Statement, filed on May 1, 2002.) |
| | |
| | | (t) | | Investment Management Agreement between the Registrant, on behalf of SVS Focused Large Cap Growth Portfolio and Deutsche Investment Management Americas Inc. dated April 5, 2002. (Incorporated by reference to Post-Effective Amendment No. 36 to the Registration Statement, filed on May 1, 2002.) |
| | |
| | | (u) | | Investment Management Agreement between the Registrant, on behalf of Scudder Focus Value+Growth Portfolio and Deutsche Investment Management Americas Inc. dated April 5, 2002. (Incorporated by reference to Post-Effective Amendment No. 36 to the Registration Statement, filed on May 1, 2002.) |
C-6
| | | | |
| | | (v) | | Investment Management Agreement between the Registrant, on behalf of SVS Index 500 Portfolio and Deutsche Investment Management Americas Inc. dated April 5, 2002. (Incorporated by reference to Post-Effective Amendment No. 36 to the Registration Statement, filed on May 1, 2002.) |
| | |
| | | (w) | | Investment Management Agreement between the Registrant, on behalf of SVS Dynamic Growth Portfolio and Deutsche Investment Management Americas Inc. dated April 5, 2002. (Incorporated by reference to Post-Effective Amendment No. 36 to the Registration Statement, filed on May 1, 2002.) |
| | |
| | | (x) | | Investment Management Agreement between the Registrant, on behalf of SVS Growth and Income Portfolio and Deutsche Investment Management Americas Inc. dated April 5, 2002. (Incorporated by reference to Post-Effective Amendment No. 36 to the Registration Statement, filed on May 1, 2002.) |
| | |
| | | (y) | | Investment Management Agreement between the Registrant, on behalf of SVS Growth Opportunities Portfolio and Deutsche Investment Management Americas Inc. dated April 5, 2002. (Incorporated by reference to Post-Effective Amendment No. 36 to the Registration Statement, filed on May 1, 2002.) |
| | |
| | | (z) | | Investment Management Agreement between the Registrant, on behalf of SVS Strategic Equity Portfolio and Deutsche Investment Management Americas Inc. dated April 5, 2002. (Incorporated by reference to Post-Effective Amendment No. 36 to the Registration Statement, filed on May 1, 2002.) |
| | |
| | | (aa) | | Investment Management Agreement between the Registrant, on behalf of SVS Mid Cap Growth Portfolio and Deutsche Investment Management Americas Inc. dated April 5, 2002. (Incorporated by reference to Post-Effective Amendment No. 36 to the Registration Statement, filed on May 1, 2002.) |
| | |
| | | (bb) | | Investment Management Agreement between the Registrant, on behalf of SVS MFS Strategic Value Portfolio and Deutsche Investment Management Americas Inc. dated May 1, 2002. (Incorporated by reference to Post-Effective Amendment No. 38 to the Registration Statement, filed on February 28, 2003.) |
| | |
| | | (cc) | | Investment Management Agreement between the Registrant, on behalf of Scudder Conservative Income Strategy Portfolio, and Deutsche Investment Management Americas Inc. dated January 14, 2004. (Incorporated by reference to Post-Effective Amendment No. 46 to the Registration Statement, filed on April 28, 2004.) |
| | |
| | | (dd) | | Investment Management Agreement between the Registrant, on behalf of Scudder Growth & Income Strategy Portfolio, and Deutsche Investment Management Americas Inc. dated April 1, 2004. (Incorporated by reference to Post-Effective Amendment No. 46 to the Registration Statement, filed on April 28, 2004.) |
| | |
| | | (ee) | | Investment Management Agreement between the Registrant, on behalf of Scudder Growth Strategy Portfolio, and Deutsche Investment Management Americas Inc. dated January 14, 2004. (Incorporated by reference to Post-Effective Amendment No. 46 to the Registration Statement, filed on April 28, 2004.) |
| | |
| | | (ff) | | Investment Management Agreement between the Registrant, on behalf of Scudder Income & Growth Strategy Portfolio, and Deutsche Investment Management Americas Inc. dated April 1, 2004. (Incorporated by reference to Post-Effective Amendment No. 46 to the Registration Statement, filed on April 28, 2004.) |
C-7
| | | | |
| | | (gg) | | Subadvisory Agreement between Scudder Kemper Investments, Inc. and Scudder Investments (U.K.) Limited, dated September 7, 1998, for Kemper International Portfolio. (Incorporated by reference to Post-Effective Amendment No. 23 to the Registration Statement, filed on February 12, 1999.) |
| | |
| | | (hh) | | Subadvisory Agreement between Scudder Kemper Investments, Inc. and Eagle Asset Management, dated October 29, 1999, for KVS Focused Large Cap Growth Portfolio. (Incorporated by reference to Post-Effective Amendment No. 30 to the Registration Statement, filed on February 25, 1999.) |
| | |
| | | (ii) | | Subadvisory Agreement between Scudder Kemper Investments, Inc. Janus Capital Corporation, dated October 29, 1999, for KVS Growth Opportunities Portfolio. (Incorporated by reference to Post-Effective Amendment No. 30 to the Registration Statement, filed on February 25, 1999.) |
| | |
| | | (jj) | | Amended and Restated Subadvisory Agreement between Scudder Kemper Investments, Inc. and Banker Trust Company, dated August 1, 2000, for Kemper Index 500 Portfolio. (Incorporated by reference to Post-Effective Amendment No. 34 to the Registration Statement, filed on April 30, 2001.) |
| | |
| | | (kk) | | Subadvisory Agreement between Zurich Scudder Investments, Inc. and Deutsche Asset Management, Inc., dated May 1, 2001, for Kemper Index 500 Portfolio. (Incorporated by reference to Post-Effective Amendment No. 34 to the Registration Statement, filed on April 30, 2001.) |
| | |
| | | (ll) | | Subadvisory Agreement between Zurich Scudder Investments, Inc. and Jennison Associates LLC, dated May 1, 2001, for SVS Focus Value+Growth Portfolio. (Incorporated by reference to Post-Effective Amendment No. 35 to the Registration statement, filed on February 13, 2002.) |
| | |
| | | (mm) | | Subadvisory Agreement between Deutsche Investment Management Americas, Inc. and Dreman Value Management, L.L.C. dated April 5, 2002, for SVS Dreman High Return Equity Portfolio. (Incorporated by reference to Post-Effective Amendment No. 39 to the Registration Statement, filed on April 30, 2003.) |
| | |
| | | (nn) | | Subadvisory Agreement between Deutsche Investment Management Americas, Inc. and Davis Select Advisors L.P. dated April 5, 2002, for SVS Davis Venture Value Portfolio. (Incorporated by reference to Post-Effective Amendment No. 39 to the Registration Statement, filed on April 30, 2003.) |
| | |
| | | (oo) | | Subadvisory Agreement between Deutsche Investment Management Americas Inc. and Deutsche Asset Management Investment Services Limited dated September 2, 2002, for Scudder Strategic Income Portfolio. (Incorporated by reference to Post-Effective Amendment No. 39 to the Registration Statement, filed on April 30, 2003.) |
| | |
| | | (pp) | | Subadvisory Agreement between Deutsche Investment Management Americas, Inc. and Deutsche Asset Management Investment Services Limited dated September 30, 2002, for Scudder International Select Equity Portfolio. (Incorporated by reference to Post-Effective Amendment No. 39 to the Registration Statement, filed on April 30, 2003.) |
| | |
| | | (qq) | | Subadvisory Agreement between Deutsche Investment Management Americas Inc. and Dreman Value Management, L.L.C., dated April 5, 2002, for SVS Dreman Financial Services Portfolio. (Incorporated by reference to Post-Effective Amendment No. 38 to the Registration Statement, filed on February 28, 2003.) |
C-8
| | | | |
| | | (rr) | | Subadvisory Agreement between Deutsche Investment Management Americas Inc. and Dreman Value Management, L.L.C., dated April 5, 2002, for SVS Dreman Small Cap Value Portfolio. (Incorporated by reference to Post-Effective Amendment No. 38 to the Registration Statement, filed on February 28, 2003.) |
| | |
| | | (ss) | | Subadvisory Agreement between Deutsche Investment Management Americas Inc. and Eagle Asset Management, L.L.C., dated April 5, 2002, for SVS Eagle Focused Large Cap Growth Portfolio. (Incorporated by reference to Post-Effective Amendment No. 38 to the Registration Statement, filed on February 28, 2003.) |
| | |
| | | (tt) | | Subadvisory Agreement between Deutsche Investment Management Americas Inc. and Jennison Associates, L.L.C., dated April 5, 2002, for SVS Focus Value+Growth Portfolio. (Incorporated by reference to Post-Effective Amendment No. 38 to the Registration Statement, filed on February 28, 2003.) |
| | |
| | | (uu) | | Subadvisory Agreement between Deutsche Investment Management Americas Inc. and Dreman Value Management, L.L.C., dated April 5, 2002, for SVS Focus Value+Growth Portfolio. (Incorporated by reference to Post-Effective Amendment No. 38 to the Registration Statement, filed on February 28, 2003.) |
| | |
| | | (vv) | | Subadvisory Agreement between Deutsche Investment Management Americas Inc. and INVESCO Funds Group, Inc., dated April 5, 2002, for SVS Dynamic Growth Portfolio. (Incorporated by reference to Post-Effective Amendment No. 38 to the Registration Statement, filed on February 28, 2003.) |
| | |
| | | (ww) | | Subadvisory Agreement between Deutsche Investment Management Americas Inc. and Janus Capital Management L.L.C., dated April 5, 2002, for SVS Growth And Income Portfolio. (Incorporated by reference to Post-Effective Amendment No. 38 to the Registration Statement, filed on February 28, 2003.) |
| | |
| | | (xx) | | Subadvisory Agreement between Deutsche Investment Management Americas Inc. and Janus Capital Management LLC, dated April 5, 2002, for SVS Growth Opportunities Portfolio. (Incorporated by reference to Post-Effective Amendment No. 38 to the Registration Statement, filed on February 28, 2003.) |
| | |
| | | (yy) | | Subadvisory Agreement between Deutsche Investment Management Americas Inc. and Massachusetts Financial Services Company, dated May 1, 2002, for SVS MFS Strategic Value Portfolio. (Incorporated by reference to Post-Effective Amendment No. 38 to the Registration Statement, filed on February 28, 2003.) |
| | |
| | | (zz) | | Subadvisory Agreement between Deutsche Investment Management Americas Inc. and Oak Associates, Ltd., dated April 5, 2002, for SVS Strategic Equity Portfolio. (Incorporated by reference to Post-Effective Amendment No. 38 to the Registration Statement, filed on February 28, 2003.) |
| | |
| | | (aaa) | | Subadvisory Agreement between Deutsche Investment Management Americas Inc. and Turner Investment Partners, Inc., dated April 5, 2002, for SVS Mid Cap Growth Portfolio. (Incorporated by reference to Post-Effective Amendment No. 38 to the Registration Statement, filed on February 28, 2003.) |
| | |
| | | (bbb) | | Subadvisory Agreement between Deutsche Investment Management Americas Inc. and Northern Trust Investments, Inc., dated April 30, 2003, for SVS Index 500 Portfolio. (Incorporated by reference to Post-Effective Amendment No. 39 to the Registration Statement, filed on April 30, 2003.) |
C-9
| | | | | | |
| | | (ccc) | | Subadvisory Agreement between Deutsche Investment Management Americas Inc. and Deutsche Asset Management Investment Services Limited, dated September 30, 2002, for Scudder International Select Equity Portfolio. (Incorporated by reference to Post-Effective Amendment No. 39 to the Registration Statement, filed on April 30, 2003.) |
| | |
| Exhibit 7 | | | | Underwriting and Distribution Services Agreement between Scudder Variable Series II and Scudder Distributors, Inc., dated April 5, 2002. (Incorporated by reference to Post-Effective Amendment No. 38 to the Registration Statement, filed on February 28, 2003.) |
| | |
| Exhibit 8 | | | | Not Applicable. |
| | |
| Exhibit 9 | | (a) | | Custody Agreement between the Registrant, on behalf of Kemper Money Market Portfolio, Kemper Total Return Portfolio, Kemper High Yield Portfolio, Kemper Growth Portfolio, Kemper Government Securities Portfolio, Kemper International Portfolio, Kemper Small Cap Growth Portfolio, Kemper Investment Grade Bond Portfolio, Kemper Value+Growth Portfolio, Kemper Horizon 20+ Portfolio, Kemper Horizon 10+ Portfolio, Kemper Horizon 5 Portfolio, Kemper Contrarian Portfolio, Kemper Small Cap Value Portfolio, Kemper Blue Chip Portfolio and Kemper Global Income Portfolio, and Investors Fiduciary Trust Company, dated March 1, 1995. (Incorporated herein by reference to Post-Effective Amendment No. 14 to the Registration Statement, filed on April 27, 1995.) |
| | |
| | | (b) | | Foreign Custodian Agreement between Chase Manhattan Bank and Kemper Investors Fund, dated January 2, 1990. (Incorporated herein by reference to Post-Effective Amendment No. 14 to the Registration Statement, filed on April 27, 1995.) |
| | |
| | | (c) | | Custody Agreement between the Registrant, on behalf of KVS Dreman High Return Equity Portfolio and KVS Dreman Financial Services Portfolio, and State Street Bank and Trust Company, dated April 24, 1998. (Incorporated by reference to Post-Effective Amendment No. 23 to the Registration Statement, filed on February 12, 1999.) |
| | |
| | | (d) | | Custody Agreement between the Registrant, on behalf of Kemper International Growth and Income Portfolio and Kemper Global Blue Chip Portfolio, and Brown Brothers Harriman & Co., dated May 1, 1998. (Incorporated by reference to Post-Effective Amendment No. 23 to the Registration Statement, filed on February 12, 1999.) |
| | |
| | | (e) | | Addendum to the Custody Agreement between the Registrant, on behalf of Kemper Aggressive Growth Portfolio and Kemper Technology Growth Portfolio, and State Street Bank and Trust Company, dated May 1, 1999. (Incorporated herein by reference to Post-Effective Amendment No. 24 to the Registration Statement, filed on April 29, 1999.) |
| | |
| | | (f) | | Amendment to Custodian Contract between State Street Bank and Trust Company and Kemper Variable Series, dated January 5, 2001. (Incorporated by reference to Post-Effective Amendment No. 34 to the Registration Statement, filed on April 30, 2001.) |
| | |
| Exhibit 10 | | (a) | | Master Distribution Plan for Class B Shares, as approved on November 28, 2001. (Incorporated by reference to Post-Effective Amendment No. 39 to the Registration Statement, filed on April 30, 2003.) |
C-10
| | | | |
| | | (b) | | Supplement to Master Distribution Plan for Class B Shares, as approved on January 15, 2003 for Scudder Strategic Income Portfolio. (Incorporated by reference to Post-Effective Amendment No. 39 to the Registration Statement, filed on April 30, 2003.) |
| | |
| | | (c) | | Plan Pursuant to Rule 18f-3 as approved on November 28, 2001. (Incorporated by reference to Post-Effective Amendment No. 39 to the Registration Statement, filed on April 30, 2003.) |
| | |
| Exhibit 11 | | | | Opinion and Consent of Vedder, Price, Kaufman & Kammholz, P.C. filed herein. |
| | |
| Exhibit 12 | | | | Form of Tax Opinion and Consent of Willkie Farr & Gallagher LLP filed herein. |
| | |
| Exhibit 13 | | (a) | | Agency Agreement between Kemper Investors Fund and Investors Fiduciary Trust Company, dated March 24, 1987. (Incorporated herein by reference to Post-Effective Amendment No. 14 to the Registration Statement, filed on April 27, 1995.) |
| | |
| | | (b) | | Agency Agreement between Scudder Variable Series II and Scudder Investments Service Company, dated July 1, 2001. (Incorporated by reference to Post-Effective Amendment No. 35 to the Registration statement, filed on February 13, 2002.) |
| | |
| | | (c) | | Supplement to Agency Agreement. (Incorporated by reference to Post-Effective Amendment No. 24 to the Registration Statement, filed on April 29, 1999.) |
| | |
| | | (d) | | Fund Accounting Services Agreements between the Registrant, on behalf of Kemper Money Market Portfolio, Kemper Total Return Portfolio, Kemper High Yield Portfolio, Kemper Growth Portfolio, Kemper Government Securities Portfolio, Kemper International Portfolio, Kemper Small Cap Growth Portfolio, Kemper Investment Grade Bond Portfolio, Kemper Value+Growth Portfolio, Kemper Horizon 20+ Portfolio, Kemper Horizon 10+ Portfolio, Kemper Horizon 5 Portfolio, Kemper Value Portfolio, Kemper Small Cap Value Portfolio, Kemper Blue Chip Portfolio and Kemper Global Income Portfolio, and Scudder Fund Accounting Corporation, dated December 31, 1997. (Incorporated herein by reference to Post-Effective Amendment No. 21 to the Registration Statement, filed on March 26, 1998.) |
| | |
| | | (e) | | Fund Accounting Services Agreement between the Registrant, on behalf of Kemper Aggressive Growth Portfolio, and Scudder Fund Accounting Corporation, dated May 1, 1999. (Incorporated by reference to Post-Effective Amendment No. 24 to the Registration Statement, filed on April 29, 1999.) |
| | |
| | | (f) | | Fund Accounting Services Agreement between the Registrant, on behalf of Kemper Technology Growth Portfolio, and Scudder Fund Accounting Corporation, dated May 1, 1999. (Incorporated by reference to Post-Effective Amendment No. 24 to the Registration Statement, filed on April 29, 1999.) |
| | |
| | | (g) | | Fund Accounting Services Agreement between the Registrant, on behalf of KVS Index 500 Portfolio (formerly, Kemper Index 500 Portfolio), and Scudder Fund Accounting Corporation, dated September 1, 1999. (Incorporated by reference to Post-Effective Amendment No. 27 to the Registration Statement, filed on August 31, 1999.) |
C-11
| | | | |
| | | (h) | | Fund Accounting Services Agreement between the Registrant, on behalf of KVS Focused Large Cap Growth Portfolio, and Scudder Fund Accounting Corporation, dated October 29, 1999. (Incorporated by reference to Post-Effective Amendment No. 30 to the Registration Statement, filed on February 25, 1999.) |
| | |
| | | (i) | | Fund Accounting Services Agreement between the Registrant, on behalf of KVS Growth and Income Portfolio, and Scudder Fund Accounting Corporation, dated October 29, 1999. (Incorporated by reference to Post-Effective Amendment No. 30 to the Registration Statement, filed on February 25, 1999.) |
| | |
| | | (j) | | Fund Accounting Services Agreement between the Registrant, on behalf of KVS Growth Opportunities Portfolio, and Scudder Fund Accounting Corporation, dated October 29, 1999. (Incorporated by reference to Post-Effective Amendment No. 30 to the Registration Statement, filed on February 25, 1999.) |
| | |
| | | (k) | | Fund Accounting Services Agreement between the Registrant, on behalf of SVS Dynamic Growth Portfolio, and Scudder Fund Accounting Corporation, dated May 1, 2001. (Incorporated by reference to Post-Effective Amendment No. 34 to the Registration Statement, filed on April 30, 2001.) |
| | |
| | | (l) | | Fund Accounting Services Agreement between the Registrant, on behalf of SVS Mid Cap Growth Portfolio, and Scudder Fund Accounting Corporation, dated May 1, 2001. (Incorporated by reference to Post-Effective Amendment No. 34 to the Registration Statement, filed on April 30, 2001.) |
| | |
| | | (m) | | Fund Accounting Services Agreement between the Registrant, on behalf of SVS Strategic Equity Portfolio, and Scudder Fund Accounting Corporation, dated May 1, 2001. (Incorporated by reference to Post-Effective Amendment No. 34 to the Registration Statement, filed on April 30, 2001.) |
| | |
| | | (n) | | Fund Accounting Services Agreement between the Registrant, on behalf of SVS Venture Value Portfolio, and Scudder Fund Accounting Corporation, dated May 1, 2001. (Incorporated by reference to Post-Effective Amendment No. 34 to the Registration Statement, filed on April 30, 2001.) |
| | |
| | | (o) | | Fund Accounting Service Agreement between the Registrant, on behalf of SVS MFS Strategic Value Portfolio, and Scudder Fund Accounting Corporation, dated May 1, 2002. (Incorporated by reference to Post-Effective Amendment No. 39 to the Registration Statement, filed on April 30, 2003.) |
| | |
| | | (p) | | Letter of Indemnity to the Scudder Funds dated September 10, 2004. (Incorporated by reference to Post-Effective Amendment No. 52 to the Registrant’s Registration Statement on Form N-1A, filed on October 12, 2004.) |
| | |
| | | (q) | | Letter of Indemnity to the Scudder Funds dated September 10, 2004. (Incorporated by reference to Post-Effective Amendment No. 52 to the Registrant’s Registration Statement on Form N-1A, filed on October 12, 2004.) |
| | |
| | | (r) | | Letter of Indemnity to the Independent Directors/Trustees dated September 10, 2004. (Incorporated by reference to Post-Effective Amendment No. 52 to the Registrant’s Registration Statement on Form N-1A, filed on October 12, 2004.) |
| | |
| Exhibit 14 | | (a) | | Consent of Ernst & Young LLP filed herein. |
| | |
| | | (b) | | Consent of PricewaterhouseCoopers LLP filed herein. |
C-12
| | | | |
| Exhibit 15 | | | | Not Applicable. |
| | |
| Exhibit 16 | | | | Powers of Attorney (Incorporated by reference to Registrant’s Registration Statement on Form N-14 (File No. 333-122253)). |
| | |
| Exhibit 17 | | | | Form of Proxy is filed herein and appears following Part A of this Registration Statement on Form N-14. |
Item 17. Undertakings.
(1) The undersigned registrant agrees that prior to any public reoffering of the securities registered through the use of a prospectus which is a part of this registration statement by any person or party who is deemed to be an underwriter within the meaning of Rule 145(c) of the Securities Act, the reoffering prospectus will contain the information called for by the applicable registration form for reofferings by persons who may be deemed underwriters, in addition to the information called for by the other items of the applicable form.
(2) The undersigned registrant agrees that every prospectus that is filed under paragraph (1) above will be filed as a part of an amendment to the registration statement and will not be used until the amendment is effective, and that, in determining any liability under the 1933 Act, each post-effective amendment shall be deemed to be a new registration statement for the securities offered therein, and the offering of the securities at that time shall be deemed to be the initial bona fide offering of them.
C-13
SIGNATURES
As required by the Securities Act of 1933, this Pre-Effective Amendment to the Registration Statement has been signed on behalf of the registrant, in the City of New York, and State of New York, on the 15th day of March, 2005.
| | |
| SCUDDER VARIABLE SERIES II |
| |
| By: | | /s/ Julian F. Sluyters
|
| | | Julian F. Sluyters |
| | | Chief Executive Officer |
As required by the Securities Act of 1933, this Pre-Effective Amendment to the Registration Statement has been signed below by the following persons in the capacities and on the dates indicated.
| | | | |
Signature
| | Title
| | Date
|
| | |
/s/ Julian F. Sluyters
Julian F. Sluyters | | Chief Executive Officer | | March 15, 2005 |
| | |
/s/ Paul Schubert
Paul Schubert | | Chief Financial Officer and Principal Accounting Officer | | March 15, 2005 |
| | |
John W. Ballantine*
John W. Ballantine | | Trustee | | March 15, 2005 |
| | |
Lewis A. Burnham*
Lewis A. Burnham | | Trustee | | March 15, 2005 |
| | |
Donald L. Dunaway*
Donald L. Dunaway | | Trustee | | March 15, 2005 |
| | |
James R. Edgar*
James R. Edgar | | Trustee | | March 15, 2005 |
| | |
Paul K. Freeman*
Paul K. Freeman | | Trustee | | March 15, 2005 |
| | |
Robert B. Hoffman*
Robert B. Hoffman | | Trustee | | March 15, 2005 |
| | |
William McClayton*
William McClayton | | Trustee | | March 15, 2005 |
| | |
Shirley D. Peterson*
Shirley D. Peterson | | Trustee | | March 15, 2005 |
| | |
William N. Shiebler*
William N. Shiebler | | Trustee | | March 15, 2005 |
| | |
Robert H. Wadsworth*
Robert H. Wadsworth | | Trustee | | March 15, 2005 |
| | |
John G. Weithers*
John G. Weithers | | Trustee | | March 15, 2005 |
| | |
*By | | /s/ John Millette
|
| | | John Millette** Secretary |
**Attorney-in-fact pursuant to the powers of attorney contained in and filed as an exhibit to Registrant’s Registration Statement on Form N-14 (File No. 333-122253) on January 24, 2005, and are incorporated by reference herein.
INDEX OF EXHIBITS
| | |
EXHIBIT NUMBER
| | EXHIBIT TITLE
|
| 11 | | Opinion and Consent of Vedder, Price, Kaufman & Kammholz P.C. |
| 12 | | Form of Tax Opinion and Consent of Willkie Farr & Gallagher LLP |
| 14(a) | | Consent of Ernst & Young LLP |
| 14(b) | | Consent of PricewaterhouseCoopers LLP |