As Filed with the Securities and Exchange Commission on July 25, 2006
Securities Act File No. 333-135111
SECURITIES AND EXCHANGE COMMISSION
Washington, D.C. 20549
FORM N-14
| | | | |
| | REGISTRATION STATEMENT UNDER THE SECURITIES ACT OF 1933 | | x |
| | Pre-Effective Amendment No. 1 | | x |
| | Post-Effective Amendment No. | | ¨ |
DWS VARIABLE SERIES II
(Exact Name of Registrant as Specified in Charter)
222 South Riverside Plaza
Chicago, IL 60606
(Address of Principal Executive Offices) (Zip Code)
617-295-2572
(Registrant’s Area Code and Telephone Number)
John Millette, Secretary
Two International Place
Boston, Massachusetts 02110
(Name and Address of Agent for Service)
With copies to:
David A. Sturms, Esq.
Vedder, Price, Kaufman & Kammholz, P.C.
222 North LaSalle Street
Chicago, Illinois 60601
Approximate date of proposed public offering: As soon as practicable after the effective date of this Registration Statement.
No filing fee is required because an indefinite number of shares have previously been registered pursuant to Rule 24f-2 under the Investment Company Act of 1940.
The Registrant hereby amends this Registration Statement on such date or dates as may be necessary to delay its effective date until the Registrant shall file a further amendment that specifically states that this Registration Statement shall thereafter become effective in accordance with Section 8(a) of the Securities Act of 1933 or until the Registration Statement shall become effective on such date as the Commission, acting pursuant to said Section 8(a), may determine.
Questions & Answers
DWS Dreman Financial Services VIP
DWS MFS Strategic Value VIP
DWS Income Allocation VIP
DWS Variable Series II
Q&A
Q What is happening?
A Deutsche Asset Management (or “DeAM” as defined on page 36 in the enclosed Prospectus/Proxy Statement) has initiated a program to reorganize and merge selected funds within the DWS fund family.
Q What issue am I being asked to vote on?
A You are being asked to vote on one (or more) of three proposals, as applicable to you, to merge an Acquired Fund into the corresponding Acquiring Fund, as listed below:
| | | | |
Acquired Fund
| | | | Acquiring Fund
|
DWS Dreman Financial Services VIP | | into | | DWS Dreman High Return Equity VIP |
DWS MFS Strategic Value VIP | | into | | DWS Dreman High Return Equity VIP |
DWS Income Allocation VIP | | into | | DWS Conservative Allocation VIP |
After carefully reviewing the proposals, the Board of DWS Variable Series II, of which each Acquired Fund is a series, has determined that each merger is in the best interests of the applicable Acquired Fund. The Board unanimously recommends that you vote for the proposal that applies to you.
Q Why has this proposal been made for my fund?
A DeAM has advised the Board of DWS Variable Series II that, as part of its ongoing program to restructure its product line, it is exiting the proprietary variable insurance

Q&A continued
products business (DeAM’s proprietary variable insurance products business involved relationships DeAM developed with select insurance companies to provide “Scudder” branded variable insurance products using certain DWS funds, including DWS Variable Series II, and certain non-DWS funds as underlying investments). Accordingly, DeAM would like to eliminate a significant number of the subadvised portfolios of DWS Variable Series II. In addition, DeAM would like to eliminate those portfolios that have little opportunity for growth. Because DeAM no longer wishes to manage or support the Acquired Funds in their current form, DeAM has proposed the merger of each Acquired Fund with an Acquiring Fund that DeAM believes is similar from an investment objective standpoint.
While DeAM believes that each Acquiring Fund should provide a comparable investment opportunity for shareholders of each Acquired Fund, there are a number of significant differences in the portfolios of each Fund. DeAM has estimated that approximately 62%, 89% and 19% of the portfolios of DWS Dreman Financial Services VIP, DWS MFS Strategic Value VIP and DWS Income Allocation VIP, respectively, will be liquidated and the proceeds will be reinvested in other securities so that upon the merger, the Acquired Fund’s portfolio will conform to the corresponding Acquiring Fund’s investment objective, policies, restrictions and strategies. As noted below, DeAM will pay all costs associated with each merger, including but not limited to transaction costs associated with the repositioning of each Fund’s portfolio.
Q Will any fund pay for the solicitation of voting instructions and legal costs associated with this solicitation?
A No. DeAM will bear these costs.
Q Will I have to pay taxes as a result of the merger of my Fund?
A Each merger is expected to be a tax-free transaction for federal income tax purposes and will not take place unless special tax counsel provides an opinion to that effect. However, if you choose to redeem or exchange your investment by surrendering your Contract or initiating a partial withdrawal, you may be subject to taxes and tax penalties.
Q&A continued
Q Upon merger, how will the value of my investment change?
A The aggregate value of your investment will not change as a result of the merger. It is likely, however, that the number of shares owned by your insurance company on your behalf will change as a result of the merger because your insurance company’s shares will be exchanged at the net asset value per share of the corresponding Acquiring Fund, which will probably be different from the net asset value per share of your Acquired Fund.
Q When would the merger take place?
A If approved, each merger would occur on or about September 17, 2006 or as soon as reasonably practicable after shareholder approval is obtained. Shortly after completion of each merger, shareholders whose accounts are affected by a merger (i.e., your insurance company) will receive a confirmation statement reflecting their new account number and the number of shares of the corresponding Acquiring Fund they are receiving. Subsequently, you will be notified of changes to your account information by your insurance company.
Q Are the mergers related?
A No. Each Acquired Fund’s shareholders will vote separately on the merger of their Fund into the corresponding Acquiring Fund. The merger of one Acquired Fund into an Acquiring Fund is not contingent upon the approval of the other Acquired Funds’ shareholders. Each merger is separate and distinct from the other and each will be governed by a separate Agreement and Plan of Reorganization.
Q I am the owner of a variable life insurance policy or a variable annuity contract offered by my insurance company. I am not a shareholder of an Acquired Fund. Why am I being asked to vote on a proposal for Acquired Fund shareholders?
A You have previously directed your insurance company to invest certain proceeds relating to your variable life insurance policy and/or variable annuity contract (each a “Contract”) in one or more of the Acquired Funds. Although you receive the gains,
Q&A continued
losses and income from this investment, your insurance company holds on your behalf any shares corresponding to your investment in an Acquired Fund. Thus, you are not the “shareholder”; rather, your insurance company is the shareholder. However, you have the right to instruct your insurance company on how to vote the Acquired Fund shares corresponding to your investment through your Contract. It is your insurance company, as the shareholder, that will actually vote the shares corresponding to your investment (likely by executing a proxy card) once it receives instructions from its Contract owners.
The attached Prospectus/Proxy Statement is used to solicit voting instructions from you and other owners of Contracts. All persons entitled to direct the voting of shares of an Acquired Fund, whether or not they are shareholders, are described as voting for purposes of the Prospectus/Proxy Statement. Please see page 1 of the attached Prospectus/Proxy Statement for more details.
Q How can I vote?
A You can vote in any one of three ways:
| n | | Through the Internet, by going to the website listed on your voting instruction form; |
| n | | By telephone, with a toll-free call to the number listed on your voting instruction form; or |
| n | | By mail, by sending the enclosed voting instruction form, signed and dated, in the enclosed envelope. |
We encourage you to vote over the Internet or by telephone, following the instructions that appear on your voting instruction form. Whichever method you choose, please take the time to read the full text of the Prospectus/Proxy Statement before you vote.
Q&A continued
Q If I send in my voting instructions now as requested, can I change my vote later?
A Shareholders may revoke proxies, including proxies given by telephone or over the Internet, at any time before they are voted at the special meeting either (i) by sending a written revocation to the Secretary of DWS Variable Series II as explained in the Prospectus/Proxy Statement; (ii) by properly executing a later-dated proxy that is received by the Fund at or prior to the special meeting; or (iii) by attending the special meeting and voting in person. Only a shareholder may execute or revoke a proxy. You should consult your insurance company regarding your ability to revoke voting instructions after you have provided them to your insurance company.
Q Whom should I call for additional information about this Prospectus/Proxy Statement?
A Please call Computershare Fund Services, Inc., your Fund’s information agent, at 1-866-390-5113.
DWS DREMAN FINANCIAL SERVICES VIP
DWS MFS STRATEGIC VALUE VIP
DWS INCOME ALLOCATION VIP
A Message from the President of DWS Variable Series II
[mailing date], 2006
Dear Investor:
I am writing to ask you to instruct your insurance company as to how to vote on an important matter that affects your investment in one or more of the DWS Funds listed above. You may vote by filling out and signing the enclosed voting instruction form, or by voting by telephone or through the Internet.
We are asking for your vote on the following matter:
| | |
| Proposal: | | Approval of a proposed merger of an Acquired Fund into the corresponding Acquiring Fund, as listed below. In each merger, your investment in the Acquired Fund would, in effect, be exchanged, on a tax-free basis for federal income tax purposes, for an investment in the same class of shares of the corresponding Acquiring Fund with an equal aggregate net asset value. |
| | | | |
Acquired Fund
| | | | Acquiring Fund
|
DWS Dreman Financial Services VIP | | into | | DWS Dreman High Return Equity VIP |
DWS MFS Strategic Value VIP | | into | | DWS Dreman High Return Equity VIP |
DWS Income Allocation VIP | | into | | DWS Conservative Allocation VIP |
Each proposed merger is part of an ongoing program initiated by Deutsche Asset Management (or “DeAM” as defined on page in the enclosed Prospectus/Proxy Statement). This program is intended to restructure DeAM’s product line to match its distribution focus in the future and to eliminate funds that have little opportunity for growth and that add unnecessary complexity and inefficiency to its business. As a part of this program, DeAM is exiting the proprietary variable insurance products business (DeAM’s proprietary variable insurance products business involved relationships DeAM developed with select insurance companies to provide “Scudder” branded variable insurance products using certain DWS funds, including DWS Variable Series II, and certain non-DWS funds as underlying investments). Accordingly, DeAM would like to eliminate a significant number of the subadvised portfolios of DWS Variable Series II. In addition, DeAM would like to eliminate those portfolios with little opportunity for growth. In order to provide you with a continuity of investment within the DWS fund family, DeAM proposed to the Board merging your fund with another DWS fund that DeAM believes is similar, from an investment objective standpoint, to your fund. Please note, however, that the investment strategies of your fund and its corresponding Acquired Fund are different. See “Investment Strategies and Risk Factors” in the enclosed Prospectus/Proxy Statement for more details.
In determining to recommend approval of each merger, the Trustees of DWS Variable Series II conducted a thorough review of the potential implications of each merger, and concluded that each Acquired Fund’s participation in its proposed merger would be in the best interests of such Acquired Fund and would not dilute the interests of such Acquired Fund’s existing shareholders. If the proposed mergers are approved, the Board expects that the proposed changes will take effect during the fourth calendar quarter of 2006.
Included in this booklet is information about the upcoming shareholders’ meeting:
| | • | | A Notice of a Joint Special Meeting of Shareholders, which summarizes the proposal(s) for which you are being asked to provide voting instructions; and |
| | • | | A Prospectus/Proxy Statement, which provides detailed information on each Acquiring Fund, the specific proposals being considered at the shareholders’ meeting, and why each proposal is being made. |
We need your voting instructions and urge you to review the enclosed materials thoroughly. Once you’ve determined how you would like your interests to be represented, please promptly complete, sign, date and return the enclosed voting instruction form or vote by telephone or through the Internet. A postage-paid envelope is enclosed for mailing, and telephone and Internet voting instructions are listed at the top of your voting instruction form. You may receive more than one voting instruction form. If so, please vote each one.
I’m sure that you, like most people, lead a busy life and are tempted to put this Prospectus/Proxy Statement aside for another day. Please don’t. Your prompt return of the enclosed voting instruction form (or voting by telephone or through the Internet) may save the necessity and expense of further solicitations.
Your vote is important to us. We appreciate the time and consideration I am sure you will give to this important matter. If you have questions about any proposal, please call Computershare Fund Services, Inc., the information agent, at 1-866-390-5113, or contact your insurance company. Thank you for your continued support of DWS Scudder.
Sincerely yours,
[Signature]
Michael Clark
President
DWS Variable Series II
DWS DREMAN FINANCIAL SERVICES VIP
DWS MFS STRATEGIC VALUE VIP
DWS INCOME ALLOCATION VIP
NOTICE OF A JOINT SPECIAL MEETING OF SHAREHOLDERS
This is the formal agenda for your Fund’s shareholder special meeting. It tells you what matters will be voted on and the time and place of the special meeting.
To the Shareholders of the Acquired Funds:
A Special Meeting of Shareholders of the Acquired Funds will be held August 24, 2006 at 4:00 p.m. Eastern time, at the offices of Deutsche Investment Management Americas Inc., 345 Park Avenue, 27th Floor, New York, New York 10154 (the “Meeting”), to consider the following:
| | |
| Proposal: | | Approving an Agreement and Plan of Reorganization and the transactions it contemplates, including the transfer of all of the assets of the Acquired Fund to the corresponding Acquiring Fund, as listed below: |
| | | | |
Acquired Fund
| | | | Acquiring Fund
|
DWS Dreman Financial Services VIP | | into | | DWS Dreman High Return Equity VIP |
DWS MFS Strategic Value VIP | | into | | DWS Dreman High Return Equity VIP |
DWS Income Allocation VIP | | into | | DWS Conservative Allocation VIP |
|
| in exchange for shares of the Acquiring Fund and the assumption by the Acquiring Fund of all liabilities of the corresponding Acquired Fund, and the distribution of such shares, on a tax-free basis for federal income tax purposes, to the shareholders of the Acquired Fund in complete liquidation of the Acquired Fund. |
The persons named as proxies will vote in their discretion on any other business that may properly come before the Meeting or any adjournments or postponements thereof.
Holders of record of shares of each Acquired Fund at the close of business on June 13, 2006 are entitled to vote with respect to their Acquired Fund at the Meeting and at any adjournments or postponements thereof.
In the event that the necessary quorum to transact business or the vote required to approve a merger is not obtained at the Meeting, the persons named as proxies may propose one or more adjournments of the Meeting in accordance with applicable law to permit such further solicitation of proxies as may be deemed necessary or advisable.
By order of the Trustees

John Millette
Secretary
[mailing date], 2006
WE URGE YOU TO MARK, SIGN, DATE AND MAIL THE ENCLOSED PROXY CARD OR VOTING INSTRUCTION FORM IN THE POSTAGE-PAID ENVELOPE PROVIDED OR RECORD YOUR VOTING INSTRUCTIONS BY TELEPHONE OR THROUGH THE INTERNET SO THAT YOU WILL BE REPRESENTED AT THE MEETING.
INSTRUCTIONS FOR SIGNING PROXY CARDS
AND VOTING INSTRUCTION FORMS
The following general rules for signing proxy cards and voting instruction forms may be of assistance to you and avoid the time and expense involved in validating your vote if you fail to sign your proxy card or voting instruction form properly.
1. Individual Accounts: Sign your name exactly as it appears in the registration on the proxy card or voting instruction form.
2. Joint Accounts: Either party may sign, but the name of the party signing should conform exactly to the name shown in the registration on the proxy card or voting instruction form.
3. All Other Accounts: The capacity of the individual signing the proxy card or voting instruction form should be indicated unless it is reflected in the form of registration. For example:
| | |
Registration
| | Valid Signature
|
Corporate Accounts | | |
(1) ABC Corp. | | ABC Corp., John Doe, Treasurer |
(2) ABC Corp. | | John Doe, Treasurer |
(3) ABC Corp. c/o John Doe, Treasurer | | John Doe |
(4) ABC Corp. Profit Sharing Plan | | John Doe, Trustee |
| |
Partnership Accounts | | |
(1) The XYZ Partnership | | Jane B. Smith, Partner |
(2) Smith and Jones, Limited Partnership | | Jane B. Smith, General Partner |
| |
Trust Accounts | | |
(1) ABC Trust Account | | Jane B. Doe, Trustee |
(2) Jane B. Doe, Trustee u/t/d 12/28/78 | | Jane B. Doe |
| |
Custodial or Estate Accounts | | |
(1) John B. Smith, Cust. f/b/o John B. Smith Jr. UGMA/UTMA | | John B. Smith |
(2) Estate of John B. Smith | | John B. Smith, Jr., Executor |
IMPORTANT INFORMATION
FOR OWNERS OF VARIABLE ANNUITY
OR LIFE INSURANCE CONTRACTS INVESTED IN
DWS DREMAN FINANCIAL SERVICES VIP
DWS MFS STRATEGIC VALUE VIP
DWS INCOME ALLOCATION VIP
This document contains a Prospectus/Proxy Statement and a voting instruction form. You can use your voting instruction form to tell your insurance company how to vote on your behalf on an important issue relating to your investment in one or more of the funds listed above. If you complete and sign the voting instruction form (or tell your insurance company by telephone or through the Internet how you want it to vote), your insurance company will vote the shares corresponding to your insurance contract exactly as you indicate. If you simply sign the voting instruction form, your insurance company will vote the shares corresponding to your insurance contract in accordance with the Trustees’ recommendation on page 42. If you do not return your voting instruction form or record your voting instructions by telephone or through the Internet, your insurance company will vote your shares in the same proportion as shares for which instructions have been received.
We urge you to review the Prospectus/Proxy Statement carefully and either fill out your voting instruction form and return it by mail or record your voting instructions by telephone or through the Internet. You may receive more than one voting instruction form since several shareholder special meetings are being held as part of the broader restructuring program of the DWS fund family. If so, please return each one. Your prompt return of the enclosed voting instruction form (or your providing voting instructions by telephone or through the Internet) may save the necessity and expense of further solicitations.
We want to know how you would like your interests to be represented. Please take a few minutes to read these materials and return your voting instruction form.
If you have any questions, please call Computershare Fund Services, Inc., the information agent, at the special toll-free number we have set up for you (1-866-390-5113) or contact your insurance company.
PROSPECTUS/PROXY STATEMENT
[effective date], 2006
| | |
Acquisition of the assets of:
| | By and in exchange for shares of:
|
| |
DWS Dreman Financial Services VIP DWS MFS Strategic Value VIP DWS Income Allocation VIP each a series of DWS Variable Series II | | DWS High Return Equity VIP DWS High Return Equity VIP DWS Conservative Allocation VIP each a series of DWS Variable Series II |
| |
222 South Riverside Plaza Chicago, IL 60606 800-621-1048 | | 222 South Riverside Plaza Chicago, IL 60606 800-621-1048 |
This Prospectus/Proxy Statement is being furnished in connection with the proposed merger of each Acquired Fund listed above (each an “Acquired Fund” and collectively, the “Acquired Funds”) into the corresponding Acquiring Fund listed above (each an “Acquiring Fund” and collectively, the “Acquiring Funds”). The Acquired Funds and the Acquiring Funds are referred to herein collectively as the “Funds,” and each is referred to herein individually as a “Fund.” As a result of each proposed merger, each shareholder of an Acquired Fund will receive a number of full and fractional shares of the corresponding class of the corresponding Acquiring Fund equal in value as of the Valuation Time (as defined below on page 42 to the total value of such shareholder’s Acquired Fund shares.
Shares of an Acquired Fund are available exclusively as a pooled funding vehicle for variable life insurance policies and variable annuity contracts (each a “Contract”) offered by the separate accounts, or sub-accounts thereof, of certain life insurance companies (“Participating Insurance Companies”). The Participating Insurance Companies own shares of an Acquired Fund as depositors for the owners of their respective Contracts (each a “Contract Owner”). Thus, individual Contract Owners are not the “shareholders” of an Acquired Fund. Rather, the Participating Insurance Companies and their separate accounts are the shareholders. To the extent required to be consistent with the interpretations of voting requirements by the staff of the Securities and Exchange Commission (“SEC”), each Participating Insurance Company will offer to Contract Owners the opportunity to instruct it as to how it should vote shares held by it and the separate accounts on the proposed merger. This Prospectus/Proxy Statement is, therefore, furnished to Contract Owners entitled to give voting instructions with regard to the Acquired Funds. All persons entitled to direct the voting of shares of an Acquired Fund, whether or not they are shareholders, are described as voting for purposes of this Prospectus/Proxy Statement. This Prospectus/Proxy Statement, along with the Notice of a Joint Special Meeting of Shareholders and the proxy card or voting instruction form, is being mailed to shareholders and Contract Owners on or about [mailing date], 2006. It explains concisely what you should know before voting on the proposals described in this Prospectus/Proxy Statement or investing in an Acquiring Fund, each of which is a diversified series of DWS Variable Series II, an open-end, registered management investment company. Please read it carefully and keep it for future reference.
The securities offered by this Prospectus/Proxy Statement have not been approved or disapproved by the SEC, nor has the SEC passed upon the accuracy or adequacy of this Prospectus/Proxy Statement. Any representation to the contrary is a criminal offense.
1
The following documents have been filed with the SEC and are incorporated into this Prospectus/Proxy Statement by reference:
| | (i) | | the prospectus of DWS Variable Series II, dated May 1, 2006, as supplemented from time to time, relating to Class A shares of each Acquired Fund (File No. 333-11802); |
| | (ii) | | the prospectus of DWS Variable Series II, dated May 1, 2006, as supplemented from time to time, relating to Class B shares of each Acquired Fund (File No. 333-11802); |
| | (iii) | | the prospectus of DWS Variable Series II, dated May 1, 2006, as supplemented from time to time, relating to Class A shares of each Acquiring Fund (File No. 333-11802), a copy of which, if applicable, is included with this Prospectus/Proxy Statement; |
| | (iv) | | the prospectus of DWS Variable Series II, dated May 1, 2006, as supplemented from time to time, relating to Class B shares of each Acquiring Fund (File No. 333-11802), a copy of which, if applicable, is included with this Prospectus/Proxy Statement; |
| | (v) | | the statement of additional information of DWS Variable Series II, dated May 1, 2006, as supplemented from time to time, relating to Class A and Class B shares of each Acquired Fund (File No. 333-11802); |
| | (vi) | | the statement of additional information of DWS Variable Series II, dated May 1, 2006, as supplemented from time to time, relating to Class B shares of DWS Income Allocation VIP (File No. 333-11802); |
| | (vii) | | the statement of additional information relating to the proposed merger, dated [effective date], 2006 (the “Merger SAI”) (File No. 333-135111); and |
| | (viii) | | the financial statements and related report of the independent registered public accounting firm relating to the Acquired Funds included in DWS Variable Series II’s Annual Report to Shareholders for the fiscal year ended December 31, 2005. |
No other parts of the prospectuses, statements of additional information or Annual Report is incorporated by reference.
You may receive free copies of the Funds’ annual reports, semiannual reports, prospectuses, statements of additional information or the Merger SAI, request other information about a Fund or make inquiries by contacting your insurance company or by calling the corresponding Fund at 1-800-621-1048.
Like shares of the Acquired Funds, shares of the Acquiring Funds are not deposits or obligations of, or guaranteed or endorsed by, any financial institution, are not insured by the Federal Deposit Insurance Corporation, the Federal Reserve Board or any other agency, and involve risk, including the possible loss of the principal amount invested.
This document is designed to give you the information you need to vote on the proposal. Much of the information is required disclosure under rules of the SEC; some of it is technical. If there is anything you don’t understand, please contact Computershare Fund Services, Inc., the information agent, at 1-866-390-5113, or contact your insurance company.
2
DWS Variable Series II is subject to the informational requirements of the Securities Exchange Act of 1934, as amended, and in accordance therewith files reports and other information with the SEC. You may review and copy information about the Funds, including the prospectuses and the statement of additional information, at the SEC’s public reference room at 100 F Street, N.E., Washington, D.C. You may call the SEC at 1-202-551-5850 for information about the operation of the public reference room. You may obtain copies of this information, with payment of a duplication fee, by electronic request at the following e-mail address: publicinfo@sec.gov, or by writing the SEC’s Public Reference Branch, Office of Consumer Affairs and Information Services, Securities and Exchange Commission, Washington, D.C. 20549. You may also access reports and other information about the Funds on the EDGAR database on the SEC’s Internet site at http://www.sec.gov.
3
I. SYNOPSIS
The responses to the questions that follow provide an overview of key points typically of concern to shareholders considering a proposed merger between mutual funds. These responses are qualified in their entirety by the remainder of this Prospectus/Proxy Statement, which you should read carefully because it contains additional information and further details regarding the proposed mergers.
| 1. | | What is being proposed? |
The Trustees of DWS Variable Series II (the “Trust”), of which each Acquired Fund (and each Acquiring Fund) is a series, are recommending that shareholders approve the transactions contemplated by an Agreement and Plan of Reorganization (as described below in Part IV and a form of which is attached hereto as Exhibit A), each of which we refer to as a “merger” of an Acquired Fund into the corresponding Acquiring Fund. If approved by shareholders, all of the assets of an Acquired Fund will be transferred to the corresponding Acquiring Fund solely in exchange for the issuance and delivery to the Acquired Fund of Class A shares, as applicable, and Class B shares of the corresponding Acquiring Fund (“Merger Shares”) with a value equal to the value of the Acquired Fund’s assets net of liabilities, and for the assumption by the corresponding Acquiring Fund of all liabilities of the Acquired Fund. Immediately following the transfer, the appropriate class of Merger Shares received by each Acquired Fund will be distributed pro-rata, on a tax-free basis for federal income tax purposes, to each of its shareholders of record.
| 2. | | What will happen to my investment in the Acquired Fund as a result of the merger? |
Your investment in the Acquired Fund will, in effect, be exchanged for an investment in the same share class of the corresponding Acquiring Fund with an equal aggregate net asset value as of the Valuation Time (as defined below on page 42).
| 3. | | Why have the Trustees of the Trust recommended that shareholders approve the mergers? |
In determining to recommend that shareholders approve the merger of each Acquired Fund, the Trustees considered, among others, the following factors:
| | • | | That, as a part of its ongoing program to restructure its product line, Deutsche Asset Management (or “DeAM” as defined below on p. 36) is exiting the proprietary variable insurance product business and/or would like to eliminate portfolios with little opportunity for growth, and in any event no longer wishes to manage or support the Acquired Fund; |
| | • | | Various alternatives to each proposed merger (e.g., liquidation of the Acquired Fund); |
| | • | | That DeAM recommended the merger of the Acquired Fund into the Acquiring Fund based on its belief that such Acquiring Fund has a similar investment objective and strategy to the Acquired Fund, relative to other DWS funds; |
| | • | | That the merger would provide a continuity of investment within the DWS fund family for shareholders of the Acquired Fund; and |
4
| | • | | With respect to Financial Services VIP, the proposed merger would address the Fund’s long-term relative underperformance. |
In addition, the Trustees noted that for each merger, DeAM has agreed to cap the total operating expense ratios of the combined fund at levels that are the same or lower than the current total expense ratios of the corresponding Acquired Fund for at least three years following each merger. The Trustees also noted that DeAM agreed to pay all costs associated with each merger, including but not limited to, transaction costs associated with the repositioning of each Fund’s portfolio.
The Trustees of the Trust have concluded that: (1) each merger is in the best interests of the Acquired Fund, and (2) the interests of the existing shareholders of the Acquired Fund will not be diluted as a result of the merger. Accordingly, the Trustees of the Trust unanimously recommend approval of each Agreement and Plan of Reorganization (as defined below) effecting the mergers.
| 4. | | How do the investment goals, policies and restrictions of the Funds compare? |
DWS Dreman Financial Services VIP—DWS Dreman High Return Equity VIP
DWS Dreman Financial Services VIP (“Financial Services VIP”) seeks to provide long-term capital appreciation. DWS Dreman High Return Equity VIP (“High Return VIP”) seeks to achieve a high rate of total return. Both Funds are managed by the same portfolio managers and use the same value investment style and investment process. Financial Services VIP normally invests at least 80% of its net assets, plus the amount of any borrowings for investment purposes, in equity securities (mainly common stocks) of financial services companies. High Return VIP normally invests 80% of its net assets, plus the amount of any borrowings for investment purposes, in common stocks and other equity securities, focusing on stocks of large US companies that are similar in size to the companies in the S&P 500 Index and that the portfolio managers believe are undervalued. Financial Services VIP may invest up to 30% of total assets in foreign securities and up to 20% of net assets in investment-grade debt securities. High Return VIP may also invest up to 30% of its net assets in US dollar-denominated American Depositary Receipts and in securities of foreign companies traded principally in securities markets outside the US. Both Funds may invest in derivatives (contracts whose value is based on, for example, indices, currencies or securities) and may lend their portfolio securities in an amount up to 33- 1/3% of their respective total assets to approved institutional borrowers. Please also see Part II—Investment Strategies and Risk Factors—below for a more detailed comparison of each Fund’s investment policies and restrictions.
While DeAM believes that High Return VIP should provide a comparable investment opportunity for shareholders of Financial Services VIP, there are a number of significant differences in the portfolios of each Fund. DeAM has estimated that approximately 62% of the portfolio of Financial Services VIP will be liquidated and the proceeds will be reinvested in other securities so that upon the merger, its portfolio will conform to the investment objective, policies, restrictions and strategies of High Return VIP.
5
The following table sets forth a summary of the composition of the investment portfolio of each Fund as of December 31, 2005, and DeAM’s estimation of the portfolio composition of High Return VIP assuming consummation of the proposed merger(s).
Portfolio Composition (as a % of Fund)
(excludes cash equivalents)
| | | | | | | | | | | | |
Common Stocks
| | Financial
Services
VIP
| | | High
Return VIP
| | | High Return
VIP—Estimated(1)
(assuming
consummation of
Financial Services
VIP—High Return
VIP merger only)
| | | High Return VIP— Estimated(2)
(assuming
consummation of
Financial Services
VIP—High Return
VIP merger and of
Strategic Value
VIP—High Return
VIP merger)
| |
Energy | | 9 | % | | 21 | % | | 21 | % | | 21 | % |
Consumer Staples | | 3 | % | | 19 | % | | 19 | % | | 19 | % |
Financials: | | | | | | | | | | | | |
Banks | | 38 | % | | 8 | % | | 8 | % | | 8 | % |
Diversified Financial Services | | 22 | % | | 17 | % | | 17 | % | | 17 | % |
Capital Markets | | 13 | % | | 0 | % | | 0 | % | | 0 | % |
Insurance | | 12 | % | | 4 | % | | 4 | % | | 4 | % |
Consumer Finance | | 2 | % | | 0 | % | | 0 | % | | 0 | % |
Real Estate | | 1 | % | | 0 | % | | 0 | % | | 0 | % |
| | |
|
| |
|
| |
|
| |
|
|
Total Financials | | 88 | % | | 29 | % | | 29 | % | | 29 | % |
Health Care | | 0 | % | | 17 | % | | 17 | % | | 17 | % |
Consumer Discretionary | | 0 | % | | 6 | % | | 6 | % | | 6 | % |
Industrials | | 0 | % | | 5 | % | | 5 | % | | 5 | % |
Information Technology | | 0 | % | | 3 | % | | 3 | % | | 3 | % |
| | |
|
| |
|
| |
|
| |
|
|
| | | 100% | | | 100 | % | | 100 | % | | 100 | % |
| | |
|
| |
|
| |
|
| |
|
|
| (1) | | Reflects DeAM’s estimation of the portfolio composition of High Return VIP subsequent to the merger, taking into account that prior to the merger, pursuant to the Agreement and Plan of Reorganization, a significant portion of the portfolio of Financial Services VIP will be liquidated and the proceeds will be used to acquire other securities consistent with the investment objective, policies, restrictions and strategies of High Return VIP. No assurance can be given as to the actual portfolio composition of High Return VIP subsequent to the merger. |
| (2) | | Reflects DeAM’s estimation of the portfolio composition of High Return VIP subsequent to the merger, taking into account that prior to the merger, pursuant to the Agreement and Plan of Reorganization, a significant portion of the portfolios of Strategic Value VIP and Financial Services VIP will be liquidated and the proceeds will be used to acquire other securities consistent with the investment objective, policies, restrictions and strategies of High Return VIP. No assurance can be given as to the actual portfolio composition of High Return VIP subsequent to the merger. |
6
DWS MFS Strategic Value VIP—DWS Dreman High Return Equity VIP
DWS MFS Strategic Value VIP’s (“Strategic Value VIP”) investment objective is to provide capital appreciation. DWS Dreman High Return Equity VIP (“High Return VIP”) seeks to obtain a high rate of total return. Both Funds use a value investment style and may invest in companies with market capitalizations of any size. Strategic Value VIP normally invests at least 65% of its net assets in common stocks and related securities, such as preferred stocks, convertible securities and depository receipts, of companies which the manager believes are undervalued in the market relative to their long-term potential. High Return VIP normally invests at least 80% of its net assets, plus the amount of any borrowings for investment purposes, in common stocks and other equity securities, focusing on stocks of large US companies that are similar in size to the companies in the S&P 500 Index and that the portfolio managers believe are undervalued. Strategic Value VIP may also invest in other types of securities, such as fixed income securities, including lower rated securities (“junk bonds”) and warrants. Strategic Value VIP may also invest in foreign securities (including emerging markets securities) and engage in frequent trading. High Return VIP may invest up to 20% of its net assets in US dollar-denominated American Depository Receipts and in securities of foreign companies traded principally in securities markets outside the US. Both Funds may invest in derivatives (contracts whose value is based on, for example, indices, currencies or securities) and may lend their portfolio securities in an amount up to 33- 1/3% of their respective total assets to approved institutional borrowers. Please also see Part II—Investment Strategies and Risk Factors—below for a more detailed comparison of each Fund’s investment policies and restrictions.
While DeAM believes that High Return VIP should provide a comparable investment opportunity for shareholders of Strategic Value VIP, there are a number of significant differences in the portfolios of each Fund. DeAM has estimated that approximately 89% of the portfolio of Strategic Value VIP will be liquidated and the proceeds will be reinvested in other securities so that upon the merger, its portfolio will conform to the investment objective, policies, restrictions and strategies of High Return VIP.
7
The following table sets forth a summary of the composition of the investment portfolio of each Fund as of December 31, 2005, and DeAM’s estimation of the portfolio composition of High Return VIP assuming consummation of the proposed merger(s) as of that date:
Portfolio Composition (as a % of Fund)
(excludes cash equivalents)
| | | | | | | | | | | | |
Common Stocks
| | Strategic
Value
VIP
| | | High
Return VIP
| | | High Return
VIP—Estimated(1)
(assuming
consummation
of Strategic
Value VIP—High
Return
VIP merger only)
| | | High Return VIP—
Estimated(2)
(assuming
consummation of
Financial Services
VIP—High Return
VIP merger and of
Strategic Value
VIP—High Return
VIP merger)
| |
Financials | | 23 | % | | 29 | % | | 29 | % | | 29 | % |
Information Technology | | 17 | % | | 3 | % | | 3 | % | | 3 | % |
Consumer Discretionary | | 17 | % | | 6 | % | | 6 | % | | 6 | % |
Health Care | | 10 | % | | 17 | % | | 17 | % | | 17 | % |
Energy | | 9 | % | | 21 | % | | 21 | % | | 21 | % |
Telecommunication Services | | 9 | % | | 0 | % | | 0 | % | | 0 | % |
Industrials | | 7 | % | | 5 | % | | 5 | % | | 5 | % |
Materials | | 5 | % | | 0 | % | | 0 | % | | 0 | % |
Consumer Staples | | 3 | % | | 19 | % | | 19 | % | | 19 | % |
| | |
|
| |
|
| |
|
| |
|
|
| | | 100% | | | 100 | % | | 100 | % | | 100 | % |
| | |
|
| |
|
| |
|
| |
|
|
| (1) | | Reflects DeAM’s estimation of the portfolio composition of High Return VIP subsequent to the merger, taking into account that prior to the merger, pursuant to the Agreement and Plan of Reorganization, a significant portion of the portfolio of Strategic Value VIP will be liquidated and the proceeds will be used to acquire other securities consistent with the investment objective, policies, restrictions and strategies of High Return VIP. No assurance can be given as to the actual portfolio composition of High Return VIP subsequent to the merger. |
| (2) | | Reflects DeAM’s estimation of the portfolio composition of High Return VIP subsequent to the merger, taking into account that prior to the merger, pursuant to the Agreement and Plan of Reorganization, a significant portion of the portfolios of Strategic Value VIP and Financial Services VIP will be liquidated and the proceeds will be used to acquire other securities consistent with the investment objective, policies, restrictions and strategies of High Return VIP. No assurance can be given as to the actual portfolio composition of High Return VIP subsequent to the merger. |
8
DWS Income Allocation VIP—DWS Conservative Allocation VIP
DWS Income Allocation VIP (“Income Allocation VIP”) and DWS Conservative Allocation VIP (“Conservative Allocation VIP”) have similar investment objectives and policies, and both invest in Class A shares of other DWS funds (“underlying portfolios”). The same management team manages both Funds.
Income Allocation VIP seeks current income and, as a secondary objective, long-term growth of capital. Conservative Allocation VIP seeks a balance of current income and long-term growth of capital with an emphasis on current income. Income Allocation VIP generally allocates 60-90% of its assets in underlying portfolios which invest primarily in fixed income securities of all credit qualities and maturities (“fixed income portfolios”) and allocates 10-40% of its assets in underlying portfolios which invest primarily in equity securities of all capitalization levels (“equity portfolios”). Conservative Allocation VIP generally invests 45-75% in fixed income portfolios and 25-55% in equity portfolios. Both Funds expect in the future to use derivatives to attempt to manage risk and enhance returns. Please also see “Part II—Investment Strategies and Risk Factors” below for a more detailed comparison of each Fund’s investment policies and restrictions.
While DeAM believes that Conservative Allocation VIP should provide a comparable investment opportunity for shareholders of Income Allocation VIP, there are a number of significant differences in the portfolios of each Fund. DeAM has estimated that approximately 19% of the portfolio of Income Allocation VIP will be liquidated and the proceeds will be reinvested in other securities so that upon the merger, its portfolio will conform to the investment objective, policies, restrictions and strategies of Conservative Allocation VIP.
The following table sets forth a summary of the composition of the investment portfolio of each Fund as of December 31, 2005, and DeAM’s estimation of the portfolio composition of Conservative Allocation VIP assuming consummation of the proposed merger.
Portfolio Composition (as a % of Fund)
| | | | | | | | | |
Asset Allocation
| | Income
Allocation
VIP
| | | Conservative
Allocation VIP
| | | Conservative
Allocation VIP—
Estimated(1)
| |
Equity Funds | | 25 | % | | 43 | % | | 43 | % |
Fixed Income Funds | | 56 | % | | 38 | % | | 38 | % |
Cash Equivalents | | 19 | % | | 19 | % | | 19 | % |
| | |
|
| |
|
| |
|
|
| | | 100% | | | 100 | % | | 100 | % |
| | |
|
| |
|
| |
|
|
| (1) | | Reflects DeAM’s estimation of the portfolio composition of Conservative Allocation VIP subsequent to the merger, taking into account that prior to the merger, pursuant to the Agreement and Plan of Reorganization, a significant portion of the portfolio of Income Allocation VIP will be liquidated and the proceeds will be used to acquire other securities consistent with the investment objective, policies, restrictions and strategies of Conservative Allocation VIP. No assurance can be given as to the actual portfolio composition of Conservative Allocation VIP subsequent to the merger. |
9
| 5. | | How do the expense ratios and management fee rates of the Funds compare, and what are they estimated to be following each merger? |
DWS Dreman Financial Services VIP—DWS Dreman High Return Equity VIP
The following tables summarize the fees and expenses you may bear directly or indirectly as an investor in the Funds, the expenses that each of the Funds incurred for the year ended December 31, 2005, and the pro forma estimated expense ratios of High Return VIP assuming consummation of the merger of Financial Services VIP into High Return VIP only, and assuming consummation of the merger of Financial Services VIP and Strategic Value VIP into High Return VIP as of December 31, 2005. The information shown below does not reflect charges and fees associated with the separate accounts that invest in the Funds or any Contract for which the Funds are investment options. These charges and fees will increase expenses.
As shown below, the merger is expected to result in a lower total expense ratio for shareholders of Financial Services VIP. However, there can be no assurance that the merger will result in expense savings.
Annual Fund Operating Expenses
(expenses that are deducted from fund assets)
(as a % of average net assets)
| | | | | | | | | | | | | | | | | |
| | | Management
Fee
| | | Distribution/
Service
(12b-1)
Fee
| | | Other
Expenses
| | | Total
Annual
Fund
Operating
Expenses
| | | Less Expense
Waiver/
Reimbursements
| | Net
Annual
Fund
Operating
Expenses
(after
waiver)
| |
Financial Services VIP | | | | | | | | | | | | | | | |
Class A | | 0.75 | % | | None | | | 0.14 | % | | 0.89 | % | | — | | 0.89 | % |
Class B | | 0.75 | % | | 0.25 | % | | 0.29 | % | | 1.29 | % | | — | | 1.29 | % |
High Return VIP | | | | | | | | | | | | | | | |
Class A | | 0.73 | % | | None | | | 0.05 | % | | 0.78 | % | | — | | 0.78 | % |
Class B | | 0.73 | % | | 0.25 | % | | 0.19 | % | | 1.17 | % | | — | | 1.17 | % |
High Return VIP
(Pro forma combined, assuming consummation of Financial Services VIP merger only) | | | | | | | | | | | | | | | | | |
Class A | | 0.73 | % | | None | | | 0.05 | %(1) | | 0.78 | % | | — | | 0.78 | %(2) |
Class B | | 0.73 | % | | 0.25 | % | | 0.17 | %(1) | | 1.15 | % | | — | | 1.15 | %(2)(3) |
High Return VIP
(Pro forma combined, assuming consummation of Financial Services VIP merger and Strategic Value VIP merger into High Return VIP) | | | | | | | | | | | | | | | | | |
Class A | | 0.73 | % | | None | | | 0.05 | %(1) | | 0.78 | % | | — | | 0.78 | %(2) |
Class B | | 0.73 | % | | 0.25 | % | | 0.17 | %(1) | | 1.15 | % | | — | | 1.15 | %(2)(3) |
10
| (1) | | Other expenses are estimated, accounting for the effect of the merger. |
| (2) | | Contingent upon effectuation of the merger, through April 30, 2010, DeIM has contractually agreed to waive all or a portion of its management fee and/or reimburse or pay operating expenses of the combined fund to the extent necessary to maintain the combined fund’s total operating expenses at 0.78% and 1.15% for Class A and Class B shares, respectively, excluding certain expenses such as extraordinary expenses, taxes, brokerage and interest. |
| (3) | | DeIM has been notified by a participating insurance company that it intends to seek a substitution order from the SEC, which would permit the insurance company to substitute shares of the Funds with shares of certain other non-DWS variable insurance product funds. There is no assurance that the substitution order will be granted by the SEC or if granted, there is no assurance as to the impact, if any, on the Funds or their respective operating expense ratios. If the substitution order is effected, and contingent upon effectuation of the merger, DeIM has contractually agreed to waive all or a portion of its management fee and/or reimburse or pay operating expenses of the combined fund to the extent necessary to maintain the combined fund’s total operating expenses at 1.11% through April 30, 2010 for Class B shares, excluding certain expenses such as extraordinary expenses, taxes, brokerage and interest. |
The tables are provided to help you understand the expenses of investing in the Funds and your share of the operating expenses that each Fund incurs and that DeAM expects the combined fund to incur in the first year following the merger.
Examples
The following examples translate the expenses shown in the preceding table into dollar amounts. By doing this, you can more easily compare the costs of investing in the Funds. The examples make certain assumptions. They assume that you invest $10,000 in a Fund for the time periods shown and reinvest all dividends and distributions. They also assume a 5% return on your investment each year and that a Fund’s operating expenses remain the same. The examples are hypothetical; your actual costs may be higher or lower.
| | | | | | | | | | | | |
| | | 1 Year
| | 3 Years
| | 5 Years
| | 10 Years
|
Financial Services VIP | | | | | | | | | |
Class A | | $ | 91 | | $ | 284 | | $ | 493 | | $ | 1,096 |
Class B | | $ | 131 | | $ | 409 | | $ | 708 | | $ | 1,556 |
High Return VIP | | | | | | | | | |
Class A | | $ | 80 | | $ | 249 | | $ | 433 | | $ | 966 |
Class B | | $ | 119 | | $ | 372 | | $ | 644 | | $ | 1,420 |
High Return VIP
(Pro forma combined, assuming consummation of Financial Services VIP merger only) | | | | | | | | | | | | |
Class A | | $ | 80 | | $ | 249 | | $ | 433 | | $ | 966 |
Class B | | $ | 117 | | $ | 365 | | $ | 633 | | $ | 1,398 |
High Return VIP
(Pro forma combined, assuming consummation of Financial Services VIP merger and Strategic Value VIP merger into High Return VIP) | | | | | | | | | | | | |
Class A | | $ | 80 | | $ | 249 | | $ | 433 | | $ | 966 |
Class B | | $ | 117 | | $ | 365 | | $ | 633 | | $ | 1,398 |
11
The table below compares the annual management fee schedules of the Funds, which are identical, expressed as a percentage of net assets. As of December 31, 2005, High Return VIP and Financial Services VIP had net assets of $920,617,494 and $137,817,528, respectively.
| | | | | | |
Financial Services VIP
| | High Return VIP
(pre- and post-merger)
|
Average Daily
Net Assets
| | Management
Fee
| | Average Daily
Net Assets
| | Management
Fee
|
| $0 to $250 million | | 0.750% | | $0 to $250 million | | 0.750% |
| $250 million to $1 billion | | 0.720% | | $250 million to $1 billion | | 0.720% |
| $1 billion to $2.5 billion | | 0.700% | | $1 billion to $2.5 billion | | 0.700% |
| $2.5 billion to $5 billion | | 0.680% | | $2.5 billion to $5 billion | | 0.680% |
| $5 billion to $7.5 billion | | 0.650% | | $5 billion to $7.5 billion | | 0.650% |
| $7.5 billion to $10 billion | | 0.640% | | $7.5 billion to $10 billion | | 0.640% |
| $10 billion to $12.5 billion | | 0.630% | | $10 billion to $12.5 billion | | 0.630% |
| Over $12.5 billion | | 0.620% | | Over $12.5 billion | | 0.620% |
DWS MFS Strategic Value VIP—DWS Dreman High Return Equity VIP
The following tables summarize the fees and expenses you may bear directly or indirectly as an investor in the Funds, the expenses that each of the Funds incurred for the year ended December 31, 2005, and the pro forma estimated expense ratios of High Return VIP assuming consummation of the merger of Strategic Value VIP into High Return VIP only, and assuming consummation of the merger of Strategic Value VIP and Financial Services VIP into High Return VIP as of December 31, 2005. The information shown below does not reflect charges and fees associated with the separate accounts that invest in the Funds or any Contract for which the Funds are investment options. These charges and fees will increase expenses.
As shown below, the merger is expected to result in a lower management fee ratio and total expense ratio for shareholders of Strategic Value VIP. However, there can be no assurance that the merger will result in expense savings.
Annual Fund Operating Expenses
(expenses that are deducted from fund assets)
(as a % of average net assets)
| | | | | | | | | | | | | | | | | |
| | | Management
Fee
| | | Distribution/
Service
(12b-1)
Fee
| | | Other
Expenses
| | | Total
Annual
Fund
Operating
Expenses
| | | Less Expense
Waiver/
Reimbursements
| | Net
Annual
Fund
Operating
Expenses
(after
waiver)
| |
Strategic Value VIP | | | | | | | | | | | | | | | |
Class A | | 0.95 | % | | None | | | 0.30 | % | | 1.25 | % | | — | | 1.25 | %(1) |
Class B | | 0.95 | % | | 0.25 | % | | 0.45 | % | | 1.65 | % | | — | | 1.65 | %(1) |
High Return VIP | | | | | | | | | | | | | | | |
Class A | | 0.73 | % | | None | | | 0.05 | % | | 0.78 | % | | — | | 0.78 | % |
Class B | | 0.73 | % | | 0.25 | % | | 0.19 | % | | 1.17 | % | | — | | 1.17 | % |
12
| | | | | | | | | | | | | | | | | |
| | | Management
Fee
| | | Distribution/
Service
(12b-1)
Fee
| | | Other
Expenses
| | | Total
Annual
Fund
Operating
Expenses
| | | Less Expense
Waiver/
Reimbursements
| | Net
Annual
Fund
Operating
Expenses
(after
waiver)
| |
High Return VIP
(Pro forma combined, assuming consummation of Strategic Value VIP merger only) | | | | | | | | | | | | | | | | | |
Class A | | 0.73 | % | | None | | | 0.05 | %(2) | | 0.78 | % | | — | | 0.78 | %(3) |
Class B | | 0.73 | % | | 0.25 | % | | 0.17 | %(2) | | 1.15 | % | | — | | 1.15 | %(3)(4) |
High Return VIP
(Pro forma combined, assuming consummation of Strategic Value VIP merger and Financial Services VIP merger into High Return VIP) | | | | | | | | | | | | | | | | | |
Class A | | 0.73 | % | | None | | | 0.05 | %(2) | | 0.78 | % | | — | | 0.78 | %(3) |
Class B | | 0.73 | % | | 0.25 | % | | 0.17 | %(2) | | 1.15 | % | | — | | 1.15 | %(3)(4) |
| (1) | | Pursuant to their respective agreements with DWS Variable Series II, DeIM, DWS-Scudder Distributors, Inc. and DWS-Scudder Fund Accounting Corporation have agreed, through September 30, 2006, to limit their respective fees and to reimburse other expenses to the extent necessary to limit total operating expenses of Class A and Class B shares of Strategic Value VIP to 0.86% and 1.26%, excluding certain expenses such as extraordinary expenses, taxes, brokerage and interest. |
| (2) | | Other expenses are estimated, accounting for the effect of the merger. |
| (3) | | Contingent upon effectuation of the merger, through April 30, 2010, DeIM has contractually agreed to waive all or a portion of its management fee and/or reimburse or pay operating expenses of the combined fund to the extent necessary to maintain the combined fund’s total operating expenses at 0.78% and 1.15% for Class A and Class B shares, respectively, excluding certain expenses such as extraordinary expenses, taxes, brokerage and interest. |
| (4) | | DeIM has been notified by a participating insurance company that it intends to seek a substitution order from the SEC, which would permit the insurance company to substitute shares of the Funds with shares of certain other non-DWS variable insurance |
13
| | product funds. There is no assurance that the substitution order will be granted by the SEC or if granted, there is no assurance as to the impact, if any, on the Funds or their respective operating expense ratios. If the substitution order is effected, and contingent upon effectuation of the merger, DeIM has contractually agreed to waive all or a portion of its management fee and/or reimburse or pay operating expenses of the combined fund to the extent necessary to maintain the combined fund’s total operating expenses at 1.11% through April 30, 2010 for Class B shares, excluding certain expenses such as extraordinary expenses, taxes, brokerage and interest. |
The tables are provided to help you understand the expenses of investing in the Funds and your share of the operating expenses that each Fund incurs and that DeAM expects the combined fund to incur in the first year following the merger.
Examples
The following examples translate the expenses shown in the preceding table into dollar amounts. By doing this, you can more easily compare the costs of investing in the Funds. The examples make certain assumptions. They assume that you invest $10,000 in a Fund for the time periods shown and reinvest all dividends and distributions. They also assume a 5% return on your investment each year and that a Fund’s operating expenses remain the same. The examples are hypothetical; your actual costs may be higher or lower.
| | | | | | | | | | | | |
| | | 1 Year
| | 3 Years
| | 5 Years
| | 10 Years
|
Strategic Value VIP | | | | | | | | | |
Class A | | $ | 127 | | $ | 397 | | $ | 686 | | $ | 1,511 |
Class B | | $ | 168 | | $ | 520 | | $ | 897 | | $ | 1,955 |
High Return VIP | | | | | | | | | |
Class A | | $ | 80 | | $ | 249 | | $ | 433 | | $ | 966 |
Class B | | $ | 119 | | $ | 372 | | $ | 644 | | $ | 1,420 |
High Return VIP
(Pro forma combined, assuming consummation of Strategic Value VIP merger only) | | | | | | | | | | | | |
Class A | | $ | 80 | | $ | 249 | | $ | 433 | | $ | 966 |
Class B | | $ | 117 | | $ | 365 | | $ | 633 | | $ | 1,398 |
High Return VIP
(Pro forma combined, assuming consummation of Strategic Value VIP merger and Financial Services VIP merger into High Return VIP) | | | | | | | | | | | | |
Class A | | $ | 80 | | $ | 249 | | $ | 433 | | $ | 966 |
Class B | | $ | 117 | | $ | 365 | | $ | 633 | | $ | 1,398 |
The table below compares the annual management fee schedules of the Funds, expressed as a percentage of net assets. As of December 31, 2005, High Return VIP and Strategic Value VIP had net assets of $920,617,494 and $61,073,237, respectively.
| | | | | | |
Strategic Value VIP
| | High Return VIP
(pre- and post-merger)
|
Average Daily
Net Assets
| | Management
Fee
| | Average Daily
Net Assets
| | Management
Fee
|
| $0 to $250 million | | 0.950% | | $0 to $250 million | | 0.750% |
| $250 million to $500 million | | 0.925% | | $250 million to $1 billion | | 0.720% |
| $500 million to $1 billion | | 0.900% | | $1 billion to $2.5 billion | | 0.700% |
| $1 billion to $1.5 billion | | 0.825% | | $2.5 billion to $5 billion | | 0.680% |
| $1.5 billion to $2.5 billion | | 0.800% | | $5 billion to $7.5 billion | | 0.650% |
| Over $2.5 billion | | 0.775% | | $7.5 billion to $10 billion | | 0.640% |
| | | | | $10 billion to $12.5 billion | | 0.630% |
| | | | | Over $12.5 billion | | 0.620% |
14
DWS Income Allocation VIP—DWS Conservative Allocation VIP
The following tables summarize the fees and expenses you may bear directly or indirectly as an investor in the Funds, the expenses that each of the Funds incurred for the year ended December 31, 2005, and the pro forma estimated expense ratios of Conservative Allocation VIP assuming consummation of the merger as of that date. The information shown below does not reflect charges and fees associated with the separate accounts that invest in the Funds or any Contract for which the Funds are investment options. These charges and fees will increase expenses.
As shown below, the merger is expected to result in the same total expense ratio for shareholders of Income Allocation VIP. However, there can be no assurance that the merger will actually result in the same total expense ratio.
Annual Fund Operating Expenses
(expenses that are deducted from fund assets)
(as a % of average net assets)
| | | | | | | | | | | | | | | | | | | | | | | |
| | | Manage-
ment
Fee
| | | Distribution/
Service
(12b-1) Fee
| | | Other
Expenses
| | | Total
Annual
Fund
Operating
Expenses
| | | Less
Expense
Waiver/
Reimburse-
ments
| | | Net
Annual
Fund
Operating
Expenses
(after
waiver)
| | | Range of
Average
Weighted
Net
Expense
Ratios for
Underlying
Portfolios
| | Estimated
Total
Annual
Direct and
Indirect
Operating
Expenses(4)
| |
Income Allocation VIP | | | | | | | | | | | | | | | | | | |
Class B | | 0.15 | % | | 0.25 | % | | 1.13 | % | | 1.53 | % | | — | | | 1.53 | %(1) | | 0.48%
to
0.79% | | 2.10 | % |
Conservative Allocation VIP | | | | | | | | | | | | | | | |
Class B | | 0.15 | % | | 0.25 | % | | 0.54 | % | | 0.94 | % | | — | | | 0.94 | %(1) | | 0.45%
to
0.84% | | 1.60 | % |
Conservative Allocation VIP
(Pro forma combined) | | | | | | | | | | | | | | | |
Class B | | 0.15 | % | | 0.25 | % | | 0.42 | %(2) | | 0.82 | % | | 0.07 | %(3) | | 0.75 | %(3) | | 0.45%
to
0.84% | | 1.41 | % |
| (1) | | Through November 30, 2006, DeIM, DWS-Scudder Distributors, Inc. and DWS-Scudder Fund Accounting Corporation have each contractually agreed to waive their respective fees to the extent necessary to maintain each Fund’s direct operating expenses at 0.75% of average daily net assets, excluding certain expenses such as extraordinary expenses, taxes, brokerage and interest. |
| (2) | | Other expenses are estimated, accounting for the effect of the merger. |
| (3) | | Contingent upon effectuation of the merger, through April 30, 2010, DeIM has contractually agreed to waive all or a portion of its management fee and/or reimburse or pay operating expenses of the combined fund to the extent necessary to maintain the combined fund’s total operating expenses at 0.75%, excluding certain expenses such as extraordinary expenses, taxes, brokerage, interest, organizational and offering costs. |
15
| (4) | | The Estimated Total Annual Direct and Indirect Operating Expenses shown in the table is the sum of each Fund’s Total Annual Operating Expenses and the weighted average expense ratio of the underlying portfolios held by the Fund. |
The tables are provided to help you understand the expenses of investing in the Funds and your share of the operating expenses that each Fund incurs and that DeAM expects the combined fund to incur in the first year following the merger.
Examples
The following examples translate the expenses shown in the preceding table into dollar amounts. By doing this, you can more easily compare the costs of investing in the Funds. The examples make certain assumptions. They assume that you invest $10,000 in a Fund for the time periods shown and reinvest all dividends and distributions. They also assume a 5% return on your investment each year and that a Fund’s operating expenses remain the same. The examples are hypothetical; your actual costs may be higher or lower.
| | | | | | | | | | | | |
| | | 1 Year
| | 3 Years
| | 5 Years
| | 10 Years
|
Income Allocation VIP | | | | | | | | | | | | |
Class B | | $ | 213 | | $ | 658 | | $ | 1,129 | | $ | 2,431 |
Conservative Allocation VIP | | | | | | | | | | | | |
Class B | | $ | 163 | | $ | 505 | | $ | 871 | | $ | 1,900 |
Conservative Allocation VIP
(Pro forma combined) | | | | | | | | | | | | |
Class B | | $ | 144 | | $ | 446 | | $ | 786 | | $ | 1,747 |
The table below compares the annual management fee schedules of the Funds, which are identical, expressed as a percentage of net assets. As of December 31, 2005, Conservative Allocation VIP and Income Allocation VIP had net assets of $46,071,582 and $12,293,419, respectively.
| | | | | | |
Income Allocation VIP
| | Conservative Allocation VIP
(pre- and post-merger)
|
Average Daily
Net Assets
| | Management
Fee
| | Average Daily
Net Assets
| | Management
Fee
|
| $0 to $500 million | | 0.150% | | $0 to $500 million | | 0.150% |
| $500 million to $1 billion | | 0.140% | | $500 million to $1 billion | | 0.140% |
| $1 billion to $1.5 billion | | 0.130% | | $1 billion to $1.5 billion | | 0.130% |
| $1.5 billion to $2.5 billion | | 0.120% | | $1.5 billion to $2.5 billion | | 0.120% |
| Over $2.5 billion | | 0.110% | | Over $2.5 billion | | 0.110% |
| 6. | | What are the federal income tax consequences of the proposed mergers? |
For federal income tax purposes, no gain or loss is expected to be recognized by an Acquired Fund or its shareholders as a direct result of its merger. As described above, shares of the Acquired Funds are available to investors purchasing Contracts funded through the separate accounts (or sub-accounts thereof) of Participating Insurance Companies. As long as these Contracts qualify as annuity contracts under Section 72 of the Internal Revenue Code of 1986, as amended (the “Code”), and Treasury Regulations thereunder, the mergers, whether treated as tax-free reorganizations or not, will not create any federal income tax liability for Contract Owners. For more information, please see “Information about the Proposed Mergers—Certain Federal Income Tax Consequences,” below.
16
| 7. | | Will my dividends be affected by the mergers? |
The mergers will not result in a change in dividend policy. All Funds intend to declare and distribute dividends from their net investment income and capital gains, if any, annually.
| 8. | | Do the procedures for purchasing, redeeming and exchanging shares of the Funds differ? |
No. The procedures for purchasing and redeeming shares of each Fund, and for exchanging shares of each Fund for shares of other DWS funds, are identical. The separate accounts of the Participating Insurance Companies place orders to purchase and redeem shares of the Funds based on, among other things, the amount of premium payments to be invested and surrender and transfer requests to be effected on that day pursuant to its Contracts. The shares of each Fund are purchased and redeemed at the net asset value of the Fund’s shares next determined after an order in proper form is received. No fee is charged to shareholders when they purchase or redeem shares of the Funds, nor will a fee be charged to shareholders when they purchase or redeem shares of the combined funds. Please see the Funds’ prospectuses for additional information.
| 9. | | How will I be notified of the outcome of the merger of my Acquired Fund? |
If the proposed merger of your Acquired Fund is approved by shareholders, shareholders whose accounts are affected by the merger will receive a confirmation statement reflecting their new account number and the number of shares of the corresponding Acquiring Fund they are receiving after the merger is completed. Subsequently, affected Contract Owners will be notified of changes to their account information by their respective Participating Insurance Companies. If the proposed merger is not approved, this result will be noted in the next shareholder report of your Acquired Fund.
| 10. | | Will the value of my investment change? |
The number of shares owned by each Participating Insurance Company will most likely change. However, the total value of your investment in the Acquiring Fund will equal the total value of your investment in your Acquired Fund at the time of the merger. Even though the net asset value per share of each Fund is likely to be different, the total value of your holdings will not change as a result of the merger.
| 11. | | What percentage of shareholders’ votes is required to approve the merger of my Fund? |
Approval of each merger will require the affirmative vote of the shareholders of the applicable Acquired Fund entitled to vote more than 50% of the votes entitled to be cast on the matter at the special meeting.
The Trustees of the Trust believe that the proposed mergers are in the best interests of each Acquired Fund. Accordingly, the Trustees unanimously recommend that shareholders vote FOR approval of the proposed mergers.
17
II. INVESTMENT STRATEGIES AND RISK FACTORS
What are the main investment strategies and related risks of each Acquiring Fund and how do they compare with those of the corresponding Acquired Fund?
DWS Dreman Financial Services VIP—DWS Dreman High Return Equity VIP
Investment Objectives and Strategies. High Return VIP seeks to achieve a high rate of total return, whereas Financial Services VIP seeks to provide long-term capital appreciation.
Under normal circumstances, High Return VIP invests at least 80% of net assets, plus the amount of any borrowings for investment purposes, in common stocks and other equity securities. High Return VIP focuses on stocks of large US companies that are similar in size to the companies in the S&P 500 Index (as of March 31, 2006, the S&P 500 Index had a median market capitalization of $11.74 billion) and that the portfolio managers believe are undervalued. High Return VIP intends to invest primarily in companies whose market capitalizations fall within the normal range of the Index. In contrast, under normal circumstances, Financial Services VIP invests at least 80% of net assets, plus the amount of any borrowings for investment purposes, in equity securities (mainly common stocks) of financial services companies. These may include companies of any size that commit at least half of their assets to the financial services sector, or derive at least half of their revenues or net income from that sector. The major types of financial services companies are banks, insurance companies, savings and loans, securities brokerage firms and diversified financial companies.
Although High Return VIP can invest in stocks of any economic sector, at times it may emphasize the financial services sector or other sectors (in fact, it may invest more than 25% of total assets in a single sector). High Return VIP may invest up to 20% of net assets in US dollar-denominated American Depository Receipts and in securities of foreign companies traded principally in securities markets outside the US. While Financial Services VIP invests mainly in US stocks, it could invest up to 30% of total assets in foreign securities, and up to 20% of net assets in investment-grade debt securities.
Both Funds use the same value investment style and investment process and are managed by the same portfolio managers. The portfolio managers begin by screening for stocks whose price-to-earnings ratios are below the average for their respective Index. The managers then compare a company’s stock price to its book value, cash flow and yield, and analyze individual companies to identify those that are financially sound and appear to have strong potential for long-term growth and income.
The managers assemble each Fund from among the most attractive stocks, drawing on analysis of economic outlooks for various sectors and industries. The managers may favor securities from different sectors and industries at different times, while still maintaining variety in terms of industries and companies represented.
The managers normally will sell a stock when it reaches a target price, its fundamental factors have changed or when other investments offer better opportunities, or for Financial Services VIP, in the course of adjusting the emphasis on a given industry.
18
Each Fund may lend its investment securities in an amount up to 33 1/3% of its total assets to approved institutional borrowers who need to borrow securities in order to complete certain transactions.
Although major changes tend to be infrequent, the Board of Trustees could change either Fund’s investment objective without seeking shareholder approval. However, the Board will provide shareholders with at least 60 days notice prior to making any changes to a Fund’s 80% investment policy.
Although not a principal investment strategy, each Fund is permitted, but not required, to use various types of derivatives. In particular, High Return VIP may use futures, currency options and forward currency transactions and Financial Services VIP may use futures and options. Each Fund may also use derivatives in circumstances where the portfolio managers believe they offer an economical means of gaining exposure to a particular asset class or to keep cash on hand to meet shareholder redemptions or other needs while maintaining exposure to the market.
As a temporary defensive measure, each Fund could shift up to 100% of assets into investments such as money market securities. This measure could prevent losses but, while engaged in a temporary defensive position, a Fund will not be pursuing its investment objective. However, the portfolio managers may choose not to use these strategies for various reasons, even in very volatile market conditions.
The portfolio turnover rate for High Return VIP, i.e., the ratio of the lesser of annual sales or purchases to the monthly average value of the Fund (excluding from both the numerator and the denominator securities with maturities at the time of acquisition of one year or less), for the fiscal year ended December 31, 2005 was 10%. The portfolio turnover rate for Financial Services VIP for the fiscal year ended December 31, 2005 was 27%. A higher portfolio turnover rate involves greater brokerage and transaction expenses to a Fund.
Although DeAM believes that High Return VIP should provide a comparable investment opportunity for shareholders of Financial Services VIP, there are a number of significant differences in the portfolios of each Fund. Pursuant to the Agreement, DeAM has estimated that approximately 62% of the portfolio of Financial Services VIP will be liquidated prior to the merger. Proceeds from the liquidation will be used to acquire securities consistent with High Return VIP’s investment objective, policies, restrictions and strategies.
For a more detailed description of the investment techniques used by High Return VIP and Financial Services VIP, please see the applicable Fund’s prospectus and statement of additional information.
Primary Risks. As with any mutual fund, you may lose money by investing in High Return VIP. Certain risks associated with an investment in High Return VIP are summarized below. The risks of an investment in High Return VIP are similar to the risks of an investment in Financial Services VIP. More detailed descriptions of the risks associated with an investment in High Return VIP can be found in the current prospectus and statement of additional information for High Return VIP.
19
The value of your investment in High Return VIP will change with changes in the values of the investments held by the Fund. A wide array of factors can affect those values. In this summary, we describe the principal risks that may affect High Return VIP’s investments as a whole. The Fund could be subject to additional principal risks because the types of investments it makes can change over time.
There are several risk factors that could hurt the performance of High Return VIP, cause you to lose money or cause the performance of High Return VIP to trail that of other investments.
Stock Market Risk. As with most stock portfolios, an important factor with High Return VIP is how stock markets perform—in this case, the large company portion of the US stock market. When large company stock prices fall, you should expect the value of your investment to fall as well. Large company stocks at times may not perform as well as stocks of small or mid-size companies. Because a stock represents ownership in its issuer, stock prices can be hurt by poor management, shrinking product demand and other business risks. These may affect single companies as well as groups of companies. In addition, movements in financial markets may adversely affect a stock’s price, regardless of how well the company performs. The market as a whole may not favor the type of investments the Fund makes and the Fund may not be able to get an attractive price for them. An investment in Financial Services VIP is also subject to this risk.
Value Investing Risk. As with any investment strategy, the “value” strategy used in managing High Return VIP’s portfolio will, at times, perform better than or worse than other investment styles and the overall market. If the portfolio managers overestimate the value or return potential of one or more common stocks, the Fund may underperform the general equity market. Value stocks may also be out of favor for certain periods in relation to growth stocks. An investment in Financial Services VIP is also subject to this risk.
Industry Risk. While High Return VIP does not concentrate in any industry, to the extent that it has exposure to a given industry or sector, any factors affecting that industry or sector could affect the value of portfolio securities. For example, manufacturers of consumer goods could be hurt by a rise in unemployment, or technology companies could be hurt by such factors as market saturation, price competition and rapid obsolescence. An investment in Financial Services VIP is subject to the risks of the financial services industry.
IPO Risk. Securities purchased in initial public offerings (IPOs) may be very volatile, rising and falling rapidly, often based, among other reasons, on investor perceptions rather than on economic factors. Additionally, investments in IPOs may magnify High Return VIP’s performance if the Fund has a small asset base. High Return VIP is less likely to experience a similar impact on its performance as its assets grow because it is unlikely that the portfolio will be able to obtain proportionately larger IPO allocations.
Derivatives Risk. Risks associated with derivatives include: the risk that the derivative is not well correlated with the security, index or currency to which it relates; the risk that derivatives used for risk management may not have the intended effects and may result in losses or missed opportunities; the risk that the Fund will be unable to sell
20
the derivative because of an illiquid secondary market; the risk that a counterparty is unwilling or unable to meet its obligation; the risk of interest rate movements and the risk that the derivatives transaction could expose the Fund to the effects of leverage, which could increase its exposure to the market and magnify potential losses. There is no guarantee that derivatives activities will be employed or that they will work, and their use could cause lower returns or even losses to the Fund. An investment in Financial Services VIP is also subject to this risk.
Securities Lending Risk. Any loss in the market price of securities loaned by the High Return VIP that occurs during the term of the loan would be borne by the Fund and would adversely affect the Fund’s performance. Also, there may be delays in recovery of securities loaned or even a loss of rights in the collateral should the borrower of the securities fail financially while the loan is outstanding. However, loans will be made only to borrowers selected by the Fund’s delegate after a review of relevant facts and circumstances, including the creditworthiness of the borrower. An investment in Financial Services VIP is also subject to this risk.
Pricing Risk. At times, market conditions might make it hard to value some investments. For example, if High Return VIP has valued its securities too highly, you may end up paying too much for Fund shares when you buy into the Fund. If the High Return VIP underestimates their price, you may not receive the full market value for your shares when you sell. An investment in Financial Services VIP is also subject to this risk.
Security Selection Risk. A risk that pervades all investing is the risk that the securities in a fund’s investment portfolio will decline in value.
Other factors that could affect performance include:
| | • | | the managers could be incorrect in their analysis of industries, companies, economic trends, the relative attractiveness of different sizes of stocks, geographical trends or other matters; and |
| | • | | foreign securities tend to be more volatile than their US counterparts, for reasons such as currency fluctuations and political and economic uncertainty. |
An investment in Financial Services VIP is also subject to these risks.
Performance Information. The following information provides some indication of the risks of investing in the Funds. The information shown below does not reflect charges and fees associated with the separate accounts that invest in the Funds or any Contract for which the Funds are investment options. If it did, performance would be less than that shown. The bar charts show year-to-year changes in the performance of each Fund’s Class A shares. The table following the charts shows how the performance of each Fund compares to that of one or more broad-based market indices (which, unlike the Funds, do not have any fees or expenses). Because the inception date for Class B of High Return VIP and of Financial Services VIP was July 1, 2002, the performance figures for Class B of each Fund before that date are based on the historical performance of the Fund’s original share class (Class A), adjusted to reflect the higher gross total annual operating expenses of Class B. The performance of the Funds and the indices varies over time. Of course, a Fund’s past performance is not necessarily an indication of future performance.
21
Calendar Year Total Returns (%)
High Return VIP
| | |
Annual Total Returns (%) as of 12/31 each year | | Class A |
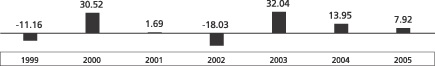
For the periods included in the bar chart:
Best Quarter: 20.80%, Q2, 2003 Worst Quarter: -17.32%, Q3, 2002
2006 Total Return as of June 30: 4.19%
Financial Services VIP
| | |
Annual Total Returns (%) as of 12/31 each year | | Class A |
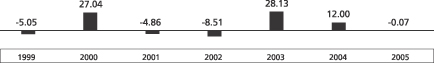
For the periods included in the bar chart:
Best Quarter: 22.35%, Q3, 2000 Worst Quarter: -15.86%, Q3, 2002
2006 Total Return as of June 30: 3.52%
Average Annual Total Returns
(%) as of 12/31/05
| | | | | | | | | | |
| | | Past 1 year
| | | Past 5 years
| | | Since Inception(1)
| |
High Return VIP | | | | | | | | | | |
Class A | | | 7.92 | % | | 6.24 | % | | 6.45 | % |
Class B | | | 7.51 | % | | 5.90 | % | | 6.13 | % |
Index 1 (Reflects no deductions for fees or expenses) | | | 4.91 | % | | 0.54 | % | | 3.09 | % |
| | | |
Financial Services VIP | | | | | | | | | | |
Class A | | - | 0.07 | % | | 4.54 | % | | 5.18 | % |
Class B | | - | 0.46 | % | | 4.21 | % | | 4.87 | % |
Index 1 (Reflects no deductions for fees or expenses) | | | 4.91 | % | | 0.54 | % | | 3.09 | % |
Index 2 (Reflects no deductions for fees or expenses) | | | 6.47 | % | | 3.76 | % | | 5.75 | % |
Index 1: The Standard & Poor’s (S&P) 500 Index is a capitalization-weighted index of 500 stocks designed to measure performance of the broad domestic economy through changes in the aggregate market value of 500 stocks representing all major industries.
22
Index 2: The S&P Financial Index is an unmanaged index generally representative of the financial stock market.
| (1) | | Since 5/4/98 for both Funds. Index comparisons begin 4/30/98. |
Current performance may be higher or lower than the performance data quoted above. For more recent performance information, call your insurance company or (800) 621-1048 or visit the DWS website at www.dws-scudder.com.
DWS MFS Strategic Value VIP—DWS Dreman High Return Equity VIP
Investment Objectives and Strategies. High Return VIP seeks to achieve a high rate of total return, whereas Strategic Value VIP seeks to provide capital appreciation.
Under normal circumstances, High Return VIP invests at least 80% of net assets, plus the amount of any borrowings for investment purposes, in common stocks and other equity securities. High Return VIP focuses on stocks of large US companies that are similar in size to the companies in the S&P 500 Index (as of March 31, 2006, the S&P 500 Index had a median market capitalization of $11.74 billion) and that the portfolio managers believe are undervalued. High Return VIP intends to invest primarily in companies whose market capitalizations fall within the normal range of the Index. Although High Return VIP can invest in stocks of any economic sector, at times it may emphasize the financial services sector or other sectors (in fact, it may invest more than 25% of total assets in a single sector).
Similar to High Return VIP, Strategic Value VIP invests, under normal market conditions, at least 65% of its net assets in common stocks and related securities, such as preferred stocks, convertible securities and depositary receipts, of companies which the manager believes are undervalued in the market relative to their long-term potential. The equity securities of these companies may be undervalued because they are temporarily out of favor in the market due to:
| | • | | a decline in the market |
| | • | | poor economic conditions |
| | • | | developments that have affected or may affect the issuer of the securities or the issuer’s industry; or |
| | • | | the market has overlooked them |
Undervalued equity securities generally have low price-to-book, price-to-sales and/or price-to-earnings ratios. Strategic Value VIP’s investments may include securities listed on a securities exchange or traded in the over-the-counter markets.
Strategic Value VIP also invests in other types of securities, such as fixed income securities, including lower rated securities commonly referred to as junk bonds, and warrants, when relative values make such purchases attractive.
High Return VIP may invest up to 20% of net assets in US dollar-denominated American Depository Receipts and in securities of foreign companies traded principally in securities markets outside the US. Strategic Value VIP is not so limited, and may invest in a broader range of foreign securities, including emerging market securities.
23
While the Funds both use a value investment style, their investment processes differ somewhat. For High Return VIP, the portfolio managers begin by screening for stocks whose price-to-earnings ratios are below the average for the S&P 500 Index. The managers then compare a company’s stock price to its book value, cash flow and yield, and analyze individual companies to identify those that are financially sound and appear to have strong potential for long-term growth and income.
The managers assemble High Return VIP’s portfolio from among the most attractive stocks, drawing on analysis of economic outlooks for various sectors and industries. The managers may favor securities from different sectors and industries at different times, while still maintaining variety in terms of industries and companies represented. The managers normally will sell a stock when it reaches a target price, its fundamental factors have changed or when other investments offer better opportunities.
For Strategic Value VIP, the manager uses a bottom-up, as opposed to a top-down, investment style in managing the Fund. This means that securities are selected based upon fundamental analysis (such as an analysis of earnings, cash flows, competitive position and management’s abilities) performed by the manager and the subadvisor’s large group of equity research analysts.
Each Fund may lend its investment securities in an amount up to 331/3% of its total assets to approved institutional borrowers who need to borrow securities in order to complete certain transactions.
Although major changes tend to be infrequent, the Board of Trustees could change either Fund’s investment objective without seeking shareholder approval. However, the Board will provide shareholders with at least 60 days notice prior to making any changes to High Return VIP’s 80% investment policy.
Although not a principal investment strategy, each Fund is permitted, but not required, to use various types of derivatives. In particular, High Return VIP may use futures, currency options and forward currency transactions. Each Fund may also use derivatives in circumstances where the portfolio managers believe they offer an economical means of gaining exposure to a particular asset class or to keep cash on hand to meet shareholder redemptions or other needs while maintaining exposure to the market.
As a temporary defensive measure, each Fund could shift up to 100% of assets into investments such as money market securities. This measure could prevent losses, but, while engaged in a temporary defensive position, a Fund will not be pursuing its investment objective. However, the portfolio managers may choose not to use these strategies for various reasons, even in very volatile market conditions.
The portfolio turnover rate for High Return VIP, i.e., the ratio of the lesser of annual sales or purchases to the monthly average value of the Fund (excluding from both the numerator and the denominator securities with maturities at the time of acquisition of one year or less), for the fiscal year ended December 31, 2005 was 10%. The portfolio turnover rate for Strategic Value VIP for the fiscal year ended December 31, 2005 was 59%. A higher portfolio turnover rate involves greater brokerage and transaction expenses to a Fund.
24
Although DeAM believes that High Return VIP should provide a comparable investment opportunity for shareholders of Strategic Value VIP, there are a number of significant differences in the portfolios of each Fund. Pursuant to the Agreement, DeAM has estimated that approximately 89% of the portfolio of Strategic Value VIP will be liquidated prior to the merger. Proceeds from the liquidation will be used to acquire securities consistent with High Return VIP’s investment objective, policies, restrictions and strategies. Subject to approval of the merger by shareholders, DeIM, and not MFS, the subadvisor to Strategic Value VIP, will direct and be responsible for all sales and purchases of assets made during the period commencing immediately after the shareholder meeting and ending immediately prior to the closing of the merger, during which period the rebalancing of Strategic Value VIP will be completed.
For a more detailed description of the investment techniques used by High Return VIP and Strategic Value VIP, please see the applicable Fund’s prospectus and statement of additional information.
Primary Risks. As with any mutual fund, you may lose money by investing in High Return VIP. Certain risks associated with an investment in High Return VIP are summarized below. The risks of an investment in High Return VIP are similar to the risks of an investment in Strategic Value VIP. More detailed descriptions of the risks associated with an investment in High Return VIP can be found in the current prospectus and statement of additional information for High Return VIP.
The value of your investment in High Return VIP will change with changes in the values of the investments held by the Fund. A wide array of factors can affect those values. In this summary, we describe the principal risks that may affect High Return VIP’s investments as a whole. The Fund could be subject to additional principal risks because the types of investments it makes can change over time.
There are several risk factors that could hurt the performance of High Return VIP, cause you to lose money or cause the performance of the Fund to trail that of other investments.
Stock Market Risk. As with most stock portfolios, an important factor with High Return VIP is how stock markets perform—in this case, the large company portion of the US stock market. When large company stock prices fall, you should expect the value of your investment to fall as well. Large company stocks at times may not perform as well as stocks of small or mid-size companies. Because a stock represents ownership in its issuer, stock prices can be hurt by poor management, shrinking product demand and other business risks. These may affect single companies as well as groups of companies. In addition, movements in financial markets may adversely affect a stock’s price, regardless of how well the company performs. The market as a whole may not favor the type of investments the Fund makes and it may not be able to get an attractive price for them. An investment in Strategic Value VIP is also subject to this risk.
Value Investing Risk. As with any investment strategy, the “value” strategy used in managing High Return VIP’s portfolio will, at times, perform better than or worse than other investment styles and the overall market. If the portfolio managers overestimate the value or return potential of one or more common stocks, the Fund may underperform the general equity market. Value stocks may also be out of favor for certain periods in relation to growth stocks. An investment in Strategic Value VIP is also subject to this risk.
Industry Risk. While High Return VIP does not concentrate in any industry, to the extent that it has exposure to a given industry or sector, any factors affecting that
25
industry or sector could affect the value of portfolio securities. For example, manufacturers of consumer goods could be hurt by a rise in unemployment, or technology companies could be hurt by such factors as market saturation, price competition and rapid obsolescence. An investment in Strategic Value VIP is also subject to this risk.
IPO Risk. Securities purchased in initial public offerings (IPOs) may be very volatile, rising and falling rapidly, often based, among other reasons, on investor perceptions rather than on economic factors. Additionally, investments in IPOs may magnify High Return VIP’s performance if it has a small asset base. High Return VIP is less likely to experience a similar impact on its performance as its assets grow because it is unlikely that the Fund will be able to obtain proportionately larger IPO allocations. An investment in Strategic Value VIP is also subject to this risk.
Derivatives Risk. Risks associated with derivatives include: the risk that the derivative is not well correlated with the security, index or currency to which it relates; the risk that derivatives used for risk management may not have the intended effects and may result in losses or missed opportunities; the risk that the Fund will be unable to sell the derivative because of an illiquid secondary market; the risk that a counterparty is unwilling or unable to meet its obligation; the risk of interest rate movements and the risk that the derivatives transaction could expose the Fund to the effects of leverage, which could increase its exposure to the market and magnify potential losses. There is no guarantee that derivatives activities will be employed or that they will work, and their use could cause lower returns or even losses to the Fund. An investment in Strategic Value VIP is also subject to this risk.
Securities Lending Risk. Any loss in the market price of securities loaned by the High Return VIP that occurs during the term of the loan would be borne by the Fund and would adversely affect the Fund’s performance. Also, there may be delays in recovery of securities loaned or even a loss of rights in the collateral should the borrower of the securities fail financially while the loan is outstanding. However, loans will be made only to borrowers selected by the Fund’s delegate after a review of relevant facts and circumstances, including the creditworthiness of the borrower. An investment in Strategic Value VIP is also subject to this risk.
Pricing Risk. At times, market conditions might make it hard to value some investments. For example, if High Return VIP has valued its securities too highly, you may end up paying too much for Fund shares when you buy into the Fund. If High Return VIP underestimates their price, you may not receive the full market value for your shares when you sell. An investment in Strategic Value VIP is also subject to this risk.
Security Selection Risk. A risk that pervades all investing is the risk that the securities in High Return VIP’s investment portfolio will decline in value.
Other factors that could affect performance include:
| | • | | the managers could be incorrect in their analysis of industries, companies, economic trends, the relative attractiveness of different sizes of stocks, geographical trends or other matters; and |
| | • | | foreign securities tend to be more volatile than their US counterparts, for reasons such as currency fluctuations and political and economic uncertainty. |
26
An investment in Strategic Value VIP is also subject to these risks.
Performance Information. The following information provides some indication of the risks of investing in the Funds. The information shown below does not reflect charges and fees associated with the separate accounts that invest in the Funds or any Contract for which the Funds are investment options. If it did, performance would be less than that shown. The bar charts show year-to-year changes in the performance of each Fund’s Class A shares. The table following the charts shows how the performance of each Fund compares to that of a broad-based market index (which, unlike the Funds, does not have any fees or expenses). Because the inception date for Class B of High Return VIP and of Strategic Value VIP was July 1, 2002, the performance figures for Class B of each Fund before that date are based on the historical performance of each Fund’s original share class (Class A), adjusted to reflect the higher gross total annual operating expenses of Class B. The performance of the Funds and the indices varies over time. Of course, a Fund’s past performance is not necessarily an indication of future performance.
Calendar Year Total Returns (%)
High Return VIP
| | |
Annual Total Returns (%) as of 12/31 each year | | Class A |

For the periods included in the bar chart:
Best Quarter: 20.80%, Q2, 2003 Worst Quarter: -17.32%, Q3, 2002
2006 Total Return as of June 30: 4.19%
Strategic Value VIP
| | |
Annual Total Returns (%) as of 12/31 each year | | Class A |
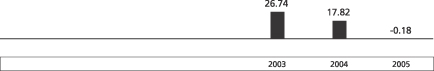
For the periods included in the bar chart:
Best Quarter: 19.90%, Q2, 2003 Worst Quarter: -5.44%, Q1, 2003
2006 Total Return as of June 30: 1.12%
27
Average Annual Total Returns
(%) as of 12/31/05
| | | | | | | | | |
| | | Past 1 year
| | | Past 5 years
| | | Since Inception(1),(2)
| |
High Return VIP | | | | | | | | | |
Class A | | 7.92 | % | | 6.24 | % | | 6.45 | % |
Class B | | 7.51 | % | | 5.90 | % | | 6.13 | % |
Index 1 (Reflects no deductions for fees or expenses) | | 4.91 | % | | 0.54 | % | | 3.09 | % |
| | | |
Strategic Value VIP | | | | | | | | | |
Class A | | -0.18 | % | | N/A | | | 5.34 | % |
Class B | | -0.60 | % | | N/A | | | 8.70 | % |
Index 2 (Reflects no deductions for fees or expenses) | | 7.05 | % | | N/A | | | 8.81 | % |
Index 1: The Standard & Poor’s (S&P) 500 Index is a capitalization-weighted index of 500 stocks designed to measure performance of the broad domestic economy through changes in the aggregate market value of 500 stocks representing all major industries.
Index 2: The Russell 1000 Value Index is an unmanaged index which consists of those stocks in the Russell 1000 Index with lower price-to-book ratios and lower forecasted growth values.
| (1) | | Since 5/4/98. Index comparisons begin 4/30/98. |
| (2) | | Since 5/1/02. Index comparisons begin 4/30/02. |
Current performance may be higher or lower than the performance data quoted above. For more recent performance information, call your insurance company or (800) 621-1048 or visit the DWS website at www.dws-scudder.com.
DWS Income Allocation VIP—DWS Conservative Allocation VIP
Investment Objectives and Strategies. As noted above, the Funds have similar investment objectives and policies and are managed by the same portfolio management team.
Conservative Allocation VIP seeks a balance of current income and long-term growth of capital. Income Allocation VIP seeks current income and, as a secondary objective, long-term growth of capital.
Both Funds invest in a portfolio of other DWS portfolios (“underlying portfolios”) that invest across a range of asset classes, utilizing a wide variety of securities and investment styles. Both Funds will always invest in the share class of an underlying portfolio with the lowest fees and expenses.
For Conservative Allocation VIP, its target portfolio allocation is as follows:
| | • | | 60% in underlying portfolios which invest primarily in fixed-income securities of all credit qualities and maturities (“fixed-income portfolios”); and |
28
| | • | | 40% in underlying portfolios which invest primarily in equity securities of all capitalization levels (“equity portfolios”). |
The portfolio managers have the flexibility to adjust this allocation within the following ranges:
| | • | | 45-75% in fixed-income portfolios; and |
| | • | | 25-55% in equity portfolios. |
For Income Allocation VIP, its target portfolio allocation is as follows:
| | • | | 75% in fixed-income portfolios; and |
| | • | | 25% in equity portfolios. |
The portfolio managers have the flexibility to adjust this allocation within the following ranges:
| | • | | 60-90% in fixed-income portfolios; and |
| | • | | 10-40% in equity portfolios. |
While the actual allocation may vary for each Fund, the portfolio managers expect that over the long-term it will average out to be similar to the target allocation.
The underlying portfolios in each Fund use a broad array of investment styles. These portfolios can buy many types of securities, among them common stocks of companies of any size, corporate bonds of varying credit quality, US government and agency bonds, mortgage- and asset-backed securities, money market instruments and others. These securities are mainly from US issuers but may be, to a more limited extent, from foreign issuers.
Each Fund uses the same investment process. The portfolio managers regularly review the actual allocation for each Fund and may adjust it in seeking to take advantage of current or expected market conditions or to manage risk. In making their allocation decisions, the managers use a proprietary mix of qualitative and quantitative inputs to arrive at a view for the securities markets and segments of those markets. Based on the desired exposure to particular investments and a thorough risk analysis, the managers then decide which portfolios to use as underlying portfolios and in which proportions for each Fund.
With respect to both Funds, it is expected that, in the future, the managers may invest in instruments, commonly called “derivatives,” including, but not limited to, futures and forward currency exchange contracts, to attempt to manage risk and enhance returns. Derivatives may be used to hedge each Fund against price fluctuations and otherwise reduce risk. Derivatives may also be used to increase each Fund’s exposure to certain markets in an attempt to enhance returns. These strategies may be used separately or in combination. The managers may also use these derivatives strategies to help maintain cash reserves or otherwise liquid assets to meet shareholder redemptions, or for other needs, while maintaining exposure to the markets. The managers will determine which derivative instruments to purchase by using a quantitative strategy that incorporates data from various international markets. The
29
strategy seeks to shift the emphasis on each Fund’s holdings in response to short- and medium-term changes in global markets. The use of the strategy is subject to Board approval. Shareholders will be notified prior to the use of the strategy.
As a temporary defensive measure, each Fund could shift up to 100% of assets into investments such as money market securities. This could prevent losses, but, while engaged in a temporary defense position, a Fund will not be pursuing its investment objective. However, the managers may choose not to use these strategies for various reasons, even in very volatile market conditions.
The portfolio turnover rate for Conservative Allocation VIP, i.e., the ratio of the lesser of annual sales or purchases to the monthly average value of the Fund (excluding from both the numerator and the denominator securities with maturities at the time of acquisition of one year or less), for the fiscal year ended December 31, 2005 was 27%. The portfolio turnover rate for Income Allocation VIP for the fiscal year ended December 31, 2005 was 46%. A higher portfolio turnover rate involves greater brokerage and transaction expenses to a Fund.
Although DeAM believes that Conservative Allocation VIP should provide a comparable investment opportunity for shareholders of Income Allocation VIP, there are some significant differences in the portfolios of each Fund. Pursuant to the Agreement, DeAM has estimated that approximately 19% of the portfolio of Income Allocation VIP will be liquidated prior to the merger. Proceeds from the liquidation will be used to acquire securities consistent with Conservative Allocation VIP’s investment objective, policies, restrictions and strategies.
For a more detailed description of the investment techniques used by Conservative Allocation VIP and Income Allocation VIP, please see the applicable Fund’s prospectus and statement of additional information.
Primary Risks. As with any mutual fund, you may lose money by investing in Conservative Allocation VIP. Certain risks associated with an investment in Conservative Allocation VIP are summarized below. The risks of an investment in Conservative Allocation VIP are similar to the risks of an investment in Income Allocation VIP. More detailed descriptions of the risks associated with an investment in Conservative Allocation VIP can be found in the current prospectus and statement of additional information for Conservative Allocation VIP.
The value of your investment in Conservative Allocation VIP will change with changes in the values of the investments held by the Fund. A wide array of factors can affect those values. In this summary, we describe the principal risks that may affect Conservative Allocation VIP’s investments as a whole. The Fund could be subject to additional principal risks because the types of investments it makes can change over time.
There are several risk factors that could hurt the performance of Conservative Allocation VIP, cause you to lose money or cause the performance of the Fund to trail that of other investments. Conservative Allocation VIP’s allocation among the underlying portfolios will change over time, causing corresponding changes in Conservative Allocation VIP’s risk profile.
30
Asset Allocation Risk. Although asset allocation among different asset classes generally limits risk and exposure to any one class, the risk remains that the investment adviser may favor an asset class that performs poorly relative to the other asset classes. For example, deteriorating stock market conditions might cause an overall weakness in the market that reduces the absolute level of stock prices in that market. Under these circumstances, if Conservative Allocation VIP was invested primarily in underlying portfolios that emphasize stocks, it would perform poorly relative to a portfolio invested primarily in bonds. An investment in Income Allocation VIP is subject to the same risk.
Reallocation Risk. From time to time, one or more underlying portfolios may experience relatively large investments or redemptions due to reallocations or rebalancings of the Funds or other funds of funds by the managers. These transactions will affect the underlying portfolios, since underlying portfolios that experience redemptions as a result of reallocations or rebalancings may have to sell securities and underlying portfolios that receive additional cash will have to invest such cash. In addition, a large redemption by a Fund or other funds of funds in a specific underlying portfolio could also hurt the performance of other funds of funds currently invested in the same underlying portfolio. While it is impossible to predict the overall impact of these transactions over time, there could also be adverse effects on a Fund’s performance to the extent that the underlying portfolios may be required to sell securities or invest cash at times when they would otherwise not do so. These transactions could also accelerate the realization of taxable income if sales of securities resulted in gains and could also increase transaction costs for the underlying portfolios. The managers are committed to minimizing such impact on the underlying portfolios to the extent consistent with pursuing the investment objective of the Funds. The managers will at all times monitor the impact on the underlying portfolios of transactions by a Fund. An investment in Income Allocation VIP is subject to the same risk.
Focused Investment Risk. Overall risk can be reduced by industry or geographic diversification, and increased by focusing investments in a limited number of geographic regions or in industries with high positive correlations to one another (e.g., different industries within broad sectors, such as technology or financial services). An underlying portfolio that focuses its investments in the securities of issuers in industries with high positive correlations to one another may be particularly vulnerable to events affecting companies in those industries because the companies may share common characteristics, are often subject to similar business risks and regulatory burdens, and often react similarly to specific economic, market, political or other developments. Similarly, underlying portfolios that invest significant portions of their assets in a narrowly defined geographic region or in a particular foreign country may be particularly vulnerable to events affecting companies located in that region or country because the companies may share common characteristics, are often subject to similar business risks and regulatory burdens, and often react similarly to specific economic, market, political or other developments. An investment in Income Allocation VIP is subject to the same risk.
Credit Risk. An underlying portfolio purchasing bonds faces the risk that the issuer or guarantor of a debt security or the other party to an over-the-counter transaction will be unable or unwilling to make timely payments of interest or principal, or otherwise to honor its obligations. The degree of this risk for a particular security may be reflected in its credit rating. This risk is greater with junk and foreign bonds because of the difficulties of requiring foreign entities, including issuers of sovereign debt, to honor their contractual commitments, and because a number of foreign governments and
31
other foreign issuers are already in default. In addition, because the issuers of high-yield bonds (rated below the fourth highest category) may be in uncertain financial health, the prices of their bonds are generally more vulnerable to bad economic news, or even the expectation of bad news, than those of investment-grade bonds. In some cases, bonds, particularly junk bonds, may decline in credit quality or go into default. An investment in Income Allocation VIP is subject to the same risk.
Interest Rate Risk. Generally, fixed income securities will decrease in value when interest rates rise. The longer the effective maturity of an underlying portfolio’s securities, the more sensitive it will be to interest rate changes. (As a general rule, a 1% rise in interest rates means a 1% fall in value for every year of duration.) As interest rates decline, the issuers of securities held by an underlying portfolio may prepay principal earlier than scheduled, forcing the underlying portfolio to reinvest in lower yielding securities. Prepayment may reduce the underlying portfolio’s income. As interest rates increase, fewer issuers tend to prepay, which may extend the average life of fixed-income securities and have the effect of locking in a below-market interest rate, increasing the underlying portfolio’s effective duration and reducing the value of the security. Because an underlying portfolio may invest in mortgage-related securities, Conservative Allocation VIP is more vulnerable to both of these risks. An investment in Income Allocation VIP is subject to these same interest risks.
Stock Market Risk. An important factor for the underlying portfolios is how stock markets perform. Because a stock represents ownership in its issuer, stock prices can be hurt by poor management, shrinking product demand and other business risks. These may affect single companies as well as groups of companies. In addition, movements in financial markets may adversely affect a stock’s price, regardless of how well the company performs. The market as a whole may not favor the types of investments an underlying portfolio makes, and the underlying portfolio may not be able to get attractive prices for them. An investment in Income Allocation VIP is also subject to this risk to a lesser degree.
Foreign Investment Risk. Foreign investments involve certain special risks, including:
| | • | | Political Risk. Some foreign governments have limited the outflow of profits to investors abroad, imposed restrictions on the exchange or export of foreign currency, extended diplomatic disputes to include trade and financial relations, seized foreign investments and imposed high taxes. |
| | • | | Information Risk. Companies based in foreign markets are usually not subject to accounting, auditing and financial reporting standards and practices as stringent as those in the US. Therefore, their financial reports may present an incomplete, untimely or misleading picture of a foreign company, as compared to the financial reports of US companies. |
| | • | | Liquidity Risk. Investments that trade less can be more difficult or more costly to buy, or to sell, than more liquid or active investments. This liquidity risk is a factor of the trading volume of a particular investment, as well as the size and liquidity of the entire local market. On the whole, foreign exchanges are smaller and less liquid than the US market. This can make buying and selling certain investments more difficult and costly. Relatively small transactions in some instances can have a disproportionately large effect on the price and supply of |
32
| | securities. In certain situations, it may become virtually impossible to sell an investment in an orderly fashion at a price that approaches the managers’ estimate of its value. For the same reason, it may at times be difficult to value an underlying portfolio’s foreign investments. |
| | • | | Regulatory Risk. There is generally less government regulation of foreign markets, companies and securities dealers than in the US. |
| | • | | Currency Risk. An underlying portfolio may invest in securities denominated in foreign currencies. This creates the possibility that changes in exchange rates between foreign currencies and the U.S. dollar will affect the U.S. dollar value of foreign securities or the income or gain received on these securities. |
| | • | | Limited Legal Recourse Risk. Legal remedies for investors may be more limited than the remedies available in the US. |
| | • | | Trading Practice Risk. Brokerage commissions and other fees may be higher for foreign investments than for US investments. The procedures and rules governing foreign transactions and custody may also involve delays in payment, delivery or recovery of money or investments. |
| | • | | Taxes. Foreign withholding and certain other taxes may reduce the amount of income available to distribute to shareholders of the portfolio. In addition, special US tax considerations may apply to the portfolio’s foreign investments. |
An investment in Income Allocation VIP is also subject to these risks to a lesser degree.
Emerging Market Risk. All of the risks of investing in foreign securities, as discussed above, are increased in connection with investments in emerging markets securities. In addition, profound social changes and business practices that depart from norms in developed countries’ economies have hindered the orderly growth of emerging economies and their markets in the past and have caused instability. High levels of debt tend to make emerging economies heavily reliant on foreign capital and vulnerable to capital flight. These countries are also more likely to experience high levels of inflation, deflation or currency devaluation, which could also hurt their economies and securities markets. For these and other reasons, investments in emerging markets are often considered speculative.
Derivatives Risk. Risks associated with derivatives include: the risk that the derivative is not well correlated with the security, index or currency for which it is acting as a substitute; derivatives used for risk management may not have the intended effects and may result in losses or missed opportunities, the risk that Conservative Allocation VIP or an underlying portfolio will be unable to sell the derivative because of an illiquid secondary market; the risk that a counterparty is unwilling or unable to meet its obligation; the risk of interest rate movements; and the risk that the derivatives transaction could expose Conservative Allocation VIP or an underlying portfolio to the effects of leverage, which could increase the Fund’s exposure to the market and magnify potential losses that it could have if it or an underlying portfolio had not entered into these transactions. There is no guarantee that these derivatives activities will be employed or that they will work, and their use could cause lower returns or even losses to Conservative Allocation VIP. An investment in Income Allocation VIP is also subject to this risk.
33
Securities Lending Risk. Any loss in the market price of securities loaned by an underlying portfolio that occurs during the term of the loan would be borne by the underlying portfolio’s performance. Also, there may be delays in recovery of securities loaned or even a loss of rights in the collateral should the borrower of the securities fail financially while the loan is outstanding. However, loans will be made only to borrowers selected by the underlying portfolio’s delegate after a review of relevant facts and circumstances, including the creditworthiness of the borrower. An investment in Income Allocation VIP is also subject to this risk.
Pricing Risk. At times, market conditions might make it hard to value some investments. For example, if the Conservative Allocation VIP or an underlying portfolio has valued its securities too highly, you may end up paying too much for shares when you buy into the Fund. If Conservative Allocation VIP or an underlying portfolio underestimates their price, you may not receive the full market value for your shares when you sell. An investment in Income Allocation VIP is also subject to this risk.
Other factors that could affect performance are:
| | • | | the managers of Conservative Allocation VIP or the underlying portfolios could be incorrect in their analysis of economic trends, countries, industries, companies, the relative attractiveness of asset classes or other matters; and |
| | • | | the underlying portfolios may trade securities more actively than comparable portfolios. Upon the use of the derivatives strategy, Conservative Allocation VIP may also trade derivative instruments more actively than comparable portfolios. Any of these cases could raise transaction costs and thereby lower returns. |
An investment in Income Allocation VIP is also subject to these risks.
Performance Information. The following information provides some indication of the risks of investing in the Funds. The information shown below does not reflect charges and fees associated with the separate accounts that invest in the Funds or any Contract for which the Funds are investment options. If it did, performance would be less than that shown. The bar charts show the performance of each Fund’s Class B shares for the Funds’ most recently completed fiscal year. The table following the charts shows how the performance of each Fund compares to that of two broad-based market indices (which, unlike the Funds, do not have any fees or expenses). The performance of the Funds and the indices varies over time. Of course, a Fund’s past performance is not necessarily an indication of future performance.
Calendar Year Total Returns (%)
Conservative Allocation VIP
| | |
Annual Total Returns (%) as of 12/31 each year | | Class B |
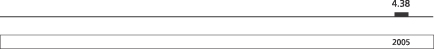
For the periods included in the bar chart:
Best Quarter: 2.28%, Q2, 2005 Worst Quarter: -1.08%, Q1, 2005
2006 Total Return as of June 30: 1.65%
34
Income Allocation VIP
| | |
Annual Total Returns (%) as of 12/31 each year | | Class B |
For the periods included in the bar chart:
Best Quarter: 2.31%, Q2, 2005 Worst Quarter: -0.67%, Q1, 2005
2006 Total Return as of June 30: 0.72%
Average Annual Total Returns
(%) as of 12/31/05
| | | | | | |
| | | Past 1 year
| | | Since inception(1)
| |
Conservative Allocation VIP | | | | | | |
Class B | | 4.38 | % | | 8.09 | % |
Index 1 (Reflects no deductions for fees or expenses) | | 2.43 | % | | 2.75 | % |
Index 2 (Reflects no deductions for fees or expenses) | | 6.27 | % | | 13.33 | % |
| | |
Income Allocation VIP | | | | | | |
Class B | | 3.53 | % | | 6.20 | % |
Index 1 (Reflects no deductions for fees or expenses) | | 2.43 | % | | 2.75 | % |
Index 2 (Reflects no deductions for fees or expenses) | | 6.27 | % | | 13.33 | % |
Index 1: The Lehman Brothers Aggregate Bond Index is an unmanaged market value-weighted measure of treasury issues, corporate bond issues and mortgage securities.
Index 2: The Standard & Poor’s (S&P) 500 Index is a capitalization-weighted index of 500 stocks designed to measure performance of the broad domestic economy through changes in the aggregate market value of 500 stocks representing all major industries.
| (1) | | Since 8/16/04 for both Funds. Index comparisons begin 8/31/04. |
Current performance may be higher or lower than the performance data quoted above. For more recent performance information, call your insurance company or (800) 621-1048 or visit the DWS website at www.dws-scudder.com.
III. OTHER COMPARISONS BETWEEN THE FUNDS
Advisor, Subadvisors and Portfolio Managers. Deutsche Investment Management Americas Inc. (“DeIM”) is the investment advisor for each Fund. Under the supervision of the Board of Trustees of the Trust, DeIM, with headquarters at 345 Park Avenue, New
35
York, New York, 10154, or a subadvisor as identified below, makes each Fund’s investment decisions, buys and sells securities for each Fund and conducts research that leads to these purchase and sale decisions. DeIM, or a subadvisor, also is responsible for selecting brokers and dealers and for negotiating brokerage commissions and dealer charges. DeIM is a part of DeAM and is an indirect wholly-owned subsidiary of Deutsche Bank AG. DeAM, or Deutsche Asset Management, is the marketing name in the United States for the asset management activities of, among others, Deutsche Bank AG, DeIM, Deutsche Asset Management Inc., Deutsche Bank Trust Company Americas and DWS Trust Company. Deutsche Bank AG is a major global banking institution that is engaged in a wide range of financial services, including investment management, mutual fund, retail, private and commercial banking, investment banking and insurance.
DWS Dreman Financial Services VIP
Dreman Value Management, L.L.C. (“DVM”), with headquarters at 520 East Cooper Avenue, Aspen, Colorado 81611, is the subadvisor to Financial Services VIP. DVM manages the Fund’s assets and provides such investment advice, research and assistance as DeIM may, from time to time, reasonably request. For its services, DVM receives from DeIM a monthly fee at an annual rate of the Fund’s average daily net assets.
David Dreman, Founder and Chairman of DVM, is the Lead Portfolio Manager of Financial Services VIP. Mr. Dreman has managed the Fund since 1998. Mr. Dreman has over 48 years of investment industry experience.
F. James Hutchinson, a Managing Director of DVM, is a Portfolio Manager of Financial Services VIP. Mr. Hutchinson has managed the Fund since 2001. Mr. Hutchinson has over 19 years of investment industry experience.
DWS MFS Strategic Value VIP
Massachusetts Financial Services Company (“MFS”), 500 Boylston Street, Boston, Massachusetts 02116, is the subadvisor to Strategic Value VIP. MFS manages the Fund’s assets and provides such investment advice, research and assistance as DeIM may, from time to time, reasonably request. For its services, MFS receives from DeIM a monthly fee at an annual rate of the Fund’s average daily net assets. The Fund’s portfolio management team is comprised of Kenneth J. Enright and Alan T. Langsner.
Mr. Enright is a Senior Vice President of MFS and a Chartered Financial Analyst. Mr. Enright has managed the Fund since 2002 and has been employed in the investment management area of MFS since 1986.
Mr. Langsner is a Vice President MFS. Mr. Langsner has managed the Fund since 2004. Mr. Langsner joined MFS in 1999 as an equity research analyst.
DWS Dreman High Return Equity VIP
Dreman Value Management, L.L.C. (“DVM”), with headquarters at 520 East Cooper Avenue, Aspen, Colorado 81611, is the subadvisor to High Return VIP. DVM manages
36
the Fund’s assets and provides such investment advice, research and assistance as DeIM may, from time to time, reasonably request. For its services, DVM receives from DeIM a monthly fee at an annual rate of the Fund’s average daily net assets.
David Dreman, Founder and Chairman of DVM, is a Co-Lead Portfolio Manager of High Return VIP. Mr. Dreman has managed the Fund since 1998. Mr. Dreman has over 48 years of investment industry experience.
F. James Hutchinson, a Managing Director of DVM, is a Co-Lead Portfolio Manager of High Return VIP. Mr. Hutchinson has managed the Fund since 2002. Mr. Hutchinson has over 19 years of investment industry experience.
DWS Income Allocation VIP
Inna Okounkova, a Director of DeAM, is a Portfolio Manager of Income Allocation VIP. Ms. Okounkova has managed the Fund since 2004. Ms. Okounkova joined DeAM in 1999 as a quantitative analyst.
Robert Wang, a Managing Director of DeAM, is a Portfolio Manager of Income Allocation VIP. Mr. Wang has managed the Fund since 2004. Mr. Wang joined DeAM in 1996 as a senior fixed income portfolio manager after 13 years of experience at J.P. Morgan & Co.
DWS Conservative Allocation VIP
Inna Okounkova, a Director of DeAM, is a Portfolio Manager of Conservative Allocation VIP. Ms. Okounkova has managed the Fund since 2004. Ms. Okounkova joined DeAM in 1999 as a quantitative analyst.
Robert Wang, a Managing Director of DeAM, is a Portfolio Manager of Conservative Allocation VIP. Mr. Wang has managed the Fund since 2004. Mr. Wang joined DeAM in 1996 as a senior fixed income portfolio manager after 13 years of experience at J.P. Morgan & Co.
Distribution and Service Fees. Pursuant to separate Underwriting Agreements, DWS-Scudder Distributors, Inc. (“DWS-SDI”), 222 South Riverside Plaza, Chicago, Illinois 60606, an affiliate of DeIM, is the principal underwriter and distributor for the Class A and Class B shares of all Funds. DWS-SDI acts as agent of each Fund in the continuous offering of shares to the separate accounts of Participating Insurance Companies in all states in which the Funds or the Trust may from time to time be registered or where permitted by applicable law. Each Acquiring Fund has adopted a distribution plan on behalf of its Class B shares in accordance with Rule 12b-1 under the Investment Company Act of 1940, as amended (the “1940 Act”) that is identical to the distribution plan adopted by each Acquired Fund on behalf of its Class B shares. These plans allow the Funds to make payments to DWS-SDI as reimbursement for distribution and shareholder servicing related expenses incurred by DWS-SDI or a Participating Insurance Company. All amounts are payable quarterly and are based on the average daily net assets of each Fund attributable to Class B shares. Because these fees are paid out of the applicable Fund’s assets on an ongoing basis, over time these fees will increase the cost of your investment and may cost you more than other types of investments. Rule 12b-1 plans have not been adopted for Class A shares of the Funds.
37
Trustees and Officers. The following individuals comprise the Board of Trustees of DWS Variable Series II (of which each Fund is a series): John W. Ballantine, Donald L. Dunaway, James R. Edgar, Paul K. Freeman, Robert B. Hoffman, William McClayton, Shirley D. Peterson (Chair) and Robert H. Wadsworth. The officers of the Trust are disclosed in each Fund’s statement of additional information.
Independent Registered Public Accounting Firm Ernst & Young LLP, 200 Clarendon Street, Boston, MA 02116, serves as each Fund’s independent registered public accounting firm. Ernst & Young LLP audits and reports on each Fund’s annual financial statements, reviews certain regulatory reports and each Fund’s federal income tax returns, and performs other professional accounting, auditing, tax and advisory services when engaged to do so by the Funds.
Charter Documents. Each Fund is a series of the Trust, a Massachusetts business trust governed by Massachusetts law. The Funds are governed by an Amended and Restated Declaration of Trust dated January 22, 1987, as amended from time to time (the “Declaration of Trust”). Additional information about the Declaration of Trust is provided below.
Shares. Shares of each Fund entitle their holders to one vote per share, with fractional shares voting proportionally; however, a separate vote will be taken by the applicable Fund or class of shares on matters affecting that particular Fund or class, as determined by the Trustees. For example, a change in a fundamental investment policy for a particular Fund would be voted upon only by shareholders of that Fund, and adoption of a distribution plan relating to a particular class and requiring shareholder approval would be voted upon only by shareholders of that class. Shares of each Fund have noncumulative voting rights with respect to the election of Trustees.
Each Fund’s shares do not have conversion, exchange, preemption or appraisal rights. Shares of each Fund are entitled to dividends (if any) as declared by the Trustees, and if a Fund were liquidated, each class of shares of that Fund would receive the net assets of the Fund attributable to said class. The Funds have the right to redeem, at the then current net asset value, the shares of any shareholder whose account does not exceed a minimum balance designated from time to time by the Trustees. Sale, conveyance or transfer of the assets of a Fund requires the affirmative vote of the shareholders entitled to vote more than 50% of the votes entitled to be cast on the matter.
Shareholder Meetings. The Funds are not required to hold annual meetings of their respective shareholders, but meetings of the shareholders shall be called for the purpose of electing Trustees, when required by the Declaration of Trust or to comply with the 1940 Act. The shareholders may call a shareholder meeting if the Trustees and the President of the Trust fail to call a meeting for thirty days after written application by the holders of at least 25% (or at least 10%, if the purpose of the meeting is to vote to remove a Trustee) of the outstanding shares entitled to vote at such meeting.
Shareholder Liability. Under Massachusetts law, shareholders of a Massachusetts business trust could, under certain circumstances, be held personally liable for the acts or obligations of a Fund. The Declaration of Trust, however, disclaims shareholder liability in connection with the applicable Fund’s property or the acts and obligations of the applicable Fund and requires notice of such disclaimer to be given in each agreement, obligation or instrument entered into or executed by a Fund or its Trustees. Moreover, the Declaration of Trust provides for indemnification out of the property of the applicable Fund for all loss and expense of any shareholder held personally liable by reason of being a shareholder of such Fund, and provides that each Fund may be covered by insurance that the Trustees consider necessary or appropriate.
38
All consideration received by the Trust for the issue or sale of shares of a Fund, together with all assets in which such consideration is invested or reinvested, and all income, earnings, profits and proceeds, including proceeds from sale, exchange or liquidation of assets, are held and accounted for separately from the other assets of the Trust and belong irrevocably to such Fund for all purposes, subject only to the rights of creditors.
DWS Variable Series II (or any series or class thereof) may be terminated by its Trustees without shareholder consent by written notice to shareholders, or by vote of the holders of more than 50% of the votes of the Trust or series or class entitled to vote on the matter. The Declaration of Trust may be amended by the Trustees when authorized by a vote of the shareholders holding more than 50% of the shares of each series entitled to vote or, where the Trustees determine that the amendment will affect the holders of only certain series or classes, a vote of the holders of more than 50% of the shares entitled to vote of each affected series or class. The Declaration of Trust may also be amended by the Trustees without shareholder consent if the purpose of the amendment is to change the name of the Trust or to supply any omission, cure any ambiguity, or cure, correct or supplement any provision which is defective or inconsistent with the 1940 Act or the requirements of the Code.
Voting Powers. The Declaration of Trust governing the Funds expressly provides that a majority of the outstanding securities of a series of the Trust, as defined in the 1940 Act, has the power to vote on whether the Trustees may enter into a contract with an investment advisor or manager for that series (although this is currently required by the 1940 Act for all mutual funds). Except as required by the 1940 Act or as described above, the Trustees of the Trust need not call meetings of the shareholders for the election or reelection of Trustees, or fill vacancies that do not cause the total number of Trustees to fall below three. Such vacancies may be filled by a majority of the standing Trustees or, if deemed appropriate by the Trustees, by a plurality of the shares voted on the matter at a meeting called for such purpose. Any Trustee of the Trust may be removed for cause by a written instrument signed by a majority of the Trustees, or with or without cause by vote of the shareholders entitled to vote more than 50% of the votes entitled to be cast on the matter or by a written consent filed with the custodian of the Trust’s portfolio securities and executed by the shareholders entitled to vote more than 50% of the votes entitled to be cast on the matter.
Quorum for a shareholder meeting of the Trust is the presence in person or by proxy of at least 30% of all the votes entitled to be cast of each series or class entitled to vote, or, where the vote is in the aggregate and not by series or class, at least 30% of all votes entitled to be cast at the meeting, irrespective of series or class.
The foregoing is a very general summary of certain provisions of the Declaration of Trust governing each Fund. It is qualified in its entirety by reference to the charter documents.
IV. INFORMATION ABOUT THE PROPOSED MERGERS
General. The shareholders of each Acquired Fund are being asked to approve a merger between their Acquired Fund and its corresponding Acquiring Fund, each pursuant to an Agreement and Plan of Reorganization between the Acquired Fund and the Acquiring Fund (each an “Agreement”), a form of which is attached to this Prospectus/Proxy Statement as Exhibit A.
39
Each merger is structured as a transfer of all of the assets of an Acquired Fund to its corresponding Acquiring Fund in exchange for the assumption by the Acquiring Fund of all of the liabilities of the corresponding Acquired Fund and for the issuance and delivery to the Acquired Fund of Merger Shares equal in aggregate value to the net value of the assets transferred to the corresponding Acquiring Fund.
After receipt of the Merger Shares, the applicable Acquired Fund will distribute the Merger Shares to its shareholders, in proportion to their existing shareholdings, in complete liquidation of such Fund, and the legal existence of such Fund as a series of the Trust will be terminated. Each shareholder of such Fund will receive a number of full and fractional Merger Shares of the same class(es) as, and equal in value as of the Valuation Time (as defined below on page [ ]) to, the aggregate value of the shareholder’s Acquired Fund shares. Such shares will be held in an account with the corresponding Acquiring Fund identical in all material respects to the account currently maintained by the applicable Acquired Fund. Each Participating Insurance Company will then allocate its Merger Shares on a pro-rata basis among the Contract Owners in the applicable Acquired Fund separate account (or in sub-accounts thereof). Unless a Contract Owner instructs his or her Participating Insurance Company otherwise, amounts that would have been allocated to the applicable Acquired Fund under an existing Contract will, following the merger, be allocated to the corresponding Acquiring Fund.
Prior to the date of the mergers, the applicable Acquired Fund will sell any investments that are not consistent with the current investment objective, policies, restrictions and strategies of the corresponding Acquiring Fund, and declare a distribution that, together with all previous distributions, will have the effect of distributing to shareholders all of its net investment income and net realized capital gains, if any, through the date of the merger. Contract Owners who invest in an Acquired Fund through a variable annuity contract or variable life insurance policy will not be affected by such distributions as long as the Contracts qualify as annuity contracts under Section 72 of the Code and Treasury Regulations thereunder.
The Trustees of the Trust have voted to approve the Agreements and the proposed mergers and to recommend that shareholders also approve the applicable merger. The actions contemplated by each Agreement and the related matters described therein will be consummated only if approved by the affirmative vote of the holders of a majority of the shares of the applicable Acquired Fund.
In the event that a merger does not receive the required shareholder approval, each applicable Acquired Fund and Acquiring Fund will continue to be managed as a separate fund in accordance with its current investment objective and policies, and the Trustees of the Trust may consider such alternatives as may be in the best interests of each Fund.
Background and Trustees’ Considerations Relating to the Proposed Mergers. DeAM first discussed each merger with the Trustees in December 2005 as a part of an ongoing program initiated by DeAM to restructure its mutual fund lineup. DeAM advised the Trustees that the program is intended to restructure its product line to match its distribution focus in the future and eliminate funds that have little opportunity for growth and that add unnecessary complexity and inefficiency to its business.
40
In particular, DeAM advised the Trustees that it is exiting the proprietary variable insurance products business (DeAM’s proprietary variable insurance products business involved relationships DeAM developed with select insurance companies to provide “Scudder” branded variable insurance products using certain DWS funds, including DWS Variable Series II, and certain non-DWS funds as underlying investments). Accordingly, DeAM would like to eliminate a significant number of the subadvised portfolios of the Trust. In addition, DeAM would like to eliminate those portfolios with little opportunity for growth. Because DeAM no longer wishes to manage or support the Acquired Funds in their current form, DeAM proposed to the Trustees the merging of each Acquired Fund with an Acquiring Fund that DeAM believes is similar from an investment objective standpoint.
The Trustees conducted a thorough review of the potential implications of each merger. They were assisted in this review by their independent legal counsel. The Trustees met on several occasions to review and discuss the mergers, both among themselves and with representatives of DeAM. In the course of their review, the Trustees requested and received substantial additional information.
On May 10, 2006, the Trustees of the Trust, all of whom are not “interested persons” (as defined by the 1940 Act) (“Disinterested Trustees”), approved the terms of each merger. The Trustees have also agreed to recommend that the mergers be approved by the Acquired Funds’ shareholders.
In determining to recommend that the shareholders of each Acquired Fund approve its merger, the Trustees considered the factors described below:
| | • | | That DeAM is exiting the proprietary variable insurance product business and/or would like to eliminate portfolios with little opportunity for growth, and in any event no longer wishes to manage or support the Acquired Fund; |
| | • | | Various alternatives to each proposed merger (e.g., liquidation of the Acquired Fund); |
| | • | | That DeAM recommended the merger of the Acquired Fund into the Acquiring Fund based on its belief that such Acquiring Fund has a similar investment objective and strategy to the Acquired Fund, relative to other DWS funds; |
| | • | | That the merger would provide a continuity of investment within the DWS fund family for shareholders of the Acquired Fund; and |
| | • | | With respect to Financial Services VIP, the proposed merger would address the Fund’s long-term relative underperformance. |
In addition, the Trustees considered the following factors, among others, in determining to recommend that the shareholders of each Acquired Fund approve its merger:
| | • | | The Trustees noted that DeAM would bear all expenses associated with each merger, including but not limited to transaction costs associated with any related repositioning of a Fund’s portfolio. |
| | • | | The Trustees noted that the estimated operating expense ratios of each combined fund are expected to be the same as or lower than the corresponding Acquired |
41
| | Fund. The Trustees also considered DeAM’s commitment to cap each combined fund’s operating expenses for approximately a three year period at levels that are the same or lower compared to each Acquired Fund’s current operating expense ratios. The Trustees noted the possible economies of scale that might be realized by DeAM in connection with each merger. |
| | • | | The Trustees concluded that no merger would result in the dilution of shareholder interests and that the terms and conditions were fair and reasonable and consistent with industry practice. |
| | • | | The Trustees noted that the services available to shareholders of each class of each Acquiring Fund were substantially identical to those available to shareholders of the corresponding class of each Acquired Fund. |
| | • | | DeIM has agreed to indemnify each Acquiring Fund against certain liabilities it may incur in connection with any litigation or regulatory action related to possible improper market timing or possible improper marketing and sales activity in the corresponding Acquired Fund (see Section VI) so that the likelihood that a combined fund would suffer any loss is considered by Fund management to be remote. |
| | • | | DeAM has agreed to indemnify the Trustees of the Acquired Fund against certain liabilities that the Trustees may incur by reason of having served as a Trustee of the Acquired Fund. |
Based on all of the foregoing, the Trustees concluded that each Acquired Fund’s participation in its proposed merger would be in the best interests of such Acquired Fund and would not dilute the interests of such Acquired Fund’s existing shareholders. The Trustees, all of whom are Disinterested Trustees, unanimously recommend that shareholders of each Acquired Fund approve its merger.
Agreement and Plan of Reorganization. Each proposed merger will be governed by a separate Agreement, a form of which is attached as Exhibit A. Each Agreement provides that each Acquiring Fund will acquire all of the assets of the corresponding Acquired Fund solely in exchange for the assumption by each Acquiring Fund of all liabilities of the corresponding Acquired Fund and for the issuance of Merger Shares equal in value to the value of the transferred assets net of assumed liabilities. The Merger Shares will be issued on the next full business day (the “Exchange Date”) following the time as of which the Funds’ shares are valued for determining net asset value for each merger (4:00 p.m. Eastern time on September 15, 2006, or such other date and time as may be agreed upon by the parties (the “Valuation Time”)). The following discussion of each Agreement is qualified in its entirety by the full text of the Agreement.
Each Acquired Fund will transfer all of its assets to the corresponding Acquiring Fund, and in exchange, such Acquiring Fund will assume all liabilities of the corresponding Acquired Fund and deliver to such Acquired Fund a number of full and fractional Merger Shares of each class having an aggregate net asset value equal to the value of the assets of such Acquired Fund attributable to shares of the corresponding class of the Acquired Fund, less the value of the liabilities of such Acquired Fund assumed by the corresponding Acquiring Fund attributable to shares of such class of the corresponding Acquired Fund. Immediately following the transfer of assets on the
42
Exchange Date, each Acquired Fund will distribute pro rata to its shareholders of record as of the Valuation Time the full and fractional Merger Shares received by such Acquired Fund, with Merger Shares of each class being distributed to holders of shares of the corresponding class of such Acquired Fund. As a result of each proposed merger, each shareholder of an Acquired Fund will receive a number of Merger Shares of each class equal in aggregate value at the Valuation Time to the value of such Acquired Fund shares of the corresponding class surrendered by the shareholder. This distribution will be accomplished by the establishment of accounts on the share records of each Acquiring Fund in the name of the corresponding Acquired Fund shareholders, each account representing the respective number of full and fractional Merger Shares of each class due to the respective shareholder. New certificates for Merger Shares will not be issued.
The Trustees of the Trust have determined that each proposed merger is in the best interests of that Fund and that the interests of each Fund’s shareholders will not be diluted as a result of the transactions contemplated by the applicable Agreement.
The consummation of each merger is subject to the conditions set forth in the applicable Agreement. Each Agreement may be terminated and a merger abandoned (i) by mutual consent of the Acquiring Fund and the corresponding Acquired Fund, (ii) by either party if the merger shall not be consummated by November 16, 2006 or (iii) if any condition set forth in the Agreement has not been fulfilled and has not been waived by the party entitled to its benefits, by such party.
If shareholders of an Acquired Fund approve its merger, both Funds agree to coordinate their respective portfolios from the date of the Agreement up to and including the Exchange Date in order that, when the assets of the Acquired Fund are added to the portfolio of the corresponding Acquiring Fund, the resulting portfolio will meet the investment objective, policies, restrictions and strategies of such Acquiring Fund. DeAM has estimated that approximately 62%, 89% and 19% of the portfolios of Financial Services VIP, Strategic Value VIP and Income Allocation VIP, respectively, will be liquidated prior to each merger. Proceeds from the liquidations will be used to acquire securities consistent with the corresponding Acquiring Fund’s investment objective, policies, restrictions and strategies.
All fees and expenses, including legal and accounting expenses, portfolio transfer taxes (if any), trading costs and any other expenses incurred in connection with the consummation of each merger and related transactions contemplated by the Agreement, will be borne by DeAM.
Description of the Merger Shares. Merger Shares will be issued to each Acquired Fund’s shareholders in accordance with the Agreement as described above. The Merger Shares will be Class A shares, as applicable, and Class B shares of the corresponding Acquiring Fund. Each class of Merger Shares has the same characteristics as shares of the corresponding class of the corresponding Acquired Fund. Merger Shares will be treated as having been purchased on the same date and for the same price as the corresponding Acquired Fund shares for which they were exchanged. For more information on the characteristics of each class of Merger Shares, please see the applicable Acquiring Fund prospectus, a copy of which is included with this Prospectus/Proxy Statement.
43
Certain Federal Income Tax Consequences. As a condition to each Fund’s obligation to consummate the mergers, each Fund will receive a tax opinion from Willkie Farr & Gallagher LLP, special tax counsel, (which opinion would be based on certain factual representations and certain customary assumptions), to the effect that, on the basis of the existing provisions of the US. Internal Revenue Code of 1986, as amended (the “Code”), current administrative rules and court decisions, for federal income tax purposes:
| | (i) | | the acquisition by each Acquiring Fund of all of the assets of the corresponding Acquired Fund solely in exchange for Merger Shares and the assumption by each Acquiring Fund of all of the corresponding Acquired Fund’s liabilities, followed by the distribution by such Acquired Fund to its shareholders of Merger Shares in complete liquidation of such Acquired Fund, all pursuant to the Agreement, constitutes a reorganization within the meaning of Section 368(a) of the Code, and each Acquiring Fund and the corresponding Acquired Fund will each be a “party to a reorganization” within the meaning of Section 368(b) of the Code; |
| | (ii) | | under Section 361 of the Code, no gain or loss will be recognized by an Acquired Fund upon the transfer of such Acquired Fund’s assets to the corresponding Acquiring Fund in exchange for Merger Shares and the assumption of the Acquired Fund liabilities by the corresponding Acquiring Fund, or upon the distribution of the Merger Shares to the Acquired Fund’s shareholders in liquidation of such Acquired Fund; |
| | (iii) | | under Section 354 of the Code, no gain or loss will be recognized by shareholders of an Acquired Fund on the receipt of Merger Shares solely in exchange for shares of such Acquired Fund; |
| | (iv) | | under Section 358 of the Code, the aggregate basis of the Merger Shares received by each Acquired Fund shareholder will be the same as the aggregate basis of such Acquired Fund shares exchanged therefor; |
| | (v) | | under Section 1223(1) of the Code, the holding periods of the Merger Shares received by each shareholder of an Acquired Fund will include the holding periods of such Acquired Fund shares exchanged therefor, provided that at the time of the reorganization such Acquired Fund shares are held by such shareholders as a capital asset; |
| | (vi) | | under Section 1032 of the Code, an Acquiring Fund will not recognize gain or loss upon the receipt of assets of the corresponding Acquired Fund in exchange for Merger Shares and the assumption by such Acquiring Fund of all of the liabilities of the corresponding Acquired Fund; |
| | (vii) | | under Section 362(b) of the Code, the basis of the assets of such Acquired Fund transferred to the corresponding Acquiring Fund in the reorganization will be the same in the hands of such Acquiring Fund as the basis of such assets in the hands of the Acquired Fund immediately prior to the transfer; and |
| | (viii) | | under Section 1223(2) of the Code, the holding periods in the hands of an Acquiring Fund of the assets of the corresponding Acquired Fund transferred to such Acquiring Fund will include the periods during which such assets were held by the corresponding Acquired Fund. |
44
As long as the Contracts qualify as annuity contracts under Section 72 of the Code, and Treasury Regulations thereunder, each merger, whether or not treated as a tax-free reorganization, will not create any federal income tax liability for Contract Owners. Contract Owners who choose to redeem or exchange their investments by surrendering their Contracts or initiating a partial withdrawal, however, may be subject to taxes and a 10% tax penalty.
This description of the federal income tax consequences of each merger is made without regard to the particular facts and circumstances of any shareholder or Contract Owner. Shareholders and Contract Owners are urged to consult their own tax advisors as to the specific consequences to them of each merger, including the applicability and effect of state, local, non-US and other tax laws.
If each Agreement is approved by the applicable Acquired Fund’s shareholders, such Acquired Fund will pay its shareholders a distribution of all undistributed net investment income and undistributed realized net capital gains (after reduction by any capital loss carryforwards) immediately prior to the Closing (as defined in the Agreement). Additional distributions may be made if necessary. All distributions, including dividends and capital gains distributions, will be reinvested in additional shares of the corresponding Acquiring Fund unless an election is made on behalf of a separate account to receive dividends and capital gains distributions in cash.
45
Capitalization. The following table shows the audited capitalization of each Fund as of December 31, 2005 and of each Acquiring Fund on a pro forma unaudited combined basis, giving effect to each proposed acquisition of assets at net asset value as of that date:
DWS DREMAN FINANCIAL SERVICES VIP—DWS DREMAN HIGH RETURN EQUITY VIP
DWS MFS STRATEGIC VALUE VIP—DWS DREMAN HIGH RETURN EQUITY VIP
| | | | | | | | | | | | | | | | | | | | | | |
| | | Financial
Services VIP
| | Strategic
Value VIP
| | High Return
VIP
| | Pro Forma
Adjustments
| | | High
Return VIP—
Pro Forma
Combined
(assuming
consummation of Financial
Services VIP—
High Return VIP only)
| | High
Return VIP—
Pro Forma
Combined
(assuming
consummation of Strategic
Value VIP—
High Return
VIP merger
only)
| | High
Return VIP—
Pro Forma
Combined
(assuming
consummation of Financial
Services VIP
merger and
Strategic Value
VIP merger into High
Return VIP)
|
Net Assets | | | | | | | | | | | | | | | | | | | | | | |
Class A Shares | | $ | 120,027,544 | | $ | 28,109,386 | | $ | 785,304,208 | | $ | (28,109,386 | ) | | $ | 905,331,752 | | | | | | |
| | | $ | 120,027,544 | | $ | 28,109,386 | | $ | 785,304,208 | | $ | (120,027,544 | ) | | | | | $ | 813,413,594 | | | |
| | | $ | 120,027,544 | | $ | 28,109,386 | | $ | 785,304,208 | | | — | | | | | | | | | $ | 933,441,138 |
Class B Shares | | $ | 17,789,984 | | $ | 32,963,851 | | $ | 135,313,286 | | $ | (32,963,851 | ) | | $ | 153,103,270 | | | | | | |
| | | $ | 17,789,984 | | $ | 32,963,851 | | $ | 135,313,286 | | $ | (17,789,984 | ) | | | | | $ | 168,277,137 | | | |
| | | $ | 17,789,984 | | $ | 32,963,851 | | $ | 135,313,286 | | | — | | | | | | | | | $ | 186,067,121 |
| | |
|
| |
|
| |
|
| |
|
|
| |
|
| |
|
| |
|
|
Total Net Assets | | $ | 137,817,528 | | $ | 61,073,237 | | $ | 920,617,494 | | | — | | | $ | 1,058,435,022 | | $ | 981,690,731 | | $ | 1,119,508,259 |
| | |
|
| |
|
| |
|
| |
|
|
| |
|
| |
|
| |
|
|
Shares Outstanding | | | | | | | | | | | | | | | | | | | | | | |
Class A Shares | | | 9,007,093 | | | 2,624,466 | | | 58,564,793 | | | (56,493 | ) | | | 67,515,393 | | | | | | |
| | | | 9,007,093 | | | 2,624,466 | | | 58,564,793 | | | (528,315 | ) | | | | | | 60,660,994 | | | |
| | | | 9,007,093 | | | 2,624,466 | | | 58,564,793 | | | (584,808 | ) | | | | | | | | | 69,611,544 |
Class B Shares | | | 1,337,909 | | | 3,070,582 | | | 10,109,241 | | | (9,307 | ) | | | 11,437,843 | | | | | | |
| | | | 1,337,909 | | | 3,070,582 | | | 10,109,241 | | | (608,756 | ) | | | | | | 12,571,067 | | | |
| | | | 1,337,909 | | | 3,070,582 | | | 10,109,241 | | | (618,063 | ) | | | | | | | | | 13,829,669 |
Net Asset Value Per Share | | | | | | | | | | | | | | | | | | | | | | |
Class A Shares | | $ | 13.33 | | $ | 10.71 | | $ | 13.41 | | | | | | $ | 13.41 | | | | | | |
| | | $ | 13.33 | | $ | 10.71 | | $ | 13.41 | | | | | | | | | $ | 13.41 | | | |
| | | $ | 13.33 | | $ | 10.71 | | $ | 13.41 | | | | | | | | | | | | $ | 13.41 |
Class B Shares | | $ | 13.30 | | $ | 10.74 | | $ | 13.39 | | | | | | $ | 13.39 | | | | | | |
| | | $ | 13.30 | | $ | 10.74 | | $ | 13.39 | | | | | | | | | $ | 13.39 | | | |
| | | $ | 13.30 | | $ | 10.74 | | $ | 13.39 | | | | | | | | | | | | $ | 13.39 |
46
DWS INCOME ALLOCATION VIP—DWS CONSERVATIVE ALLOCATION VIP
| | | | | | | | | | | | |
| | | Income
Allocation VIP
| | Conservative
Allocation VIP
| | Pro Forma
Adjustments
| | | Conservative
Allocation VIP—
Pro Forma
Combined
(assuming
consummation
of the merger)
|
Net Assets | | | | | | | | | | | | |
Class B Shares | | $ | 12,293,419 | | $ | 46,071,582 | | — | | | $ | 58,365,001 |
| | |
|
| |
|
| |
|
| |
|
|
Total Net Assets | | $ | 12,293,419 | | $ | 46,071,582 | | — | | | $ | 58,365,001 |
| | |
|
| |
|
| |
|
| |
|
|
Shares Outstanding | | | | | | | | | | | | |
Class B Shares | | | 1,133,437 | | | 4,149,791 | | (25,992 | ) | | | 5,257,306 |
Net Asset Value Per Share | | | | | | | | | | | | |
Class B Shares | | $ | 10.85 | | $ | 11.10 | | — | | | $ | 11.10 |
Unaudited pro forma combined financial statements of the Funds as of December 31, 2005 and for the twelve-month period then ended, are included in the Merger SAI. Because each Agreement provides that each Acquiring Fund will be the surviving fund following the mergers, and because each Acquiring Fund’s investment objective and policies will remain unchanged, the pro forma combined financial statements reflect the transfer of the assets and liabilities of an Acquired Fund to the corresponding Acquiring Fund as contemplated by the Agreement.
The Trustees of the Trust, all of whom are Disinterested Trustees, unanimously recommend approval of each merger.
V. INFORMATION ABOUT VOTING AND THE JOINT
SPECIAL SHAREHOLDER MEETING
General. This Prospectus/Proxy Statement is furnished in connection with the proposed mergers and the solicitation of proxies by and on behalf of the Trustees of the Trust for use at the Joint Special Meeting of the Acquired Funds’ shareholders (the “Meeting”). The Meeting is to be held on August 24, 2006 at 4:00 p.m. Eastern time, at the offices of DeIM, 345 Park Avenue, 27th Floor, New York, New York 10154, or at such later time as is made necessary by adjournment. The Notice of the Joint Special Meeting of Shareholders, the combined Prospectus/Proxy Statement and the enclosed form of proxy or voting instruction form are being mailed to investors on or about [mailing date].
As of June 13, 2006, each Acquired Fund had the following shares outstanding:
| | | | |
Fund
| | Share Class
| | Number of Shares
|
| Financial Services VIP | | Class A | | 8,430,481.66 |
| | | Class B | | 1,309,008.53 |
| | | | |
Fund
| | Share Class
| | Number of Shares
|
| Strategic Value VIP | | Class A | | 2,578,273.98 |
| | | Class B | | 2,795,053.56 |
47
| | | | |
Fund
| | Share Class
| | Number of Shares
|
| Income Allocation VIP | | Class B | | 1,165,192.54 |
Only shareholders of record on June 13, 2006 will be entitled to notice of and to vote at the Meeting. With respect to each merger, each share is entitled to one vote, with fractional shares voting proportionally.
The Trustees of the Trust know of no matters other than those set forth herein to be brought before the Meeting. If, however, any other matters properly come before the Meeting, it is the Trustees’ intention that proxies will be voted on such matters in accordance with the judgment of the persons named in the proxy.
Required Vote. Proxies are being solicited from each Acquired Fund’s shareholders by the Trust’s Trustees for the Meeting. Unless revoked, all valid proxies will be voted in accordance with the specification thereon or, in the absence of specification, FOR approval of the applicable Agreement. With respect to each merger, the transactions contemplated by the Agreement will be consummated only if approved by the affirmative vote of the shareholders of the applicable Acquired Fund entitled to vote more than 50% of the votes entitled to be cast on the matter.
Record Date, Quorum and Method of Tabulation. Shareholders of record of an Acquired Fund at the close of business on June 13, 2006 (the “Record Date”) will be entitled to vote with respect to their merger at the Meeting or any adjournment thereof. The holders of at least 30% of the shares of an Acquired Fund outstanding at the close of business on the Record Date present in person or represented by proxy will constitute a quorum with respect to such Acquired Fund’s merger at the Meeting.
Votes cast by proxy or in person at the Meeting will be counted by persons appointed by the applicable Acquired Fund as tellers for the Meeting. The tellers will count the total number of votes cast “FOR” approval of each proposal for purposes of determining whether sufficient affirmative votes have been cast. The tellers will count shares represented by proxies that reflect abstentions as shares that are present and entitled to vote on the matter for purposes of determining the presence of a quorum, but will have the effect of a negative vote on the proposal. Shares attributable to amounts retained by each Participating Insurance Company will be voted in the same proportion as voting instructions received from Contract Owners. Accordingly, there are not expected to be any “broker non-votes.”
Share Ownership. As of June 13, 2006, the officers of and Trustees of the Trust, as a group, beneficially owned less than 1% of the outstanding shares of such Fund.
To the best of the knowledge of Financial Services VIP, the following shareholders owned of record or beneficially 5% or more of the outstanding shares of any class of Financial Services VIP as of June 13, 2006:
| | | | |
Class
| | Shareholder Name and Address
| | Percentage Owned
|
A | | ZURICH DESTINATIONS FARMERS SVSII C/O KILICO ATTN INVESTMENT ACCOUNTING LL-2W PO BOX 19097 GREENVILLE SC 29602-9097 | | 59.92% |
48
| | | | |
Class
| | Shareholder Name and Address
| | Percentage Owned
|
| | | ALLMERICA LIFE SVSII 440 LINCOLN ST WORCESTER MA 01653-0002 | | 37.53% |
| | |
B | | THE MANUFACTURES LIFE INS CO (USA) 500 BOYLSTON ST STE 400 BOSTON MA 02116-3787 | | 73.05% |
| | |
| | | METLIFE INSURANCE CO OF CT ATTN SHAREHOLDER ACCOUNTING DEPT PO BOX 990027 HARTFORD CT 06199-0027 | | 15.22% |
| | |
| | | METLIFE LIFE & ANNUITY CO OF CT ATTN SHAREHOLDER ACCOUNTING DEPT 1 CITYPLACE HARTFORD CT 06103-3415 | | 11.40% |
To the best of the knowledge of Strategic Value VIP, the following shareholders owned of record or beneficially 5% or more of the outstanding shares of any class of Strategic Value VIP as of June 13, 2006:
| | | | | |
Class
| | Shareholder Name and Address
| | Percentage Owned
| |
A | | STATE STREET BANK & TR CUST FBO SVSII SCUD GROWTH STRAT PORT ATTN MARYLOU MCPHEE ADAMS BLDG 2 NORTH JPB2N 1776 HERITAGE DR NORTH QUINCY MA 02171-2119 | | 38.54 | % |
| | |
| | | STATE STREET BANK & TR CUST FBO SVSII SCUD GRWTH & INC STRAT PORT ATTN MARYLOU MCPHEE ADAMS BLDG 2 NORTH JPB2N 1776 HERITAGE DR NORTH QUINCY MA 02171-2119 | | 25.11 | % |
| | |
| | | ALLMERICA LIFE SVSII 440 LINCOLN ST WORCESTER MA 01653-0002 | | 19.34 | % |
| | |
| | | SSC INVESTMENT CORP ATTN V RAMTAKAH 345 PARK AVE FL 26 NEW YORK NY 10154-0004 | | 10.96 | % |
49
| | | | | |
Class
| | Shareholder Name and Address
| | Percentage Owned
| |
B | | THE MANUFACTURES LIFE INS CO (USA) 500 BOYLSTON ST STE 400 BOSTON MA 02116-3787 | | 86.83 | % |
| | |
| | | METLIFE INSURANCE CO OF CT ATTN SHAREHOLDER ACCOUNTING DEPT PO BOX 990027 HARTFORD CT 06199-0027 | | 7.08 | % |
| | |
| | | METLIFE LIFE & ANNUITY CO OF CT ATTN SHAREHOLDER ACCOUNTING DEPT 1 CITYPLACE HARTFORD CT 06103-3415 | | 5.98 | % |
To the best of the knowledge of High Return VIP, the following shareholders owned of record or beneficially 5% or more of the outstanding shares of any class of High Return VIP as of June 13, 2006:
| | | | |
Class
| | Shareholder Name and Address
| | Percentage Owned
|
A | | ZURICH DESTINATIONS FARMERS SVSII C/O KILICO ATTN INVESTMENT ACCOUNTING LL-2W PO BOX 19097 GREENVILLE SC 29602-9097 | | 67.83% |
| | |
| | | ALLMERICA LIFE SVSII 440 LINCOLN ST WORCESTER MA 01653-0002 | | 24.94% |
| | |
B | | THE MANUFACTURES LIFE INS CO (USA) 500 BOYLSTON ST STE 400 BOSTON MA 02116-3787 | | 79.63% |
| | |
| | | METLIFE INSURANCE CO OF CT ATTN SHAREHOLDER ACCOUNTING DEPT PO BOX 990027 HARTFORD CT 06199-0027 | | 10.21% |
| | |
| | | METLIFE LIFE & ANNUITY CO OF CT ATTN SHAREHOLDER ACCOUNTING DEPT 1 CITYPLACE HARTFORD CT 06103-3415 | | 8.20% |
50
To the best of the knowledge of Income Allocation VIP, the following shareholders owned of record or beneficially 5% or more of the outstanding Class B shares of Income Allocation VIP as of June 13, 2006:
| | | | |
Class
| | Shareholder Name and Address
| | Percentage Owned
|
B | | THE MANUFACTURES LIFE INS CO (USA) 500 BOYLSTON ST STE 400 BOSTON MA 02116-3787 | | 65.04% |
| | |
| | | METLIFE INSURANCE CO OF CT ATTN SHAREHOLDER ACCOUNTING DEPT PO BOX 990027 HARTFORD CT 06199-0027 | | 23.97% |
| | |
| | | METLIFE LIFE & ANNUITY CO OF CT ATTN SHAREHOLDER ACCOUNTING DEPT 1 CITYPLACE HARTFORD CT 06103-3415 | | 10.99% |
To the best of the knowledge of Conservative Allocation VIP, the following shareholders owned of record or beneficially 5% or more of the outstanding Class B shares of Conservative Allocation VIP as of June 13, 2006:
| | | | |
Class
| | Shareholder Name and Address
| | Percentage Owned
|
B | | THE MANUFACTURES LIFE INS CO (USA) 500 BOYLSTON ST STE 400 BOSTON MA 02116-3787 | | 72.26% |
| | |
| | | METLIFE INSURANCE CO OF CT ATTN SHAREHOLDER ACCOUNTING DEPT PO BOX 990027 HARTFORD CT 06199-0027 | �� | 16.52% |
| | |
| | | METLIFE LIFE & ANNUITY CO OF CT ATTN SHAREHOLDER ACCOUNTING DEPT 1 CITYPLACE HARTFORD CT 06103-3415 | | 11.22% |
Solicitation of Proxies. As discussed above, shares of the Acquired Funds are offered only to Participating Insurance Companies to fund benefits under their Contracts. Accordingly, as of the close of business on [recent date], shares of the Acquired Funds were held by separate accounts, or sub-accounts thereof, of various Participating Insurance Companies. These shares are owned by the Participating Insurance Companies as depositors for their respective Contracts issued to individual
51
Contract Owners or to a group (e.g., a defined benefit plan) in which Contract Owners participate. Contract Owners have the right to instruct the Participating Insurance Companies on how to vote the shares related to their interests through their Contracts (i.e., pass-through voting). A Participating Insurance Company must vote the shares of an Acquired Fund held in its name as directed. In the absence of voting directions on any voting instruction form that is signed and returned, the Participating Insurance Company will vote the interest represented thereby in favor of the proposal. If a Participating Insurance Company does not receive voting instructions for all of the shares of an Acquired Fund held under the Contracts, it will vote all of the shares in the relevant separate accounts with respect to the proposal, for, against, or abstaining, in the same proportion as the shares of such Fund for which it has received instructions from Contract Owners (i.e., echo voting). This Prospectus/Proxy Statement is used to solicit voting instructions from Contract Owners, as well as to solicit proxies from the Participating Insurance Companies and the actual shareholders of the Acquired Funds. All persons entitled to direct the voting of shares, whether or not they are shareholders, are described as voting for purposes of this Prospectus/Proxy Statement.
In addition to soliciting proxies by mail, certain officers and representatives of the Acquired Funds, officers and employees of DeAM and certain financial services firms and their representatives, who will receive no extra compensation for their services, may solicit proxies by telephone, by telegram or personally.
All properly executed proxies received in time for the Meeting will be voted with respect to the applicable proposal as specified in the proxy or, if no specification is made, in favor of such proposal.
Computershare Fund Services, Inc. (“Computershare”) has been engaged to act as information agent at an estimated cost of $3,500 per Acquired Fund. As the Meeting date approaches, certain shareholders of the Acquired Funds may receive a telephone call from a representative of Computershare if their votes have not yet been received. Authorization to permit Computershare to execute proxies may be obtained by telephonically or electronically transmitted instructions from shareholders of an Acquired Fund. Proxies that are obtained telephonically or through the Internet will be recorded in accordance with the procedures described below. The Trustees believe that these procedures are reasonably designed to ensure that both the identity of the shareholder casting the vote and the voting instructions of the shareholder are accurately determined.
In all cases where a telephonic proxy is solicited, the Computershare representative is required to ask for each shareholder’s full name and address, or zip code, or both, and to confirm that the shareholder has received the proxy materials in the mail. If the shareholder is a corporation or other entity, the Computershare representative is required to ask for the person’s title and confirmation that the person is authorized to direct the voting of the shares. If the information solicited agrees with the information provided to Computershare, then the Computershare representative has the responsibility to explain the process, read the proposal on the proxy card, and ask for the shareholder’s instructions on the proposal. Although the Computershare representative is permitted to answer questions about the process, he or she is not permitted to recommend to the shareholder how to vote, other than to read any recommendation set forth in this Prospectus/Proxy Statement. Computershare will record the shareholder’s instructions on the card. Within 72 hours, the shareholder will
52
be sent a letter or mailgram to confirm his or her vote and asking the shareholder to call Computershare immediately if his or her instructions are not correctly reflected in the confirmation.
Please see the instructions on your voting instruction or proxy card for telephone touch-tone voting and Internet voting. Shareholders will have an opportunity to review their voting instructions and make any necessary changes before submitting their voting instructions and terminating their telephone call or Internet link. Shareholders who vote through the Internet, in addition to confirming their voting instructions prior to submission, will also receive an e-mail confirming their instructions upon request.
If a shareholder wishes to participate in the Meeting, but does not wish to give a proxy by telephone or electronically, the shareholder may still submit the proxy card originally sent with the Prospectus/Proxy Statement or attend in person. Should shareholders require additional information regarding the proxy or replacement proxy card, they may contact Computershare toll-free at 1-866-390-5113. Any proxy given by a shareholder is revocable until voted at the Meeting.
Persons holding shares as nominees will, upon request, be reimbursed for their reasonable expenses in soliciting instructions from their principals. The cost of preparing, printing and mailing the enclosed proxy card and/or voting instruction form and Prospectus/Proxy Statement, and all other costs incurred in connection with the solicitation of proxies for each Acquired Fund, including any additional solicitation made by letter, telephone or telegraph, will be paid by DeAM.
Revocation of Voting Instructions. Proxies, including proxies given by telephone or over the Internet, may be revoked at any time before they are voted either (i) by a written revocation received by the Secretary of the Trust at Two International Place, Boston, MA 02110, (ii) by properly executing a later-dated proxy that is received by the Fund at or prior to the Meeting or (iii) by attending the Meeting and voting in person. Merely attending the Meeting without voting, however, will not revoke a previously submitted proxy. Only a shareholder may execute or revoke a proxy. Contract Owners should consult their Participating Insurance Company regarding their ability to revoke voting instructions after such instructions have been provided to the Participating Insurance Company.
Adjournment. If sufficient votes in favor of the proposal set forth in the Notice of the Joint Special Meeting of Shareholders are not received by the time scheduled for the Meeting, the persons named as proxies may propose adjournments of the Meeting for a reasonable time after the date set for the original meeting to permit further solicitation of proxies.
VI. REGULATORY AND LITIGATION MATTERS
Market Timing Related Regulatory and Litigation Matters. Since at least July 2003, federal, state and industry regulators have been conducting ongoing inquiries and investigations (“inquiries”) into the mutual fund industry, and have requested information from numerous mutual fund companies, including DWS Scudder. The DWS funds’ advisors have been cooperating in connection with these inquiries and are in
53
discussions with the regulators concerning proposed settlements. Publicity about mutual fund practices arising from these industry wide inquiries serves as the general basis of a number of private lawsuits against the DWS funds. These lawsuits, which previously have been reported in the press, involve purported class action and derivative lawsuits, making various allegations and naming as defendants various persons, including certain DWS funds, the funds’ investment advisors and their affiliates, and certain individuals, including in some cases fund Trustees/Directors, officers, and other parties. Each DWS fund’s investment advisor has agreed to indemnify the applicable DWS funds in connection with these lawsuits regarding market timing, revenue sharing, fund valuation or other subjects arising from or related to the pending inquiries. It is not possible to determine with certainty what the outcome of these inquiries will be or what the effect, if any, would be on the funds or their advisors.
With respect to the lawsuits, based on currently available information, the funds’ investment advisors believe the likelihood that the pending lawsuits will have a material adverse financial impact on a DWS fund is remote and such actions are not likely to materially affect their ability to perform under their investment management agreements with the DWS funds.
With respect to the regulatory matters, Deutsche Asset Management (“DeAM”) has advised the funds as follows:
DeAM expects to reach final agreements with regulators in 2006 regarding allegations of improper trading in the DWS funds. DeAM expects that it will reach settlement agreements with the Securities and Exchange Commission, the New York Attorney General and the Illinois Secretary of State providing for payment of disgorgement, penalties, and investor education contributions totaling approximately $134 million. Approximately $127 million of this amount would be distributed to shareholders of the affected DWS funds in accordance with a distribution plan to be developed by an independent distribution consultant. DeAM does not believe that any of the DWS funds will be named as respondents or defendants in any proceedings. The funds’ investment advisors do not believe these amounts will have a material adverse financial impact on them or materially affect their ability to perform under their investment management agreements with the DWS funds. The above-described amounts are not material to Deutsche Bank, and they have already been reserved.
Based on the settlement discussions thus far, DeAM believes that it will be able to reach a settlement with the regulators on a basis that is generally consistent with settlements reached by other advisors, taking into account the particular facts and circumstances of market timing at DeAM and at the legacy Scudder and Kemper organizations prior to their acquisition by DeAM in April 2002. Among the terms of the expected settled orders, DeAM would be subject to certain undertakings regarding the conduct of its business in the future, including maintaining existing management fee reductions for certain funds for a period of five years. DeAM expects that these settlements would resolve regulatory allegations that it violated certain provisions of federal and state securities laws (i) by entering into trading arrangements that permitted certain investors to engage in market timing in certain DWS funds and (ii) by failing more generally to take adequate measures to prevent market timing in the DWS funds, primarily during the 1999-2001 period. With respect to the trading arrangements, DeAM expects that the settlement documents
54
will include allegations related to one legacy DeAM arrangement, as well as three legacy Scudder and six legacy Kemper arrangements. All of these trading arrangements originated in businesses that existed prior to the current DeAM organization, which came together in April 2002 as a result of the various mergers of the legacy Scudder, Kemper and Deutsche fund groups, and all of the arrangements were terminated prior to the start of the regulatory investigations that began in the summer of 2003. No current DeAM employee approved the trading arrangements.
There is no certainty that the final settlement documents will contain the foregoing terms and conditions. The independent Trustees/Directors of the DWS funds have carefully monitored these regulatory investigations with the assistance of independent legal counsel and independent economic consultants. Additional information announced by DeAM regarding the terms of the expected settlements will be made available at www.dws-scudder.com/regulatory_settlements, which will also disclose the terms of any final settlement agreements once they are announced.
Other Regulatory Matters. DeAM is also engaged in settlement discussions with the Enforcement Staffs of the SEC and the NASD regarding DeAM’s practices during 2001-2003 with respect to directing brokerage commissions for portfolio transactions by certain DWS funds to broker-dealers that sold shares in the DWS funds and provided enhanced marketing and distribution for shares in the DWS funds. In addition, on January 13, 2006, DWS Scudder Distributors, Inc. received a Wells notice from the Enforcement Staff of the NASD regarding DWS Scudder Distributors’ payment of non-cash compensation to associated persons of NASD member firms, as well as DWS Scudder Distributors’ procedures regarding non-cash compensation to associated persons of NASD member firms, as well as DWS Scudder Distributors’ procedures regarding non-cash compensation regarding entertainment provided to such associated persons. Additional information announced by DeAM regarding the terms of the expected settlements will be made available at www.dws-scudder.com/regulatory_settlements, which will also disclose the terms of any final settlement agreements once they are announced.
55
EXHIBIT A
FORM OF AGREEMENT AND PLAN OF REORGANIZATION
THIS AGREEMENT AND PLAN OF REORGANIZATION (the “Agreement”) is made as of this [ ] day of [ �� ], 2006, by DWS Variable Series II, a Massachusetts business trust (the “Trust”), on behalf of [DWS Dreman Financial Services VIP/DWS MFS Strategic Value VIP/DWS Income Allocation VIP], a separate series of the Trust (the “Acquired Fund”), and on behalf of [DWS Dreman High Return Equity VIP/DWS Conservative Allocation VIP], also a separate series of the Trust (the “Acquiring Fund” and, together with the Acquired Fund, each a “Fund,” and collectively, the “Funds”); and Deutsche Investment Management Americas Inc. (“DeIM”), investment adviser for the Funds (for purposes of section 10.2 of the Agreement only). The principal place of business of the Trust is 222 South Riverside Plaza, Chicago, Illinois 60606.
This Agreement is intended to be and is adopted as a plan of reorganization within the meaning of Section 368 of the Internal Revenue Code of 1986, as amended (the “Code”) and the Treasury Regulations promulgated thereunder. The reorganization will consist of the transfer of all of the assets of the Acquired Fund to the Acquiring Fund in exchange solely for Class A and Class B voting shares [Class B shares only for DWS Conservative Allocation VIP] of beneficial interest (no par value) of the Acquiring Fund (the “Acquiring Fund Shares”), the assumption by the Acquiring Fund of all of the liabilities of the Acquired Fund and the distribution of the Acquiring Fund Shares to the shareholders of each corresponding class of the Acquired Fund in complete liquidation of the Acquired Fund as provided herein, all upon the terms and conditions hereinafter set forth in this Agreement (the “Reorganization”).
NOW, THEREFORE, in consideration of the premises and of the covenants and agreements hereinafter set forth, the parties hereto covenant and agree as follows:
| 1. | | Transfer of Assets of the Acquired Fund to the Acquiring Fund in Consideration For Acquiring Fund Shares, the Assumption of All Acquired Fund Liabilities and the Liquidation of the Acquired Fund |
1.1 Subject to the terms and conditions herein set forth and on the basis of the representations and warranties contained herein, the Acquired Fund agrees to transfer to the Acquiring Fund all of the Acquired Fund’s assets as set forth in section 1.2, and the Acquiring Fund agrees in consideration therefor (i) to deliver to the Acquired Fund that number of full and fractional Class A and Class B Acquiring Fund Shares [Class B shares only of DWS Conservative Allocation VIP] determined in the manner set forth in section 2.3; and (ii) to assume all of the liabilities of the Acquired Fund, including, but not limited to, any deferred compensation to the Trustees of the Trust (the “Trustees”) relating to the Acquired Fund. All Acquiring Fund Shares delivered to the Acquired Fund shall be delivered at net asset value without a sales load, commission or other similar fee being imposed. Such transactions shall take place at the closing provided for in section 3.1 (the “Closing”).
1.2 The assets of the Acquired Fund to be acquired by the Acquiring Fund (the “Assets”) shall consist of all assets, including, without limitation, all cash, cash equivalents, securities, commodities and futures contracts and dividends or interest or
A-1
other receivables that are owned by the Acquired Fund and any deferred or prepaid expenses shown on the unaudited statement of assets and liabilities of the Acquired Fund prepared as of the effective time of the Closing in accordance with accounting principles generally accepted in the United States of America (“GAAP”) applied consistently with those of the Acquired Fund’s most recent audited balance sheet. The Assets shall constitute at least 90% of the fair market value of the net assets, and at least 70% of the fair market value of the gross assets, held by the Acquired Fund immediately before the Closing (excluding for these purposes assets used to pay the dividends and other distributions paid pursuant to section 1.4).
1.3 The Acquired Fund will endeavor, to the extent practicable, to discharge all of its liabilities and obligations that are accrued prior to the Closing Date as defined in section 3.1.
1.4 On or as soon as practicable prior to the Closing Date as defined in section 3.1, the Acquired Fund will declare and pay to its shareholders of record one or more dividends and/or other distributions so that it will have distributed substantially all of its investment company taxable income (computed without regard to any deduction for dividends paid) and realized net capital gain, if any, for the current taxable year through the Closing Date.
1.5 Immediately after the transfer of Assets provided for in section 1.1, the Acquired Fund will distribute to the Acquired Fund’s shareholders of record with respect to each class of its shares (the “Acquired Fund Shareholders”), determined as of the Valuation Time (as defined in section 2.1), on a pro rata basis within that class, the Acquiring Fund Shares of the same class received by the Acquired Fund pursuant to section 1.1 and will completely liquidate. Such distribution and liquidation will be accomplished with respect to each class of the Acquired Fund by the transfer of the Acquiring Fund Shares then credited to the account of the Acquired Fund on the books of the Acquiring Fund to open accounts on the share records of the Acquiring Fund in the names of the Acquired Fund Shareholders. The Acquiring Fund shall have no obligation to inquire as to the validity, propriety or correctness of such records, but shall assume that such transaction is valid, proper and correct. The aggregate net asset value of Class A and Class B Acquiring Fund Shares to be so credited to the Class A and Class B Acquired Fund Shareholders [Class B shares only for the DWS Income Allocation VIP—DWS Conservative Allocation VIP merger] shall, with respect to each class, be equal to the aggregate net asset value of the Acquired Fund shares of the same class owned by such shareholders as of the Valuation Time. All issued and outstanding shares of the Acquired Fund will simultaneously be cancelled on the books of the Acquired Fund, although share certificates representing interests in Class A shares of the Acquired Fund will represent a number of Acquiring Fund Shares after the Closing Date as determined in accordance with section 2.3. The Acquiring Fund will not issue certificates representing Acquiring Fund Shares.
1.6 Ownership of Acquiring Fund Shares will be shown on the books of the Acquiring Fund. Shares of the Acquiring Fund will be issued in the manner described in the Acquiring Fund’s then-current prospectus and statement of additional information.
1.7 Any reporting responsibility of the Acquired Fund including, without limitation, the responsibility for filing of regulatory reports, tax returns, or other documents with the
A-2
Securities and Exchange Commission (the “Commission”), any state securities commission, and any federal, state or local tax authorities or any other relevant regulatory authority, is and shall remain the responsibility of the Acquired Fund.
1.8 All books and records of the Acquired Fund, including all books and records required to be maintained under the Investment Company Act of 1940, as amended (the “1940 Act”), and the rules and regulations thereunder, shall be available to the Acquiring Fund from and after the Closing Date and shall be turned over to the Acquiring Fund as soon as practicable following the Closing Date.
2.1 The value of the Assets and the liabilities of the Acquired Fund shall be computed as of the close of regular trading on The New York Stock Exchange, Inc. (the “NYSE”) on the business day immediately preceding the Closing Date, as defined in section 3.1 (the “Valuation Time”) after the declaration and payment of any dividends and/or other distributions on that date, using the valuation procedures set forth in the Trust’s Declaration of Trust, as amended, and the Acquiring Fund’s then-current prospectus or statement of additional information, copies of which have been delivered to the Acquired Fund.
2.2 The net asset value of a Class A or Class B Acquiring Fund Share [Class B shares only for DWS Conservative Allocation VIP] shall be the net asset value per share computed with respect to that class as of the Valuation Time using the valuation procedures referred to in section 2.1. Notwithstanding anything to the contrary contained in this Agreement, in the event that, as of the Valuation Time, there are no Class A or Class B Acquiring Fund Shares issued and outstanding, then, for purposes of this Agreement, the per share net asset value of Class A or Class B shares, as applicable, shall be equal to the net asset value of one Class B or Class A share, respectively, of the Acquiring Fund.
2.3 The number of Class A and Class B Acquiring Fund Shares [Class B shares only for DWS Conservative Allocation VIP] to be issued (including fractional shares, if any) in consideration for the Assets shall be determined with respect to each such class by dividing the value of the Assets net of liabilities with respect to Class A and Class B shares of the Acquired Fund, as the case may be, determined in accordance with section 2.1 by the net asset value of an Acquiring Fund Share of the same class determined in accordance with section 2.2.
2.4 All computations of value hereunder shall be made by or under the direction of each Fund’s respective accounting agent, if applicable, in accordance with its regular practice and the requirements of the 1940 Act and shall be subject to confirmation by each Fund’s Independent Registered Public Accounting Firm upon the reasonable request of the other Fund.
| 3. | | Closing and Closing Date |
3.1 The Closing of the transactions contemplated by this Agreement shall be September 18, 2006, or such later date as the parties may agree in writing (the “Closing Date”). All acts taking place at the Closing shall be deemed to take place simultaneously
A-3
as of 9:00 a.m., Eastern time, on the Closing Date, unless otherwise agreed to by the parties. The Closing shall be held at the offices of counsel to the Funds, or at such other place and time as the parties may agree.
3.2 The Acquired Fund shall deliver to the Acquiring Fund on the Closing Date a schedule of Assets.
3.3 State Street Bank and Trust Company (“State Street”), custodian for the Acquired Fund, shall deliver at the Closing a certificate of an authorized officer stating that (a) the Assets have been delivered in proper form to State Street, custodian for the Acquiring Fund, prior to or on the Closing Date and (b) all necessary taxes in connection with the delivery of the Assets, including all applicable federal and state stock transfer stamps, if any, have been paid or provision for payment has been made. The Acquired Fund’s portfolio securities represented by a certificate or other written instrument shall be presented by the custodian for the Acquired Fund to the custodian for the Acquiring Fund for examination no later than five business days preceding the Closing Date and transferred and delivered by the Acquired Fund as of the Closing Date by the Acquired Fund for the account of Acquiring Fund duly endorsed in proper form for transfer in such condition as to constitute good delivery thereof. The Acquired Fund’s portfolio securities and instruments deposited with a securities depository, as defined in Rule 17f-4 under the 1940 Act, shall be delivered as of the Closing Date by book entry in accordance with the customary practices of such depositories and the custodian for the Acquiring Fund. The cash to be transferred by the Acquired Fund shall be delivered by [book entry] on the Closing Date.
3.4 DWS Scudder Investment Service Company (“DSISC”) (or its designee), as transfer agent (or subtransfer agent) for the Acquired Fund, on behalf of the Acquired Fund, shall deliver at the Closing a certificate of an authorized officer stating that its records contain the names and addresses of the Acquired Fund Shareholders and the number and percentage ownership (to three decimal places) of outstanding Class A and Class B Acquired Fund shares [Class B shares only for DWS Income Allocation VIP] owned by each such shareholder immediately prior to the Closing. The Acquiring Fund shall issue and deliver a confirmation evidencing the Acquiring Fund Shares to be credited on the Closing Date to the Acquired Fund or provide evidence satisfactory to the Acquired Fund that such Acquiring Fund Shares have been credited to the Acquired Fund’s account on the books of the Acquiring Fund. At the Closing, each party shall deliver to the other such bills of sale, checks, assignments, share certificates, if any, receipts or other documents as such other party or its counsel may reasonably request to effect the transactions contemplated by this Agreement.
3.5 In the event that immediately prior to the Valuation Time (a) the NYSE or another primary trading market for portfolio securities of the Acquiring Fund or the Acquired Fund shall be closed to trading or trading thereupon shall be restricted, or (b) trading or the reporting of trading on such Exchange or elsewhere shall be disrupted so that, in the judgment of the Trustees, accurate appraisal of the value of the net assets with respect to the Class A and Class B shares [Class B shares only for the DWS Income Allocation VIP—DWS Conservative Allocation VIP merger] of the Acquiring Fund or the Acquired Fund is impracticable, the Closing Date shall be postponed until the first business day after the day when trading shall have been fully resumed and reporting shall have been restored.
A-4
3.6 The liabilities of the Acquired Fund shall include all of the Acquired Fund’s liabilities, debts, obligations, and duties of whatever kind or nature, whether absolute, accrued, contingent, or otherwise, whether or not arising in the ordinary course of business, whether or not determinable at the Closing Date, and whether or not specifically referred to in this Agreement including but not limited to any deferred compensation to the Trustees relating to the Acquired Funds.
| 4. | | Representations and Warranties |
4.1 The Trust, on behalf of the Acquired Fund, represents and warrants to the Acquiring Fund as follows:
(a) The Trust is a voluntary association with transferable shares commonly referred to as a Massachusetts business trust duly organized and validly existing under the laws of The Commonwealth of Massachusetts with power under the Trust’s Declaration of Trust, as amended, to own all of its properties and assets and to carry on its business as it is now being conducted and, subject to approval of shareholders of the Acquired Fund, to carry out the Agreement. The Acquired Fund is a separate series of the Trust duly designated in accordance with the applicable provisions of the Trust’s Declaration of Trust. The Trust and Acquired Fund are qualified to do business in all jurisdictions in which they are required to be so qualified, except jurisdictions in which the failure to so qualify would not have a material adverse effect on the Trust or Acquired Fund. The Acquired Fund has all material federal, state and local authorizations necessary to own all of the properties and assets and to carry on its business as now being conducted, except authorizations which the failure to so obtain would not have a material adverse effect on the Acquired Fund;
(b) The Trust is registered with the Commission as an open-end management investment company under the 1940 Act, and such registration is in full force and effect and the Acquired Fund is in compliance in all material respects with the 1940 Act and the rules and regulations thereunder;
(c) No consent, approval, authorization or order of any court or governmental authority is required for the consummation by the Acquired Fund of the transactions contemplated herein, except such as have been obtained under the Securities Act of 1933, as amended (the “1933 Act”), the Securities Exchange Act of 1934, as amended (the “1934 Act”), and the 1940 Act and such as may be required by state securities laws;
(d) The Trust is not, and the execution, delivery and performance of this Agreement by the Trust will not result, (i) in violation of Massachusetts law or of the Trust’s Declaration of Trust, as amended, or By-Laws, (ii) in a violation or breach of, or constitute a default under, any material agreement, indenture, instrument, contract, lease or other undertaking to which the Trust on behalf of the Acquired Fund is a party or by which it is bound, and the execution, delivery and performance of this Agreement by the Trust on behalf of the Acquired Fund will not result in the acceleration of any obligation, or the imposition of any penalty, under any agreement, indenture, instrument, contract, lease, judgment or decree to which the Trust on behalf of the Acquired Fund is a party or by which it is bound, or (iii) in the creation or imposition of any lien, charge or encumbrance on any property or assets of the Acquired Fund;
A-5
(e) Other than as disclosed on a schedule provided by the Acquired Fund, no material litigation or administrative proceeding or investigation of or before any court or governmental body is presently pending or to its knowledge threatened against the Acquired Fund or any properties or assets held by it. The Acquired Fund knows of no facts which might form the basis for the institution of such proceedings which would materially and adversely affect its business, other than as disclosed in the foregoing schedule, and is not a party to or subject to the provisions of any order, decree or judgment of any court or governmental body which materially and adversely affects its business or its ability to consummate the transactions herein contemplated;
(f) The Statements of Assets and Liabilities, Operations, and Changes in Net Assets, the Financial Highlights, and the Investment Portfolio of the Acquired Fund at and for the fiscal year ended December 31, 2005, have been audited by Ernst & Young LLP, Independent Registered Public Accounting Firm, and are in accordance with GAAP consistently applied, and such statements (a copy of each of which has been furnished to the Acquiring Fund) present fairly, in all material respects, the financial position of the Acquired Fund as of such date in accordance with GAAP and there are no known contingent liabilities of the Acquired Fund required to be reflected on a balance sheet (including the notes thereto) in accordance with GAAP as of such date not disclosed therein;
(g) Since December 31, 2005, there has not been any material adverse change in the Acquired Fund’s financial condition, assets, liabilities or business other than changes occurring in the ordinary course of business, or any incurrence by the Acquired Fund of indebtedness maturing more than one year from the date such indebtedness was incurred except as otherwise disclosed to and accepted in writing by the Acquiring Fund. For purposes of this subsection (g), a decline in net asset value per share of the Acquired Fund due to declines in market values of securities in the Acquired Fund’s portfolio, the discharge of Acquired Fund liabilities, or the redemption of Acquired Fund shares by Acquired Fund Shareholders shall not constitute a material adverse change;
(h) At the date hereof and at the Closing Date, all federal and other tax returns and reports of the Acquired Fund required by law to have been filed by such dates (including any extensions) shall have been filed and are or will be correct in all material respects, and all federal and other taxes (whether or not shown as due or required to be shown as due on said returns and reports) shall have been paid or provision shall have been made for the payment thereof, and, to the best of the Acquired Fund’s knowledge, no such return is currently under audit and no assessment has been asserted with respect to such returns;
(i) For each taxable year of its operation (including the taxable year ending on the Closing Date), the Acquired Fund has met the requirements of Subchapter M of the Code for qualification as a regulated investment company and has elected to be treated as such, has been eligible to and has computed its federal income tax under Section 852 of the Code, and will have distributed all of its investment company taxable income (as determined without regard to any deduction for dividends paid by the Acquired Fund) and net capital gain, as such terms are defined in the Code, that has accrued through the Closing Date;
(j) All issued and outstanding shares of the Acquired Fund (i) have been offered and sold in every state and the District of Columbia in compliance in all material respects with applicable registration requirements of the 1933 Act and state securities laws, (ii) are, and on the Closing Date will be, duly and validly
A-6
issued and outstanding, fully paid and non-assessable and not subject to preemptive or dissenter’s rights (recognizing that, under Massachusetts law, Acquired Fund shareholders, under certain circumstances, could be held personally liable for the obligations of the Acquired Fund), and (iii) will be held at the time of the Closing by the persons and in the amounts set forth in the records of DSISC, as provided in section 3.4. The Acquired Fund does not have outstanding any options, warrants or other rights to subscribe for or purchase any of the Acquired Fund shares, nor is there outstanding any security convertible into any Acquired Fund shares;
(k) At the Closing Date, the Acquired Fund will have good and marketable title to the Acquired Fund’s assets to be transferred to the Acquiring Fund pursuant to section 1.1 and full right, power, and authority to sell, assign, transfer and deliver such assets hereunder free of any liens or other encumbrances, except those liens or encumbrances as to which the Acquiring Fund has received notice at or prior to the Closing, and upon delivery and payment for such assets, the Acquiring Fund will acquire good and marketable title thereto, subject to no restrictions on the full transfer thereof, including such restrictions as might arise under the 1933 Act and the 1940 Act, except those restrictions as to which the Acquiring Fund has received notice and necessary documentation at or prior to the Closing;
(l) The execution, delivery and performance of this Agreement will have been duly authorized prior to the Closing Date by all necessary action on the part of the Trustees (including the determinations required by Rule 17a-8(a) under the 1940 Act), and, subject to the approval of the Acquired Fund Shareholders, this Agreement constitutes a valid and binding obligation of the Trust, on behalf of the Acquired Fund, enforceable in accordance with its terms, subject, as to enforcement, to bankruptcy, insolvency, fraudulent transfer, reorganization, moratorium and other laws relating to or affecting creditors’ rights and to general equity principles;
(m) The information to be furnished by the Acquired Fund for use in applications for orders, registration statements or proxy materials or for use in any other document filed or to be filed with any federal, state or local regulatory authority (including the National Association of Securities Dealers, Inc. (the “NASD”)), which may be necessary in connection with the transactions contemplated hereby, shall be accurate and complete in all material respects and shall comply in all material respects with federal securities and other laws and regulations applicable thereto;
(n) The current prospectus[es] and statement of additional information of the Acquired Fund conform in all material respects to the applicable requirements of the 1933 Act and the 1940 Act and the rules and regulations of the Commission thereunder and do not include any untrue statement of a material fact or omit to state any material fact required to be stated therein or necessary to make the statements therein, in light of the circumstances under which they were made, not materially misleading; and
(o) The Registration Statement referred to in section 5.7, insofar as it relates to the Acquired Fund, will, on the effective date of the Registration Statement and on the Closing Date, (i) comply in all material respects with the provisions and regulations of the 1933 Act, the 1934 Act and the 1940 Act, as applicable, and (ii) not contain any untrue statement of a material fact or omit to state a material fact required to be stated therein or necessary to make the statements therein, in
A-7
light of the circumstances under which such statements are made, not materially misleading; provided, however, that the representations and warranties in this section shall not apply to statements in or omissions from the Registration Statement made in reliance upon and in conformity with information that was furnished or should have been furnished by the Acquiring Fund for use therein.
4.2 The Trust, on behalf of the Acquiring Fund, represents and warrants to the Acquired Fund as follows:
(a) The Trust is a voluntary association with transferable shares commonly referred to as a Massachusetts business trust duly organized and validly existing under the laws of The Commonwealth of Massachusetts with power under the Trust’s Declaration of Trust, as amended, to own all of its properties and assets and to carry on its business as it is now being conducted and to carry out the Agreement. The Acquiring Fund is a separate series of the Trust duly designated in accordance with the applicable provisions of the Trust’s Declaration of Trust. The Trust and Acquiring Fund are qualified to do business in all jurisdictions in which they are required to be so qualified, except jurisdictions in which the failure to so qualify would not have a material adverse effect on the Trust or Acquiring Fund. The Acquiring Fund has all material federal, state and local authorizations necessary to own all of the properties and assets and to carry on its business as now being conducted, except authorizations which the failure to so obtain would not have a material adverse effect on the Acquiring Fund;
(b) The Trust is registered with the Commission as an open-end management investment company under the 1940 Act, and such registration is in full force and effect and the Acquiring Fund is in compliance in all material respects with the 1940 Act and the rules and regulations thereunder;
(c) No consent, approval, authorization, or order of any court or governmental authority is required for the consummation by the Acquiring Fund of the transactions contemplated herein, except such as have been obtained under the 1933 Act, the 1934 Act and the 1940 Act and such as may be required by state securities laws;
(d) The Trust is not, and the execution, delivery and performance of this Agreement by the Trust will not result, (i) in violation of Massachusetts law or of the Trust’s Declaration of Trust, as amended, or By-Laws, (ii) in a violation or breach of, or constitute a default under, any material agreement, indenture, instrument, contract, lease or other undertaking known to counsel to which the Trust on behalf of the Acquiring Fund is a party or by which it is bound, and the execution, delivery and performance of this Agreement by the Trust on behalf of the Acquiring Fund will not result in the acceleration of any obligation, or the imposition of any penalty, under any agreement, indenture, instrument, contract, lease, judgment or decree to which the Trust on behalf of the Acquiring Fund is a party or by which it is bound, or (iii) in the creation or imposition of any lien, charge or encumbrance on any property or assets of the Acquiring Fund;
(e) Other than as disclosed on a schedule provided by the Acquiring Fund, no material litigation or administrative proceeding or investigation of or before any court or governmental body is presently pending or to its knowledge threatened against the Acquiring Fund or any properties or assets held by it. The Acquiring Fund knows of no facts which might form the basis for the institution of such
A-8
proceedings which would materially and adversely affect its business, other than as disclosed in the foregoing schedule, and is not a party to or subject to the provisions of any order, decree or judgment of any court or governmental body which materially and adversely affects its business or its ability to consummate the transactions herein contemplated;
(f) The Statements of Assets and Liabilities, Operations, and Changes in Net Assets, the Financial Highlights, and the Investment Portfolio of the Acquiring Fund at and for the fiscal year ended December 31, 2005, have been audited by Ernst & Young LLP, Independent Registered Public Accounting Firm, and are in accordance with GAAP consistently applied, and such statements (a copy of each of which has been furnished to the Acquired Fund) present fairly, in all material respects, the financial position of the Acquiring Fund as of such date in accordance with GAAP, and there are no known contingent liabilities of the Acquiring Fund required to be reflected on a balance sheet (including the notes thereto) in accordance with GAAP as of such date not disclosed therein;
(g) Since December 31, 2005, there has not been any material adverse change in the Acquiring Fund’s financial condition, assets, liabilities or business other than changes occurring in the ordinary course of business, or any incurrence by the Acquiring Fund of indebtedness maturing more than one year from the date such indebtedness was incurred except as otherwise disclosed to and accepted in writing by the Acquired Fund. For purposes of this subsection (g), a decline in net asset value per share of the Acquiring Fund due to declines in market values of securities in the Acquiring Fund’s portfolio, the discharge of Acquiring Fund liabilities, or the redemption of Acquiring Fund shares by Acquiring Fund shareholders shall not constitute a material adverse change;
(h) At the date hereof and at the Closing Date, all federal and other tax returns and reports of the Acquiring Fund required by law to have been filed by such dates (including any extensions) shall have been filed and are or will be correct in all material respects, and all federal and other taxes (whether or not shown as due or required to be shown as due on said returns and reports) shall have been paid or provision shall have been made for the payment thereof, and, to the best of the Acquiring Fund’s knowledge, no such return is currently under audit and no assessment has been asserted with respect to such returns;
(i) For each taxable year of its operation, the Acquiring Fund has met the requirements of Subchapter M of the Code for qualification as a regulated investment company and has elected to be treated as such, has been eligible to and has computed its federal income tax under Section 852 of the Code, and will do so for the taxable year that includes the Closing Date;
(j) All issued and outstanding shares of the Acquiring Fund (i) have been offered and sold in every state and the District of Columbia in compliance in all material respects with applicable registration requirements of the 1933 Act and state securities laws and (ii) are, and on the Closing Date will be, duly and validly issued and outstanding, fully paid and non-assessable, and not subject to preemptive or dissenter’s rights (recognizing that, under Massachusetts law, Acquiring Fund shareholders, under certain circumstances, could be held personally liable for the obligations of the Acquiring Fund). The Acquiring Fund does not have outstanding any options, warrants or other rights to subscribe for or purchase any of the Acquiring Fund shares, nor is there outstanding any security convertible into any Acquiring Fund Shares;
A-9
(k) The Acquiring Fund Shares to be issued and delivered to the Acquired Fund, for the account of the Acquired Fund Shareholders, pursuant to the terms of this Agreement, will at the Closing Date have been duly authorized and, when so issued and delivered, will be duly and validly issued and outstanding Acquiring Fund Shares, and will be fully paid and non-assessable (recognizing that, under Massachusetts law, Acquiring Fund shareholders, under certain circumstances, could be held personally liable for the obligations of the Acquiring Fund);
(l) At the Closing Date, the Acquiring Fund will have good and marketable title to the Acquiring Fund’s assets, free of any liens or other encumbrances, except those liens or encumbrances as to which the Acquired Fund has received notice at or prior to the Closing;
(m) The execution, delivery and performance of this Agreement will have been duly authorized prior to the Closing Date by all necessary action on the part of the Board members of the Trust (including the determinations required by Rule 17a-8(a) under the 1940 Act) and this Agreement will constitute a valid and binding obligation of the Trust, on behalf of the Acquiring Fund, enforceable in accordance with its terms, subject, as to enforcement, to bankruptcy, insolvency, fraudulent transfer, reorganization, moratorium and other laws relating to or affecting creditors’ rights and to general equity principles;
(n) The information to be furnished by the Acquiring Fund for use in applications for orders, registration statements or proxy materials or for use in any other document filed or to be filed with any federal, state or local regulatory authority (including the NASD), which may be necessary in connection with the transactions contemplated hereby, shall be accurate and complete in all material respects and shall comply in all material respects with federal securities and other laws and regulations applicable thereto;
(o) The current prospectus[es] and statement of additional information of the Acquiring Fund conform in all material respects to the applicable requirements of the 1933 Act and the 1940 Act and the rules and regulations of the Commission thereunder and do not include any untrue statement of a material fact or omit to state any material fact required to be stated therein or necessary to make the statements therein, in light of the circumstances under which they were made, not materially misleading;
(p) The Registration Statement, only insofar as it relates to the Acquiring Fund, will, on the effective date of the Registration Statement and on the Closing Date, (i) comply in all material respects with the provisions and regulations of the 1933 Act, the 1934 Act and the 1940 Act and (ii) not contain any untrue statement of a material fact or omit to state a material fact required to be stated therein or necessary to make the statements therein, in light of the circumstances under which such statements were made, not materially misleading; provided, however, that the representations and warranties in this section shall not apply to statements in or omissions from the Registration Statement made in reliance upon and in conformity with information that was furnished or should have been furnished by the Acquired Fund for use therein; and
(q) The Acquiring Fund agrees to use all reasonable efforts to obtain the approvals and authorizations required by the 1933 Act, the 1940 Act and such of the state securities laws as may be necessary in order to continue its operations after the Closing Date.
A-10
| 5. | | Covenants of the Acquiring Fund and the Acquired Fund |
The Trust on behalf of each Fund covenants as follows:
5.1 The Acquiring Fund and the Acquired Fund each covenants to operate its business in the ordinary course between the date hereof and the Closing Date, it being understood that (a) such ordinary course of business will include (i) the declaration and payment of customary dividends and other distributions and (ii) such changes as are contemplated by the Funds’ normal operations; and (b) each Fund shall retain exclusive control of the composition of its portfolio until the Closing Date. No party shall take any action that would, or reasonably would be expected to, result in any of its representations and warranties set forth in this Agreement being or becoming untrue in any material respect. The Acquired Fund and Acquiring Fund covenant and agree to coordinate the respective portfolios of the Acquired Fund and Acquiring Fund from the date of the Agreement up to and including the Closing Date in order that at Closing, when the Assets are added to the Acquiring Fund’s portfolio, the resulting portfolio will meet the Acquiring Fund’s investment objective, policies, restrictions and investment strategies, as set forth in the Acquiring Fund’s prospectus, a copy of which has been delivered to the Acquired Fund.
5.2 Upon reasonable notice, the Acquiring Fund’s officers and agents shall have reasonable access to the Acquired Fund’s books and records necessary to maintain current knowledge of the Acquired Fund and to ensure that the representations and warranties made by the Acquired Fund are accurate.
5.3 The Acquired Fund covenants to call a meeting of the Acquired Fund Shareholders entitled to vote thereon to consider and act upon this Agreement and to take all other reasonable action necessary to obtain approval of the transactions contemplated herein. Such meeting shall be scheduled for no later than [meeting deadline], 2006.
5.4 The Acquired Fund covenants that the Acquiring Fund Shares to be issued hereunder are not being acquired for the purpose of making any distribution thereof other than in accordance with the terms of this Agreement.
5.5 The Acquired Fund covenants that it will assist the Acquiring Fund in obtaining such information as the Acquiring Fund reasonably requests concerning the beneficial ownership of the Acquired Fund shares.
5.6 Subject to the provisions of this Agreement, the Acquiring Fund and the Acquired Fund will each take, or cause to be taken, all actions, and do or cause to be done, all things reasonably necessary, proper and/or advisable to consummate and make effective the transactions contemplated by this Agreement.
5.7 Each Fund covenants to prepare in compliance with the 1933 Act, the 1934 Act and the 1940 Act the Registration Statement on Form N-14 (the “Registration Statement”) in connection with the meeting of the Acquired Fund Shareholders to consider approval of this Agreement and the transactions contemplated herein. The Trust will file the Registration Statement, including a proxy statement, with the Commission. The Acquired Fund will provide the Acquiring Fund with information
A-11
reasonably necessary for the preparation of a prospectus, which will include a proxy statement, all to be included in the Registration Statement, in compliance in all material respects with the 1933 Act, the 1934 Act and the 1940 Act.
5.8 The Acquired Fund covenants that it will, from time to time, as and when reasonably requested by the Acquiring Fund, execute and deliver or cause to be executed and delivered all such assignments and other instruments, and will take or cause to be taken such further action as the Acquiring Fund may reasonably deem necessary or desirable in order to vest in and confirm the Acquiring Fund’s title to and possession of all the Assets and otherwise to carry out the intent and purpose of this Agreement.
5.9 The Acquiring Fund covenants to use all reasonable efforts to obtain the approvals and authorizations required by the 1933 Act and 1940 Act, and such of the state securities laws as it deems appropriate in order to continue its operations after the Closing Date and to consummate the transactions contemplated herein; provided, however, that the Acquiring Fund may take such actions it reasonably deems advisable after the Closing Date as circumstances change.
5.10 The Acquiring Fund covenants that it will, from time to time, as and when reasonably requested by the Acquired Fund, execute and deliver or cause to be executed and delivered all such assignments, assumption agreements, releases, and other instruments, and will take or cause to be taken such further action, as the Acquired Fund may reasonably deem necessary or desirable in order to (i) vest and confirm to the Acquired Fund title to and possession of all Acquiring Fund shares to be transferred to the Acquired Fund pursuant to this Agreement and (ii) assume all the liabilities of the Acquired Fund.
5.11 As soon as reasonably practicable after the Closing, the Acquired Fund shall make a liquidating distribution to its shareholders consisting of the Acquiring Fund Shares received at the Closing and will completely liquidate.
5.12 The Acquiring Fund and the Acquired Fund shall each use its reasonable best efforts to fulfill or obtain the fulfillment of the conditions precedent to effect the transactions contemplated by this Agreement as promptly as practicable.
5.13 The intention of the parties is that the transaction will qualify as a reorganization within the meaning of Section 368(a) of the Code. Neither the Trust, the Acquiring Fund nor the Acquired Fund shall take any action, or cause any action to be taken (including, without limitation, the filing of any tax return) that is inconsistent with such treatment or results in the failure of the transaction to qualify as a reorganization within the meaning of Section 368(a) of the Code. At or prior to the Closing Date, the Trust, the Acquiring Fund and the Acquired Fund will take such action, or cause such action to be taken, as is reasonably necessary to enable Willkie Farr & Gallagher LLP to render the tax opinion contemplated herein in section 8.5.
5.14 At or immediately prior to the Closing, the Acquired Fund will declare and pay to its shareholders a dividend or other distribution in an amount large enough so that it will have distributed substantially all (and in any event not less than 98%) of its investment company taxable income (computed without regard to any deduction for dividends paid) and realized net capital gain, if any, for the current taxable year through the Closing Date.
A-12
5.15 The Acquiring Fund agrees to identify in writing prior to the Closing Date any assets of the Acquired Fund that it does not wish to acquire because they are not consistent with the current investment objective, policies, restrictions or strategies of the Acquiring Fund, and the Acquired Fund agrees to dispose of such assets prior to the Closing Date. The Acquiring Fund agrees to identify in writing prior to the Closing Date any assets that it would like the Acquired Fund to purchase, consistent with the Acquiring Fund’s investment objective, policies, restrictions and strategies, and the Acquired Fund agrees to purchase such assets with cash proceeds from the disposition of assets pursuant to the foregoing sentence prior to the Closing Date.
| 6. | | Conditions Precedent to Obligations of the Acquired Fund |
The obligations of the Acquired Fund to consummate the transactions provided for herein shall be subject, at its election, to the performance by the Acquiring Fund of all the obligations to be performed by it hereunder on or before the Closing Date, and, in addition thereto, the following further conditions:
6.1 All representations and warranties of the Trust, on behalf of the Acquiring Fund, contained in this Agreement shall be true and correct in all material respects as of the date hereof and, except as they may be affected by the transactions contemplated by this Agreement, as of the Closing Date, with the same force and effect as if made on and as of the Closing Date; and there shall be (i) no pending or threatened litigation brought by any person (other than the Acquired Fund, its adviser or any of their affiliates) against the Acquiring Fund or its investment adviser(s), Trustees or officers arising out of this Agreement and (ii) no facts known to the Acquiring Fund which the Acquiring Fund reasonably believes might result in such litigation.
6.2 The Acquiring Fund shall have delivered to the Acquired Fund on the Closing Date a certificate executed in its name by the Trust’s President or a Vice President, in a form reasonably satisfactory to the Acquired Fund, and dated as of the Closing Date, to the effect that the representations and warranties of the Trust on behalf of the Acquiring Fund made in this Agreement are true and correct on and as of the Closing Date, except as they may be affected by the transactions contemplated by this Agreement, and as to such other matters as the Acquired Fund shall reasonably request.
6.3 The Acquired Fund shall have received on the Closing Date an opinion of Vedder, Price, Kaufman & Kammholz, P.C., in a form reasonably satisfactory to the Acquired Fund, and dated as of the Closing Date, to the effect that:
(a) the Trust has been formed and is a business trust legally existing under the laws of The Commonwealth of Massachusetts;
(b) the Acquiring Fund has the power to carry on its business as presently conducted in accordance with the description thereof in the Trust’s registration statement under the 1940 Act;
(c) the Agreement has been duly authorized, executed and delivered by the Trust, on behalf of the Acquiring Fund, and is a valid and binding obligation of the Trust, on behalf of the Acquiring Fund, enforceable in accordance with its terms, subject to bankruptcy, insolvency, fraudulent transfer, reorganization, moratorium and laws of general applicability relating to or affecting creditors’ rights and to general equity principles;
A-13
(d) the execution and delivery of the Agreement did not, and the issuance of Acquiring Fund Shares pursuant to the Agreement will not, violate the Trust’s Declaration of Trust, as amended, or By-laws; and
(e) to the knowledge of such counsel, and without any independent investigation, (i) other than as disclosed on the schedule provided by the Acquiring Fund pursuant to section 4.2 of the Agreement, the Acquiring Fund is not subject to any litigation or other proceedings that might have a materially adverse effect on the operations of the Acquiring Fund, (ii) the Trust is registered as an investment company under the 1940 Act and no stop order suspending the effectiveness of its registration statement has been issued under the 1933 Act and no order of suspension or revocation of registration pursuant to Section 8(e) of the 1940 Act has been issued, and (iii) all regulatory consents, authorizations, approvals or filings required to be obtained or made by the Acquiring Fund under the federal laws of the United States or the laws of The Commonwealth of Massachusetts for the issuance of Acquiring Fund Shares pursuant to the Agreement have been obtained or made.
The delivery of such opinion is conditioned upon receipt by Vedder, Price, Kaufman & Kammholz, P.C. of customary representations it shall reasonably request of the Trust.
6.4 The Acquiring Fund shall have performed all of the covenants and complied with all of the provisions required by this Agreement to be performed or complied with by the Acquiring Fund on or before the Closing Date.
6.5 The Trust on behalf of the Acquiring Fund shall have entered into an expense cap agreement with DeIM limiting the total operating expenses of the Acquiring Fund to [0.78% and 1.15% for Class A and Class B shares, respectively or, if the substitution order of a certain participating insurance company is effected, to 1.11% for Class B shares for DWS Dreman High Return Equity VIP] [0.75% for Class B shares for DWS Conservative Allocation VIP] [excluding certain expenses, such as extraordinary expenses, taxes, brokerage and interest,] for the period commencing , 2006, and ending April 30, 2010, in a form reasonably satisfactory to the Acquired Fund.
| 7. | | Conditions Precedent to Obligations of the Acquiring Fund |
The obligations of the Acquiring Fund to consummate the transactions provided for herein shall be subject, at its election, to the performance by the Acquired Fund of all of the obligations to be performed by it hereunder on or before the Closing Date and, in addition thereto, the following further conditions:
7.1 All representations and warranties of the Trust, on behalf of the Acquired Fund, contained in this Agreement shall be true and correct in all material respects as of the date hereof and, except as they may be affected by the transactions contemplated by this Agreement, as of the Closing Date, with the same force and effect as if made on and as of the Closing Date; and there shall be (i) no pending or threatened litigation brought by any person (other than the Acquiring Fund, its adviser or any of their affiliates) against the Acquired Fund or its investment adviser(s), Trustees or officers arising out of this Agreement and (ii) no facts known to the Acquired Fund which the Acquired Fund reasonably believes might result in such litigation.
A-14
7.2 The Acquired Fund shall have delivered to the Acquiring Fund a statement of the Acquired Fund’s assets and liabilities as of the Closing Date, certified by the Treasurer of the Trust.
7.3 The Acquired Fund shall have delivered to the Acquiring Fund on the Closing Date a certificate executed in its name by the Trust’s President or a Vice President, in a form reasonably satisfactory to the Acquiring Fund, and dated as of the Closing Date, to the effect that the representations and warranties of the Trust with respect to the Acquired Fund made in this Agreement are true and correct on and as of the Closing Date, except as they may be affected by the transactions contemplated by this Agreement, and as to such other matters as the Acquiring Fund shall reasonably request.
7.4 The Acquiring Fund shall have received on the Closing Date an opinion of Vedder, Price, Kaufman & Kammholz, P.C., in a form reasonably satisfactory to the Acquiring Fund, and dated as of the Closing Date, to the effect that:
(a) the Trust has been formed and is a business trust legally existing under the laws of the Commonwealth of Massachusetts;
(b) the Acquired Fund has the power to carry on its business as presently conducted in accordance with the description thereof in the Trust’s registration statement under the 1940 Act;
(c) the Agreement has been duly authorized, executed and delivered by the Trust, on behalf of the Acquired Fund, and constitutes a valid and legally binding obligation of the Trust, on behalf of the Acquired Fund, enforceable in accordance with its terms, subject to bankruptcy, insolvency, fraudulent transfer, reorganization, moratorium and laws of general applicability relating to or affecting creditors’ rights and to general equity principles;
(d) the execution and delivery of the Agreement did not, and the exchange of the Acquired Fund’s assets for Acquiring Fund Shares pursuant to the Agreement will not, violate the Trust’s Declaration of Trust, as amended, or By-laws; and
(e) to the knowledge of such counsel, and without any independent investigation, (i) other than as disclosed on the schedule provided by the Acquired Fund pursuant to section 4.1 of the Agreement, the Acquired Fund is not subject to any litigation or other proceedings that might have a materially adverse effect on the operations of the Acquired Fund, (ii) the Trust is registered as an investment company under the 1940 Act and no stop order suspending the effectiveness of its registration statement has been issued under the 1933 Act and no order of suspension or revocation of registration pursuant to Section 8(e) of the 1940 Act has been issued, and (iii) all regulatory consents, authorizations, approvals or filings required to be obtained or made by the Acquired Fund under the federal laws of the United States or the laws of The Commonwealth of Massachusetts for the exchange of the Acquired Fund’s assets for Acquiring Fund Shares pursuant to the Agreement have been obtained or made.
The delivery of such opinion is conditioned upon receipt by Vedder, Price, Kaufman & Kammholz, P.C. of customary representations it shall reasonably request of the Trust.
A-15
7.5 The Acquired Fund shall have performed all of the covenants and complied with all of the provisions required by this Agreement to be performed or complied with by the Acquired Fund on or before the Closing Date.
| 8. | | Further Conditions Precedent to Obligations of the Acquiring Fund and the Acquired Fund |
If any of the conditions set forth below have not been met on or before the Closing Date with respect to the Acquired Fund or the Acquiring Fund, the Trust on behalf of the applicable Fund, shall, at its option, not be required to consummate the transactions contemplated by this Agreement:
8.1 This Agreement and the transactions contemplated herein shall have been approved by the requisite vote of the holders of the outstanding shares of the Acquired Fund in accordance with the provisions of the Trust’s Declaration of Trust, as amended, and By-Laws, applicable Massachusetts law and the 1940 Act, and certified copies of the resolutions evidencing such approval shall have been delivered to the Acquiring Fund. Notwithstanding anything herein to the contrary, neither the Acquiring Fund nor the Acquired Fund may waive the conditions set forth in this section 8.1.
8.2 On the Closing Date, no action, suit or other proceeding shall be pending or to its knowledge threatened before any court or governmental agency in which it is sought to restrain or prohibit, or obtain material damages or other relief in connection with, this Agreement or the transactions contemplated herein.
8.3 All consents of other parties and all other consents, orders and permits of federal, state and local regulatory authorities deemed necessary by the Acquiring Fund or the Acquired Fund to permit consummation, in all material respects, of the transactions contemplated hereby shall have been obtained, except where failure to obtain any such consent, order or permit would not involve a risk of a material adverse effect on the assets or properties of the Acquiring Fund or the Acquired Fund, provided that either party hereto may for itself waive any of such conditions.
8.4 The Registration Statement shall have become effective under the 1933 Act and no stop orders suspending the effectiveness thereof shall have been issued and, to the best knowledge of the parties hereto, no investigation or proceeding for that purpose shall have been instituted or be pending, threatened or contemplated under the 1933 Act.
8.5 The parties shall have received an opinion of Willkie Farr & Gallagher LLP addressed to the Trust on behalf of each of the Acquiring Fund and the Acquired Fund, in a form reasonably satisfactory to each such party to this Agreement, substantially to the effect that, based upon certain facts, assumptions and representations of the parties, for federal income tax purposes: (i) the acquisition by the Acquiring Fund of all of the assets of the Acquired Fund solely in exchange for Acquiring Fund Shares and the assumption by the Acquiring Fund of all of the liabilities of the Acquired Fund, followed by the distribution by the Acquired Fund to its shareholders of Acquiring Fund Shares in complete liquidation of the Acquired Fund, all pursuant to the Agreement, constitutes a reorganization within the meaning of Section 368(a) of the Code, and the Acquiring Fund and the Acquired Fund will each be a “party to a reorganization” within the meaning of Section 368(b) of the Code; (ii) under Section 361 of the Code, the Acquired Fund will not recognize gain or loss upon the transfer of its assets to the Acquiring Fund in exchange for
A-16
Acquiring Fund Shares and the assumption of the Acquired Fund liabilities by the Acquiring Fund, and the Acquired Fund will not recognize gain or loss upon the distribution to its shareholders of the Acquiring Fund Shares in liquidation of the Acquired Fund; (iii) under Section 354 of the Code, shareholders of the Acquired Fund will not recognize gain or loss on the receipt of Acquiring Fund Shares solely in exchange for Acquired Fund shares; (iv) under Section 358 of the Code, the aggregate basis of the Acquiring Fund Shares received by each shareholder of the Acquired Fund will be the same as the aggregate basis of the Acquired Fund shares exchanged therefor; (v) under Section 1223(1) of the Code, the holding period of the Acquiring Fund Shares received by each Acquired Fund shareholder will include the holding period of the Acquired Fund shares exchanged therefor, provided that the Acquired Fund shareholder held the Acquired Fund shares at the time of the reorganization as a capital asset; (vi) under Section 1032 of the Code, the Acquiring Fund will not recognize gain or loss upon the receipt of assets of the Acquired Fund in exchange for Acquiring Fund Shares and the assumption by the Acquiring Fund of all of the liabilities of the Acquired Fund; (vii) under Section 362(b) of the Code, the basis of the assets of the Acquired Fund transferred to the Acquiring Fund in the reorganization will be the same in the hands of the Acquiring Fund as the basis of such assets in the hands of the Acquired Fund immediately prior to the transfer; and (viii) under Section 1223(2) of the Code, the holding periods of the assets of the Acquired Fund transferred to the Acquiring Fund in the reorganization in the hands of the Acquiring Fund will include the periods during which such assets were held by the Acquired Fund. The delivery of such opinion is conditioned upon receipt by Willkie Farr & Gallagher LLP of customary representations it shall reasonably request of the Trust. Notwithstanding anything herein to the contrary, neither the Acquiring Fund nor the Acquired Fund may waive the condition set forth in this section 8.5.
9.1 The Acquiring Fund agrees to indemnify and hold harmless the Acquired Fund and each of the Trustees and officers from and against any and all losses, claims, damages, liabilities or expenses (including, without limitation, the payment of reasonable legal fees and reasonable costs of investigation) to which jointly and severally, the Trust or any of the Trustees or officers may become subject, insofar as any such loss, claim, damage, liability or expense (or actions with respect thereto) arises out of or is based on any breach by the Acquiring Fund of any of its representations, warranties, covenants or agreements set forth in this Agreement.
9.2 The Acquired Fund agrees to indemnify and hold harmless the Acquiring Fund and each of the Trustees and officers from and against any and all losses, claims, damages, liabilities or expenses (including, without limitation, the payment of reasonable legal fees and reasonable costs of investigation) to which jointly and severally, the Trust or any of the Trustees or officers may become subject, insofar as any such loss, claim, damage, liability or expense (or actions with respect thereto) arises out of or is based on any breach by the Acquired Fund of any of its representations, warranties, covenants or agreements set forth in this Agreement.
10.1 The Trust, on behalf of the Acquiring Fund and the Acquired Fund, represents and warrants that it has no obligations to pay any brokers or finders fees in connection with the transactions provided for herein.
A-17
10.2 DeIM or its affiliates will bear all the expenses associated with the Reorganization, including any transaction costs payable by the Acquired Fund in connection with the reconfiguration of its portfolio, as designated by the Acquiring Fund, in anticipation of the Reorganization.
The Trust on behalf of the Acquiring Fund and the Acquired Fund agrees that it has not made any representation, warranty or covenant not set forth herein and that this Agreement constitutes the entire agreement relating to the Reorganization.
This Agreement may be terminated and the transactions contemplated hereby may be abandoned (i) by the Trust on behalf of both Funds, or (ii) by the Trust on behalf of either Fund if the Closing shall not have occurred on or before November 16, 2006, unless such date is extended by the Trust on behalf of both Funds, or (iii) by the Trust on behalf of either Fund if the other Fund shall have materially breached its obligations under this Agreement or made a material and intentional misrepresentation herein or in connection herewith. In the event of any such termination, this Agreement shall become void and there shall be no liability hereunder on the part of the Trust or the Trustees or officers, except for any such material breach or intentional misrepresentation, as to each of which all remedies at law or in equity of the party adversely affected shall survive.
This Agreement may be amended, modified or supplemented in such manner as may be mutually agreed upon in writing by any authorized officer of the Trust on behalf of the Acquired Fund and any authorized officer of the Trust on behalf of the Acquiring Fund; provided, however, that following the meeting of the Acquired Fund Shareholders called by the Acquired Fund pursuant to section 5.3 of this Agreement, no such amendment may have the effect of changing the provisions for determining the number of the Acquiring Fund Shares to be issued to the Acquired Fund Shareholders under this Agreement to the detriment of such shareholders without their further approval.
Any notice, report, statement or demand required or permitted by any provisions of this Agreement shall be in writing and shall be deemed duly given if delivered by hand (including by Federal Express or similar express courier) or transmitted by facsimile or three days after being mailed by prepaid registered or certified mail, return receipt requested, addressed to the Trust, 222 South Riverside Plaza, Chicago, Illinois 60606, with a copy to Vedder, Price, Kaufman & Kammholz, P.C., 222 North LaSalle Street, Chicago, Illinois 60601, Attention: David A. Sturms, Esq.
| 15. | | Headings; Counterparts; Assignment; Limitation of Liability |
15.1 The Article and section headings contained in this Agreement are for reference purposes only and shall not affect in any way the meaning or interpretation of this Agreement.
A-18
15.2 This Agreement may be executed in any number of counterparts, each of which shall be deemed an original.
15.3 This Agreement shall bind and inure to the benefit of the parties hereto and their respective successors and assigns, but no assignment or transfer hereof or of any rights or obligations hereunder shall be made by any party without the written consent of the other party. Nothing herein expressed or implied is intended or shall be construed to confer upon or give any person, firm or corporation, other than the parties hereto and the shareholders of the Acquiring Fund and the Acquired Fund and their respective successors and assigns, any rights or remedies under or by reason of this Agreement.
15.4 References in this Agreement to the Trust mean and refer to the Trustees of the Trust from time to time serving under the Declaration of Trust on file with the Secretary of The Commonwealth of Massachusetts, as the same may be amended from time to time, pursuant to which the Trust conducts its business. It is expressly agreed that the obligations of the Trust hereunder shall not be binding upon any of the Trustees, shareholders, nominees, officers, agents, or employees of the Trust personally, but bind only the respective property of the Funds, as provided in the Trust’s Declaration of Trust. Moreover, no series of the Trust other than the Funds shall be responsible for the obligations of the Trust hereunder, and all persons shall look only to the assets of the Funds to satisfy the obligations of the Trust hereunder. The execution and the delivery of this Agreement have been authorized by the Trustees, on behalf of the applicable Fund, and this Agreement has been signed by authorized officers of the Trust acting as such, and neither such authorization by the Trustees, nor such execution and delivery by such officers, shall be deemed to have been made by any of them individually or to impose any liability on any of them personally, but shall bind only the respective property of the Funds, as provided in the Trust’s Declaration of Trust.
Notwithstanding anything to the contrary contained in this Agreement, the obligations, agreements, representations and warranties with respect to each Fund shall constitute the obligations, agreements, representations and warranties of that Fund only (the “Obligated Fund”), and in no event shall any other series of the Trust or the assets of any such series be held liable with respect to the breach or other default by the Obligated Fund of its obligations, agreements, representations and warranties as set forth herein.
15.5 This Agreement shall be governed by, and construed and enforced in accordance with, the laws of The Commonwealth of Massachusetts, without regard to its principles of conflicts of laws.
A-19
IN WITNESS WHEREOF, the Trust has caused this Agreement to be executed by an authorized officer and its seal to be affixed thereto and attested by its Secretary or Assistant Secretary.
| | |
Attest: | | DWS VARIABLE SERIES II, on behalf of [DWS Dreman Financial Services VIP/DWS MFS Strategic Value VIP/DWS Income Allocation VIP] |
| |
| |
|
Secretary | | By: Its: |
| |
Attest: | | DWS VARIABLE SERIES II, on behalf of [DWS Dreman High Return Equity VIP/DWS Conservative Allocation VIP] |
| |
| |
|
Secretary | | By: Its: |
AGREED TO AND ACKNOWLEDGED ONLY WITH RESPECT TO SECTION 10.2 HERETO DEUTSCHE INVESTMENT MANAGEMENT AMERICAS INC. | | |
| |
| | |
By: Its: | | |
A-20
TABLE OF CONTENTS
DWS Scudder
222 South Riverside Plaza
Chicago, Illinois 60606
800-621-1048
For more information please call your Fund’s information agent,
Computershare Fund Services, Inc., at 1-866-390-5113.
Costello WII Annuities
| | | | |
 | | FORM OF PROXY | | |
| | DWS VARIABLE SERIES II | | PROXY CARD |
| | [FUND NAME HERE] | | |
| | PROXY FOR THE JOINT SPECIAL MEETING OF SHAREHOLDERS | | |
| | 345 Park Avenue, 27th Floor, New York, New York 10154 | | |
| PO Box 9132 | | 4:00 p.m., Eastern time, on August 24, 2006 | | |
| Hingham, MA 02043-9132 | | | | |
The undersigned hereby appoint(s) Philip J. Collora, Patricia DeFilippis, John Millette and Caroline Pearson, and each of them, with full power of substitution, as proxy or proxies of the undersigned to vote all shares of the Fund that the undersigned is entitled in any capacity to vote at the above-stated Joint Special Meeting of Shareholders, and at any and all adjournments or postponements therof (the “Special Meeting”), on the matter set forth in the Notice of Joint Special Meeting of Shareholders and on this Proxy Card, and, in their discretion, upon all matters incident to the conduct of the Special Meeting and upon such other matters as may properly be brought before the Special Meeting. This proxy revokes all prior proxies given by the undersigned.
All properly executed proxies will be voted as directed. If no instructions are indicated on a properly executed proxy, the proxy will be voted FOR approval of the Proposal. All ABSTAIN votes will be counted in determining the existence of a quorum at the Special Meeting. Receipt of the Notice of Joint Special Meeting and the related Proxy Statement/Prospectus is hereby acknowledged.
| | | | |
| VOTE VIA THE INTERNET: https://vote.proxy-direct.com |
| VOTE VIA THE TELEPHONE: 1-866-241-6192 |
| 999 9999 9999 999 | | | | |
|
| Note: Joint owners should EACH sign. Please sign EXACTLY as your name(s) appears on this proxy card. When signing as attorney, trustee, executor, administrator, guardian or corporate officer, please give your FULL title as such. |
|
| Signature(s) (Title(s), if applicable) |
|
| Date | | | | COS |
| | | | | WAVE II |
VOTING OPTIONS
Read your proxy statement and have it at hand when voting.
| | | | | | |
 | |  | |  | |  |
| | | |
| VOTE ON THE INTERNET | | VOTE BY PHONE | | VOTE BY MAIL | | VOTE IN PERSON |
Log on to: https://vote.proxy direct.com Follow the on-screen instructions available 24 hours | | Call 1-866-241-6192 Follow the recorded instructions available 24 hours | | Vote, sign and date this Proxy Card and return in the postage-paid envelope | | Attend Shareholder Meeting 345 Park Avenue, 27th Floor New York, NY 10154 on August 24, 2006 |
If you vote on the Internet or by telephone, you need not return this proxy card.
THIS PROXY IS SOLICITED ON BEHALF OF THE BOARD OF TRUSTEES WITH RESPECT TO YOUR FUND. THE FOLLOWING MATTER IS PROPOSED BY YOUR FUND. THE BOARD OF TRUSTEES RECOMMENDS A VOTE FOR THE PROPOSAL.
TO VOTE, MARK A BLOCK BELOW IN BLUE OR BLACK INK. Example:
VOTE ON PROPOSAL:
| | | | | | | | |
| | | | | FOR | | AGAINST | | ABSTAIN |
| 1. | | To approve an Agreement and Plan of Reorganization and the transactions it contemplates, including the transfer of all of the assets of [Acquired Fund] to [Acquiring Fund] in exchange for shares of [Acquiring Fund] and the assumption by [Acquiring Fund] of all the liabilities of [Acquired Fund] and the distribution of such shares to the shareholders [Acquired Fund] in complete liquidation and termination of [Acquired Fund]. | | ¨ | | ¨ | | ¨ |
| | | | |
| | The appointed proxies will vote on any other business as may properly come before the Special Meeting. | | | | | | |
UNLESS VOTING BY TELEPHONE OR INTERNET, PLEASE SIGN, DATE AND MAIL THIS PROXY CARD PROMPTLY USING THE ENCLOSED ENVELOPE.
NO POSTAGE REQUIRED.
MAY 1, 2006
PROSPECTUS
DWS VARIABLE SERIES II
(formerly Scudder Variable Series II)
CLASS A SHARES
DWS Dreman High Return Equity VIP
(formerly SVS Dreman High Return Equity Portfolio)
This prospectus should be read in conjunction with the variable life insurance or variable annuity contract prospectus and plan documents for tax-qualified plans. These shares are available and are being marketed exclusively as a pooled funding vehicle for life insurance companies writing all types of variable life insurance policies and variable annuity contracts.
The Securities and Exchange Commission (SEC) does not approve or disapprove these shares or determine whether the information in this prospectus is truthful or complete. It is a criminal offense for anyone to inform you otherwise.
ONE GLOBAL FORCE. ONE FOCUS. YOU. [DWS SCUDDER Logo]
Deutsche Bank Group
Table of Contents
How the Portfolio Works
The portfolio is designed to serve as an investment option for certain variable annuity contracts, variable life insurance policies and tax-qualified plans. Your investment in the portfolio is made in conjunction with one of these contracts or policies.
Remember that the portfolio is not a bank deposit. It’s not insured or guaranteed by the FDIC or any other government agency. Its share price will go up and down and you could lose money by investing in the portfolio.
Please read this prospectus in conjunction with the prospectus for your variable life insurance policy or variable annuity contract or plan documents for tax-qualified plans.
DWS Dreman High Return Equity VIP
(formerly SVS Dreman High Return Equity Portfolio)
The Portfolio’s Main Investment Strategy
The portfolio seeks to achieve a high rate of total return.
Under normal circumstances, the portfolio invests at least 80% of net assets, plus the amount of any borrowings for investment purposes, in common stocks and other equity securities. The portfolio focuses on stocks of large US companies that are similar in size to the companies in the S&P 500 Index (as of March 31, 2006, the S&P 500 Index had a median market capitalization of $11.74 billion) and that the portfolio managers believe are undervalued. The portfolio intends to invest primarily in companies whose market capitalizations fall within the normal range of the Index. Although the portfolio can invest in stocks of any economic sector, at times it may emphasize the financial services sector or other sectors (in fact, it may invest more than 25% of total assets in a single sector).
The portfolio managers begin by screening for stocks whose price-to-earnings ratios are below the average for the S&P 500 Index. The managers then compare a company’s stock price to its book value, cash flow and yield, and analyze individual companies to identify those that are financially sound and appear to have strong potential for long-term growth and income.
The managers assemble the portfolio from among the most attractive stocks, drawing on analysis of economic outlooks for various sectors and industries. The managers may favor securities from different sectors and industries at different times, while still maintaining variety in terms of industries and companies represented.
The managers normally will sell a stock when it reaches a target price, its fundamental factors have changed or when other investments offer better opportunities.
Securities Lending. The portfolio may lend its investment securities in an amount up to 33 1/3% of its total assets to approved institutional borrowers who need to borrow securities in order to complete certain transactions.
Although major changes tend to be infrequent, the Board of Trustees could change the portfolio’s investment objective without seeking shareholder approval. However, the Board will provide shareholders with at least 60 days’ notice prior to making any changes to the portfolio’s 80% investment policy.
Other Investments
The portfolio may invest up to 20% of net assets in US dollar-denominated American Depository Receipts and in securities of foreign companies traded principally in securities markets outside the US.
Although not one of its principal investment strategies, the portfolio is permitted, but not required, to use various types of derivatives (contracts whose value is based on, for example, indices, currencies or securities). In particular, the portfolio may use futures, currency options and forward currency transactions. The portfolio may also use derivatives in circumstances where the portfolio believes they offer an economical means of gaining exposure to a particular asset class or to keep cash on hand to meet shareholder redemptions or other needs while maintaining exposure to the market.
As a temporary defensive measure, the portfolio could shift up to 100% of assets into investments such as money market securities. This measure could prevent losses, but, while engaged in a temporary defensive position, the portfolio will not be pursuing its investment objective. However, the portfolio managers may choose not to use these strategies for various reasons, even in very volatile market conditions.
The Main Risks of Investing in the Portfolio
There are several risk factors that could hurt the portfolio’s performance, cause you to lose money or cause the portfolio’s performance to trail that of other investments.
3
Stock Market Risk. As with most stock portfolios, an important factor with this portfolio is how stock markets perform—in this case, the large company portion of the US stock market. When large company stock prices fall, you should expect the value of your investment to fall as well. Large company stocks at times may not perform as well as stocks of small or mid-size companies. Because a stock represents ownership in its issuer, stock prices can be hurt by poor management, shrinking product demand and other business risks. These may affect single companies as well as groups of companies. In addition, movements in financial markets may adversely affect a stock’s price, regardless of how well the company performs. The market as a whole may not favor the type of investments the portfolio makes and the portfolio may not be able to get attractive prices for them.
Value Investing Risk. As with any investment strategy, the “value” strategy used in managing the portfolio’s portfolio will, at times, perform better than or worse than other investment styles and the overall market. If the advisor overestimates the value or return potential of one or more common stocks, the portfolio may underperform the general equity market. Value stocks may also be out of favor for certain periods in relation to growth stocks.
Industry Risk. While the portfolio does not concentrate in any industry, to the extent that the portfolio has exposure to a given industry or sector, any factors affecting that industry or sector could affect the value of portfolio securities. For example, manufacturers of consumer goods could be hurt by a rise in unemployment, or technology companies could be hurt by such factors as market saturation, price competition and rapid obsolescence.
IPO Risk. Securities purchased in initial public offerings (IPOs) may be very volatile, rising and falling rapidly, often based, among other reasons, on investor perceptions rather than on economic factors. Additionally, investments in IPOs may magnify the portfolio’s performance if it has a small asset base. The portfolio is less likely to experience a similar impact on its performance as its assets grow because it is unlikely that the portfolio will be able to obtain proportionately larger IPO allocations.
Derivatives Risk. Risks associated with derivatives include: the risk that the derivative is not well correlated with the security, index or currency to which it relates; the risk that derivatives used for risk management may not have the intended effects and may result in losses or missed opportunities; the risk that the portfolio will be unable to sell the derivative because of an illiquid secondary market; the risk that a counterparty is unwilling or unable to meet its obligation; the risk of interest rate movements and the risk that the derivatives transaction could expose the portfolio to the effects of leverage, which could increase the portfolio’s exposure to the market and magnify potential losses. There is no guarantee that derivatives activities will be employed or that they will work, and their use could cause lower returns or even losses to the portfolio.
Securities Lending Risk. Any loss in the market price of securities loaned by the portfolio that occurs during the term of the loan would be borne by the portfolio and would adversely affect the portfolio’s performance. Also, there may be delays in recovery of securities loaned or even a loss of rights in the collateral should the borrower of the securities fail financially while the loan is outstanding. However, loans will be made only to borrowers selected by the portfolio’s delegate after a review of relevant facts and circumstances, including the creditworthiness of the borrower.
Pricing Risk. At times, market conditions might make it hard to value some investments. For example, if the portfolio has valued its securities too highly, you may end up paying too much for portfolio shares when you buy into the portfolio. If the portfolio underestimates their price, you may not receive the full market value for your portfolio shares when you sell.
Security Selection Risk. A risk that pervades all investing is the risk that the securities held by the portfolio will decline in value.
Other factors that could affect performance include:
| | • | | the managers could be incorrect in their analysis of industries, companies, economic trends, the relative attractiveness of different sizes of stocks, geographical trends or other matters; and |
| | • | | foreign securities tend to be more volatile than their US counterparts, for reasons such as currency fluctuations and political and economic uncertainty. |
This portfolio may serve investors with long-term goals who are interested in a large-cap value portfolio that may focus on certain sectors of the economy.
4
Performance
While a portfolio’s past performance isn’t necessarily a sign of how it will do in the future, it can be valuable for an investor to know.
The bar chart shows how the returns for the portfolio’s Class A shares have varied from year to year, which may give some idea of risk. The table shows how average annual returns for the portfolio’s Class A shares compare with a broad-based market index (which, unlike the portfolio, does not have any fees or expenses). The performance of both the portfolio and the index varies over time. All figures on this page assume reinvestment of dividends and distributions.
This information doesn’t reflect charges and fees associated with the separate account that invests in the portfolio or any variable life insurance policy or variable annuity contract for which the portfolio is an investment option. These charges and fees will reduce returns.
Annual Total Returns (%) as of 12/31 each year — Class A shares
THE ORIGINAL DOCUMENT CONTAINS A BAR CHART HERE
BAR CHART DATA:
| | | | | | | | | | | | |
| -11.16 | | 30.52 | | 1.69 | | -18.03 | | 32.04 | | 13.95 | | 7.92 |
| 1999 | | 2000 | | 2001 | | 2002 | | 2003 | | 2004 | | 2005 |
For the periods included in the bar chart:
| | |
| Best Quarter: 20.80%, Q2 2003 | | Worst Quarter: -17.32%, Q3 2002 |
2006 Total Return as of March 31: 2.82%
Average Annual Total Returns (%) as of 12/31/2005
| | | | | | |
| | | 1 Year | | 5 Years | | Since Inception* |
Portfolio — Class A | | 7.92 | | 6.24 | | 6.45 |
Index | | 4.91 | | 0.54 | | 3.09 |
Index: The Standard & Poor’s (S&P) 500 Index is a capitalization-weighted index of 500 stocks designed to measure performance of the broad domestic economy through changes in the aggregate market value of 500 stocks representing all major industries.
| * | Since 5/4/98. Index comparison begins 4/30/98. |
Current performance information may be higher or lower than the performance data quoted above. For more recent performance information, contact your participating insurance company.
5
How Much Investors Pay
This table describes the fees and expenses that you may pay if you buy and hold portfolio shares. The information in the table does not reflect charges and fees associated with the separate account that invests in the portfolio or any variable life insurance policy or variable annuity contract for which the portfolio is an investment option. These charges and fees will increase expenses.
| | | |
Fee Table | | Class A | |
Annual Operating Expenses, deducted from portfolio assets | | | |
Management Fee | | 0.73 | % |
Distribution/Service (12b-1) Fee | | None | |
Other Expenses | | 0.05 | |
| | | |
Total Annual Operating Expenses | | 0.78 | |
| | | |
Based on the costs above, this example helps you compare the expenses of Class A shares to those of other mutual funds. This example assumes the expenses above remain the same. It also assumes that you invested $10,000, earned 5% annual returns, reinvested all dividends and distributions and sold your shares at the end of each period. This is only an example; actual expenses will be different.
| | | | | | | | | | | | |
Example | | 1 Year | | 3 Years | | 5 Years | | 10 Years |
Class A shares | | $ | 80 | | $ | 249 | | $ | 433 | | $ | 966 |
The Portfolio Managers
The portfolio’s subadvisor is Dreman Value Management L.L.C. The portfolio is managed by a team of investment professionals who collaborate to develop and implement the portfolio’s investment strategy. Each portfolio manager on the team has authority over all aspects of the portfolio’s investment portfolio, including but not limited to, purchases and sales of individual securities, portfolio construction techniques, portfolio risk assessment and the management of daily cash flows in accordance with portfolio holdings.
The following people handle the day-to-day management of the portfolio:
| | |
| David N. Dreman | | F. James Hutchinson |
| |
| Chairman and CIO of the subadvisor and Co-Manager of the portfolio. | | Managing Director of the subadvisor and Co-Manager of the portfolio. |
| |
• Began investment career in 1957. | | • Began investment career in 1986. |
| |
• Joined the portfolio in 1998. | | • Joined the portfolio in 2002. |
| |
• Founder and Chairman, Dreman Value Management L.L.C. since 1977. | | • Prior to joining Dreman Value Management, L.L.C. in 2000, associated with The Bank of New York for over 30 years in both the corporate finance and trust/investment management areas, including President of The Bank of New York (NJ). |
The portfolio’s Statement of Additional Information provides additional information about the portfolio managers’ investments in the portfolio, a description of their compensation structure and information regarding other accounts they manage.
6
Financial Highlights
This table is designed to help you understand the portfolio’s financial performance. The figures in the first part of the table are for a single share. The total return figures represent the percentage that an investor in the portfolio would have earned (or lost), assuming all dividends and distributions were reinvested. This information has been audited by Ernst & Young LLP, independent registered public accounting firm, whose report, along with the portfolio’s financial statements, is included in the portfolio’s annual report (see “Shareholder reports” on the back cover).
The following table includes selected data for a share outstanding throughout each period and other performance information derived from the financial statements.
This information doesn’t reflect charges and fees associated with the separate account that invests in the portfolio or any variable life insurance policy or variable annuity contract for which the portfolio is an investment option. These charges and fees will reduce returns.
DWS Dreman High Return Equity VIP — Class A
To Be Updated.
| | | | | | | | | | | | | | | | | | | | |
Years Ended December 31, | | 2005 | | | 2004 | | | 2003 | | | 2002 | | | 2001 | |
Selected Per Share Data | | | | | | | | | | | | | | | | | | | | |
Net asset value, beginning of period | | $ | 12.65 | | | $ | 11.29 | | | $ | 8.76 | | | $ | 10.81 | | | $ | 10.77 | |
Income (loss) from investment operations: | | | | | | | | | | | | | | | | | | | | |
Net investment income (loss)^a | | | .24 | | | | .23 | | | | .20 | | | | .21 | | | | .19 | |
Net realized and unrealized gain (loss) on investment transactions | | | .75 | | | | 1.32 | | | | 2.53 | | | | (2.13 | ) | | | (.01 | ) |
| | | | | | | | | | | | | | | | | | | | |
Total from investment operations | | | .99 | | | | 1.55 | | | | 2.73 | | | | (1.92 | ) | | | .18 | |
| | | | | | | | | | | | | | | | | | | | |
Less distributions from: | | | | | | | | | | | | | | | | | | | | |
Net investment income | | | (.23 | ) | | | (.19 | ) | | | (.20 | ) | | | (.09 | ) | | | (.14 | ) |
Net realized gain on investment transactions | | | — | | | | — | | | | — | | | | (.04 | ) | | | — | |
| | | | | | | | | | | | | | | | | | | | |
Total distributions | | | (.23 | ) | | | (.19 | ) | | | (.20 | ) | | | (.13 | ) | | | (.14 | ) |
| | | | | | | | | | | | | | | | | | | | |
Net asset value, end of period | | $ | 13.41 | | | $ | 12.65 | | | $ | 11.29 | | | $ | 8.76 | | | $ | 10.81 | |
| | | | | | | | | | | | | | | | | | | | |
Total Return (%) | | | 7.92 | | | | 13.95 | | | | 32.04 | | | | (18.03 | ) | | | 1.69 | |
| | | | | | | | | | | | | | | | | | | | |
Ratios to Average Net Assets and Supplemental Data | | | | | | | | | | | | | | | | | | | | |
Net assets, end of period ($ millions) | | | 785 | | | | 747 | | | | 672 | | | | 510 | | | | 443 | |
Ratio of expenses (%) | | | .78 | | | | .78 | | | | .79 | | | | .79 | | | | .82 | |
Ratio of net investment income (%) | | | 1.84 | | | | 1.96 | | | | 2.14 | | | | 2.21 | | | | 1.78 | |
Portfolio turnover rate (%) | | | 10 | | | | 9 | | | | 18 | | | | 17 | | | | 16 | |
| ^a | Based on average shares outstanding during the period. |
7
Other Policies and Risks
While the previous pages describe the main points of the portfolio’s strategy and risks, there are a few other issues to know about:
| | • | | The portfolio may trade securities actively. This strategy could raise transaction costs and, accordingly, lower performance. |
| | • | | The advisor or subadvisor may establish a debt security’s credit quality when it buys a security, using independent ratings, or for unrated securities, its own credit determination. When ratings don’t agree, the portfolio may use the higher rating. If a security’s credit quality falls, the advisor or subadvisor will determine whether selling it would be in the portfolio’s best interest. |
The portfolio’s complete portfolio holdings as of the end of each calendar month are posted on www.dws-scudder.com ordinarily on the 15th day of the following calendar month or the first business day thereafter. This posted information generally remains accessible at least until the portfolio files its Form N-CSR or N-Q with the Securities and Exchange Commission for the period that includes the date as of which the www.dws-scudder.com information is current (expected to be at least three months). The portfolio’s Statement of Additional Information includes a description of the portfolio’s policies and procedures with respect to the disclosure of the portfolio’s holdings.
This prospectus doesn’t tell you about every policy or risk of investing in the portfolio. If you want more information on the portfolio’s allowable securities and investment practices and the characteristics and risks of each one, you may want to request a copy of the Statement of Additional Information (the back cover tells you how to do this).
Keep in mind that there is no assurance that any mutual fund will achieve its goal.
Investment Advisor
DWS Scudder is part of Deutsche Asset Management, which is the marketing name in the US for the asset management activities of Deutsche Bank AG, Deutsche Investment Management Americas Inc. (“DeIM” or the “advisor”), Deutsche Asset Management, Inc., Deutsche Bank Trust Company Americas and DWS Trust Company.
Deutsche Asset Management is a global asset management organization that offers a wide range of investing expertise and resources, including hundreds of portfolio managers and analysts and an office network that reaches the world’s major investment centers. This well-resourced global investment platform brings together a wide variety of experience and investment insight, across industries, regions, asset classes and investing styles.
DeIM is an indirect, wholly owned subsidiary of Deutsche Bank AG. Deutsche Bank AG is a major global banking institution that is engaged in a wide range of financial services, including investment management, mutual fund, retail, private and commercial banking, investment banking and insurance.
DeIM is the investment advisor for the portfolio. Under the supervision of the Board of Trustees, DeIM, with headquarters at 345 Park Avenue, New York, NY 10154, or the subadvisor makes the portfolio’s investment decisions, buy and sell securities for the portfolio and conduct research that leads to these purchase and sale decisions. DeIM and its predecessors have more than 80 years of experience managing mutual funds and DeIM provides a full range of investment advisory services to institutional and retail clients. DeIM or the subadvisor is also responsible for selecting brokers and dealers and for negotiating brokerage commissions and dealer charges.
The portfolio’s shareholder report for the year ended December 31, 2005 contains a discussion regarding the basis for the Board of Trustees’ approval of the portfolio’s investment management agreement and subadvisory agreement (see “Shareholder reports” on the back cover).
The advisor receives a management fee from the portfolio. Below is the actual rate paid by the portfolio during the most recent fiscal year, as a percentage of the portfolio’s average daily net assets:
| | | |
Portfolio Name | | Fee Paid | |
DWS Dreman High Return Equity VIP | | 0.73 | % |
8
Portfolio Subadvisor
Dreman Value Management L.L.C., 520 East Cooper Avenue, Aspen, Colorado, is the subadvisor to DWS Dreman High Return Equity VIP and receives a fee for its services from DeIM. Founded in 1977, Dreman Value Management L.L.C. currently manages over $11 billion in assets. DeIM pays a fee to Dreman Value Management L.L.C. for acting as subadvisor to DWS Dreman High Return Equity VIP.
Market timing related regulatory and litigation matters
Since at least July 2003, federal, state and industry regulators have been conducting ongoing inquiries and investigations (“inquiries”) into the mutual fund industry, and have requested information from numerous mutual fund companies, including DWS Scudder. The DWS funds’ advisors have been cooperating in connection with these inquiries and are in discussions with the regulators concerning proposed settlements. Publicity about mutual fund practices arising from these industrywide inquiries serves as the general basis of a number of private lawsuits against the DWS funds. These lawsuits, which previously have been reported in the press, involve purported class action and derivative lawsuits, making various allegations and naming as defendants various persons, including certain DWS funds, the funds’ investment advisors and their affiliates, and certain individuals, including in some cases fund Trustees/Directors, officers, and other parties. Each DWS fund’s investment advisor has agreed to indemnify the applicable DWS funds in connection with these lawsuits, or other lawsuits or regulatory actions that may be filed making allegations similar to these lawsuits regarding market timing, revenue sharing, fund valuation or other subjects arising from or related to the pending inquiries. It is not possible to determine with certainty what the outcome of these inquiries will be or what the effect, if any, would be on the funds or their advisors.
With respect to the lawsuits, based on currently available information, the funds’ investment advisors believe the likelihood that the pending lawsuits will have a material adverse financial impact on a DWS fund is remote and such actions are not likely to materially affect their ability to perform under their investment management agreements with the DWS funds.
With respect to the regulatory matters, Deutsche Asset Management (“DeAM”) has advised the funds as follows:
DeAM expects to reach final agreements with regulators early in 2006 regarding allegations of improper trading in the DWS funds. DeAM expects that it will reach settlement agreements with the Securities and Exchange Commission, the New York Attorney General and the Illinois Secretary of State providing for payment of disgorgement, penalties, and investor education contributions totaling approximately $134 million. Approximately $127 million of this amount would be distributed to shareholders of the affected DWS funds in accordance with a distribution plan to be developed by an independent distribution consultant. DeAM does not believe that any of the DWS funds will be named as respondents or defendants in any proceedings. The funds’ investment advisors do not believe these amounts will have a material adverse financial impact on them or materially affect their ability to perform under their investment management agreements with the DWS funds. The above-described amounts are not material to Deutsche Bank, and they have already been reserved.
9
Based on the settlement discussions thus far, DeAM believes that it will be able to reach a settlement with the regulators on a basis that is generally consistent with settlements reached by other advisors, taking into account the particular facts and circumstances of market timing at DeAM and at the legacy Scudder and Kemper organizations prior to their acquisition by DeAM in April 2002. Among the terms of the expected settled orders, DeAM would be subject to certain undertakings regarding the conduct of its business in the future, including maintaining existing management fee reductions for certain funds for a period of five years. DeAM expects that these settlements would resolve regulatory allegations that it violated certain provisions of federal and state securities laws (i) by entering into trading arrangements that permitted certain investors to engage in market timing in certain DWS funds and (ii) by failing more generally to take adequate measures to prevent market timing in the DWS funds, primarily during the 1999-2001 period. With respect to the trading arrangements, DeAM expects that the settlement documents will include allegations related to one legacy DeAM arrangement, as well as three legacy Scudder and six legacy Kemper arrangements. All of these trading arrangements originated in businesses that existed prior to the current DeAM organization, which came together in April 2002 as a result of the various mergers of the legacy Scudder, Kemper and Deutsche fund groups, and all of the arrangements were terminated prior to the start of the regulatory investigations that began in the summer of 2003. No current DeAM employee approved the trading arrangements.
There is no certainty that the final settlement documents will contain the foregoing terms and conditions. The independent Trustees/Directors of the DWS funds have carefully monitored these regulatory investigations with the assistance of independent legal counsel and independent economic consultants. Additional information announced by DeAM regarding the terms of the expected settlements will be made available at www.dws-scudder.com/regulatory_settlements, which will also disclose the terms of any final settlement agreements once they are announced.
Other regulatory matters
DeAM is also engaged in settlement discussions with the Enforcement Staffs of the SEC and the NASD regarding DeAM’s practices during 2001-2003 with respect to directing brokerage commissions for portfolio transactions by certain DWS funds to broker-dealers that sold shares in the DWS funds and provided enhanced marketing and distribution for shares in the DWS funds. In addition, on January 13, 2006, DWS Scudder Distributors, Inc. received a Wells notice from the Enforcement Staff of the NASD regarding DWS Scudder Distributors’ payment of non-cash compensation to associated persons of NASD member firms, as well as DWS Scudder Distributors’ procedures regarding non-cash compensation regarding entertainment provided to such associated persons. Additional information announced by DeAM regarding the terms of the expected settlements will be made available at www.dws-scudder.com/regulatory_settlements, which will also disclose the terms of any final settlement agreements once they are announced.
10
Your Investment in the Portfolio
The information in this section may affect anyone who selects the portfolio as an investment option in a variable annuity contract or variable life insurance policy that offers the portfolio. These contracts and policies are described in separate prospectuses issued by participating insurance companies. The portfolio assumes no responsibility for such prospectuses.
Policies about transactions
The information in this prospectus applies to Class A shares of the portfolio. Class A shares are offered at net asset value. The portfolio has another class of shares which is offered separately.
Technically, the shareholders of DWS Variable Series II (which includes the portfolio just described) are the participating insurance companies (the “insurance companies”) that offer the portfolio as a choice for holders of certain variable annuity contracts or variable life insurance policies (the “contract(s)”) issued or sponsored by the insurance companies. The insurance companies effectively pass through the ownership of portfolio shares to their contract owners and some may pass through voting rights as well. The portfolio does not sell shares directly to the public. The portfolio sells shares only to separate accounts of insurance companies. As a contract owner, your premium payments are allocated to the portfolio by the insurance companies in accordance with your contract. Please see the contract prospectus that accompanies this prospectus for a detailed explanation of your contract.
Please bear in mind that there are important differences between funds available to any investor (a “Retail Fund”) and those that are only available through certain financial institutions, such as insurance companies. For example, Retail Funds, unlike the portfolio, are not sold to insurance company separate accounts to support investments in variable insurance contracts. In addition, the investment objectives, policies and strategies of the portfolio, while similar to those of a Retail Fund, may not be identical. Retail Funds may be smaller or larger than the portfolio and have different expense ratios than the portfolio. As a result, the performance of the portfolio and a Retail Fund will differ.
Should any conflict between contract owners arise that would require that a substantial amount of net assets be withdrawn from the portfolio, orderly portfolio management could be disrupted to the potential detriment of contract owners in the portfolio.
The portfolio has a verification process for new insurance company accounts to help the government fight the funding of terrorism and money laundering activities. Federal law requires all financial institutions to obtain, verify and record information that identifies each insurance company that opens an account. What this means to you: when an insurance company opens an account, the portfolio will ask for its name, address and other information that will allow the portfolio to identify the company. This information will be verified to ensure the identity of all insurance companies opening an account.
For certain insurance companies, the portfolio might request additional information (for instance, the portfolio would ask for documents such as the insurance company’s articles of incorporation) to help the portfolio verify the insurance company’s identity.
The portfolio will not complete the purchase of any shares for an account until all information has been provided and the application has been submitted in “good order.” Once the application is determined to be in good order, the purchase(s) will be effected at the net asset value per share next calculated.
The portfolio may reject a new account application if the insurance company doesn’t provide any required or requested identifying information, or for other reasons.
11
The advisor, DWS Scudder Distributors, Inc. and/or their affiliates may pay additional compensation from their own assets to other persons for selling, distributing and/or servicing portfolio shares. This compensation may be significant. You should talk to your insurance company to determine if this compensation influenced the financial advisor’s recommendation of the portfolio.
Buying and Selling Shares
The portfolio is open for business each day the New York Stock Exchange is open. The portfolio calculates its share price every business day, as of the close of regular trading on the New York Stock Exchange (typically 4 p.m. Eastern time, but sometimes earlier, as in the case of scheduled half-day trading or unscheduled suspensions of trading).
The portfolio continuously sells shares to each insurance company, without a sales charge, at the net asset value per share next determined after a proper purchase order is placed with the insurance company. The insurance company offers contract owners units in its separate accounts which directly correspond to shares in the portfolio. Each insurance company submits purchase and redemption orders to the portfolio based on allocation instructions for premium payments, transfer instructions and surrender or partial withdrawal requests for contract owners, as set forth in the accompanying prospectus for the contracts. These orders reflect the amount of premium payments to be invested, surrender and transfer requests, and other matters. Redemption orders are effected at the next net asset value per share determined after a proper redemption order is placed with the insurance company. Contract owners should look at their contract prospectuses for redemption procedures and fees.
Important information about buying and selling shares
| | • | | After receiving a contract owner’s order, the insurance company buys or sells shares at the net asset value next calculated on any day the portfolio is open for business. |
| | • | | Unless otherwise instructed, the portfolio normally makes payment of the proceeds from the sale of shares the next business day but always within seven calendar days. |
| | • | | The portfolio does not issue share certificates. |
| | • | | The portfolio reserves the right to reject purchases of shares for any reason. |
| | • | | The portfolio reserves the right to withdraw or suspend the offering of shares at any time. |
| | • | | The portfolio reserves the right to reject purchases of shares or to suspend or postpone redemptions at times when the New York Stock Exchange is closed (other than customary closings), trading is restricted or when an emergency exists that prevents the portfolio from disposing of its securities or pricing its shares. |
| | • | | The portfolio may refuse, cancel or rescind any purchase order; freeze any account (meaning the insurance company will not be able to purchase shares in its account); suspend account services; and/or involuntarily redeem the account if we think that the account is being used for fraudulent or illegal purposes by the insurance company; one or more of these actions will be taken when, at the sole discretion of the portfolio, they are deemed to be in the portfolio’s best interest or when the portfolio is requested or compelled to do so by governmental authority or by applicable law. |
| | • | | The portfolio may close and liquidate an account if the portfolio is unable to verify provided information, or for other reasons; if the portfolio decides to close the account, the shares will be redeemed at the net asset value per share next calculated after we determine to close the account; the insurance company may be subject to gain or loss on the redemption of the portfolio shares and the insurance company may incur tax liability. |
| | • | | A contract owner’s purchase order may not be accepted if the sale of portfolio shares has been suspended or if it is determined that the purchase would be detrimental to the interests of the portfolio’s shareholders. |
| | • | | Currently, the Board of Trustees of DWS Variable Series II does not foresee any disadvantages to contract owners arising from the fact that the interests of contract owners may differ. Nevertheless, the Board intends to monitor events in order to identify any material irreconcilable conflicts that may possibly arise and to determine what action, if any, should be taken. |
12
Market Timing Policies and Procedures. Short-term and excessive trading of portfolio shares may present risks to the portfolio’s long-term shareholders, including potential dilution in the value of portfolio shares, interference with the efficient management of the portfolio (including losses on the sale of investments), taxable gains to remaining shareholders and increased brokerage and administrative costs. To the extent that the portfolio invests in such securities, these risks may be more pronounced for certain securities such as those that trade in foreign markets, are illiquid or do not otherwise have “readily available market quotations.” Certain investors may seek to employ short-term trading strategies aimed at exploiting variations in portfolio valuation that arise from the nature of the securities held by the portfolio (e.g., “time zone arbitrage”).
The portfolio discourages short-term and excessive trading. The portfolio will take steps to detect and deter short-term and excessive trading pursuant to the portfolio’s policies as described in this prospectus and approved by the Board.
The portfolio’s policies include:
| | • | | the portfolio reserves the right to reject or cancel a purchase or exchange order for any reason when, in the opinion of the advisor, there appears to be a pattern of short-term or excessive trading activity by a shareholder or any other trading activity deemed harmful or disruptive to the portfolio; and |
| | • | | the portfolio has adopted certain fair valuation practices reasonably designed to protect the portfolio from “time zone arbitrage” with respect to its foreign securities holdings and other trading practices that seek to exploit variations in portfolio valuation that arise from the nature of the securities held by the portfolio. (See “How the Portfolio Calculates Share Price.”) |
When a pattern of short-term or excessive trading activity or other trading activity deemed harmful or disruptive to the portfolio is detected in a particular separate account, the advisor will take steps to stop this activity by contacting the insurance company that maintains the accounts for the underlying contract holders and seeking to have the insurance company enforce the separate account’s policies on short-term or excessive trading, if any. In addition, the advisor and the portfolio reserves the right to terminate a separate account’s ability to invest in the portfolio if apparent short-term or excessive trading activity persists. The detection of these patterns and the banning of further trading are inherently subjective and therefore involve some selectivity in their application. The advisor seeks to make such determinations in a manner consistent with the interests of the portfolio’s long-term shareholders.
There is no assurance that these policies and procedures will be effective in limiting short-term and excessive trading in all cases. For example, the advisor may not be able to effectively monitor, detect or limit short-term or excessive trading by underlying shareholders that occurs through separate accounts maintained by insurance companies or other financial intermediaries. Depending on the amount of portfolio shares held in a particular separate account (which may represent most of the portfolio’s shares) short-term and/or excessive trading of portfolio shares could adversely affect long-term shareholders in the portfolio. It is important to note that the advisor and the portfolio does not have access to underlying shareholders’ trading activity and that investors will be subject to the policies and procedures of their insurance company with respect to short-term and excessive trading in the portfolio.
The portfolio’s policies and procedures may be modified or terminated at any time.
How to receive account information
If you are a contract owner, you should contact your insurance company or the organization that provides record keeping services for information about your account.
Please see the contract prospectus that accompanies this prospectus for the customer service phone number.
How to buy and sell shares
Each insurance company has different provisions about how and when their contract owners may buy and sell portfolio shares. Each insurance company is responsible for communicating its contract owners’ instructions to the portfolio. Contract owners should contact their insurance company to effect transactions in the portfolio.
13
How the Portfolio Calculates Share Price
To calculate net asset value per share, or NAV, the portfolio uses the following equation:
| | |
| TOTAL ASSETS - TOTAL LIABILITIES | | = NAV |
| TOTAL NUMBER OF SHARES OUTSTANDING | |
The price at which you buy and sell shares for the portfolio is the NAV.
We typically value securities using information furnished by an independent pricing service or market quotations, where appropriate. However, we may use methods approved by the portfolio’s Board, such as a fair valuation model, which are intended to reflect fair value when pricing service information or market quotations are not readily available or when a security’s value or a meaningful portion of the value of the portfolio is believed to have been materially affected by a significant event, such as a natural disaster, an economic event like a bankruptcy filing, or a substantial fluctuation in domestic or foreign markets, that has occurred between the close of the exchange or market on which the security is principally traded (for example, a foreign exchange or market) and the close of the New York Stock Exchange. In such a case, the portfolio’s value for a security is likely to be different from the last quoted market price or pricing service information. In addition, due to the subjective and variable nature of fair value pricing, it is possible that the value determined for a particular asset may be materially different from the value realized upon such asset’s sale. It is expected that the greater the percentage of portfolio assets that is invested in non-US securities, the more extensive will be the portfolio’s use of fair value pricing. This is intended to reduce the portfolio’s exposure to “time zone arbitrage” and other harmful trading practices. (See “Market Timing Policies and Procedures.”)
To the extent that the portfolio invests in securities that are traded primarily in foreign markets, the value of its holdings could change at a time when you aren’t able to buy or sell portfolio shares through the contract. This is because some foreign markets are open on days and at times when the portfolio doesn’t price its shares.
Distributions
The portfolio intends to declare and distribute dividends from their net investment income and capital gains, if any, annually. The portfolio may make additional distributions if necessary.
All distributions will be reinvested in shares of the portfolio unless we are informed by an insurance company that they should be paid out in cash. The insurance companies will be informed about the amount and character of distributions from the portfolio for federal income tax purposes.
Taxes
The portfolio intends to qualify each year as a regulated investment company under Subchapter M of the Internal Revenue Code of 1986, as amended, (the “Code”) and to meet all requirements necessary to avoid paying any federal income or excise taxes.
Generally, owners of variable annuity and variable life contracts are not taxed currently on income or gains realized with respect to such contracts. However, some distributions from such contracts, whether made prior to or during the annuity payment period, may be taxable at ordinary income tax rates. In addition, distributions made to an owner who is younger than 59 1/2 may be subject to a 10% penalty tax. For further information concerning federal income tax consequences for the holders of variable annuity contracts and variable life insurance policies, such holders should consult the prospectus used in connection with the issuance of their particular contracts or policies.
In order for investors to receive the favorable tax treatment available to holders of variable annuity and variable life contracts, the separate accounts underlying such contracts, as well as the funds in which such accounts invest, must meet certain diversification requirements. The portfolio intends to comply with these requirements. If the portfolio or separate account does not meet such requirements or otherwise fails to qualify as a regulated investment company for any taxable year, income allocable to the contracts associated with the separate account would be taxable currently to the holders of such contracts and income from prior periods with respect to such contracts also could be taxable, most likely in the year of the failure.
14
Under Treasury regulations, insurance companies holding the separate accounts must report to the Internal Revenue Service losses above a certain amount resulting from a sale or disposition of the portfolio’s share.
The discussion above is generally based on the assumption that shares of the portfolio will be respected as owned by insurance company separate accounts. If this is not the case (for example, because the Internal Revenue Service finds an impermissible level of “investor control” over the investment options underlying variable contracts), the advantageous tax treatment provided in respect of insurance company separate accounts under the Code will no longer be available, and the person or persons determined to own the portfolio shares will be currently taxed on portfolio distributions, and on the proceeds of any redemption of portfolio shares, under the Code rules.
Portfolio investments in securities of foreign issuers may be subject to withholding and other taxes at the source, including on dividend or interest payments. Participating insurance companies should consult their own tax advisors as to whether such distributions are subject to federal income tax if they are retained as part of policy reserves.
The portfolio’s investments in certain debt obligations may cause the portfolio to recognize taxable income in excess of the cash generated by such obligation. Thus, the portfolio could be required at times to liquidate other investments in order to satisfy its distribution requirements.
The preceding is a brief summary of certain of the relevant tax considerations. Because each shareholder and contract holder’s tax situation is unique, ask your tax professional about the tax consequences of your investments, including possible foreign, state or local taxes.
15
To Get More Information
Shareholder reports — These include commentary from the portfolio’s management team about recent market conditions and the portfolio’s performance. They also have detailed performance figures, a list of everything the portfolio owns and its financial statements. Shareholders get these reports automatically.
Statement of Additional Information (SAI) — This tells you more about the portfolio’s features and policies, including additional risk information. The SAI is incorporated by reference into this document (meaning that it’s legally part of this prospectus).
For a free copy of any of these documents or to request other information about the portfolio, call (800) 778-1482 or contact DWS Scudder at the address listed below. The portfolio’s SAI and shareholder reports are also available through the DWS Scudder Web site at www.dws-scudder.com. These documents and other information about the portfolio are available from the EDGAR Database on the SEC’s Web site at www.sec.gov. If you like, you may obtain copies of this information, after paying a copying fee, by e-mailing a request to publicinfo@sec.gov or by writing the SEC at the address listed below. You can also review and copy these documents and other information about the portfolio, including the portfolio’s SAI, at the SEC’s Public Reference Room in Washington, D.C. Information on the operation of the SEC’s Public Reference Room may be obtained by calling (202) 551-5850.
| | |
| DWS Scudder Distributors, Inc. | | SEC |
| |
222 South Riverside Plaza Chicago, IL 60606-5808 (800) 778-1482 | | 100 F Street, N.E. Washington, D.C. 20549-2001 (202) 551-5850 |
| |
| | www.sec.gov |
| |
| | SEC File # |
| |
| DWS Variable Series II | | 811-5002 |
MAY 1, 2006
PROSPECTUS
DWS VARIABLE SERIES II
(formerly Scudder Variable Series II)
CLASS B SHARES
DWS Dreman High Return Equity VIP
(formerly SVS Dreman High Return Equity Portfolio)
This prospectus should be read in conjunction with the variable life insurance or variable annuity contract prospectus and plan documents for tax-qualified plans. These shares are available and are being marketed exclusively as a pooled funding vehicle for life insurance companies writing all types of variable life insurance policies and variable annuity contracts.
The Securities and Exchange Commission (SEC) does not approve or disapprove these shares or determine whether the information in this prospectus is truthful or complete. It is a criminal offense for anyone to inform you otherwise.
ONE GLOBAL FORCE. ONE FOCUS. YOU. [DWS SCUDDER Logo]
Deutsche Bank Group
Table of Contents
How the Portfolio Works
The portfolio is designed to serve as an investment option for certain variable annuity contracts, variable life insurance policies and tax-qualified plans. Your investment in the portfolio is made in conjunction with one of these contracts or policies.
Remember that the portfolio is not a bank deposit. It’s not insured or guaranteed by the FDIC or any other government agency. Its share price will go up and down and you could lose money by investing in the portfolio.
Please read this prospectus in conjunction with the prospectus for your variable life insurance policy or variable annuity contract or plan documents for tax-qualified plans.
DWS Dreman High Return Equity VIP
(formerly SVS Dreman High Return Equity Portfolio)
The Portfolio’s Main Investment Strategy
The portfolio seeks to achieve a high rate of total return.
Under normal circumstances, the portfolio invests at least 80% of net assets, plus the amount of any borrowings for investment purposes, in common stocks and other equity securities. The portfolio focuses on stocks of large US companies that are similar in size to the companies in the S&P 500 Index (as of March 31, 2006, the S&P 500 Index had a median market capitalization of $11.74 billion) and that the portfolio managers believe are undervalued. The portfolio intends to invest primarily in companies whose market capitalizations fall within the normal range of the Index. Although the portfolio can invest in stocks of any economic sector, at times it may emphasize the financial services sector or other sectors (in fact, it may invest more than 25% of total assets in a single sector).
The portfolio managers begin by screening for stocks whose price-to-earnings ratios are below the average for the S&P 500 Index. The managers then compare a company’s stock price to its book value, cash flow and yield, and analyze individual companies to identify those that are financially sound and appear to have strong potential for long-term growth and income.
The managers assemble the portfolio from among the most attractive stocks, drawing on analysis of economic outlooks for various sectors and industries. The managers may favor securities from different sectors and industries at different times, while still maintaining variety in terms of industries and companies represented.
The portfolio normally will sell a stock when it reaches a target price, its fundamental factors have changed or when other investments offer better opportunities.
Securities Lending. The portfolio may lend its investment securities in an amount up to 33 1/3% of its total assets to approved institutional borrowers who need to borrow securities in order to complete certain transactions.
Although major changes tend to be infrequent, the Board of Trustees could change the portfolio’s investment objective without seeking shareholder approval. However, the Board will provide shareholders with at least 60 days’ notice prior to making any changes to the portfolio’s 80% investment policy.
Other Investments
The portfolio may invest up to 20% of net assets in US dollar-denominated American Depository Receipts and in securities of foreign companies traded principally in securities markets outside the US.
Although not one of its principal investment strategies, the portfolio is permitted, but not required, to use various types of derivatives (contracts whose value is based on, for example, indices, currencies or securities). In particular, the portfolio may use futures, currency options and forward currency transactions. The portfolio may also use derivatives in circumstances where the portfolio believes they offer an economical means of gaining exposure to a particular asset class or to keep cash on hand to meet shareholder redemptions or other needs while maintaining exposure to the market.
As a temporary defensive measure, the portfolio could shift up to 100% of assets into investments such as money market securities. This measure could prevent losses, but, while engaged in a temporary defensive position, the portfolio will not be pursuing its investment objective. However, the portfolio managers may choose not to use these strategies for various reasons, even in very volatile market conditions.
The Main Risks of Investing in the Portfolio
There are several risk factors that could hurt the portfolio’s performance, cause you to lose money or cause the portfolio’s performance to trail that of other investments.
3
Stock Market Risk. As with most stock portfolios, an important factor with this portfolio is how stock markets perform — in this case, the large company portion of the US stock market. When large company stock prices fall, you should expect the value of your investment to fall as well. Large company stocks at times may not perform as well as stocks of small or mid-size companies. Because a stock represents ownership in its issuer, stock prices can be hurt by poor management, shrinking product demand and other business risks. These may affect single companies as well as groups of companies. In addition, movements in financial markets may adversely affect a stock’s price, regardless of how well the company performs. The market as a whole may not favor the type of investments the portfolio makes and the portfolio may not be able to get attractive prices for them.
Value Investing Risk. As with any investment strategy, the “value” strategy used in managing the portfolio’s portfolio will, at times, perform better than or worse than other investment styles and the overall market. If the advisor overestimates the value or return potential of one or more common stocks, the portfolio may underperform the general equity market. Value stocks may also be out of favor for certain periods in relation to growth stocks.
Industry Risk. While the portfolio does not concentrate in any industry, to the extent that the portfolio has exposure to a given industry or sector, any factors affecting that industry or sector could affect the value of portfolio securities. For example, manufacturers of consumer goods could be hurt by a rise in unemployment, or technology companies could be hurt by such factors as market saturation, price competition and rapid obsolescence.
IPO Risk. Securities purchased in initial public offerings (IPOs) may be very volatile, rising and falling rapidly, often based, among other reasons, on investor perceptions rather than on economic factors. Additionally, investments in IPOs may magnify the portfolio’s performance if it has a small asset base. The portfolio is less likely to experience a similar impact on its performance as its assets grow because it is unlikely that the portfolio will be able to obtain proportionately larger IPO allocations.
Derivatives Risk. Risks associated with derivatives include: the risk that the derivative is not well correlated with the security, index or currency to which it relates; the risk that derivatives used for risk management may not have the intended effects and may result in losses or missed opportunities; the risk that the portfolio will be unable to sell the derivative because of an illiquid secondary market; the risk that a counterparty is unwilling or unable to meet its obligation; the risk of interest rate movements and the risk that the derivatives transaction could expose the portfolio to the effects of leverage, which could increase the portfolio’s exposure to the market and magnify potential losses. There is no guarantee that derivatives activities will be employed or that they will work, and their use could cause lower returns or even losses to the portfolio.
Securities Lending Risk. Any loss in the market price of securities loaned by the portfolio that occurs during the term of the loan would be borne by the portfolio and would adversely affect the portfolio’s performance. Also, there may be delays in recovery of securities loaned or even a loss of rights in the collateral should the borrower of the securities fail financially while the loan is outstanding. However, loans will be made only to borrowers selected by the portfolio’s delegate after a review of relevant facts and circumstances, including the creditworthiness of the borrower.
Pricing Risk. At times, market conditions might make it hard to value some investments. For example, if the portfolio has valued its securities too highly, you may end up paying too much for portfolio shares when you buy into the portfolio. If the portfolio underestimates their price, you may not receive the full market value for your portfolio shares when you sell.
Security Selection Risk. A risk that pervades all investing is the risk that the securities held by the portfolio will decline in value.
Other factors that could affect performance include:
| | • | | the managers could be incorrect in their analysis of industries, companies, economic trends, the relative attractiveness of different sizes of stocks, geographical trends or other matters; and |
| | • | | foreign securities tend to be more volatile than their US counterparts, for reasons such as currency fluctuations and political and economic uncertainty. |
This portfolio may serve investors with long-term goals who are interested in a large-cap value portfolio that may focus on certain sectors of the economy.
4
Performance
While a portfolio’s past performance isn’t necessarily a sign of how it will do in the future, it can be valuable for an investor to know.
The bar chart shows how portfolio performance has varied from year to year, which may give some idea of risk. The table shows how average annual returns for the portfolio’s Class B shares compare with a broad-based market index (which, unlike the portfolio, does not have any fees or expenses). The performance of both the portfolio and the index varies over time. All figures on this page assume reinvestment of dividends and distributions.
The inception date for Class B was July 1, 2002. In the bar chart and table, the performance figures for Class B before that date are based on the historical performance of the portfolio’s original share class (Class A), adjusted to reflect the higher gross total annual operating expenses of Class B. Class A is offered in a different prospectus.
This information doesn’t reflect charges and fees associated with the separate account that invests in the portfolio or any variable life insurance policy or variable annuity contract for which the portfolio is an investment option. These charges and fees will reduce returns.
Annual Total Returns (%) as of 12/31 each year — Class B shares
THE ORIGINAL DOCUMENT CONTAINS A BAR CHART HERE
BAR CHART DATA:
| | | | | | | | | | | | |
| -11.38 | | 30.19 | | 1.44 | | -18.25 | | 31.60 | | 13.53 | | 7.51 |
| 1999 | | 2000 | | 2001 | | 2002 | | 2003 | | 2004 | | 2005 |
For the periods included in the bar chart:
Best Quarter: 20.65%, Q2 2003 Worst Quarter: -17.44%, Q3 2002
2006 Total Return as of March 31: 2.71%
Average Annual Total Returns (%) as of 12/31/2005
| | | | | | |
| | | 1 Year | | 5 Years | | Since Inception* |
Portfolio — Class B | | 7.51 | | 5.90 | | 6.13 |
Index | | 4.91 | | 0.54 | | 3.09 |
Index: The Standard & Poor’s (S&P) 500 Index is a capitalization-weighted index of 500 stocks designed to measure performance of the broad domestic economy through changes in the aggregate market value of 500 stocks representing all major industries.
| * | Since 5/4/98. Index comparison begins 4/30/98. |
Current performance information may be higher or lower than the performance data quoted above. For more recent performance information, contact your participating insurance company.
5
How Much Investors Pay
This table describes the fees and expenses that you may pay if you buy and hold portfolio shares. The information in the table does not reflect charges and fees associated with the separate account that invests in the portfolio or any variable life insurance policy or variable annuity contract for which the portfolio is an investment option. These charges and fees will increase expenses.
| | | |
Fee Table | | Class B | |
Annual Operating Expenses, deducted from portfolio assets | | | |
Management Fee | | 0.73 | % |
Distribution/Service (12b-1) Fee | | 0.25 | |
Other Expenses | | 0.19 | |
| | | |
Total Annual Operating Expenses | | 1.17 | |
| | | |
Based on the costs above, this example helps you compare the expenses of Class B shares to those of other mutual funds. This example assumes the expenses above remain the same. It also assumes that you invested $10,000, earned 5% annual returns, reinvested all dividends and distributions and sold your shares at the end of each period. This is only an example; actual expenses will be different.
| | | | | | | | | | | | |
Example | | 1 Year | | 3 Years | | 5 Years | | 10 Years |
Class B shares | | $ | 119 | | $ | 372 | | $ | 644 | | $ | 1,420 |
The Portfolio Managers
The portfolio’s subadvisor is Dreman Value Management L.L.C. The portfolio is managed by a team of investment professionals who collaborate to develop and implement the portfolio’s investment strategy. Each portfolio manager on the team has authority over all aspects of the portfolio’s investment portfolio, including but not limited to, purchases and sales of individual securities, portfolio construction techniques, portfolio risk assessment and the management of daily cash flows in accordance with portfolio holdings.
The following people handle the day-to-day management of the portfolio:
| | |
| David N. Dreman | | F. James Hutchinson |
| |
| Chairman and CIO of the subadvisor and | | Managing Director of the subadvisor |
| |
| Co-Manager of the portfolio. | | and Co-Manager of the portfolio. |
| |
• Began investment career in 1957. | | • Began investment career in 1986. |
| |
• Joined the portfolio in 1998. | | • Joined the portfolio in 2002. |
| |
• Founder and Chairman, Dreman Value Management L.L.C. since 1977. | | • Prior to joining Dreman Value Management, L.L.C. in 2000, associated with The Bank of New York for over 30 years in both the corporate finance and trust/investment management areas, including President of The Bank of New York (NJ). |
The portfolio’s Statement of Additional Information provides additional information about the portfolio managers’ investments in the portfolio, a description of their compensation structure and information regarding other accounts they manage.
6
Financial Highlights
This table is designed to help you understand the portfolio’s financial performance. The figures in the first part of the table are for a single share. The total return figures represent the percentage that an investor in the portfolio would have earned (or lost), assuming all dividends and distributions were reinvested. This information has been audited by Ernst & Young LLP, independent registered public accounting firm, whose report, along with the portfolio’s financial statements, is included in the portfolio’s annual report (see “Shareholder reports” on the back cover).
The following table includes selected data for a share outstanding throughout each period and other performance information derived from the financial statements.
This information doesn’t reflect charges and fees associated with the separate account that invests in the portfolio or any variable life insurance policy or variable annuity contract for which the portfolio is an investment option. These charges and fees will reduce returns.
DWS Dreman High Return Equity VIP — Class B
| | | | | | | | | | | | | | | | |
Years Ended December 31, | | 2005 | | | 2004 | | | 2003 | | | 2002^a | |
Selected Per Share Data | | | | | | | | | | | | | | | | |
Net asset value, beginning of period | | $ | 12.63 | | | $ | 11.27 | | | $ | 8.75 | | | $ | 9.57 | |
Income (loss) from investment operations: | | | | | | | | | | | | | | | | |
Net investment income (loss)^b | | | .19 | | | | .18 | | | | .16 | | | | .18 | |
Net realized and unrealized gain (loss) on investment transactions | | | .75 | | | | 1.33 | | | | 2.53 | | | | (1.00 | ) |
| | | | | | | | | | | | | | | | |
Total from investment operations | | | .94 | | | | 1.51 | | | | 2.69 | | | | (.82 | ) |
| | | | | | | | | | | | | | | | |
Less distributions from: | | | | | | | | | | | | | | | | |
Net investment income | | | (.18 | ) | | | (.15 | ) | | | (.17 | ) | | | — | |
Net asset value, end of period | | $ | 13.39 | | | $ | 12.63 | | | $ | 11.27 | | | $ | 8.75 | |
| | | | | | | | | | | | | | | | |
Total Return (%) | | | 7.51 | | | | 13.53 | | | | 31.60 | | | | (8.57 | )** |
| | | | | | | | | | | | | | | | |
Ratios to Average Net Assets and Supplemental Data | | | | | | | | | | | | | | | | |
Net assets, end of period ($ millions) | | | 135 | | | | 117 | | | | 66 | | | | 2 | |
Ratio of expenses (%) | | | 1.17 | | | | 1.16 | | | | 1.18 | | | | 1.05 | * |
Ratio of net investment income (%) | | | 1.45 | | | | 1.58 | | | | 1.75 | | | | 4.30 | * |
Portfolio turnover rate (%) | | | 10 | | | | 9 | | | | 18 | | | | 17 | |
| ^a | For the period from July 1, 2002 (commencement of operations of Class B shares) to December 31, 2002. |
| ^b | Based on average shares outstanding during the period. |
7
Other Policies and Risks
While the previous pages describe the main points of the portfolio’s strategy and risks, there are a few other issues to know about:
| | • | | The portfolio may trade securities actively. This strategy could raise transaction costs and, accordingly, lower performance. |
| | • | | The advisor or subadvisor may establish a debt security’s credit quality when it buys a security, using independent ratings, or for unrated securities, its own credit determination. When ratings don’t agree, a portfolio may use the higher rating. If a security’s credit quality falls, the advisor or subadvisor will determine whether selling it would be in the portfolio’s best interest. |
The portfolio’s complete portfolio holdings as of the end of each calendar month are posted on www.dws-scudder.com ordinarily on the 15th day of the following calendar month or the first business day thereafter. This posted information generally remains accessible at least until the portfolio files its Form N-CSR or N-Q with the Securities and Exchange Commission for the period that includes the date as of which the www.dws-scudder.com information is current (expected to be at least three months). The portfolios’ Statement of Additional Information includes a description of the portfolio’s policies and procedures with respect to the disclosure of the portfolio’s holdings.
This prospectus doesn’t tell you about every policy or risk of investing in the portfolio. If you want more information on the portfolio’s allowable securities and investment practices and the characteristics and risks of each one, you may want to request a copy of the Statement of Additional Information (the back cover tells you how to do this).
Keep in mind that there is no assurance that any mutual fund will achieve its goal.
Investment Advisor
DWS Scudder is part of Deutsche Asset Management, which is the marketing name in the US for the asset management activities of Deutsche Bank AG, Deutsche Investment Management Americas Inc. (“DeIM” or the “advisor”), Deutsche Asset Management, Inc., Deutsche Bank Trust Company Americas and DWS Trust Company.
Deutsche Asset Management is a global asset management organization that offers a wide range of investing expertise and resources, including hundreds of portfolio managers and analysts and an office network that reaches the world’s major investment centers. This well-resourced global investment platform brings together a wide variety of experience and investment insight, across industries, regions, asset classes and investing styles.
DeIM is an indirect, wholly owned subsidiary of Deutsche Bank AG. Deutsche Bank AG is a major global banking institution that is engaged in a wide range of financial services, including investment management, mutual fund, retail, private and commercial banking, investment banking and insurance.
DeIM is the investment advisor for the portfolio. Under the supervision of the Board of Trustees, DeIM, with headquarters at 345 Park Avenue, New York, NY 10154, or the subadvisor makes the portfolio’s investment decisions, buy and sell securities for the portfolio and conduct research that leads to these purchase and sale decisions. DeIM and its predecessors have more than 80 years of experience managing mutual funds and DeIM provides a full range of investment advisory services to institutional and retail clients. DeIM or the subadvisor is also responsible for selecting brokers and dealers and for negotiating brokerage commissions and dealer charges.
The portfolio’s shareholder report for the year ended December 31, 2005 contains a discussion regarding the basis for the Board of Trustees’ approval of the portfolio’s investment management agreement and subadvisory agreement (see “Shareholder reports” on the back cover).
8
The advisor receives a management fee from the portfolio. Below is the actual rate paid by the portfolio during the most recent fiscal year, as a percentage of the portfolio’s average daily net assets:
| | | |
Portfolio Name | | Fee Paid | |
DWS Dreman High Return Equity VIP | | 0.73 | % |
Portfolio Subadvisor
Dreman Value Management L.L.C., 520 East Cooper Avenue, Aspen, Colorado, is the subadvisor to the portfolio and receives a fee for its services from DeIM. Founded in 1977, Dreman Value Management L.L.C. currently manages over $11 billion in assets. DeIM pays a fee to Dreman Value Management L.L.C. for acting as subadvisor to DWS Dreman High Return Equity VIP.
Market timing related regulatory and litigation matters
Since at least July 2003, federal, state and industry regulators have been conducting ongoing inquiries and investigations (“inquiries”) into the mutual fund industry, and have requested information from numerous mutual fund companies, including DWS Scudder. The DWS funds’ advisors have been cooperating in connection with these inquiries and are in discussions with the regulators concerning proposed settlements. Publicity about mutual fund practices arising from these industrywide inquiries serves as the general basis of a number of private lawsuits against the DWS funds. These lawsuits, which previously have been reported in the press, involve purported class action and derivative lawsuits, making various allegations and naming as defendants various persons, including certain DWS funds, the funds’ investment advisors and their affiliates, and certain individuals, including in some cases fund Trustees/Directors, officers, and other parties. Each DWS fund’s investment advisor has agreed to indemnify the applicable DWS funds in connection with these lawsuits, or other lawsuits or regulatory actions that may be filed making allegations similar to these lawsuits regarding market timing, revenue sharing, fund valuation or other subjects arising from or related to the pending inquiries. It is not possible to determine with certainty what the outcome of these inquiries will be or what the effect, if any, would be on the funds or their advisors.
With respect to the lawsuits, based on currently available information, the funds’ investment advisors believe the likelihood that the pending lawsuits will have a material adverse financial impact on a DWS fund is remote and such actions are not likely to materially affect their ability to perform under their investment management agreements with the DWS funds.
With respect to the regulatory matters, Deutsche Asset Management (“DeAM”) has advised the funds as follows:
DeAM expects to reach final agreements with regulators early in 2006 regarding allegations of improper trading in the DWS funds. DeAM expects that it will reach settlement agreements with the Securities and Exchange Commission, the New York Attorney General and the Illinois Secretary of State providing for payment of disgorgement, penalties, and investor education contributions totaling approximately $134 million. Approximately $127 million of this amount would be distributed to shareholders of the affected DWS funds in accordance with a distribution plan to be developed by an independent distribution consultant. DeAM does not believe that any of the DWS funds will be named as respondents or defendants in any proceedings. The funds’ investment advisors do not believe these amounts will have a material adverse financial impact on them or materially affect their ability to perform under their investment management agreements with the DWS funds. The above-described amounts are not material to Deutsche Bank, and they have already been reserved.
9
Based on the settlement discussions thus far, DeAM believes that it will be able to reach a settlement with the regulators on a basis that is generally consistent with settlements reached by other advisors, taking into account the particular facts and circumstances of market timing at DeAM and at the legacy Scudder and Kemper organizations prior to their acquisition by DeAM in April 2002. Among the terms of the expected settled orders, DeAM would be subject to certain undertakings regarding the conduct of its business in the future, including maintaining existing management fee reductions for certain funds for a period of five years. DeAM expects that these settlements would resolve regulatory allegations that it violated certain provisions of federal and state securities laws (i) by entering into trading arrangements that permitted certain investors to engage in market timing in certain DWS funds and (ii) by failing more generally to take adequate measures to prevent market timing in the DWS funds, primarily during the 1999-2001 period. With respect to the trading arrangements, DeAM expects that the settlement documents will include allegations related to one legacy DeAM arrangement, as well as three legacy Scudder and six legacy Kemper arrangements. All of these trading arrangements originated in businesses that existed prior to the current DeAM organization, which came together in April 2002 as a result of the various mergers of the legacy Scudder, Kemper and Deutsche fund groups, and all of the arrangements were terminated prior to the start of the regulatory investigations that began in the summer of 2003. No current DeAM employee approved the trading arrangements.
There is no certainty that the final settlement documents will contain the foregoing terms and conditions. The independent Trustees/Directors of the DWS funds have carefully monitored these regulatory investigations with the assistance of independent legal counsel and independent economic consultants. Additional information announced by DeAM regarding the terms of the expected settlements will be made available at www.dws-scudder.com/regulatory_settlements, which will also disclose the terms of any final settlement agreements once they are announced.
Other regulatory matters
DeAM is also engaged in settlement discussions with the Enforcement Staffs of the SEC and the NASD regarding DeAM’s practices during 2001-2003 with respect to directing brokerage commissions for portfolio transactions by certain DWS funds to broker-dealers that sold shares in the DWS funds and provided enhanced marketing and distribution for shares in the DWS funds. In addition, on January 13, 2006, DWS Scudder Distributors, Inc. received a Wells notice from the Enforcement Staff of the NASD regarding DWS Scudder Distributors’ payment of non-cash compensation to associated persons of NASD member firms, as well as DWS Scudder Distributors’ procedures regarding non-cash compensation regarding entertainment provided to such associated persons. Additional information announced by DeAM regarding the terms of the expected settlements will be made available at www.dws-scudder.com/regulatory_settlements, which will also disclose the terms of any final settlement agreements once they are announced.
10
Your Investment in the Portfolio
The information in this section may affect anyone who selects the portfolio as an investment option in a variable annuity contract or variable life insurance policy that offers the portfolio. These contracts and policies are described in separate prospectuses issued by participating insurance companies. The portfolio assumes no responsibility for such prospectuses.
Policies about transactions
The information in this prospectus applies to Class B shares of the portfolio. Class B shares are offered at net asset value and are subject to a 12b-1 fee. The portfolio has another class of shares which is offered separately.
Technically, the shareholders of DWS Variable Series II (which includes the portfolio just described) are the participating insurance companies (the “insurance companies”) that offer the portfolio as a choice for holders of certain variable annuity contracts or variable life insurance policies (the “contract(s)”) issued or sponsored by the insurance companies. The insurance companies effectively pass through the ownership of portfolio shares to their contract owners and some may pass through voting rights as well. The portfolio does not sell shares directly to the public. The portfolio sells shares only to separate accounts of insurance companies. As a contract owner, your premium payments are allocated to the portfolio by the insurance companies in accordance with your contract. Please see the contract prospectus that accompanies this prospectus for a detailed explanation of your contract.
Please bear in mind that there are important differences between funds available to any investor (a “Retail Fund”) and those that are only available through certain financial institutions, such as insurance companies. For example, Retail Funds, unlike the portfolio, are not sold to insurance company separate accounts to support investments in variable insurance contracts. In addition, the investment objectives, policies and strategies of the portfolio, while similar to those of a Retail Fund, may not be identical. Retail Funds may be smaller or larger than the portfolio and have different expense ratios than the portfolio. As a result, the performance of the portfolio and a Retail Fund will differ.
Should any conflict between contract owners arise that would require that a substantial amount of net assets be withdrawn from the portfolio, orderly portfolio management could be disrupted to the potential detriment of contract owners in the portfolio.
The portfolio has a verification process for new insurance company accounts to help the government fight the funding of terrorism and money laundering activities. Federal law requires all financial institutions to obtain, verify and record information that identifies each insurance company that opens an account. What this means to you: when an insurance company opens an account, the portfolio will ask for its name, address and other information that will allow the portfolio to identify the company. This information will be verified to ensure the identity of all insurance companies opening an account.
For certain insurance companies, a portfolio might request additional information (for instance, the portfolio would ask for documents such as the insurance company’s articles of incorporation) to help the portfolio verify the insurance company’s identity.
The portfolio will not complete the purchase of any shares for an account until all information has been provided and the application has been submitted in “good order.” Once the application is determined to be in good order, the purchase(s) will be effected at the net asset value per share next calculated.
The portfolio may reject a new account application if the insurance company doesn’t provide any required or requested identifying information, or for other reasons.
11
The advisor, DWS Scudder Distributors, Inc. and/or their affiliates may pay additional compensation from their own assets to other persons for selling, distributing and/or servicing portfolio shares. This compensation may be significant. You should talk to your insurance company to determine if this compensation influenced the financial advisor’s recommendation of the portfolio.
Buying and Selling Shares
The portfolio is open for business each day the New York Stock Exchange is open. The portfolio calculates its share price every business day, as of the close of regular trading on the Exchange (typically 4 p.m. Eastern time, but sometimes earlier, as in the case of scheduled half-day trading or unscheduled suspensions of trading).
The portfolio continuously sells shares to each insurance company, without a sales charge, at the net asset value per share next determined after a proper purchase order is placed with the insurance company. The insurance company offers contract owners units in its separate accounts which directly correspond to shares in the portfolio. Each insurance company submits purchase and redemption orders to the portfolio based on allocation instructions for premium payments, transfer instructions and surrender or partial withdrawal requests for contract owners, as set forth in the accompanying prospectus for the contracts. These orders reflect the amount of premium payments to be invested, surrender and transfer requests, and other matters. Redemption orders are effected at the next net asset value per share determined after a proper redemption order is placed with the insurance company. Contract owners should look at their contract prospectuses for redemption procedures and fees.
Important information about buying and selling shares
| | • | | After receiving a contract owner’s order, the insurance company buys or sells shares at the net asset value next calculated on any day the portfolio is open for business. |
| | • | | Unless otherwise instructed, the portfolio normally makes payment of the proceeds from the sale of shares the next business day but always within seven calendar days. |
| | • | | The portfolio does not issue share certificates. |
| | • | | The portfolio reserves the right to reject purchases of shares for any reason. |
| | • | | The portfolio reserves the right to withdraw or suspend the offering of shares at any time. |
| | • | | The portfolio reserves the right to reject purchases of shares or to suspend or postpone redemptions at times when the New York Stock Exchange is closed (other than customary closings), trading is restricted or when an emergency exists that prevents the portfolio from disposing of its securities or pricing its shares. |
| | • | | The portfolio may refuse, cancel or rescind any purchase order; freeze any account (meaning the insurance company will not be able to purchase shares in its account); suspend account services; and/or involuntarily redeem the account if we think that the account is being used for fraudulent or illegal purposes by the insurance company; one or more of these actions will be taken when, at the sole discretion of the portfolio, they are deemed to be in the portfolio’s best interest or when the portfolio is requested or compelled to do so by governmental authority or by applicable law. |
| | • | | The portfolio may close and liquidate an account if the portfolio is unable to verify provided information, or for other reasons; if the portfolio decides to close the account, the shares will be redeemed at the net asset value per share next calculated after we determine to close the account; the insurance company may be subject to gain or loss on the redemption of the portfolio shares and may incur tax liability. |
| | • | | A contract owner’s purchase order may not be accepted if the sale of portfolio shares has been suspended or if it is determined that the purchase would be detrimental to the interests of the portfolio’s shareholders. |
| | • | | Currently, the Board of Trustees of DWS Variable Series II does not foresee any disadvantages to contract owners arising from the fact that the interests of contract owners may differ. Nevertheless, the Board intends to monitor events in order to identify any material irreconcilable conflicts that may possibly arise and to determine what action, if any, should be taken. |
12
Market Timing Policies and Procedures. Short-term and excessive trading of portfolio shares may present risks to the portfolio’s long-term shareholders, including potential dilution in the value of portfolio shares, interference with the efficient management of the portfolio (including losses on the sale of investments), taxable gains to remaining shareholders and increased brokerage and administrative costs. To the extent that the portfolio invests in such securities, the risks may be more pronounced for certain securities such as those that trade in foreign markets, are illiquid or do not otherwise have “readily available market quotations.” Certain investors may seek to employ short-term trading strategies aimed at exploiting variations in portfolio valuation that arise from the nature of the securities held by the portfolio (e.g., “time zone arbitrage”).
The portfolio discourages short-term and excessive trading. The portfolio will take steps to detect and deter short-term and excessive trading pursuant to the portfolio’s policies as described in this prospectus and approved by the Board.
The portfolio’s policies include:
| | • | | the portfolio reserves the right to reject or cancel a purchase or exchange order for any reason when, in the opinion of the advisor, there appears to be a pattern of short-term or excessive trading activity by a shareholder or any other trading activity deemed harmful or disruptive to the portfolio; and |
| | • | | the portfolio has adopted certain fair valuation practices reasonably designed to protect the portfolio from “time zone arbitrage” with respect to its foreign securities holdings and other trading practices that seek to exploit variations in portfolio valuation that arise from the nature of the securities held by the portfolio. (See “How the Portfolio Calculates Share Price.”) |
When a pattern of short-term or excessive trading activity or other trading activity deemed harmful or disruptive to the portfolio is detected in a particular separate account, the advisor will take steps to stop this activity by contacting the insurance company that maintains the accounts for the underlying contract holders and seeking to have the insurance company enforce the separate account’s policies on short-term or excessive trading, if any. In addition, the advisor and the portfolio reserves the right to terminate a separate account’s ability to invest in the portfolio if apparent short-term or excessive trading activity persists. The detection of these patterns and the banning of further trading are inherently subjective and therefore involve some selectivity in their application. The advisor seeks to make such determinations in a manner consistent with the interests of the portfolio’s long-term shareholders.
There is no assurance that these policies and procedures will be effective in limiting short-term and excessive trading in all cases. For example, the advisor may not be able to effectively monitor, detect or limit short-term or excessive trading by underlying shareholders that occurs through separate accounts maintained by insurance companies or other financial intermediaries. Depending on the amount of portfolio shares held in a particular separate account (which may represent most of the portfolio’s shares) short-term and/or excessive trading of portfolio shares could adversely affect long-term shareholders in the portfolio. It is important to note that the advisor and the portfolio does not have access to underlying shareholders’ trading activity and that investors will be subject to the policies and procedures of their insurance company with respect to short-term and excessive trading in the portfolio.
The portfolio’s policies and procedures may be modified or terminated at any time.
How to receive account information
If you are a contract owner, you should contact your insurance company or the organization that provides record keeping services for information about your account.
Please see the contract prospectus that accompanies this prospectus for the customer service phone number.
How to buy and sell shares
Each insurance company has different provisions about how and when their contract owners may buy and sell portfolio shares. Each insurance company is responsible for communicating its contract owners’ instructions to the portfolio. Contract owners should contact their insurance company to effect transactions in the portfolio.
13
How the Portfolio Calculates Share Price
To calculate net asset value per share, or NAV, the portfolio uses the following equation:
| | |
| TOTAL ASSETS - TOTAL LIABILITIES | | = NAV |
| TOTAL NUMBER OF SHARES OUTSTANDING | |
The price at which you buy and sell shares for the portfolio is the NAV.
We typically value securities using information furnished by an independent pricing service or market quotations, where appropriate. However, we may use methods approved by the portfolio’s Board, such as a fair valuation model, which are intended to reflect fair value when pricing service information or market quotations are not readily available or when a security’s value or a meaningful portion of the value of the portfolio is believed to have been materially affected by a significant event, such as a natural disaster, an economic event like a bankruptcy filing, or a substantial fluctuation in domestic or foreign markets, that has occurred between the close of the exchange or market on which the security is principally traded (for example, a foreign exchange or market) and the close of the New York Stock Exchange. In such a case, the portfolio’s value for a security is likely to be different from the last quoted market price or pricing service information. In addition, due to the subjective and variable nature of fair value pricing, it is possible that the value determined for a particular asset may be materially different from the value realized upon such asset’s sale. It is expected that the greater the percentage of portfolio assets that is invested in non-US securities, the more extensive will be the portfolio’s use of fair value pricing. This is intended to reduce the portfolio’s exposure to “time zone arbitrage” and other harmful trading practices. (See “Market Timing Policies and Procedures.”)
To the extent that the portfolio invests in securities that are traded primarily in foreign markets, the value of its holdings could change at a time when you aren’t able to buy or sell portfolio shares through the contract. This is because some foreign markets are open on days and at times when the portfolio doesn’t price its shares.
Distributions
The portfolio intends to declare and distribute dividends from its net investment income and capital gains, if any, annually. The portfolio may make additional distributions if necessary.
All distributions will be reinvested in shares of the portfolio unless we are informed by an insurance company that they should be paid out in cash. The insurance companies will be informed about the amount and character of distributions from the portfolio for federal income tax purposes.
Taxes
The portfolio intends to qualify each year as a regulated investment company under Subchapter M of the Internal Revenue Code of 1986, as amended, (the “Code”) and to meet all requirements necessary to avoid paying any federal income or excise taxes.
Generally, owners of variable annuity and variable life contracts are not taxed currently on income or gains realized with respect to such contracts. However, some distributions from such contracts, whether made prior to or during the annuity payment period, may be taxable at ordinary income tax rates. In addition, distributions made to an owner who is younger than 59 1/2 may be subject to a 10% penalty tax. For further information concerning federal income tax consequences for the holders of variable annuity contracts and variable life insurance policies, such holders should consult the prospectus used in connection with the issuance of their particular contracts or policies.
In order for investors to receive the favorable tax treatment available to holders of variable annuity and variable life contracts, the separate accounts underlying such contracts, as well as the funds in which such accounts invest, must meet certain diversification requirements. The portfolio intends to comply with these requirements. If the portfolio or separate account does not meet such requirements or otherwise fails to qualify as a regulated investment company for any taxable year, income allocable to the contracts associated with the separate account would be taxable currently to the holders of such contracts and income from prior periods with respect to such contracts also could be taxable, most likely in the year of the failure.
14
Under Treasury regulations, insurance companies holding the separate accounts must report to the Internal Revenue Service losses above a certain amount resulting from a sale or disposition of the portfolio’s share.
The discussion above is generally based on the assumption that shares of the portfolio will be respected as owned by insurance company separate accounts. If this is not the case (for example, because the Internal Revenue Service finds an impermissible level of “investor control” over the investment options underlying variable contracts), the advantageous tax treatment provided in respect of insurance company separate accounts under the Code will no longer be available, and the person or persons determined to own the portfolio shares will be currently taxed on portfolio distributions, and on the proceeds of any redemption of portfolio shares, under the Code rules.
Portfolio investments in securities of foreign issuers may be subject to withholding and other taxes at the source, including on dividend or interest payments. Participating insurance companies should consult their own tax advisors as to whether such distributions are subject to federal income tax if they are retained as part of policy reserves.
The portfolio’s investments in certain debt obligations may cause the portfolio to recognize taxable income in excess of the cash generated by such obligation. Thus, the portfolio could be required at times to liquidate other investments in order to satisfy its distribution requirements.
The preceding is a brief summary of certain of the relevant tax considerations. Because each shareholder and contract holder’s tax situation is unique, ask your tax professional about the tax consequences of your investments, including possible foreign, state or local taxes.
Marketing and Distribution Fees
DWS Scudder Distributors, Inc., a subsidiary of the investment advisor, is the portfolio’s distributor.
DWS Variable Series II has adopted a 12b-1 plan for all Class B shares. Under the plan, DWS Variable Series II may make quarterly payments to the distributor for distribution and shareholder servicing related expenses incurred or paid by the distributor or a participating insurance company. No such payment shall be made with respect to any quarterly period in excess of an amount determined for such period at the annual rate of 0.25% of the average daily net assets of Class B shares during that quarterly period. Depending on the participating insurance company’s corporate structure and applicable state law, the distributor may remit payments to the participating insurance company’s affiliated broker-dealers or other affiliated company rather than the participating insurance company itself.
Because 12b-1 fees for Class B shares are paid out of portfolio assets on an ongoing basis, they will, over time, increase the cost of investment in Class B shares and may cost more than other types of sales charges.
Examples of expenses payable under the plan include the costs of printing and mailing materials (such as portfolio prospectuses, shareholder reports, portfolio advertisements and sales literature), holding seminars and sales meetings, providing customer service to policyholders and sales compensation.
15
To Get More Information
Shareholder reports — These include commentary from the portfolio’s management team about recent market conditions and the portfolio’s performance. They also have detailed performance figures, a list of everything the portfolio owns and its financial statements. Shareholders get these reports automatically.
Statement of Additional Information (SAI) — This tells you more about the portfolio’s features and policies, including additional risk information. The SAI is incorporated by reference into this document (meaning that it’s legally part of this prospectus).
For a free copy of any of these documents or to request other information about the portfolio, call (800) 778-1482, or contact DWS Scudder at the address listed below. The portfolio’s SAI and shareholder reports are also available through the DWS Scudder Web site at www.dws-scudder.com. These documents and other information about the portfolio are available from the EDGAR Database on the SEC’s Web site at www.sec.gov. If you like, you may obtain copies of this information, after paying a copying fee, by e-mailing a request to publicinfo@sec.gov or by writing the SEC at the address listed below. You can also review and copy these documents and other information about the portfolio, including the portfolio’s SAI, at the SEC’s Public Reference Room in Washington, D.C. Information on the operation of the SEC’s Public Reference Room may be obtained by calling (202) 551-5850.
| | |
| DWS Scudder Distributors, Inc. | | SEC |
| |
| 222 South Riverside Plaza | | 100 F Street, N.E. |
| Chicago, IL 60606-5808 | | Washington, D.C. 20549-2001 |
| (800) 778-1482 | | (202) 551-5850 |
| |
| | www.sec.gov |
| |
| | SEC File # |
| DWS Variable Series II | | 811-5002 |
MAY 1, 2006
PROSPECTUS
DWS VARIABLE SERIES II
(formerly Scudder Variable Series II)
CLASS B SHARES
DWS Conservative Allocation VIP
(formerly Scudder Income & Growth Strategy Portfolio)
This prospectus should be read in conjunction with the variable life insurance or variable annuity contract prospectus and plan documents for tax-qualified plans. These shares are available and are being marketed exclusively as a pooled funding vehicle for life insurance companies writing all types of variable life insurance policies and variable annuity contracts.
The Securities and Exchange Commission (SEC) does not approve or disapprove these shares or determine whether the information in this prospectus is truthful or complete. It is a criminal offense for anyone to inform you otherwise.
ONE GLOBAL FORCE. ONE FOCUS. YOU. [DWS SCUDDER Logo]
Deutsche Bank Group
Table of Contents
How the Portfolio Works
The portfolio is designed to serve as an investment option for certain variable annuity contracts, variable life insurance policies and tax-qualified plans. Your investment in the portfolio is made in conjunction with one of these contracts or policies.
Remember that the portfolio is not a bank deposit. It’s not insured or guaranteed by the FDIC or any other government agency. Its share price will go up and down and you could lose money by investing in the portfolio.
Please read this prospectus in conjunction with the prospectus for your variable life insurance policy or variable annuity contract or plan documents for tax-qualified plans.
DWS Conservative Allocation VIP
(formerly Scudder Income & Growth Strategy Portfolio)
The Portfolio’s Main Investment Strategy
The portfolio seeks a balance of current income and long-term growth of capital with an emphasis on current income. It does this by investing in a portfolio of other DWS portfolios (“underlying portfolios”) that invest across a range of asset classes, utilizing a wide variety of securities and investment styles. The portfolio will always invest in the share class of an underlying portfolio with the lowest fees and expenses.
For DWS Conservative Allocation VIP, the portfolio’s target allocation is as follows:
| | • | | 60% in underlying portfolios which invest primarily in fixed-income securities of all credit qualities and maturities (“fixed-income portfolios”). |
| | • | | 40% in underlying portfolios which invest primarily in equity securities of all capitalization levels (“equity portfolios”). |
The portfolio managers have the flexibility to adjust this allocation within the following ranges:
| | • | | 45-75% in fixed-income portfolios. |
| | • | | 25-55% in equity portfolios. |
While the actual allocation may vary, the portfolio managers expect that over the long term it will average out to be similar to the target allocation.
The portfolio managers regularly review the actual allocation and may adjust it in seeking to take advantage of current or expected market conditions or to manage risk. In making their allocation decisions, the managers use a proprietary mix of qualitative and quantitative inputs to arrive at a view for the securities markets and segments of those markets. Based on the desired exposure to particular investments and a thorough risk analysis, the managers then decide which portfolios to use as underlying portfolios and in which proportions.
It is expected that, in the future, the managers may invest in instruments, commonly called “derivatives,” including, but not limited to, futures and forward currency exchange contracts, to attempt to manage risk and enhance returns. Derivatives may be used to hedge the portfolio against price fluctuations and otherwise reduce risk. Derivatives may also be used to increase the portfolio’s exposure to certain markets in an attempt to enhance returns. These strategies may be used separately or in combination. The managers may also use these derivatives strategies to help maintain cash reserves or otherwise liquid assets to meet shareholder redemptions, or for other needs, while maintaining exposure to the markets. The managers will determine which derivative instruments to purchase by using a quantitative strategy that incorporates data from various international markets. The strategy seeks to shift the emphasis on the portfolio’s holdings in response to short- and medium-term changes in global markets. The use of the strategy is subject to Board approval. Shareholders will be notified prior to the use of the strategy.
The underlying portfolios use a broad array of investment styles. These portfolios can buy many types of securities, among them common stocks of companies of any size, corporate bonds of varying credit quality, US government and agency bonds, mortgage- and asset-backed securities, money market instruments and others. These securities are mainly from US issuers but may be, to a more limited extent, from foreign issuers.
As a temporary defensive measure, the portfolio could shift up to 100% of assets into investments such as money market securities. This could prevent losses, but, while engaged in a temporary defensive position, the portfolio will not be pursuing its investment objective. However, the managers may choose not to use these strategies for various reasons, even in very volatile market conditions.
The Main Risks of Investing in the Portfolio
There are several risk factors that could hurt the portfolio’s performance, cause you to lose money or cause the portfolio’s performance to trail that of other investments. The portfolio’s allocations among the underlying portfolios will change over time, causing corresponding changes in the portfolio’s risk profile.
3
Asset Allocation Risk. Although asset allocation among different asset classes generally limits risk and exposure to any one class, the risk remains that the investment advisor may favor an asset class that performs poorly relative to the other asset classes. For example, deteriorating stock market conditions might cause an overall weakness in the market that reduces the absolute level of stock prices in that market. Under these circumstances, if the portfolio was invested primarily in underlying portfolios that emphasize stocks, it would perform poorly relative to a portfolio invested primarily in bonds.
Reallocation Risk. From time to time, one or more underlying portfolios may experience relatively large investments or redemptions due to reallocations or rebalancings of the portfolios by the managers. These transactions will affect the underlying portfolios, since underlying portfolios that experience redemptions as a result of reallocations or rebalancings may have to sell securities and underlying portfolios that receive additional cash will have to invest such cash. In addition, a large redemption by a portfolio in a specific underlying portfolio could also hurt the performance of another portfolio currently invested in the same underlying portfolio. While it is impossible to predict the overall impact of these transactions over time, there could also be adverse effects on a portfolio’s performance to the extent that the underlying portfolios may be required to sell securities or invest cash at times when they would otherwise not do so. These transactions could also accelerate the realization of taxable income if sales of securities resulted in gains and could also increase transaction costs for the underlying portfolios. The managers are committed to minimizing such impact on the underlying portfolios to the extent consistent with pursuing the investment objective of a portfolio. The managers will at all times monitor the impact on the underlying portfolios of transactions by a portfolio.
Focused Investment Risk. Overall risk can be reduced by industry or geographic diversification, and increased by focusing investments in a limited number of geographic regions or in industries with high positive correlations to one another (e.g., different industries within broad sectors, such as technology or financial services). An underlying portfolio that focuses its investments in the securities of issuers in industries with high positive correlations to one another may be particularly vulnerable to events affecting companies in those industries because the companies may share common characteristics, are often subject to similar business risks and regulatory burdens, and often react similarly to specific economic, market, political, or other developments. Similarly, underlying portfolios that invest significant portions of their assets in a narrowly defined geographic region or in a particular foreign country may be particularly vulnerable to events affecting companies located in that region or country because the companies may share common characteristics, are often subject to similar business risks and regulatory burdens, and often react similarly to specific economic, market, political or other developments.
Credit Risk. An underlying portfolio purchasing bonds faces the risk that the issuer or guarantor of a debt security or the other party to an over-the-counter transaction will be unable or unwilling to make timely payments of interest or principal, or otherwise to honor its obligations. The degree of this risk for a particular security may be reflected in its credit rating. This risk is greater with junk and foreign bonds because of the difficulties of requiring foreign entities, including issuers of sovereign debt, to honor their contractual commitments, and because a number of foreign governments and other foreign issuers are already in default. In addition, because the issuers of high yield bonds (rated below the fourth highest category) may be in uncertain financial health, the prices of their bonds are generally more vulnerable to bad economic news or even the expectation of bad news, than those of investment-grade bonds. In some cases, bonds, particularly junk bonds, may decline in credit quality or go into default.
Interest Rate Risk. Generally, fixed income securities will decrease in value when interest rates rise. The longer the effective maturity of an underlying portfolio’s securities, the more sensitive it will be to interest rate changes. (As a general rule, a 1% rise in interest rates means a 1% fall in value for every year of duration.) As interest rates decline, the issuers of securities held by an underlying portfolio may prepay principal earlier than scheduled, forcing the underlying portfolio to reinvest in lower yielding securities. Prepayment may reduce the underlying portfolio’s income. As interest rates increase, fewer issuers tend to prepay, which may extend the average life of fixed income securities and have the effect of locking in a below-market interest rate, increasing the underlying portfolio’s effective duration and reducing the value of the security. Because an underlying portfolio may invest in mortgage-related securities, the portfolio is more vulnerable to both of these risks.
4
Stock Market Risk. An important factor for the underlying portfolios is how stock markets perform. Because a stock represents ownership in its issuer, stock prices can be hurt by poor management, shrinking product demand and other business risks. These may affect single companies as well as groups of companies. In addition, movements in financial markets may adversely affect a stock’s price, regardless of how well the company performs. The market as a whole may not favor the types of investments an underlying portfolio makes and the underlying portfolio may not be able to get attractive prices for them.
Foreign Investment Risk. Foreign investments involve certain special risks, including:
| | • | | Political Risk. Some foreign governments have limited the outflow of profits to investors abroad, imposed restrictions on the exchange or export of foreign currency, extended diplomatic disputes to include trade and financial relations, seized foreign investment and imposed high taxes. |
| | • | | Information Risk. Companies based in foreign markets are usually not subject to accounting, auditing and financial reporting standards and practices as stringent as those in the US. Therefore, their financial reports may present an incomplete, untimely or misleading picture of a foreign company, as compared to the financial reports of US companies. |
| | • | | Liquidity Risk. Investments that trade less can be more difficult or more costly to buy, or to sell, than more liquid or active investments. This liquidity risk is a factor of the trading volume of a particular investment, as well as the size and liquidity of the entire local market. On the whole, foreign exchanges are smaller and less liquid than the US market. This can make buying and selling certain investments more difficult and costly. Relatively small transactions in some instances can have a disproportionately large effect on the price and supply of securities. In certain situations, it may become virtually impossible to sell an investment in an orderly fashion at a price that approaches the managers’ estimate of its value. For the same reason, it may at times be difficult to value an underlying portfolio’s foreign investments. |
| | • | | Regulatory Risk. There is generally less government regulation of foreign markets, companies and securities dealers than in the US. |
| | • | | Currency Risk. An underlying portfolio may invest in securities denominated in foreign currencies. This creates the possibility that changes in exchange rates between foreign currencies and the US dollar will affect the US dollar value of foreign securities or the income or gain received on these securities. |
| | • | | Limited Legal Recourse Risk. Legal remedies for investors may be more limited than the remedies available in the US. |
| | • | | Trading Practice Risk. Brokerage commissions and other fees may be higher for foreign investments than for US investments. The procedures and rules governing foreign transactions and custody may also involve delays in payment, delivery or recovery of money or investments. |
| | • | | Taxes. Foreign withholding and certain other taxes may reduce the amount of income available to distribute to shareholders of the portfolio. In addition, special US tax considerations may apply to the portfolio’s foreign investments. |
Emerging Market Risk. All of the risks of investing in foreign securities, as discussed above, are increased in connection with investments in emerging markets securities. In addition, profound social changes and business practices that depart from norms in developed countries’ economies have hindered the orderly growth of emerging economies and their markets in the past and have caused instability. High levels of debt tend to make emerging economies heavily reliant on foreign capital and vulnerable to capital flight. These countries are also more likely to experience high levels of inflation, deflation or currency devaluation, which could also hurt their economies and securities markets. For these and other reasons, investments in emerging markets are often considered speculative.
Derivatives Risk. Risks associated with derivatives include: the risk that the derivative is not well correlated with the security, index or currency for which it is acting as a substitute; derivatives used for risk management may not have the intended effects and may result in losses or missed opportunities; the risk that the portfolio or an underlying portfolio will be unable to sell the derivative because of an illiquid secondary market; the risk that a counterparty is unwilling or unable to meet its obligation; the risk of interest rate movements; and the risk that the derivatives transaction could expose the portfolio or an underlying portfolio to the effects of leverage, which could increase the portfolio’s exposure to the market and magnify potential losses that it could have if it or an underlying portfolio had not entered into these transactions. There is no guarantee that these derivatives activities will be employed or that they will work, and their use could cause lower returns or even losses to the portfolio.
5
Securities Lending Risk. Any loss in the market price of securities loaned by an underlying portfolio that occurs during the term of the loan would be borne by the underlying portfolio and would adversely affect that underlying portfolio’s performance. Also, there may be delays in recovery of securities loaned or even a loss of rights in the collateral should the borrower of the securities fail financially while the loan is outstanding. However, loans will be made only to borrowers selected by the underlying portfolio’s delegate after a review of relevant facts and circumstances, including the creditworthiness of the borrower.
Pricing Risk. At times, market conditions might make it hard to value some investments. For example, if the portfolio or an underlying portfolio has valued its securities too highly, you may end up paying too much for shares when you buy into the portfolio. If the portfolio or an underlying portfolio underestimates their price, you may not receive the full market value for your shares when you sell.
Other factors that could affect performance are:
| | • | | the managers of the portfolio or the underlying portfolios could be incorrect in their analysis of economic trends, countries, industries, companies, the relative attractiveness of asset classes or other matters; and |
| | • | | the underlying portfolios may trade securities more actively than comparable portfolios. Upon the use of the derivatives strategy, the portfolio may also trade derivative instruments more actively than comparable portfolios. Any of these cases could raise transactions costs and thereby lower returns. |
This portfolio is designed for investors who are interested in a relatively conservative balanced asset allocation investment.
Performance
While a portfolio’s past performance isn’t necessarily a sign of how it will do in the future, it can be valuable for an investor to know.
The table shows how average annual returns for the portfolio’s Class B shares compare with two broad-based market indices (which, unlike the portfolio, do not have any fees or expenses). The performance of both the portfolio and the indices vary over time. All figures on this page assume reinvestment of dividends and distributions.
This information doesn’t reflect charges and fees associated with the separate account that invests in the portfolio or any variable life insurance policy or variable annuity contract for which the portfolio is an investment option. These charges and fees will reduce returns.
Annual Total Returns (%) as of 12/31 each year — Class B shares
THE ORIGINAL DOCUMENT CONTAINS A BAR CHART HERE
BAR CHART DATA:
For the period included in the bar chart:
| | |
Best Quarter: 2.28%, Q2 2005 | | Worst Quarter: -1.08%, Q1 2005 |
| |
2006 Total Return as of March 31: 2.48% | | |
6
Average Annual Total Returns (%) as of 12/31/2005
| | | | |
| | | 1 Year | | Since Inception* |
Portfolio — Class B | | 4.38 | | 8.09 |
Index 1 | | 2.43 | | 2.75 |
Index 2 | | 6.27 | | 13.33 |
Index 1: The Lehman Brothers Aggregate Bond Index is an unmanaged market value-weighted measure of treasury issues, corporate bond issues and mortgage securities.
Index 2: The Russell 1000 Index is an unmanaged capitalization-weighted price-only index composed of the largest-capitalized US companies whose common stocks are traded in the United States.
| * | Since 8/16/04. Index comparisons begin 8/31/04. |
Total returns would have been lower if operating expenses hadn’t been reduced.
Current performance information may be higher or lower than the performance data quoted above. For more recent performance information, contact your participating insurance company.
How Much Investors Pay
This table describes the fees and expenses that you may pay if you buy and hold portfolio shares. The portfolio’s shareholders directly bear the fees and expenses of the portfolio, subject to the contractual obligations of the advisor, underwriter and accounting agent to waive fees or reimburse expenses to maintain the portfolio’s operating expenses at a specified level. The portfolio will indirectly bear its proportionate share of fees and expenses incurred by the underlying portfolios in which the portfolio is invested (see “Range of Average Weighted Net Expense Ratios” in the table below). The information in the table does not reflect charges and fees associated with the separate account that invests in the portfolio or any variable life insurance policy or variable annuity contract for which the portfolio is an investment option. These charges and fees will increase expenses.
| | |
Fee Table | | Class B |
Annual Operating Expenses, deducted from portfolio assets | | |
Management Fee | | 0.15% |
Distribution/Service (12b-1) Fee | | 0.25 |
Other Expenses | | 0.54 |
| | |
Total Annual Operating Expenses(1) | | 0.94 |
| | |
Range of Average Weighted Net Expense Ratios for underlying portfolios(2) | | 0.65% to 0.84% |
Estimated Total Annual Direct and Indirect Operating Expenses(3) | | 1.60% |
| (1) | Through November 30, 2006, the advisor, underwriter and accounting agent have each contractually agreed to waive their respective fees to the extent necessary to maintain the portfolio’s direct operating expenses at 0.75% of average daily net assets, excluding certain expenses such as extraordinary expenses, taxes, brokerage and interest. |
| (2) | Certain ratios reduced for contractual expense limitations and/or reimbursements where applicable, based on the most recent prospectuses. |
| (3) | The Estimated Total Annual Direct and Indirect Operating Expenses shown in the table is the sum of the portfolio’s Total Annual Operating Expenses and the underlying portfolios’ estimated Indirect Expenses. |
Based on the costs above, this example helps you compare the expenses of Class B shares to those of other mutual funds. This example assumes the expenses above remain the same. It also assumes that you invested $10,000, earned 5% annual returns, reinvested all dividends and distributions, and sold your shares at the end of each period. This is only an example; actual expenses will be different.
| | | | | | | | | | | | |
Example | | 1 Year | | 3 Years | | 5 Years | | 10 Years |
Class B shares | | $ | 163 | | $ | 505 | | $ | 871 | | $ | 1,900 |
7
The Portfolio Managers
The portfolio is managed by a team of investment professionals who each play an important role in the portfolio’s management process. This team works for the advisor or its affiliates and is supported by a large staff of economists, research analysts, traders and other investment specialists. The advisor or its affiliates believe(s) its team approach benefits portfolio investors by bringing together many disciplines and leveraging its extensive resources.
The portfolio is managed by a team of investment professionals who collaborate to develop and implement the portfolio’s investment strategy. Each portfolio manager on the team has authority over all aspects of the portfolio’s investment portfolio, including but not limited to, purchases and sales of individual securities, portfolio construction techniques, portfolio risk assessment and the management of daily cash flows in accordance with portfolio holdings.
The following people handle the day-to-day management of the portfolio:
| | |
Inna Okounkova Director of Deutsche Asset Management and Portfolio Manager of the portfolio. • Global Asset Allocation portfolio manager: New York. • Joined Deutsche Asset Management in 1999 as a quantitative analyst, becoming an associate portfolio manager in 2001. • BS, MS, Moscow State University; MBA, University of Chicago. • Joined the portfolio in 2004. | | Robert Wang Managing Director of Deutsche Asset Management and Portfolio Manager of the’ portfolio. • Global Asset Allocation senior portfolio manager: New York. • Joined Deutsche Asset Management in 1995 as a senior fixed income portfolio manager after 13 years of experience at J.P. Morgan & Co. trading fixed income, derivatives and foreign exchange products. • BS, The Wharton School, University of Pennsylvania. • Joined the portfolio in 2004. |
The portfolio’s Statement of Additional Information provides additional information about the portfolio managers’ investments in the portfolio, a description of their compensation structure and information regarding other accounts they manage.
8
Financial Highlights
This table is designed to help you understand the portfolio’s financial performance. The figures in the first part of the table are for a single share. The total return figures represent the percentage that an investor in the portfolio would have earned (or lost), assuming all dividends and distributions were reinvested. This information has been audited by Ernst & Young LLP, independent registered public accounting firm, whose report, along with the portfolio’s financial statements, is included in the portfolio’s annual report (see “Shareholder reports” on the back cover).
The following table includes selected data for a share outstanding throughout each period and other performance information derived from the financial statements.
This information doesn’t reflect charges and fees associated with the separate account that invests in the portfolio or any variable life insurance policy or variable annuity contract for which the portfolio is an investment option. These charges and fees will reduce returns.
DWS Conservative Allocation VIP
| | | | | | | | |
Years Ended December 31, | | 2005 | | | 2004^a | |
Selected Per Share Data | | | | | | | | |
Net asset value, beginning of period | | $ | 10.66 | | | $ | 10.00 | |
Income (loss) from investment operations: | | | | | | | | |
Net investment income (loss)^b | | | .19 | | | | (.03 | ) |
Net realized and unrealized gain (loss) on investment transactions | | | .28 | | | | .69 | |
| | | | | | | | |
Total from investment operations | | | .47 | | | | .66 | |
| | | | | | | | |
Less distributions from: | | | | | | | | |
Net realized gains on investment transactions | | | (.03 | ) | | | — | |
Net asset value, end of period | | $ | 11.10 | | | $ | 10.66 | |
| | | | | | | | |
Total Return (%)^c,^d | | | 4.38 | | | | 6.60 | * |
| | | | | | | | |
Ratios to Average Net Assets and Supplemental Data | | | | | | | | |
Net assets, end of period ($ millions) | | | 46 | | | | 14 | |
Ratio of expenses before expense reductions (%)^e | | | .94 | | | | 2.96 | * |
Ratio of expenses after expense reductions (%)^e | | | .75 | | | | .75 | * |
Ratio of net investment income (%) | | | 1.73 | | | | (.67 | )* |
Portfolio turnover rate (%) | | | 27 | | | | 18 | * |
| ^a | For the period from August 16, 2004 (commencement of operations) to December 31, 2004. |
| ^b | Based on average shares outstanding during the period. |
| ^c | Total return would have been lower had certain expenses not been reduced. |
| ^d | Total return would have been lower if the Advisor had not maintained some Underlying Portfolios’ expenses. |
| ^e | The Portfolio invests in other DWS Portfolios and indirectly bears its proportionate share of fees and expenses incurred by the Underlying DWS Portfolios in which the Portfolio is invested. |
9
Other Policies and Risks
While the previous pages describe the main points of the portfolio’s strategy and risks, there are a few other issues to know about:
| | • | | The portfolio may trade securities actively. This strategy could raise transaction costs and, accordingly, lower performance. |
| | • | | The advisor may establish a debt security’s credit quality when it buys a security, using independent ratings, or for unrated securities, its own credit determination. When ratings don’t agree, a portfolio may use the higher rating. If a security’s credit quality falls, the advisor will determine whether selling it would be in the portfolio’s best interest. |
The portfolio’s complete portfolio holdings as of the end of each calendar month are posted on www.dws-scudder.com ordinarily on the 15th day of the following calendar month or the first business day thereafter. This posted information generally remains accessible at least until the portfolio files its Form N-CSR or N-Q with the Securities and Exchange Commission for the period that includes the date as of which the www.dws-scudder.com information is current (expected to be at least three months). The portfolios’ Statement of Additional Information includes a description of the portfolio’s policies and procedures with respect to the disclosure of the portfolio’s holdings.
This prospectus doesn’t tell you about every policy or risk of investing in the portfolio. If you want more information on the portfolio’s allowable securities and investment practices and the characteristics and risks of each one, you may want to request a copy of the Statement of Additional Information (the back cover tells you how to do this).
Keep in mind that there is no assurance that any mutual fund will achieve its goal.
Investment Advisor
DWS Scudder is part of Deutsche Asset Management, which is the marketing name in the US for the asset management activities of Deutsche Bank AG, Deutsche Investment Management Americas Inc. (“DeIM” or the “advisor”), Deutsche Asset Management, Inc., Deutsche Bank Trust Company Americas and DWS Trust Company.
Deutsche Asset Management is a global asset management organization that offers a wide range of investing expertise and resources, including hundreds of portfolio managers and analysts and an office network that reaches the world’s major investment centers. This well-resourced global investment platform brings together a wide variety of experience and investment insight, across industries, regions, asset classes and investing styles.
DeIM is an indirect, wholly owned subsidiary of Deutsche Bank AG. Deutsche Bank AG is a major global banking institution that is engaged in a wide range of financial services, including investment management, mutual fund, retail, private and commercial banking, investment banking and insurance.
DeIM is the investment advisor for the portfolio. Under the supervision of the Board of Trustees, DeIM, with headquarters at 345 Park Avenue, New York, NY 10154, makes the portfolio’s investment decisions, buys and sells securities for the portfolio and conducts research that leads to these purchase and sale decisions. DeIM and its predecessors have more than 80 years of experience managing mutual funds and DeIM provides a full range of investment advisory services to institutional and retail clients. DeIM is also responsible for selecting brokers and dealers and for negotiating brokerage commissions and dealer charges.
The portfolio’s shareholder report for the year ended December 31, 2005 contains a discussion regarding the basis for the Board of Trustees’ approval of the portfolio’s investment management agreement (see “Shareholder reports” on the back cover).
The advisor receives a management fee from the portfolio. Below is the actual rate paid by the portfolio during the most recent fiscal year, as a percentage of the portfolio’s average daily net assets:
| | | |
Portfolio Name | | Fee Paid | |
DWS Conservative Allocation VIP* | | 0.10 | % |
| * | Reflecting the effect of expense limitations and/or fee waivers then in effect. |
10
Market timing related regulatory and litigation matters
Since at least July 2003, federal, state and industry regulators have been conducting ongoing inquiries and investigations (“inquiries”) into the mutual fund industry, and have requested information from numerous mutual fund companies, including DWS Scudder. The DWS funds’ advisors have been cooperating in connection with these inquiries and are in discussions with the regulators concerning proposed settlements. Publicity about mutual fund practices arising from these industrywide inquiries serves as the general basis of a number of private lawsuits against the DWS funds. These lawsuits, which previously have been reported in the press, involve purported class action and derivative lawsuits, making various allegations and naming as defendants various persons, including certain DWS funds, the funds’ investment advisors and their affiliates, and certain individuals, including in some cases fund Trustees/Directors, officers, and other parties. Each DWS fund’s investment advisor has agreed to indemnify the applicable DWS funds in connection with these lawsuits, or other lawsuits or regulatory actions that may be filed making allegations similar to these lawsuits regarding market timing, revenue sharing, fund valuation or other subjects arising from or related to the pending inquiries. It is not possible to determine with certainty what the outcome of these inquiries will be or what the effect, if any, would be on the funds or their advisors.
With respect to the lawsuits, based on currently available information, the funds’ investment advisors believe the likelihood that the pending lawsuits will have a material adverse financial impact on a DWS fund is remote and such actions are not likely to materially affect their ability to perform under their investment management agreements with the DWS funds.
With respect to the regulatory matters, Deutsche Asset Management (“DeAM”) has advised the funds as follows:
DeAM expects to reach final agreements with regulators early in 2006 regarding allegations of improper trading in the DWS funds. DeAM expects that it will reach settlement agreements with the Securities and Exchange Commission, the New York Attorney General and the Illinois Secretary of State providing for payment of disgorgement, penalties, and investor education contributions totaling approximately $134 million. Approximately $127 million of this amount would be distributed to shareholders of the affected DWS funds in accordance with a distribution plan to be developed by an independent distribution consultant. DeAM does not believe that any of the DWS funds will be named as respondents or defendants in any proceedings. The funds’ investment advisors do not believe these amounts will have a material adverse financial impact on them or materially affect their ability to perform under their investment management agreements with the DWS funds. The above-described amounts are not material to Deutsche Bank, and they have already been reserved.
Based on the settlement discussions thus far, DeAM believes that it will be able to reach a settlement with the regulators on a basis that is generally consistent with settlements reached by other advisors, taking into account the particular facts and circumstances of market timing at DeAM and at the legacy Scudder and Kemper organizations prior to their acquisition by DeAM in April 2002. Among the terms of the expected settled orders, DeAM would be subject to certain undertakings regarding the conduct of its business in the future, including maintaining existing management fee reductions for certain funds for a period of five years. DeAM expects that these settlements would resolve regulatory allegations that it violated certain provisions of federal and state securities laws (i) by entering into trading arrangements that permitted certain investors to engage in market timing in certain DWS funds and (ii) by failing more generally to take adequate measures to prevent market timing in the DWS funds, primarily during the 1999-2001 period. With respect to the trading arrangements, DeAM expects that the settlement documents will include allegations related to one legacy DeAM arrangement, as well as three legacy Scudder and six legacy Kemper arrangements. All of these trading arrangements originated in businesses that existed prior to the current DeAM organization, which came together in April 2002 as a result of the various mergers of the legacy Scudder, Kemper and Deutsche fund groups, and all of the arrangements were terminated prior to the start of the regulatory investigations that began in the summer of 2003. No current DeAM employee approved the trading arrangements.
11
There is no certainty that the final settlement documents will contain the foregoing terms and conditions. The independent Trustees/Directors of the DWS funds have carefully monitored these regulatory investigations with the assistance of independent legal counsel and independent economic consultants. Additional information announced by DeAM regarding the terms of the expected settlements will be made available at www.dws-scudder.com/regulatory_settlements, which will also disclose the terms of any final settlement agreements once they are announced.
Other regulatory matters
DeAM is also engaged in settlement discussions with the Enforcement Staffs of the SEC and the NASD regarding DeAM’s practices during 2001-2003 with respect to directing brokerage commissions for portfolio transactions by certain DWS funds to broker-dealers that sold shares in the DWS funds and provided enhanced marketing and distribution for shares in the DWS funds. In addition, on January 13, 2006, DWS Scudder Distributors, Inc. received a Wells notice from the Enforcement Staff of the NASD regarding DWS Scudder Distributors’ payment of non-cash compensation to associated persons of NASD member firms, as well as DWS Scudder Distributors’ procedures regarding non-cash compensation regarding entertainment provided to such associated persons. Additional information announced by DeAM regarding the terms of the expected settlements will be made available at www.dws-scudder.com/regulatory_settlements, which will also disclose the terms of any final settlement agreements once they are announced.
12
Your Investment in the Portfolio
The information in this section may affect anyone who selects the portfolio as an investment option in a variable annuity contract or variable life insurance policy that offers the portfolio. These contracts and policies are described in separate prospectuses issued by participating insurance companies. The portfolio assumes no responsibility for such prospectuses.
Policies about transactions
The information in this prospectus applies to Class B shares of the portfolio. Class B shares are offered at net asset value and are subject to a 12b-1 fee. The portfolio has another class of shares which is offered separately.
Technically, the shareholders of DWS Variable Series II (which includes the portfolio just described) are the participating insurance companies (the “insurance companies”) that offer the portfolio as a choice for holders of certain variable annuity contracts or variable life insurance policies (the “contract(s)”) issued or sponsored by the insurance companies. The insurance companies effectively pass through the ownership of portfolio shares to their contract owners and some may pass through voting rights as well. The portfolio does not sell shares directly to the public. The portfolio sells shares only to separate accounts of insurance companies. As a contract owner, your premium payments are allocated to the portfolio by the insurance companies in accordance with your contract. Please see the contract prospectus that accompanies this prospectus for a detailed explanation of your contract.
Please bear in mind that there are important differences between funds available to any investor (a “Retail Fund”) and those that are only available through certain financial institutions, such as insurance companies. For example, Retail Funds, unlike the portfolio, are not sold to insurance company separate accounts to support investments in variable insurance contracts. In addition, the investment objectives, policies and strategies of the portfolio, while similar to those of a Retail Fund, may not be identical. Retail Funds may be smaller or larger than the portfolio and have different expense ratios than the portfolio. As a result, the performance of the portfolio and a Retail Fund will differ.
Should any conflict between contract owners arise that would require that a substantial amount of net assets be withdrawn from the portfolio, orderly portfolio management could be disrupted to the potential detriment of contract owners in the portfolio.
The portfolio has a verification process for new insurance company accounts to help the government fight the funding of terrorism and money laundering activities. Federal law requires all financial institutions to obtain, verify and record information that identifies each insurance company that opens an account. What this means to you: when an insurance company opens an account, the portfolio will ask for its name, address and other information that will allow the portfolio to identify the company. This information will be verified to ensure the identity of all insurance companies opening an account.
For certain insurance companies, a portfolio might request additional information (for instance, the portfolio would ask for documents such as the insurance company’s articles of incorporation) to help the portfolio verify the insurance company’s identity.
The portfolio will not complete the purchase of any shares for an account until all information has been provided and the application has been submitted in “good order.” Once the application is determined to be in good order, the purchase(s) will be effected at the net asset value per share next calculated.
The portfolio may reject a new account application if the insurance company doesn’t provide any required or requested identifying information, or for other reasons.
13
The advisor, DWS Scudder Distributors, Inc. and/or their affiliates may pay additional compensation from their own assets to other persons for selling, distributing and/or servicing portfolio shares. This compensation may be significant. You should talk to your insurance company to determine if this compensation influenced the financial advisor’s recommendation of the portfolio.
Buying and Selling Shares
The portfolio is open for business each day the New York Stock Exchange is open. The portfolio calculates its share price every business day, as of the close of regular trading on the Exchange (typically 4 p.m. Eastern time, but sometimes earlier, as in the case of scheduled half-day trading or unscheduled suspensions of trading).
The portfolio continuously sells shares to each insurance company, without a sales charge, at the net asset value per share next determined after a proper purchase order is placed with the insurance company. The insurance company offers contract owners units in its separate accounts which directly correspond to shares in the portfolio. Each insurance company submits purchase and redemption orders to the portfolio based on allocation instructions for premium payments, transfer instructions and surrender or partial withdrawal requests for contract owners, as set forth in the accompanying prospectus for the contracts. These orders reflect the amount of premium payments to be invested, surrender and transfer requests, and other matters. Redemption orders are effected at the next net asset value per share determined after a proper redemption order is placed with the insurance company. Contract owners should look at their contract prospectuses for redemption procedures and fees.
Important information about buying and selling shares
| | • | | After receiving a contract owner’s order, the insurance company buys or sells shares at the net asset value next calculated on any day the portfolio is open for business. |
| | • | | Unless otherwise instructed, the portfolio normally makes payment of the proceeds from the sale of shares the next business day but always within seven calendar days. |
| | • | | The portfolio does not issue share certificates. |
| | • | | The portfolio reserves the right to reject purchases of shares for any reason. |
| | • | | The portfolio reserves the right to withdraw or suspend the offering of shares at any time. |
| | • | | The portfolio reserves the right to reject purchases of shares or to suspend or postpone redemptions at times when the New York Stock Exchange is closed (other than customary closings), trading is restricted or when an emergency exists that prevents the portfolio from disposing of its securities or pricing its shares. |
| | • | | The portfolio may refuse, cancel or rescind any purchase order; freeze any account (meaning the insurance company will not be able to purchase shares in its account); suspend account services; and/or involuntarily redeem the account if we think that the account is being used for fraudulent or illegal purposes by the insurance company; one or more of these actions will be taken when, at the sole discretion of the portfolio, they are deemed to be in the portfolio’s best interest or when the portfolio is requested or compelled to do so by governmental authority or by applicable law. |
| | • | | The portfolio may close and liquidate an account if the portfolio is unable to verify provided information, or for other reasons; if the portfolio decides to close the account, the shares will be redeemed at the net asset value per share next calculated after we determine to close the account; the insurance company may be subject to gain or loss on the redemption of the portfolio shares and may incur tax liability. |
| | • | | A contract owner’s purchase order may not be accepted if the sale of portfolio shares has been suspended or if it is determined that the purchase would be detrimental to the interests of the portfolio’s shareholders. |
| | • | | Currently, the Board of Trustees of DWS Variable Series II does not foresee any disadvantages to contract owners arising from the fact that the interests of contract owners may differ. Nevertheless, the Board intends to monitor events in order to identify any material irreconcilable conflicts that may possibly arise and to determine what action, if any, should be taken. |
14
Market Timing Policies and Procedures. Short-term and excessive trading of portfolio shares may present risks to the portfolio’s long-term shareholders, including potential dilution in the value of portfolio shares, interference with the efficient management of the portfolio (including losses on the sale of investments), taxable gains to remaining shareholders and increased brokerage and administrative costs. The risks may be more pronounced for portfolios that invest in certain securities such as those that trade in foreign markets, are illiquid or do not otherwise have “readily available market quotations.” Certain investors may seek to employ short-term trading strategies aimed at exploiting variations in portfolio valuation that arise from the nature of the securities held by the portfolio (e.g., “time zone arbitrage”).
The portfolio discourages short-term and excessive trading. The portfolio will take steps to detect and deter short-term and excessive trading pursuant to the portfolio’s policies as described in this prospectus and approved by the Board.
The portfolio’s policies include:
| | • | | the portfolio reserves the right to reject or cancel a purchase or exchange order for any reason when, in the opinion of the advisor, there appears to be a pattern of short-term or excessive trading activity by a shareholder or any other trading activity deemed harmful or disruptive to the portfolio; and |
| | • | | the portfolio has adopted certain fair valuation practices reasonably designed to protect the portfolio from “time zone arbitrage” with respect to its foreign securities holdings and other trading practices that seek to exploit variations in portfolio valuation that arise from the nature of the securities held by the portfolio. (See “How the Portfolio Calculates Share Price.”) |
When a pattern of short-term or excessive trading activity or other trading activity deemed harmful or disruptive to the portfolio is detected in a particular separate account, the advisor will take steps to stop this activity by contacting the insurance company that maintains the accounts for the underlying contract holders and seeking to have the insurance company enforce the separate account’s policies on short-term or excessive trading, if any. In addition, the advisor and the portfolio reserves the right to terminate a separate account’s ability to invest in the portfolio if apparent short-term or excessive trading activity persists. The detection of these patterns and the banning of further trading are inherently subjective and therefore involve some selectivity in their application. The advisor seeks to make such determinations in a manner consistent with the interests of the portfolio’s long-term shareholders.
There is no assurance that these policies and procedures will be effective in limiting short-term and excessive trading in all cases. For example, the advisor may not be able to effectively monitor, detect or limit short-term or excessive trading by underlying shareholders that occurs through separate accounts maintained by insurance companies or other financial intermediaries. Depending on the amount of portfolio shares held in a particular separate account (which may represent most of the portfolio’s shares) short-term and/or excessive trading of portfolio shares could adversely affect long-term shareholders in the portfolio. It is important to note that the advisor and the portfolio does not have access to underlying shareholders’ trading activity and that investors will be subject to the policies and procedures of their insurance company with respect to short-term and excessive trading in the portfolio.
The portfolio’s policies and procedures may be modified or terminated at any time.
How to receive account information
If you are a contract owner, you should contact your insurance company or the organization that provides record keeping services for information about your account.
Please see the contract prospectus that accompanies this prospectus for the customer service phone number.
How to buy and sell shares
Each insurance company has different provisions about how and when their contract owners may buy and sell portfolio shares. Each insurance company is responsible for communicating its contract owners’ instructions to the portfolio. Contract owners should contact their insurance company to effect transactions in the portfolio.
15
How the Portfolio Calculates Share Price
To calculate net asset value per share, or NAV, the portfolio uses the following equation:
| | |
| TOTAL ASSETS - TOTAL LIABILITIES | | = NAV |
| TOTAL NUMBER OF SHARES OUTSTANDING | |
The price at which you buy and sell shares for the portfolio is the NAV.
We typically value securities using information furnished by an independent pricing service or market quotations, where appropriate. However, we may use methods approved by the portfolio’s Board, such as a fair valuation model, which are intended to reflect fair value when pricing service information or market quotations are not readily available or when a security’s value or a meaningful portion of the value of the portfolio is believed to have been materially affected by a significant event, such as a natural disaster, an economic event like a bankruptcy filing, or a substantial fluctuation in domestic or foreign markets, that has occurred between the close of the exchange or market on which the security is principally traded (for example, a foreign exchange or market) and the close of the New York Stock Exchange. In such a case, the portfolio’s value for a security is likely to be different from the last quoted market price or pricing service information. In addition, due to the subjective and variable nature of fair value pricing, it is possible that the value determined for a particular asset may be materially different from the value realized upon such asset’s sale. It is expected that the greater the percentage of portfolio assets that is invested in non-US securities, the more extensive will be the portfolio’s use of fair value pricing. This is intended to reduce the portfolio’s exposure to “time zone arbitrage” and other harmful trading practices. (See “Market Timing Policies and Procedures.”)
To the extent that the portfolio invests in securities that are traded primarily in foreign markets, the value of its holdings could change at a time when you aren’t able to buy or sell portfolio shares through the contract. This is because some foreign markets are open on days and at times when the portfolio doesn’t price its shares.
Distributions
The portfolio intends to declare and distribute dividends from its net investment income and capital gains, if any, annually. The portfolio may make additional distributions if necessary.
All distributions will be reinvested in shares of the portfolio unless we are informed by an insurance company that they should be paid out in cash. The insurance companies will be informed about the amount and character of distributions from the portfolio for federal income tax purposes.
Taxes
The portfolio intends to qualify each year as a regulated investment company under Subchapter M of the Internal Revenue Code of 1986, as amended, (the “Code”) and to meet all requirements necessary to avoid paying any federal income or excise taxes.
Generally, owners of variable annuity and variable life contracts are not taxed currently on income or gains realized with respect to such contracts. However, some distributions from such contracts, whether made prior to or during the annuity payment period, may be taxable at ordinary income tax rates. In addition, distributions made to an owner who is younger than 59 1/2 may be subject to a 10% penalty tax. For further information concerning federal income tax consequences for the holders of variable annuity contracts and variable life insurance policies, such holders should consult the prospectus used in connection with the issuance of their particular contracts or policies.
In order for investors to receive the favorable tax treatment available to holders of variable annuity and variable life contracts, the separate accounts underlying such contracts, as well as the funds in which such accounts invest, must meet certain diversification requirements. The portfolio intends to comply with these requirements. If the portfolio or separate account does not meet such requirements or otherwise fails to qualify as a regulated investment company for any taxable year, income allocable to the contracts associated with the separate account would be taxable currently to the holders of such contracts and income from prior periods with respect to such contracts also could be taxable, most likely in the year of the failure.
16
Under Treasury regulations, insurance companies holding the separate accounts must report to the Internal Revenue Service losses above a certain amount resulting from a sale or disposition of the portfolio’s share.
The discussion above is generally based on the assumption that shares of the portfolio will be respected as owned by insurance company separate accounts. If this is not the case (for example, because the Internal Revenue Service finds an impermissible level of “investor control” over the investment options underlying variable contracts), the advantageous tax treatment provided in respect of insurance company separate accounts under the Code will no longer be available, and the person or persons determined to own the portfolio shares will be currently taxed on portfolio distributions, and on the proceeds of any redemption of portfolio shares, under the Code rules.
Portfolio investments in securities of foreign issuers may be subject to withholding and other taxes at the source, including on dividend or interest payments. Participating insurance companies should consult their own tax advisors as to whether such distributions are subject to federal income tax if they are retained as part of policy reserves.
The portfolio’s investments in certain debt obligations may cause the portfolio to recognize taxable income in excess of the cash generated by such obligation. Thus, the portfolio could be required at times to liquidate other investments in order to satisfy its distribution requirements.
The preceding is a brief summary of certain of the relevant tax considerations. Because each shareholder and contract holder’s tax situation is unique, ask your tax professional about the tax consequences of your investments, including possible foreign, state or local taxes.
Marketing and Distribution Fees
DWS Scudder Distributors, Inc., a subsidiary of the investment advisor, is the portfolio’s distributor.
DWS Variable Series II has adopted a 12b-1 plan for all Class B shares. Under the plan, DWS Variable Series II may make quarterly payments to the distributor for distribution and shareholder servicing related expenses incurred or paid by the distributor or a participating insurance company. No such payment shall be made with respect to any quarterly period in excess of an amount determined for such period at the annual rate of 0.25% of the average daily net assets of Class B shares during that quarterly period. Depending on the participating insurance company’s corporate structure and applicable state law, the distributor may remit payments to the participating insurance company’s affiliated broker-dealers or other affiliated company rather than the participating insurance company itself.
Because 12b-1 fees for Class B shares are paid out of portfolio assets on an ongoing basis, they will, over time, increase the cost of investment in Class B shares and may cost more than other types of sales charges.
Examples of expenses payable under the plan include the costs of printing and mailing materials (such as portfolio prospectuses, shareholder reports, portfolio advertisements and sales literature), holding seminars and sales meetings, providing customer service to policyholders and sales compensation.
17
To Get More Information
Shareholder reports — These include commentary from the portfolio’s management team about recent market conditions and the portfolio’s performance. They also have detailed performance figures, a list of everything the portfolio owns and its financial statements. Shareholders get these reports automatically.
Statement of Additional Information (SAI) — This tells you more about the portfolio’s features and policies, including additional risk information. The SAI is incorporated by reference into this document (meaning that it’s legally part of this prospectus).
For a free copy of any of these documents or to request other information about the portfolio, call (800) 778-1482, or contact DWS Scudder at the address listed below. The portfolio’s SAI and shareholder reports are also available through the DWS Scudder Web site at www.dws-scudder.com. These documents and other information about the portfolio are available from the EDGAR Database on the SEC’s Web site at www.sec.gov. If you like, you may obtain copies of this information, after paying a copying fee, by e-mailing a request to publicinfo@sec.gov or by writing the SEC at the address listed below. You can also review and copy these documents and other information about the portfolio, including the portfolio’s SAI, at the SEC’s Public Reference Room in Washington, D.C. Information on the operation of the SEC’s Public Reference Room may be obtained by calling (202) 551-5850.
| | |
DWS Scudder Distributors, Inc. | | SEC |
| |
222 South Riverside Plaza | | 100 F Street, N.E. |
Chicago, IL 60606-5808 | | Washington, D.C. 20549-2001 |
(800) 778-1482 | | (202) 551-5850 |
| |
| | www.sec.gov |
| |
| | SEC File # |
DWS Variable Series II | | 811-5002 |
DWS VARIABLE SERIES II
SUPPLEMENT TO THE CURRENTLY EFFECTIVE PROSPECTUSES OF
EACH OF THE LISTED PORTFOLIOS:
DWS Dreman Financial Services VIP
DWS Income Allocation VIP
DWS MFS Strategic Value VIP
Deutsche Investment Management Americas Inc. (the “Advisor”), the investment advisor of the above Portfolios, is proposing the following mergers as part of the Advisor’s initiative to restructure and streamline the family of DWS funds. In the chart below, the Acquired Portfolios on the left are proposed to be merged into the Acquiring Portfolios on the right.
| | |
| Acquired Portfolios | | Acquiring Portfolios |
| |
| DWS Dreman Financial Services VIP | | DWS Dreman High Return Equity VIP |
| |
| DWS Income Allocation VIP | | DWS Conservative Allocation VIP |
| |
| DWS MFS Strategic Value VIP | | DWS Dreman High Return Equity VIP |
Completion of each merger is subject to a number of conditions, including final approval by each Portfolio’s Board and approval by shareholders of the applicable Acquired Portfolio at a shareholder meeting expected to be held on or about August 24, 2006. Prior to the shareholder meeting, shareholders of each Acquired Portfolio will receive: (i) a Proxy Statement/Prospectus describing in detail the proposed merger and the Board’s considerations in recommending that shareholders approve the merger; (ii) a proxy card(s) and instructions on how to submit your vote; and (iii) a Prospectus for the applicable Acquiring Portfolio.
Please Retain This Supplement for Future Reference
| | |
| | [Logo]DWS SCUDDER |
| May 12, 2006 | | Deutsche Bank Group |
MAY 1, 2006
PROSPECTUS
DWS VARIABLE SERIES II
(formerly Scudder Variable Series II)
CLASS A SHARES
DWS Dreman Financial Services VIP
(formerly SVS Dreman Financial Services Portfolio)
This prospectus should be read in conjunction with the variable life insurance or variable annuity contract prospectus and plan documents for tax-qualified plans. These shares are available and are being marketed exclusively as a pooled funding vehicle for life insurance companies writing all types of variable life insurance policies and variable annuity contracts.
The Securities and Exchange Commission (SEC) does not approve or disapprove these shares or determine whether the information in this prospectus is truthful or complete. It is a criminal offense for anyone to inform you otherwise.
ONE GLOBAL FORCE. ONE FOCUS. YOU. [DWS SCUDDER Logo]
Deutsche Bank Group
Table of Contents
How the Portfolio Works
The portfolio is designed to serve as an investment option for certain variable annuity contracts, variable life insurance policies and tax-qualified plans. Your investment in the portfolio is made in conjunction with one of these contracts or policies.
Remember that the portfolio is not a bank deposit. It’s not insured or guaranteed by the FDIC or any other government agency. Its share price will go up and down and you could lose money by investing in the portfolio.
Please read this prospectus in conjunction with the prospectus for your variable life insurance policy or variable annuity contract or plan documents for tax-qualified plans.
DWS Dreman Financial Services VIP
(formerly SVS Dreman Financial Services Portfolio)
The Portfolio’s Main Investment Strategy
The portfolio seeks to provide long-term capital appreciation.
Under normal circumstances, the portfolio invests at least 80% of net assets, plus the amount of any borrowings for investment purposes, in equity securities (mainly common stocks) of financial services companies. These may include companies of any size that commit at least half of their assets to the financial services sector, or derive at least half of their revenues or net income from that sector. The major types of financial services companies are banks, insurance companies, savings and loans, securities brokerage firms and diversified financial companies.
The portfolio managers begin by screening for financial services stocks whose price-to-earnings ratios are below the average for the Standard & Poors Financial Index. The managers then compare a company’s stock price to its book value, cash flow and yield, and analyze individual companies to identify those that are financially sound and appear to have strong potential for long-term growth.
The managers assemble the portfolio from among the most attractive stocks, drawing on an analysis of economic outlooks for various financial industries. The managers may favor securities from different industries in the financial sector at different times, while still maintaining variety in terms of industries and companies represented.
The portfolio normally will sell a stock when the managers believe its price is unlikely to go higher, its fundamental factors have changed, other investments offer better opportunities or in the course of adjusting the emphasis on a given industry.
Securities Lending. The portfolio may lend its investment securities in an amount up to 33 1/3% of its total assets to approved institutional borrowers who need to borrow securities in order to complete certain transactions.
Although major changes tend to be infrequent, the Board of Trustees could change the portfolio’s investment objective without seeking shareholder approval. However, the Board will provide shareholders with at least 60 days’ notice prior to making any changes to the portfolio’s 80% investment policy.
Other Investments
While the portfolio invests mainly in US stocks, it could invest up to 30% of total assets in foreign securities, and up to 20% of net assets in investment-grade debt securities.
The portfolio is permitted, but not required, to use various types of derivatives (contracts whose value is based on, for example, indices, currencies or securities). In particular, the portfolio may use futures and options. The portfolio may use derivatives in circumstances where the managers believe they offer an economical means of gaining exposure to a particular asset class or to keep cash on hand to meet shareholder redemptions or other needs while maintaining exposure to the market.
As a temporary defensive measure, the portfolio could shift up to 100% of assets into investments such as money market securities. This measure could prevent losses, but, while engaged in a temporary defensive position, the portfolio will not be pursuing its investment objective. However, the portfolio managers may choose not to use these strategies for various reasons, even in very volatile market conditions.
The Main Risks of Investing in the Portfolio
There are several risk factors that could hurt the portfolio’s performance, cause you to lose money or cause the portfolio’s performance to trail that of other investments.
Stock Market Risk. As with most stock portfolios, an important factor with this portfolio is how stock markets perform—in this case, financial services company stocks. When prices of these stocks fall, you should expect the value of your investment to fall as well. Because a stock represents ownership in its issuer, stock prices can be hurt by poor management, shrinking product demand and other business risks. These may affect single companies as well as groups of companies. In addition, movements in financial markets may adversely affect a stock’s price, regardless of how well the company performs. The market as a whole may not favor the types of investments the portfolio makes and the portfolio may not be able to get attractive prices for them.
4
Value Investing Risk. As with any investment strategy, the “value” strategy used in managing the portfolio will, at times, perform better than or worse than other investment styles and the overall market. If the advisor overestimates the value or return potential of one or more common stocks, the portfolio may underperform the general equity market. Value stocks may also be out of favor for certain periods in relation to growth stocks.
Concentration Risk. The portfolio concentrates its investments in companies in the financial services sector. A portfolio with a concentrated portfolio is vulnerable to the risks of the industry or industries in which it invests and is subject to greater risks and market fluctuations than portfolios investing in a broader range of industries.
Non-Diversification Risk. The portfolio is classified as “non-diversified.” This means that it may invest in securities of relatively few issuers. Thus, the performance of one or a small number of portfolio holdings can affect overall performance more than if the portfolio invested in a larger number of issuers.
Derivatives Risk. Risks associated with derivatives include: the risk that the derivative is not well correlated with the security, index or currency to which it relates; the risk that derivatives used for risk management may not have the intended effects and may result in losses or missed opportunities; the risk that the portfolio will be unable to sell the derivative because of an illiquid secondary market; the risk that a counterparty is unwilling or unable to meet its obligation; the risk of interest rate movements and the risk that the derivatives transaction could expose the portfolio to the effects of leverage, which could increase the portfolio’s exposure to the market and magnify potential losses. There is no guarantee that derivatives activities will be employed or that they will work, and their use could cause lower returns or even losses to the portfolio.
Securities Lending Risk. Any loss in the market price of securities loaned by the portfolio that occurs during the term of the loan would be borne by the portfolio and would adversely affect the portfolio’s performance. Also, there may be delays in recovery of securities loaned or even a loss of rights in the collateral should the borrower of the securities fail financially while the loan is outstanding. However, loans will be made only to borrowers selected by the portfolio’s delegate after a review of relevant facts and circumstances, including the creditworthiness of the borrower.
Pricing Risk. At times, market conditions might make it hard to value some investments. For example, if the portfolio has valued its securities too highly, you may end up paying too much for portfolio shares when you buy into the portfolio. If the portfolio underestimates their price, you may not receive the full market value for your portfolio shares when you sell.
Security Selection Risk. A risk that pervades all investing is the risk that the securities held by the portfolio will decline in value.
Other factors that could affect performance include:
| | • | | the managers could be incorrect in their analysis of industries, companies, economic trends, the relative attractiveness of different sizes of stocks, geographical trends or other matters; |
| | • | | foreign securities tend to be more volatile than their US counterparts, for reasons such as currency fluctuations and political and economic uncertainty; and |
| | • | | a bond could fall in credit quality, go into default, or decrease in value for various reasons, including a change in prevailing interest rates. |
This portfolio may be appropriate for long-term investors who want to gain exposure to the financial services sector and can accept the above-average risks of a sector-specific investment.
5
Performance
While a portfolio’s past performance isn’t necessarily a sign of how it will do in the future, it can be valuable for an investor to know.
The bar chart shows how the returns for the portfolio’s Class A shares have varied from year to year, which may give some idea of risk. The table shows how average annual returns for the portfolio’s Class A shares compare with a broad-based market index and one other relevant index (which, unlike the portfolio, do not have any fees or expenses). The performance of both the portfolio and the indices varies over time. All figures on this page assume reinvestment of dividends and distributions.
This information doesn’t reflect charges and fees associated with the separate account that invests in the portfolio or any variable life insurance policy or variable annuity contract for which the portfolio is an investment option. These charges and fees will reduce returns.
Annual Total Returns (%) as of 12/31 each year — Class A shares
THE ORIGINAL DOCUMENT CONTAINS A BAR CHART HERE
BAR CHART DATA:
| | | | | | | | | | | | |
| -5.05 | | 27.04 | | -4.86 | | -8.51 | | 28.13 | | 12.00 | | -0.07 |
| 1999 | | 2000 | | 2001 | | 2002 | | 2003 | | 2004 | | 2005 |
For the periods included in the bar chart:
| | |
Best Quarter: 22.35%, Q3 2000 | | Worst Quarter: -15.86%, Q3 2002 |
| |
2006 Total Return as of March 31: 3.68% | | |
Average Annual Total Returns (%) as of 12/31/2005
| | | | | | |
| | | 1 Year | | 5 Years | | Since Inception* |
Portfolio — Class A | | -0.07 | | 4.54 | | 5.18 |
Index 1 | | 4.91 | | 0.54 | | 3.09 |
Index 2 | | 6.47 | | 3.76 | | 5.75 |
Index 1: The Standard & Poor’s (S&P) 500 Index is a capitalization-weighted index of 500 stocks designed to measure performance of the broad domestic economy through changes in the aggregate market value of 500 stocks representing all major industries.
Index 2: The S&P Financial Index is an unmanaged index generally representative of the financial stock market.
| * | Since 5/4/98. Index comparisons begin 4/30/98. |
Current performance information may be higher or lower than the performance data quoted above. For more recent performance information, contact your participating insurance company.
6
How Much Investors Pay
This table describes the fees and expenses that you may pay if you buy and hold portfolio shares. The information in the table does not reflect charges and fees associated with the separate account that invests in the portfolio or any variable life insurance policy or variable annuity contract for which the portfolio is an investment option. These charges and fees will increase expenses.
| | | |
Fee Table | | Class A | |
Annual Operating Expenses, deducted from portfolio assets | | | |
Management Fee | | 0.75 | % |
Distribution/Service (12b-1) Fee | | None | |
Other Expenses | | 0.14 | |
| | | |
Total Annual Operating Expenses | | 0.89 | |
| | | |
Based on the costs above, this example helps you compare the expenses of Class A shares to those of other mutual funds. This example assumes the expenses above remain the same. It also assumes that you invested $10,000, earned 5% annual returns, reinvested all dividends and distributions and sold your shares at the end of each period. This is only an example; actual expenses will be different.
| | | | | | | | | | | | |
Example | | 1 Year | | 3 Years | | 5 Years | | 10 Years |
Class A shares | | $ | 91 | | $ | 284 | | $ | 493 | | $ | 1,096 |
The Portfolio Managers
The portfolio’s subadvisor is Dreman Value Management L.L.C. The portfolio is managed by a team of investment professionals who collaborate to implement the portfolio’s investment strategy. The team is led by a lead portfolio manager who is responsible for developing the portfolio’s investment strategy. Each portfolio manager on the team has authority over all aspects of the portfolio’s investment portfolio, including but not limited to, purchases and sales of individual securities, portfolio construction techniques, portfolio risk assessment and the management of daily cash flows in accordance with portfolio holdings.
The following people handle the day-to-day management of the portfolio:
| | |
David N. Dreman Chairman and CIO of the subadvisor and Lead Manager of the portfolio. • Began investment career in 1957. • Joined the portfolio in 1998. • Founder and Chairman, Dreman Value Management L.L.C. since 1977. | | F. James Hutchinson Managing Director of the subadvisor and Portfolio Manager of the portfolio. • Began investment career in 1986. • Joined the portfolio in 2001. • Prior to joining Dreman Value Management, L.L.C. in 2000, associated with The Bank of New York for over 30 years in both the corporate finance and trust/investment management areas, including President of The Bank of New York (NJ). |
| |
| |
| |
| |
The portfolio’s Statement of Additional Information provides additional information about the portfolio managers’ investments in the portfolio, a description of their compensation structure and information regarding other accounts they manage.
7
Financial Highlights
This table is designed to help you understand the portfolio’s financial performance. The figures in the first part of the table are for a single share. The total return figures represent the percentage that an investor in the portfolio would have earned (or lost), assuming all dividends and distributions were reinvested. This information has been audited by Ernst & Young LLP, independent registered public accounting firm, whose report, along with the portfolio’s financial statements, is included in the portfolio’s annual report (see “Shareholder reports” on the back cover).
The following table includes selected data for a share outstanding throughout each period and other performance information derived from the financial statements.
This information doesn’t reflect charges and fees associated with the separate account that invests in the portfolio or any variable life insurance policy or variable annuity contract for which the portfolio is an investment option. These charges and fees will reduce returns.
DWS Dreman Financial Services VIP — Class A
| | | | | | | | | | | | | | | | | | | | |
Years Ended December 31, | | 2005 | | | 2004 | | | 2003 | | | 2002 | | | 2001 | |
Selected Per Share Data | | | | | | | | | | | | | | | | | | | | |
Net asset value, beginning of period | | $ | 13.60 | | | $ | 12.33 | | | $ | 9.79 | | | $ | 10.78 | | | $ | 11.53 | |
Income (loss) from investment operations: | | | | | | | | | | | | | | | | | | | | |
Net investment income (loss)^a | | | .27 | | | | .23 | | | | .20 | | | | .15 | | | | .14 | |
Net realized and unrealized gain (loss) on investment transactions | | | (.30 | ) | | | 1.23 | | | | 2.50 | | | | (1.06 | ) | | | (.71 | ) |
| | | | | | | | | | | | | | | | | | | | |
Total from investment operations | | | (.03 | ) | | | 1.46 | | | | 2.70 | | | | (.91 | ) | | | (.57 | ) |
| | | | | | | | | | | | | | | | | | | | |
Less distributions from: | | | | | | | | | | | | | | | | | | | | |
Net investment income | | | (.24 | ) | | | (.20 | ) | | | (.16 | ) | | | (.08 | ) | | | (.13 | ) |
Net realized gain on investment transactions | | | — | | | | — | | | | — | | | | — | | | | (.05 | ) |
| | | | | | | | | | | | | | | | | | | | |
Total distributions | | | (.24 | ) | | | (.20 | ) | | | (.16 | ) | | | (.08 | ) | | | (.18 | ) |
| | | | | | | | | | | | | | | | | | | | |
Net asset value, end of period | | $ | 13.33 | | | $ | 13.60 | | | $ | 12.33 | | | $ | 9.79 | | | $ | 10.78 | |
| | | | | | | | | | | | | | | | | | | | |
Total Return (%) | | | (.07 | ) | | | 12.00 | | | | 28.13 | | | | (8.51 | ) | | | (4.86 | ) |
| | | | | | | | | | | | | | | | | | | | |
Ratios to Average Net Assets and Supplemental Data | | | | | | | | | | | | | | | | | | | | |
Net assets, end of period ($ millions) | | | 120 | | | | 145 | | | | 143 | | | | 120 | | | | 117 | |
Ratio of expenses | | | .89 | | | | .84 | | | | .86 | | | | .83 | | | | .86 | |
Ratio of net investment income (%) | | | 2.10 | | | | 1.79 | | | | 1.84 | | | | 1.44 | | | | 1.31 | |
Portfolio turnover rate (%) | | | 27 | | | | 8 | | | | 7 | | | | 13 | | | | 22 | |
| ^a | Based on average shares outstanding during the period. |
8
Other Policies and Risks
While the previous pages describe the main points of the portfolio’s strategy and risks, there are a few other issues to know about:
| | • | | The portfolio may trade securities actively. This strategy could raise transaction costs and, accordingly, lower performance. |
| | • | | The advisor or subadvisor may establish a debt security’s credit quality when it buys a security, using independent ratings, or for unrated securities, its own credit determination. When ratings don’t agree, the portfolio may use the higher rating. If a security’s credit quality falls, the advisor or subadvisor will determine whether selling it would be in the portfolio’s best interest. |
The portfolio’s complete portfolio holdings as of the end of each calendar month are posted on www.dws-scudder.com ordinarily on the 15th day of the following calendar month or the first business day thereafter. This posted information generally remains accessible at least until the portfolio files its Form N-CSR or N-Q with the Securities and Exchange Commission for the period that includes the date as of which the www.dws-scudder.com information is current (expected to be at least three months). The portfolio’s Statement of Additional Information includes a description of the portfolio’s policies and procedures with respect to the disclosure of the portfolio’s holdings.
This prospectus doesn’t tell you about every policy or risk of investing in the portfolio. If you want more information on the portfolio’s allowable securities and investment practices and the characteristics and risks of each one, you may want to request a copy of the Statement of Additional Information (the back cover tells you how to do this).
Keep in mind that there is no assurance that any mutual fund will achieve its goal.
Investment Advisor
DWS Scudder is part of Deutsche Asset Management, which is the marketing name in the US for the asset management activities of Deutsche Bank AG, Deutsche Investment Management Americas Inc. (“DeIM” or the “advisor”), Deutsche Asset Management, Inc., Deutsche Bank Trust Company Americas and DWS Trust Company.
Deutsche Asset Management is a global asset management organization that offers a wide range of investing expertise and resources, including hundreds of portfolio managers and analysts and an office network that reaches the world’s major investment centers. This well-resourced global investment platform brings together a wide variety of experience and investment insight, across industries, regions, asset classes and investing styles.
DeIM is an indirect, wholly owned subsidiary of Deutsche Bank AG. Deutsche Bank AG is a major global banking institution that is engaged in a wide range of financial services, including investment management, mutual fund, retail, private and commercial banking, investment banking and insurance.
DeIM is the investment advisor for the portfolio. Under the supervision of the Board of Trustees, DeIM, with headquarters at 345 Park Avenue, New York, NY 10154, or the subadvisor makes the portfolio’s investment decisions, buy and sell securities for the portfolio and conduct research that leads to these purchase and sale decisions. DeIM and its predecessors have more than 80 years of experience managing mutual funds and DeIM provides a full range of investment advisory services to institutional and retail clients. DeIM or the subadvisor is also responsible for selecting brokers and dealers and for negotiating brokerage commissions and dealer charges.
The portfolio’s shareholder report for the year ended December 31, 2005 contains a discussion regarding the basis for the Board of Trustees’ approval of the portfolio’s investment management agreement and subadvisory agreement (see “Shareholder reports” on the back cover).
The advisor receives a management fee from the portfolio. Below is the actual rate paid by the portfolio during the most recent fiscal year, as a percentage of the portfolio’s average daily net assets:
| | | |
Portfolio Name | | Fee Paid | |
DWS Dreman Financial Services VIP | | 0.75 | % |
9
Portfolio Subadvisor
Dreman Value Management L.L.C., 520 East Cooper Avenue, Aspen, Colorado, is the subadvisor to DWS Dreman Financial Services VIP and receives a fee for its services from DeIM. Founded in 1977, Dreman Value Management L.L.C. currently manages over $11 billion in assets. DeIM pays a fee to Dreman Value Management L.L.C. for acting as subadvisor to the portfolio.
Market timing related regulatory and litigation matters
Since at least July 2003, federal, state and industry regulators have been conducting ongoing inquiries and investigations (“inquiries”) into the mutual fund industry, and have requested information from numerous mutual fund companies, including DWS Scudder. The DWS funds’ advisors have been cooperating in connection with these inquiries and are in discussions with the regulators concerning proposed settlements. Publicity about mutual fund practices arising from these industrywide inquiries serves as the general basis of a number of private lawsuits against the DWS funds. These lawsuits, which previously have been reported in the press, involve purported class action and derivative lawsuits, making various allegations and naming as defendants various persons, including certain DWS funds, the funds’ investment advisors and their affiliates, and certain individuals, including in some cases fund Trustees/Directors, officers, and other parties. Each DWS fund’s investment advisor has agreed to indemnify the applicable DWS funds in connection with these lawsuits, or other lawsuits or regulatory actions that may be filed making allegations similar to these lawsuits regarding market timing, revenue sharing, fund valuation or other subjects arising from or related to the pending inquiries. It is not possible to determine with certainty what the outcome of these inquiries will be or what the effect, if any, would be on the funds or their advisors.
With respect to the lawsuits, based on currently available information, the funds’ investment advisors believe the likelihood that the pending lawsuits will have a material adverse financial impact on a DWS fund is remote and such actions are not likely to materially affect their ability to perform under their investment management agreements with the DWS funds.
With respect to the regulatory matters, Deutsche Asset Management (“DeAM”) has advised the funds as follows:
DeAM expects to reach final agreements with regulators early in 2006 regarding allegations of improper trading in the DWS funds. DeAM expects that it will reach settlement agreements with the Securities and Exchange Commission, the New York Attorney General and the Illinois Secretary of State providing for payment of disgorgement, penalties, and investor education contributions totaling approximately $134 million. Approximately $127 million of this amount would be distributed to shareholders of the affected DWS funds in accordance with a distribution plan to be developed by an independent distribution consultant. DeAM does not believe that any of the DWS funds will be named as respondents or defendants in any proceedings. The funds’ investment advisors do not believe these amounts will have a material adverse financial impact on them or materially affect their ability to perform under their investment management agreements with the DWS funds. The above-described amounts are not material to Deutsche Bank, and they have already been reserved.
10
Based on the settlement discussions thus far, DeAM believes that it will be able to reach a settlement with the regulators on a basis that is generally consistent with settlements reached by other advisors, taking into account the particular facts and circumstances of market timing at DeAM and at the legacy Scudder and Kemper organizations prior to their acquisition by DeAM in April 2002. Among the terms of the expected settled orders, DeAM would be subject to certain undertakings regarding the conduct of its business in the future, including maintaining existing management fee reductions for certain funds for a period of five years. DeAM expects that these settlements would resolve regulatory allegations that it violated certain provisions of federal and state securities laws (i) by entering into trading arrangements that permitted certain investors to engage in market timing in certain DWS funds and (ii) by failing more generally to take adequate measures to prevent market timing in the DWS funds, primarily during the 1999-2001 period. With respect to the trading arrangements, DeAM expects that the settlement documents will include allegations related to one legacy DeAM arrangement, as well as three legacy Scudder and six legacy Kemper arrangements. All of these trading arrangements originated in businesses that existed prior to the current DeAM organization, which came together in April 2002 as a result of the various mergers of the legacy Scudder, Kemper and Deutsche fund groups, and all of the arrangements were terminated prior to the start of the regulatory investigations that began in the summer of 2003. No current DeAM employee approved the trading arrangements.
There is no certainty that the final settlement documents will contain the foregoing terms and conditions. The independent Trustees/Directors of the DWS funds have carefully monitored these regulatory investigations with the assistance of independent legal counsel and independent economic consultants. Additional information announced by DeAM regarding the terms of the expected settlements will be made available at www.dws-scudder.com/regulatory_settlements, which will also disclose the terms of any final settlement agreements once they are announced.
Other regulatory matters
DeAM is also engaged in settlement discussions with the Enforcement Staffs of the SEC and the NASD regarding DeAM’s practices during 2001-2003 with respect to directing brokerage commissions for portfolio transactions by certain DWS funds to broker-dealers that sold shares in the DWS funds and provided enhanced marketing and distribution for shares in the DWS funds. In addition, on January 13, 2006, DWS Scudder Distributors, Inc. received a Wells notice from the Enforcement Staff of the NASD regarding DWS Scudder Distributors’ payment of non-cash compensation to associated persons of NASD member firms, as well as DWS Scudder Distributors’ procedures regarding non-cash compensation regarding entertainment provided to such associated persons. Additional information announced by DeAM regarding the terms of the expected settlements will be made available at www.dws-scudder.com/regulatory_settlements, which will also disclose the terms of any final settlement agreements once they are announced.
11
Your Investment in the Portfolio
The information in this section may affect anyone who selects the portfolio as an investment option in a variable annuity contract or variable life insurance policy that offers the portfolio. These contracts and policies are described in separate prospectuses issued by participating insurance companies. The portfolio assumes no responsibility for such prospectuses.
Policies about transactions
The information in this prospectus applies to Class A shares of the portfolio. Class A shares are offered at net asset value. The portfolio has another class of shares which is offered separately.
Technically, the shareholders of DWS Variable Series II (which includes the portfolio just described) are the participating insurance companies (the “insurance companies”) that offer the portfolio as a choice for holders of certain variable annuity contracts or variable life insurance policies (the “contract(s)”) issued or sponsored by the insurance companies. The insurance companies effectively pass through the ownership of portfolio shares to their contract owners and some may pass through voting rights as well. The portfolio does not sell shares directly to the public. The portfolio sells shares only to separate accounts of insurance companies. As a contract owner, your premium payments are allocated to the portfolio by the insurance companies in accordance with your contract. Please see the contract prospectus that accompanies this prospectus for a detailed explanation of your contract.
Please bear in mind that there are important differences between funds available to any investor (a “Retail Fund”) and those that are only available through certain financial institutions, such as insurance companies. For example, Retail Funds, unlike the portfolio, are not sold to insurance company separate accounts to support investments in variable insurance contracts. In addition, the investment objectives, policies and strategies of the portfolio, while similar to those of a Retail Fund, may not be identical. Retail Funds may be smaller or larger than the portfolio and have different expense ratios than the portfolio. As a result, the performance of the portfolio and a Retail Fund will differ.
Should any conflict between contract owners arise that would require that a substantial amount of net assets be withdrawn from the portfolio, orderly portfolio management could be disrupted to the potential detriment of contract owners in the portfolio.
The portfolio has a verification process for new insurance company accounts to help the government fight the funding of terrorism and money laundering activities. Federal law requires all financial institutions to obtain, verify and record information that identifies each insurance company that opens an account. What this means to you: when an insurance company opens an account, the portfolio will ask for its name, address and other information that will allow the portfolio to identify the company. This information will be verified to ensure the identity of all insurance companies opening an account.
For certain insurance companies, the portfolio might request additional information (for instance, the portfolio would ask for documents such as the insurance company’s articles of incorporation) to help the portfolio verify the insurance company’s identity.
The portfolio will not complete the purchase of any shares for an account until all information has been provided and the application has been submitted in “good order.” Once the application is determined to be in good order, the purchase(s) will be effected at the net asset value per share next calculated.
The portfolio may reject a new account application if the insurance company doesn’t provide any required or requested identifying information, or for other reasons.
12
The advisor, DWS Scudder Distributors, Inc. and/or their affiliates may pay additional compensation from their own assets to other persons for selling, distributing and/or servicing portfolio shares. This compensation may be significant. You should talk to your insurance company to determine if this compensation influenced the financial advisor’s recommendation of the portfolio.
Buying and Selling Shares
The portfolio is open for business each day the New York Stock Exchange is open. The portfolio calculates its share price every business day, as of the close of regular trading on the New York Stock Exchange (typically 4 p.m. Eastern time, but sometimes earlier, as in the case of scheduled half-day trading or unscheduled suspensions of trading).
The portfolio continuously sells shares to each insurance company, without a sales charge, at the net asset value per share next determined after a proper purchase order is placed with the insurance company. The insurance company offers contract owners units in its separate accounts which directly correspond to shares in the portfolio. Each insurance company submits purchase and redemption orders to the portfolio based on allocation instructions for premium payments, transfer instructions and surrender or partial withdrawal requests for contract owners, as set forth in the accompanying prospectus for the contracts. These orders reflect the amount of premium payments to be invested, surrender and transfer requests, and other matters. Redemption orders are effected at the next net asset value per share determined after a proper redemption order is placed with the insurance company. Contract owners should look at their contract prospectuses for redemption procedures and fees.
Important information about buying and selling shares
| | • | | After receiving a contract owner’s order, the insurance company buys or sells shares at the net asset value next calculated on any day the portfolio is open for business. |
| | • | | Unless otherwise instructed, the portfolio normally makes payment of the proceeds from the sale of shares the next business day but always within seven calendar days. |
| | • | | The portfolio does not issue share certificates. |
| | • | | The portfolio reserves the right to reject purchases of shares for any reason. |
| | • | | The portfolio reserves the right to withdraw or suspend the offering of shares at any time. |
| | • | | The portfolio reserves the right to reject purchases of shares or to suspend or postpone redemptions at times when the New York Stock Exchange is closed (other than customary closings), trading is restricted or when an emergency exists that prevents the portfolio from disposing of its securities or pricing its shares. |
| | • | | The portfolio may refuse, cancel or rescind any purchase order; freeze any account (meaning the insurance company will not be able to purchase shares in its account); suspend account services; and/or involuntarily redeem the account if we think that the account is being used for fraudulent or illegal purposes by the insurance company; one or more of these actions will be taken when, at the sole discretion of the portfolio, they are deemed to be in the portfolio’s best interest or when the portfolio is requested or compelled to do so by governmental authority or by applicable law. |
| | • | | The portfolio may close and liquidate an account if the portfolio is unable to verify provided information, or for other reasons; if the portfolio decides to close the account, the shares will be redeemed at the net asset value per share next calculated after we determine to close the account; the insurance company may be subject to gain or loss on the redemption of the portfolio shares and the insurance company may incur tax liability. |
| | • | | A contract owner’s purchase order may not be accepted if the sale of portfolio shares has been suspended or if it is determined that the purchase would be detrimental to the interests of the portfolio’s shareholders. |
| | • | | Currently, the Board of Trustees of DWS Variable Series II does not foresee any disadvantages to contract owners arising from the fact that the interests of contract owners may differ. Nevertheless, the Board intends to monitor events in order to identify any material irreconcilable conflicts that may possibly arise and to determine what action, if any, should be taken. |
13
Market Timing Policies and Procedures. Short-term and excessive trading of portfolio shares may present risks to the portfolio’s long-term shareholders, including potential dilution in the value of portfolio shares, interference with the efficient management of the portfolio (including losses on the sale of investments), taxable gains to remaining shareholders and increased brokerage and administrative costs. To the extent that the portfolio invests in such securities, these risks may be more pronounced for certain securities such as those that trade in foreign markets, are illiquid or do not otherwise have “readily available market quotations.” Certain investors may seek to employ short-term trading strategies aimed at exploiting variations in portfolio valuation that arise from the nature of the securities held by the portfolio (e.g., “time zone arbitrage”).
The portfolio discourages short-term and excessive trading. The portfolio will take steps to detect and deter short-term and excessive trading pursuant to the portfolio’s policies as described in this prospectus and approved by the Board.
The portfolio’s policies include:
| | • | | the portfolio reserves the right to reject or cancel a purchase or exchange order for any reason when, in the opinion of the advisor, there appears to be a pattern of short-term or excessive trading activity by a shareholder or any other trading activity deemed harmful or disruptive to the portfolio; and |
| | • | | the portfolio has adopted certain fair valuation practices reasonably designed to protect the portfolio from “time zone arbitrage” with respect to its foreign securities holdings and other trading practices that seek to exploit variations in portfolio valuation that arise from the nature of the securities held by the portfolio. (See “How the Portfolio Calculates Share Price.”) |
When a pattern of short-term or excessive trading activity or other trading activity deemed harmful or disruptive to the portfolio is detected in a particular separate account, the advisor will take steps to stop this activity by contacting the insurance company that maintains the accounts for the underlying contract holders and seeking to have the insurance company enforce the separate account’s policies on short-term or excessive trading, if any. In addition, the advisor and the portfolio reserves the right to terminate a separate account’s ability to invest in the portfolio if apparent short-term or excessive trading activity persists. The detection of these patterns and the banning of further trading are inherently subjective and therefore involve some selectivity in their application. The advisor seeks to make such determinations in a manner consistent with the interests of the portfolio’s long-term shareholders.
There is no assurance that these policies and procedures will be effective in limiting short-term and excessive trading in all cases. For example, the advisor may not be able to effectively monitor, detect or limit short-term or excessive trading by underlying shareholders that occurs through separate accounts maintained by insurance companies or other financial intermediaries. Depending on the amount of portfolio shares held in a particular separate account (which may represent most of the portfolio’s shares) short-term and/or excessive trading of portfolio shares could adversely affect long-term shareholders in the portfolio. It is important to note that the advisor and the portfolio does not have access to underlying shareholders’ trading activity and that investors will be subject to the policies and procedures of their insurance company with respect to short-term and excessive trading in the portfolio.
The portfolio’s policies and procedures may be modified or terminated at any time.
How to receive account information
If you are a contract owner, you should contact your insurance company or the organization that provides record keeping services for information about your account.
Please see the contract prospectus that accompanies this prospectus for the customer service phone number.
How to buy and sell shares
Each insurance company has different provisions about how and when their contract owners may buy and sell portfolio shares. Each insurance company is responsible for communicating its contract owners’ instructions to the portfolio. Contract owners should contact their insurance company to effect transactions in the portfolio.
14
How the Portfolio Calculates Share Price
To calculate net asset value per share, or NAV, the portfolio uses the following equation:
| | |
| TOTAL ASSETS - TOTAL LIABILITIES | | = NAV |
| TOTAL NUMBER OF SHARES OUTSTANDING | |
The price at which you buy and sell shares for the portfolio is the NAV.
We typically value securities using information furnished by an independent pricing service or market quotations, where appropriate. However, we may use methods approved by the portfolio’s Board, such as a fair valuation model, which are intended to reflect fair value when pricing service information or market quotations are not readily available or when a security’s value or a meaningful portion of the value of the portfolio is believed to have been materially affected by a significant event, such as a natural disaster, an economic event like a bankruptcy filing, or a substantial fluctuation in domestic or foreign markets, that has occurred between the close of the exchange or market on which the security is principally traded (for example, a foreign exchange or market) and the close of the New York Stock Exchange. In such a case, the portfolio’s value for a security is likely to be different from the last quoted market price or pricing service information. In addition, due to the subjective and variable nature of fair value pricing, it is possible that the value determined for a particular asset may be materially different from the value realized upon such asset’s sale. It is expected that the greater the percentage of portfolio assets that is invested in non-US securities, the more extensive will be the portfolio’s use of fair value pricing. This is intended to reduce the portfolio’s exposure to “time zone arbitrage” and other harmful trading practices. (See “Market Timing Policies and Procedures.”)
To the extent that the portfolio invests in securities that are traded primarily in foreign markets, the value of its holdings could change at a time when you aren’t able to buy or sell portfolio shares through the contract. This is because some foreign markets are open on days and at times when the portfolio doesn’t price its shares.
Distributions
The portfolio intends to declare and distribute dividends from their net investment income and capital gains, if any, annually. The portfolio may make additional distributions if necessary.
All distributions will be reinvested in shares of the portfolio unless we are informed by an insurance company that they should be paid out in cash. The insurance companies will be informed about the amount and character of distributions from the portfolio for federal income tax purposes.
Taxes
The portfolio intends to qualify each year as a regulated investment company under Subchapter M of the Internal Revenue Code of 1986, as amended, (the “Code”) and to meet all requirements necessary to avoid paying any federal income or excise taxes.
Generally, owners of variable annuity and variable life contracts are not taxed currently on income or gains realized with respect to such contracts. However, some distributions from such contracts, whether made prior to or during the annuity payment period, may be taxable at ordinary income tax rates. In addition, distributions made to an owner who is younger than 59 1/2 may be subject to a 10% penalty tax. For further information concerning federal income tax consequences for the holders of variable annuity contracts and variable life insurance policies, such holders should consult the prospectus used in connection with the issuance of their particular contracts or policies.
In order for investors to receive the favorable tax treatment available to holders of variable annuity and variable life contracts, the separate accounts underlying such contracts, as well as the funds in which such accounts invest, must meet certain diversification requirements. The portfolio intends to comply with these requirements. If the portfolio or separate account does not meet such requirements or otherwise fails to qualify as a regulated investment company for any taxable year, income allocable to the contracts associated with the separate account would be taxable currently to the holders of such contracts and income from prior periods with respect to such contracts also could be taxable, most likely in the year of the failure.
15
Under Treasury regulations, insurance companies holding the separate accounts must report to the Internal Revenue Service losses above a certain amount resulting from a sale or disposition of the portfolio’s share.
The discussion above is generally based on the assumption that shares of the portfolio will be respected as owned by insurance company separate accounts. If this is not the case (for example, because the Internal Revenue Service finds an impermissible level of “investor control” over the investment options underlying variable contracts), the advantageous tax treatment provided in respect of insurance company separate accounts under the Code will no longer be available, and the person or persons determined to own the portfolio shares will be currently taxed on portfolio distributions, and on the proceeds of any redemption of portfolio shares, under the Code rules.
Portfolio investments in securities of foreign issuers may be subject to withholding and other taxes at the source, including on dividend or interest payments. Participating insurance companies should consult their own tax advisors as to whether such distributions are subject to federal income tax if they are retained as part of policy reserves.
The portfolio’s investments in certain debt obligations may cause the portfolio to recognize taxable income in excess of the cash generated by such obligation. Thus, the portfolio could be required at times to liquidate other investments in order to satisfy its distribution requirements.
The preceding is a brief summary of certain of the relevant tax considerations. Because each shareholder and contract holder’s tax situation is unique, ask your tax professional about the tax consequences of your investments, including possible foreign, state or local taxes.
16
To Get More Information
Shareholder reports — These include commentary from the portfolio’s management team about recent market conditions and the portfolio’s performance. They also have detailed performance figures, a list of everything the portfolio owns and its financial statements. Shareholders get these reports automatically.
Statement of Additional Information (SAI) — This tells you more about the portfolio’s features and policies, including additional risk information. The SAI is incorporated by reference into this document (meaning that it’s legally part of this prospectus).
For a free copy of any of these documents or to request other information about the portfolio, call (800) 778-1482 or contact DWS Scudder at the address listed below. The portfolio’s SAI and shareholder reports are also available through the DWS Scudder Web site at www.dws-scudder.com. These documents and other information about the portfolio are available from the EDGAR Database on the SEC’s Web site at www.sec.gov. If you like, you may obtain copies of this information, after paying a copying fee, by e-mailing a request to publicinfo@sec.gov or by writing the SEC at the address listed below. You can also review and copy these documents and other information about the portfolio, including the portfolio’s SAI, at the SEC’s Public Reference Room in Washington, D.C. Information on the operation of the SEC’s Public Reference Room may be obtained by calling (202) 551-5850.
| | |
| DWS Scudder Distributors, Inc. | | SEC |
| |
| 222 South Riverside Plaza | | 100 F Street, N.E. |
| Chicago, IL 60606-5808 | | Washington, D.C. 20549-2001 |
| (800) 778-1482 | | (202) 551-5850 |
| |
| | www.sec.gov |
| |
| | SEC File # |
| |
| DWS Variable Series II | | 811-5002 |
MAY 1, 2006
PROSPECTUS
DWS VARIABLE SERIES II
(formerly Scudder Variable Series II)
CLASS B SHARES
DWS Dreman Financial Services VIP
(formerly SVS Dreman Financial Services Portfolio)
This prospectus should be read in conjunction with the variable life insurance or variable annuity contract prospectus and plan documents for tax-qualified plans. These shares are available and are being marketed exclusively as a pooled funding vehicle for life insurance companies writing all types of variable life insurance policies and variable annuity contracts.
The Securities and Exchange Commission (SEC) does not approve or disapprove these shares or determine whether the information in this prospectus is truthful or complete. It is a criminal offense for anyone to inform you otherwise.
ONE GLOBAL FORCE. ONE FOCUS. YOU. [DWS SCUDDER Logo]
Deutsche Bank Group
Table of Contents
How the Portfolio Works
How the Portfolio Works
The portfolio is designed to serve as an investment option for certain variable annuity contracts, variable life insurance policies and tax-qualified plans. Your investment in the portfolio is made in conjunction with one of these contracts or policies.
Remember that the portfolio is not a bank deposit. It’s not insured or guaranteed by the FDIC or any other government agency. Its share price will go up and down and you could lose money by investing in the portfolio.
Please read this prospectus in conjunction with the prospectus for your variable life insurance policy or variable annuity contract or plan documents for tax-qualified plans.
DWS Dreman Financial Services VIP
(formerly SVS Dreman Financial Services Portfolio)
The Portfolio’s Main Investment Strategy
The portfolio seeks to provide long-term capital appreciation.
Under normal circumstances, the portfolio invests at least 80% of net assets, plus the amount of any borrowings for investment purposes, in equity securities (mainly common stocks) of financial services companies. These may include companies of any size that commit at least half of their assets to the financial services sector, or derive at least half of their revenues or net income from that sector. The major types of financial services companies are banks, insurance companies, savings and loans, securities brokerage firms and diversified financial companies.
The portfolio managers begin by screening for financial services stocks whose price-to-earnings ratios are below the average for the Standard & Poors Financial Index. The managers then compare a company’s stock price to its book value, cash flow and yield, and analyze individual companies to identify those that are financially sound and appear to have strong potential for long-term growth.
The managers assemble the portfolio from among the most attractive stocks, drawing on an analysis of economic outlooks for various financial industries. The managers may favor securities from different industries in the financial sector at different times, while still maintaining variety in terms of industries and companies represented.
The portfolio normally will sell a stock when the managers believe its price is unlikely to go higher, its fundamental factors have changed, other investments offer better opportunities or in the course of adjusting the emphasis on a given industry.
Securities Lending. The portfolio may lend its investment securities in an amount up to 33 1/3% of its total assets to approved institutional borrowers who need to borrow securities in order to complete certain transactions.
Although major changes tend to be infrequent, the Board of Trustees could change the portfolio’s investment objective without seeking shareholder approval. However, the Board will provide shareholders with at least 60 days’ notice prior to making any changes to the portfolio’s 80% investment policy.
Other Investments
While the portfolio invests mainly in US stocks, it could invest up to 30% of total assets in foreign securities, and up to 20% of net assets in investment-grade debt securities.
The portfolio is permitted, but not required, to use various types of derivatives (contracts whose value is based on, for example, indices, currencies or securities). In particular, the portfolio may use futures and options. The portfolio may use derivatives in circumstances where the managers believe they offer an economical means of gaining exposure to a particular asset class or to keep cash on hand to meet shareholder redemptions or other needs while maintaining exposure to the market.
As a temporary defensive measure, the portfolio could shift up to 100% of assets into investments such as money market securities. This measure could prevent losses, but, while engaged in a temporary defensive position, the portfolio will not be pursuing its investment objective. However, the portfolio managers may choose not to use these strategies for various reasons, even in very volatile market conditions.
The Main Risks of Investing in the Portfolio
There are several risk factors that could hurt the portfolio’s performance, cause you to lose money or cause the portfolio’s performance to trail that of other investments.
Stock Market Risk. As with most stock portfolios, an important factor with this portfolio is how stock markets perform—in this case, financial services company stocks. When prices of these stocks fall, you should expect the value of your investment to fall as well. Because a stock represents ownership in its issuer, stock prices can be hurt by poor management, shrinking product demand and other business risks. These may affect single companies as well as groups of companies. In addition, movements in financial markets may adversely affect a stock’s price, regardless of how well the company performs. The market as a whole may not favor the types of investments the portfolio makes and the portfolio may not be able to get attractive prices for them.
3
Value Investing Risk. As with any investment strategy, the “value” strategy used in managing the portfolio will, at times, perform better than or worse than other investment styles and the overall market. If the advisor overestimates the value or return potential of one or more common stocks, the portfolio may underperform the general equity market. Value stocks may also be out of favor for certain periods in relation to growth stocks.
Concentration Risk. The portfolio concentrates its investments in companies in the financial services sector. A portfolio with a concentrated portfolio is vulnerable to the risks of the industry or industries in which it invests and is subject to greater risks and market fluctuations than portfolios investing in a broader range of industries.
Non-Diversification Risk. The portfolio is classified as “non-diversified.” This means that it may invest in securities of relatively few issuers. Thus, the performance of one or a small number of portfolio holdings can affect overall performance more than if the portfolio invested in a larger number of issuers.
Derivatives Risk. Risks associated with derivatives include: the risk that the derivative is not well correlated with the security, index or currency to which it relates; the risk that derivatives used for risk management may not have the intended effects and may result in losses or missed opportunities; the risk that the portfolio will be unable to sell the derivative because of an illiquid secondary market; the risk that a counterparty is unwilling or unable to meet its obligation; the risk of interest rate movements and the risk that the derivatives transaction could expose the portfolio to the effects of leverage, which could increase the portfolio’s exposure to the market and magnify potential losses. There is no guarantee that derivatives activities will be employed or that they will work, and their use could cause lower returns or even losses to the portfolio.
Securities Lending Risk. Any loss in the market price of securities loaned by the portfolio that occurs during the term of the loan would be borne by the portfolio and would adversely affect the portfolio’s performance. Also, there may be delays in recovery of securities loaned or even a loss of rights in the collateral should the borrower of the securities fail financially while the loan is outstanding. However, loans will be made only to borrowers selected by the portfolio’s delegate after a review of relevant facts and circumstances, including the creditworthiness of the borrower.
Pricing Risk. At times, market conditions might make it hard to value some investments. For example, if the portfolio has valued its securities too highly, you may end up paying too much for portfolio shares when you buy into the portfolio. If the portfolio underestimates their price, you may not receive the full market value for your portfolio shares when you sell.
Security Selection Risk. A risk that pervades all investing is the risk that the securities held by the portfolio will decline in value.
Other factors that could affect performance include:
| | • | | the managers could be incorrect in their analysis of industries, companies, economic trends, the relative attractiveness of different sizes of stocks, geographical trends or other matters; |
| | • | | foreign securities tend to be more volatile than their US counterparts, for reasons such as currency fluctuations and political and economic uncertainty; and |
| | • | | a bond could fall in credit quality, go into default, or decrease in value for various reasons, including a change in prevailing interest rates. |
This portfolio may be appropriate for long-term investors who want to gain exposure to the financial services sector and can accept the above-average risks of a sector-specific investment.
4
Performance
While a portfolio’s past performance isn’t necessarily a sign of how it will do in the future, it can be valuable information for an investor to know.
The bar chart shows how portfolio performance has varied from year to year, which may give some idea of risk. The table shows how average annual returns for the portfolio’s Class B shares compare with a broad-based market index and one other relevant index (which, unlike the portfolio, do not have any fees or expenses). The performance of both the portfolio and the indices varies over time. All figures on this page assume reinvestment of dividends and distributions.
The inception date for Class B was July 1, 2002. In the bar chart and table, the performance figures for Class B before that date are based on the historical performance of the portfolio’s original share class (Class A), adjusted to reflect the higher gross total annual operating expenses of Class B. Class A is offered in a different prospectus.
This information doesn’t reflect charges and fees associated with the separate account that invests in the portfolio or any variable life insurance policy or variable annuity contract for which the portfolio is an investment option. These charges and fees will reduce returns.
Annual Total Returns (%) as of 12/31 each year — Class B shares
THE ORIGINAL DOCUMENT CONTAINS A BAR CHART HERE
BAR CHART DATA:
| | | | | | | | | | | | |
| 5.29 | | 26.72 | | -5.09 | | -8.65 | | 27.73 | | 11.50 | | -0.46 |
| 1999 | | 2000 | | 2001 | | 2002 | | 2003 | | 2004 | | 2005 |
For the periods included in the bar chart:
Best Quarter: 22.27%, Q3 2000 Worst Quarter: -15.79%, Q3 2002
2006 Total Return as of March 31: 3.58%
Average Annual Total Returns (%) as of 12/31/2005
| | | | | | |
| | | 1 Year | | 5 Years | | Since Inception* |
Portfolio — Class B | | -0.46 | | 4.21 | | 4.87 |
Index 1 | | 4.91 | | 0.54 | | 3.09 |
Index 2 | | 6.47 | | 3.76 | | 5.75 |
Index 1: The Standard & Poor’s (S&P) 500 Index is a capitalization-weighted index of 500 stocks designed to measure performance of the broad domestic economy through changes in the aggregate market value of 500 stocks representing all major industries.
Index 2: The S&P Financial Index is an unmanaged index generally representative of the financial stock market.
| * | Since 5/4/98. Index comparisons begin 4/30/98. |
Current performance information may be higher or lower than the performance data quoted above. For more recent performance information, contact your participating insurance company.
5
How Much Investors Pay
This table describes the fees and expenses that you may pay if you buy and hold portfolio shares. The information in the table does not reflect charges and fees associated with the separate account that invests in the portfolio or any variable life insurance policy or variable annuity contract for which the portfolio is an investment option. These charges and fees will increase expenses.
| | | |
Fee Table | | Class B | |
Annual Operating Expenses, deducted from portfolio assets | | | |
Management Fee | | 0.75 | % |
Distribution/Service (12b-1) Fee | | 0.25 | |
Other Expenses | | 0.29 | |
| | | |
Total Annual Operating Expenses | | 1.29 | |
| | | |
Based on the costs above, this example helps you compare the expenses of Class B shares to those of other mutual funds. This example assumes the expenses above remain the same. It also assumes that you invested $10,000, earned 5% annual returns, reinvested all dividends and distributions and sold your shares at the end of each period. This is only an example; actual expenses will be different.
| | | | | | | | | | | | |
Example | | 1 Year | | 3 Years | | 5 Years | | 10 Years |
Class B shares | | $ | 131 | | $ | 409 | | $ | 708 | | $ | 1,559 |
The Portfolio Managers
The portfolio’s subadvisor is Dreman Value Management L.L.C. The portfolio is managed by a team of investment professionals who collaborate to implement the portfolio’s investment strategy. The team is led by a lead portfolio manager who is responsible for developing the portfolio’s investment strategy. Each portfolio manager on the team has authority over all aspects of the portfolio’s investment portfolio, including but not limited to, purchases and sales of individual securities, portfolio construction techniques, portfolio risk assessment and the management of daily cash flows in accordance with portfolio holdings.
The following people handle the day-to-day management of the portfolio:
| | |
David N. Dreman Chairman and CIO of the subadvisor and Lead Manager of the portfolio. • Began investment career in 1957. • Joined the portfolio in 1998. • Founder and Chairman, Dreman Value Management L.L.C. since 1977. | | F. James Hutchinson Managing Director of the subadvisor and Portfolio Manager of the portfolio. • Began investment career in 1986. • Joined the portfolio in 2001. • Prior to joining Dreman Value Management, L.L.C. in 2000, associated with The Bank of New York for over 30 years in both the corporate finance and trust/investment management areas, including President of The Bank of New York (NJ). |
The portfolio’s Statement of Additional Information provides additional information about the portfolio managers’ investments in the portfolio, a description of their compensation structure and information regarding other accounts they manage.
6
Financial Highlights
This table is designed to help you understand the portfolio’s financial performance. The figures in the first part of the table are for a single share. The total return figures represent the percentage that an investor in the portfolio would have earned (or lost), assuming all dividends and distributions were reinvested. This information has been audited by Ernst & Young LLP, independent registered public accounting firm, whose report, along with the portfolio’s financial statements, is included in the portfolio’s annual report (see “Shareholder reports” on the back cover).
The following table includes selected data for a share outstanding throughout each period and other performance information derived from the financial statements.
This information doesn’t reflect charges and fees associated with the separate account that invests in the portfolio or any variable life insurance policy or variable annuity contract for which the portfolio is an investment option. These charges and fees will reduce returns.
DWS Dreman Financial Services VIP — Class B
| | | | | | | | | | | | | | | | |
Years Ended December 31, | | 2005 | | | 2004 | | | 2003 | | | 2002^a | |
Selected Per Share Data | | | | | | | | | | | | | | | | |
Net asset value, beginning of period | | $ | 13.57 | | | $ | 12.31 | | | $ | 9.78 | | | $ | 10.57 | |
Income (loss) from investment operations: | | | | | | | | | | | | | | | | |
Net investment income (loss)^b | | | .21 | | | | .18 | | | | .14 | | | | .06 | |
Net realized and unrealized gain (loss) on investment transactions | | | (.29 | ) | | | 1.22 | | | | 2.53 | | | | (.85 | ) |
| | | | | | | | | | | | | | | | |
Total from investment operations | | | (.08 | ) | | | 1.40 | | | | 2.67 | | | | (.79 | ) |
| | | | | | | | | | | | | | | | |
Less distributions from: | | | | | | | | | | | | | | | | |
Net investment income | | | (.19 | ) | | | (.14 | ) | | | (.14 | ) | | | — | |
Net asset value, end of period | | $ | 13.30 | | | $ | 13.57 | | | $ | 12.31 | | | $ | 9.78 | |
| | | | | | | | | | | | | | | | |
Total Return (%) | | | (.46 | ) | | | 11.50 | | | | 27.73 | | | | (7.47 | )** |
| | | | | | | | | | | | | | | | |
Ratios to Average Net Assets and Supplemental Data | | | | | | | | | | | | | | | | |
Net assets, end of period ($ millions) | | | 18 | | | | 17 | | | | 9 | | | | .4 | |
Ratio of expenses (%) | | | 1.29 | | | | 1.22 | | | | 1.25 | | | | 1.08 | * |
Ratio of net investment income (%) | | | 1.70 | | | | 1.41 | | | | 1.45 | | | | 1.33 | * |
Portfolio turnover rate (%) | | | 27 | | | | 8 | | | | 7 | | | | 13 | |
| ^a | For the period from July 1, 2002 (commencement of operations of Class B shares) to December 31, 2002. |
| ^b | Based on average shares outstanding during the period. |
7
Other Policies and Risks
While the previous pages describe the main points of the portfolio’s strategy and risks, there are a few other issues to know about:
| | • | | The portfolio may trade securities actively. This strategy could raise transaction costs and, accordingly, lower performance. |
| | • | | The advisor or subadvisor may establish a debt security’s credit quality when it buys a security, using independent ratings, or for unrated securities, its own credit determination. When ratings don’t agree, a portfolio may use the higher rating. If a security’s credit quality falls, the advisor or subadvisor will determine whether selling it would be in the portfolio’s best interest. For Scudder Money Market Portfolio, such determination will be made pursuant to procedures adopted by the Board. |
The portfolio’s complete portfolio holdings as of the end of each calendar month are posted on www.dws-scudder.com ordinarily on the 15th day of the following calendar month or the first business day thereafter. This posted information generally remains accessible at least until the portfolio files its Form N-CSR or N-Q with the Securities and Exchange Commission for the period that includes the date as of which the www.dws-scudder.com information is current (expected to be at least three months). The portfolios’ Statement of Additional Information includes a description of the portfolio’s policies and procedures with respect to the disclosure of the portfolio’s holdings.
This prospectus doesn’t tell you about every policy or risk of investing in the portfolio. If you want more information on the portfolio’s allowable securities and investment practices and the characteristics and risks of each one, you may want to request a copy of the Statement of Additional Information (the back cover tells you how to do this).
Keep in mind that there is no assurance that any mutual fund will achieve its goal.
Investment Advisor
DWS Scudder is part of Deutsche Asset Management, which is the marketing name in the US for the asset management activities of Deutsche Bank AG, Deutsche Investment Management Americas Inc. (“DeIM” or the “advisor”), Deutsche Asset Management, Inc., Deutsche Bank Trust Company Americas and DWS Trust Company.
Deutsche Asset Management is a global asset management organization that offers a wide range of investing expertise and resources, including hundreds of portfolio managers and analysts and an office network that reaches the world’s major investment centers. This well-resourced global investment platform brings together a wide variety of experience and investment insight, across industries, regions, asset classes and investing styles.
DeIM is an indirect, wholly owned subsidiary of Deutsche Bank AG. Deutsche Bank AG is a major global banking institution that is engaged in a wide range of financial services, including investment management, mutual fund, retail, private and commercial banking, investment banking and insurance.
DeIM is the investment advisor for the portfolio. Under the supervision of the Board of Trustees, DeIM, with headquarters at 345 Park Avenue, New York, NY 10154, or the subadvisor makes the portfolio’s investment decisions, buy and sell securities for the portfolio and conduct research that leads to these purchase and sale decisions. DeIM and its predecessors have more than 80 years of experience managing mutual funds and DeIM provides a full range of investment advisory services to institutional and retail clients. DeIM or the subadvisor is also responsible for selecting brokers and dealers and for negotiating brokerage commissions and dealer charges.
The portfolio’s shareholder report for the year ended December 31, 2005 contains a discussion regarding the basis for the Board of Trustees’ approval of the portfolio’s investment management agreement and subadvisory agreement (see “Shareholder reports” on the back cover).
8
The advisor receives a management fee from the portfolio. Below is the actual rate paid by the portfolio during the most recent fiscal year, as a percentage of the portfolio’s average daily net assets:
| | | |
Portfolio Name | | Fee Paid | |
DWS Dreman Financial Services VIP | | 0.75 | % |
Portfolio Subadvisor
Dreman Value Management L.L.C., 520 East Cooper Avenue, Aspen, Colorado, is the subadvisor to DWS Dreman Financial Services VIP and receives a fee for its services from DeIM. Founded in 1977, Dreman Value Management L.L.C. currently manages over $11 billion in assets. DeIM pays a fee to Dreman Value Management L.L.C. for acting as subadvisor to DWS Dreman Financial Services VIP.
Market timing related regulatory and litigation matters
Since at least July 2003, federal, state and industry regulators have been conducting ongoing inquiries and investigations (“inquiries”) into the mutual fund industry, and have requested information from numerous mutual fund companies, including DWS Scudder. The DWS funds’ advisors have been cooperating in connection with these inquiries and are in discussions with the regulators concerning proposed settlements. Publicity about mutual fund practices arising from these industrywide inquiries serves as the general basis of a number of private lawsuits against the DWS funds. These lawsuits, which previously have been reported in the press, involve purported class action and derivative lawsuits, making various allegations and naming as defendants various persons, including certain DWS funds, the funds’ investment advisors and their affiliates, and certain individuals, including in some cases fund Trustees/Directors, officers, and other parties. Each DWS fund’s investment advisor has agreed to indemnify the applicable DWS funds in connection with these lawsuits, or other lawsuits or regulatory actions that may be filed making allegations similar to these lawsuits regarding market timing, revenue sharing, fund valuation or other subjects arising from or related to the pending inquiries. It is not possible to determine with certainty what the outcome of these inquiries will be or what the effect, if any, would be on the funds or their advisors.
With respect to the lawsuits, based on currently available information, the funds’ investment advisors believe the likelihood that the pending lawsuits will have a material adverse financial impact on a DWS fund is remote and such actions are not likely to materially affect their ability to perform under their investment management agreements with the DWS funds.
With respect to the regulatory matters, Deutsche Asset Management (“DeAM”) has advised the funds as follows:
DeAM expects to reach final agreements with regulators early in 2006 regarding allegations of improper trading in the DWS funds. DeAM expects that it will reach settlement agreements with the Securities and Exchange Commission, the New York Attorney General and the Illinois Secretary of State providing for payment of disgorgement, penalties, and investor education contributions totaling approximately $134 million. Approximately $127 million of this amount would be distributed to shareholders of the affected DWS funds in accordance with a distribution plan to be developed by an independent distribution consultant. DeAM does not believe that any of the DWS funds will be named as respondents or defendants in any proceedings. The funds’ investment advisors do not believe these amounts will have a material adverse financial impact on them or materially affect their ability to perform under their investment management agreements with the DWS funds. The above-described amounts are not material to Deutsche Bank, and they have already been reserved.
9
Based on the settlement discussions thus far, DeAM believes that it will be able to reach a settlement with the regulators on a basis that is generally consistent with settlements reached by other advisors, taking into account the particular facts and circumstances of market timing at DeAM and at the legacy Scudder and Kemper organizations prior to their acquisition by DeAM in April 2002. Among the terms of the expected settled orders, DeAM would be subject to certain undertakings regarding the conduct of its business in the future, including maintaining existing management fee reductions for certain funds for a period of five years. DeAM expects that these settlements would resolve regulatory allegations that it violated certain provisions of federal and state securities laws (i) by entering into trading arrangements that permitted certain investors to engage in market timing in certain DWS funds and (ii) by failing more generally to take adequate measures to prevent market timing in the DWS funds, primarily during the 1999-2001 period. With respect to the trading arrangements, DeAM expects that the settlement documents will include allegations related to one legacy DeAM arrangement, as well as three legacy Scudder and six legacy Kemper arrangements. All of these trading arrangements originated in businesses that existed prior to the current DeAM organization, which came together in April 2002 as a result of the various mergers of the legacy Scudder, Kemper and Deutsche fund groups, and all of the arrangements were terminated prior to the start of the regulatory investigations that began in the summer of 2003. No current DeAM employee approved the trading arrangements.
There is no certainty that the final settlement documents will contain the foregoing terms and conditions. The independent Trustees/Directors of the DWS funds have carefully monitored these regulatory investigations with the assistance of independent legal counsel and independent economic consultants. Additional information announced by DeAM regarding the terms of the expected settlements will be made available at www.dws-scudder.com/regulatory_settlements, which will also disclose the terms of any final settlement agreements once they are announced.
Other regulatory matters
DeAM is also engaged in settlement discussions with the Enforcement Staffs of the SEC and the NASD regarding DeAM’s practices during 2001-2003 with respect to directing brokerage commissions for portfolio transactions by certain DWS funds to broker-dealers that sold shares in the DWS funds and provided enhanced marketing and distribution for shares in the DWS funds. In addition, on January 13, 2006, DWS Scudder Distributors, Inc. received a Wells notice from the Enforcement Staff of the NASD regarding DWS Scudder Distributors’ payment of non-cash compensation to associated persons of NASD member firms, as well as DWS Scudder Distributors’ procedures regarding non-cash compensation regarding entertainment provided to such associated persons. Additional information announced by DeAM regarding the terms of the expected settlements will be made available at www.dws-scudder.com/regulatory_settlements, which will also disclose the terms of any final settlement agreements once they are announced.
10
Your Investment in the Portfolio
The information in this section may affect anyone who selects the portfolio as an investment option in a variable annuity contract or variable life insurance policy that offers the portfolio. These contracts and policies are described in separate prospectuses issued by participating insurance companies. The portfolio assumes no responsibility for such prospectuses.
Policies about transactions
The information in this prospectus applies to Class B shares of the portfolio. Class B shares are offered at net asset value and are subject to a 12b-1 fee. The portfolio has another class of shares which is offered separately.
Technically, the shareholders of DWS Variable Series II (which includes the portfolio just described) are the participating insurance companies (the “insurance companies”) that offer the portfolio as a choice for holders of certain variable annuity contracts or variable life insurance policies (the “contract(s)”) issued or sponsored by the insurance companies. The insurance companies effectively pass through the ownership of portfolio shares to their contract owners and some may pass through voting rights as well. The portfolio does not sell shares directly to the public. The portfolio sells shares only to separate accounts of insurance companies. As a contract owner, your premium payments are allocated to the portfolio by the insurance companies in accordance with your contract. Please see the contract prospectus that accompanies this prospectus for a detailed explanation of your contract.
Please bear in mind that there are important differences between funds available to any investor (a “Retail Fund”) and those that are only available through certain financial institutions, such as insurance companies. For example, Retail Funds, unlike the portfolio, are not sold to insurance company separate accounts to support investments in variable insurance contracts. In addition, the investment objectives, policies and strategies of the portfolio, while similar to those of a Retail Fund, may not be identical. Retail Funds may be smaller or larger than the portfolio and have different expense ratios than the portfolio. As a result, the performance of the portfolio and a Retail Fund will differ.
Should any conflict between contract owners arise that would require that a substantial amount of net assets be withdrawn from the portfolio, orderly portfolio management could be disrupted to the potential detriment of contract owners in the portfolio.
The portfolio has a verification process for new insurance company accounts to help the government fight the funding of terrorism and money laundering activities. Federal law requires all financial institutions to obtain, verify and record information that identifies each insurance company that opens an account. What this means to you: when an insurance company opens an account, the portfolio will ask for its name, address and other information that will allow the portfolio to identify the company. This information will be verified to ensure the identity of all insurance companies opening an account.
For certain insurance companies, a portfolio might request additional information (for instance, the portfolio would ask for documents such as the insurance company’s articles of incorporation) to help the portfolio verify the insurance company’s identity.
The portfolio will not complete the purchase of any shares for an account until all information has been provided and the application has been submitted in “good order.” Once the application is determined to be in good order, the purchase(s) will be effected at the net asset value per share next calculated.
The portfolio may reject a new account application if the insurance company doesn’t provide any required or requested identifying information, or for other reasons.
11
The advisor, DWS Scudder Distributors, Inc. and/or their affiliates may pay additional compensation from their own assets to other persons for selling, distributing and/or servicing portfolio shares. This compensation may be significant. You should talk to your insurance company to determine if this compensation influenced the financial advisor’s recommendation of the portfolio.
Buying and Selling Shares
The portfolio is open for business each day the New York Stock Exchange is open. The portfolio calculates its share price every business day, as of the close of regular trading on the Exchange (typically 4 p.m. Eastern time, but sometimes earlier, as in the case of scheduled half-day trading or unscheduled suspensions of trading).
The portfolio continuously sells shares to each insurance company, without a sales charge, at the net asset value per share next determined after a proper purchase order is placed with the insurance company. The insurance company offers contract owners units in its separate accounts which directly correspond to shares in the portfolio. Each insurance company submits purchase and redemption orders to the portfolio based on allocation instructions for premium payments, transfer instructions and surrender or partial withdrawal requests for contract owners, as set forth in the accompanying prospectus for the contracts. These orders reflect the amount of premium payments to be invested, surrender and transfer requests, and other matters. Redemption orders are effected at the next net asset value per share determined after a proper redemption order is placed with the insurance company. Contract owners should look at their contract prospectuses for redemption procedures and fees.
Important information about buying and selling shares
| | • | | After receiving a contract owner’s order, the insurance company buys or sells shares at the net asset value next calculated on any day the portfolio is open for business. |
| | • | | Unless otherwise instructed, the portfolio normally makes payment of the proceeds from the sale of shares the next business day but always within seven calendar days. |
| | • | | The portfolio does not issue share certificates. |
| | • | | The portfolio reserves the right to reject purchases of shares for any reason. |
| | • | | The portfolio reserves the right to withdraw or suspend the offering of shares at any time. |
| | • | | The portfolio reserves the right to reject purchases of shares or to suspend or postpone redemptions at times when the New York Stock Exchange is closed (other than customary closings), trading is restricted or when an emergency exists that prevents the portfolio from disposing of its securities or pricing its shares. |
| | • | | The portfolio may refuse, cancel or rescind any purchase order; freeze any account (meaning the insurance company will not be able to purchase shares in its account); suspend account services; and/or involuntarily redeem the account if we think that the account is being used for fraudulent or illegal purposes by the insurance company; one or more of these actions will be taken when, at the sole discretion of the portfolio, they are deemed to be in the portfolio’s best interest or when the portfolio is requested or compelled to do so by governmental authority or by applicable law. |
| | • | | The portfolio may close and liquidate an account if the portfolio is unable to verify provided information, or for other reasons; if the portfolio decides to close the account, the shares will be redeemed at the net asset value per share next calculated after we determine to close the account; the insurance company may be subject to gain or loss on the redemption of the portfolio shares and may incur tax liability. |
| | • | | A contract owner’s purchase order may not be accepted if the sale of portfolio shares has been suspended or if it is determined that the purchase would be detrimental to the interests of the portfolio’s shareholders. |
| | • | | Currently, the Board of Trustees of DWS Variable Series II does not foresee any disadvantages to contract owners arising from the fact that the interests of contract owners may differ. Nevertheless, the Board intends to monitor events in order to identify any material irreconcilable conflicts that may possibly arise and to determine what action, if any, should be taken. |
12
Market Timing Policies and Procedures. Short-term and excessive trading of portfolio shares may present risks to the portfolio’s long-term shareholders, including potential dilution in the value of portfolio shares, interference with the efficient management of the portfolio (including losses on the sale of investments), taxable gains to remaining shareholders and increased brokerage and administrative costs. To the extent that the portfolio invests in such securities, the risks may be more pronounced for certain securities such as those that trade in foreign markets, are illiquid or do not otherwise have “readily available market quotations.” Certain investors may seek to employ short-term trading strategies aimed at exploiting variations in portfolio valuation that arise from the nature of the securities held by the portfolio (e.g., “time zone arbitrage”).
The portfolio discourages short-term and excessive trading. The portfolio will take steps to detect and deter short-term and excessive trading pursuant to the portfolio’s policies as described in this prospectus and approved by the Board.
The portfolio’s policies include:
| | • | | the portfolio reserves the right to reject or cancel a purchase or exchange order for any reason when, in the opinion of the advisor, there appears to be a pattern of short-term or excessive trading activity by a shareholder or any other trading activity deemed harmful or disruptive to the portfolio; and |
| | • | | the portfolio has adopted certain fair valuation practices reasonably designed to protect the portfolio from “time zone arbitrage” with respect to its foreign securities holdings and other trading practices that seek to exploit variations in portfolio valuation that arise from the nature of the securities held by the portfolio. (See “How the Portfolio Calculates Share Price.”) |
When a pattern of short-term or excessive trading activity or other trading activity deemed harmful or disruptive to the portfolio is detected in a particular separate account, the advisor will take steps to stop this activity by contacting the insurance company that maintains the accounts for the underlying contract holders and seeking to have the insurance company enforce the separate account’s policies on short-term or excessive trading, if any. In addition, the advisor and the portfolio reserves the right to terminate a separate account’s ability to invest in the portfolio if apparent short-term or excessive trading activity persists. The detection of these patterns and the banning of further trading are inherently subjective and therefore involve some selectivity in their application. The advisor seeks to make such determinations in a manner consistent with the interests of the portfolio’s long-term shareholders.
There is no assurance that these policies and procedures will be effective in limiting short-term and excessive trading in all cases. For example, the advisor may not be able to effectively monitor, detect or limit short-term or excessive trading by underlying shareholders that occurs through separate accounts maintained by insurance companies or other financial intermediaries. Depending on the amount of portfolio shares held in a particular separate account (which may represent most of the portfolio’s shares) short-term and/or excessive trading of portfolio shares could adversely affect long-term shareholders in the portfolio. It is important to note that the advisor and the portfolio does not have access to underlying shareholders’ trading activity and that investors will be subject to the policies and procedures of their insurance company with respect to short-term and excessive trading in the portfolio.
The portfolio’s policies and procedures may be modified or terminated at any time.
How to receive account information
If you are a contract owner, you should contact your insurance company or the organization that provides record keeping services for information about your account.
Please see the contract prospectus that accompanies this prospectus for the customer service phone number.
How to buy and sell shares
Each insurance company has different provisions about how and when their contract owners may buy and sell portfolio shares. Each insurance company is responsible for communicating its contract owners’ instructions to the portfolio. Contract owners should contact their insurance company to effect transactions in the portfolio.
13
How the Portfolio Calculates Share Price
To calculate net asset value per share, or NAV, the portfolio uses the following equation:
| | |
| TOTAL ASSETS - TOTAL LIABILITIES | | = NAV |
| TOTAL NUMBER OF SHARES OUTSTANDING | |
The price at which you buy and sell shares for the portfolio is the NAV.
We typically value securities using information furnished by an independent pricing service or market quotations, where appropriate. However, we may use methods approved by the portfolio’s Board, such as a fair valuation model, which are intended to reflect fair value when pricing service information or market quotations are not readily available or when a security’s value or a meaningful portion of the value of the portfolio is believed to have been materially affected by a significant event, such as a natural disaster, an economic event like a bankruptcy filing, or a substantial fluctuation in domestic or foreign markets, that has occurred between the close of the exchange or market on which the security is principally traded (for example, a foreign exchange or market) and the close of the New York Stock Exchange. In such a case, the portfolio’s value for a security is likely to be different from the last quoted market price or pricing service information. In addition, due to the subjective and variable nature of fair value pricing, it is possible that the value determined for a particular asset may be materially different from the value realized upon such asset’s sale. It is expected that the greater the percentage of portfolio assets that is invested in non-US securities, the more extensive will be the portfolio’s use of fair value pricing. This is intended to reduce the portfolio’s exposure to “time zone arbitrage” and other harmful trading practices. (See “Market Timing Policies and Procedures.”)
To the extent that the portfolio invests in securities that are traded primarily in foreign markets, the value of its holdings could change at a time when you aren’t able to buy or sell portfolio shares through the contract. This is because some foreign markets are open on days and at times when the portfolio doesn’t price its shares.
Distributions
The portfolio intends to declare and distribute dividends from its net investment income and capital gains, if any, annually. The portfolio may make additional distributions if necessary.
All distributions will be reinvested in shares of the portfolio unless we are informed by an insurance company that they should be paid out in cash. The insurance companies will be informed about the amount and character of distributions from the portfolio for federal income tax purposes.
Taxes
The portfolio intends to qualify each year as a regulated investment company under Subchapter M of the Internal Revenue Code of 1986, as amended, (the “Code”) and to meet all requirements necessary to avoid paying any federal income or excise taxes.
Generally, owners of variable annuity and variable life contracts are not taxed currently on income or gains realized with respect to such contracts. However, some distributions from such contracts, whether made prior to or during the annuity payment period, may be taxable at ordinary income tax rates. In addition, distributions made to an owner who is younger than 59 1/2 may be subject to a 10% penalty tax. For further information concerning federal income tax consequences for the holders of variable annuity contracts and variable life insurance policies, such holders should consult the prospectus used in connection with the issuance of their particular contracts or policies.
In order for investors to receive the favorable tax treatment available to holders of variable annuity and variable life contracts, the separate accounts underlying such contracts, as well as the funds in which such accounts invest, must meet certain diversification requirements. The portfolio intends to comply with these requirements. If the portfolio or separate account does not meet such requirements or otherwise fails to qualify as a regulated investment company for any taxable year, income allocable to the contracts associated with the separate account would be taxable currently to the holders of such contracts and income from prior periods with respect to such contracts also could be taxable, most likely in the year of the failure.
14
Under Treasury regulations, insurance companies holding the separate accounts must report to the Internal Revenue Service losses above a certain amount resulting from a sale or disposition of the portfolio’s share.
The discussion above is generally based on the assumption that shares of the portfolio will be respected as owned by insurance company separate accounts. If this is not the case (for example, because the Internal Revenue Service finds an impermissible level of “investor control” over the investment options underlying variable contracts), the advantageous tax treatment provided in respect of insurance company separate accounts under the Code will no longer be available, and the person or persons determined to own the portfolio shares will be currently taxed on portfolio distributions, and on the proceeds of any redemption of portfolio shares, under the Code rules.
Portfolio investments in securities of foreign issuers may be subject to withholding and other taxes at the source, including on dividend or interest payments. Participating insurance companies should consult their own tax advisors as to whether such distributions are subject to federal income tax if they are retained as part of policy reserves.
The portfolio’s investments in certain debt obligations may cause the portfolio to recognize taxable income in excess of the cash generated by such obligation. Thus, the portfolio could be required at times to liquidate other investments in order to satisfy its distribution requirements.
The preceding is a brief summary of certain of the relevant tax considerations. Because each shareholder and contract holder’s tax situation is unique, ask your tax professional about the tax consequences of your investments, including possible foreign, state or local taxes.
Marketing and Distribution Fees
DWS Scudder Distributors, Inc., a subsidiary of the investment advisor, is the portfolio’s distributor.
DWS Variable Series II has adopted a 12b-1 plan for all Class B shares. Under the plan, DWS Variable Series II may make quarterly payments to the distributor for distribution and shareholder servicing related expenses incurred or paid by the distributor or a participating insurance company. No such payment shall be made with respect to any quarterly period in excess of an amount determined for such period at the annual rate of 0.25% of the average daily net assets of Class B shares during that quarterly period. Depending on the participating insurance company’s corporate structure and applicable state law, the distributor may remit payments to the participating insurance company’s affiliated broker-dealers or other affiliated company rather than the participating insurance company itself.
Because 12b-1 fees for Class B shares are paid out of portfolio assets on an ongoing basis, they will, over time, increase the cost of investment in Class B shares and may cost more than other types of sales charges.
Examples of expenses payable under the plan include the costs of printing and mailing materials (such as portfolio prospectuses, shareholder reports, portfolio advertisements and sales literature), holding seminars and sales meetings, providing customer service to policyholders and sales compensation.
15
This page
Intentionally
left blank.
To Get More Information
Shareholder reports — These include commentary from the portfolio’s management team about recent market conditions and the portfolio’s performance. They also have detailed performance figures, a list of everything the portfolio owns and its financial statements. Shareholders get these reports automatically.
Statement of Additional Information (SAI) — This tells you more about the portfolio’s features and policies, including additional risk information. The SAI is incorporated by reference into this document (meaning that it’s legally part of this prospectus).
For a free copy of any of these documents or to request other information about the portfolio, call (800) 778-1482, or contact DWS Scudder at the address listed below. The portfolio’s SAI and shareholder reports are also available through the DWS Scudder Web site at www.dws-scudder.com. These documents and other information about the portfolio are available from the EDGAR Database on the SEC’s Web site at www.sec.gov. If you like, you may obtain copies of this information, after paying a copying fee, by e-mailing a request to publicinfo@sec.gov or by writing the SEC at the address listed below. You can also review and copy these documents and other information about the portfolio, including the portfolio’s SAI, at the SEC’s Public Reference Room in Washington, D.C. Information on the operation of the SEC’s Public Reference Room may be obtained by calling (202) 551-5850.
| | |
| DWS Scudder Distributors, Inc. | | SEC |
| |
| 222 South Riverside Plaza | | 100 F Street, N.E. |
| Chicago, IL 60606-5808 | | Washington, D.C. 20549-2001 |
| (800) 778-1482 | | (202) 551-5850 |
| |
| | www.sec.gov |
| |
| | SEC File # |
| |
| DWS Variable Series II | | 811-5002 |
MAY 1, 2006
PROSPECTUS
DWS VARIABLE SERIES II
(formerly Scudder Variable Series II)
CLASS A SHARES
DWS MFS Strategic Value VIP
(formerly SVS MFS Strategic Value Portfolio)
This prospectus should be read in conjunction with the variable life insurance or variable annuity contract prospectus and plan documents for tax-qualified plans. These shares are available and are being marketed exclusively as a pooled funding vehicle for life insurance companies writing all types of variable life insurance policies and variable annuity contracts.
The Securities and Exchange Commission (SEC) does not approve or disapprove these shares or determine whether the information in this prospectus is truthful or complete. It is a criminal offense for anyone to inform you otherwise.
ONE GLOBAL FORCE. ONE FOCUS. YOU. [DWS SCUDDER Logo]
Deutsche Bank Group
Table of Contents
How the Portfolio Works
The portfolio is designed to serve as an investment option for certain variable annuity contracts, variable life insurance policies and tax-qualified plans. Your investment in the portfolio is made in conjunction with one of these contracts or policies.
Remember that the portfolio is not a bank deposit. It’s not insured or guaranteed by the FDIC or any other government agency. Its share price will go up and down and you could lose money by investing in the portfolio.
Please read this prospectus in conjunction with the prospectus for your variable life insurance policy or variable annuity contract or plan documents for tax-qualified plans.
DWS MFS Strategic Value VIP
(formerly SVS MFS Strategic Value Portfolio)
The Portfolio’s Main Investment Strategy
The portfolio’s investment objective is to provide capital appreciation. The portfolio invests, under normal market conditions, at least 65% of its net assets in common stocks and related securities, such as preferred stocks, convertible securities and depositary receipts, of companies which the manager believes are undervalued in the market relative to their long term potential. The equity securities of these companies may be undervalued because they are temporarily out of favor in the market due to:
| | • | | a decline in the market |
| | • | | poor economic conditions |
| | • | | developments that have affected or may affect the issuer of the securities or the issuer’s industry; or |
| | • | | the market has overlooked them |
Undervalued equity securities generally have low price-to-book, price-to-sales and/or price-to-earnings ratios. The portfolio’s investments may include securities listed on a securities exchange or traded in the over-the-counter markets.
The portfolio also invests in other types of securities, such as fixed income securities, including lower rated securities commonly referred to as junk bonds, and warrants, when relative values make such purchases attractive.
The manager uses a bottom-up, as opposed to a top-down, investment style in managing the portfolio. This means that securities are selected based upon fundamental analysis (such as an analysis of earnings, cash flows, competitive position and management’s abilities) performed by the manager and the subadvisor’s large group of equity research analysts.
Securities Lending. The portfolio may lend its investment securities in an amount up to 33 1/3% of its total assets to approved institutional borrowers who need to borrow securities in order to complete certain transactions.
Although major changes tend to be infrequent, the Board of Trustees could change the portfolio’s investment objective without seeking shareholder approval.
Other Investments
The portfolio may invest in foreign securities (including emerging markets securities), through which it may have exposure to foreign currencies. The portfolio has engaged and may engage in active and frequent trading to achieve its principal investment strategies.
The portfolio is permitted, but not required, to use various types of derivatives (contracts whose value is based on, for example, indexes, currencies or securities). The portfolio may use derivatives in circumstances where the manager believes they offer an economical means of gaining exposure to a particular asset class or to keep cash on hand to meet shareholder redemptions or other needs while maintaining exposure to the market.
As a temporary defensive measure, the portfolio could shift up to 100% of assets into investments such as money market securities. This measure could prevent losses, but, while engaged in a temporary defensive position, the portfolio will not be pursuing its investment objective. However, the portfolio manager may choose not to use these strategies for various reasons, even in very volatile market conditions.
The Main Risks of Investing in the Portfolio
There are several risk factors that could hurt the portfolio’s performance, cause you to lose money or cause the portfolio’s performance to trail that of other investments.
3
Stock Market Risk. As with most stock portfolios, an important factor with this portfolio is how stock markets perform. When stock prices fall, you should expect the value of your investment to fall as well. Large company stocks at times may not perform as well as stocks of smaller or mid-sized companies. Because a stock represents ownership in its issuer, stock prices can be hurt by poor management, shrinking product demand and other business risks. These may affect single companies as well as groups of companies. In addition, movements in financial markets may adversely affect a stock’s price, regardless of how well the company performs. The market as a whole may not favor the type of investments the portfolio makes and the portfolio may not be able to get attractive prices for them.
Value Investing Risk. As with any investment strategy, the “value” strategy used in managing the portfolio will, at times, perform better than or worse than other investment styles and the overall market. If the advisor overestimates the value or return potential of one or more common stocks, the portfolio may underperform the general equity market. Value stocks may also be out of favor for certain periods in relation to growth stocks.
Industry Risk. While the portfolio does not concentrate in any industry, to the extent that the portfolio has exposure to a given industry or sector, any factors affecting that industry or sector could affect the value of portfolio securities. For example, manufacturers of consumer goods could be hurt by a rise in unemployment, or technology companies could be hurt by such factors as market saturation, price competition and rapid obsolescence.
IPO Risk. Securities purchased in initial public offerings (IPOs) may be very volatile, rising and falling rapidly, often based, among other reasons, on investor perceptions rather than on economic factors. Additionally, investments in IPOs may magnify the portfolio’s performance if it has a small asset base. The portfolio is less likely to experience a similar impact on its performance as its assets grow because it is unlikely that the portfolio will be able to obtain proportionately larger IPO allocations.
Derivatives Risk. Risks associated with derivatives include: the risk that the derivative is not well correlated with the security, index or currency to which it relates; the risk that derivatives used for risk management may not have the intended effects and may result in losses or missed opportunities; the risk that the portfolio will be unable to sell the derivative because of an illiquid secondary market; the risk that a counterparty is unwilling or unable to meet its obligation; the risk of interest rate movements and the risk that the derivatives transaction could expose the portfolio to the effects of leverage, which could increase the portfolio’s exposure to the market and magnify potential losses. There is no guarantee that derivatives activities will be employed or that they will work, and their use could cause lower returns or even losses to the portfolio.
Securities Lending Risk. Any loss in the market price of securities loaned by the portfolio that occurs during the term of the loan would be borne by the portfolio and would adversely affect the portfolio’s performance. Also, there may be delays in recovery of securities loaned or even a loss of rights in the collateral should the borrower of the securities fail financially while the loan is outstanding. However, loans will be made only to borrowers selected by the portfolio’s delegate after a review of relevant facts and circumstances, including the creditworthiness of the borrower.
Pricing Risk. At times, market conditions might make it hard to value some investments. For example, if the portfolio has valued its securities too highly, you may end up paying too much for portfolio shares when you buy into the portfolio. If the portfolio underestimates their price, you may not receive the full market value for your portfolio shares when you sell.
Security Selection Risk. A risk that pervades all investing is the risk that the securities held by the portfolio will decline in value.
Other factors that could affect performance include:
| | • | | the manager could be incorrect in his analysis of industries, companies, economic trends, the relative attractiveness of different sizes of stocks, geographical trends or other matters; |
| | • | | a bond could decline in credit quality or go into default; this risk is greater with lower rated bonds; |
| | • | | some bonds could be paid off earlier than expected, which could hurt the portfolio’s performance; and |
| | • | | foreign securities tend to be more volatile than their US counterparts, for reasons such as currency fluctuations and political and economic uncertainty. |
4
Performance
While a portfolio’s past performance isn’t necessarily a sign of how it will do in the future, it can be valuable for an investor to know.
The bar chart shows how the returns for the portfolio’s Class A shares have varied from year to year, which may give some idea of risk. The table shows how average annual returns for the portfolio’s Class A shares compare with a broad-based market index (which, unlike the portfolio, does not have any fees or expenses). The performance of both the portfolio and the index varies over time. All figures on this page assume reinvestment of dividends and distributions.
This information doesn’t reflect charges and fees associated with the separate account that invests in the portfolio or any variable life insurance policy or variable annuity contract for which the portfolio is an investment option. These charges and fees will reduce returns.
Annual Total Return (%) as of 12/31 each year — Class A shares
THE ORIGINAL DOCUMENT CONTAINS A BAR CHART HERE
BAR CHART DATA:
| | | | |
| 26.74 | | 17.82 | | -0.18 |
| 2003 | | 2004 | | 2005 |
For the periods included in the bar chart:
| | |
| Best Quarter: 19.90%, Q2 2003 | | Worst Quarter: -5.44%, Q1 2003 |
2006 Total Return as of March 31: 4.76%
Average Annual Total Returns (%) as of 12/31/2005
| | | | |
| | | 1 Year | | Since Inception* |
Portfolio — Class A | | -0.18 | | 5.34 |
Index | | 7.05 | | 8.81 |
Index: The Russell 1000 Value Index is an unmanaged index which consists of those stocks in the Russell 1000 Index with lower price-to-book ratios and lower forecasted growth values.
| * | Since 5/1/02. Index comparison begins 4/30/02. |
Total returns would have been lower if operating expenses hadn’t been reduced.
Current performance information may be higher or lower than the performance data quoted above. For more recent performance information, contact your participating insurance company.
5
How Much Investors Pay
This table describes the fees and expenses that you may pay if you buy and hold portfolio shares. The information in the table does not reflect charges and fees associated with the separate account that invests in the portfolio or any variable life insurance policy or variable annuity contract for which the portfolio is an investment option. These charges and fees will increase expenses.
| | | |
Fee Table | | Class A | |
Annual Operating Expenses, deducted from portfolio assets | | | |
Management Fee | | 0.95 | % |
Distribution/Service (12b-1) Fee | | None | |
Other Expenses | | 0.30 | |
| | | |
Total Annual Operating Expenses(1) | | 1.25 | |
| | | |
| (1) | Pursuant to their respective agreements with DWS Variable Series II, the advisor, the underwriter and the accounting agent have agreed, through September 30, 2006, to limit their respective fees and to reimburse other expenses to the extent necessary to limit total operating expenses of Class A shares of DWS MFS Strategic Value VIP to 0.86%, excluding certain expenses such as extraordinary expenses, taxes, brokerage and interest. |
Based on the costs above, this example helps you compare the expenses of Class A shares to those of other mutual funds. This example assumes the expenses above remain the same. It also assumes that you invested $10,000, earned 5% annual returns, reinvested all dividends and distributions and sold your shares at the end of each period. This is only an example; actual expenses will be different.
| | | | | | | | | | | | |
Example | | 1 Year | | 3 Years | | 5 Years | | 10 Years |
Class A shares | | $ | 127 | | $ | 397 | | $ | 686 | | $ | 1,511 |
The Portfolio Managers
The portfolio’s subadvisor is Massachusetts Financial Services Company (“MFS”). The portfolio is managed by a team that participates equally in the research process, strategy discussions, portfolio construction, final buy and sell decisions, and risk management for the portfolio. The portfolio management team is comprised of Kenneth J. Enright and Alan T. Langsner. Mr. Enright is a Senior Vice President of MFS and a Chartered Financial Analyst, has been employed in the investment management area of the subadvisor since 1986 and joined the portfolio in 2002. Mr. Langsner is a Vice President of MFS. He joined MFS in 1999 as an Equity Research Analyst following newspapers, networking, telecom equipment, specialty pharmaceuticals, electric equipment, software, and small and mid-cap biotechnology. Mr. Langsner joined the portfolio in 2004.
The portfolio’s Statement of Additional Information provides additional information about the portfolio managers’ investments in the portfolio, a description of their compensation structure and information regarding other accounts they manage.
6
Financial Highlights
This table is designed to help you understand the portfolio’s financial performance. The figures in the first part of the table are for a single share. The total return figures represent the percentage that an investor in the portfolio would have earned (or lost), assuming all dividends and distributions were reinvested. This information has been audited by Ernst & Young LLP, independent registered public accounting firm, whose report, along with the portfolio’s financial statements, is included in the portfolio’s annual report (see “Shareholder reports” on the back cover).
The following table includes selected data for a share outstanding throughout each period and other performance information derived from the financial statements.
This information doesn’t reflect charges and fees associated with the separate account that invests in the portfolio or any variable life insurance policy or variable annuity contract for which the portfolio is an investment option. These charges and fees will reduce returns.
DWS MFS Strategic Value VIP — Class A
| | | | | | | | | | | | | | | | |
Years Ended December 31, | | 2005 | | | 2004 | | | 2003 | | | 2002^a | |
Selected Per Share Data | | | | | | | | | | | | | | | | |
Net asset value, beginning of period | | $ | 12.00 | | | $ | 10.24 | | | $ | 8.12 | | | $ | 10.00 | |
Income (loss) from investment operations: | | | | | | | | | | | | | | | | |
Net investment income (loss)^b | | | .08 | | | | .11 | | | | .06 | | | | .05 | |
Net realized and unrealized gain (loss) on investment transactions | | | (.12 | ) | | | 1.71 | | | | 2.10 | | | | (1.93 | ) |
| | | | | | | | | | | | | | | | |
Total from investment operations | | | (.04 | ) | | | 1.82 | | | | 2.16 | | | | (1.88 | ) |
| | | | | | | | | | | | | | | | |
Less distributions from: | | | | | | | | | | | | | | | | |
Net investment income | | | (.16 | ) | | | (.05 | ) | | | (.04 | ) | | | — | |
Net realized gain on investment transactions | | | (.99 | ) | | | (.01 | ) | | | — | | | | — | |
Tax return of capital | | | (.10 | ) | | | — | | | | — | | | | — | |
| | | | | | | | | | | | | | | | |
Total distributions | | | (1.25 | ) | | | (.06 | ) | | | (.04 | ) | | | — | |
| | | | | | | | | | | | | | | | |
Net asset value, end of period | | $ | 10.71 | | | $ | 12.00 | | | $ | 10.24 | | | $ | 8.12 | |
Total Return (%)^c | | | (.18 | ) | | | 17.82 | | | | 26.74 | | | | (18.80 | )** |
Ratios to Average Net Assets and Supplemental Data | | | | | | | | | | | | | | | | |
Net assets, end of period ($ millions) | | | 28 | | | | 15 | | | | 7 | | | | 5 | |
Ratio of expenses before expense reductions (%) | | | 1.25 | | | | 1.42 | | | | 1.93 | | | | 2.71 | * |
Ratio of expenses after expense reductions (%) | | | 1.05 | | | | 1.14 | | | | 1.15 | | | | 1.15 | * |
Ratio of net investment income (loss) (%) | | | .73 | | | | 1.05 | | | | .67 | | | | .82 | * |
Portfolio turnover rate (%) | | | 59 | | | | 54 | | | | 40 | | | | 7 | |
| ^a | For the period from May 1, 2002 (commencement of operations) to December 31, 2002. |
| ^b | Based on average shares outstanding during the period. |
| ^c | Total return would have been lower had certain expenses not been reduced. |
7
Other Policies and Risks
While the previous pages describe the main points of the portfolio’s strategy and risks, there are a few other issues to know about:
| | • | | The portfolio may trade securities actively. This strategy could raise transaction costs and, accordingly, lower performance. |
| | • | | The advisor or subadvisor may establish a debt security’s credit quality when it buys a security, using independent ratings, or for unrated securities, its own credit determination. When ratings don’t agree, the portfolio may use the higher rating. If a security’s credit quality falls, the advisor or subadvisor will determine whether selling it would be in the portfolio’s best interest. |
The portfolio’s complete portfolio holdings as of the end of each calendar month are posted on www.dws-scudder.com ordinarily on the 15th day of the following calendar month or the first business day thereafter. This posted information generally remains accessible at least until the portfolio files its Form N-CSR or N-Q with the Securities and Exchange Commission for the period that includes the date as of which the www.dws-scudder.com information is current (expected to be at least three months). The portfolio’s Statement of Additional Information includes a description of the portfolio’s policies and procedures with respect to the disclosure of the portfolio’s holdings.
This prospectus doesn’t tell you about every policy or risk of investing in the portfolio. If you want more information on the portfolio’s allowable securities and investment practices and the characteristics and risks of each one, you may want to request a copy of the Statement of Additional Information (the back cover tells you how to do this).
Keep in mind that there is no assurance that any mutual fund will achieve its goal.
Investment Advisor
DWS Scudder is part of Deutsche Asset Management, which is the marketing name in the US for the asset management activities of Deutsche Bank AG, Deutsche Investment Management Americas Inc. (“DeIM” or the “advisor”), Deutsche Asset Management, Inc., Deutsche Bank Trust Company Americas and DWS Trust Company.
Deutsche Asset Management is a global asset management organization that offers a wide range of investing expertise and resources, including hundreds of portfolio managers and analysts and an office network that reaches the world’s major investment centers. This well-resourced global investment platform brings together a wide variety of experience and investment insight, across industries, regions, asset classes and investing styles.
DeIM is an indirect, wholly owned subsidiary of Deutsche Bank AG. Deutsche Bank AG is a major global banking institution that is engaged in a wide range of financial services, including investment management, mutual fund, retail, private and commercial banking, investment banking and insurance.
DeIM is the investment advisor for the portfolio. Under the supervision of the Board of Trustees, DeIM, with headquarters at 345 Park Avenue, New York, NY 10154, or the subadvisor makes the portfolio’s investment decisions, buy and sell securities for the portfolio and conduct research that leads to these purchase and sale decisions. DeIM and its predecessors have more than 80 years of experience managing mutual funds and DeIM provides a full range of investment advisory services to institutional and retail clients. DeIM or the subadvisor is also responsible for selecting brokers and dealers and for negotiating brokerage commissions and dealer charges.
The portfolio’s shareholder report for the year ended December 31, 2005 contains a discussion regarding the basis for the Board of Trustees’ approval of the portfolio’s investment management agreement and subadvisory agreement (see “Shareholder reports” on the back cover).
The advisor receives a management fee from the portfolio. Below is the actual rate paid by the portfolio during the most recent fiscal year, as a percentage of the portfolio’s average daily net assets:
| | | |
Portfolio Name | | Fee Paid | |
DWS MFS Strategic Value VIP* | | 0.75 | % |
| * | Reflecting the effect of expense limitations and/or fee waivers then in effect. |
8
Portfolio Subadvisor
Massachusetts Financial Services Company (“MFS”), 500 Boylston Street, Boston, Massachusetts 02116, is the subadvisor to DWS MFS Strategic Value VIP. MFS is America’s oldest mutual fund organization. MFS and its predecessor organizations have a history of money management dating from 1924 and the founding of the first mutual fund, Massachusetts Investors Trust. Net assets under the management of the MFS organization were approximately $163 billion as of December 31, 2005. DeIM pays a fee to MFS for acting as subadvisor to DWS MFS Strategic Value VIP.
Although none of the legal proceedings described below currently involve your portfolio, these matters affect MFS, your portfolio’s subadvisor. The information that follows has been provided to the portfolio by MFS.
On March 31, 2004, MFS settled an administrative proceeding with the Securities and Exchange Commission (“SEC”) regarding disclosure of brokerage allocation practices in connection with MFS fund sales (the term “MFS funds” means the open-end registered management investment companies sponsored by MFS). The brokerage allocation practices which were the subject of this proceeding were discontinued by MFS in November 2003. In addition, in February 2004, MFS reached agreement with the SEC, the New York Attorney General (“NYAG”) and the Bureau of Securities Regulation of the State of New Hampshire to settle administrative proceedings alleging false and misleading information in certain MFS open-end retail fund prospectuses regarding market timing and related matters.
Since December 2003, MFS, MFS Fund Distributors, Inc., MFS Service Center, Inc., MFS Corporation Retirement Committee, Sun Life Financial Inc., various MFS funds, certain current and/or former Trustees of these MFS funds, and certain officers of MFS have been named as defendants in multiple lawsuits filed in federal and state courts. The lawsuits variously have been commenced as class actions or individual actions on behalf of investors who purchased, held or redeemed shares of the MFS funds during specified periods, as ERISA actions by participants in certain retirement plan accounts on behalf of those accounts, or as derivative actions on behalf of the MFS funds. The lawsuits relating to market timing and related matters have been transferred to, and consolidated before, the United States District Court for the District of Maryland, as part of a multi-district litigation of market timing and related claims involving several other fund complexes (In re Mutual Funds Investment Litigation (Alger, Columbia, Janus, MFS, One Group, Putnam, Allianz Dresdner), No. 1:04-md-15863 (transfer began March 19, 2004)). The market timing cases related to the MFS complex are Riggs v. MFS et al., Case No. 04-CV-01162-JFM (direct), Hammerslough v. MFS et al., Case No. 04-MD-01620 (derivative), Anita Walker v. MFS et al., Case No. 1:04-CV-01758 (ERISA), and Reaves v. MFS Series Trust I, et al., Case No. 1:05-CV-02220-JFM (Class B Shares). The plaintiffs in these consolidated lawsuits generally seek injunctive relief including removal of the named Trustees, adviser and distributor, rescission of contracts and 12b-1 Plans, disgorgement of fees and profits, monetary damages, punitive damages, attorney’s fees and costs and other equitable and declaratory relief. Two lawsuits alleging improper brokerage allocation practices and excessive compensation are pending in the United States District Court for the District of Massachusetts (Forsythe v. Sun Life Financial Inc., et al., No. 04cv10584 (GAO) (a consolidated action) and Marcus Dumond, et al. v. Massachusetts Financial Servs. Co., et al., No. 04cv11458 (GAO)). The plaintiffs in these lawsuits generally seek compensatory damages, punitive damages, recovery of fees, rescission of contracts, an accounting, restitution, declaratory relief, equitable and/or injunctive relief and attorney’s fees and costs. The various lawsuits generally allege that some or all of the defendants (i) permitted or acquiesced in market timing and/or late trading in some of the MFS funds, inadequately disclosed MFS’ internal policies concerning market timing and such matters, (ii) received excessive compensation as fiduciaries to the MFS funds, or (iii) permitted or acquiesced in the improper use of fund assets by MFS to support the distribution of MFS fund shares and inadequately disclosed MFS’ use of fund assets in this manner. The actions assert that some or all of the defendants violated the federal securities laws, including the Securities Act of 1933 and the Securities Exchange Act of 1934, the Investment Company Act of 1940 and the Investment Advisers Act of 1940, the Employee Retirement Income Security Act of 1974, as well as fiduciary duties and other violations of common law. Insofar as any of the actions is appropriately brought derivatively on behalf of any of the MFS funds, any recovery will inure to the benefit of the MFS funds. The defendants filed separate motions to dismiss all claims of the various lawsuits (except Reaves, which has not been separately briefed). On November 3, 2005, the district judge considering the motions to dismiss the Riggs and Hammerslough actions issued memoranda indicating that he intends to grant in part and deny in part defendants’ motions in these actions. A formal order consistent with the court’s memoranda is forthcoming. On January 19, 2006, the district judge considering the Forsythe and
9
Dumond actions denied defendants’ motion to dismiss the Dumond action and granted in part (including dismissing all claims against the Trustees and Sun Life Financial, Inc.) and denied in part defendants’ motion to dismiss the Forsythe action. Additional lawsuits based on similar allegations may be filed in the future.
Any potential resolution of these matters may include, but not be limited to, judgments or settlements for damages against MFS, the MFS funds, or any other named defendant. It is not clear whether any amounts paid in connection with the above regulatory settlements will be sufficient to compensate shareholders for all of the damage they allegedly sustained, whether certain shareholders or putative class members may have additional claims to compensation, or whether the damages that may be awarded in any of the actions will exceed these amounts. In the event the MFS funds incur any losses, costs or expenses in connection with such lawsuits, the Boards of Trustees of the affected MFS funds may pursue claims on behalf of such funds against any party that may have liability to the funds in respect thereof. There can be no assurance that these regulatory actions and lawsuits, or the adverse publicity associated with these developments, will not result in increased fund redemptions, reduced sales of fund shares, or other adverse consequences to the MFS funds.
Market timing related regulatory and litigation matters
Since at least July 2003, federal, state and industry regulators have been conducting ongoing inquiries and investigations (“inquiries”) into the mutual fund industry, and have requested information from numerous mutual fund companies, including DWS Scudder. The DWS funds’ advisors have been cooperating in connection with these inquiries and are in discussions with the regulators concerning proposed settlements. Publicity about mutual fund practices arising from these industrywide inquiries serves as the general basis of a number of private lawsuits against the DWS funds. These lawsuits, which previously have been reported in the press, involve purported class action and derivative lawsuits, making various allegations and naming as defendants various persons, including certain DWS funds, the funds’ investment advisors and their affiliates, and certain individuals, including in some cases fund Trustees/Directors, officers, and other parties. Each DWS fund’s investment advisor has agreed to indemnify the applicable DWS funds in connection with these lawsuits, or other lawsuits or regulatory actions that may be filed making allegations similar to these lawsuits regarding market timing, revenue sharing, fund valuation or other subjects arising from or related to the pending inquiries. It is not possible to determine with certainty what the outcome of these inquiries will be or what the effect, if any, would be on the funds or their advisors.
With respect to the lawsuits, based on currently available information, the funds’ investment advisors believe the likelihood that the pending lawsuits will have a material adverse financial impact on a DWS fund is remote and such actions are not likely to materially affect their ability to perform under their investment management agreements with the DWS funds.
With respect to the regulatory matters, Deutsche Asset Management (“DeAM”) has advised the funds as follows:
DeAM expects to reach final agreements with regulators early in 2006 regarding allegations of improper trading in the DWS funds. DeAM expects that it will reach settlement agreements with the Securities and Exchange Commission, the New York Attorney General and the Illinois Secretary of State providing for payment of disgorgement, penalties, and investor education contributions totaling approximately $134 million. Approximately $127 million of this amount would be distributed to shareholders of the affected DWS funds in accordance with a distribution plan to be developed by an independent distribution consultant. DeAM does not believe that any of the DWS funds will be named as respondents or defendants in any proceedings. The funds’ investment advisors do not believe these amounts will have a material adverse financial impact on them or materially affect their ability to perform under their investment management agreements with the DWS funds. The above-described amounts are not material to Deutsche Bank, and they have already been reserved.
10
Based on the settlement discussions thus far, DeAM believes that it will be able to reach a settlement with the regulators on a basis that is generally consistent with settlements reached by other advisors, taking into account the particular facts and circumstances of market timing at DeAM and at the legacy Scudder and Kemper organizations prior to their acquisition by DeAM in April 2002. Among the terms of the expected settled orders, DeAM would be subject to certain undertakings regarding the conduct of its business in the future, including maintaining existing management fee reductions for certain funds for a period of five years. DeAM expects that these settlements would resolve regulatory allegations that it violated certain provisions of federal and state securities laws (i) by entering into trading arrangements that permitted certain investors to engage in market timing in certain DWS funds and (ii) by failing more generally to take adequate measures to prevent market timing in the DWS funds, primarily during the 1999-2001 period. With respect to the trading arrangements, DeAM expects that the settlement documents will include allegations related to one legacy DeAM arrangement, as well as three legacy Scudder and six legacy Kemper arrangements. All of these trading arrangements originated in businesses that existed prior to the current DeAM organization, which came together in April 2002 as a result of the various mergers of the legacy Scudder, Kemper and Deutsche fund groups, and all of the arrangements were terminated prior to the start of the regulatory investigations that began in the summer of 2003. No current DeAM employee approved the trading arrangements.
There is no certainty that the final settlement documents will contain the foregoing terms and conditions. The independent Trustees/Directors of the DWS funds have carefully monitored these regulatory investigations with the assistance of independent legal counsel and independent economic consultants. Additional information announced by DeAM regarding the terms of the expected settlements will be made available at www.dws-scudder.com/regulatory_settlements, which will also disclose the terms of any final settlement agreements once they are announced.
Other regulatory matters
DeAM is also engaged in settlement discussions with the Enforcement Staffs of the SEC and the NASD regarding DeAM’s practices during 2001-2003 with respect to directing brokerage commissions for portfolio transactions by certain DWS funds to broker-dealers that sold shares in the DWS funds and provided enhanced marketing and distribution for shares in the DWS funds. In addition, on January 13, 2006, DWS Scudder Distributors, Inc. received a Wells notice from the Enforcement Staff of the NASD regarding DWS Scudder Distributors’ payment of non-cash compensation to associated persons of NASD member firms, as well as DWS Scudder Distributors’ procedures regarding non-cash compensation regarding entertainment provided to such associated persons. Additional information announced by DeAM regarding the terms of the expected settlements will be made available at www.dws-scudder.com/regulatory_settlements, which will also disclose the terms of any final settlement agreements once they are announced.
11
Your Investment in the Portfolio
The information in this section may affect anyone who selects the portfolio as an investment option in a variable annuity contract or variable life insurance policy that offers the portfolio. These contracts and policies are described in separate prospectuses issued by participating insurance companies. The portfolio assumes no responsibility for such prospectuses.
Policies about transactions
The information in this prospectus applies to Class A shares of the portfolio. Class A shares are offered at net asset value. The portfolio has another class of shares which is offered separately.
Technically, the shareholders of DWS Variable Series II (which includes the portfolio just described) are the participating insurance companies (the “insurance companies”) that offer the portfolio as a choice for holders of certain variable annuity contracts or variable life insurance policies (the “contract(s)”) issued or sponsored by the insurance companies. The insurance companies effectively pass through the ownership of portfolio shares to their contract owners and some may pass through voting rights as well. The portfolio does not sell shares directly to the public. The portfolio sells shares only to separate accounts of insurance companies. As a contract owner, your premium payments are allocated to the portfolio by the insurance companies in accordance with your contract. Please see the contract prospectus that accompanies this prospectus for a detailed explanation of your contract.
Please bear in mind that there are important differences between funds available to any investor (a “Retail Fund”) and those that are only available through certain financial institutions, such as insurance companies. For example, Retail Funds, unlike the portfolio, are not sold to insurance company separate accounts to support investments in variable insurance contracts. In addition, the investment objectives, policies and strategies of the portfolio, while similar to those of a Retail Fund, may not be identical. Retail Funds may be smaller or larger than the portfolio and have different expense ratios than the portfolio. As a result, the performance of the portfolio and a Retail Fund will differ.
Should any conflict between contract owners arise that would require that a substantial amount of net assets be withdrawn from the portfolio, orderly portfolio management could be disrupted to the potential detriment of contract owners in the portfolio.
The portfolio has a verification process for new insurance company accounts to help the government fight the funding of terrorism and money laundering activities. Federal law requires all financial institutions to obtain, verify and record information that identifies each insurance company that opens an account. What this means to you: when an insurance company opens an account, the portfolio will ask for its name, address and other information that will allow the portfolio to identify the company. This information will be verified to ensure the identity of all insurance companies opening an account.
For certain insurance companies, the portfolio might request additional information (for instance, the portfolio would ask for documents such as the insurance company’s articles of incorporation) to help the portfolio verify the insurance company’s identity.
The portfolio will not complete the purchase of any shares for an account until all information has been provided and the application has been submitted in “good order.” Once the application is determined to be in good order, the purchase(s) will be effected at the net asset value per share next calculated.
The portfolio may reject a new account application if the insurance company doesn’t provide any required or requested identifying information, or for other reasons.
12
The advisor, DWS Scudder Distributors, Inc. and/or their affiliates may pay additional compensation from their own assets to other persons for selling, distributing and/or servicing portfolio shares. This compensation may be significant. You should talk to your insurance company to determine if this compensation influenced the financial advisor’s recommendation of the portfolio.
Buying and Selling Shares
The portfolio is open for business each day the New York Stock Exchange is open. The portfolio calculates its share price every business day, as of the close of regular trading on the New York Stock Exchange (typically 4 p.m. Eastern time, but sometimes earlier, as in the case of scheduled half-day trading or unscheduled suspensions of trading).
The portfolio continuously sells shares to each insurance company, without a sales charge, at the net asset value per share next determined after a proper purchase order is placed with the insurance company. The insurance company offers contract owners units in its separate accounts which directly correspond to shares in the portfolio. Each insurance company submits purchase and redemption orders to the portfolio based on allocation instructions for premium payments, transfer instructions and surrender or partial withdrawal requests for contract owners, as set forth in the accompanying prospectus for the contracts. These orders reflect the amount of premium payments to be invested, surrender and transfer requests, and other matters. Redemption orders are effected at the next net asset value per share determined after a proper redemption order is placed with the insurance company. Contract owners should look at their contract prospectuses for redemption procedures and fees.
Important information about buying and selling shares
| | • | | After receiving a contract owner’s order, the insurance company buys or sells shares at the net asset value next calculated on any day the portfolio is open for business. |
| | • | | Unless otherwise instructed, the portfolio normally makes payment of the proceeds from the sale of shares the next business day but always within seven calendar days. |
| | • | | The portfolio does not issue share certificates. |
| | • | | The portfolio reserves the right to reject purchases of shares for any reason. |
| | • | | The portfolio reserves the right to withdraw or suspend the offering of shares at any time. |
| | • | | The portfolio reserves the right to reject purchases of shares or to suspend or postpone redemptions at times when the New York Stock Exchange is closed (other than customary closings), trading is restricted or when an emergency exists that prevents the portfolio from disposing of its securities or pricing its shares. |
| | • | | The portfolio may refuse, cancel or rescind any purchase order; freeze any account (meaning the insurance company will not be able to purchase shares in its account); suspend account services; and/or involuntarily redeem the account if we think that the account is being used for fraudulent or illegal purposes by the insurance company; one or more of these actions will be taken when, at the sole discretion of the portfolio, they are deemed to be in the portfolio’s best interest or when the portfolio is requested or compelled to do so by governmental authority or by applicable law. |
| | • | | The portfolio may close and liquidate an account if the portfolio is unable to verify provided information, or for other reasons; if the portfolio decides to close the account, the shares will be redeemed at the net asset value per share next calculated after we determine to close the account; the insurance company may be subject to gain or loss on the redemption of the portfolio shares and the insurance company may incur tax liability. |
| | • | | A contract owner’s purchase order may not be accepted if the sale of portfolio shares has been suspended or if it is determined that the purchase would be detrimental to the interests of the portfolio’s shareholders. |
| | • | | Currently, the Board of Trustees of DWS Variable Series II does not foresee any disadvantages to contract owners arising from the fact that the interests of contract owners may differ. Nevertheless, the Board intends to monitor events in order to identify any material irreconcilable conflicts that may possibly arise and to determine what action, if any, should be taken. |
13
Market Timing Policies and Procedures. Short-term and excessive trading of portfolio shares may present risks to the portfolio’s long-term shareholders, including potential dilution in the value of portfolio shares, interference with the efficient management of the portfolio (including losses on the sale of investments), taxable gains to remaining shareholders and increased brokerage and administrative costs. To the extent that the portfolio invests in such securities, these risks may be more pronounced for certain securities such as those that trade in foreign markets, are illiquid or do not otherwise have “readily available market quotations.” Certain investors may seek to employ short-term trading strategies aimed at exploiting variations in portfolio valuation that arise from the nature of the securities held by the portfolio (e.g., “time zone arbitrage”).
The portfolio discourages short-term and excessive trading. The portfolio will take steps to detect and deter short-term and excessive trading pursuant to the portfolio’s policies as described in this prospectus and approved by the Board.
The portfolio’s policies include:
| | • | | the portfolio reserves the right to reject or cancel a purchase or exchange order for any reason when, in the opinion of the advisor, there appears to be a pattern of short-term or excessive trading activity by a shareholder or any other trading activity deemed harmful or disruptive to the portfolio; and |
| | • | | the portfolio has adopted certain fair valuation practices reasonably designed to protect the portfolio from “time zone arbitrage” with respect to its foreign securities holdings and other trading practices that seek to exploit variations in portfolio valuation that arise from the nature of the securities held by the portfolio. (See “How the Portfolio Calculates Share Price.”) |
When a pattern of short-term or excessive trading activity or other trading activity deemed harmful or disruptive to the portfolio is detected in a particular separate account, the advisor will take steps to stop this activity by contacting the insurance company that maintains the accounts for the underlying contract holders and seeking to have the insurance company enforce the separate account’s policies on short-term or excessive trading, if any. In addition, the advisor and the portfolio reserves the right to terminate a separate account’s ability to invest in the portfolio if apparent short-term or excessive trading activity persists. The detection of these patterns and the banning of further trading are inherently subjective and therefore involve some selectivity in their application. The advisor seeks to make such determinations in a manner consistent with the interests of the portfolio’s long-term shareholders.
There is no assurance that these policies and procedures will be effective in limiting short-term and excessive trading in all cases. For example, the advisor may not be able to effectively monitor, detect or limit short-term or excessive trading by underlying shareholders that occurs through separate accounts maintained by insurance companies or other financial intermediaries. Depending on the amount of portfolio shares held in a particular separate account (which may represent most of the portfolio’s shares) short-term and/or excessive trading of portfolio shares could adversely affect long-term shareholders in the portfolio. It is important to note that the advisor and the portfolio does not have access to underlying shareholders’ trading activity and that investors will be subject to the policies and procedures of their insurance company with respect to short-term and excessive trading in the portfolio.
The portfolio’s policies and procedures may be modified or terminated at any time.
How to receive account information
If you are a contract owner, you should contact your insurance company or the organization that provides record keeping services for information about your account.
Please see the contract prospectus that accompanies this prospectus for the customer service phone number.
How to buy and sell shares
Each insurance company has different provisions about how and when their contract owners may buy and sell portfolio shares. Each insurance company is responsible for communicating its contract owners’ instructions to the portfolio. Contract owners should contact their insurance company to effect transactions in the portfolio.
14
How the Portfolio Calculates Share Price
To calculate net asset value per share, or NAV, the portfolio uses the following equation:
| | |
| TOTAL ASSETS - TOTAL LIABILITIES | | = NAV |
| TOTAL NUMBER OF SHARES OUTSTANDING | |
The price at which you buy and sell shares for the portfolio is the NAV.
We typically value securities using information furnished by an independent pricing service or market quotations, where appropriate. However, we may use methods approved by the portfolio’s Board, such as a fair valuation model, which are intended to reflect fair value when pricing service information or market quotations are not readily available or when a security’s value or a meaningful portion of the value of the portfolio is believed to have been materially affected by a significant event, such as a natural disaster, an economic event like a bankruptcy filing, or a substantial fluctuation in domestic or foreign markets, that has occurred between the close of the exchange or market on which the security is principally traded (for example, a foreign exchange or market) and the close of the New York Stock Exchange. In such a case, the portfolio’s value for a security is likely to be different from the last quoted market price or pricing service information. In addition, due to the subjective and variable nature of fair value pricing, it is possible that the value determined for a particular asset may be materially different from the value realized upon such asset’s sale. It is expected that the greater the percentage of portfolio assets that is invested in non-US securities, the more extensive will be the portfolio’s use of fair value pricing. This is intended to reduce the portfolio’s exposure to “time zone arbitrage” and other harmful trading practices. (See “Market Timing Policies and Procedures.”)
To the extent that the portfolio invests in securities that are traded primarily in foreign markets, the value of its holdings could change at a time when you aren’t able to buy or sell portfolio shares through the contract. This is because some foreign markets are open on days and at times when the portfolio doesn’t price its shares.
Distributions
The portfolio intends to declare and distribute dividends from their net investment income and capital gains, if any, annually. The portfolio may make additional distributions if necessary.
All distributions will be reinvested in shares of the portfolio unless we are informed by an insurance company that they should be paid out in cash. The insurance companies will be informed about the amount and character of distributions from the portfolio for federal income tax purposes.
Taxes
The portfolio intends to qualify each year as a regulated investment company under Subchapter M of the Internal Revenue Code of 1986, as amended, (the “Code”) and to meet all requirements necessary to avoid paying any federal income or excise taxes.
Generally, owners of variable annuity and variable life contracts are not taxed currently on income or gains realized with respect to such contracts. However, some distributions from such contracts, whether made prior to or during the annuity payment period, may be taxable at ordinary income tax rates. In addition, distributions made to an owner who is younger than 59(1)/2 may be subject to a 10% penalty tax. For further information concerning federal income tax consequences for the holders of variable annuity contracts and variable life insurance policies, such holders should consult the prospectus used in connection with the issuance of their particular contracts or policies.
In order for investors to receive the favorable tax treatment available to holders of variable annuity and variable life contracts, the separate accounts underlying such contracts, as well as the funds in which such accounts invest, must meet certain diversification requirements. The portfolio intends to comply with these requirements. If the portfolio or separate account does not meet such requirements or otherwise fails to qualify as a regulated investment company for any taxable year, income allocable to the contracts associated with the separate account would be taxable currently to the holders of such contracts and income from prior periods with respect to such contracts also could be taxable, most likely in the year of the failure.
15
Under Treasury regulations, insurance companies holding the separate accounts must report to the Internal Revenue Service losses above a certain amount resulting from a sale or disposition of the portfolio’s share.
The discussion above is generally based on the assumption that shares of the portfolio will be respected as owned by insurance company separate accounts. If this is not the case (for example, because the Internal Revenue Service finds an impermissible level of “investor control” over the investment options underlying variable contracts), the advantageous tax treatment provided in respect of insurance company separate accounts under the Code will no longer be available, and the person or persons determined to own the portfolio shares will be currently taxed on portfolio distributions, and on the proceeds of any redemption of portfolio shares, under the Code rules.
Portfolio investments in securities of foreign issuers may be subject to withholding and other taxes at the source, including on dividend or interest payments. Participating insurance companies should consult their own tax advisors as to whether such distributions are subject to federal income tax if they are retained as part of policy reserves.
The portfolio’s investments in certain debt obligations may cause the portfolio to recognize taxable income in excess of the cash generated by such obligation. Thus, the portfolio could be required at times to liquidate other investments in order to satisfy its distribution requirements.
The preceding is a brief summary of certain of the relevant tax considerations. Because each shareholder and contract holder’s tax situation is unique, ask your tax professional about the tax consequences of your investments, including possible foreign, state or local taxes.
16
This page
intentionally
left blank.
To Get More Information
Shareholder reports — These include commentary from the portfolio’s management team about recent market conditions and the portfolio’s performance. They also have detailed performance figures, a list of everything the portfolio owns and its financial statements. Shareholders get these reports automatically.
Statement of Additional Information (SAI) — This tells you more about the portfolio’s features and policies, including additional risk information. The SAI is incorporated by reference into this document (meaning that it’s legally part of this prospectus).
For a free copy of any of these documents or to request other information about the portfolio, call (800) 778-1482 or contact DWS Scudder at the address listed below. The portfolio’s SAI and shareholder reports are also available through the DWS Scudder Web site at www.dws-scudder.com. These documents and other information about the portfolio are available from the EDGAR Database on the SEC’s Web site at www.sec.gov. If you like, you may obtain copies of this information, after paying a copying fee, by e-mailing a request to publicinfo@sec.gov or by writing the SEC at the address listed below. You can also review and copy these documents and other information about the portfolio, including the portfolio’s SAI, at the SEC’s Public Reference Room in Washington, D.C. Information on the operation of the SEC’s Public Reference Room may be obtained by calling (202) 551-5850.
| | |
| DWS Scudder Distributors, Inc. | | SEC |
| |
| 222 South Riverside Plaza | | 100 F Street, N.E. |
| Chicago, IL 60606-5808 | | Washington, D.C. 20549-2001 |
| (800) 778-1482 | | (202) 551-5850 |
| |
| | www.sec.gov |
| |
| | SEC File # |
| DWS Variable Series II | | 811-5002 |
MAY 1, 2006
PROSPECTUS
DWS VARIABLE SERIES II
(formerly Scudder Variable Series II)
CLASS B SHARES
DWS MFS Strategic Value VIP
(formerly SVS MFS Strategic Value Portfolio)
This prospectus should be read in conjunction with the variable life insurance or variable annuity contract prospectus and plan documents for tax-qualified plans. These shares are available and are being marketed exclusively as a pooled funding vehicle for life insurance companies writing all types of variable life insurance policies and variable annuity contracts.
The Securities and Exchange Commission (SEC) does not approve or disapprove these shares or determine whether the information in this prospectus is truthful or complete. It is a criminal offense for anyone to inform you otherwise.
ONE GLOBAL FORCE. ONE FOCUS. YOU. [DWS SCUDDER Logo]
Deutsche Bank Group
Table of Contents
How the Portfolio Works
The portfolio is designed to serve as an investment option for certain variable annuity contracts, variable life insurance policies and tax-qualified plans. Your investment in the portfolio is made in conjunction with one of these contracts or policies.
Remember that the portfolio is not a bank deposit. It’s not insured or guaranteed by the FDIC or any other government agency. Its share price will go up and down and you could lose money by investing in the portfolio.
Please read this prospectus in conjunction with the prospectus for your variable life insurance policy or variable annuity contract or plan documents for tax-qualified plans.
DWS MFS Strategic Value VIP
(formerly SVS MFS Strategic Value Portfolio)
The Portfolio’s Main Investment Strategy
The portfolio’s investment objective is to provide capital appreciation. The portfolio invests, under normal market conditions, at least 65% of its net assets in common stocks and related securities, such as preferred stocks, convertible securities and depositary receipts, of companies which the manager believes are undervalued in the market relative to their long term potential. The equity securities of these companies may be undervalued because they are temporarily out of favor in the market due to:
| | • | | a decline in the market |
| | • | | poor economic conditions |
| | • | | developments that have affected or may affect the issuer of the securities or the issuer’s industry; or |
| | • | | the market has overlooked them |
Undervalued equity securities generally have low price-to-book, price-to-sales and/or price-to-earnings ratios. The portfolio’s investments may include securities listed on a securities exchange or traded in the over-the-counter markets.
The portfolio also invests in other types of securities, such as fixed income securities, including lower rated securities commonly referred to as junk bonds, and warrants, when relative values make such purchases attractive.
The manager uses a bottom-up, as opposed to a top-down, investment style in managing the portfolio. This means that securities are selected based upon fundamental analysis (such as an analysis of earnings, cash flows, competitive position and management’s abilities) performed by the manager and the subadvisor’s large group of equity research analysts.
Securities Lending. The portfolio may lend its investment securities in an amount up to 33 1/3% of its total assets to approved institutional borrowers who need to borrow securities in order to complete certain transactions.
Although major changes tend to be infrequent, the Board of Trustees could change the portfolio’s investment objective without seeking shareholder approval.
Other Investments
The portfolio may invest in foreign securities (including emerging markets securities), through which it may have exposure to foreign currencies. The portfolio has engaged and may engage in active and frequent trading to achieve its principal investment strategies.
The portfolio is permitted, but not required, to use various types of derivatives (contracts whose value is based on, for example, indexes, currencies or securities). The portfolio may use derivatives in circumstances where the manager believes they offer an economical means of gaining exposure to a particular asset class or to keep cash on hand to meet shareholder redemptions or other needs while maintaining exposure to the market.
As a temporary defensive measure, the portfolio could shift up to 100% of assets into investments such as money market securities. This measure could prevent losses, but, while engaged in a temporary defensive position, the portfolio will not be pursuing its investment objective. However, the portfolio manager may choose not to use these strategies for various reasons, even in very volatile market conditions.
The Main Risks of Investing in the Portfolio
There are several risk factors that could hurt the portfolio’s performance, cause you to lose money or cause the portfolio’s performance to trail that of other investments.
3
Stock Market Risk. As with most stock portfolios, an important factor with this portfolio is how stock markets perform. When stock prices fall, you should expect the value of your investment to fall as well. Large company stocks at times may not perform as well as stocks of smaller or mid-sized companies. Because a stock represents ownership in its issuer, stock prices can be hurt by poor management, shrinking product demand and other business risks. These may affect single companies as well as groups of companies. In addition, movements in financial markets may adversely affect a stock’s price, regardless of how well the company performs. The market as a whole may not favor the type of investments the portfolio makes and the portfolio may not be able to get attractive prices for them.
Value Investing Risk. As with any investment strategy, the “value” strategy used in managing the portfolio will, at times, perform better than or worse than other investment styles and the overall market. If the advisor overestimates the value or return potential of one or more common stocks, the portfolio may underperform the general equity market. Value stocks may also be out of favor for certain periods in relation to growth stocks.
Industry Risk. While the portfolio does not concentrate in any industry, to the extent that the portfolio has exposure to a given industry or sector, any factors affecting that industry or sector could affect the value of portfolio securities. For example, manufacturers of consumer goods could be hurt by a rise in unemployment, or technology companies could be hurt by such factors as market saturation, price competition and rapid obsolescence.
IPO Risk. Securities purchased in initial public offerings (IPOs) may be very volatile, rising and falling rapidly, often based, among other reasons, on investor perceptions rather than on economic factors. Additionally, investments in IPOs may magnify the portfolio’s performance if it has a small asset base. The portfolio is less likely to experience a similar impact on its performance as its assets grow because it is unlikely that the portfolio will be able to obtain proportionately larger IPO allocations.
Derivatives Risk. Risks associated with derivatives include: the risk that the derivative is not well correlated with the security, index or currency to which it relates; the risk that derivatives used for risk management may not have the intended effects and may result in losses or missed opportunities; the risk that the portfolio will be unable to sell the derivative because of an illiquid secondary market; the risk that a counterparty is unwilling or unable to meet its obligation; the risk of interest rate movements and the risk that the derivatives transaction could expose the portfolio to the effects of leverage, which could increase the portfolio’s exposure to the market and magnify potential losses. There is no guarantee that derivatives activities will be employed or that they will work, and their use could cause lower returns or even losses to the portfolio.
Securities Lending Risk. Any loss in the market price of securities loaned by the portfolio that occurs during the term of the loan would be borne by the portfolio and would adversely affect the portfolio’s performance. Also, there may be delays in recovery of securities loaned or even a loss of rights in the collateral should the borrower of the securities fail financially while the loan is outstanding. However, loans will be made only to borrowers selected by the portfolio’s delegate after a review of relevant facts and circumstances, including the creditworthiness of the borrower.
Pricing Risk. At times, market conditions might make it hard to value some investments. For example, if the portfolio has valued its securities too highly, you may end up paying too much for portfolio shares when you buy into the portfolio. If the portfolio underestimates their price, you may not receive the full market value for your portfolio shares when you sell.
Security Selection Risk. A risk that pervades all investing is the risk that the securities held by the portfolio will decline in value.
Other factors that could affect performance include:
| | • | | the manager could be incorrect in his analysis of industries, companies, economic trends, the relative attractiveness of different sizes of stocks, geographical trends or other matters; |
| | • | | a bond could decline in credit quality or go into default; this risk is greater with lower rated bonds; |
| | • | | some bonds could be paid off earlier than expected, which could hurt the portfolio’s performance; and |
| | • | | foreign securities tend to be more volatile than their US counterparts, for reasons such as currency fluctuations and political and economic uncertainty. |
4
Performance
While a portfolio’s past performance isn’t necessarily a sign of how it will do in the future, it can be valuable for an investor to know.
The bar chart shows how the returns for the portfolio’s Class B shares have varied from year to year, which may give some idea of risk. The table shows how average annual returns for the portfolio’s Class B shares compare with a broad-based market index (which, unlike the portfolio, does not have any fees or expenses). The performance of both the portfolio and the index varies over time. All figures on this page assume reinvestment of dividends and distributions.
This information doesn’t reflect charges and fees associated with the separate account that invests in the portfolio or any variable life insurance policy or variable annuity contract for which the portfolio is an investment option. These charges and fees will reduce returns.
Annual Total Returns (%) as of 12/31 each year — Class B shares
THE ORIGINAL DOCUMENT CONTAINS A BAR CHART HERE
BAR CHART DATA:
| | | | | | | | | | | | | | | | | | |
| | | | | | | | | | | | | | 26.35 | | 17.40 | | -0.60 |
| 1996 | | 1997 | | 1998 | | 1999 | | 2000 | | 2001 | | 2002 | | 2003 | | 2004 | | 2005 |
For the periods included in the bar chart:
| | |
Best Quarter: 19.76%, Q2 2003 | | Worst Quarter: -5.55%, Q1 2003 |
| |
2006 Total Return as of March 31: 4.75% | | |
Average Annual Total Returns (%) as of 12/31/2005
| | | | |
| | | 1 Year | | Since Inception* |
Portfolio — Class B | | -0.60 | | 8.70 |
Index | | 7.05 | | 10.95 |
Index: The Russell 1000 Value Index is an unmanaged index which consists of those stocks in the Russell 1000 Index with lower price-to-book ratios and lower forecasted growth values.
| * | Since 7/1/02. Index comparison begins 6/30/02. |
Total returns would have been lower if operating expenses hadn’t been reduced.
Current performance information may be higher or lower than the performance data quoted above. For more recent performance information, contact your participating insurance company.
5
How Much Investors Pay
This table describes the fees and expenses that you may pay if you buy and hold portfolio shares. The information in the table does not reflect charges and fees associated with the separate account that invests in the portfolio or any variable life insurance policy or variable annuity contract for which the portfolio is an investment option. These charges and fees will increase expenses.
| | | |
Fee Table | | Class B | |
Annual Operating Expenses, deducted from portfolio assets | | | |
Management Fee | | 0.95 | % |
Distribution/Service (12b-1) Fee | | 0.25 | |
Other Expenses | | 0.45 | |
| | | |
Total Annual Operating Expenses(1) | | 1.65 | |
| | | |
| (1) | Pursuant to their respective agreements with DWS Variable Series II, the advisor, the underwriter and the accounting agent have agreed, through September 30, 2006, to limit their respective fees and to reimburse other expenses to the extent necessary to limit total operating expenses of Class B shares of DWS MFS Strategic Value VIP to 1.26%, excluding certain expenses such as extraordinary expenses, taxes, brokerage and interest. |
Based on the costs above, this example helps you compare the expenses of Class B shares to those of other mutual funds. This example assumes the expenses above remain the same. It also assumes that you invested $10,000, earned 5% annual returns, reinvested all dividends and distributions and sold your shares at the end of each period. This is only an example; actual expenses will be different.
| | | | | | | | | | | | |
Example | | 1 Year | | 3 Years | | 5 Years | | 10 Years |
Class B shares | | $ | 168 | | $ | 520 | | $ | 897 | | $ | 1,955 |
The Portfolio Managers
The portfolio’s subadvisor is Massachusetts Financial Services Company (“MFS”). The portfolio is managed by a team that participates equally in the research process, strategy discussions, portfolio construction, final buy and sell decisions, and risk management for the portfolio. The portfolio management team is comprised of Kenneth J. Enright and Alan T. Langsner. Mr. Enright is a Senior Vice President of MFS and a Chartered Financial Analyst, has been employed in the investment management area of the subadvisor since 1986 and joined the portfolio in 2002. Mr. Langsner is a Vice President of MFS. He joined MFS in 1999 as an Equity Research Analyst following newspapers, networking, telecom equipment, specialty pharmaceuticals, electric equipment, software, and small and mid-cap biotechnology. Mr. Langsner joined the portfolio in 2004.
The portfolio’s Statement of Additional Information provides additional information about the portfolio managers’ investments in the portfolio, a description of their compensation structure and information regarding other accounts they manage.
6
Financial Highlights
This table is designed to help you understand the portfolio’s financial performance. The figures in the first part of the table are for a single share. The total return figures represent the percentage that an investor in the portfolio would have earned (or lost), assuming all dividends and distributions were reinvested. This information has been audited by Ernst & Young LLP, independent registered public accounting firm, whose report, along with the portfolio’s financial statements, is included in the portfolio’s annual report (see “Shareholder reports” on the back cover).
The following table includes selected data for a share outstanding throughout each period and other performance information derived from the financial statements.
This information doesn’t reflect charges and fees associated with the separate account that invests in the portfolio or any variable life insurance policy or variable annuity contract for which the portfolio is an investment option. These charges and fees will reduce returns.
DWS MFS Strategic Value VIP — Class B
| | | | | | | | | | | | | | | | |
Years Ended December 31, | | 2005 | | | 2004 | | | 2003 | | | 2002^a | |
Selected Per Share Data | | | | | | | | | | | | | | | | |
Net asset value, beginning of period | | $ | 11.98 | | | $ | 10.22 | | | $ | 8.11 | | | $ | 8.93 | |
Income (loss) from investment operations: | | | | | | | | | | | | | | | | |
Net investment income (loss)^b | | | .04 | | | | .07 | | | | .02 | | | | .04 | |
Net realized and unrealized gain (loss) on investment transactions | | | (.12 | ) | | | 1.71 | | | | 2.11 | | | | (.86 | ) |
| | | | | | | | | | | | | | | | |
Total from investment operations | | | (.08 | ) | | | 1.78 | | | | 2.13 | | | | (.82 | ) |
| | | | | | | | | | | | | | | | |
Less distributions from: | | | | | | | | | | | | | | | | |
Net investment income | | | (.07 | ) | | | (.01 | ) | | | (.02 | ) | | | — | |
Net realized gain on investment transactions | | | (.99 | ) | | | (.01 | ) | | | — | | | | — | |
Tax return of capital | | | (.10 | ) | | | — | | | | — | | | | — | |
| | | | | | | | | | | | | | | | |
Total distributions | | | (1.16 | ) | | | (.02 | ) | | | (.02 | ) | | | — | |
| | | | | | | | | | | | | | | | |
Net asset value, end of period | | $ | 10.74 | | | $ | 11.98 | | | $ | 10.22 | | | $ | 8.11 | |
| | | | | | | | | | | | | | | | |
Total Return (%)^c | | | (.60 | ) | | | 17.40 | | | | 26.35 | | | | (9.18 | )** |
| | | | | | | | | | | | | | | | |
Ratios to Average Net Assets and Supplemental Data | | | | | | | | | | | | | | | | |
Net assets, end of period ($ millions) | | | 33 | | | | 34 | | | | 13 | | | | .3 | |
Ratio of expenses before expense reductions (%) | | | 1.65 | | | | 1.79 | | | | 2.32 | | | | 2.96 | * |
Ratio of expenses after expense reductions (%) | | | 1.45 | | | | 1.52 | | | | 1.54 | | | | 1.40 | * |
Ratio of net investment income (loss) (%) | | | .33 | | | | .67 | | | | .28 | | | | .87 | * |
Portfolio turnover rate (%) | | | 59 | | | | 54 | | | | 40 | | | | 7 | |
| ^a | For the period from July 1, 2002 (commencement of operations of Class B shares) to December 31, 2002. |
| ^b | Based on average shares outstanding during the period. |
| ^c | Total return would have been lower had certain expenses not been reduced. |
7
Other Policies and Risks
While the previous pages describe the main points of the portfolio’s strategy and risks, there are a few other issues to know about:
| | • | | The portfolio may trade securities actively. This strategy could raise transaction costs and, accordingly, lower performance. |
| | • | | The advisor or subadvisor may establish a debt security’s credit quality when it buys a security, using independent ratings, or for unrated securities, its own credit determination. When ratings don’t agree, a portfolio may use the higher rating. If a security’s credit quality falls, the advisor or subadvisor will determine whether selling it would be in the portfolio’s best interest. |
The portfolio’s complete portfolio holdings as of the end of each calendar month are posted on www.dws-scudder.com ordinarily on the 15th day of the following calendar month or the first business day thereafter. This posted information generally remains accessible at least until the portfolio files its Form N-CSR or N-Q with the Securities and Exchange Commission for the period that includes the date as of which the www.dws-scudder.com information is current (expected to be at least three months). The portfolios’ Statement of Additional Information includes a description of the portfolio’s policies and procedures with respect to the disclosure of the portfolio’s holdings.
This prospectus doesn’t tell you about every policy or risk of investing in the portfolio. If you want more information on the portfolio’s allowable securities and investment practices and the characteristics and risks of each one, you may want to request a copy of the Statement of Additional Information (the back cover tells you how to do this).
Keep in mind that there is no assurance that any mutual fund will achieve its goal.
Investment Advisor
DWS Scudder is part of Deutsche Asset Management, which is the marketing name in the US for the asset management activities of Deutsche Bank AG, Deutsche Investment Management Americas Inc. (“DeIM” or the “advisor”), Deutsche Asset Management, Inc., Deutsche Bank Trust Company Americas and DWS Trust Company.
Deutsche Asset Management is a global asset management organization that offers a wide range of investing expertise and resources, including hundreds of portfolio managers and analysts and an office network that reaches the world’s major investment centers. This well-resourced global investment platform brings together a wide variety of experience and investment insight, across industries, regions, asset classes and investing styles.
DeIM is an indirect, wholly owned subsidiary of Deutsche Bank AG. Deutsche Bank AG is a major global banking institution that is engaged in a wide range of financial services, including investment management, mutual fund, retail, private and commercial banking, investment banking and insurance.
DeIM is the investment advisor for the portfolio. Under the supervision of the Board of Trustees, DeIM, with headquarters at 345 Park Avenue, New York, NY 10154, or the subadvisor makes the portfolio’s investment decisions, buy and sell securities for the portfolio and conduct research that leads to these purchase and sale decisions. DeIM and its predecessors have more than 80 years of experience managing mutual funds and DeIM provides a full range of investment advisory services to institutional and retail clients. DeIM or the subadvisor is also responsible for selecting brokers and dealers and for negotiating brokerage commissions and dealer charges.
The portfolio’s shareholder report for the year ended December 31, 2005 contains a discussion regarding the basis for the Board of Trustees’ approval of the portfolio’s investment management agreement and subadvisory agreement (see “Shareholder reports” on the back cover).
The advisor receives a management fee from the portfolio. Below is the actual rate paid by the portfolio during the most recent fiscal year, as a percentage of the portfolio’s average daily net assets:
| | | |
Portfolio Name | | Fee Paid | |
DWS MFS Strategic Value VIP* | | 0.75 | % |
| * | Reflecting the effect of expense limitations and/or fee waivers then in effect. |
8
Portfolio Subadvisor
Massachusetts Financial Services Company (“MFS”), 500 Boylston Street, Boston, Massachusetts 02116, is the subadvisor to DWS MFS Strategic Value VIP. MFS is America’s oldest mutual fund organization. MFS and its predecessor organizations have a history of money management dating from 1924 and the founding of the first mutual fund, Massachusetts Investors Trust. Net assets under the management of the MFS organization were approximately $163 billion as of December 31, 2005. DeIM pays a fee to MFS for acting as subadvisor to DWS MFS Strategic Value VIP.
Although none of the legal proceedings described below currently involve your portfolio, these matters affect MFS, your portfolio’s subadvisor. The information that follows has been provided to the portfolio by MFS.
On March 31, 2004, MFS settled an administrative proceeding with the Securities and Exchange Commission (“SEC”) regarding disclosure of brokerage allocation practices in connection with MFS fund sales (the term “MFS funds” means the open-end registered management investment companies sponsored by MFS). The brokerage allocation practices which were the subject of this proceeding were discontinued by MFS in November 2003. In addition, in February 2004, MFS reached agreement with the SEC, the New York Attorney General (“NYAG”) and the Bureau of Securities Regulation of the State of New Hampshire to settle administrative proceedings alleging false and misleading information in certain MFS open-end retail fund prospectuses regarding market timing and related matters.
Since December 2003, MFS, MFS Fund Distributors, Inc., MFS Service Center, Inc., MFS Corporation Retirement Committee, Sun Life Financial Inc., various MFS funds, certain current and/or former Trustees of these MFS funds, and certain officers of MFS have been named as defendants in multiple lawsuits filed in federal and state courts. The lawsuits variously have been commenced as class actions or individual actions on behalf of investors who purchased, held or redeemed shares of the MFS funds during specified periods, as ERISA actions by participants in certain retirement plan accounts on behalf of those accounts, or as derivative actions on behalf of the MFS funds. The lawsuits relating to market timing and related matters have been transferred to, and consolidated before, the United States District Court for the District of Maryland, as part of a multi-district litigation of market timing and related claims involving several other fund complexes (In re Mutual Funds Investment Litigation (Alger, Columbia, Janus, MFS, One Group, Putnam, Allianz Dresdner), No. 1:04-md-15863 (transfer began March 19, 2004)). The market timing cases related to the MFS complex are Riggs v. MFS et al., Case No. 04-CV-01162-JFM (direct), Hammerslough v. MFS et al., Case No. 04-MD-01620 (derivative), Anita Walker v. MFS et al., Case No. 1:04-CV-01758 (ERISA), and Reaves v. MFS Series Trust I, et al., Case No. 1:05-CV-02220-JFM (Class B Shares). The plaintiffs in these consolidated lawsuits generally seek injunctive relief including removal of the named Trustees, adviser and distributor, rescission of contracts and 12b-1 Plans, disgorgement of fees and profits, monetary damages, punitive damages, attorney’s fees and costs and other equitable and declaratory relief. Two lawsuits alleging improper brokerage allocation practices and excessive compensation are pending in the United States District Court for the District of Massachusetts (Forsythe v. Sun Life Financial Inc., et al., No. 04cv10584 (GAO) (a consolidated action) and Marcus Dumond, et al. v. Massachusetts Financial Servs. Co., et al., No. 04cv11458 (GAO)). The plaintiffs in these lawsuits generally seek compensatory damages, punitive damages, recovery of fees, rescission of contracts, an accounting, restitution, declaratory relief, equitable and/or injunctive relief and attorney’s fees and costs. The various lawsuits generally allege that some or all of the defendants (i) permitted or acquiesced in market timing and/or late trading in some of the MFS funds, inadequately disclosed MFS’ internal policies concerning market timing and such matters, (ii) received excessive compensation as fiduciaries to the MFS funds, or (iii) permitted or acquiesced in the improper use of fund assets by MFS to support the distribution of MFS fund shares and inadequately disclosed MFS’ use of fund assets in this manner. The actions assert that some or all of the defendants violated the federal securities laws, including the Securities Act of 1933 and the Securities Exchange Act of 1934, the Investment Company Act of 1940 and the Investment Advisers Act of 1940, the Employee Retirement Income Security Act of 1974, as well as fiduciary duties and other violations of common law. Insofar as any of the actions is appropriately brought derivatively on behalf of any of the MFS funds, any recovery will inure to the benefit of the MFS funds. The defendants filed separate motions to dismiss all claims of the various lawsuits (except Reaves, which has not been separately briefed). On November 3, 2005, the district judge considering the motions to dismiss the Riggs and Hammerslough actions issued memoranda indicating that he intends to grant in part and deny in part defendants’ motions in these actions. A formal order consistent with the court’s memoranda is forthcoming. On January 19, 2006, the district judge considering the Forsythe and Dumond actions denied defendants’ motion to dismiss the Dumond action and granted in part (including dismissing all claims against the Trustees and Sun Life Financial, Inc.) and denied in part defendants’ motion to dismiss the Forsythe action. Additional lawsuits based on similar allegations may be filed in the future.
9
Any potential resolution of these matters may include, but not be limited to, judgments or settlements for damages against MFS, the MFS funds, or any other named defendant. It is not clear whether any amounts paid in connection with the above regulatory settlements will be sufficient to compensate shareholders for all of the damage they allegedly sustained, whether certain shareholders or putative class members may have additional claims to compensation, or whether the damages that may be awarded in any of the actions will exceed these amounts. In the event the MFS funds incur any losses, costs or expenses in connection with such lawsuits, the Boards of Trustees of the affected MFS funds may pursue claims on behalf of such funds against any party that may have liability to the funds in respect thereof. There can be no assurance that these regulatory actions and lawsuits, or the adverse publicity associated with these developments, will not result in increased fund redemptions, reduced sales of fund shares, or other adverse consequences to the MFS funds.
Market timing related regulatory and litigation matters
Since at least July 2003, federal, state and industry regulators have been conducting ongoing inquiries and investigations (“inquiries”) into the mutual fund industry, and have requested information from numerous mutual fund companies, including DWS Scudder. The DWS funds’ advisors have been cooperating in connection with these inquiries and are in discussions with the regulators concerning proposed settlements. Publicity about mutual fund practices arising from these industrywide inquiries serves as the general basis of a number of private lawsuits against the DWS funds. These lawsuits, which previously have been reported in the press, involve purported class action and derivative lawsuits, making various allegations and naming as defendants various persons, including certain DWS funds, the funds’ investment advisors and their affiliates, and certain individuals, including in some cases fund Trustees/Directors, officers, and other parties. Each DWS fund’s investment advisor has agreed to indemnify the applicable DWS funds in connection with these lawsuits, or other lawsuits or regulatory actions that may be filed making allegations similar to these lawsuits regarding market timing, revenue sharing, fund valuation or other subjects arising from or related to the pending inquiries. It is not possible to determine with certainty what the outcome of these inquiries will be or what the effect, if any, would be on the funds or their advisors.
With respect to the lawsuits, based on currently available information, the funds’ investment advisors believe the likelihood that the pending lawsuits will have a material adverse financial impact on a DWS fund is remote and such actions are not likely to materially affect their ability to perform under their investment management agreements with the DWS funds.
With respect to the regulatory matters, Deutsche Asset Management (“DeAM”) has advised the funds as follows:
DeAM expects to reach final agreements with regulators early in 2006 regarding allegations of improper trading in the DWS funds. DeAM expects that it will reach settlement agreements with the Securities and Exchange Commission, the New York Attorney General and the Illinois Secretary of State providing for payment of disgorgement, penalties, and investor education contributions totaling approximately $134 million. Approximately $127 million of this amount would be distributed to shareholders of the affected DWS funds in accordance with a distribution plan to be developed by an independent distribution consultant. DeAM does not believe that any of the DWS funds will be named as respondents or defendants in any proceedings. The funds’ investment advisors do not believe these amounts will have a material adverse financial impact on them or materially affect their ability to perform under their investment management agreements with the DWS funds. The above-described amounts are not material to Deutsche Bank, and they have already been reserved.
10
Based on the settlement discussions thus far, DeAM believes that it will be able to reach a settlement with the regulators on a basis that is generally consistent with settlements reached by other advisors, taking into account the particular facts and circumstances of market timing at DeAM and at the legacy Scudder and Kemper organizations prior to their acquisition by DeAM in April 2002. Among the terms of the expected settled orders, DeAM would be subject to certain undertakings regarding the conduct of its business in the future, including maintaining existing management fee reductions for certain funds for a period of five years. DeAM expects that these settlements would resolve regulatory allegations that it violated certain provisions of federal and state securities laws (i) by entering into trading arrangements that permitted certain investors to engage in market timing in certain DWS funds and (ii) by failing more generally to take adequate measures to prevent market timing in the DWS funds, primarily during the 1999-2001 period. With respect to the trading arrangements, DeAM expects that the settlement documents will include allegations related to one legacy DeAM arrangement, as well as three legacy Scudder and six legacy Kemper arrangements. All of these trading arrangements originated in businesses that existed prior to the current DeAM organization, which came together in April 2002 as a result of the various mergers of the legacy Scudder, Kemper and Deutsche fund groups, and all of the arrangements were terminated prior to the start of the regulatory investigations that began in the summer of 2003. No current DeAM employee approved the trading arrangements.
There is no certainty that the final settlement documents will contain the foregoing terms and conditions. The independent Trustees/Directors of the DWS funds have carefully monitored these regulatory investigations with the assistance of independent legal counsel and independent economic consultants. Additional information announced by DeAM regarding the terms of the expected settlements will be made available at www.dws-scudder.com/regulatory_settlements, which will also disclose the terms of any final settlement agreements once they are announced.
Other regulatory matters
DeAM is also engaged in settlement discussions with the Enforcement Staffs of the SEC and the NASD regarding DeAM’s practices during 2001-2003 with respect to directing brokerage commissions for portfolio transactions by certain DWS funds to broker-dealers that sold shares in the DWS funds and provided enhanced marketing and distribution for shares in the DWS funds. In addition, on January 13, 2006, DWS Scudder Distributors, Inc. received a Wells notice from the Enforcement Staff of the NASD regarding DWS Scudder Distributors’ payment of non-cash compensation to associated persons of NASD member firms, as well as DWS Scudder Distributors’ procedures regarding non-cash compensation regarding entertainment provided to such associated persons. Additional information announced by DeAM regarding the terms of the expected settlements will be made available at www.dws-scudder.com/regulatory_settlements, which will also disclose the terms of any final settlement agreements once they are announced.
11
Your Investment in the Portfolio
The information in this section may affect anyone who selects the portfolio as an investment option in a variable annuity contract or variable life insurance policy that offers the portfolio. These contracts and policies are described in separate prospectuses issued by participating insurance companies. The portfolio assumes no responsibility for such prospectuses.
Policies about transactions
The information in this prospectus applies to Class B shares of the portfolio. Class B shares are offered at net asset value and are subject to a 12b-1 fee. The portfolio has another class of shares which is offered separately.
Technically, the shareholders of DWS Variable Series II (which includes the portfolio just described) are the participating insurance companies (the “insurance companies”) that offer the portfolio as a choice for holders of certain variable annuity contracts or variable life insurance policies (the “contract(s)”) issued or sponsored by the insurance companies. The insurance companies effectively pass through the ownership of portfolio shares to their contract owners and some may pass through voting rights as well. The portfolio does not sell shares directly to the public. The portfolio sells shares only to separate accounts of insurance companies. As a contract owner, your premium payments are allocated to the portfolio by the insurance companies in accordance with your contract. Please see the contract prospectus that accompanies this prospectus for a detailed explanation of your contract.
Please bear in mind that there are important differences between funds available to any investor (a “Retail Fund”) and those that are only available through certain financial institutions, such as insurance companies. For example, Retail Funds, unlike the portfolio, are not sold to insurance company separate accounts to support investments in variable insurance contracts. In addition, the investment objectives, policies and strategies of the portfolio, while similar to those of a Retail Fund, may not be identical. Retail Funds may be smaller or larger than the portfolio and have different expense ratios than the portfolio. As a result, the performance of the portfolio and a Retail Fund will differ.
Should any conflict between contract owners arise that would require that a substantial amount of net assets be withdrawn from the portfolio, orderly portfolio management could be disrupted to the potential detriment of contract owners in the portfolio.
The portfolio has a verification process for new insurance company accounts to help the government fight the funding of terrorism and money laundering activities. Federal law requires all financial institutions to obtain, verify and record information that identifies each insurance company that opens an account. What this means to you: when an insurance company opens an account, the portfolio will ask for its name, address and other information that will allow the portfolio to identify the company. This information will be verified to ensure the identity of all insurance companies opening an account.
For certain insurance companies, a portfolio might request additional information (for instance, the portfolio would ask for documents such as the insurance company’s articles of incorporation) to help the portfolio verify the insurance company’s identity.
The portfolio will not complete the purchase of any shares for an account until all information has been provided and the application has been submitted in “good order.” Once the application is determined to be in good order, the purchase(s) will be effected at the net asset value per share next calculated.
The portfolio may reject a new account application if the insurance company doesn’t provide any required or requested identifying information, or for other reasons.
12
The advisor, DWS Scudder Distributors, Inc. and/or their affiliates may pay additional compensation from their own assets to other persons for selling, distributing and/or servicing portfolio shares. This compensation may be significant. You should talk to your insurance company to determine if this compensation influenced the financial advisor’s recommendation of the portfolio.
Buying and Selling Shares
The portfolio is open for business each day the New York Stock Exchange is open. The portfolio calculates its share price every business day, as of the close of regular trading on the Exchange (typically 4 p.m. Eastern time, but sometimes earlier, as in the case of scheduled half-day trading or unscheduled suspensions of trading).
The portfolio continuously sells shares to each insurance company, without a sales charge, at the net asset value per share next determined after a proper purchase order is placed with the insurance company. The insurance company offers contract owners units in its separate accounts which directly correspond to shares in the portfolio. Each insurance company submits purchase and redemption orders to the portfolio based on allocation instructions for premium payments, transfer instructions and surrender or partial withdrawal requests for contract owners, as set forth in the accompanying prospectus for the contracts. These orders reflect the amount of premium payments to be invested, surrender and transfer requests, and other matters. Redemption orders are effected at the next net asset value per share determined after a proper redemption order is placed with the insurance company. Contract owners should look at their contract prospectuses for redemption procedures and fees.
Important information about buying and selling shares
| | • | | After receiving a contract owner’s order, the insurance company buys or sells shares at the net asset value next calculated on any day the portfolio is open for business. |
| | • | | Unless otherwise instructed, the portfolio normally makes payment of the proceeds from the sale of shares the next business day but always within seven calendar days. |
| | • | | The portfolio does not issue share certificates. |
| | • | | The portfolio reserves the right to reject purchases of shares for any reason. |
| | • | | The portfolio reserves the right to withdraw or suspend the offering of shares at any time. |
| | • | | The portfolio reserves the right to reject purchases of shares or to suspend or postpone redemptions at times when the New York Stock Exchange is closed (other than customary closings), trading is restricted or when an emergency exists that prevents the portfolio from disposing of its securities or pricing its shares. |
| | • | | The portfolio may refuse, cancel or rescind any purchase order; freeze any account (meaning the insurance company will not be able to purchase shares in its account); suspend account services; and/or involuntarily redeem the account if we think that the account is being used for fraudulent or illegal purposes by the insurance company; one or more of these actions will be taken when, at the sole discretion of the portfolio, they are deemed to be in the portfolio’s best interest or when the portfolio is requested or compelled to do so by governmental authority or by applicable law. |
| | • | | The portfolio may close and liquidate an account if the portfolio is unable to verify provided information, or for other reasons; if the portfolio decides to close the account, the shares will be redeemed at the net asset value per share next calculated after we determine to close the account; the insurance company may be subject to gain or loss on the redemption of the portfolio shares and may incur tax liability. |
| | • | | A contract owner’s purchase order may not be accepted if the sale of portfolio shares has been suspended or if it is determined that the purchase would be detrimental to the interests of the portfolio’s shareholders. |
| | • | | Currently, the Board of Trustees of DWS Variable Series II does not foresee any disadvantages to contract owners arising from the fact that the interests of contract owners may differ. Nevertheless, the Board intends to monitor events in order to identify any material irreconcilable conflicts that may possibly arise and to determine what action, if any, should be taken. |
13
Market Timing Policies and Procedures. Short-term and excessive trading of portfolio shares may present risks to the portfolio’s long-term shareholders, including potential dilution in the value of portfolio shares, interference with the efficient management of the portfolio (including losses on the sale of investments), taxable gains to remaining shareholders and increased brokerage and administrative costs. These risks may be more pronounced for portfolios investing in certain securities such as those that trade in foreign markets, are illiquid or do not otherwise have “readily available market quotations.” Certain investors may seek to employ short-term trading strategies aimed at exploiting variations in portfolio valuation that arise from the nature of the securities held by the portfolio (e.g., “time zone arbitrage”).
The portfolio discourages short-term and excessive trading. The portfolio will take steps to detect and deter short-term and excessive trading pursuant to the portfolio’s policies as described in this prospectus and approved by the Board.
The portfolio’s policies include:
| | • | | the portfolio reserves the right to reject or cancel a purchase or exchange order for any reason when, in the opinion of the advisor, there appears to be a pattern of short-term or excessive trading activity by a shareholder or any other trading activity deemed harmful or disruptive to the portfolio; and |
| | • | | the portfolio has adopted certain fair valuation practices reasonably designed to protect the portfolio from “time zone arbitrage” with respect to its foreign securities holdings and other trading practices that seek to exploit variations in portfolio valuation that arise from the nature of the securities held by the portfolio. (See “How the Portfolio Calculates Share Price.”) |
When a pattern of short-term or excessive trading activity or other trading activity deemed harmful or disruptive to the portfolio is detected in a particular separate account, the advisor will take steps to stop this activity by contacting the insurance company that maintains the accounts for the underlying contract holders and seeking to have the insurance company enforce the separate account’s policies on short-term or excessive trading, if any. In addition, the advisor and the portfolio reserves the right to terminate a separate account’s ability to invest in the portfolio if apparent short-term or excessive trading activity persists. The detection of these patterns and the banning of further trading are inherently subjective and therefore involve some selectivity in their application. The advisor seeks to make such determinations in a manner consistent with the interests of the portfolio’s long-term shareholders.
There is no assurance that these policies and procedures will be effective in limiting short-term and excessive trading in all cases. For example, the advisor may not be able to effectively monitor, detect or limit short-term or excessive trading by underlying shareholders that occurs through separate accounts maintained by insurance companies or other financial intermediaries. Depending on the amount of portfolio shares held in a particular separate account (which may represent most of the portfolio’s shares) short-term and/or excessive trading of portfolio shares could adversely affect long-term shareholders in the portfolio. It is important to note that the advisor and the portfolio does not have access to underlying shareholders’ trading activity and that investors will be subject to the policies and procedures of their insurance company with respect to short-term and excessive trading in the portfolio.
The portfolio’s policies and procedures may be modified or terminated at any time.
How to receive account information
If you are a contract owner, you should contact your insurance company or the organization that provides record keeping services for information about your account.
Please see the contract prospectus that accompanies this prospectus for the customer service phone number.
How to buy and sell shares
Each insurance company has different provisions about how and when their contract owners may buy and sell portfolio shares. Each insurance company is responsible for communicating its contract owners’ instructions to the portfolio. Contract owners should contact their insurance company to effect transactions in the portfolio.
14
How the Portfolio Calculates Share Price
To calculate net asset value per share, or NAV, the portfolio uses the following equation:
| | |
TOTAL ASSETS - TOTAL LIABILITIES | | = NAV |
TOTAL NUMBER OF SHARES OUTSTANDING | |
The price at which you buy and sell shares for the portfolio is the NAV.
We typically value securities using information furnished by an independent pricing service or market quotations, where appropriate. However, we may use methods approved by the portfolio’s Board, such as a fair valuation model, which are intended to reflect fair value when pricing service information or market quotations are not readily available or when a security’s value or a meaningful portion of the value of the portfolio is believed to have been materially affected by a significant event, such as a natural disaster, an economic event like a bankruptcy filing, or a substantial fluctuation in domestic or foreign markets, that has occurred between the close of the exchange or market on which the security is principally traded (for example, a foreign exchange or market) and the close of the New York Stock Exchange. In such a case, the portfolio’s value for a security is likely to be different from the last quoted market price or pricing service information. In addition, due to the subjective and variable nature of fair value pricing, it is possible that the value determined for a particular asset may be materially different from the value realized upon such asset’s sale. It is expected that the greater the percentage of portfolio assets that is invested in non-US securities, the more extensive will be the portfolio’s use of fair value pricing. This is intended to reduce the portfolio’s exposure to “time zone arbitrage” and other harmful trading practices. (See “Market Timing Policies and Procedures.”)
To the extent that the portfolio invests in securities that are traded primarily in foreign markets, the value of its holdings could change at a time when you aren’t able to buy or sell portfolio shares through the contract. This is because some foreign markets are open on days and at times when the portfolio doesn’t price its shares.
Distributions
DWS Money Market VIP intends to declare its net investment income as a dividend daily and distribute dividends monthly. The portfolio intends to declare and distribute dividends from their net investment income and capital gains, if any, annually. The portfolio may make additional distributions if necessary.
All distributions will be reinvested in shares of the portfolio unless we are informed by an insurance company that they should be paid out in cash. The insurance companies will be informed about the amount and character of distributions from the portfolio for federal income tax purposes.
Taxes
The portfolio intends to qualify each year as a regulated investment company under Subchapter M of the Internal Revenue Code of 1986, as amended, (the “Code”) and to meet all requirements necessary to avoid paying any federal income or excise taxes.
Generally, owners of variable annuity and variable life contracts are not taxed currently on income or gains realized with respect to such contracts. However, some distributions from such contracts, whether made prior to or during the annuity payment period, may be taxable at ordinary income tax rates. In addition, distributions made to an owner who is younger than 59 1/2 may be subject to a 10% penalty tax. For further information concerning federal income tax consequences for the holders of variable annuity contracts and variable life insurance policies, such holders should consult the prospectus used in connection with the issuance of their particular contracts or policies.
In order for investors to receive the favorable tax treatment available to holders of variable annuity and variable life contracts, the separate accounts underlying such contracts, as well as the funds in which such accounts invest, must meet certain diversification requirements. The portfolio intends to comply with these requirements. If the portfolio or separate account does not meet such requirements or otherwise fails to qualify as a regulated investment company for any taxable year, income allocable to the contracts associated with the separate account would be taxable currently to the holders of such contracts and income from prior periods with respect to such contracts also could be taxable, most likely in the year of the failure.
15
Under Treasury regulations, insurance companies holding the separate accounts must report to the Internal Revenue Service losses above a certain amount resulting from a sale or disposition of the portfolio’s share.
The discussion above is generally based on the assumption that shares of the portfolio will be respected as owned by insurance company separate accounts. If this is not the case (for example, because the Internal Revenue Service finds an impermissible level of “investor control” over the investment options underlying variable contracts), the advantageous tax treatment provided in respect of insurance company separate accounts under the Code will no longer be available, and the person or persons determined to own the portfolio shares will be currently taxed on portfolio distributions, and on the proceeds of any redemption of portfolio shares, under the Code rules.
Portfolio investments in securities of foreign issuers may be subject to withholding and other taxes at the source, including on dividend or interest payments. Participating insurance companies should consult their own tax advisors as to whether such distributions are subject to federal income tax if they are retained as part of policy reserves.
The portfolio’s investments in certain debt obligations may cause the portfolio to recognize taxable income in excess of the cash generated by such obligation. Thus, the portfolio could be required at times to liquidate other investments in order to satisfy its distribution requirements.
The preceding is a brief summary of certain of the relevant tax considerations. Because each shareholder and contract holder’s tax situation is unique, ask your tax professional about the tax consequences of your investments, including possible foreign, state or local taxes.
Marketing and Distribution Fees
DWS Scudder Distributors, Inc., a subsidiary of the investment advisor, is the portfolio’s distributor.
DWS Variable Series II has adopted a 12b-1 plan for all Class B shares. Under the plan, DWS Variable Series II may make quarterly payments to the distributor for distribution and shareholder servicing related expenses incurred or paid by the distributor or a participating insurance company. No such payment shall be made with respect to any quarterly period in excess of an amount determined for such period at the annual rate of 0.25% of the average daily net assets of Class B shares during that quarterly period. Depending on the participating insurance company’s corporate structure and applicable state law, the distributor may remit payments to the participating insurance company’s affiliated broker-dealers or other affiliated company rather than the participating insurance company itself.
Because 12b-1 fees for Class B shares are paid out of portfolio assets on an ongoing basis, they will, over time, increase the cost of investment in Class B shares and may cost more than other types of sales charges.
Examples of expenses payable under the plan include the costs of printing and mailing materials (such as portfolio prospectuses, shareholder reports, portfolio advertisements and sales literature), holding seminars and sales meetings, providing customer service to policyholders and sales compensation.
16
This page
Intentionally
left blank.
To Get More Information
Shareholder reports — These include commentary from the portfolio’s management team about recent market conditions and the portfolio’s performance. They also have detailed performance figures, a list of everything the portfolio owns and its financial statements. Shareholders get these reports automatically.
Statement of Additional Information (SAI) — This tells you more about the portfolio’s features and policies, including additional risk information. The SAI is incorporated by reference into this document (meaning that it’s legally part of this prospectus).
For a free copy of any of these documents or to request other information about the portfolio, call (800) 778-1482, or contact DWS Scudder at the address listed below. The portfolio’s SAI and shareholder reports are also available through the DWS Scudder Web site at www.dws-scudder.com. These documents and other information about the portfolio are available from the EDGAR Database on the SEC’s Web site at www.sec.gov. If you like, you may obtain copies of this information, after paying a copying fee, by e-mailing a request to publicinfo@sec.gov or by writing the SEC at the address listed below. You can also review and copy these documents and other information about the portfolio, including the portfolio’s SAI, at the SEC’s Public Reference Room in Washington, D.C. Information on the operation of the SEC’s Public Reference Room may be obtained by calling (202) 551-5850.
| | |
DWS Scudder Distributors, Inc. | | SEC |
| |
222 South Riverside Plaza | | 100 F Street, N.E. |
Chicago, IL 60606-5808 | | Washington, D.C. 20549-2001 |
(800) 778-1482 | | (202) 551-5850 |
| |
| | www.sec.gov |
| |
| | SEC File # |
| |
DWS Variable Series II | | 811-5002 |
MAY 1, 2006
PROSPECTUS
DWS VARIABLE SERIES II
(formerly Scudder Variable Series II)
CLASS B SHARES
DWS Income Allocation VIP
(formerly Scudder Conservative Income Strategy Portfolio)
This prospectus should be read in conjunction with the variable life insurance or variable annuity contract prospectus and plan documents for tax-qualified plans. These shares are available and are being marketed exclusively as a pooled funding vehicle for life insurance companies writing all types of variable life insurance policies and variable annuity contracts.
The Securities and Exchange Commission (SEC) does not approve or disapprove these shares or determine whether the information in this prospectus is truthful or complete. It is a criminal offense for anyone to inform you otherwise.
ONE GLOBAL FORCE. ONE FOCUS. YOU. [DWS SCUDDER Logo]
Deutsche Bank Group
Table of Contents
How the Portfolio Works
The portfolio is designed to serve as an investment option for certain variable annuity contracts, variable life insurance policies and tax-qualified plans. Your investment in the portfolio is made in conjunction with one of these contracts or policies.
Remember that the portfolio is not a bank deposit. It’s not insured or guaranteed by the FDIC or any other government agency. Its share price will go up and down and you could lose money by investing in the portfolio.
Please read this prospectus in conjunction with the prospectus for your variable life insurance policy or variable annuity contract or plan documents for tax-qualified plans.
DWS Income Allocation VIP
(formerly Scudder Conservative Income Strategy Portfolio)
The Portfolio’s Main Investment Strategy
The portfolio seeks current income and, as a secondary objective, long-term growth of capital. It does this by investing in other DWS portfolios (“underlying portfolios”) that invest across a range of asset classes, utilizing a wide variety of securities and investment styles. The portfolio will always invest in the share class of an underlying portfolio with the lowest fees and expenses.
For DWS Income Allocation VIP, the portfolio’s target allocation is as follows:
| | • | | 75% in underlying portfolios which invest primarily in fixed-income securities of all credit qualities and maturities (“fixed-income portfolios”). |
| | • | | 25% in underlying portfolios which invest primarily in equity securities of all capitalization levels (“equity portfolios”). |
The portfolio managers have the flexibility to adjust this allocation within the following ranges:
| | • | | 60-90% in fixed-income portfolios. |
| | • | | 10-40% in equity portfolios. |
While the actual allocation may vary, the portfolio managers expect that over the long term it will average out to be similar to the target allocation.
The portfolio managers regularly review the actual allocation and may adjust it in seeking to take advantage of current or expected market conditions or to manage risk. In making their allocation decisions, the managers use a proprietary mix of qualitative and quantitative inputs to arrive at a view for the securities markets and segments of those markets. Based on the desired exposure to particular investments and a thorough risk analysis, the managers then decide which portfolios to use as underlying portfolios and in which proportions.
It is expected that, in the future, the managers may invest in instruments, commonly called “derivatives,” including, but not limited to, futures and forward currency exchange contracts, to attempt to manage risk and enhance returns. Derivatives may be used to hedge the portfolio against price fluctuations and otherwise reduce risk. Derivatives may also be used to increase the portfolio’s exposure to certain markets in an attempt to enhance returns. These strategies may be used separately or in combination. The managers may also use these derivatives strategies to help maintain cash reserves or otherwise liquid assets to meet shareholder redemptions, or for other needs, while maintaining exposure to the markets. The managers will determine which derivative instruments to purchase by using a quantitative strategy that incorporates data from various international markets. The strategy seeks to shift the emphasis on the portfolio’s holdings in response to short- and medium-term changes in global markets. The use of the strategy is subject to Board approval. Shareholders will be notified prior to the use of the strategy.
The underlying portfolios use a broad array of investment styles. These portfolios can buy many types of securities, among them common stocks of companies of any size, corporate bonds of varying credit quality, US government and agency bonds, mortgage- and asset-backed securities, money market instruments and others. These securities are mainly from US issuers but may be, to a more limited extent, from foreign issuers.
As a temporary defensive measure, the portfolio could shift up to 100% of assets into investments such as money market securities. This could prevent losses, but, while engaged in a temporary defensive position, the portfolio will not be pursuing its investment objective. However, the managers may choose not to use these strategies for various reasons, even in very volatile market conditions.
The Main Risks of Investing in the Portfolio
There are several risk factors that could hurt the portfolio’s performance, cause you to lose money or cause the portfolio’s performance to trail that of other investments. The portfolio’s allocations among the underlying portfolios will change over time, causing corresponding changes in the portfolio’s risk profile.
3
Asset Allocation Risk. Although asset allocation among different asset classes generally limits risk and exposure to any one class, the risk remains that the investment advisor may favor an asset class that performs poorly relative to the other asset classes. For example, deteriorating stock market conditions might cause an overall weakness in the market that reduces the absolute level of stock prices in that market. Under these circumstances, if the portfolio was invested primarily in underlying portfolios that emphasize stocks, it would perform poorly relative to a portfolio invested primarily in bonds.
Reallocation Risk. From time to time, one or more underlying portfolios may experience relatively large investments or redemptions due to reallocations or rebalancings of the portfolios by the managers. These transactions will affect the underlying portfolios, since underlying portfolios that experience redemptions as a result of reallocations or rebalancings may have to sell securities and underlying portfolios that receive additional cash will have to invest such cash. In addition, a large redemption by a portfolio in a specific underlying portfolio could also hurt the performance of another portfolio currently invested in the same underlying portfolio. While it is impossible to predict the overall impact of these transactions over time, there could also be adverse effects on a portfolio’s performance to the extent that the underlying portfolios may be required to sell securities or invest cash at times when they would otherwise not do so. These transactions could also accelerate the realization of taxable income if sales of securities resulted in gains and could also increase transaction costs for the underlying portfolios. The managers are committed to minimizing such impact on the underlying portfolios to the extent consistent with pursuing the investment objective of a portfolio. The managers will at all times monitor the impact on the underlying portfolios of transactions by a portfolio.
Focused Investment Risk. Overall risk can be reduced by industry or geographic diversification, and increased by focusing investments in a limited number of geographic regions or in industries with high positive correlations to one another (e.g., different industries within broad sectors, such as technology or financial services). An underlying portfolio that focuses its investments in the securities of issuers in industries with high positive correlations to one another may be particularly vulnerable to events affecting companies in those industries because the companies may share common characteristics, are often subject to similar business risks and regulatory burdens, and often react similarly to specific economic, market, political, or other developments. Similarly, underlying portfolios that invest significant portions of their assets in a narrowly defined geographic region or in a particular foreign country may be particularly vulnerable to events affecting companies located in that region or country because the companies may share common characteristics, are often subject to similar business risks and regulatory burdens, and often react similarly to specific economic, market, political or other developments.
Credit Risk. An underlying portfolio purchasing bonds faces the risk that the issuer or guarantor of a debt security or the other party to an over-the-counter transaction will be unable or unwilling to make timely payments of interest or principal, or otherwise to honor its obligations. The degree of this risk for a particular security may be reflected in its credit rating. This risk is greater with junk and foreign bonds because of the difficulties of requiring foreign entities, including issuers of sovereign debt, to honor their contractual commitments, and because a number of foreign governments and other foreign issuers are already in default. In addition, because the issuers of high yield bonds (rated below the fourth highest category) may be in uncertain financial health, the prices of their bonds are generally more vulnerable to bad economic news or even the expectation of bad news, than those of investment-grade bonds. In some cases, bonds, particularly junk bonds, may decline in credit quality or go into default.
Interest Rate Risk. Generally, fixed income securities will decrease in value when interest rates rise. The longer the effective maturity of an underlying portfolio’s securities, the more sensitive it will be to interest rate changes. (As a general rule, a 1% rise in interest rates means a 1% fall in value for every year of duration.) As interest rates decline, the issuers of securities held by an underlying portfolio may prepay principal earlier than scheduled, forcing the underlying portfolio to reinvest in lower yielding securities. Prepayment may reduce the underlying portfolio’s income. As interest rates increase, fewer issuers tend to prepay, which may extend the average life of fixed income securities and have the effect of locking in a below-market interest rate, increasing the underlying portfolio’s effective duration and reducing the value of the security. Because an underlying portfolio may invest in mortgage-related securities, the portfolio is more vulnerable to both of these risks.
4
Stock Market Risk. An important factor for the underlying portfolios is how stock markets perform. Because a stock represents ownership in its issuer, stock prices can be hurt by poor management, shrinking product demand and other business risks. These may affect single companies as well as groups of companies. In addition, movements in financial markets may adversely affect a stock’s price, regardless of how well the company performs. The market as a whole may not favor the types of investments an underlying portfolio makes and the underlying portfolio may not be able to get attractive prices for them.
Derivatives Risk. Risks associated with derivatives include: the risk that a derivative is not well correlated with the security, index or currency to which it relates; the risk that derivatives used for risk management may not have the intended effects and may result in losses or missed opportunities; the risk that the portfolio or an underlying portfolio will be unable to sell the derivative because of an illiquid secondary market; the risk that a counterparty is unwilling or unable to meet its obligation; the risk of interest rate movements; and the risk that the derivatives transaction could expose the portfolio or an underlying portfolio to the effects of leverage, which could increase the portfolio’s or an underlying portfolio’s exposure to the market and magnify potential losses. There is no guarantee that derivatives activities will be employed or that they will work, and their use could cause lower returns or even losses to the portfolio or an underlying portfolio.
Securities Lending Risk. Any loss in the market price of securities loaned by an underlying portfolio that occurs during the term of the loan would be borne by the underlying portfolio and would adversely affect that underlying portfolio’s performance. Also, there may be delays in recovery of securities loaned or even a loss of rights in the collateral should the borrower of the securities fail financially while the loan is outstanding. However, loans will be made only to borrowers selected by the underlying portfolio’s delegate after a review of relevant facts and circumstances, including the creditworthiness of the borrower.
Pricing Risk. At times, market conditions might make it hard to value some investments. For example, if the portfolio or an underlying portfolio has valued its securities too highly, you may end up paying too much for shares when you buy into the portfolio. If the portfolio or an underlying portfolio underestimates their price, you may not receive the full market value for your shares when you sell.
Other factors that could affect performance include:
| | • | | the managers of the portfolio or the underlying portfolios could be incorrect in their analysis of economic trends, countries, industries, companies, the relative attractiveness of asset classes or other matters; |
| | • | | to the extent an underlying portfolio invests in foreign securities, it faces the risks inherent in foreign investing including adverse political, economic or social developments which could hurt portfolio performance; and |
| | • | | the underlying portfolios may trade securities more actively than comparable portfolios. Upon the use of the derivatives strategy, the portfolio may also trade derivative instruments more actively than comparable portfolios. Any of these cases could raise transactions costs and thereby lower returns. |
The portfolio is designed for investors who are interested in a relatively conservative asset allocation investment.
5
Performance
While a portfolio’s past performance isn’t necessarily a sign of how it will do in the future, it can be valuable information for an investor to know.
The table shows how average annual returns for the portfolio’s Class B shares compare with two broad-based market indices (which, unlike the portfolio, do not have any fees or expenses). The performance of both the portfolio and the indices vary over time. All figures on this page assume reinvestment of dividends and distributions.
This information doesn’t reflect charges and fees associated with the separate account that invests in the portfolio or any variable life insurance policy or variable annuity contract for which the portfolio is an investment option. These charges and fees will reduce returns.
Annual Total Returns (%) as of 12/31 each year — Class B shares
THE ORIGINAL DOCUMENT CONTAINS A BAR CHART HERE
BAR CHART DATA:
For the periods included in the bar chart:
| | |
| Best Quarter: 2.31%, Q2 2005 | | Worst Quarter: -0.67%, Q1 2005 |
2006 Total Return as of March 31: 1.19%
Average Annual Total Returns (%) as of 12/31/2005
| | | | |
| | | 1 Year | | Since Inception* |
Portfolio — Class B | | 3.53 | | 6.20 |
Index 1 | | 2.43 | | 2.75 |
Index 2 | | 6.27 | | 13.33 |
Index 1: The Lehman Brothers Aggregate Bond Index is an unmanaged market value-weighted measure of treasury issues, corporate bond issues and mortgage securities.
Index 2: The Russell 1000 Index is an unmanaged capitalization-weighted price-only index composed of the largest-capitalized US companies whose common stocks are traded in the United States.
| * | Since 8/16/04. Index comparisons begin 8/31/04. |
Total returns would have been lower if operating expenses hadn’t been reduced.
Current performance information may be higher or lower than the performance data quoted above. For more recent performance information, contact your participating insurance company.
6
How Much Investors Pay
This table describes the fees and expenses that you may pay if you buy and hold portfolio shares. The portfolio’s shareholders directly bear the fees and expenses of the portfolio, subject to the contractual obligations of the advisor, underwriter and accounting agent to waive fees or reimburse expenses to maintain the portfolio’s operating expenses at a specified level. The portfolio will indirectly bear its proportionate share of fees and expenses incurred by the underlying portfolios in which the portfolio is invested (see “Range of Average Weighted Net Expense Ratios” in the table below). The information in the table does not reflect charges and fees associated with the separate account that invests in the portfolio or any variable life insurance policy or variable annuity contract for which the portfolio is an investment option. These charges and fees will increase expenses.
| | |
Fee Table | | Class B |
Annual Operating Expenses, deducted from portfolio assets | | |
Management Fee | | 0.15% |
Distribution/Service (12b-1) Fee | | 0.25 |
Other Expenses | | 1.13 |
| | |
Total Annual Operating Expenses(1) | | 1.53 |
| | |
Range of Average Weighted Net Expense Ratios for underlying portfolios(2) | | 0.63% to 0.79% |
Estimated Total Annual Direct and Indirect Operating Expenses(3) | | 2.10 |
| (1) | Through November 30, 2006, the advisor, underwriter and accounting agent have each contractually agreed to waive their respective fees to the extent necessary to maintain the portfolio’s direct operating expenses at 0.75% of average daily net assets, excluding certain expenses such as extraordinary expenses, taxes, brokerage and interest. |
| (2) | Certain ratios reduced for contractual expense limitations and/or reimbursements where applicable, based on the most recent prospectuses. |
| (3) | The Estimated Total Annual Direct and Indirect Operating Expenses shown in the table is the sum of the portfolio’s Total Annual Operating Expenses and the underlying portfolios’ estimated Indirect Expenses. |
Based on the costs above, this example helps you compare the expenses of Class B shares to those of other mutual funds. This example assumes the expenses above remain the same. It also assumes that you invested $10,000, earned 5% annual returns, reinvested all dividends and distributions, and sold your shares at the end of each period. This is only an example; actual expenses will be different.
| | | | | | | | | | | | |
Example | | 1 Year | | 3 Years | | 5 Years | | 10 Years |
Class B shares | | $ | 213 | | $ | 658 | | $ | 1,129 | | $ | 2,431 |
7
The Portfolio Managers
The portfolio is managed by a team of investment professionals who each play an important role in the portfolio’s management process. This team works for the advisor or its affiliates and is supported by a large staff of economists, research analysts, traders and other investment specialists. The advisor or its affiliates believe(s) its team approach benefits portfolio investors by bringing together many disciplines and leveraging its extensive resources.
The portfolio is managed by a team of investment professionals who collaborate to develop and implement the portfolio’s investment strategy. Each portfolio manager on the team has authority over all aspects of the portfolio’s investment portfolio, including but not limited to, purchases and sales of individual securities, portfolio construction techniques, portfolio risk assessment and the management of daily cash flows in accordance with portfolio holdings.
The following people handle the day-to-day management of the portfolio:
| | |
| Inna Okounkova | | Robert Wang |
| |
| Director of Deutsche Asset Management and Portfolio Manager of the portfolio. | | Managing Director of Deutsche Asset Management and Portfolio Manager of the portfolio. |
| |
• Global Asset Allocation portfolio manager: New York. • Joined Deutsche Asset Management in 1999 as a quantitative analyst, becoming an associate portfolio manager in 2001. • BS, MS, Moscow State University; MBA, University of Chicago. • Joined the portfolio in 2004. | | • Global Asset Allocation senior portfolio manager: New York. • Joined Deutsche Asset Management in 1995 as a senior fixed income portfolio manager after 13 years of experience at J.P. Morgan & Co. trading fixed income, derivatives and foreign exchange products. • BS, The Wharton School, University of Pennsylvania. • Joined the portfolio in 2004. |
The portfolio’s Statement of Additional Information provides additional information about the portfolio managers’ investments in the portfolio, a description of their compensation structure and information regarding other accounts they manage.
8
Financial Highlights
This table is designed to help you understand the portfolio’s financial performance. The figures in the first part of the table are for a single share. The total return figures represent the percentage that an investor in the portfolio would have earned (or lost), assuming all dividends and distributions were reinvested. This information has been audited by Ernst & Young LLP, independent registered public accounting firm, whose report, along with the portfolio’s financial statements, is included in the portfolio’s annual report (see “Shareholder reports” on the back cover).
The following table includes selected data for a share outstanding throughout each period and other performance information derived from the financial statements.
This information doesn’t reflect charges and fees associated with the separate account that invests in the portfolio or any variable life insurance policy or variable annuity contract for which the portfolio is an investment option. These charges and fees will reduce returns.
DWS Income Allocation VIP
To Be Updated.
| | | | | | | | |
Years Ended December 31, | | 2005 | | | 2004^a | |
Selected Per Share Data | | | | | | | | |
Net asset value, beginning of period | | $ | 10.49 | | | $ | 10.00 | |
Income (loss) from investment operations: | | | | | | | | |
Net investment income (loss)^b | | | .21 | | | | (.02 | ) |
Net realized and unrealized gain (loss) on investment transactions | | | .16 | | | | .51 | |
| | | | | | | | |
Total from investment operations | | | .37 | | | | .49 | |
| | | | | | | | |
Less distributions from: | | | | | | | | |
Net realized gains on investment transactions | | | (.01 | ) | | | — | |
Net asset value, end of period | | $ | 10.85 | | | $ | 10.49 | |
| | | | | | | | |
Total Return (%)^c,^d | | | 3.53 | | | | 4.90 | ** |
| | | | | | | | |
Ratios to Average Net Assets and Supplemental Data | | | | | | | | |
Net assets, end of period ($ millions) | | | 12 | | | | 2 | |
Ratio of expenses before expense reductions (%)^e | | | 1.53 | | | | 21.20 | * |
Ratio of expenses after expense reductions (%)^e | | | .75 | | | | .75 | * |
Ratio of net investment income (%) | | | 2.03 | | | | (.63 | )* |
Portfolio turnover rate (%) | | | 46 | | | | 37 | * |
| ^a | For the period from August 16, 2004 (commencement of operations) to December 31, 2004. |
| ^b | Based on average shares outstanding during the period. |
| ^c | Total return would have been lower had certain expenses not been reduced. |
| ^d | Total return would have lower if the Advisor had not maintained some Underlying Portfolios’ expenses. |
| ^e | The Portfolio invests in other DWS Portfolios and indirectly bears its proportionate share of fees and expenses incurred by the Underlying DWS Portfolios in which the Portfolio is invested. |
9
Other Policies and Risks
While the previous pages describe the main points of the portfolio’s strategy and risks, there are a few other issues to know about:
| | • | | The portfolio may trade securities actively. This strategy could raise transaction costs and, accordingly, lower performance. |
| | • | | The advisor may establish a debt security’s credit quality when it buys a security, using independent ratings, or for unrated securities, its own credit determination. When ratings don’t agree, a portfolio may use the higher rating. If a security’s credit quality falls, the advisor will determine whether selling it would be in the portfolio’s best interest. |
The portfolio’s complete portfolio holdings as of the end of each calendar month are posted on www.dws-scudder.com ordinarily on the 15th day of the following calendar month or the first business day thereafter. This posted information generally remains accessible at least until the portfolio files its Form N-CSR or N-Q with the Securities and Exchange Commission for the period that includes the date as of which the www.dws-scudder.com information is current (expected to be at least three months). The portfolios’ Statement of Additional Information includes a description of the portfolio’s policies and procedures with respect to the disclosure of the portfolio’s holdings.
This prospectus doesn’t tell you about every policy or risk of investing in the portfolio. If you want more information on the portfolio’s allowable securities and investment practices and the characteristics and risks of each one, you may want to request a copy of the Statement of Additional Information (the back cover tells you how to do this).
Keep in mind that there is no assurance that any mutual fund will achieve its goal.
Investment Advisor
DWS Scudder is part of Deutsche Asset Management, which is the marketing name in the US for the asset management activities of Deutsche Bank AG, Deutsche Investment Management Americas Inc. (“DeIM” or the “advisor”), Deutsche Asset Management, Inc., Deutsche Bank Trust Company Americas and DWS Trust Company.
Deutsche Asset Management is a global asset management organization that offers a wide range of investing expertise and resources, including hundreds of portfolio managers and analysts and an office network that reaches the world’s major investment centers. This well-resourced global investment platform brings together a wide variety of experience and investment insight, across industries, regions, asset classes and investing styles.
DeIM is an indirect, wholly owned subsidiary of Deutsche Bank AG. Deutsche Bank AG is a major global banking institution that is engaged in a wide range of financial services, including investment management, mutual fund, retail, private and commercial banking, investment banking and insurance.
DeIM is the investment advisor for the portfolio. Under the supervision of the Board of Trustees, DeIM, with headquarters at 345 Park Avenue, New York, NY 10154, makes the portfolio’s investment decisions, buys and sells securities for the portfolio and conducts research that leads to these purchase and sale decisions. DeIM and its predecessors have more than 80 years of experience managing mutual funds and DeIM provides a full range of investment advisory services to institutional and retail clients. DeIM is also responsible for selecting brokers and dealers and for negotiating brokerage commissions and dealer charges.
The portfolio’s shareholder report for the year ended December 31, 2005 contains a discussion regarding the basis for the Board of Trustees’ approval of the portfolio’s investment management agreement (see “Shareholder reports” on the back cover).
The advisor receives a management fee from the portfolio. Below is the actual rate paid by the portfolio during the most recent fiscal year, as a percentage of the portfolio’s average daily net assets:
| | | |
Portfolio Name | | Fee Paid | |
DWS Income Allocation VIP* | | 0.00 | % |
| * | Reflecting the effect of expense limitations and/or fee waivers then in effect. |
10
Market timing related regulatory and litigation matters
Since at least July 2003, federal, state and industry regulators have been conducting ongoing inquiries and investigations (“inquiries”) into the mutual fund industry, and have requested information from numerous mutual fund companies, including DWS Scudder. The DWS funds’ advisors have been cooperating in connection with these inquiries and are in discussions with the regulators concerning proposed settlements. Publicity about mutual fund practices arising from these industrywide inquiries serves as the general basis of a number of private lawsuits against the DWS funds. These lawsuits, which previously have been reported in the press, involve purported class action and derivative lawsuits, making various allegations and naming as defendants various persons, including certain DWS funds, the funds’ investment advisors and their affiliates, and certain individuals, including in some cases fund Trustees/Directors, officers, and other parties. Each DWS fund’s investment advisor has agreed to indemnify the applicable DWS funds in connection with these lawsuits, or other lawsuits or regulatory actions that may be filed making allegations similar to these lawsuits regarding market timing, revenue sharing, fund valuation or other subjects arising from or related to the pending inquiries. It is not possible to determine with certainty what the outcome of these inquiries will be or what the effect, if any, would be on the funds or their advisors.
With respect to the lawsuits, based on currently available information, the funds’ investment advisors believe the likelihood that the pending lawsuits will have a material adverse financial impact on a DWS fund is remote and such actions are not likely to materially affect their ability to perform under their investment management agreements with the DWS funds.
With respect to the regulatory matters, Deutsche Asset Management (“DeAM”) has advised the funds as follows:
DeAM expects to reach final agreements with regulators early in 2006 regarding allegations of improper trading in the DWS funds. DeAM expects that it will reach settlement agreements with the Securities and Exchange Commission, the New York Attorney General and the Illinois Secretary of State providing for payment of disgorgement, penalties, and investor education contributions totaling approximately $134 million. Approximately $127 million of this amount would be distributed to shareholders of the affected DWS funds in accordance with a distribution plan to be developed by an independent distribution consultant. DeAM does not believe that any of the DWS funds will be named as respondents or defendants in any proceedings. The funds’ investment advisors do not believe these amounts will have a material adverse financial impact on them or materially affect their ability to perform under their investment management agreements with the DWS funds. The above-described amounts are not material to Deutsche Bank, and they have already been reserved.
Based on the settlement discussions thus far, DeAM believes that it will be able to reach a settlement with the regulators on a basis that is generally consistent with settlements reached by other advisors, taking into account the particular facts and circumstances of market timing at DeAM and at the legacy Scudder and Kemper organizations prior to their acquisition by DeAM in April 2002. Among the terms of the expected settled orders, DeAM would be subject to certain undertakings regarding the conduct of its business in the future, including maintaining existing management fee reductions for certain funds for a period of five years. DeAM expects that these settlements would resolve regulatory allegations that it violated certain provisions of federal and state securities laws (i) by entering into trading arrangements that permitted certain investors to engage in market timing in certain DWS funds and (ii) by failing more generally to take adequate measures to prevent market timing in the DWS funds, primarily during the 1999-2001 period. With respect to the trading arrangements, DeAM expects that the settlement documents will include allegations related to one legacy DeAM arrangement, as well as three legacy Scudder and six legacy Kemper arrangements. All of these trading arrangements originated in businesses that existed prior to the current DeAM organization, which came together in April 2002 as a result of the various mergers of the legacy Scudder, Kemper and Deutsche fund groups, and all of the arrangements were terminated prior to the start of the regulatory investigations that began in the summer of 2003. No current DeAM employee approved the trading arrangements.
11
There is no certainty that the final settlement documents will contain the foregoing terms and conditions. The independent Trustees/Directors of the DWS funds have carefully monitored these regulatory investigations with the assistance of independent legal counsel and independent economic consultants. Additional information announced by DeAM regarding the terms of the expected settlements will be made available at www.dws-scudder.com/regulatory_settlements, which will also disclose the terms of any final settlement agreements once they are announced.
Other regulatory matters
DeAM is also engaged in settlement discussions with the Enforcement Staffs of the SEC and the NASD regarding DeAM’s practices during 2001-2003 with respect to directing brokerage commissions for portfolio transactions by certain DWS funds to broker-dealers that sold shares in the DWS funds and provided enhanced marketing and distribution for shares in the DWS funds. In addition, on January 13, 2006, DWS Scudder Distributors, Inc. received a Wells notice from the Enforcement Staff of the NASD regarding DWS Scudder Distributors’ payment of non-cash compensation to associated persons of NASD member firms, as well as DWS Scudder Distributors’ procedures regarding non-cash compensation regarding entertainment provided to such associated persons. Additional information announced by DeAM regarding the terms of the expected settlements will be made available at www.dws-scudder.com/regulatory_settlements, which will also disclose the terms of any final settlement agreements once they are announced.
12
Your Investment in the Portfolio
The information in this section may affect anyone who selects the portfolio as an investment option in a variable annuity contract or variable life insurance policy that offers the portfolio. These contracts and policies are described in separate prospectuses issued by participating insurance companies. The portfolio assumes no responsibility for such prospectuses.
Policies about transactions
The information in this prospectus applies to Class B shares of the portfolio. Class B shares are offered at net asset value and are subject to a 12b-1 fee. The portfolio has another class of shares which is offered separately.
Technically, the shareholders of DWS Variable Series II (which includes the portfolio just described) are the participating insurance companies (the “insurance companies”) that offer the portfolio as a choice for holders of certain variable annuity contracts or variable life insurance policies (the “contract(s)”) issued or sponsored by the insurance companies. The insurance companies effectively pass through the ownership of portfolio shares to their contract owners and some may pass through voting rights as well. The portfolio does not sell shares directly to the public. The portfolio sells shares only to separate accounts of insurance companies. As a contract owner, your premium payments are allocated to the portfolio by the insurance companies in accordance with your contract. Please see the contract prospectus that accompanies this prospectus for a detailed explanation of your contract.
Please bear in mind that there are important differences between funds available to any investor (a “Retail Fund”) and those that are only available through certain financial institutions, such as insurance companies. For example, Retail Funds, unlike the portfolio, are not sold to insurance company separate accounts to support investments in variable insurance contracts. In addition, the investment objectives, policies and strategies of the portfolio, while similar to those of a Retail Fund, may not be identical. Retail Funds may be smaller or larger than the portfolio and have different expense ratios than the portfolio. As a result, the performance of the portfolio and a Retail Fund will differ.
Should any conflict between contract owners arise that would require that a substantial amount of net assets be withdrawn from the portfolio, orderly portfolio management could be disrupted to the potential detriment of contract owners in the portfolio.
The portfolio has a verification process for new insurance company accounts to help the government fight the funding of terrorism and money laundering activities. Federal law requires all financial institutions to obtain, verify and record information that identifies each insurance company that opens an account. What this means to you: when an insurance company opens an account, the portfolio will ask for its name, address and other information that will allow the portfolio to identify the company. This information will be verified to ensure the identity of all insurance companies opening an account.
For certain insurance companies, a portfolio might request additional information (for instance, the portfolio would ask for documents such as the insurance company’s articles of incorporation) to help the portfolio verify the insurance company’s identity.
The portfolio will not complete the purchase of any shares for an account until all information has been provided and the application has been submitted in “good order.” Once the application is determined to be in good order, the purchase(s) will be effected at the net asset value per share next calculated.
The portfolio may reject a new account application if the insurance company doesn’t provide any required or requested identifying information, or for other reasons.
13
The advisor, DWS Scudder Distributors, Inc. and/or their affiliates may pay additional compensation from their own assets to other persons for selling, distributing and/or servicing portfolio shares. This compensation may be significant. You should talk to your insurance company to determine if this compensation influenced the financial advisor’s recommendation of the portfolio.
Buying and Selling Shares
The portfolio is open for business each day the New York Stock Exchange is open. The portfolio calculates its share price every business day, as of the close of regular trading on the Exchange (typically 4 p.m. Eastern time, but sometimes earlier, as in the case of scheduled half-day trading or unscheduled suspensions of trading).
The portfolio continuously sells shares to each insurance company, without a sales charge, at the net asset value per share next determined after a proper purchase order is placed with the insurance company. The insurance company offers contract owners units in its separate accounts which directly correspond to shares in the portfolio. Each insurance company submits purchase and redemption orders to the portfolio based on allocation instructions for premium payments, transfer instructions and surrender or partial withdrawal requests for contract owners, as set forth in the accompanying prospectus for the contracts. These orders reflect the amount of premium payments to be invested, surrender and transfer requests, and other matters. Redemption orders are effected at the next net asset value per share determined after a proper redemption order is placed with the insurance company. Contract owners should look at their contract prospectuses for redemption procedures and fees.
Important information about buying and selling shares
| | • | | After receiving a contract owner’s order, the insurance company buys or sells shares at the net asset value next calculated on any day the portfolio is open for business. |
| | • | | Unless otherwise instructed, the portfolio normally makes payment of the proceeds from the sale of shares the next business day but always within seven calendar days. |
| | • | | The portfolio does not issue share certificates. |
| | • | | The portfolio reserves the right to reject purchases of shares for any reason. |
| | • | | The portfolio reserves the right to withdraw or suspend the offering of shares at any time. |
| | • | | The portfolio reserves the right to reject purchases of shares or to suspend or postpone redemptions at times when the New York Stock Exchange is closed (other than customary closings), trading is restricted or when an emergency exists that prevents the portfolio from disposing of its securities or pricing its shares. |
| | • | | The portfolio may refuse, cancel or rescind any purchase order; freeze any account (meaning the insurance company will not be able to purchase shares in its account); suspend account services; and/or involuntarily redeem the account if we think that the account is being used for fraudulent or illegal purposes by the insurance company; one or more of these actions will be taken when, at the sole discretion of the portfolio, they are deemed to be in the portfolio’s best interest or when the portfolio is requested or compelled to do so by governmental authority or by applicable law. |
| | • | | The portfolio may close and liquidate an account if the portfolio is unable to verify provided information, or for other reasons; if the portfolio decides to close the account, the shares will be redeemed at the net asset value per share next calculated after we determine to close the account; the insurance company may be subject to gain or loss on the redemption of the portfolio shares and may incur tax liability. |
| | • | | A contract owner’s purchase order may not be accepted if the sale of portfolio shares has been suspended or if it is determined that the purchase would be detrimental to the interests of the portfolio’s shareholders. |
| | • | | Currently, the Board of Trustees of DWS Variable Series II does not foresee any disadvantages to contract owners arising from the fact that the interests of contract owners may differ. Nevertheless, the Board intends to monitor events in order to identify any material irreconcilable conflicts that may possibly arise and to determine what action, if any, should be taken. |
14
Market Timing Policies and Procedures. Short-term and excessive trading of portfolio shares may present risks to the portfolio’s long-term shareholders, including potential dilution in the value of portfolio shares, interference with the efficient management of the portfolio (including losses on the sale of investments), taxable gains to remaining shareholders and increased brokerage and administrative costs. To the extent that the portfolio invests in such securities, the risks may be more pronounced for certain securities such as those that trade in foreign markets, are illiquid or do not otherwise have “readily available market quotations.” Certain investors may seek to employ short-term trading strategies aimed at exploiting variations in portfolio valuation that arise from the nature of the securities held by the portfolio (e.g., “time zone arbitrage”).
The portfolio discourages short-term and excessive trading. The portfolio will take steps to detect and deter short-term and excessive trading pursuant to the portfolio’s policies as described in this prospectus and approved by the Board.
The portfolio’s policies include:
| | • | | the portfolio reserves the right to reject or cancel a purchase or exchange order for any reason when, in the opinion of the advisor, there appears to be a pattern of short-term or excessive trading activity by a shareholder or any other trading activity deemed harmful or disruptive to the portfolio; and |
| | • | | the portfolio has adopted certain fair valuation practices reasonably designed to protect the portfolio from “time zone arbitrage” with respect to its foreign securities holdings and other trading practices that seek to exploit variations in portfolio valuation that arise from the nature of the securities held by the portfolio. (See “How the Portfolio Calculates Share Price.”) |
When a pattern of short-term or excessive trading activity or other trading activity deemed harmful or disruptive to the portfolio is detected in a particular separate account, the advisor will take steps to stop this activity by contacting the insurance company that maintains the accounts for the underlying contract holders and seeking to have the insurance company enforce the separate account’s policies on short-term or excessive trading, if any. In addition, the advisor and the portfolio reserves the right to terminate a separate account’s ability to invest in the portfolio if apparent short-term or excessive trading activity persists. The detection of these patterns and the banning of further trading are inherently subjective and therefore involve some selectivity in their application. The advisor seeks to make such determinations in a manner consistent with the interests of the portfolio’s long-term shareholders.
There is no assurance that these policies and procedures will be effective in limiting short-term and excessive trading in all cases. For example, the advisor may not be able to effectively monitor, detect or limit short-term or excessive trading by underlying shareholders that occurs through separate accounts maintained by insurance companies or other financial intermediaries. Depending on the amount of portfolio shares held in a particular separate account (which may represent most of the portfolio’s shares) short-term and/or excessive trading of portfolio shares could adversely affect long-term shareholders in the portfolio. It is important to note that the advisor and the portfolio does not have access to underlying shareholders’ trading activity and that investors will be subject to the policies and procedures of their insurance company with respect to short-term and excessive trading in the portfolio.
The portfolio’s policies and procedures may be modified or terminated at any time.
How to receive account information
If you are a contract owner, you should contact your insurance company or the organization that provides record keeping services for information about your account.
Please see the contract prospectus that accompanies this prospectus for the customer service phone number.
How to buy and sell shares
Each insurance company has different provisions about how and when their contract owners may buy and sell portfolio shares. Each insurance company is responsible for communicating its contract owners’ instructions to the portfolio. Contract owners should contact their insurance company to effect transactions in the portfolio.
15
How the Portfolio Calculates Share Price
To calculate net asset value per share, or NAV, the portfolio uses the following equation:
| | |
| TOTAL ASSETS - TOTAL LIABILITIES | | = NAV |
| TOTAL NUMBER OF SHARES OUTSTANDING | |
The price at which you buy and sell shares for the portfolio is the NAV.
We typically value securities using information furnished by an independent pricing service or market quotations, where appropriate. However, we may use methods approved by the portfolio’s Board, such as a fair valuation model, which are intended to reflect fair value when pricing service information or market quotations are not readily available or when a security’s value or a meaningful portion of the value of the portfolio is believed to have been materially affected by a significant event, such as a natural disaster, an economic event like a bankruptcy filing, or a substantial fluctuation in domestic or foreign markets, that has occurred between the close of the exchange or market on which the security is principally traded (for example, a foreign exchange or market) and the close of the New York Stock Exchange. In such a case, the portfolio’s value for a security is likely to be different from the last quoted market price or pricing service information. In addition, due to the subjective and variable nature of fair value pricing, it is possible that the value determined for a particular asset may be materially different from the value realized upon such asset’s sale. It is expected that the greater the percentage of portfolio assets that is invested in non-US securities, the more extensive will be the portfolio’s use of fair value pricing. This is intended to reduce the portfolio’s exposure to “time zone arbitrage” and other harmful trading practices. (See “Market Timing Policies and Procedures.”)
To the extent that the portfolio invests in securities that are traded primarily in foreign markets, the value of its holdings could change at a time when you aren’t able to buy or sell portfolio shares through the contract. This is because some foreign markets are open on days and at times when the portfolio doesn’t price its shares.
Distributions
The portfolio intends to declare and distribute dividends from its net investment income and capital gains, if any, annually. The portfolio may make additional distributions if necessary.
All distributions will be reinvested in shares of the portfolio unless we are informed by an insurance company that they should be paid out in cash. The insurance companies will be informed about the amount and character of distributions from the portfolio for federal income tax purposes.
Taxes
The portfolio intends to qualify each year as a regulated investment company under Subchapter M of the Internal Revenue Code of 1986, as amended, (the “Code”) and to meet all requirements necessary to avoid paying any federal income or excise taxes.
Generally, owners of variable annuity and variable life contracts are not taxed currently on income or gains realized with respect to such contracts. However, some distributions from such contracts, whether made prior to or during the annuity payment period, may be taxable at ordinary income tax rates. In addition, distributions made to an owner who is younger than 59 1/2 may be subject to a 10% penalty tax. For further information concerning federal income tax consequences for the holders of variable annuity contracts and variable life insurance policies, such holders should consult the prospectus used in connection with the issuance of their particular contracts or policies.
In order for investors to receive the favorable tax treatment available to holders of variable annuity and variable life contracts, the separate accounts underlying such contracts, as well as the funds in which such accounts invest, must meet certain diversification requirements. The portfolio intends to comply with these requirements. If the portfolio or separate account does not meet such requirements or otherwise fails to qualify as a regulated investment company for any taxable year, income allocable to the contracts associated with the separate account would be taxable currently to the holders of such contracts and income from prior periods with respect to such contracts also could be taxable, most likely in the year of the failure.
16
Under Treasury regulations, insurance companies holding the separate accounts must report to the Internal Revenue Service losses above a certain amount resulting from a sale or disposition of the portfolio’s share.
The discussion above is generally based on the assumption that shares of the portfolio will be respected as owned by insurance company separate accounts. If this is not the case (for example, because the Internal Revenue Service finds an impermissible level of “investor control” over the investment options underlying variable contracts), the advantageous tax treatment provided in respect of insurance company separate accounts under the Code will no longer be available, and the person or persons determined to own the portfolio shares will be currently taxed on portfolio distributions, and on the proceeds of any redemption of portfolio shares, under the Code rules.
Portfolio investments in securities of foreign issuers may be subject to withholding and other taxes at the source, including on dividend or interest payments. Participating insurance companies should consult their own tax advisors as to whether such distributions are subject to federal income tax if they are retained as part of policy reserves.
The portfolio’s investments in certain debt obligations may cause the portfolio to recognize taxable income in excess of the cash generated by such obligation. Thus, the portfolio could be required at times to liquidate other investments in order to satisfy its distribution requirements.
The preceding is a brief summary of certain of the relevant tax considerations. Because each shareholder and contract holder’s tax situation is unique, ask your tax professional about the tax consequences of your investments, including possible foreign, state or local taxes.
Marketing and Distribution Fees
DWS Scudder Distributors, Inc., a subsidiary of the investment advisor, is the portfolio’s distributor.
DWS Variable Series II has adopted a 12b-1 plan for all Class B shares. Under the plan, DWS Variable Series II may make quarterly payments to the distributor for distribution and shareholder servicing related expenses incurred or paid by the distributor or a participating insurance company. No such payment shall be made with respect to any quarterly period in excess of an amount determined for such period at the annual rate of 0.25% of the average daily net assets of Class B shares during that quarterly period. Depending on the participating insurance company’s corporate structure and applicable state law, the distributor may remit payments to the participating insurance company’s affiliated broker-dealers or other affiliated company rather than the participating insurance company itself.
Because 12b-1 fees for Class B shares are paid out of portfolio assets on an ongoing basis, they will, over time, increase the cost of investment in Class B shares and may cost more than other types of sales charges.
Examples of expenses payable under the plan include the costs of printing and mailing materials (such as portfolio prospectuses, shareholder reports, portfolio advertisements and sales literature), holding seminars and sales meetings, providing customer service to policyholders and sales compensation.
17
To Get More Information
Shareholder reports — These include commentary from the portfolio’s management team about recent market conditions and the portfolio’s performance. They also have detailed performance figures, a list of everything the portfolio owns and its financial statements. Shareholders get these reports automatically.
Statement of Additional Information (SAI) — This tells you more about the portfolio’s features and policies, including additional risk information. The SAI is incorporated by reference into this document (meaning that it’s legally part of this prospectus).
For a free copy of any of these documents or to request other information about the portfolio, call (800) 778-1482, or contact DWS Scudder at the address listed below. The portfolio’s SAI and shareholder reports are also available through the DWS Scudder Web site at www.dws-scudder.com. These documents and other information about the portfolio are available from the EDGAR Database on the SEC’s Web site at www.sec.gov. If you like, you may obtain copies of this information, after paying a copying fee, by e-mailing a request to publicinfo@sec.gov or by writing the SEC at the address listed below. You can also review and copy these documents and other information about the portfolio, including the portfolio’s SAI, at the SEC’s Public Reference Room in Washington, D.C. Information on the operation of the SEC’s Public Reference Room may be obtained by calling (202) 551-5850.
| | |
| DWS Scudder Distributors, Inc. | | SEC |
| |
| 222 South Riverside Plaza | | 100 F Street, N.E. |
| Chicago, IL 60606-5808 | | Washington, D.C. 20549-2001 |
| (800) 778-1482 | | (202) 551-5850 |
| |
| | www.sec.gov |
| |
| | SEC File # |
| |
| DWS Variable Series II | | 811-5002 |
STATEMENT OF ADDITIONAL INFORMATION
DWS VARIABLE SERIES II
DWS Dreman High Return Equity VIP
DWS Conservative Allocation VIP
222 S. Riverside Plaza
Chicago, Illinois 60606
This statement of additional information is not a prospectus, but should be read in conjunction with the Proxy Statement/Prospectus dated [ , 2006] for the Joint Special Meeting of Shareholders of DWS Dreman Financial Services VIP, DWS MFS Strategic Value VIP and DWS Income Allocation VIP (each an “Acquired Fund”), each of which is a series of DWS Variable Series II, to be held on August 24, 2006, into which this statement of additional information is hereby incorporated by reference. Copies of the Proxy Statement/Prospectus may be obtained at no charge by contacting DWS Scudder Distributors, Inc., 222 South Riverside Plaza, Chicago, Illinois 60606, (800) 621-1048, or from the firm from which this statement of additional information was obtained and are available along with other materials on the Securities and Exchange Commission’s Internet website (http://www.sec.gov). Unless otherwise indicated, capitalized terms used herein and not otherwise defined have the same meanings as are given to them in the Proxy Statement/Prospectus.
Further information about DWS Dreman High Return Equity VIP and DWS Conservative Allocation VIP (each an “Acquiring Fund”), each of which is a series of DWS Variable Series II is contained in the Acquiring Funds’ statements of additional information (“SAI”) each dated May 1, 2006 as supplemented from time to time for Class A and B shares, which are attached to this statement of additional information as Appendices A and B, respectively. Further information about the Acquired Funds is also contained in such statements of additional information. The audited financial statements and related Independent Registered Public Accountants’ report for the Acquiring Funds contained in the Annual Report for the fiscal year ended December 31, 2005 are incorporated herein by reference insofar as they relate to each fund’s participation in the mergers. No other part of the Annual Report is incorporated by reference herein.
The unaudited pro forma financial statements for the merger of DWS Dreman Financial Services VIP into DWS Dreman High Return Equity VIP and DWS Income Allocation VIP into DWS Conservative Allocation VIP, each of which are attached hereto, are intended to present the financial condition and related results of operations of each Acquiring Fund, as if such mergers had been consummated on December 31, 2005.
The date of this statement of additional information is [ , 2006].
Pro Forma
Portfolio of Investments as of December 31, 2005
(Unaudited)
| | | | | | | | | | | | |
| | | DWS
Dreman
High
Return
Equity VIP
Shares
| | DWS
Dreman
Financial
Services
VIP
Shares
| | Combined
Pro Forma
Shares
| | DWS
Dreman
High
Return
Equity VIP
Value ($)
| | DWS
Dreman
Financial
Services
VIP
Value ($)
| | Combined
Pro Forma
Value ($)
|
Common Stocks 94.4% | | | | | | | | | | | | |
| | | | | | |
Consumer Discretionary 5.1% | | | | | | | | | | | | |
Automobiles 0.3% | | | | | | | | | | | | |
Ford Motor Co. | | 345,000 | | — | | 345,000 | | 2,663,400 | | — | | 2,663,400 |
| | | | | | | | |
| |
| |
|
| | | | | | | | | 2,663,400 | | — | | 2,663,400 |
| | | | | | | | |
| |
| |
|
Multiline Retail 0.8% | | | | | | | | | | | | |
Federated Department Stores, Inc. | | 129,505 | | — | | 129,505 | | 8,590,066 | | — | | 8,590,066 |
| | | | | | | | |
| |
| |
|
| | | | | | | | | 8,590,066 | | — | | 8,590,066 |
| | | | | | | | |
| |
| |
|
Specialty Retail 4.0% | | | | | | | | | | | | |
Borders Group, Inc. | | 712,900 | | — | | 712,900 | | 15,448,543 | | — | | 15,448,543 |
Home Depot, Inc. | | 388,455 | | — | | 388,455 | | 15,724,659 | | — | | 15,724,659 |
Staples, Inc. | | 501,247 | | — | | 501,247 | | 11,383,319 | | — | | 11,383,319 |
| | | | | | | | |
| |
| |
|
| | | | | | | | | 42,556,521 | | — | | 42,556,521 |
| | | | | | | | |
| |
| |
|
Consumer Staples 15.5% | | | | | | | | | | | | |
Food & Staples Retailing 0.5% | | | | | | | | | | | | |
Safeway, Inc. | | 232,650 | | — | | 232,650 | | 5,504,499 | | — | | 5,504,499 |
| | | | | | | | |
| |
| |
|
| | | | | | | | | 5,504,499 | | — | | 5,504,499 |
| | | | | | | | |
| |
| |
|
Tobacco 15.0% | | | | | | | | | | | | |
Altria Group, Inc. | | 1,121,820 | | 57,100 | | 1,178,920 | | 83,822,391 | | 4,266,512 | | 88,088,903 |
Imperial Tobacco Group PLC (ADR) | | 95,145 | | — | | 95,145 | | 5,755,321 | | — | | 5,755,321 |
Reynolds American, Inc.(a) | | 214,773 | | — | | 214,773 | | 20,474,310 | | — | | 20,474,310 |
Universal Corp. | | 266,570 | | — | | 266,570 | | 11,558,475 | | — | | 11,558,475 |
UST, Inc. | | 816,640 | | — | | 816,640 | | 33,343,411 | | — | | 33,343,411 |
| | | | | | | | |
| |
| |
|
| | | | | | | | | 154,953,908 | | 4,266,512 | | 159,220,420 |
| | | | | | | | |
| |
| |
|
Energy 18.1% | | | | | | | | | | | | |
Energy Equipment & Services 0.1% | | | | | | | | | | | | |
Transocean, Inc.* | | 22,400 | | — | | 22,400 | | 1,561,056 | | — | | 1,561,056 |
| | | | | | | | |
| |
| |
|
| | | | | | | | | 1,561,056 | | — | | 1,561,056 |
| | | | | | | | |
| |
| |
|
Oil, Gas & Consumable Fuels 18.0% | | | | | | | | | | | | |
Anadarko Petroleum Corp. | | 47,500 | | 7,100 | | 54,600 | | 4,500,625 | | 672,725 | | 5,173,350 |
S-1
| | | | | | | | | | | | |
| | | DWS
Dreman
High
Return
Equity VIP
Shares
| | DWS
Dreman
Financial
Services
VIP
Shares
| | Combined
Pro Forma
Shares
| | DWS
Dreman
High
Return
Equity VIP
Value ($)
| | DWS
Dreman
Financial
Services
VIP
Value ($)
| | Combined
Pro Forma
Value ($)
|
Apache Corp. | | 147,100 | | 9,100 | | 156,200 | | 10,079,292 | | 623,532 | | 10,702,824 |
Burlington Resources, Inc. | | 163,500 | | 9,100 | | 172,600 | | 14,093,700 | | 784,420 | | 14,878,120 |
Chevron Corp. | | 562,860 | | — | | 562,860 | | 31,953,562 | | — | | 31,953,562 |
ConocoPhillips | | 995,046 | | 79,700 | | 1,074,746 | | 57,891,776 | | 4,636,946 | | 62,528,722 |
Devon Energy Corp. | | 514,600 | | 10,600 | | 525,200 | | 32,183,084 | | 662,924 | | 32,846,008 |
El Paso Corp. | | 846,510 | | — | | 846,510 | | 10,293,562 | | — | | 10,293,562 |
EnCana Corp. | | 66,200 | | 25,800 | | 92,000 | | 2,989,592 | | 1,165,128 | | 4,154,720 |
Kerr-McGee Corp. | | 2,928 | | — | | 2,928 | | 266,038 | | — | | 266,038 |
Occidental Petroleum Corp. | | 148,700 | | 16,400 | | 165,100 | | 11,878,156 | | 1,310,032 | | 13,188,188 |
Tesoro Corp. | | — | | 22,400 | | 22,400 | | — | | 1,378,720 | | 1,378,720 |
Valero Energy Corp. | | — | | 32,800 | | 32,800 | | — | | 1,692,480 | | 1,692,480 |
| | | | | | | | |
| |
| |
|
| | | | | | | | | 176,129,387 | | 12,926,907 | | 189,056,294 |
| | | | | | | | |
| |
| |
|
Financials 34.9% | | | | | | | | | | | | |
Banks 15.0% | | | | | | | | | | | | |
Bank of America Corp. | | 521,636 | | 203,920 | | 725,556 | | 24,073,501 | | 9,410,908 | | 33,484,409 |
Fifth Third Bancorp. | | — | | 44,100 | | 44,100 | | — | | 1,663,452 | | 1,663,452 |
Hudson City Bancorp., Inc. | | — | | 35,100 | | 35,100 | | — | | 425,412 | | 425,412 |
Independence Community Bank Corp. | | — | | 13,100 | | 13,100 | | — | | 520,463 | | 520,463 |
KeyCorp | | 294,000 | | 138,855 | | 432,855 | | 9,681,420 | | 4,572,495 | | 14,253,915 |
Marshall & Ilsley Corp. | | — | | 44,500 | | 44,500 | | — | | 1,915,280 | | 1,915,280 |
Mercantile Bankshares Corp. | | — | | 11,400 | | 11,400 | | — | | 643,416 | | 643,416 |
National Bank of Canada | | — | | 81,350 | | 81,350 | | — | | 4,221,284 | | 4,221,284 |
National City Corp. | | — | | 68,331 | | 68,331 | | — | | 2,293,872 | | 2,293,872 |
PNC Financial Services Group, Inc. | | 169,300 | | 47,340 | | 216,640 | | 10,467,819 | | 2,927,032 | | 13,394,851 |
Regions Financial Corp. | | — | | 59,072 | | 59,072 | | — | | 2,017,900 | | 2,017,900 |
Sovereign Bancorp, Inc. | | 493,600 | | 89,775 | | 583,375 | | 10,671,632 | | 1,940,936 | | 12,612,568 |
US Bancorp | | 265,700 | | 140,320 | | 406,020 | | 7,941,773 | | 4,194,165 | | 12,135,938 |
Wachovia Corp. | | 140,000 | | 63,340 | | 203,340 | | 7,400,400 | | 3,348,152 | | 10,748,552 |
Washington Mutual, Inc. | | 854,175 | | 209,832 | | 1,064,007 | | 37,156,613 | | 9,127,692 | | 46,284,305 |
Wells Fargo & Co. | | — | | 36,410 | | 36,410 | | — | | 2,287,640 | | 2,287,640 |
| | | | | | | | |
| |
| |
|
| | | | | | | | | 107,393,158 | | 51,510,099 | | 158,903,257 |
| | | | | | | | |
| |
| |
|
Capital Markets 1.7% | | | | | | | | | | | | |
Ameriprise Financial, Inc. | | — | | 13,890 | | 13,890 | | — | | 569,490 | | 569,490 |
Bear Stearns Companies, Inc. | | — | | 17,140 | | 17,140 | | — | | 1,980,184 | | 1,980,184 |
Franklin Resources, Inc. | | — | | 17,210 | | 17,210 | | — | | 1,617,912 | | 1,617,912 |
S-2
| | | | | | | | | | | | |
| | | DWS
Dreman
High
Return
Equity VIP
Shares
| | DWS
Dreman
Financial
Services
VIP
Shares
| | Combined
Pro Forma
Shares
| | DWS
Dreman
High
Return
Equity VIP
Value ($)
| | DWS
Dreman
Financial
Services
VIP
Value ($)
| | Combined
Pro Forma
Value ($)
|
Lehman Brothers Holdings, Inc. | | — | | 17,200 | | 17,200 | | — | | 2,204,524 | | 2,204,524 |
Mellon Financial Corp. | | — | | 95,300 | | 95,300 | | — | | 3,264,025 | | 3,264,025 |
Morgan Stanley | | — | | 98,480 | | 98,480 | | — | | 5,587,756 | | 5,587,756 |
Piper Jaffray Companies, Inc.* | | 1,071 | | — | | 1,071 | | 43,268 | | — | | 43,268 |
The Goldman Sachs Group, Inc. | | — | | 19,400 | | 19,400 | | — | | 2,477,574 | | 2,477,574 |
| | | | | | | | |
| |
| |
|
| | | | | | | | | 43,268 | | 17,701,465 | | 17,744,733 |
| | | | | | | | |
| |
| |
|
Consumer Finance 0.3% | | | | | | | | | | | | |
American Express Co. | | — | | 63,950 | | 63,950 | | — | | 3,290,867 | | 3,290,867 |
| | | | | | | | |
| |
| |
|
| | | | | | | | | — | | 3,290,867 | | 3,290,867 |
| | | | | | | | |
| |
| |
|
Diversified Financial Services 13.8% | | | | | | | | | | | | |
CIT Group, Inc. | | 89,100 | | 50,590 | | 139,690 | | 4,613,598 | | 2,619,550 | | 7,233,148 |
Citigroup, Inc. | | 134,600 | | 101,300 | | 235,900 | | 6,532,138 | | 4,916,089 | | 11,448,227 |
Fannie Mae | | 894,873 | | 167,480 | | 1,062,353 | | 43,678,751 | | 8,174,699 | | 51,853,450 |
Freddie Mac | | 853,641 | | 130,005 | | 983,646 | | 55,785,440 | | 8,495,827 | | 64,281,267 |
JPMorgan Chase & Co. | | 132,864 | | 122,124 | | 254,988 | | 5,273,372 | | 4,847,101 | | 10,120,473 |
The PMI Group, Inc. | | — | | 39,300 | | 39,300 | | — | | 1,614,051 | | 1,614,051 |
| | | | | | | | |
| |
| |
|
| | | | | | | | | 115,883,299 | | 30,667,317 | | 146,550,616 |
| | | | | | | | |
| |
| |
|
Insurance 4.0% | | | | | | | | | | | | |
Allstate Corp. | | — | | 29,495 | | 29,495 | | — | | 1,594,795 | | 1,594,795 |
American International Group, Inc. | | 331,300 | | 172,573 | | 503,873 | | 22,604,599 | | 11,774,656 | | 34,379,255 |
Chubb Corp. | | — | | 18,630 | | 18,630 | | — | | 1,819,219 | | 1,819,219 |
Prudential Financial, Inc. | | — | | 14,690 | | 14,690 | | — | | 1,075,161 | | 1,075,161 |
The St. Paul Travelers Companies, Inc. | | 70,605 | | — | | 70,605 | | 3,153,925 | | — | | 3,153,925 |
| | | | | | | | |
| |
| |
|
| | | | | | | | | 25,758,524 | | 16,263,831 | | 42,022,355 |
| | | | | | | | |
| |
| |
|
Real Estate 0.1% | | | | | | | | | | | | |
NovaStar Financial, Inc. (REIT)(a) | | — | | 39,500 | | 39,500 | | — | | 1,110,344 | | 1,110,344 |
| | | | | | | | |
| |
| |
|
| | | | | | | | | — | | 1,110,344 | | 1,110,344 |
| | | | | | | | |
| |
| |
|
Health Care 14.3% | | | | | | | | | | | | |
Health Care Equipment & Supplies 1.2% | | | | | | | | | | | | |
Becton, Dickinson & Co. | | 111,555 | | — | | 111,555 | | 6,702,224 | | — | | 6,702,224 |
Fisher Scientific International, Inc.* | | 102,100 | | — | | 102,100 | | 6,315,906 | | — | | 6,315,906 |
| | | | | | | | |
| |
| |
|
| | | | | | | | | 13,018,130 | | — | | 13,018,130 |
| | | | | | | | |
| |
| |
|
S-3
| | | | | | | | | | | | |
| | | DWS
Dreman
High
Return
Equity VIP
Shares
| | DWS
Dreman
Financial
Services
VIP
Shares
| | Combined
Pro Forma
Shares
| | DWS
Dreman
High
Return
Equity VIP
Value ($)
| | DWS
Dreman
Financial
Services
VIP
Value ($)
| | Combined
Pro Forma
Value ($)
|
Health Care Providers & Services 7.0% | | | | | | | | | | | | |
Cardinal Health, Inc. | | 119,400 | | — | | 119,400 | | 8,208,750 | | — | | 8,208,750 |
HCA, Inc. | | 296,200 | | — | | 296,200 | | 14,958,100 | | — | | 14,958,100 |
Laboratory Corp. of America Holdings* | | 343,075 | | — | | 343,075 | | 18,474,589 | | — | | 18,474,589 |
Medco Health Solutions, Inc.* | | 316,434 | | — | | 316,434 | | 17,657,017 | | — | | 17,657,017 |
Quest Diagnostics, Inc. | | 291,100 | | — | | 291,100 | | 14,985,828 | | — | | 14,985,828 |
| | | | | | | | |
| |
| |
|
| | | | | | | | | 74,284,284 | | — | | 74,284,284 |
| | | | | | | | |
| |
| |
|
Pharmaceuticals 6.1% | | | | | | | | | | | | |
Bristol-Myers Squibb Co. | | 743,460 | | — | | 743,460 | | 17,084,711 | | — | | 17,084,711 |
Merck & Co., Inc. | | 525,195 | | — | | 525,195 | | 16,706,453 | | — | | 16,706,453 |
Pfizer, Inc. | | 931,930 | | — | | 931,930 | | 21,732,608 | | — | | 21,732,608 |
Wyeth | | 193,675 | | — | | 193,675 | | 8,922,607 | | — | | 8,922,607 |
| | | | | | | | |
| |
| |
|
| | | | | | | | | 64,446,379 | | — | | 64,446,379 |
| | | | | | | | |
| |
| |
|
Industrials 4.1% | | | | | | | | | | | | |
Air Freight & Logistics 0.5% | | | | | | | | | | | | |
FedEx Corp. | | 45,000 | | — | | 45,000 | | 4,652,550 | | — | | 4,652,550 |
| | | | | | | | |
| |
| |
|
| | | | | | | | | 4,652,550 | | — | | 4,652,550 |
| | | | | | | | |
| |
| |
|
Industrial Conglomerates 2.7% | | | | | | | | | | | | |
3M Co. | | 125,200 | | — | | 125,200 | | 9,703,000 | | — | | 9,703,000 |
General Electric Co. | | 209,350 | | — | | 209,350 | | 7,337,718 | | — | | 7,337,718 |
Tyco International Ltd. | | 415,005 | | — | | 415,005 | | 11,977,044 | | — | | 11,977,044 |
| | | | | | | | |
| |
| |
|
| | | | | | | | | 29,017,762 | | — | | 29,017,762 |
| | | | | | | | |
| |
| |
|
Machinery 0.9% | | | | | | | | | | | | |
PACCAR, Inc. | | 138,700 | | — | | 138,700 | | 9,602,201 | | — | | 9,602,201 |
| | | | | | | | |
| |
| |
|
| | | | | | | | | 9,602,201 | | — | | 9,602,201 |
| | | | | | | | |
| |
| |
|
S-4
| | | | | | | | | | | | | | | |
| | | DWS
Dreman
High
Return
Equity VIP
Shares/Principal
| | DWS
Dreman
Financial
Services
VIP
Shares/Principal
| | Combined
Pro Forma
Shares
| | DWS
Dreman
High
Return
Equity VIP
Value ($)
| | | DWS
Dreman
Financial
Services
VIP
Value ($)
| | | Combined
Pro Forma
Value ($)
| |
Information Technology 2.4% | | | | | | | | | | | | | | | |
IT Consulting & Services | | | | | | | | | | | | | | | |
Electronic Data Systems Corp. | | 1,059,440 | | — | | 1,059,440 | | 25,468,938 | | | — | | | 25,468,938 | |
| | | | | | | | |
|
| |
|
| |
|
|
| | | | | | | | | 25,468,938 | | | — | | | 25,468,938 | |
| | | | | | | | |
|
| |
|
| |
|
|
Utilities 0.0% | | | | | | | | | | | | | | | |
Multi-Utilities | | | | | | | | | | | | | | | |
NiSource, Inc. | | 5,303 | | — | | 5,303 | | 110,621 | | | — | | | 110,621 | |
| | | | | | | | |
|
| |
|
| |
|
|
| | | | | | | | | 110,621 | | | — | | | 110,621 | |
| | | | | | | | |
|
| |
|
| |
|
|
Total Common Stocks (Cost $668,478,882, $107,620,603 and $776,099,485, respectively) | | | | | | | | 861,637,951 | | | 137,737,342 | | | 999,375,293 | |
| | | | | | | | |
|
| |
|
| |
|
|
Securities Lending Collateral 1.0% | | | | | | | | | | | | | | | |
Daily Assets Fund Institutional,
4.28% (b)(c) | | 9,612,900 | | 1,020,625 | | 10,633,525 | | 9,612,900 | | | 1,020,625 | | | 10,633,525 | |
(Cost $9,612,900, $1,020,625 and $10,633,525, respectively) | | | | | | | | 9,612,900 | | | 1,020,625 | | | 10,633,525 | |
| | | | | | | | |
|
| |
|
| |
|
|
Cash Equivalents 5.2% | | | | | | | | | | | | | | | |
Cash Management QP Trust,
4.26%(d) | | 55,136,790 | | 148,666 | | 55,285,456 | | 55,136,790 | | | 148,666 | | | 55,285,456 | |
(Cost $55,136,790, $148,666 and $55,285,456, respectively) | | | | | | | | 55,136,790 | | | 148,666 | | | 55,285,456 | |
| | | | | | | | |
|
| |
|
| |
|
|
Total Investment Portfolio
(Cost $733,228,572,+ $108,789,894++ and $842,018,466, respectively) 100.6% | | | | | | | | 926,387,641 | | | 138,906,633 | | | 1,065,294,274 | |
Other Assets and Liabilities,
Net (0.6)% | | | | | | | | (5,770,147 | ) | | (1,089,105 | ) | | (6,859,252 | ) |
| | | | | | | | |
|
| |
|
| |
|
|
Net Assets 100.0% | | | | | | | | 920,617,494 | | | 137,817,528 | | | 1,058,435,022 | |
| | | | | | | | |
|
| |
|
| |
|
|
| + | | The cost for federal income tax purposes was $734,465,757. At December 31, 2005, net unrealized appreciation for all securities based on tax cost was $191,921,884. This consisted of aggregate gross unrealized appreciation for all securities in which there was an excess of value over tax cost of $246,714,121 and aggregate gross unrealized depreciation for all securities in which there was an excess of tax cost over value of $54,792,237. |
| ++ | | The cost for federal income tax purposes was $110,050,124. At December 31, 2005, net unrealized appreciation for all securities based on tax cost was $28,856,509. This consisted of aggregate gross unrealized appreciation for all securities in which there was an excess of value over tax cost of $33,017,241 and aggregate gross unrealized depreciation for all securities in which there was an excess of tax cost over value of $4,240,732. |
| * | | Non-income producing security. |
| (a) | | All or a portion of these securities were on loan. The value of all securities loaned at December 31, 2005 amounted to $9,437,670 (1% of net assets) for High Return Equity VIP and $997,905 (0.7% of net assets) for Financial Services VIP. |
| (b) | | Daily Assets Fund Institutional, an affiliated fund, is managed by Deutsche Asset Management, Inc. The rate shown is the annualized seven-day yield at period end. |
| (c) | | Represents collateral held in connection with securities lending. |
| (d) | | Cash Management QP Trust, an affiliated fund, is managed by Deutsche Investment Management Americas Inc. The rate shown is the annualized seven-day yield at period end. |
S-5
PRO FORMA CAPITALIZATION (UNAUDITED)
The following table shows the unaudited capitalization of each Fund as of December 31, 2005 and of DWS Dreman High Return Equity VIP on a pro forma combined basis, giving effect to each proposed acquisition of assets at net asset value as of that date.(1)
| | | | | | | | | | | | | | | | | | | | | | |
| | | DWS Dreman
High Return
Equity VIP
| | DWS Dreman
Financial
Services VIP
| | DWS MFS
Strategic
Value VIP
| | Pro Forma
Adjustments
| | | DWS Dreman
High Return
Equity
VIP/Financial
Services
Pro Forma
Combined
| | DWS Dreman
High Return
Equity VIP/
Strategic Value
Pro Forma
Combined
| | High Return
Equity/Financial
Services/
Strategic Value
Pro Forma
Combined
|
Net Assets | | | | | | | | | | | | | | | | | | | | | | |
Class A Shares | | $ | 785,304,208 | | $ | 120,027,544 | | $ | 28,109,386 | | | (28,109,386 | ) | | $ | 905,331,752 | | | | | | |
| | | $ | 785,304,208 | | $ | 120,027,544 | | $ | 28,109,386 | | | (120,027,544 | ) | | | | | $ | 813,413,594 | | | |
| | | $ | 785,304,208 | | $ | 120,027,544 | | $ | 28,109,386 | | | | | | | | | | | | $ | 933,441,138 |
Class B Shares | | $ | 135,313,286 | | $ | 17,789,984 | | $ | 32,963,851 | | | (32,963,851 | ) | | $ | 153,103,270 | | | | | | |
| | | $ | 135,313,286 | | $ | 17,789,984 | | $ | 32,963,851 | | | (17,789,984 | ) | | | | | $ | 168,277,137 | | | |
| | | $ | 135,313,286 | | $ | 17,789,984 | | $ | 32,963,851 | | | | | | | | | | | | $ | 186,067,121 |
| | |
|
| |
|
| |
|
| |
|
|
| |
|
| |
|
| |
|
|
Total Net Assets | | $ | 920,617,494 | | $ | 137,817,528 | | $ | 61,073,237 | | | — | | | $ | 1,058,435,022 | | $ | 981,690,731 | | $ | 1,119,508,259 |
| | |
|
| |
|
| |
|
| |
|
|
| |
|
| |
|
| |
|
|
Shares Outstanding | | | | | | | | | | | | | | | | | | | | | | |
Class A Shares | | | 58,564,793 | | | 9,007,093 | | | 2,624,466 | | | (56,493 | ) | | | 67,515,393 | | | | | | |
| | | | 58,564,793 | | | 9,007,093 | | | 2,624,466 | | | (528,315 | ) | | | | | | 60,660,944 | | | |
| | | | 58,564,793 | | | 9,007,093 | | | 2,624,466 | | | (584,808 | ) | | | | | | | | | 69,611,544 |
Class B Shares | | | 10,109,241 | | | 1,337,909 | | | 3,070,582 | | | (9,307 | ) | | | 11,437,843 | | | | | | |
| | | | 10,109,241 | | | 1,337,909 | | | 3,070,582 | | | (608,756 | ) | | | | | | 12,571,067 | | | |
| | | | 10,109,241 | | | 1,337,909 | | | 3,070,582 | | | (618,063 | ) | | | | | | | | | 13,899,669 |
Net Asset Value Per Share | | | | | | | | | | | | | | | | | | | | | | |
Class A Shares | | $ | 13.41 | | $ | 13.33 | | $ | 10.71 | | $ | — | | | $ | 13.41 | | | | | | |
| | | $ | 13.41 | | $ | 13.33 | | $ | 10.71 | | | | | | | | | $ | 13.41 | | | |
| | | $ | 13.41 | | $ | 13.33 | | $ | 10.71 | | | | | | | | | | | | $ | 13.41 |
Class B Shares | | $ | 13.39 | | $ | 13.30 | | $ | 10.74 | | $ | — | | | $ | 13.39 | | | | | | |
| | | $ | 13.39 | | $ | 13.30 | | $ | 10.74 | | | | | | | | | $ | 13.39 | | | |
| | | $ | 13.39 | | $ | 13.30 | | $ | 10.74 | | | | | | | | | | | | $ | 13.39 |
| (1) | | Assumes the mergers had been consummated on December 31, 2005, and is for information purposes only. No assurance can be given as to how many shares of the DWS Dreman High Return Equity VIP will be received by the shareholders of the DWS Dreman Financial Services VIP and DWS MFS Strategic Value VIP on the date the mergers take place, and the foregoing should not be relied upon to reflect the number of shares of the DWS Dreman High Return Equity VIP that actually will be received on or after such date. |
S-6
PRO FORMA FINANCIAL STATEMENTS (UNAUDITED)
PRO FORMA COMBINING CONDENSED STATEMENT OF
ASSETS AND LIABILITIES AS OF
December 31, 2005
(Unaudited)
| | | | | | | | | | | | | | | | |
| | | DWS Dreman
High Return
Equity VIP
| | | DWS Dreman
Financial
Services VIP
| | | Pro Forma
Adjustments
| | | Pro Forma
Combined
| |
Investments, at value | | $ | 926,387,641 | | | $ | 138,906,633 | | | $ | — | | | $ | 1,065,294,274 | |
Cash | | $ | 10,000 | | | $ | 26,450 | | | $ | — | | | $ | 36,450 | |
Other assets less liabilities | | $ | (5,780,147 | ) | | $ | (1,115,555 | ) | | $ | — | | | $ | (6,895,702 | ) |
| | |
|
|
| |
|
|
| |
|
|
| |
|
|
|
Total Net Assets | | $ | 920,617,494 | | | $ | 137,817,528 | | | $ | — | | | $ | 1,058,435,022 | |
| | |
|
|
| |
|
|
| |
|
|
| |
|
|
|
Net Assets | | | | | | | | | | | | | | | | |
Class A Shares | | $ | 785,304,208 | | | $ | 120,027,544 | | | $ | — | | | $ | 905,331,752 | |
Class B Shares | | $ | 135,313,286 | | | $ | 17,789,984 | | | $ | — | | | $ | 153,103,270 | |
| | |
|
|
| |
|
|
| |
|
|
| |
|
|
|
Total Net Assets | | $ | 920,617,494 | | | $ | 137,817,528 | | | $ | — | | | $ | 1,058,435,022 | |
| | |
|
|
| |
|
|
| |
|
|
| |
|
|
|
Shares Outstanding | | | | | | | | | | | | | | | | |
Class A Shares | | | 58,564,793 | | | | 9,007,093 | | | | (56,493 | ) | | | 67,515,393 | |
Class B Shares | | | 10,109,241 | | | | 1,337,909 | | | | (9,307 | ) | | | 11,437,843 | |
Net Asset Value Per Share | | | | | | | | | | | | | | | | |
Class A Shares | | $ | 13.41 | | | $ | 13.33 | | | $ | — | | | $ | 13.41 | |
Class B Shares | | $ | 13.39 | | | $ | 13.30 | | | $ | — | | | $ | 13.39 | |
S-7
PRO FORMA COMBINING CONDENSED STATEMENT OF OPERATIONS
FOR THE YEAR ENDED DECEMBER 31, 2005 (UNAUDITED)
| | | | | | | | | | | | | | | | |
| | | DWS Dreman
High Return
Equity VIP
| | | DWS Dreman
Financial
Services VIP
| | | Pro Forma
Adjustments
| | | Pro Forma
Combined
| |
Investment Income: | | | | | | | | | | | | | | | | |
Interest and dividend income | | $ | 23,222,759 | | | $ | 4,294,440 | | | $ | — | | | $ | 27,517,199 | |
| | |
|
|
| |
|
|
| |
|
|
| |
|
|
|
Total Investment Income | | | 23,222,759 | | | | 4,294,440 | | | | | | | | 27,517,199 | |
Expenses | | | | | | | | | | | | | | | | |
Management Fees | | | 6,460,811 | | | | 1,076,058 | | | | (41,557 | )(2) | | | 7,495,312 | |
Record keeping fees | | | 177,001 | | | | 25,055 | | | | (31,833 | )(3) | | | 170,223 | |
Custodian Fees | | | 222 | | | | 15,282 | | | | 16,572 | (3) | | | 32,076 | |
Fund Accounting | | | 131,840 | | | | 80,307 | | | | (66,587 | )(3) | | | 145,560 | |
Distribution Service Fees | | | 312,165 | | | | 42,361 | | | | — | | | | 354,526 | |
Auditing | | | 46,008 | | | | 44,166 | | | | (36,174 | )(3) | | | 54,000 | |
Legal | | | 17,646 | | | | 6,859 | | | | 21,518 | (3) | | | 46,023 | |
Trustees Fees | | | 42,080 | | | | 6,302 | | | | (5,957 | )(3) | | | 42,425 | |
Reports to Shareholders | | | 153,623 | | | | 34,133 | | | | (16,493 | )(3) | | | 171,263 | |
Other Expenses | | | 42,087 | | | | 20,307 | | | | (12,610 | )(3) | | | 49,784 | |
| | |
|
|
| |
|
|
| |
|
|
| |
|
|
|
Total expenses before reductions | | | 7,383,483 | | | | 1,350,830 | | | | (173,121 | ) | | | 8,561,192 | |
Expense reductions | | | (10,907 | ) | | | (2,712 | ) | | | (43,122 | )(4) | | | (56,741 | ) |
| | |
|
|
| |
|
|
| |
|
|
| |
|
|
|
Expenses, net | | | 7,372,576 | | | | 1,348,118 | | | | (216,243 | ) | | | 8,504,451 | |
| | |
|
|
| |
|
|
| |
|
|
| |
|
|
|
Net investment income (loss) | | | 15,850,183 | | | | 2,946,322 | | | | 216,243 | | | | 19,012,748 | |
| | |
|
|
| |
|
|
| |
|
|
| |
|
|
|
Net Realized and Unrealized Gain (Loss) | | | | | | | | | | | | | | | | |
Net realized gain (loss) on investments, foreign currency related transactions | | | 13,990,869 | | | | 6,472,632 | | | | — | | | | 20,463,501 | |
Net unrealized appreciation (depreciation) on investments, and foreign currency related transactions | | | 37,872,457 | | | | (10,651,013 | ) | | | — | | | | 27,221,444 | |
| | |
|
|
| |
|
|
| |
|
|
| |
|
|
|
Net increase in net assets from operations | | $ | 67,713,509 | | | $ | (1,232,059 | ) | | $ | 216,243 | | | $ | 66,697,693 | |
| | |
|
|
| |
|
|
| |
|
|
| |
|
|
|
S-8
Notes to Pro Forma Combining Financial Statements
December 31, 2005
1. These financial statements set forth the unaudited pro forma condensed Statement of Assets and Liabilities as of December 31, 2005, and the unaudited pro forma condensed Statement of Operations for the year ended December 31, 2005 for DWS Dreman High Return Equity VIP and DWS Dreman Financial Services VIP, as adjusted, giving effect to the merger as if it had occurred as of the beginning of the period. These statements have been derived from the books and records utilized in calculating daily net asset value for each fund and have been prepared in accordance with accounting principles generally accepted in the United States of America which require the use of management estimates. Actual results could differ from those estimates.
Basis of Combination
Under the terms of the Plan of Reorganization, the combination will be accounted for by the method of accounting for tax-free mergers of investment companies. The acquisitions would be accomplished by an acquisition of the net assets of DWS Dreman Financial Services VIP in exchange for shares of DWS Dreman High Return Equity VIP at net asset value. Following the acquisition, DWS Dreman High Return Equity VIP will be the accounting survivor. In accordance with accounting principles generally accepted in the United States of America, the historical cost of investment securities will be carried forward to the surviving fund and the results of operations for pre-combination periods will not be restated.
Portfolio Valuation
Investments are stated at value determined as of the close of regular trading on the New York Stock Exchange on each day the exchange is open for trading. Equity securities are valued at the most recent sales price or official closing price reported on the exchange (U.S. or foreign) or over-the-counter market on which the security is traded most extensively. Securities for which no sales are reported are valued at the calculated mean between the most recent bid and asked quotations on the relevant market or, if a mean cannot be determined, at the most recent bid quotation. Money market instruments purchased with an original or remaining maturity of sixty days or less, maturing at par, are valued at amortized cost. Investments in open-end investment companies and Scudder Cash Management QP Trust are valued at their net asset value each day.
Securities and other assets for which market quotations are not readily available or for which the above valuation procedures are deemed not to reflect fair value are valued in a manner that is intended to reflect their fair value as determined in accordance with procedures approved by the Trustees.
Pre-Merger Liquidation of Certain Assets of DWS Dreman Financial VIP
Pursuant to the Agreement and Plan of Reorganization, it is expected that approximately 62% of the assets of DWS Dreman Financial Services VIP will be liquidated prior to the merger. Proceeds from the liquidation will be used to acquire securities consistent with the investment objective, policies, restrictions and strategies of DWS Dreman High Return VIP. The expected liquidation of assets and purchase of securities with the sales proceeds are not reflected in these pro forma financial statements.
Federal Income Taxes
It is each Fund’s policy to comply with the requirements of the Internal Revenue Code, as amended, which are applicable to regulated investment companies, and to
S-9
distribute all of their taxable income to shareholders. After the acquisition, DWS Dreman High Return Equity VIP intends to continue to qualify as a regulated investment company.
At December 31, 2005, DWS Dreman High Return Equity VIP had a net tax basis capital loss carryforward of approximately $6,700,000, which may be applied against any realized net taxable capital gains of each succeeding year until fully utilized or until December 31, 2011. During the year ended December 31, 2005, DWS High Return Equity VIP utilized approximately $12,700,000 of a prior year capital loss carryforward.
At December 31, 2005, DWS Dreman Financial Services VIP did not have a net tax basis capital loss carryforward. During the year ended December 31, 2005, DWS Dreman Financial Services VIP utilized approximately $5,323,000 of a prior year capital loss carryforward.
2. Represents reduction in management fees resulting from the use of DWS Dreman High Return Equity VIP’s management fee agreement, applied to the pro forma combined average daily net assets.
3. Represents estimated increase (decrease) in expense resulting from the merger.
4. Represents increased expense reimbursement due to lower expense limitation to be in effect upon consummation of the merger.
S-10
Pro Forma
Portfolio of Investments as of December 31, 2005
(Unaudited)
| | | | | | | | | | | | | |
| | | DWS
Conservative
Allocation
VIP Shares
| | DWS
Income
Allocation
VIP Shares
| | Combined
Pro Forma
Shares
| | DWS
Conservative
Allocation
VIP Value ($)
| | DWS
Income
Allocation
VIP Value ($)
| | | Combined
Pro Forma
Value ($)
|
Equity Funds 39.2% | | | | | | | | | | | | | |
DWS Blue Chip VIP “A” | | 152,244 | | 23,280 | | 175,524 | | 2,265,394 | | 346,408 | | | 2,611,802 |
DWS Capital Growth VIP “A” | | 58,867 | | 5,401 | | 64,268 | | 994,854 | | 91,274 | | | 1,086,128 |
DWS Davis Venture Value VIP “A” | | 93,980 | | 14,483 | | 108,463 | | 1,173,815 | | 180,893 | | | 1,354,708 |
DWS Dreman High Return Equity VIP “A” | | 72,767 | | 15,459 | | 88,226 | | 975,806 | | 207,309 | | | 1,183,115 |
DWS Dreman Small Cap Value VIP “A” | | 70,295 | | 11,262 | | 81,557 | | 1,404,494 | | 225,011 | | | 1,629,505 |
DWS Global Opportunities VIP “A” | | 1,679 | | 186 | | 1,865 | | 25,189 | | 2,794 | | | 27,983 |
DWS Growth and Income VIP “A” | | 382,184 | | 58,515 | | 440,699 | | 3,714,831 | | 568,764 | | | 4,283,595 |
DWS International Select Equity VIP “A” | | 9,107 | | 1,475 | | 10,582 | | 120,665 | | 19,546 | | | 140,211 |
DWS International VIP “A” | | 100,267 | | 15,698 | | 115,965 | | 1,087,894 | | 170,319 | | | 1,258,213 |
DWS Janus Growth Opportunities VIP “A” | | 169,822 | | 31,878 | | 201,700 | | 1,419,708 | | 266,503 | | | 1,686,211 |
DWS Large Cap Value VIP “A” | | 173,652 | | 27,062 | | 200,714 | | 2,745,432 | | 427,853 | | | 3,173,285 |
DWS MFS Strategic Value VIP “A” | | 114,693 | | 11,367 | | 126,060 | | 1,228,376 | | 121,740 | | | 1,350,116 |
DWS Mid Cap Growth VIP “A” | | 25,293 | | 5,258 | | 30,551 | | 286,312 | | 59,517 | | | 345,829 |
DWS RREEF Real Estate Securities VIP “A” | | 40,655 | | 5,212 | | 45,867 | | 674,055 | | 86,423 | | | 760,478 |
DWS Small Cap Growth VIP “A” | | 68,335 | | 10,772 | | 79,107 | | 921,159 | | 145,200 | | | 1,066,359 |
DWS Templeton Foreign Value VIP “A” | | 68,563 | | 10,405 | | 78,968 | | 783,670 | | 118,935 | | | 902,605 |
| | | | | | | | |
| |
|
| |
|
Total Equity Funds (Cost $18,648,679, $2,852,508 and $21,501,187, respectively) | | | | | | | | 19,821,654 | | 3,038,489 | | | 22,860,143 |
| | | | | | | | |
| |
|
| |
|
Fixed Income Funds 41.4% | | | | | | | | | | | | | |
DWS Core Fixed Income VIP “A” | | 1,323,908 | | 533,039 | | 1,856,947 | | 15,635,352 | | 6,295,190 | | | 21,930,542 |
DWS Government & Agency Securities VIP “A” | | 2,782 | | 481 | | 3,263 | | 34,111 | | 5,897 | | | 40,008 |
DWS High Income VIP “A” | | 160,437 | | 55,776 | | 216,213 | | 1,320,395 | | 459,036 | | | 1,779,431 |
DWS Strategic Income VIP “A” | | 28,500 | | 9,984 | | 38,484 | | 327,745 | | 114,816 | | | 442,561 |
| | | | | | | | |
| |
|
| |
|
(Cost Total Fixed Income Funds | | | | | | | | 17,317,603 | | 6,874,939 | | | 24,192,542 |
| | | | | | | | |
| |
|
| |
|
Total Fixed Income Funds (Cost $17,388,324, $6,906,348 and $24,294,672, respectively) | | | | | | | | | | | | | |
| | | | | | |
Cash Equivalents 18.5% | | | | | | | | | | | | | |
Cash Management QP Trust(a), 4.26% (Cost $8,389,113, $2,404,189 and $10,793,302, respectively) | | 8,389,113 | | 2,404,189 | | 10,793,302 | | 8,389,113 | | 2,404,189 | | | 10,793,302 |
| | | | | | | | |
| |
|
| |
|
Total Investment Portfolio (Cost $44,426,116,+ $12,163,045++ and $56,589,161, respectively) 99.1% | | | | | | | | 45,528,370 | | 12,317,617 | | | 57,845,987 |
Other Assets and Liabilities, Net 0.9% | | | | | | | | 543,212 | | (24,198 | ) | | 519,014 |
| | | | | | | | |
| |
|
| |
|
Net Assets 100.0% | | | | | | | | 46,071,582 | | 12,293,419 | | | 58,365,001 |
| | | | | | | | |
| |
|
| |
|
| + | | The cost for federal income tax purposes was $44,455,253. At December 31, 2005, net unrealized appreciation for all securities based on tax cost was $1,073,117. This consisted of aggregate gross unrealized appreciation for all securities in which there was an excess of value over tax cost of $1,227,505 and aggregate gross unrealized depreciation for all securities in which there was an excess of tax cost over value of $154,388. |
| ++ | | The cost for federal income tax purposes was $12,196,529. At December 31, 2005, net unrealized appreciation for all securities based on tax cost was $123,088. This consisted of aggregate gross unrealized appreciation for all securities in which there was an excess of value over tax cost of $190,239 and aggregate gross unrealized depreciation for all securities in which there was an excess of tax cost over value of $67,151. |
| (a) | | Cash Management QP Trust, an affiliated fund, is managed by Deutsche Investment Management Americas Inc. The rate shown is the annualized seven-day yield at period end. |
S-11
PRO FORMA CAPITALIZATION (UNAUDITED)
The following table shows the unaudited capitalization of each Fund as of December 31, 2005 and of DWS Conservative Allocation VIP on a pro forma combined basis, giving effect to the proposed acquisition of assets at net asset value as of that date.(1)
| | | | | | | | | | | | |
| | | DWS
Conservative
Allocation VIP
| | DWS Income
Allocation VIP
| | Pro Forma
Adjustments
| | | DWS
Conservative
Allocation VIP
Pro Forma
Combined
|
Net Assets | | | | | | | | | | | | |
Class B Shares | | $ | 46,071,582 | | $ | 12,293,419 | | — | | | $ | 58,365,001 |
| | |
|
| |
|
| |
|
| |
|
|
Total Net Assets | | $ | 46,071,582 | | $ | 12,293,419 | | — | | | $ | 58,365,001 |
| | |
|
| |
|
| |
|
| |
|
|
Shares Outstanding | | | | | | | | | | | | |
Class B Shares | | | 4,149,791 | | | 1,133,437 | | (25,922 | ) | | | 5,257,306 |
Net Asset Value Per Share | | | | | | | | | | | | |
Class B Shares | | $ | 11.10 | | $ | 10.85 | | — | | | $ | 11.10 |
| (1) | | Assumes the mergers had been consummated on December 31, 2005, and is for information purposes only. No assurance can be given as to how many shares of the DWS Conservative Allocation VIP will be received by the shareholders of the DWS Income Allocation VIP on the date the merger take place, and the foregoing should not be relied upon to reflect the number of shares of the DWS Conservative Allocation VIP that actually will be received on or after such date. |
PRO FORMA FINANCIAL STATEMENTS (UNAUDITED)
PRO FORMA COMBINING CONDENSED STATEMENT OF ASSETS AND LIABILITIES AS OF DECEMBER 31, 2005 (UNAUDITED)
| | | | | | | | | | | | | | |
| | | DWS
Conservative
Allocation VIP
| | DWS Income
Allocation VIP
| | | Pro Forma
Adjustments
| | | Pro Forma
Combined
|
Investments, at value | | $ | 45,528,370 | | $ | 12,317,617 | | | $ | — | | | $ | 57,845,987 |
Cash | | $ | — | | $ | — | | | $ | — | | | $ | — |
Other assets less liabilities | | $ | 543,212 | | $ | (24,198 | ) | | $ | — | | | $ | 519,014 |
| | |
|
| |
|
|
| |
|
|
| |
|
|
Total Net Assets | | $ | 46,071,582 | | $ | 12,293,419 | | | $ | — | | | $ | 58,365,001 |
| | |
|
| |
|
|
| |
|
|
| |
|
|
Net Assets | | | | | | | | | | | | | | |
Class B Shares | | $ | 46,071,582 | | $ | 12,293,419 | | | $ | — | | | $ | 58,365,001 |
| | |
|
| |
|
|
| |
|
|
| |
|
|
Total Net Assets | | $ | 46,071,582 | | $ | 12,293,419 | | | $ | — | | | $ | 58,365,001 |
| | |
|
| |
|
|
| |
|
|
| |
|
|
Share Outstanding | | | | | | | | | | | | | | |
Class B Shares | | | 4,149,791 | | | 1,133,437 | | | | (25,922 | ) | | | 5,257,306 |
Net Asset Value Per Share | | | | | | | | | | | | | | |
Class B Shares | | $ | 11.10 | | $ | 10.85 | | | $ | — | | | $ | 11.10 |
S-12
PRO FORMA COMBINING CONDENSED STATEMENT OF OPERATIONS
FOR THE YEAR ENDED DECEMBER 31, 2005 (UNAUDITED)
| | | | | | | | | | | | | | | | |
| | | DWS
Conservative
Allocation VIP
| | | DWS Income
Allocation VIP
| | | Pro Forma
Adjustments
| | | DWS
Conservative
Allocation VIP
Pro Forma
Combined
| |
Investment Income: | | | | | | | | | | | | | | | | |
Interest and dividend income | | $ | 711,486 | | | $ | 243,050 | | | $ | — | | | $ | 954,536 | |
| | |
|
|
| |
|
|
| |
|
|
| |
|
|
|
Total Investment Income | | | 711,486 | | | | 243,050 | | | | | | | | 954,536 | |
Expenses | | | | | | | | | | | | | | | | |
Management Fees | | | 43,018 | | | | 13,116 | | | | — | | | | 56,134 | |
Record keeping fees | | | 44,325 | | | | 11,265 | | | | (14,374 | )(2) | | | 41,216 | |
Custodian Fees | | | 6,659 | | | | 6,462 | | | | (6,164 | )(2) | | | 6,957 | |
Fund Accounting | | | 61,714 | | | | 45,388 | | | | (60,930 | )(2) | | | 46,172 | |
Distribution Service Fees | | | 71,696 | | | | 21,861 | | | | — | | | | 93,557 | |
Auditing | | | 21,315 | | | | 17,679 | | | | (10,614 | )(2) | | | 28,380 | |
Legal | | | 13,549 | | | | 13,832 | | | | (5,062 | )(2) | | | 22,319 | |
Trustees Fees | | | 511 | | | | 61 | | | | 619 | (2) | | | 1,191 | |
Reports to Shareholders | | | 6,081 | | | | 2,965 | | | | 221 | (2) | | | 9,267 | |
Offering Costs | | | 281 | | | | 587 | | | | — | | | | 868 | |
Other Expenses | | | 743 | | | | 702 | | | | 1,509 | (2) | | | 2,954 | |
| | |
|
|
| |
|
|
| |
|
|
| |
|
|
|
Total expenses before reductions | | | 269,892 | | | | 133,918 | | | | (94,795 | ) | | | 309,015 | |
Expense reductions | | | (54,266 | ) | | | (68,244 | ) | | | 96,282 | (3) | | | (26,228 | ) |
| | |
|
|
| |
|
|
| |
|
|
| |
|
|
|
Expenses, net | | | 215,626 | | | | 65,674 | | | | 1,487 | | | | 282,787 | |
| | |
|
|
| |
|
|
| |
|
|
| |
|
|
|
Net investment income (loss) | | | 495,860 | | | | 177,376 | | | | (1,487 | ) | | | 671,749 | |
| | |
|
|
| |
|
|
| |
|
|
| |
|
|
|
Net Realized and Unrealized Gain (Loss) | | | | | | | | | | | | | | | | |
Net realized gain (loss) on investments, foreign currency related transactions | | | 344,656 | | | | 79,532 | | | | — | | | | 424,188 | |
Net unrealized appreciation (depreciation) on investments, and foreign currency related transactions | | | 667,693 | | | | 127,168 | | | | — | | | | 794,861 | |
| | |
|
|
| |
|
|
| |
|
|
| |
|
|
|
Net increase in net assets from operations | | $ | 1,508,209 | | | $ | 384,076 | | | $ | (1,487 | ) | | $ | 1,890,798 | |
| | |
|
|
| |
|
|
| |
|
|
| |
|
|
|
S-13
Notes to Pro Forma Combining Financial Statements
December 31, 2005
1. These financial statements set forth the unaudited pro forma condensed Statement of Assets and Liabilities as of December 31, 2005, and the unaudited pro forma condensed Statement of Operations for the year ended December 31, 2005 for DWS Conservative Allocation VIP and DWS Income Allocation VIP as adjusted, giving effect to the merger as if it had occurred as of December 31, 2005. These statements have been derived from the books and records utilized in calculating daily net asset value for each fund and have been prepared in accordance with accounting principles generally accepted in the United States of America which require the use of management estimates. Actual results could differ from those estimates.
Basis of Combination
Under the terms of the Plan of Reorganization, the combination will be accounted for by the method of accounting for tax free mergers of investment companies. The acquisitions would be accomplished by an acquisition of the net assets of DWS Income Allocation VIP in exchange for shares of DWS Conservative Allocation VIP at net asset value. Following the acquisition, DWS Conservative Allocation VIP will be the accounting survivor. In accordance with accounting principles generally accepted in the United States of America, the historical cost of investment securities will be carried forward to the surviving fund and the results of operations for pre-combination periods will not be restated.
Portfolio Valuation
Investments in Underlying Portfolios are valued at the net asset value per share of each class of the Underlying Portfolios as of the close of regular trading on the New York Stock Exchange on each day the exchange is open for trading. Investments in Scudder Cash Management QP Trust are valued at their net asset value each day.
Securities and other assets for which market quotations are not readily available or for which the above valuation procedures are deemed not to reflect fair value are valued in a manner that is intended to reflect their fair value as determined in accordance with procedures approved by the Trustees.
Pre-Merger Liquidation of Certain Assets of DWS Income Allocation VIP
Pursuant to the Agreement and Plan of Reorganization, it is expected that approximately 19% of the assets of DWS Income Allocation VIP will be liquidated prior to the merger. Proceeds from the liquidation will be used to acquire securities consistent with the investment objective, policies, restrictions and strategies of DWS Conservative Allocation VIP. The expected liquidation of assets and purchase of securities with the sales proceeds are not reflected in these pro forma financial statements.
S-14
Federal Income Taxes
It is each Fund’s policy to comply with the requirements of the Internal Revenue Code, as amended, which are applicable to regulated investment companies, and to distribute all of their taxable income to shareholders. After the acquisition, DWS Conservative Allocation VIP intends to continue to qualify as a regulated investment company.
2. Represents estimated increase (decrease) in expense resulting from the merger.
3. Represents decreased expense reimbursement due to higher average net assets resulting from the merger.
S-15
Appendix A
Supplement to the currently effective Statement of Additional Information of:
DWS Variable Series II
The following information supplements the section entitled “Borrowing” under “Investment Policies and Techniques” in the Statement of Additional Information:
Borrowing. Each Portfolio will borrow only when the Advisor or a subadvisor believes that borrowing will benefit a Portfolio after taking into account all considerations such as the costs of the borrowing relative to the expected return. DWS High Income VIP may borrow up to 5% of its net assets against called and tendered bonds held by the Portfolio. Any borrowing, including borrowing against called and tendered bonds, is subject to the Portfolio’s fundamental and non-fundamental investment policies, which currently limit borrowings (other than borrowings for temporary or emergency purposes or investment techniques that may be deemed borrowings, such as reverse repurchase agreements or dollar rolls) to 5% of total assets.
Borrowing by the Portfolio will involve special risk considerations. To the extent a Portfolio borrows money, positive or negative performance by a Portfolio’s investments may be magnified. Any gain in the value of securities purchased with borrowed money, or income earned on such securities, that exceeds the interest paid on the amount borrowed would cause the net asset value of a Portfolio’s shares to increase more rapidly than otherwise would be the case. Conversely, any decline in the value of securities purchased, or cost in excess of income earned, would cause the net asset value of a Portfolio’s shares to decrease more rapidly than otherwise would be the case. Borrowed money thus creates an opportunity for greater capital gain but at the same time increases exposure to capital risk. Money borrowed will be subject to interest costs which may or may not be recovered by appreciation of the securities purchased or from income received as a holder of those securities. A Portfolio also may be required to maintain minimum average balances in connection with such borrowing or to pay a commitment or other fee to maintain a line of credit; either of these requirements would increase the cost of borrowing over the stated interest rate.
Please Retain This Supplement for Future Reference
July 3, 2006
Appendix A
STATEMENT OF ADDITIONAL INFORMATION
May 1, 2006
As revised May 23, 2006
CLASS A AND B SHARES
DWS VARIABLE SERIES II
(formerly SCUDDER VARIABLE SERIES II)
222 South Riverside Plaza, Chicago, Illinois 60606
1-800-778-1482
This combined Statement of Additional Information is not a prospectus. It should be read in conjunction with the applicable prospectuses of DWS Variable Series II (the “Fund”) dated May 1, 2006, as amended from time to time. The prospectuses may be obtained without charge from the Fund by calling the toll-free number listed above, and are also available along with other related materials on the Securities and Exchange Commission (“SEC”) Internet Web site (http://www.sec.gov). The prospectuses are also available from Participating Insurance Companies.
DWS Variable Series II offers a choice of 29 portfolios, 25 of which are described herein (each a “Portfolio,” collectively, the “Portfolios”), to holders of certain variable life insurance and variable annuity contracts offered by participating insurance companies (“Participating Insurance Companies”).
The Portfolios described herein are:
DWS Balanced VIP (formerly Scudder Total Return Portfolio)
DWS Blue Chip VIP (formerly Scudder Blue Chip Portfolio)
DWS Core Fixed Income VIP (formerly Scudder Fixed Income Portfolio)
DWS Davis Venture Value VIP (formerly SVS Davis Venture Value Portfolio)
DWS Dreman Financial Services VIP (formerly SVS Dreman Financial Services Portfolio)
DWS Dreman High Return Equity VIP (formerly SVS Dreman High Return Equity Portfolio)
DWS Dreman Small Cap Value VIP (formerly SVS Dreman Small Cap Value Portfolio)
DWS Global Thematic VIP (formerly Scudder Global Blue Chip Portfolio)
DWS Government & Agency Securities VIP (formerly Scudder Government & Agency Securities Portfolio)
DWS High Income VIP (formerly Scudder High Income Portfolio)
DWS International Select Equity VIP (formerly Scudder International Select Equity Portfolio)
DWS Janus Growth & Income VIP (formerly SVS Janus Growth And Income Portfolio)
DWS Janus Growth Opportunities VIP (formerly SVS Janus Growth Opportunities Portfolio)
DWS Large Cap Value VIP (formerly Scudder Large Cap Value Portfolio)
DWS Legg Mason Aggressive Growth VIP (formerly SVS Salomon Aggressive Growth Portfolio)
DWS Mercury Large Cap Core VIP (formerly Scudder Mercury Large Cap Core Portfolio)
DWS MFS Strategic Value VIP (formerly SVS MFS Strategic Value Portfolio)
DWS Mid Cap Growth VIP (formerly Scudder Aggressive Growth Portfolio)
DWS Money Market VIP (formerly Scudder Money Market Portfolio)
DWS Oak Strategic Equity VIP (formerly SVS Oak Strategic Equity Portfolio)
DWS Small Cap Growth VIP (formerly Scudder Small Cap Growth Portfolio)
DWS Strategic Income VIP (formerly Scudder Strategic Income Portfolio)
DWS Technology VIP (formerly Scudder Technology Growth Portfolio)
DWS Templeton Foreign Value VIP (formerly Scudder Templeton Foreign Value Portfolio)
DWS Turner Mid Cap Growth VIP (formerly SVS Turner Mid Cap Growth Portfolio)
TABLE OF CONTENTS
i
INVESTMENT RESTRICTIONS
Except as otherwise indicated, each Portfolio’s investment objective and policies are not fundamental and may be changed without a vote of shareholders. There can be no assurance that a Portfolio’s objective will be met.
If a percentage restriction is adhered to at the time of the investment, a later increase or decrease in percentage beyond the specified limit resulting from a change in values or net assets will not be considered a violation.
The Fund has adopted for each Portfolio certain fundamental investment restrictions that cannot be changed for a Portfolio without approval by a “majority” of the outstanding voting shares of that Portfolio. As defined in the Investment Company Act of 1940, as amended (the “1940 Act”), this means the lesser of the vote of (a) 67% of the shares of a Portfolio present at a meeting where more than 50% of the outstanding shares are present in person or by proxy or (b) more than 50% of the outstanding shares of a Portfolio.
Each Portfolio (except DWS Dreman Financial Services VIP and DWS Technology VIP) is classified as a diversified open-end management investment company. A diversified portfolio may not, with respect to 75% of total assets, invest more than 5% of total assets in the securities of a single issuer or invest in more than 10% of the outstanding voting securities of such issuer.
DWS Dreman Financial Services VIP and DWS Technology VIP are classified as non-diversified open-end management investment companies. A non-diversified portfolio may invest a greater proportion of its assets in the obligations of a small number of issuers, and may be subject to greater risk and substantial losses as a result of changes in the financial condition or the market’s assessment of the issuers. While not limited by the 1940 Act as to the proportion of its assets that it may invest in obligations of a single issuer, each of the foregoing Portfolios intends to comply with the diversification requirements imposed by the Internal Revenue Code of 1986 (the “Code”) for qualification as a regulated investment company.
Each Portfolio may not, as a fundamental policy:
| (1) | borrow money, except as permitted under the 1940 Act, and as interpreted or modified by regulatory authority having jurisdiction, from time to time; |
| (2) | issue senior securities, except as permitted under the 1940 Act, and as interpreted or modified by regulatory authority having jurisdiction, from time to time; |
| (3) | for all Portfolios except DWS Money Market VIP and DWS Technology VIP: concentrate its investments in a particular industry, as that term is used in the 1940 Act, and as interpreted or modified by regulatory authority having jurisdiction, from time to time; |
for DWS Money Market VIP: concentrate its investments in a particular industry, as that term is used in the 1940 Act, and as interpreted or modified by regulatory authority having jurisdiction, from time to time, except that the Portfolio reserves the freedom of action to concentrate in government securities and instruments issued by domestic banks.
for DWS Technology VIP: concentrate its investments in a particular industry, as that term is used in the 1940 Act, and as interpreted or modified by regulatory authority having jurisdiction, from time to time, except that the Portfolio will concentrate its assets in the group of industries constituting the technology sector and may concentrate in one or more industries in the technology sector.
| (4) | engage in the business of underwriting securities issued by others, except to the extent that the Portfolio may be deemed to be an underwriter in connection with the disposition of portfolio securities; |
| (5) | purchase or sell real estate, which term does not include securities of companies which deal in real estate or mortgages or investments secured by real estate or interests therein, except that the Portfolio reserves freedom of action to hold and to sell real estate acquired as a result of the Portfolio’s ownership of securities; |
| (6) | purchase physical commodities or contracts relating to physical commodities; or |
| (7) | make loans except as permitted under the 1940 Act, as amended, and as interpreted or modified by regulatory authority having jurisdiction, from time to time. |
With regard to Restriction (3) above, for purposes of determining the percentage of DWS Money Market VIP’s total assets invested in securities of issuers having their principal business activities in a particular industry, asset-backed securities will be classified based on standard classifications utilized by ratings agencies.
DWS Money Market VIP may not invest more than 50% of it assets in asset-backed securities.
With regard to Restriction (3) above, for purposes of determining the percentage of each Portfolio’s (except DWS Money Market VIP) total assets invested in securities of issuers having their principal business activities in a particular industry, asset-backed securities will be classified as a single industry.
With respect to investment restriction (3) for DWS Money Market VIP, domestic banks include US banks and US branches of foreign banks that are subject to the same regulation as US banks. Domestic banks may also include foreign branches of domestic banks if the investment risk associated with investing in instruments issued by the foreign branch of a domestic bank is the same as investing in instruments issued by the domestic parent. As a result, the Portfolio may be more adversely affected by changes in market or economic conditions and other circumstances affecting the banking industry than it would be if the Portfolio’s assets were not so concentrated.
The Fund has also adopted the following non-fundamental policies, which may be changed or eliminated for each Portfolio by the Fund’s Board of Trustees without a vote of the shareholders:
As a matter of non-fundamental policy, each Portfolio, except DWS Money Market VIP, does not intend to:
| (1) | borrow money in an amount greater than 5% of its total assets, except (i) for temporary or emergency purposes and (ii) by engaging in reverse repurchase agreements, dollar rolls, or other investments or transactions described in the Portfolio’s registration statement which may be deemed to be borrowings; |
| (2) | purchase securities on margin or make short sales, except (i) short sales against the box, (ii) in connection with arbitrage transactions, (iii) for margin deposits in connection with futures contracts, options or other permitted investments, (iv) that transactions in futures contracts and options shall not be deemed to constitute selling securities short, and (v) that the Portfolio may obtain such short-term credits as may be deemed necessary for the clearance of securities transactions; |
| (3) | purchase options, unless the aggregate premiums paid on all such options held by a Portfolio at any time do not exceed 20% of its total assets; or sell put options, if as a result, the aggregate value of the obligations underlying such put options would exceed 50% of its total assets; |
| (4) | enter into futures contracts or purchase options thereon unless immediately after the purchase, the value of the aggregate initial margin with respect to such futures contracts entered into on behalf of a Portfolio and the premium paid for such options on futures contracts does not exceed 5% of the fair market value of a Portfolio’s total assets; provided that in the case of an option that is in-the-money at the time of purchase, the in-the money amount may be excluded in computing the 5% limit; |
| (5) | purchase warrants if as a result, such securities, taken at the lower of cost or market value, would represent more than 5% of the value of a Portfolio’s total assets (for this purpose, warrants acquired in units or attached to securities will be deemed to have no value); and |
| (6) | invest more than 15% of net assets in illiquid securities. |
2
For all portfolios:
| (7) | acquire securities of registered, open-end investment companies or registered unit investment trusts in reliance on Sections 12(d)(1)(F) or 12(d)(1)(G) of the Investment Company Act of 1940, as amended. |
For all portfolios except DWS Core Fixed Income VIP, DWS Government & Agency Securities VIP, DWS High Income VIP, DWS Money Market VIP and DWS Strategic Income VIP:
| (8) | enter into either of reverse repurchase agreements or dollar rolls in an amount greater than 5% of its total assets. |
For all portfolios except DWS Money Market VIP:
| (9) | lend portfolio securities in an amount greater than one third of its total assets. |
For DWS Money Market VIP:
| (10) | borrow money in an amount greater than 5% of its total assets, except for temporary emergency purposes; |
| (11) | lend portfolio securities in an amount greater than 5% of its total assets; and |
| (12) | invest more than 10% of total assets in non-affiliated registered investment companies. |
Concentration. DWS Technology VIP “concentrates,” for purposes of the 1940 Act, its assets in securities of companies in the technology sector which means that at least 25% of its net assets will be invested in these assets at all times. As a result, the Portfolio may be subject to greater market fluctuation than a portfolio which has securities representing a broader range of investment alternatives.
Master-feeder Fund Structure. The Fund’s Board of Trustees has the discretion with respect to each Portfolio to retain the current distribution arrangement for the Portfolio while investing in a master fund in a master-feeder fund structure as described below.
A master-feeder fund structure is one in which a fund (a “feeder fund”), instead of investing directly in a portfolio of securities, invests most or all of its investment assets in a separate registered investment company (the “master fund”) with substantially the same investment objective and policies as the feeder fund. Such a structure permits the pooling of assets of two or more feeder funds, preserving separate identities or distribution channels at the feeder fund level. Based on the premise that certain of the expenses of operating an investment portfolio are relatively fixed, a larger investment portfolio may eventually achieve a lower ratio of operating expenses to average net assets. An existing investment company is able to convert to a feeder fund by selling all of its investments, which involves brokerage and other transaction costs and realization of a taxable gain or loss, or by contributing its assets to the master fund and avoiding transaction costs and, if proper procedures are followed, the realization of taxable gain or loss.
Portfolio Holdings
In addition to the public disclosure of portfolio holdings through required Securities and Exchange Commission (“SEC”) quarterly filings, the portfolios may make their portfolio holdings information publicly available on the DWS Funds Web site as described in the portfolios’ prospectuses. The portfolios do not disseminate non-public information about portfolio holdings except in accordance with policies and procedures adopted by a portfolio.
The portfolios’ procedures permit non-public portfolio holdings information to be shared with Deutsche Asset Management, Inc. and its affiliates (collectively “DeAM”), subadvisors, if any, custodians, independent registered public accounting firms, securities lending agents, financial printers, proxy voting firms and other service providers to a portfolio who require access to this information to fulfill their duties to a portfolio, subject to the requirements described below. This non-public information may also be disclosed to certain mutual fund analysts and rating and tracking agencies, to shareholders in connection with in-kind redemptions, or to other entities if a portfolio has a legitimate business purpose in providing the information, subject to the requirements described below.
3
Prior to any disclosure of a portfolio’s non-public portfolio holdings information to the foregoing types of entities or persons, a person authorized by the portfolios’ Trustees must make a good faith determination in light of the facts then known that a portfolio has a legitimate business purpose for providing the information, that the disclosure is in the best interest of a portfolio, and that the recipient assents or otherwise has a duty to keep the information confidential and to not trade based on the information received while the information remains non-public. No compensation is received by a portfolio or DeAM for disclosing non-public holdings information. Periodic reports regarding these procedures will be provided to the portfolios’ Trustees.
Portfolio holdings information distributed by the trading desks of DeAM or a subadvisor for the purpose of facilitating efficient trading of such securities and receipt of relevant research is not subject to the foregoing requirements. Non-public portfolio holding information does not include portfolio characteristics (other than holdings or subsets of holdings) about each portfolio and information derived therefrom, including, but not limited to, how each portfolio’s investments are divided among various sectors, industries, countries, value and growth stocks, bonds, currencies and cash, types of bonds, bond maturities, duration, bond coupons and bond credit quality ratings so long as a portfolio’s holdings could not be derived from such information.
Registered investment companies that are subadvised by DeAM may be subject to different portfolio holdings disclosure policies, and neither DeAM nor the portfolios’ Trustees exercise control over such policies. In addition, separate account clients of DeAM have access to their portfolio holdings and are not subject to a portfolio’s portfolio holdings disclosure policy. The portfolio holdings of some of the funds subadvised by DeAM and some of the separate accounts managed by DeAM may substantially overlap with the portfolio holdings of a portfolio.
DeAM also manages certain unregistered commingled trusts and creates model portfolios, the portfolio holdings of which may substantially overlap with the portfolio holdings of a portfolio. To the extent that investors in these commingled trusts or recipients of model portfolio holdings information may receive portfolio holdings information of their trust or of a model portfolio on a different basis from that on which portfolio holdings information is made public, DeAM has implemented procedures reasonably designed to encourage such investors and recipients to keep such information confidential, and to prevent those investors from trading on the basis of non-public holdings information.
There is no assurance that a portfolio’s policies and procedures with respect to the disclosure of portfolio holdings information will protect a portfolio from the potential misuse of portfolio holdings information by those in possession of that information.
INVESTMENT POLICIES AND TECHNIQUES
General Investment Objectives and Policies
Two classes of shares of each Portfolio described herein are currently offered through Participating Insurance Companies. Class A shares are offered at net asset value and are not subject to a Rule 12b-1 Distribution Plan. Class B shares are offered at net asset value and are subject to a Rule12b-1 fee.
Descriptions in this Statement of Additional Information of a particular investment practice or technique in which a Portfolio may engage (such as short selling, hedging, etc.) or a financial instrument which a Portfolio may purchase (such as options, forward foreign currency contracts, etc.) are meant to describe the spectrum of investments that Deutsche Investment Management Americas Inc. (“DeIM” or the “Advisor”), in its discretion, might, but is not required to, use in managing each Portfolio’s assets. The Advisor may, in its discretion, at any time employ such practice, technique or instrument for one or more Portfolios but not for all investment companies advised by it. Furthermore, it is possible that certain types of financial instruments or investment techniques described herein may not be available, permissible, economically feasible or effective for their intended purposes in all markets. Certain practices, techniques or instruments may not be principal activities of a Portfolio but, to the extent employed, could from time to time have a material impact on the Portfolio’s performance.
It is possible that certain investment practices and techniques described below may not be permissible for a Portfolio based on its investment restrictions, as described herein, and in the Portfolio’s applicable prospectus.
Each Portfolio has a different investment objective which it pursues through separate investment policies, as described below. The differences in objectives and policies among the Portfolios can be expected to affect the degree of market
4
and financial risk to which each Portfolio is subject and the return of each Portfolio. The investment objectives and policies of each Portfolio may, unless otherwise specifically stated, be changed by the Trustees of the Fund without a vote of the shareholders. There is no assurance that the objectives of any Portfolio will be achieved.
Each Portfolio, except DWS Money Market VIP, may engage in futures, options, swaps and other derivatives transactions in accordance with its respective investment objectives and policies. Each such Portfolio may engage in such transactions if it appears to the Advisor or a Portfolio’s subadvisor (a “Subadvisor”) to be advantageous to do so, in order to pursue its objective, enhance returns, to hedge (i.e., protect) against the effects of fluctuating interest rates and to stabilize the value of its assets. The use of futures, options and other derivatives, and their possible benefits and attendant risks, are discussed below along with information concerning certain other investment policies and techniques.
Portfolio Turnover. The portfolio turnover rates for each Portfolio, other than DWS Money Market VIP, are listed under “Financial Highlights” in the Fund’s Annual Report dated December 31, 2005. Each Portfolio’s average portfolio turnover rate is the ratio of the lesser of sales or purchases to the monthly average value of the portfolio securities owned during the year, excluding all securities with maturities or expiration dates at the time of acquisition of one year or less. Securities with maturities of less than one year are excluded from portfolio turnover rate calculations. Frequency of portfolio turnover will not be a limiting factor should a Portfolio’s Advisor or Subadvisor deems it desirable to purchase or sell securities. Purchases and sales are made for a Portfolio whenever necessary, in management’s opinion, to meet a Portfolio’s objective. Higher portfolio turnover (over 100%) involves correspondingly greater brokerage commissions or other transaction costs. Higher portfolio turnover may result in the realization of greater net short-term capital gains.
The Portfolios do not generally make investments for short-term profits, but are not restricted in policy with regard to portfolio turnover and will make changes in their investment portfolios from time to time as business and economic conditions and market prices may dictate and as its investment policy may require.
Asset-Backed Securities. Asset-backed securities may include pools of mortgages (“mortgage-backed securities”), loans, receivables or other assets. Payment of principal and interest may be largely dependent upon the cash flows generated by the assets backing the securities. Asset-backed securities present certain risks that are not presented by mortgage-backed securities. Primarily, these securities may not have the benefit of any security interest in the related assets. Credit card receivables are generally unsecured and the debtors are entitled to the protection of a number of state and federal consumer credit laws, many of which give such debtors the right to set off certain amounts owed on the credit cards, thereby reducing the balance due. There is the possibility that recoveries on repossessed collateral may not, in some cases, be available to support payments on these securities. Asset-backed securities are often backed by a pool of assets representing the obligations of a number of different parties. To lessen the effect of failures by obligors on underlying assets to make payments, the securities may contain elements of credit support which fall into two categories: (i) liquidity protection, and (ii) protection against losses resulting from ultimate default by an obligor on the underlying assets. Liquidity protection refers to the provision of advances, generally by the entity administering the pool of assets, to ensure that the receipt of payments on the underlying pool occurs in a timely fashion. Protection against losses results from payment of the insurance obligations on at least a portion of the assets in the pool. This protection may be provided through guarantees, policies or letters of credit obtained by the issuer or sponsor from third parties, through various means of structuring the transaction or through a combination of such approaches. A Portfolio will not pay any additional or separate fees for credit support. The degree of credit support provided for each issue is generally based on historical information respecting the level of credit risk associated with the underlying assets. Delinquency or loss in excess of that anticipated or failure of the credit support could adversely affect the return on an investment in such a security. The availability of asset-backed securities may be affected by legislative or regulatory developments. It is possible that such developments may require the Portfolios to dispose of any then existing holdings of such securities. The Portfolios, except DWS Balanced VIP, DWS Core Fixed Income VIP and DWS Money Market VIP, do not intend to invest more than 5% of total assets in asset-backed securities. DWS Balanced VIP and DWS Core Fixed Income VIP currently do not intend to invest more than 25% of total assets in asset-backed securities. DWS Money Market VIP may not invest more than 50% of its assets in asset-backed securities.
Bank Loans. DWS Balanced VIP, DWS High Income VIP and DWS Strategic Income VIP may each invest in bank loans, which are typically senior debt obligations of borrowers (issuers) and as such, are considered to hold a senior position in the capital structure of the borrower. These may include loans which hold the most senior position, that hold an equal ranking with other senior debt, or loans that are, in the judgment of the Advisor, in the category of senior debt of the borrower. This capital structure position generally gives the holders of these loans a priority claim on some or all of the borrower’s assets in the event of a default. In most cases, these loans are either partially or fully collateralized by the
5
assets of a corporation, partnership, limited liability company or other business entity, or by cash flow that the Advisor believes has a market value at the time of acquisition that equals or exceeds the principal amount of the loan. These loans are often issued in connection with recapitalizations, acquisitions, leveraged buy-outs and refinancings. It is important to note that Moody’s and S&P generally rate bank loans a notch or two higher than high yield bonds of the same issuer to reflect their more senior position. A Portfolio may invest in both fixed- and floating-rate loans. In addition, bank loans can trade either as an “assignment” or “participation.” When a Portfolio buys an assignment, it is essentially becoming a party to the bank agreement. The vast majority of all trades are assignments and would therefore generally represent the preponderance of bank loans held by the Portfolio. In certain cases, the Portfolio may buy bank loans on a participation basis, if for example, a Portfolio did not want to become party to the bank agreement. However, in all cases, a Portfolio will not purchase bank loans where Deutsche Bank, or an affiliate, serves as an agent bank.
Participations and assignments involve credit risk, interest rate risk, liquidity risk, and the risk of being a lender. If a Portfolio purchases a participation, it may only be able to enforce its rights through the lender, and may assume the credit risk of both the lender and the borrower.
Investments in loans through direct assignment of a financial institution’s interests with respect to a loan may involve additional risks. For example, if a loan is foreclosed, the purchaser could become part owner of any collateral, and would bear the costs and liabilities associated with owning and disposing of the collateral. In addition, it is at least conceivable that under emerging legal theories of lender liability, a purchaser could be held liable as a co-lender.
In the case of loans administered by a bank or other financial institution that acts as agent for all holders, if assets held by the agent for the benefit of a purchaser are determined to be subject to the claims of the agent’s general creditors, the purchaser might incur certain costs and delays in realizing payment on the loan or loan participation and could suffer a loss of principal or interest.
In the case of loan participations where a bank or other lending institution serves as financial intermediary between a fund and the borrower, if the participation does not shift to the portfolio the direct debtor-creditor relationship with the borrower, SEC interpretations require the portfolio, in some circumstances, to treat both the lending bank or other lending institution and the borrower as issuers for purposes of a Portfolio’s investment policies. Treating a financial intermediary as an issuer of indebtedness may restrict a Portfolio’s ability to invest in indebtedness related to a single financial intermediary, or a group of intermediaries engaged in the same industry, even if the underlying borrowers represent many different companies and industries.
Borrowing. Each Portfolio will borrow only when the Advisor or a subadvisor believes that borrowing will benefit the Portfolio after taking into account considerations such as the costs of the borrowing. Borrowing by each Portfolio will involve special risk considerations. Although the principal of each Portfolio’s borrowings will be fixed, a Portfolio’s assets may change in value during the time a borrowing is outstanding, proportionately increasing exposure to capital risk.
Certificates of Deposit and Bankers’ Acceptances. Certificates of deposit are receipts issued by a depository institution in exchange for the deposit of funds. The issuer agrees to pay the amount deposited plus interest to the bearer of the receipt on the date specified on the certificate. The certificate usually can be traded in the secondary market prior to maturity. Bankers’ acceptances typically arise from short-term credit arrangements designed to enable businesses to obtain funds to finance commercial transactions. Generally, an acceptance is a time draft drawn on a bank by an exporter or an importer to obtain a stated amount of funds to pay for specific merchandise. The draft is then “accepted” by a bank that, in effect, unconditionally guarantees to pay the face value of the instrument on its maturity date. The acceptance may then be held by the accepting bank as an earning asset or it may be sold in the secondary market at the going rate of discount for a specific maturity. Although maturities for acceptances can be as long as 270 days, most acceptances have maturities of six months or less.
Banker’s acceptances are credit instruments evidencing the obligations of a bank to pay a draft drawn on it by a customer. These instruments reflect the obligation both of the bank and of the drawer to pay the face amount of the instrument upon maturity.
Time deposits are non-negotiable deposits maintained in a banking institution for a specified period of time at a stated interest rate. Time deposits which may be held by the Portfolios will not benefit from insurance from the Bank Insurance Fund or the Savings Association Insurance Fund administered by the Federal Deposit Insurance Corporation. Fixed time
6
deposits may be withdrawn on demand by the investor, but may be subject to early withdrawal penalties that vary with market conditions and the remaining maturity of the obligation. Fixed time deposits subject to withdrawal penalties maturing in more than seven calendar days are subject to a Portfolio’s limitation on investments in illiquid securities.
Collateralized Obligations. Subject to its investment objectives and policies, a Portfolio may purchase collateralized obligations, including interest only (“IO”) and principal only (“PO”) securities. A collateralized obligation is a debt security issued by a corporation, trust or custodian, or by a US Government agency or instrumentality, that is collateralized by a portfolio or pool of mortgages, mortgage-backed securities, US Government securities or other assets. The issuer’s obligation to make interest and principal payments is secured by the underlying pool or portfolio of securities. Collateralized obligations issued or guaranteed by a US Government agency or instrumentality, such as the Federal Home Loan Mortgage Corporation, are considered US Government securities. Privately-issued collateralized obligations collateralized by a portfolio of US Government securities are not direct obligations of the US Government or any of its agencies or instrumentalities and are not considered US Government securities. A variety of types of collateralized obligations are available currently and others may become available in the future.
Collateralized obligations, depending on their structure and the rate of prepayments, can be volatile. Some collateralized obligations may not be as liquid as other securities. Since collateralized obligations may be issued in classes with varying maturities and interest rates, the investor may obtain greater predictability of maturity than with direct investments in mortgage-backed securities. Classes with shorter maturities may have lower volatility and lower yield while those with longer maturities may have higher volatility and higher yield. This provides the investor with greater control over the characteristics of the investment in a changing interest rate environment. With respect to interest only and principal only securities, an investor has the option to select from a pool of underlying collateral the portion of the cash flows that most closely corresponds to the investor’s forecast of interest rate movements. These instruments tend to be highly sensitive to prepayment rates on the underlying collateral and thus place a premium on accurate prepayment projections by the investor.
A Portfolio, other than DWS Money Market VIP, may invest in collateralized obligations whose yield floats inversely against a specified index rate. These “inverse floaters” are more volatile than conventional fixed or floating rate collateralized obligations and the yield thereon, as well as the value thereof, will fluctuate in inverse proportion to changes in the index upon which rate adjustments are based. As a result, the yield on an inverse floater will generally increase when market yields (as reflected by the index) decrease and decrease when market yields increase. The extent of the volatility of inverse floaters depends on the extent of anticipated changes in market rates of interest. Generally, inverse floaters provide for interest rate adjustments based upon a multiple of the specified interest index, which further increases their volatility. The degree of additional volatility will be directly proportional to the size of the multiple used in determining interest rate adjustments. Currently, none of the Portfolios intends to invest more than 5% of its net assets in inverse floaters. DWS Money Market VIP does not invest in inverse floaters.
A Portfolio will currently invest in only those collateralized obligations that are fully collateralized and that meet the quality standards otherwise applicable to the Portfolio’s investments. Fully collateralized means that the collateral will generate cash flows sufficient to meet obligations to holders of the collateralized obligations under even the most conservative prepayment and interest rate projections. Thus, the collateralized obligations are structured to anticipate a worst case prepayment condition and to minimize the reinvestment rate risk for cash flows between coupon dates for the collateralized obligations. A worst case prepayment condition generally assumes immediate prepayment of all securities purchased at a premium and zero prepayment of all securities purchased at a discount. Reinvestment rate risk may be minimized by assuming very conservative reinvestment rates and by other means such as by maintaining the flexibility to increase principal distributions in a low interest rate environment. The effective credit quality of the collateralized obligations in such instances is the credit quality of the issuer of the collateral. The requirements as to collateralization are determined by the issuer or sponsor of the collateralized obligation in order to satisfy rating agencies, if rated. Payments of principal and interest on the underlying collateral securities are not passed through directly to the holders of the collateralized obligations as such. Collateralized obligations, depending on their structure and the rate of prepayments, can be volatile. Some collateralized obligations may not be as liquid as other securities.
Collateralized obligations often are issued in two or more classes with varying maturities and stated rates of interest. Because interest and principal payments on the underlying securities are not passed through directly to holders of collateralized obligations, such obligations of varying maturities may be secured by a single portfolio or pool of securities, the payments on which are used to pay interest on each class and to retire successive maturities in sequence. These relationships may in effect “strip” the interest payments from principal payments of the underlying securities and
7
allow for the separate purchase of either the interest or the principal payments. Collateralized obligations are designed to be retired as the underlying securities are repaid. In the event of prepayment on or call of such securities, the class of collateralized obligation first to mature generally will be paid down first. Therefore, although in most cases the issuer of collateralized obligations will not supply additional collateral in the event of such prepayment, there will be sufficient collateral to secure collateralized obligations that remain outstanding. It is anticipated that no more than 5% of a Portfolio’s net assets will be invested in IO and PO securities. Governmentally-issued and privately-issued IO’s and PO’s will be considered illiquid for purposes of a Portfolio’s limitation on illiquid securities, however, the Board of Trustees may adopt guidelines under which governmentally-issued IO’s and PO’s may be determined to be liquid.
Common Stocks. Common stock is issued by companies to raise cash for business purposes and represents a proportionate interest in the issuing companies. Therefore, a Portfolio participates in the success or failure of any company in which it holds stock. The market values of common stock can fluctuate significantly, reflecting the business performance of the issuing company, investor perception and general economic or financial market movements. Despite the risk of price volatility, however, common stocks have historically offered a greater potential for long-term gain on investment, compared to other classes of financial assets, such as bonds or cash equivalents, although there can be no assurance that this will be true in the future.
Convertible Securities. Subject to its investment objectives and policies, each Portfolio (except DWS Money Market VIP) may invest in convertible securities, that is, bonds, notes, debentures, preferred stocks and other securities which are convertible into common stock. Investments in convertible securities can provide an opportunity for capital appreciation and/or income through interest and dividend payments and/or by virtue of their conversion or exchange features.
The convertible securities in which a Portfolio may invest include fixed-income or zero coupon debt securities which may be converted or exchanged at a stated or determinable exchange ratio into underlying shares of common stock including Liquid Yield Option Notes (“LYONs”™). The exchange ratio for any particular convertible security may be adjusted from time to time due to stock splits, dividends, spin-offs, other corporate distributions or scheduled changes in the exchange ratio. Convertible debt securities and convertible preferred stocks, until converted, have general characteristics similar to both debt and equity securities. Although to a lesser extent than with debt securities generally, the market value of convertible securities tends to decline as interest rates increase and, conversely, tends to increase as interest rates decline. In addition, because of the conversion or exchange feature, the market value of convertible securities typically changes as the market value of the underlying common stocks changes, and, therefore, also tends to follow movements in the general market for equity securities. A unique feature of convertible securities is that as the market price of the underlying common stock declines, convertible securities tend to trade increasingly on a yield basis, and so may not experience market value declines to the same extent as the underlying common stock. When the market price of the underlying common stock increases, the prices of the convertible securities tend to rise as a reflection of the value of the underlying common stock, although typically not as much as the underlying common stock. While no securities investments are without risk, investments in convertible securities generally entail less risk than investments in common stock of the same issuer.
Convertible securities often provide for a stream of income (or in the case of zero coupon securities, accretion of income) with generally higher yields than common stocks. Convertible securities generally offer lower yields than non-convertible securities of similar quality because of their conversion or exchange features. Of course, like all debt securities, there can be no assurance of income or principal payments because the issuers of the convertible securities may default on their obligations.
Convertible securities generally are subordinated to other similar but non-convertible securities of the same issuer, although convertible bonds, as corporate debt obligations, enjoy seniority in right of payment to all equity securities, and convertible preferred stock is senior to common stock of the same issuer. However, because of the subordination feature, convertible bonds and convertible preferred stock typically have lower ratings than similar non-convertible securities.
Delayed Delivery Transactions. DWS Balanced VIP, DWS Core Fixed Income VIP, DWS Davis Venture Value VIP , DWS Dreman Financial Services VIP, DWS Dreman High Return Equity, DWS Small Cap Value VIP, DWS Global Thematic VIP, DWS Government & Agency Securities VIP, DWS High Income VIP, DWS Janus Growth & Income VIP, DWS Janus Growth Opportunities VIP, DWS Mercury Large Cap Core VIP, DWS Mid Cap Growth VIP, DWS Oak Strategic Equity VIP, DWS Legg Mason Aggressive Growth VIP, DWS Strategic Income VIP, DWS Technology VIP, DWS Templeton Foreign Value VIP, and DWS Turner Mid Cap Growth VIP may purchase or sell portfolio securities on a when-issued or delayed delivery basis. When-issued or delayed delivery transactions arise when securities
8
are purchased by the Portfolio with payment and delivery to take place in the future in order to secure what is considered to be an advantageous price and yield to the Portfolio at the time of entering into the transaction. When the Portfolio enters into a delayed delivery transaction, it becomes obligated to purchase securities and it has all of the rights and risks attendant to ownership of a security, although delivery and payment occur at a later date. The value of fixed-income securities to be delivered in the future will fluctuate as interest rates vary. At the time a Portfolio makes the commitment to purchase a security on a when-issued or delayed delivery basis, it will record the transaction and reflect the liability for the purchase and the value of the security in determining its net asset value. Likewise, at the time a Portfolio makes the commitment to sell a security on a delayed delivery basis, it will record the transaction and include the proceeds to be received in determining its net asset value; accordingly, any fluctuations in the value of the security sold pursuant to a delayed delivery commitment are ignored in calculating net asset value so long as the commitment remains in effect. The Portfolio generally has the ability to close out a purchase obligation on or before the settlement date, rather than take delivery of the security.
Depositary Receipts. Investments in securities of foreign issuers may be in the form of sponsored or unsponsored American Depositary Receipts (“ADRs”), European Depositary Receipts (“EDRs”), Global Depositary Receipts (“GDRs”), International Depositary Receipts (“IDRs”) and other types of Depositary Receipts (which, together with ADRs, EDRs, GDRs and IDRs are hereinafter referred to as “Depositary Receipts”). Depositary Receipts provide indirect investment in securities of foreign issuers. Prices of unsponsored Depositary Receipts may be more volatile than if they were sponsored by the issuer of the underlying securities. Depositary Receipts may not necessarily be denominated in the same currency as the underlying securities into which they may be converted. In addition, the issuers of the stock of unsponsored Depositary Receipts are not obligated to disclose material information in the United States and, therefore, there may not be a correlation between such information and the market value of the Depositary Receipts. ADRs are Depository Receipts typically issued by a US bank or trust company which evidence ownership of underlying securities issued by a foreign corporation. GDRs, IDRs and other types of Depositary Receipts are typically issued by foreign banks or trust companies, although they also may be issued by United States banks or trust companies, and evidence ownership of underlying securities issued by either a foreign or a United States corporation. Generally, Depositary Receipts in registered form are designed for use in the United States securities markets and Depositary Receipts in bearer form are designed for use in securities markets outside the United States. For purposes of a Portfolio’s investment policies, a Portfolio’s investments in ADRs, GDRs and other types of Depositary Receipts will be deemed to be investments in the underlying securities. Depositary Receipts, including those denominated in US dollars, will be subject to foreign currency exchange rate risk. However, by investing in US dollar-denominated ADRs rather than directly in foreign issuers’ stock, a Portfolio avoids currency risks during the settlement period. In general, there is a large, liquid market in the United States for most ADRs. However, certain Depositary Receipts may not be listed on an exchange and therefore may be illiquid securities.
Direct Debt Instruments. Direct debt instruments are interests in amounts owed by a corporate, governmental or other borrower to lenders (direct loans), to suppliers of goods or services (trade claims or other receivables) or to other parties. DWS Balanced VIP, DWS High Income VIP and DWS Strategic Income VIP may invest in all types of direct debt investments, but among these investments each Portfolio currently intends to invest primarily in direct loans and trade claims.
When a Portfolio participates in a direct loan it will be lending money directly to an issuer. Direct loans generally do not have an underwriter or agent bank, but instead, are negotiated between a company’s management team and a lender or group of lenders. Direct loans typically offer better security and structural terms than other types of high yield securities. Direct debt obligations are often the most senior-obligations in an issuer’s capital structure or are well-collateralized so that overall risk is lessened.
Trade claims are unsecured rights of payment arising from obligations other than borrowed funds. Trade claims include vendor claims and other receivables that are adequately documented and available for purchase from high yield broker-dealers. Trade claims typically may sell at a discount. In addition to the risks otherwise associated with low-quality obligations, trade claims have other risks, including the possibility that the amount of the claim may be disputed by the obligor. Trade claims normally would be considered illiquid and pricing can be volatile.
Direct debt instruments involve a risk of loss in case of default or insolvency of the borrower. A Portfolio will rely primarily upon the creditworthiness of the borrower and/or the collateral for payment of interest and repayment of principal. The value of a Portfolio’s investments may be adversely affected if scheduled interest or principal payments are not made. Because most direct loans will be secured, there will be a smaller risk of loss with direct loans than with an
9
investment in unsecured high yield bonds or trade claims. Indebtedness of borrowers whose creditworthiness is poor involves substantially greater risks and may be highly speculative. Borrowers that are in bankruptcy or restructuring may never pay off their indebtedness or may pay only a small fraction of the amount owed. Investments in direct debt instruments also involve interest rate risk and liquidity risk. However, interest rate risk is lessened by the generally short-term nature of direct debt instruments and their interest rate structure, which typically floats. To the extent the direct debt instruments in which a Portfolio invests are considered illiquid, the lack of a liquid secondary market (1) will have an adverse impact on the value of such instruments, (2) will have an adverse impact on the Portfolio’s ability to dispose of them when necessary to meet the Portfolio’s liquidity needs or in response to a specific economic event, such as a decline in creditworthiness of the issuer, and (3) may make it more difficult for the Portfolio to assign a value of these instruments for purposes of valuing the Portfolio’s portfolio and calculating its net asset value. In order to lessen liquidity risk, each Portfolio anticipates investing primarily in direct debt instruments that are quoted and traded in the high yield market and will not invest in these instruments if it would cause more than 15% of the Portfolio’s net assets to be illiquid. Trade claims may also present a tax risk to a Portfolio. The Portfolios will not invest in trade claims if it affects the Portfolio’s qualification as a regulated investment company under Subchapter M of the Internal Revenue Code.
Foreign Fixed-Income Securities. Since most foreign fixed-income securities are not rated, a Portfolio will invest in foreign fixed-income securities based upon the Advisor’s or subadvisor’s analysis without relying on published ratings. Since such investments will be based upon the Advisor or subadvisor’s analysis rather than upon published ratings, achievement of a Portfolio’s goals may depend more upon the abilities of the Advisor or subadvisor than would otherwise be the case.
The value of the foreign fixed-income securities held by a Portfolio, and thus the net asset value of the Portfolio’s shares, generally will fluctuate with (a) changes in the perceived creditworthiness of the issuers of those securities, (b) movements in interest rates, and (c) changes in the relative values of the currencies in which a Portfolio’s investments in fixed-income securities are denominated with respect to the US Dollar. The extent of the fluctuation will depend on various factors, such as the average maturity of a Portfolio’s investments in foreign fixed-income securities, and the extent to which a Portfolio hedges against its interest rate, credit and currency exchange rate risks. Many of the foreign fixed-income obligations in which a Portfolio will invest will have long maturities. A longer average maturity generally is associated with a higher level of volatility in the market value of such securities in response to changes in market conditions.
Investment in sovereign debt, including Brady Bonds, can involve a high degree of risk. The governmental entity that controls the repayment of sovereign debt may not be able or willing to repay the principal and/or interest when due in accordance with the terms of such debt. A governmental entity’s willingness or ability to repay principal and interest due in a timely manner may be affected by, among other factors, its cash flow situation, the extent of its foreign reserves, the availability of sufficient foreign exchange on the date a payment is due, the relative size of the debt service burden to the economy as a whole, the governmental entity’s policy toward the International Monetary Fund, and the political constraints to which a governmental entity may be subject. Governmental entities may also be dependent on expected disbursements from foreign governments, multilateral agencies and others abroad to reduce principal and interest arrearages on their debt. The commitment on the part of these governments, agencies and others to make such disbursements may be conditioned on a governmental entity’s implementation of economic reforms and/or economic performance and the timely service of such debtor’s obligations. Failure to implement such reforms, achieve such levels of economic performance or repay principal or interest when due may result in the cancellation of such third parties commitments to lend funds to the governmental entity, which may further impair such debtor’s ability or willingness to service its debts in a timely manner. Consequently, governmental entities may default on their sovereign debt. Holders of sovereign debt may be requested to participate in the rescheduling of such debt and to extend further loans to governmental entities. There is no bankruptcy proceeding by which sovereign debt on which governmental entities have defaulted may be collected in whole or in part.
Brady Bonds are debt securities issued under a plan implemented to allow debtor nations to restructure their outstanding commercial bank indebtedness. Foreign governmental issuers of debt or the governmental authorities that control the repayment of the debt may be unable or unwilling to repay principal or pay interest when due. In the event of default, there may be limited or no legal recourse in that, generally, remedies for defaults must be pursued in the courts of the defaulting party. Political conditions, especially a sovereign entity’s willingness to meet the terms of its fixed-income securities, are of considerable significance. Also, there can be no assurance that the holders of commercial bank loans to the same sovereign entity may not contest payments to the holders of sovereign debt in the event of default under commercial bank loan agreements. In addition, there is no bankruptcy proceeding with respect to sovereign debt on
10
which a sovereign has defaulted, and a Portfolio may be unable to collect all or any part of its investment in a particular issue.
Foreign investment in certain sovereign debt is restricted or controlled to varying degrees, including requiring governmental approval for the repatriation of income, capital or proceeds of sales by foreign investors. These restrictions or controls may at times limit or preclude foreign investment in certain sovereign debt or increase the costs and expenses of a Portfolio. A significant portion of the sovereign debt in which a Portfolio may invest is issued as part of debt restructuring and such debt is to be considered speculative. There is a history of defaults with respect to commercial bank loans by public and private entities issuing Brady Bonds. All or a portion of the interest payments and/or principal repayment with respect to Brady Bonds may be uncollateralized.
Foreign Investment. Foreign securities are normally denominated and traded in foreign currencies. As a result, the value of the fund’s foreign investments and the value of its shares may be affected favorably or unfavorably by changes in currency exchange rates relative to the US dollar. There may be less information publicly available about a foreign issuer than about a US issuer, and foreign issuers may not be subject to accounting, auditing and financial reporting standards and practices comparable to those in the US. The securities of some foreign issuers are less liquid and at times more volatile than securities of comparable US issuers. Foreign brokerage commissions and other fees are also generally higher than in the US. Foreign settlement procedures and trade regulations may involve certain risks (such as delay in payment or delivery of securities or in the recovery of the fund’s assets held abroad) and expenses not present in the settlement of investments in US markets. Payment for securities without delivery may be required in certain foreign markets.
In addition, foreign securities may be subject to the risk of nationalization or expropriation of assets, imposition of currency exchange controls or restrictions on the repatriation of foreign currency, confiscatory taxation, political or financial instability and diplomatic developments which could affect the value of the fund’s investments in certain foreign countries. Governments of many countries have exercised and continue to exercise substantial influence over many aspects of the private sector through the ownership or control of many companies, including some of the largest in these countries. As a result, government actions in the future could have a significant effect on economic conditions which may adversely affect prices of certain portfolio securities. There is also generally less government supervision and regulation of stock exchanges, brokers, and listed companies than in the US. Dividends or interest on, or proceeds from the sale of, foreign securities may be subject to foreign withholding taxes, and special US tax considerations may apply. Moreover, foreign economies may differ favorably or unfavorably from the US economy in such respects as growth of gross national product, rate of inflation, capital reinvestment, resource self-sufficiency and balance of payments position.
Legal remedies available to investors in certain foreign countries may be more limited than those available with respect to investments in the US or in other foreign countries. The laws of some foreign countries may limit the fund’s ability to invest in securities of certain issuers organized under the laws of those foreign countries.
Of particular importance, many foreign countries are heavily dependent upon exports, particularly to developed countries, and, accordingly, have been and may continue to be adversely affected by trade barriers, managed adjustments in relative currency values, and other protectionist measures imposed or negotiated by the US and other countries with which they trade. These economies also have been and may continue to be negatively impacted by economic conditions in the US and other trading partners, which can lower the demand for goods produced in those countries.
The risks described above, including the risks of nationalization or expropriation of assets, typically are increased in connection with investments in “emerging markets.” For example, political and economic structures in these countries may be in their infancy and developing rapidly, and such countries may lack the social, political and economic stability characteristic of more developed countries (including amplified risk of war and terrorism). Certain of these countries have in the past failed to recognize private property rights and have at times nationalized and expropriated the assets of private companies. Investments in emerging markets may be considered speculative.
The currencies of certain emerging market countries have experienced devaluations relative to the US dollar, and future devaluations may adversely affect the value of assets denominated in such currencies. In addition, currency hedging techniques may be unavailable in certain emerging market countries. Many emerging market countries have experienced substantial, and in some periods extremely high, rates of inflation or deflation for many years, and future inflation may adversely affect the economies and securities markets of such countries.
11
In addition, unanticipated political or social developments may affect the value of investments in emerging markets and the availability of additional investments in these markets. Any change in the leadership or politics of emerging market countries, or the countries that exercise a significant influence over those countries, may halt the expansion of or reverse the liberalization of foreign investment policies now occurring and adversely affect existing investment opportunities. The small size, limited trading volume and relative inexperience of the securities markets in these countries may make investments in securities traded in emerging markets illiquid and more volatile than investments in securities traded in more developed countries. For example, limited market size may cause prices to be unduly influenced by traders who control large positions. In addition, the fund may be required to establish special custodial or other arrangements before making investments in securities traded in emerging markets. There may be little financial or accounting information available with respect to issuers of emerging market securities, and it may be difficult as a result to assess the value of prospects of an investment in such securities.
The risk also exists that an emergency situation may arise in one or more emerging markets as a result of which trading of securities may cease or may be substantially curtailed and prices for a fund’s securities in such markets may not be readily available. A fund may suspend redemption of its shares for any period during which an emergency exists, as determined by the SEC. Accordingly if a fund believes that appropriate circumstances exist, it will promptly apply to the SEC for a determination that an emergency is present. During the period commencing from a fund’s identification of such condition until the date of the SEC action, a fund’s securities in the affected markets will be valued at fair value determined in good faith by or under the direction of a fund’s Board.
Certain of the foregoing risks may also apply to some extent to securities of US issuers that are denominated in foreign currencies or that are traded in foreign markets, or securities of US issuers having significant foreign operations.
High Yield, High Risk Bonds. Certain Portfolios may also purchase debt securities which are rated below investment-grade (commonly referred to as “junk bonds”), that is, rated below Baa by Moody’s or below BBB by S&P or judged to be of equivalent quality as determined by the Advisor or subadvisor. These securities usually entail greater risk (including the possibility of default or bankruptcy of the issuers of such securities), generally involve greater volatility of price and risk to principal and income, and may be less liquid, than securities in the higher rating categories. The lower the ratings of such debt securities, the more their risks render them like equity securities. Securities rated D may be in default with respect to payment of principal or interest. See the Appendix to this Statement of Additional Information for a more complete description of the ratings assigned by ratings organizations and their respective characteristics.
Issuers of such high yielding securities often are highly leveraged and may not have available to them more traditional methods of financing. Therefore, the risk associated with acquiring the securities of such issuers generally is greater than is the case with higher rated securities. For example, during an economic downturn or a sustained period of rising interest rates, highly leveraged issuers of high yield securities may experience financial stress. During such periods, such issuers may not have sufficient revenues to meet their interest payment obligations. The issuer’s ability to service its debt obligations may also be adversely affected by specific corporate developments, or the issuer’s inability to meet specific projected business forecasts, or the unavailability of additional financing. The risk of loss from default by the issuer is significantly greater for the holders of high yield securities because such securities are generally unsecured and are often subordinated to other creditors of the issuer. Prices and yields of high yield securities will fluctuate over time and, during periods of economic uncertainty, volatility of high yield securities may adversely affect a Portfolio’s net asset value. In addition, investments in high yield zero coupon or pay-in-kind bonds, rather than income-bearing high yield securities, may be more speculative and may be subject to greater fluctuations in value due to changes in interest rates.
A Portfolio may have difficulty disposing of certain high yield (high risk) securities because they may have a thin trading market. Because not all dealers maintain markets in all high yield securities, a Portfolio anticipates that such securities could be sold only to a limited number of dealers or institutional investors. The lack of a liquid secondary market may have an adverse effect on the market price and a Portfolio’s ability to dispose of particular issues and may also make it more difficult for a Portfolio to obtain accurate market quotations for purposes of valuing a Portfolio’s assets. Market quotations generally are available on many high yield issues only from a limited number of dealers and may not necessarily represent firm bids of such dealers or prices for actual sales. Adverse publicity and investor perceptions may decrease the values and liquidity of high yield securities. These securities may also involve special registration responsibilities, liabilities and costs, and liquidity and valuation difficulties.
Credit quality in the high-yield securities market can change suddenly and unexpectedly, and even recently-issued credit ratings may not fully reflect the actual risks posed by a particular high-yield security. For these reasons, it is generally
12
the policy of the Advisor and Subadvisors not to rely exclusively on ratings issued by established credit rating agencies, but to supplement such ratings with their own independent and ongoing review of credit quality. The achievement of a Portfolio’s investment objective by investment in such securities may be more dependent on the Advisor’s or Subadvisor’s credit analysis than is the case for higher quality bonds. Should the rating of a portfolio security be downgraded, the Advisor or Subadvisor will determine whether it is in the best interests of the Portfolio to retain or dispose of such security.
Prices for below investment-grade securities may be affected by legislative and regulatory developments. Also, Congress has from time to time considered legislation which would restrict or eliminate the corporate tax deduction for interest payments in these securities and regulate corporate restructurings. Such legislation may significantly depress the prices of outstanding securities of this type.
DWS Core Fixed Income VIP will not invest more than 5% of its net assets in junk bonds.
Interfund Borrowing and Lending Program. The Fund has received exemptive relief from the SEC which permits a Portfolio to participate in an interfund lending program among certain investment companies advised by the Advisor. The interfund lending program allows the participating portfolios to borrow money from and loan money to each other for temporary or emergency purposes. The program is subject to a number of conditions designed to ensure fair and equitable treatment of all participating funds, including the following: (1) no Portfolio may borrow money through the program unless it receives a more favorable interest rate than a rate approximating the lowest interest rate at which bank loans would be available to any of the participating portfolio under a loan agreement; and (2) no Portfolio may lend money through the program unless it receives a more favorable return than that available from an investment in repurchase agreements and, to the extent applicable, money market cash sweep arrangements. In addition, a Portfolio may participate in the program only if and to the extent that such participation is consistent with the Portfolio’s investment objectives and policies (for instance, money market funds would normally participate only as lenders and tax exempt funds only as borrowers). Interfund loans and borrowings may extend overnight, but could have a maximum duration of seven days. Loans may be called on one day’s notice. A Portfolio may have to borrow from a bank at a higher interest rate if an interfund loan is called or not renewed. Any delay in repayment to a lending Portfolio could result in a lost investment opportunity or additional costs. The program is subject to the oversight and periodic review of the Boards of the participating funds. Borrowings through the interfund lending program are subject to each Portfolio’s policies on borrowing.
Investment Company Securities. Each Portfolio may acquire securities of other investment companies to the extent consistent with its investment objective and policies and subject to the limitations of the 1940 Act. The Portfolio will indirectly bear its proportionate share of any management fees and other expenses paid by such other investment companies. For example, a Portfolio may invest in a variety of investment companies which seek to track the composition and performance of specific indexes or a specific portion of an index. These index-based investments hold substantially all of their assets in securities representing their specific index or a specific portion of an index. Accordingly, the main risk of investing in index-based investments is the same as investing in a portfolio of equity securities comprising the index. The market prices of index-based investments will fluctuate in accordance with both changes in the market value of their underlying portfolio securities and due to supply and demand for the instruments on the exchanges on which they are traded (which may result in their trading at a discount or premium to their NAVs). Index-based investments may not replicate exactly the performance of their specified index because of transaction costs and because of the temporary unavailability of certain component securities of the index.
Examples of index-based investments include:
SPDRs®: SPDRs, an acronym for “Standard & Poor’s Depositary Receipts,” are based on the S&P 500 Composite Stock Price Index. They are issued by the SPDR Trust, a unit investment trust that holds shares of substantially all the companies in the S&P 500 in substantially the same weighting and seeks to closely track the price performance and dividend yield of the Index.
MidCap SPDRs®: MidCap SPDRs are based on the S&P MidCap 400 Index. They are issued by the MidCap SPDR Trust, a unit investment trust that holds a portfolio of securities consisting of substantially all of the common stocks in the S&P MidCap 400 Index in substantially the same weighting and seeks to closely track the price performance and dividend yield of the Index.
13
Select Sector SPDRs®: Select Sector SPDRs are based on a particular sector or group of industries that are represented by a specified Select Sector Index within the Standard & Poor’s Composite Stock Price Index. They are issued by The Select Sector SPDR Trust, an open-end management investment company with nine portfolios that each seeks to closely track the price performance and dividend yield of a particular Select Sector Index.
DIAMONDSSM: DIAMONDS are based on the Dow Jones Industrial AverageSM. They are issued by the DIAMONDS Trust, a unit investment trust that holds a portfolio of all the component common stocks of the Dow Jones Industrial Average and seeks to closely track the price performance and dividend yield of the Dow.
Nasdaq-100 Shares: Nasdaq-100 Shares are based on the Nasdaq 100 Index. They are issued by the Nasdaq-100 Trust, a unit investment trust that holds a portfolio consisting of substantially all of the securities, in substantially the same weighting, as the component stocks of the Nasdaq-100 Index and seeks to closely track the price performance and dividend yield of the Index.
WEBsSM: WEBs, an acronym for “World Equity Benchmark Shares,” are based on 17 country-specific Morgan Stanley Capital International Indexes. They are issued by the WEBs Index Fund, Inc., an open-end management investment company that seeks to generally correspond to the price and yield performance of a specific Morgan Stanley Capital International Index.
Investment-Grade Bonds. “Investment-grade” bonds are those rated Aaa, Aa, A or Baa by Moody’s or AAA, AA, A or BBB by S&P or, if unrated, judged to be of equivalent quality as determined by the Advisor or a Subadvisor. Moody’s considers bonds it rates Baa to have speculative elements as well as investment-grade characteristics. To the extent that a Portfolio invests in higher-grade securities, a Portfolio will not be able to avail itself of opportunities for higher income which may be available at lower grades.
Investment of Uninvested Cash Balances. Each Portfolio may have cash balances that have not been invested in portfolio securities (“Uninvested Cash”). Uninvested Cash may result from a variety of sources, including dividends or interest received from portfolio securities, unsettled securities transactions, reserves held for investment strategy purposes, scheduled maturity of investments, liquidation of investment securities to meet anticipated redemptions and dividend payments, and new cash received from investors. Uninvested Cash may be invested directly in money market instruments or other short-term debt obligations. Pursuant to an Exemptive Order issued by the SEC, each Portfolio (except DWS Money Market VIP) may use Uninvested Cash to purchase shares of affiliated funds including money market funds, short-term bond funds and Cash Management QP Trust or one or more future entities for which DeIM acts as trustee or investment advisor that operate as cash management investment vehicles and that are excluded from the definition of investment company pursuant to Section 3(c)(1) or 3(c)(7) of the 1940 Act (collectively, the “Central Funds”) in excess of the limitations of Section 12(d)(1) of the 1940 Act. Investment by each Portfolio in shares of the Central Funds will be in accordance with the Portfolio’s investment policies and restrictions as set forth in its registration statement. Currently, DWS Money Market VIP does not intend to invest in Central Funds.
Certain of the Central Funds comply with Rule 2a-7 under the Act. The other Central Funds are or will be short-term bond funds that invest in fixed-income securities and maintain a dollar-weighted average maturity of three years or less. Each of the Central Funds will be managed specifically to maintain a highly liquid portfolio, and access to them will enhance each Portfolio’s ability to manage Uninvested Cash.
Each Portfolio will invest Uninvested Cash in Central Funds only to the extent that each Portfolio’s aggregate investment in the Central Funds does not exceed 25% of its total assets (except DWS Core Fixed Income VIP cannot exceed 20% of its total assets) in shares of the Central Funds. Purchase and sales of shares of Central Funds are made at net asset value.
Lending of Portfolio Securities. Each Portfolio (with the exception of DWS Money Market VIP ) may lend its investment securities to approved institutional borrowers who need to borrow securities in order to complete certain transactions, such as covering short sales, avoiding failures to deliver securities or completing arbitrage operations. By lending their investment securities, the Portfolios attempt to increase their net investment income through the receipt of interest on the loan. Any gain or loss in the market price of the securities loaned that might occur during the term of the loan would belong to a Portfolio. A Portfolio may lend its investment securities so long as the terms, structure and the aggregate amount of such loans are not inconsistent with the 1940 Act or the rules and regulations or interpretations of the SEC thereunder, which currently require that (a) the borrower pledge and maintain with a Portfolio collateral consisting of liquid, unencumbered assets having a value at all times not less than 100% of the value of the securities
14
loaned, (b) the borrower add to such collateral whenever the price of the securities loaned rises (i.e., the borrower “marks to the market” on a daily basis), (c) the loan be made subject to termination by a Portfolio at any time, and (d) a Portfolio receives reasonable interest on the loan (which may include the Portfolio investing any cash collateral in interest bearing short-term investments), and distributions on the loaned securities and any increase in their market value. There may be risks of delay in recovery of the securities or even loss of rights in the collateral should the borrower of the securities fail financially. However, loans will be made only to borrowers selected by a Portfolio’s delegate after a commercially reasonable review of relevant facts and circumstances, including the creditworthiness of the borrower.
At the present time, the staff of the SEC does not object if an investment company pays reasonable negotiated fees in connection with loaned securities, so long as such fees are set forth in a written contract and approved by the investment company’s Board of Trustees/Directors. In addition, voting rights may pass with the loaned securities, but if a material event occurs affecting an investment on loan, the loan must be called and the securities voted. Pursuant to an exemptive order granted by the SEC, cash collateral received by a Portfolio may be invested in a money market fund managed by the Advisor or a subadvisor (or one of its affiliates).
Maintenance of $1.00 Net Asset Value, Credit Quality and Portfolio Maturity. DWS Money Market VIP effects sales, redemptions and repurchases at the net asset value per share, normally $1.00. In fulfillment of their responsibilities under Rule 2a-7 of the 1940 Act, the Fund’s Board has approved policies established by the Portfolio’s Advisor reasonably calculated to prevent the Fund’s net asset value per share from deviating from $1.00 except under unusual or extraordinary circumstances and the Fund’s Board will periodically review the Advisor’s operations under such policies at regularly scheduled Board meetings. Those policies include a weekly monitoring by the Advisor of unrealized gains and losses in the Portfolio’s portfolio, and when necessary, in an effort to avoid deviation, taking corrective action, such as adjusting the maturity of the portfolio, or, if possible, realizing gains or losses to offset in part unrealized losses or gains. The result of those policies may be that the yield on shares of the Portfolio will be lower than would be the case if the policies were not in effect. Such policies also provide for certain action to be taken with respect to portfolio securities which experience a downgrade in rating or suffer a default.
Non-Diversified Portfolios. DWS Dreman Financial Services VIP and DWS Technology VIP are each classified as a “non-diversified” portfolio so that each will be able to invest to a greater degree in the securities of a single issuer, subject to the diversification requirements of Subchapter M of the Code applicable to the Portfolio. This allows each Portfolio, as to 50% of its assets, to invest more than 5% of its assets, but not more than 25%, in the securities of an individual foreign government or corporate issuer. Since a Portfolio may invest a relatively high percentage of its assets in the securities (i.e., these funds purchase stock) of a limited number of issuers, a Portfolio may be more susceptible to any single economic, political or regulatory occurrence than a diversified portfolio.
Privatized Enterprises. Investments in foreign securities may include securities issued by enterprises that have undergone or are currently undergoing privatization. The governments of certain foreign countries have, to varying degrees, embarked on privatization programs contemplating the sale of all or part of their interests in state enterprises. A Portfolio’s investments in the securities of privatized enterprises may include privately negotiated investments in a government or state-owned or controlled company or enterprise that has not yet conducted an initial equity offering, investments in the initial offering of equity securities of a state enterprise or former state enterprise and investments in the securities of a state enterprise following its initial equity offering.
In certain jurisdictions, the ability of foreign entities, such as a Portfolio, to participate in privatizations may be limited by local law, or the price or terms on which a Portfolio may be able to participate may be less advantageous than for local investors. Moreover, there can be no assurance that governments that have embarked on privatization programs will continue to divest their ownership of state enterprises, that proposed privatizations will be successful or that governments will not re-nationalize enterprises that have been privatized.
In the case of the enterprises in which a Portfolio may invest, large blocks of the stock of those enterprises may be held by a small group of stockholders, even after the initial equity offerings by those enterprises. The sale of some portion or all of those blocks could have an adverse effect on the price of the stock of any such enterprise.
Prior to making an initial equity offering, most state enterprises or former state enterprises go through an internal reorganization or management. Such reorganizations are made in an attempt to better enable these enterprises to compete in the private sector. However, certain reorganizations could result in a management team that does not function as well as the enterprise’s prior management and may have a negative effect on such enterprise. In addition, the privatization of
15
an enterprise by its government may occur over a number of years, with the government continuing to hold a controlling position in the enterprise even after the initial equity offering for the enterprise.
Prior to privatization, most of the state enterprises in which a Portfolio may invest enjoy the protection of and receive preferential treatment from the respective sovereigns that own or control them. After making an initial equity offering these enterprises may no longer have such protection or receive such preferential treatment and may become subject to market competition from which they were previously protected. Some of these enterprises may not be able to effectively operate in a competitive market and may suffer losses or experience bankruptcy due to such competition.
Real Estate Investment Trusts (REITs). Certain Portfolios may invest in REITs. REITs are sometimes informally characterized as equity REITs, mortgage REITs and hybrid REITs. Investment in REITs may subject the Portfolio to risks associated with the direct ownership of real estate, such as decreases in real estate values, overbuilding, increased competition and other risks related to local or general economic conditions, increases in operating costs and property taxes, changes in zoning laws, casualty or condemnation losses, possible environmental liabilities, regulatory limitations on rent and fluctuations in rental income. Equity REITs generally experience these risks directly through fee or leasehold interests, whereas mortgage REITs generally experience these risks indirectly through mortgage interests, unless the mortgage REIT forecloses on the underlying real estate. Changes in interest rates may also affect the value of the Portfolio’s investment in REITs. For instance, during periods of declining interest rates, certain mortgage REITs may hold mortgages that the mortgagors elect to prepay, which prepayment may diminish the yield on securities issued by those REITs.
Certain REITs have relatively small market capitalization, which may tend to increase the volatility of the market price of their securities. Furthermore, REITs are dependent upon specialized management skills, have limited diversification and are, therefore, subject to risks inherent in operating and financing a limited number of projects. REITs are also subject to heavy cash flow dependency, defaults by borrowers and the possibility of failing to qualify for tax-free pass-through of income under the Code and to maintain exemption from the registration requirements of the 1940 Act. By investing in REITs indirectly through the Portfolio, a shareholder will bear not only his or her proportionate share of the expenses of the Portfolio, but also, indirectly, similar expenses of the REITs. In addition, REITs depend generally on their ability to generate cash flow to make distributions to shareholders.
Repurchase Agreements. Each Portfolio may invest in repurchase agreements pursuant to its investment guidelines. In a repurchase agreement, the Portfolio acquires ownership of a security and simultaneously commits to resell that security to the seller, typically a bank or broker/dealer.
A repurchase agreement provides a means for a Portfolio to earn income on funds for periods as short as overnight. It is an arrangement under which the purchaser (i.e., the Portfolio) acquires a security (“Obligation”) and the seller agrees, at the time of sale, to repurchase the Obligation at a specified time and price. Securities subject to a repurchase agreement are held in a segregated account and, as described in more detail below, the value of such securities is kept at least equal to the repurchase price on a daily basis. The repurchase price may be higher than the purchase price, the difference being income to a Portfolio, or the purchase and repurchase prices may be the same, with interest at a stated rate due to a Portfolio together with the repurchase price upon repurchase. In either case, the income to a Portfolio is unrelated to the interest rate on the Obligation itself. Obligations will be held by the custodian or in the Federal Reserve Book Entry System.
It is not clear whether a court would consider the Obligation purchased by a Portfolio subject to a repurchase agreement as being owned by a Portfolio or as being collateral for a loan by a Portfolio to the seller. In the event of the commencement of bankruptcy or insolvency proceedings with respect to the seller of the Obligation before repurchase of the Obligation under a repurchase agreement, a Portfolio may encounter delay and incur costs before being able to sell the security. Delays may involve loss of interest or decline in price of the Obligation. If the court characterizes the transaction as a loan and a Portfolio has not perfected a security interest in the Obligation, a Portfolio may be required to return the Obligation to the seller’s estate and be treated as an unsecured creditor of the seller. As an unsecured creditor, a Portfolio would be at risk of losing some or all of the principal and income involved in the transaction. As with any unsecured debt Obligation purchased for a Portfolio, the Advisor or a subadvisor seeks to reduce the risk of loss through repurchase agreements by analyzing the creditworthiness of the obligor, in this case the seller of the Obligation. Apart from the risk of bankruptcy or insolvency proceedings, there is also the risk that the seller may fail to repurchase the Obligation, in which case a Portfolio may incur a loss if the proceeds to a Portfolio of the sale to a third party are less than the repurchase price. However, if the market value (including interest) of the Obligation subject to the repurchase
16
agreement becomes less than the repurchase price (including interest), a Portfolio will direct the seller of the Obligation to deliver additional securities so that the market value (including interest) of all securities subject to the repurchase agreement will equal or exceed the repurchase price.
Reverse Repurchase Agreements. Each Portfolio (except DWS Money Market VIP) may enter into “reverse repurchase agreements,” which are repurchase agreements in which a Portfolio, as the seller of the securities, agrees to repurchase such securities at an agreed time and price. Each Portfolio maintains a segregated account in connection with outstanding reverse repurchase agreements. A Portfolio will enter into reverse repurchase agreements only when the Advisor or Subadvisor believes that the interest income to be earned from the investment of the proceeds of the transaction will be greater than the interest expense of the transaction. Such transactions may increase fluctuations in the market value of Portfolio assets and its yield.
Section 4(2) Paper. Subject to its investment objectives and policies, each Portfolio may invest in commercial paper issued under the Securities Act of 1933 in reliance on the exemption from registration afforded by Section 3(a)(3) thereof. Such commercial paper may be issued only to finance current transactions and must mature in nine months or less. Trading of such commercial paper is conducted primarily by institutional investors through investment dealers, and individual investor participation in the commercial paper market is very limited. A Portfolio also may invest in commercial paper issued in reliance on the so-called “private placement” exemption from registration afforded by Section 4(2) of the Securities Act of 1933 (“Section 4(2) paper”). Section 4(2) paper is restricted as to disposition under the federal securities laws, and generally is sold to institutional investors such as a Portfolio who agree that they are purchasing the paper for investment and not with a view to public distribution. Any resale by the purchaser must be in an exempt transaction. Section 4(2) paper normally is resold to other institutional investors like the Portfolio through or with the assistance of the issuer or investment dealers who make a market in the Section 4(2) paper, thus providing liquidity. The Advisor or subadvisor considers the legally restricted but readily saleable Section 4(2) paper to be liquid; however, pursuant to procedures approved by the Board of Trustees of the Fund, if a particular investment in Section 4(2) paper is not determined to be liquid, that investment will be included within the limitation of the particular Portfolio on illiquid securities. The Advisor or Subadvisor monitors the liquidity of each Portfolio’s investments in Section 4(2) paper on a continuing basis.
Short Sales Against-the-Box. All Portfolios (except DWS Money Market VIP) may make short sales against-the-box for the purpose of, but not limited to, deferring realization of loss when deemed advantageous for federal income tax purposes. A short sale “against-the-box” is a short sale in which a Portfolio owns at least an equal amount of the securities sold short or securities convertible into or exchangeable for, without payment of any further consideration, securities of the same issue as, and at least equal in amount to, the securities sold short. A Portfolio will incur a loss as a result of the short sale if the price of the security increases between the dates of the short sale and the date on which a Portfolio replaces the borrowed security. A Portfolio will incur transaction costs, including interest expenses in connection with opening, maintaining, and closing short sales against the box. Each Portfolio does not currently intend to engage in such short sales to the extent that more than 5% of its net assets will be held as collateral.
Variable Rate Securities. DWS Money Market VIP may invest in Variable Rate Securities, instruments having rates of interest that are adjusted periodically or that “float” continuously according to formulae intended to minimize fluctuation in values of the instruments. The interest rate of Variable Rate Securities ordinarily is determined by reference to or is a percentage of an objective standard such as a bank’s prime rate, the 90-day US Treasury Bill rate, or the rate of return on commercial paper or bank certificates of deposit. Generally, the changes in the interest rate on Variable Rate Securities reduce the fluctuation in the market value of such securities. Accordingly, as interest rates decrease or increase, the potential for capital appreciation or depreciation is less than for fixed-rate obligations. Some Variable Rate Demand Securities (“Variable Rate Demand Securities”) have a demand feature entitling the purchaser to resell the securities at an amount approximately equal to amortized cost or the principal amount thereof plus accrued interest. As is the case for other Variable Rate Securities, the interest rate on Variable Rate Demand Securities varies according to some objective standard intended to minimize fluctuation in the values of the instruments. The Portfolio determines the maturity of Variable Rate Securities in accordance with Rule 2a-7 which allows the Portfolio to consider certain of such instruments as having maturities shorter than the maturity date on the face of the instrument.
SPECIAL RISK FACTORS. There are risks inherent in investing in any security, including shares of each Portfolio. The Advisor and, when applicable, a subadvisor, attempts to reduce risk through a variety of means such as fundamental research, diversification and the use of Strategic Transactions; however, there is no guarantee that such efforts will be
17
successful and each Portfolio’s returns and net asset value will fluctuate over time. There are special risks associated with each Portfolio’s investments that are discussed below.
Special Risk Factors — Foreign Securities. DWS Mid Cap Growth VIP, DWS Blue Chip VIP, DWS Balanced VIP, DWS Small Cap Growth VIP and DWS Legg Mason Aggressive Growth VIP invest mainly in US common stocks, but may invest up to 25% of total assets in foreign securities. DWS Mercury Large Cap Core VIP may invest up to 10% of its total assets in foreign securities and DWS Templeton Foreign Value VIP will invest at least 80% of its net assets in foreign securities. DWS High Income VIP generally invests in US bonds or instruments, but up to 50% of total assets could be in bonds from foreign issuers. DWS Dreman Financial Services VIP may invest up to 30% of total assets in foreign securities. DWS Core Fixed Income VIP generally invests in US bonds or instruments, but up to 25% of total assets could be in bonds from foreign issuers. DWS Technology VIP and DWS MFS Strategic Value VIP invest mainly in US stocks, but may invest up to 35% and 20%, respectively, of net assets in foreign securities. DWS Dreman High Return Equity VIP and DWS Dreman Small Cap Value VIP may invest up to 20% of net assets in US Dollar-denominated American Depositary Receipts (“ADRs”) and in securities of foreign companies traded principally in securities markets outside the US. DWS Money Market VIP and DWS Government & Agency Securities VIP, each within its quality standards, may also invest in securities of foreign issuers. However, such investments will be in US Dollar denominated instruments.
Investing in foreign securities involves certain special considerations, including those set forth below, which are not typically associated with investing in US securities and which may favorably or unfavorably affect a Portfolio’s performance. As foreign companies are not generally subject to uniform accounting, auditing and financial reporting standards, practices and requirements comparable to those applicable to domestic companies, there may be less publicly available information about a foreign company than about a domestic company. Many foreign securities markets, while growing in volume of trading activity, have substantially less volume than the US market, and securities of some foreign issuers are less liquid and more volatile than securities of domestic issuers. Similarly, volume and liquidity in most foreign bond markets is less than in the US and, at times, volatility of price can be greater than in the US. Fixed commissions on some foreign securities exchanges and bid to asked spreads in foreign bond markets are generally higher than commissions or bid to asked spreads on US markets, although the Advisor and a subadvisor will endeavor to achieve the most favorable net results on its portfolio transactions. There is generally less governmental supervision and regulation of securities exchanges, brokers and listed companies in foreign countries than in the US. It may be more difficult for a Portfolio’s agents to keep currently informed about corporate actions in foreign countries which may affect the prices of portfolio securities. Communications between the US and foreign countries may be less reliable than within the US, thus increasing the risk of delayed settlements of portfolio transactions or loss of certificates for portfolio securities. Payment for securities without delivery may be required in certain foreign markets. In addition, with respect to certain foreign countries, there is the possibility of expropriation or confiscatory taxation, political or social instability, or diplomatic developments which could affect US investments in those countries. Moreover, individual foreign economies may differ favorably or unfavorably from the US economy in such respects as growth of gross national product, rate of inflation, capital reinvestment, resource self-sufficiency and balance of payments position. The management of a Portfolio seeks to mitigate the risks associated with the foregoing considerations through continuous professional management.
Special Risk Factors — Small Company Risk. DWS Small Cap Growth VIP and DWS Dreman Small Cap Value VIP intend to invest a substantial portion of their assets in small capitalization stocks similar in size to those comprising the Russell 2000 Growth Index and the Russell 2000 Value Index, respectively. Other Portfolios may invest in small capitalization stocks to a lesser degree. Many small companies may have sales and earnings growth rates which exceed those of larger companies and such growth rates may in turn be reflected in more rapid share price appreciation over time; however, investing in smaller company stocks involves greater risk than is customarily associated with investing in larger, more established companies. For example, smaller companies can have limited product lines, markets, or financial and managerial resources. Smaller companies may also be dependent on one or a few key persons, and may be more susceptible to losses and risks of bankruptcy. Also, the securities of smaller companies may be thinly traded (and therefore have to be sold at a discount from current market prices or sold in small lots over an extended period of time). Transaction costs in smaller company stocks may be higher than those of larger companies. Investors should therefore expect that the value of the shares of the DWS Small Cap Growth VIP, DWS Dreman Small Cap Value VIP may be more volatile than the shares of a portfolio that invests in larger capitalization stocks.
Strategic Transactions and Derivatives (all Portfolios except DWS Money Market VIP). A Portfolio may, but is not required to, utilize various other investment strategies as described below for a variety of purposes, such as hedging
18
various market risks, managing the effective maturity or duration of fixed-income securities in a portfolio, or enhancing potential gain. These strategies may be executed through the use of derivative contracts.
In the course of pursuing these investment strategies, a Portfolio may purchase and sell exchange-listed and over-the-counter put and call options on securities, equity and fixed-income indices and other instruments, purchase and sell futures contracts and options thereon, enter into various transactions such as swaps, caps, floors, collars, currency forward contracts, currency futures contracts, currency swaps or options on currencies, or currency futures and various other currency transactions (collectively, all the above are called “Strategic Transactions”). In addition, Strategic Transactions may also include new techniques, instruments or strategies that are permitted as regulatory changes occur. Strategic Transactions may be used without limit (subject to certain limitations imposed by the 1940 Act) to attempt to protect against possible changes in the market value of securities held in or to be purchased for a Portfolio resulting from securities markets or currency exchange rate fluctuations, to protect a Portfolio’s unrealized gains in the value of its portfolio securities, to facilitate the sale of such securities for investment purposes, to manage the effective maturity or duration of fixed-income securities in a portfolio, or to establish a position in the derivatives markets as a substitute for purchasing or selling particular securities. Some Strategic Transactions may also be used to enhance potential gain although no more than 5% of a Portfolio’s assets will be committed to certain Strategic Transactions entered into for non-hedging purposes, unless permitted by the investment objective and policies of a Portfolio. Any or all of these investment techniques may be used at any time and in any combination, and there is no particular strategy that dictates the use of one technique rather than another, as use of any Strategic Transaction is a function of numerous variables including market conditions. The ability of a Portfolio to utilize these Strategic Transactions successfully will depend on the Advisor’s ability to predict pertinent market movements, which cannot be assured. A Portfolio will comply with applicable regulatory requirements when implementing these strategies, techniques and instruments. Strategic Transactions will not be used to alter fundamental investment purposes and characteristics of a Portfolio, and each Fund will segregate assets (or as provided by applicable regulations, enter into certain offsetting positions) to cover its obligations under options, futures and swaps to limit leveraging of a Portfolio.
Strategic Transactions, including derivative contracts, have risks associated with them including possible default by the other party to the transaction, illiquidity and, to the extent the Advisor’s or a subadvisor’s view as to certain market movements is incorrect, the risk that the use of such Strategic Transactions could result in losses greater than if they had not been used. Use of put and call options may result in losses to a Portfolio, force the sale or purchase of portfolio securities at inopportune times or for prices higher than (in the case of put options) or lower than (in the case of call options) current market values, limit the amount of appreciation a Portfolio can realize on its investments or cause a Portfolio to hold a security it might otherwise sell. The use of currency transactions can result in a Portfolio incurring losses as a result of a number of factors including the imposition of exchange controls, suspension of settlements, or the inability to deliver or receive a specified currency. The use of options and futures transactions entails certain other risks. In particular, the variable degree of correlation between price movements of futures contracts and price movements in the related portfolio position of a Portfolio creates the possibility that losses on the hedging instrument may be greater than gains in the value of a Portfolio’s position. In addition, futures and options markets may not be liquid in all circumstances and certain over-the-counter options may have no markets. As a result, in certain markets, a Portfolio might not be able to close out a transaction without incurring substantial losses, if at all. Although the use of futures and options transactions for hedging should tend to minimize the risk of loss due to a decline in the value of the hedged position, at the same time they tend to limit any potential gain which might result from an increase in value of such position. Finally, the daily variation margin requirements for futures contracts would create a greater ongoing potential financial risk than would purchases of options, where the exposure is limited to the cost of the initial premium. Losses resulting from the use of Strategic Transactions would reduce net asset value, and possibly income, and such losses can be greater than if the Strategic Transactions had not been utilized.
General Characteristics of Options. Put options and call options typically have similar structural characteristics and operational mechanics regardless of the underlying instrument on which they are purchased or sold. Thus, the following general discussion relates to each of the particular types of options discussed in greater detail below. In addition, many Strategic Transactions involving options require segregation of Portfolio assets in special accounts, as described below under “Use of Segregated and Other Special Accounts.”
A put option gives the purchaser of the option, upon payment of a premium, the right to sell, and the writer the obligation to buy, the underlying security, commodity, index, currency or other instrument at the exercise price. For instance, a Portfolio’s purchase of a put option on a security might be designed to protect its holdings in the underlying instrument (or, in some cases, a similar instrument) against a substantial decline in the market value by giving a Portfolio the right to
19
sell such instrument at the option exercise price. A call option, upon payment of a premium, gives the purchaser of the option the right to buy, and the seller the obligation to sell, the underlying instrument at the exercise price. A Portfolio’s purchase of a call option on a security, financial future, index, currency or other instrument might be intended to protect a Portfolio against an increase in the price of the underlying instrument that it intends to purchase in the future by fixing the price at which it may purchase such instrument. An American style put or call option may be exercised at any time during the option period while a European style put or call option may be exercised only upon expiration or during a fixed period prior thereto. A Portfolio is authorized to purchase and sell exchange listed options and over-the-counter options (“OTC options”). Exchange listed options are issued by a regulated intermediary such as the Options Clearing Corporation (“OCC”), which guarantees the performance of the obligations of the parties to such options. The discussion below uses the OCC as an example, but is also applicable to other financial intermediaries.
With certain exceptions, OCC issued and exchange listed options generally settle by physical delivery of the underlying security or currency, although in the future cash settlement may become available. Index options and Eurodollar instruments are cash settled for the net amount, if any, by which the option is “in-the-money” (i.e., where the value of the underlying instrument exceeds, in the case of a call option, or is less than, in the case of a put option, the exercise price of the option) at the time the option is exercised. Frequently, rather than taking or making delivery of the underlying instrument through the process of exercising the option, listed options are closed by entering into offsetting purchase or sale transactions that do not result in ownership of the new option.
A Portfolio’s ability to close out its position as a purchaser or seller of an OCC or exchange listed put or call option is dependent, in part, upon the liquidity of the option market. Among the possible reasons for the absence of a liquid option market on an exchange are: (i) insufficient trading interest in certain options; (ii) restrictions on transactions imposed by an exchange; (iii) trading halts, suspensions or other restrictions imposed with respect to particular classes or series of options or underlying securities including reaching daily price limits; (iv) interruption of the normal operations of the OCC or an exchange; (v) inadequacy of the facilities of an exchange or OCC to handle current trading volume; or (vi) a decision by one or more exchanges to discontinue the trading of options (or a particular class or series of options), in which event the relevant market for that option on that exchange would cease to exist, although outstanding options on that exchange would generally continue to be exercisable in accordance with their terms.
The hours of trading for listed options may not coincide with the hours during which the underlying financial instruments are traded. To the extent that the option markets close before the markets for the underlying financial instruments, significant price and rate movements can take place in the underlying markets that cannot be reflected in the option markets.
OTC options are purchased from or sold to securities dealers, financial institutions or other parties (“Counterparties”) through direct bilateral agreement with the Counterparty. In contrast to exchange listed options, which generally have standardized terms and performance mechanics, all the terms of an OTC option, including such terms as method of settlement, term, exercise price, premium, guarantees and security, are set by negotiation of the parties. A Portfolio will only sell OTC options (other than OTC currency options) that are subject to a buy-back provision permitting a Portfolio to require the Counterparty to sell the option back to a Portfolio at a formula price within seven days. A Portfolio expects generally to enter into OTC options that have cash settlement provisions, although it is not required to do so.
Unless the parties provide for it, there is no central clearing or guaranty function in an OTC option. As a result, if the Counterparty fails to make or take delivery of the security, currency or other instrument underlying an OTC option it has entered into with a Portfolio or fails to make a cash settlement payment due in accordance with the terms of that option, a Portfolio will lose any premium it paid for the option as well as any anticipated benefit of the transaction. Accordingly, the Advisor or a subadvisor must assess the creditworthiness of each such Counterparty or any guarantor or credit enhancement of the Counterparty’s credit to determine the likelihood that the terms of the OTC option will be satisfied. A Portfolio will engage in OTC option transactions only with US Government securities dealers recognized by the Federal Reserve Bank of New York as “primary dealers” or broker/dealers, domestic or foreign banks or other financial institutions which have received (or the guarantors of the obligation of which have received) a short-term credit rating of A-1 from Standard & Poor’s Ratings Services (“S&P”) or P-1 from Moody’s Investors Service (“Moody’s”) or an equivalent rating from any nationally recognized statistical rating organization (“NRSRO”) or, in the case of OTC currency transactions, are determined to be of equivalent credit quality by the Advisor or a subadvisor. The staff of the SEC currently takes the position that OTC options purchased by a Portfolio, and portfolio securities “covering” the amount of a Portfolio’s obligation pursuant to an OTC option sold by it (the cost of the sell-back plus the in-the-money
20
amount, if any) are illiquid, and are subject to a Portfolio’s limitation on investing no more than 15% of its net assets in illiquid securities.
If a Portfolio sells a call option, the premium that it receives may serve as a partial hedge, to the extent of the option premium, against a decrease in the value of the underlying securities or instruments in its portfolio or will increase a Portfolio’s income. The sale of put options can also provide income.
A Portfolio may purchase and sell call options on securities including US Treasury and agency securities, mortgage-backed securities, foreign sovereign debt, corporate debt securities, equity securities (including convertible securities) and Eurodollar instruments that are traded on US and foreign securities exchanges and in the over-the-counter markets, and on securities indices, currencies and futures contracts. All calls sold by a Portfolio must be “covered” (i.e., a Portfolio must own the securities or futures contract subject to the call) or must meet the asset segregation requirements described below as long as the call is outstanding. Even though a Portfolio will receive the option premium to help protect it against loss, a call sold by a Portfolio exposes a Portfolio during the term of the option to possible loss of opportunity to realize appreciation in the market price of the underlying security or instrument and may require a Portfolio to hold a security or instrument which it might otherwise have sold.
A Portfolio may purchase and sell put options on securities including US Treasury and agency securities, mortgage-backed securities, foreign sovereign debt, corporate debt securities, equity securities (including convertible securities) and Eurodollar instruments (whether or not it holds the above securities in its portfolio), and on securities indices, currencies and futures contracts other than futures on individual corporate debt and individual equity securities. A Portfolio will not sell put options if, as a result, more than 50% of a Portfolio’s total assets would be required to be segregated to cover its potential obligations under such put options other than those with respect to futures and options thereon. In selling put options, there is a risk that a Portfolio may be required to buy the underlying security at a disadvantageous price above the market price.
General Characteristics of Futures. A Portfolio may enter into futures contracts or purchase or sell put and call options on such futures as a hedge against anticipated interest rate, currency or equity market changes, and for duration management, risk management and return enhancement purposes. Futures are generally bought and sold on the commodities exchanges where they are listed with payment of initial and variation margin as described below. The sale of a futures contract creates a firm obligation by a Portfolio, as seller, to deliver to the buyer the specific type of financial instrument called for in the contract at a specific future time for a specified price (or, with respect to index futures and Eurodollar instruments, the net cash amount). Options on futures contracts are similar to options on securities except that an option on a futures contract gives the purchaser the right in return for the premium paid to assume a position in a futures contract and obligates the seller to deliver such position.
The Portfolios have claimed exclusion from the definition of the term “commodity pool operator” adopted by the CFTC and the National Futures Association, which regulate trading in the futures markets. Therefore, the Portfolios are not subject to commodity pool operator registration and regulation under the Commodity Exchange Act. Futures and options on futures may be entered into for bona fide hedging, risk management (including duration management) or other portfolio and return enhancement management purposes to the extent consistent with the exclusion from commodity pool operator registration. Typically, maintaining a futures contract or selling an option thereon requires a Portfolio to deposit with a financial intermediary or futures commission merchant as security for its obligations an amount of cash or other specified assets (initial margin) which initially is typically 1% to 10% of the face amount of the contract (but may be higher in some circumstances). Additional cash or assets (variation margin) may be required to be deposited thereafter on a daily basis as the mark to market value of the contract fluctuates. The purchase of an option on financial futures involves payment of a premium for the option without any further obligation on the part of a Portfolio. If a Portfolio exercises an option on a futures contract it will be obligated to post initial margin (and potential subsequent variation margin) for the resulting futures position just as it would for any position. Futures contracts and options thereon are generally settled by entering into an offsetting transaction but there can be no assurance that the position can be offset prior to settlement at an advantageous price, nor that delivery will occur.
Options on Securities Indices and Other Financial Indices. A Portfolio also may purchase and sell call and put options on securities indices and other financial indices and in so doing can achieve many of the same objectives it would achieve through the sale or purchase of options on individual securities or other instruments. Options on securities indices and other financial indices are similar to options on a security or other instrument except that, rather than settling by physical delivery of the underlying instrument, they settle by cash settlement, i.e., an option on an index gives the
21
holder the right to receive, upon exercise of the option, an amount of cash if the closing level of the index upon which the option is based exceeds, in the case of a call, or is less than, in the case of a put, the exercise price of the option (except if, in the case of an OTC option, physical delivery is specified). This amount of cash is equal to the excess of the closing price of the index over the exercise price of the option, which also may be multiplied by a formula value. The seller of the option is obligated, in return for the premium received, to make delivery of this amount. The gain or loss on an option on an index depends on price movements in the instruments making up the market, market segment, industry or other composite on which the underlying index is based, rather than price movements in individual securities, as is the case with respect to options on securities.
Currency Transactions. A Portfolio may engage in currency transactions with Counterparties primarily in order to hedge, or manage the risk of the value of portfolio holdings denominated in particular currencies against fluctuations in relative value or to enhance returns. Currency transactions include forward currency contracts, exchange listed currency futures, exchange listed and OTC options on currencies, and currency swaps. A forward currency contract involves a privately negotiated obligation to purchase or sell (with delivery generally required) a specific currency at a future date, which may be any fixed number of days from the date of the contract agreed upon by the parties, at a price set at the time of the contract. A currency swap is an agreement to exchange cash flows based on the notional difference among two or more currencies and operates similarly to an interest rate swap, which is described below. A Portfolio may enter into currency transactions with Counterparties which have received (or the guarantors of the obligations which have received) a credit rating of A-1 or P-1 by S&P or Moody’s, respectively, or that have an equivalent rating from a NRSRO or (except for OTC currency options) are determined to be of equivalent credit quality by the Advisor or a subadvisor.
With respect to hedging, a Portfolio’s dealings in forward currency contracts and other currency transactions such as futures, options, options on futures and swaps may involve hedging either specific transactions or portfolio positions except as described below. Transaction hedging is entering into a currency transaction with respect to specific assets or liabilities of a Portfolio, which will generally arise in connection with the purchase or sale of its portfolio securities or the receipt of income therefrom. Position hedging is entering into a currency transaction with respect to portfolio security positions denominated in, exposed to or generally quoted in that currency.
A Portfolio generally will not enter into a transaction to hedge currency exposure to an extent greater, after netting all transactions intended wholly or partially to offset other transactions, than the aggregate market value (at the time of entering into the transaction) of the securities held in its portfolio that are denominated in, exposed to or generally quoted in or currently convertible into such currency, other than with respect to proxy hedging or cross hedging as described below.
A Portfolio may also cross-hedge currencies by entering into transactions to purchase or sell one or more currencies that are expected to decline in value relative to other currencies to which a Portfolio has or in which a Portfolio expects to have portfolio exposure.
To reduce the effect of currency fluctuations on the value of existing or anticipated holdings of portfolio securities, a Portfolio may also engage in proxy hedging. Proxy hedging is often used when the currency to which a Portfolio’s portfolio is exposed is difficult to hedge or to hedge against the dollar. Proxy hedging entails entering into a commitment or option to sell a currency whose changes in value are generally considered to be correlated to a currency or currencies in which some or all of a Portfolio’s portfolio securities are or are expected to be denominated, in exchange for US dollars. The amount of the commitment or option would not exceed the value of a Portfolio’s securities denominated in correlated currencies. Currency hedging involves some of the same risks and considerations as other transactions with similar instruments. Currency transactions can result in losses to a Portfolio if the currency being hedged fluctuates in value to a degree or in a direction that is not anticipated. Further, there is the risk that the perceived correlation between various currencies may not be present or may not be present during the particular time that a Portfolio is engaging in proxy hedging. If a Portfolio enters into a currency hedging transaction, a Portfolio will comply with the asset segregation requirements described below.
Risks of Currency Transactions. Currency transactions are subject to risks different from those of other portfolio transactions. Because currency control is of great importance to the issuing governments and influences economic planning and policy, purchases and sales of currency and related instruments can be negatively affected by government exchange controls, blockages, and manipulations or exchange restrictions imposed by governments. These can result in losses to a Portfolio if it is unable to deliver or receive currency or funds in settlement of obligations and could also cause hedges it has entered into to be rendered useless, resulting in full currency exposure as well as incurring transaction costs.
22
Buyers and sellers of currency futures are subject to the same risks that apply to the use of futures generally. Further, settlement of a currency futures contract for the purchase of most currencies must occur at a bank based in the issuing nation. Trading options on currency futures is relatively new, and the ability to establish and close out positions on such options is subject to the maintenance of a liquid market which may not always be available. Currency exchange rates may fluctuate based on factors extrinsic to that country’s economy.
Swaps, Caps, Floors and Collars. Among the Strategic Transactions into which a Portfolio may enter are interest rate, credit default, currency, index and other swaps and the purchase or sale of related caps, floors and collars. A Portfolio expects to enter into these transactions primarily to preserve a return or spread on a particular investment or portion of its portfolio, to protect against currency fluctuations, as a duration management technique or to protect against any increase in the price of securities a Portfolio anticipates purchasing at a later date or to enhance returns. A Portfolio will not sell interest rate caps or floors where it does not own securities or other instruments providing the income stream a Portfolio may be obligated to pay. Interest rate swaps involve the exchange by a Portfolio with another party of their respective commitments to pay or receive interest, e.g., an exchange of floating rate payments for fixed rate payments with respect to a notional amount of principal. A currency swap is an agreement to exchange cash flows on a notional amount of two or more currencies based on the relative value differential among them and an index swap is an agreement to swap cash flows on a notional amount based on changes in the values of the reference indices. The purchase of a cap entitles the purchaser to receive payments on a notional principal amount from the party selling such cap to the extent that a specified index exceeds a predetermined interest rate or amount. The purchase of a floor entitles the purchaser to receive payments on a notional principal amount from the party selling such floor to the extent that a specified index falls below a predetermined interest rate or amount. A collar is a combination of a cap and a floor that preserves a certain return within a predetermined range of interest rates or values.
A Portfolio will usually enter into swaps on a net basis, i.e., the two payment streams are netted out in a cash settlement on the payment date or dates specified in the instrument, with a Portfolio receiving or paying, as the case may be, only the net amount of the two payments. Inasmuch as a Portfolio will segregate assets (or enter into offsetting positions) to cover its obligations under swaps, the Advisor and a Portfolio believe such obligations do not constitute senior securities under the 1940 Act and, accordingly, will not treat them as being subject to its borrowing restrictions. A Portfolio will not enter into any swap, cap, floor or collar transaction unless, at the time of entering into such transaction, the unsecured long-term debt of the Counterparty, combined with any credit enhancements, is rated at least A by S&P or Moody’s or has an equivalent rating from a NRSRO or is determined to be of equivalent credit quality by the Advisor. If there is a default by the Counterparty, a Portfolio may have contractual remedies pursuant to the agreements related to the transaction. The swap market has grown substantially in recent years with a large number of banks and investment banking firms acting both as principals and as agents utilizing standardized swap documentation. As a result, the swap market has become relatively liquid. Caps, floors and collars are more recent innovations for which standardized documentation has not yet been fully developed and, accordingly, they are less liquid than swaps.
Credit default swaps are used as a means of “buying” credit protection, i.e., attempting to mitigate the risk of default or credit quality deterioration in some portion of a Portfolio’s holdings, or “selling” credit protection, i.e., attempting to gain exposure to an underlying issuer’s credit quality characteristics without directly investing in that issuer. No more than 5% of a Portfolio’s assets may be invested in credit default swaps for the purposes of buying credit protection. A Portfolio will only sell credit protection with respect to securities in which it would be authorized to invest directly. A Portfolio may also borrow up to 5% of that Portfolio’s net assets against called and tendered bonds in the Portfolio. For the risks associated with borrowing, please see the “Borrowing” subsection of the “Investment Restrictions” section of this Statement of Additional Information. DWS Balanced VIP may invest up to 15% of its total assets in credit default swaps.
Swaps have special risks associated including possible default by the counterparty to the transaction, illiquidity and, where swaps are used for hedges, the risk that the use of a swap could result in losses greater than if the swap had not been employed. Whether the use of swap agreements will be successful in furthering its investment objective will depend on the Advisor’s ability to correctly predict whether certain types of investments are likely to produce greater returns than other investments. Certain swap agreements may be considered to be illiquid because they are two party contracts and because they may have terms of greater than seven days. Moreover, a Portfolio bears the risk of loss of the amount expected to be received under a swap agreement in the event of the default or bankruptcy of a swap agreement counterparty.
23
Eurodollar Instruments. A Portfolio may make investments in Eurodollar instruments. Eurodollar instruments are US dollar-denominated futures contracts or options thereon which are linked to the London Interbank Offered Rate (“LIBOR”), although foreign currency-denominated instruments are available from time to time. Eurodollar futures contracts enable purchasers to obtain a fixed rate for the lending of funds and sellers to obtain a fixed rate for borrowings. A Portfolio might use Eurodollar futures contracts and options thereon to hedge against changes in LIBOR, to which many interest rate swaps and fixed income instruments are linked.
Risks of Strategic Transactions Outside the US. When conducted outside the US, Strategic Transactions may not be regulated as rigorously as in the US, may not involve a clearing mechanism and related guarantees, and are subject to the risk of governmental actions affecting trading in, or the prices of, foreign securities, currencies and other instruments. The value of such positions also could be adversely affected by: (i) other complex foreign political, legal and economic factors, (ii) lesser availability than in the US of data on which to make trading decisions, (iii) delays in a Portfolio’s ability to act upon economic events occurring in foreign markets during non-business hours in the US, (iv) the imposition of different exercise and settlement terms and procedures and margin requirements than in the US, and (v) lower trading volume and liquidity.
Use of Segregated and Other Special Accounts. Many Strategic Transactions, in addition to other requirements, require that a Portfolio segregate cash or liquid assets with its custodian to the extent Fund obligations are not otherwise “covered” through ownership of the underlying security, financial instrument or currency. In general, either the full amount of any obligation by a Portfolio to pay or deliver securities or assets must be covered at all times by the securities, instruments or currency required to be delivered, or, subject to any regulatory restrictions, an amount of cash or liquid assets at least equal to the current amount of the obligation must be segregated with the custodian. The segregated assets cannot be sold or transferred unless equivalent assets are substituted in their place or it is no longer necessary to segregate them. For example, a call option written by a Portfolio will require a Portfolio to hold the securities subject to the call (or securities convertible into the needed securities without additional consideration) or to segregate cash or liquid assets sufficient to purchase and deliver the securities if the call is exercised. A call option sold by a Portfolio on an index will require a Portfolio to own portfolio securities which correlate with the index or to segregate cash or liquid assets equal to the excess of the index value over the exercise price on a current basis. A put option written by a Portfolio requires a Portfolio to segregate cash or liquid assets equal to the exercise price.
Except when a Portfolio enters into a forward contract for the purchase or sale of a security denominated in a particular currency, which requires no segregation, a currency contract which obligates a Portfolio to buy or sell currency will generally require a Portfolio to hold an amount of that currency or liquid assets denominated in that currency equal to a Portfolio’s obligations or to segregate cash or liquid assets equal to the amount of a Portfolio’s obligation.
OTC options entered into by a Portfolio, including those on securities, currency, financial instruments or indices and OCC issued and exchange listed index options, will generally provide for cash settlement. As a result, when a Portfolio sells these instruments it will only segregate an amount of cash or liquid assets equal to its accrued net obligations, as there is no requirement for payment or delivery of amounts in excess of the net amount. These amounts will equal 100% of the exercise price in the case of a non cash-settled put, the same as an OCC guaranteed listed option sold by a Portfolio, or the in-the-money amount plus any sell-back formula amount in the case of a cash-settled put or call. In addition, when a Portfolio sells a call option on an index at a time when the in-the-money amount exceeds the exercise price, a Portfolio will segregate, until the option expires or is closed out, cash or cash equivalents equal in value to such excess. OCC issued and exchange listed options sold by a Portfolio other than those above generally settle with physical delivery, or with an election of either physical delivery or cash settlement and a Portfolio will segregate an amount of cash or liquid assets equal to the full value of the option. OTC options settling with physical delivery, or with an election of either physical delivery or cash settlement will be treated the same as other options settling with physical delivery.
In the case of a futures contract or an option thereon, a Portfolio must deposit initial margin and possible daily variation margin in addition to segregating cash or liquid assets sufficient to meet its obligation to purchase or provide securities or currencies, or to pay the amount owed at the expiration of an index-based futures contract. Such liquid assets may consist of cash, cash equivalents, liquid debt or equity securities or other acceptable assets.
With respect to swaps, a Portfolio will accrue the net amount of the excess, if any, of its obligations over its entitlements with respect to each swap on a daily basis and will segregate an amount of cash or liquid assets having a value equal to the accrued excess. Caps, floors and collars require segregation of assets with a value equal to a Portfolio’s net obligation, if any.
24
Strategic Transactions may be covered by other means when consistent with applicable regulatory policies. A Portfolio may also enter into offsetting transactions so that its combined position, coupled with any segregated assets, equals its net outstanding obligation in related options and Strategic Transactions. For example, a Portfolio could purchase a put option if the strike price of that option is the same or higher than the strike price of a put option sold by a Portfolio. Moreover, instead of segregating cash or liquid assets if a Portfolio held a futures or forward contract, it could purchase a put option on the same futures or forward contract with a strike price as high or higher than the price of the contract held. Other Strategic Transactions may also be offset in combinations. If the offsetting transaction terminates at the time of or after the primary transaction no segregation is required, but if it terminates prior to such time, cash or liquid assets equal to any remaining obligation would need to be segregated.
Combined Transactions. A Portfolio may enter into multiple transactions, including multiple options transactions, multiple futures transactions, multiple currency transactions (including forward currency contracts) and multiple interest rate transactions and any combination of futures, options, currency and interest rate transactions (“component” transactions), instead of a single Strategic Transaction, as part of a single or combined strategy when, in the opinion of the Advisor or Subadvisor, it is in the best interests of a Portfolio to do so. A combined transaction will usually contain elements of risk that are present in each of its component transactions. Although combined transactions are normally entered into based on the Advisor’s or a subadvisor’s judgment that the combined strategies will reduce risk or otherwise more effectively achieve the desired portfolio management goal, it is possible that the combination will instead increase such risks or hinder achievement of the portfolio management objective.
Warrants. Each Portfolio (except DWS Money Market VIP) may invest in warrants up to five percent of the value of its respective net assets. The holder of a warrant has the right, until the warrant expires, to purchase a given number of shares of a particular issuer at a specified price. Such investments can provide a greater potential for profit or loss than an equivalent investment in the underlying security. Prices of warrants do not necessarily move, however, in tandem with the prices of the underlying securities and are, therefore, considered speculative investments. Warrants pay no dividends and confer no rights other than a purchase option. Thus, if a warrant held by a Portfolio were not exercised by the date of its expiration, a Portfolio would lose the entire purchase price of the warrant.
Zero Coupon Government Securities. Subject to its investment objective and policies, a Portfolio may invest in zero coupon US Government securities. Zero coupon bonds are purchased at a discount from the face amount. The buyer receives only the right to receive a fixed payment on a certain date in the future and does not receive any periodic interest payments. These securities may include those created directly by the US Treasury and those created as collateralized obligations through various proprietary custodial, trust or other relationships. The effect of owning instruments which do not make current interest payments is that a fixed yield is earned not only on the original investment but also, in effect, on all discount accretion during the life of the obligations. This implicit reinvestment of earnings at the same rate eliminates the risk of being unable to reinvest distributions at a rate as high as the implicit yield on the zero coupon bond, but at the same time eliminates any opportunity to reinvest earnings at higher rates. For this reason, zero coupon bonds are subject to substantially greater price fluctuations during periods of changing market interest rates than those of comparable securities that pay interest currently, which fluctuation is greater as the period to maturity is longer. Zero coupon bonds created as collateralized obligations are similar to those created through the US Treasury, but the former investments do not provide absolute certainty of maturity or of cash flows after prior classes of the collateralized obligations are retired. No Portfolio currently intends to invest more than 20% of its net assets in zero coupon US Government securities.
MANAGEMENT OF THE FUND
Investment Advisor
On April 5, 2002, 100% of Zurich Scudder Investments, Inc. (“Scudder”), not including certain U.K. operations (known as Threadneedle Investments), was acquired by Deutsche Bank AG and changed its name to Deutsche Investment Management Americas Inc. (“DeIM” or the “Advisor”). DeIM, which is part of Deutsche Asset Management (“DeAM”), is the investment advisor for each Portfolio. Under the supervision of the Board of Trustees of the Fund, with headquarters at 345 Park Avenue, New York, New York 10154, DeIM or a subadvisor, makes the Portfolios’ investment decisions, buys and sells securities for each Portfolio and conducts research that leads to these purchase and sale decisions. The Advisor or a subadvisor manages each Portfolio’s daily investment and business affairs subject to the policies established by the Fund’s Board of Trustees. DeIM and its predecessors have more than 80 years of experience managing mutual funds. DeIM provides a full range of investment advisory services to institutional and retail clients. The
25
Fund’s investment advisor or a subadvisor is also responsible for selecting brokers and dealers and for negotiating brokerage commissions and dealer charges.
Deutsche Asset Management is the marketing name in the US for the asset management activities of Deutsche Bank AG, DeIM, Deutsche Asset Management Inc., Deutsche Bank Trust Company Americas and DWS Trust Company. Deutsche Asset Management is a global asset management organization that offers a wide range of investing expertise and resources, including hundreds of portfolio managers and analysts and an office network that reaches the world’s major investment centers. This well-resourced global investment platform brings together a wide variety of experience and investment insight, across industries, regions, asset classes and investing styles. DeIM is an indirect, wholly owned subsidiary of Deutsche Bank AG. Deutsche Bank AG is a major global banking institution that is engaged in a wide range of financial services, including investment management, mutual fund, retail, private and commercial banking, investment banking and insurance.
Pursuant to an investment management agreement with each Portfolio (each an “Agreement,” and collectively, the “Agreements”), the Advisor acts as each Portfolio’s investment advisor, manages its investments, administers its business affairs, furnishes office facilities and equipment, provides clerical and administrative services and permits its officers and employees to serve without compensation as trustees or officers of one or both funds if elected to such positions. To the extent permissible by law, the Advisor may appoint certain of its affiliates as subadvisors to perform certain of the Advisor’s duties.
The Advisor provides investment counsel for many individuals and institutions, including insurance companies, industrial corporations, and financial and banking organizations, as well as providing investment advice to open- and closed-end SEC registered funds.
In certain cases, the investments for a Portfolio are managed by the same individuals who manage one or more other mutual funds advised by the Advisor that have similar names, objectives and investment styles. You should be aware that the Portfolios are likely to differ from these other mutual funds in size, cash flow pattern and tax matters. Accordingly, the holdings and performance of the Portfolios can be expected to vary from those of these other mutual funds.
Certain investments may be appropriate for a Portfolio and also for other clients advised by the Advisor. Investment decisions for a portfolio and other clients are made with a view to achieving their respective investment objectives and after consideration of such factors as their current holdings, availability of cash for investment and the size of their investments generally. Frequently, a particular security may be bought or sold for only one client or in different amounts and at different times for more than one but less than all clients. Likewise, a particular security may be bought for one or more clients when one or more other clients are selling the security. In addition, purchases or sales of the same security may be made for two or more clients on the same day. In such event, such transactions will be allocated among the clients in a manner believed by the Advisor to be equitable to each. In some cases, this procedure could have an adverse effect on the price or amount of the securities purchased or sold by a Portfolio. Purchase and sale orders for a Portfolio may be combined with those of other clients of the Advisor in the interest of achieving the most favorable net results to that Portfolio.
Each Portfolio is managed by a team of investment professionals who each play an important role in a Portfolio’s management process. Team members work together to develop investment strategies and select securities for a Portfolio. This team works for the Advisor or its affiliates and is supported by a large staff of economists, research analysts, traders and other investment specialists. The Advisor or its affiliates believe(s) its team approach benefits Portfolio investors by bringing together many disciplines and leveraging its extensive resources. Team members with primary responsibility for management of each Portfolio, as well as team members who have other ongoing management responsibilities for each Portfolio, are identified in each Portfolio’s prospectus as of the date of the prospectus. Composition of the team may change over time, and Portfolio shareholders and investors will be notified of changes affecting individuals with primary Portfolio management responsibility.
The current Agreements for all Portfolios were last renewed by the Trustees on September 23, 2005. Each Agreement continues in effect until September 30, 2006 and from year to year thereafter only if its continuance is approved annually by the vote of a majority of those Trustees who are not parties to such Agreements or interested persons of the Advisor or the Fund, cast in person at a meeting called for the purpose of voting on such approval, and either by a vote of the Fund’s Trustees or of a majority of the outstanding voting securities of the respective Portfolio. The Agreements may be
26
terminated at any time without payment of penalty by either party on sixty days’ written notice and automatically terminate in the event of their assignment.
Under the Agreements, the Advisor or a subadvisor regularly provide the Portfolios with investment research, advice and supervision and furnishes continuously an investment program consistent with the investment objectives and policies of each Portfolio, and determines, for each Portfolio, what securities shall be purchased, what securities shall be held or sold, and what portion of a Portfolio’s assets shall be held uninvested, subject always to the provisions of the Fund’s Declaration of Trust and By-Laws, and of the 1940 Act and to a Portfolio’s investment objectives, policies and restrictions, and subject further to such policies and instructions as the Trustees may from time to time establish. The Advisor also advises and assists the officers of the Fund in taking such steps as are necessary or appropriate to carry out the decisions of its Trustees and the appropriate committees of the Trustees regarding the conduct of the business of the Fund.
Under the Agreements, the Advisor also renders significant administrative services (not otherwise provided by third parties) necessary for each Portfolio’s operations as an open-end investment company including, but not limited to, preparing reports and notices to the Trustees and shareholders; supervising, negotiating contractual arrangements with, and monitoring various third-party service providers to the Portfolios (such as the Portfolios’ transfer agent, pricing agents, custodian, accountants and others); preparing and making filings with the SEC and other regulatory agencies; assisting in the preparation and filing of each Portfolio’s federal, state and local tax returns; preparing and filing the Fund’s federal excise tax returns; assisting with investor and public relations matters; monitoring the valuation of securities and the calculation of net asset value, monitoring the registration of shares of the Fund under applicable federal and state securities laws; maintaining each Portfolio’s books and records to the extent not otherwise maintained by a third party; assisting in establishing accounting policies of the Fund; assisting in the resolution of accounting and legal issues; establishing and monitoring each Portfolio’s operating budget; processing the payment of each Portfolio’s bills; assisting the Fund and the Portfolios in, and otherwise arranging for, the payment of distributions and dividends and otherwise assisting the Fund and the Portfolios in the conduct of their business, subject to the direction and control of the Trustees.
Pursuant to a sub-accounting and administrator agreement among the Advisor, DWS-SFAC and State Street Bank and Trust Company (“SSB”), the Advisor has delegated certain administrative functions to SSB under each Portfolio’s investment management agreements. The costs and expenses of such delegation are borne by the Advisor, not by the Portfolios.
For its investment management services, the Advisor receives compensation monthly at the following annual rates from each Portfolio:
| | | |
Portfolio | | Fee Rate | |
DWS Blue Chip VIP | | 0.650 | % |
DWS Core Fixed Income VIP | | 0.600 | % |
DWS Government & Agency Securities VIP | | 0.550 | % |
DWS High Income VIP | | 0.600 | % |
DWS International Select Equity VIP | | 0.750 | % |
DWS Large Cap Value VIP | | 0.750 | % |
DWS Dreman Small Cap Value VIP | | 0.750 | % |
DWS Strategic Income VIP | | 0.650 | % |
DWS Dreman Financial Services VIP, DWS Mid Cap Growth VIP, DWS Dreman High Return Equity VIP and DWS Technology VIP each pay the Advisor a graduated investment management fee, based on the average daily net assets of a Portfolio, payable monthly, at the annual rates shown below:
| | | |
Average Daily Net Assets of the Portfolio | | Fee Rate | |
$0–$250 million | | 0.750 | % |
next $750 million | | 0.720 | % |
next $1.5 billion | | 0.700 | % |
next $2.5 billion | | 0.680 | % |
next $2.5 billion | | 0.650 | % |
next $2.5 billion | | 0.640 | % |
next $2.5 billion | | 0.630 | % |
Over $12.5 billion | | 0.620 | % |
27
DWS Global Thematic VIP pays the Advisor a graduated investment management fee, based on the average daily net assets of the Portfolio, payable monthly, at the annual rates shown below:
| | | |
Average Daily Net Assets of the Portfolio | | Fee Rate | |
$0–$250 million | | 1.000 | % |
next $500 million | | 0.950 | % |
next $750 million | | 0.900 | % |
next $1.5 billion | | 0.850 | % |
Over $3 billion | | 0.800 | % |
For the period January 1, 2004 through September 30, 2004, DWS Money Market VIP paid a monthly investment management fee at an annual rate of 0.50%, based on the average daily net assets of the portfolio. Effective October 1, 2004, DWS Money Market VIP pays the Advisor a graduated investment fee based on the average daily net assets of the Portfolio, computed and accrued daily and payable monthly, at the annual rates shown below:
| | | |
Average Daily Net Assets of the Portfolio | | Fee Rate | |
$0–$215 million | | 0.500 | % |
next $335 million | | 0.375 | % |
next $250 million | | 0.300 | % |
Over $800 million | | 0.250 | % |
For the period from January 1, 2005 through May 1, 2005, DWS Small Cap Growth VIP paid a monthly investment management fee of 0.65%, based on the average daily net assets of the Portfolio. Effective May 2, 2005, DWS Small Cap Growth VIP pays a monthly investment management fee, based on the average daily net assets of the Portfolio, computed and accrued daily and payable monthly, at the annual rates shown below:
| | | |
Average Daily Net Assets | | Fee Rate | |
First $250 million | | 0.650 | % |
Next $750 million | | 0.625 | % |
Over $1 billion | | 0.600 | % |
For the period from January 1, 2005 through May 1, 2005, DWS Balanced VIP paid a monthly investment management fee at an annual rate of 0.55%, based on the average daily net assets of the Portfolio. Effective May 2, 2005, DWS Balanced VIP pays a monthly investment management fee, based on the average daily net assets of the Portfolio, computed and accrued daily and payable monthly, at the annual rates shown below:
| | | |
Average Daily Net Assets | | Fee Rate | |
First $250 million | | 0.470 | % |
Next $750 million | | 0.445 | % |
Over $1 billion | | 0.410 | % |
Effective November 15, 2004, DWS Mercury Large Cap Core VIP pays a monthly investment management fee, based on the average daily net assets of the Portfolio, computed and accrued daily and payable monthly, at the annual rates shown below:
| | | |
Average Daily Net Assets | | Fee Rate | |
First $250 million | | 0.900 | % |
Next $250 million | | 0.850 | % |
Next $500 million | | 0.800 | % |
Next $1 billion | | 0.750 | % |
Next $500 million | | 0.700 | % |
Over $2.5 billion | | 0.650 | % |
28
Effective November 15, 2004, DWS Templeton Foreign Value VIP pays a monthly investment management fee, based on the average daily net assets of the Portfolio, computed and accrued daily and payable monthly, at the annual rates shown below:
| | | |
Average Daily Net Assets | | Fee Rate | |
First $250 million | | 0.950 | % |
Next $250 million | | 0.900 | % |
Next $500 million | | 0.850 | % |
Next $1 billion | | 0.750 | % |
Next $500 million | | 0.700 | % |
Over $2.5 billion | | 0.650 | % |
DWS Legg Mason Aggressive Growth VIP (through July 31, 2005) and DWS Turner Mid Cap Growth VIP (through September 30, 2005) each paid the Advisor a monthly investment management fee, based on the average daily net assets of each Portfolio, computed and accrued daily and payable monthly, at the annual rates shown below:
| | | |
Average Daily Net Assets of the Portfolio | | Fee Rate | |
$0-$250 million | | 1.000 | % |
Next $250 million | | 0.975 | % |
Next $500 million | | 0.950 | % |
Next $1.5 billion | | 0.925 | % |
Over $2.5 billion | | 0.900 | % |
Effective August 1, 2005, DWS Legg Mason Aggressive Growth VIP pays a monthly investment management fee, based on the average daily net assets of the Portfolio, computed and accrued daily and payable monthly, at the annual rates shown below:
| | | |
Average Daily Net Assets | | Fee Rate | |
First $250 million | | 0.800 | % |
Next $500 million | | 0.775 | % |
Next $750 million | | 0.750 | % |
Over $1.5 billion | | 0.725 | % |
Effective October 1, 2005, DWS Turner Mid Cap Growth VIP pays the Advisor a graduated investment management fee based on the average daily net assets of the Portfolio, computed and accrued daily and payable monthly, at the annual rates shown below:
| | | |
Average Daily Net Assets of the Portfolio | | Fee Rate | |
First $250 million | | 0.800 | % |
Next $250 million | | 0.785 | % |
Next $500 million | | 0.770 | % |
Over $1 billion | | 0.755 | % |
Through May 1, 2005, DWS Janus Growth & Income VIP and DWS Janus Growth Opportunities VIP each pays a monthly investment management fee, based on the average daily net assets of each Portfolio, computed and accrued daily and payable monthly, at the annual rates shown below:
| | | |
Average Daily Net Assets | | Fee Rate | |
First $250 million | | 0.950 | % |
Next $250 million | | 0.925 | % |
Next $500 million | | 0.900 | % |
Next $1.5 billion | | 0.875 | % |
Over $2.5 billion | | 0.850 | % |
29
Effective May 1, 2005, DWS Janus Growth & Income VIP and DWS Janus Growth Opportunities VIP each pays a monthly investment management fee, based on the average daily net assets of each Portfolio, computed and accrued daily and payable monthly, at the annual rates shown below:
| | | |
Average Daily Net Assets | | Fee Rate | |
First $250 million | | 0.750 | % |
Next $750 million | | 0.725 | % |
Next $1.5 billion | | 0.700 | % |
Over $2.5 billion | | 0.675 | % |
DWS Davis Venture Value VIP pays the Advisor a graduated investment management fee based on the average daily net assets of the Portfolio, computed and accrued daily and payable monthly, at the annual rates shown below:
| | | |
Average Daily Net Assets of the Portfolio | | Fee Rate | |
$0–$250 million | | 0.950 | % |
next $250 million | | 0.925 | % |
next $500 million | | 0.900 | % |
next $1.5 billion | | 0.875 | % |
Over $2.5 billion | | 0.850 | % |
Through October 1, 2005, DWS Oak Strategic Equity VIP paid the Advisor a graduated investment management fee based on the average daily net assets of the Portfolio, computed and accrued daily and payable monthly, at the annual rates shown below:
| | | |
Average Daily Net Assets of the Portfolio | | Fee Rate | |
$0–$250 million | | 0.950 | % |
next $250 million | | 0.925 | % |
next $500 million | | 0.900 | % |
next $1.5 billion | | 0.875 | % |
Over $2.5 billion | | 0.850 | % |
Effective October 1, 2005, DWS Oak Strategic Equity VIP pays the Advisor a graduated investment management fee based on the average daily net assets of the Portfolio, computed and accrued daily and payable monthly, at the annual rates shown below:
| | | |
Average Daily Net Assets | | Fee Rate | |
First $250 million | | 0.750 | % |
Next $250 million | | 0.735 | % |
Next $500 million | | 0.720 | % |
Over $1 billion | | 0.705 | % |
DWS MFS Strategic Value VIP pays the Advisor a graduated investment management fee based on the average daily net assets of the Portfolio, computed and accrued daily and payable monthly, at the annual rates shown below:
| | | |
Average Daily Net Assets of the Portfolio | | Fee Rate | |
$0–$250 million | | 0.950 | % |
$250–$500 million | | 0.925 | % |
$500 million–$1 billion | | 0.900 | % |
$1 billion–$1.5 billion | | 0.825 | % |
$1.5 billion–$2.5 billion | | 0.800 | % |
Over $2.5 billion | | 0.775 | % |
30
The investment management fees paid by each Portfolio for its last three fiscal years are shown in the table below:
| | | | | | | | | |
Portfolio | | Fiscal 2005 | | Fiscal 2004 | | Fiscal 2003 |
DWS Mid Cap Growth VIP(1) | | $ | 453,434 | | $ | 433,852 | | $ | 379,697 |
DWS Blue Chip VIP | | $ | 2,118,362 | | $ | 1,814,765 | | $ | 1,406,973 |
DWS Core Fixed Income VIP | | $ | 1,883,098 | | $ | 1,589,597 | | $ | 1,453,086 |
| (1) | For the year ended December 31, 2004, the Advisor agreed to limit its fees and reimburse expenses of each class of the DWS Mid Cap Growth VIP to the extent necessary to maintain the annual expenses of Class A at 0.95% and Class B at 1.35%. For the year ended December 31, 2004, the Advisor waived $42,450 of management fees. For the period from January 1, 2005 through September 30, 2005, the Advisor agreed to limit its fees and reimburse expenses of each class of DWS Mid Cap Growth VIP to the extent necessary to maintain the annual expenses of Class A at 0.95% and Class B at 1.35%. Effective October 1, 2005 through September 30, 2006, the Advisor agreed to limit its fees and reimburse expenses of DWS Mid Cap Growth VIP to the extent necessary to maintain the annual expenses of Class B at 1.308% (excluding certain expenses such as extraordinary expenses, taxes, brokerage, interest and fund accounting outsourcing fee savings). Accordingly, for the year ended December 31, 2005, the Advisor waived $32,030 of management fees. In addition, for the year ended December 31, 2005, the Advisor waived $2,113 of record keeping fees for Class B shares of DWS Mid Cap Growth VIP. |
| (2) | For the period from January 1, 2005 through September 30, 2005, the Advisor agreed to limit its fees and reimburse expenses of each class of DWS Global Thematic VIP to the extent necessary to maintain the annual expenses of Class A at 1.56% and Class B at 1.96%. Effective October 1, 2005 through September 30, 2006, the Advisor agreed to limit its fees and reimburse expenses of DWS Global Thematic VIP to the extent necessary to maintain the annual expenses of Class A at 1.04% and Class B at 1.44% (excluding certain expenses such as extraordinary expenses, taxes, brokerage, interest and fund accounting outsourcing fee savings). Accordingly, for the year ended December 31, 2005, the Advisor waived $112,367 of management fees. In addition, for the year ended December 31, 2005, the Advisor waived $1,700 of record keeping fees for Class B shares of DWS Global Thematic VIP. |
| (3) | For the year ended December 31, 2005, the Advisor agreed to limit its fees and reimburse expenses of each class of DWS Large Cap Value VIP to the extent necessary to maintain annual expenses of Class A at 0.80% and Class B at 1.20%. For the year ended December 31, 2005, the Advisor waived $12,690 of management fee and the fee pursuant to the Management Agreement was equivalent to an annual effective rate of 0.75% of the portfolio’s average daily net assets. In addition, for the year ended December 31, 2005, the Advisor waived $536 of record keeping fees for Class B shares of the DWS Large Cap Value VIP. |
| (4) | Effective May 2, 2005 through April 30, 2008, the Advisor agreed to limit its fees and reimburse expenses of DWS Small Cap Growth VIP to the extent necessary to maintain the annual expense of Class A at 0.72% and |
31
| | Class B at 1.09% (excluding certain expenses such as extraordinary expenses, taxes, brokerage, interest and fund accounting outsourcing fee savings). For the year ended December 31, 2005, the Advisor waived $9,538 of record keeping fees for Class B shares of the DWS Small Cap Growth VIP. |
| (5) | For the period from January 1, 2005, through September 30, 2005, the Advisor agreed to limit its fees and reimburse expenses of each class of the DWS Strategic Income VIP to the extent necessary to maintain the annual expenses of Class A at 1.05% and Class B at 1.30%. Effective October 1, 2005 through September 30, 2006, the Advisor agreed to limit its fees and reimburse expenses of DWS Strategic Income VIP to the extent necessary to maintain the annual expenses of Class B at 1.199% (excluding certain expenses such as extraordinary expenses, taxes, brokerage, interest and fund accounting outsourcing fee savings). In addition, for the year ended December 31, 2005, the Advisor waived $5,796 of record keeping fees for Class B shares of the DWS Strategic Income VIP. |
| (6) | Effective May 2, 2005 through April 30, 2008, the Advisor agreed to limit its fees and reimburse expenses of DWS Balanced VIP to the extent necessary to maintain the annual expenses of Class A at 0.51% and Class B 0.89% (excluding certain expenses such as extraordinary expenses, taxes, brokerage, interest and fund accounting outsourcing fee savings). Accordingly, for the year ended December 31, 2005, the Advisor waived $99,176 of management fee and the fee pursuant to the Management Agreement was equivalent to an annual effective rate of 0.47% of the portfolio’s average daily net assets. In addition, for the year ended December 31, 2005, the Advisor waived $8,199 of record keeping fees for Class B shares of DWS Balanced VIP |
| (7) | Commenced operations on November 15, 2004 |
| (8) | For the year ended December 31, 2004, the Advisor agreed to limit its fees and reimburse expenses of each class of the DWS Mercury Large Cap Core VIP to the extent necessary to maintain the annualized expenses of Class A at 1.00% and Class B at 1.20%. For the year ended December 31, 2004, the Advisor waived $1,398 of management fees. In addition, for the period ended December 31, 2004, the Advisor waived $26,726 of other expenses. For the period from January 1, 2005 through September 30, 2005, the Advisor agreed to limit its fees and reimburse expenses of each class of DWS Mercury Large Cap Core VIP to the extent necessary to maintain the annual expenses of Class A at 1.00% and Class B at 1.20%. Effective October 1, 2005 through September 30, 2006, the Advisor agreed to limit its fees and reimburse expenses of DWS Mercury Large Cap Core VIP to the extent necessary to maintain the annual expenses of Class A at 0.873% and Class B at 1.20% (excluding certain expenses such as extraordinary expenses, taxes, brokerage, interest and fund accounting outsourcing fee savings). Accordingly, for the year ended December 31, 2005, the Advisor waived $26,156 of management fee. In addition, for the year ended December 31, 2005, the Advisor waived $1,954 of record keeping fees for Class B shares of the portfolio and $40,416 of other expenses. |
| (9) | For the year ended December 31, 2004, the Advisor agreed to limit its fees and reimburse expenses of each class of the DWS Templeton Foreign Value VIP to the extent necessary to maintain the annualized expenses of Class A at 1.14% and Class B at 1.34%. For the year ended December 31, 2004, the Advisor waived $6,260 of management fees. Accordingly, for the year ended December 31, 2004, the fee pursuant to the Management Agreement was equivalent to an annual effective rate of 0.00% of the Portfolio’s average daily net assets. In addition, for the period ended December 31, 2004, the Advisor waived $26,622 of other expenses. Effective October 1, 2005 through September 30, 2006, the Advisor agreed to limit its fees and reimburse expenses of each class of DWS Templeton Foreign Value VIP to the extent necessary to maintain the annual expenses of Class A at 1.14% and Class B at 1.34% (excluding certain expenses such as extraordinary expenses, taxes, brokerage, interest and fund accounting outsourcing fee savings). For the year ended December 31, 2005, the Advisor waived $112,526 of management fees. In addition, for the year ended December 31, 2005, the Advisor waived $1,741 of record keeping fees for Class B shares of DWS Templeton Foreign Value VIP. |
| (10) | For the period from January 1, 2005 through September 30, 2005, the Advisor agreed to limit its fees and reimburse expenses of each class of DWS Davis Venture Value VIP to the extent necessary to maintain the annual expenses of Class A at 1.15% and Class B at 1.55%. Effective October 1, 2005 through September 30, 2006, the Advisor agreed to limit its fees and reimburse expenses of DWS Davis Venture Value VIP to the extent necessary to maintain the annual expenses of Class A at 0.853% and Class B at 1.003% (excluding certain expenses such as extraordinary expenses, taxes, brokerage, interest, 12b-1 fees and fund accounting outsourcing fee savings). Accordingly, for the year ended December 31, 2005, the Advisor waived $187,410 of |
32
| | management fees. In addition, for the year ended December 31, 2005, the Advisor waived $7,238 of record keeping fees for Class B shares of DWS Davis Venture Value VIP. |
| (11) | For the year ended December 31, 2004, the Advisor agreed to limit its fees and reimburse expenses of each class of the DWS Legg Mason Aggressive Growth VIP to the extent necessary to maintain the annual expenses of Class A at 1.30% and Class B at 1.70%. For the year ended December 31, 2004, the Advisor waived $68,858 of management fees. For the period from January 1, 2005 to July 31, 2005, the Advisor agreed to limit its fees and reimburse expenses of each class of DWS Legg Mason Aggressive Growth VIP to the extent necessary to maintain the annual expenses of Class A at 1.30% and Class B at 1.70%. Effective August 1, 2005 through September 30, 2005, the Advisor agreed to limit its fees and reimburse expenses of DWS Legg Mason Aggressive Growth VIP to the extent necessary to maintain annual expenses of Class A at 1.10% and Class B at 1.50%. Effective October 1, 2005 through September 30, 2006, the Advisor agreed to limit its fees and reimburse expenses of DWS Legg Mason Aggressive Growth VIP to the extent necessary to maintain the annual expense of Class A at 0.908% and Class B at 1.058% (excluding certain expenses such as extraordinary expenses, taxes, brokerage, interest, 12b-1 fees and fund accounting outsourcing fee savings). Accordingly, for the year ended December 31, 2005, the Advisor waived $119,238 of management fees. |
| (12) | For the period from January 1, 2005 through September 30, 2005, the Advisor agreed to limit the fees and reimburse each class of DWS Janus Growth & Income VIP to the extent necessary to maintain annual operating expenses of Class A at 1.15% and Class B at 1.55%. Effective May 2, 2005, through April 30, 2006, the Advisor agreed to limit the fees and reimburse expenses of the DWS Janus Growth & Income VIP to the extent necessary to maintain annual operating expenses of Class A at 0.95%. Effective May 2, 2005, through September 30, 2005, the Advisor agreed to limit the fees and reimburse expenses of DWS Janus Growth & Income VIP to the extent necessary to maintain annual operating expenses of Class B at 1.35%. Effective October 1, 2005 through September 30, 2006, the Advisor agreed to limit the fees and reimburse expenses of DWS Janus Growth & Income VIP to the extent necessary to maintain annual expenses of Class B at 1.003% (excluding certain expenses such as extraordinary expense, taxes, brokerage, interest, 12b-1 fees and fund accounting outsourcing fee savings). Accordingly, for the year ended December 31, 2005, the Advisor waived $6,113 of record keeping fees for Class B shares of the portfolio. |
| (13) | For the year ended December 31, 2004, the Advisor agreed to limit its fees and reimburse expenses of each class of the DWS MFS Strategic Value VIP to the extent necessary to maintain the annualized expenses of Class A at 1.15% and Class B at 1.55%. Accordingly, for the year ended December 31, 2004, the Advisor waived $89,208 of management fees. For the period from January 1, 2005, through September 30, 2005, the Advisor agreed to limit its fees and reimburse expenses of each class of DWS MFS Strategic Value VIP to the extent necessary to maintain the annual expenses of Class A at 1.15% and Class B at 1.55%. Effective October 1, 2005 through September 30, 2006, the Advisor agreed to limit it fees and reimburse expenses of DWS MFS Strategic Value VIP to the extent necessary to maintain the annual operating expense of Class A at 0.86% and Class B at 1.010%. (excluding certain expenses such as extraordinary expenses, taxes, brokerage, interest, 12b-1 fees and fund accounting outsourcing fee savings). Accordingly, for year ended December 31, 2005, the Advisor waived $98,710 of management fees. |
| (14) | For the period from January 1, 2005 through September 30, 2005, the Advisor agreed to limit its fees and reimburse expenses of each class of DWS Oak Strategic Equity VIP to the extent necessary to maintain the annual expenses of Class A at 1.15% and Class B at 1.55%. Effective October 1, 2005 through September 30, 2006, the Advisor agreed to limit its fees and reimburse expenses of DWS Oak Strategic Equity VIP to the extent necessary to maintain the annual expenses of Class B at 1.051% (excluding certain expenses such as extraordinary expenses, taxes, brokerage, interest, 12b-1 fees and fund accounting outsourcing fee savings). For the year ended December 31, 2005, the Advisor waived $7,449 of record keeping fees for Class B shares of DWS Oak Strategic Equity VIP. |
| (15) | For the period from January 1, 2005 through September 30, 2005, the Advisor agreed to limit its fees and reimburse expenses of each class of DWS Turner Mid Cap Growth VIP to the extent necessary to maintain the annual expenses of Class A at 1.30% and Class B at 1.70%. Effective October 1, 2005 through September 30, 2006, the Advisor agreed to limit its fees and reimburse expenses of DWS Turner Mid Cap Growth VIP to the extent necessary to maintain the annual expense of Class B at 1.087% (excluding certain expenses such as extraordinary expenses, taxes, brokerage, interest, 12b-1 fees and fund accounting fee savings). For the year |
33
| | ended December 31, 2005, the Advisor waived $6,545 of record keeping fees for Class B shares of DWS Turner Mid Cap Growth VIP. |
| (16) | The Advisor agreed to limit its management fee to 0.85% for the Scudder Global Blue Chip Portfolio through April 30, 2003. Accordingly, for the year ended December 31, 2003 the Advisor waived $142,979 of management fee and the fees pursuant to the Management Agreement were equivalent to an annual effective rate of 0.70% for the Portfolio’s average daily net assets. |
| (17) | For the year ended December 31, 2003 the Advisor agreed to limit its fees and reimburse expenses of each class of the SVS INVESCO Dynamic Growth Portfolio to the extent necessary to maintain the annualized expenses of Class A at 1.30% and Class B at 1.55%. Effective May 1, 2003 the Advisor increased the expense limitation for Class B to 1.70%. For the year ended December 31, 2003 the Advisor waived $48,767 of management fees. |
| (18) | For the year ended December 31, 2003 the Advisor agreed to limit its fees and reimburse expenses of each class of the SVS MFS Strategic Value Portfolio to the extent necessary to maintain the annualized expenses of Class A at 1.15% and Class B at 1.40%. Effective May 1, 2003 the Advisor increased the expense limitation for Class B to 1.55%. Accordingly, for the year ended December 31, 2003 the Advisor waived $80,609 of management fee and the fees pursuant to the Management Agreement were equivalent to an annual effective rate of 0.17% of the Portfolio’s average daily net assets. |
Subadvisor to DWS Core Fixed Income VIP. On December 1, 2005, Aberdeen Asset Management PLC (“Aberdeen PLC”) acquired from Deutsche Bank AG, parts of its asset management business and related assets based in London and Philadelphia.
Effective December 2, 2005, and pursuant to a written contract with the Advisor, Aberdeen Asset Management Inc. (“AAMI”) is the sub-advisor to the Portfolio (the “Aberdeen Subadvisory Agreement”). As subadvisor, AAMI, under the supervision of the Board of Trustees and the Advisor, makes the Portfolio’s investment decisions, buys and sells securities for the Portfolio and conducts the research that leads to these purchase and sale decisions. AAMI is also responsible for selecting brokers and dealers and for negotiating brokerage commissions and dealer charges. AAMI provides a full range of international investment advisory services to institutional and retail clients. AAMI is a direct wholly-owned subsidiary of Aberdeen PLC, and a registered investment advisor under the Investment Advisers Act of 1940, as amended.
Under the terms of the Aberdeen Subadvisory Agreement, AAMI agrees, subject to the supervision and control of the Advisor and the Board, to manage the securities and assets of the Portfolio entrusted to it by the Advisor and in accordance with the Portfolio’s investment objective, policies and restrictions. AAMI is paid for its services by the Advisor, and not the Portfolio, from its fee as investment advisor to the Portfolio. As compensation for its services under the Aberdeen Subadvisory Agreement, the Advisor pays AAMI a fee at the annual rate of 0.38% of the average daily net assets of the Portfolio, computed daily and paid monthly.
The Aberdeen Subadvisory Agreement will have an initial term of two years (unless sooner terminated) and will remain in effect from year to year thereafter if approved annually (i) by the Board or by the vote of a “majority of the outstanding voting securities” of the Portfolio, and (ii) by a majority of the Independent Board Members who are not parties to the Agreement, cast in person at a meeting called for such purpose.
AAMI is obligated to pay all expenses (excluding brokerage costs, custodian fees, fees of independent registered public accounting firms or other expenses of the Portfolio to be borne by the Portfolio or the Trust in connection with the performance of its services). The Portfolio bears certain other expenses incurred in its operation. The services of AAMI are not deemed to be exclusive and nothing in the Aberdeen Subadvisory Agreement prevents AAMI or its affiliates from providing similar services to other investment companies and other clients (whether or not their investment objective and policies are similar to those of the Portfolio) or from engaging in other activities.
Under the Aberdeen Subadvisory Agreement, AAMI will be liable (i) if it causes the Portfolio to be in violation of any applicable federal or state law, rule or regulation or any investment policy or restriction set forth in the Prospectus or any written guidelines, policies or instructions provided in writing by the Board or the Advisor, and (ii) for its willful misfeasance, bad faith or gross negligence in the performance of its duties or its reckless disregard of its obligations and duties under the Aberdeen Subadvisory Agreement.
34
The subadvisory fee paid by DeIM to AAMI for DWS Core Fixed Income VIP for the period December 2, 2005 to December 31, 2005 was $106,768. Subadvisor to DWS Davis Venture Value VIP. Davis Selected Advisors, L.P. (“DSA”), 2949 E. Elvira Road, Suite 101, Tucson, AZ 85706, is the subadvisor to DWS Davis Venture Value VIP. DSA has served as subadvisor to the Portfolio since its inception. DSA is a limited partnership, Davis Investments, LLC is the general partner; Christopher C. Davis is the managing member of Davis Investments, LLC.
Under the terms of the subadvisory agreement, DSA manages the investment and reinvestment of the Portfolio’s assets and will provide such investment advice, research and assistance as the Advisor may, from time to time, reasonably request.
The subadvisory agreement provides that DSA will not be liable for any error of judgment or mistake of law or for any loss suffered by the Portfolio in connection with matters to which the subadvisory agreement relates, except a loss resulting from willful misfeasance, bad faith or gross negligence on the part of DSA in the performance of its duties or from reckless disregard by DSA of its obligations and duties under the subadvisory agreement.
The subadvisory agreement with DSA was last renewed on September 23, 2005 and will continue in effect from year to year, but only as long as such continuance is specifically approved at least annually (a) by a majority of the trustees who are not parties to such agreement or interested persons of any such party except in their capacity as trustees of the Fund, and (b) by a majority of the shareholders or the Board of Trustees of the Fund. The subadvisory agreement may be terminated at any time upon 60 days’ notice by DSA, by DeIM or by the Board of Trustees of the Fund or by majority vote of the outstanding shares of the Portfolio and will terminate automatically upon assignment or upon termination of the Portfolio’s investment management agreement.
The Advisor pays DSA for its services a subadvisory fee, payable monthly, at the annual rates shown below:
| | | |
Average Daily Net Assets of the Portfolio | | Annual Subadvisory Fee Rate | |
$0–$100 million | | 0.50 | % |
Next $400 million | | 0.45 | % |
On amounts over $500 million | | 0.40 | % |
The subadvisory fees paid by DeIM to DSA for DWS Davis Venture Value VIP for the past three fiscal years are as follows:
| | | | | | | | | |
| | | 2005 | | 2004 | | 2003 |
DWS Davis Venture Value VIP | | $ | 1,651,883 | | $ | 1,347,251 | | $ | 909,672 |
Subadvisor to DWS Dreman Financial Services VIP, DWS Dreman High Return Equity VIP and DWS Dreman Small Cap Value VIP. Dreman Value Management, L.L.C. (“DVM”), 520 East Cooper Avenue, Aspen, Colorado, is the subadvisor to DWS Dreman High Return Equity VIP, DWS Dreman Financial Services VIP and DWS Dreman Small Cap Value VIP. DVM is controlled by David N. Dreman. DVM serves as subadvisor pursuant to the terms of a subadvisory agreement between it and the Advisor for each Portfolio. DVM was formed in April 1997 and has served as subadvisor for DWS Dreman Financial Services VIP and DWS Dreman High Return Equity VIP since their inception and for DWS Dreman Small Cap Value VIP since January 18, 2002. DVM is controlled by David Dreman.
Under the terms of each subadvisory agreement, DVM manages the investment and reinvestment of each Portfolio’s assets and will provide such investment advice, research and assistance as the Advisor may, from time to time, reasonably request.
Each subadvisory agreement provides that DVM will not be liable for any error of judgment or mistake of law or for any loss suffered by the Portfolio in connection with matters to which the subadvisory agreement relates, except a loss resulting from willful misfeasance, bad faith or gross negligence on the part of DVM in the performance of its duties or from reckless disregard by DVM of its obligations and duties under the subadvisory agreement.
The subadvisory agreement with DVM for DWS Dreman Small Cap Value VIP has an initial term ending June 30, 2007. Each subadvisory agreement was last renewed on September 23, 2005 and will continue in effect from year to year, but only as long as such continuance is specifically approved at least annually (a) by a majority of the trustees who are not parties to such agreement or interested persons of any such party except in their capacity as trustees of the Fund, and
35
(b) by the shareholders or the Board of Trustees of the Fund. Each subadvisory agreement may be terminated at any time upon 60 days’ notice by the Advisor or by the Board of Trustees of the Fund or by majority vote of the outstanding shares of the Portfolio, and will terminate automatically upon assignment or upon termination of the Portfolio’s investment management agreement. DVM may terminate the subadvisory agreement upon 90 days’ notice to the Advisor.
Pursuant to separate subadvisory agreements dated April 8, 2002 and April 5, 2002, DVM receives a subadvisory fee of 1/12 of an annualized rate of 0.3375% of 1% of the average daily net assets for DWS Dreman Financial Services VIP and DWS Dreman High Return Equity VIP, respectively. Effective January 18, 2002, DVM also receives a subadvisory fee of 1/12 of an annualized rate of 0.375% of 1% of the average daily net assets for DWS Dreman Small Cap Value VIP. Fees paid to DVM for the last three fiscal years were as follows:
| | | | | | | | | |
| | | 2005 | | 2004 | | 2003 |
DWS Dreman Financial Services VIP | | $ | 502,180 | | $ | 529,182 | | $ | 376,743 |
DWS Dreman High Return Equity VIP | | $ | 2,946,412 | | $ | 2,568,258 | | $ | 1,800,568 |
DWS Dreman Small Cap Value VIP | | $ | 1,995,042 | | $ | 1,568,583 | | $ | 966,304 |
Subadvisor to DWS Janus Growth & Income VIP and DWS Janus Growth Opportunities VIP. Janus Capital Management LLC (“Janus Capital”) 151 Detroit Street, Denver, Colorado 80206-4928, is the subadvisor to DWS Janus Growth & Income VIP and DWS Janus Growth Opportunities VIP. Janus Capital is a direct subsidiary of Janus Capital Group Inc. Janus Capital began serving as investment advisor to Janus Fund in 1970 and currently serves as investment advisor to all of the Janus Funds, acts as subadvisor for a number of private-label mutual funds and provides separate account advisory services for institutional accounts. Janus Capital has served as subadvisor to the Portfolios since their inception on October 29, 1999.
Under the terms of each subadvisory agreement, Janus Capital manages the investment and reinvestment of each Portfolio’s assets and will provide such investment advice, research and assistance as the Advisor may, from time to time, reasonably request.
Each subadvisory agreement provides that Janus Capital will not be liable for any error of judgment or mistake of law or for any loss suffered by the Portfolio in connection with matters to which the subadvisory agreement relates, except a loss resulting from willful misfeasance, bad faith or gross negligence on the part of Janus Capital in the performance of its duties or from reckless disregard by Janus Capital of its obligations and duties under the subadvisory agreement.
Each subadvisory agreement with Janus Capital was last renewed on September 23, 2005 and will continue in effect from year to year, but only as long as such continuance is specifically approved at least annually (a) by a majority of the trustees who are not parties to such agreement or interested persons of any such party except in their capacity as trustees of the Fund, and (b) by a majority of the shareholders or the Board of Trustees of the Fund. The subadvisory agreement may be terminated at any time upon 60 days’ notice by Janus Capital, by the Advisor or by the Board of Trustees of the Fund or by majority vote of the outstanding shares of the Portfolio, and will terminate automatically upon assignment or upon termination of the Portfolio’s investment management agreement.
The Advisor pays Janus Capital for its services a subadvisory fee, payable monthly, at the annual rates shown below:
| | | |
Average Daily Net Assets of the Portfolios | | Annual Subadvisory Fee Rate | |
First $25 million | | 0.45 | % |
Next $125 million | | 0.40 | % |
Next $600 million | | 0.375 | % |
Over $750 million | | 0.35 | % |
The subadvisory fees paid by DeIM to Janus Capital for DWS Janus Growth & Income VIP and DWS Janus Growth Opportunities VIP for the past three fiscal years is as follows:
| | | | | | | | | |
| | | 2005 | | 2004 | | 2003 |
DWS Janus Growth & Income VIP | | $ | 569,033 | | $ | 1,036,387 | | $ | 936,074 |
DWS Janus Growth Opportunities VIP | | $ | 1,001,098 | | $ | 696,528 | | $ | 649,430 |
36
Subadvisor to DWS Legg Mason Aggressive Growth VIP. Effective August 1, 2005, Salomon Brothers Asset Management Inc. (“SBAM”) is the subadvisor to the Portfolio, replacing INVESCO Institutional (N.A.) Inc. SBAM is a wholly owned subsidiary of Legg Mason, Inc. The portfolio was renamed DWS Legg Mason Aggressive Growth VIP on May 1, 2006. The Advisor pays SBAM for its services as subadvisor a subadvisory fee, payable monthly, at the annual rates shown below:
| | | |
Average Daily Net Assets | | Fee Rate | |
First $100 million | | 0.425 | % |
Next $400 million | | 0.400 | % |
Over $500 million | | 0.350 | % |
The subadvisory agreement was last renewed on September 23, 2005 and will continue in effect from year to year, but only as long as such continuance is specifically approved at least annually (a) by a majority of the Trustees of the Fund who are not parties to such agreement or interested persons of any such party except in their capacity as Trustees of the Fund, and (b) by the shareholders or the Board of Trustees of the Fund. The subadvisory agreement may be terminated at any time upon 60 days’ written notice by the Advisor or by the Board of Trustees of the Fund or by vote of a majority of the outstanding voting securities of the Portfolio, and will terminate automatically upon assignment or upon termination of the Portfolio’s investment management agreement.
The subadvisory fee paid by DeIM to SBAM for DWS Legg Mason Aggressive Growth VIP for the period August 1, 2005 to December 31, 2005 was $79,177.
Subadvisor to DWS Mercury Large Cap Core VIP. Fund Asset Management, L.P., doing business as Mercury Advisors, 800 Scudders Mill Road, Plainsboro, New Jersey 08536, a division of Merrill Lynch Investment Management (“MLIM”) is the Portfolio’s Subadvisor and is responsible for managing the Portfolio’s assets. The Advisor compensates MLIM out of the management fee it receives from the Portfolio.
The subadvisory agreement was last renewed on September 23, 2005 and will continue in effect from year to year, but only as long as such continuance is specifically approved at least annually (a) by a majority of the Trustees of the Fund who are not parties to such agreement or interested persons of any such party except in their capacity as Trustees of the Fund, and (b) by the shareholders or the Board of Trustees of the Fund. The subadvisory agreement may be terminated at any time upon 60 days’ written notice by the Advisor or by the Board of Trustees of the Fund or by vote of a majority of the outstanding voting securities of the Portfolio, and will terminate automatically upon assignment or upon termination of the Portfolio’s investment management agreement. As of December 31, 2005, MLIM and its affiliates manage over $ billion in client assets worldwide.
DeIM pays a fee to MLIM for serving as subadvisor to the Portfolio as shown below:
| | | |
Average Daily Net Assets of the Portfolio | | Annualized Rate | |
On the first $50 million | | 0.470 | % |
On the next $200 million | | 0.440 | % |
On the next $250 million | | 0.400 | % |
On the next $500 million | | 0.350 | % |
On the next $1.5 billion | | 0.325 | % |
Over $2.5 billion | | 0.300 | % |
The subadvisory fees paid by DeIM to MLIM for DWS Mercury Large Cap Core VIP for the past two fiscal years are as follows:
| | | | | | |
| | | 2005 | | 2004 |
DWS Mercury Large Cap Core VIP | | $ | 13,718 | | $ | 737 |
Subadvisor to DWS MFS Strategic Value VIP. Massachusetts Financial Services Company (“MFS”), 500 Boylston Street, Boston, Massachusetts 02116, is the subadvisor to DWS MFS Strategic Value VIP. MFS is controlled by Sun Life of Canada (US) Financial Services Holdings, Inc. MFS has served as the subadvisor to the Portfolio since its inception.
37
Under the terms of the subadvisory agreement, MFS manages the investment and reinvestment of the Portfolio’s assets and will provide such investment advice, research and assistance as the Advisor may, from time to time, reasonably request.
The subadvisory agreement provides that MFS will not be liable for any error of judgment or mistake of law or for any loss suffered by the Portfolio in connection with matters to which the subadvisory agreement relates, except a loss resulting from willful misfeasance, bad faith or gross negligence on the part of MFS in the performance of its duties or from reckless disregard by MFS of its obligations and duties under the subadvisory agreement.
The subadvisory agreement with MFS was last renewed on September 23, 2005 and will continue in effect from year to year, but only as long as such continuance is specifically approved at least annually (a) by a majority of the trustees who are not parties to such agreement or interested persons of any such party except in their capacity as trustees of the Fund, and (b) by a majority of the shareholders or the Board of Trustees of the Fund. The subadvisory agreement may be terminated at any time upon 60 days’ notice by MFS, by the Advisor or by the Board of Trustees of the Fund or by majority vote of the outstanding shares of the Portfolio and will terminate automatically upon assignment or upon termination of the Portfolio’s investment management agreement.
The Advisor pays MFS for its services a subadvisory fee, payable monthly, at the annual rates shown below:
| | | |
Average Daily Net Assets of the Portfolio | | Annual Subadvisory Fee Rate | |
On the first $100 million | | 0.475 | % |
On the next $150 million | | 0.425 | % |
On the next $250 million | | 0.375 | % |
On the next $500 million | | 0.350 | % |
On the next $500 million | | 0.275 | % |
Over $1.5 billion | | 0.250 | % |
The subadvisory fee paid by DeIM to MFS for DWS MFS Strategic Value VIP for the past three fiscal years is as follows:
| | | | | | | | | |
| | | 2005 | | 2004 | | 2003 |
DWS MFS Strategic Value VIP | | $ | 237,524 | | $ | 157,472 | | $ | 49,179 |
Subadvisor to DWS Oak Strategic Equity VIP. Oak Associates, Ltd. (“Oak”), 3875 Embassy Parkway, Suite 250, Akron, OH 44333, is the subadvisor to DWS Oak Strategic Equity VIP. Oak has served as subadvisor to the Portfolio since its inception on May 1, 2001.
Under the terms of the subadvisory agreement, Oak manages the investment and reinvestment of the Portfolio’s assets and will provide such investment advice, research and assistance as the Advisor may, from time to time, reasonably request.
The subadvisory agreement provides that Oak will not be liable for any error of judgment or mistake of law or for any loss suffered by the Portfolio in connection with matters to which the subadvisory agreement relates, except a loss resulting from willful misfeasance, bad faith or gross negligence on the part of Oak in the performance of its duties or from reckless disregard by Oak of its obligations and duties under the subadvisory agreement.
The subadvisory agreement with Oak was last renewed on September 23, 2005 and will continue in effect from year to year, but only as long as such continuance is specifically approved at least annually (a) by a majority of the trustees who are not parties to such agreement or interested persons of any such party except in their capacity as trustees of the Fund, and (b) by a majority of the shareholders or the Board of Trustees of the Fund. The subadvisory agreement may be terminated at any time upon 60 days’ notice by Oak, by DeIM or by the Board of Trustees of the Fund or by majority vote of the outstanding shares of the Portfolio and will terminate automatically upon assignment or upon termination of the Portfolio’s investment management agreement.
38
The Advisor pays Oak for its services a subadvisory fee, payable monthly, at the annual rates shown below:
| | | |
Average Daily Net Assets of the Portfolio | | Annual Subadvisory Fee Rate | |
On all assets | | 0.300 | % |
The subadvisory fees paid by DeIM to Oak for DWS Oak Strategic Equity VIP for the past three fiscal years are as follows:
| | | | | | | | | |
| | | 2005 | | 2004 | | 2003 |
DWS Oak Strategic Equity VIP | | $ | 239,046 | | $ | 269,807 | | $ | 179,780 |
Subadvisor to DWS Templeton Foreign Value VIP. Templeton Investment Counsel LLC (“Templeton”), 500 East Broward Boulevard, Suite 2100, Fort Lauderdale, FL, is the subadvisor for the Portfolio and is responsible for managing the Portfolio’s assets. Templeton is an indirect, wholly owned subsidiary of Franklin Resources, Inc. The Advisor compensates Templeton out of the management fee it receives from the Portfolio. Templeton is an indirect, wholly owned subsidiary of Franklin Resources, Inc. (“Resources”), a publicly owned company engaged in the financial services industry through its subsidiaries. Charles B. Johnson and Rupert H. Johnson are the principal shareholders of Resources.
The Templeton organization has been investing globally since 1940. Templeton and its affiliates have offices in Argentina, Australia, Bahamas, Belgium, Brazil, Canada, China, France, Germany, Holland (The Netherlands), Hong Kong, India, Ireland, Italy, Japan, Luxembourg, Poland, Russia, Singapore, South Korea, Spain, Sweden, Switzerland, Taiwan, Turkey, United Kingdom, United Arab Emirates and the United States.
Templeton and its affiliates manage numerous other investment companies and accounts. Templeton may give advice and take action with respect to any of the other funds it manages, or for its own account, that may differ from action taken by it on behalf of the Portfolio. Similarly, with respect to the Portfolio, Templeton is not obligated to recommend, buy or sell, or to refrain from recommending, buying or selling any security that Templeton or access persons, as defined by applicable federal securities laws, may buy or sell for its or their own account or for the accounts of any other fund or account. Templeton is not obligated to refrain from investing in securities held by the Portfolio or other funds or accounts it manages. Because Templeton is a subsidiary of a financial holding company (FHC) under the Gramm-Leach-Bliley Act of 1999, federal regulations applicable to FHCs may limit or restrict the Portfolio’s ability to acquire or hold a position in a given security when it might otherwise be advantageous for the Portfolio to acquire or hold that security.
The subadvisory agreement was last renewed on September 23, 2005 and will continue in effect from year to year, but only as long as such continuance is specifically approved at least annually (a) by a majority of the Trustees of the Fund who are not parties to such agreement or interested persons of any such party except in their capacity as Trustees of the Fund, and (b) by the shareholders or the Board of Trustees of the Fund. The subadvisory agreement may be terminated at any time upon 60 days’ written notice by the Advisor or by the Board of Trustees of the Fund or by vote of a majority of the outstanding voting securities of the Portfolio, and will terminate automatically upon assignment or upon termination of the Portfolio’s investment management agreement.
DeIM pays a fee to Templeton for serving as subadvisor to the Portfolio as shown below:
| | | |
Average Daily Net Assets | | Annualized Rate | |
On the first $50 million | | 0.625 | % |
On the next $150 million | | 0.465 | % |
On the next $300 million | | 0.375 | % |
Over $500 million | | 0.350 | % |
The subadvisory fees paid by DeIM to Templeton for DWS Templeton Foreign Value VIP for the past two fiscal years are as follows:
| | | | | | |
| | | 2005 | | 2004 |
DWS Templeton Foreign Value VIP | | $ | 74,309 | | $ | 4,131 |
39
Subadvisor to DWS Turner Mid Cap Growth VIP. Turner Investment Partners, Inc. (“TIP”), 1235 Westlakes Drive, Suite 350, Berwyn, PA 19312, is the subadvisor to DWS Turner Mid Cap Growth VIP. TIP is controlled by Robert E. Turner and Mark D. Turner. TIP has served as subadvisor to the Portfolio since its inception on May 1, 2001.
Under the terms of the subadvisory agreement, TIP manages the investment and reinvestment of the Portfolio’s assets and will provide such investment advice, research and assistance as the Advisor may, from time to time, reasonably request.
The subadvisory agreement provides that TIP will not be liable for any error of judgment or mistake of law or for any loss suffered by the Portfolio in connection with matters to which the subadvisory agreement relates, except a loss resulting from willful misfeasance, bad faith or gross negligence on the part of TIP in the performance of its duties or from reckless disregard by TIP of its obligations and duties under the subadvisory agreement.
The subadvisory agreement with TIP was last renewed on September 23, 2005 and will continue in effect from year to year, but only as long as such continuance is specifically approved at least annually (a) by a majority of the trustees who are not parties to such agreement or interested persons of any such party except in their capacity as trustees of the Fund, and (b) by a majority of the shareholders or the Board of Trustees of the Fund. The subadvisory agreement may be terminated at any time upon 60 days’ notice by TIP, by the Advisor or by the Board of Trustees of the Fund or by majority vote of the outstanding shares of the Portfolio and will terminate automatically upon assignment or upon termination of the Portfolio’s investment management agreement.
The Advisor pays TIP for its services a subadvisory fee, payable monthly, at the annual rates shown below:
| | | |
Average Daily Net Assets of the Portfolio | | Annual Subadvisory Fee Rate | |
$0–$50 million | | 0.550 | % |
Next $250 million | | 0.525 | % |
On amounts over $250 million | | 0.500 | % |
The subadvisory fees paid by DeIM to TIP for DWS Turner Mid Cap Growth VIP for the past three fiscal years are as follows:
| | | | | | | | | |
| | | 2005 | | 2004 | | 2003 |
DWS Turner Mid Cap Growth VIP | | $ | 725,709 | | $ | 693,454 | | $ | 465,545 |
PORTFOLIO TRANSACTIONS
The Advisor is generally responsible for placing the orders for the purchase and sale of portfolio securities, including the allocation of brokerage. With respect to those portfolios for which a sub-investment advisor manages the portfolio’s investments, references in this section to the “Advisor” should be read to mean a “subadvisor” unless specifically noted.
The policy of the Advisor in placing orders for the purchase and sale of securities for the portfolios is to seek best execution, taking into account such factors, among others, as price; commission (where applicable); the broker-dealer’s ability to ensure that securities will be delivered on settlement date; the willingness of the broker-dealer to commit its capital and purchase a thinly traded security for its own inventory; whether the broker-dealer specializes in block orders or large program trades; the broker-dealer’s knowledge of the market and the security; the broker-dealer’s ability to maintain confidentiality; the financial condition of the broker-dealer; and whether the broker-dealer has the infrastructure and operational capabilities to execute and settle the trade. The Advisor seeks to evaluate the overall reasonableness of brokerage commissions with commissions charged on comparable transactions and compares the brokerage commissions (if any) paid by the funds to reported commissions paid by others. The Advisor routinely reviews commission rates, execution and settlement services performed, and makes internal and external comparisons.
Commission rates on transactions in equity securities on U.S. securities exchanges are subject to negotiation. Commission rates on transactions in equity securities on foreign securities exchanges are generally fixed. Purchases and sales of fixed-income securities and other over-the-counter securities are effected on a net basis, without the payment of brokerage commissions. Transactions in fixed income and other over-the-counter securities are generally placed by the Advisor with the principal market makers for these securities unless the Advisor reasonably believes more favorable results are available elsewhere. Transactions with dealers serving as market makers reflect the spread between the bid and asked prices. Purchases of underwritten issues will include an underwriting fee paid to the underwriter. Money
40
market instruments are normally purchased in principal transactions directly from the issuer or from an underwriter or market maker.
It is likely that the broker-dealers selected based on the considerations described in this section will include firms that also sell shares of the portfolios to their customers. However, the Advisor does not consider sales of shares of the portfolios as a factor in the selection of broker-dealers to execute portfolio transactions for the Portfolios and, accordingly, has implemented policies and procedures reasonably designed to prevent its traders from considering sales of shares of the portfolios as a factor in the selection of broker-dealers to execute portfolio transactions for the portfolios.
The Advisor is permitted by Section 28(e) of the Securities Exchange Act of 1934, as amended (the “1934 Act”), when placing portfolio transactions for a portfolio, to cause the portfolio to pay brokerage commissions in excess of that which another broker-dealer might charge for executing the same transaction in order to obtain research and brokerage services. The Advisor, however, does not as a matter of policy execute transactions with broker-dealers for a portfolio in order to obtain research from such broker-dealers that is prepared by third parties (i.e., “third party research”). However, the Advisor may from time to time, in reliance on Section 28(e) of the 1934 Act, obtain proprietary research prepared by the executing broker-dealer in connection with a transaction or transactions through that broker-dealer (i.e., “proprietary research”). Consistent with the Advisor’s policy regarding best execution, where more than one broker is believed to be capable of providing best execution for a particular trade, the Advisor may take into consideration the receipt of proprietary research in selecting the broker-dealer to execute the trade. Proprietary research provided by broker-dealers may include, but is not limited to, information on the economy, industries, groups of securities, individual companies, statistical information, accounting and tax law interpretations, political developments, legal developments affecting portfolio securities, technical market action, pricing and appraisal services, credit analysis, risk measurement analysis, performance analysis, and measurement and analysis of corporate responsibility issues. Proprietary research is typically received in the form of written reports, telephone contacts and personal meetings with security analysts, but may also be provided in the form of access to various computer software and associated hardware, and meetings arranged with corporate and industry representatives.
In reliance on Section 28(e) of the 1934 Act, the Advisor may obtain from broker-dealers brokerage services in the form of software and/or hardware that is used in connection with executing trades. Typically, this computer software and/or hardware is used by the Advisor to facilitate trading activity with those broker-dealers.
Proprietary research and brokerage services received from a broker-dealer chosen to execute a particular trade may be useful to the Advisor in providing services to clients other than the fund making the trade, and not all such information is used by the Advisor in connection with such portfolio. Conversely, such information provided to the Advisor by broker-dealers through which other clients of the Advisor effect securities transactions may be useful to the Advisor in providing services to a portfolio.
The Advisor will monitor regulatory developments and market practice in the use of client commissions to obtain research and brokerage services, whether proprietary or third party.
Investment decisions for each portfolio and for other investment accounts managed by the Advisor are made independently of each other in light of differing conditions. However, the same investment decision may be made for two or more of such accounts. In such cases, simultaneous transactions are inevitable. To the extent permitted by law, the Advisor may aggregate the securities to be sold or purchased for a portfolio with those to be sold or purchased for other accounts in executing transactions. Purchases or sales are then averaged as to price and commission and allocated as to amount in a manner deemed equitable to each account. While in some cases this practice could have a detrimental effect on the price paid or received by the portfolio, or on the size of the position obtained or disposed of for the portfolio, in other cases it is believed that the ability to engage in volume transactions will be beneficial to the portfolio.
Deutsche Bank AG or one of its affiliates (or in the case of a sub-adviser, the sub-adviser or one of its affiliates) may act as a broker for the portfolios and receive brokerage commissions or other transaction-related compensation from the portfolios in the purchase and sale of securities, options or futures contracts when, in the judgment of the Advisor, and in accordance with procedures approved by the Fund’s Board, including a majority of the Independent Trustees, the affiliated broker will be able to obtain a price and execution at least as favorable as those obtained from other qualified brokers and if, in the transaction, the affiliated broker charges the portfolio a rate consistent with that charged to comparable unaffiliated customers in similar transactions.
41
DWS Mid Cap Growth VIP: The Portfolio is required to identify any securities of its “regular brokers or dealers” (as such term is defined in the 1940 Act) that the Portfolio has acquired during the most recent fiscal year. As of December 31, 2005, the Portfolio held the following securities of its regular brokers or dealers:
| | | |
Name of Regular Broker or Dealer or Parent (Issuer) | | Value of Securities Owned as of December 31, 2005 (in thousands) |
Affiliated Managers Group, Inc. | | $ | 1,789 |
Legg Mason, Inc. | | $ | 1,296 |
DWS Blue Chip VIP: The Portfolio is required to identify any securities of its “regular brokers or dealers” (as such term is defined in the 1940 Act) that the Portfolio has acquired during the most recent fiscal year. As of December 31, 2005, the Portfolio held the following securities of its regular brokers or dealers:
| | | |
Name of Regular Broker or Dealer or Parent (Issuer) | | Value of Securities Owned as of December 31, 2005 (in thousands) |
Citigroup | | $ | 11,676 |
Wells Fargo & Co. | | $ | 7,439 |
US Bancorp | | $ | 5,601 |
General Electric Capital Corp. | | $ | 4,833 |
Goldman Sachs | | $ | 4,317 |
Mellon Financial Corp. | | $ | 3,089 |
PNC Financial Services Group | | $ | 2,399 |
KeyCorp. | | $ | 1,818 |
Morgan Stanley | | $ | 1,600 |
Franklin Resources, Inc. | | $ | 1,006 |
DWS Core Fixed Income VIP: The Portfolio is required to identify any securities of its “regular brokers or dealers” (as such term is defined in the 1940 Act) that the Portfolio has acquired during the most recent fiscal year. As of December 31, 2005, the Portfolio held the following securities of its regular brokers or dealers:
| | | |
Name of Regular Broker or Dealer or Parent (Issuer) | | Value of Securities Owned as of December 31, 2005 (in thousands) |
Merrill Lynch & Co. | | $ | 4,367 |
Amsouth Bancorp | | $ | 4,049 |
HSBC Bank USA | | $ | 1,185 |
Goldman Sachs | | $ | 372 |
BNP Paribas | | $ | 291 |
DWS Global Thematic VIP: The Portfolio is required to identify any securities of its “regular brokers or dealers” (as such term is defined in the 1940 Act) that the Portfolio has acquired during the most recent fiscal year. As of December 31, 2005, the Portfolio held the following securities of its regular brokers or dealers:
| | | |
Name of Regular Broker or Dealer or Parent (Issuer) | | Value of Securities Owned as of December 31, 2005 (in thousands) |
Goldman Sachs | | $ | 1,453 |
Julius Baer International, Ltd. | | $ | 1,136 |
Skandinaviska Enskilda Banken AB | | $ | 1,066 |
Citigroup | | $ | 953 |
Societe Generale | | $ | 716 |
DBS Group Holdings, Ltd. | | $ | 655 |
Bangkok Bank | | $ | 627 |
Credit Suisse Group | | $ | 612 |
Yuan Ta Core Pacific | | $ | 523 |
ABN Amro Holdings NV | | $ | 516 |
Erste Bank Der Oesterreichischen Sparkassen | | $ | 366 |
Sinopac Financial Holdings | | $ | 303 |
42
DWS Government & Agency Securities VIP: The Portfolio is required to identify any securities of its “regular brokers or dealers” (as such term is defined in the 1940 Act) that the Portfolio has acquired during the most recent fiscal year. As of December 31, 2005, the Portfolio did not hold any securities of its regular brokers or dealers.
DWS High Income VIP: The Portfolio is required to identify any securities of its “regular brokers or dealers” (as such term is defined in the 1940 Act) that the Portfolio has acquired during the most recent fiscal year. As of December 31, 2005, the Portfolio held the following securities of its regular brokers or dealers:
| | | |
Name of Regular Broker or Dealer or Parent (Issuer) | | Value of Securities Owned as of December 31, 2005 (in thousands) |
Americredit Corp. | | $ | 3,563 |
Doral Financial Corp. | | $ | 2,270 |
DWS International Select Equity VIP: The Portfolio is required to identify any securities of its “regular brokers or dealers” (as such term is defined in the 1940 Act) that the Portfolio has acquired during the most recent fiscal year. As of December 31, 2005, the Portfolio held the following securities of its regular brokers or dealers:
| | | |
Name of Regular Broker or Dealer or Parent (Issuer) | | Value of Securities Owned as of December 31, 2005 (in thousands) |
BNP Paribas | | $ | 6,940 |
Credit Suisse Group | | $ | 6,270 |
Banca Intesa Spa | | $ | 6,171 |
Allianz AG | | $ | 5,856 |
Australia & New Zealand Banking Group, Plc. | | $ | 3,406 |
Macquaire Bank Ltd. | | $ | 3,382 |
DWS Large Cap Value VIP: The Portfolio is required to identify any securities of its “regular brokers or dealers” (as such term is defined in the 1940 Act) that the Portfolio has acquired during the most recent fiscal year. As of December 31, 2005, the Portfolio held the following securities of its regular brokers or dealers:
| | | |
Name of Regular Broker or Dealer or Parent (Issuer) | | Value of Securities Owned as of December 31, 2005 (in thousands) |
Amsouth Bancorp | | $ | 4,049 |
Bear Stearns & Co. | | $ | 3,154 |
PNC Financial Services Group, Inc. | | $ | 3,432 |
Suntrust Banks, Inc. | | $ | 2,350 |
Wachovia Corp. | | $ | 7,189 |
Wells Fargo & Co. | | $ | 7,087 |
JP Morgan Chase & Co. | | $ | 8,248 |
Morgan Stanley | | $ | 3,331 |
US Bancorp | | $ | 2,974 |
Bank of America | | $ | 9,480 |
43
DWS Money Market VIP: The Portfolio is required to identify any securities of its “regular brokers or dealers” (as such term is defined in the 1940 Act) that the Portfolio has acquired during the most recent fiscal year. As of December 31, 2005, the Portfolio held the following securities of its regular brokers or dealers:
| | | |
Name of Regular Broker or Dealer or Parent (Issuer) | | Value of Securities Owned as of December 31, 2005 (in thousands) |
BNP Paribas | | $ | 3,000 |
Canadia Imperial Bank | | $ | 6,004 |
Unicredito Italiano SpA | | $ | 3,000 |
HBOS Plc | | $ | 3,000 |
DWS Small Cap Growth VIP: The Portfolio is required to identify any securities of its “regular brokers or dealers” (as such term is defined in the 1940 Act) that the Portfolio has acquired during the most recent fiscal year. As of December 31, 2005, the Portfolio held the following securities of its regular brokers or dealers:
| | | |
Name of Regular Broker or Dealer or Parent (Issuer) | | Value of Securities Owned as of December 31, 2005 (in thousands) |
Wintrust Financial Corp. | | $ | 5,589 |
DWS Strategic Income VIP: The Portfolio is required to identify any securities of its “regular brokers or dealers” (as such term is defined in the 1940 Act) that the Portfolio has acquired during the most recent fiscal year. As of December 31, 2005, the Portfolio held the following securities of its regular brokers or dealers:
| | | |
Name of Regular Broker or Dealer or Parent (Issuer) | | Value of Securities Owned as of December 31, 2005 (in thousands) |
Americredit Corp. | | $ | 358 |
DWS Technology VIP: The Portfolio is required to identify any securities of its “regular brokers or dealers” (as such term is defined in the 1940 Act) that the Portfolio has acquired during the most recent fiscal year. As of December 31, 2005, the Portfolio did not hold any securities of its regular brokers or dealers.
DWS Balanced VIP: The Portfolio is required to identify any securities of its “regular brokers or dealers” (as such term is defined in the 1940 Act) that the Portfolio has acquired during the most recent fiscal year. As of December 31, 2005, the Portfolio held the following securities of its regular brokers or dealers:
| | | |
Name of Regular Broker or Dealer or Parent (Issuer) | | Value of Securities Owned as of December 31, 2005 (in thousands) |
General Electric Capital Corp. | | $ | 9,865 |
Bank of America Corp. | | $ | 9,652 |
JP Morgan Chase | | $ | 8,193 |
Citigroup | | $ | 8,129 |
Wells Fargo & Co. | | $ | 7,710 |
Wachovia Securities | | $ | 6,048 |
Bear Stearns | | $ | 4,701 |
American International Group | | $ | 4,126 |
Merrill Lynch | | $ | 3,389 |
Goldman Sachs | | $ | 2,689 |
Amsouth Bancorp | | $ | 2,348 |
PNC Financial Services Group | | $ | 2,164 |
HSBC Bank USA | | $ | 1,173 |
Americredit Corp. | | $ | 558 |
Piper Jaffray | | $ | 501 |
Oriental Finance Group, Inc. | | $ | 388 |
Fremont General Corp. | | $ | 374 |
Doral Financial Corp. | | $ | 365 |
WSFS Financial | | $ | 233 |
Hanmi Financial Corp. | | $ | 196 |
BNP Paribas | | $ | 150 |
Pacific Capital Bancorp | | $ | 114 |
44
DWS Mercury Large Cap Core VIP: The Portfolio is required to identify any securities of its “regular brokers or dealers” (as such term is defined in the 1940 Act) that the Portfolio has acquired during the most recent fiscal year. As of December 31, 2005, the Portfolio did not hold any securities of its regular brokers or dealers.
DWS Templeton Foreign Value VIP: The Portfolio is required to identify any securities of its “regular brokers or dealers” (as such term is defined in the 1940 Act) that the Portfolio has acquired during the most recent fiscal year. As of December 31, 2005, the Portfolio did not hold any securities of its regular brokers or dealers.
DWS Davis Venture Value VIP: The Portfolio is required to identify any securities of its “regular brokers or dealers” (as such term is defined in the 1940 Act) that the Portfolio has acquired during the most recent fiscal year. As of December 31, 2005, the Portfolio held the following securities of its regular brokers or dealers:
| | | |
Name of Regular Broker or Dealer or Parent (Issuer) | | Value of Securities Owned as of December 31, 2005 (in thousands) |
JPMorgan Chase & Co. | | $ | 15,256 |
HSBC Holdings Plc | | $ | 11,927 |
Wells Fargo & Co. | | $ | 9,399 |
Citigroup | | $ | 9,240 |
H&R Block, Inc. | | $ | 5,696 |
Fifth Third Bancorp | | $ | 2,825 |
Marsh & McLennan Co., Inc. | | $ | 2,693 |
Lloyds TSB Group PCL | | $ | 2,565 |
Lehman Brothers Holdings, Inc. | | $ | 2,563 |
Morgan Stanley | | $ | 2,468 |
Principal Financial Group, Inc. | | $ | 1,271 |
State Street Corp. | | $ | 743 |
DWS Dreman Financial Services VIP: The Portfolio is required to identify any securities of its “regular brokers or dealers” (as such term is defined in the 1940 Act) that the Portfolio has acquired during the most recent fiscal year. As of December 31, 2005, the Portfolio held the following securities of its regular brokers or dealers:
| | | |
Name of Regular Broker or Dealer or Parent (Issuer) | | Value of Securities Owned as of December 31, 2005 (in thousands) |
Morgan Stanley | | $ | 5,588 |
KeyCorp | | $ | 4,572 |
Mellon Financial Corp. | | $ | 3,264 |
PNC Financial Services Group | | $ | 2,927 |
National City Corp. | | $ | 2,294 |
Regions Financial Corp. | | $ | 2,018 |
Bear Stearns | | $ | 1,980 |
Marshall & Isley Corp. | | $ | 1,915 |
Fifth Third Bancorp | | $ | 1,663 |
45
DWS Dreman High Return Equity VIP: The Portfolio is required to identify any securities of its “regular brokers or dealers” (as such term is defined in the 1940 Act) that the Portfolio has acquired during the most recent fiscal year. As of December 31, 2005, the Portfolio held the following securities of its regular brokers or dealers:
| | | |
Name of Regular Broker or Dealer or Parent (Issuer) | | Value of Securities Owned as
of December 31, 2005
(in thousands) |
Bank of America Corp. | | $ | 24,074 |
PNC Financial Services Group, Inc. | | $ | 10,468 |
US Bancorp | | $ | 7,942 |
Wachovia Corp. | | $ | 7,400 |
General Electric Capital Corp. | | $ | 7,338 |
Citigroup | | $ | 6,532 |
JPMorgan Chase & Co. | | $ | 5,273 |
Piper Jaffray & Co. | | $ | 43 |
DWS Dreman Small Cap Value VIP: The Portfolio is required to identify any securities of its “regular brokers or dealers” (as such term is defined in the 1940 Act) that the Portfolio has acquired during the most recent fiscal year. As of December 31, 2005, the Portfolio held the following securities of its regular brokers or dealers:
| | | |
Name of Regular Broker or Dealer or Parent (Issuer) | | Value of Securities Owned as
of December 31, 2005
(in thousands) |
BankAtlantic Bancorp | | $ | 1,274 |
DWS Legg Mason Aggressive Growth VIP: The Portfolio is required to identify any securities of its “regular brokers or dealers” (as such term is defined in the 1940 Act) that the Portfolio has acquired during the most recent fiscal year. As of December 31, 2005, the Portfolio held the following securities of its regular brokers or dealers:
| | | |
Name of Regular Broker or Dealer or Parent (Issuer) | | Value of Securities Owned as
of December 31, 2005
(in thousands) |
Lehman Brothers Holdings, Inc. | | $ | 2,563 |
Merrill Lynch | | $ | 1,523 |
Nasdaq 100 | | $ | 990 |
DWS Janus Growth & Income VIP: The Portfolio is required to identify any securities of its “regular brokers or dealers” (as such term is defined in the 1940 Act) that the Portfolio has acquired during the most recent fiscal year. As of December 31, 2005, the Portfolio held the following securities of its regular brokers or dealers:
| | | |
Name of Regular Broker or Dealer or Parent (Issuer) | | Value of Securities Owned as
of December 31, 2005
(in thousands) |
Citigroup | | $ | 7,751 |
Goldman Sachs | | $ | 4,983 |
General Electric Capital Corp. | | $ | 4,746 |
JPMorgan Chase & Co. | | $ | 4,458 |
Lehman Brothers Holdings, Inc. | | $ | 3,484 |
US Bancorp | | $ | 3,105 |
Merrill Lynch | | $ | 2,819 |
Morgan Stanley | | $ | 1,796 |
DWS Janus Growth Opportunities VIP: The Portfolio is required to identify any securities of its “regular brokers or dealers” (as such term is defined in the 1940 Act) that the Portfolio has acquired during the most recent fiscal year. As of December 31, 2005, the Portfolio held the following securities of its regular brokers or dealers:
| | | |
Name of Regular Broker or Dealer or Parent (Issuer) | | Value of Securities Owned as
of December 31, 2005
(in thousands) |
General Electric Capital Corp. | | $ | 9,399 |
Morgan Stanley | | $ | 1,913 |
46
DWS MFS Strategic Value VIP: The Portfolio is required to identify any securities of its “regular brokers or dealers” (as such term is defined in the 1940 Act) that the Portfolio has acquired during the most recent fiscal year. As of December 31, 2005, the Portfolio held the following securities of its regular brokers or dealers:
| | | |
Name of Regular Broker or Dealer or Parent (Issuer) | | Value of Securities Owned as
of December 31, 2005
(in thousands) |
JPMorgan Chase & Co. | | $ | 2,736 |
PNC Financial Services Group, Inc. | | $ | 2,557 |
Bank of America Corp. | | $ | 2,444 |
Mellon Financial | | $ | 2,066 |
Merrill Lynch | | $ | 1,242 |
DWS Oak Strategic Equity VIP: The Portfolio is required to identify any securities of its “regular brokers or dealers” (as such term is defined in the 1940 Act) that the Portfolio has acquired during the most recent fiscal year. As of December 31, 2005, the Portfolio held the following securities of its regular brokers or dealers:
| | | |
Name of Regular Broker or Dealer or Parent (Issuer) | | Value of Securities Owned as
of December 31, 2005
(in thousands) |
Charles Schwab & Co. | | $ | 4,920 |
Citigroup | | $ | 3,193 |
DWS Turner Mid Cap Growth VIP: The Portfolio is required to identify any securities of its “regular brokers or dealers” (as such term is defined in the 1940 Act) that the Portfolio has acquired during the most recent fiscal year. As of December 31, 2005, the Portfolio held the following securities of its regular brokers or dealers:
| | | |
Name of Regular Broker or Dealer or Parent (Issuer) | | Value of Securities Owned as
of December 31, 2005
(in thousands) |
T. Rowe Price Group, Inc. | | $ | 2,181 |
Chicago Mercantile Exchange Holdings | | $ | 1,871 |
Affiliated Managers Group, Inc. | | $ | 1,762 |
Mellon Financial Corp. | | $ | 1,716 |
Ameritrade Holding Corp. | | $ | 1,576 |
The table below shows total brokerage commissions paid by each Portfolio for the last three fiscal years, as applicable.
| | | | | | | | | |
Portfolio | | Fiscal 2005 | | Fiscal 2004 | | Fiscal 2003 |
DWS Mid Cap Growth VIP | | $ | 138,639 | | $ | 144,175 | | $ | 129,184 |
DWS Blue Chip VIP | | | 7,140,407 | | $ | 437,994 | | $ | 365,208 |
DWS Core Fixed Income VIP | | $ | 0 | | $ | 0 | | $ | 0 |
DWS Global Thematic VIP | | $ | 260,871 | | $ | 149,399 | | $ | 97,252 |
DWS Government & Agency Securities VIP | | $ | 8,678 | | $ | 0 | | $ | 0 |
DWS High Income VIP | | $ | 0 | | $ | 0 | | $ | 0 |
DWS International Select Equity VIP | | $ | 633,618 | | $ | 553,166 | | $ | 461,119 |
DWS Large Cap Value VIP | | $ | 377,944 | | $ | 270,524 | | $ | 362,438 |
DWS Money Market VIP | | $ | 0 | | $ | 0 | | $ | 0 |
DWS Small Cap Growth VIP | | $ | 821,102 | | $ | 937,527 | | $ | 982,755 |
DWS Strategic Income VIP | | $ | 11,767 | | $ | 0 | | $ | 0 |
DWS Technology VIP | | $ | 1,109,118 | | $ | 982,299 | | $ | 591,677 |
DWS Balanced VIP | | $ | 559,360 | | $ | 259,205 | | $ | 139,867 |
DSW Mercury Large Cap Core VIP(1) | | $ | 2,210 | | $ | 891 | | | N/A |
DWS Templeton Foreign Value VIP(1) | | $ | 12,934 | | $ | 2,724 | | | N/A |
DWS Davis Venture Value VIP | | $ | 82,063 | | $ | 72,280 | | $ | 52,683 |
DWS Dreman Financial Services VIP | | $ | 73,272 | | $ | 27,369 | | $ | 39,552 |
DWS Dreman High Return Equity VIP | | $ | 164,905 | | $ | 182,508 | | $ | 339,487 |
DWS Dreman Small Cap Value VIP | | $ | 1,430,062 | | $ | 1,449,022 | | $ | 1,129,408 |
DWS Legg Mason Aggressive Growth VIP | | $ | 89,152 | | $ | 118,590 | | $ | 113,346 |
DWS Janus Growth & Income VIP | | $ | 123,775 | | $ | 211,249 | | $ | 176,783 |
DWS Janus Growth Opportunities VIP | | $ | 117,702 | | $ | 163,724 | | $ | 161,639 |
DWS MFS Strategic Value VIP | | $ | 104,259 | | $ | 88,774 | | $ | 28,139 |
DWS Oak Strategic Equity VIP | | $ | 55,659 | | $ | 113,050 | | $ | 48,753 |
DWS Turner Mid Cap Growth VIP | | $ | 379,027 | | $ | 741,896 | | $ | 1,123,591 |
| (1) | Commenced operations on November 15, 2004. |
47
In addition, for the fiscal year ended December 31, 2005:
| | | | | | | | | |
Portfolio | | Percentage of
Commissions
Paid to Affiliated
Brokers | | | Percentage of
Transactions
Involving
Commissions Paid to
Affiliated Brokers | | | Dollar Amount of
Commissions Paid
to Brokers for
Research Services |
DWS Mid Cap Growth VIP | | 0 | % | | 0 | % | | $ | 0 |
DWS Blue Chip VIP | | 0 | | | 0 | | | $ | 0 |
DWS Large Cap Value VIP | | 0 | | | 0 | | | $ | 0 |
DWS Core Fixed Income VIP | | 0 | | | 0 | | | $ | 0 |
DWS Global Thematic VIP | | 0 | | | 0 | | | $ | 0 |
DWS Government & Agency Securities VIP | | 0 | | | 0 | | | $ | 0 |
DWS High Income VIP | | 0 | | | 0 | | | $ | 0 |
DWS International Select Equity VIP | | 0 | | | 0 | | | $ | 0 |
DWS Money Market VIP | | 0 | | | 0 | | | $ | 0 |
DWS Small Cap Growth VIP | | 0 | | | 0 | | | $ | 0 |
DWS Strategic Income VIP | | 0 | | | 0 | | | $ | 0 |
DWS Technology VIP | | 0 | | | 0 | | | $ | 0 |
DWS Balanced VIP | | 0 | | | 0 | | | $ | 0 |
DWS Mercury Large Cap Core VIP | | 0 | | | 0 | | | $ | 0 |
DWS Templeton Foreign Value VIP | | 0 | | | 0 | | | $ | 0 |
DWS Davis Venture Value VIP | | 0 | | | 0 | | | $ | 0 |
DWS Dreman Financial Services VIP | | 0 | | | 0 | | | $ | 0 |
DWS Dreman High Return Equity VIP | | 0 | | | 0 | | | $ | 0 |
DWS Dreman Small Cap Value VIP | | 0 | | | 0 | | | $ | 0 |
DWS Legg Mason Aggressive Growth VIP | | 0 | | | 0 | | | $ | 0 |
DWS Janus Growth & Income VIP | | 0 | | | 0 | | | $ | 0 |
DWS Janus Growth Opportunities VIP | | 0 | | | 0 | | | $ | 0 |
DWS MFS Strategic Value VIP | | 0 | | | 0 | | | $ | 0 |
DWS Oak Strategic Equity VIP | | 0 | | | 0 | | | $ | 0 |
DWS Turner Mid Cap Growth VIP | | 0 | | | 0 | | | $ | 0 |
Codes of Ethics. The Fund, Advisor and subadvisors, and principal underwriter have each adopted codes of ethics under Rule 17j-1 under the 1940 Act. Board members, officers of the Fund and employees of the Advisor or Subadvisors, and principal underwriter are permitted to make personal securities transactions, including transactions in securities that may be purchased or held by the Portfolios, subject to requirements and restrictions set forth in the applicable Code of Ethics. The Advisor’s Code of Ethics contains provisions and requirements designed to identify and address certain conflicts of interest between personal investment activities and the interests of the Portfolios. Among other things, the Advisor’s Code of Ethics prohibits certain types of transactions absent prior approval, imposes time periods during which personal transactions may not be made in certain securities, imposes holding periods (generally 30 days) on most transactions and requires the submission of duplicate broker confirmations and quarterly reporting of securities transactions. Exceptions to these and other provisions of the Advisor’s Code of Ethics may be granted in particular circumstances after review by appropriate personnel.
48
Compensation of Portfolio Managers Advised by the Advisor or its Affiliates. For all portfolio managers, except those listed below in “For certain senior investment professionals managing the following portfolios: DWS High Income VIP, DWS Strategic Income VIP and DWS Balanced VIP.” The Portfolios have been advised that the Advisor seeks to offer its investment professionals competitive short-term and long-term compensation. Portfolio managers and research professionals are paid (i) fixed base salaries, which are linked to job function, responsibilities and financial services industry peer comparison and (ii) variable compensation, which is linked to investment performance, individual contributions to the team and DWS Scudder’s and Deutsche Bank’s financial results. Variable compensation may include a cash bonus incentive and participation in a variety of long-term equity programs (usually in the form of Deutsche Bank equity).
Bonus and long-term incentives comprise a greater proportion of total compensation as an investment professional’s seniority and compensation levels increase. Top performing investment professionals earn a total compensation package that is highly competitive, including a bonus that is a multiple of their base salary. The amount of equity awarded under the long-term equity programs is generally based on the individual’s total compensation package and may comprise from 0%-40% of the total compensation award. As incentive compensation increases, the percentage of compensation awarded in Deutsche Bank equity also increases. Certain senior investment professionals may be subject to a mandatory diverting of a portion of their equity compensation into proprietary mutual funds that they manage.
To evaluate its investment professionals, the Advisor uses a Performance Management Process. Objectives evaluated by the process are related to investment performance and generally take into account peer group and benchmark related data. The ultimate goal of this process is to link the performance of investment professionals with client investment objectives and to deliver investment performance that meets or exceeds clients’ risk and return objectives. When determining total compensation, the Advisor considers a number of quantitative and qualitative factors such as:
| | • | | DWS Scudder’s performance and the performance of Deutsche Asset Management; quantitative measures which include 1, 3 and 5 year pre-tax returns versus benchmark (such as the benchmark used in the prospectus) and appropriate peer group, taking into consideration risk targets. Additionally, the portfolio manager’s retail/institutional asset mix is weighted, as appropriate for evaluation purposes. |
| | • | | Qualitative measures include adherence to the investment process and individual contributions to the process, among other things. In addition, the Advisor assesses compliance, risk management and teamwork skills. |
| | • | | Other factors, including contributions made to the investment team as well as adherence to compliance, risk management, and “living the values” of the Advisor, are part of a discretionary component which gives management the ability to reward these behaviors on a subjective basis through bonus incentives. |
In addition, the Advisor analyzes competitive compensation levels through the use of extensive market data surveys. Portfolio manager compensation is reviewed and may be modified each year as appropriate to reflect changes in the market, as well as to adjust the factors used to determine overall compensation to promote good sustained investment performance.
For certain senior investment professionals managing the following portfolios: DWS High Income VIP, DWS Strategic Income VIP and DWS Balanced VIP. These portfolios have been advised that the Advisor seeks to offer its investment professionals competitive short-term and long-term compensation. Portfolio managers and research professionals are paid (i) base salaries, which are linked to job function, responsibilities and financial services industry peer comparison and (ii) variable compensation. Variable compensation consists of a compensation pool that is determined based on revenues generated by the funds they manage, which are generally impacted by overall investment performance. The compensation pool is shared equally among those senior investment professionals. The compensation structure for these investment professionals is dependent on, among other things, their continuing obligation to fulfill their fiduciary responsibilities to their clients and to “live the values” of the Advisor through adherence to the Advisor’s compliance policies and procedures. This compensation structure creates an incentive to maximize the size of the funds. However, the Advisor has in place controls designed to maintain disciplined growth of the products managed by this team within the capacity constraints of the investment process. The Advisor believes that this compensation structure has been a positive incentive to this team and has contributed to the development of a strong team culture and a risk managed, consistent investment approach that has benefited portfolio shareholders over time.
49
Portfolio Ownership of Portfolio Managers. For Portfolios managed by the Advisor the following table shows the dollar range of shares owned beneficially and of record by each member of the Portfolios’ management team (except DWS Money Market VIP) in the applicable Portfolio as well as in all DWS Funds as a group (i.e. those funds/portfolios advised by Deutsche Asset Management or its affiliates), including investments by their immediate family members sharing the same household and amounts invested through retirement and deferred compensation plans. This information is provided as of the Portfolios’ most recent fiscal year end.
| | | | | | | | |
Name of Portfolio | | Name of Portfolio Manager | | Dollar Range of
Portfolio Shares
Owned | | | Dollar Range of All
DWS Fund Shares
Owned |
| Balanced | | Andrew Cestone | | $ | 0 | (1) | | Over $1,000,000 |
| | William Chepolis | | $ | 0 | | | $500,001-$1,000,000 |
| | Inna Okounkova | | $ | 0 | | | $100,001-$500,000 |
| | Thomas F. Sassi | | $ | 0 | | | $100,001-$500,000 |
| | Julie VanCleave | | $ | 0 | | | Over $1,000,000 |
| | Robert Wang | | $ | 0 | | | $500,001-$1,000,000 |
| Blue Chip | | Julie Abbett | | $ | 0 | | | Over $1,000,000 |
| | Robert Wang | | $ | 0 | | | $500,001-$1,000,000 |
| | Jin Chen | | $ | 0 | | | $50,001-$100,000 |
| Global Thematic | | Steve M. Wreford | | $ | 0 | | | $100,001-$500,000 |
| | Oliver Kratz | | $ | 0 | | | $100,001-$500,000 |
| Government & Agency Securities | | William Chepolis | | $ | 0 | (2) | | $500,001-$1,000,000 |
| High Income | | Andrew P. Cestone | | $ | 0 | | | Over $1,000,000 |
| International Select Equity | | Matthias Knerr | | $ | 0 | (3) | | $100,001-$500,000 |
| Large Cap Value | | Thomas F. Sassi | | $ | 0 | | | $100,001-$500,000 |
| | Steve Scrudato | | $ | 0 | | | $100,001-$500,000 |
| Mid Cap Growth | | Robert S. Janis | | $ | 0 | | | $100,001-$500,000 |
| Small Cap Growth | | Robert S. Janis | | $ | 0 | | | $100,001-$500,000 |
| Strategic Income | | Andrew P. Cestone | | $ | 0 | | | Over $1,000,000 |
| | William Chepolis | | $ | 0 | | | $100,001-$500,000 |
| | Robert Wang | | $ | 0 | | | $500,001-$1,000,000 |
| Technology | | Brian S. Peters | | $ | 0 | | | $50,001-$100,000 |
| | Kelly P. Davis | | $ | 0 | | | $10,001-$50,000 |
| (1) | Although the Portfolio Manager does not have an investment in this variable annuity portfolio, the Portfolio Manager does hold over $1,000,000 in DWS Balanced Fund, the retail mutual fund that has the same investment strategy. This investment is included in the “Dollar Range of All DWS Fund Shares Owned.” |
| (2) | Although the Portfolio Manager does not have an investment in this variable annuity portfolio, the Portfolio Manager does hold $10,001-$50,000 in DWS Government & Agency Securities Fund, the retail mutual fund that has the same investment strategy. This investment is included in the “Dollar Range of All DWS Fund Shares Owned.” |
| (3) | Although the Portfolio Manager does not have an investment in this variable annuity portfolio, the Portfolio Manager does hold $100,001-$500,000 in DWS International Select Equity Fund, the retail mutual fund that has the same investment strategy. This investment is included in the “Dollar Range of All DWS Fund Shares Owned.” |
50
Conflicts of Interest. In addition to managing the assets of the Portfolios, the portfolio managers may have responsibility for managing other client accounts of the Advisor or its affiliates. The tables below show, for each portfolio manager of Portfolios managed by the Advisor, the number and asset size of (1) SEC registered investment companies (or series thereof) other than the Fund, (2) pooled investment vehicles that are not registered investment companies and (3) other accounts (e.g., accounts managed for individuals or organizations) managed by each portfolio manager. The tables also show the number of performance-based fee accounts, as well as the total assets of the accounts for which the advisory fee is based on the performance of the account. This information is provided as of the Portfolios’ most recent fiscal year end.
Other SEC Registered Investment Companies Managed:
| | | | | | | | | | | | |
Name of Portfolio | | Name of Portfolio Manager | | Number of
Registered
Investment
Companies | | Total Assets of
Registered
Investment
Companies | | Number of
Investment
Company
Accounts with
Performance-
Based Fee | | Total Assets of
Performance-
Based Fee
Accounts |
| Balanced | | Andrew Cestone | | 11 | | $ | 8,374,560,023 | | 0 | | $ | 0 |
| | William Chepolis | | 15 | | $ | 11,570,769,898 | | 0 | | $ | 0 |
| | Inna Okounkova | | 10 | | $ | 3,419,031,192 | | 0 | | $ | 0 |
| | Thomas F. Sassi | | 2 | | $ | 2,264,837,207 | | 0 | | $ | 0 |
| | Robert Wang | | 25 | | $ | 5,874,984,861 | | 0 | | $ | 0 |
| Blue Chip | | Julie Abbett | | 3 | | $ | 1,140,738,858 | | 0 | | $ | 0 |
| | Robert Wang | | 8 | | $ | 2,804,960,996 | | 0 | | $ | 0 |
| | Jin Chen | | 3 | | $ | 1,140,738,858 | | | | | |
| Global Thematic | | Oliver Kratz | | 4 | | $ | 2,705,843,043 | | 0 | | $ | 0 |
| Government & Agency Securities | | William Chepolis | | 15 | | $ | 11,967,686,276 | | 0 | | $ | 0 |
| High Income | | Andrew P. Cestone | | 25 | | $ | 2,145,940,881 | | 0 | | $ | 0 |
| International Select Equity | | Matthias Knerr | | 4 | | $ | 2,986,050,395 | | 0 | | $ | 0 |
| Large Cap Value | | Thomas F. Sassi | | 3 | | $ | 2,959,377,897 | | 0 | | $ | 0 |
| | Steve Scrudato | | 2 | | $ | 2,103,161,241 | | 0 | | $ | 0 |
| Mid Cap Growth | | Robert S. Janis | | 4 | | $ | 2,241,029,312 | | 0 | | $ | 0 |
| Small Cap Growth | | Robert S. Janis | | 4 | | $ | 2,023,272,795 | | 0 | | $ | 0 |
| Strategic Income | | Andrew P. Cestone | | 25 | | $ | 4,656,345,231 | | 0 | | $ | 0 |
| | William Chepolis | | 25 | | $ | 5,985,516,164 | | 0 | | $ | 0 |
| | Robert Wang | | 31 | | $ | 3,393,242,507 | | 0 | | $ | 0 |
| Technology | | Brian S. Peters | | 1 | | $ | 1,326,713,349 | | 0 | | $ | 0 |
| | Kelly P. Davis | | 1 | | $ | 1,326,713,349 | | 0 | | $ | 0 |
51
Other Pooled Investment Vehicles Managed:
| | | | | | | | | | | | |
Name of Portfolio | | Name of Portfolio Manager | | Number of
Pooled
Investment
Vehicles | | Total Assets of Pooled
Investment Vehicles | | Number of
Pooled
Investment
Vehicle
Accounts with
Performance-
Based Fee | | Total Assets of
Performance-
Based Fee
Accounts |
| Balanced | | Andrew Cestone | | 0 | | $ | 0 | | 0 | | $ | 0 |
| | William Chepolis | | 0 | | $ | 0 | | 0 | | $ | 0 |
| | Inna Okounkova | | 5 | | $ | 144,851,864 | | 0 | | $ | 0 |
| | Thomas F. Sassi | | 2 | | $ | 22,289,373 | | 0 | | $ | 0 |
| | Julie VanCleave | | 0 | | $ | 0 | | 0 | | $ | 0 |
| | Robert Wang | | 26 | | $ | 216,836,429 | | 0 | | $ | 0 |
| Blue Chip | | Julie Abbett | | 7 | | $ | 104,323,096 | | 0 | | $ | 0 |
| | Robert Wang | | 35 | | $ | 6,041,714,812 | | 0 | | $ | 0 |
| | Jin Chen | | 7 | | $ | 104,323,096 | | | | | |
| Global Thematic | | Oliver Kratz | | 3 | | $ | 533,396,687 | | 0 | | $ | 0 |
| Government & Agency Securities | | William Chepolis | | 0 | | $ | 0 | | 0 | | $ | 0 |
| High Income | | Andrew P. Cestone | | 3 | | $ | 256,102,833 | | 0 | | $ | 0 |
| International Select Equity | | Matthias Knerr | | 5 | | $ | 46,365,659 | | 0 | | $ | 0 |
| Large Cap Value | | Thomas F. Sassi | | 2 | | $ | 22,289,373 | | 0 | | $ | 0 |
| | Steve Scrudato | | 2 | | $ | 22,289,373 | | 0 | | $ | 0 |
| Mid Cap Growth | | Robert S. Janis | | 2 | | $ | 2,638,157 | | 0 | | $ | 0 |
| Small Cap Growth | | Robert S. Janis | | 2 | | $ | 2,638,157 | | 0 | | $ | 0 |
| Strategic Income | | Andrew P. Cestone | | 3 | | $ | 256,102,833 | | 0 | | $ | 0 |
| | William Chepolis | | 0 | | $ | 0 | | 0 | | $ | 0 |
| | Robert Wang | | 9 | | $ | 312,463,092 | | 0 | | $ | 0 |
| Technology | | Brian S. Peters | | 0 | | $ | 0 | | 0 | | $ | 0 |
| | Kelly P. Davis | | 0 | | $ | 0 | | 0 | | $ | 0 |
52
Other Accounts Managed:
| | | | | | | | | | | | |
Name of Portfolio | | Name of Portfolio Manager | | Number
of Other
Accounts | | Total Assets of
Other Accounts | | Number of
Other
Accounts with
Performance-
Based Fee | | Total Assets of
Performance-
Based Fee
Accounts |
Balanced | | Andrew Cestone | | 0 | | $ | 0 | | 0 | | $ | 0 |
| | William Chepolis | | 1 | | $ | 306,664,004 | | 0 | | $ | 0 |
| | Inna Okounova | | 0 | | $ | 0 | | 0 | | $ | 0 |
| | Thomas Sassi | | 64 | | $ | 4,043,932,244 | | 0 | | $ | 0 |
| | Julie VanCleave | | 14 | | $ | 1,279,351,379 | | 0 | | $ | 0 |
| | Robert Wang | | 35 | | $ | 6,041,714,812 | | 0 | | $ | 0 |
Blue Chip | | Julie Abbett | | 4 | | $ | 814,216,970 | | 0 | | $ | 0 |
| | Robert Wang | | 35 | | $ | 6,041,714,812 | | 0 | | $ | 0 |
| | Jin Chen | | 4 | | $ | 814,216,970 | | | | | |
Global Thematic | | Oliver Kratz | | 6 | | $ | 869,656,192 | | 0 | | $ | 0 |
Government & Agency Securities | | William Chepolis | | 1 | | $ | 306,664,004 | | 0 | | $ | 0 |
High Income | | Andrew P. Cestone | | 21 | | $ | 203,370,712 | | 0 | | $ | 0 |
International Select Equity | | Matthias Knerr | | 3 | | $ | 484,336,218 | | 0 | | $ | 0 |
Large Cap Value | | Thomas F. Sassi | | 64 | | $ | 4,043,932,244 | | 0 | | $ | 0 |
| | Steve Scrudato | | 64 | | $ | 4,043,932,244 | | 0 | | $ | 0 |
Mid Cap Growth | | Robert S. Janis | | 4 | | $ | 413,907,642 | | | | | |
Small Cap Growth | | Robert S. Janis | | 4 | | $ | 413,907,642 | | 0 | | $ | 0 |
Strategic Income | | Andrew P. Cestone | | 18 | | $ | 203,370,712 | | 0 | | $ | 0 |
| | William Chepolis | | 2 | | $ | 157,019,931 | | 0 | | $ | 0 |
| | Robert Wang | | 35 | | $ | 6,041,714,812 | | 0 | | $ | 0 |
Technology | | Brian S. Peters | | 0 | | $ | 0 | | 0 | | $ | 0 |
| | Kelly P. Davis | | 0 | | $ | 0 | | 0 | | $ | 0 |
In addition to the accounts above, an investment professional may have personal accounts that may include holdings that are similar to, or the same as, those of the Portfolios. The Advisor has in place a Code of Ethics that is designed to address conflicts of interest and that, among other things, imposes restrictions on the ability of portfolio managers and other “access persons” to invest in securities that may be recommended or traded in the Portfolios and other client accounts.
Real, potential or apparent conflicts of interest may arise when a portfolio manager has day-to-day portfolio management responsibilities with respect to more than one Portfolio or account, including the following:
| | • | | Certain investments may be appropriate for a Portfolio and also for other clients advised by the Advisor, including other client accounts managed by a Portfolio’s management team. Investment decisions for a Portfolio and other clients are made with a view to achieving their respective investment objectives and after |
53
| | consideration of such factors as their current holdings, availability of cash for investment and the size of their investments generally. A particular security may be bought or sold for only one client or in different amounts and at different times for more than one but less than all clients. Likewise, because clients of the Advisor may have differing investment strategies, a particular security may be bought for one or more clients when one or more other clients are selling the security. The investment results achieved for a Portfolio may differ from the results achieved for other clients of the Advisor. In addition, purchases or sales of the same security may be made for two or more clients on the same day. In such event, such transactions will be allocated among the clients in a manner believed by the Advisor to be most equitable to each client, generally utilizing a pro rata allocation methodology. In some cases, the allocation procedure could potentially have an adverse effect or positive effect on the price or amount of the securities purchased or sold by a Portfolio. Purchase and sale orders for the Fund may be combined with those of other clients of the Advisor in the interest of achieving the most favorable net results to a Portfolio and the other clients. |
| | • | | To the extent that a portfolio manager has responsibilities for managing multiple client accounts, a portfolio manager will need to divide time and attention among relevant accounts. The Advisor attempts to minimize these conflicts by aligning its portfolio management teams by investment strategy and by employing similar investment models across multiple client accounts. |
| | • | | In some cases, an apparent conflict may arise where the Advisor has an incentive, such as a performance-based fee, in managing one account and not with respect to other accounts it manages. The Advisor will not determine allocations based on whether it receives a performance-based fee from the client. Additionally, the Advisor has in place supervisory oversight processes to periodically monitor performance deviations for accounts with like strategies. |
The Advisor is owned by Deutsche Bank AG, a multi-national financial services company. Therefore, the Advisor is affiliated with a variety of entities that provide, and/or engage in commercial banking, insurance, brokerage, investment banking, financial advisory, broker-dealer activities (including sales and trading), hedge funds, real estate and private equity investing, in addition to the provision of investment management services to institutional and individual investors. Since Deutsche Bank AG, its affiliates, directors, officers and employees (the “Firm”) are engaged in businesses and have interests other than managing asset management accounts, such other activities involve real, potential or apparent conflicts of interests. These interests and activities include potential advisory, transactional and financial activities and other interests in securities and companies that may be directly or indirectly purchased or sold by the Firm for its clients’ advisory accounts. These are considerations of which advisory clients should be aware and which may cause conflicts that could be to the disadvantage of the Advisor’s advisory clients. The Advisor has instituted business and compliance policies, procedures and disclosures that are designed to identify, monitor and mitigate conflicts of interest and, as appropriate, to report them to the Board.
Compensation of Portfolio Managers of Subadvised Portfolios.
DWS Core Fixed Income VIP
Aberdeen PLC and its subsidiaries, including AAMI, are known as “Aberdeen.” Aberdeen’s remuneration policy (“Policy”) is designed to reflect the importance of recruiting, retaining and motivating senior executives and portfolio managers of the caliber necessary to maintain and improve Aberdeen’s position in the asset management industry. The Policy seeks to reward performance in a manner which aligns the interests of clients, shareholders and executives. The elements of the Policy as it relates to the Portfolio’s portfolio managers are as follows:
Basic salary. The salaries of all employees are reviewed annually and are determined by reference to external market research. Aberdeen’s Policy is to pay salaries which, when taken together with other benefits, will provide a remuneration package that is reasonable and competitive in the asset management industry. Aberdeen participates in compensation surveys which provide salary comparisons for a range of employees across Aberdeen. Aberdeen also considers information included in other publicly available research and survey results. Staff performance is reviewed formally once a year with mid-term reviews. The review process looks at all of the ways in which an individual has contributed to the organization, and specifically, in the case of portfolio managers, to the investment team.
Annual bonus. The Policy is to recognize corporate and individual achievements each year through an appropriate annual bonus plan. The aggregate amount of a cash bonus available in any year is dependent on Aberdeen’s overall performance
54
and profitability. Consideration will also be given to the levels of bonuses paid in the marketplace. Individual awards, payable to all members of staff, are determined by a rigorous assessment of achievement against defined objectives, and are reviewed and approved by Aberdeen’s Remuneration Committee. Portfolio managers’ bonuses are based on a combination of the investment team’s overall performance, the individual’s performance and the overall performance of Aberdeen. In calculating a portfolio manager’s bonus, Aberdeen takes into consideration the performance of funds managed by the team as well as more subjective issues that benefit Aberdeen. Portfolio manager performance on investment matters is judged over all funds to which the fund manager contributes. Performance is measured against appropriate market indices as well as peer universes over various time periods.
Deferred bonus. A deferred bonus plan exists and is designed to encourage the retention of certain key employees identified as critical to Aberdeen’s achievement of its long-term goals. Deferred bonuses may be in the form of deferred equity in Aberdeen PLC.
Retention and incentives for former Deutsche Asset Management employees. In addition to the Policy, appropriate retention and incentive arrangements have been put into place for certain employees of the former Deutsche Asset Management businesses, including in some cases participation in a long-term incentive plan. The costs of these arrangements are being borne by both Deutsche Asset Management and Aberdeen.
DWS Legg Mason Aggressive Growth VIP
Salomon Brothers Asset Management (“SBAM”) investment professionals receive base salary and other employee benefits and are eligible to receive incentive compensation. Base salary is fixed and typically determined based on market factors and the skill and experience of individual investment personnel. SBAM is a wholly-owned subsidiary of Legg Mason, Inc.
SBAM has implemented an investment management incentive and deferred compensation plan (the “Plan”) for its investment professionals, including the fund’s portfolio manager(s). Each investment professional works as a part of an investment team. The Plan is designed to align the objectives of SBAM investment professionals with those of fund shareholders and other SBAM clients. Under the Plan a “base incentive pool” is established for each team each year as a percentage of SBAM’s revenue attributable to the team (largely management and related fees generated by funds and other accounts). A team’s revenues are typically expected to increase or decrease depending on the effect that the team’s investment performance as well as inflows and outflows have on the level of assets in the investment products managed by the team. The “base incentive pool” of a team is reduced by base salaries paid to members of the team and employee benefits expenses attributable to the team.
The investment team’s incentive pool is then adjusted to reflect its ranking among a “peer group” of non-SBAM investment managers and the team’s pre-tax investment performance against the applicable product benchmark (e.g. a securities index and, with respect to a fund, the benchmark set forth in the fund’s prospectus to which the fund’s average annual total returns are compared or, if none, the benchmark set forth in the fund’s annual report). SBAM may also measure the team’s pre-tax investment performance against additional benchmarks, as it determines appropriate. Longer-term (5- year) performance will be more heavily weighted than shorter-term (1- year) performance in the calculation of the performance adjustment factor. The incentive pool for a team may also be adjusted to reflect other factors (e.g., severance pay to departing members of the team, and discretionary allocations by the applicable SBAM chief investment officer from one investment team to another). The incentive pool will be allocated by the applicable SBAM chief investment officer to the team leader and, based on the recommendations of the team leader, to the other members of the team.
Up to 20% of an investment professional’s annual incentive compensation is subject to deferral. Of that principal deferred award amount, 50% will accrue a return based on the hypothetical returns of the investment fund or product that is the primary focus of the investment professional’s business activities with the Firm, and 50% may be received in the form of Legg Mason restricted stock shares.
DWS Mercury Large Cap Core VIP
The Merrill Lynch Investment Manager (MLIM) Portfolio Manager compensation program is critical to MLIM’s ability to attract and retain the most talented asset management professionals. This program ensures that compensation is aligned with maximizing investment returns and it provides a competitive pay opportunity for competitive performance.
55
Compensation. The elements of total compensation for MLIM portfolio managers are base salary, annual performance-based cash and stock compensation and other benefits. MLIM has balanced these components of pay to provide portfolio managers with a powerful incentive to achieve consistently superior investment performance. By design, portfolio manager compensation levels fluctuate — both up and down — with the relative investment performance of the portfolios that they manage.
Base Salary. Under the MLIM approach, like that of many asset management firms, base salaries represent a relatively small portion of a portfolio manager’s total compensation. This approach serves to enhance the motivational value of the performance-based (and therefore variable) compensation elements of the compensation program.
Performance-Based Compensation. MLIM believes that the best interests of investors are served by recruiting and retaining exceptional asset management talent and managing their compensation within a consistent and disciplined framework that emphasizes pay for performance in the context of an intensely competitive market for talent.
To that end, the portfolio manager incentive compensation is derived based on the portfolio manager’s performance of the products they manage, investment performance relative to appropriate competitors or benchmarks over 1-, 3- and 5-year performance periods, performance relative to peers, external market conditions and year over year performance. In addition, portfolio manager’s compensation can be based on MLIM’s investment performance, financial results of MLIM, expense control, profit margins, strategic planning and implementation, quality of client service, market share, corporate reputation, capital allocation, compliance and risk control, leadership, workforce diversity, technology and innovation. MLIM also considers the extent to which individuals exemplify and foster Merrill Lynch’s principles of Client Focus, Respect for the Individual, Teamwork, Responsible Citizenship and Integrity. All factors are considered collectively by MLIM management.
Cash Bonus. Performance-based compensation is distributed to portfolio managers in a combination of cash and stock. Typically, the cash bonus, when combined with base salary, represents more than 60% of total compensation for portfolio managers.
Stock Bonus. A portion of the dollar value of the total annual performance-based bonus is paid in restricted shares of Merrill Lynch stock. Paying a portion of annual bonuses in stock puts compensation earned by a PM for a given year “at risk” based on the Company’s ability to sustain and improve its performance over future periods.
The ultimate value of stock bonuses is dependent on future ML stock price performance. As such, the stock bonus aligns each portfolio manager’s financial interests with those of the Merrill Lynch shareholders and encourages a balance between short-term goals and long-term strategic objectives.
Management strongly believes that providing a significant portion of competitive performance-based compensation in stock is in the best interests of investors and shareholders. This approach ensures that portfolio managers participate as shareholders in both the “downside risk” and “upside opportunity” of the company’s performance. Portfolio managers therefore have a direct incentive to protect ML’s reputation for integrity.
Other Benefits. Portfolio Managers are also eligible to participate in broad-based plans offered generally to Merrill Lynch employees, including broad-based retirement, 401(k), health and other employee benefit plans.
DWS Templeton Foreign Value VIP
Franklin Templeton seeks to maintain a compensation program that is competitively positioned to attract, retain and motivate top-quality investment professionals. Portfolio managers receive a base salary, an incentive bonus opportunity, an equity compensation opportunity, and a benefits package. Portfolio manager compensation is reviewed annually and the level of compensation is based on individual performance, the salary range for a portfolio manager’s level of responsibility and Franklin Templeton budget guidelines. Each portfolio manager’s compensation consists of the following three elements:
Base salary. Each portfolio manager is paid a base salary.
56
Annual bonus. Each portfolio manager is eligible to receive an annual bonus. Franklin Templeton feels that portfolio managers should have some deferred or equity-based compensation in order to build a vested interest in the company and its shareholders. With this in mind, bonuses generally are split between cash (65%) and restricted shares of Franklin Resources stock (35%). Larger bonus awards are 50% cash and 50% in restricted shares of Franklin Resources stock. The bonus plan is intended to provide a competitive level of annual bonus compensation that is tied to the portfolio manager achieving superior investment performance and aligns the financial incentives of Templeton Investment Counsel and the portfolio manager. Any bonus under the plan is completely discretionary. While the amount of any bonus is discretionary, the following factors are generally used in determining bonuses under the plan:
Assets: The size and complexity of funds and overall asset size of those funds managed by the portfolio manager are factored in the manager’s appraisal.
Investment Performance: The historic investment performance of all accounts managed by the portfolio manager is considered. The pre-tax performance of each fund managed is measured relative to an appropriate securities market index.
Research: Since the Templeton global equity team also has research responsibilities, each portfolio manager is evaluated on the number and performance of recommendations over time, productivity and quality of recommendations, and peer evaluation.
Non-Investment Performance: For senior portfolio managers, there is a qualitative evaluation based on leadership and the mentoring of staff.
Additional long term equity-based compensation: Portfolio managers may be awarded options to purchase common shares of Franklin Resources stock that would permit the portfolio to purchase a set amount of shares at the market price on the date of grant. Some portfolio managers may be granted additional restricted shares of Franklin Resources stock. Awards of such equity-based compensation typically vest over time, so as to create incentives to retain key talent.
Portfolio managers also participate in benefit plans and programs available generally to all employees.
DWS Davis Venture Value VIP
Kenneth Feinberg’s compensation as a Davis Advisors employee consists of (i) a base salary, (ii) an annual bonus equal to a percentage of growth in Davis Advisors’ profits, (iii) awards of equity (“Units”) in Davis Advisors including Units, options on Units, and/or phantom Units, and (iv) an incentive plan whereby Davis Advisors purchases shares in selected funds managed by Davis Advisors. At the end of specified periods, generally five years following the date of purchase, some, all, or none of the fund shares will be registered in the employee’s name based on fund performance, after expenses on a pre-tax basis, versus the S&P 500 Index, and versus peer groups as defined by Morningstar or Lipper. Davis Advisors’ portfolio managers are provided benefits packages including life insurance, health insurance, and participation in company 401(k) plan comparable to that received by other company employees. Christopher Davis’ annual compensation as an employee and general partner of Davis Advisors consists of a base salary.
DWS Dreman Financial Services VIP, DWS Dreman High Return Equity VIP and DWS Dreman Small Cap Value VIP
The Portfolios have been advised that the subadvisor has implemented a highly competitive compensation plan which seeks to attract and retain exceptional investment professionals who have demonstrated that they can consistently outperform their respective fund’s benchmark. The compensation plan is comprised of both a fixed component and a variable component. The variable component is determined by assessing the investment professional’s performance measured utilizing both quantitative and qualitative factors.
The subadvisor’s investment professionals are each paid a fixed base salary that is determined based on their job function and responsibilities. The base salary is deemed to be competitive with the marketplace and specifically with salaries in the financial services industry by utilizing various salary surveys compiled for the financial services industry, specifically, investment advisory firms. The variable component of the subadvisor’s compensation plan which takes the form of a cash bonus combined with either stock appreciation rights grants or outright stock grants is discretionary and is designed
57
to reward and retain investment professionals including portfolio managers and research analysts for their contributions to a portfolio’s performance relative to its benchmark.
Investment professionals may receive equity in the form of units or fractional units of membership interest in the subadvisor or they may receive stock appreciation rights which enable them to participate in the growth of the firm. The subadvisor’s membership units are valued based on a multiple of net profits so grants of stock appreciation rights which vest over a specified term will result in additional compensation as net profits increase. Investment professionals also participate in the subadvisor’s profit sharing plan, a defined contribution plan that allows the subadvisor to contribute up to twenty-five percent of an employee’s total compensation, subject to various regulatory limitations, to each employee’s profit sharing account. The subadvisor’s profit sharing plan is a non-discriminatory plan which benefits all employees of the firm including both portfolio managers and research analysts. Contributions to the subadvisor’s profit sharing plan vest over a specified term. Finally all employees of the subadvisor including investment professionals receive additional fringe benefits in the form of subsidized medical and dental and group-term and life insurance coverage.
The basis for determining the variable component of an investment professional’s total compensation is determined through a subjective process which evaluates an investment professional performance against several quantitative and qualitative factors including the following:
Quantitative factors:
| | • | | Relative ranking of a portfolio’s performance against its peers in the one, three and five year pre-tax investment performance categories. The portfolios’ performance is evaluated against peers in its fund category and performance is ranked from one to four on a declining scale depending on the quartile in which the portfolio manager’s absolute performance falls. The portfolio manager is rewarded on a graduated scale for outperforming relative to his peers. |
| | • | | Relative performance of a portfolio’s performance against the pre-determined indices for the product strategy against which a portfolio’s performance is measured. The portfolio manager is rewarded on a graduated scale for outperforming relative to the fund’s benchmark index. |
| | • | | Performance of a portfolio measured through attribution analysis models which analyses the portfolio manager’s contribution from both an asset allocation or sector allocation perspective and security selection perspective. This factor evaluates how the investment professional performs in linking performance with the client’s investment objective including investment parameters and risk and return objectives. This factor may include some qualitative characteristics. |
Qualitative factors:
| | • | | Ability to work well with other members of the investment professional team and mentor junior members. |
| | • | | Contributions to the organizational overall success with new product strategies. |
| | • | | Other factors such as contributing to the team in a leadership role and by being responsive to requests for assistance |
DWS Janus Growth & Income VIP and DWS Janus Growth Opportunities VIP
The following describes the structure and method of calculating the portfolio manager’s compensation.
The portfolio manager is compensated by Janus Capital for managing a Portfolio and any other funds, portfolios or accounts managed by the portfolio manager (collectively, the “Managed Funds”) through two components: fixed compensation and variable compensation.
Fixed Compensation: Fixed compensation is paid in cash and is comprised of an annual base salary and an additional amount calculated based on factors such as the complexity of managing funds and other accounts, scope of responsibility (including assets under management), tenure and long-term performance as a portfolio manager.
58
Variable Compensation: Variable compensation is paid in the form of cash and long-term incentive awards (consisting of Janus Capital Group Inc. restricted stock, stock options and a cash deferred award aligned with Janus fund shares). Variable compensation is structured to pay the portfolio manager primarily on individual performance, with additional compensation available for team performance and a lesser component based on net asset flows in the Managed Funds. Variable compensation is based on pre-tax performance of the Managed Funds.
The portfolio manager’s individual performance compensation is determined by applying a multiplier tied to the Managed Funds’ aggregate asset-weighted Lipper peer group performance ranking for one- and three-year performance periods, if applicable, with a greater emphasis on three year results. The multiplier is applied against the portfolio manager’s fixed compensation. The portfolio manager is also eligible to receive additional individual performance compensation if the Managed Funds achieve a certain rank in their Lipper peer performance groups in each of three, four, or five consecutive years. The portfolio manager’s compensation is also subject to reduction in the event that the Managed Funds incur material negative absolute performance, and the portfolio manager will not be eligible to earn any individual performance compensation if the Managed Funds’ performance does not meet or exceed a certain ranking in their Lipper peer performance group.
The portfolio manager is also eligible to participate with other Janus equity portfolio managers in a team performance compensation pool which is derived from a formula tied to the team’s aggregate asset-weighted Lipper peer group performance ranking for the one-year performance period. Such compensation is then allocated among eligible individual equity portfolio managers at the discretion of Janus Capital. No team performance compensation is paid to any equity portfolio manager if the aggregate asset-weighted team performance for the one-year period does not meet or exceed a certain rank in the relevant Lipper peer group.
The portfolio manager may elect to defer payment of a designated percentage of fixed compensation and/or up to all variable compensation in accordance with the Janus Executive Income Deferral Program.
DWS Janus Growth Opportunities VIP’s Lipper peer group for compensation purposes is the Large-Cap Growth Funds. DWS Janus Growth & Income VIP’s Lipper peer group for compensation purposes is the Large-Cap Core Funds.
DWS MFS Strategic Value VIP
Portfolio manager total cash compensation is a combination of base salary and performance bonus:
Base Salary – Base salary represents a relatively smaller percentage of portfolio manager total cash compensation (generally below 33%) than incentive compensation.
Performance Bonus – Generally, incentive compensation represents a majority of portfolio manager total cash compensation. The performance bonus is based on a combination of quantitative and qualitative factors, with more weight given to the former (generally over 60 %) and less weight given to the latter.
The quantitative portion is based on pre-tax performance of all of the accounts managed by the portfolio manager (which includes the Portfolio and any other accounts managed by the portfolio manager) over a one-, three- and five-year period relative to the appropriate Lipper peer group universe and/or one or more benchmark indices with respect to each account. The primary weight is given to portfolio performance over a three-year time period with lesser consideration given to portfolio performance over one- and five-year periods (adjusted as appropriate if the portfolio manager has served for shorter periods).
The qualitative portion is based on the results of an annual internal peer review process (conducted by other portfolio managers, analysts and traders) and management’s assessment of overall portfolio manager contributions to the investment process (distinct from portfolio performance).
Portfolio managers also typically benefit from the opportunity to participate in the MFS Equity Plan. Equity interests in MFS or its parent company are awarded by management, on a discretionary basis, taking into account tenure at MFS, contribution to the investment process and other factors.
Finally, portfolio managers are provided with a benefits package including a defined contribution plan, health coverage and other insurance, which are available to other employees of MFS on substantially similar terms. The percentage of
59
compensation provided by these benefits depends upon the length of the individual’s tenure at MFS and salary level as well as other factors.
DWS Oak Strategic Equity VIP
James D. Oelschlager owns 99% of Oak Associates, ltd. As a result, Mr. Oelschlager earns 99% of the net profits from Oak Associates, ltd.
DWS Turner Mid Cap VIP
Compensation. Turner’s investment professionals receive a base salary commensurate with their level of experience. Turner’s goal is to maintain competitive base salaries through review of industry standards, market conditions, and salary surveys. Bonus compensation, which is a multiple of base salary, is computed annually based on the one year performance of each individual’s sector and portfolio assignments relative to appropriate market benchmarks. In addition, each employee is eligible for equity ownership and equity owners share the firm’s profits. Most of the members of the Investment Team and all Portfolio Managers are equity owners of Turner. This compensation and ownership structure provides incentive to attract and retain highly qualified people, as each member of the firm has the opportunity to share directly in the accomplishments of the business.
The objective performance criteria noted above accounts for 90% of the bonus calculation. The remaining 10% is based upon subjective, “good will” factors including teamwork, interpersonal relations, the individual’s contribution to overall success of the firm, media and client relations, presentation skills, and professional development. Portfolio managers/analysts are reviewed on an annual basis. The Chief Investment Officer is responsible for setting base salaries, bonus targets, and making all subjective judgments related to an investment professionals’ compensation. The CIO is also responsible for identifying investment professionals that should be considered for equity ownership on an annual basis.
Portfolio Ownership of Portfolio Managers for each Portfolio managed by a Subadvisor. The following table shows the dollar range of shares owned beneficially and of record by each member of the Portfolios’ management team in the applicable Portfolio, including investments by their immediate family members sharing the same household and amounts invested through retirement and deferred compensation plans. This information is provided as of the Portfolios’ most recent fiscal year end.
| | | | | |
Name of Portfolio | | Name of Portfolio Manager | | Dollar Range of
Portfolio Shares Owned |
| Core Fixed Income | | Gary W. Bartlett | | $ | 0 |
| | J. Christopher Gagnier | | $ | 0 |
| | Warren S. Davis | | $ | 0 |
| | Daniel R. Taylor | | $ | 0 |
| | Thomas J. Flaherty | | $ | 0 |
| | Timothy C. Vile | | $ | 0 |
| | William T. Lissenden | | $ | 0 |
| Mercury Large Cap Core | | Robert C. Doll | | $ | 0 |
| Templeton Foreign Value | | Antonio Docal | | $ | 0 |
| Davis Venture Value | | Christopher C. Davis | | $ | 0 |
| | Kenneth Charles Feinberg | | $ | 0 |
| Dreman Financial Services | | David N. Dreman | | Over $ | 100,000,000 |
| | F. James Hutchinson | | $ | 0 |
| Dreman High Return Equity | | David N. Dreman | | $ | 0 |
| | F. James Hutchinson | | $ | 0 |
| Dreman Small Cap Value | | David N. Dreman | | $ | 0 |
| | Nelson Woodward | | $ | 0 |
| Legg Mason Aggressive Growth | | Richard Freeman | | $ | 0 |
| Janus Growth & Income | | Minyoung Sohn | | $ | 0 |
| Janus Growth Opportunities | | Marc Pinto | | $ | 0 |
| MFS Strategic Value | | Kenneth J. Enright | | $ | 0 |
| | Alan T. Langsner | | $ | 0 |
| Oak Strategic Equity | | James D. Oelschlager | | $ | 0 |
| Turner Mid Cap Growth | | Christopher K. McHugh | | $ | 0 |
| | William C. McVail | | $ | 0 |
| | Robert E. Turner | | $ | 0 |
60
Although the portfolio managers do not have an investment in the portfolios, the portfolio managers may have an investment in the retail fund that has the same investment strategy.
Conflicts of Interest. In addition to managing the assets of the Portfolios, the portfolio managers may have responsibility for managing other client accounts of the applicable subadvisor. The tables below show for each Portfolio managed by a Subadvisor, for each portfolio manager, the number and asset size of (1) SEC registered investment companies (or series thereof) other than a portfolio, (2) pooled investment vehicles that are not registered investment companies and (3) other accounts (e.g., accounts managed for individuals or organizations) managed by each portfolio manager. The tables also show the number of performance based fee accounts, as well as the total assets of the accounts for which the advisory fee is based on the performance of the account. This information is provided as of the Portfolios’ most recent fiscal year end.
Other SEC Registered Investment Companies Managed:
| | | | | | | | | | | | | |
Name of Portfolio | | Name of Portfolio Manager | | Number of
Registered
Investment
Companies | | Total Assets of
Registered
Investment
Companies | | | Number of
Investment
Company
Accounts with
Performance-
Based Fee | | Total Assets of
Performance-
Based Fee
Accounts |
Core Fixed Income | | Gary W. Bartlett | | 8 | | $ | 3,091,919,797 | | | 0 | | $ | 0 |
| | J. Christopher Gagnier | | 8 | | $ | 3,091,919,797 | | | 0 | | $ | 0 |
| | Warren S. Davis, III | | 8 | | $ | 3,091,919,797 | | | 0 | | $ | 0 |
| | Daniel R. Taylor | | 8 | | $ | 3,091,919,797 | | | 0 | | $ | 0 |
| | Thomas J. Flaherty | | 8 | | $ | 3,091,919,797 | | | 0 | | $ | 0 |
| | Timothy C. Vile | | 8 | | $ | 3,091,919,797 | | | 0 | | $ | 0 |
| | William T. Lissenden | | 8 | | $ | 3,091,919,797 | | | 0 | | $ | 0 |
Mercury Large Cap Core | | Robert C. Doll | | 17 | | $ | 8,385,700,000 | | | 0 | | $ | 0 |
Templeton Foreign Value | | Antonio Docal | | 6 | | $ | 7,909,200,000 | | | 0 | | $ | 0 |
Davis Venture Value | | Christopher C. Davis | | 24 | | $ | 57,000,000,000 | | | 0 | | $ | 0 |
| | Kenneth Charles Feinberg | | 24 | | $ | 57,000,000,000 | | | 0 | | $ | 0 |
Dreman Financial Services | | David N. Dreman | | 3 | | $ | 1,500,000,000 | | | 0 | | $ | 0 |
| | F. James Hutchinson | | 1 | | $ | 1,400,000,000 | | | 0 | | $ | 0 |
Dreman High Return Equity | | David N. Dreman | | 3 | | $ | 1,500,000,000 | | | 0 | | $ | 0 |
| | F. James Hutchinson | | 1 | | $ | 1,400,000,000 | | | 0 | | $ | 0 |
Dreman Small Cap Value | | David N. Dreman | | 3 | | $ | 1,500,000,000 | | | 0 | | $ | 0 |
| | Nelson Woodward | | 1 | | $ | 1,400,000,000 | | | 0 | | $ | 0 |
Legg Mason Aggressive Growth | | Richard Freeman | | 13 | | $ | 12,390,000,000 | | | 0 | | $ | 0 |
Janus Growth & Income | | Minyoung Sohn | | 8 | | $ | 7,828,108,811 | | | 0 | | $ | 0 |
Janus Growth Opportunities | | Marc Pinto | | 10 | | $ | 7,390,215,237 | | | 0 | | $ | 0 |
MFS Strategic Value | | Kenneth J. Enright | | 12 | | $ | 23,840,196,912 | (3) | | 0 | | $ | 0 |
| | Alan T. Langsner | | 12 | | $ | 23,840,196,192 | (3) | | 0 | | $ | 0 |
Oak Strategic Equity | | James D. Oelschlager | | 1 | | $ | 22,532,679 | | | 0 | | $ | 0 |
Turner Mid Cap Growth | | Christopher K. McHugh | | 17 | | $ | 3,400,000,000 | | | 1 | | $ | 741,000,000 |
| | William C. McVail | | 15 | | $ | 3,200,000,000 | | | 0 | | $ | 0 |
| | Robert E. Turner | | 22 | | $ | 4,400,000,000 | | | 1 | | $ | 741,000,000 |
| (3) | Includes the assets of DWS MFS Strategic Value VIP. |
61
Other Pooled Investment Vehicles Managed:
| | | | | | | | | | | | |
Name of Portfolio | | Name of Portfolio Manager | | Number of
Pooled
Investment
Vehicles | | Total Assets of
Pooled
Investment
Vehicles | | Number of
Pooled
Investment
Vehicle
Accounts with
Performance-
Based Fee | | Total
Assets of
Performance-
Based Fee
Accounts |
Core Fixed Income | | Gary W. Bartlett | | 14 | | $ | 3,939,987,953 | | 0 | | $ | 0 |
| | J. Christopher Gagnier | | 14 | | $ | 3,939,987,953 | | 0 | | $ | 0 |
| | Warren S. Davis | | 14 | | $ | 3,939,987,953 | | 0 | | $ | 0 |
| | Daniel R. Taylor | | 14 | | $ | 3,939,987,953 | | 0 | | $ | 0 |
| | Thomas J. Flaherty | | 14 | | $ | 3,939,987,953 | | 0 | | $ | 0 |
| | Timothy C. Vile | | 14 | | $ | 3,939,987,953 | | 0 | | $ | 0 |
| | William T. Lissenden | | 14 | | $ | 3,939,987,953 | | 0 | | $ | 0 |
Mercury Large Cap Core | | Robert C. Doll | | 6 | | $ | 4,683,500,000 | | 0 | | $ | 0 |
Templeton Foreign Value | | Antonio Docal | | 17 | | $ | 1,694,000,000 | | 0 | | $ | 0 |
Davis Venture Value | | Christopher C. Davis | | 10 | | $ | 1,000,000,000 | | 0 | | $ | 0 |
| | Kenneth Charles Feinberg | | 10 | | $ | 1,000,000,000 | | 0 | | $ | 0 |
Dreman Financial Services | | David N. Dreman | | 2 | | $ | 46,000,000 | | 0 | | $ | 0 |
| | F. James Hutchinson | | 0 | | $ | 0 | | 0 | | $ | 0 |
Dreman High Return Equity | | David N. Dreman | | 2 | | $ | 46,000,000 | | 0 | | $ | 0 |
| | F. James Hutchinson | | 0 | | $ | 0 | | 0 | | $ | 0 |
Dreman Small Cap Value | | David N. Dreman | | 2 | | $ | 46,000,000 | | 0 | | $ | 0 |
| | Nelson Woodward | | 2 | | $ | 46,000,000 | | 0 | | $ | 0 |
Legg Mason Aggressive Growth | | Richard Freeman | | 2 | | $ | 340,000,000 | | 0 | | $ | 0 |
Janus Growth & Income | | Minyoung Sohn | | 0 | | $ | 0 | | 0 | | $ | 0 |
Janus Growth Opportunities | | Marc Pinto | | 2 | | $ | 82,643,135 | | 0 | | $ | 0 |
MFS Strategic Value | | Kenneth J. Enright | | 1 | | $ | 125,323,419 | | 0 | | $ | 0 |
| | Alan T. Langsner | | 2 | | $ | 1,338,777,676 | | 0 | | $ | 0 |
Oak Strategic Equity | | James D. Oelschlager | | 1 | | $ | 828,946,550 | | 0 | | $ | 0 |
Turner Mid Cap Growth | | Christopher K. McHugh | | 29 | | $ | 527,000,000 | | 1 | | $ | 13,000,000 |
| | William C. McVail | | 17 | | $ | 228,000,000 | | 1 | | $ | 13,000,000 |
| | Robert E. Turner | | 29 | | $ | 609,000,000 | | 0 | | $ | 0 |
62
Other Accounts Managed:
| | | | | | | | | | | | |
Name of Portfolio | | Name of Portfolio Manager | | Number of
Other
Accounts | | Total Assets of
Other Accounts | | Number of
Other
Accounts with
Performance-
Based Fee | | Total Assets of
Performance-
Based Fee
Accounts |
Core Fixed Income | | Gary W. Bartlett | | 153 | | $ | 17,598,133,380 | | 1 | | $ | 103,088,903 |
| | J. Christopher Gagnier | | 153 | | $ | 17,598,133,380 | | 1 | | $ | 103,088,903 |
| | Warren S. Davis | | 153 | | $ | 17,598,133,380 | | 1 | | $ | 103,088,903 |
| | Daniel R. Taylor | | 153 | | $ | 17,598,133,380 | | 1 | | $ | 103,088,903 |
| | Thomas J. Flaherty | | 153 | | $ | 17,598,133,380 | | 1 | | $ | 103,088,903 |
| | Timothy C. Vile | | 153 | | $ | 17,598,133,380 | | 1 | | $ | 103,088,903 |
| | William T. Lissenden | | 153 | | $ | 17,598,133,380 | | 1 | | $ | 103,088,903 |
Mercury Large Cap Core | | Robert C. Doll | | 4 | | $ | 818,300,000 | | 0 | | $ | 0 |
Templeton Foreign Value | | Antonio Docal | | 23 | | $ | 4,398,900,000 | | 0 | | $ | 0 |
Davis Venture Value | | Christopher C. Davis | | 37,500 | | $ | 11,200,000,000 | | 0 | | $ | 0 |
| | Kenneth Charles Feinberg | | 37,500 | | $ | 11,200,000,000 | | 0 | | $ | 0 |
Dreman Financial Services | | David N. Dreman | | 99 | | $ | 2,200,000,000 | | 0 | | $ | 0 |
| | F. James Hutchinson | | 0 | | $ | 0 | | 0 | | $ | 0 |
Dreman High Return Equity | | David N. Dreman | | 99 | | $ | 2,200,000,000 | | 0 | | $ | 0 |
| | F. James Hutchinson | | 0 | | $ | 0 | | 0 | | $ | 0 |
Dreman Small Cap Value | | David N. Dreman | | 99 | | $ | 2,200,000,000 | | 0 | | $ | 0 |
| | Nelson Woodward | | 99 | | $ | 2,200,000,000 | | 0 | | $ | 0 |
Legg Mason Dynamic Growth | | Richard Freeman | | 125,829 | | $ | 10,730,000,000 | | 0 | | $ | 0 |
Janus Growth & Income | | Minyoung Sohn | | 1 | | $ | 7,114,012 | | 0 | | $ | 0 |
Janus Growth Opportunities | | Marc Pinto | | 27 | | $ | 477,804,583 | | 2 | | $ | 251,336,722 |
MFS Strategic Value | | Kenneth J. Enright | | 0 | | $ | 0 | | 0 | | $ | 0 |
| | Alan T. Langsner | | 0 | | $ | 0 | | 0 | | $ | 0 |
Oak Strategic Equity | | James D. Oelschlager | | 767 | | $ | 0 | | 2 | | $ | 905,993,458 |
Turner Mid Cap Growth | | Christopher K. McHugh | | 73 | | $ | 4,500,000,000 | | 3 | | $ | 174,000,000 |
| | William C. McVail | | 65 | | $ | 3,700,000,000 | | 3 | | $ | 174,000,000 |
| | Robert E. Turner | | 92 | | $ | 7,400,000,000 | | 1 | | $ | 19,000,000 |
63
Potential Conflicts of Interest for Subadvised Portfolios’ Managers.
DWS Mercury Large Cap Core VIP
Real, potential or apparent conflicts of interest may arise when a portfolio manager has day-today portfolio management responsibilities with respect to more than one fund or account, including the following:
Certain investments may be appropriate for the Portfolio and also for other clients advised by MLIM and its affiliates, including other client accounts managed by the Portfolio’s management team. Investment decisions for the Portfolio and other clients are made with a view to achieving their respective investment objectives and after consideration of such factors as their current holdings, availability of cash for investment and the size of their investments generally. Frequently, a particular security may be bought or sold for only one client or in different amounts and at different times for more than one but less than all clients. Likewise, because clients of MLIM and its affiliates may have differing investment strategies, a particular security may be bought for one or more clients when one or more other clients are selling the security. The investment results for the Portfolio may differ from the results achieved by other clients of MLIM and its affiliates and results among clients may differ. In addition, purchases or sales of the same security may be made for two or more clients on the same day. In such event, such transactions will be allocated among the clients in a manner believed by MLIM to be equitable to each. MLIM will not determine allocations based on whether it receives a performance based fee from the client. In some cases, the allocation procedure could have an adverse effect on the price or amount of the securities purchased or sold by the Portfolio. Purchase and sale orders for the Portfolio may be combined with those of other clients of MLIM and its affiliates in the interest of achieving the most favorable net results to the Portfolio.
To the extent that the Portfolio’s portfolio management team has responsibilities for managing accounts in addition to the Portfolio, a portfolio manager will need to divide his time and attention among relevant accounts.
In some cases, a real, potential or apparent conflict may also arise where: (i) MLIM may have an incentive, such as a performance based fee, in managing one account and not with respect to other accounts it manages; or (ii) where a member of the Portfolio’s management team owns an interest in one fund or account he or she manages and not another.
64
DWS Templeton Foreign Value VIP
The management of multiple funds and accounts may also give rise to potential conflicts of interest if the funds and other accounts have different objectives, benchmarks, time horizons, and fees as the portfolio manager must allocate his or her time and investment ideas across multiple funds and accounts. The manager seeks to manage such competing interests for the time and attention of portfolio managers by having portfolio managers focus on a particular investment discipline. Most other accounts managed by a portfolio manager are managed using the same investment strategies that are used in connection with the management of the Portfolio. Accordingly, portfolio holdings, position sizes, and industry and sector exposures tend to be similar across similar portfolios, which may minimize the potential for conflicts of interest. The separate management of the trade execution and valuation functions from the portfolio management process also helps to reduce potential conflicts of interest. However, securities selected for funds or accounts other than the Portfolio may outperform the securities selected for the Portfolio. Moreover, if a portfolio manager identifies a limited investment opportunity that may be suitable for more than one fund or other account, the Portfolio may not be able to take full advantage of that opportunity due to an allocation of that opportunity across all eligible funds and other accounts. The manager seeks to manage such potential conflicts by using procedures intended to provide a fair allocation of buy and sell opportunities among funds and other accounts.
The structure of a portfolio manager’s compensation may give rise to potential conflicts of interest. A portfolio manager’s base pay and bonus tend to increase with additional and more complex responsibilities that include increased assets under management. As such, there may be an indirect relationship between a portfolio manager’s marketing or sales efforts and his or her bonus.
Finally, the management of personal accounts by a portfolio manager may give rise to potential conflicts of interest. While the funds and the manager have adopted a code of ethics which they believe contains provisions reasonably necessary to prevent a wide range of prohibited activities by portfolio managers and others with respect to their personal trading activities, there can be no assurance that the code of ethics addresses all individual conduct that could result in conflicts of interest.
The manager and the Fund have adopted certain compliance procedures that are designed to address these, and other, types of conflicts. However, there is no guarantee that such procedures will detect each and every situation where a conflict arises.
DWS Davis Venture Value VIP
Potential conflicts of interest actual or apparent conflicts of interest may arise when a portfolio manager has day-to-day management responsibilities with respect to more than one portfolio or other account. More specifically, portfolio managers who manage multiple portfolios and /or other accounts are presented with the following potential conflicts:
| | • | | The management of multiple portfolios and/or other accounts may result in a portfolio manager devoting unequal time and attention to the management of each portfolio and/or other account. Davis Advisors seeks to manage such competing interests for the time and attention of portfolio managers by having portfolio managers focus on a particular investment discipline. Most other accounts managed by a portfolio manager are managed using the same investment models that are used in connection with the management of the portfolios. |
| | • | | If a portfolio manager identifies a limited investment opportunity which may be suitable for more than one portfolio or other account, a portfolio may not be able to take full advantage of that opportunity due to an allocation of filled purchase or sale orders across all eligible portfolios and other accounts. To deal with these situations, Davis Advisors has adopted procedures for allocating portfolio transactions across multiple accounts. |
| | • | | With respect to securities transactions for the portfolios, Davis Advisors determines which broker to use to execute each order, consistent with its duty to seek best execution of the transaction. However, with respect to certain other accounts (such as mutual funds for which Davis Advisors other pooled investment vehicles that are not registered mutual funds, and other accounts managed for organizations and individuals), Davis Advisors may be limited by the client with respect to the selection of brokers or may be instructed to direct trades through a particular broker. In these cases, Davis Advisors may place separate, non-simultaneous, transactions for a |
65
| | portfolio and another account which may temporarily affect the market price of the security or the execution of the transaction, or both, to the detriment of the portfolio or the other account. |
| | • | | Finally, substantial investment of Davis Advisor or Davis Family assets in certain mutual funds may lead to conflicts of interest. To mitigate these potential conflicts of interest, Davis Advisors has adopted policies and procedures intended to ensure that all clients are treated fairly overtime. Davis Advisors does not receive an incentive based fee on any account. |
DWS Dreman Financial Services VIP, DWS Dreman High Return Equity VIP and DWS Dreman Small Cap Value VIP
The subadvisor manages clients’ accounts using a contrarian value investment strategy. For both its large capitalization and small capitalization strategies the subadvisor utilizes a model portfolio and rebalances clients accounts whenever changes are made to the model portfolio. In addition the subadvisor aggregates its trades and allocates the trades to all clients accounts in an equitable manner. The subadvisor strongly believes aggregating its orders protect all clients from being disadvantaged by price or time execution. The model portfolio approach and the trade aggregation policy of the subadvisor mitigates potential or apparent conflicts of interest that could arise when a portfolio manager has day-to-day portfolio management responsibilities with respect to more than one fund or account. The subadvisor does not receive any performance-based fees from any of its accounts with the exception of a hedge fund that is managed by an affiliated firm. However the hedge funds are treated like any other client account and trades done for the fund are generally aggregated with trades done for its regular client accounts.
The subadvisor’s investment professional are compensated in the same manner for all client accounts irrespective of the type of account.
DWS Legg Mason Aggressive Growth VIP
Material Conflicts of Interest.
Material conflicts of interest may arise when a Fund’s portfolio manager also has day-to-day management responsibilities with respect to one or more other funds or other accounts, as is the case for certain of the portfolio managers listed in the table above.
These potential conflicts include:
Allocation of Limited Time and Attention.
A portfolio manager who is responsible for managing multiple funds and/or accounts may devote unequal time and attention to the management of those funds and/or accounts. As a result, the portfolio manager may not be able to formulate as complete a strategy or identify equally attractive investment opportunities for each of those accounts as might be the case if he or she were to devote substantially more attention to the management of a single fund. The effects of this potential conflict may be more pronounced where funds and/or accounts overseen by a particular portfolio manager have different investment strategies.
Allocation of Limited Investment Opportunities.
If a portfolio manager identifies a limited investment opportunity that may be suitable for multiple funds and/or accounts, the opportunity may be allocated among these several funds or accounts, which may limit a fund’s ability to take full advantage of the investment opportunity.
Pursuit of Differing Strategies.
At times, a portfolio manager may determine that an investment opportunity may be appropriate for only some of the funds and/or accounts for which he or she exercises investment responsibility, or may decide that certain of the funds and/or accounts should take differing positions with respect to a particular security. In these cases, the portfolio manager
66
may place separate transactions for one or more funds or accounts which may affect the market price of the security or the execution of the transaction, or both, to the detriment or benefit of one or more other funds and/or accounts.
Selection of Brokers/Dealers.
Portfolio managers may be able to select or influence the selection of the brokers and dealers that are used to execute securities transactions for the funds and/or account that they supervise. In addition to executing trades, some brokers and dealers provide portfolio managers with brokerage and research services (as those terms are defined in Section 28(e) of the Securities Exchange Act of 1934), which may result in the payment of higher brokerage fees than might have otherwise be available. These services may be more beneficial to certain funds or accounts than to others. Although the payment of brokerage commissions is subject to the requirement that the portfolio manager determine in good faith that the commissions are reasonable in relation to the value of the brokerage and research services provided to the fund, a portfolio manager’s decision as to the selection of brokers and dealers could yield disproportionate costs and benefits among the funds and/or accounts that he or she manages.
Variation in Compensation.
A conflict of interest may arise where the financial or other benefits available to the portfolio manager differ among the funds and/or accounts that he or she manages. If the structure of the investment adviser’s management fee and/or the portfolio manager’s compensation differs among funds and/or accounts (such as where certain funds or accounts pay higher management fees or performance-based management fees), the portfolio manager might be motivated to help certain funds and/or accounts over others. The portfolio manager might be motivated to favor funds and/or accounts in which he or she has an interest or in which the investment advisor and/or its affiliates have interests. Similarly, the desire to maintain assets under management or to enhance the portfolio manager’s performance record or to derive other rewards, financial or otherwise, could influence the portfolio manager in affording preferential treatment to those funds and/or accounts that could most significantly benefit the portfolio manager.
Related Business Opportunities.
The investment adviser or its affiliates may provide more services (such as distribution or recordkeeping) for some types of funds or accounts than for others. In such cases, a portfolio manager may benefit, either directly or indirectly, by devoting disproportionate attention to the management of fund and/or accounts that provide greater overall returns to the investment manager and its affiliates.
DWS Janus Growth & Income VIP and DWS Janus Growth Opportunities VIP
The portfolio manager may manage other accounts with investment strategies similar to the Portfolio. Fees may vary among these accounts and the portfolio manager may personally invest in some but not all of these accounts. These factors could create conflicts of interest because a portfolio manager may have incentives to favor certain accounts over others, resulting in other accounts outperforming the Portfolio. A conflict may also exist if a portfolio manager identified a limited investment opportunity that may be appropriate for more than one account, but the Portfolio is not able to take full advantage of that opportunity due to the need to allocate that opportunity among multiple accounts. In addition, the portfolio manager may execute transactions for another account that may adversely impact the value of securities held by the Portfolio. However, these risks may be mitigated by the fact that accounts with like investment strategies managed by a particular portfolio manager may be generally managed in a similar fashion, subject to exceptions to account for particular investment restrictions or policies applicable only to certain accounts, portfolio holdings that may be transferred in-kind when an account is opened, differences in cash flows and account sizes, and similar factors.
DWS MFS Strategic Value VIP
MFS seeks to identify potential conflicts of interest resulting from a portfolio manager’s management of both the Portfolio and other accounts and has adopted policies and procedures designed to address such potential conflicts.
In certain instances there may be securities which are suitable for the Portfolio as well as for accounts with similar investment objectives of the Adviser or subsidiary of the Adviser. Securities transactions for the Portfolio and other accounts with similar investment objectives are generally executed on the same day, or the next day. Nevertheless, it may develop that a particular security is bought or sold for only one client even though it might be held by, or bought or sold
67
for, other clients. Likewise, a particular security may be bought for one or more clients when one or more other clients are selling that same security.
When two or more clients are simultaneously engaged in the purchase or sale of the same security, the securities are allocated among clients in a manner believed by MFS to be fair and equitable to each. It is recognized that in some cases this system could have a detrimental effect on the price or volume of the security as far as the Portfolio is concerned. In most cases, however, MFS believes that the Portfolio’s ability to participate in volume transactions will produce better executions for the Portfolio.
MFS does not receive a performance fee for its management of the Portfolio. MFS and/or a portfolio manager may have an incentive to allocate favorable or limited opportunity investments or structure the timing of investments to favor accounts other than the Portfolio — for instance, those that pay a higher advisory fee and/or have a performance fee.
DWS Oak Strategic Equity VIP
The subadvisor does not believe that there are potential material conflicts of interest that would arise because James D. Oelschlager puts his own assets in the same areas he puts his clients’ assets while adhering to the Code of Ethics of Oak Associates ltd.
DWS Turner Mid Cap Growth VIP
As is typical for many money managers, potential conflicts of interest may arise related to Turner’s management of accounts including the Portfolio where not all accounts are able to participate in a desired IPO, or other limited opportunity, relating to use of soft dollars and other brokerage practices, related to the voting of proxies, employee personal securities trading related to the side by side management of accounts with performance-based fees and accounts with fixed fees, and relating to a variety of other circumstances. In all cases, however, Turner believes it has written policies and procedures in place reasonably designed to prevent violations of the federal securities laws and to prevent material conflicts of interest from arising. Please also see Turner’s Form ADV, Part II for a description of some of its policies and procedures in this regard.
DISTRIBUTOR
DWS Scudder Distributors, Inc. (“DWS-SDI” or the “Distributor”), 222 South Riverside Plaza, Chicago, Illinois 60606, a wholly owned subsidiary of DeIM, is the distributor and principal underwriter for shares of each Portfolio pursuant to an Underwriting Agreement in the continuous offering of its shares. Terms of continuation, termination and assignment under the underwriting agreement are identical to those described above with regard to the investment management agreements, except that termination other than upon assignment requires sixty days’ notice.
Each Portfolio has adopted a distribution plan under Rule 12b-1 (the “Plan”) that provides for fees payable as an expense of the Class B shares. Under the plan, the Fund may make quarterly payments as reimbursement to the distributor for distribution and shareholder servicing related expenses incurred or paid by the distributor or a participating insurance company. No such payment shall be made with respect to any quarterly period in excess of an amount determined for such period at the annual rate of .25% of the average daily net assets of Class B shares during that quarterly period. The fee is payable by the Fund, on behalf of each Portfolio, of up to 0.25% of the average daily net assets attributable to the Class B shares of a Portfolio. Because 12b-1 fees are paid out of Portfolio assets on an ongoing basis, they will, over time, increase the cost of investment and may cost more than other types of sales charges. The Plan and any Rule 12b-1-related agreement that is entered into by the Fund or the Distributor in connection with the Plan will continue in effect for a period of more than one year only so long as continuance is specifically approved at least annually by a vote of a majority of the Fund’s Board of Trustees, and of a majority of the Trustees who are not interested persons (as defined in the 1940 Act) of the Fund or a Portfolio (“Independent Trustees”), cast in person at a meeting called for the purpose of voting on the Plan, or the Rule 12b-1 related agreement, as applicable. In addition, the Plan and any Rule 12b-1 related agreement, may be terminated as to Class B shares of a Portfolio at any time, without penalty, by vote of a majority of the outstanding Class B shares of that Portfolio or by vote of a majority of the Independent Trustees. The Plan and Underwriting Agreement also provide that it may not be amended to increase materially the amount that may be spent for distribution of Class B shares of a Portfolio without the approval of Class B shareholders of that Portfolio.
68
For the fiscal years ended December 31, 2005 and 2004, respectively, the distribution fees paid were as follows:
| | | | | | | | | | | | |
Portfolio | | Total Fees for Fiscal 2005 | | Fees Waived | | Unpaid at December 31, 2005 | | Total Fees for Fiscal 2004 |
DWS Mid Cap Growth VIP | | $ | 15,682 | | $ | 0 | | $ | 1,509 | | $ | 12,985 |
DWS Blue Chip VIP | | $ | 101,201 | | $ | 0 | | $ | 9,106 | | $ | 67,530 |
DWS Core Fixed Income VIP | | $ | 220,712 | | $ | 0 | | $ | 16,924 | | $ | 175,814 |
DWS Global Thematic VIP | | $ | 38,339 | | $ | 0 | | $ | 3,983 | | $ | 23,461 |
DWS Government & Agency Securities VIP | | $ | 120,593 | | $ | 0 | | $ | 9,901 | | $ | 112,953 |
DWS High Income VIP | | $ | 139,382 | | $ | 0 | | $ | 11,558 | | $ | 116,895 |
DWS International Select Equity VIP | | $ | 133,737 | | $ | 0 | | $ | 12,631 | | $ | 78,650 |
DWS Large Cap Value VIP | | $ | 100,801 | | $ | 0 | | $ | 8,454 | | $ | 81,071 |
DWS Money Market VIP | | $ | 140,673 | | $ | 0 | | $ | 13,454 | | $ | 157,184 |
DWS Small Cap Growth VIP | | $ | 85,045 | | $ | 0 | | $ | 8,149 | | $ | 55,527 |
DWS Strategic Income VIP | | $ | 58,999 | | $ | 2,527 | | $ | 3,902 | | $ | 39,636 |
DWS Technology VIP | | $ | 37,898 | | $ | 0 | | $ | 3,494 | | $ | 34,701 |
DWS Balanced VIP | | $ | 82,992 | | $ | 0 | | $ | 7,009 | | $ | 66,432 |
DWS Mercury Large Cap Core VIP | | $ | 5,900 | | $ | 579 | | $ | 0 | | $ | 229 |
DWS Templeton Foreign Value VIP | | $ | 11,702 | | $ | 2,484 | | $ | 0 | | $ | 846 |
DWS Davis Venture Value VIP | | $ | 177,310 | | $ | 0 | | $ | 16,146 | | $ | 121,863 |
DWS Dreman Financial Services VIP | | $ | 42,361 | | $ | 0 | | $ | 3,703 | | $ | 34,738 |
DWS Dreman High Return Equity VIP | | $ | 312,165 | | $ | 0 | | $ | 27,861 | | $ | 230,719 |
DWS Dreman Small Cap Value VIP | | $ | 189,045 | | $ | 0 | | $ | 16,717 | | $ | 128,313 |
DWS Legg Mason Aggressive Growth VIP | | $ | 18,686 | | $ | 0 | | $ | 1,948 | | $ | 14,375 |
DWS Janus Growth & Income VIP | | $ | 70,642 | | $ | 0 | | $ | 6,642 | | $ | 53,141 |
DWS Janus Growth Opportunities VIP | | $ | 22,312 | | $ | 0 | | $ | 2,143 | | $ | 17,186 |
DWS MFS Strategic Value VIP | | $ | 82,714 | | $ | 0 | | $ | 3,791 | | $ | 59,488 |
DWS Oak Strategic Equity VIP | | $ | 50,458 | | $ | 0 | | $ | 4,285 | | $ | 42,282 |
DWS Turner Mid Cap Growth VIP | | $ | 60,306 | | $ | 0 | | $ | 5,613 | | $ | 46,764 |
In addition, DWS-SDI may, from time to time, from its own resources pay certain firms additional amounts for ongoing administrative services and assistance provided to their customers and clients who are shareholders of the Fund.
FUND SERVICE PROVIDERS
Transfer Agent
DWS Scudder Investments Service Company (“DWS-SISC”), 811 Main Street, Kansas City, Missouri 64105-2005, an affiliate of the Advisor, acts as each Portfolio’s transfer agent, dividend-paying agent and shareholder service agent. Pursuant to a sub-transfer agency agreement between DWS-SISC and DST Systems, Inc. (“DST”), DWS-SISC has delegated certain transfer agent and dividend paying agent functions to DST. The costs and expenses of such delegation are borne by DWS-SISC, not by the Portfolios.
Recordkeeping
Technically, the shareholders of the Portfolios of the Fund are the Participating Insurance Companies that offer the Portfolios as investment options for holders of certain variable annuity contracts and variable life insurance policies.
69
Effectively, ownership of Portfolio shares is passed through to insurance company contract and policy holders. The holders of the shares of the Portfolios on the records of the Fund are the Participating Insurance Companies and no information concerning the Portfolio holdings of specific contract and policy holders is maintained by the Fund. The insurance companies place orders for the purchase and redemption of Portfolio shares with the Fund reflecting the investment of premiums paid, surrender and transfer requests and other matters on a net basis; they maintain all records of the transactions and holdings of Portfolio shares and distributions thereon for individual contract and policy holders; and they prepare and mail to contract and policy holders confirmations and periodic account statements reflecting such transactions and holdings.
The Portfolios of the Fund may compensate certain insurance companies for record keeping and other administrative services performed with regard to holdings of Class B Portfolio shares as an expense of the Class B shares. These fees are included within the “Other Expenses” category in the fee table for each portfolio in the Class B Shares Prospectus (see “How Much Investors Pay” in a Portfolio’s prospectus). In addition, the Advisor may, from time to time, pay from its own resources certain insurance companies for record keeping and other administrative services related to Class A and Class B shares of the Portfolios held by such insurance companies on behalf of their contract and policy holders.
Custodian
State Street Bank and Trust Company, 225 Franklin Street, Boston, Massachusetts 02110, as custodian, has custody of all securities and cash of each Portfolio (other than the DWS International Select Equity VIP and DWS Global Thematic VIP). Brown Brothers Harriman & Co., as custodian, has custody of all securities and cash of DWS International Select Equity VIP and DWS Global Thematic VIP. Each custodian attends to the collection of principal and income, and payment for and collection of proceeds of securities bought and sold by those Portfolios.
For DWS High Income VIP, DWS Core Fixed Income VIP, DWS Strategic Income VIP, DWS Technology VIP, DWS Balanced VIP, DWS Davis Venture Value VIP, DWS Legg Mason Aggressive Growth VIP and DWS Janus Growth & Income VIP: Each of the above-noted Portfolios employs State Street Bank and Trust Company (“SSB”) 225 Franklin Street, Boston, Massachusetts 02110 as custodian. SSB has entered into agreements with foreign subcustodians approved by the Trustees pursuant to Rule 17f-5 under the 1940 Act. SSB uses Deutsche Bank AG, an affiliate of the Investment Advisor, as subcustodian (“DB Subcustodian”) in certain countries. To the extent a Portfolio holds any securities in the countries in which SSB uses DB Subcustodian as a subcustodian, those securities will be held by DB Subcustodian as part of a larger omnibus account in the name of SSB (the “Omnibus Account”). For its services, DB Subcustodian receives (1) an annual fee based on a percentage of the average daily net assets of the Omnibus Account and (2) transaction charges with respect to transactions that occur within the Omnibus Account.
Independent Registered Public Accounting Firm
The Fund’s independent registered public accounting firm, Ernst & Young LLP, 200 Clarendon Street, Boston, MA 02116 audit and report on the Portfolios’ annual financial statements, review certain regulatory reports and the Portfolios’ federal income tax returns, and perform other professional accounting, auditing, tax and advisory services when engaged to do so by the Fund. Shareholders will receive annual audited financial statements and semi-annual unaudited financial statements.
Counsel
Vedder, Price, Kaufman & Kammholz, P.C., 222 N. LaSalle St., Chicago, Illinois, serves as legal counsel to the Fund and its Independent Trustees.
Fund Accounting Agent
DWS Scudder Fund Accounting Corp. (“DWS-SFAC”), Two International Place, Boston, Massachusetts, 02210-4103, a subsidiary of DeIM, is responsible for determining the daily net asset value per share and maintaining the portfolio and general accounting records of each Portfolio. DWS-SFAC receives no fee for its services to each Portfolio, other than the Portfolios noted below. However, subject to Board approval, at some time in the future, DWS-SFAC may seek payment for its services to other Portfolios under its agreement with such Portfolios.
70
For the fiscal years ended December 31, 2005, 2004 and 2003, respectively, DWS-SFAC received the following fees for its services for the following Portfolios:
| | | | | | | | | | | | | | | |
Portfolio | | Fiscal 2005 | | Waived | | Unpaid at December 31,
2005 | | Fiscal 2004 | | Fiscal 2003 |
DWS Mid Cap Growth VIP | | $ | 62,902 | | $ | 0 | | $ | 5,623 | | $ | 72,186 | | $ | 40,010 |
DWS Global Thematic VIP | | $ | 111,026 | | $ | 0 | | $ | 8,428 | | $ | 100,052 | | $ | 61,017 |
DWS Technology VIP | | $ | 78,641 | | $ | 0 | | $ | 6,461 | | $ | 71,164 | | $ | 67,604 |
DWS Mercury Large Cap Core VIP(1) | | $ | 99,304 | | $ | 99,304 | | $ | 0 | | $ | 4,692 | | | n/a |
DWS Templeton Foreign Value VIP(1) | | $ | 102,741 | | $ | 92,526 | | $ | 0 | | $ | 8,188 | | | n/a |
DWS Davis Venture Value VIP | | $ | 85,936 | | $ | 0 | | $ | 7,908 | | $ | 88,473 | | $ | 55,063 |
DWS Dreman Financial Services VIP | | $ | 80,307 | | $ | 0 | | $ | 11,078 | | $ | 59,176 | | $ | 46,761 |
DWS Dreman High Return Equity VIP | | $ | 131,840 | | $ | 0 | | $ | 11,543 | | $ | 133,714 | | $ | 83,669 |
DWS Legg Mason Aggressive Growth VIP | | $ | 79,855 | | $ | 0 | | $ | 3,120 | | $ | 98,193 | | $ | 55,989 |
DWS Janus Growth & Income VIP | | $ | 70,775 | | $ | 0 | | $ | 6,829 | | $ | 73,094 | | $ | 77,682 |
DWS Janus Growth Opportunities VIP | | $ | 58,944 | | $ | 0 | | $ | 5,787 | | $ | 64,004 | | $ | 48,173 |
DWS MFS Strategic Value VIP | | $ | 72,872 | | $ | 0 | | $ | 5,858 | | $ | 84,107 | | $ | 36,987 |
DWS Oak Strategic Equity VIP | | $ | 53,346 | | $ | 0 | | $ | 4,520 | | $ | 58,218 | | $ | 37,800 |
DWS Turner Mid Cap Growth VIP | | $ | 94,542 | | $ | 0 | | $ | 9,447 | | $ | 99,561 | | $ | 55,282 |
| (1) | Commenced operations on November 15, 2004. |
Pursuant to a sub-administration and sub-accounting agreement among the Advisor, DWS-SFAC and SSB, DWS-SFAC has delegated certain fund accounting functions to SSB under each Portfolio’s fund accounting agreements. The costs and expenses of such delegation are borne by DWS-SFAC, not by the Portfolios.
PURCHASE AND REDEMPTIONS
Portfolio shares are sold at their net asset value next determined after an order and payment are received as described below. (See “Net Asset Value.”)
Upon receipt by a Portfolio’s transfer agent of a request for redemption, shares will be redeemed by the Fund, on behalf of a particular Portfolio, at the applicable net asset value as described below.
Market timing — the frequent trading of portfolio shares designed to take advantage of short-term market movements — can harm a Portfolio and its shareholders. The Portfolios and their agents may reject or limit purchase orders when there appears to be a pattern of market timing or other frequent purchases and sales. Because the Portfolios’ shares are offered exclusively to insurance company separate accounts that fund certain insurance contracts, a portfolio generally has little or no access to the records of individual contract holders. The Portfolios are dependent on the ability of these separate accounts to limit market timing and excessive trading of portfolio shares. The Portfolios are working with separate accounts to assess and improve controls against inappropriate trading. There can be no assurance that market timing in the Portfolios’ shares will not occur.
The Fund may, on behalf of a Portfolio, may suspend or postpone redemptions as permitted pursuant to Section 22(e) of the Investment Company Act of 1940. Generally, those circumstances are when: 1) the New York Stock Exchange is closed other than customary weekend or holiday closings; 2) trading on the New York Stock Exchange is restricted; 3) an emergency exists which makes the disposal of securities owned by a fund or the fair determination of the value of a fund’s net assets not reasonably practicable; or 4) the SEC, by order, permits the suspension of the right of redemption. Redemption payments by wire may also be delayed in the event of a non-routine closure of the Federal Reserve wire payment system.
DIVIDENDS, CAPITAL GAINS AND TAXES
Dividends for DWS Money Market VIP. DWS Money Market VIP’s net investment income is declared as a dividend daily and paid monthly in additional shares. If a shareholder withdraws its entire account, all dividends accrued to the time of withdrawal will be paid at that time.
71
Dividends for All Portfolios Except DWS Money Market VIP. The Fund normally follows the practice of declaring and distributing substantially all the net investment income and any net short-term and long-term capital gains of these Portfolios at least annually.
The Fund may at any time vary the dividend practices with respect to a Portfolio and, therefore, reserves the right from time to time to either distribute or retain for reinvestment such of its net investment income and its net short-term and long-term capital gains as the Board of Trustees of the Fund determines appropriate under the then current circumstances.
Taxes. Each Portfolio intends to qualify as a regulated investment company under subchapter M of the Internal Revenue Code (“Code”) in order to avoid taxation of the Portfolio and its shareholders.
Pursuant to the requirements of Section 817(h) of the Code, with certain limited exceptions, the only shareholders of the Portfolios will be insurance companies and their separate accounts that fund variable insurance contracts. The prospectus that describes a particular variable insurance contract discusses the taxation of separate accounts and the owner of the particular variable insurance contract.
Each Portfolio intends to comply with the requirements of Section 817(h) and related regulations. Section 817(h) of the Code and the regulations issued by the Treasury Department impose certain diversification requirements affecting the securities in which the Portfolios may invest. These diversification requirements are in addition to the diversification requirements under subchapter M and the 1940 Act. The consequences of failure to meet the requirements of Section 817(h) could result in taxation of the insurance company offering the variable insurance contract and immediate taxation of the owner of the contract to the extent of appreciation on investment under the contract.
The preceding is a brief summary of certain of the relevant tax considerations. The summary is not intended as a complete explanation or a substitute for careful tax planning and consultation with individual tax advisors.
NET ASSET VALUE
For all Portfolios (other than the DWS Money Market VIP). The net asset value of shares of each Portfolio is computed as of the close of regular trading on the New York Stock Exchange (the “Exchange”) on each day the Exchange is open for trading (the “Value Time”). The Exchange is scheduled to be closed on the following holidays: New Year’s Day, Dr. Martin Luther King, Jr. Day, Presidents’ Day, Good Friday, Memorial Day, Independence Day, Labor Day, Thanksgiving and Christmas, and on the preceding Friday or subsequent Monday when one of these holidays falls on a Saturday or Sunday, respectively. Net asset value per share is determined separately for each class of shares by dividing the value of the total assets of each Portfolio attributable to the shares of that class, less all liabilities attributable to that class, by the total number of shares of that class outstanding. The per share net asset value may be lower for certain classes of each Portfolio because of higher expenses borne by these classes.
An equity security is valued at its most recent sale price on the primary exchange or OTC market as of the Value Time. Lacking any sales, the security is valued at the calculated mean between the most recent bid quotation and the most recent asked quotation (the “Calculated Mean”) on such exchange or OTC market as of the Value Time. If it is not possible to determine the Calculated Mean, the security is valued at the most recent bid quotation on such exchange or OTC market as of the Value Time. In the case of certain foreign exchanges or OTC markets, the closing price reported by the exchange or OTC market (which may sometimes be referred to as the “official close” or the “official closing price” or other similar term) will be considered the most recent sale price.
Debt securities are valued as follows. Money market instruments purchased with an original or remaining maturity of 60 days or less, maturing at par, are valued at amortized cost. Other money market instruments are valued based on information obtained from an independent pricing service or, if such information is not readily available, by using matrix pricing techniques (formula driven calculations based primarily on current market yields). Bank loans are valued at prices supplied by an independent pricing service (which are intended to reflect the mean between the bid and asked prices), if available, and otherwise at the mean of the most recent bid and asked quotations or evaluated prices, as applicable, based on quotations or evaluated prices obtained from one or more broker-dealers. Privately placed debt securities, other than Rule 144A debt securities, initially are valued at cost and thereafter based on all relevant factors including type of security, size of holding and restrictions on disposition. Municipal debt securities are valued at prices supplied by an independent pricing service (which are intended to reflect the mean between the bid and asked prices), if available, and otherwise at the average of the means based on the most recent bid and asked quotations or evaluated prices obtained
72
from two broker-dealers. Other debt securities not addressed above are valued at prices supplied by an independent pricing service, if available, and otherwise at the most recent bid quotation or evaluated price, as applicable, obtained from one or more broker-dealers. If it is not possible to value a particular debt security pursuant to the above methods, the security is valued on the basis of factors including (but not limited to) maturity, coupon, creditworthiness, currency denomination, and the movement of the market in which the security is normally traded.
An exchange-traded option contract on securities, currencies and other financial instruments is valued at its most recent sale price on such exchange. Lacking any sales, the option contract is valued at the Calculated Mean. If it is not possible to determine the Calculated Mean, the option contract is valued at the most recent bid quotation in the case of a purchased option contract or the most recent asked quotation in the case of a written option contract, in each case as of the Value Time. An option contract on securities, currencies and other financial instruments traded in the OTC market is valued on the Value Date at the market to market price, or if not available, at the evaluated price provided by the broker-dealer with which it was traded. Futures contracts (and options thereon) are valued at the most recent settlement price, if available, on the exchange on which they are traded most extensively. With the exception of stock index futures contracts which trade on the Chicago Mercantile Exchange, closing settlement times are prior to the close of trading on the New York Stock Exchange. For stock index futures contracts which trade on the Chicago Mercantile Exchange, closing settlement prices are normally available at approximately 4:20 Eastern time. If no settlement price is available, the last traded price on such exchange will be used.
If market quotations for a portfolio asset are not readily available or the value of a portfolio asset as determined in accordance with Board-approved procedures does not represent the fair market value of a portfolio asset, the value of the portfolio asset is taken to be an amount which, in the opinion of a portfolio’s Pricing Committee (or, in some cases, the Board’s Valuation Committee), represents fair market value. The value of other portfolio holdings owned by a Portfolio in the Fund is determined in a manner which is intended to reflect the fair market value of the asset on the valuation date, based on valuation procedures adopted by the portfolio’s Board and overseen by the portfolio’s Pricing Committee.
For DWS Money Market VIP. The net asset value of shares of the Portfolio is calculated at 4:00 p.m. Eastern time or the close of business on each day the New York Stock Exchange (the “Exchange”) is open for trading. The Exchange is scheduled to be closed on the following holidays: New Year’s Day, Dr. Martin Luther King, Jr. Day, Presidents’ Day, Good Friday, Memorial Day, Independence Day, Labor Day, Thanksgiving and Christmas, and on the preceding Friday or subsequent Monday when one of these holidays falls on a Saturday or Sunday, respectively.
DWS Money Market VIP values its portfolio instruments at amortized cost, which does not take into account unrealized capital gains or losses. This involves initially valuing an instrument at its cost and thereafter assuming a constant amortization to maturity of any discount or premium, regardless of the impact of fluctuating interest rates on the market value of the instrument. While this method provides certainty in valuation, it may result in periods during which value, as determined by amortized cost, is higher or lower than the price the Portfolio would receive if it sold the instrument. Calculations are made to compare the value of the Portfolio’s investments valued at amortized cost with market values. Market valuations are obtained by using actual quotations provided by market makers, estimates of market value, or values obtained from yield data relating to classes of money market instruments published by reputable sources at the mean between the bid and asked prices for the instruments. If a deviation of 1/2 of 1% or more were to occur between the net asset value per share calculated by reference to market values and the Portfolio’s $1.00 per share net asset value, or if there were any other deviation that the Board of Trustees believed would result in a material dilution to shareholders or purchasers, the Board of Trustees would promptly consider what action, if any, should be initiated. If the Portfolio’s net asset value per share (computed using market values) declined, or were expected to decline, below $1.00 (computed using amortized cost), the Board of Trustees might temporarily reduce or suspend dividend payments in an effort to maintain the net asset value at $1.00 per share. As a result of such reduction or suspension of dividends or other action by the Board of Trustees, an investor would receive less income during a given period than if such a reduction or suspension had not taken place. Such action could result in investors receiving no dividend for the period during which they hold their shares and receiving, upon redemption, a price per share lower than that which they paid. On the other hand, if the Portfolio’s net asset value per share (computed using market values) were to increase, or were anticipated to increase above $1.00 (computed using amortized cost), the Board of Trustees might supplement dividends in an effort to maintain the net asset value at $1.00 per share. Redemption orders received in connection with the administration of checkwriting programs by certain dealers or other financial services firms prior to the determination of the Portfolio’s net asset value also may be processed on a confirmed basis in accordance with the procedures established by DWS-SDI.
73
TRUSTEES AND OFFICERS
The following table presents certain information regarding the Trustees and Officers of DWS Variable Series II as of May 1, 2006. Each individual’s year of birth is set forth in parentheses after his or her name. Unless otherwise noted, (i) each individual has engaged in the principal occupation(s) noted in the table for at least the most recent five years, although not necessarily in the same capacity, and (ii) unless otherwise noted, the address of each individual is c/o Deutsche Asset Management, 222 South Riverside Plaza, Chicago, Illinois 60606. Each Trustee’s term of office extends until the next shareholder’s meeting called for the purpose of electing such Trustee and until the election and qualification of a successor, or until such Trustee sooner dies, retires, resigns or is removed as provided in the governing documents of the Trust.
The following individuals hold the same position with the Fund and the Trust.
Independent Trustees
| | | | |
Name, Year of Birth, Position(s) Held with
the Trust and Length of Time Served(1) | | Principal Occupation(s) During Past 5 Years and Other Directorships Held | | Number of
Funds in DWS
Fund Complex
Overseen |
Shirley D. Peterson (1941) Chairperson since 2004, and Trustee, 1995-present | | Retired; formerly, President, Hood College (1995-2000); prior thereto, Partner, Steptoe & Johnson (law firm); Commissioner, Internal Revenue Service; Assistant Attorney General (Tax), US Department of Justice. Directorships: Federal Mogul Corp. (supplier of automotive components and subsystems); AK Steel (steel production); Goodyear Tire & Rubber Co. (April 2004-present); Champion Enterprises, Inc. (manufactured home building); Wolverine World Wide, Inc. (designer, manufacturer and marketer of footwear) (April 2005-present); Trustee, Bryn Mawr College. Former Directorship: Bethlehem Steel Corp. | | 71 |
| | |
John W. Ballantine (1946) Trustee, 1999-present | | Retired; formerly, Executive Vice President and Chief Risk Management Officer, First Chicago NBD Corporation/The First National Bank of Chicago (1996-1998); Executive Vice President and Head of International Banking (1995-1996). Directorships: First Oak Brook Bancshares, Inc.; Oak Brook Bank; Healthways Inc. (provider of disease and care management services); Portland General Electric (utility company) | | 71 |
| | |
Donald L. Dunaway (1937) Trustee, 1980-present | | Retired; formerly, Executive Vice President, A. O. Smith Corporation (diversified manufacturer) (1963-1994) | | 71 |
| | |
James R. Edgar (1946) Trustee, 1999-present | | Distinguished Fellow, University of Illinois, Institute of Government and Public Affairs (1999-present); formerly, Governor, State of Illinois (1991-1999). Directorships: Kemper Insurance Companies; John B. Sanfilippo & Son, Inc. (processor/packager/marketer of nuts, snacks and candy products); Horizon Group Properties, Inc.; Youbet.com (online wagering platform); Alberto-Culver Company (manufactures, distributes and markets health and beauty care products) | | 71 |
| | |
Paul K. Freeman (1950) Trustee, 2002-present | | President, Cook Street Holdings (consulting); Consultant, World Bank/Inter-American Development Bank; formerly, Project Leader, International Institute for Applied Systems Analysis (1998-2001); Chief Executive Officer, The Eric Group, Inc. (environmental insurance) (1986-1998) | | 71 |
| | |
Robert B. Hoffman (1936) Trustee, 1981-present | | Retired; formerly, Chairman, Harnischfeger Industries, Inc. (machinery for the mining and paper industries) (1999-2000); prior thereto, Vice Chairman and Chief Financial Officer, Monsanto Company (agricultural, pharmaceutical and nutritional/food products) (1994-1999). Directorship: RCP Advisors, LLC (a private equity investment advisory firm) | | 71 |
74
| | | | |
William McClayton (1944) Trustee, 2004-present | | Managing Director of Finance and Administration, DiamondCluster International, Inc. (global management consulting firm) (2001-present); formerly, Partner, Arthur Andersen LLP (1986-2001). Formerly: Trustee, Ravinia Festival; Board of Managers, YMCA of Metropolitan Chicago | | 71 |
| | |
Robert H. Wadsworth (1940) Trustee, 2004-present | | President, Robert H. Wadsworth & Associates, Inc. (consulting firm) (1983 to present). Director, The European Equity Fund, Inc. (since 1986), The New Germany Fund, Inc. (since 1992), The Central Europe and Russia Fund, Inc. (since 1990). Formerly, Trustee of New York Board DWS Funds; President and Trustee, Trust for Investment Managers (registered investment company) (1999-2002). President, Investment Company Administration, L.L.C. (1992*-2001); President, Treasurer and Director, First Fund Distributors, Inc. (June 1990-January 2002); Vice President, Professionally Managed Portfolios (May 1991-January 2002) and Advisors Series Trust (October 1996-January 2002) (registered investment companies) | | 74 |
| | |
| | * Inception date of the corporation which was the predecessor to the L.L.C. | | |
Officers(2)
| | | | |
Name, Date of Birth, Position(s) Held with
the Trust and Length of Time Served(1) | | Principal Occupation(s) During Past 5 Years and Other Directorships Held | | Number of
Funds in DWS
Fund Complex
Overseen |
Michael Colon(4) (1969) President, 2006-present | | Managing Director(3) and Chief Operating Officer, Deutsche Asset Management (since 1999); President, DWS Global High Income Fund, Inc. (since April 2006), DWS Global Commodities Stock Fund, Inc. (since April 2006), The Brazil Fund, Inc. (since April 2006), The Korea Fund, Inc. (since April 2006) | | n/a |
| | |
Philip J. Collora (1945) Vice President and Assistant Secretary, 1986-present | | Director(3), Deutsche Asset Management | | n/a |
| | |
Paul H. Schubert(4) (1963) Chief Financial Officer, 2004-present Treasurer, 2005-present | | Managing Director(3), Deutsche Asset Management (since July 2004); formerly, Executive Director, Head of Mutual Fund Services and Treasurer for UBS Family of Funds (1998-2004); Vice President and Director of Mutual Fund Finance at UBS Global Asset Management (1994-1998) | | n/a |
| | |
John Millette(5) (1962) Secretary, 2001-present | | Director(3), Deutsche Asset Management | | n/a |
| | |
Patricia DeFilippis(4) (1963) Assistant Secretary, 2005-present | | Vice President, Deutsche Asset Management (since June 2005); formerly, Counsel, New York Life Investment Management LLC (2003-2005); legal associate, Lord, Abbett & Co. LLC (1998-2003) | | n/a |
| | |
Elisa D. Metzger(4) (1962) Assistant Secretary since 2005 | | Director(3), Deutsche Asset Management (since September 2005); formerly, Counsel, Morrison and Foerster LLP (1999-2005) | | n/a |
| | |
Caroline Pearson(5) (1962) Assistant Secretary, 1998-present | | Managing Director(3), Deutsche Asset Management | | n/a |
| | |
Scott M. McHugh(5) (1971) Assistant Treasurer, 2005-present | | Director(3), Deutsche Asset Management | | n/a |
75
| | | | |
Kathleen Sullivan D’Eramo(5) (1957) Assistant Treasurer, 2003-present | | Director(3), Deutsche Asset Management | | n/a |
| | |
John Robbins(4) (1966) Anti-Money Laundering Compliance Officer, 2005-present | | Managing Director(3), Deutsche Asset Management (since 2005); formerly, Chief Compliance Officer and Anti-Money Laundering Compliance Officer for GE Asset Management (1999-2005) | | n/a |
| | |
Philip Gallo(4) (1962) Chief Compliance Officer, 2004-present | | Managing Director(3), Deutsche Asset Management (2003-present); formerly, Co-Head of Goldman Sachs Asset Management Legal (1994-2003) | | n/a |
| (1) | Length of time served represents the date that each Trustee was first elected to the common board of Trustees which oversees a number of investment companies, including the Fund, managed by the Advisor. For the officers of the Fund, length of time served represents the date that each officer was first elected to serve as an officer of any fund overseen by the aforementioned common board of Trustees. |
| (2) | As a result of their respective positions held with the Advisor, these individuals are considered “interested persons” of the Advisor within the meaning of the 1940 Act. Interested persons receive no compensation from the Fund. |
| (3) | Executive title, not a board directorship. |
| (4) | Address: 345 Park Avenue, New York, New York 10154. |
| (5) | Address: Two International Place, Boston, Massachusetts 02110. |
Officers’ Role with Principal Underwriter: DWS Scudder Distributors, Inc.
| | |
| Michael Colon: | | Director and Chief Operating Officer |
| Paul H. Schubert: | | Vice President |
| Caroline Pearson: | | Secretary |
| Philip J. Collora: | | Assistant Secretary |
Trustees’ Responsibilities. The officers of the Trust manage its day-to-day operations under the direction of the Trust’s Board of Trustees. The primary responsibility of the Board is to represent the interests of the shareholders of the Fund and to provide oversight of the management of the Fund. A majority of the Trust’s Board members are not “interested persons” of the Advisor.
The Board has adopted its own Governance Procedures and Guidelines and has established a number of committees, as described below. For each of the following Committees, the Board has adopted a written charter setting forth the Committees’ responsibilities.
Board Committees. The Board of Trustees oversees a number of investment companies managed by the Advisor. Information shown below represents meetings held on behalf of all such funds. The common Board has the following committees:
Audit Committee: The Audit Committee, which consists entirely of Independent Trustees, makes recommendations regarding the selection of independent registered public accounting firms for the Fund, confers with the independent registered public accounting firm regarding the Fund’s financial statements, the results of audits and related matters, and performs such other tasks as the full Board deems necessary or appropriate. The Audit Committee receives annual representations from the independent registered public accounting firms as to their independence. The members of the Audit Committee are Donald L. Dunaway (Chair), Robert B. Hoffman and William McClayton. The Audit Committee held ten meetings during calendar year 2005.
76
Nominating and Governance Committee: The Nominating and Governance Committee, which consists entirely of Independent Trustees, seeks and reviews candidates for consideration as nominees for membership on the Board and oversees the administration of the Fund’s Governance Procedures and Guidelines. The members of the Nominating and Governance Committee are Shirley D. Peterson (Chair), James R. Edgar and William McClayton. Shareholders wishing to submit the name of a candidate for consideration as a Board member by the Committee should submit their recommendation(s) and resume to the Secretary of the Trust. The Nominating and Governance Committee held five meetings during calendar year 2005.
Contract Review Committee: The Contract Review Committee, which consists entirely of Independent Trustees, oversees the annual contract review process. The members of the Contract Review Committee are Paul K. Freeman (Chair), John W. Ballantine, Donald L. Dunaway and Robert B. Hoffman. The Contract Review Committee held three meetings during calendar year 2005.
Valuation Committee: The Valuation Committee reviews Valuation Procedures adopted by the Board, determines fair value of the Fund’s securities as needed in accordance with the Valuation Procedures and performs such other tasks as the full Board deems necessary. The members of the Valuation Committee are John W. Ballantine (Chair), Robert H. Wadsworth, Donald L. Dunaway (alternate) and William McClayton (alternate). The Trust’s Valuation Committee held one meeting for each portfolio during calendar year 2005 except as follows: for DWS Balanced VIP, DWS High Income VIP, DWS Strategic Income VIP and DWS Dreman Small Cap Value VIP, the Trust’s Valuation Committee held two meetings for during calendar year 2005.
Equity Oversight Committee: The Equity Oversight Committee oversees investment activities of the Fund, such as investment performance and risk, expenses and services provided under the investment management agreement. The members of the Equity Oversight Committee are Robert B. Hoffman (Chair), John W. Ballantine and Robert H. Wadsworth. The Equity Oversight Committee held five meetings during calendar year 2005.
Operations Committee: The Operations Committee oversees the operations of the Fund, such as reviewing each Fund’s administrative fees and expenses, distribution arrangements, portfolio transaction policies, custody and transfer agency arrangements and shareholder services. Currently, the members of the Operations Committee are John W. Ballantine (Chair), Paul K. Freeman and Robert H. Wadsworth. The Operations Committee held seven meetings during calendar year 2005.
Fixed-Income Oversight Committee: The Fixed-Income Oversight Committee oversees investment activities of the Funds, such as investment performance and risk, expenses and services provided under the investment management agreement. The members of the Fixed-Income Oversight Committee are Paul K. Freeman (Chair), Donald L. Dunaway and James R. Edgar. The Fixed-Income Oversight Committee held six meetings during calendar year 2005.
Remuneration. For the calendar year ended 2005, each Independent Trustee received a monthly retainer, paid on a quarterly basis, and an attendance fee, plus expenses, for each Board meeting and Committee meeting attended. Effective January 1, 2006, each Independent Trustee receives an annual base retainer, paid quarterly, and, as applicable, an additional annual fixed fee(s) for serving as committee member, committee chairman and/or as the Independent Board chairman. The Trustees serve as board members of various other funds advised by the Advisor. The Advisor supervises the Fund’s investments, pays the compensation and expenses of its personnel who serve as Trustees and officers on behalf of the Fund and receives a management fee for its services.
The Board of Trustees of the Trust established a deferred compensation plan for the Independent Trustees (“Deferred Compensation Plan”). Under the Deferred Compensation Plan, the Independent Trustees may defer receipt of all, or a portion, of the compensation they earn for their services to the Fund, in lieu of receiving current payments of such compensation. Any deferred amount is treated as though an equivalent dollar amount has been invested in shares of one or more funds advised by the Advisor (“Shadow Shares”). Governor Edgar currently has elected to defer at least a portion of his fees. In addition, previously, Mr. Dunaway elected to defer fees that were payable, which are now included under the Deferred Compensation Plan. The equivalent Shadow Shares are reflected below in the table describing the Trustee’s share ownership.
Members of the Board of Trustees who are officers, directors, employees or stockholders of the Advisor or its affiliates receive no direct compensation from the Fund, although they are compensated as employees of the Advisor, or its affiliates, and as a result may be deemed to participate in fees paid by the Fund. The Independent Trustees are not entitled
77
to benefits under any fund pension or retirement plan. The following table shows compensation received by each Trustee from the Fund and aggregate compensation from the fund complex during the calendar year 2005.
| | | | | | | | | |
Name of Trustee | | Compensation from DWS Variable Series II | | Pension or Retirement Benefits Accrued as Part of Fund Expenses | | Total Compensation Paid to Trustee from Fund Complex(3)(4)(5) |
John W. Ballantine | | $ | 34,410 | | $ | 0 | | $ | 215,150 |
Donald L. Dunaway(1) | | $ | 33,810 | | $ | 0 | | $ | 224,660 |
James R. Edgar(2) | | $ | 28,210 | | $ | 0 | | $ | 173,790 |
Paul K. Freeman | | $ | 32,520 | | $ | 0 | | $ | 215,150 |
Robert B. Hoffman | | $ | 30,750 | | $ | 0 | | $ | 187,940 |
William McClayton | | $ | 27,560 | | $ | 0 | | $ | 181,180 |
Shirley D. Peterson(6) | | $ | 32,680 | | $ | 0 | | $ | 208,580 |
Robert H. Wadsworth | | $ | 29,910 | | $ | 0 | | $ | 224,510 |
| (1) | Does not include deferred fees. Pursuant to a Deferred Compensation Plan, as discussed above, Mr. Dunaway previously elected, in prior years, to defer fees. Deferred amounts are treated as though an equivalent dollar amount has been invested in Shadow Shares (as defined above) of funds managed by the Advisor. |
| (2) | Includes deferred fees. Pursuant to a Deferred Compensation Plan, as discussed above, deferred amounts are treated as though an equivalent dollar amount has been invested in Shadow Shares (as defined above) of funds managed by the Advisor in which compensation may be deferred by Governor Edgar. Total deferred fees (including interest thereon and the return from the assumed investment in the funds managed by the Advisor) payable from the Fund to Governor Edgar are $81,477. |
| (3) | For each Trustee, except Mr. Wadsworth, total compensation includes compensation for service on the boards of 31 trusts/corporations comprised of 85 funds/portfolios. Each Trustee, except Mr. Wadsworth, currently serves on the boards of 22 trusts/corporations comprised of 71 funds/portfolios. Mr. Wadsworth currently serves on the boards of 24 DeAM trust/corporations comprised of 74 funds/portfolios. |
| (4) | Aggregate compensation reflects amounts paid to the Trustees for numerous special meetings of ad hoc committees of the Chicago Board in connection with reviewing the Funds’ rebranding initiatives to change to the DWS Family of Funds and with respect to legal and regulatory matters. Such amounts totaled $15,340 for each of Messrs. Ballantine, Freeman and Ms. Peterson, $20,510 for Mr. Dunaway, and $5,170 for Messrs. Edgar, Hoffman, McClayton and Wadsworth. These meeting fees were borne by the Advisor. |
| (5) | If the new Independent Trustee compensation structure, effective January 1, 2006, had been in effect for the calendar year 2005, the range of compensation paid to the Independent Trustees would have been between $175,000 and $225,000. |
| (6) | Includes $38,010 in annual retainer fees received by Ms. Peterson as Chairperson of the Board. |
Mr. Freeman, prior to his service as Independent Trustee of the Trust, served as a board member of certain funds in the Deutsche Bank complex (“DB Funds”). In connection with his resignation and the resignation of certain other board members as Trustees of the DB Funds on July 30, 2002 (the “Effective Date”), which was part of a restructuring of the boards overseeing the DB Funds, Deutsche Asset Management, Inc. (“DeAM”) agreed to recommend, and, if necessary obtain, directors and officers (“D&O”) liability insurance coverage for the prior board members, including Mr. Freeman, that is at least as equivalent in scope and amount to the D&O coverage provided to the prior board members for the six-year period following the Effective Date. In the event that D&O insurance coverage is not available in the commercial marketplace on commercially reasonable terms from a conventional third party insurer, DeAM reserved the right to provide substantially equivalent protection in the form of an indemnity or financial guarantee from an affiliate of DeAM. The D&O policy in effect prior to the Effective Date provided aggregate coverage of $25,000,000, subject to a $250,000 per claim deductible.
78
Trustee Fund Ownership. Under the Trust’s Governance Procedures and Guidelines, the Independent Trustees have established the expectation that within three years of becoming a Trustee, an Independent Trustee will have invested an amount in those funds he or she oversees (which shall include amounts held under a deferred fee agreement that are valued based on “shadow shares” in such funds) in the aggregate in excess of $150,000. Each interested Trustee is also encouraged to own an amount of shares (based upon their own individual judgment) of those funds that he or she oversees that is suitable for his or her own appropriate investment needs. The following tables set forth each Trustee’s share ownership of the Fund and all funds in the fund complex overseen by each Trustee as of December 31, 2005.
| | | | |
Name of Trustee | | Dollar Range of Securities Owned in DWS Variable Series II | | Aggregate Dollar Range of Securities Owned in All Funds in the Fund Complex Overseen by Trustee |
| John W. Ballantine | | None | | Over $100,000 |
| Donald L. Dunaway* | | None | | Over $100,000 |
| James R. Edgar* | | None | | Over $100,000 |
| Paul K. Freeman | | None | | $1-$10,000** |
| Robert B. Hoffman | | None | | Over $100,000 |
| William McClayton | | None | | $50,001-$100,000*** |
| Shirley D. Peterson | | None | | Over $100,000 |
| Robert H. Wadsworth | | None | | Over $100,000 |
| * | The dollar range of shares shown includes shadow shares of certain DWS Family of Funds in which Mr. Dunaway and Governor Edgar are deemed to be invested pursuant to the Fund’s Deferred Compensation Plan as more fully described above under “Remuneration.” |
| ** | Mr. Freeman owned over $100,000 in other funds within the DWS Fund Complex. |
| *** | Mr. McClayton was appointed to the Chicago Board on December 30, 2004. Ownership in Securities of the Advisor and Related Companies |
As reported to the Fund, the information in the following table reflects ownership by the Independent Trustees and their immediate family members of certain securities as of December 31, 2005. An immediate family member can be a spouse, children residing in the same household including step and adoptive children and any dependents. The securities represent ownership in an investment advisor or principal underwriter of the Fund and any persons (other than a registered investment company) directly or indirectly controlling, controlled by, or under common control with an investment advisor or principal underwriter of the Fund (including Deutsche Bank AG) (collectively, the “Company”).
| | | | | | | | | | |
Independent Trustee | | Owner and
Relationship to Trustee | | Company | | Title of Class | | Value of Securities on
an Aggregate Basis | | Percent of Class on an Aggregate Basis |
| John W. Ballantine | | | | None | | | | | | |
| Donald L. Dunaway | | | | None | | | | | | |
| James R. Edgar | | | | None | | | | | | |
| Paul K. Freeman | | | | None | | | | | | |
| Robert B. Hoffman | | | | None | | | | | | |
| William McClayton | | | | None | | | | | | |
| Shirley D. Peterson | | | | None | | | | | | |
| Robert H. Wadsworth | | | | None | | | | | | |
Securities Beneficially Owned
As of April 10, 2006 all Trustees and Officers of the Fund as a group owned beneficially (as that term is defined is section 13(d) of the Securities Exchange Act of 1934) less than 1% of the outstanding securities of the Fund.
79
To the best of the Fund’s knowledge, as of April 10, 2006, no person owned of record or beneficially 5% or more of any class of the Fund’s outstanding shares, except as noted below.
Beneficial Ownership Information
As of April 10, 2006, 7,066,488.508 shares in the aggregate, or 25.22% of the outstanding shares of DWS Balanced VIP, Class A were held in the name of Allmerica Life SVSII, Worcester, MA 01653-002, who may be deemed as the beneficial owner of certain of these shares.
As of April 10, 2006, 1,656,410.784 shares in the aggregate, or 5.91% of the outstanding shares of DWS Balanced VIP, Class A were held in the name of Allmerica Life Ins. Co., Worcester, MA 01653-002, who may be deemed as the beneficial owner of certain of these shares.
As of April 10, 2006, 11,128,640.429 shares in the aggregate, or 39.72% of the outstanding shares of DWS Balanced VIP, Class A were held in the name of Kemper Investors Life, Elgin, IL 60123-7836, who may be deemed as the beneficial owner of certain of these shares.
As of April 10, 2006,1,862,420.899 shares in the aggregate, or 39.72% of the outstanding shares of DWS Balanced VIP, Class A were held in the name of Symetra Life Insurance, Co., Attn: Life Finance, Separate Accounts, Bellevue, WA 98004-5130, who may be deemed as the beneficial owner of certain of these shares.
As of April 10, 2006, 4,851,837.195 shares in the aggregate, or 17.32% of the outstanding shares of DWS Balanced VIP, Class A were held in the name of Zurich Destinations Farmers SVSII, c/o Kilico, Attn: Investment Accounting LL-2W, Greenville, SC 29602-9097, who may be deemed as the beneficial owner of certain of these shares.
As of April 10, 2006, 1,071,675.468 shares in the aggregate, or 73.29% of the outstanding shares of DWS Balanced VIP, Class B were held in the name of The Manufacturers Life Ins. Co. (USA), Boston, MA 02116.3787, who may be deemed as the beneficial owner of certain of these shares.
As of April 10, 2006, 185,140.700 shares in the aggregate, or 12.66% of the outstanding shares of DWS Balanced VIP, Class B were held in the name of Travelers Life & Annuity Company, Hartford, CT 06103-3432, who may be deemed as the beneficial owner of certain of these shares.
As of April 10, 2006, 199,334.431 shares in the aggregate, or 13.63% of the outstanding shares of DWS Balanced VIP, Class B were held in the name of Travelers Insurance Company, Attn: Shareholder Accounting Unit, Hartford, CT 06199-0027, who may be deemed as the beneficial owner of certain of these shares.
As of April 10, 2006, 6,420,241.897 shares in the aggregate, or 31.58% of the outstanding shares of DWS Blue Chip VIP, Class A were held in the name of Allmerica Life SVSII, Worcester, MA 01653-0002, who may be deemed as the beneficial owner of certain of these shares.
As of April 10, 2006, 11,073,540.602 shares in the aggregate, or 54.48% of the outstanding shares of DWS Blue Chip VIP, Class A were held in the name of Zurich Destinations Farmers SVSII, c/o Kilico, Attn: Investment Accounting LL-2W, Greenville, SC 29602-9097, who may be deemed as the beneficial owner of certain of these shares.
As of April 10, 2006, 894,804.087 shares in the aggregate, or 4.40% of the outstanding shares of DWS Blue Chip VIP, Class A were held in the name of State Street Band & Trust Co., FBO SVSII Scud Growth & Inc., Strategic Portfolio, Attn: Marylou McPhee, Adams Building 2 North, JPB2N, North Quincy, MA 02171-2119, who may be deemed as the beneficial owner of certain of these shares.
As of April 10, 2006, 1,174,938.811 shares in the aggregate, or 5.65% of the outstanding shares of DWS Blue Chip VIP, Class A were held in the name of State Street Band & Trust Co., FBO SVSII Scud Growth, Strategic Portfolio, Attn: Marylou McPhee, North Quincy, MA 02171-2119, who may be deemed as the beneficial owner of certain of these shares.
80
As of April 10, 2006, 2,248,100.693 shares in the aggregate, or 74.67% of the outstanding shares of DWS Blue Chip VIP, Class B were held in the name of The Manufacturers Life Ins. Co. (USA), Boston, MA 02116-3787, who may be deemed as the beneficial owner of certain of these shares.
As of April 10, 2006, 353,720.738 shares in the aggregate, or 11.75% of the outstanding shares of DWS Blue Chip VIP, Class B were held in the name of Travelers Life & Annuity Company, Hartford, CT 06103-3432, who may be deemed as the beneficial owner of certain of these shares.
As of April 10, 2006, 388,501.313 shares in the aggregate, or 12.90% of the outstanding shares of DWS Blue Chip VIP, Class B were held in the name of Travelers Insurance Company, Attn: Shareholder Accounting Unit, Hartford, CT 06199-0027, who may be deemed as the beneficial owner of certain of these shares.
As of April 10, 2006, 6,214,161.772 shares in the aggregate, or 26.30% of the outstanding shares of DWS Core Fixed Income VIP, Class A were held in the name of Allmerica Life SVSII, Worcester, MA 01653-0002, who may be deemed as the beneficial owner of certain of these shares.
As of April 10, 2006, 6,670,159.932 shares in the aggregate, or 28.23% of the outstanding shares of DWS Core Fixed Income VIP, Class A were held in the name of Zurich Destinations Farmers SVSII, c/o Kilico, Attn: Investment Accounting LL-2W, Greenville, SC 29602-9097, who may be deemed as the beneficial owner of certain of these shares.
As of April 10, 2006, 4,648,390.823 shares in the aggregate, or 19.68% of the outstanding shares of DWS Core Fixed Income VIP, Class A were held in the name of State Street Band & Trust Co., FBO SVSII Scud Growth & Inc., Strategic Portfolio, Attn: Marylou McPhee, Adams Building 2 North, JPB2N, North Quincy, MA 02171-2119, who may be deemed as the beneficial owner of certain of these shares.
As of April 10, 2006, 2,793,348.955 shares in the aggregate, or 11.82% of the outstanding shares of DWS Core Fixed Income VIP, Class A were held in the name of State Street Band & Trust Co., FBO SVSII Scud Growth & Inc., Strategic Portfolio, Attn: Marylou McPhee, North Quincy, MA 02171-2119, who may be deemed as the beneficial owner of certain of these shares.
As of April 10, 2006, 1,523,341.495 shares in the aggregate, or 6.45% of the outstanding shares of DWS Core Fixed Income VIP, Class A were held in the name of State Street Band & Trust Co., FBO SVSII Scudder Growth & Income Strategic Portfolio, Attn: Marylou McPhee, North Quincy, MA 02171-2119, who may be deemed as the beneficial owner of certain of these shares.
As of April 10, 2006, 6,311,895.151 shares in the aggregate, or 82.53% of the outstanding shares of DWS Core Fixed Income VIP, Class B were held in the name of The Manufacturers Life Insurance Company (USA), Boston, MA 02116-3787, who may be deemed as the beneficial owner of certain of these shares.
As of April 10, 2006, 672,364.844 shares in the aggregate, or 8.79% of the outstanding shares of DWS Core Fixed Income VIP, Class B were held in the name of Travelers Life & Annuity Company, Hartford, CT 06103-3432, who may be deemed as the beneficial owner of certain of these shares.
As of April 10, 2006, 642,059.202 shares in the aggregate, or 8.39% of the outstanding shares of DWS Core Fixed Income VIP, Class B were held in the name of Travelers Insurance Company, Attn: Shareholder Accounting Unit, Hartford, CT 06199-0027, who may be deemed as the beneficial owner of certain of these shares.
As of April 10, 2006, 4,943,664.911 shares in the aggregate, or 19.71% of the outstanding shares of DWS Davis Venture Value VIP, Class A were held in the name of Allmerica Life SVSII, Worcester, MA 01653-0002, who may be deemed as the beneficial owner of certain of these shares.
As of April 10, 2006, 18,023,966.293 shares in the aggregate, or 71.87% of the outstanding shares of DWS Davis Venture Value VIP, Class A were held in the name of Zurich Destinations Farmers SVSII, c/o Kilico, Attn: Investment Accounting LL-2W, Greenville, SC 29602-9097, who may be deemed as the beneficial owner of certain of these shares.
81
As of April 10, 2006, 4,455,222.236 shares in the aggregate, or 70.86% of the outstanding shares of DWS Davis Venture Value VIP, Class B were held in the name of The Manufacturers Life Ins. Co. (USA), Boston, MA 02116-3787, who may be deemed as the beneficial owner of certain of these shares.
As of April 10, 2006, 1,046,046.939 shares in the aggregate, or 16.64% of the outstanding shares of DWS Davis Venture Value VIP, Class B were held in the name of Travelers Life & Annuity Company, Hartford, CT 06103-3432, who may be deemed as the beneficial owner of certain of these shares.
As of April 10, 2006, 747,342.104 shares in the aggregate, or 11.89% of the outstanding shares of DWS Davis Venture Value VIP, Class B were held in the name of Travelers Insurance Company, Attn: Shareholder Accounting Unit, Hartford, CT 06199-0027, who may be deemed as the beneficial owner of certain of these shares.
As of April 10, 2006, 3,407,725.545 shares in the aggregate, or 38.65% of the outstanding shares of DWS Dreman Financial Service VIP, Class A were held in the name of Allmerica Life SVSII, Worcester, MA 01653-0002, who may be deemed as the beneficial owner of certain of these shares.
As of April 10, 2006, 5,168,205.535 shares in the aggregate, or 58.62% of the outstanding shares of DWS Dreman Financial Service VIP, Class A were held in the name of Zurich Destinations Farmers SVSII, c/o Kilico, Attn: Investment Accounting LL02W, Greenville, SC 29602-9097, who may be deemed as the beneficial owner of certain of these shares.
As of April 10, 2006, 985,812.634 shares in the aggregate, or 73.26% of the outstanding shares of DWS Dreman Financial Service VIP, Class B were held in the name of The Manufacturers Life Ins. Co. (USA), Boston, MA 02116-3787, who may be deemed as the beneficial owner of certain of these shares.
As of April 10, 2006, 156,621.498 shares in the aggregate, or 11.64% of the outstanding shares of DWS Dreman Financial Service VIP, Class B were held in the name of Travelers Life & Annuity Company, Hartford, CT 06103-3432, who may be deemed as the beneficial owner of certain of these shares.
As of April 10, 2006, 198,685.665 shares in the aggregate, or 14.77% of the outstanding shares of DWS Dreman Financial Service VIP, Class B were held in the name of Travelers Insurance Company, Attn: Shareholder Accounting Unit, Hartford, CT 06199-0027, who may be deemed as the beneficial owner of certain of these shares.
As of April 10, 2006, 14,728,625.702 shares in the aggregate, or 25.37% of the outstanding shares of DWS Dreman High Return Equity VIP, Class A were held in the name of New York, NY 10154-0004, who may be deemed as the beneficial owner of certain of these shares.
As of April 10, 2006, 39,211,425.273 shares in the aggregate, or 67.54% of the outstanding shares of DWS Dreman High Return Equity VIP, Class A were held in the name of Zurich Destinations Farmers SVSII, c/o Kilico, Attn: Investment Accounting LL-2W, Greenville, SC 29602-9097, who may be deemed as the beneficial owner of certain of these shares.
As of April 10, 2006, 8,132,177.056 shares in the aggregate, or 79.98% of the outstanding shares of DWS Dreman High Return Equity VIP, Class B were held in the name of The Manufacturers Life Ins. Co. (USA), Boston, MA 02116-3787, who may be deemed as the beneficial owner of certain of these shares.
As of April 10, 2006, 852,888.781 shares in the aggregate, or 8.39% of the outstanding shares of DWS Dreman High Return Equity VIP, Class B were held in the name of Travelers Life & Annuity Company, Hartford, CT 06103-3432, who may be deemed as the beneficial owner of certain of these shares.
As of April 10, 2006, 992,896.377 shares in the aggregate, or 9.76% of the outstanding shares of DWS Dreman High Return Equity VIP, Class B were held in the name of Travelers Insurance Company, Attn: Shareholder Accounting Unit, Hartford, CT 06199-0027, who may be deemed as the beneficial owner of certain of these shares.
82
As of April 10, 2006, 6,346,057.276 shares in the aggregate, or 24.08% of the outstanding shares of DWS Dreman Small Cap Value VIP, Class A were held in the name of Allmerica Life SVSII, Worcester, MA 01653-0002, who may be deemed as the beneficial owner of certain of these shares.
As of April 10, 2006, 3,875,180.366 shares in the aggregate, or 14.71% of the outstanding shares of DWS Dreman Small Cap Value VIP, Class A were held in the name of Kemper Investors Life, Elgin, IL 60123-7836, who may be deemed as the beneficial owner of certain of these shares.
As of April 10, 2006, 14,856,715.096 shares in the aggregate, or 56.38% of the outstanding shares of DWS Dreman Small Cap Value VIP, Class A were held in the name of Zurich Destinations Farmers SVSII, c/o Kilico, Attn: Investment Accounting LL-2W, Greenville, SC 29602-9097, who may be deemed as the beneficial owner of certain of these shares.
As of April 10, 2006, 3,285,639.694 shares in the aggregate, or 74.12% of the outstanding shares of DWS Dreman Small Cap Value VIP, Class B were held in the name of The Manufacturers Life Ins. Co. (USA), Boston, MA 02116-3787, who may be deemed as the beneficial owner of certain of these shares.
As of April 10, 2006, 507,844.365 shares in the aggregate, or 11.46% of the outstanding shares of DWS Dreman Small Cap Value VIP, Class B were held in the name of Travelers Life & Annuity Company, Hartford, CT 06103-3432, who may be deemed as the beneficial owner of certain of these shares.
As of April 10, 2006, 433,761.882 shares in the aggregate, or 9.78% of the outstanding shares of DWS Dreman Small Cap Value VIP, Class B were held in the name of Travelers Insurance Company, Attn: Shareholder Accounting Unit, Hartford, CT 06199-0027, who may be deemed as the beneficial owner of certain of these shares.
As of April 10, 2006, 2,286,821.988 shares in the aggregate, or 33.10% of the outstanding shares of DWS Global Thematic VIP, Class A were held in the name of Allmerica Life SVSII, Worcester, MA 01653-0002, who may be deemed as the beneficial owner of certain of these shares.
As of April 10, 2006, 4,528,864.779 shares in the aggregate, or 65.56% of the outstanding shares of DWS Global Thematic VIP, Class A were held in the name of Zurich Destinations Farmers SVSII, c/o Kilico, Attn: Investment Accounting LL-2W, Greenville, SC 29602-9097, who may be deemed as the beneficial owner of certain of these shares.
As of April 10, 2006, 1,027,456.717 shares in the aggregate, or 66.18% of the outstanding shares of DWS Global Thematic VIP, Class B were held in the name of The Manufacturers Life Ins. Co. (USA), Boston, MA 02116-3787, who may be deemed as the beneficial owner of certain of these shares.
As of April 10, 2006, 277,946.237 shares in the aggregate, or 17.90% of the outstanding shares of DWS Global Thematic VIP, Class B were held in the name of Travelers Life & Annuity Company, Hartford, CT 06103-3432, who may be deemed as the beneficial owner of certain of these shares.
As of April 10, 2006, 243,976.901 shares in the aggregate, or 15.72% of the outstanding shares of DWS Global Thematic VIP, Class B were held in the name of Travelers Insurance Company, Attn: Shareholder Accounting Unit, Hartford, CT 06199-0027, who may be deemed as the beneficial owner of certain of these shares.
As of April 10, 2006, 7,865,959.092 shares in the aggregate, or 40.53% of the outstanding shares of DWS Government & Agency SEC VIP, Class A were held in the name of Allmerica Life SVSII, Worcester, MA 01653-0002, who may be deemed as the beneficial owner of certain of these shares.
As of April 10, 2006, 3,569,122.336 shares in the aggregate, or 18.39% of the outstanding shares of DWS Government & Agency SEC VIP, Class A were held in the name of Kemper Investors Life, Elgin, IL 60123-7836, who may be deemed as the beneficial owner of certain of these shares.
As of April 10, 2006, 6,801,523.493 shares in the aggregate, or 35.05% of the outstanding shares of DWS Government & Agency SEC VIP, Class A were held in the name of Zurich Destinations Farmers SVSII, c/o Kilico, Attn: Investment Accounting LL-2W, Greenville, SC 29602-9097, who may be deemed as the beneficial owner of certain of these shares.
83
As of April 10, 2006, 3,348,203.148 shares in the aggregate, or 87.57% of the outstanding shares of DWS Government & Agency SEC VIP, Class B were held in the name of The Manufacturers Life Ins. Co. (USA), Boston, MA 02116-3787, who may be deemed as the beneficial owner of certain of these shares.
As of April 10, 2006, 322,033.560 shares in the aggregate, or 8.42% of the outstanding shares of DWS Government & Agency SEC VIP, Class B were held in the name of Travelers Life & Annuity Company, Hartford, CT 06103-3432, who may be deemed as the beneficial owner of certain of these shares.
As of April 10, 2006, 128,907.123 shares in the aggregate, or 3.37% of the outstanding shares of DWS Government & Agency SEC VIP, Class B were held in the name of Travelers Insurance Company, Attn: Shareholder Accounting Unit, Hartford, CT 06199-0027, who may be deemed as the beneficial owner of certain of these shares.
As of April 10, 2006, 15,689,062.066 shares in the aggregate, or 36.39% of the outstanding shares of DWS High Income VIP, Class A were held in the name of Allmerica Life SVSII, Worcester, MA 01653-0002, who may be deemed as the beneficial owner of certain of these shares.
As of April 10, 2006, 10,977,667.990 shares in the aggregate, or 25.46% of the outstanding shares of DWS High Income VIP, Class A were held in the name of Kemper Investors Life, Elgin, IL 60123-7836, who may be deemed as the beneficial owner of certain of these shares.
As of April 10, 2006, 13,880,546.898 shares in the aggregate, or 32.19% of the outstanding shares of DWS High Income VIP, Class A were held in the name of Zurich Destinations Farmers SVSII, c/o Kilico, Attn: Investment Accounting LL-2W, Greenville, SC 29602-9097, who may be deemed as the beneficial owner of certain of these shares.
As of April 10, 2006, 5,505,423.374 shares in the aggregate, or 77.89% of the outstanding shares of DWS High Income VIP, Class B were held in the name of The Manufacturers Life Ins. Co. (USA), Boston, MA 02116-3787, who may be deemed as the beneficial owner of certain of these shares.
As of April 10, 2006, 783,827.765 shares in the aggregate, or 11.09% of the outstanding shares of DWS High Income VIP, Class B were held in the name of Travelers Life & Annuity Company, Hartford, CT 06103-3432, who may be deemed as the beneficial owner of certain of these shares.
As of April 10, 2006, 726,259.894 shares in the aggregate, or 10.27% of the outstanding shares of DWS High Income VIP, Class B were held in the name of Travelers Insurance Company, Attn: Shareholder Accounting Unit, Hartford, CT 06199-0027, who may be deemed as the beneficial owner of certain of these shares.
As of April 10, 2006, 4,135,304.862 shares in the aggregate, or 27.64% of the outstanding shares of DWS International Select Equity VIP, Class A were held in the name of Allmerica Life SVSII, Worcester, MA 01653-0002, who may be deemed as the beneficial owner of certain of these shares.
As of April 10, 2006, 3,639,474.966 shares in the aggregate, or 24.32% of the outstanding shares of DWS International Select Equity VIP, Class A were held in the name of Kemper Investors Life, Elgin, IL 60123-7836, who may be deemed as the beneficial owner of certain of these shares.
As of April 10, 2006, 6,796,506.785 shares in the aggregate, or 45.42% of the outstanding shares of DWS International Select Equity VIP, Class A were held in the name of Zurich Destinations Farmers SVSII, c/o Kilico, Attn: Investment Accounting LL-2W, Greenville, SC 29602-9097, who may be deemed as the beneficial owner of certain of these shares.
As of April 10, 2006, 2,744,263.464 shares in the aggregate, or 56.68% of the outstanding shares of DWS International Select Equity VIP, Class B were held in the name of The Manufacturers Life Ins. Co. (USA), Boston, MA 02116-3787, who may be deemed as the beneficial owner of certain of these shares.
As of April 10, 2006, 1,122,060.639 shares in the aggregate, or 23.18% of the outstanding shares of DWS International Select Equity VIP, Class B were held in the name of Travelers Life & Annuity Company, Hartford, CT 06103-3432, who may be deemed as the beneficial owner of certain of these shares.
84
As of April 10, 2006, 964,974.737 shares in the aggregate, or 19.93% of the outstanding shares of DWS International Select Equity VIP, Class B were held in the name of Travelers Insurance Company, Attn: Shareholder Accounting Unit, Hartford, CT 06199-0027, who may be deemed as the beneficial owner of certain of these shares.
As of April 10, 2006, 4,997,583.299 shares in the aggregate, or 27.98% of the outstanding shares of DWS Janus Growth & Income VIP, Class A were held in the name of Allmerica Life SVSII, Worcester, MA 01653-0002, who may be deemed as the beneficial owner of certain of these shares.
As of April 10, 2006, 12,672,595.865 shares in the aggregate, or 70.94% of the outstanding shares of DWS Janus Growth & Income VIP, Class A were held in the name of Zurich Destinations Farmers SVSII, c/o Kilico, Attn: Investment Accounting LL-2W, Greenville, SC 29602-9097, who may be deemed as the beneficial owner of certain of these shares.
As of April 10, 2006, 2,473,381.552 shares in the aggregate, or 83.62% of the outstanding shares of DWS Janus Growth & Income VIP, Class B were held in the name of The Manufacturers Life Ins. Co. (USA), Boston, MA 02116-3787, who may be deemed as the beneficial owner of certain of these shares.
As of April 10, 2006, 231,360.624 shares in the aggregate, or 7.82% of the outstanding shares of DWS Janus Growth & Income VIP, Class B were held in the name of Travelers Life & Annuity Company, Hartford, CT 06103-3432, who may be deemed as the beneficial owner of certain of these shares.
As of April 10, 2006, 245,135.817 shares in the aggregate, or 8.29% of the outstanding shares of DWS Janus Growth & Income VIP, Class B were held in the name of Travelers Insurance Company, Attn: Shareholder Accounting Unit, Hartford, CT, 06199-0027, who may be deemed as the beneficial owner of certain of these shares.
As of April 10, 2006, 4,193,923.618 shares in the aggregate, or 25.58% of the outstanding shares of DWS Janus Growth Opportunities VIP, Class A were held in the name of Allmerica Life SVSII, Worcester, MA 01653-0002, who may be deemed as the beneficial owner of certain of these shares.
As of April 10, 2006, 9,780,544.080 shares in the aggregate, or 59.67% of the outstanding shares of DWS Janus Growth Opportunities VIP, Class A were held in the name of Zurich Destinations Farmers SVSII, c/o Kilico, Attn: Investment Accounting LL-2W, Greenville, SC 29602-9097, who may be deemed as the beneficial owner of certain of these shares.
As of April 10, 2006, 910,723.149 shares in the aggregate, or 5.56% of the outstanding shares of DWS Janus Growth Opportunities VIP, Class A were held in the name of State Street Bank & Trust Cust. FBO SVSII Scud Growth & Income Strategic Portfolio, Attn: Marylou McPhee, Adams Bldg. 2 North JPB2N, North Quincy, MA 02171-2119, who may be deemed as the beneficial owner of certain of these shares.
As of April 10, 2006, 1,197,872.839 shares in the aggregate, or 7.31% of the outstanding shares of DWS Janus Growth Opportunities VIP, Class A were held in the name of State Street Bank & Trust Cust. FBO SVSII Scud Growth & Income Strategic Portfolio, Attn: Marylou McPhee, Adams Bldg. 2 North JPB2N, North Quincy, MA 02171-2119, who may be deemed as the beneficial owner of certain of these shares.
As of April 10, 2006, 1,161,743.253 shares in the aggregate, or 87.85% of the outstanding shares of DWS Janus Growth Opportunities VIP, Class B were held in the name of The Manufacturers Life Ins. Co. (USA), Boston, MA 02116-3787, who may be deemed as the beneficial owner of certain of these shares.
As of April 10, 2006, 105,577.681 shares in the aggregate, or 7.98% of the outstanding shares of DWS Janus Growth Opportunities VIP, Class B were held in the name of Travelers Insurance Company, Attn: Shareholder Accounting Unit, Hartford, CT 06199-0027, who may be deemed as the beneficial owner of certain of these shares.
As of April 10, 2006, 4,982,256.037 shares in the aggregate, or 29.89% of the outstanding shares of DWS Large Cap Value VIP, Class A were held in the name of Allmerica Life SVSII, Worcester, MA 01653-0002, who may be deemed as the beneficial owner of certain of these shares.
85
As of April 10, 2006, 2,413,661.840 shares in the aggregate, or 14.48% of the outstanding shares of DWS Large Cap Value VIP, Class A were held in the name of Kemper Investors Life, Elgin, IL 60123-7836, who may be deemed as the beneficial owner of certain of these shares.
As of April 10, 2006, 6,459,721.682 shares in the aggregate, or 38.75% of the outstanding shares of DWS Large Cap Value VIP, Class A were held in the name of Zurich Destinations Farmers SVSII, c/o Kilico, Attn: Investment Accounting LL-2W, Greenville, SC 29602-9097, who may be deemed as the beneficial owner of certain of these shares.
As of April 10, 2006, 981,978.299 shares in the aggregate, or 5.89% of the outstanding shares of DWS Large Cap Value VIP, Class A were held in the name of State Street Bank & Trust Cust. FBO SVSII Scud Growth & Income Strategic Portfolio, Attn: Marylou McPhee, North Quincy, MA 02171-2119, who may be deemed as the beneficial owner of certain of these shares.
As of April 10, 2006, 1,399,706.656 shares in the aggregate, or 8.40% of the outstanding shares of DWS Large Cap Value VIP, Class A were held in the name of State Street Bank & Trust Cust. FBO SVSII Scud Growth Strategic Portfolio, Attn: Marylou McPhee, North Quincy, MA 02171-2119, who may be deemed as the beneficial owner of certain of these shares.
As of April 10, 2006, 2,057,565.146 shares in the aggregate, or 81.28% of the outstanding shares of DWS Large Cap Value VIP, Class B were held in the name of The Manufacturers Life Ins. Co. (USA), Boston, MA 02166-3787, who may be deemed as the beneficial owner of certain of these shares.
As of April 10, 2006, 286,905.541 shares in the aggregate, or 11.33% of the outstanding shares of DWS Large Cap Value VIP, Class B were held in the name of Travelers Life & Annuity Company, Hartford, CT 06103-3432, who may be deemed as the beneficial owner of certain of these shares.
As of April 10, 2006, 178,033.606 shares in the aggregate, or 7.03% of the outstanding shares of DWS Large Cap Value VIP, Class B were held in the name of Travelers Insurance Company, Attn: Shareholder Accounting Unit, Hartford, CT 06199-0027, who may be deemed as the beneficial owner of certain of these shares.
As of April 10, 2006, 50,350.762 shares in the aggregate, or 100.00% of the outstanding shares of DWS Mercury Large Cap Core VIP, Class A were held in the name of Deutsche Investment Management Americas, Inc., Attn: Enrique Cuesta, New York, NY 10154-0004, who may be deemed as the beneficial owner of certain of these shares.
As of April 10, 2006, 50,355.984 shares in the aggregate, or 11.19% of the outstanding shares of DWS Mercury Large Cap Core VIP, Class B were held in the name of Deutsche Investment Management Americas, Inc., Attn: Enrique Cuesta, New York, NY 10154-0004, who may be deemed as the beneficial owner of certain of these shares.
As of April 10, 2006, 117,125.476 shares in the aggregate, or 26.03% of the outstanding shares of DWS Mercury Large Cap Core VIP, Class B were held in the name of The Manufacturers Life Ins. Co. (USA), Boston, MA 02116-3787, who may be deemed as the beneficial owner of certain of these shares.
As of April 10, 2006, 110,831.226 shares in the aggregate, or 24.63% of the outstanding shares of DWS Mercury Large Cap Core VIP, Class B were held in the name of Travelers Life & Annuity Company, Hartford, CT 06103-3432, who may be deemed as the beneficial owner of certain of these shares.
As of April 10, 2006, 171,695.701 shares in the aggregate, or 38.15% of the outstanding shares of DWS Mercury Large Cap Core VIP, Class B were held in the name of Travelers Insurance Company, Attn: Shareholder Accounting Unit, Hartford, CT 06199-0027, who may be deemed as the beneficial owner of certain of these shares.
As of April 10, 2006, 282,519.323 shares in the aggregate, or 10.80% of the outstanding shares of DWS MFS Strategic Value VIP, Class A were held in the name of SSC Investment Corp, Attn: V. Ramtakah, 345 Park Ave., Fl. 26, New York, NY 10154-0004, who may be deemed as the beneficial owner of certain of these shares.
86
As of April 10, 2006, 507,127.500 shares in the aggregate, or 19.39% of the outstanding shares of DWS MFS Strategic Value VIP, Class A were held in the name of Allmerica Life SVSII, Worcester, MA 01653-0002, who may be deemed as the beneficial owner of certain of these shares.
As of April 10, 2006, 647,227.953 shares in the aggregate, or 24.75% of the outstanding shares of DWS MFS Strategic Value VIP, Class A were held in the name of State Street Bank & Trust Cust. FBO SVSII Scud. Growth & Income Strategies Portfolio, Attn: Marylou McPhee, North Quincy, MA 02171-2119, who may be deemed as the beneficial owner of certain of these shares.
As of April 10, 2006, 1,025,244.692 shares in the aggregate, or 39.20% of the outstanding shares of DWS MFS Strategic Value VIP, Class A were held in the name of State Street Bank & Trust Cust. FBO SVSII Scudder Growth Strategies Portfolio, Attn: Marylou McPhee, North Quincy, MA 02171-2119, who may be deemed as the beneficial owner of certain of these shares.
As of April 10, 2006, 2,535.117.423 shares in the aggregate, or 87.20% of the outstanding shares of DWS MFS Strategic Value VIP, Class B were held in the name of The Manufacturers Life Ins. Co. (USA), Boston, MA 02116-3787, who may be deemed as the beneficial owner of certain of these shares.
As of April 10, 2006, 168,780.606 shares in the aggregate, or 5.81% of the outstanding shares of DWS MFS Strategic Value VIP, Class B were held in the name of Travelers Life & Annuity Company, Hartford, CT 60103, who may be deemed as the beneficial owner of certain of these shares.
As of April 10, 2006, 200,167.425 shares in the aggregate, or 6.88% of the outstanding shares of DWS MFS Strategic Value VIP, Class B were held in the name of Travelers Insurance Company, Attn: Shareholder Accounting Unit, Hartford, CT 06199-0027, who may be deemed as the beneficial owner of certain of these shares.
As of April 10, 2006, 3,266,297.029 shares in the aggregate, or 66.11% of the outstanding shares of DWS Mid Cap Growth VIP, Class A were held in the name of Zurich Destinations Farmers SVSII, c/o Kilico, Attn: Investment Accounting LL-2W, Greenville, SC 29602-9097, who may be deemed as the beneficial owner of certain of these shares.
As of April 10, 2006, 1,505,028.759 shares in the aggregate, or 30.46% of the outstanding shares of DWS Mid Cap Growth VIP, Class A were held in the name of Allmerica Life SVSII, Worcester, MA 01653-0002, who may be deemed as the beneficial owner of certain of these shares.
As of April 10, 2006, 474,300.396 shares in the aggregate, or 74.23% of the outstanding shares of DWS Mid Cap Growth VIP, Class B were held in the name of The Manufacturers Life Ins. Co. (USA), Boston, MA 02116-3787, who may be deemed as the beneficial owner of certain of these shares.
As of April 10, 2006, 86,772.004 shares in the aggregate, or 13.58% of the outstanding shares of DWS Mid Cap Growth VIP, Class B were held in the name of Travelers Insurance Company, Attn: Shareholder Accounting Unit, Hartford, CT 06199-0027, who may be deemed as the beneficial owner of certain of these shares.
As of April 10, 2006, 72,943.185 shares in the aggregate, or 11.42% of the outstanding shares of DWS Mid Cap Growth VIP, Class B were held in the name of Travelers Insurance Company, Attn: Shareholder Accounting Unit, Hartford, CT 06199-0027, who may be deemed as the beneficial owner of certain of these shares.
As of April 10, 2006, 73,665,296.090 shares in the aggregate, or 30.77% of the outstanding shares of DWS Money Market VIP, Class A were held in the name of Allmerica Life SVSII, Worcester, MA 01653-0002, who may be deemed as the beneficial owner of certain of these shares.
As of April 10, 2006, 55,923,058.670 shares in the aggregate, or 23.36% of the outstanding shares of DWS Money Market VIP, Class A were held in the name of Kemper Investors Life, Elgin, IL 60123-7836, who may be deemed as the beneficial owner of certain of these shares.
87
As of April 10, 2006, 105,407,869.810 shares in the aggregate, or 44.03% of the outstanding shares of DWS Money Market VIP, Class A were held in the name of Zurich Destinations Farmers SVSII, c/o Kilico, Attn: Investment Accounting LL-2W, Greenville, SC 29602-9097, who may be deemed as the beneficial owner of certain of these shares.
As of April 10, 2006, 40,202,174.740 shares in the aggregate, or 66.13% of the outstanding shares of DWS Money Market VIP, Class B were held in the name of The Manufacturers Life Ins. Co. (USA), Boston, MA 02116-3787, who may be deemed as the beneficial owner of certain of these shares.
As of April 10, 2006, 16,426,667.880 shares in the aggregate, or 27.02% of the outstanding shares of DWS Money Market VIP, Class B were held in the name of Travelers Life & Annuity Company, Hartford, CT 06103-3432, who may be deemed as the beneficial owner of certain of these shares.
As of April 10, 2006, 4,140,833.790 shares in the aggregate, or 6.81% of the outstanding shares of DWS Money Market VIP, Class B were held in the name of Travelers Insurance Company, Attn: Shareholder Accounting Unit, Hartford, CT 06199-0027, who may be deemed as the beneficial owner of certain of these shares.
As of April 10, 2006, 1,511,395.753 shares in the aggregate, or 19.69% of the outstanding shares of DWS Oak Strategic Equity VIP, Class A were held in the name of Allmerica Life SVSII, Worcester, MA 01653-0002, who may be deemed as the beneficial owner of certain of these shares.
As of April 10, 2006, 6,135,545.988 shares in the aggregate, or 79.93% of the outstanding shares of DWS Oak Strategic Equity VIP, Class A were held in the name of Zurich Destinations Farmers SVSII, c/o Kilico, Attn: Investment Accounting LL-2W, Greenville, SC 29602-9097, who may be deemed as the beneficial owner of certain of these shares.
As of April 10, 2006, 2,382,755.966 shares in the aggregate, or 76.97% of the outstanding shares of DWS Oak Strategic Equity VIP, Class B were held in the name of The Manufacturers Life Ins. Co. (USA), Boston, MA 02116-3787, who may be deemed as the beneficial owner of certain of these shares.
As of April 10, 2006, 370,276.449 shares in the aggregate, or 11.96% of the outstanding shares of DWS Oak Strategic Equity VIP, Class B were held in the name of Travelers Life & Annuity Company, Hartford, CT 06103-3432, who may be deemed as the beneficial owner of certain of these shares.
As of April 10, 2006, 330,833.961 shares in the aggregate, or 10.69% of the outstanding shares of DWS Oak Strategic Equity VIP, Class B were held in the name of Travelers Insurance Company, Attn: Shareholder Accounting Unit, Hartford, CT 06199-0027, who may be deemed as the beneficial owner of certain of these shares.
As of April 10, 2006, 762,644.387 shares in the aggregate, or 15.78% of the outstanding shares of DWS Salomon Aggressive Growth VIP, Class A were held in the name of Allmerica Life SVSII, Worcester, MA 02116-0002, who may be deemed as the beneficial owner of certain of these shares.
As of April 10, 2006, 3,821,221.463 shares in the aggregate, or 79.07% of the outstanding shares of DWS Salomon Aggressive Growth VIP, Class A were held in the name of Zurich Destinations Farmers SVSII, c/o Kilico, Attn: Investment Accounting LL-2W, Greenville, SC 29602-9097, who may be deemed as the beneficial owner of certain of these shares.
As of April 10, 2006, 811,699.359 shares in the aggregate, or 86.74% of the outstanding shares of DWS Salomon Aggressive Growth VIP, Class B were held in the name of The Manufacturers Life Ins. Co. (USA), Boston, MA 02116-3787, who may be deemed as the beneficial owner of certain of these shares.
As of April 10, 2006, 64,146.525 shares in the aggregate, or 6.85% of the outstanding shares of DWS Salomon Aggressive Growth VIP, Class B were held in the name of Travelers Life & Annuity Company, Hartford, CT 06103-3432, who may be deemed as the beneficial owner of certain of these shares.
As of April 10, 2006, 54,699.055 shares in the aggregate, or 5.84% of the outstanding shares of DWS Salomon Aggressive Growth VIP, Class B were held in the name of Travelers Insurance Company, Attn: Shareholder Accounting Unit, Hartford, CT 06199-0027, who may be deemed as the beneficial owner of certain of these shares.
88
As of April 10, 2006, 3,786,982.765 shares in the aggregate, or 22.10% of the outstanding shares of DWS Salomon Aggressive Growth VIP, Class B were held in the name of Allmerica Life SVSII, Worcester, MA 01653-0002, who may be deemed as the beneficial owner of certain of these shares.
As of April 10, 2006, 3,534,031.857 shares in the aggregate, or 20.63% of the outstanding shares of DWS Small Cap Growth VIP, Class A were held in the name of Kemper Investors Life, Elgin, IL 60123-7836, who may be deemed as the beneficial owner of certain of these shares.
As of April 10, 2006, 8,207,710.947 shares in the aggregate, or 47.90% of the outstanding shares of DWS Small Cap Growth VIP, Class A were held in the name of Zurich Destinations Farmers SVSII, c/o Kilico, Attn: Investment Accounting LL-2W, Greenville, SC 29602-9097, who may be deemed as the beneficial owner of certain of these shares.
As of April 10, 2006, 2,323,204.071 shares in the aggregate, or 81.71% of the outstanding shares of DWS Small Cap Growth VIP, Class B were held in the name of The Manufacturers Life Ins. Co. (USA), Boston, MA 02116-3787, who may be deemed as the beneficial owner of certain of these shares.
As of April 10, 2006, 292,916.536 shares in the aggregate, or 10.30% of the outstanding shares of DWS Small Cap Growth VIP, Class B were held in the name of Travelers Life & Annuity Company, Hartford, CT 06103-3432, who may be deemed as the beneficial owner of certain of these shares.
As of April 10, 2006, 224,057.333 shares in the aggregate, or 7.88% of the outstanding shares of DWS Small Cap Growth VIP, Class B were held in the name of Travelers Insurance Company, Attn: Shareholder Accounting Unit, Hartford, CT 06199-0027, who may be deemed as the beneficial owner of certain of these shares.
As of April 10, 2006, 2,537,778.676 shares in the aggregate, or 39.11% of the outstanding shares of DWS Strategic Income VIP, Class A were held in the name of Allmerica Life SVSII, Worcester, MA 01653-0002, who may be deemed as the beneficial owner of certain of these shares.
As of April 10, 2006, 3,449,407.307 shares in the aggregate, or 53.16% of the outstanding shares of DWS Strategic Income VIP, Class A were held in the name of Zurich Destinations Farmers SVSII, c/o Kilico, Attn: Investment Accounting LL-2W, Greenville, SC 29602-9097, who may be deemed as the beneficial owner of certain of these shares.
As of April 10, 2006, 1,481,082.694 shares in the aggregate, or 65.32% of the outstanding shares of DWS Strategic Income VIP, Class B were held in the name of The Manufacturers Life Ins. Co. (USA), Boston, MA 02116-3787, who may be deemed as the beneficial owner of certain of these shares.
As of April 10, 2006, 367,853.745 shares in the aggregate, or 16.22% of the outstanding shares of DWS Strategic Income VIP, Class B were held in the name of Travelers Life & Annuity Company, Hartford, CT 06103-3432, who may be deemed as the beneficial owner of certain of these shares.
As of April 10, 2006, 413,197.614 shares in the aggregate, or 18.22% of the outstanding shares of DWS Strategic Income VIP, Class B were held in the name of Travelers Insurance Company, Attn: Shareholder Accounting Unit, Hartford, CT 06199-0027, who may be deemed as the beneficial owner of certain of these shares.
As of April 10, 2006, 6,598,064.001 shares in the aggregate, or 32.11% of the outstanding shares of DWS Technology VIP, Class A were held in the name of Allmerica Life SVSII, Worcester, MA 01653-0002, who may be deemed as the beneficial owner of certain of these shares.
As of April 10, 2006, 13,157,645.957 shares in the aggregate, or 64.03% of the outstanding shares of DWS Technology VIP, Class A were held in the name of Zurich Destinations Farmers SVSII, c/o Kilico, Attn: Investment Accounting LL-2W, Greenville, SC 29602-9097, who may be deemed as the beneficial owner of certain of these shares.
As of April 10, 2006, 1,357,898.731 shares in the aggregate, or 76.96% of the outstanding shares of DWS Technology VIP, Class B were held in the name of The Manufactures Life Ins. Co. (USA), Boston, MA 02116-3787, who may be deemed as the beneficial owner of certain of these shares.
89
As of April 10, 2006, 217,586.284 shares in the aggregate, or 12.33% of the outstanding shares of DWS Technology VIP, Class B were held in the name of Travelers Life & Annuity Company, Hartford, CT 06103-3432, who may be deemed as the beneficial owner of certain of these shares.
As of April 10, 2006, 160,845.836 shares in the aggregate, or 9.12% of the outstanding shares of DWS Technology VIP, Class B were held in the name of Travelers Insurance Company, Attn: Shareholder Accounting Unit, Hartford, CT 06199-0027, who may be deemed as the beneficial owner of certain of these shares.
As of April 10, 2006, 254,141.381 shares in the aggregate, or 25.97% of the outstanding shares of DWS Templeton Foreign Value VIP, Class A were held in the name of Deutsche Investment Management Americas, Inc., Attn: Enrique Cuesta, New York, NY 10154-0004, who may be deemed as the beneficial owner of certain of these shares.
As of April 10, 2006, 234,573.823 shares in the aggregate, or 23.97% of the outstanding shares of DWS Templeton Foreign Value VIP, Class A were held in the name of State Street Bank & Trust Cust. FBO SVSII Scudder Growth & Income Strategic Portfolio, Attn: Marylou McPhee, North Quincy, MA 02171-2119, who may be deemed as the beneficial owner of certain of these shares.
As of April 10, 2006, 428,939.006 shares in the aggregate, or 43.84% of the outstanding shares of DWS Templeton Foreign Value VIP, Class A were held in the name of State Street Bank & Trust Cust. FBO SVSII Scud. Growth Strategic Portfolio, Attn: Marylou McPhee, North Quincy, MA 02171-2119, who may be deemed as the beneficial owner of certain of these shares.
As of April 10, 2006, 53,122.837 shares in the aggregate, or 5.43% of the outstanding shares of DWS Templeton Foreign Value VIP, Class A were held in the name of State Street Bank & Trust Cust. FBO SVSII Scud. Income & Growth Strategic Portfolio, Attn: Marylou McPhee, North Quincy, MA 02171-2119, who may be deemed as the beneficial owner of certain of these shares.
As of April 10, 2006, 253,627.608 shares in the aggregate, or 38.05% of the outstanding shares of DWS Templeton Foreign Value VIP, Class B were held in the name of Deutsche Investment Management Americas, Inc., Attn: Enrique Cuesta, New York, NY 10154-0004, who may be deemed as the beneficial owner of certain of these shares.
As of April 10, 2006, 131,469.492 shares in the aggregate, or 19.73% of the outstanding shares of DWS Templeton Foreign Value VIP, Class B were held in the name of The Manufactures Life Ins. Co. (USA), Boston, MA 02116-3787, who may be deemed as the beneficial owner of certain of these shares.
As of April 10, 2006, 93,159.113 shares in the aggregate, or 13.98% of the outstanding shares of DWS Templeton Foreign Value VIP, Class B were held in the name of Travelers Life & Annuity Company, Hartford, CT 06103-3432, who may be deemed as the beneficial owner of certain of these shares.
As of April 10, 2006, 188,252.263 shares in the aggregate, or 28.24% of the outstanding shares of DWS Templeton Foreign Value VIP, Class B were held in the name of Travelers Insurance Company, Attn: Shareholder Accounting Unit, Hartford, CT 06199-0027, who may be deemed as the beneficial owner of certain of these shares.
As of April 10, 2006, 2,280,225.650 shares in the aggregate, or 19.08% of the outstanding shares of DWS Turner Mid Cap Growth VIP, Class A were held in the name of Allmerica Life SVSII, Worcester, MA 01653-0002, who may be deemed as the beneficial owner of certain of these shares.
As of April 10, 2006, 9,621,766.811 shares in the aggregate, or 80.51% of the outstanding shares of DWS Turner Mid Cap Growth VIP, Class A were held in the name of Zurich Destinations Farmers SVSII, c/o Kilico, Attn: Investment Accounting LL-2W, Greenville, SC 29602-9097, who may be deemed as the beneficial owner of certain of these shares.
As of April 10, 2006, 2,229,779.646 shares in the aggregate, or 82.79% of the outstanding shares of DWS Turner Mid Cap Growth VIP, Class B were held in the name of The Manufactures Life Ins. Co. (USA), Boston, MA 02116-3787, who may be deemed as the beneficial owner of certain of these shares.
90
As of April 10, 2006, 252,964.345 shares in the aggregate, or 9.39% of the outstanding shares of DWS Turner Mid Cap Growth VIP, Class B were held in the name of Travelers Life & Annuity Company, Hartford, CT 06103-3432, who may be deemed as the beneficial owner of certain of these shares.
As of April 10, 2006, 206,657.129 shares in the aggregate, or 7.67% of the outstanding shares of DWS Turner Mid Cap Growth VIP, Class B were held in the name of Travelers Insurance Company, Attn: Shareholder Accounting Unit, Hartford, CT 06199-0027, who may be deemed as the beneficial owner of certain of these shares.
Agreement to Indemnify Independent Trustees for Certain Expenses
In connection with litigation or regulatory action related to possible improper market timing or other improper trading activity or possible improper marketing and sales activity in the Fund, the Fund’s investment advisor has agreed, subject to applicable law and regulation, to indemnify and hold harmless the Fund against any and all loss, damage, liability and expense, arising from market timing or marketing and sales matters alleged in any enforcement actions brought by governmental authorities involving or potentially affecting the Fund or the investment advisor (“Enforcement Actions”) or that are the basis for private actions brought by shareholders of the Fund against the Funds, its Trustees and officers, the Fund’s investment advisor and/or certain other parties (“Private Litigation”), or any proceedings or actions that may be threatened or commenced in the future by any person (including governmental authorities), arising from or similar to the matters alleged in the Enforcement Actions or Private Litigation. In recognition of its undertaking to indemnify the Fund and in light of the rebuttable presumption generally afforded to independent directors/trustees of investment companies that they have not engaged in disabling conduct, the Fund’s investment advisor has also agreed, subject to applicable law and regulation, to indemnify the Fund’s Independent Trustees against certain liabilities the Independent Trustees may incur from the matters alleged in any Enforcement Actions or Private Litigation or arising from or similar to the matters alleged in the Enforcement Actions or Private Litigation, and advance expenses that may be incurred by the Independent Trustees in connection with any Enforcement Actions or Private Litigation. The investment advisor is not, however, required to provide indemnification and advancement of expenses: (1) with respect to any proceeding or action with respect to which the Fund’s Board determines that the Independent Trustee ultimately would not be entitled to indemnification or (2) for any liability of the Independent Trustee to the Fund or their shareholders to which the Independent Trustee would otherwise be subject by reason of willful misfeasance, bad faith, gross negligence or reckless disregard of the Independent Trustee’s duties as a director or trustee of the Fund as determined in a final adjudication in such action or proceeding. The estimated amount of any expenses that may be advanced to the Independent Trustees or indemnity that may be payable under the indemnity agreements is currently unknown. These agreements by the Fund’s investment advisor will survive the termination of the investment management agreements between the investment advisor and the Fund.
FUND ORGANIZATION
The Fund was organized as a business trust under the laws of Massachusetts on January 22, 1987. On May 1, 1997, the Fund changed its name from “Kemper Investors Fund” to “Investors Fund Series.” On May 1, 1999 the Fund changed its name from “Investors Fund Series” to “Kemper Variable Series”. On May 1, 2001, the Fund changed its name from “Kemper Variable Series” to “Scudder Variable Series II” and on February 6, 2006 the Fund changed its name from “Scudder Variable Series II” to “DWS Variable Series II.” The Fund may issue an unlimited number of shares of beneficial interest all having no par value. Since the Fund offers multiple Portfolios, it is known as a “series company.” Currently, each Portfolio offered herein offers two classes of shares: Class A and Class B shares. Shares of each Portfolio have equal noncumulative voting rights except that each Portfolio’s Class B shares have separate and exclusive voting rights with respect to the Portfolios’ Rule 12b-1 Plan. Shares of each class also have equal rights with respect to dividends, assets and liquidation subject to any preferences (such as resulting from different Rule 12b-1 distribution fees), rights or privileges of any classes of shares of a Portfolio. Shares are fully paid and nonassessable when issued, and have no preemptive or conversion rights.
Information about the Portfolios’ investment performance is contained in the Fund’s 2005 Annual Report to Shareholders, which may be obtained without charge from the Fund or from Participating Insurance Companies which offer the Portfolios.
Shareholder inquiries should be made by writing the Fund at the address shown on the front cover or from Participating Insurance Companies which offer the Portfolios.
91
The Fund is generally not required to hold meetings of its shareholders. Under the Agreement and Declaration of Trust of the Fund (“Declaration of Trust”), however, shareholder meetings will be held in connection with the following matters: (a) the election or removal of trustees if a meeting is called for such purpose; (b) the adoption of any contract for which approval is required by the 1940 Act; (c) any termination or reorganization of the Fund to the extent and as provided in the Declaration of Trust; (d) any amendment of the Declaration of Trust (other than amendments changing the name of the Fund or any Portfolio, establishing a Portfolio, supplying any omission, curing any ambiguity or curing, correcting or supplementing any defective or inconsistent provision thereof); (e) as to whether a court action, preceding or claim should or should not be brought or maintained derivatively or as a class action on behalf of the Fund or the shareholders, to the same extent as the stockholders of a Massachusetts business corporation; and (f) such additional matters as may be required by law, the Declaration of Trust, the By-laws of the Fund, or any registration of the Fund with the SEC or any state, or as the trustees may consider necessary or desirable. The shareholders also would vote upon changes in fundamental investment objectives, policies or restrictions.
The Board may, at any time, terminate the Fund, a Portfolio or a class without shareholder approval.
Under current interpretations of the 1940 Act, the Fund expects that Participating Insurance Company shareholders will offer VLI and VA contract holders the opportunity to instruct them as to how Fund shares attributable to such contracts will be voted with respect to the matters described above. The separate prospectuses describing the VLI and VA contracts include additional disclosure of how contract holder voting rights are computed.
Under Massachusetts law, shareholders of a Massachusetts business trust could, under certain circumstances, be held personally liable for obligations of the Fund. The Declaration of Trust, however, contains provisions designed to protect shareholders from liability for acts or obligations of the Fund and requires that notice of such provisions be given in each agreement, obligation or instrument entered into or executed by the Fund or the trustees. Moreover, the Declaration of Trust provides for indemnification out of Fund property for all losses and expenses of any shareholders held personally liable for the obligations of the Fund and the Fund will be covered by insurance which the trustees consider adequate to cover foreseeable tort claims. Thus, the risk of a shareholder incurring financial loss on account of shareholder liability is considered by DeIM remote and not material since it is limited to circumstances in which the provisions limiting liability are inoperative and the Fund itself is unable to meet its obligations.
The Declaration of Trust further provides that the trustees will not be liable for errors of judgment or mistakes of fact or law. The Declaration of Trust does not protect a trustee against any liability to which he or she should otherwise be subject by reason of willful misfeasance, bad faith, gross negligence or reckless disregard of the duties of a trustee. The Declaration of Trust permits the Fund to purchase insurance against certain liabilities on behalf of the Trustees.
PROXY VOTING GUIDELINES
The Fund has delegated proxy voting responsibilities to the Advisor, subject to the Board’s general oversight. The Fund has delegated proxy voting to the Advisor with the direction that proxies should be voted consistent with the Fund’s best economic interests. The Advisor has adopted its own Proxy Voting Policies and Procedures (“Policies”), and Proxy Voting Guidelines (“Guidelines”) for this purpose. The Policies address, among other things, conflicts of interest that may arise between the interests of the Fund, and the interests of the Advisor and its affiliates, including the Fund’s principal underwriter. The Guidelines set forth the Advisor’s general position on various proposals, such as:
| | • | | Shareholder Rights — The Advisor generally votes against proposals that restrict shareholder rights. |
| | • | | Corporate Governance — The Advisor generally votes for confidential and cumulative voting and against supermajority voting requirements for charter and bylaw amendments. The Advisor generally votes for proposals to restrict a chief executive officer from serving on more than three outside boards of directors. The Advisor generally votes against proposals that require a company to appoint a Chairman who is an independent director. |
| | • | | Anti-Takeover Matters — The Advisor generally votes for proposals that require shareholder ratification of poison pills or that request boards to redeem poison pills, and votes against the adoption of poison pills if they are submitted for shareholder ratification. The Advisor generally votes for fair price proposals. |
92
| | • | | Compensation Matters — The Advisor generally votes for executive cash compensation proposals, unless they are unreasonably excessive. The Advisor generally votes against stock option plans that do not meet the Advisor’s criteria. |
| | • | | Routine Matters — The Advisor generally votes for the ratification of auditors, procedural matters related to the annual meeting and changes in company name, and against bundled proposals and adjournment. |
The general provisions described above do not apply to investment companies. The Advisor generally votes proxies solicited by investment companies in accordance with the recommendations of an independent third party, except for proxies solicited by or with respect to investment companies for which the Advisor or an affiliate serves as the Advisor or principal underwriter (“affiliated investment companies”). The Advisor votes affiliated investment company proxies in the same proportion as the vote of the investment company’s other shareholders (sometimes called “mirror” or “echo” voting). Master fund proxies solicited from feeder funds are voted in accordance with applicable requirements of the Investment Company Act of 1940.
Although the Guidelines set forth the Advisor’s general voting positions on various proposals, the Advisor may, consistent with the Funds’ best interests, determine under some circumstances to vote contrary to those positions.
The Guidelines on a particular issue may or may not reflect the view of individual members of the Board or of a majority of the Board. In addition, the Guidelines may reflect a voting position that differs from the actual practices of the public companies within the Deutsche Bank organization or of the investment companies for which the Advisor or an affiliate serves as investment advisor or sponsor.
The Advisor may consider the views of a portfolio company’s management in deciding how to vote a proxy or in establishing general voting positions for the Guidelines, but management’s views are not determinative.
As mentioned above, the Policies describe the way in which the Advisor resolves conflicts of interest. To resolve conflicts, the advisor, under normal circumstances, votes proxies in accordance with its Guidelines.
If the Advisor departs from the Guidelines with respect to a particular proxy or if the Guidelines do not specifically address a certain proxy proposal, a proxy voting committee established by the advisor will vote the proxy. Before voting any such proxy, however, the Advisor’s conflicts review committee will conduct an investigation to determine whether any potential conflicts of interest exist in connection with the particular proxy proposal. If the conflicts review committee determines that the Advisor has a material conflict of interest, or certain individuals on the proxy voting committee should be recused from participating in a particular proxy vote, it will inform the proxy voting committee. If notified that the Advisor has a material conflict, or fewer than three voting members are eligible to participate in the proxy vote, typically the Advisor will engage an independent third party to vote the proxy or follow the proxy voting recommendations of an independent third party.
Under certain circumstances, the Advisor may not be able to vote proxies or the Advisor may find that the expected economic costs from voting outweigh the benefits associated with voting. For example, the Advisor may not vote proxies on certain foreign securities due to local restrictions or customs. The Advisor generally does not vote proxies on securities subject to share blocking restrictions.
You may obtain information about how the Fund voted proxies related to its portfolio securities during the 12-month period ended June 30 by visiting the SEC’s Web site at www.sec.gov or by visiting our Web site at: www.dws-scudder.com (click on “proxy voting” at the bottom of the page).
93
ADDITIONAL INFORMATION
Other Information
The CUSIP number for each Portfolio is as follows:
| | |
DWS Balanced VIP - Class A | | 23338H685 |
DWS Balanced VIP - Class B | | 23338H677 |
DWS Blue Chip VIP - Class A | | 23338H305 |
DWS Blue Chip VIP - Class B | | 23338H404 |
DWS Core Fixed Income VIP - Class A | | 23338H826 |
DWS Core Fixed Income VIP - Class B | | 23338H818 |
DWS Davis Venture Value VIP - Class A | | 23338H537 |
DWS Davis Venture Value VIP - Class B | | 23338H529 |
DWS Dreman Financial Services VIP - Class A | | 23338H644 |
DWS Dreman Financial Services VIP - Class B | | 23338H636 |
DWS Dreman High Return Equity VIP - Class A | | 23338H628 |
DWS Dreman High Return Equity VIP - Class B | | 23338H610 |
DWS Dreman Small Cap Value VIP - Class A | | 23338H750 |
DWS Dreman Small Cap Value VIP - Class B | | 23338H743 |
DWS Global Thematic VIP - Class A | | 23338H701 |
DWS Global Thematic VIP - Class B | | 23338H800 |
DWS Government & Agency Securities VIP - Class A | | 23338H883 |
DWS Government & Agency Securities VIP - Class B | | 23338H875 |
DWS High Income VIP - Class A | | 23338H867 |
DWS High Income VIP - Class B | | 23338H859 |
DWS International Select Equity VIP - Class A | | 23338H842 |
DWS International Select Equity VIP - Class B | | 23338H834 |
DWS Janus Growth & Income VIP - Class A | | 23338H594 |
DWS Janus Growth & Income VIP - Class B | | 23338H586 |
DWS Janus Growth Opportunities VIP - Class A | | 23338H396 |
DWS Janus Growth Opportunities VIP - Class B | | 23338H388 |
DWS Large Cap Value VIP - Class A | | 23338H503 |
DWS Large Cap Value VIP - Class B | | 23338H602 |
DWS Legg Mason Aggressive Growth VIP - Class A | | 23338H669 |
DWS Legg Mason Aggressive Growth VIP - Class B | | 23338H651 |
DWS Mercury Large Cap Core VIP - Class A | | 23338H487 |
DWS Mercury Large Cap Core VIP - Class B | | 23338H479 |
DWS MFS Strategic Value VIP - Class A | | 23338H511 |
DWS MFS Strategic Value VIP - Class B | | 23338H495 |
DWS Mid Cap Growth VIP - Class A | | 23338H107 |
DWS Mid Cap Growth VIP - Class B | | 23338H206 |
DWS Money Market VIP - Class A | | 23338H792 |
DWS Money Market VIP - Class B | | 23338H784 |
DWS Oak Strategic Equity VIP - Class A | | 23338H552 |
DWS Oak Strategic Equity VIP - Class B | | 23338H545 |
DWS Small Cap Growth VIP - Class A | | 23338H776 |
DWS Small Cap Growth VIP - Class B | | 23338H768 |
DWS Strategic Income VIP - Class A | | 23338H735 |
DWS Strategic Income VIP - Class B | | 23338H727 |
DWS Technology VIP - Class A | | 23338H719 |
DWS Technology VIP - Class B | | 23338H693 |
DWS Templeton Foreign Value VIP - Class B | | 23338H412 |
DWS Templeton Foreign Value VIP - Class A | | 23338H420 |
DWS Small Cap Index VIP - Class A | | 23339F407 |
DWS Small Cap Index VIP - Class B | | 23339F506 |
DWS Turner Mid Cap Growth VIP - Class A | | 23338H578 |
DWS Turner Mid Cap Growth VIP - Class B | | 23338H560 |
94
The Fund has a fiscal year ending December 31.
Many of the investment changes in the Portfolios will be made at prices different from those prevailing at the time they may be reflected in a regular report to shareholders of the Fund. These transactions will reflect investment decisions made by the Advisor in light of each Portfolio’s investment objectives and policies, its other portfolio holdings and tax considerations, and should not be construed as recommendations for similar action by other investors.
The Portfolios’ prospectuses and this Statement of Additional Information omit certain information contained in the Registration Statement and its amendments which the Fund has filed with the SEC under the Securities Act of 1933 and reference is hereby made to the Registration Statement for further information with respect to the Fund and the securities offered hereby. The Registration Statement and its amendments are available for inspection by the public at the SEC in Washington, D.C.
FINANCIAL STATEMENTS
The audited financial statements, including the investment portfolios of each Portfolio, as applicable, together with the Report of Independent Registered Public Accounting Firm, Financial Highlights and notes to financial statements in the Annual Report to the Shareholders of each Portfolio dated December 31, 2005 are incorporated herein by reference and are hereby deemed to be a part of this Statement of Additional Information. A copy of the Fund’s Annual Report may be obtained without charge by contacting the Customer Service Center at the telephone number shown in the contract Prospectus.
95
APPENDIX A
BOND AND COMMERCIAL PAPER RATINGS
Set forth below are descriptions of ratings which represent opinions as to the quality of the securities. It should be emphasized, however, that ratings are relative and subjective and are not absolute standards of quality.
MOODY’S INVESTORS SERVICE, INC. — CORPORATE BOND RATINGS
Aaa: Bonds which are rated Aaa are judged to be of the highest quality. They carry the smallest degree of investment risk and are generally referred to as “gilt-edged.” Interest payments are protected by a large or by an exceptionally stable margin and principal is secure. While the various protective elements are likely to change, such changes as can be visualized are most unlikely to impair the fundamentally strong position of such issues.
Aa: Bonds which are rated Aa are judged to be of high quality by all standards. Together with the Aaa group they comprise what are generally known as high grade bonds. They are rated lower than the best bonds because margins of protection may not be as large as in Aaa securities or fluctuations of protective elements may be of greater amplitude or there may be other elements present which make the long-term risk appear somewhat larger than in Aaa securities.
A: Bonds which are rated A possess many favorable investment attributes and are to be considered as upper-medium grade obligations. Factors giving security to principal and interest are considered adequate, but elements may be present which suggest a susceptibility to impairment sometime in the future.
Baa: Bonds which are rated Baa are considered as medium grade obligations, (i.e., they are neither highly protected nor poorly secured). Interest payments and principal security appear adequate for the present, but certain protective elements may be lacking or may be characteristically unreliable over any great length of time. Such bonds lack outstanding investment characteristics and in fact have speculative characteristics as well.
Ba: Bonds which are rated Ba are judged to have speculative elements; their future cannot be considered as well assured. Often the protection of interest and principal payments may be very moderate and thereby not well safe-guarded during both good and bad times over the future. Uncertainty of position characterizes bonds in this class.
B: Bonds which are rated B are considered speculative and generally lack characteristics of the desirable investment. Assurance of interest and principal payments or of maintenance of other terms of the contract over any long period of time may be small.
Caa: Bonds which are rated Caa are of poor standing. Such issues may be in default or there may be present elements of danger with respect to principal or interest.
Ca: Bonds which are rated Ca represent obligations which are highly speculative. Such issues are often in default or have other marked shortcomings.
C: Bonds which are rated C are the lowest rated class of bonds, typically are in default and can be regarded as having extremely poor prospects of ever attaining any real investment standing.
Note: Moody’s appends numerical modifiers 1, 2 and 3 to each generic rating classification from Aa through Caa in its corporate bond rating system. The modifier 1 indicates that the issue ranks in the higher end of its generic rating category; the modifier 2 indicates a mid-range ranking; and the modifier 3 indicates that the issue ranks in the lower end of its generic rating category.
96
MOODY’S INVESTORS SERVICE, INC. — SHORT-TERM RATINGS
Moody’s short-term debt ratings are opinions of the ability of issuers to honor short-term financial obligations. Ratings may be assigned to issuers, short-term programs or to individual short-term debt instruments. Such obligations generally have an original maturity not exceeding thirteen months, unless explicitly noted. Issuers rated Prime-1 or P-1 (or supporting institutions) have a superior ability for repayment of short-term debt obligations. Prime-1 or P-1 repayment ability will often be evidenced by many of the following characteristics:
| | • | | Leading market positions in well established industries. |
| | • | | High rates of return on funds employed. |
| | • | | Conservative capitalization structure with moderate reliance on debt and ample asset protection. |
| | • | | Broad margins in earnings coverage of fixed financial charges and high internal cash generation. |
| | • | | Well established access to a range of financial markets and assured sources of alternate liquidity. |
Issuers rated Prime-2 or P-2 (or supporting institutions) have a strong ability for repayment of short-term debt obligations. This will normally be evidenced by many of the characteristics cited above but to a lesser degree. Earnings trends and coverage ratios, while sound, may be more subject to variation. Capitalization characteristics, while still appropriate, may be more affected by external conditions. Ample alternate liquidity is maintained.
STANDARD & POOR’S RATINGS SERVICES — CORPORATE BOND RATINGS
INVESTMENT GRADE
AAA: Debt rated AAA has the highest rating assigned by S&P’s to a debt obligation. Capacity to pay interest and repay principal is extremely strong.
AA: Debt rated AA has a very strong capacity to pay interest and repay principal and differs from the higher rated issues only in small degree.
A: Debt rated A has a strong capacity to pay interest and repay principal although it is somewhat more susceptible to the adverse effects of changes in circumstances and economic conditions than bonds in higher rated categories.
BBB: Debt rated BBB has an adequate capacity to pay interest and repay principal. Whereas it normally exhibits adequate protection parameters, adverse economic conditions or changing circumstances are more likely to lead to a weakened capacity to pay interest and repay principal for debt in this category than in higher rated categories.
SPECULATIVE GRADE
Debt rated BB, B, CCC, CC, and C has significant speculative characteristics with respect to capacity to pay interest and repay principal. BB indicates the least degree of speculation and C the highest. While such debt will likely have some quality and protective characteristics, these may be outweighed by large uncertainties or major exposures to adverse conditions.
BB: Debt rated BB has less near-term vulnerability to default than other speculative issues. However, it faces major ongoing uncertainties or exposure to adverse business, financial, or economic conditions which could lead to inadequate capacity to meet timely interest and principal payments.
The BB rating category is also used for debt subordinated to senior debt that is assigned an actual or implied BBB- rating.
B: Debt rated B has a greater vulnerability to default but currently has the capacity to meet interest payments and principal repayments. Adverse business, financial, or economic conditions will likely impair capacity or willingness to pay interest and repay principal.
97
The B rating category is also used for debt subordinated to senior debt that is assigned an actual or implied BB or BB- rating.
CCC: Debt rated CCC has a current vulnerability to default, and is dependent upon favorable business, financial, and economic conditions to meet timely payment of interest and repayment of principal. In the event of adverse business, financial, or economic conditions, it is not likely to have the capacity to pay interest and repay principal.
The CCC rating category is also used for debt subordinated to senior debt that is assigned an actual or implied B or B- rating.
CC: Debt rated CC has a current high vulnerability to default, and is dependent upon favorable business, financial, and economic conditions to meet timely payment of interest and repayment of principal.
The rating CC is also applied to debt subordinated to senior debt which is assigned an actual or implied CCC debt rating.
C: The rating C is typically applied to debt subordinated to senior debt which is assigned an actual or implied CCC- debt rating. The C rating may be used to cover a situation where a bankruptcy petition has been filed, but debt service payments are continued.
C1: The Rating C1 is reserved for income bonds on which no interest is being paid.
D: Debt rated D is in payment default. The D rating category is used when interest payments or principal payments are not made on the date due even if the applicable grace period has not expired, unless Standard & Poor’s believes that such payments will be made during such grace period. The D rating also will be used upon the filing of a bankruptcy petition if debt service payments are jeopardized.
Plus (+) or Minus (-): The ratings from AA to CCC may be modified by the addition of a plus or minus sign to show relative standing within the major rating categories.
R: Debt rated ‘R’ is under regulatory supervision owing to its financial condition. During the pendency of the regulatory supervision, the regulators may have the power to favor one class of obligations over others or pay some obligations and not others.
N.R.: Bonds may lack a S&P’s rating because no public rating has been requested, because there is insufficient information on which to base a rating, or because S&P’s does not rate a particular type of obligation as a matter of policy.
STANDARD & POOR’S RATINGS SERVICES — SHORT-TERM RATINGS
S&P’s commercial paper rating is a current assessment of the likelihood of timely payment of debt considered short-term in the relevant market.
A-1: This highest category indicates that the degree of safety regarding timely payment is strong. Those issues determined to possess extremely strong safety characteristics are denoted with a plus (+) sign designation.
A-2: Capacity for timely payment on issues with this designation is satisfactory. However, the relative degree of safety is not as high as for issues designated A-1.
A-3: Issues carrying this designation have adequate capacity for timely payment. However, adverse economic conditions or changing circumstances are more likely to lead to a weakened capacity of the issuer to meet its financial commitments.
FITCH INVESTORS SERVICE, INC. — BOND RATINGS
INVESTMENT GRADE
AAA: Bonds considered to be investment grade and of the highest credit quality. The obligor has an exceptionally strong ability to pay interest and repay principal, which is unlikely to be affected by reasonably foreseeable events.
98
AA: Bonds considered to be investment grade and of very high credit quality. The obligor’s ability to pay interest and repay principal is very strong, although not quite as strong as bonds rated AAA. Bonds rated in the AAA and AA categories are not significantly vulnerable to foreseeable events.
A: Bonds considered to be investment grade and of high credit quality. The obligor’s ability to pay interest and repay principal is considered to be strong, but may be more vulnerable to adverse changes in economic conditions and circumstances than bonds with higher ratings.
BBB: Bonds considered to be investment grade and of good credit quality. The obligor’s ability to pay interest and repay principal is considered to be adequate. Adverse changes in economic conditions and circumstances, however, are more likely to have adverse impact on these bonds, and therefore, impair timely payment. The likelihood that the ratings of these bonds will fall below investment grade is higher than for bonds with higher ratings.
SPECULATIVE GRADE
BB: Bonds are considered speculative. The obligor’s ability to pay interest and repay principal may be affected over time by adverse economic changes. However, business or financial alternatives may be available which could assist the obligor in satisfying its debt service requirements.
B: Bonds are considered highly speculative. While bonds in this class are currently meeting debt service requirements, the probability of continued timely payment of principal and interest reflects the obligor’s limited margin of safety and the need for reasonable business and economic activity throughout the life of the issue.
CCC: Bonds have certain identifiable characteristics which, if not remedied, may lead to default. The ability to meet obligations requires an advantageous business and economic environment.
CC: Bonds are minimally protected. Default in payment of interest and/or principal seems probable over time.
C: Bonds are in imminent default in payment of interest or principal.
DDD, DD and D: Bonds are in default of interest and/or principal payments. Such bonds are extremely speculative and should be valued on the basis of their ultimate recovery value in liquidation or reorganization of the obligor. DDD represents the highest potential for recovery on these bonds, and D represents the lowest potential for recovery.
Plus (+) or Minus (-): The ratings from AA to CC may be appended by the addition of a plus or minus sign to denote the relative status within the rating category.
NR: Indicates that Fitch Rating does not publicly rate the specific issue.
FITCH INVESTORS SERVICE, INC. — SHORT-TERM RATINGS
Fitch’s short-term ratings apply to debt obligations that are payable on demand or have original maturities of generally up to three years, including commercial paper, certificates of deposit, medium-term notes, and municipal and investment notes.
F-1+: Exceptionally Strong Credit Quality. Issues assigned this rating are regarded as having the strongest capacity for timely payment.
F-1: Very Strong Credit Quality. Issues assigned this rating reflect a capacity for timely payment only slightly less than issues rated F-1+.
F-2: Good Credit Quality. Issues assigned this rating have a satisfactory capacity for timely payment, but the margin of safety is not as great as the F-1+ and F-1 categories.
F-3: Fair Credit Quality. Issues assigned this rating have characteristics suggesting that the capacity for timely payment is adequate; however, near-term adverse changes could cause these securities to be rated below investment grade.
99
B: Speculative. Minimal capacity for timely payment of financial commitments, plus vulnerability to near-term adverse changes in financial and economic conditions.
C: High default risk. Default is a real possibility. Capacity for meeting financial commitments is solely reliant upon a sustained, favorable business and economic environment.
D: Default. Denotes actual or imminent payment default.
100
Appendix B
STATEMENT OF ADDITIONAL INFORMATION
May 1, 2006
CLASS B SHARES
DWS VARIABLE SERIES II
(formerly Scudder Variable Series II)
222 South Riverside Plaza, Chicago, Illinois 60606
1-800-778-1482
This combined Statement of Additional Information is not a prospectus. It should be read in conjunction with the applicable prospectus of DWS Variable Series II (the “Fund”) dated May 1, 2006, as amended from time to time. The prospectus may be obtained without charge from the Fund by calling the toll-free number listed above, and is also available along with other related materials on the Securities and Exchange Commission (“SEC”) Internet web site (http://www.sec.gov). The prospectus is also available from the Participating Insurance Companies.
DWS Variable Series II offers a choice of 29 portfolios, four of which are described herein (each a “Portfolio,” collectively, the “Portfolios”), to holders of certain variable annuity contracts and variable life insurance policies offered by participating insurance companies (“Participating Insurance Companies”).
The Portfolios described herein are:
DWS CONSERVATIVE ALLOCATION VIP (formerly Scudder Income and Growth Strategy Portfolio)
DWS GROWTH ALLOCATION VIP (formerly Scudder Growth Strategy Portfolio)
DWS INCOME ALLOCATION VIP (formerly Scudder Conservative Income Strategy Portfolio)
DWS MODERATE ALLOCATION VIP (formerly Scudder Growth and Income Strategy Portfolio)
TABLE OF CONTENTS
i
INVESTMENT RESTRICTIONS
Except as otherwise indicated, each Portfolio’s investment objective and policies are not fundamental and may be changed without a vote of shareholders. There can be no assurance that a Portfolio’s objective will be met.
If a percentage restriction is adhered to at the time of the investment, a later increase or decrease in percentage beyond the specified limit resulting from a change in values or net assets will not be considered a violation.
The Fund has adopted for each Portfolio certain fundamental investment restrictions that cannot be changed for a Portfolio without approval by a “majority” of the outstanding voting shares of that Portfolio. As defined in the Investment Company Act of 1940, as amended (the “1940 Act”), this means the lesser of the vote of (a) 67% of the shares of a Portfolio present at a meeting where more than 50% of the outstanding shares are present in person or by proxy or (b) more than 50% of the outstanding shares of a Portfolio.
Each Portfolio is classified as a diversified open-end management investment company. A diversified portfolio may not, with respect to 75% of total assets, invest more than 5% of total assets in the securities of a single issuer or invest in more than 10% of the outstanding voting securities of such issuer.
Each Portfolio may not, as a fundamental policy:
| (1) | borrow money, except as permitted under the 1940 Act, and as interpreted or modified by regulatory authority having jurisdiction, from time to time; |
| (2) | issue senior securities, except as permitted under the 1940 Act, and as interpreted or modified by regulatory authority having jurisdiction, from time to time; |
| (3) | concentrate its investments in a particular industry, as that term is used in the 1940 Act, and as interpreted or modified by regulatory authority having jurisdiction, from time to time; |
| (4) | engage in the business of underwriting securities issued by others, except to the extent that the Portfolio may be deemed to be an underwriter in connection with the disposition of portfolio securities; |
| (5) | purchase or sell real estate, which term does not include securities of companies which deal in real estate or mortgages or investments secured by real estate or interests therein, except that the Portfolio reserves freedom of action to hold and to sell real estate acquired as a result of the Portfolio’s ownership of securities; |
| (6) | purchase physical commodities or contracts relating to physical commodities; or |
| (7) | make loans except as permitted under the 1940 Act, and as interpreted or modified by regulatory authority having jurisdiction, from time to time. |
With regard to Restriction (3) above, for purposes of determining the percentage of each Portfolio’s total assets invested in securities of issuers having their principal business activities in a particular industry, asset-backed securities will be classified as a single industry.
The Fund has also adopted the following non-fundamental policies, which may be changed or eliminated for each Portfolio by the Fund’s Board of Trustees without a vote of the shareholders:
As a matter of non-fundamental policy, each Portfolio does not intend to:
| (1) | borrow money in an amount greater than 5% of its total assets, except (i) for temporary or emergency purposes and (ii) by engaging in reverse repurchase agreements, dollar rolls, or other investments or transactions described in the Portfolio’s registration statement which may be deemed to be borrowings; |
| (2) | purchase securities on margin or make short sales, except (i) short sales against the box, (ii) in connection with arbitrage transactions, (iii) for margin deposits in connection with futures contracts, options or other permitted investments, (iv) that transactions in futures contracts and options shall not be deemed to constitute selling securities short, and (v) that the Portfolio may obtain such short-term credits as may be deemed necessary for the clearance of securities transactions; |
| (3) | purchase options, unless the aggregate premiums paid on all such options held by a Portfolio at any time do not exceed 20% of its total assets; or sell put options, if as a result, the aggregate value of the obligations underlying such put options would exceed 50% of its total assets; |
| (4) | enter into futures contracts or purchase options thereon unless immediately after the purchase, the value of the aggregate initial margin with respect to such futures contracts entered into on behalf of a Portfolio and the premium paid for such options on futures contracts does not exceed 5% of the fair market value of a Portfolio’s total assets; provided that in the case of an option that is in-the-money at the time of purchase, the in-the money amount may be excluded in computing the 5% limit; |
| (5) | purchase warrants if as a result, such securities, taken at the lower of cost or market value, would represent more than 5% of the value of a Portfolio’s total assets (for this purpose, warrants acquired in units or attached to securities will be deemed to have no value); |
| (6) | invest more than 15% of net assets in illiquid securities; and |
| (7) | lend portfolio securities in an amount greater than one third of its total assets. |
Portfolio Holdings
In addition to the public disclosure of portfolio holdings through required Securities and Exchange Commission (“SEC”) quarterly filings, the portfolios may make their portfolio holdings information publicly available on the DWS Funds Web site as described in the portfolios’ prospectuses. The portfolios do not disseminate non-public information about portfolio holdings except in accordance with policies and procedures adopted by a portfolio.
The portfolios’ procedures permit non-public portfolio holdings information to be shared with Deutsche Asset Management, Inc. and its affiliates (collectively “DeAM”), subadvisors, if any, custodians, independent registered public accounting firms, securities lending agents, financial printers, proxy voting firms and other service providers to a portfolio who require access to this information to fulfill their duties to a portfolio, subject to the requirements described below. This non-public information may also be disclosed to certain mutual fund analysts and rating and tracking agencies, to shareholders in connection with in-kind redemptions, or to other entities if a portfolio has a legitimate business purpose in providing the information, subject to the requirements described below.
Prior to any disclosure of a portfolio’s non-public portfolio holdings information to the foregoing types of entities or persons, a person authorized by the portfolios’ Trustees must make a good faith determination in light of the facts then known that a portfolio has a legitimate business purpose for providing the information, that the disclosure is in the best interest of a portfolio, and that the recipient assents or otherwise has a duty to keep the information confidential and to not trade based on the information received while the information remains non-public. No compensation is received by a portfolio or DeAM for disclosing non-public holdings information. Periodic reports regarding these procedures will be provided to the portfolios’ Trustees.
Portfolio holdings information distributed by the trading desks of DeAM or a subadvisor for the purpose of facilitating efficient trading of such securities and receipt of relevant research is not subject to the foregoing requirements. Non-public portfolio holding information does not include portfolio characteristics (other than holdings or subsets of holdings) about each portfolio and information derived therefrom, including, but not limited to, how each portfolio’s investments are divided among various sectors, industries, countries, value and growth stocks, bonds, currencies and cash, types of bonds, bond maturities, duration, bond coupons and bond credit quality ratings so long as a portfolio’s holdings could not be derived from such information.
2
Registered investment companies that are subadvised by DeAM may be subject to different portfolio holdings disclosure policies, and neither DeAM nor the portfolios’ Trustees exercise control over such policies. In addition, separate account clients of DeAM have access to their portfolio holdings and are not subject to a portfolio’s portfolio holdings disclosure policy. The portfolio holdings of some of the funds subadvised by DeAM and some of the separate accounts managed by DeAM may substantially overlap with the portfolio holdings of a portfolio.
DeAM also manages certain unregistered commingled trusts and creates model portfolios, the portfolio holdings of which may substantially overlap with the portfolio holdings of a portfolio. To the extent that investors in these commingled trusts or recipients of model portfolio holdings information may receive portfolio holdings information of their trust or of a model portfolio on a different basis from that on which portfolio holdings information is made public, DeAM has implemented procedures reasonably designed to encourage such investors and recipients to keep such information confidential, and to prevent those investors from trading on the basis of non-public holdings information.
There is no assurance that a portfolio’s policies and procedures with respect to the disclosure of portfolio holdings information will protect a portfolio from the potential misuse of portfolio holdings information by those in possession of that information.
Master/feeder Fund Structure. The Board of Trustees have the discretion to retain the current distribution arrangement for the Portfolios while investing in a master fund in a master/feeder fund structure as described below.
A master/feeder fund structure is one in which a fund (a “feeder fund”), instead of investing directly in a portfolio of securities, invests most or all of its investment assets in a separate registered investment company (the “master fund”) with substantially the same investment objective and policies as the feeder fund. Such a structure permits the pooling of assets of two or more feeder funds, preserving separate identities or distribution channels at the feeder fund level. Based on the premise that certain of the expenses of operating an investment portfolio are relatively fixed, a larger investment portfolio may eventually achieve a lower ratio of operating expenses to average net assets. An existing investment company is able to convert to a feeder fund by selling all of its investments, which involves brokerage and other transaction costs and realization of a taxable gain or loss, or by contributing its assets to the master fund and avoiding transaction costs and, if proper procedures are followed, the realization of taxable gain or loss.
INVESTMENT POLICIES AND TECHNIQUES FOR THE PORTFOLIOS
General Investment Policies
Each Portfolio is an open-end management investment company which continuously offers and redeems shares at net asset value. Each Portfolio is a series of DWS Variable Series II and each offers one class of shares: Class B.
Descriptions in this Statement of Additional Information of a particular investment practice or technique in which a Portfolio may engage or a financial instrument which a Portfolio may purchase are meant to describe the spectrum of investments that Deutsche Investment Management Americas Inc. (“DeIM” or the “Advisor”), in its discretion, might, but is not required to, use in managing each Portfolio’s assets. The Advisor may, in its discretion, at any time employ such practice, technique or instrument for one or more Portfolios but not for all investment companies advised by it. Furthermore, it is possible that certain types of financial instruments or investment techniques described herein may not be available, permissible, economically feasible or effective for their intended purposes in all markets. Certain practices, techniques, or instruments may not be principal activities of a Portfolio but, to the extent employed, could from time to time have a material impact on the Portfolio’s performance.
It is possible that certain investment practices and techniques described below may not be permissible for a Portfolio based on its investment restrictions, as described herein, and in the Portfolio’s prospectus.
The Portfolios are professionally managed portfolios which allocate their investments among select underlying DWS portfolios (the “underlying portfolios”) of DWS Variable Series I, DWS Variable Series II and DWS Investments VIT Funds. Each Portfolio is designed for investors seeking a distinct investment style: a conservative investment approach (“DWS Income Allocation VIP”), a balance of growth and income (“DWS Moderate Allocation VIP”), growth of capital
3
(“DWS Growth Allocation VIP”) or a balance of income and growth (“DWS Conservative Allocation VIP”). The Portfolios have been created in response to increasing demand by investors for a simple and effective means of structuring a diversified investment program suited to their general needs. As has been well documented in the financial press, the proliferation of funds over the last several years has left many investors confused and in search of a simpler means to manage their investments. Many investors realize the value of diversifying their investments in a number of portfolios (e.g., a money market portfolio for liquidity and price stability, a growth portfolio for long-term appreciation, an income portfolio for current income and relative safety of principal), but need professional management to decide such questions as which portfolios to select, how much of their assets to commit to each portfolio and when to allocate their selections. The Portfolios will allow investors to rely on the Advisor to determine (within clearly explained parameters) the amount to invest in each of several underlying portfolios and the timing of such investments.
Derivatives Strategy. It is expected that, in the future, the managers may invest in instruments, commonly called “derivatives,” including, but not limited to, futures and forward currency exchange contracts, to attempt to manage risk and enhance returns. Derivatives may be used to hedge a Portfolio against price fluctuations and otherwise reduce risk. Derivatives may also be used to increase a Portfolio’s exposure to certain markets in an attempt to enhance returns. These strategies may be used separately or in combination. The managers may also use these derivatives strategies to help maintain cash reserves or otherwise liquid assets to meet shareholder redemptions, or for other needs, while maintaining exposure to the markets. The managers will determine which derivatives instruments to purchase by using a quantitative strategy that incorporates data from various international markets. The strategy seeks to shift the emphasis on a Portfolio’s holdings in response to short- and medium-term changes in global markets. The use of the strategy is subject to Board approval. Shareholders will be notified prior to the use of the strategy.
The derivative disclosure below reflects only the derivative strategies which may, upon Board approval, be employed by the Portfolios. The underlying portfolios will utilize derivatives differently as described more fully in the “Investment Policies and Techniques for the Underlying Portfolios” section.
General. It is expected that, in the future, the Portfolios may invest in various instruments that are commonly known as “derivatives.” Generally, a derivative is a financial arrangement, the value of which is based on, or “derived” from, a traditional security, asset or market index. Some “derivatives” such as mortgage-related and other asset-backed securities are in many respects like any other investment, although they may be more volatile and/or less liquid than more traditional debt securities. There are, in fact, many different types of derivatives and many different ways to use them. There are a range of risks associated with those uses. For example, the Portfolios may use futures and options as a low-cost method of gaining exposure to a particular securities market without investing directly in those securities and for traditional hedging purposes to attempt to protect the Portfolios from exposure to changing interest rates, securities prices or currency exchange rates and for cash management or other investment purposes. The use of derivatives may result in leverage, which tends to magnify the effects of an instrument’s price changes as market conditions change. Leverage involves the use of a small amount of money to control a large amount of financial assets, and can in some circumstances, lead to significant losses. The Portfolios will limit the leverage created by its use of derivatives for investment purposes by “covering” such positions as required by the SEC. The Advisor may use derivatives in circumstances where the Advisor believes they offer an economical means of gaining exposure to a particular asset class. The use of derivatives for non-hedging purposes may be considered speculative.
The Portfolios’ investment in options, futures or forward contracts, and similar strategies depend on the Advisor’s judgment as to the potential risks and rewards of different types of strategies. Options and futures can be volatile investments, and may not perform as expected. If the Advisor applies a hedge at an inappropriate time or judges price trends incorrectly, options and futures strategies may lower the Portfolios’ return. The Portfolios could also experience losses if the prices of options and futures positions were poorly correlated with other investments, or if it could not close out its positions because of an illiquid secondary market. Options and futures traded on foreign exchanges generally are not regulated by US authorities, and may offer less liquidity and less protection to the Portfolios in the event of default by the other party to the contract.
Options on Securities. A Portfolio may purchase and write (sell) put and call options on stocks. A call option gives the purchaser of the option the right to buy, and obligates the writer to sell, the underlying stock at the exercise price at any
4
time during the option period. Similarly, a put option gives the purchaser of the option the right to sell, and obligates the writer to buy, the underlying stock at the exercise price at any time during the option period.
A Portfolio may write (sell) covered call and put options to a limited extent on its portfolio securities (“covered options”) in an attempt to increase income through the premiums it receives for writing the option(s). However, in return for the premium, a Portfolio may forgo the benefits of appreciation on securities sold or may pay more than the market price on securities acquired pursuant to call and put options written by a Portfolio.
A call option written by a Portfolio is “covered” if the portfolio owns the underlying security covered by the call or has an absolute and immediate right to acquire that security without additional cash consideration (or for additional cash consideration held in a segregated account by its custodian) upon conversion or exchange of other securities held in its portfolio. A call option is also covered if the portfolio holds a call option on the same security and in the same principal amount as the written call option where the exercise price of the call option so held (a) is equal to or less than the exercise price of the written call option or (b) is greater than the exercise price of the written call option if the difference is segregated by the Portfolios in cash or liquid securities.
When a Portfolio writes a covered call option, it gives the purchaser of the option the right to buy the underlying security at the price specified in the option (the “exercise price”) by exercising the option at any time during the option period. If the option expires unexercised, the portfolio will realize income in an amount equal to the premium received for writing the option. If the option is exercised, a decision over which the portfolio has no control, the Portfolio must sell the underlying security to the option holder at the exercise price. By writing a covered call option, a Portfolio foregoes, in exchange for the premium less the commission (“net premium”), the opportunity to profit during the option period from an increase in the market value of the underlying security above the exercise price. In addition, a Portfolio may continue to hold a stock which might otherwise have been sold to protect against depreciation in the market price of the stock.
A put option written by a Portfolio is “covered” when, among other things, cash or liquid securities acceptable to the broker are placed in a segregated account to fulfill the obligations undertaken. When a Portfolio writes a covered put option, it gives the purchaser of the option the right to sell the underlying security to the Portfolio at the specified exercise price at any time during the option period. If the option expires unexercised, the Portfolio will realize income in the amount of the net premium received for writing the option. If the put option is exercised, a decision over which the Portfolio has no control, the Portfolio must purchase the underlying security from the option holder at the exercise price. By writing a covered put option, a Portfolio, in exchange for the net premium received, accepts the risk of a decline in the market value of the underlying security below the exercise price. A Portfolio will only write put options involving securities for which a determination is made at the time the option is written that the Portfolio wishes to acquire the securities at the exercise price.
A Portfolio may terminate its obligation as the writer of a call or put option by purchasing an option with the same exercise price and expiration date as the option previously written. This transaction is called a “closing purchase transaction.” A Portfolio will realize a profit or loss on a closing purchase transaction if the amount paid to purchase an option is less or more, as the case may be, than the amount received from the sale thereof. To close out a position as a purchaser of an option, a Portfolio may enter into a “closing sale transaction” which involves liquidating the portfolio’s position by selling the option previously purchased. Where a Portfolio cannot effect a closing purchase transaction, it may be forced to incur brokerage commissions or dealer spreads in selling securities it receives or it may be forced to hold underlying securities until an option is exercised or expires.
When a Portfolio writes an option, an amount equal to the net premium received by the Portfolio is included in the liability section of the Portfolio’s statement of assets and liabilities as a deferred credit. The amount of the deferred credit will be subsequently marked to market to reflect the current market value of the option written. The current market value of a traded option is the last sale price or, in the absence of a sale, the mean between the closing bid and asked price. If an option expires on its stipulated expiration date or if a Portfolio enters into a closing purchase transaction, the Portfolio will realize a gain (or loss if the cost of a closing purchase transaction exceeds the premium received when the option was sold), and the deferred credit related to such option will be eliminated. If a call option is exercised, a Portfolio will realize a gain or loss from the sale of the underlying security and the proceeds of the sale will be increased by the premium originally received. The writing of covered call options may be deemed to involve the pledge of the
5
securities against which the option is being written. Securities against which call options are written will be identified on a Portfolio’s books.
A Portfolio may also purchase call and put options on any securities in which it may invest. A Portfolio would normally purchase a call option in anticipation of an increase in the market value of such securities. The purchase of a call option would entitle the Portfolio, in exchange for the premium paid, to purchase a security at a specified price during the option period. A Portfolio would ordinarily have a gain if the value of the securities increased above the exercise price sufficiently to cover the premium and would have a loss if the value of the securities remained at or below the exercise price during the option period.
A Portfolio would normally purchase put options in anticipation of a decline in the market value of securities in its portfolio (“protective puts”) or securities of the type in which it is permitted to invest. The purchase of a put option would entitle a Portfolio, in exchange for the premium paid, to sell a security, which may or may not be held by the portfolio at a specified price during the option period. The purchase of protective puts is designed merely to offset or hedge against a decline in the market value of the portfolio. Put options also may be purchased by a portfolio for the purpose of affirmatively benefiting from a decline in the price of securities that the portfolio does not own. A Portfolio would ordinarily recognize a gain if the value of the securities decreased below the exercise price sufficiently to cover the premium and would recognize a loss if the value of the securities remained at or above the exercise price. Gains and losses on the purchase of protective put options would tend to be offset by countervailing changes in the value of underlying portfolio securities.
The hours of trading for options on securities may not conform to the hours during which the underlying securities are traded. To the extent that the option markets close before the markets for the underlying securities, significant price and rate movements can take place in the underlying securities markets that cannot be reflected in the option markets. It is impossible to predict the volume of trading that may exist in such options, and there can be no assurance that viable exchange markets will develop or continue.
A Portfolio may also engage in options transactions in the over-the-counter (“OTC”) market with broker-dealers who make markets in these options. At present, approximately ten broker-dealers, including several of the largest primary dealers in US government securities, make markets in OTC options. The ability to terminate OTC option positions is more limited than with exchange-traded option positions because the predominant market is the issuing broker rather than an exchange, and may involve the risk that broker-dealers participating in such transactions will not fulfill their obligations. To reduce this risk, a portfolio will purchase such options only from broker-dealers who are primary US government securities dealers recognized by the Federal Reserve Bank of New York and who agree to (and are expected to be capable of) entering into closing transactions, although there can be no guarantee that any such option will be liquidated at a favorable price prior to expiration. The Advisor will monitor the creditworthiness of dealers with whom the Portfolios enter into such options transactions under the general supervision of the Portfolios’ Board of Trustees. Unless the Board concludes otherwise, the Portfolios intend to treat OTC options purchased and the assets used to “cover” OTC options written as not readily marketable and therefore subject to the Portfolios’ limit on investments in illiquid securities.
Options on Securities Indices. A Portfolio may also purchase and write exchange-listed and OTC put and call options on securities indices. A securities index measures the movement of a certain group of securities by assigning relative values to the securities included in the index, fluctuating with changes in the market values of the securities included in the index. Some securities index options are based on a broad market index, such as the NYSE Composite Index, or a narrower market index such as the Standard & Poor’s 100 S&P (which consists of the 100 companies with the largest market capitalizations of the companies in the Standard & Poor’s 500 Index). Indexes may also be based on a particular industry or market segment.
Options on securities indices are similar to options on securities except that (1) the expiration cycles of securities index options are monthly, while those of securities options are currently quarterly, and (2) the delivery requirements are different. Instead of giving the right to take or make delivery of stock at a specified price, an option on a securities index gives the holder the right to receive a cash “exercise settlement amount” equal to (a) the amount, if any, by which the fixed exercise price of the option exceeds (in the case of a put) or is less than (in the case of a call) the closing value of
6
the underlying index on the date of exercise, multiplied by (b) a fixed “index multiplier.” Receipt of this cash amount will depend upon the closing level of the securities index upon which the option is based being greater than, in the case of a call, or less than, in the case of a put, the exercise price of the index and the exercise price of the option times a specified multiple. The writer of the option is obligated, in return for the premium received, to make delivery of this amount. Securities index options may be offset by entering into closing transactions as described above for securities options.
As discussed in “Options on Securities,” a Portfolio would normally purchase a call option in anticipation of an increase in the market value of the relevant index. The purchase of a call option would entitle the Portfolio, in exchange for the premium paid, to purchase the underlying securities at a specified price during the option period. A Portfolio would ordinarily have a gain if the value of the underlying securities increased above the exercise price sufficiently to cover the premium and would have a loss if the value of the securities remained at or below the exercise price during the option period.
As discussed in “Options on Securities,” a Portfolio would normally purchase put options in anticipation of a decline in the market value of the relevant index (“protective puts”). The purchase of a put option would entitle the portfolio, in exchange for the premium paid, to sell the underlying securities at a specified price during the option period. The purchase of protective puts is designed merely to offset or hedge against a decline in the market value of the index. A Portfolio would ordinarily recognize a gain if the value of the index decreased below the exercise price sufficiently to cover the premium and would recognize a loss if the value of the index remained at or above the exercise price. Gains and losses on the purchase of protective put options would tend to be offset by countervailing changes in the value of the index.
Because the value of an index option depends upon movements in the level of the index rather than the price of a particular stock, whether a Portfolio will realize a gain or loss from the purchase or writing of options on an index depends upon movements in the level of stock prices in the stock market generally or, in the case of certain indices, in an industry or market segment, rather than movements in the price of a particular stock. Accordingly, successful use by a portfolio of options on stock indices will be subject to the Advisor’s ability to predict correctly movements in the direction of the stock market generally or of a particular industry. This requires different skills and techniques than predicting changes in the price of individual stocks.
Options on securities indices entail risks in addition to the risks of options on securities. The absence of a liquid secondary market to close out options positions on securities indices is more likely to occur, although a Portfolio generally will only purchase or write such an option if the Advisor believes the option can be closed out. Use of options on securities indices also entails the risk that trading in such options may be interrupted if trading in certain securities included in the index is interrupted. A Portfolio will not purchase such options unless the Advisor believes the market is sufficiently developed such that the risk of trading in such options is no greater than the risk of trading in options on securities.
Price movements in a Portfolio’s investment portfolio may not correlate precisely with movements in the level of an index and, therefore, the use of options on indices cannot serve as a complete hedge. Because options on securities indices require settlement in cash, the Advisor may be forced to liquidate portfolio securities to meet settlement obligations. A Portfolio’s activities in index options may also be restricted by the requirements of the Code for qualification as a regulated investment company.
In addition, the hours of trading for options on the securities indices may not conform to the hours during which the underlying securities are traded. To the extent that the option markets close before the markets for the underlying securities, significant price and rate movements can take place in the underlying securities markets that cannot be reflected in the option markets. It is impossible to predict the volume of trading that may exist in such options, and there can be no assurance that viable exchange markets will develop or continue.
Hedging Strategies. A Portfolio may use certain strategies designed to adjust the overall risk of its investment portfolio. These “hedging” strategies involve derivative contracts, including (but not limited to) US Treasury and Eurodollar futures contracts and exchange-traded put and call options on such futures contracts. New financial products and risk
7
management techniques continue to be developed and may be used if consistent with a portfolio’s investment objective and policies. Among other purposes, these hedging strategies may be used to effectively maintain desired portfolio duration or to protect against market risk should a portfolio change its investments among different types of fixed income, equity or other securities. In this respect, these hedging strategies are designed for different purposes than the investments in wrapper agreements (contracts with financial institutions such as banks and insurance companies).
A Portfolio might not use any hedging strategies, and there can be no assurance that any strategy used will succeed. If the Advisor is incorrect in its judgment on market values, interest rates or other economic factors in using a hedging strategy, a Portfolio may have lower net income and a net loss on the investment. Each of these strategies involves certain risks, which include:
| | • | | the fact that the skills needed to use hedging instruments are different from those needed to select securities for a Portfolio; |
| | • | | the possibility of imperfect correlation, or even no correlation, between the price movements of hedging instruments and price movements of the securities or currencies being hedged; |
| | • | | possible constraints placed on a Portfolio’s ability to purchase or sell portfolio investments at advantageous times due to the need for a Portfolio to maintain “cover” or to segregate securities; and |
| | • | | the possibility that a Portfolio will be unable to close out or liquidate its hedged position. |
A hedge is designed to offset a loss in a Portfolio’s position with a gain in the hedged position; at the same time, however, a properly correlated hedge will result in a gain in the portfolio position being offset by a loss in the hedged position. As a result, the use of options, futures and currency exchange transactions for hedging purposes could limit any potential gain from an increase in the value of the position hedged. With respect to futures contracts, since the value of portfolio securities will far exceed the value of the futures contracts sold by a Portfolio, an increase in the value of the futures contracts could only mitigate, but not totally offset, the decline in the value of a Portfolio’s assets.
To the extent that a Portfolio engages in the strategies described above, that Portfolio may experience losses greater than if these strategies had not been utilized. In addition to the risks described above, these instruments may be illiquid and/or subject to trading limits, and a portfolio may be unable to close out a position without incurring substantial losses, if at all. A portfolio is also subject to the risk of default by a counterparty to an off-exchange transaction. See “Illiquid Securities.”
Futures Contracts and Options on Futures Contracts. A Portfolio may enter into futures contracts on equity securities, fixed income securities, securities indices, foreign currencies and interest rates, and purchase and write (sell) options thereon which are traded on exchanges designated by the Commodity Futures Trading Commission (the “CFTC”) or, if consistent with CFTC regulations, on foreign exchanges. These futures contracts are standardized contracts for the future delivery of, among other things, a commodity, a non-US currency, an interest rate sensitive security or, in the case of index futures contracts or certain other futures contracts, a cash settlement with reference to a specified multiplier times the change in the index. An option on a futures contract gives the purchaser the right, in return for the premium paid, to assume a position in a futures contract.
A Portfolio may enter into futures contracts and options on futures contracts on equity securities, fixed income securities, securities indices and currencies both to manage its exposure to changing interest rates, security prices and currency exchange rates and as an efficient means of managing allocations between asset classes. Aggregate initial margin and premiums required to establish positions other than those considered by the CFTC to be “bona fide hedging” will not exceed 5% of the portfolios’ net asset value.
The successful use of futures contracts and options thereon draws upon the Advisor’s skill and experience with respect to such instruments and are subject to special risk considerations. A liquid secondary market for any futures or options contract may not be available when a futures or options position is sought to be closed. In addition, there may be an imperfect correlation between movements in the securities or currency in a Portfolio. Successful use of futures or options
8
contracts is further dependent on the Advisor’s ability to predict correctly movements in the securities or foreign currency markets and no assurance can be given that its judgment will be correct.
Futures Contracts. Futures contracts are contracts to purchase or sell a fixed amount of an underlying instrument, commodity or index at a fixed time and place in the future. US futures contracts have been designed by exchanges which have been designated “contracts markets” by the CFTC, and must be executed through a futures commission merchant, or brokerage firm, which is a member of the relevant contract market. Futures contracts trade on a number of exchange markets, and, through their clearing corporations, the exchanges guarantee performance of the contracts as between the clearing members of the exchange. A portfolio may enter into contracts for the purchase or sale for future delivery of equity securities, fixed-income securities, foreign currencies, or financial indices including any index of US government securities, foreign government securities or corporate debt securities. A portfolio may enter into futures contracts which are based on debt securities that are backed by the full faith and credit of the US government, such as long-term US Treasury Bonds, Treasury Notes and US Treasury Bills. A portfolio may also enter into futures contracts which are based on bonds issued by governments other than the US government. Futures contracts on foreign currencies may be used to hedge against securities that are denominated in foreign currencies.
At the same time a futures contract is entered into, a Portfolio must allocate cash or liquid securities as a deposit payment (“initial margin”). Daily thereafter, the futures contract is valued and the payment of “variation margin” may be required, since each day a Portfolio would provide or receive cash that reflects any decline or increase in the contract’s value.
At the time of delivery of securities pursuant to such a contract, adjustments are made to recognize differences in value arising from the delivery of securities with a different interest rate from that specified in the contract. In some, but not many cases, securities called for by a futures contract may not have been issued when the contract was written.
Although futures contracts (other than those that settle in cash, such as index futures) by their terms call for the actual delivery or acquisition of the instrument underlying the contract, in most cases the contractual obligation is fulfilled by offset before the date of the contract without having to make or take delivery of the instrument underlying the contract. The offsetting of a contractual obligation is accomplished by entering into an opposite position in an identical futures contract on the commodities exchange on which the futures contract was entered into (or a linked exchange) calling for delivery in the same month. Such a transaction, which is effected through a member of an exchange, cancels the obligation to make or take delivery of the instrument underlying the contract. Since all transactions in the futures market are made, offset or fulfilled through a clearinghouse associated with the exchange on which the contracts are traded, the portfolios will incur brokerage fees when it enters into futures contracts.
The purpose of the acquisition or sale of a futures contract, in cases where a Portfolio holds or intends to acquire equity securities or fixed-income securities, is to attempt to protect a Portfolio from fluctuations in interest or foreign exchange rates without actually buying or selling fixed-income securities or foreign currencies. For example, if interest rates were expected to increase (which thus would cause the prices of debt securities to decline), the portfolios might enter into futures contracts for the sale of debt securities. Such a sale would have much the same effect as selling an equivalent value of the debt securities owned by a Portfolio. If interest rates did increase, the value of the debt security in the Portfolio would decline, but the value of the futures contracts to the portfolio would increase at approximately the same rate, thereby keeping the net asset value of the Portfolio from declining as much as it otherwise would have. The Portfolios could accomplish similar results by selling debt securities and investing in bonds with short maturities when interest rates are expected to increase. However, since the futures market is more liquid than the cash market, the use of futures contracts as an investment technique allows the portfolios to maintain a defensive position without having to sell its portfolio securities.
Similarly, when it is expected that interest rates may decline (thus increasing the value of debt securities), futures contracts may be purchased to attempt to hedge against anticipated purchases of debt securities at higher prices. Since the fluctuations in the value of futures contracts should be similar to those of debt securities, the portfolios could take advantage of the anticipated rise in the value of debt securities without actually buying them until the market had stabilized. At that time, the futures contracts could be liquidated and a Portfolio could then buy debt securities on the cash market. The segregated assets maintained to cover a Portfolio’s obligations with respect to such futures contracts will consist of cash or liquid securities acceptable to the broker from its portfolio in an amount equal to the difference
9
between the fluctuating market value of such futures contracts and the aggregate value of the initial and variation margin payments made by a Portfolio with respect to such futures contracts.
The ordinary spreads between prices in the cash and futures market, due to differences in the nature of those markets, are subject to distortions. First, all participants in the futures market are subject to initial deposit and variation margin requirements. Rather than meeting additional variation margin requirements, investors may close futures contracts through offsetting transactions which could distort the normal relationship between the cash and futures markets. Second, the liquidity of the futures market depends on most participants entering into offsetting transactions rather than making or taking delivery. To the extent that many participants decide to make or take delivery, liquidity in the futures market could be reduced, thus producing distortion. Third, from the point of view of speculators, the margin deposit requirements in the futures market are less onerous than margin requirements in the securities market. Therefore, increased participation by speculators in the futures market may cause temporary price distortions. Due to the possibility of distortion, a correct forecast of securities price, general interest rate or currency exchange rate trends by the Advisor may still not result in a successful transaction.
In addition, futures contracts entail significant risks. Although the Advisor believes that use of such contracts will benefit the Portfolios, if the Advisor’s investment judgment about the general direction of interest rates or an index is incorrect, the Portfolios’ overall performance would be poorer than if it had not entered into any such contract. For example, if a Portfolio has hedged against the possibility of an increase in interest rates or a decrease in an index which would adversely affect the value of securities held in its portfolio and interest rates decrease or securities prices increase instead, a Portfolio will lose part or all of the benefit of the increased value of its securities which it has hedged because it will have offsetting losses in its futures positions. In addition, in such situations, if a Portfolio has insufficient cash, it may have to sell securities from its portfolio to meet daily variation margin requirements. Such sales of securities may be, but will not necessarily be, at increased prices which reflect the rising market. A Portfolio may have to sell securities at a time when it may be disadvantageous to do so.
Futures Contracts on Securities Indices. A Portfolio may also enter into futures contracts providing for the making and acceptance of a cash settlement based upon changes in the value of an index of US or non-US securities. This investment technique may be used as a low-cost method of gaining exposure to a particular securities market without investing directly in those securities or to hedge against anticipated future change in general market prices which otherwise might either adversely affect the value of securities held by the Portfolios or adversely affect the prices of securities which are intended to be purchased at a later date for the Portfolios or as an efficient means of managing allocation between asset classes. A futures contract may also be entered into to close out or offset an existing futures position.
When used for hedging purposes, each futures contract on a securities index transaction involves the establishment of a position which, the Advisor believes, will move in a direction opposite to that of the investment being hedged. If these hedging transactions are successful, the futures positions taken for a Portfolio will rise in value by an amount which approximately offsets the decline in value of the portion of a Portfolio’s investments that are being hedged. Should general market prices move in an unexpected manner, the full anticipated benefits of futures contracts may not be achieved or a loss may be realized.
Options on Futures Contracts (including Futures Contracts on Securities Indices). A Portfolio may purchase and write (sell) options on futures contracts for hedging purposes. For example, as with the purchase of futures contracts, when a Portfolio is not fully invested, it may purchase a call option on an interest rate sensitive futures contract to hedge against a potential price increase on debt securities due to declining interest rates.
The purchase of a call option on a futures contract is similar in some respects to the purchase of a call option on an index or individual security. Depending on the pricing of the option compared to either the price of the futures contract upon which it is based or the price of the underlying debt securities, it may or may not be less risky than ownership of the futures contract or underlying debt securities.
The writing of a call option on a futures contract may constitute a partial hedge against declining prices of the underlying portfolio securities which are the same as or correlate with the security or foreign currency that is deliverable upon
10
exercise of the futures contract. If the futures price at expiration of the option is below the price specified in the premium received for writing the option (“exercise price”), a portfolio will retain the full amount of the net premium (the premium received for writing the option less any commission), which provides a partial hedge against any decline that may have occurred in a Portfolio’s holdings.
The writing of a put option on an index futures contract may constitute a partial hedge against increasing prices of the underlying securities or foreign currency that are deliverable upon exercise of the futures contract. If the futures price at expiration of the option is higher than the exercise price, a portfolio will retain the full amount of the option net premium, which provides a partial hedge against any increase in the price of securities that a portfolio intends to purchase.
If a put or call option a Portfolio has written is exercised, the Portfolio will incur a loss that will be reduced by the amount of the net premium it receives. Depending on the degree of correlation between changes in the value of its portfolio securities and changes in the value of its futures positions, a Portfolio’s losses from existing options on futures may to some extent be reduced or increased by changes in the value of portfolio securities.
The purchase of a call or put option on a futures contract with respect to an index is similar in some respects to the purchase of a call or protective put option on an index. For example, a Portfolio may purchase a put option on an index futures contract to hedge against the risk of lowering securities values.
The amount of risk the portfolios assume when they purchases an option on a futures contract with respect to an index is the premium paid for the option plus related transaction costs. In addition to the correlation risks discussed above, the purchase of such an option also entails the risk that changes in the value of the underlying futures contract will not be fully reflected in the value of the option purchased.
Global Asset Allocation Strategy (“GAA Strategy”). In connection with the GAA Strategy and in addition to the securities described above, a Portfolio may invest in indexed securities, futures contracts on securities indices, securities of foreign issuers (e.g., ADRs, GDRs and EDRs), options on stocks, options on futures contracts, foreign currency exchange transactions and options on foreign currencies. These are discussed below, to the extent not already described above.
Indexed Securities. The indexed securities in which a Portfolio may invest include debt securities whose value at maturity is determined by reference to the relative prices of various currencies or to the price of a stock index. The value of such securities depends on the price of foreign currencies, securities indices or other financial values or statistics. These securities may be positively or negatively indexed; that is, their value may increase or decrease if the underlying instrument appreciates.
Currency Exchange Contracts. Because a Portfolio may buy and sell securities denominated in currencies other than the US dollar and receives interest, dividends and sale proceeds in currencies other than the US dollar, the Portfolios from time to time may enter into currency exchange transactions to convert to and from different foreign currencies and to convert foreign currencies to and from the US dollar. A Portfolio either enters into these transactions on a spot (i.e., cash) basis at the spot rate prevailing in the foreign currency exchange market or uses forward contracts to purchase or sell foreign currencies.
Forward Currency Exchange Contracts. A forward currency exchange contract is an obligation by a Portfolio to purchase or sell a specific currency at a future date, which may be any fixed number of days from the date of the contract. Forward currency exchange contracts establish an exchange rate at a future date. These contracts are transferable in the interbank market conducted directly between currency traders (usually large commercial banks and brokerages) and their customers. A forward currency exchange contract may not have a deposit requirement and may be traded at a net price without commission. A Portfolio maintains with its custodian a segregated account of cash or liquid securities in an amount at least equal to its obligations under each forward currency exchange contract. Neither spot transactions nor forward currency exchange contracts eliminate fluctuations in the prices of a Portfolio’s securities or in foreign exchange rates, or prevent loss if the prices of these securities should decline.
11
A Portfolio may enter into foreign currency hedging transactions in an attempt to protect against changes in currency exchange rates between the trade and settlement dates of specific securities transactions or changes in currency exchange rates that would adversely affect the portfolios’ position or an anticipated investment position. Since consideration of the prospect for currency parities will be incorporated into the Advisor’s long-term investment decisions, a portfolio will not routinely enter into currency hedging transactions with respect to security transactions; however, the Advisor believes that it is important to have the flexibility to enter into currency hedging transactions when it determines that the transactions would be in a portfolio’s best interest. Although these transactions tend to minimize the risk of loss due to a decline in the value of the hedged currency, at the same time they tend to limit any potential gain that might be realized should the value of the hedged currency increase. The precise matching of the forward contract amounts and the value of the securities involved will not generally be possible because the future value of such securities in foreign currencies will change as a consequence of market movements in the value of such securities between the date the forward contract is entered into and the date it matures. The projection of currency market movements is extremely difficult, and the successful execution of a hedging strategy is highly uncertain.
While these contracts are not presently regulated by the CFTC, the CFTC may in the future assert authority to regulate forward contracts. In such event a portfolio’s ability to utilize forward contracts may be restricted. Forward contracts may reduce the potential gain from a positive change in the relationship between the US dollar and foreign currencies. Unanticipated changes in currency prices may result in poorer overall performance for a portfolio than if it had not entered into such contracts. The use of currency forward contracts may not eliminate fluctuations in the underlying US dollar equivalent value of the prices of or rates of return on a portfolio’s foreign currency denominated portfolio securities and the use of such techniques will subject a portfolio to certain risks.
Securities of Foreign Issuers. A Portfolio’s investments in the securities of foreign issuers may be made directly or in the form of American Depositary Receipts (“ADRs”), Global Depositary Receipts (“GDRs”, also referred to as International Depositary Receipts, “IDRs”), European Depositary Receipts (“EDRs”) or other similar securities representing securities of foreign issuers. These securities may not necessarily be denominated in the same currency as the securities they represent, and while designed for use as alternatives to the purchase of the underlying securities in their national markets and currencies, are subject to the same risks as the foreign securities to which they relate.
ADRs are receipts typically issued by a US bank or trust company which evidence ownership of underlying securities issued by a foreign corporation. EDRs, which are sometimes referred to as Continental Depository Receipts (“CDRs”), are receipts issued in Europe, and GDRs or IDRs are issued outside the United States. EDRs (CDRs) and GDRs (IDRs) are typically issued by non-US banks and trust companies and evidence ownership of either foreign or domestic securities. Generally, ADRs in registered form are designed for use in US securities markets, and EDRs (CDRs) and GDRs (IDRs) in bearer form are designed for use in European and non-US securities markets, respectively. For purposes of a portfolio’s investment policies, depository receipts generally are deemed to have the same classification as the underlying securities they represent. Thus, a depository receipt representing ownership of common stock will be treated as common stock.
ADRs are publicly traded on exchanges or over-the-counter in the United States and are issued through “sponsored” or “unsponsored” arrangements. In a sponsored ADR arrangement, the foreign issuer assumes the obligation to pay some or all of the depository’s transaction fees, whereas under an unsponsored arrangement, the foreign issuer assumes no obligations and the depository’s transaction fees are paid directly by the ADR holders. In addition, less information is available in the United States about an unsponsored ADR than about a sponsored ADR.
The Underlying Portfolios
The Portfolios will always invest in the share class of the underlying portfolio with the lowest fees and expenses. Each Portfolio will purchase or sell securities to: (a) accommodate purchases and sales of a Portfolio’s shares, (b) change the percentages of the Portfolio’s assets invested in each of the underlying portfolios in response to changing market conditions, and © maintain or modify the allocation of a Portfolio’s assets in accordance with the Portfolio’s target investment allocations.
12
The following is a list of the underlying portfolios in which the Portfolios may invest:
DWS Variable Series I Portfolios:
DWS Bond VIP
DWS Capital Growth VIP
DWS Global Opportunities VIP
DWS Growth & Income VIP
DWS Health Care VIP
DWS International VIP
DWS Variable Series II Portfolios:
DWS Balanced VIP
DWS Blue Chip VIP
DWS Core Fixed Income VIP
DWS Global Thematic VIP
DWS Government & Agency Securities VIP
DWS High Income VIP
DWS International Select Equity VIP
DWS Large Cap Value VIP
DWS Mid Cap Growth VIP
DWS Money Market VIP
DWS Small Cap Growth VIP
DWS Strategic Income VIP
DWS Technology VIP
DWS Mercury Large Cap Core VIP
DWS Templeton Foreign Value VIP
DWS Davis Venture Value VIP
DWS Dreman Financial Services VIP
DWS Dreman High Return Equity VIP
DWS Dreman Small Cap Value VIP
DWS Legg Mason Aggressive Growth VIP
DWS Janus Growth & Income VIP
DWS Janus Growth Opportunities VIP
DWS MFS Strategic Value VIP
DWS Oak Strategic Equity VIP
DWS Turner Mid Cap Growth VIP
DWS Investments VIT Funds:
DWS RREEF Real Estate Securities VIP
Cash Management QP Trust
The following is a brief discussion of the investment goals and policies for each underlying portfolio:
DWS Variable Series I: DWS Bond VIP. The portfolio seeks to maximize total return consistent with preservation of capital and prudent investment management, by investing for both current income and capital appreciation.) Under normal circumstances, the portfolio invests at least 80% of net assets, plus the amount of any borrowings for investment purposes, in bonds of any maturity.
DWS Variable Series I: DWS Capital Growth VIP. The portfolio seeks to maximize long-term capital growth through a broad and flexible investment program. The portfolio invests at least 65% of total assets in common stocks of US companies. Although the portfolio can invest in companies of any size, it generally focuses on established companies that are similar in size to the companies in the S&P 500 Index or the Russell 1000 Growth Index.
DWS Variable Series I: DWS Global Opportunities VIP. The portfolio seeks above-average capital appreciation over the long term. The portfolio invests at least 65% of total assets in common stocks and other equities of small companies throughout the world (companies with market values similar to the smallest 20% of the Citigroup Broad Market Index).
DWS Variable Series I: DWS Growth & Income VIP. The portfolio seeks long-term growth of capital, current income and growth of income. The portfolio invests at least 65% of total assets in equities, mainly common stocks. Although the portfolio can invest in companies of any size and from any country, it invests primarily in large US companies.
DWS Variable Series I: DWS Health Care VIP. Under normal circumstances, the portfolio seeks long-term growth of capital by investing at least 80% of total assets, plus the amount of any borrowings for investment purposes, in common stocks of companies in the health care sector.
DWS Variable Series I: DWS International VIP. The portfolio seeks long-term growth of capital primarily through diversified holdings of marketable foreign equity investments. The portfolio invests primarily in common stocks of
13
established companies listed on foreign exchanges, which the portfolio management team believes have favorable characteristics. Deutsche Investment Management Americas Inc. is the investment advisor for the portfolio.
DWS Variable Series II: DWS Balanced VIP. The portfolio seeks high total return, a combination of income and capital appreciation. The portfolio follows a flexible investment program, investing in a mix of growth and value stocks, and bonds. The portfolio can buy many types of securities, among them common stocks, convertible securities, corporate bonds, US government bonds, and mortgage- and asset-backed securities.
DWS Variable Series II: DWS Blue Chip VIP. The portfolio seeks growth of capital and income. Under normal circumstances, the portfolio invests at least 80% of net assets, plus the amount of any borrowings for investment purposes, in common stocks of large US companies that are similar in size to the companies in the S&P 500 Index and that the portfolio managers believe are “blue chip” companies.
DWS Variable Series II: DWS Core Fixed Income VIP. The portfolio seeks high current income. The portfolio invests for current income, not capital appreciation. Under normal circumstances, the portfolio invests at least 80% of its assets, determined at the time of purchase, in fixed income securities.
DWS Variable Series II: DWS Global Thematic VIP. The portfolio seeks long-term capital growth. Under normal circumstances, the portfolio invests at least 80% of net assets, plus the amount of any borrowings for investment purposes, in common stocks and other equities of companies throughout the world that the portfolio managers believe are “blue chip” companies.
DWS Variable Series II: DWS Government & Agency Securities VIP. The portfolio seeks high current income consistent with preservation of capital. The portfolio normally invests all of its assets in securities issued or guaranteed by the US government, its agencies or instrumentalities, except the portfolio may invest up to 10% of its net assets in cash equivalents, such as money market funds, and short-term bond funds. These securities may not be issued or guaranteed by the US government, its agencies or instrumentalities.
DWS Variable Series II: DWS High Income VIP. The portfolio seeks to provide a high level of current income. Under normal circumstances, the portfolio generally invests at least 65% of net assets, plus the amount of any borrowings for investment purposes, in junk bonds, which are those rated below the fourth highest credit rating category (i.e., Grade BB/Ba and below). Generally, most are from US issuers, but up to 25% of total assets could be invested in bonds denominated in US dollars or foreign currencies from foreign issuers.
DWS Variable Series II: DWS International Select Equity VIP. The portfolio seeks capital appreciation. Under normal circumstances, the portfolio invests at least 80% of its net assets, plus the amount of any borrowing for investment purposes, in equity securities and other securities with equity characteristics.
DWS Variable Series II: DWS Large Cap Value VIP. The portfolio seeks to achieve a high rate of total return. Under normal circumstances, the portfolio invests at least 80% of net assets, plus the amount of any borrowings for investment purposes, in common stocks and other equity securities of large US companies that are similar in size to the companies in the Russell 1000 Value Index and that the portfolio managers believe are undervalued.
DWS Variable Series II: DWS Legg Mason Aggressive Growth VIP. The portfolio seeks to achieve its objective by investing primarily in the common stocks of companies that the subadvisor believes are experiencing, or will experience, growth in earnings that exceeds the average rate of earnings growth of the companies in the S&P 500 Index.
DWS Variable Series II: DWS Mercury Large Cap Core VIP. The portfolio’s investment objective is long-term capital growth. The portfolio seeks to achieve its objective by investing primarily in a diversified portfolio of equity securities of large-cap companies located in the US.
DWS Variable Series II: DWS Mid Cap Growth VIP. The portfolio seeks long-term capital growth. Under normal circumstances, the portfolio invests at least 80% of its net assets, plus the amount of any borrowings for investment purposes, determined at the time of purchase, in companies with market capitalizations within the market capitalization
14
range of the Russell Mid Cap Growth Index or securities with equity characteristics that provide exposure to those companies.
DWS Variable Series II: DWS Money Market VIP. The portfolio seeks maximum current income to the extent consistent with stability of principal. The portfolio invests exclusively in high-quality short-term securities, as well as certain repurchase agreements that are backed by high quality securities.
DWS Variable Series II: DWS Small Cap Growth VIP. The portfolio seeks maximum appreciation of investors’ capital. Under normal circumstances, the portfolio invests at least 80% of net assets, plus the amount of any borrowings for investment purposes, in small capitalization stocks similar in size to those comprising the Russell 2000 Growth Index.
DWS Variable Series II: DWS Strategic Income VIP. The portfolio seeks high current return. The portfolio invests mainly in bonds issued by US and foreign corporations and governments. The portfolio may invest up to 50% of total assets in foreign bonds. The portfolio may also invest in emerging markets securities and dividend-paying common stock.
DWS Variable Series II: DWS Technology VIP. The portfolio seeks growth of capital. Under normal circumstances, the portfolio invests at least 80% of net assets, plus the amount of any borrowings for investment purposes, in common stocks of companies in the technology sector.
DWS Variable Series II: DWS Templeton Foreign Value VIP. The portfolio seeks long-term capital growth. Under normal market conditions, the portfolio invests mainly in the equity securities of companies located outside the US, including emerging markets. The portfolio will invest, under normal circumstances, at least 80% of its net assets in “foreign securities,” as defined below, which may include emerging markets. For purposes of the portfolio’s investments, “foreign securities” means those securities issued by companies:
| | • | | whose principal securities trading markets are outside the US; or |
| | • | | that derive a significant share of their total revenue from either goods or services produced or sales made in markets outside the US; or |
| | • | | that have a significant portion of their assets outside the US; or |
| | • | | that are linked to non-US dollar currencies; or |
| | • | | that are organized under the laws of, or with principal offices in, another country. |
DWS Variable Series II: DWS Davis Venture Value VIP. The portfolio seeks growth of capital. The portfolio invests primarily in common stock of US companies with market capitalizations of at least $5 billion.
DWS Variable Series II: DWS Dreman Financial Services VIP. The portfolio seeks to provide long-term capital appreciation. Under normal circumstances, the portfolio invests at least 80% of net assets, plus the amount of any borrowings for investment purposes, in equity securities (mainly common stocks) of financial services companies.
DWS Variable Series II: DWS Dreman High Return Equity VIP. The portfolio seeks to achieve a high rate of total return. Under normal circumstances, the portfolio invests at least 80% of net assets, plus the amount of any borrowings for investment purposes, in common stocks and other equity securities. The portfolio focuses on stocks of large US companies that are similar in size to the companies in the S&P 500 Index and that the portfolio managers believe are undervalued.
DWS Variable Series II: DWS Dreman Small Cap Value VIP. The portfolio seeks long-term capital appreciation. Under normal circumstances, the portfolio invests at least 80% of net assets, plus the amount of any borrowings for investment purposes, in undervalued common stocks of small US companies, which the portfolio defines as companies that are similar in market value to those in the Russell 2000 Value Index.
15
DWS Variable Series II: DWS Janus Growth & Income VIP. The portfolio seeks long-term capital growth and current income. It may invest up to 75% of its total assets in equity securities selected primarily for their growth potential and at least 25% of its total assets in securities the portfolio manager believes have income potential.
DWS Variable Series II: DWS Janus Growth Opportunities VIP. The portfolio seeks long-term growth of capital in a manner consistent with the preservation of capital. The portfolio invests primarily in equity securities selected for their growth potential.
DWS Variable Series II: DWS MFS Strategic Value VIP. The portfolio’s investment objective is to provide capital appreciation. The portfolio invests, under normal market conditions, at least 65% of its net assets in common stocks and related securities, such as preferred stocks, convertible securities and depositary receipts, of companies which the manager believes are undervalued in the market relative to their long term potential.
DWS Variable Series II: DWS Oak Strategic Equity VIP. The portfolio seeks long-term capital growth. Under normal circumstances, the portfolio invests at least 80% of net assets, plus the amount of any borrowings for investment purposes, in equity securities. The portfolio invests primarily in common stocks of established US companies with large market capitalizations (in excess of $5 billion).
DWS Variable Series II: DWS Turner Mid Cap Growth VIP. The portfolio seeks capital appreciation. The portfolio pursues its objective by investing in common stocks and other equity securities of US companies with medium market capitalizations that the portfolio managers believe have strong earnings growth potential.
DWS RREEF Real Estate Securities VIP (a series of DWS Investments VIT Funds). The portfolio’s investment objectives are long-term capital appreciation and current income. Under normal circumstances, the Portfolio intends to keep at least 80% of its net assets, plus the amount of any borrowing for investment purposes (calculated at the time of any investment), invested in equity securities of real estate investment trusts and real estate companies.
Risk Factors of Underlying Portfolios. In pursuing their investment objectives, each of the underlying portfolios is permitted a wide range of investment techniques. The underlying portfolios’ risks are determined by the nature of the securities held and the management strategies used by the Advisor. Further information about the underlying portfolios is contained in the prospectuses of such portfolios. Because each Portfolio invests in certain of the underlying portfolios, shareholders of each Portfolio will be affected by the management strategies and investment policies of the underlying portfolios in direct proportion to the amount of assets a Portfolio allocates to each underlying portfolio.
Investment of Uninvested Cash Balances. Each Portfolio may have cash balances that have not been invested in portfolio securities (“Uninvested Cash”). Uninvested Cash may result from a variety of sources, including dividends or interest received from portfolio securities, unsettled securities transactions, reserves held for investment strategy purposes, scheduled maturity of investments, liquidation of investment securities to meet anticipated redemptions and dividend payments, and new cash received from investors. Uninvested Cash may be invested directly in money market instruments or other short-term debt obligations. Pursuant to an Exemptive Order issued by the SEC, each Portfolio may use Uninvested Cash to purchase shares of affiliated funds including money market funds, short-term bond funds and Cash Management QP Trust or one or more future entities for which DeIM acts as trustee or investment advisor that operate as cash management investment vehicles and that are excluded from the definition of investment company pursuant to Section 3©(1) or 3©(7) of the 1940 Act (collectively, the “Central Funds”) in excess of the limitations of Section 12(d)(1) of the 1940 Act. Investment by each Portfolio in shares of the Central Funds will be in accordance with the Portfolio’s investment policies and restrictions as set forth in its registration statement.
Certain of the Central Funds comply with Rule 2a-7 under the Act. The other Central Funds are or will be short-term bond funds that invest in fixed-income securities and maintain a dollar-weighted average maturity of three years or less. Each of the Central Funds will be managed specifically to maintain a highly liquid portfolio, and access to them will enhance each Portfolio’s ability to manage Uninvested Cash.
16
Each Portfolio will invest Uninvested Cash in Central Funds only to the extent that each Portfolio’s aggregate investment in the Central Funds does not exceed 25% of its total assets in shares of the Central Funds. Purchase and sales of shares of Central Funds are made at net asset value.
INVESTMENT POLICIES AND TECHNIQUES FOR THE UNDERLYING PORTFOLIOS
DWS Variable Series I Underlying Portfolios
Asset-Indexed Securities. DWS Health Care VIP may purchase asset-indexed securities which are debt securities usually issued by companies in precious metals related businesses such as mining, the principal amount, redemption terms, or interest rates of which are related to the market price of a specified precious metal. The Portfolio will only enter into transactions in publicly traded asset-indexed securities. Market prices of asset-indexed securities will relate primarily to changes in the market prices of the precious metals to which the securities are indexed rather than to changes in market rates of interest. However, there may not be a perfect correlation between the price movements of the asset-indexed securities and the underlying precious metals. Asset-indexed securities typically bear interest or pay dividends at below market rates (and in certain cases at nominal rates). The Portfolio may purchase asset-indexed securities to the extent permitted by law.
Bank and Savings and Loan Obligations. These obligations include negotiable certificates of deposit, bankers’ acceptances, deposit notes, fixed time deposits or other short-term bank obligations. Certificates of deposit are negotiable certificates evidencing the obligations of a bank to repay funds deposited with it for a specified period of time. A portfolio may invest in certificates of deposit of large domestic banks and their foreign branches, large US regulated subsidiaries of large foreign banks (i.e., banks which at the time of their most recent annual financial statements show total assets in excess of $1 billion), and of smaller banks as described below. Although a portfolio recognizes that the size of a bank is important, this fact alone is not necessarily indicative of its creditworthiness.
Borrowing. As a matter of fundamental policy, each Portfolio will not borrow money, except as permitted under the 1940 Act, and as interpreted by regulatory authority having jurisdiction, from time to time. While the Trustees do not currently intend to borrow for investment leveraging purposes, if such a strategy were implemented in the future it would increase a portfolio’s volatility and the risk of loss in a declining market. Borrowing by a portfolio will involve special risk considerations. Although the principal of a portfolio’s borrowings will be fixed, the Portfolio’s assets may change in value during the time that a borrowing is outstanding, thus increasing exposure to capital risk.
Collateralized Mortgage Obligations (“CMOs”). CMOs are hybrids between a mortgage-backed bond and mortgage pass-through securities. Similar to a bond, interest and prepaid principal are paid, in most cases, semiannually. CMOs may be collateralized by whole mortgage loans but are more typically collateralized by portfolios of mortgage pass-through securities guaranteed by GNMA, FHLMC, or Fannie Mae, and their income streams.
CMOs are structured into multiple classes, each bearing a different stated maturity. Actual maturity and average life will depend upon the prepayment experience of the collateral. CMOs provide for a modified form of call protection through a de facto breakdown of the underlying pool of mortgages according to how quickly the loans are repaid. Monthly payment of principal received from the pool of underlying mortgages, including prepayments, is first returned to investors holding the shortest maturity class. Investors holding the longer maturity classes receive principal only after the first class has been retired. An investor is partially guarded against a sooner than desired return of principal because of the sequential payments. The prices of certain CMOs, depending on their structure and the rate of prepayments, can be volatile. Some CMOs may also not be as liquid as other securities.
In a typical CMO transaction, a corporation issues multiple series, (e.g., A, B, C, Z) of CMO bonds (“Bonds”). Proceeds of the Bond offering are used to purchase mortgages or mortgage pass-through certificates (“Collateral”). The Collateral is pledged to a third party trustee as security for the Bonds. Principal and interest payments from the Collateral are used to pay principal on the Bonds in the order A, B, C, Z. The Series A, B, and C bonds all bear current interest. Interest on the Series Z Bond is accrued and added to principal and a like amount is paid as principal on the Series A, B, or C Bond currently being paid off. When the Series A, B, and C Bonds are paid in full, interest and principal on the Series Z Bond
17
begins to be paid currently. With some CMOs, the issuer serves as a conduit to allow loan originators (primarily builders or savings and loan associations) to borrow against their loan portfolios.
Combined Transactions. Each Portfolio may enter into multiple transactions, including multiple options transactions, multiple futures transactions and multiple interest rate transactions and any combination of futures, options and interest rate transactions (“component” transactions), instead of a single Strategic Transaction, as part of a single or combined strategy when, in the opinion of the Advisor, it is in the best interests of a Portfolio to do so. A combined transaction will usually contain elements of risk that are present in each of its component transactions. Although combined transactions are normally entered into based on the Advisor’s judgment that the combined strategies will reduce risk or otherwise more effectively achieve the desired portfolio management goal, it is possible that the combination will instead increase such risks or hinder achievement of the portfolio management objective.
Commercial Paper. Commercial paper consists of short-term, unsecured promissory notes issued to finance short-term credit needs. The commercial paper purchased by a fund will consist only of direct obligations issued by domestic and foreign entities.
Corporate Obligations. Investment in corporate debt obligations involves credit and interest rate risk. The value of fixed-income investments will fluctuate with changes in interest rates and bond market conditions, tending to rise as interest rates decline and to decline as interest rates rise. Corporate debt obligations generally offer less current yield than securities of lower quality, but lower-quality securities generally have less liquidity, greater credit and market risk, and as a result, more price volatility. Longer-term bonds are, however, generally more volatile than bonds with shorter maturities.
Dollar Roll Transactions. Dollar roll transactions consist of the sale by a Portfolio to a bank or broker/dealer (the “counterparty”) of GNMA certificates or other mortgage-backed securities together with a commitment to purchase from the counterparty similar, but not identical, securities at a future date, at the same price. The counterparty receives all principal and interest payments, including prepayments, made on the security while it is the holder. A Portfolio receives a fee from the counterparty as consideration for entering into the commitment to purchase. Dollar rolls may be renewed over a period of several months with a different purchase and repurchase price fixed and a cash settlement made at each renewal without physical delivery of securities. Moreover, the transaction may be preceded by a firm commitment agreement pursuant to which a Portfolio agrees to buy a security on a future date.
Each Portfolio will segregate cash, US Government securities or other liquid assets in an amount sufficient to meet their purchase obligations under the transactions. The Portfolios will also maintain asset coverage of at least 300% for all outstanding firm commitments, dollar rolls and other borrowings.
Dollar rolls may be treated for purposes of the 1940 Act, as amended, as borrowings of each Portfolio because they involve the sale of a security coupled with an agreement to repurchase. A dollar roll involves costs to the Portfolio. For example, while a Portfolio receives a fee as consideration for agreeing to repurchase the security, the Fund forgoes the right to receive all principal and interest payments while the counterparty holds the security. These payments to the counterparty may exceed the fee received by the Portfolio, thereby effectively charging the Portfolio interest on its borrowing. Further, although a Portfolio can estimate the amount of expected principal prepayment over the term of the dollar roll, a variation in the actual amount of prepayment could increase or decrease the cost of the Portfolio’s borrowing.
The entry into dollar rolls involves potential risks of loss that are different from those related to the securities underlying the transactions. For example, if the counterparty becomes insolvent, a Portfolio’s right to purchase from the counterparty might be restricted. Additionally, the value of such securities may change adversely before a Fund is able to purchase them. Similarly, a Portfolio may be required to purchase securities in connection with a dollar roll at a higher price than may otherwise be available on the open market. Since, as noted above, the counterparty is required to deliver a similar, but not identical security to a Portfolio, the security that the Portfolio is required to buy under the dollar roll may be worth less than an identical security. Finally, there can be no assurance that each Portfolio’s use of the cash that it receives from a dollar roll will provide a return that exceeds borrowing costs.
18
Eastern Europe. DWS Global Opportunities VIP may invest up to 5% of its total assets in the securities of issuers domiciled in Eastern European countries. Investments in companies domiciled in Eastern European countries may be subject to potentially greater risks than those of other foreign issuers. These risks include (i) potentially less social, political and economic stability; (ii) the small current size of the markets for such securities and the low volume of trading, which result in less liquidity and in greater price volatility; (iii) certain national policies which may restrict the Portfolio’s investment opportunities, including restrictions on investment in issuers or industries deemed sensitive to national interests; (iv) foreign taxation; (v) the absence of developed legal structures governing private or foreign investment or allowing for judicial redress for injury to private property; (vi) the absence, until recently in certain Eastern European countries, of a capital market structure or market-oriented economy; and (vii) the possibility that recent favorable economic developments in Eastern Europe may be slowed or reversed by unanticipated political or social events in such countries, or in the countries of the former Soviet Union.
Investments in such countries involve risks of nationalization, expropriation and confiscatory taxation. The Communist governments of a number of East European countries expropriated large amounts of private property in the past, in many cases without adequate compensation, and there may be no assurance that such expropriation will not occur in the future. In the event of such expropriation, the Portfolio could lose a substantial portion of any investments it has made in the affected countries. Further, no accounting standards exist in East European countries. Finally, even though certain East European currencies may be convertible into US dollars, the conversion rates may be artificial to the actual market values and may be adverse to the Portfolio.
Eurodollar Instruments. Each Portfolio may make investments in Eurodollar instruments. Eurodollar instruments are US dollar-denominated futures contracts or options thereon which are linked to the London Interbank Offered Rate (“LIBOR”), although foreign currency-denominated instruments are available from time to time. Eurodollar futures contracts enable purchasers to obtain a fixed rate for the lending of funds and sellers to obtain a fixed rate for borrowings. Each Portfolio might use Eurodollar futures contracts and options thereon to hedge against changes in LIBOR, to which many interest rate swaps and fixed income instruments are linked.
Eurodollar Obligations. Eurodollar bank obligations are US dollar-denominated certificates of deposit and time deposits issued outside the US capital markets by foreign branches of US banks and US branches of foreign banks. Eurodollar obligations are subject to the same risks that pertain to domestic issues, notably credit risk, market risk and liquidity risk. Additionally, Eurodollar obligations are subject to certain sovereign risks.
FHLMC Collateralized Mortgage Obligations. Federal Home Loan Mortgage Corporation (“FHLMC”) CMOs are debt obligations of FHLMC issued in multiple classes having different maturity dates which are secured by the pledge of a pool of conventional mortgage loans purchased by FHLMC. Unlike FHLMC PCs, payments of principal and interest on the CMOs are made semiannually, as opposed to monthly. The amount of principal payable on each semiannual payment date is determined in accordance with FHLMC’s mandatory sinking fund schedule, which, in turn, is equal to approximately 100% of FHA prepayment experience applied to the mortgage collateral pool. All sinking fund payments in the CMOs are allocated to the retirement of the individual classes of bonds in the order of their stated maturities. Payment of principal on the mortgage loans in the collateral pool in excess of the amount of FHLMC’s minimum sinking fund obligation for any payment date are paid to the holders of the CMOs as additional sinking fund payments. Because of the “pass-through” nature of all principal payments received on the collateral pool in excess of FHLMC’s minimum sinking fund requirement, the rate at which principal of the CMOs is actually repaid is likely to be such that each class of bonds will be retired in advance of its scheduled maturity date.
If collection of principal (including prepayments) on the mortgage loans during any semiannual payment period is not sufficient to meet FHLMC’s minimum sinking fund obligation on the next sinking fund payment date, FHLMC agrees to make up the deficiency from its general funds.
Criteria for the mortgage loans in the pool backing the CMOs are identical to those of FHLMC PCs. FHLMC has the right to substitute collateral in the event of delinquencies and/or defaults.
Foreign Currencies. Because investments in foreign securities usually will involve currencies of foreign countries, and because a Portfolio may hold foreign currencies and forward contracts, futures contracts and options on foreign
19
currencies and foreign currency futures contracts, the value of the assets of a Portfolio as measured in US dollars may be affected favorably or unfavorably by changes in foreign currency exchange rates and exchange control regulations, and a Portfolio may incur costs and experience conversion difficulties and uncertainties in connection with conversions between various currencies. Fluctuations in exchange rates may also affect the earning power and asset value of the foreign entity issuing the security.
The strength or weakness of the US dollar against these currencies is responsible for part of a Portfolio’s investment performance. If the dollar falls in value relative to the Japanese yen, for example, the dollar value of a Japanese stock held in the portfolio will rise even though the price of the stock remains unchanged. Conversely, if the dollar rises in value relative to the yen, the dollar value of the Japanese stock will fall.
Although a Portfolio values its assets daily in terms of US dollars, it does not intend to convert its holdings of foreign currencies into US dollars on a daily basis. It will do so from time to time, and investors should be aware of the costs of currency conversion. Although foreign exchange dealers typically do not charge a fee for conversion, they do realize a profit based on the difference (the “spread”) between the prices at which they are buying and selling various currencies. Thus, a dealer may offer to sell a foreign currency to a Portfolio at one rate, while offering a lesser rate of exchange should a Portfolio desire to resell that currency to the dealer. The Portfolio will conduct its foreign currency exchange transactions either on a spot (i.e., cash) basis at the spot rate prevailing in the foreign currency exchange market, or through entering into options or forward or futures contracts to purchase or sell foreign currencies.
Foreign Currency Transactions. DWS Bond VIP, DWS Capital Growth VIP and DWS International VIP may enter into forward foreign currency exchange contracts (“forward contracts”) for hedging purposes. These Portfolios may also, for hedging purposes, purchase foreign currencies in the form of bank deposits as well as other foreign money market instruments, including but not limited to, bankers’ acceptances, certificates of deposit, commercial paper, short-term government and corporate obligations and repurchase agreements. International Portfolio may also enter into foreign currency futures contracts and foreign currency options.
Because investments in foreign companies usually will involve currencies of foreign countries, and because the Portfolios temporarily may hold funds in bank deposits in foreign currencies during the completion of investment programs, the value of their assets as measured in US dollars may be affected favorably or unfavorably by changes in foreign currency exchange rates and exchange control regulations, and they may incur costs in connection with conversions between various currencies. Although the Portfolios value their assets daily in terms of US dollars, they do not intend to convert their holdings of foreign currencies into US dollars on a daily basis. They will do so from time to time, and investors should be aware of the costs of currency conversion. Although foreign exchange dealers do not charge a fee for conversion, they do realize a profit based on the difference (the “spread”) between the prices at which they are buying and selling various currencies. Thus, a dealer may offer to sell a foreign currency to the Portfolios at one rate, while offering a lesser rate of exchange should the Portfolios desire to resell that currency to the dealer. The Portfolios will conduct their foreign currency exchange transactions either on a spot (i.e., cash) basis at the spot rate prevailing in the foreign currency exchange market, or through entering into forward or, in the case of International Portfolio, futures contracts to purchase or sell foreign currencies.
A forward contract involves an obligation to purchase or sell a specific currency at a future date, which may be any fixed number of days from the date of the contract agreed upon by the parties, at a price set at the time of the contract. These contracts are traded in the interbank market conducted directly between currency traders (usually large commercial banks) and their customers. A forward contract generally has no deposit requirement, and no commissions are charged at any stage for trades.
A foreign currency futures contract is a standardized contract for the future delivery of a specified amount of a foreign currency at a future date at a price set at the time of the contract. The agreed price may be fixed or within a specified range of prices. Foreign currency futures contracts traded in the United States are designed by and traded on exchanges regulated by the Commodity Futures Trading Commission (“CFTC”), such as the Chicago Mercantile Exchange. Futures contracts involve brokerage costs, which may vary from less than 1% to 2.5% of the contract price, and require parties to the contract to make “margin” deposits to secure performance of the contract. International Portfolio would also be required to segregate assets to cover contracts that would require it to purchase foreign currencies. International Portfolio
20
would enter into futures contracts solely for hedging or other appropriate risk management purposes as defined in CFTC regulations.
Forward contracts differ from foreign currency futures contracts in certain respects. For example, the maturity date of a forward contract may be any fixed number of days from the date of the contract agreed upon by the parties, rather than a predetermined date in a given month, and they may be in any amounts agreed upon by the parties rather than predetermined amounts. Also, forward contracts are traded directly between currency traders so that no intermediary is required. A forward contract generally requires no margin or other deposit.
Upon the maturity of a forward or foreign currency futures contract a Portfolio may either accept or make delivery of the currency specified in the contract or, at or prior to maturity, enter into a closing purchase transaction involving the purchase or sale of an offsetting contract. Closing purchase transactions with respect to forward contracts are usually effected with the currency trader who is a party to the original forward contract. Closing purchase transactions with respect to futures contracts are effected on a commodities exchange; a clearing corporation associated with the exchange assumes responsibility for closing out such contracts.
A Portfolio may enter into forward contracts and foreign currency futures contracts under certain circumstances. When a Portfolio enters into a contract for the purchase or sale of a security denominated in a foreign currency, or when a Portfolio anticipates the receipt in a foreign currency of dividends or interest payments on such a security which it holds, the Portfolio may desire to “lock in” the US dollar price of the security or the US dollar equivalent of such dividend or interest payment, as the case may be. By entering into a forward or futures contract for the purchase or sale, for a fixed amount of dollars, of the amount of foreign currency involved in the underlying transactions, the Portfolio will attempt to protect itself against a possible loss resulting from an adverse change in the relationship between the US dollar and the foreign currency during the period between the date on which the security is purchased or sold, or on which the dividend or interest payment is declared, and the date on which such payments are made or received.
Additionally, when management of a Portfolio believes that the currency of a particular foreign country may suffer a substantial decline against the US dollar, it may enter into a forward or futures contract to sell, for a fixed amount of dollars, the amount of foreign currency approximating the value of some or all of the Portfolio’s securities denominated in such foreign currency. The precise matching of the forward or futures contract amounts and the value of the securities involved will not generally be possible because the future value of such securities in foreign currencies will change as a consequence of market movements in the value of those securities between the date on which the contract is entered into and the date it matures. The precise projection of short-term currency market movements is not possible, and short-term hedging provides a means of fixing the dollar value of a portion of the Portfolio’s foreign assets.
The Portfolios do not intend to enter into such forward or futures contracts to protect the value of their portfolio securities on a regular continuous basis, and will not do so if, as a result, a Portfolio will have more than 15% of the value of its total assets committed to the consummation of such contracts. A Portfolio also will not enter into such forward or foreign currency futures contracts or maintain a net exposure to such contracts where the consummation of the contracts would obligate the Portfolio to deliver an amount of foreign currency in excess of the value of the Portfolio’s securities or other assets denominated in that currency. Under normal circumstances, consideration of the prospect for currency parities will be incorporated into the long-term investment decisions made with regard to overall diversification strategies. However, the Portfolios believe that it is important to have the flexibility to enter into such forward or foreign currency futures contracts when each determines that the best interests of the Portfolio will be served.
Except when a Portfolio enters into a forward contract for the purpose of the purchase or sale of a security denominated in a foreign currency, Brown Brothers Harriman & Co. or State Street Bank and Trust Company (each a “Custodian”), will place cash or liquid securities into a segregated account of the Portfolio in an amount equal to the value of the Portfolio’s total assets committed to the consummation of forward contracts (or the Portfolio’s forward contracts will be otherwise covered consistent with applicable regulatory policies) and foreign currency futures contracts that require the Portfolio to purchase foreign currencies. If the value of the securities placed in the segregated account declines, additional cash or securities will be placed in the account on a daily basis so that the value of the account will equal the amount of the Portfolio’s commitments with respect to such contracts.
21
The Portfolios generally will not enter into a forward or foreign currency futures contract with a term of greater than one year. It also should be realized that this method of protecting the value of a Portfolio’s securities against a decline in the value of a currency does not eliminate fluctuations in the underlying prices of the securities. It simply establishes a rate of exchange which the Portfolio can achieve at some future point in time.
While the Portfolios will enter into forward and, in the case of DWS Bond VIP and DWS International VIP, foreign currency futures contracts and foreign currency options to reduce currency exchange rate risks, transactions in such contracts involve certain other risks. Thus, while a Portfolio may benefit from such transactions, unanticipated changes in currency prices may result in a poorer overall performance for the Portfolio than if it had not engaged in any such transaction. Moreover, there may be imperfect correlation between the value of the Portfolio’s holdings of securities denominated in a particular currency and forward or futures contracts entered into by the Portfolio. Such imperfect correlation may prevent the Portfolio from achieving a complete hedge or expose the Portfolio to risk of foreign exchange loss.
DWS Bond VIP and DWS International VIP may purchase options on foreign currencies for hedging purposes in a manner similar to that of transactions in forward contracts. For example, a decline in the dollar value of a foreign currency in which portfolio securities are denominated will reduce the dollar value of such securities, even if their value in the foreign currency remains constant. In order to protect against such decreases in the value of portfolio securities, the Portfolio may purchase put options on the foreign currency. If the value of the currency declines, the Portfolio will have the right to sell such currency for a fixed amount of dollars which exceeds the market value of such currency. This would result in a gain that may offset, in whole or in part, the negative effect of currency depreciation on the value of the Portfolio’s securities denominated in that currency.
Conversely, if a rise in the dollar value of a currency is projected for those securities to be acquired, thereby increasing the cost of such securities, DWS Bond VIP and DWS International VIP may purchase call options on such currency. If the value of such currency increased, the purchase of such call options would enable the Portfolio to purchase currency for a fixed amount of dollars which is less than the market value of such currency. Such a purchase would result in a gain that may offset, at least partially, the effect of any currency related increase in the price of securities the Portfolio intends to acquire. As in the case of other types of options transactions, however, the benefit the Portfolio derives from purchasing foreign currency options will be reduced by the amount of the premium and related transaction costs. In addition, if currency exchange rates do not move in the direction or to the extent anticipated, the Portfolio could sustain losses on transactions in foreign currency options which would deprive it of a portion or all of the benefits of advantageous changes in such rates.
DWS International VIP may close out its position in a currency option by either selling the option it has purchased or entering into an offsetting option.
Foreign Fixed Income Securities. Since most foreign fixed income securities are not rated, a Portfolio will invest in foreign fixed income securities based on the Advisor’s analysis without relying on published ratings. Since such investments will be based upon the Advisor’s analysis rather than upon published ratings, achievement of a Portfolio’s goals may depend more upon the abilities of the Advisor than would otherwise be the case.
The value of the foreign fixed income securities held by a Portfolio, and thus the net asset value of a Portfolio’s shares, generally will fluctuate with (a) changes in the perceived creditworthiness of the issuers of those securities, (b) movements in interest rates, and (c) changes in the relative values of the currencies in which a Portfolio’s investments in fixed income securities are denominated with respect to the US Dollar. The extent of the fluctuation will depend on various factors, such as the average maturity of a Portfolio’s investments in foreign fixed income securities, and the extent to which a Portfolio hedges its interest rate, credit and currency exchange rate risks. A longer average maturity generally is associated with a higher level of volatility in the market value of such securities in response to changes in market conditions.
Investments in sovereign debt, including Brady Bonds, involve special risks. Brady Bonds are debt securities issued under a plan implemented to allow debtor nations to restructure their outstanding commercial bank indebtedness. Foreign governmental issuers of debt or the governmental authorities that control the repayment of the debt may be unable or
22
unwilling to repay principal or pay interest when due. In the event of default, there may be limited or no legal recourse in that, generally, remedies for defaults must be pursued in the courts of the defaulting party. Political conditions, especially a sovereign entity’s willingness to meet the terms of its fixed income securities, are of considerable significance. Also, there can be no assurance that the holders of commercial bank loans to the same sovereign entity may not contest payments to the holders of sovereign debt in the event of default under commercial bank loan agreements. In addition, there is no bankruptcy proceeding with respect to sovereign debt on which a sovereign has defaulted, and a Portfolio may be unable to collect all or any part of its investment in a particular issue. Foreign investment in certain sovereign debt is restricted or controlled to varying degrees, including requiring governmental approval for the repatriation of income, capital or proceeds of sales by foreign investors. These restrictions or controls may at times limit or preclude foreign investment in certain sovereign debt or increase the costs and expenses of a Portfolio. Sovereign debt may be issued as part of debt restructuring and such debt is to be considered speculative. There is a history of defaults with respect to commercial bank loans by public and private entities issuing Brady Bonds. All or a portion of the interest payments and/or principal repayment with respect to Brady Bonds may be uncollateralized.
Foreign Investment. DWS Bond VIP, DWS Growth & Income VIP, DWS Capital Growth VIP, DWS Global Opportunities VIP and DWS International VIP may each invest, except as applicable to debt securities generally, in US dollar-denominated foreign debt securities (including those issued by the Dominion of Canada and its provinces and other debt securities which meet the criteria applicable to the Portfolio’s domestic investments), and in certificates of deposit issued by foreign banks and foreign branches of United States banks, to any extent deemed appropriate by the Advisor. DWS Bond VIP may invest up to 25% of its assets in non-US dollar-denominated foreign debt securities. DWS Growth & Income VIP may invest up to 25% of its assets in non-US dollar denominated equity securities of foreign issuers. DWS Capital Growth VIP may invest up to 25% of its assets, and DWS Global Opportunities VIP and DWS International VIP may invest without limit, in non-US dollar-denominated equity securities of foreign issuers.
Foreign Securities. Foreign securities are normally denominated and traded in foreign currencies. As a result, the value of the portfolio’s foreign investments and the value of its shares may be affected favorably or unfavorably by changes in currency exchange rates relative to the US dollar. There may be less information publicly available about a foreign issuer than about a US issuer, and foreign issuers may not be subject to accounting, auditing and financial reporting standards and practices comparable to those in the US. The securities of some foreign issuers are less liquid and at times more volatile than securities of comparable US issuers. Foreign brokerage commissions and other fees are also generally higher than in the US. Foreign settlement procedures and trade regulations may involve certain risks (such as delay in payment or delivery of securities or in the recovery of the portfolio’s assets held abroad) and expenses not present in the settlement of investments in US markets. Payment for securities without delivery may be required in certain foreign markets.
In addition, foreign securities may be subject to the risk of nationalization or expropriation of assets, imposition of currency exchange controls or restrictions on the repatriation of foreign currency, confiscatory taxation, political or financial instability and diplomatic developments which could affect the value of the portfolio’s investments in certain foreign countries. Governments of many countries have exercised and continue to exercise substantial influence over many aspects of the private sector through the ownership or control of many companies, including some of the largest in these countries. As a result, government actions in the future could have a significant effect on economic conditions which may adversely affect prices of certain portfolio securities. There is also generally less government supervision and regulation of stock exchanges, brokers, and listed companies than in the US. Dividends or interest on, or proceeds from the sale of, foreign securities may be subject to foreign withholding taxes, and special US tax considerations may apply. Moreover, foreign economies may differ favorably or unfavorably from the US economy in such respects as growth of gross national product, rate of inflation, capital reinvestment, resource self-sufficiency and balance of payments position.
Legal remedies available to investors in certain foreign countries may be more limited than those available with respect to investments in the US or in other foreign countries. The laws of some foreign countries may limit the portfolio’s ability to invest in securities of certain issuers organized under the laws of those foreign countries.
Of particular importance, many foreign countries are heavily dependent upon exports, particularly to developed countries, and, accordingly, have been and may continue to be adversely affected by trade barriers, managed adjustments in relative currency values, and other protectionist measures imposed or negotiated by the US and other countries with
23
which they trade. These economies also have been and may continue to be negatively impacted by economic conditions in the US and other trading partners, which can lower the demand for goods produced in those countries.
The risks described above, including the risks of nationalization or expropriation of assets, typically are increased in connection with investments in “emerging markets.” For example, political and economic structures in these countries may be in their infancy and developing rapidly, and such countries may lack the social, political and economic stability characteristic of more developed countries (including amplified risk of war and terrorism). Certain of these countries have in the past failed to recognize private property rights and have at times nationalized and expropriated the assets of private companies. Investments in emerging markets may be considered speculative.
The currencies of certain emerging market countries have experienced devaluations relative to the US dollar, and future devaluations may adversely affect the value of assets denominated in such currencies. In addition, currency hedging techniques may be unavailable in certain emerging market countries. Many emerging market countries have experienced substantial, and in some periods extremely high, rates of inflation or deflation for many years, and future inflation may adversely affect the economies and securities markets of such countries.
In addition, unanticipated political or social developments may affect the value of investments in emerging markets and the availability of additional investments in these markets. Any change in the leadership or politics of emerging market countries, or the countries that exercise a significant influence over those countries, may halt the expansion of or reverse the liberalization of foreign investment policies now occurring and adversely affect existing investment opportunities. The small size, limited trading volume and relative inexperience of the securities markets in these countries may make investments in securities traded in emerging markets illiquid and more volatile than investments in securities traded in more developed countries. For example, limited market size may cause prices to be unduly influenced by traders who control large positions. In addition, the fund may be required to establish special custodial or other arrangements before making investments in securities traded in emerging markets. There may be little financial or accounting information available with respect to issuers of emerging market securities, and it may be difficult as a result to assess the value of prospects of an investment in such securities.
The risk also exists that an emergency situation may arise in one or more emerging markets as a result of which trading of securities may cease or may be substantially curtailed and prices for a portfolio’s securities in such markets may not be readily available. A portfolio may suspend redemption of its shares for any period during which an emergency exists, as determined by the SEC. Accordingly if a portfolio believes that appropriate circumstances exist, it will promptly apply to the SEC for a determination that an emergency is present. During the period commencing from a portfolio’s identification of such condition until the date of the SEC action, a portfolio’s securities in the affected markets will be valued at fair value determined in good faith by or under the direction of a portfolio’s Board.
Certain of the foregoing risks may also apply to some extent to securities of US issuers that are denominated in foreign currencies or that are traded in foreign markets, or securities of US issuers having significant foreign operations.
Futures Contracts. DWS Bond VIP and DWS International VIP may enter into futures contracts. A futures contract may generally be described as an agreement between two parties to buy and sell a particular financial instrument for an agreed price during a designated month (or to deliver the final cash settlement price, in the case of a contract relating to an index or otherwise not calling for physical delivery at the end of trading in the contract). Futures contracts obligate the long or short holder to take or make delivery of a specified quantity of a commodity or financial instrument, such as a security or the cash value of a securities index, during a specified future period at a specified price.
When interest rates are rising or securities prices are falling, the Portfolios can seek to offset a decline in the value of its current portfolio securities through the sale of futures contracts. When interest rates are falling or securities prices are rising, the Portfolios, through the purchase of futures contracts, can attempt to secure better rates or prices than might later be available in the market when it affects anticipated purchases.
Positions taken in the futures markets are not normally held to maturity but are instead liquidated through offsetting transactions which may result in a profit or a loss. While futures contracts on securities will usually be liquidated in this manner, each Portfolio may instead make, or take, delivery of the underlying securities whenever it appears economically
24
advantageous to do so. A clearing corporation associated with the exchange on which futures on securities are traded guarantees that, if still open, the sale or purchase will be performed on the settlement date.
Futures on Debt Securities. A futures contract on a debt security is a binding contractual commitment which, if held to maturity, will result in an obligation to make or accept delivery, during a particular future month, of securities having a standardized face value and rate of return. By purchasing futures on debt securities — assuming a “long” position — the Fund, on behalf of a Portfolio, will legally obligate itself to accept the future delivery of the underlying security and pay the agreed price. By selling futures on debt securities — assuming a “short” position — it will legally obligate itself to make the future delivery of the security against payment of the agreed price. Open futures positions on debt securities will be valued at the most recent settlement price, unless such price does not appear to the Trustees to reflect the fair value of the contract, in which case the positions will be valued by or under the direction of the Trustees.
Positions taken in the futures markets are normally not held to maturity, but are instead liquidated through offsetting transactions which may result in a profit or a loss. While futures positions taken by the Fund on behalf of a Portfolio will usually be liquidated in this manner, the Fund may instead make or take delivery of the underlying securities whenever it appears economically advantageous to the Portfolio to do so. A clearing corporation associated with the exchange on which futures are traded assumes responsibility for closing-out and guarantees that the sale and purchase obligations will be performed with regard to all positions that remain open at the termination of the contract.
Hedging by use of futures on debt securities seeks to establish more certainly than would otherwise be possible the effective rate of return on portfolio securities. A Portfolio may, for example, take a “short” position in the futures market by selling contracts for the future delivery of debt securities held by the Portfolio (or securities having characteristics similar to those held by the Portfolio) in order to hedge against an anticipated rise in interest rates that would adversely affect the value of the Portfolio’s portfolio securities. When hedging of this character is successful, any depreciation in the value of portfolio securities will be substantially offset by appreciation in the value of the futures position.
On other occasions, the Portfolio may take a “long” position by purchasing futures on debt securities. This would be done, for example, when the Fund intends to purchase for the Portfolio particular securities when it has the necessary cash, but expects the rate of return available in the securities markets at that time to be less favorable than rates currently available in the futures markets. If the anticipated rise in the price of the securities should occur (with its concomitant reduction in yield), the increased cost to the Portfolio of purchasing the securities will be offset, at least to some extent, by the rise in the value of the futures position taken in anticipation of the subsequent securities purchase.
Hedging Strategies. DWS Bond VIP may utilize hedging strategies. Hedging, by use of futures contracts, seeks to establish with more certainty the effective price and rate of return on portfolio securities and securities that the Portfolio proposes to acquire. The portfolio may, for example, take a “short” position in the futures market by selling futures contracts in order to hedge against an anticipated rise in interest rates or a decline in market prices that would adversely affect the value of the portfolio’s securities. Such futures contracts may include contracts for the future delivery of securities held by the portfolio or securities with characteristics similar to those of portfolio securities. If, in the opinion of the Advisor, there is a sufficient degree of correlation between price trends for the portfolio’s securities and futures contracts based on other financial instruments, securities indices or other indices, the portfolio may also enter into such futures contracts as part of its hedging strategy. Although under some circumstances prices of securities in the Portfolio’s may be more or less volatile than prices of such futures contracts, the Advisor will attempt to estimate the extent of this volatility difference based on historical patterns and compensate for any such differential by having a Fund enter into a greater or lesser number of futures contracts or by attempting to achieve only a partial hedge against price changes affecting in the portfolio’s securities portfolio. When hedging of this character is successful, any depreciation in the value of portfolio securities will be substantially offset by appreciation in the value of the futures position. On the other hand, any unanticipated appreciation in the value of in the portfolio’s securities would be substantially offset by a decline in the value of the futures position.
On other occasions, the portfolio may take a “long” position by purchasing futures contracts. This would be done, for example, when the portfolio anticipates the subsequent purchase of particular cash securities, but expects the prices then available in the applicable market to be less favorable than prices that are currently available.
25
Indexed Securities. DWS Bond VIP may invest in indexed securities, the value of which is linked to currencies, interest rates, commodities, indices or other financial indicators (“reference instruments”). Most indexed securities have maturities of three years or less.
Indexed securities differ from other types of debt securities in which a Portfolio may invest in several respects. First, the interest rate or, unlike other debt securities, the principal amount payable at maturity of an indexed security may vary based on changes in one or more specified reference instruments, such as an interest rate compared with a fixed interest rate or the currency exchange rates between two currencies (neither of which need be the currency in which the instrument is denominated). The reference instrument need not be related to the terms of the indexed security. For example, the principal amount of a US dollar denominated indexed security may vary based on the exchange rate of two foreign currencies. An indexed security may be positively or negatively indexed; that is, its value may increase or decrease if the value of the reference instrument increases. Further, the change in the principal amount payable or the interest rate of an indexed security may be a multiple of the percentage change (positive or negative) in the value of the underlying reference instrument(s).
Investment in indexed securities involves certain risks. In addition to the credit risk of the security’s issuer and the normal risks of price changes in response to changes in interest rates, the principal amount of indexed securities may decrease as a result of changes in the value of reference instruments. Further, in the case of certain indexed securities in which the interest rate is linked to a reference instrument, the interest rate may be reduced to zero, and any further declines in the value of the security may then reduce the principal amount payable on maturity. Finally, indexed securities may be more volatile than the reference instruments underlying indexed securities.
IPO Risk. Securities issued through an initial public offering (IPO) can experience an immediate drop in value if the demand for the securities does not continue to support the offering price. Information about the issuers of IPO securities is also difficult to acquire since they are new to the market and may not have lengthy operating histories. The Health Sciences Portfolio may engage in short-term trading in connection with its IPO investments, which could produce higher trading costs and adverse tax consequences. The number of securities issued in an IPO is limited, so it is likely that IPO securities will represent a smaller component of the Portfolio’s portfolio as its assets increase (and thus have a more limited effect on the Portfolio’s performance).
Letters of Credit. Municipal obligations, including certificates of participation, commercial paper and other short-term obligations, may be backed by an irrevocable letter of credit of a bank which assumes the obligation for payment of principal and interest in the event of default by the issuer. Only banks which, in the opinion of the Advisor, are of investment quality comparable to other permitted investments of the Portfolio may be used for letter of credit backed investments.
Options on Futures Contracts. DWS Bond VIP may enter into options on future contracts. The acquisition of put and call options on futures contracts will give the Portfolio the right (but not the obligation) for a specified price to sell or to purchase, respectively, the underlying futures contract at any time during the option period. As the purchaser of an option on a futures contract, the portfolio obtains the benefit of the futures position if prices move in a favorable direction but limits its risk of loss in the event of an unfavorable price movement to the loss of the premium and transaction costs.
The writing of a call option on a futures contract generates a premium which may partially offset a decline in the value of the portfolio’s assets. By writing a call option, the portfolio becomes obligated, in exchange for the premium, to sell a futures contract (if the option is exercised), which may have a value higher than the exercise price. Conversely, the writing of a put option on a futures contract generates a premium which may partially offset an increase in the price of securities that the portfolio intends to purchase. However, the portfolio becomes obligated to purchase a futures contract (if the option is exercised) which may have a value lower than the exercise price. Thus, the loss incurred by the portfolio in writing options on futures is potentially unlimited and may exceed the amount of the premium received. The portfolio will incur transaction costs in connection with the writing of options on futures.
The holder or writer of an option on a futures contract may terminate its position by selling or purchasing an offsetting option on the same series. There is no guarantee that such closing transactions can be effected. The portfolio’s ability to establish and close out positions on such options will be subject to the development and maintenance of a liquid market.
26
The portfolio may use options on futures contracts solely for bona fide hedging or other non-hedging purposes as described below.
Limitations on the Use of Futures Contracts and Options on Futures. For all Portfolios except DWS Bond VIP, all of the futures contracts and options on futures transactions into which the Fund will enter will be for bona fide hedging or other appropriate risk management purposes as permitted by CFTC regulations and to the extent consistent with requirements of the SEC.
To ensure that its futures and options transactions meet this standard, the Portfolio will enter into them only for the purposes or with the intent specified in CFTC regulations, subject to the requirements of the SEC. The Fund will further seek to assure that fluctuations in the price of the futures contracts and options on futures that it uses for hedging purposes will be substantially correlated to fluctuations in the price of the securities held by a Portfolio or which it expects to purchase, though there can be no assurance that this result will be achieved. The Portfolio will sell futures contracts or acquire puts to protect against a decline in the price of securities that a Portfolio owns. The Portfolio will purchase futures contracts or calls on futures contracts to protect a Portfolio against an increase in the price of securities the Fund intends later to purchase for the Portfolio before it is in a position to do so.
As evidence of this hedging intent, the Fund expects that on 75% or more of the occasions on which it purchases a long futures contract or call option on futures for a Portfolio the Fund will effect the purchase of securities in the cash market or take delivery as it closes out a Portfolio’s futures position. In particular cases, however, when it is economically advantageous to the Portfolio, a long futures position may be terminated (or an option may expire) without the corresponding purchase of securities.
As an alternative to literal compliance with the bona fide hedging definition, a CFTC definition now permits the Fund to elect to comply with a different test, under which its long futures positions will not exceed the sum of (a) cash or cash equivalents segregated for this purpose, (b) cash proceeds on existing investments due within thirty days and © accrued profits on the particular futures or options positions. However, the Fund will not utilize this alternative unless it is advised by counsel that to do so is consistent with the requirements of the SEC.
Futures on debt securities and stock index futures are at present actively traded on exchanges that are licensed and registered by the CFTC, or consistent with the CFTC regulations on foreign exchanges. Portfolios will incur brokerage fees in connection with their futures and options transactions, and will be required to deposit and maintain funds with brokers as margin to guarantee performance of futures obligations. In addition, while futures contracts and options on futures will be purchased and sold to reduce certain risks, those transactions themselves entail certain other risks. Thus, while a Portfolio may benefit from the use of futures and options on futures, unanticipated changes in interest rates or stock price movements may result in a poorer overall performance for the Portfolio than if it had not entered into any futures contracts or options transactions. Moreover, in the event of an imperfect correlation between the futures position and the portfolio position which is intended to be protected, the desired protection may not be obtained and the Portfolio may be exposed to risk of loss.
Each Portfolio, in dealing in futures contracts and options on futures, is subject to the 300% asset coverage requirement for borrowings set forth under “Investment Restrictions” in the Fund’s prospectus. The Trustees have also adopted a policy (which is not fundamental and may be modified by the Trustees without a shareholder vote) that, immediately after the purchase or sale of a futures contract or option thereon, the value of the aggregate initial margin with respect to all futures contracts and premiums on options on futures contracts entered into by a Portfolio will not exceed 5% of the fair market value of the Portfolio’s total assets. Additionally, the value of the aggregate premiums paid for all put and call options held by the Portfolio will not exceed 20% of its total assets. A futures contract for the receipt of a debt security and long index futures will be offset by assets of the Portfolio held in a segregated account in an amount equal to the total market value of the futures contracts less the amount of the initial margin for the contracts.
Micro-Cap Company Risk. While, historically, micro-capitalization company stocks have outperformed the stocks of large companies, the former have customarily involved more investment risk as well. There can be no assurance that this will continue to be true in the future. Micro-capitalization companies may have limited product lines, markets or financial resources; may lack management depth or experience; and may be more vulnerable to adverse general market or
27
economic developments than large companies. The prices of micro-capitalization company securities are often more volatile than prices associated with large company issues, and can display abrupt or erratic movements at times, due to limited trading volumes and less publicly available information.
Also, because micro-capitalization companies normally have fewer shares outstanding and these shares trade less frequently than large companies, it may be more difficult for a fund to buy and sell significant amounts of such shares without an unfavorable impact on prevailing market prices.
Some of the companies in which a fund may invest may distribute, sell or produce products which have recently been brought to market and may be dependent on key personnel. The securities of micro-capitalization companies are often traded over-the-counter and may not be traded in the volumes typical on a national securities exchange. Consequently, in order to sell this type of holding, a fund may need to discount the securities from recent prices or dispose of the securities over a long period of time.
Mortgage-Backed Securities and Mortgage Pass-Through Securities. DWS Bond VIP, DWS Global Opportunities VIP and DWS Growth & Income VIP may also invest in mortgage-backed securities, which are interests in pools of mortgage loans, including mortgage loans made by savings and loan institutions, mortgage bankers, commercial banks, and others. Pools of mortgage loans are assembled as securities for sale to investors by various governmental, government-related, and private organizations as further described below. Underlying mortgages may be of a variety of types, including adjustable rate, conventional 30-year, graduated payment and 15-year.
A decline in interest rates may lead to a faster rate of repayment of the underlying mortgages, and expose the Portfolios to a lower rate of return upon reinvestment. To the extent that such mortgage-backed securities are held by the Portfolios, the prepayment right will tend to limit to some degree the increase in net asset value of the Portfolios because the value of the mortgage-backed securities held by the Portfolios may not appreciate as rapidly as the price of non-callable debt securities. Mortgage-backed securities are subject to the risk of prepayment and the risk that the underlying loans will not be repaid. Because principal may be prepaid at any time, mortgage-backed securities may involve significantly greater price and yield volatility than traditional debt securities.
When interest rates rise, mortgage prepayment rates tend to decline, thus lengthening the life of mortgage-related securities and increasing their volatility, affecting the price volatility of the Fund’s shares.
Interests in pools of mortgage-backed securities differ from other forms of debt securities, which normally provide for periodic payment of interest in fixed amounts with principal payments at maturity or specified call dates. Instead, these securities provide a monthly payment which consists of both interest and principal payments. In effect, these payments are a “pass-through” of the monthly payments made by the individual borrowers on their mortgage loans, net of any fees paid to the issuer or guarantor of such securities. Additional payments are caused by repayments of principal resulting from the sale of the underlying property, refinancing or foreclosure, net of fees or costs which may be incurred. Some mortgage-related securities such as securities issued by the “GNMA” are described as “modified pass-through.” These securities entitle the holder to receive all interest and principal payments owed on the mortgage pool, net of certain fees, at the scheduled payment dates regardless of whether or not the mortgagor actually makes the payment.
The principal governmental guarantor of mortgage-related securities is GNMA. GNMA is a wholly owned US Government corporation within the Department of Housing and Urban Development. GNMA is authorized to guarantee, with the full faith and credit of the US Government, the timely payment of principal and interest on securities issued by institutions approved by GNMA (such as savings and loan institutions, commercial banks, and mortgage bankers) and backed by pools of FHA-insured or VA-guaranteed mortgages. These guarantees, however, do not apply to the market value or yield of mortgage-backed securities or to the value of Portfolio shares. Also, GNMA securities often are purchased at a premium over the maturity value of the underlying mortgages. This premium is not guaranteed and will be lost if prepayment occurs.
Government-related guarantors (i.e., not backed by the full faith and credit of the US Government) include Fannie Mae and the “FHLMC.” Fannie Mae is a government-sponsored corporation owned entirely by private stockholders. It is subject to general regulation by the Secretary of Housing and Urban Development. Fannie Mae purchases conventional
28
(i.e., not insured or guaranteed by any governmental agency) mortgages from a list of approved seller/servicers which include state and federally chartered savings and loan associations, mutual savings banks, commercial banks, credit unions, and mortgage bankers. Pass-through securities issued by Fannie Mae are guaranteed as to timely payment of principal and interest by Fannie Mae but are not backed by the full faith and credit of the US Government.
FHLMC is a corporate instrumentality of the US Government and was created by Congress in 1970 for the purpose of increasing the availability of mortgage credit for residential housing. Its stock is owned by the twelve Federal Home Loan Banks. FHLMC issues Participation Certificates (“PCs”) which represent interests in conventional mortgages from FHLMC’s national portfolio. FHLMC guarantees the timely payment of interest and ultimate collection of principal, but PCs are not backed by the full faith and credit of the US Government.
Commercial banks, savings and loan institutions, private mortgage insurance companies, mortgage bankers, and other secondary market issuers also create pass-through pools of conventional mortgage loans. Such issuers may, in addition, be the originators and/or servicers of the underlying mortgage loans as well as the guarantors of the mortgage-related securities. Pools created by such non-governmental issuers generally offer a higher rate of interest than governmental and government-related pools because there are no direct or indirect government or agency guarantees of payments. However, timely payment of interest and principal of these pools may be supported by various forms of insurance or guarantees, including individual loan, title, pool and hazard insurance, and letters of credit. The insurance and guarantees are issued by governmental entities, private insurers, and the mortgage poolers. Such insurance and guarantees and the creditworthiness of the issuers thereof will be considered in determining whether a mortgage-related security meets the Portfolios’ investment quality standards. There can be no assurance that the private insurers or guarantors can meet their obligations under the insurance policies or guarantee arrangements. The Portfolios may buy mortgage-related securities without insurance or guarantees, if through an examination of the loan experience and practices of the originators/servicers and poolers, the Advisor determines that the securities meet the Portfolios’ quality standards. Although the market for such securities is becoming increasingly liquid, securities issued by certain private organizations may not be readily marketable.
Other Mortgage-Backed Securities. The Advisor expects that governmental, government-related, or private entities may create mortgage loan pools and other mortgage-related securities offering mortgage pass-through and mortgage-collateralized investments in addition to those described above. The mortgages underlying these securities may include alternative mortgage instruments, that is, mortgage instruments whose principal or interest payments may vary or whose terms to maturity may differ from customary long-term fixed rate mortgages. As new types of mortgage-related securities are developed and offered to investors, the Advisor will, consistent with the Portfolio’s investment objectives, policies, and quality standards, consider making investments in such new types of mortgage-related securities.
Mortgage Dollar Rolls. DWS Bond VIP may enter into mortgage dollar rolls in which the Portfolio sells mortgage-backed securities for delivery in the current month and simultaneously contracts to repurchase similar, but not identical, securities on a fixed date. The Portfolio receives compensation as consideration for entering into the commitment to repurchase. The compensation is paid in the form of a fee which is recorded as deferred income and amortized to income over the roll period, or alternatively, a lower price for the security upon its repurchase. Mortgage dollar rolls may be renewed with a new sale and repurchase price and a cash settlement made at each renewal without physical delivery of the securities subject to the contract.
Municipal Obligations. DWS Bond VIP may invest in municipal obligations. Municipal obligations are issued by or on behalf of states, territories and possessions of the United States and their political subdivisions, agencies and instrumentalities and the District of Columbia to obtain funds for various public purposes. The interest on these obligations is generally exempt from federal income tax in the hands of most investors. The two principal classifications of municipal obligations are “notes” and “bonds.” Municipal notes are generally used to provide for short-term capital needs and generally have maturities of one year or less. Municipal notes include: Tax Anticipation Notes; Revenue Anticipation Notes; Bond Anticipation Notes; and Construction Loan Notes.
Tax Anticipation Notes are sold to finance working capital needs of municipalities. They are generally payable from specific tax revenues expected to be received at a future date. Revenue Anticipation Notes are issued in expectation of receipt of other types of revenue. Tax Anticipation Notes and Revenue Anticipation Notes are generally issued in
29
anticipation of various seasonal revenue such as income, sales, use and business taxes. Bond Anticipation Notes are sold to provide interim financing and Construction Loan Notes are sold to provide construction financing. These notes are generally issued in anticipation of long-term financing in the market. In most cases, these monies provide for the repayment of the notes. After the projects are successfully completed and accepted, many projects receive permanent financing through the FHA under Fannie Mae or GNMA. There are, of course, a number of other types of notes issued for different purposes and secured differently than those described above.
Municipal bonds, which meet longer-term capital needs and generally have maturities of more than one year when issued, have two principal classifications: “general obligation” bonds and “revenue” bonds.
Issuers of general obligation bonds include states, counties, cities, towns and regional districts. The proceeds of these obligations are used to fund a wide range of public projects including the construction or improvement of schools, highways and roads, water and sewer systems and a variety of other public purposes. The basic security behind general obligation bonds is the issuer’s pledge of its full faith, credit, and taxing power for the payment of principal and interest. The taxes that can be levied for the payment of debt service may be limited or unlimited as to rate or amount or special assessments.
The principal security for a revenue bond is generally the net revenues derived from a particular facility or group of facilities or, in some cases, from the proceeds of a special excise or other specific revenue source. Revenue bonds have been issued to fund a wide variety of capital projects including: electric, gas, water and sewer systems; highways, bridges and tunnels; port and airport facilities; colleges and universities; and hospitals. Although the principal security behind these bonds varies widely, many provide additional security in the form of a debt service reserve fund whose monies may also be used to make principal and interest payments on the issuer’s obligations. Housing finance authorities have a wide range of security including partially or fully-insured, rent-subsidized and/or collateralized mortgages, and/or the net revenues from housing or other public projects. In addition to a debt service reserve fund, some authorities provide further security in the form of a state’s ability (without obligation) to make up deficiencies in the debt reserve fund. Lease rental bonds issued by a state or local authority for capital projects are secured by annual lease rental payments from the state or locality to the authority sufficient to cover debt service on the authority’s obligations.
Some issues of municipal bonds are payable from United States Treasury bonds and notes held in escrow by a trustee, frequently a commercial bank. The interest and principal on these US Government securities are sufficient to pay all interest and principal requirements of the municipal securities when due. Some escrowed Treasury securities are used to retire municipal bonds at their earliest call date, while others are used to retire municipal bonds at their maturity.
Securities purchased for the Portfolio may include variable/floating rate instruments, variable mode instruments, put bonds, and other obligations which have a specified maturity date but also are payable before maturity after notice by the holder (“demand obligations”). Demand obligations are considered for the Portfolio’s purposes to mature at the demand date.
There are, in addition, a variety of hybrid and special types of municipal obligations as well as numerous differences in the security of municipal obligations both within and between the two principal classifications (i.e., notes and bonds) discussed above.
An entire issue of municipal securities may be purchased by one or a small number of institutional investors such as the Portfolio. Thus, such an issue may not be said to be publicly offered. Unlike the equity securities of operating companies or mutual funds which must be registered under the Securities Act of 1933 prior to offer and sale unless an exemption from such registration is available, municipal securities, whether publicly or privately offered, may nevertheless be readily marketable. A secondary market exists for municipal securities which have been publicly offered as well as securities which have not been publicly offered initially but which may nevertheless be readily marketable. Municipal securities purchased for the Portfolio are subject to the limitations on holdings of securities which are not readily marketable based on whether it may be sold in a reasonable time consistent with the customs of the municipal markets (usually seven days) at a price (or interest rate) which accurately reflects its recorded value. A Portfolio believes that the quality standards applicable to their investments enhance marketability. In addition, stand-by commitments, participation interests and demand obligations also enhance marketability.
30
Provisions of the federal bankruptcy statutes relating to the adjustment of debts of political subdivisions and authorities of states of the United States provide that, in certain circumstances, such subdivisions or authorities may be authorized to initiate bankruptcy proceedings without prior notice to or consent of creditors, which proceedings could result in material and adverse modification or alteration of the rights of holders of obligations issued by such subdivisions or authorities.
Litigation challenging the validity under state constitutions of present systems of financing public education has been initiated or adjudicated in a number of states, and legislation has been introduced to effect changes in public school finances in some states. In other instances there has been litigation challenging the issuance of pollution control revenue bonds or the validity of their issuance under state or federal law which litigation could ultimately affect the validity of those Municipal Securities or the tax-free nature of the interest thereon.
For the purpose of the Portfolio’s investment restrictions, the identification of the “issuer” of municipal obligations which are not general obligation bonds is made by the Advisor on the basis of the characteristics of the obligation as described above, the most significant of which is the source of funds for the payment of principal and interest on such obligations.
DWS Bond VIP may acquire municipal obligations when, due to disparities in the debt securities markets, the anticipated total return on such obligations is higher than that on taxable obligations. DWS Bond VIP has no current intention of purchasing tax-exempt municipal obligations that would amount to greater than 5% of the Portfolio’s total assets.
Participation Interests. A Portfolio may purchase from financial institutions participation interests in securities in which a Portfolio may invest. A participation interest gives a Portfolio an undivided interest in the security in the proportion that a Portfolio’s participation interest bears to the principal amount of the security. These instruments may have fixed, floating or variable interest rates, with remaining maturities of 397 days or less. If the participation interest is unrated, or has been given a rating below that which is permissible for purchase by a Portfolio, the participation interest will be backed by an irrevocable letter of credit or guarantee of a bank, or the payment obligation otherwise will be collateralized by US Government securities, or, in the case of unrated participation interest, determined by the Advisor to be of comparable quality to those instruments in which a Portfolio may invest. For certain participation interests, a Portfolio will have the right to demand payment, on not more than seven days’ notice, for all or any part of a Portfolio’s participation interests in the security, plus accrued interest. As to these instruments, a Portfolio generally intends to exercise its right to demand payment only upon a default under the terms of the security.
Options. DWS Variable Series I, on behalf of DWS Bond VIP, DWS Capital Growth VIP and DWS International VIP, may write covered call options on the portfolio securities of such Portfolio in an attempt to enhance investment performance. A call option is a contract generally having a duration of nine months or less which gives the purchaser of the option, in return for a premium paid, the right to buy, and the writer the obligation to sell, the underlying security at the exercise price at any time upon the assignment of an exercise notice prior to the expiration of the option, regardless of the market price of the security during the option period. A covered call option is an option written on a security which is owned by the writer throughout the option period.
DWS Variable Series I will write, on behalf of a Portfolio, covered call options both to reduce the risks associated with certain of its investments and to increase total investment return. In return for the premium income, the Portfolio will give up the opportunity to profit from an increase in the market price of the underlying security above the exercise price so long as its obligations under the contract continue, except insofar as the premium represents a profit. Moreover, in writing the option, the Portfolio will retain the risk of loss should the price of the security decline, which loss the premium is intended to offset in whole or in part. Unlike the situation in which a Portfolio owns securities not subject to a call option, a Portfolio, in writing call options, must assume that the call may be exercised at any time prior to the expiration of its obligations as a writer, and that in such circumstances the net proceeds realized from the sale of the underlying securities pursuant to the call may be substantially below the prevailing market price. A Portfolio may forego the benefit of appreciation in its Portfolios on securities sold pursuant to call options.
When the Portfolio writes a covered call option, it gives the purchaser of the option the right to buy the underlying security at the price specified in the option (the “exercise price”) by exercising the option at any time during the option period, generally ranging up to nine months. Some of the options which a Portfolio writes may be of the European type which means they may be exercised only at a specified time. If the option expires unexercised, the Portfolio will realize
31
income in an amount equal to the premium received for the written option. If the option is exercised, a decision over which the Portfolio has no control, the Portfolio must sell the underlying security to the option holder at the exercise price. By writing a covered call option, the Portfolio forgoes, in exchange for the premium less the commission (“net premium”), the opportunity to profit during the option period from an increase in the market value of the underlying security above the exercise price.
DWS Capital Growth VIP and DWS International VIP may each write covered call and put options to a limited extent in an attempt to earn additional income on their portfolios, consistent with their investment objectives. The Portfolios may forego the benefits of appreciation on securities sold or depreciation on securities acquired pursuant to call and put options written by the Portfolios. Each Portfolio has no current intention of writing options on more than 5% of its net assets.
When DWS Variable Series I, on behalf of DWS Capital Growth VIP and DWS International VIP, writes a put option, it gives the purchaser of the option the right to sell the underlying security to the Portfolio at the specified exercise price at any time during the option period. Some of the European type options which the Fund writes may be exercised only at a specified time. If the option expires unexercised, the Portfolio will realize income in the amount of the premium received for writing the option. If the put option is exercised, a decision over which the Portfolio has no control, the Portfolio must purchase the underlying security from the option holder at the exercise price. By writing a put option, the Portfolio, in exchange for the net premium received, accepts the risk of a decline in the market value of the underlying security below the exercise price. With respect to each put option it writes, the Portfolio will have deposited in a separate account with its custodian US Treasury obligations, high-grade debt securities or cash equal in value to the exercise price of the put option, will have purchased a put option with a higher exercise price that will expire no earlier than the put option written or will have used some combination of these two methods. The Fund on behalf of each Portfolio, will only write put options involving securities for which a determination is made that it wishes to acquire the securities at the exercise price at the time the option is written.
A Portfolio may terminate its obligation as a writer of a call or put option by purchasing an option with the same exercise price and expiration date as the option previously written. This transaction is called a “closing purchase transaction.”
When a Portfolio writes an option, an amount equal to the net premium received by the Portfolio is included in the liability section of the Portfolio Statement of Assets and Liabilities as a deferred credit. The amount of the deferred credit will be subsequently marked to market to reflect the current market value of the option written. The current market value of a traded option is the last sale price or, in the absence of a sale, the mean between the closing bid and asked price. If an option expires on its stipulated expiration date or if the Portfolio enters into a closing purchase transaction, the Portfolio will realize a gain (or loss if the cost of a closing purchase transaction exceeds the premium received when the option was sold), and the deferred credit related to such option will be eliminated. If a call option is exercised, the Portfolio will realize a gain or loss from the sale of the underlying security and the proceeds of the sale will be increased by the premium originally received. The writing of covered call options may be deemed to involve the pledge of the securities against which the option is being written. Securities against which call options are written will be segregated on the books of the custodian for the Portfolio.
A Portfolio may purchase call options on any securities in which it may invest in anticipation of an increase in the market value of such securities. The purchase of a call option would entitle the Portfolio, in exchange for the premium paid, to purchase a security at a specified price during the option period. The Portfolio would ordinarily have a gain if the value of the securities increased above the exercise price sufficiently to cover the premium and would have a loss if the value of the securities remained at or below the exercise price during the option period.
DWS Capital Growth VIP and DWS International VIP will normally purchase put options in anticipation of a decline in the market value of securities in their portfolios (“protective puts”) or securities of the type in which they are permitted to invest. The purchase of a put option would entitle the Portfolio, in exchange for the premium paid, to sell a security, which may or may not be held by the Portfolio, at a specified price during the option period. The purchase of protective puts is designed merely to offset or hedge against a decline in the market value of the Portfolio’s portfolio securities. Put options may also be purchased by the Portfolio for the purpose of affirmatively benefiting from a decline in the price of securities which the Portfolio does not own. The Portfolio would ordinarily recognize a gain if the value of the securities
32
decreased below the exercise price sufficiently to cover the premium and would recognize a loss if the value of the securities remained at or above the exercise price. Gains and losses on the purchase of protective put options would tend to be offset by countervailing changes in the value of underlying portfolio securities.
The hours of trading for options on securities may not conform to the hours during which the underlying securities are traded. To the extent that the option markets close before the markets for the underlying securities, significant price and rate movements can take place in the underlying securities markets that cannot be reflected in the option markets. Exchange markets in securities options are a relatively new and untested concept. It is impossible to predict the volume of trading that may exist in such options, and there can be no assurance that viable exchange markets will develop or continue.
DWS Variable Series I, on behalf of a Portfolio, may engage in over-the-counter options transactions with broker-dealers who make markets in these options. At present, approximately thirty broker-dealers make these markets and the Advisor will consider risk factors such as their creditworthiness when determining a broker-dealer with which to engage in options transactions. The ability to terminate over-the-counter option positions is more limited than with exchange-traded option positions because the predominant market is the issuing broker rather than an exchange, and may involve the risk that broker-dealers participating in such transactions will not fulfill their obligations. Written over-the-counter options purchased by the Fund and portfolio securities “covering” the Fund’s obligation pursuant to an over-the-counter option may be deemed to be illiquid and may not be readily marketable. The Advisor will monitor the creditworthiness of dealers with whom the Fund enters into such options transactions under the general supervision of the Fund’s Trustees.
Options on Futures. For bona fide hedging purposes, DWS Variable Series I may also purchase and write, on behalf of DWS Bond VIP, DWS Capital Growth VIP and DWS International VIP, call and put options on futures contracts, which are traded on exchanges that are licensed and regulated by the CFTC or on any foreign exchange for the purpose of options trading, to the extent permitted by law. A “call” option on a futures contract gives the purchaser the right, in return for the premium paid, to purchase a futures contract (assume a “long” position) at a specified exercise price at any time before the option expires. A “put” option gives the purchaser the right, in return for the premium paid, to sell a futures contract (assume a “short” position), for a specified exercise price, at any time before the option expires.
Upon the exercise of a “call,” the writer of the option is obligated to sell the futures contract (to deliver a “long” position to the option holder) at the option exercise price, which will presumably be lower than the current market price of the contract in the futures market. Upon exercise of a “put,” the writer of the option is obligated to purchase the futures contract (deliver a “short” position to the option holder) at the option exercise price, which will presumably be higher than the current market price of the contract in the futures market. When a person exercises an option and assumes a long futures position, in the case of a “call,” or a short futures position, in the case of a “put,” his gain will be credited to his futures margin account, while the loss suffered by the writer of the option will be debited to his account. However, as with the trading of futures, most participants in the options markets do not seek to realize their gains or losses by exercise of their option rights. Instead, the holder of an option will usually realize a gain or loss by buying or selling an offsetting option at a market price that will reflect an increase or a decrease from the premium originally paid.
Options on futures can be used by a Portfolio to hedge substantially the same risks as might be addressed by the direct purchase or sale of the underlying futures contracts. If the Portfolio purchases an option on a futures contract, it may obtain benefits similar to those that would result if it held the futures position itself. But in contrast to a futures transaction, in which only transaction costs are involved, benefits received in an option transaction will be reduced by the amount of the premium paid as well as by transaction costs. In the event of an adverse market movement, however, the Portfolio will not be subject to a risk of loss on the option transaction beyond the price of the premium it paid plus its transaction costs, and may consequently benefit from a favorable movement in the value of its portfolio securities that would have been more completely offset if the hedge had been effected through the use of futures.
If a Portfolio writes options on futures contracts, the Portfolio will receive a premium but will assume a risk of adverse movement in the price of the underlying futures contract comparable to that involved in holding a futures position. If the option is not exercised, the Portfolio will gain the amount of the premium, which may partially offset unfavorable changes in the value of securities held in or to be acquired for the Portfolio. If the option is exercised, the Portfolio will
33
incur a loss in the option transaction, which will be reduced by the amount of the premium it has received, but which may partially offset favorable changes in the value of its portfolio securities.
While the holder or writer of an option on a futures contract may normally terminate its position by selling or purchasing an offsetting option of the same series, the Portfolio’s ability to establish and close out options positions at fairly established prices will be subject to the maintenance of a liquid market. A Portfolio will not purchase or write options on futures contracts unless, in the Advisor’s opinion, the market for such options has sufficient liquidity that the risks associated with such options transactions are not at unacceptable levels.
Other Asset-Backed Securities. The securitization techniques used to develop mortgaged-backed securities are now being applied to a broad range of assets. Through the use of trusts and special purpose corporations, various types of assets, including automobile loans, computer leases and credit card receivables, are being securitized in pass-through structures similar to the mortgage pass-through structures or in a structure similar to the CMO structure. In general, the collateral supporting these securities is of shorter maturity than mortgage loans and is less likely to experience substantial prepayments with interest rate fluctuations.
Several types of asset-backed securities have already been offered to investors, including Certificates for Automobile Receivables(SM) (“CARS(SM)”). CARS(SM) represent undivided fractional interests in a trust whose assets consist of a pool of motor vehicle retail installment sales contracts and security interests in the vehicles securing the contracts. Payments of principal and interest on CARS(SM) are passed through monthly to certificate holders, and are guaranteed up to certain amounts and for a certain time period by a letter of credit issued by a financial institution unaffiliated with the trustee or originator of the trust. An investor’s return on CARS(SM) may be affected by early prepayment of principal on the underlying vehicle sales contracts. If the letter of credit is exhausted, the trust may be prevented from realizing the full amount due on a sales contract because of state law requirements and restrictions relating to foreclosure sales of vehicles and the obtaining of deficiency judgments following such sales or because of depreciation, damage or loss of a vehicle, the application of federal and state bankruptcy and insolvency laws, or other factors. As a result, certificate holders may experience delays in payments or losses if the letter of credit is exhausted.
Asset-backed securities present certain risks that are not presented by mortgage-backed securities. Primarily, these securities may not have the benefit of any security interest in the related assets. Credit card receivables are generally unsecured and the debtors are entitled to the protection of a number of state and federal consumer credit laws, many of which give such debtors the right to set off certain amounts owed on the credit cards, thereby reducing the balance due. There is the possibility that recoveries on repossessed collateral may not, in some cases, be available to support payments on these securities.
Asset-backed securities are often backed by a pool of assets representing the obligations of a number of different parties. To lessen the effect of failures by obligors on underlying assets to make payments, the securities may contain elements of credit support which fall into two categories: (i) liquidity protection, and (ii) protection against losses resulting from ultimate default by an obligor on the underlying assets. Liquidity protection refers to the provision of advances, generally by the entity administering the pool of assets, to ensure that the receipt of payments on the underlying pool occurs in a timely fashion. Protection against losses results from payment of the insurance obligations on at least a portion of the assets in the pool. This protection may be provided through guarantees, policies or letters of credit obtained by the issuer or sponsor from third parties, through various means of structuring the transaction or through a combination of such approaches. DWS Bond VIP will not pay any additional or separate fees for credit support. The degree of credit support provided for each issue is generally based on historical information respecting the level of credit risk associated with the underlying assets. Delinquency or loss in excess of that anticipated, or failure of the credit support could adversely affect the return on an investment in such a security.
DWS Bond VIP may also invest in residual interests in asset-backed securities. In the case of asset-backed securities issued in a pass-through structure, the cash flow generated by the underlying assets is applied to make required payments on the securities and to pay related administrative expenses. The residual interest in an asset-backed security pass-through structure represents the interest in any excess cash flow remaining after making the foregoing payments. The amount of residual cash flow resulting from a particular issue of asset-backed securities will depend on, among other things, the characteristics of the underlying assets, the coupon rates on the securities, prevailing interest rates, the amount
34
of administrative expenses and the actual prepayment experience on the underlying assets. Asset-backed security residuals not registered under the Securities Act of 1933 may be subject to certain restrictions on transferability. In addition, there may be no liquid market for such securities.
The availability of asset-backed securities may be affected by legislative or regulatory developments. It is possible that such developments may require DWS Bond VIP to dispose of any then existing holdings of such securities.
Securities Index Options. DWS Bond VIP, DWS Capital Growth VIP and DWS International VIP may each purchase call and put options on securities indexes for the purpose of hedging against the risk of unfavorable price movements adversely affecting the value of a Portfolio’s securities. Options on securities indexes are similar to options on stock except that the settlement is made in cash.
Unlike a securities option, which gives the holder the right to purchase or sell a specified security at a specified price, an option on a securities index gives the holder the right to receive a cash “exercise settlement amount” equal to (i) the difference between the exercise price of the option and the value of the underlying securities index on the exercise date, multiplied by (ii) a fixed “index multiplier.” In exchange for undertaking the obligation to make such cash payment, the writer of the securities index option receives a premium.
A securities index fluctuates with changes in the market values of the securities so included. Some securities index options are based on a broad market index such as the S&P 500 or the NYSE Composite Index, or a narrower market index such as the S&P 100. Indices are also based on an industry or market segment such as the AMEX Oil and Gas Index or the Computer and Business Equipment Index. Options on securities indexes are currently traded on exchanges including the Chicago Board Options Exchange, Philadelphia Exchange, New York Stock Exchange, and American Stock Exchange.
The effectiveness of hedging through the purchase of securities index options will depend upon the extent to which price movements in the portion of the securities portfolio being hedged correlate with price movements in the selected securities index. Perfect correlation is not possible because the securities holdings of a Portfolio will not exactly match the composition of the securities indexes on which options are written. In addition, the purchase of securities index options involves essentially the same risks as the purchase of options on futures contracts. The principal risk is that the premium and transactions costs paid by a Portfolio in purchasing an option will be lost as a result of unanticipated movements in prices of the securities comprising the securities index on which the option is written. Options on securities indexes also entail the risk that a liquid secondary market to close out the option will not exist, although a Portfolio will generally only purchase or write such an option if the Advisor believes the option can be closed out.
Short Sales Against the Box. DWS Health Care VIP may make short sales of common stocks if, at all times when a short position is open, the Portfolio owns the stock or owns preferred stocks or debt securities convertible or exchangeable, without payment of further consideration, into the shares of common stock sold short. Short sales of this kind are referred to as short sales “against the box.” The portfolio will incur a loss as a result of the short sale if the price of the security increases between the dates of the short sale and the date on which the Portfolio replaces the borrowed security. The broker/dealer that executes a short sale generally invests cash proceeds of the sale until they are paid to the Portfolio. Arrangements may be made with the broker/dealer to obtain a portion of the interest earned by the broker on the investment of short sale proceeds. The Portfolio will segregate the common stock or convertible or exchangeable preferred stock or debt securities in a special account with the custodian. The Portfolio will incur transaction costs, including interest expenses in connection with opening, maintaining, and closing short sales against the box. Uncertainty regarding the tax effects of short sales of appreciated investments may limit the extent to which the Portfolio may enter into short sales against the box.
Small Company Risk. The Advisor believes that many small companies often have sales and earnings growth rates which exceed those of larger companies, and that such growth rates may in turn be reflected in more rapid share price appreciation over time. However, investing in smaller company stocks involves greater risk than is customarily associated with investing in larger, more established companies. For example, smaller companies can have limited product lines, markets, or financial and managerial resources. Smaller companies may also be dependent on one or a few key persons, and may be more susceptible to losses and risks of bankruptcy. Also, the securities of smaller companies
35
may be thinly traded (and therefore have to be sold at a discount from current market prices or sold in small lots over an extended period of time). Transaction costs in smaller company stocks may be higher than those of larger companies.
Sovereign Debt. Investment in sovereign debt can involve a high degree of risk. The governmental entity that controls the repayment of sovereign debt may not be able or willing to repay the principal and/or interest when due in accordance with the terms of such debt. A governmental entity’s willingness or ability to repay principal and interest due in a timely manner may be affected by, among other factors, its cash flow situation, the extent of its foreign reserves, the availability of sufficient foreign exchange on the date a payment is due, the relative size of the debt service burden to the economy as a whole, the governmental entity’s policy toward the International Monetary Fund, and the political constraints to which a governmental entity may be subject. Governmental entities may also be dependent on expected disbursements from foreign governments, multilateral agencies and others abroad to reduce principal and interest arrearages on their debt. The commitment on the part of these governments, agencies and others to make such disbursements may be conditioned on a governmental entity’s implementation of economic reforms and/or economic performance and the timely service of such debtor’s obligations. Failure to implement such reforms, achieve such levels of economic performance or repay principal or interest when due may result in the cancellation of such third parties commitments to lend funds to the governmental entity, which may further impair such debtor’s ability or willingness to service its debts in a timely manner. Consequently, governmental entities may default on their sovereign debt. Holders of sovereign debt may be requested to participate in the rescheduling of such debt and to extend further loans to governmental entities. There is no bankruptcy proceeding by which sovereign debt on which governmental entities have defaulted may be collected in whole or in part.
Stock Index Futures. A stock index futures contract does not require the physical delivery of securities, but merely provides for profits and losses resulting from changes in the market value of the contract to be credited or debited at the close of each trading day to the respective accounts of the parties to the contract. On the contract’s expiration date a final cash settlement occurs and the futures positions are simply closed out. Changes in the market value of a particular stock index futures contract reflect changes in the specified index of equity securities on which the future is based. That index is designed to reflect overall price trends in the market for equity securities.
Stock index futures may be used to hedge the equity securities of each of DWS Growth & Income VIP, DWS Capital Growth VIP or DWS International VIP with regard to market (systematic) risk (involving the market’s assessment of overall economic prospects), as distinguished from stock-specific risk (involving the market’s evaluation of the merits of the issuer of a particular security). By establishing an appropriate “short” position in stock index futures, the Fund may seek to protect the value of the equity of a Portfolio’s securities against an overall decline in the market for equity securities. Alternatively, in anticipation of a generally rising market, the Fund can seek on behalf of a Portfolio to avoid losing the benefit of apparently low current prices by establishing a “long” position in stock index futures and later liquidating that position as particular equity securities are in fact acquired. To the extent that these hedging strategies are successful, the Portfolio will be affected to a lesser degree by adverse overall market price movements, unrelated to the merits of specific portfolio equity securities, than would otherwise be the case.
Stripped Zero Coupon Securities. Zero coupon securities include securities issued directly by the US Treasury, and US Treasury bonds or notes and their unmatured interest coupons and receipts for their underlying principal (“coupons”) which have been separated by their holder, typically a custodian bank or investment brokerage firm. A holder will separate the interest coupons from the underlying principal (the “corpus”) of the US Treasury security. A number of securities firms and banks have stripped the interest coupons and receipts and then resold them in custodial receipt programs with a number of different names, including “Treasury Income Growth Receipts” (“TIGRS™”) and Certificate of Accrual on Treasuries (“CATS™”). The underlying US Treasury bonds and notes themselves are held in book-entry form at the Federal Reserve Bank or, in the case of bearer securities (i.e., unregistered securities which are owned ostensibly by the bearer or holder thereof), in trust on behalf of the owners thereof. The Treasury has facilitated transfers of ownership of zero coupon securities by accounting separately for the beneficial ownership of particular interest coupons and corpus payments on Treasury securities through the Federal Reserve book-entry record-keeping system. The Federal Reserve program as established by the Treasury Department is known as “STRIPS” or “Separate Trading of Registered Interest and Principal of Securities.” Under the STRIPS program, the Portfolio will be able to have its beneficial ownership of zero coupon securities recorded directly in the book-entry record-keeping system in lieu of having to hold certificates or other evidences of ownership of the underlying US Treasury securities.
36
When US Treasury obligations have been stripped of their unmatured interest coupons by the holder, the principal or corpus is sold at a deep discount because the buyer receives only the right to receive a future fixed payment on the security and does not receive any rights to periodic interest (i.e. cash) payments. Once stripped or separated, the corpus and coupons may be sold separately. Typically, the coupons are sold separately or grouped with other coupons with like maturity dates and sold in such bundled form. Purchasers of stripped obligations acquire, in effect, discount obligations that are economically identical to the zero coupon securities that the Treasury sells itself.
Supranational Entities. Supranational entities are international organizations designated or supported by governmental entities to promote economic reconstruction or development and international banking institutions and related government agencies. Examples include the International Bank for Reconstruction and Development (the World Bank), the European Coal and Steel Community, The Asian Development Bank and the InterAmerican Development Bank. Obligations of supranational entities are backed by the guarantee of one or more foreign governmental parties which sponsor the entity.
Trust Preferred Securities. DWS Bond VIP may invest in Trust Preferred Securities, which are hybrid instruments issued by a special purpose trust (the “Special Trust”), the entire equity interest of which is owned by a single issuer. The proceeds of the issuance to the Portfolios of Trust Preferred Securities are typically used to purchase a junior subordinated debenture, and distributions from the Special Trust are funded by the payments of principal and interest on the subordinated debenture.
If payments on the underlying junior subordinated debentures held by the Special Trust are deferred by the debenture issuer, the debentures would be treated as original issue discount (“OID”) obligations for the remainder of their term. As a result, holders of Trust Preferred Securities, such as the portfolio, would be required to accrue daily for Federal income tax purposes, their share of the stated interest and the de minimis OID on the debentures (regardless of whether the portfolio receives any cash distributions from the Special Trust), and the value of Trust Preferred Securities would likely be negatively affected. Interest payments on the underlying junior subordinated debentures typically may only be deferred if dividends are suspended on both common and preferred stock of the issuer. The underlying junior subordinated debentures generally rank slightly higher in terms of payment priority than both common and preferred securities of the issuer, but rank below other subordinated debentures and debt securities. Trust Preferred Securities may be subject to mandatory prepayment under certain circumstances. The market values of Trust Preferred Securities may be more volatile than those of conventional debt securities. Trust Preferred Securities may be issued in reliance on Rule 144A under the Securities Act of 1933, as amended, and, unless and until registered, are restricted securities; there can be no assurance as to the liquidity of Trust Preferred Securities and the ability of holders of Trust Preferred Securities, such as the portfolio, to sell its holdings.
US Government Securities. There are two broad categories of US Government-related debt instruments: (a) direct obligations of the US Treasury, and (b) securities issued or guaranteed by US Government agencies.
Examples of direct obligations of the US Treasury are Treasury Bills, Notes, Bonds and other debt securities issued by the US Treasury. These instruments are backed by the “full faith and credit” of the United States. They differ primarily in interest rates, the length of maturities and the dates of issuance. Treasury bills have original maturities of one year or less. Treasury notes have original maturities of one to ten years and Treasury bonds generally have original maturities of greater than ten years.
Some agency securities are backed by the full faith and credit of the United States (such as Maritime Administration Title XI Ship Financing Bonds and Agency for International Development Housing Guarantee Program Bonds) and others are backed only by the rights of the issuer to borrow from the US Treasury (such as Federal Home Loan Bank Bonds and Federal National Mortgage Association Bonds), while still others, such as the securities of the Federal Farm Credit Bank, are supported only by the credit of the issuer. With respect to securities supported only by the credit of the issuing agency or by an additional line of credit with the US Treasury, there is no guarantee that the US Government will provide support to such agencies and such securities may involve risk of loss of principal and interest.
37
US Government Securities may include “zero coupon” securities that have been stripped by the US Government of their unmatured interest coupons and collateralized obligations issued or guaranteed by a US Government agency or instrumentality.
Interest rates on US Government obligations may be fixed or variable. Interest rates on variable rate obligations are adjusted at regular intervals, at least annually, according to a formula reflecting then current specified standard rates, such as 91-day US Treasury bill rates. These adjustments generally tend to reduce fluctuations in the market value of the securities.
The government guarantee of the US Government Securities in a Portfolio’s portfolio does not guarantee the net asset value of the shares of a fund. There are market risks inherent in all investments in securities and the value of an investment in a fund will fluctuate over time. Normally, the value of investments in US Government Securities varies inversely with changes in interest rates. For example, as interest rates rise the value of investments in US Government Securities will tend to decline, and as interest rates fall the value of a fund’s investments will tend to increase. In addition, the potential for appreciation in the event of a decline in interest rates may be limited or negated by increased principal prepayments with respect to certain Mortgage-Backed Securities, such as GNMA Certificates. Prepayments of high interest rate Mortgage-Backed Securities during times of declining interest rates will tend to lower the return of a fund and may even result in losses to a fund if some securities were acquired at a premium. Moreover, during periods of rising interest rates, prepayments of Mortgage-Backed Securities may decline, resulting in the extension of a Portfolio’s average portfolio maturity. As a result, a Portfolio’s portfolio may experience greater volatility during periods of rising interest rates than under normal market conditions.
Warrants. Each Portfolio may invest in warrants up to 5% of the value of its total assets. The holder of a warrant has the right, until the warrant expires, to purchase a given number of shares of a particular issuer at a specified price. Such investments can provide a greater potential for profit or loss than an equivalent investment in the underlying security. Prices of warrants do not necessarily move, however, in tandem with the prices of the underlying securities and are, therefore, considered speculative investments. Warrants pay no dividends and confer no rights other than a purchase option. Thus, if a warrant held by a Portfolio were not exercised by the date of its expiration, the Portfolio would lose the entire purchase price of the warrant.
When-Issued Securities. A Portfolio may from time to time purchase securities on a “when-issued” or “forward delivery” basis. Debt securities are often issued on this basis. The price of such securities, which may be expressed in yield terms, is generally fixed at the time a commitment to purchase is made, but delivery and payment for the when-issued or forward delivery securities take place at a later date. During the period between purchase and settlement, no payment is made by the Portfolio and no interest accrues to the Portfolio. When a Portfolio purchases such securities, it immediately assumes the risks of ownership, including the risk of price fluctuation. Failure to deliver a security purchased on this basis may result in a loss or missed opportunity to make an alternative investment.
To the extent that assets of a Portfolio are held in cash pending the settlement of a purchase of securities, that Portfolio would earn no income. While such securities may be sold prior to the settlement date, a Portfolio intends to purchase them with the purpose of actually acquiring them unless a sale appears desirable for investment reasons. At the time a Portfolio makes the commitment to purchase a security on this basis, it will record the transaction and reflect the value of the security in determining its net asset value. The market value of the securities may be more or less than the purchase price. A Portfolio will establish a segregated account in which it will maintain cash and liquid securities equal in value to commitments for such securities.
Zero Coupon Securities. DWS Bond VIP, DWS Growth & Income VIP, DWS Capital Growth VIP and DWS Global Opportunities VIP may each invest in zero coupon securities which pay no cash income and are sold at substantial discounts from their value at maturity. When held to maturity, their entire income, which consists of accretion of discount, comes from the difference between the issue price and their value at maturity. The effect of owning instruments which do not make current interest payments is that a fixed yield is earned not only on the original investment but also, in effect, on all discount accretion during the life of the obligation. This implicit reinvestment of earnings at the same rate eliminates the risk of being unable to reinvest distributions at a rate as high as the implicit yield on the zero coupon bond, but at the same time eliminates any opportunity to reinvest earnings at higher rates. For this reason, zero coupon bonds
38
are subject to substantially greater price fluctuations during periods of changing market interest rates than those of comparable securities that pay interest currently, which fluctuation is greater as the period to maturity is longer. Zero coupon securities which are convertible into common stock offer the opportunity for capital appreciation (or depreciation) as increases (or decreases) in market value of such securities closely follow the movements in the market value of the underlying common stock. Zero coupon convertible securities generally are expected to be less volatile than the underlying common stocks, as they usually are issued with maturities of 15 years or less and are issued with options and/or redemption features exercisable by the holder of the obligation entitling the holder to redeem the obligation and receive a defined cash payment.
DWS Variable Series II Underlying Portfolios
Each underlying portfolio may engage in futures, options, and other derivatives transactions in accordance with its respective investment objectives and policies. Each such portfolio may engage in such transactions if it appears to the Advisor or, when applicable, an underlying portfolio’s subadvisor, to be advantageous to do so, in order to pursue its objective, to hedge (i.e., protect) against the effects of fluctuating interest rates and to stabilize the value of its assets and not for speculation. The use of futures and options, and possible benefits and attendant risks, are discussed below along with information concerning certain other investment policies and techniques.
Bank and Savings and Loan Obligations for DWS High Income VIP. DWS High Income VIP may also invest in bank loans, which are typically senior debt obligations of borrowers (issuers) and as such, are considered to hold a senior position in the capital structure of the borrower. These may include loans which hold the most senior position, that hold an equal ranking with other senior debt, or loans that are, in the judgment of the Advisor, in the category of senior debt of the borrower. This capital structure position generally gives the holders of these loans a priority claim on some or all of the borrower’s assets in the event of a default. In most cases, these loans are either partially or fully collateralized by the assets of a corporation, partnership, limited liability company or other business entity, or by cash flow that the Advisor believes has a market value at the time of acquisition that equals or exceeds the principal amount of the loan. These loans are often issued in connection with recapitalizations, acquisitions, leveraged buy-outs and refinancings. It is important to note that Moody’s and S&P generally rate bank loans a notch or two higher than high yield bonds of the same issuer to reflect their more senior position. The portfolio may invest in both fixed- and floating-rate loans. In addition, bank loans can trade either as an “assignment” or “participation.” When a portfolio buys an assignment, it is essentially becoming a party to the bank agreement. The vast majority of all trades are assignments and would therefore generally represent the preponderance of bank loans held by the portfolio. In certain cases, the portfolio may buy bank loans on a participation basis, if for example, the portfolio did not want to become party to the bank agreement. However, in all cases, the portfolio will not purchase bank loans where Deutsche Bank, or an affiliate, serves as an agent bank.
Participations and assignments involve credit risk, interest rate risk, liquidity risk, and the risk of being a lender. If the portfolio purchases a participation, it may only be able to enforce its rights through the lender, and may assume the credit risk of both the lender and the borrower.
Investments in loans through direct assignment of a financial institution’s interests with respect to a loan may involve additional risks. For example, if a loan is foreclosed, the purchaser could become part owner of any collateral, and would bear the costs and liabilities associated with owning and disposing of the collateral. In addition, it is at least conceivable that under emerging legal theories of lender liability, a purchaser could be held liable as a co-lender.
In the case of loans administered by a bank or other financial institution that acts as agent for all holders, if assets held by the agent for the benefit of a purchaser are determined to be subject to the claims of the agent’s general creditors, the purchaser might incur certain costs and delays in realizing payment on the loan or loan participation and could suffer a loss of principal or interest.
In the case of loan participations where a bank or other lending institution serves as financial intermediary between a portfolio and the borrower, if the participation does not shift to the portfolio the direct debtor-creditor relationship with the borrower, SEC interpretations require the portfolio, in some circumstances, to treat both the lending bank or other lending institution and the borrower as issuers for purposes of the portfolio’s investment policies. Treating a financial intermediary as an issuer of indebtedness may restrict a portfolio’s ability to invest in indebtedness related to a single
39
financial intermediary, or a group of intermediaries engaged in the same industry, even if the underlying borrowers represent many different companies and industries.
Borrowing. Each Portfolio will borrow only when the Advisor or subadvisor believes that borrowing will benefit the Portfolio after taking into account considerations such as the costs of the borrowing. Borrowing by each Portfolio will involve special risk considerations. Although the principal of each Portfolio’s borrowings will be fixed, a Portfolio’s assets may change in value during the time a borrowing is outstanding, proportionately increasing exposure to capital risk.
Collateralized Obligations. Subject to its investment objectives and policies, a Portfolio may purchase collateralized obligations, including interest only (“IO”) and principal only (“PO”) securities. A collateralized obligation is a debt security issued by a corporation, trust or custodian, or by a US Government agency or instrumentality, that is collateralized by a portfolio or pool of mortgages, mortgage-backed securities, US Government securities or other assets. The issuer’s obligation to make interest and principal payments is secured by the underlying pool or portfolio of securities. Collateralized obligations guaranteed by a US Government agency or instrumentality are considered US Government securities. Privately issued collateralized obligations collateralized by a portfolio of US Government securities are not direct obligations of the US Government or any of its agencies or instrumentalities and are not considered US Government securities. A variety of types of collateralized obligations are available currently and others may become available in the future.
Collateralized obligations, depending on their structure and the rate of prepayments, can be volatile. Some collateralized obligations may not be as liquid as other securities. Since collateralized obligations may be issued in classes with varying maturities and interest rates, the investor may obtain greater predictability of maturity than with direct investments in mortgage-backed securities. Classes with shorter maturities may have lower volatility and lower yield while those with longer maturities may have higher volatility and higher yield. This provides the investor with greater control over the characteristics of the investment in a changing interest rate environment. With respect to interest only and principal only securities, an investor has the option to select from a pool of underlying collateral the portion of the cash flows that most closely corresponds to the investor’s forecast of interest rate movements. These instruments tend to be highly sensitive to prepayment rates on the underlying collateral and thus place a premium on accurate prepayment projections by the investor.
A Portfolio, other than DWS Money Market VIP, may invest in collateralized obligations whose yield floats inversely against a specified index rate. These “inverse floaters” are more volatile than conventional fixed or floating rate collateralized obligations and the yield thereon, as well as the value thereof, will fluctuate in inverse proportion to changes in the index upon which rate adjustments are based. As a result, the yield on an inverse floater will generally increase when market yields (as reflected by the index) decrease and decrease when market yields increase. The extent of the volatility of inverse floaters depends on the extent of anticipated changes in market rates of interest. Generally, inverse floaters provide for interest rate adjustments based upon a multiple of the specified interest index, which further increases their volatility. The degree of additional volatility will be directly proportional to the size of the multiple used in determining interest rate adjustments. Currently, none of the Portfolios intends to invest more than 5% of its net assets in inverse floaters. DWS Money Market VIP does not invest in inverse floaters.
A Portfolio will currently invest in only those collateralized obligations that are fully collateralized and that meet the quality standards otherwise applicable to the Portfolio’s investments. Fully collateralized means that the collateral will generate cash flows sufficient to meet obligations to holders of the collateralized obligations under even the most conservative prepayment and interest rate projections. Thus, the collateralized obligations are structured to anticipate a worst-case prepayment condition and to minimize the reinvestment rate risk for cash flows between coupon dates for the collateralized obligations. A worst-case prepayment condition generally assumes immediate prepayment of all securities purchased at a premium and zero prepayment of all securities purchased at a discount. Reinvestment rate risk may be minimized by assuming very conservative reinvestment rates and by other means such as by maintaining the flexibility to increase principal distributions in a low interest rate environment. The effective credit quality of the collateralized obligations in such instances is the credit quality of the issuer of the collateral. The requirements as to collateralization are determined by the issuer or sponsor of the collateralized obligation in order to satisfy rating agencies, if rated. Payments of principal and interest on the underlying collateral securities are not passed through directly to the holders of
40
the collateralized obligations as such. Collateralized obligations, depending on their structure and the rate of prepayments, can be volatile. Some collateralized obligations may not be as liquid as other securities.
Collateralized obligations often are issued in two or more classes with varying maturities and stated rates of interest. Because interest and principal payments on the underlying securities are not passed through directly to holders of collateralized obligations, such obligations of varying maturities may be secured by a single portfolio or pool of securities, the payments on which are used to pay interest on each class and to retire successive maturities in sequence. These relationships may in effect “strip” the interest payments from principal payments of the underlying securities and allow for the separate purchase of either the interest or the principal payments. Collateralized obligations are designed to be retired as the underlying securities are repaid. In the event of prepayment on or call of such securities, the class of collateralized obligation first to mature generally will be paid down first. Therefore, although in most cases the issuer of collateralized obligations will not supply additional collateral in the event of such prepayment, there will be sufficient collateral to secure collateralized obligations that remain outstanding. It is anticipated that no more than 5% of a Portfolio’s net assets will be invested in IO and PO securities. Governmentally-issued and privately issued IO’s and PO’s will be considered illiquid for purposes of a Portfolio’s limitation on illiquid securities, however, the Board of Trustees may adopt guidelines under which governmentally-issued IO’s and PO’s may be determined to be liquid.
Concentration Risk. DWS Technology VIP concentrates its investments in the group of industries constituting the technology sector. As a result, market price movements, market saturation and rapid product obsolescence affecting companies in this field will have a significant impact on the portfolio’s performance. Additionally, many technology companies are smaller companies that may have limited business lines and financial resources, making them highly vulnerable to business and economic risks.
Delayed Delivery Transactions. DWS Mid Cap Growth VIP, DWS Global Thematic VIP, DWS Government & Agency Securities VIP, DWS High Income VIP, DWS Core Fixed Income VIP, DWS Strategic Income VIP, DWS Technology VIP, DWS Balanced VIP, DWS Mercury Large Cap Core VIP, DWS Templeton Foreign Value VIP, DWS Davis Venture Value VIP, DWS Dreman Financial Services VIP, DWS Legg Mason Aggressive Growth VIP, DWS Janus Growth & Income VIP, DWS Janus Growth Opportunities VIP, DWS Oak Strategic Equity VIP and DWS Turner Mid Cap Growth VIP may purchase or sell portfolio securities on a when-issued or delayed delivery basis. When-issued or delayed delivery transactions arise when securities are purchased by the Portfolio with payment and delivery to take place in the future in order to secure what is considered to be an advantageous price and yield to the Portfolio at the time of entering into the transaction. When the Portfolio enters into a delayed delivery transaction, it becomes obligated to purchase securities and it has all of the rights and risks attendant to ownership of a security, although delivery and payment occur at a later date. The value of fixed-income securities to be delivered in the future will fluctuate as interest rates vary. At the time a Portfolio makes the commitment to purchase a security on a when-issued or delayed delivery basis, it will record the transaction and reflect the liability for the purchase and the value of the security in determining its net asset value. Likewise, at the time a Portfolio makes the commitment to sell a security on a delayed delivery basis, it will record the transaction and include the proceeds to be received in determining its net asset value; accordingly, any fluctuations in the value of the security sold pursuant to a delayed delivery commitment are ignored in calculating net asset value so long as the commitment remains in effect. The Portfolio generally has the ability to close out a purchase obligation on or before the settlement date, rather than take delivery of the security.
Foreign Fixed-Income Securities. Since most foreign fixed-income securities are not rated, a Portfolio will invest in foreign fixed-income securities based upon the Advisor’s or subadvisor’s analysis without relying on published ratings. Since such investments will be based upon the Advisor or subadvisor’s analysis rather than upon published ratings, achievement of a Portfolio’s goals may depend more upon the abilities of the Advisor or subadvisor than would otherwise be the case.
The value of the foreign fixed-income securities held by a Portfolio, and thus the net asset value of the Portfolio’s shares, generally will fluctuate with (a) changes in the perceived creditworthiness of the issuers of those securities, (b) movements in interest rates, and (c) changes in the relative values of the currencies in which a Portfolio’s investments in fixed-income securities are denominated with respect to the US Dollar. The extent of the fluctuation will depend on various factors, such as the average maturity of a Portfolio’s investments in foreign fixed-income securities, and the extent to which a Portfolio hedges against its interest rate, credit and currency exchange rate risks. Many of the foreign
41
fixed-income obligations in which a Portfolio will invest will have long maturities. A longer average maturity generally is associated with a higher level of volatility in the market value of such securities in response to changes in market conditions.
Investments in sovereign debt, including Brady Bonds, involve special risks. Brady Bonds are debt securities issued under a plan implemented to allow debtor nations to restructure their outstanding commercial bank indebtedness. Foreign governmental issuers of debt or the governmental authorities that control the repayment of the debt may be unable or unwilling to repay principal or pay interest when due. In the event of default, there may be limited or no legal recourse in that, generally, remedies for defaults must be pursued in the courts of the defaulting party. Political conditions, especially a sovereign entity’s willingness to meet the terms of its fixed-income securities, are of considerable significance. Also, there can be no assurance that the holders of commercial bank loans to the same sovereign entity may not contest payments to the holders of sovereign debt in the event of default under commercial bank loan agreements. In addition, there is no bankruptcy proceeding with respect to sovereign debt on which a sovereign has defaulted, and a Portfolio may be unable to collect all or any part of its investment in a particular issue.
Foreign investment in certain sovereign debt is restricted or controlled to varying degrees, including requiring governmental approval for the repatriation of income, capital or proceeds of sales by foreign investors. These restrictions or controls may at times limit or preclude foreign investment in certain sovereign debt or increase the costs and expenses of a Portfolio. A significant portion of the sovereign debt in which a Portfolio may invest is issued as part of debt restructuring and such debt is to be considered speculative. There is a history of defaults with respect to commercial bank loans by public and private entities issuing Brady Bonds. All or a portion of the interest payments and/or principal repayment with respect to Brady Bonds may be uncollateralized.
Maintenance of $1.00 Net Asset Value, Credit Quality and Portfolio Maturity. DWS Money Market VIP effects sales, redemptions and repurchases at the net asset value per share, normally $1.00. In fulfillment of their responsibilities under Rule 2a-7 of the 1940 Act, the Fund’s Board has approved policies established by the Portfolio’s Advisor reasonably calculated to prevent the Fund’s net asset value per share from deviating from $1.00 except under unusual or extraordinary circumstances and the Fund’s Board will periodically review the Advisor’s operations under such policies at regularly scheduled Board meetings. Those policies include a weekly monitoring by the Advisor of unrealized gains and losses in the Portfolio’s portfolio, and when necessary, in an effort to avoid deviation, taking corrective action, such as adjusting the maturity of the portfolio, or, if possible, realizing gains or losses to offset in part unrealized losses or gains. The result of those policies may be that the yield on shares of the Portfolio will be lower than would be the case if the policies were not in effect. Such policies also provide for certain action to be taken with respect to portfolio securities which experience a downgrade in rating or suffer a default.
Non-Diversified Portfolios. DWS Dreman Financial Services VIP and DWS Technology VIP are each classified as a “non-diversified” portfolio so that each will be able to invest more than 5% of its assets in the obligations of an issuer, subject to the diversification requirements of Subchapter M of the Internal Revenue Code applicable to the Portfolio. This allows each Portfolio, as to 50% of its assets, to invest more than 5% of its assets, but not more than 25%, in the securities of an individual foreign government or corporate issuer. Since the Portfolio may invest a relatively high percentage of its assets in the obligations of a limited number of issuers, the Portfolio may be more susceptible to any single economic, political or regulatory occurrence than a diversified portfolio.
Commercial Paper. Subject to its investment objectives and policies, each DWS Variable Series II portfolio may invest in commercial paper issued by major corporations under the Securities Act of 1933 in reliance on the exemption from registration afforded by Section 3(a)(3) thereof. Such commercial paper may be issued only to finance current transactions and must mature in nine months or less. Trading of such commercial paper is conducted primarily by institutional investors through investment dealers, and individual investor participation in the commercial paper market is very limited. A portfolio also may invest in commercial paper issued in reliance on the so-called “private placement” exemption from registration afforded by Section 4(2) of the Securities Act of 1933 (“Section 4(2) paper”). Section 4(2) paper is restricted as to disposition under the federal securities laws, and generally is sold to institutional investors such as a Portfolio who agree that they are purchasing the paper for investment and not with a view to public distribution. Any resale by the purchaser must be in an exempt transaction. Section 4(2) paper normally is resold to other institutional investors like the portfolio through or with the assistance of the issuer or investment dealers who make a market in the
42
Section 4(2) paper, thus providing liquidity. The Advisor or a subadvisor considers the legally restricted but readily saleable Section 4(2) paper to be liquid; however, pursuant to procedures approved by the Board of Trustees of the Fund, if a particular investment in Section 4(2) paper is not determined to be liquid, that investment will be included within the limitation of the particular portfolio on illiquid securities. The Advisor or a subadvisor monitors the liquidity of each portfolio’s investments in Section 4(2) paper on a continuing basis.
Short Sales Against-the-Box. Each DWS Variable Series II portfolio (except DWS Money Market VIP) may make short sales against-the-box for the purpose of, but not limited to, deferring realization of loss when deemed advantageous for federal income tax purposes. A short sale “against-the-box” is a short sale in which a portfolio owns at least an equal amount of the securities sold short or securities convertible into or exchangeable for, without payment of any further consideration, securities of the same issue as, and at least equal in amount to, the securities sold short. The portfolio will incur a loss as a result of the short sale if the price of the security increases between the dates of the short sale and the date on which the Portfolio replaces the borrowed security. The Portfolio will incur transaction costs, including interest expenses in connection with opening, maintaining, and closing short sales against the box. Each Portfolio does not currently intend to engage in such short sales to the extent that more than 5% of its net assets will be held as collateral.
SPECIAL RISK FACTORS (DWS VARIABLE SERIES II UNDERLYING PORTFOLIOS). There are risks inherent in investing in any security, including shares of each underlying portfolio. The Advisor and, when applicable, the subadvisor, attempts to reduce risk through a variety of means such as fundamental research, diversification and the use of strategic transactions; however, there is no guarantee that such efforts will be successful and each Portfolio’s returns and net asset value will fluctuate over time. There are special risks associated with each Portfolio’s investments that are discussed below.
Special Risk Factors — Foreign Securities. DWS Mid Cap Growth VIP, DWS Blue Chip VIP, DWS Balanced VIP, DWS Small Cap Growth VIP and DWS Legg Mason Aggressive Growth VIP invest mainly in US common stocks, but may invest up to 25% of total assets in foreign securities. DWS Mercury Large Cap Core VIP may invest up to 10% of its total assets in foreign securities and DWS Templeton Foreign Value VIP will invest at least 80% of its net assets in foreign securities. DWS High Income VIP generally invests in US bonds or instruments, but up to 50% of total assets could be in bonds from foreign issuers. DWS Dreman Financial Services VIP may invest up to 30% of total assets in foreign securities. DWS Core Fixed Income VIP generally invests in US bonds or instruments, but up to 25% of total assets could be in bonds from foreign issuers. DWS MFS Strategic Value VIP invests mainly in US stocks, but may invest up to 20% of net assets in foreign securities. DWS Technology VIP invests mainly in US stocks, but may invest up to 35% of net assets in foreign securities. DWS Dreman High Return Equity VIP, and DWS Dreman Small Cap Value VIP may invest up to 20% of net assets in US Dollar-denominated American Depositary Receipts (“ADRs”) and in securities of foreign companies traded principally in securities markets outside the US. See “Investment Policies and Techniques — Options and Financial Futures Transactions — Foreign Currency Transactions.” DWS Money Market VIP and DWS Government & Agency Securities VIP, each within its quality standards, may also invest in securities of foreign issuers. However, such investments will be in US Dollar denominated instruments.
Investing in foreign securities involves certain special considerations, including those set forth below, which are not typically associated with investing in US securities and which may favorably or unfavorably affect a Portfolio’s performance. As foreign companies are not generally subject to uniform accounting, auditing and financial reporting standards, practices and requirements comparable to those applicable to domestic companies, there may be less publicly available information about a foreign company than about a domestic company. Many foreign securities markets, while growing in volume of trading activity, have substantially less volume than the US market, and securities of some foreign issuers are less liquid and more volatile than securities of domestic issuers. Similarly, volume and liquidity in most foreign bond markets is less than in the US and, at times, volatility of price can be greater than in the US. Fixed commissions on some foreign securities exchanges and bid to asked spreads in foreign bond markets are generally higher than commissions or bid to asked spreads on US markets, although the Advisor and subadvisor will endeavor to achieve the most favorable net results on its portfolio transactions. There is generally less governmental supervision and regulation of securities exchanges, brokers and listed companies in foreign countries than in the US. It may be more difficult for a Portfolio’s agents to keep currently informed about corporate actions in foreign countries which may affect the prices of portfolio securities. Communications between the US and foreign countries may be less reliable than within the US, thus increasing the risk of delayed settlements of portfolio transactions or loss of certificates for portfolio
43
securities. Payment for securities without delivery may be required in certain foreign markets. In addition, with respect to certain foreign countries, there is the possibility of expropriation or confiscatory taxation, political or social instability, or diplomatic developments which could affect US investments in those countries. Moreover, individual foreign economies may differ favorably or unfavorably from the US economy in such respects as growth of gross national product, rate of inflation, capital reinvestment, resource self-sufficiency and balance of payments position. The management of a Portfolio seeks to mitigate the risks associated with the foregoing considerations through continuous professional management.
Special Risk Factors — Small Company Risk. DWS Small Cap Growth VIP and DWS Dreman Small Cap Value VIP intend to invest a substantial portion of their assets in small capitalization stocks similar in size to those comprising the Russell 2000 Growth Index, Russell 2000 Index and Russell 2000 Value Index, respectively. Other Portfolios may invest in small capitalization stocks to a lesser degree. Many small companies may have sales and earnings growth rates which exceed those of larger companies and such growth rates may in turn be reflected in more rapid share price appreciation over time; however, investing in smaller company stocks involves greater risk than is customarily associated with investing in larger, more established companies. For example, smaller companies can have limited product lines, markets, or financial and managerial resources. Smaller companies may also be dependent on one or a few key persons, and may be more susceptible to losses and risks of bankruptcy. Also, the securities of smaller companies may be thinly traded (and therefore have to be sold at a discount from current market prices or sold in small lots over an extended period of time). Transaction costs in smaller company stocks may be higher than those of larger companies. Investors should therefore expect that the value of the shares of the DWS Small Cap Growth VIP, DWS Dreman Small Cap Value VIP may be more volatile than the shares of a portfolio that invests in larger capitalization stocks.
All DWS Variable Series I & II Underlying Portfolios
Asset-Backed Securities. Asset backed securities may include pools of mortgages (“mortgage-backed securities”), loans, receivables or other assets. Payment of principal and interest may be largely dependent upon the cash flows generated by the assets backing the securities. For purposes of determining the percentage of a fund’s total assets invested in securities of issuers having their principal business activities in a particular industry, asset backed securities will be classified separately. Asset-backed securities present certain risks that are not presented by mortgage-backed securities. Primarily, these securities may not have the benefit of any security interest in the related assets. Credit card receivables are generally unsecured and the debtors are entitled to the protection of a number of state and federal consumer credit laws, many of which give such debtors the right to set off certain amounts owed on the credit cards, thereby reducing the balance due. There is the possibility that recoveries on repossessed collateral may not, in some cases, be available to support payments on these securities. Asset-backed securities are often backed by a pool of assets representing the obligations of a number of different parties. To lessen the effect of failures by obligors on underlying assets to make payments, the securities may contain elements of credit support which fall into two categories: (i) liquidity protection, and (ii) protection against losses resulting from ultimate default by an obligor on the underlying assets. Liquidity protection refers to the provision of advances, generally by the entity administering the pool of assets, to ensure that the receipt of payments on the underlying pool occurs in a timely fashion. Protection against losses results from payment of the insurance obligations on at least a portion of the assets in the pool. This protection may be provided through guarantees, policies or letters of credit obtained by the issuer or sponsor from third parties, through various means of structuring the transaction or through a combination of such approaches. The funds will not pay any additional or separate fees for credit support. The degree of credit support provided for each issue is generally based on historical information respecting the level of credit risk associated with the underlying assets. Delinquency or loss in excess of that anticipated or failure of the credit support could adversely affect the return on an investment in such a security. The availability of asset-backed securities may be affected by legislative or regulatory developments. It is possible that such developments may require the funds to dispose of any then existing holdings of such securities. The Portfolios, except DWS Core Fixed Income VIP and DWS Balanced VIP, do not intend to invest more than 5% of total assets in asset-backed securities. DWS Core Fixed Income VIP and DWS Balanced VIP currently do not intend to invest more than 25% of total assets in asset-backed securities.
Certificates of Deposit and Bankers’ Acceptances. Certificates of deposit are receipts issued by a depository institution in exchange for the deposit of funds. The issuer agrees to pay the amount deposited plus interest to the bearer of the receipt on the date specified on the certificate. The certificate usually can be traded in the secondary market prior to maturity. Bankers’ acceptances typically arise from short-term credit arrangements designed to enable businesses to obtain funds to finance commercial transactions. Generally, an acceptance is a time draft drawn on a bank by an exporter
44
or an importer to obtain a stated amount of funds to pay for specific merchandise. The draft is then “accepted” by a bank that, in effect, unconditionally guarantees to pay the face value of the instrument on its maturity date. The acceptance may then be held by the accepting bank as an earning asset or it may be sold in the secondary market at the going rate of discount for a specific maturity. Although maturities for acceptances can be as long as 270 days, most acceptances have maturities of six months or less.
Banker’s acceptances are credit instruments evidencing the obligations of a bank to pay a draft drawn on it by a customer. These instruments reflect the obligation both of the bank and of the drawer to pay the face amount of the instrument upon maturity.
Time deposits are non-negotiable deposits maintained in a banking institution for a specified period of time at a stated interest rate. Time deposits which may be held by the Fund will not benefit from insurance from the Bank Insurance Fund or the Savings Association Insurance Fund administered by the Federal Deposit Insurance Corporation. Fixed time deposits may be withdrawn on demand by the investor, but may be subject to early withdrawal penalties that vary with market conditions and the remaining maturity of the obligation. Fixed time deposits subject to withdrawal penalties maturing in more than seven calendar days are subject to a fund’s limitation on investments in illiquid securities.
Common Stocks. Certain underlying portfolios invest in common stocks. Common stock is issued by companies to raise cash for business purposes and represents a proportionate interest in the issuing companies. Therefore, the Portfolios may participate in the success or failure of any company in which it holds stock. The market values of common stock can fluctuate significantly, reflecting the business performance of the issuing company, investor perception and general economic or financial market movements. Despite the risk of price volatility, however, common stocks have historically offered a greater potential for long-term gain on investment, compared to other classes of financial assets such as bonds or cash equivalents, although there can be no assurance that this will be true in the future.
Convertible Securities. Certain underlying portfolios may invest in convertible securities; that is, bonds, notes, debentures, preferred stocks and other securities which are convertible into common stock. Investments in convertible securities can provide an opportunity for capital appreciation and/or income through interest and dividend payments by virtue of their conversion or exchange features.
The convertible securities in which the Portfolios may invest include fixed-income or zero coupon debt securities which may be converted or exchanged at a stated or determinable exchange ratio into underlying shares of common stock. The exchange ratio for any particular convertible security may be adjusted from time to time due to stock splits, dividends, spin-offs, other corporate distributions or scheduled changes in the exchange ratio. Convertible securities and convertible preferred stocks, until converted, have general characteristics similar to both debt and equity securities. Although to a lesser extent than with debt securities generally, the market values of convertible securities tends to decline as interest rates increase and, conversely, tend to increase as interest rates decline. In addition, because of the conversion or exchange feature, the market values of convertible securities typically changes as the market value of the underlying common stocks changes, and, therefore, also tend to follow movements in the general market for equity securities. A unique feature of convertible securities is that as the market price of the underlying common stock declines, convertible securities tend to trade increasingly on a yield basis, and so may not experience market value declines to the same extent as the underlying common stock. When the market price of the underlying common stock increases, the prices of the convertible securities tend to rise as a reflection of the value of the underlying common stock, although typically not as much as the underlying common stock. While no securities investments are without risk, investments in convertible securities generally entail less risk than investments in common stock of the same issuer.
As debt securities, convertible securities are investments which provide for a stream of income (or in the case of zero coupon securities, accretion of income) with generally higher yields than common stocks. Convertible securities generally offer lower yields than non-convertible securities of similar quality because of their conversion or exchange features.
Of course, like all debt securities, there can be no assurance of income or principal payments because the issuers of the convertible securities may default on their obligations.
45
Convertible securities are generally subordinated to other similar but non-convertible securities of the same issuer, although convertible bonds, as corporate debt obligations, enjoy seniority in right of payment to all equity securities, and convertible preferred stock is senior to common stock, of the same issuer. However, because of the subordination feature, convertible bonds and convertible preferred stock typically have lower ratings than similar non-convertible securities. Convertible securities may be issued as fixed income obligations that pay current income or as zero coupon notes and bonds, including Liquid Yield Option Notes (“LYONs”).
Depositary Receipts. Investments in securities of foreign issuers may be in the form of sponsored or unsponsored American Depositary Receipts (“ADRs”), European Depositary Receipts (“EDRs”), Global Depositary Receipts (“GDRs”), International Depositary Receipts (“IDRs”) and other types of Depositary Receipts (which, together with ADRs, EDRs, GDRs and IDRs are hereinafter referred to as “Depositary Receipts”). Depositary Receipts provide indirect investment in securities of foreign issuers. Prices of unsponsored Depositary Receipts may be more volatile than if they were sponsored by the issuer of the underlying securities. Depositary Receipts may not necessarily be denominated in the same currency as the underlying securities into which they may be converted. In addition, the issuers of the stock of unsponsored Depositary Receipts are not obligated to disclose material information in the United States and, therefore, there may not be a correlation between such information and the market value of the Depositary Receipts. ADRs are Depository Receipts typically issued by a US bank or trust company which evidence ownership of underlying securities issued by a foreign corporation. GDRs, IDRs and other types of Depositary Receipts are typically issued by foreign banks or trust companies, although they also may be issued by United States banks or trust companies, and evidence ownership of underlying securities issued by either a foreign or a United States corporation. Generally, Depositary Receipts in registered form are designed for use in the United States securities markets and Depositary Receipts in bearer form are designed for use in securities markets outside the United States. For purposes of a Portfolio’s investment policies, a Portfolio’s investments in ADRs, GDRs and other types of Depositary Receipts will be deemed to be investments in the underlying securities. Depositary Receipts, including those denominated in US dollars, will be subject to foreign currency exchange rate risk. However, by investing in US dollar-denominated ADRs rather than directly in foreign issuers’ stock, a Portfolio avoids currency risks during the settlement period. In general, there is a large, liquid market in the United States for most ADRs. However, certain Depositary Receipts may not be listed on an exchange and therefore may be illiquid securities.
Direct Debt Instruments. Direct debt instruments are interests in amounts owed by a corporate, governmental or other borrower to lenders (direct loans), to suppliers of goods or services (trade claims or other receivables) or to other parties. DWS Bond VIP, DWS Balanced VIP, DWS Strategic Income VIP and DWS High Income VIP may invest in all types of direct debt investments, but among these investments each portfolio currently intends to invest primarily in direct loans and trade claims.
When a Portfolio participates in a direct loan it will be lending money directly to an issuer. Direct loans generally do not have an underwriter or agent bank, but instead, are negotiated between a company’s management team and a lender or group of lenders. Direct loans typically offer better security and structural terms than other types of high yield securities. Direct debt obligations are often the most senior-obligations in an issuer’s capital structure or are well-collateralized so that overall risk is lessened.
Trade claims are unsecured rights of payment arising from obligations other than borrowed funds. Trade claims include vendor claims and other receivables that are adequately documented and available for purchase from high yield broker-dealers. Trade claims typically may sell at a discount. In addition to the risks otherwise associated with low-quality obligations, trade claims have other risks, including the possibility that the amount of the claim may be disputed by the obligor. Trade claims normally would be considered illiquid and pricing can be volatile.
Direct debt instruments involve a risk of loss in case of default or insolvency of the borrower. The portfolio will rely primarily upon the creditworthiness of the borrower and/or the collateral for payment of interest and repayment of principal. The value of a portfolio’s investments may be adversely affected if scheduled interest or principal payments are not made. Because most direct loans will be secured, there will be a smaller risk of loss with direct loans than with an investment in unsecured high yield bonds or trade claims. Indebtedness of borrowers whose creditworthiness is poor involves substantially greater risks and may be highly speculative. Borrowers that are in bankruptcy or restructuring may never pay off their indebtedness or may pay only a small fraction of the amount owed. Investments in direct debt
46
instruments also involve interest rate risk and liquidity risk. However, interest rate risk is lessened by the generally short-term nature of direct debt instruments and their interest rate structure, which typically floats. To the extent the direct debt instruments in which a portfolio invests are considered illiquid, the lack of a liquid secondary market (1) will have an adverse impact on the value of such instruments, (2) will have an adverse impact on a portfolio’s ability to dispose of them when necessary to meet the portfolio’s liquidity needs or in response to a specific economic event, such as a decline in creditworthiness of the issuer, and (3) may make it more difficult for a portfolio to assign a value of these instruments for purposes of valuing the portfolio’s portfolio and calculating its net asset value. In order to lessen liquidity risk, the Portfolio anticipates investing primarily in direct debt instruments that are quoted and traded in the high yield market and will not invest in these instruments if it would cause more than 15% of the portfolio’s net assets to be illiquid. Trade claims may also present a tax risk to the portfolio. A portfolio will not invest in trade claims if it effects the portfolio’s qualification as a regulated investment company under Subchapter M of the Internal Revenue Code.
High Yield, High Risk Bonds. Certain portfolios may also purchase debt securities which are rated below investment-grade (commonly referred to as “junk bonds”), that is, rated below Baa by Moody’s or below BBB by S&P or judged to be of equivalent quality as determined by the Advisor. These securities usually entail greater risk (including the possibility of default or bankruptcy of the issuers of such securities), generally involve greater volatility of price and risk to principal and income, and may be less liquid, than securities in the higher rating categories. The lower the ratings of such debt securities, the more their risks render them like equity securities. Securities rated D may be in default with respect to payment of principal or interest. See the Appendix to this Statement of Additional Information for a more complete description of the ratings assigned by ratings organizations and their respective characteristics.
Issuers of such high yielding securities often are highly leveraged and may not have available to them more traditional methods of financing. Therefore, the risk associated with acquiring the securities of such issuers generally is greater than is the case with higher rated securities. For example, during an economic downturn or a sustained period of rising interest rates, highly leveraged issuers of high yield securities may experience financial stress. During such periods, such issuers may not have sufficient revenues to meet their interest payment obligations. The issuer’s ability to service its debt obligations may also be adversely affected by specific corporate developments, or the issuer’s inability to meet specific projected business forecasts, or the unavailability of additional financing. The risk of loss from default by the issuer is significantly greater for the holders of high yield securities because such securities are generally unsecured and are often subordinated to other creditors of the issuer. Prices and yields of high yield securities will fluctuate over time and, during periods of economic uncertainty, volatility of high yield securities may adversely affect a Portfolio’s net asset value. In addition, investments in high yield zero coupon or pay-in-kind bonds, rather than income-bearing high yield securities, may be more speculative and may be subject to greater fluctuations in value due to changes in interest rates.
A portfolio may have difficulty disposing of certain high yield (high risk) securities because they may have a thin trading market. Because not all dealers maintain markets in all high yield securities, a Portfolio anticipates that such securities could be sold only to a limited number of dealers or institutional investors. The lack of a liquid secondary market may have an adverse effect on the market price and a Portfolio’s ability to dispose of particular issues and may also make it more difficult for a Portfolio to obtain accurate market quotations for purposes of valuing a Portfolio’s assets. Market quotations generally are available on many high yield issues only from a limited number of dealers and may not necessarily represent firm bids of such dealers or prices for actual sales. Adverse publicity and investor perceptions may decrease the values and liquidity of high yield securities. These securities may also involve special registration responsibilities, liabilities and costs, and liquidity and valuation difficulties.
Credit quality in the high-yield securities market can change suddenly and unexpectedly, and even recently issued credit ratings may not fully reflect the actual risks posed by a particular high-yield security. For these reasons, it is generally the policy of the Advisor and subadvisors not to rely exclusively on ratings issued by established credit rating agencies, but to supplement such ratings with their own independent and ongoing review of credit quality. The achievement of a Portfolio’s investment objective by investment in such securities may be more dependent on the Advisor’s or subadvisor’s credit analysis than is the case for higher quality bonds. Should the rating of a portfolio security be downgraded, the Advisor or subadvisor will determine whether it is in the best interests of the Portfolio to retain or dispose of such security.
47
Prices for below investment-grade securities may be affected by legislative and regulatory developments. Also, Congress has from time to time considered legislation which would restrict or eliminate the corporate tax deduction for interest payments in these securities and regulate corporate restructurings. Such legislation may significantly depress the prices of outstanding securities of this type.
DWS Core Fixed Income VIP will not invest more than 5% of its net assets in junk bonds.
Foreign Investment. Foreign securities are normally denominated and traded in foreign currencies. As a result, the value of the fund’s foreign investments and the value of its shares may be affected favorably or unfavorably by changes in currency exchange rates relative to the US dollar. There may be less information publicly available about a foreign issuer than about a US issuer, and foreign issuers may not be subject to accounting, auditing and financial reporting standards and practices comparable to those in the US. The securities of some foreign issuers are less liquid and at times more volatile than securities of comparable US issuers. Foreign brokerage commissions and other fees are also generally higher than in the US. Foreign settlement procedures and trade regulations may involve certain risks (such as delay in payment or delivery of securities or in the recovery of the fund’s assets held abroad) and expenses not present in the settlement of investments in US markets. Payment for securities without delivery may be required in certain foreign markets.
In addition, foreign securities may be subject to the risk of nationalization or expropriation of assets, imposition of currency exchange controls or restrictions on the repatriation of foreign currency, confiscatory taxation, political or financial instability and diplomatic developments which could affect the value of the fund’s investments in certain foreign countries. Governments of many countries have exercised and continue to exercise substantial influence over many aspects of the private sector through the ownership or control of many companies, including some of the largest in these countries. As a result, government actions in the future could have a significant effect on economic conditions which may adversely affect prices of certain portfolio securities. There is also generally less government supervision and regulation of stock exchanges, brokers, and listed companies than in the US. Dividends or interest on, or proceeds from the sale of, foreign securities may be subject to foreign withholding taxes, and special US tax considerations may apply. Moreover, foreign economies may differ favorably or unfavorably from the US economy in such respects as growth of gross national product, rate of inflation, capital reinvestment, resource self-sufficiency and balance of payments position.
Legal remedies available to investors in certain foreign countries may be more limited than those available with respect to investments in the US or in other foreign countries. The laws of some foreign countries may limit the fund’s ability to invest in securities of certain issuers organized under the laws of those foreign countries.
Of particular importance, many foreign countries are heavily dependent upon exports, particularly to developed countries, and, accordingly, have been and may continue to be adversely affected by trade barriers, managed adjustments in relative currency values, and other protectionist measures imposed or negotiated by the US and other countries with which they trade. These economies also have been and may continue to be negatively impacted by economic conditions in the US and other trading partners, which can lower the demand for goods produced in those countries.
The risks described above, including the risks of nationalization or expropriation of assets, typically are increased in connection with investments in “emerging markets.” For example, political and economic structures in these countries may be in their infancy and developing rapidly, and such countries may lack the social, political and economic stability characteristic of more developed countries (including amplified risk of war and terrorism). Certain of these countries have in the past failed to recognize private property rights and have at times nationalized and expropriated the assets of private companies. Investments in emerging markets may be considered speculative.
The currencies of certain emerging market countries have experienced devaluations relative to the US dollar, and future devaluations may adversely affect the value of assets denominated in such currencies. In addition, currency hedging techniques may be unavailable in certain emerging market countries. Many emerging market countries have experienced substantial, and in some periods extremely high, rates of inflation or deflation for many years, and future inflation may adversely affect the economies and securities markets of such countries.
48
In addition, unanticipated political or social developments may affect the value of investments in emerging markets and the availability of additional investments in these markets. Any change in the leadership or politics of emerging market countries, or the countries that exercise a significant influence over those countries, may halt the expansion of or reverse the liberalization of foreign investment policies now occurring and adversely affect existing investment opportunities. The small size, limited trading volume and relative inexperience of the securities markets in these countries may make investments in securities traded in emerging markets illiquid and more volatile than investments in securities traded in more developed countries. For example, limited market size may cause prices to be unduly influenced by traders who control large positions. In addition, the fund may be required to establish special custodial or other arrangements before making investments in securities traded in emerging markets. There may be little financial or accounting information available with respect to issuers of emerging market securities, and it may be difficult as a result to assess the value of prospects of an investment in such securities.
The risk also exists that an emergency situation may arise in one or more emerging markets as a result of which trading of securities may cease or may be substantially curtailed and prices for a fund’s securities in such markets may not be readily available. A fund may suspend redemption of its shares for any period during which an emergency exists, as determined by the SEC. Accordingly if a fund believes that appropriate circumstances exist, it will promptly apply to the SEC for a determination that an emergency is present. During the period commencing from a fund’s identification of such condition until the date of the SEC action, a fund’s securities in the affected markets will be valued at fair value determined in good faith by or under the direction of a fund’s Board.
Certain of the foregoing risks may also apply to some extent to securities of US issuers that are denominated in foreign currencies or that are traded in foreign markets, or securities of US issuers having significant foreign operations.
Illiquid Securities and Restricted Securities. A portfolio may purchase securities that are subject to legal or contractual restrictions on resale (“restricted securities”). Generally speaking, restricted securities may be sold (i) only to qualified institutional buyers; (ii) in a privately negotiated transaction to a limited number of purchasers; (iii) in limited quantities after they have been held for a specified period of time and other conditions are met pursuant to an exemption from registration; or (iv) in a public offering for which a registration statement is in effect under the Securities Act of 1933, as amended. Issuers of restricted securities may not be subject to the disclosure and other investor protection requirements that would be applicable if their securities were publicly traded.
Restricted securities are often illiquid, but they may also be liquid. For example, restricted securities that are eligible for resale under Rule 144A are often deemed to be liquid.
A portfolio’s Board has approved guidelines for use by the Advisor in determining whether a security is liquid or illiquid. Among the factors the Advisor may consider in reaching liquidity decisions relating to Rule 144A securities are: (1) the frequency of trades and quotes for the security; (2) the number of dealers wishing to purchase or sell the security and the number of other potential purchasers; (3) dealer undertakings to make a market in the security; and (4) the nature of the security and the nature of the market for the security (i.e., the time needed to dispose of the security, the method of soliciting offers, and the mechanics of the transfer). Issuers of restricted securities may not be subject to the disclosure and other investor protection requirement that would be applicable if their securities were publicly traded. Where a registration statement is required for the resale of restricted securities, a Portfolio may be required to bear all or part of the registration expenses. A Portfolio may be deemed to be an “underwriter” for purposes of the Securities Act of 1933, as amended when selling restricted securities to the public and, in such event, a Portfolio may be liable to purchasers of such securities if the registration statement prepared by the issuer is materially inaccurate or misleading.
A portfolio may also purchase securities that are not subject to legal or contractual restrictions on resale, but that are deemed illiquid. Such securities may be illiquid, for example, because there is a limited trading market for them.
A portfolio may be unable to sell a restricted or illiquid security. In addition, it may be more difficult to determine a market value for restricted or illiquid securities. Moreover, if adverse market conditions were to develop during the period between a Portfolio’s decision to sell a restricted or illiquid security and the point at which a Portfolio is permitted or able to sell such security, a Portfolio might obtain a price less favorable than the price that prevailed when it decided to sell. This investment practice, therefore, could have the effect of increasing the level of illiquidity of a Portfolio.
49
Interfund Borrowing and Lending Program. The portfolios have received exemptive relief from the Securities and Exchange Commission (“SEC”) which permits the portfolios to participate in an interfund lending program among certain investment companies advised by the Advisor. The interfund lending program allows the participating funds to borrow money from and loan money to each other for temporary or emergency purposes. The program is subject to a number of conditions designed to ensure fair and equitable treatment of all participating funds, including the following: (1) no fund may borrow money through the program unless it receives a more favorable interest rate than a rate approximating the lowest interest rate at which bank loans would be available to any of the participating funds under a loan agreement; and (2) no fund may lend money through the program unless it receives a more favorable return than that available from an investment in repurchase agreements and, to the extent applicable, money market cash sweep arrangements. In addition, a fund may participate in the program only if and to the extent that such participation is consistent with the fund’s investment objectives and policies (for instance, money market funds would normally participate only as lenders and tax exempt funds only as borrowers). Interfund loans and borrowings may extend overnight, but could have a maximum duration of seven days. Loans may be called on one day’s notice. A fund may have to borrow from a bank at a higher interest rate if an interfund loan is called or not renewed. Any delay in repayment to a lending fund could result in a lost investment opportunity or additional costs. The program is subject to the oversight and periodic review of the Boards of the participating funds. To the extent a Portfolio is actually engaged in borrowing through the interfund lending program, the Portfolio, as a matter of non-fundamental policy, may not borrow for other than temporary or emergency purposes (and not for leveraging), except that a Portfolio (except Money Market Portfolio) may engage in reverse repurchase agreements and dollar rolls for any purpose.
Investment-Grade Bonds. “Investment-grade” bonds are those rated Aaa, Aa, A or Baa by Moody’s or AAA, AA, A or BBB by S&P or, if unrated, judged to be of equivalent quality as determined by the Advisor. Moody’s considers bonds it rates Baa to have speculative elements as well as investment-grade characteristics. To the extent that a Portfolio invests in higher-grade securities, a Portfolio will not be able to avail itself of opportunities for higher income which may be available at lower grades.
Investment Company Securities. Each portfolio may acquire securities of other investment companies to the extent consistent with its investment objective and subject to the limitations of the 1940 Act. Each Portfolio will indirectly bear its proportionate share of any management fees and other expenses paid by such other investment companies.
For example, a portfolio may invest in a variety of investment companies which seek to track the composition and performance of specific indexes or a specific portion of an index. These index-based investments hold substantially all of their assets in securities representing their specific index. Accordingly, the main risk of investing in index-based investments is the same as investing in a portfolio of equity securities comprising the index. The market prices of index-based investments will fluctuate in accordance with both changes in the market value of their underlying portfolio securities and due to supply and demand for the instruments on the exchanges on which they are traded (which may result in their trading at a discount or premium to their Net Asset Value (“NAVs”). Index-based investments may not replicate exactly the performance of their specified index because of transaction costs and because of the temporary unavailability of certain component securities of the index.
Examples of index-based investments include:
SPDRs®: SPDRs, an acronym for “Standard & Poor’s Depositary Receipts,” are based on the S&P 500. They are issued by the SPDR Trust, a unit investment trust that holds shares of substantially all the companies in the S&P 500 in substantially the same weighting and seeks to closely track the price performance and dividend yield of the Index.
MidCap SPDRs®: MidCap SPDRs are based on the S&P MidCap 400 Index. They are issued by the MidCap SPDR Trust, a unit investment trust that holds a portfolio of securities consisting of substantially all of the common stocks in the S&P MidCap 400 Index in substantially the same weighting and seeks to closely track the price performance and dividend yield of the Index.
Select Sector SPDRs®: Select Sector SPDRs are based on a particular sector or group of industries that are represented by a specified Select Sector Index within the S&P 500. They are issued by The Select Sector SPDR Trust, an open-end
50
management investment company with nine portfolios that each seeks to closely track the price performance and dividend yield of a particular Select Sector Index.
DIAMONDS(SM): DIAMONDS are based on the Dow Jones Industrial Average(SM). They are issued by the DIAMONDS Trust, a unit investment trust that holds a portfolio of all the component common stocks of the Dow Jones Industrial Average and seeks to closely track the price performance and dividend yield of the Dow.
Nasdaq-100 Shares: Nasdaq-100 Shares are based on the Nasdaq 100 Index. They are issued by the Nasdaq-100 Trust, a unit investment trust that holds a portfolio consisting of substantially all of the securities, in substantially the same weighting, as the component stocks of the Nasdaq-100 Index and seeks to closely track the price performance and dividend yield of the Index.
WEBs(SM): WEBs, an acronym for “World Equity Benchmark Shares,” are based on 17 country-specific Morgan Stanley Capital International Indexes. They are issued by the WEBs Index Fund, Inc., an open-end management investment company that seeks to generally correspond to the price and yield performance of a specific Morgan Stanley Capital International Index.
Investment of Uninvested Cash Balances. Each portfolio, may have cash balances that have not been invested in portfolio securities (“Uninvested Cash”). Uninvested Cash may result from a variety of sources, including dividends or interest received from portfolio securities, unsettled securities transactions, reserves held for investment strategy purposes, scheduled maturity of investments, liquidation of investment securities to meet anticipated redemptions and dividend payments, and new cash received from investors. Uninvested Cash may be invested directly in money market instruments or other short-term debt obligations. Pursuant to an Exemptive Order issued by the SEC, each Portfolio (except DWS Money Market Portfolio) may use Uninvested Cash to purchase shares of affiliated funds including money market funds, short-term bond funds and Cash Management QP Trust or one or more future entities for which DeIM acts as trustee or investment advisor that operate as cash management investment vehicles and that are excluded from the definition of investment company pursuant to Section 3©(1) or 3©(7) of the 1940 Act (collectively, the “Central Funds”) in excess of the limitations of Section 12(d)(1) of the 1940 Act. Investment by each Portfolio in shares of the Central Funds will be in accordance with Portfolio’s investment policies and restrictions as set forth in its registration statement. Currently, DWS Money Market Portfolio does not intend to investing in the Central Fund.
Certain of the Central Funds comply with Rule 2a-7 under the Act. The other Central Funds are or will be short-term bond funds that invest in fixed-income securities and maintain a dollar-weighted average maturity of three years or less. Each of the Central Funds will be managed specifically to maintain a highly liquid portfolio, and access to them will enhance each Portfolio’s ability to manage Uninvested Cash.
Each portfolio will invest Uninvested Cash in Central Funds only to the extent that each Portfolio’s aggregate investment in the Central Funds does not exceed 25% of its total assets (except DWS Fixed Income Portfolio cannot exceed 20% of its total assets) in shares of the Central Funds. Purchase and sales of shares of Central Funds are made at net asset value.
Lending of Portfolio Securities. Certain Portfolios may lend its investment securities to approved institutional borrowers who need to borrow securities in order to complete certain transactions, such as covering short sales, avoiding failures to deliver securities or completing arbitrage operations. By lending its investment securities, a portfolio attempts to increase its net investment income through the receipt of interest on the loan. Any gain or loss in the market price of the securities loaned that might occur during the term of the loan would belong to the portfolio. A portfolio may lend its investment securities so long as the terms, structure and the aggregate amount of such loans are not inconsistent with the 1940 Act or the rules and regulations or interpretations of the SEC thereunder, which currently require that (a) the borrower pledge and maintain with the portfolio collateral consisting of liquid, unencumbered assets having a value at all times not less than 100% of the value of the securities loaned, (b) the borrower add to such collateral whenever the price of the securities loaned rises (i.e., the borrower “marks to the market” on a daily basis), © the loan be made subject to termination by a portfolio at any time, and (d) a portfolio receives reasonable interest on the loan (which may include the portfolio investing any cash collateral in interest bearing short-term investments), and distributions on the loaned securities and any increase in their market value. There may be risks of delay in recovery of the securities or even loss of rights in the collateral should the borrower of the securities fail financially. However, loans will be made only to
51
borrowers selected by a portfolio’s delegate after a commercially reasonable review of relevant facts and circumstances, including the creditworthiness of the borrower.
At the present time, the staff of the SEC does not object if an investment company pays reasonable negotiated fees in connection with loaned securities, so long as such fees are set forth in a written contract and approved by the investment company’s Board of Trustees. In addition, voting rights may pass with the loaned securities, but if a material event occurs affecting an investment on loan, the loan must be called and the securities voted. Pursuant to an exemptive order granted by the SEC, cash collateral received by a Portfolio may be invested in a money market fund managed by the Advisor (or one of its affiliates).
Privatized Enterprises. Investments in foreign securities may include securities issued by enterprises that have undergone or are currently undergoing privatization. The governments of certain foreign countries have, to varying degrees, embarked on privatization programs contemplating the sale of all or part of their interests in state enterprises. A Portfolio’s investments in the securities of privatized enterprises may include privately negotiated investments in a government or state-owned or controlled company or enterprise that has not yet conducted an initial equity offering, investments in the initial offering of equity securities of a state enterprise or former state enterprise and investments in the securities of a state enterprise following its initial equity offering.
In certain jurisdictions, the ability of foreign entities, such as a Portfolio, to participate in privatizations may be limited by local law, or the price or terms on which a Portfolio may be able to participate may be less advantageous than for local investors. Moreover, there can be no assurance that governments that have embarked on privatization programs will continue to divest their ownership of state enterprises, that proposed privatizations will be successful or that governments will not re-nationalize enterprises that have been privatized.
In the case of the enterprises in which a Portfolio may invest, large blocks of the stock of those enterprises may be held by a small group of stockholders, even after the initial equity offerings by those enterprises. The sale of some portion or all of those blocks could have an adverse effect on the price of the stock of any such enterprise.
Prior to making an initial equity offering, most state enterprises or former state enterprises go through an internal reorganization of management. Such reorganizations are made in an attempt to better enable these enterprises to compete in the private sector. However, certain reorganizations could result in a management team that does not function as well as an enterprise’s prior management and may have a negative effect on such enterprise. In addition, the privatization of an enterprise by its government may occur over a number of years, with the government continuing to hold a controlling position in the enterprise even after the initial equity offering for the enterprise.
Prior to privatization, most of the state enterprises in which a Portfolio may invest enjoy the protection of and receive preferential treatment from the respective sovereigns that own or control them. After making an initial equity offering, these enterprises may no longer have such protection or receive such preferential treatment and may become subject to market competition from which they were previously protected. Some of these enterprises may not be able to operate effectively in a competitive market and may suffer losses or experience bankruptcy due to such competition.
Real Estate Investment Trusts (REITs). Certain Portfolios may invest in REITs. REITs are sometimes informally characterized as equity REITs, mortgage REITs and hybrid REITs. Investment in REITs may subject the Portfolio to risks associated with the direct ownership of real estate, such as decreases in real estate values, overbuilding, increased competition and other risks related to local or general economic conditions, increases in operating costs and property taxes, changes in zoning laws, casualty or condemnation losses, possible environmental liabilities, regulatory limitations on rent and fluctuations in rental income. Equity REITs generally experience these risks directly through fee or leasehold interests, whereas mortgage REITs generally experience these risks indirectly through mortgage interests, unless the mortgage REIT forecloses on the underlying real estate. Changes in interest rates may also affect the value of the Portfolio’s investment in REITs. For instance, during periods of declining interest rates, certain mortgage REITs may hold mortgages that the mortgagors elect to prepay, which prepayment may diminish the yield on securities issued by those REITs.
52
Certain REITs have relatively small market capitalization, which may tend to increase the volatility of the market price of their securities. Furthermore, REITs are dependent upon specialized management skills, have limited diversification and are, therefore, subject to risks inherent in operating and financing a limited number of projects. REITs are also subject to heavy cash flow dependency, defaults by borrowers and the possibility of failing to qualify for tax-free pass-through of income under the Code and to maintain exemption from the registration requirements of the 1940 Act. By investing in REITs indirectly through the Portfolio, a shareholder will bear not only his or her proportionate share of the expenses of the Portfolio, but also, indirectly, similar expenses of the REITs. In addition, REITs depend generally on their ability to generate cash flow to make distributions to shareholders.
Repurchase Agreements. Each Portfolio may invest in repurchase agreements pursuant to its investment guidelines. In a repurchase agreement, the Portfolio acquires ownership of a security and simultaneously commits to resell that security to the seller, typically a bank or broker/dealer.
A repurchase agreement provides a means for a Portfolio to earn income on funds for periods as short as overnight. It is an arrangement under which the purchaser (i.e., the Portfolio) acquires a security (“Obligation”) and the seller agrees, at the time of sale, to repurchase the Obligation at a specified time and price. Securities subject to a repurchase agreement are held in a segregated account and, as described in more detail below, the value of such securities is kept at least equal to the repurchase price on a daily basis. The repurchase price may be higher than the purchase price, the difference being income to a Portfolio, or the purchase and repurchase prices may be the same, with interest at a stated rate due to a Portfolio together with the repurchase price upon repurchase. In either case, the income to a Portfolio is unrelated to the interest rate on the Obligation itself. Obligations will be held by the custodian or in the Federal Reserve Book Entry System.
It is not clear whether a court would consider the Obligation purchased by a Portfolio subject to a repurchase agreement as being owned by a Portfolio or as being collateral for a loan by a Portfolio to the seller. In the event of the commencement of bankruptcy or insolvency proceedings with respect to the seller of the Obligation before repurchase of the Obligation under a repurchase agreement, a Portfolio may encounter delay and incur costs before being able to sell the security. Delays may involve loss of interest or decline in price of the Obligation. If the court characterizes the transaction as a loan and a Portfolio has not perfected a security interest in the Obligation, a Portfolio may be required to return the Obligation to the seller’s estate and be treated as an unsecured creditor of the seller. As an unsecured creditor, a Portfolio would be at risk of losing some or all of the principal and income involved in the transaction. As with any unsecured debt Obligation purchased for a Portfolio, the Advisor or Sub Advisor seeks to reduce the risk of loss through repurchase agreements by analyzing the creditworthiness of the obligor, in this case the seller of the Obligation. Apart from the risk of bankruptcy or insolvency proceedings, there is also the risk that the seller may fail to repurchase the Obligation, in which case a Portfolio may incur a loss if the proceeds to a Portfolio of the sale to a third party are less than the repurchase price. However, if the market value (including interest) of the Obligation subject to the repurchase agreement becomes less than the repurchase price (including interest), a Portfolio will direct the seller of the Obligation to deliver additional securities so that the market value (including interest) of all securities subject to the repurchase agreement will equal or exceed the repurchase price.
Reverse Repurchase Agreements. Each Portfolio (except DWS Money Market VIP) may enter into “reverse repurchase agreements,” which are repurchase agreements in which a Portfolio, as the seller of the securities, agrees to repurchase such securities at an agreed time and price. Each Portfolio maintains a segregated account in connection with outstanding reverse repurchase agreements. A Portfolio will enter into reverse repurchase agreements only when the Advisor or subadvisor believes that the interest income to be earned from the investment of the proceeds of the transaction will be greater than the interest expense of the transaction. Such transactions may increase fluctuations in the market value of Portfolio assets and its yield.
Variable Rate Securities. DWS Money Market VIP may invest in Variable Rate Securities, instruments having rates of interest that are adjusted periodically or that “float” continuously according to formulae intended to minimize fluctuation in values of the instruments. The interest rate of Variable Rate Securities ordinarily is determined by reference to or is a percentage of an objective standard such as a bank’s prime rate, the 90-day US Treasury Bill rate, or the rate of return on commercial paper or bank certificates of deposit. Generally, the changes in the interest rate on Variable Rate Securities reduce the fluctuation in the market value of such securities. Accordingly, as interest rates decrease or increase, the
53
potential for capital appreciation or depreciation is less than for fixed-rate obligations. Some Variable Rate Demand Securities (“Variable Rate Demand Securities”) have a demand feature entitling the purchaser to resell the securities at an amount approximately equal to amortized cost or the principal amount thereof plus accrued interest. As is the case for other Variable Rate Securities, the interest rate on Variable Rate Demand Securities varies according to some objective standard intended to minimize fluctuation in the values of the instruments. The Portfolio determines the maturity of Variable Rate Securities in accordance with Rule 2a-7, which allows the Portfolio to consider certain of such instruments as having maturities shorter than the maturity date on the face of the instrument.
Strategic Transactions and Derivatives (all underlying DWS Variable Series I & II portfolios except DWS Capital Growth VIP and DWS International VIP).
A Portfolio may, but is not required to, utilize various other investment strategies as described below for a variety of purposes, such as hedging various market risks, managing the effective maturity or duration of fixed-income securities in a portfolio, or enhancing potential gain. These strategies may be executed through the use of derivative contracts.
In the course of pursuing these investment strategies, a Portfolio may purchase and sell exchange-listed and over-the-counter put and call options on securities, equity and fixed-income indices and other instruments, purchase and sell futures contracts and options thereon, enter into various transactions such as swaps, caps, floors, collars, currency forward contracts, currency futures contracts, currency swaps or options on currencies, or currency futures and various other currency transactions (collectively, all the above are called “Strategic Transactions”). In addition, Strategic Transactions may also include new techniques, instruments or strategies that are permitted as regulatory changes occur. Strategic Transactions may be used without limit (subject to certain limitations imposed by the 1940 Act) to attempt to protect against possible changes in the market value of securities held in or to be purchased for a Portfolio’s portfolio resulting from securities markets or currency exchange rate fluctuations, to protect a Portfolio’s unrealized gains in the value of its portfolio securities, to facilitate the sale of such securities for investment purposes, to manage the effective maturity or duration of fixed-income securities in a portfolio, or to establish a position in the derivatives markets as a substitute for purchasing or selling particular securities. Some Strategic Transactions may also be used to enhance potential gain although no more than 5% of a Portfolio’s (10% for DWS Bond VIP) assets will be committed to Strategic Transactions entered into for non-hedging purposes. Any or all of these investment techniques may be used at any time and in any combination, and there is no particular strategy that dictates the use of one technique rather than another, as use of any Strategic Transaction is a function of numerous variables including market conditions. The ability of a Portfolio to utilize these Strategic Transactions successfully will depend on the Advisor’s ability to predict pertinent market movements, which cannot be assured. A Portfolio will comply with applicable regulatory requirements when implementing these strategies, techniques and instruments. Strategic Transactions will not be used to alter fundamental investment purposes and characteristics of a Portfolio, and each Fund will segregate assets (or as provided by applicable regulations, enter into certain offsetting positions) to cover its obligations under options, futures and swaps to limit leveraging of a Portfolio.
Strategic Transactions, including derivative contracts, have risks associated with them including possible default by the other party to the transaction, illiquidity and, to the extent the Advisor’s view as to certain market movements is incorrect, the risk that the use of such Strategic Transactions could result in losses greater than if they had not been used. Use of put and call options may result in losses to a Portfolio, force the sale or purchase of portfolio securities at inopportune times or for prices higher than (in the case of put options) or lower than (in the case of call options) current market values, limit the amount of appreciation a Portfolio can realize on its investments or cause a Portfolio to hold a security it might otherwise sell. The use of currency transactions can result in a Portfolio incurring losses as a result of a number of factors including the imposition of exchange controls, suspension of settlements, or the inability to deliver or receive a specified currency. The use of options and futures transactions entails certain other risks. In particular, the variable degree of correlation between price movements of futures contracts and price movements in the related portfolio position of a Portfolio creates the possibility that losses on the hedging instrument may be greater than gains in the value of a Portfolio’s position. In addition, futures and options markets may not be liquid in all circumstances and certain over-the-counter options may have no markets. As a result, in certain markets, a Portfolio might not be able to close out a transaction without incurring substantial losses, if at all. Although the use of futures and options transactions for hedging should tend to minimize the risk of loss due to a decline in the value of the hedged position, at the same time they tend to limit any potential gain which might result from an increase in value of such position. Finally, the daily variation margin requirements for futures contracts would create a greater ongoing potential financial risk than would purchases of
54
options, where the exposure is limited to the cost of the initial premium. Losses resulting from the use of Strategic Transactions would reduce net asset value, and possibly income, and such losses can be greater than if the Strategic Transactions had not been utilized.
General Characteristics of Options. Put options and call options typically have similar structural characteristics and operational mechanics regardless of the underlying instrument on which they are purchased or sold. Thus, the following general discussion relates to each of the particular types of options discussed in greater detail below. In addition, many Strategic Transactions involving options require segregation of Portfolio assets in special accounts, as described below under “Use of Segregated and Other Special Accounts.”
A put option gives the purchaser of the option, upon payment of a premium, the right to sell, and the writer the obligation to buy, the underlying security, commodity, index, currency or other instrument at the exercise price. For instance, a Portfolio’s purchase of a put option on a security might be designed to protect its holdings in the underlying instrument (or, in some cases, a similar instrument) against a substantial decline in the market value by giving a Portfolio the right to sell such instrument at the option exercise price. A call option, upon payment of a premium, gives the purchaser of the option the right to buy, and the seller the obligation to sell, the underlying instrument at the exercise price. A Portfolio’s purchase of a call option on a security, financial future, index, currency or other instrument might be intended to protect a Portfolio against an increase in the price of the underlying instrument that it intends to purchase in the future by fixing the price at which it may purchase such instrument. An American style put or call option may be exercised at any time during the option period while a European style put or call option may be exercised only upon expiration or during a fixed period prior thereto. A Portfolio is authorized to purchase and sell exchange listed options and over-the-counter options (“OTC options”). Exchange listed options are issued by a regulated intermediary such as the Options Clearing Corporation (“OCC”), which guarantees the performance of the obligations of the parties to such options. The discussion below uses the OCC as an example, but is also applicable to other financial intermediaries.
With certain exceptions, OCC issued and exchange listed options generally settle by physical delivery of the underlying security or currency, although in the future cash settlement may become available. Index options and Eurodollar instruments are cash settled for the net amount, if any, by which the option is “in-the-money” (i.e., where the value of the underlying instrument exceeds, in the case of a call option, or is less than, in the case of a put option, the exercise price of the option) at the time the option is exercised. Frequently, rather than taking or making delivery of the underlying instrument through the process of exercising the option, listed options are closed by entering into offsetting purchase or sale transactions that do not result in ownership of the new option.
A Portfolio’s ability to close out its position as a purchaser or seller of an OCC or exchange listed put or call option is dependent, in part, upon the liquidity of the option market. Among the possible reasons for the absence of a liquid option market on an exchange are: (i) insufficient trading interest in certain options; (ii) restrictions on transactions imposed by an exchange; (iii) trading halts, suspensions or other restrictions imposed with respect to particular classes or series of options or underlying securities including reaching daily price limits; (iv) interruption of the normal operations of the OCC or an exchange; (v) inadequacy of the facilities of an exchange or OCC to handle current trading volume; or (vi) a decision by one or more exchanges to discontinue the trading of options (or a particular class or series of options), in which event the relevant market for that option on that exchange would cease to exist, although outstanding options on that exchange would generally continue to be exercisable in accordance with their terms.
The hours of trading for listed options may not coincide with the hours during which the underlying financial instruments are traded. To the extent that the option markets close before the markets for the underlying financial instruments, significant price and rate movements can take place in the underlying markets that cannot be reflected in the option markets.
OTC options are purchased from or sold to securities dealers, financial institutions or other parties (“Counterparties”) through direct bilateral agreement with the Counterparty. In contrast to exchange listed options, which generally have standardized terms and performance mechanics, all the terms of an OTC option, including such terms as method of settlement, term, exercise price, premium, guarantees and security, are set by negotiation of the parties. A Portfolio will only sell OTC options (other than OTC currency options) that are subject to a buy-back provision permitting a Portfolio
55
to require the Counterparty to sell the option back to a Portfolio at a formula price within seven days. A Portfolio expects generally to enter into OTC options that have cash settlement provisions, although it is not required to do so.
Unless the parties provide for it, there is no central clearing or guaranty function in an OTC option. As a result, if the Counterparty fails to make or take delivery of the security, currency or other instrument underlying an OTC option it has entered into with a Portfolio or fails to make a cash settlement payment due in accordance with the terms of that option, a Portfolio will lose any premium it paid for the option as well as any anticipated benefit of the transaction. Accordingly, the Advisor must assess the creditworthiness of each such Counterparty or any guarantor or credit enhancement of the Counterparty’s credit to determine the likelihood that the terms of the OTC option will be satisfied. A Portfolio will engage in OTC option transactions only with US Government securities dealers recognized by the Federal Reserve Bank of New York as “primary dealers” or broker/dealers, domestic or foreign banks or other financial institutions which have received (or the guarantors of the obligation of which have received) a short-term credit rating of A-1 from Standard & Poor’s Ratings Services (“S&P”) or P-1 from Moody’s Investors Service (“Moody’s”) or an equivalent rating from any nationally recognized statistical rating organization (“NRSRO”) or, in the case of OTC currency transactions, are determined to be of equivalent credit quality by the Advisor. The staff of the Securities and Exchange Commission (the “SEC”) currently takes the position that OTC options purchased by a Portfolio, and portfolio securities “covering” the amount of a Portfolio’s obligation pursuant to an OTC option sold by it (the cost of the sell-back plus the in-the-money amount, if any) are illiquid, and are subject to a Portfolio’s limitation on investing no more than 15% of its net assets in illiquid securities.
If a Portfolio sells a call option, the premium that it receives may serve as a partial hedge, to the extent of the option premium, against a decrease in the value of the underlying securities or instruments in its portfolio or will increase a Portfolio’s income. The sale of put options can also provide income.
A Portfolio may purchase and sell call options on securities including US Treasury and agency securities, mortgage-backed securities, foreign sovereign debt, corporate debt securities, equity securities (including convertible securities) and Eurodollar instruments that are traded on US and foreign securities exchanges and in the over-the-counter markets, and on securities indices, currencies and futures contracts. All calls sold by a Portfolio must be “covered” (i.e., a Portfolio must own the securities or futures contract subject to the call) or must meet the asset segregation requirements described below as long as the call is outstanding. Even though a Portfolio will receive the option premium to help protect it against loss, a call sold by a Portfolio exposes a Portfolio during the term of the option to possible loss of opportunity to realize appreciation in the market price of the underlying security or instrument and may require a Portfolio to hold a security or instrument which it might otherwise have sold.
A Portfolio may purchase and sell put options on securities including US Treasury and agency securities, mortgage-backed securities, foreign sovereign debt, corporate debt securities, equity securities (including convertible securities) and Eurodollar instruments (whether or not it holds the above securities in its portfolio), and on securities indices, currencies and futures contracts other than futures on individual corporate debt and individual equity securities. A Portfolio will not sell put options if, as a result, more than 50% of a Portfolio’s total assets would be required to be segregated to cover its potential obligations under such put options other than those with respect to futures and options thereon. In selling put options, there is a risk that a Portfolio may be required to buy the underlying security at a disadvantageous price above the market price.
General Characteristics of Futures. A Portfolio may enter into futures contracts or purchase or sell put and call options on such futures as a hedge against anticipated interest rate, currency or equity market changes, and for duration management, risk management and return enhancement purposes. Futures are generally bought and sold on the commodities exchanges where they are listed with payment of initial and variation margin as described below. The sale of a futures contract creates a firm obligation by a Portfolio, as seller, to deliver to the buyer the specific type of financial instrument called for in the contract at a specific future time for a specified price (or, with respect to index futures and Eurodollar instruments, the net cash amount). Options on futures contracts are similar to options on securities except that an option on a futures contract gives the purchaser the right in return for the premium paid to assume a position in a futures contract and obligates the seller to deliver such position.
56
The portfolios have claimed exclusion from the definition of the term “commodity pool operator” adopted by the CFTC and the National Futures Association, which regulate trading in the futures markets. Therefore, the Portfolios are not subject to commodity pool operator registration and regulation under the Commodity Exchange Act.
Futures and options on futures may be entered into for bona fide hedging, risk management (including duration management) or other portfolio and return enhancement management purposes to the extent consistent with the exclusion from commodity pool operator registration. Typically, maintaining a futures contract or selling an option thereon requires a Portfolio to deposit with a financial intermediary as security for its obligations an amount of cash or other specified assets (initial margin) which initially is typically 1% to 10% of the face amount of the contract (but may be higher in some circumstances). Additional cash or assets (variation margin) may be required to be deposited thereafter on a daily basis as the mark to market value of the contract fluctuates. The purchase of an option on financial futures involves payment of a premium for the option without any further obligation on the part of a Portfolio. If a Portfolio exercises an option on a futures contract it will be obligated to post initial margin (and potential subsequent variation margin) for the resulting futures position just as it would for any position. Futures contracts and options thereon are generally settled by entering into an offsetting transaction but there can be no assurance that the position can be offset prior to settlement at an advantageous price, nor that delivery will occur.
Each portfolio will not enter into a futures contract or related option (except for closing transactions) if, immediately thereafter, the sum of the amount of its initial margin and premiums on open futures contracts and options thereon would exceed 5% of a portfolio’s total assets (taken at current value); however, in the case of an option that is in-the-money at the time of the purchase, the in-the-money amount may be excluded in calculating the 5% limitation. The segregation requirements with respect to futures contracts and options thereon are described below.
Options on Securities Indices and Other Financial Indices. A Portfolio also may purchase and sell call and put options on securities indices and other financial indices and in so doing can achieve many of the same objectives it would achieve through the sale or purchase of options on individual securities or other instruments. Options on securities indices and other financial indices are similar to options on a security or other instrument except that, rather than settling by physical delivery of the underlying instrument, they settle by cash settlement, i.e., an option on an index gives the holder the right to receive, upon exercise of the option, an amount of cash if the closing level of the index upon which the option is based exceeds, in the case of a call, or is less than, in the case of a put, the exercise price of the option (except if, in the case of an OTC option, physical delivery is specified). This amount of cash is equal to the excess of the closing price of the index over the exercise price of the option, which also may be multiplied by a formula value. The seller of the option is obligated, in return for the premium received, to make delivery of this amount. The gain or loss on an option on an index depends on price movements in the instruments making up the market, market segment, industry or other composite on which the underlying index is based, rather than price movements in individual securities, as is the case with respect to options on securities.
Currency Transactions. A Portfolio may engage in currency transactions with Counterparties primarily in order to hedge, or manage the risk of the value of portfolio holdings denominated in particular currencies against fluctuations in relative value. Currency transactions include forward currency contracts, exchange listed currency futures, exchange listed and OTC options on currencies, and currency swaps. A forward currency contract involves a privately negotiated obligation to purchase or sell (with delivery generally required) a specific currency at a future date, which may be any fixed number of days from the date of the contract agreed upon by the parties, at a price set at the time of the contract. A currency swap is an agreement to exchange cash flows based on the notional difference among two or more currencies and operates similarly to an interest rate swap, which is described below. A Portfolio may enter into currency transactions with Counterparties which have received (or the guarantors of the obligations which have received) a credit rating of A-1 or P-1 by S&P or Moody’s, respectively, or that have an equivalent rating from a NRSRO or (except for OTC currency options) are determined to be of equivalent credit quality by the Advisor.
A Portfolio’s dealings in forward currency contracts and other currency transactions such as futures, options, options on futures and swaps generally will be limited to hedging involving either specific transactions or portfolio positions except as described below. Transaction hedging is entering into a currency transaction with respect to specific assets or liabilities of a Portfolio, which will generally arise in connection with the purchase or sale of its portfolio securities or the
57
receipt of income therefrom. Position hedging is entering into a currency transaction with respect to portfolio security positions denominated in, exposed to or generally quoted in that currency.
A Portfolio generally will not enter into a transaction to hedge currency exposure to an extent greater, after netting all transactions intended wholly or partially to offset other transactions, than the aggregate market value (at the time of entering into the transaction) of the securities held in its portfolio that are denominated in, exposed to or generally quoted in or currently convertible into such currency, other than with respect to proxy hedging or cross hedging as described below.
A Portfolio may also cross-hedge currencies by entering into transactions to purchase or sell one or more currencies that are expected to decline in value relative to other currencies to which a Portfolio has or in which a Portfolio expects to have portfolio exposure.
To reduce the effect of currency fluctuations on the value of existing or anticipated holdings of portfolio securities, a Portfolio may also engage in proxy hedging. Proxy hedging is often used when the currency to which a Portfolio’s portfolio is exposed is difficult to hedge or to hedge against the dollar. Proxy hedging entails entering into a commitment or option to sell a currency whose changes in value are generally considered to be correlated to a currency or currencies in which some or all of a Portfolio’s portfolio securities are or are expected to be denominated, in exchange for US dollars. The amount of the commitment or option would not exceed the value of a Portfolio’s securities denominated in correlated currencies. Currency hedging involves some of the same risks and considerations as other transactions with similar instruments. Currency transactions can result in losses to a Portfolio if the currency being hedged fluctuates in value to a degree or in a direction that is not anticipated. Further, there is the risk that the perceived correlation between various currencies may not be present or may not be present during the particular time that a Portfolio is engaging in proxy hedging. If a Portfolio enters into a currency hedging transaction, a Portfolio will comply with the asset segregation requirements described below.
Risks of Currency Transactions. Currency transactions are subject to risks different from those of other portfolio transactions. Because currency control is of great importance to the issuing governments and influences economic planning and policy, purchases and sales of currency and related instruments can be negatively affected by government exchange controls, blockages, and manipulations or exchange restrictions imposed by governments. These can result in losses to a Portfolio if it is unable to deliver or receive currency or funds in settlement of obligations and could also cause hedges it has entered into to be rendered useless, resulting in full currency exposure as well as incurring transaction costs. Buyers and sellers of currency futures are subject to the same risks that apply to the use of futures generally. Further, settlement of a currency futures contract for the purchase of most currencies must occur at a bank based in the issuing nation. Trading options on currency futures is relatively new, and the ability to establish and close out positions on such options is subject to the maintenance of a liquid market which may not always be available. Currency exchange rates may fluctuate based on factors extrinsic to that country’s economy.
Combined Transactions. A Portfolio may enter into multiple transactions, including multiple options transactions, multiple futures transactions, multiple currency transactions (including forward currency contracts) and multiple interest rate transactions and any combination of futures, options, currency and interest rate transactions (“component” transactions), instead of a single Strategic Transaction, as part of a single or combined strategy when, in the opinion of the Advisor, it is in the best interests of a Portfolio to do so. A combined transaction will usually contain elements of risk that are present in each of its component transactions. Although combined transactions are normally entered into based on the Advisor’s judgment that the combined strategies will reduce risk or otherwise more effectively achieve the desired portfolio management goal, it is possible that the combination will instead increase such risks or hinder achievement of the portfolio management objective.
Swaps, Caps, Floors and Collars. Among the Strategic Transactions into which a Portfolio may enter are interest rate, currency, index and other swaps and the purchase or sale of related caps, floors and collars. A Portfolio expects to enter into these transactions primarily to preserve a return or spread on a particular investment or portion of its portfolio, to protect against currency fluctuations, as a duration management technique or to protect against any increase in the price of securities a Portfolio anticipates purchasing at a later date. A Portfolio will not sell interest rate caps or floors where it does not own securities or other instruments providing the income stream a Portfolio may be obligated to pay. Interest
58
rate swaps involve the exchange by a Portfolio with another party of their respective commitments to pay or receive interest, e.g., an exchange of floating rate payments for fixed rate payments with respect to a notional amount of principal. A currency swap is an agreement to exchange cash flows on a notional amount of two or more currencies based on the relative value differential among them and an index swap is an agreement to swap cash flows on a notional amount based on changes in the values of the reference indices. The purchase of a cap entitles the purchaser to receive payments on a notional principal amount from the party selling such cap to the extent that a specified index exceeds a predetermined interest rate or amount. The purchase of a floor entitles the purchaser to receive payments on a notional principal amount from the party selling such floor to the extent that a specified index falls below a predetermined interest rate or amount. A collar is a combination of a cap and a floor that preserves a certain return within a predetermined range of interest rates or values.
A Portfolio will usually enter into swaps on a net basis, i.e., the two payment streams are netted out in a cash settlement on the payment date or dates specified in the instrument, with a Portfolio receiving or paying, as the case may be, only the net amount of the two payments. Inasmuch as a Portfolio will segregate assets (or enter into offsetting positions) to cover its obligations under swaps, the Advisor and a Portfolio believe such obligations do not constitute senior securities under the 1940 Act and, accordingly, will not treat them as being subject to its borrowing restrictions. A Portfolio will not enter into any swap, cap, floor or collar transaction unless, at the time of entering into such transaction, the unsecured long-term debt of the Counterparty, combined with any credit enhancements, is rated at least A by S&P or Moody’s or has an equivalent rating from a NRSRO or is determined to be of equivalent credit quality by the Advisor. If there is a default by the Counterparty, a Portfolio may have contractual remedies pursuant to the agreements related to the transaction. The swap market has grown substantially in recent years with a large number of banks and investment banking firms acting both as principals and as agents utilizing standardized swap documentation. As a result, the swap market has become relatively liquid. Caps, floors and collars are more recent innovations for which standardized documentation has not yet been fully developed and, accordingly, they are less liquid than swaps.
A credit default swap is a contract between a buyer and a seller of protection against a pre-defined credit event. The buyer of protection pays the seller a fixed regular fee provided that no event of default on an underlying reference obligation has occurred. If an event of default occurs, the seller must pay the buyer the full notional value, or “par value”, of the reference obligation in exchange for the reference obligation. Credit default swaps are used as a means of “buying” credit protection, i.e., attempting to mitigate the risk of default or credit quality deterioration in some portion of a Portfolio’s holdings, or “selling” credit protection, i.e., attempting to gain exposure to an underlying issuer’s credit quality characteristics without directly investing in that issuer. Where a Portfolio is a seller of credit protection, it effectively adds leverage to its portfolio because, in addition to its total net assets, a Portfolio would be subject to investment exposure on the notional amount of the swap. The Portfolio will only sell credit protection with respect to securities in which it would be authorized to invest directly. The Portfolio currently considers credit default swaps to be illiquid and treats the market value of the contract as illiquid for purposes of determining compliance with a Portfolio’s restrictions on investing in illiquid securities.
If a Portfolio is a buyer of a credit default swap and no event of default occurs, the Portfolio will lose its investment and recover nothing. However, if the Portfolio is a buyer and an event of default occurs, the Portfolio will receive the full notional value of the reference obligation that may have little or no value. As a seller, a Portfolio receives a fixed rate of income through the term of the contract (typically between six months and three years), provided that there is no default event. If an event of default occurs, the seller must pay the buyer the full notional value of the reference obligation. Credit default swaps involve greater risks than if the Portfolio had invested in the reference obligation directly.
The Portfolio may use credit default swaps to gain exposure to particular issuers or particular markets through investments in portfolios of credit default swaps, such as Dow Jones CDX.NA.HY certificates. By investing in certificates representing interests in a basket of credit default swaps, the Fund is taking credit risk with respect to an entity or group of entities and providing credit protection to the swap counterparties. For example, the CDX EM is a tradable basket of 19 credit default swaps on country credits which seeks to replicate the returns on the indices of a broad group of emerging markets countries. The credits are a subset of the countries represented by the JPMorgan Emerging Markets Bond Index Global Diversified. By purchasing interests in CDX EM, the Portfolio is gaining emerging markets exposure through a single investment. Unlike other types of credit default swaps which are generally considered illiquid, credit default swap certificates generally can be sold within seven days and are not subject to the Portfolio’s restrictions on investing in illiquid securities.
59
No more than 5% of a Portfolio’s assets may be invested in credit default swaps for the purposes of buying credit protection. A Portfolio will only sell credit protection with respect to securities in which it would be authorized to invest directly. A Portfolio may also borrow up to 5% of that Portfolio’s net assets against called and tendered bonds in the Portfolio. For the risks associated with borrowing, please see the “Borrowing” subsection of the “Investment Restrictions” section of this Statement of Additional Information.
DWS Bond VIP may invest up to 15% of their total assets in credit default swaps for both hedging and non-hedging purposes. DWS Balanced VIP may invest up to 15% of its total assets in credit default swaps.
Swaps have special risks associated including possible default by the counterparty to the transaction, illiquidity and, where swaps are used for hedges, the risk that the use of a swap could result in losses greater than if the swap had not been employed. Whether the use of swap agreements will be successful in furthering its investment objective will depend on the Advisor’s ability to correctly predict whether certain types of investments are likely to produce greater returns than other investments. Certain swap agreements may be considered to be illiquid because they are two party contracts and because they may have terms of greater than seven days. Moreover, a Portfolio bears the risk of loss of the amount expected to be received under a swap agreement in the event of the default or bankruptcy of a swap agreement counterparty.
Eurodollar Instruments. A Portfolio may make investments in Eurodollar instruments. Eurodollar instruments are US dollar-denominated futures contracts or options thereon which are linked to the London Interbank Offered Rate (“LIBOR”), although foreign currency-denominated instruments are available from time to time. Eurodollar futures contracts enable purchasers to obtain a fixed rate for the lending of funds and sellers to obtain a fixed rate for borrowings. A Portfolio might use Eurodollar futures contracts and options thereon to hedge against changes in LIBOR, to which many interest rate swaps and fixed income instruments are linked.
Risks of Strategic Transactions Outside the US. When conducted outside the US, Strategic Transactions may not be regulated as rigorously as in the US, may not involve a clearing mechanism and related guarantees, and are subject to the risk of governmental actions affecting trading in, or the prices of, foreign securities, currencies and other instruments. The value of such positions also could be adversely affected by: (i) other complex foreign political, legal and economic factors, (ii) lesser availability than in the US of data on which to make trading decisions, (iii) delays in a Portfolio’s ability to act upon economic events occurring in foreign markets during non-business hours in the US, (iv) the imposition of different exercise and settlement terms and procedures and margin requirements than in the US, and (v) lower trading volume and liquidity.
Use of Segregated and Other Special Accounts. Many Strategic Transactions, in addition to other requirements, require that a Portfolio segregate cash or liquid assets with its custodian to the extent Fund obligations are not otherwise “covered” through ownership of the underlying security, financial instrument or currency. In general, either the full amount of any obligation by a Portfolio to pay or deliver securities or assets must be covered at all times by the securities, instruments or currency required to be delivered, or, subject to any regulatory restrictions, an amount of cash or liquid assets at least equal to the current amount of the obligation must be segregated with the custodian. The segregated assets cannot be sold or transferred unless equivalent assets are substituted in their place or it is no longer necessary to segregate them. For example, a call option written by a Portfolio will require a Portfolio to hold the securities subject to the call (or securities convertible into the needed securities without additional consideration) or to segregate cash or liquid assets sufficient to purchase and deliver the securities if the call is exercised. A call option sold by a Portfolio on an index will require a Portfolio to own portfolio securities which correlate with the index or to segregate cash or liquid assets equal to the excess of the index value over the exercise price on a current basis. A put option written by a Portfolio requires a Portfolio to segregate cash or liquid assets equal to the exercise price.
Except when a Portfolio enters into a forward contract for the purchase or sale of a security denominated in a particular currency, which requires no segregation, a currency contract which obligates a Portfolio to buy or sell currency will generally require a Portfolio to hold an amount of that currency or liquid assets denominated in that currency equal to a Portfolio’s obligations or to segregate cash or liquid assets equal to the amount of a Portfolio’s obligation.
60
OTC options entered into by a Portfolio, including those on securities, currency, financial instruments or indices and OCC issued and exchange listed index options, will generally provide for cash settlement. As a result, when a Portfolio sells these instruments it will only segregate an amount of cash or liquid assets equal to its accrued net obligations, as there is no requirement for payment or delivery of amounts in excess of the net amount. These amounts will equal 100% of the exercise price in the case of a non cash-settled put, the same as an OCC guaranteed listed option sold by a Portfolio, or the in-the-money amount plus any sell-back formula amount in the case of a cash-settled put or call. In addition, when a Portfolio sells a call option on an index at a time when the in-the-money amount exceeds the exercise price, a Portfolio will segregate, until the option expires or is closed out, cash or cash equivalents equal in value to such excess. OCC issued and exchange listed options sold by a Portfolio other than those above generally settle with physical delivery, or with an election of either physical delivery or cash settlement and a Portfolio will segregate an amount of cash or liquid assets equal to the full value of the option. OTC options settling with physical delivery, or with an election of either physical delivery or cash settlement will be treated the same as other options settling with physical delivery.
In the case of a futures contract or an option thereon, a Portfolio must deposit initial margin and possible daily variation margin in addition to segregating cash or liquid assets sufficient to meet its obligation to purchase or provide securities or currencies, or to pay the amount owed at the expiration of an index-based futures contract. Such liquid assets may consist of cash, cash equivalents, liquid debt or equity securities or other acceptable assets.
With respect to swaps, a Portfolio will accrue the net amount of the excess, if any, of its obligations over its entitlements with respect to each swap on a daily basis and will segregate an amount of cash or liquid assets having a value equal to the accrued excess. Caps, floors and collars require segregation of assets with a value equal to a Portfolio’s net obligation, if any.
Strategic Transactions may be covered by other means when consistent with applicable regulatory policies. A Portfolio may also enter into offsetting transactions so that its combined position, coupled with any segregated assets, equals its net outstanding obligation in related options and Strategic Transactions. For example, a Portfolio could purchase a put option if the strike price of that option is the same or higher than the strike price of a put option sold by a Portfolio. Moreover, instead of segregating cash or liquid assets if a Portfolio held a futures or forward contract, it could purchase a put option on the same futures or forward contract with a strike price as high or higher than the price of the contract held. Other Strategic Transactions may also be offset in combinations. If the offsetting transaction terminates at the time of or after the primary transaction no segregation is required, but if it terminates prior to such time, cash or liquid assets equal to any remaining obligation would need to be segregated.
Warrants. Each Portfolio may invest in warrants up to five percent of the value of its respective net assets. The holder of a warrant has the right, until the warrant expires, to purchase a given number of shares of a particular issuer at a specified price. Such investments can provide a greater potential for profit or loss than an equivalent investment in the underlying security. Prices of warrants do not necessarily move, however, in tandem with the prices of the underlying securities and are, therefore, considered speculative investments. Warrants pay no dividends and confer no rights other than a purchase option. Thus, if a warrant held by a Portfolio were not exercised by the date of its expiration, a Portfolio would lose the entire purchase price of the warrant.
Zero Coupon Government Securities. Subject to its investment objective and policies, a Portfolio may invest in zero coupon US Government securities. Zero coupon bonds are purchased at a discount from the face amount. The buyer receives only the right to receive a fixed payment on a certain date in the future and does not receive any periodic interest payments. These securities may include those created directly by the US Treasury and those created as collateralized obligations through various proprietary custodial, trust or other relationships. The effect of owning instruments which do not make current interest payments is that a fixed yield is earned not only on the original investment but also, in effect, on all discount accretion during the life of the obligations. This implicit reinvestment of earnings at the same rate eliminates the risk of being unable to reinvest distributions at a rate as high as the implicit yield on the zero coupon bond, but at the same time eliminates any opportunity to reinvest earnings at higher rates. For this reason, zero coupon bonds are subject to substantially greater price fluctuations during periods of changing market interest rates than those of comparable securities that pay interest currently, which fluctuation is greater as the period to maturity is longer. Zero coupon bonds created as collateralized obligations are similar to those created through the US Treasury, but the former investments do
61
not provide absolute certainty of maturity or of cash flows after prior classes of the collateralized obligations are retired. No Portfolio currently intends to invest more than 20% of its net assets in zero coupon US Government securities.
DWS RREEF Real Estate Securities VIP
Equity and Equity Equivalents. In addition to investing in common stocks, the Portfolio may invest in other equity securities and equity equivalents, including securities that permit the Portfolio to receive an equity interest in an issuer, the opportunity to acquire an equity interest in an issuer, or the opportunity to receive a return on its investment that permits the Portfolio to benefit from the growth over time in the equity of an issuer. Examples of equity securities and equity security equivalents include preferred stock, convertible preferred stock and convertible debt securities.
The Portfolio will limit its holdings of convertible debt securities to those that, at the time of purchase, are rated at least B- by the Standard & Poor’s division of The McGraw-Hill Companies, Inc. (“S&P”) or B3 by Moody’s Investors Service (“Moody’s”), or, if not rated by S&P and Moody’s, are of equivalent investment quality as determined by the subadvisor. The Portfolio’s investments in convertible debt securities and other high-yield/high-risk, nonconvertible debt securities rated below investment-grade will comprise no more than 20% of the Portfolio’s net assets. Debt securities rated below the four highest categories are not considered “investment-grade” obligations.
These securities have speculative characteristics and present more credit risk than investment-grade obligations. Equity equivalents also may include securities whose value or return is derived from the value or return of a different security.
Debt Securities. The Portfolio may invest in debt securities because the Portfolio has current income as a secondary investment objective. As a result, the Portfolio may invest in debt securities when the subadvisor believes such securities represent an attractive investment for the Portfolio. It is intended that the Portfolio may invest in debt securities for income or as a defensive strategy when the subadvisor believes adverse economic or market conditions exist.
The value of the debt securities in which the Portfolio may invest will fluctuate based upon changes in interest rates and the credit quality of the issuer. Debt securities that comprise part of the Portfolio’s fixed-income portfolio will be limited primarily to “investment-grade” obligations. However, the Portfolio may invest up to 5% of its assets in “high-yield/high-risk” securities. “Investment grade” means that at the time of purchase, such obligations are rated within the four highest categories by a nationally recognized statistical rating organization (for example, at least Baa by Moody’s or BBB by S&P), or, if not rated, are of equivalent investment quality as determined by the subadvisor. According to Moody’s, bonds rated Baa are medium-grade and possess some speculative characteristics. A BBB rating by S&P indicates S&P’s belief that a security exhibits a satisfactory degree of safety and capacity for repayment, but is more vulnerable to adverse economic conditions and changing circumstances.
“High-yield” securities, sometimes referred to as “junk bonds,” are higher risk, non-convertible debt obligations that are rated below investment-grade securities, or are unrated, but with similar credit quality.
There are no credit or maturity restrictions on the fixed-income securities in which the high-yield portion of the Portfolio’s portfolio may be invested. Debt securities rated lower than Baa by Moody’s or BBB by S&P or their equivalent are considered by many to be predominantly speculative. Changes in economic conditions or other circumstances are more likely to lead to a weakened capacity to make principal and interest payments on such securities than is the case with higher quality debt securities. Regardless of rating levels, all debt securities considered for purchase by the Portfolio are analyzed by the subadvisor to determine, to the extent reasonably possible, that the planned investment is sound, given the investment objectives of the Portfolio.
The Portfolio will not necessarily dispose of high-yield securities if the aggregate value of such securities exceeds 5% of the Portfolio’s assets, if such level is exceeded as a result of market appreciation of the value of such securities or market depreciation of the value of the other assets of the Portfolio. Rather, the subadvisor will cease purchasing any additional high-yield securities until the value of such securities is less than 5% of the Portfolio’s assets and will monitor such investments to determine whether continuing to hold such investments is likely to assist the Portfolio in meeting its investment objective.
62
In addition, the value of the Portfolio’s investments in fixed-income securities will change as prevailing interest rates change. In general, the prices of such securities vary inversely with interest rates. As prevailing interest rates fall, the prices of bonds and other securities that trade on a yield basis generally rise. When prevailing interest rates rise, bond prices generally fall. These changes in value may, depending upon the particular amount and type of fixed-income securities holdings of the Portfolio, impact the net asset value of the Portfolio’s shares.
Notwithstanding the fact that the Portfolio will invest primarily in equity securities, under adverse market or economic conditions, the Portfolio may temporarily invest all or a substantial portion of its assets in cash or investment-grade short-term securities. To the extent that the Portfolio assumes a defensive position, it will not be investing for long-term capital appreciation. When the Portfolio is invested for temporary defensive purposes, it may not pursue or achieve its investment objective.
Convertible Debt Securities. A convertible debt security is a fixed-income security that offers the potential for capital appreciation through a conversion feature that enables the holder to convert the fixed-income security into a stated number of shares of common stock. As fixed-income securities, convertible debt securities provide a stable stream of income with generally higher yields than common stocks. Because convertible debt securities offer the potential to benefit from increases in the market price of the underlying common stock, they generally offer lower yields than non-convertible securities of similar quality. Like all fixed-income securities, there can be no assurance of current income because the issuers of the convertible securities may default on their obligations. In addition, there can be no assurance of capital appreciation because the value of the underlying common stock will fluctuate.
Convertible debt securities generally are subordinated to other similar but non-convertible debt securities of the same issuer, although convertible bonds, as corporate debt obligations, enjoy seniority in right of payment to all equity securities. Because of the subordination feature, however, convertible securities typically have lower ratings than similar non-convertible securities.
Real Estate Investment Trusts. The Portfolio intends to invest at least 80% of its net assets, plus the amount of any borrowings for investment purposes (calculated at the time of any investment), in equity securities of real estate investment trusts and real estate companies. A company is considered to be a real estate company if, in the opinion of the subadvisor, at least 50% of its revenues or 50% of the market value of its assets at the time its securities are purchased by the Portfolio are attributed to the ownership, construction, management or sale of real estate.
A REIT invests primarily in income-producing real estate or makes loans to persons involved in the real estate industry. Some REITs, called equity REITs, buy real estate and pay investors income from the rents received from the real estate owned by the REIT and from any profits on the sale of its properties. Other REITs, called mortgage REITS, lend money to building developers and other real estate companies and pay investors income from the interest paid on those loans. There are also hybrid REITs which engage in both owning real estate and making loans.
Short Sales. The Portfolio may engage in short sales, if, at the time of the short sale, the Portfolio owns or has the right to acquire securities equivalent in kind and amount to the securities being sold short (i.e., a short sale “against the box”).
In a short sale, the seller does not immediately deliver the securities sold and is said to have a short position in those securities until delivery occurs. To make delivery to the purchaser, the executing broker borrows the securities being sold short on behalf of the seller. While the short position is maintained, the seller collateralizes its obligation to deliver the securities sold short in an amount equal to the proceeds of the short sale plus an additional margin amount established by the Board of Governors of the Federal Reserve. If the Portfolio engages in a short sale, the collateral account will be maintained by State Street Bank and Trust Company, the Portfolio’s custodian. While the short sale is open, the Portfolio will maintain, in a segregated custodial account, an amount of securities convertible into, or exchangeable for, such equivalent securities at no additional cost. These securities would constitute the Portfolio’s long position.
There will be certain additional transaction costs associated with short sales, but the Portfolio will endeavor to offset these costs with returns from the investment of the cash proceeds of short sales.
63
Derivative Securities. To the extent permitted by its investment objective and policies, the Portfolio may invest in securities that are commonly referred to as derivative securities. Generally, a derivative is a financial arrangement, the value of which is based on or derived from a traditional security, asset or market index. Certain derivative securities are described more accurately as index structured securities. Index structured securities are derivative securities whose value or performance is linked to other equity securities (such as depository receipts), interest rates, indices or other financial indicators (reference indices).
Some derivatives, such as mortgage-related and other asset-backed securities, are in many respects like any other investment, although they may be more volatile or less liquid than more traditional debt securities.
There are many different types of derivatives and many different ways to use them. Futures and options are commonly used for traditional hedging purposes to attempt to protect the Portfolio from exposure to changing interest rates, securities prices, and for cash management purposes as a low-cost method of gaining exposure to a particular securities market without investing directly in those securities.
The Portfolio may not invest in a derivative security if it would be possible for the Portfolio to lose more money than it invested, or unless the reference index or the instrument to which it relates is an eligible investment for the Portfolio.
The return on a derivative security may increase or decrease, depending upon changes in the reference index or instrument to which it relates.
There is a range of risks associated with derivative investments, including:
| | • | | The risk that the underlying security, interest rate, market index or other financial asset will not move in the direction the subadvisor anticipates. |
| | • | | The possibility that there may be no liquid secondary market, or the possibility that price fluctuation limits may be imposed by the exchange on which the derivative is traded, either of which may make it difficult or impossible to close out a position when desired. |
| | • | | The risk that the other party will fail to perform its obligations. |
Other Investment Companies. The Portfolio may invest up to 10% of its total assets in other mutual funds, including those of the Advisor or subadvisor provided that the investment is consistent with the Portfolio’s investment policies and restrictions. Under the 1940 Act, the Portfolio’s investment in such securities, subject to certain exceptions, currently is limited to (a) 3% of the total voting stock of any one investment company; (b) 5% of the Portfolio’s total assets with respect to any one investment company; and © 10% of the Portfolio’s total assets in the aggregate. Such purchases will be made in the open market where no commission or profit to a sponsor or dealer results from the purchase other than the customary brokers’ commissions. As a shareholder of another investment company, the Portfolio would bear, along with other shareholders, its pro rata portion of the other investment company’s expenses, including advisory fees. These expenses would be in addition to the management fee than the Portfolio bears directly in connection with its own operations.
Repurchase Agreements. The Portfolio may invest in repurchase agreements when such transactions present an attractive short-term return on cash that is not otherwise committed to the purchase of securities pursuant to the investment policies of the Portfolio.
A repurchase agreement occurs when, at the time the Portfolio purchases an interest-bearing obligation, the seller (a bank or a broker-dealer registered under the Securities Exchange Act of 1934) agrees to purchase it on a specified date in the future at an agreed-upon price. The repurchase price reflects an agreed-upon interest rate during the time the Portfolio’s money is invested in the security.
Because the security purchased constitutes a security for the repurchase obligation, a repurchase agreement can be considered a loan collateralized by the security purchased. The Portfolio’s risk is the ability of the seller to pay the
64
agreed-upon repurchase price on the repurchase date. If the seller defaults, the Portfolio may incur costs in disposing of the collateral, which would reduce the amount realized thereon. If the seller seeks relief under the bankruptcy laws, the disposition of the collateral may be delayed or limited. To the extent the value of the security decreases, the Portfolio could experience a loss.
The Portfolio will limit repurchase agreement transactions to securities issued by the US government and its agencies and instrumentalities, and will enter into such transactions with those banks and securities dealers who are deemed creditworthy pursuant to criteria adopted by the Portfolio’s Board of Trustees or its designee.
The Portfolio will not invest more than 15% of its net assets in illiquid securities, including repurchase agreements maturing in more than seven days.
When-Issued and Forward Commitment Agreements. The Portfolio may sometimes purchase new issues of securities on a when-issued or forward commitment basis in which the transaction price and yield are each fixed at the time the commitment is made, but payment and delivery occur at a future date (typically 15 to 45 days later).
When purchasing securities on a when-issued or forward commitment basis, the Portfolio assumes the rights and risks of ownership, including the risks of price and yield fluctuations. Market rates of interest on debt securities at the time of delivery may be higher or lower than those contracted for on the when-issued security. Accordingly, the value of such a security may decline prior to delivery, which could result in a loss to the Portfolio. While the Portfolio will make commitments to purchase or sell securities with the intention of actually receiving or delivering them, it may sell the securities before the settlement date if doing so is deemed advisable as a matter of investment strategy. In purchasing securities on a when-issued or forward commitment basis, the Portfolio will establish and maintain a segregated account consisting of cash, cash equivalents or other appropriate liquid securities until the settlement date in an amount sufficient to meet the purchase price. When the time comes to pay for the when-issued securities, the Portfolio will meet its obligations with available cash, through the sale of securities, or, although it would not normally expect to do so, by selling the when-issued securities themselves (which may have a market value greater or less than the Portfolio’s payment obligation). Selling securities to meet when-issued or forward commitment obligations may generate taxable capital gains or losses.
Restricted and Illiquid Securities. The Portfolio may, from time to time, purchase securities that are subject to legal or contractual restrictions on resale (“restricted securities”) or illiquid securities, including Rule 144A securities, when they present attractive investment opportunities that otherwise meet the Portfolio’s criteria for investment. The Portfolio may invest up to 15% of its net assets in such securities. Rule 144A securities are securities that are privately placed with and traded among qualified institutional investors rather than the general public. Although Rule 144A securities are considered restricted securities, they are not necessarily illiquid.
With respect to securities eligible for resale under Rule 144A, the staff of the SEC has taken the position that the liquidity of such securities is a question of fact for the Board of Trustees of the Portfolio to determine, based upon a consideration of the readily available trading markets and the review of any contractual restrictions. Accordingly, the Board is responsible for developing and establishing the guidelines and procedures for determining the liquidity of Rule 144A securities. As allowed by Rule 144A, the Board has delegated the day-to-day function of determining the liquidity of Rule 144A securities to the subadvisor. The Board retains the responsibility to monitor the implementation of the guidelines and procedures it has adopted.
Because the secondary market for such securities is limited to certain qualified institutional investors, the liquidity of such securities may be limited accordingly and the Portfolio may, from time to time, hold a Rule 144A or other security that is illiquid. In such an event, the subadvisor will consider appropriate remedies to minimize the effect on the Portfolio’s liquidity.
Short-Term Securities. In order to meet anticipated redemptions, to hold pending the purchase of additional securities for the portfolio, or, in some cases, for temporary defensive purposes, the Portfolio may invest a portion of its assets in money market and other short-term securities. When the Portfolio is invested for temporary defensive purposes, it may not achieve or pursue its investment objectives.
65
Examples of short-term securities include:
| | • | | Securities issued or guaranteed by the US government and its agencies and instrumentalities; |
| | • | | Certificates of deposit and euro dollar certificates of deposit; |
| | • | | Short-term notes, bonds, debentures or other debt instruments; and |
The Portfolio may also invest up to 5% of its total assets in any money market fund, including those advised by the Advisor or subadvisor.
Futures and Options. The Portfolio may enter into futures contracts, options on futures contracts and options on securities and indices. Generally, futures transactions may be used to:
| | • | | Protect against a decline in market value of the Portfolio’s securities (taking a short futures position); |
| | • | | Protect against the risk of an increase in market value for securities in which the Portfolio generally invests at a time when the Portfolio is not fully invested (taking a long futures position); and |
| | • | | Provide a temporary substitute for the purchase of an individual security that may not be purchased in an orderly fashion. |
Some futures and options strategies, such as selling futures, buying puts and writing calls, hedge the Portfolio’s investments against price fluctuations. Other strategies, such as buying futures, writing puts and buying calls, tend to increase market exposure.
Although other techniques may be used to control the Portfolio’s exposure to market fluctuations, the use of futures contracts may be a more effective means of hedging this exposure. While the Portfolio pays brokerage commissions in connection with opening and closing out futures positions, these costs are lower than the transaction costs incurred in the purchase and sale of the underlying securities.
For example, the sale of a future by the Portfolio means the Portfolio becomes obligated to deliver the security (or securities, in the case of an index future) at a specified price on a specified date. The purchase of a future means the Portfolio becomes obligated to buy the security (or securities) at a specified price on a specified date. Futures contracts provide for the sale by one party and purchase by another party of a specific security at a specified future time and price. The subadvisor may engage in futures and options transactions based on securities indices that are consistent with the Portfolio’s investment objectives. An example of an index that may be used is the S&P 500® Index. The managers also may engage in futures and options transactions based on specific securities, such as US Treasury bonds or notes. Futures contracts are traded on national futures exchanges. Futures exchanges and trading are regulated under the Commodity Exchange Act by the Commodity Futures Trading Commission (the “CFTC”), a US government agency.
Index futures contracts differ from traditional futures contracts in that when delivery takes place, no stocks or bonds change hands. Instead, these contracts settle in cash at the spot market value of the index. Although other types of futures contracts by their terms call for actual delivery or acceptance of the underlying securities, in most cases the contracts are closed out before the settlement date. A futures position may be closed by taking an opposite position in an identical contract (i.e., buying a contract that has previously been sold or selling a contract that has previously been bought).
66
Unlike the situation in which the Portfolio purchases or sells an equity security, no price is paid or received by the Portfolio upon the purchase or sale of the future. Initially, the Portfolio will be required to deposit an amount of cash or securities equal to a varying specified percentage of the contract amount. This amount is known as initial margin. The margin deposit is intended to ensure completion of the contract (delivery or acceptance of the underlying security) if it is not terminated prior to the specified delivery date. A margin deposit does not constitute margin transactions for purposes of the Portfolio’s investment restrictions. Minimum initial margin requirements are established by the futures exchanges and may be revised. In addition, brokers may establish margin deposit requirements that are higher than the exchange minimums. Cash held in the margin account is not income producing. Subsequent payments to and from the broker, called variation margin, will be made on a daily basis as the price of the underlying securities or index fluctuates, making the future more or less valuable, a process known as marking the contract to market. Changes in variation margin are recorded by the Portfolio as unrealized gains or losses. At any time prior to expiration of the future, the Portfolio may elect to close the position by taking an opposite position that will operate to terminate its position in the future. A final determination of variation margin is then made, additional cash is required to be paid by or released to the Portfolio, and the Portfolio realizes a loss or gain.
Options on Securities. The Portfolio may purchase and write (sell) put and call options on securities. A call option gives the purchaser of the option the right to buy, and obligates the writer to sell, the underlying security at the exercise price at any time during the option period. Similarly, a put option gives the purchaser of the option the right to sell, and obligates the writer to buy, the underlying security at the exercise price at any time during the option period.
The Portfolio may write (sell) covered call and put options to a limited extent on its portfolio securities (“covered options”) in an attempt to increase income through the premiums it receives for writing the option(s). However, in return for the premium, the Portfolio may forgo the benefits of appreciation on securities sold or may pay more than the market price on securities acquired pursuant to call and put options written by the Portfolio. All options written by the Portfolio are “covered.”
A call option written by the Portfolio is “covered” if the Portfolio owns the underlying security covered by the call or has an absolute and immediate right to acquire that security without additional cash consideration (or for additional cash consideration held in a segregated account) upon conversion or exchange of other securities held in its portfolio. A call option is also covered if the Portfolio holds a call option on the same security and in the same principal amount as the written call option where the exercise price of the call option so held (a) is equal to or less than the exercise price of the written call option or (b) is greater than the exercise price of the written call option if the difference is segregated by the Portfolio in cash or liquid securities.
When the Portfolio writes a covered call option, it gives the purchaser of the option the right to buy the underlying security at the price specified in the option (the “exercise price”) by exercising the option at any time during the option period. If the option expires unexercised, the Portfolio will realize income in an amount equal to the premium received for writing the option. If the option is exercised, a decision over which the Portfolio has no control, the Portfolio must sell the underlying security to the option holder at the exercise price. By writing a covered call option, the Portfolio forgoes, in exchange for the premium less the commission (“net premium”), the opportunity to profit during the option period from an increase in the market value of the underlying security above the exercise price. In addition, the Portfolio may continue to hold a security which might otherwise have been sold to protect against depreciation in the market price of the security.
A put option written by the Portfolio is “covered” when, among other things, cash or liquid securities are placed in a segregated account to fulfill the obligations undertaken. When the Portfolio writes a covered put option, it gives the purchaser of the option the right to sell the underlying security to the Portfolio at the specified exercise price at any time during the option period. If the option expires unexercised, the Portfolio will realize income in the amount of the net premium received for writing the option. If the put option is exercised, a decision over which the Portfolio has no control, the Portfolio must purchase the underlying security from the option holder at the exercise price. By writing a covered put option, the Portfolio, in exchange for the net premium received, accepts the risk of a decline in the market value of the underlying security below the exercise price.
67
The Portfolio may terminate its obligation as the writer of a call or put option by purchasing an option with the same exercise price and expiration date as the option previously written. This transaction is called a “closing purchase transaction.” The Portfolio will realize a profit or loss on a closing purchase transaction if the amount paid to purchase an option is less or more, as the case may be, than the amount received from the sale thereof. To close out a position as a purchaser of an option, the Portfolio may enter into a “closing sale transaction” which involves liquidating the Portfolio’s position by selling the option previously purchased. Where the Portfolio cannot effect a closing purchase transaction, it may be forced to incur brokerage commissions or dealer spreads in selling securities it receives or it may be forced to hold underlying securities until an option is exercised or expires.
The current market value of a traded option is the last sale price or, in the absence of a sale, the mean between the closing bid and asked price. If an option expires on its stipulated expiration date or if the Portfolio enters into a closing purchase transaction, the Portfolio will realize a gain (or loss if the cost of a closing purchase transaction exceeds the premium received when the option was sold), and the deferred credit related to such option will be eliminated. If a call option is exercised, the Portfolio will realize a gain or loss from the sale of the underlying security and the proceeds of the sale will be increased by the premium originally received.
The Portfolio may also purchase call and put options on any securities in which they may invest. The Portfolio would normally purchase a call option in anticipation of an increase in the market value of such securities. The purchase of a call option would entitle the Portfolio, in exchange for the premium paid, to purchase a security at a specified price during the option period. The Portfolio would ordinarily have a gain if the value of the securities increased above the exercise price sufficiently to cover the premium and would have a loss if the value of the securities remained at or below the exercise price during the option period.
The Portfolio would normally purchase put options in anticipation of a decline in the market value of securities in its portfolio (“protective puts”) or securities of the type in which it is permitted to invest. The purchase of a put option would entitle the Portfolio, in exchange for the premium paid, to sell a security, which may or may not be held by the Portfolio at a specified price during the option period. The purchase of protective puts is designed merely to offset or hedge against a decline in the market value of the Portfolio. Put options also may be purchased by the Portfolio for the purpose of affirmatively benefiting from a decline in the price of securities that the Portfolio does not own. The Portfolio would ordinarily recognize a gain if the value of the securities decreased below the exercise price sufficiently to cover the premium and would recognize a loss if the value of the securities remained at or above the exercise price. Gains and losses on the purchase of protective put options would tend to be offset by countervailing changes in the value of underlying portfolio securities.
The hours of trading for options on securities may not conform to the hours during which the underlying securities are traded. To the extent that the option markets close before the markets for the underlying securities, significant price and rate movements can take place in the underlying securities markets that cannot be reflected in the option markets. It is impossible to predict the volume of trading that may exist in such options, and there can be no assurance that viable exchange markets will develop or continue.
The Portfolio may enter into closing transactions in order to offset an open option position prior to exercise or expiration by selling an option it has purchased or by entering into an offsetting option. If the Portfolio cannot effect closing transactions, it may have to retain a security in its portfolio it would otherwise sell or deliver a security it would otherwise retain. The Portfolio may also purchase and sell options traded on US exchanges and, to the extent permitted by law, options traded over-the-counter.
The Portfolio may also engage in options transactions in the over-the-counter (“OTC”) market with broker-dealers who make markets in these options. The Portfolio will engage in OTC options only with broker-dealers deemed by the subadvisor to be creditworthy. The ability to terminate OTC option positions is more limited than with exchange-traded option positions because the predominant market is the issuing broker rather than an exchange, and may involve the risk that broker-dealers participating in such transactions will not fulfill their obligations. To reduce this risk, the Portfolio will purchase such options only from a counter party approved for these purposes by the subadvisor. The subadvisor will monitor the creditworthiness of dealers with whom the Portfolio enters into such options transactions.
68
Options on Indices. The Portfolio may also purchase and write exchange-listed and OTC put and call options on securities indices. A securities index measures the movement of a certain group of securities by assigning relative values to the securities included in the index, fluctuating with changes in the market values of the securities included in the index. Some securities index options are based on a broad market index, such as the NYSE Composite Index, or a narrower market index such as the Standard & Poor’s 100. Indices may also be based on a particular industry or market segment.
Options on securities indices are similar to options on securities except that (1) the expiration cycles of securities index options are monthly, while those of securities options are currently quarterly, and (2) the delivery requirements are different. Instead of giving the right to take or make delivery of securities at a specified price, an option on a securities index gives the holder the right to receive a cash “exercise settlement amount” equal to (a) the amount, if any, by which the fixed exercise price of the option exceeds (in the case of a put) or is less than (in the case of a call) the closing value of the underlying index on the date of exercise, multiplied by (b) a fixed “index multiplier.” Receipt of this cash amount will depend upon the closing level of the securities index upon which the option is based being greater than, in the case of a call, or less than, in the case of a put, the exercise price of the index and the exercise price of the option times a specified multiple. The writer of the option is obligated, in return for the premium received, to make delivery of this amount. Securities index options may be offset by entering into closing transactions as described above for securities options.
As discussed in “Options on Securities,” the Portfolio would normally purchase a call option in anticipation of an increase in the market value of the relevant index. The purchase of a call option would entitle the Portfolio, in exchange for the premium paid, to receive upon exercise a cash payment based on the level of the index on the exercise date. The Portfolio would ordinarily have a gain if the value of the index increased above the exercise price sufficiently to cover the premium and would have a loss if the value of the index remained at or below the exercise price during the option period.
As discussed in “Options on Securities,” the Portfolio would normally purchase “protective puts” in anticipation of a decline in the market value of the relevant index. The purchase of a put option would entitle the Portfolio, in exchange for the premium paid, to receive upon exercise a cash payment based on the level of the index on the exercise date. The purchase of protective puts is generally designed to offset or hedge against a decline in the market value of the index. The Portfolio would ordinarily recognize a gain if the value of the index decreased below the exercise price sufficiently to cover the premium and would recognize a loss if the value of the index remained at or above the exercise price. Gains and losses on the purchase of protective put options would tend to be offset by countervailing changes in the value of the index.
Because the value of an index option depends upon movements in the level of the index rather than the price of a particular security, whether the Portfolio will realize a gain or loss from the purchase or writing of options on an index depends upon movements in the level of securities prices in the securities market generally or, in the case of certain indices, in an industry or market segment, rather than movements in the price of a particular security. Accordingly, successful use by the Portfolio of options on securities indices will be subject to the subadvisor’s ability to predict correctly movements in the direction of the securities market generally or of a particular industry. This requires different skills and techniques than predicting changes in the price of individual securities.
Options on Futures. By purchasing an option on a futures contract, the Portfolio obtains the right, but not the obligation, to sell the futures contract (a put option) or to buy the contract (a call option) at a fixed strike price. The Portfolio can terminate its position in a put option by allowing it to expire or by exercising the option. If the option is exercised, the Portfolio completes the sale of the underlying security at the strike price. Purchasing an option on a futures contract does not require the Portfolio to make margin payments unless the option is exercised.
Although it does not currently intend to do so, the Portfolio may write (or sell) call options that obligate them to sell (or deliver) the option’s underlying instrument upon exercise of the option. While the receipt of option premiums would mitigate the effects of price declines, the Portfolio would give up some ability to participate in a price increase on the underlying security. If the Portfolio were to engage in options transactions, it would own the futures contract at the time a call was written and would keep the contract open until the obligation to deliver it pursuant to the call expired.
69
Risks Related to Futures and Options Transactions. Futures and options prices can be volatile, and trading in these markets involves certain risks. If the subadvisor utilizes a hedge at an inappropriate time or judges interest rate or equity market trends incorrectly, futures and options strategies may lower the Portfolio’s return.
The Portfolio could suffer losses if it is unable to close out its position because of an illiquid secondary market. Futures contracts may be closed out only on an exchange that provides a secondary market for these contracts, and there is no assurance that a liquid secondary market will exist for any particular futures contract at any particular time. Consequently, it may not be possible to close a futures position when the subadvisor considers it appropriate or desirable to do so. In the event of adverse price movements, the Portfolio would be required to continue making daily cash payments to maintain its required margin. If the Portfolio had insufficient cash, it might have to sell portfolio securities to meet daily margin requirements at a time when the subadvisor would not otherwise elect to do so. In addition, the Portfolio may be required to deliver or take delivery of instruments underlying futures contracts it holds. The subadvisor will seek to minimize these risks by limiting the contracts entered into on behalf of the Portfolio to those traded on national futures exchanges and for which there appears to be a liquid secondary market.
The Portfolio could suffer losses if the prices of its futures and options positions were poorly correlated with its other investments, or if securities underlying futures contracts purchased by the Portfolio had different maturities than those of the portfolio securities being hedged. Such imperfect correlation may give rise to circumstances in which the Portfolio loses money on a futures contract at the same time that it experiences a decline in the value of its hedged portfolio securities. The Portfolio also could lose margin payments it has deposited with a margin broker, if, for example, the broker became bankrupt.
Most futures exchanges limit the amount of fluctuation permitted in futures contract prices during a single trading day. The daily limit establishes the maximum amount that the price of a futures contract may vary either up or down from the previous day’s settlement price at the end of the trading session. Once the daily limit has been reached in a particular type of contract, no trades may be made on that day at a price beyond the limit. However, the daily limit governs only price movements during a particular trading day and, therefore, does not limit potential losses. In addition, the daily limit may prevent liquidation of unfavorable positions. Futures contract prices have occasionally moved to the daily limit for several consecutive trading days with little or no trading, thereby preventing prompt liquidation of futures positions and subjecting some futures traders to substantial losses.
Options on securities indices entail risks in addition to the risks of options on securities. The absence of a liquid secondary market to close out options positions on securities indices may be more likely to occur, although the Portfolio generally will only purchase or write such an option if the subadvisor believes the option can be closed out. Use of options on securities indices also entails the risk that trading in such options may be interrupted if trading in certain securities included in the index is interrupted. The Portfolio will not purchase such options unless the subadvisor believes the market is sufficiently developed such that the risk of trading in such options is no greater than the risk of trading in options on securities.
Price movements in the Portfolio’s holdings may not correlate precisely with movements in the level of an index and, therefore, the use of options on indices cannot serve as a complete hedge. Because options on securities indices require settlement in cash, the subadvisor may be forced to liquidate portfolio securities to meet settlement obligations. The Portfolio’s activities in index options may also be restricted by the requirements of the Code for qualification as a regulated investment company.
In addition, the hours of trading for options on the securities indices may not conform to the hours during which the underlying securities are traded. To the extent that the option markets close before the markets for the underlying securities, significant price and rate movements can take place in the underlying securities markets that cannot be reflected in the option markets. It is impossible to predict the volume of trading that may exist in such options, and there can be no assurance that viable exchange markets will develop or continue.
Restrictions on the Use of Futures Contracts and Options. Under CFTC regulations, the Portfolio may enter into futures and options transactions (a) for hedging purposes without regard to the percentage of assets committed to initial margin and option premiums or (b) for purposes other than hedging, provided that assets committed to initial margin and
70
option premiums do not exceed 5% of the Portfolio’s total assets. To the extent required by law, the Portfolio will segregate cash or securities on its records in an amount sufficient to cover its obligations under the futures contracts and options.
Non-diversification. The Portfolio is classified as a non-diversified management investment company under the 1940 Act, which means that the Portfolio is not limited by the 1940 Act in the proportion of its assets that it may invest in the obligations of a single issuer. The investment of a large percentage of the Portfolio’s assets in the securities of a small number of issuers may cause the Portfolio’s share price to fluctuate more than that of a diversified fund.
Lending of Portfolio Securities. The Portfolio has the authority to lend up to 33.3% of the total value of its securities to brokers, dealers and other financial organizations. The Portfolio will not lend securities to the Advisor, the subadvisor, the Distributor or their affiliates, except as may be permitted by the 1940 Act or an order from the SEC. The Board of Trustees will make a determination that the fee paid to the placing broker is reasonable. These loans must be collateralized by cash or liquid securities at least equal to the market value of the securities loaned plus accrued income. By lending its securities, the Portfolio may increase its income by continuing to receive payments in respect of dividends and interest on the loaned securities as well as by either investing the cash collateral in short-term securities or obtaining yield in the form of interest paid by the borrower when irrevocable letters of credit and US Government securities are used as collateral. Any gain or loss in the market price of the securities loaned that might occur during the term of the loan would be for the account of the Portfolio. From time to time, the Portfolio may return a part of the interest earned from the investment of collateral received for securities loaned to the borrower and/or a third party that is unaffiliated with the Portfolio and that is acting as a “finder.”
The Portfolio will adhere to the following conditions whenever its securities are loaned: (1) the Portfolio must receive at least 100% collateral consisting of cash or equivalent securities of the type discussed above at least equal to the market value of the securities loaned plus accrued interest from the borrower; (2) the borrower must increase this collateral whenever the market value of the securities including accrued interest rises above the level of the collateral; (3) the Portfolio must be able to terminate the loan at any time; (4) the Portfolio must receive reasonable interest on the loan, as well as any dividends, interest or other distributions on the loaned securities; (5) the Portfolio may pay only reasonable custodian fees in connection with the loan; and (6) voting rights on the loaned securities may pass to the borrower; provided, however, that if a material event adversely affecting the investment occurs, the Portfolio must retain the right to terminate the loan and recall and vote the securities.
During the term of the loan, the Portfolio continues to bear the risk of fluctuations in the price of the loaned securities. In lending securities to brokers, dealers and other organizations, the Portfolio is subject to risks which, like those associated with other extensions of credit, include delays in receiving additional collateral, in recovery of the securities or even loss of rights in the collateral should the borrower of the securities fail financially. Default by or bankruptcy of a borrower would expose the Portfolio to possible loss because of adverse market action, expenses and/or delays in connection with the disposition of the underlying securities. The Portfolio is a party to an exemptive order from the SEC which allows cash collateral to be invested in a money market fund managed by the Advisor or the subadvisor (or one of its affiliates) and the Advisor (or one of its affiliates) may serve as the Portfolio’s lending agent and may share in revenue received from securities lending transactions as compensation for this service.
Investment of Uninvested Cash Balances. The Portfolio may have cash balances that have not been invested in portfolio securities (“Uninvested Cash”). Uninvested Cash may result from a variety of sources, including dividends or interest received from portfolio securities, unsettled securities transactions, reserves held for investment strategy purposes, scheduled maturity of investments, liquidation of investment securities to meet anticipated redemptions or dividend payments, and new cash received from investors. Uninvested Cash may be invested directly in money market instruments or other short-term debt obligations. Pursuant to an exemptive order issued by the SEC, the Portfolio may use Uninvested Cash to purchase shares of affiliated funds, including money market funds and Cash Management QP Trust, or entities for the which the Advisor may act as investment advisor now or in the future that operate as cash management investment vehicles but are excluded from the definition of investment company pursuant to Section 3©(1) or 3©(7) of the 1940 Act (collectively, the “Central Funds”) in excess of the limitations of Section 12(d)(1) of the 1940 Act. Investment by the Portfolio in shares of the Central Funds will comply with Rule 2a-7 under the 1940 Act and will be in accordance with the Portfolio’s investment policies and restrictions.
71
The Portfolio will invest Uninvested Cash in Central Funds only to the extent that the Portfolio’s aggregate investment in the Central Funds does not exceed 25% of its total assets. Purchase and sales of shares of Central Funds are made at net asset value.
MANAGEMENT OF THE FUND
Investment Advisor
On April 5, 2002, 100% of Zurich Scudder Investments, Inc. (“Scudder”), not including certain U.K. operations (known as Threadneedle Investments), was acquired by Deutsche Bank AG. and changed its name to Deutsche Investment Management Americas Inc. (“DeIM” or the “Advisor”). DeIM, which is part of Deutsche Asset Management (DeAM), is the investment advisor for the Portfolios. Under the supervision of the Fund’s Board of Trustees, DeIM, with headquarters at 345 Park Avenue, New York, New York, makes each Portfolio’s investment decisions, buys and sells securities for the Portfolios and conducts research that leads to these purchase and sale decisions. The Advisor manages each Portfolio’s daily investment and business affairs subject to the policies established by the Fund’s Board of Trustees. DeIM and its predecessors have more than 80 years of experience managing mutual funds. DeIM provides a full range of investment advisory services to institutional and retail clients. The Portfolios’ investment advisor is also responsible for selecting brokers and dealers and for negotiating brokerage commissions and dealer charges.
Deutsche Asset Management (“DeAM”) is the marketing name in the US for the asset management activities of Deutsche Bank AG, DeIM, DeAM, Deutsche Bank Trust Company Americas and DWS Trust Company. DeAM is a global asset management organization that offers a wide range of investing expertise and resources, including hundreds of portfolio managers and analysts and an office network that reaches the world’s major investment centers. This well-resourced global investment platform brings together a wide variety of experience and investment insight, across industries, regions, asset classes and investing styles. DeIM is an indirect, wholly owned subsidiary of Deutsche Bank AG. Deutsche Bank AG is a major global banking institution that is engaged in a wide range of financial services, including investment management, mutual fund, retail, private and commercial banking, investment banking and insurance.
Pursuant to an investment management agreement (each an “Agreement” and, collectively the “Agreements”) with each Portfolio, the Advisor acts as each Portfolio’s investment advisor, manages its investments, administers its business affairs, furnishes office facilities and equipment, provides clerical and administrative services and permits its officers and employees to serve without compensation as directors or officers of one or more funds if elected to such positions. To the extent permissible by law, the Advisor may appoint certain of its affiliates as subadvisors to perform certain of the Advisor’s duties.
The Advisor provides investment counsel for many individuals and institutions, including insurance companies, industrial corporations, and financial and banking organizations, as well as providing investment advice to open- and closed-end SEC registered funds.
In certain cases, the investments for a Portfolio are managed by the same individuals who manage one or more other mutual funds advised by the Advisor that have similar names, objectives and investment styles. You should be aware that a Portfolio is likely to differ from these other mutual funds in size, cash flow pattern and tax matters. Accordingly, the holdings and performance of a Portfolio can be expected to vary from those of these other mutual funds.
Certain investments may be appropriate for a Portfolio and also for other clients advised by the Advisor. Investment decisions for a Portfolio and other clients are made with a view to achieving their respective investment objectives and after consideration of such factors as their current holdings, availability of cash for investment and the size of their investments generally. Frequently, a particular security may be bought or sold for only one client or in different amounts and at different times for more than one but less than all clients. Likewise, a particular security may be bought for one or more clients when one or more other clients are selling the security. In addition, purchases or sales of the same security may be made for two or more clients on the same day. In such event, such transactions will be allocated among the clients in a manner believed by the Advisor to be equitable to each. In some cases, this procedure could have an adverse effect on the price or amount of the securities purchased or sold by a Portfolio. Purchase and sale orders for a Portfolio may be
72
combined with those of other clients of the Advisor in the interest of achieving the most favorable net results to a Portfolio.
Each Portfolio is managed by a team of investment professionals who each play an important role in a Portfolio’s management process. Team members work together to develop investment strategies and select securities for a Portfolio’s portfolio. This team works for the Advisor or its affiliates and is supported by a large staff of economists, research analysts, traders and other investment specialists. The Advisor or its affiliates believe(s) its team approach benefits Portfolio investors by bringing together many disciplines and leveraging its extensive resources. Team members with primary responsibility for management of the Portfolios, as well as team members who have other ongoing management responsibilities for each Portfolio, are identified in each Portfolio’s prospectus, as of the date of the Portfolio’s prospectus. Composition of the team may change over time, and Portfolio shareholders and investors will be notified of changes affecting individuals with primary Portfolio management responsibility.
The Agreements for the Portfolios were most recently approved by the Trustees on September 23, 2005. The Agreements each will continue in effect until September 30, 2006 and from year to year thereafter only if their continuance is approved annually by the vote of a majority of those Trustees who are not parties to such Agreements or interested persons of the Advisor or the Fund (“Independent Trustee”) cast in person at a meeting called for the purpose of voting on such approval, and either by a vote of the Fund’s Trustees or of a majority of the outstanding voting securities of the Portfolios.
The Agreements may be terminated at any time without payment of penalty by either party on sixty days’ written notice and automatically terminate in the event of its assignment.
Under each Agreement, the Advisor regularly provides each Portfolio with continuing investment management consistent with each Portfolio’s investment objective, policies and restrictions and determines what securities shall be purchased, held or sold and what portion of a Portfolio’s assets shall be held uninvested, subject to the Fund’s Declaration of Trust, By-Laws, the 1940 Act, the Code and to each Portfolio’s investment objective, policies and restrictions, and subject, further, to such policies and instructions as the Board of Trustees may from time to time establish. The Advisor also advises and assists the officers of the Fund in taking such steps as are necessary or appropriate to carry out the decisions of its Trustees and the appropriate committees of the Trustees regarding the conduct of the business of each Portfolio.
Under each Agreement, the Advisor also renders administrative services (not otherwise provided by third parties) necessary for each Portfolio’s operations as an open-end investment company including, but not limited to, preparing reports and notices to the Trustees and shareholders; supervising, negotiating contractual arrangements with, and monitoring various third-party service providers to a Portfolio (such as the Portfolios’ transfer agent, pricing agents, custodian, accountants and others); preparing and making filings with the SEC and other regulatory agencies; assisting in the preparation and filing of the Portfolios’ federal, state and local tax returns; preparing and filing the Portfolios’ federal excise tax returns; assisting with investor and public relations matters; monitoring the valuation of securities and the calculation of net asset value; monitoring the registration of shares of each Portfolio under applicable federal and state securities laws; maintaining the Portfolios’ books and records to the extent not otherwise maintained by a third party; assisting in establishing accounting policies of each Portfolio; assisting in the resolution of accounting and legal issues; establishing and monitoring the Portfolios’ operating budget; processing the payment of each Portfolio’s bills; assisting each Portfolio in, and otherwise arranging for, the payment of distributions and dividends; and otherwise assisting each Portfolio in the conduct of its business, subject to the direction and control of the Trustees.
Pursuant to a sub-accounting and administrator agreement among the Advisor, DWS Scudder Fund Accounting Corporation (“DWS-SFAC”) and State Street Bank and Trust Company (“SSB”), the Advisor has delegated certain administrative functions to SSB under the Agreement. The costs and expenses of such delegation are borne by the Advisor, not by the Portfolios.
73
The Portfolios each pay the Advisor a graduated investment management fee, based on the average daily net assets of the Portfolio, payable monthly, at the annual rates shown below:
| | | |
Average Daily Net Assets of the Portfolio | | Fee Rate | |
$0-$500 million | | 0.15 | % |
next $500 million | | 0.14 | % |
next $500 million | | 0.13 | % |
next $1 billion | | 0.12 | % |
Over $2.5 billion | | 0.11 | % |
Additionally, through September 30, 2006 or until the commencement of the Global Asset Allocation strategy, the advisor has agreed to waive 0.05% of its management fee.
In addition to their investment management fee, each Portfolio will also bear its pro rata share of the investment management fees of all the underlying portfolios in which it invests.
For the year ended December 31, 2004, the Advisor agreed to limit its fees and reimburse expenses of DWS Income Allocation VIP, DWS Moderate Allocation VIP, DWS Growth Allocation VIP and DWS Conservative Allocation VIP to the extent necessary to maintain the annualized expenses at 0.75%, 0.75%, 0.75% and 0.75%, respectively. For the year ended December 31, 2004, the Advisor waived $363, $9,387, $11,104 and $3,818 of management fees, respectively. Accordingly, for the year ended December 31, 2004, the fee pursuant to the investment management agreement was equivalent to an annualized effective rate of 0.00% of each Portfolio’s average daily net assets.
In addition, for the year ended December 31, 2004, the Advisor waived $28,805, $9,381, $11,097 and $15,697 of other expenses for DWS Income Allocation VIP, DWS Moderate Allocation VIP, DWS Growth Allocation VIP and DWS Conservative Allocation VIP, respectively.
For the year ended December 31, 2005, the Advisor agreed to waive 0.05% of average daily net assets of each Portfolio against the monthly investment management fee of Class B of the DWS Income Allocation VIP, DWS Moderate Allocation VIP, DWS Growth Allocation VIP and DWS Conservative Allocation VIP. For the year ended December 31, 2005, the Advisor waived $4,372, $49,685, $55,420 and $14,339 of management fees for the DWS Income Allocation VIP, DWS Moderate Allocation VIP, DWS Growth Allocation VIP and DWS Conservative Allocation VIP, respectively.
In addition, for the year ended December 31, 2005, the Advisor waived $8,744 of management fees for the DWS Income Allocation VIP.
Through September 30, 2006 the Advisor, underwriter and accounting agent have each contractually agreed to waive their respective fees and reimburse expenses of Class B of the DWS Income Allocation VIP, DWS Moderate Allocation VIP, DWS Growth Allocation VIP and DWS Conservative Allocation VIP to the extent necessary to maintain each portfolio’s direct operating expenses at 0.75% of average daily net assets (excluding certain expenses such as extraordinary expenses, taxes, brokerage and interest). For the year ended December 31, 2005, the Advisor waived $11,265 and $39,927 of record keeping fees for the DWS Income Allocation VIP and DWS Conservative Allocation VIP, respectively.
Under each Agreement, a Portfolio is responsible for all of its other expenses including: organizational costs, fees and expenses incurred in connection with membership in investment company organizations; brokers’ commissions; legal, auditing and accounting expenses; insurance; taxes and governmental fees; the fees and expenses of the transfer agent; any other expenses of issue, sale, underwriting, distribution, redemption or repurchase of shares; the expenses of and the fees for registering or qualifying securities for sale; the fees and expenses of Trustees, officers and employees of a Portfolio who are not affiliated with the Advisor; the cost of printing and distributing reports and notices to shareholders; and the fees and disbursements of custodians. A Portfolio may arrange to have third parties assume all or part of the expenses of sale, underwriting and distribution of shares of the Portfolio. A Portfolio is also responsible for its expenses of shareholders’ meetings, the cost of responding to shareholders’ inquiries, and its expenses incurred in connection with
74
litigation, proceedings and claims and the legal obligation it may have to indemnify its officers and Trustees of the Fund with respect thereto.
In reviewing the terms of each Agreement and in discussions with the Advisor concerning such Agreement, the Independent Trustees of the Fund are represented by independent counsel at the Fund’s expense.
Each Agreement provides that the Advisor shall not be liable for any error of judgment or mistake of law or for any loss suffered by a Portfolio in connection with matters to which the Agreement relates, except a loss resulting from willful misfeasance, bad faith or gross negligence on the part of the Advisor in the performance of its duties or from reckless disregard by the Advisor of its obligations and duties under the Agreement.
Officers and employees of the Advisor from time to time may have transactions with various banks, including the Portfolios’ custodian bank. It is the Advisor’s opinion that the terms and conditions of those transactions which have occurred were not influenced by existing or potential custodial or other Fund relationships.
The Advisor may serve as advisor to other funds with investment objectives and policies similar to those of a Portfolio that may have different distribution arrangements or expenses, which may affect performance.
None of the officers or Trustees of the Fund may have dealings with a Portfolio as principals in the purchase or sale of securities, except as individual subscribers to or holders of shares of a Portfolio.
The term DWS Scudder is the designation given to the services provided by the Advisor and its affiliates to the DWS Family of Funds.
Fees and Expenses of Underlying Portfolios
As noted above, the Portfolios will bear their pro rata share of the underlying portfolios’ fees and expenses. The management fees and total operating expenses of the underlying portfolios during their most recent fiscal year are described in the following table. Reimbursement and/or waiver arrangements applicable to certain underlying portfolios caused the net fees and/or expenses for those funds to be lower than the values below.
The information in the table does not reflect charges and fees associated with the separate account that invests in a portfolio or any variable life insurance policy or variable annuity contract for which a portfolio is an investment option. These charges and fees will increase expenses.
| | | | |
Name | | Total Expenses (%) | | Management Fees (%) |
DWS Capital Growth VIP(1) | | 0.49 | | 0.45 |
DWS Global Opportunities VIP(2)((3)) | | 1.17 | | 0.98 |
DWS Growth & Income VIP((4)) | | 0.54 | | 0.47 |
DWS International VIP(5)((6)) | | 1.02 | | 0.86 |
DWS Health Care VIP(7)((8)) | | 0.88 | | 0.75 |
DWS RREEF Real Estate Securities VIP(9)(10) | | 1.48 | | 0.90 |
DWS Balanced VIP(1(1)) | | 0.51 | | 0.45 |
DWS Blue Chip VIP | | 0.70 | | 0.65 |
DWS Core Fixed Income VIP | | 0.67 | | 0.60 |
DWS Davis Venture Value VIP(1(2)) | | 1.02 | | 0.94 |
DWS Dreman Financial Services VIP | | 0.89 | | 0.75 |
DWS Dreman High Return Equity VIP | | 0.78 | | 0.73 |
DWS Dreman Small Cap Value VIP | | 0.79 | | 0.75 |
DWS Global Thematic VIP(1(3)) | | 1.41 | | 1.00 |
DWS Government & Agency Securities VIP | | 0.63 | | 0.55 |
DWS High Income VIP | | 0.70 | | 0.60 |
DWS International Select Equity VIP | | 0.87 | | 0.75 |
DWS Janus Growth & Income VIP | | 0.86 | | 0.75 |
75
| | | | |
Name | | Total Expenses (%) | | Management Fees (%) |
DWS Janus Growth Opportunities VIP | | 0.86 | | 0.75 |
DWS Large Cap Value VIP | | 0.80 | | 0.75 |
DWS Legg Mason Aggressive Growth VIP(1(4)) | | 1.33 | | 0.80 |
DWS Mercury Large Cap Core VIP(1(5)) | | 6.67 | | 0.90 |
DWS Mid Cap Growth VIP | | 1.01 | | 0.75 |
DWS Money Market VIP | | 0.52 | | 0.46 |
DWS Small Cap Growth VIP(1(6)) | | 0.72 | | 0.65 |
DWS Strategic Income VIP | | 0.88 | | 0.65 |
DWS Technology VIP | | 0.86 | | 0.75 |
DWS Templeton Foreign Value VIP(1(7)) | | 2.88 | | 0.95 |
DWS MFS Strategic Value VIP(1(8)) | | 1.25 | | 0.95 |
DWS Oak Strategic Equity VIP | | 0.95 | | 0.75 |
DWS Turner Mid Cap Growth VIP | | 0.96 | | 0.80 |
| (1) | Pursuant to an agreement with DWS Variable Series I, the advisor, the underwriter and the accounting agent have agreed to waive all or a portion of their respective fees and/or reimburse or pay operating expenses to the extent necessary to maintain the portfolio’s total operating expenses at 0.49% for Class A shares, excluding certain expenses such as extraordinary expenses, taxes, brokerage and interest. |
| (2) | Pursuant to an agreement with DWS Variable Series I, the advisor, the underwriter and the accounting agent have agreed through May 31, 2006, to waive all or a portion of their respective fees and/or reimburse or pay operating expenses to the extent necessary to maintain the portfolio’s total operating expenses at 1.24% for Class A shares, excluding certain expenses such as extraordinary expenses, taxes, brokerage and interest. |
| (3) | Pursuant to an agreement with DWS Variable Series I, the advisor, the underwriter and the accounting agent have agreed for the period June 1, 2006 through September 30, 2006, to waive all or a portion of their respective fees and/or reimburse or pay operating expenses to the extent necessary to maintain the portfolio’s total operating expenses at 1.24% for Class A shares, excluding certain expenses such as extraordinary expenses, taxes, brokerage and interest. |
| (4) | Pursuant to an agreement with DWS Variable Series I, the advisor, the underwriter and the accounting agent have agreed through April 30, 2008, to waive all or a portion of their respective fees and/or reimburse or pay operating expenses to the extent necessary to maintain the portfolio’s total operating expenses at 0.54% for Class A shares, excluding certain expenses such as extraordinary expenses, taxes, brokerage and interest. |
| (5) | Pursuant to an agreement with DWS Variable Series I, the advisor, the underwriter and the accounting agent have agreed through May 31, 2006, to waive all or a portion of their respective fees and/or reimburse or pay operating expenses to the extent necessary to maintain the portfolio’s total operating expenses at 1.37% for Class A shares, excluding certain expenses such as extraordinary expenses, taxes, brokerage and interest. |
| (6) | Pursuant to an agreement with DWS Variable Series I, the advisor, the underwriter and the accounting agent have agreed for the period June 1, 2006 through September 30, 2006, to waive all or a portion of their respective fees and/or reimburse or pay operating expenses to the extent necessary to maintain the portfolio’s total operating expenses at 1.15% for Class A shares, excluding certain expenses such as extraordinary expenses, taxes, brokerage and interest. |
| (7) | Pursuant to an agreement with DWS Variable Series I, the advisor, the underwriter and the accounting agent have agreed through May 31, 2006, to waive all or a portion of their respective fees and/or reimburse or pay operating expenses to the extent necessary to maintain the portfolio’s total operating expenses at 0.95% for Class A shares, excluding certain expenses such as extraordinary expenses, taxes, brokerage and interest. |
| (8) | Pursuant to an agreement with DWS Variable Series I, the advisor, the underwriter and the accounting agent have agreed for the period June 1, 2006 through September 30, 2006, to waive all or a portion of their respective |
76
| | fees and/or reimburse or pay operating expenses to the extent necessary to maintain the portfolio’s total operating expenses at 1.135% for Class A shares, excluding certain expenses such as extraordinary expenses, taxes, brokerage and interest. |
| (9) | Pursuant to an agreement with DWS Variable Series I, the advisor, the underwriter and the accounting agent have agreed through May 31, 2006, to waive all or a portion of their respective fees and/or reimburse or pay operating expenses to the extent necessary to maintain the portfolio’s total operating expenses at 1.10% for Class A shares, excluding certain expenses such as extraordinary expenses, taxes, brokerage and interest. |
| (10) | Pursuant to an agreement with DWS Variable Series I, the advisor, the underwriter and the accounting agent have agreed for the period June 1, 2006 through September 30, 2006, to waive all or a portion of their respective fees and/or reimburse or pay operating expenses to the extent necessary to maintain the portfolio’s total operating expenses at 1.099% for Class A shares, excluding certain expenses such as extraordinary expenses, taxes, brokerage and interest. |
| (11) | Through April 30, 2008, the advisor, the underwriter and the accounting agent have agreed to waive all or a portion of their respective fees and/or reimburse or pay operating expenses to the extent necessary to maintain the portfolio’s total operating expenses at 0.51% for Class A shares, excluding certain expenses such as extraordinary expenses, taxes, brokerage and interest. |
| (12) | Pursuant to an agreement with DWS Variable Series II, the advisor, the underwriter and the accounting agent have agreed, through September 30, 2006, to waive all or a portion of their respective fees and/or reimburse or pay operating expenses to the extent necessary to maintain the portfolio’s total operating expenses at 0.853% for Class A shares, excluding certain expenses such as extraordinary expenses, taxes, brokerage and interest. |
| (13) | Pursuant to an agreement with DWS Variable Series II, the advisor, the underwriter and the accounting agent have agreed, through September 30, 2006, to waive all or a portion of their respective fees and/or reimburse or pay operating expenses to the extent necessary to maintain the portfolio’s total operating expenses at 1.04% for Class A shares, excluding certain expenses such as extraordinary expenses, taxes, brokerage and interest. |
| (14) | Pursuant to an agreement with DWS Variable Series II, the advisor, the underwriter and the accounting agent have agreed, through September 30, 2006, to waive all or a portion of their respective fees and/or reimburse or pay operating expenses to the extent necessary to maintain the portfolio’s total operating expenses at 0.908% for Class A shares, excluding certain expenses such as extraordinary expenses, taxes, brokerage and interest. |
| (15) | Pursuant to an agreement with DWS Variable Series II, the advisor, the underwriter and the accounting agent have agreed, through September 30, 2006, to waive all or a portion of their respective fees and/or reimburse or pay operating expenses to the extent necessary to maintain the portfolio’s total operating expenses at 0.873% for Class A shares, excluding certain expenses such as extraordinary expenses, taxes, brokerage and interest. |
| (16) | Through April 30, 2008, the advisor, the underwriter and the accounting agent have agreed to waive all or a portion of their respective fees and/or reimburse or pay operating expenses to the extent necessary to maintain the portfolio’s total operating expenses at 0.72% for Class A shares, excluding certain expenses such as extraordinary expenses, taxes, brokerage and interest. |
| (17) | Pursuant to an agreement with DWS Variable Series II, the advisor, the underwriter and the accounting agent have agreed, through September 30, 2006, to waive all or a portion of their respective fees and/or reimburse or pay operating expenses to the extent necessary to maintain the portfolio’s total operating expenses at 1.14% for Class A shares, excluding certain expenses such as extraordinary expenses, taxes, brokerage and interest. |
| (18) | Pursuant to an agreement with DWS Variable Series II, the advisor, the underwriter and the accounting agent have agreed, through September 30, 2006, to waive all or a portion of their respective fees and/or reimburse or pay operating expenses to the extent necessary to maintain the portfolio’s total operating expenses at 0.86% for Class A shares, excluding certain expenses such as extraordinary expenses, taxes, brokerage and interest. |
77
Codes of Ethics
The Fund, the Advisor, the underlying portfolios’ subadvisors and the Fund’s principal underwriter have each adopted codes of ethics under Rule 17j-1 under the 1940 Act. Trustees, officers of the Fund and employees of the Advisor and principal underwriter are permitted to make personal securities transactions, including transactions in securities that may be purchased or held by the Fund, subject to requirements and restrictions set forth in the applicable Code of Ethics. The Advisor’s Code of Ethics contains provisions and requirements designed to identify and address certain conflicts of interest between personal investment activities and the interests of the Fund. Among other things, the Advisor’s Code of Ethics prohibits certain types of transactions absent prior approval, imposes time periods during which personal transactions may not be made in certain securities, and requires the submission of duplicate broker confirmations and quarterly reporting of securities transactions. Additional restrictions apply to portfolio managers, traders, research analysts and others involved in the investment advisory process. Exceptions to these and other provisions of the Advisor’s Code of Ethics may be granted in particular circumstances after review by appropriate personnel.
Compensation of Portfolio Managers. The Portfolios have been advised that the Advisor seeks to offer its investment professionals competitive short-term and long-term compensation. Portfolio managers and research professionals are paid (i) fixed base salaries, which are linked to job function, responsibilities and financial services industry peer comparison and (ii) variable compensation, which is linked to investment performance, individual contributions to the team and DWS Scudder’s and Deutsche Bank’s financial results. Variable compensation may include a cash bonus incentive and participation in a variety of long-term equity programs (usually in the form of Deutsche Bank equity).
Bonus and long-term incentives comprise a greater proportion of total compensation as an investment professional’s seniority and compensation levels increase. Top performing investment professionals earn a total compensation package that is highly competitive, including a bonus that is a multiple of their base salary. The amount of equity awarded under the long-term equity programs is generally based on the individual’s total compensation package and may comprise from 0%-40% of the total compensation award. As incentive compensation increases, the percentage of compensation awarded in Deutsche Bank equity also increases. Certain senior investment professionals may be subject to a mandatory diverting of a portion of their equity compensation into proprietary mutual funds that they manage.
To evaluate its investment professionals, the Advisor uses a Performance Management Process. Objectives evaluated by the process are related to investment performance and generally take into account peer group and benchmark related data. The ultimate goal of this process is to link the performance of investment professionals with client investment objectives and to deliver investment performance that meets or exceeds clients’ risk and return objectives. When determining total compensation, the Advisor considers a number of quantitative and qualitative factors such as:
| | • | | DWS Scudder’s performance and the performance of Deutsche Asset Management; quantitative measures which include 1, 3 and 5 year pre-tax returns versus benchmark (such as the benchmark used in the prospectus) and appropriate peer group, taking into consideration risk targets. Additionally, the portfolio manager’s retail/institutional asset mix is weighted, as appropriate for evaluation purposes. |
| | • | | Qualitative measures include adherence to the investment process and individual contributions to the process, among other things. In addition, the Advisor assesses compliance, risk management and teamwork skills. |
| | • | | Other factors, including contributions made to the investment team as well as adherence to compliance, risk management, and “living the values” of the Advisor, are part of a discretionary component which gives management the ability to reward these behaviors on a subjective basis through bonus incentives. |
In addition, the Advisor analyzes competitive compensation levels through the use of extensive market data surveys. Portfolio manager compensation is reviewed and may be modified each year as appropriate to reflect changes in the market, as well as to adjust the factors used to determine overall compensation to promote good sustained investment performance.
Portfolio Ownership of Portfolio Managers. The following table shows the dollar range of shares owned beneficially and of record by each member of the Portfolios’ management team in the applicable portfolio as well as in all DWS
78
Funds as a group (i.e. those funds/portfolios advised by Deutsche Asset Management or its affiliates), including investments by their immediate family members sharing the same household and amounts invested through retirement and deferred compensation plans. This information is provided as of the portfolios’ most recent fiscal year end.
| | | | | | | |
Name of Portfolio | | Name of Portfolio Manager | | Dollar Range of
Portfolio Shares Owned | | Dollar Range of All DWS
Fund Shares Owned |
DWS Income Allocation VIP | | Inna Okounkova | | $ | 0 | | $100,001-$500,000 |
| | Robert Wang | | $ | 0 | | $500,001-$1,000,000 |
DWS Moderate Allocation VIP | | Inna Okounkova | | $ | 0 | | $100,001-$500,000 |
| | Robert Wang | | $ | 0 | | $500,001-$1,000,000 |
DWS Growth Allocation VIP | | Inna Okounkova | | $ | 0 | | $100,001-$500,000 |
| | Robert Wang | | $ | 0 | | $500,001-$1,000,000 |
DWS Conservative Allocation VIP | | Inna Okounkova | | $ | 0 | | $100,001-$500,000 |
| | Robert Wang | | $ | 0 | | $500,001-$1,000,000 |
Conflicts of Interest. In addition to managing the assets of the Portfolios, the portfolio managers may have responsibility for managing other client accounts of the Advisor or its affiliates. The tables below show, for each portfolio manager, the number and asset size of (1) SEC registered investment companies (or series thereof) other than a Portfolio, (2) pooled investment vehicles that are not registered investment companies and (3) other accounts (e.g., accounts managed for individuals or organizations) managed by each portfolio manager. The tables also show the number of performance-based fee accounts, as well as the total assets of the accounts for which the advisory fee is based on the performance of the account. This information is provided as of the Portfolios’ most recent fiscal year end.
Other SEC Registered Investment Companies Managed:
| | | | | | | | | | | | |
Name of Portfolio | | Name of Portfolio Manager | | Number of Registered Investment
Companies | | Total Assets of Registered
Investment Companies | | Number of Investment Company Accounts with Performance-Based Fee | | Total Assets of Performance-Based Fee Accounts |
DWS Income Allocation VIP | | Inna Okounkova | | 10 | | $ | 4,093,948,659 | | 0 | | $ | 0 |
| | Robert Wang | | 18 | | $ | 6,549,902,328 | | | | | |
DWS Moderate Allocation VIP | | Inna Okounkova | | 10 | | $ | 3,935,175,777 | | | | | |
| | Robert Wang | | 18 | | $ | 6,391,129,446 | | 0 | | $ | 0 |
DWS Growth Allocation VIP | | Inna Okounkova | | 10 | | $ | 3,909,292,029 | | | | | |
| | Robert Wang | | 18 | | $ | 6,365,245,698 | | 0 | | $ | 0 |
DWS Conservative Allocation VIP | | Inna Okounkova | | 10 | | $ | 4,060,725,041 | | 0 | | $ | 0 |
| | Robert Wang | | 18 | | $ | 6,516,678,710 | | 0 | | $ | 0 |
79
Other Pooled Investment Vehicles Managed:
| | | | | | | | | | | | |
Name of Portfolio | | Name of Portfolio Manager | | Number of
Pooled
Investment
Vehicles | | Total Assets of Pooled Investment Vehicles | | Number of Pooled
Investment Vehicle Accounts with Performance-Based Fee | | Total Assets of Performance-Based Fee Accounts |
DWS Income Allocation VIP | | Inna Okounkova | | 5 | | $ | 144,851,864 | | 0 | | $ | 0 |
| | Robert Wang | | 26 | | $ | 214,836,429 | | 0 | | $ | 0 |
DWS Moderate Allocation VIP | | Inna Okounkova | | 5 | | $ | 144,851,864 | | 0 | | $ | 0 |
| | Robert Wang | | 26 | | $ | 214,836,429 | | 0 | | $ | 0 |
DWS Growth Allocation VIP | | Inna Okounkova | | 5 | | $ | 144,851,864 | | 0 | | $ | 0 |
| | Robert Wang | | 26 | | $ | 214,836,429 | | 0 | | $ | 0 |
DWS Conservative Allocation VIP | | Inna Okounkova | | 5 | | $ | 144,851,864 | | 0 | | $ | 0 |
| | Robert Wang | | 26 | | $ | 214,836,429 | | 0 | | $ | 0 |
| | | | | |
Name of Portfolio | | Name of Portfolio Manager | | Number of Other Accounts | | Total Assets of Other Accounts | | Number of Other Accounts with Performance-Based Fee | | Total Assets of Performance-Based Fee Accounts |
DWS Income Allocation VIP | | Inna Okounkova | | 0 | | $ | 0 | | 0 | | $ | 0 |
| | Robert Wang | | 35 | | $ | 6,041,714,812 | | 0 | | $ | 0 |
DWS Moderate Allocation VIP | | Inna Okounkova | | 0 | | $ | 0 | | 0 | | $ | 0 |
| | Robert Wang | | 35 | | $ | 6,041,714,812 | | 0 | | $ | 0 |
DWS Growth Allocation VIP | | Inna Okounkova | | 0 | | $ | 0 | | 0 | | $ | 0 |
| | Robert Wang | | 35 | | $ | 6,041,714,812 | | 0 | | $ | 0 |
DWS Conservative Allocation VIP | | Inna Okounkova | | 0 | | $ | 0 | | 0 | | $ | 0 |
| | Robert Wang | | 35 | | $ | 6,041,714,812 | | 0 | | $ | 0 |
In addition to the accounts above, an investment professional may have personal accounts that may include holdings that are similar to, or the same as, those of the Portfolios. The Advisor has in place a Code of Ethics that is designed to address conflicts of interest and that, among other things, imposes restrictions on the ability of portfolio managers and other “access persons” to invest in securities that may be recommended or traded in the portfolios and other client accounts.
Real, potential or apparent conflicts of interest may arise when a portfolio manager has day-to-day portfolio management responsibilities with respect to more than one portfolio or account, including the following:
| | • | | Certain investments may be appropriate for a Portfolio and also for other clients advised by the Advisor, including other client accounts managed by a Portfolio’s management team. Investment decisions for a Portfolio and other clients are made with a view to achieving their respective investment objectives and after consideration of such factors as their current holdings, availability of cash for investment and the size of their investments generally. A particular security may be bought or sold for only one client or in different amounts |
80
| | and at different times for more than one but less than all clients. Likewise, because clients of the Advisor may have differing investment strategies, a particular security may be bought for one or more clients when one or more other clients are selling the security. The investment results achieved for a Portfolio may differ from the results achieved for other clients of the Advisor. In addition, purchases or sales of the same security may be made for two or more clients on the same day. In such event, such transactions will be allocated among the clients in a manner believed by the Advisor to be most equitable to each client, generally utilizing a pro rata allocation methodology. In some cases, the allocation procedure could potentially have an adverse effect or positive effect on the price or amount of the securities purchased or sold by a Portfolio. Purchase and sale orders for a Portfolio may be combined with those of other clients of the Advisor in the interest of achieving the most favorable net results to a Portfolio and the other clients. |
| | • | | To the extent that a portfolio manager has responsibilities for managing multiple client accounts, a portfolio manager will need to divide time and attention among relevant accounts. The Advisor attempts to minimize these conflicts by aligning its portfolio management teams by investment strategy and by employing similar investment models across multiple client accounts. |
| | • | | In some cases, an apparent conflict may arise where the Advisor has an incentive, such as a performance-based fee, in managing one account and not with respect to other accounts it manages. The Advisor will not determine allocations based on whether it receives a performance-based fee from the client. Additionally, the Advisor has in place supervisory oversight processes to periodically monitor performance deviations for accounts with like strategies. |
The Advisor is owned by Deutsche Bank AG, a multi-national financial services company. Therefore, the Advisor is affiliated with a variety of entities that provide, and/or engage in commercial banking, insurance, brokerage, investment banking, financial advisory, broker-dealer activities (including sales and trading), hedge funds, real estate and private equity investing, in addition to the provision of investment management services to institutional and individual investors. Since Deutsche Bank AG, its affiliates, directors, officers and employees (the “Firm”) are engaged in businesses and have interests other than managing asset management accounts, such other activities involve real, potential or apparent conflicts of interests. These interests and activities include potential advisory, transactional and financial activities and other interests in securities and companies that may be directly or indirectly purchased or sold by the Firm for its clients’ advisory accounts. These are considerations of which advisory clients should be aware and which may cause conflicts that could be to the disadvantage of the Advisor’s advisory clients. The Advisor has instituted business and compliance policies, procedures and disclosures that are designed to identify, monitor and mitigate conflicts of interest and, as appropriate, to report them to the Fund’s Board.
FUND SERVICE PROVIDERS
Distributor
DWS Scudder Distributors, Inc. (“DWS-SDI” or the “Distributor”), 222 South Riverside Plaza, Chicago, Illinois 60606, a wholly owned subsidiary of the Advisor, is the distributor and principal underwriter for shares of each Portfolio pursuant to an Underwriting Agreement in the continuous offering of its shares. Terms of continuation, termination and assignment under the underwriting agreement are identical to those described above with regard to the investment management agreements, except that termination other than upon assignment requires sixty days’ notice.
Each Portfolio has adopted a distribution plan under Rule 12b-1 (the “Plan”) that provides for fees payable as an expense of the Class B shares. Under the plan, DWS Variable Series II may make quarterly payments as reimbursement to the distributor for distribution and shareholder servicing related expenses incurred or paid by the distributor or a participating insurance company. No such payment shall be made with respect to any quarterly period in excess of an amount determined for such period at the annual rate of 0.25% of the average daily net assets of Class B shares during that quarterly period. The fee is payable by the Fund, on behalf of each Portfolio, of up to 0.25% of the average daily net assets attributable to the Class B shares of a Portfolio. Because 12b-1 fees are paid out of Portfolio assets on an ongoing basis, they will, over time, increase the cost of investment and may cost more than other types of sales charges. The Plan and any Rule 12b-1-related agreement that is entered into by the Fund or the Distributor in connection with the Plan will
81
continue in effect for a period of more than one year only so long as continuance is specifically approved at least annually by a vote of a majority of the Fund’s Board of Trustees, and of a majority of the Trustees who are not interested persons (as defined in the 1940 Act) of the Fund or a Portfolio (“Independent Trustees”), cast in person at a meeting called for the purpose of voting on the Plan, or the Rule 12b-1 related agreement, as applicable. In addition, the Plan and any Rule 12b-1 related agreement, may be terminated as to Class B shares of a Portfolio at any time, without penalty, by vote of a majority of the outstanding Class B shares of that Portfolio or by vote of a majority of the Independent Trustees. The Plan and Underwriting Agreement also provide that it may not be amended to increase materially the amount that may be spent for distribution of Class B shares of a Portfolio without the approval of Class B shareholders of that Portfolio.
As of December 31, 2005, the Portfolios paid distribution fees as follows:
| | | | | | | | | |
Name of Portfolio | | Total Aggregated Fee | | Waived | | Unpaid at December 31, 2005 |
DWS Income Allocation VIP | | $ | 21,861 | | $ | 21,861 | | $ | 0 |
DWS Moderate Allocation VIP | | $ | 248,426 | | $ | 0 | | $ | 33,738 |
DWS Growth Allocation VIP | | $ | 277,101 | | $ | 0 | | $ | 40,041 |
DWS Conservative Allocation VIP | | $ | 71,696 | | $ | 0 | | $ | 5,437 |
In addition, DWS-SDI may, from time to time, from its own resources pay certain firms additional amounts for ongoing administrative services and assistance provided to their customers and clients who are shareholders of DWS Variable Series II.
Recordkeeping. Technically, the shareholders of the Portfolios of DWS Variable Series II are the participating insurance companies that offer the Portfolios as investment options for holders of certain variable annuity contracts and variable life insurance policies. Effectively, ownership of Portfolio shares is passed through to insurance company contract and policy holders. The holders of the shares of the Portfolios on the records of DWS Variable Series II are the participating insurance companies and no information concerning the Portfolio holdings of specific contract and policy holders is maintained by DWS Variable Series II. The insurance companies place orders for the purchase and redemption of Portfolio shares with DWS Variable Series II reflecting the investment of premiums paid, surrender and transfer requests and other matters on a net basis; they maintain all records of the transactions and holdings of Portfolio shares and distributions thereon for individual contract and policy holders; and they prepare and mail to contract and policy holders confirmations and periodic account statements reflecting such transactions and holdings.
The Portfolios of DWS Variable Series II may compensate certain insurance companies for record keeping and other administrative services performed with regard to holdings of Class B shares as an expense of the Class B shares. These fees are included within the “Other Expenses” category in the fee table for each portfolio in the Portfolios’ prospectus (see “How Much Investors Pay” in the Portfolio’s prospectus). In addition, the Advisor may, from time to time, pay from its own resources certain insurance companies for record keeping and other administrative services related to Class B shares of the Portfolios held by such insurance companies on behalf of their contract and policy holders.
Transfer Agent
State Street Bank and Trust Company (“SSB”), 225 Franklin Street, Boston, Massachusetts 02110, is the transfer agent and dividend-paying agent for each Portfolio. Pursuant to an agreement with SSB, DWS Scudder Investments Service Company (“DWS-SISC”), 811 Main Street, Kansas City, Missouri 64105-2005, an affiliate of the Advisor, acts as each Portfolio’s transfer agent, dividend-paying agent and shareholder service agent. DWS-SISC receives as transfer agent, annual account fees of $5 per account, transaction and maintenance charges, and out-of-pocket expense reimbursement.
Pursuant to a sub-transfer agency agreement between DWS-SISC and DST Systems, Inc. (“DST”), DWS-SISC has delegated certain transfer agent and dividend paying agent functions to DST. The costs and expenses of such delegation are borne by DWS-SISC, not by the Portfolios.
82
Custodian
State Street Bank and Trust Company (“SSB”), 225 Franklin Street, Boston, Massachusetts 02110, as custodian, has custody of all securities and cash of each Portfolio. The custodian attends to the collection of principal and income, and payment for and collection of proceeds of securities bought and sold by the Portfolios. SSB also serves as the foreign custody manager for the Portfolios.
Independent Registered Public Accounting Firm
The Fund’s independent registered public accounting firm, Ernst & Young LLP, 200 Clarendon Street, Boston, MA 02116 audits and reports on the Portfolios’ annual financial statements, review certain regulatory reports and the Portfolios’ federal income tax returns, and perform other professional accounting, auditing, tax and advisory services when engaged to do so by the Fund. Shareholders will receive annual audited financial statements and semi-annual unaudited financial statements.
Counsel
Vedder, Price, Kaufman & Kammholz, P.C., 222 N. LaSalle St., Chicago, Illinois, serves as legal counsel to the Fund and the Independent Trustees.
Fund Accounting Agent
DWS Scudder Fund Accounting Corp. (“DWS-SFAC”), Two International Place, Boston, Massachusetts, 02210-4103, a subsidiary of DeIM, is responsible for determining the daily net asset value per share and maintaining the portfolio and general accounting records of each Portfolio. For the fiscal year ended December 31, 2005, DWS-SFAC received fees from the Portfolios as follows:
| | | | | | | | | |
Name of Portfolio | | Total Aggregated Fee | | Waived | | Unpaid at December 31, 2005 |
DWS Income Allocation VIP | | $ | 45,388 | | $ | 22,002 | | $ | 10,727 |
DWS Moderate Allocation VIP | | $ | 73,338 | | $ | 0 | | $ | 4,148 |
DWS Growth Allocation VIP | | $ | 62,705 | | $ | 0 | | $ | 5,249 |
DWS Conservative Allocation VIP | | $ | 61,714 | | $ | 0 | | $ | 3,100 |
Pursuant to a sub-administration and sub-accounting agreement among the Advisor, DWS-SFAC and SSB, DWS-SFAC has delegated certain fund accounting functions to SSB under the Portfolios’ fund accounting agreements. The costs and expenses of such delegation are borne by DWS-SFAC, not by the Portfolios.
PORTFOLIO TRANSACTIONS
The Advisor is generally responsible for placing the orders for the purchase and sale of portfolio securities, including the allocation of brokerage.
The policy of the Advisor in placing orders for the purchase and sale of securities for the portfolios is to seek best execution, taking into account such factors, among others, as price; commission (where applicable); the broker-dealer’s ability to ensure that securities will be delivered on settlement date; the willingness of the broker-dealer to commit its capital and purchase a thinly traded security for its own inventory; whether the broker-dealer specializes in block orders or large program trades; the broker-dealer’s knowledge of the market and the security; the broker-dealer’s ability to maintain confidentiality; the financial condition of the broker-dealer; and whether the broker-dealer has the infrastructure and operational capabilities to execute and settle the trade. The Advisor seeks to evaluate the overall reasonableness of brokerage commissions with commissions charged on comparable transactions and compares the brokerage commissions
83
(if any) paid by the funds to reported commissions paid by others. The Advisor routinely reviews commission rates, execution and settlement services performed, and makes internal and external comparisons.
Commission rates on transactions in equity securities on U.S. securities exchanges are subject to negotiation. Commission rates on transactions in equity securities on foreign securities exchanges are generally fixed. Purchases and sales of fixed-income securities and other over-the-counter securities are effected on a net basis, without the payment of brokerage commissions. Transactions in fixed income and other over-the-counter securities are generally placed by the Advisor with the principal market makers for these securities unless the Advisor reasonably believes more favorable results are available elsewhere. Transactions with dealers serving as market makers reflect the spread between the bid and asked prices. Purchases of underwritten issues will include an underwriting fee paid to the underwriter. Money market instruments are normally purchased in principal transactions directly from the issuer or from an underwriter or market maker.
It is likely that the broker-dealers selected based on the considerations described in this section will include firms that also sell shares of the portfolios to their customers. However, the Advisor does not consider sales of shares of the portfolios as a factor in the selection of broker-dealers to execute portfolio transactions for the portfolios and, accordingly, has implemented policies and procedures reasonably designed to prevent its traders from considering sales of shares of the portfolios as a factor in the selection of broker-dealers to execute portfolio transactions for the portfolios.
The Advisor is permitted by Section 28(e) of the Securities Exchange Act of 1934, as amended (the “1934 Act”), when placing portfolio transactions for a portfolio, to cause the portfolio to pay brokerage commissions in excess of that which another broker-dealer might charge for executing the same transaction in order to obtain research and brokerage services. The Advisor, however, does not as a matter of policy execute transactions with broker-dealers for a portfolio in order to obtain research from such broker-dealers that is prepared by third parties (i.e., “third party research”). However, the Advisor may from time to time, in reliance on Section 28(e) of the 1934 Act, obtain proprietary research prepared by the executing broker-dealer in connection with a transaction or transactions through that broker-dealer (i.e., “proprietary research”). Consistent with the Advisor’s policy regarding best execution, where more than one broker is believed to be capable of providing best execution for a particular trade, the Advisor may take into consideration the receipt of proprietary research in selecting the broker-dealer to execute the trade. Proprietary research provided by broker-dealers may include, but is not limited to, information on the economy, industries, groups of securities, individual companies, statistical information, accounting and tax law interpretations, political developments, legal developments affecting portfolio securities, technical market action, pricing and appraisal services, credit analysis, risk measurement analysis, performance analysis, and measurement and analysis of corporate responsibility issues. Proprietary research is typically received in the form of written reports, telephone contacts and personal meetings with security analysts, but may also be provided in the form of access to various computer software and associated hardware, and meetings arranged with corporate and industry representatives.
In reliance on Section 28(e) of the 1934 Act, the Advisor may obtain from broker-dealers brokerage services in the form of software and/or hardware that is used in connection with executing trades. Typically, this computer software and/or hardware is used by the Advisor to facilitate trading activity with those broker-dealers.
Proprietary research and brokerage services received from a broker-dealer chosen to execute a particular trade may be useful to the Advisor in providing services to clients other than the fund making the trade, and not all such information is used by the Advisor in connection with such portfolio. Conversely, such information provided to the Advisor by broker-dealers through which other clients of the Advisor effect securities transactions may be useful to the Advisor in providing services to a portfolio.
The Advisor will monitor regulatory developments and market practice in the use of client commissions to obtain research and brokerage services, whether proprietary or third party.
Investment decisions for each Portfolio and for other investment accounts managed by the Advisor are made independently of each other in light of differing conditions. However, the same investment decision may be made for two or more of such accounts. In such cases, simultaneous transactions are inevitable. To the extent permitted by law, the Advisor may aggregate the securities to be sold or purchased for a portfolio with those to be sold or purchased for other
84
accounts in executing transactions. Purchases or sales are then averaged as to price and commission and allocated as to amount in a manner deemed equitable to each account. While in some cases this practice could have a detrimental effect on the price paid or received by the portfolio, or on the size of the position obtained or disposed of for the portfolio, in other cases it is believed that the ability to engage in volume transactions will be beneficial to the portfolio.
Deutsche Bank AG or one of its affiliates (or in the case of a sub-adviser, the sub-adviser or one of its affiliates) may act as a broker for the portfolios and receive brokerage commissions or other transaction-related compensation from the portfolios in the purchase and sale of securities, options or futures contracts when, in the judgment of the Advisor, and in accordance with procedures approved by the Fund’s Board, including a majority of the Independent Trustees, the affiliated broker will be able to obtain a price and execution at least as favorable as those obtained from other qualified brokers and if, in the transaction, the affiliated broker charges the portfolio a rate consistent with that charged to comparable unaffiliated customers in similar transactions.
DWS Income Allocation VIP, DWS Moderate Allocation VIP, DWS Growth Allocation VIP and DWS Conservative Allocation VIP are each required to identify any securities of its “regular brokers or dealers” (as such term is defined in the 1940 Act) that the Portfolio has acquired during the most recent fiscal year. As of December 31, 2005, each Portfolio did not hold any securities of its regular brokers or dealers.
The table below shows total brokerage commissions paid by each Portfolio for the most recent fiscal year:
| | | |
Portfolio | | Fiscal 2005 |
DWS Income Allocation VIP | | $ | 0 |
DWS Moderate Allocation VIP | | $ | 0 |
DWS Growth Allocation VIP | | $ | 0 |
DWS Conservative Allocation VIP | | $ | 0 |
Portfolio Turnover
Portfolio turnover rate is defined by the SEC as the ratio of the lesser of annual sales or purchases to the monthly average value of the securities owned by the portfolios during the year, excluding from both the numerator and the denominator all securities whose remaining maturities at the time of acquisition of one year or less.
Higher levels of activity by an underlying portfolio result in higher transaction costs and may also result in taxes on realized capital gains to be borne by that underlying portfolio’s shareholders and, indirectly, by shareholders of the Portfolios.
Portfolio turnover rates for the years ended December 31, 2005 and 2004, respectively, for the Portfolios are as follows:
| | | | | | |
Name | | December 31, 2005 | | | December 31, 2004(1) | |
DWS Income Allocation VIP | | 46 | % | | 37 | % |
DWS Moderate Allocation VIP | | 14 | % | | 13 | % |
DWS Growth Allocation VIP | | 20 | % | | 15 | % |
DWS Conservative Allocation VIP | | 27 | % | | 18 | % |
| (1) | For the period from August 16, 2004 (commencement of operations) to December 31, 2004. |
85
Portfolio turnover rates for the years ended December 31, 2005 and 2004, respectively, for the underlying portfolios that are part of DWS Variable Series I are as follows:
| | | | | | |
Name | | December 31, 2005 | | | December 31, 2004 | |
DWS Bond VIP(1) | | 187 | % | | 223 | % |
DWS Growth & Income VIP | | 115 | % | | 33 | % |
DWS Capital Growth VIP | | 17 | % | | 15 | % |
DWS Global Opportunities VIP | | 30 | % | | 24 | % |
DWS International VIP | | 59 | % | | 73 | % |
DWS Health Care VIP | | 43 | % | | 77 | % |
| (1) | The portfolio turnover rates including mortgage dollar roll transactions were 197% and 245% for the years ended December 31, 2005 and 2004, respectively. |
Portfolio turnover rates for the years ended December 31, 2005 and 2004, respectively, for the underlying portfolios that are part of DWS Variable Series II are as follows:
| | | | | | |
Name | | December 31, 2005 | | | December 31, 2004 | |
DWS Mid Cap Growth VIP | | 104 | % | | 103 | % |
DWS Blue Chip VIP | | 288 | % | | 249 | % |
DWS Core Fixed Income VIP(1) | | 164 | % | | 185 | % |
DWS Global Thematic VIP | | 95 | % | | 81 | % |
DWS Government & Agency Securities VIP(2) | | 191 | % | | 226 | % |
DWS High Income VIP | | 100 | % | | 162 | % |
DWS International Select Equity VIP | | 93 | % | | 88 | % |
DWS Large Cap Value VIP | | 64 | % | | 40 | % |
DWS Small Cap Growth VIP | | 94 | % | | 117 | % |
DWS Strategic Income VIP | | 120 | % | | 210 | % |
DWS Technology VIP | | 135 | % | | 112 | % |
DWS Balanced VIP(3) | | 121 | % | | 131 | % |
DWS Mercury Large Cap Core VIP | | 78 | % | | 104 | %(4) |
DWS Templeton Foreign Value VIP | | 15 | % | | n/a | |
DWS Davis Venture Value VIP | | 8 | % | | 3 | % |
DWS Dreman Financial Services VIP | | 27 | % | | 8 | % |
DWS Dreman High Return Equity VIP | | 10 | % | | 9 | % |
DWS Dreman Small Cap Value VIP | | 61 | % | | 73 | % |
DWS Legg Mason Aggressive Growth VIP | | 166 | % | | 133 | % |
DWS Janus Growth & Income VIP | | 32 | % | | 52 | % |
DWS Janus Growth Opportunities VIP | | 46 | % | | 58 | % |
DWS MFS Strategic Value VIP | | 59 | % | | 54 | % |
DWS Oak Strategic Equity VIP | | 19 | % | | 39 | % |
DWS Turner Mid Cap Growth VIP | | 151 | % | | 174 | % |
| (1) | The portfolio turnover rates including mortgage dollar roll transactions were 176% and 204% for the years ended December 31, 2005 and 2004, respectively. |
| (2) | The portfolio turnover rates including mortgage dollar roll transactions were 325% and 391 for the years ended December 31, 2005 and December 31, 2004, respectively. |
| (3) | The portfolio turnover rates including mortgage dollar roll transactions were 122% and 140% for the years ended December 31, 2005 and 2004, respectively. |
| (4) | For the period November 15, 2004 (commencement of operations) to December 31, 2004. |
86
The portfolio turnover rates for DWS RREEF Real Estate Securities VIP were 70% and 84% for the years ended December 31, 2005 and December 31, 2004, respectively.
Purchases and sales for each Portfolio are made whenever necessary, in management’s opinion, to meet a Portfolio’s objective.
PURCHASE AND REDEMPTIONS
Portfolio shares are sold at their net asset value next determined after an order and payment are received as described below. (See “Net Asset Value.”)
Upon receipt by a Portfolio’s transfer agent of a request for redemption, shares will be redeemed by the Fund, on behalf of a particular Portfolio, at the applicable net asset value as described below.
The Fund may, on behalf of a Portfolio, may suspend or postpone redemptions as permitted pursuant to Section 22(e) of the Investment Company Act of 1940. Generally, those circumstances are when: 1) the New York Stock Exchange is closed other than customary weekend or holiday closings; 2) trading on the New York Stock Exchange is restricted; 3) an emergency exists which makes the disposal of securities owned by a fund or the fair determination of the value of a fund’s net assets not reasonably practicable; or 4) the SEC, by order, permits the suspension of the right of redemption. Redemption payments by wire may also be delayed in the event of a non-routine closure of the Federal Reserve wire payment system.
DIVIDENDS AND CAPITAL GAINS
The Fund normally follows the practice of declaring and distributing substantially all the net investment income and any net short-term and long-term capital gains of these Portfolios at least annually.
The Fund may at any time vary the dividend practices with respect to a Portfolio and, therefore, reserves the right from time to time to either distribute or retain for reinvestment such of its net investment income and its net short-term and long-term capital gains as the Board of Trustees of the Fund determines appropriate under the then current circumstances.
TAXES
Each Portfolio and each underlying portfolio intends to qualify as a regulated investment company under subchapter M of the Internal Revenue Code (the “Code”) in order to avoid taxation of the Portfolio and its shareholders.
Pursuant to the requirements of Section 817(h) of the Code, with certain limited exceptions, the only shareholders of the Portfolios will be insurance companies and their separate accounts that fund variable insurance contracts. The prospectus that describes a particular variable insurance contract discusses the taxation of separate accounts and the owner of the particular variable insurance contract.
Each Portfolio intends to comply with the requirements of Section 817(h) and related regulations. Section 817(h) of the Code and the regulations issued by the Treasury Department impose certain diversification requirements affecting the securities in which the Portfolios may invest. These diversification requirements are in addition to the diversification requirements under subchapter M and the 1940 Act. The consequences of failure to meet the requirements of Section 817(h) could result in taxation of the insurance company offering the variable insurance contract and immediate taxation of the owner of the contract to the extent of appreciation on investment under the contract. Pursuant to a ruling issued by
87
the Internal Revenue Service, for purposes of the diversification requirements of Section 817(h), each Portfolio generally will be treated as owning a pro rata portion of the investments of each of the underlying portfolios in which the Portfolio holds an interest. Thus, because each of the underlying portfolios intends to satisfy the diversification requirements of Section 817(h), each of the Portfolios generally should also be treated as satisfying those requirements.
The preceding is a brief summary of certain of the relevant tax considerations. The summary is not intended as a complete explanation or a substitute for careful tax planning and consultation with individual tax advisors.
NET ASSET VALUE
The net asset value of shares of each Portfolio is computed as of the close of regular trading on the New York Stock Exchange on each day the Exchange is open for trading (the “Value Time”). The Exchange is scheduled to be closed on the following holidays: New Year’s Day, Dr. Martin Luther King, Jr. Day, Presidents’ Day, Good Friday, Memorial Day, Independence Day, Labor Day, Thanksgiving and Christmas, and on the preceding Friday or subsequent Monday when one of these holidays falls on a Saturday or Sunday, respectively. Net asset value per share is determined by dividing the value of the total assets of each Portfolio, less all liabilities attributable to that class, by the total number of shares outstanding.
An equity security is valued at its most recent sale price on the primary exchange or OTC market as of the Value Time. Lacking any sales, the security is valued at the calculated mean between the most recent bid quotation and the most recent asked quotation (the “Calculated Mean”) on such exchange or OTC market as of the Value Time. If it is not possible to determine the Calculated Mean, the security is valued at the most recent bid quotation on such exchange or OTC market as of the Value Time. In the case of certain foreign exchanges or OTC markets, the closing price reported by the exchange or OTC market (which may sometimes be referred to as the “official close” or the “official closing price” or other similar term) will be considered the most recent sale price.
Debt securities are valued as follows. Money market instruments purchased with an original or remaining maturity of 60 days or less, maturing at par, are valued at amortized cost. Other money market instruments are valued based on information obtained from an independent pricing service or, if such information is not readily available, by using matrix pricing techniques (formula driven calculations based primarily on current market yields). Bank loans are valued at prices supplied by an independent pricing service (which are intended to reflect the mean between the bid and asked prices), if available, and otherwise at the mean of the most recent bid and asked quotations or evaluated prices, as applicable, based on quotations or evaluated prices obtained from one or more broker-dealers. Privately placed debt securities, other than Rule 144A debt securities, initially are valued at cost and thereafter based on all relevant factors including type of security, size of holding and restrictions on disposition. Municipal debt securities are valued at prices supplied by an independent pricing service (which are intended to reflect the mean between the bid and asked prices), if available, and otherwise at the average of the means based on the most recent bid and asked quotations or evaluated prices obtained from two broker-dealers. Other debt securities not addressed above are valued at prices supplied by an independent pricing service, if available, and otherwise at the most recent bid quotation or evaluated price, as applicable, obtained from one or more broker-dealers. If it is not possible to value a particular debt security pursuant to the above methods, the security is valued on the basis of factors including (but not limited to) maturity, coupon, creditworthiness, currency denomination, and the movement of the market in which the security is normally traded.
An exchange-traded option contract on securities, currencies and other financial instruments is valued at its most recent sale price on such exchange. Lacking any sales, the option contract is valued at the Calculated Mean. If it is not possible to determine the Calculated Mean, the option contract is valued at the most recent bid quotation in the case of a purchased option contract or the most recent asked quotation in the case of a written option contract, in each case as of the Value Time. An option contract on securities, currencies and other financial instruments traded in the OTC market is valued on the Value Date at the market to market price, or if not available, at the evaluated price provided by the broker-dealer with which it was traded. Futures contracts (and options thereon) are valued at the most recent settlement price, if available, on the exchange on which they are traded most extensively. With the exception of stock index futures contracts which trade on the Chicago Mercantile Exchange, closing
88
settlement times are prior to the close of trading on the New York Stock Exchange. For stock index futures contracts which trade on the Chicago Mercantile Exchange, closing settlement prices are normally available at approximately 4:20 Eastern time. If no settlement price is available, the last traded price on such exchange will be used.
If market quotations for a portfolio asset are not readily available or the value of a portfolio asset as determined in accordance with Board-approved procedures does not represent the fair market value of a portfolio asset, the value of the portfolio asset is taken to be an amount which, in the opinion of a portfolio’s Pricing Committee (or, in some cases, the Board’s Valuation Committee), represents fair market value. The value of other portfolio holdings owned by a Portfolio is determined in a manner which is intended to reflect the fair market value of the asset on the valuation date, based on valuation procedures adopted by the Board and overseen by the Pricing Committee.
TRUSTEES AND OFFICERS
The following table presents certain information regarding the Trustees and Officers of DWS Variable Series II as of May 1, 2006. Each individual’s year of birth is set forth in parentheses after his or her name. Unless otherwise noted, (i) each individual has engaged in the principal occupation(s) noted in the table for at least the most recent five years, although not necessarily in the same capacity, and (ii) unless otherwise noted, the address of each individual is c/o Deutsche Asset Management, 222 South Riverside Plaza, Chicago, Illinois 60606. Each Trustee’s term of office extends until the next shareholder’s meeting called for the purpose of electing such Trustee and until the election and qualification of a successor, or until such Trustee sooner dies, retires, resigns or is removed as provided in the governing documents of the Trust.
The following individuals hold the same position with the Fund and the Trust:
Independent Trustees
| | | | |
Name, Year of Birth, Position(s) Held with
the Trust and Length of Time Served(1) | | Principal Occupation(s) During Past 5 Years and Other Directorships Held | | Number of Funds in
DWS Fund
Complex Overseen |
Shirley D. Peterson (1941) Chairperson since 2004, and Trustee, 1995-present | | Retired; formerly, President, Hood College (1995-2000); prior thereto, Partner, Steptoe & Johnson (law firm); Commissioner, Internal Revenue Service; Assistant Attorney General (Tax), US Department of Justice. Directorships: Federal Mogul Corp. (supplier of automotive components and subsystems); AK Steel (steel production); Goodyear Tire & Rubber Co. (April 2004-present); Champion Enterprises, Inc. (manufactured home building); Wolverine World Wide, Inc. (designer, manufacturer and marketer of footwear) (April 2005-present); Trustee, Bryn Mawr College. Former Directorship: Bethlehem Steel Corp. | | 71 |
| | |
John W. Ballantine (1946) Trustee, 1999-present | | Retired; formerly, Executive Vice President and Chief Risk Management Officer, First Chicago NBD Corporation/The First National Bank of Chicago (1996-1998); Executive Vice President and Head of International Banking (1995-1996). Directorships: First Oak Brook Bancshares, Inc.; Oak Brook Bank; Healthways Inc. (provider of disease and care management services); Portland General Electric (utility company) | | 71 |
| | |
Donald L. Dunaway (1937) Trustee, 1980-present | | Retired; formerly, Executive Vice President, A. O. Smith Corporation (diversified manufacturer) (1963-1994) | | 71 |
89
| | | | |
Name, Year of Birth, Position(s) Held with
the Trust and Length of Time Served(1) | | Principal Occupation(s) During Past 5 Years and Other Directorships Held | | Number of Funds in
DWS Fund
Complex Overseen |
James R. Edgar (1946) Trustee, 1999-present | | Distinguished Fellow, University of Illinois, Institute of Government and Public Affairs (1999-present); formerly, Governor, State of Illinois (1991-1999). Directorships: Kemper Insurance Companies; John B. Sanfilippo & Son, Inc. (processor/packager/marketer of nuts, snacks and candy products); Horizon Group Properties, Inc.; Youbet.com (online wagering platform); Alberto-Culver Company (manufactures, distributes and markets health and beauty care products) | | 71 |
| | |
Paul K. Freeman (1950) Trustee, 2002-present | | President, Cook Street Holdings (consulting); Consultant, World Bank/Inter-American Development Bank; formerly, Project Leader, International Institute for Applied Systems Analysis (1998-2001); Chief Executive Officer, The Eric Group, Inc. (environmental insurance) (1986-1998) | | 71 |
| | |
Robert B. Hoffman (1936) Trustee, 1981-present | | Retired; formerly, Chairman, Harnischfeger Industries, Inc. (machinery for the mining and paper industries) (1999-2000); prior thereto, Vice Chairman and Chief Financial Officer, Monsanto Company (agricultural, pharmaceutical and nutritional/food products) (1994-1999). Directorship: RCP Advisors, LLC (a private equity investment advisory firm) | | 71 |
| | |
William McClayton (1944) Trustee, 2004-present | | Managing Director of Finance and Administration, DiamondCluster International, Inc. (global management consulting firm) (2001-present); formerly, Partner, Arthur Andersen LLP (1986-2001). Formerly: Trustee, Ravinia Festival; Board of Managers, YMCA of Metropolitan Chicago | | 71 |
| | |
Robert H. Wadsworth (1940) Trustee, 2004-present | | President, Robert H. Wadsworth & Associates, Inc. (consulting firm) (1983 to present). Director, The European Equity Fund, Inc. (since 1986), The New Germany Fund, Inc. (since 1992), The Central Europe and Russia Fund, Inc. (since 1990). Formerly, Trustee of New York Board DWS Funds; President and Trustee, Trust for Investment Managers (registered investment company) (1999-2002). President, Investment Company Administration, L.L.C. (1992*-2001); President, Treasurer and Director, First Fund Distributors, Inc. (June 1990-January 2002); Vice President, Professionally Managed Portfolios (May 1991-January 2002) and Advisors Series Trust (October 1996-January 2002) (registered investment companies) * Inception date of the corporation which was the predecessor to the L.L.C. | | 74 |
90
Officers(2)
| | | | |
Name, Year of Birth, Position(s) Held with
the Trust and Length of Time Served(1) | | Principal Occupation(s) During Past 5 Years and Other Directorships Held | | Number of Funds in
DWS Fund
Complex Overseen |
Michael Colon(4) (1969) President, 2006-present | | Managing Director(3) and Chief Operating Officer, Deutsche Asset Management (since 1999); President, DWS Global High Income Fund, Inc. (since April 2006), DWS Global Commodities Stock Fund, Inc. (since April 2006), The Brazil Fund, Inc. (since April 2006), The Korea Fund, Inc. (since April 2006) | | n/a |
| | |
Philip J. Collora (1945) Vice President and Assistant Secretary, 1986-present | | Director(3), Deutsche Asset Management | | n/a |
| | |
Paul H. Schubert(4) (1963) Chief Financial Officer, 2004-present Treasurer, 2005-present | | Managing Director(3), Deutsche Asset Management (since July 2004); formerly, Executive Director, Head of Mutual Fund Services and Treasurer for UBS Family of Funds (1998-2004); Vice President and Director of Mutual Fund Finance at UBS Global Asset Management (1994-1998) | | n/a |
| | |
John Millette(5) (1962) Secretary, 2001-present | | Director(3), Deutsche Asset Management | | n/a |
| | |
Patricia DeFilippis(4) (1963) Assistant Secretary, 2005-present | | Vice President, Deutsche Asset Management (since June 2005); formerly, Counsel, New York Life Investment Management LLC (2003-2005); legal associate, Lord, Abbett & Co. LLC (1998-2003) | | n/a |
| | |
Elisa D. Metzger(4) (1962) Assistant Secretary since 2005 | | Director(3), Deutsche Asset Management (since September 2005); formerly, Counsel, Morrison and Foerster LLP (1999-2005) | | n/a |
| | |
Caroline Pearson(5) (1962) Assistant Secretary, 1998-present | | Managing Director(3), Deutsche Asset Management | | n/a |
| | |
Scott M. McHugh(5) (1971) Assistant Treasurer, 2005-present | | Director(3), Deutsche Asset Management | | n/a |
| | |
Kathleen Sullivan D’Eramo(5) (1957) Assistant Treasurer, 2003-present | | Director(3), Deutsche Asset Management | | n/a |
| | |
John Robbins(4) (1966) Anti-Money Laundering Compliance Officer, 2005-present | | Managing Director(3), Deutsche Asset Management (since 2005); formerly, Chief Compliance Officer and Anti-Money Laundering Compliance Officer for GE Asset Management (1999-2005) | | n/a |
| | |
Philip Gallo(4) (1962) Chief Compliance Officer, 2004-present | | Managing Director(3), Deutsche Asset Management (2003-present); formerly, Co-Head of Goldman Sachs Asset Management Legal (1994-2003) | | n/a |
| (1) | Length of time served represents the date that each Trustee was first elected to the common board of Trustees which oversees a number of investment companies, including the Fund, managed by the Advisor. For the officers of the Fund, length of time served represents the date that each officer was first elected to serve as an officer of any fund overseen by the aforementioned common board of Trustees. |
| (2) | As a result of their respective positions held with the Advisor, these individuals are considered “interested persons” of the Advisor within the meaning of the 1940 Act. Interested persons receive no compensation from the Fund. |
91
| (3) | Executive title, not a board directorship. |
| (4) | Address: 345 Park Avenue, New York, New York 10154. |
| (5) | Address: Two International Place, Boston, Massachusetts 02110. |
Officers’ Role with Principal Underwriter: DWS Scudder Distributors, Inc.
| | |
| Michael Colon: | | Director and Chief Operating Officer |
| Paul H. Schubert: | | Vice President |
| Caroline Pearson: | | Secretary |
| Philip J. Collora: | | Assistant Secretary |
Trustees’ Responsibilities. The officers of the Trust manage its day-to-day operations under the direction of the Trust’s Board of Trustees. The primary responsibility of the Board is to represent the interests of the shareholders of the Fund and to provide oversight of the management of the Fund. A majority of the Trust’s Board members are not “interested persons” of the Advisor.
The Board has adopted its own Governance Procedures and Guidelines and has established a number of committees, as described below. For each of the following Committees, the Board has adopted a written charter setting forth the Committees’ responsibilities.
Board Committees. The Board of Trustees oversees a number of investment companies managed by the Advisor. Information shown below represents meetings held on behalf of all such funds. The common Board has the following committees:
Audit Committee: The Audit Committee, which consists entirely of Independent Trustees, makes recommendations regarding the selection of independent registered public accounting firms for the Fund, confers with the independent registered public accounting firm regarding the Fund’s financial statements, the results of audits and related matters, and performs such other tasks as the full Board deems necessary or appropriate. The Audit Committee receives annual representations from the independent registered public accounting firms as to their independence. The members of the Audit Committee are Donald L. Dunaway (Chair), Robert B. Hoffman and William McClayton. The Audit Committee held ten meetings during calendar year 2005.
Nominating and Governance Committee: The Nominating and Governance Committee, which consists entirely of Independent Trustees, seeks and reviews candidates for consideration as nominees for membership on the Board and oversees the administration of the Fund’s Governance Procedures and Guidelines. The members of the Nominating and Governance Committee are Shirley D. Peterson (Chair), James R. Edgar and William McClayton. Shareholders wishing to submit the name of a candidate for consideration as a Board member by the Committee should submit their recommendation(s) and resume to the Secretary of the Trust. The Nominating and Governance Committee held five meetings during calendar year 2005.
Contract Review Committee: The Contract Review Committee, which consists entirely of Independent Trustees, oversees the annual contract review process. The members of the Contract Review Committee are Paul K. Freeman (Chair), John W. Ballantine, Donald L. Dunaway and Robert B. Hoffman. The Contract Review Committee held three meetings during calendar year 2005.
Valuation Committee: The Valuation Committee reviews Valuation Procedures adopted by the Board, determines fair value of the Fund’s securities as needed in accordance with the Valuation Procedures and performs such other tasks as the full Board deems necessary. The members of the Valuation Committee are John W. Ballantine (Chair), Robert H. Wadsworth, Donald L. Dunaway (alternate) and William McClayton (alternate). The Trust’s Valuation Committee held one meeting for each portfolio during calendar year 2005.
92
Equity Oversight Committee: The Equity Oversight Committee oversees investment activities of the Fund, such as investment performance and risk, expenses and services provided under the investment management agreement. The members of the Equity Oversight Committee are Robert B. Hoffman (Chair), John W. Ballantine and Robert H. Wadsworth. The Equity Oversight Committee held five meetings during calendar year 2005.
Operations Committee: The Operations Committee oversees the operations of the Fund, such as reviewing each Fund’s administrative fees and expenses, distribution arrangements, portfolio transaction policies, custody and transfer agency arrangements and shareholder services. Currently, the members of the Operations Committee are John W. Ballantine (Chair), Paul K. Freeman and Robert H. Wadsworth. The Operations Committee held seven meetings during calendar year 2005.
Fixed-Income Oversight Committee: The Fixed-Income Oversight Committee oversees investment activities of the Funds, such as investment performance and risk, expenses and services provided under the investment management agreement. The members of the Fixed-Income Oversight Committee are Paul K. Freeman (Chair), Donald L. Dunaway and James R. Edgar. The Fixed-Income Oversight Committee held six meetings during calendar year 2005.
Remuneration. For the calendar year ended 2005, each Independent Trustee received a monthly retainer, paid on a quarterly basis, and an attendance fee, plus expenses, for each Board meeting and Committee meeting attended. Effective January 1, 2006, each Independent Trustee receives an annual base retainer, paid quarterly, and, as applicable, an additional annual fixed fee(s) for serving as committee member, committee chairman and/or as the Independent Board chairman. The Trustees serve as board members of various other funds advised by the Advisor. The Advisor supervises the Fund’s investments, pays the compensation and expenses of its personnel who serve as Trustees and officers on behalf of the Fund and receives a management fee for its services.
The Board of Trustees of the Trust established a deferred compensation plan for the Independent Trustees (“Deferred Compensation Plan”). Under the Deferred Compensation Plan, the Independent Trustees may defer receipt of all, or a portion, of the compensation they earn for their services to the Fund, in lieu of receiving current payments of such compensation. Any deferred amount is treated as though an equivalent dollar amount has been invested in shares of one or more funds advised by the Advisor (“Shadow Shares”). Governor Edgar currently has elected to defer at least a portion of his fees. In addition, previously, Mr. Dunaway elected to defer fees that were payable, which are now included under the Deferred Compensation Plan. The equivalent Shadow Shares are reflected below in the table describing the Trustee’s share ownership.
Members of the Board of Trustees who are officers, directors, employees or stockholders of the Advisor or its affiliates receive no direct compensation from the Fund, although they are compensated as employees of the Advisor, or its affiliates, and as a result may be deemed to participate in fees paid by the Fund. The Independent Trustees are not entitled to benefits under any fund pension or retirement plan. The following table shows compensation received by each Trustee from the Fund and aggregate compensation from the fund complex during the calendar year 2005.
| | | | | | | | | |
Name of Trustee | | Compensation from
DWS Variable Series II | | Pension or Retirement
Benefits Accrued as Part
of Fund Expenses | | Total Compensation Paid to
Trustee from Fund Complex(3)(4)(5) |
John W. Ballantine | | $ | 34,410 | | $ | 0 | | $ | 215,150 |
Donald L. Dunaway(1) | | $ | 33,810 | | $ | 0 | | $ | 224,660 |
James R. Edgar(2) | | $ | 28,210 | | $ | 0 | | $ | 173,790 |
Paul K. Freeman | | $ | 32,520 | | $ | 0 | | $ | 215,150 |
Robert B. Hoffman | | $ | 30,750 | | $ | 0 | | $ | 187,940 |
William McClayton | | $ | 27,560 | | $ | 0 | | $ | 181,180 |
Shirley D. Peterson(6) | | $ | 32,680 | | $ | 0 | | $ | 208,580 |
Robert H. Wadsworth | | $ | 29,910 | | $ | 0 | | $ | 224,510 |
| (1) | Does not include deferred fees. Pursuant to a Deferred Compensation Plan, as discussed above, Mr. Dunaway previously elected, in prior years, to defer fees. Deferred amounts are treated as though an equivalent dollar amount has been invested in Shadow Shares (as defined above) of funds managed by the Advisor. |
93
| (2) | Includes deferred fees. Pursuant to a Deferred Compensation Plan, as discussed above, deferred amounts are treated as though an equivalent dollar amount has been invested in Shadow Shares (as defined above) of funds managed by the Advisor in which compensation may be deferred by Governor Edgar. Total deferred fees (including interest thereon and the return from the assumed investment in the funds managed by the Advisor) payable from the Fund to Governor Edgar are $81,477. |
| (3) | For each Trustee, except Mr. Wadsworth, total compensation includes compensation for service on the boards of 31 trusts/corporations comprised of 85 funds/portfolios. Each Trustee, except Mr. Wadsworth, currently serves on the boards of 22 trusts/corporations comprised of 71 funds/portfolios. Mr. Wadsworth currently serves on the boards of 24 DeAM trust/corporations comprised of 74 funds/portfolios. |
| (4) | Aggregate compensation reflects amounts paid to the Trustees for numerous special meetings of ad hoc committees of the Chicago Board in connection with reviewing the Funds’ rebranding initiatives to change to the DWS Family of Funds and with respect to legal and regulatory matters. Such amounts totaled $15,340 for each of Messrs. Ballantine, Freeman and Ms. Peterson, $20,510 for Mr. Dunaway, and $5,170 for Messrs. Edgar, Hoffman, McClayton and Wadsworth. These meeting fees were borne by the Advisor. |
| (5) | If the new Independent Trustee compensation structure, effective January 1, 2006, had been in effect for the calendar year 2005, the range of compensation paid to the Independent Trustees would have been between $175,000 and $225,000. |
| (6) | Includes $38,010 in annual retainer fees received by Ms. Peterson as Chairperson of the Board. |
Mr. Freeman, prior to his service as Independent Trustee of the Trust, served as a board member of certain funds in the Deutsche Bank complex (“DB Funds”). In connection with his resignation and the resignation of certain other board members as Trustees of the DB Funds on July 30, 2002 (the “Effective Date”), which was part of a restructuring of the boards overseeing the DB Funds, Deutsche Asset Management, Inc. (“DeAM”) agreed to recommend, and, if necessary obtain, directors and officers (“D&O”) liability insurance coverage for the prior board members, including Mr. Freeman, that is at least as equivalent in scope and amount to the D&O coverage provided to the prior board members for the six-year period following the Effective Date. In the event that D&O insurance coverage is not available in the commercial marketplace on commercially reasonable terms from a conventional third party insurer, DeAM reserved the right to provide substantially equivalent protection in the form of an indemnity or financial guarantee from an affiliate of DeAM. The D&O policy in effect prior to the Effective Date provided aggregate coverage of $25,000,000, subject to a $250,000 per claim deductible.
Trustee Fund Ownership. Under the Trust’s Governance Procedures and Guidelines, the Independent Trustees have established the expectation that within three years of becoming a Trustee, an Independent Trustee will have invested an amount in those funds he or she oversees (which shall include amounts held under a deferred fee agreement that are valued based on “shadow shares” in such funds) in the aggregate in excess of $150,000. Each interested Trustee is also encouraged to own an amount of shares (based upon their own individual judgment) of those funds that he or she oversees that is suitable for his or her own appropriate investment needs. The following tables set forth each Trustee’s share ownership of the Fund and all funds in the fund complex overseen by each Trustee as of December 31, 2005.
| | | | |
Name of Trustee | | Dollar Range of
Securities Owned in
DWS Variable Series II(1) | | Aggregate Dollar Range of Securities
Owned in All Funds in the Fund
Complex Overseen by Trustee |
John W. Ballantine | | None | | Over $100,000 |
Donald L. Dunaway* | | None | | Over $100,000 |
James R. Edgar* | | None | | Over $100,000 |
Paul K. Freeman | | None | | $1-$10,000** |
Robert B. Hoffman | | None | | Over $100,000 |
William McClayton | | None | | $50,001-$100,000*** |
Shirley D. Peterson | | None | | Over $100,000 |
Robert H. Wadsworth | | None | | Over $100,000 |
| * | The dollar range of shares shown includes shadow shares of certain DWS Family of Funds in which Mr. Dunaway and Governor Edgar are deemed to be invested pursuant to the Fund’s Deferred Compensation Plan as more fully described above under “Remuneration.” |
94
| ** | Mr. Freeman owned over $100,000 in other funds within the DWS Fund Complex. |
| *** | Mr. McClayton was appointed to the Chicago Board on December 30, 2004. |
| (1) | DWS Variable Series II, and each of its series: |
DWS Balanced VIP DWS Blue Chip VIP
DWS Core Fixed Income VIP
DWS Davis Venture Value VIP
DWS Dreman Financial Services VIP
DWS Dreman High Return Equity VIP
DWS Dreman Small Cap Value VIP
DWS Global Thematic VIP
DWS Government & Agency Securities VIP
DWS High Income VIP
DWS International Select Equity VIP
DWS Janus Growth & Income VIP
DWS Janus Growth Opportunities VIP
DWS Large Cap Value VIP
DWS Legg Mason Aggressive Growth VIP
DWS Mercury Large Cap Core VIP
DWS MFS Strategic Value VIP
DWS Mid Cap Growth VIP
DWS Money Market VIP DWS Oak Strategic Equity VIP
DWS Small Cap Growth VIP
DWS Strategic Income VIP
DWS Technology VIP
DWS Templeton Foreign Value VIP
DWS Turner Mid Cap Growth VIP
DWS Conservative Allocation VIP
DWS Growth Allocation VIP
DWS Income Allocation VIP
DWS Moderate Allocation VIP
Ownership in Securities of the Advisor and Related Companies
As reported to the Fund, the information in the following table reflects ownership by the Independent Trustees and their immediate family members of certain securities as of December 31, 2005. An immediate family member can be a spouse, children residing in the same household including step and adoptive children and any dependents. The securities represent ownership in an investment advisor or principal underwriter of the Fund and any persons (other than a registered investment company) directly or indirectly controlling, controlled by, or under common control with an investment advisor or principal underwriter of the Fund (including Deutsche Bank AG) (collectively, the “Company”).
95
| | | | | | | | | | |
Independent Trustee | | Owner and
Relationship to Trustee | | Company | | Title of Class | | Value of Securities on an Aggregate Basis | | Percent of Class on an Aggregate Basis |
| John W. Ballantine | | | | None | | | | | | |
| Donald L. Dunaway | | | | None | | | | | | |
| James R. Edgar | | | | None | | | | | | |
| Paul K. Freeman | | | | None | | | | | | |
| Robert B. Hoffman | | | | None | | | | | | |
| William McClayton | | | | None | | | | | | |
| Shirley D. Peterson | | | | None | | | | | | |
| Robert H. Wadsworth | | | | None | | | | | | |
Securities Beneficially Owned
As of April 10, 2006 all Trustees and Officers of the Fund as a group owned beneficially (as that term is defined is section 13(d) of the Securities Exchange Act of 1934) less than 1% of the outstanding securities of the Fund.
To the best of the Fund’s knowledge, as of April 10, 2006, no person owned of record or beneficially 5% or more of any class of the Fund’s outstanding shares, except as noted below.
As of April 10, 2006, 15,283,941.723 shares in the aggregate, or 85.57% of the outstanding shares of DWS Growth Allocation VIP, Class B were held in the name of The Manufacturers Life Ins. Co. (USA), Boston, MA 02116-3787, who may be deemed as the beneficial owner of certain of these shares.
As of April 10, 2006, 1,032,177.832 shares in the aggregate, or 5.78% of the outstanding shares of DWS Growth Allocation VIP, Class B were held in the name of Travelers Life & Annuity Company, Hartford, CT 06103-3432, who may be deemed as the beneficial owner of certain of these shares.
As of April 10, 2006, 1,544,467.388 shares in the aggregate, or 8.65% of the outstanding shares of DWS Growth Allocation VIP, Class B were held in the name of Travelers Insurance Company, Attn: Shareholder Accounting Unit, Hartford, CT 06199-0027, who may be deemed as the beneficial owner of certain of these shares.
As of April 10, 2006, 769,903.361 shares in the aggregate, or 65.74% of the outstanding shares of DWS Income Allocation VIP, Class B were held in the name of The Manufacturers Life Ins. Co. (USA), Boston, MA 02116-3787, who may be deemed as the beneficial owner of certain of these shares.
As of April 10, 2006, 120,846.457 shares in the aggregate, or 10.32% of the outstanding shares of DWS Income Allocation VIP, Class B were held in the name of Travelers Life & Annuity Company, Hartford, CT 06103-3432, who may be deemed as the beneficial owner of certain of these shares.
As of April 10, 2006, 280,438.298 shares in the aggregate, or 23.94% of the outstanding shares of DWS Income Allocation VIP, Class B were held in the name of Travelers Insurance Company, Attn: Shareholder Accounting Unit, Hartford, CT 06199-0027, who may be deemed as the beneficial owner of certain of these shares.
As of April 10, 2006, 12,871,006.828 shares in the aggregate, or 80.67% of the outstanding shares of DWS Moderate Allocation VIP, Class B were held in the name of The Manufacturers Life Ins. Co. (USA), Boston, MA 02116-3787, who may be deemed as the beneficial owner of certain of these shares.
As of April 10, 2006, 1,514,874.489 shares in the aggregate, or 9.49% of the outstanding shares of DWS Moderate Allocation VIP, Class B were held in the name of Travelers Life & Annuity Company, Hartford, CT 06103-3432, who may be deemed as the beneficial owner of certain of these shares.
96
As of April 10, 2006, 1,569,899.533 shares in the aggregate, or 9.84% of the outstanding shares of DWS Moderate Allocation VIP, Class B were held in the name of Travelers Insurance Company, Attn: Shareholder Accounting Unit, Hartford, CT 06199-0027, who may be deemed as the beneficial owner of certain of these shares.
Agreement to Indemnify Independent Trustees for Certain Expenses
In connection with litigation or regulatory action related to possible improper market timing or other improper trading activity or possible improper marketing and sales activity in the Fund, the Fund’s investment advisor has agreed, subject to applicable law and regulation, to indemnify and hold harmless the Fund against any and all loss, damage, liability and expense, arising from market timing or marketing and sales matters alleged in any enforcement actions brought by governmental authorities involving or potentially affecting the Fund or the investment advisor (“Enforcement Actions”) or that are the basis for private actions brought by shareholders of the Fund against the Funds, its Trustees and officers, the Fund’s investment advisor and/or certain other parties (“Private Litigation”), or any proceedings or actions that may be threatened or commenced in the future by any person (including governmental authorities), arising from or similar to the matters alleged in the Enforcement Actions or Private Litigation. In recognition of its undertaking to indemnify the Fund and in light of the rebuttable presumption generally afforded to independent directors/trustees of investment companies that they have not engaged in disabling conduct, the Fund’s investment advisor has also agreed, subject to applicable law and regulation, to indemnify the Fund’s Independent Trustees against certain liabilities the Independent Trustees may incur from the matters alleged in any Enforcement Actions or Private Litigation or arising from or similar to the matters alleged in the Enforcement Actions or Private Litigation, and advance expenses that may be incurred by the Independent Trustees in connection with any Enforcement Actions or Private Litigation. The investment advisor is not, however, required to provide indemnification and advancement of expenses: (1) with respect to any proceeding or action with respect to which the Fund’s Board determines that the Independent Trustee ultimately would not be entitled to indemnification or (2) for any liability of the Independent Trustee to the Fund or their shareholders to which the Independent Trustee would otherwise be subject by reason of willful misfeasance, bad faith, gross negligence or reckless disregard of the Independent Trustee’s duties as a director or trustee of the Fund as determined in a final adjudication in such action or proceeding. The estimated amount of any expenses that may be advanced to the Independent Trustees or indemnity that may be payable under the indemnity agreements is currently unknown. These agreements by the Fund’s investment advisor will survive the termination of the investment management agreements between the investment advisor and the Fund.
FUND ORGANIZATION
The Fund was organized as a business trust under the laws of Massachusetts on January 22, 1987. On May 1, 1997, the Fund changed its name from “Kemper Investors Fund” to “Investors Fund Series,” on May 1, 1999 the Fund changed its name from “Investors Fund Series” to “Kemper Variable Series”, on May 1, 2001, the Fund changed its name from “Kemper Variable Series” to “Scudder Variable Series II” and on February 6, 2006 the Fund changed its name from “Scudder Variable Series II” to “DWS Variable Series II.” The Fund may issue an unlimited number of shares of beneficial interest all having no par value. Since the Fund offers multiple portfolios, it is known as a “series company.” Currently, each Portfolio offered herein offers one class of shares: Class B. The Portfolios’ Class B shares have separate and exclusive voting rights with respect to the Portfolios’ Rule 12b-1 Plan. The Portfolios’ Class B shares also have equal rights with respect to dividends, assets and liquidation subject to any preferences (such as resulting from different Rule 12b-1 distribution fees), rights or privileges of any classes of shares of a Portfolio. Shares are fully paid and nonassessable when issued, and have no preemptive or conversion rights.
Shareholder inquiries should be made by writing the Fund at the address shown on the front cover or from Participating Insurance Companies which offer the Portfolios.
The Fund is generally not required to hold meetings of its shareholders. Under the Agreement and Declaration of Trust of the Fund (“Declaration of Trust”), however, shareholder meetings will be held in connection with the following matters: (a) the election or removal of trustees if a meeting is called for such purpose; (b) the adoption of any contract for which approval is required by the 1940 Act; © any termination or reorganization of the Fund to the extent and as provided in the Declaration of Trust; (d) any amendment of the Declaration of Trust (other than amendments changing the name of the Fund or any Portfolio, establishing a Portfolio, supplying any omission, curing any ambiguity or curing, correcting or
97
supplementing any defective or inconsistent provision thereof); (e) as to whether a court action, preceding or claim should or should not be brought or maintained derivatively or as a class action on behalf of the Fund or the shareholders, to the same extent as the stockholders of a Massachusetts business corporation; and (f) such additional matters as may be required by law, the Declaration of Trust, the By-laws of the Fund, or any registration of the Fund with the SEC or any state, or as the Trustees may consider necessary or desirable. The shareholders also would vote upon changes in fundamental investment objectives, policies or restrictions.
The Board may, at any time, terminate the Fund, a Portfolio or a class without shareholder approval.
Under current interpretations of the 1940 Act, the Fund expects that Participating Insurance Company shareholders will offer VLI and VA contract holders the opportunity to instruct them as to how Fund shares attributable to such contracts will be voted with respect to the matters described above. The separate prospectuses describing the VLI and VA contracts include additional disclosure of how contract holder voting rights are computed.
Under Massachusetts law, shareholders of a Massachusetts business trust could, under certain circumstances, be held personally liable for obligations of the Fund. The Declaration of Trust, however, contains provisions designed to protect shareholders from liability for acts or obligations of the Fund and requires that notice of such provisions be given in each agreement, obligation or instrument entered into or executed by the Fund or the trustees. Moreover, the Declaration of Trust provides for indemnification out of Fund property for all losses and expenses of any shareholders held personally liable for the obligations of the Fund and the Fund will be covered by insurance which the trustees consider adequate to cover foreseeable tort claims. Thus, the risk of a shareholder incurring financial loss on account of shareholder liability is considered by DeIM remote and not material since it is limited to circumstances in which the provisions limiting liability are inoperative and the Fund itself is unable to meet its obligations.
The Declaration of Trust further provides that the trustees will not be liable for errors of judgment or mistakes of fact or law. The Declaration of Trust does not protect a trustee against any liability to which he or she should otherwise be subject by reason of willful misfeasance, bad faith, gross negligence or reckless disregard of the duties of a trustee. The Declaration of Trust permits the Fund to purchase insurance against certain liabilities on behalf of the Trustees.
PROXY VOTING GUIDELINES
The Fund has delegated proxy voting responsibilities to the Advisor, subject to the Board’s general oversight. The Fund has delegated proxy voting to the Advisor with the direction that proxies should be voted consistent with the Fund’s best economic interests. The Advisor has adopted its own Proxy Voting Policies and Procedures (“Policies”), and Proxy Voting Guidelines (“Guidelines”) for this purpose. The Policies address, among other things, conflicts of interest that may arise between the interests of the Fund, and the interests of the Advisor and its affiliates, including the Fund’s principal underwriter. The Guidelines set forth the Advisor’s general position on various proposals, such as:
| | • | | Shareholder Rights — The Advisor generally votes against proposals that restrict shareholder rights. |
| | • | | Corporate Governance — The Advisor generally votes for confidential and cumulative voting and against supermajority voting requirements for charter and bylaw amendments. The Advisor generally votes for proposals to restrict a chief executive officer from serving on more than three outside boards of directors. The Advisor generally votes against proposals that require a company to appoint a Chairman who is an independent director. |
| | • | | Anti-Takeover Matters — The Advisor generally votes for proposals that require shareholder ratification of poison pills or that request boards to redeem poison pills, and votes against the adoption of poison pills if they are submitted for shareholder ratification. The Advisor generally votes for fair price proposals. |
| | • | | Compensation Matters — The Advisor generally votes for executive cash compensation proposals, unless they are unreasonably excessive. The Advisor generally votes against stock option plans that do not meet the Advisor’s criteria. |
98
| | • | | Routine Matters — The Advisor generally votes for the ratification of auditors, procedural matters related to the annual meeting and changes in company name, and against bundled proposals and adjournment. |
The general provisions described above do not apply to investment companies. The Advisor generally votes proxies solicited by investment companies in accordance with the recommendations of an independent third party, except for proxies solicited by or with respect to investment companies for which the Advisor or an affiliate serves as the Advisor or principal underwriter (“affiliated investment companies”). The Advisor votes affiliated investment company proxies in the same proportion as the vote of the investment company’s other shareholders (sometimes called “mirror” or “echo” voting). Master fund proxies solicited from feeder funds are voted in accordance with applicable requirements of the Investment Company Act of 1940.
Although the Guidelines set forth the Advisor’s general voting positions on various proposals, the Advisor may, consistent with the Funds’ best interests, determine under some circumstances to vote contrary to those positions.
The Guidelines on a particular issue may or may not reflect the view of individual members of the Board or of a majority of the Board. In addition, the Guidelines may reflect a voting position that differs from the actual practices of the public companies within the Deutsche Bank organization or of the investment companies for which the Advisor or an affiliate serves as investment advisor or sponsor.
The Advisor may consider the views of a portfolio company’s management in deciding how to vote a proxy or in establishing general voting positions for the Guidelines, but management’s views are not determinative.
As mentioned above, the Policies describe the way in which the Advisor resolves conflicts of interest. To resolve conflicts, the advisor, under normal circumstances, votes proxies in accordance with its Guidelines.
If the Advisor departs from the Guidelines with respect to a particular proxy or if the Guidelines do not specifically address a certain proxy proposal, a proxy voting committee established by the advisor will vote the proxy. Before voting any such proxy, however, the Advisor’s conflicts review committee will conduct an investigation to determine whether any potential conflicts of interest exist in connection with the particular proxy proposal. If the conflicts review committee determines that the Advisor has a material conflict of interest, or certain individuals on the proxy voting committee should be recused from participating in a particular proxy vote, it will inform the proxy voting committee. If notified that the Advisor has a material conflict, or fewer than three voting members are eligible to participate in the proxy vote, typically the Advisor will engage an independent third party to vote the proxy or follow the proxy voting recommendations of an independent third party.
Under certain circumstances, the Advisor may not be able to vote proxies or the Advisor may find that the expected economic costs from voting outweigh the benefits associated with voting. For example, the Advisor may not vote proxies on certain foreign securities due to local restrictions or customs. The Advisor generally does not vote proxies on securities subject to share blocking restrictions.
You may obtain information about how the Fund voted proxies related to its portfolio securities during the 12-month period ended June 30 by visiting the SEC’s Web site at www.sec.gov or by visiting our Web site at: www.dws-scudder.com (click on “proxy voting” at the bottom page).
99
ADDITIONAL INFORMATION
The CUSIP number for each Portfolio is as follows:
| | |
| | | Class B |
DWS Conservative Allocation VIP | | 23338H461 |
DWS Growth Allocation VIP | | 23338H453 |
DWS Income Allocation VIP | | 23338H438 |
DWS Moderate Allocation VIP | | 23338H446 |
DWS Variable Series II has a fiscal year ending December 31.
FINANCIAL STATEMENTS
The audited financial statements, including the investment portfolios of each of the portfolios of DWS Variable Series II, together with the Report of Independent Registered Public Accounting Firm, Financial Highlights and notes to financial statements in the Annual Report to the Shareholders of each DWS Variable Series II portfolio dated December 31, 2005 are incorporated herein by reference and are hereby deemed to be a part of this Statement of Additional Information. A copy of the Fund’s Annual Report may be obtained without charge by contacting the Customer Service Center at the telephone number shown in the contract Prospectus.
100
APPENDIX
BOND AND COMMERCIAL PAPER RATINGS
Set forth below are descriptions of ratings which represent opinions as to the quality of the securities. It should be emphasized, however, that ratings are relative and subjective and are not absolute standards of quality.
MOODY’S INVESTORS SERVICE, INC. — CORPORATE BOND RATINGS
Aaa: Bonds which are rated Aaa are judged to be of the highest quality. They carry the smallest degree of investment risk and are generally referred to as “gilt-edged.” Interest payments are protected by a large or by an exceptionally stable margin and principal is secure. While the various protective elements are likely to change, such changes as can be visualized are most unlikely to impair the fundamentally strong position of such issues.
Aa: Bonds which are rated Aa are judged to be of high quality by all standards. Together with the Aaa group they comprise what are generally known as high grade bonds. They are rated lower than the best bonds because margins of protection may not be as large as in Aaa securities or fluctuations of protective elements may be of greater amplitude or there may be other elements present which make the long-term risk appear somewhat larger than in Aaa securities.
A: Bonds which are rated A possess many favorable investment attributes and are to be considered as upper-medium grade obligations. Factors giving security to principal and interest are considered adequate, but elements may be present which suggest a susceptibility to impairment sometime in the future.
Baa: Bonds which are rated Baa are considered as medium grade obligations, (i.e., they are neither highly protected nor poorly secured). Interest payments and principal security appear adequate for the present, but certain protective elements may be lacking or may be characteristically unreliable over any great length of time. Such bonds lack outstanding investment characteristics and in fact have speculative characteristics as well.
Ba: Bonds which are rated Ba are judged to have speculative elements; their future cannot be considered as well assured. Often the protection of interest and principal payments may be very moderate and thereby not well safe-guarded during both good and bad times over the future. Uncertainty of position characterizes bonds in this class.
B: Bonds which are rated B are considered speculative and generally lack characteristics of the desirable investment. Assurance of interest and principal payments or of maintenance of other terms of the contract over any long period of time may be small.
Caa: Bonds which are rated Caa are of poor standing. Such issues may be in default or there may be present elements of danger with respect to principal or interest.
Ca: Bonds which are rated Ca represent obligations which are highly speculative. Such issues are often in default or have other marked shortcomings.
C: Bonds which are rated C are the lowest rated class of bonds, typically are in default and can be regarded as having extremely poor prospects of ever attaining any real investment standing.
Note: Moody’s appends numerical modifiers 1, 2 and 3 to each generic rating classification from Aa through Caa in its corporate bond rating system. The modifier 1 indicates that the issue ranks in the higher end of its generic rating category; the modifier 2 indicates a mid-range ranking; and the modifier 3 indicates that the issue ranks in the lower end of its generic rating category.
101
MOODY’S INVESTORS SERVICE, INC. — SHORT-TERM RATINGS
Moody’s short-term debt ratings are opinions of the ability of issuers to honor short-term financial obligations. Ratings may be assigned to issuers, short-term programs or to individual short-term debt instruments. Such obligations generally have an original maturity not exceeding thirteen months, unless explicitly noted. Issuers rated Prime-1 or P-1 (or supporting institutions) have a superior ability for repayment of short-term debt obligations. Prime-1 or P-1 repayment ability will often be evidenced by many of the following characteristics:
| | • | | Leading market positions in well established industries. |
| | • | | High rates of return on funds employed. |
| | • | | Conservative capitalization structure with moderate reliance on debt and ample asset protection. |
| | • | | Broad margins in earnings coverage of fixed financial charges and high internal cash generation. |
| | • | | Well established access to a range of financial markets and assured sources of alternate liquidity. |
Issuers rated Prime-2 or P-2 (or supporting institutions) have a strong ability for repayment of short-term debt obligations. This will normally be evidenced by many of the characteristics cited above but to a lesser degree. Earnings trends and coverage ratios, while sound, may be more subject to variation. Capitalization characteristics, while still appropriate, may be more affected by external conditions. Ample alternate liquidity is maintained.
STANDARD & POOR’S RATINGS SERVICES — CORPORATE BOND RATINGS
INVESTMENT GRADE
AAA: Debt rated AAA has the highest rating assigned by S&P’s to a debt obligation. Capacity to pay interest and repay principal is extremely strong.
AA: Debt rated AA has a very strong capacity to pay interest and repay principal and differs from the higher rated issues only in small degree.
A: Debt rated A has a strong capacity to pay interest and repay principal although it is somewhat more susceptible to the adverse effects of changes in circumstances and economic conditions than bonds in higher rated categories.
BBB: Debt rated BBB has an adequate capacity to pay interest and repay principal. Whereas it normally exhibits adequate protection parameters, adverse economic conditions or changing circumstances are more likely to lead to a weakened capacity to pay interest and repay principal for debt in this category than in higher rated categories.
SPECULATIVE GRADE
Debt rated BB, B, CCC, CC, and C has significant speculative characteristics with respect to capacity to pay interest and repay principal. BB indicates the least degree of speculation and C the highest. While such debt will likely have some quality and protective characteristics, these may be outweighed by large uncertainties or major exposures to adverse conditions.
BB: Debt rated BB has less near-term vulnerability to default than other speculative issues. However, it faces major ongoing uncertainties or exposure to adverse business, financial, or economic conditions which could lead to inadequate capacity to meet timely interest and principal payments.
The BB rating category is also used for debt subordinated to senior debt that is assigned an actual or implied BBB- rating.
B: Debt rated B has a greater vulnerability to default but currently has the capacity to meet interest payments and principal repayments. Adverse business, financial, or economic conditions will likely impair capacity or willingness to pay interest and repay principal.
102
The B rating category is also used for debt subordinated to senior debt that is assigned an actual or implied BB or BB- rating.
CCC: Debt rated CCC has a current vulnerability to default, and is dependent upon favorable business, financial, and economic conditions to meet timely payment of interest and repayment of principal. In the event of adverse business, financial, or economic conditions, it is not likely to have the capacity to pay interest and repay principal.
The CCC rating category is also used for debt subordinated to senior debt that is assigned an actual or implied B or B- rating.
CC: Debt rated CC has a current high vulnerability to default, and is dependent upon favorable business, financial, and economic conditions to meet timely payment of interest and repayment of principal.
The rating CC is also applied to debt subordinated to senior debt which is assigned an actual or implied CCC debt rating.
C: The rating C is typically applied to debt subordinated to senior debt which is assigned an actual or implied CCC- debt rating. The C rating may be used to cover a situation where a bankruptcy petition has been filed, but debt service payments are continued.
C1: The Rating C1 is reserved for income bonds on which no interest is being paid.
D: Debt rated D is in payment default. The D rating category is used when interest payments or principal payments are not made on the date due even if the applicable grace period has not expired, unless Standard & Poor’s believes that such payments will be made during such grace period. The D rating also will be used upon the filing of a bankruptcy petition if debt service payments are jeopardized.
Plus (+) or Minus (-): The ratings from AA to CCC may be modified by the addition of a plus or minus sign to show relative standing within the major rating categories.
R: Debt rated ‘R’ is under regulatory supervision owing to its financial condition. During the pendency of the regulatory supervision, the regulators may have the power to favor one class of obligations over others or pay some obligations and not others.
N.R.: Bonds may lack a S&P’s rating because no public rating has been requested, because there is insufficient information on which to base a rating, or because S&P’s does not rate a particular type of obligation as a matter of policy.
STANDARD & POOR’S RATINGS SERVICES — SHORT-TERM RATINGS
S&P’s commercial paper rating is a current assessment of the likelihood of timely payment of debt considered short-term in the relevant market.
A-1: This highest category indicates that the degree of safety regarding timely payment is strong. Those issues determined to possess extremely strong safety characteristics are denoted with a plus (+) sign designation.
A-2: Capacity for timely payment on issues with this designation is satisfactory. However, the relative degree of safety is not as high as for issues designated A-1.
A-3: Issues carrying this designation have adequate capacity for timely payment. However, adverse economic conditions or changing circumstances are more likely to lead to a weakened capacity of the issuer to meet its financial commitments.
FITCH INVESTORS SERVICE, INC. — BOND RATINGS
INVESTMENT GRADE
AAA: Bonds considered to be investment grade and of the highest credit quality. The obligor has an exceptionally strong ability to pay interest and repay principal, which is unlikely to be affected by reasonably foreseeable events.
103
AA: Bonds considered to be investment grade and of very high credit quality. The obligor’s ability to pay interest and repay principal is very strong, although not quite as strong as bonds rated AAA. Bonds rated in the AAA and AA categories are not significantly vulnerable to foreseeable events.
A: Bonds considered to be investment grade and of high credit quality. The obligor’s ability to pay interest and repay principal is considered to be strong, but may be more vulnerable to adverse changes in economic conditions and circumstances than bonds with higher ratings.
BBB: Bonds considered to be investment grade and of good credit quality. The obligor’s ability to pay interest and repay principal is considered to be adequate. Adverse changes in economic conditions and circumstances, however, are more likely to have adverse impact on these bonds, and therefore, impair timely payment. The likelihood that the ratings of these bonds will fall below investment grade is higher than for bonds with higher ratings.
SPECULATIVE GRADE
BB: Bonds are considered speculative. The obligor’s ability to pay interest and repay principal may be affected over time by adverse economic changes. However, business or financial alternatives may be available which could assist the obligor in satisfying its debt service requirements.
B: Bonds are considered highly speculative. While bonds in this class are currently meeting debt service requirements, the probability of continued timely payment of principal and interest reflects the obligor’s limited margin of safety and the need for reasonable business and economic activity throughout the life of the issue.
CCC: Bonds have certain identifiable characteristics which, if not remedied, may lead to default. The ability to meet obligations requires an advantageous business and economic environment.
CC: Bonds are minimally protected. Default in payment of interest and/or principal seems probable over time.
C: Bonds are in imminent default in payment of interest or principal.
DDD, DD and D: Bonds are in default of interest and/or principal payments. Such bonds are extremely speculative and should be valued on the basis of their ultimate recovery value in liquidation or reorganization of the obligor. DDD represents the highest potential for recovery on these bonds, and D represents the lowest potential for recovery.
Plus (+) or Minus (-): The ratings from AA to CC may be appended by the addition of a plus or minus sign to denote the relative status within the rating category.
NR: Indicates that Fitch Rating does not publicly rate the specific issue.
FITCH INVESTORS SERVICE, INC. — SHORT-TERM RATINGS
Fitch’s short-term ratings apply to debt obligations that are payable on demand or have original maturities of generally up to three years, including commercial paper, certificates of deposit, medium-term notes, and municipal and investment notes.
F-1+: Exceptionally Strong Credit Quality. Issues assigned this rating are regarded as having the strongest capacity for timely payment.
F-1: Very Strong Credit Quality. Issues assigned this rating reflect a capacity for timely payment only slightly less than issues rated F-1+.
F-2: Good Credit Quality. Issues assigned this rating have a satisfactory capacity for timely payment, but the margin of safety is not as great as the F-1+ and F-1 categories.
F-3: Fair Credit Quality. Issues assigned this rating have characteristics suggesting that the capacity for timely payment is adequate; however, near-term adverse changes could cause these securities to be rated below investment grade.
104
B: Speculative. Minimal capacity for timely payment of financial commitments, plus vulnerability to near-term adverse changes in financial and economic conditions.
C: High default risk. Default is a real possibility. Capacity for meeting financial commitments is solely reliant upon a sustained, favorable business and economic environment.
D: Default. Denotes actual or imminent payment default.
105

DECEMBER 31, 2005
ANNUAL REPORT
DWS VARIABLE SERIES II
(formerly Scudder Variable Series II)
DWS Balanced VIP
DWS Blue Chip VIP
DWS Conservative Allocation VIP
DWS Core Fixed Income VIP
DWS Davis Venture Value VIP
DWS Dreman Financial Services VIP
DWS Dreman High Return Equity VIP
DWS Dreman Small Cap Value VIP
DWS Global Thematic VIP
DWS Government & Agency Securities VIP
DWS Growth Allocation VIP
DWS High Income VIP
DWS Income Allocation VIP
DWS International Select Equity VIP
DWS Janus Growth & Income VIP
DWS Janus Growth Opportunities VIP
DWS Large Cap Value VIP
DWS Mercury Large Cap Core VIP
DWS MFS Strategic Value VIP
DWS Mid Cap Growth VIP
DWS Moderate Allocation VIP
DWS Money Market VIP
DWS Oak Strategic Equity VIP
DWS Salomon Aggressive Growth VIP
DWS Small Cap Growth VIP
DWS Strategic Income VIP
DWS Technology VIP
DWS Templeton Foreign Value VIP
DWS Turner Mid Cap Growth VIP
Contents
Performance Summary, Information About Your Portfolio’s Expenses, Management Summary, Portfolio Summary, Investment Portfolio, Financial Statements and Financial Highlights for:
2
This report must be preceded or accompanied by a prospectus. To obtain a prospectus, call (800) 778-1482 or your financial representative. We advise you to carefully consider the product’s objectives, risks, charges and expenses before investing. The prospectus contains this and other important information about the product. Please read the prospectus carefully before you invest.
NOT FDIC/NCUA INSURED NO BANK GUARANTEE MAY LOSE VALUE NOT A DEPOSIT NOT INSURED BY ANY FEDERAL GOVERNMENT AGENCY
Investments in variable portfolios involve risk. Some portfolios have more risk than others. These include portfolios that allow exposure to or otherwise concentrate investments in certain sectors, geographic regions, security types, market capitalization or foreign securities (e.g., political or economic instability, which can be accentuated in Emerging Market countries). Please read the prospectus for specific details regarding its investments and risk profile.
DWS Scudder is part of Deutsche Asset Management, which is the marketing name in the US for the asset management activities of Deutsche Bank AG, Deutsche Bank Trust Company Americas, Deutsche Asset Management, Inc., Deutsche Investment Management Americas Inc. and DWS Trust Company.
Effective October 28, 2005, Scudder Aggressive Growth Portfolio changed its name to Scudder Mid Cap Growth Portfolio, and effective August 1, 2005, SVS INVESCO Dynamic Growth Portfolio changed its name to Scudder Salomon Aggressive Growth Portfolio.
Performance Summary December 31, 2005
DWS Balanced VIP
All performance shown is historical, assumes reinvestment of all dividend and capital gain distributions and does not guarantee future results. Investment return and principal value fluctuate with changing market conditions so that, when redeemed, shares may be worth more or less than their original cost. Current performance may be lower or higher than the performance data quoted. Please visit www.dws-scudder.com for the Portfolio’s most recent month-end performance. Performance doesn’t reflect charges and fees (“contract charges”) associated with the separate account that invests in the Portfolio or any variable life insurance policy or variable annuity contract for which the Portfolio is an investment option. These charges and fees will reduce returns. While all share classes have the same underlying portfolio, their performance will differ.
The Portfolio is subject to stock market risk, meaning stocks in the Portfolio may decline in value for extended periods of time due to the activities and financial prospects of individual companies, or due to general market and economic conditions. The Portfolio also invests in individual bonds whose yields and market values fluctuate so that your investment may be worth more or less than its original cost. Bond investments are subject to interest-rate risk such that when interest rates rise, the prices of the bonds, and thus the value of the bond portfolio, can decline and the investor can lose principal value. Please read this Portfolio’s prospectus for specific details regarding its investments and risk profile.
Portfolio returns shown for all periods reflect a fee waiver and/or expense reimbursement. Without this waiver/reimbursement, returns would have been lower.
Growth of an Assumed $10,000 Investment in DWS Balanced VIP from 12/31/1995 to 12/31/2005
¨ DWS Balanced VIP — Class A
¨ S&P 500 Index
¨ Lehman Brothers Aggregate Bond Index
Yearly periods ended December 31
The Standard & Poor’s (S&P) 500 Index is an unmanaged capitalization-weighted index of 500 stocks. The index is designed to measure performance of the broad domestic economy through changes in the aggregate market value of 500 stocks representing all major industries. The Lehman Brothers Aggregate Bond Index is an unmanaged market value-weighted measure of treasury issues, agency issues, corporate and issues and mortgage securities.
Index returns assume reinvested dividends and, unlike Portfolio returns, do not reflect any fees or expenses. It is not possible to invest directly into an index
4
Comparative Results
| | | | | | | | | | | | | | | | | | |
DWS Balanced VIP | | | | 1-Year | | | 3-Year | | | 5-Year | | | 10-Year | |
Class A | | Growth of $10,000 | | $ | 10,430 | | | $ | 13,136 | | | $ | 10,464 | | | $ | 18,867 | |
| | Average annual total return | | | 4.30 | % | | | 9.52 | % | | | .91 | % | | | 6.55 | % |
S&P 500 Index | | Growth of $10,000 | | $ | 10,491 | | | $ | 14,970 | | | $ | 10,275 | | | $ | 23,836 | |
| | Average annual total return | | | 4.91 | % | | | 14.39 | % | | | .54 | % | | | 9.07 | % |
Lehman Brothers Aggregate Bond Index | | Growth of $10,000 | | $ | 10,243 | | | $ | 11,126 | | | $ | 13,303 | | | $ | 18,189 | |
| | Average annual total return | | | 2.43 | % | | | 3.62 | % | | | 5.87 | % | | | 6.16 | % |
| | | | | |
DWS Balanced VIP | | | | | | | 1-Year | | | 3-Year | | | Life of Class* | |
Class B | | Growth of $10,000 | | | | | | $ | 10,390 | | | $ | 12,991 | | | $ | 12,444 | |
| | Average annual total return | | | | | | | 3.90 | % | | | 9.11 | % | | | 6.45 | % |
S&P 500 Index | | Growth of $10,000 | | | | | | $ | 10,491 | | | $ | 14,970 | | | $ | 13,428 | |
| | Average annual total return | | | | | | | 4.91 | % | | | 14.39 | % | | | 8.79 | % |
Lehman Brothers Aggregate Bond Index | | Growth of $10,000 | | | | | | $ | 10,243 | | | $ | 11,126 | | | $ | 11,819 | |
| | Average annual total return | | | | | | | 2.43 | % | | | 3.62 | % | | | 4.89 | % |
The growth of $10,000 is cumulative.
| * | The Portfolio commenced offering Class B shares on July 1, 2002. Index returns begin June 30, 2002. |
Information About Your Portfolio’s Expenses
DWS Balanced VIP
As an investor of the Portfolio, you incur two types of costs: ongoing expenses and transaction costs. Ongoing expenses include management fees, distribution and service (12b-1) fees and other Portfolio expenses. Examples of transaction costs include sales charges (loads), redemption fees and account maintenance fees, which are not shown in this section. The following tables are intended to help you understand your ongoing expenses (in dollars) of investing in the Portfolio and to help you compare these expenses with the ongoing expenses of investing in other mutual funds. In the most recent six-month period, the Advisor limited these expenses, had they not done so, expenses would have been higher. The tables are based on an investment of $1,000 made at the beginning of the six-month period ended December 31, 2005.
The tables illustrate your Portfolio’s expenses in two ways:
Actual Portfolio Return. This helps you estimate the actual dollar amount of ongoing expenses (but not transaction costs) paid on a $1,000 investment in the Portfolio using the Portfolio’s actual return during the period. To estimate the expenses you paid over the period, simply divide your account value by $1,000 (for example, an $8,600 account value divided by $1,000 = 8.6), then multiply the result by the number in the “Expenses Paid per $1,000” line under the share class you hold.
Hypothetical 5% Portfolio Return. This helps you to compare your Portfolio’s ongoing expenses (but not transaction costs) with those of other mutual funds using the Portfolio’s actual expense ratio and a hypothetical rate of return of 5% per year before expenses. Examples using a 5% hypothetical Portfolio return may be found in the shareholder reports of other mutual funds. The hypothetical account values and expenses may not be used to estimate the actual ending account balance or expenses you paid for the period.
5
Please note that the expenses shown in these tables are meant to highlight your ongoing expenses only and do not reflect any transaction costs. The “Expenses Paid per $1,000” line of the tables is useful in comparing ongoing expenses only and will not help you determine the relative total expense of owning different funds. If these transaction costs had been included, your costs would have been higher.
Expenses and Value of a $1,000 Investment for the six months ended December 31, 2005
| | | | | | |
Actual Portfolio Return | | Class A | | Class B |
Beginning Account Value 7/1/05 | | $ | 1,000.00 | | $ | 1,000.00 |
Ending Account Value 12/31/05 | | $ | 1,035.00 | | $ | 1,033.20 |
Expenses Paid per $1,000* | | $ | 2.62 | | $ | 4.56 |
| | |
Hypothetical 5% Portfolio Return | | Class A | | Class B |
Beginning Account Value 7/1/05 | | $ | 1,000.00 | | $ | 1,000.00 |
Ending Account Value 12/31/05 | | $ | 1,022.63 | | $ | 1,020.72 |
Expenses Paid per $1,000* | | $ | 2.60 | | $ | 4.53 |
| * | Expenses are equal to the Portfolio’s annualized expense ratio for each share class, multiplied by the average account value over the period, multiplied by the number of days in the most recent six-month period, then divided by 365. |
| | | | | | |
Annualized Expense Ratios | | Class A | | | Class B | |
DWS Variable Series II — DWS Balanced VIP | | .51 | % | | .89 | % |
For more information, please refer to the Portfolio’s prospectus.
These tables do not reflect charges and fees (“contract charges”) associated with the separate account that invests in the portfolio or any variable life insurance policy or variable annuity contract for which the portfolio is an investment option.
Management Summary December 31, 2005
DWS Balanced VIP
The US economy posted positive growth for all four quarters of 2005, with concerns about inflation and the sustainability of the economic expansion seeming to abate as the year progressed. All major asset classes — equities, bonds and cash — had positive returns for the year.
For the 12 months ended December 31, 2005, the return of DWS Balanced VIP (Class A shares, unadjusted for contract charges) was 4.30%. As expected, since this Portfolio invests in a blend of equity and bond securities, the Portfolio’s return was between those of our major equity and bond benchmarks, the Standard & Poor’s 500 (S&P 500) Index, which returned 4.91%, and the Lehman Brothers Aggregate Bond Index, with a return of 2.43%. The Portfolio’s Lipper peer group of Balanced Funds had an average return of 4.69%.
During 2005, the Portfolio’s asset allocation was close to the revised targets defined in the fourth quarter of 2004 for each of the major asset classes, which are large-cap growth, large-cap value, small cap, investment-grade bonds and high-yield bonds. Throughout the year, equities were overweight and bonds were underweight relative to the target allocations. For most of the year, large-cap growth stocks were the most tactically overweight asset class; this positioning contributed to performance. On balance, tactical asset allocations (that is, overweights or underweights of asset classes relative to the strategic targets) contributed marginally to performance.
6
Among the equity strategies, large-cap growth had an excellent year, largely because of an overweight in energy, which was the best-performing sector. The large-cap value portion of the Portfolio lagged, mainly because of an emphasis on high-quality large-cap stocks at a time that lower-quality mid-cap issues were performing better, and also because of an emphasis within the energy industry on large integrated oil companies, which performed well but not as well as oil service companies. The small-cap portion of the Portfolio also disappointed, with most of the underperformance occurring in the second half of the year when lower-quality stocks with little or no earnings rallied; this Portfolio’s focus is on higher-quality issues. Performance of the high-yield bond portion of the fixed-income Portfolio was exceptionally strong. The core fixed-income sleeve also outperformed its benchmark, the Lehman Brothers Aggregate Bond Index.
Andrew P. Cestone Thomas F. Sassi
William Chepolis, CFA Julie M. Van Cleave, CFA
Inna Okounkova Robert Wang
Portfolio Managers
Deutsche Investment Management Americas Inc.
All performance shown is historical, assumes reinvestment of all dividend and capital gain distributions, and does not guarantee future results. Investment return and principal value fluctuate with changing market conditions so that, when redeemed, shares may be worth more or less than their original cost. Current performance may be lower or higher than the performance data quoted. Please visit www.dws-scudder.com for the product’s most recent month-end performance. Performance doesn’t reflect charges and fees (“contract charges”) associated with the separate account that invests in the Portfolio or any variable life insurance policy or variable annuity contract for which the Portfolio is an investment option. These charges and fees will reduce returns.
Risk Considerations
The Portfolio is subject to stock market risk, meaning stocks in the Portfolio may decline in value for extended periods of time due to the activities and financial prospects of individual companies, or due to general market and economic conditions. The Portfolio also invests in individual bonds whose yields and market values fluctuate so that your investment may be worth more or less than its original cost. Bond investments are subject to interest-rate risk such that when interest rates rise, the prices of the bonds, and thus the value of the bond portfolio, can decline and the investor can lose principal value. Please read this Portfolio’s prospectus for specific details regarding its investments and risk profile.
The Standard & Poor’s 500 (S&P 500) Index is an unmanaged capitalization-weighted index of 500 stocks. The index is designed to measure performance of the broad domestic economy through changes in the aggregate market value of 500 stocks representing all major industries.
The Lehman Brothers Aggregate Bond Index is an unmanaged, market-value-weighted measure of treasury issues, agency issues, corporate bond issues and mortgage securities.
Index returns assume reinvestment of all dividends and, unlike portfolio returns, do not reflect any fees or expenses. It is not possible to invest directly into an index.
The Lipper Balanced Fund category includes funds whose primary objective is to conserve principal by maintaining at all times a balanced portfolio of both stocks and bonds. Typically, the stock/bond ratio ranges around 60%/40%. It is not possible to invest directly in a Lipper category.
Portfolio management market commentary is as of December 31, 2005, and may not come to pass. This information is subject to change at any time based on market and other conditions.
7
Portfolio Summary
DWS Balanced VIP
| | | | | | |
Asset Allocation (Excludes Securities Lending Collateral) | | 12/31/05 | | | 12/31/04 | |
Common Stocks | | 58 | % | | 60 | % |
Corporate Bonds | | 12 | % | | 11 | % |
Commercial and Non-Agency Mortgage Backed Securities | | 7 | % | | 2 | % |
Cash Equivalents | | 5 | % | | 3 | % |
Collateralized Mortgage Obligations | | 5 | % | | 7 | % |
US Treasury Obligations | | 3 | % | | 4 | % |
Foreign Bonds — US$ Denominated | | 3 | % | | 5 | % |
US Government Agency Sponsored Pass-Throughs | | 2 | % | | 1 | % |
Asset Backed | | 2 | % | | 3 | % |
Municipal Bonds and Notes | | 2 | % | | 2 | % |
US Government Sponsored Agencies | | 1 | % | | — | |
Foreign Bonds — Non US$ Denominated | | — | | | 1 | % |
Government National Mortgage Association | | — | | | 1 | % |
| | | | | | |
| | 100 | % | | 100 | % |
| | | | | | |
| | |
Sector Diversification (As a % of Corporate Bonds and Foreign Bonds) | | 12/31/05 | | | 12/31/04 | |
Financials | | 19 | % | | 19 | % |
Information Technology | | 18 | % | | 19 | % |
Consumer Discretionary | | 12 | % | | 12 | % |
Energy | | 12 | % | | 9 | % |
Health Care | | 12 | % | | 16 | % |
Industrials | | 10 | % | | 11 | % |
Consumer Staples | | 7 | % | | 8 | % |
Materials | | 4 | % | | 4 | % |
Utilities | | 3 | % | | 1 | % |
Telecommunication Services | | 3 | % | | 1 | % |
| | | | | | |
| | 100 | % | | 100 | % |
| | | | | | |
Asset allocation and sector diversification are subject to change.
For more complete details about the Portfolio’s investment portfolio, see page 8. A quarterly Fact Sheet is available upon request. Information concerning portfolio holdings of the Portfolio as of month end will be posted to www.dws-scudder.com on the 15th of the following month.
Following the Portfolio’s fiscal first and third quarter-end, a complete portfolio holdings listing is filed with the SEC on Form N-Q. The form will be available on the SEC’s Web site at www.sec.gov, and it also may be reviewed and copied at the SEC’s Public Reference Room in Washington, D.C. Information on the operation of the SEC’s Public Reference Room may be obtained by calling (800) SEC-0330.
8
Investment Portfolio December 31, 2005
DWS Balanced VIP
| | | | |
| | | Shares | | Value ($) |
Common Stocks 58.2% | | | | |
Consumer Discretionary 5.7% | | | | |
Auto Components 0.2% | | | | |
American Axle & Manufacturing Holdings, Inc. | | 20,800 | | 381,264 |
ArvinMeritor, Inc. | | 24,500 | | 352,555 |
CSK Auto Corp.* | | 23,200 | | 349,856 |
Modine Manufacturing Co. | | 7,700 | | 250,943 |
| | | | |
| | | | 1,334,618 |
| | | | |
Automobiles 0.3% | | | | |
Harley-Davidson, Inc. | | 34,000 | | 1,750,660 |
| | | | |
Distributors 0.0% | | | | |
Audiovox Corp. “A”* | | 16,100 | | 223,146 |
| | | | |
Diversified Consumer Services 0.1% | | | | |
Alderwoods Group, Inc.* | | 22,500 | | 357,075 |
| | | | |
Hotels Restaurants & Leisure 0.4% | | | | |
Ameristar Casinos, Inc. | | 15,000 | | 340,500 |
CKE Restaurants, Inc. | | 15,200 | | 205,352 |
Luby’s, Inc.* | | 9,700 | | 129,010 |
MTR Gaming Group, Inc.* | | 4,600 | | 47,886 |
Multimedia Games, Inc.* | | 27,900 | | 258,075 |
RARE Hospitality International, Inc.* | | 12,800 | | 388,992 |
Starbucks Corp.* | | 48,900 | | 1,467,489 |
| | | | |
| | | | 2,837,304 |
| | | | |
Household Durables 0.2% | | | | |
American Woodmark Corp. | | 9,600 | | 237,984 |
Fortune Brands, Inc. | | 17,000 | | 1,326,340 |
| | | | |
| | | | 1,564,324 |
| | | | |
Internet & Catalog Retail 0.3% | | | | |
Blair Corp. | | 400 | | 15,576 |
eBay, Inc.* | | 41,800 | | 1,807,850 |
Stamps.com, Inc.* | | 7,400 | | 169,904 |
| | | | |
| | | | 1,993,330 |
| | | | |
Leisure Equipment & Products 0.0% | | | | |
JAKKS Pacific, Inc.* | | 12,400 | | 259,656 |
| | | | |
Media 0.9% | | | | |
LodgeNet Entertainment Corp.* | | 1,400 | | 19,516 |
McGraw-Hill Companies, Inc. | | 52,100 | | 2,689,923 |
Mediacom Communications Corp. ”A”* | | 50,000 | | 274,500 |
Omnicom Group, Inc. | | 28,700 | | 2,443,231 |
Playboy Enterprises, Inc. “B”* | | 6,800 | | 94,452 |
Sinclair Broadcast Group, Inc. “A” | | 36,400 | | 334,880 |
| | | | |
| | | | 5,856,502 |
| | | | |
Multiline Retail 1.2% | | | | |
Federated Department Stores, Inc. | | 16,000 | | 1,061,280 |
Kohl’s Corp.* | | 71,600 | | 3,479,760 |
Target Corp. | | 60,300 | | 3,314,691 |
The Bon-Ton Stores, Inc. | | 10,900 | | 208,517 |
| | | | |
| | | | 8,064,248 |
| | | | |
Specialty Retail 2.0% | | | | |
Bed Bath & Beyond, Inc.* | | 21,600 | | 780,840 |
Cato Corp. “A” | | 3,550 | | 76,147 |
9
| | | | |
| | | Shares | | Value ($) |
Charming Shoppes, Inc.* | | 26,100 | | 344,520 |
Home Depot, Inc. | | 12,200 | | 493,856 |
Jos. A. Bank Clothiers, Inc.* | | 7,100 | | 308,211 |
Limited Brands, Inc. | | 85,400 | | 1,908,690 |
Lowe’s Companies, Inc. | | 48,300 | | 3,219,678 |
Pacific Sunwear of California, Inc.* | | 16,700 | | 416,164 |
Payless ShoeSource, Inc.* | | 16,800 | | 421,680 |
Select Comfort Corp.* | | 11,400 | | 311,790 |
Staples, Inc. | | 79,000 | | 1,794,090 |
TJX Companies, Inc. | | 163,500 | | 3,798,105 |
Trans World Entertainment Corp.* | | 21,000 | | 119,700 |
| | | | |
| | | | 13,993,471 |
| | | | |
Textiles, Apparel & Luxury Goods 0.1% | | | | |
Guess?, Inc.* | | 7,400 | | 263,440 |
Steven Madden Ltd. | | 12,500 | | 365,375 |
| | | | |
| | | | 628,815 |
| | | | |
Consumer Staples 4.8% | | | | |
Beverages 0.8% | | | | |
Diageo PLC | | 50,394 | | 730,472 |
PepsiCo, Inc. | | 77,080 | | 4,553,887 |
| | | | |
| | | | 5,284,359 |
| | | | |
Food & Staples Retailing 1.0% | | | | |
Casey’s General Stores, Inc. | | 9,300 | | 230,640 |
Longs Drug Stores Corp. | | 9,400 | | 342,066 |
Nash-Finch Co. | | 8,100 | | 206,388 |
Pantry, Inc.* | | 6,200 | | 291,338 |
Wal-Mart Stores, Inc. | | 61,600 | | 2,882,880 |
Walgreen Co. | | 60,600 | | 2,682,156 |
| | | | |
| | | | 6,635,468 |
| | | | |
Food Products 1.4% | | | | |
Chiquita Brands International, Inc. | | 17,000 | | 340,170 |
Dean Foods Co.* | | 28,400 | | 1,069,544 |
General Mills, Inc. | | 50,400 | | 2,485,728 |
Kellogg Co. | | 39,200 | | 1,694,224 |
Ralcorp Holdings, Inc.* | | 5,600 | | 223,496 |
Sanderson Farms, Inc. | | 10,100 | | 308,353 |
Seaboard Corp. | | 100 | | 151,100 |
The Hershey Co. | | 23,100 | | 1,276,275 |
Unilever NV (NY Shares) | | 28,500 | | 1,956,525 |
| | | | |
| | | | 9,505,415 |
| | | | |
Household Products 1.6% | | | | |
Colgate-Palmolive Co. | | 67,700 | | 3,713,345 |
Kimberly-Clark Corp. | | 54,800 | | 3,268,820 |
Procter & Gamble Co. | | 70,300 | | 4,068,964 |
| | | | |
| | | | 11,051,129 |
| | | | |
Personal Products 0.0% | | | | |
USANA Health Sciences, Inc.* | | 7,000 | | 268,520 |
| | | | |
Energy 7.9% | | | | |
Energy Equipment & Services 2.1% | | | | |
Baker Hughes, Inc. | | 79,100 | | 4,807,698 |
Crosstex Energy, Inc. | | 600 | | 37,836 |
Halliburton Co. | | 43,300 | | 2,682,868 |
Noble Corp. | | 13,000 | | 917,020 |
Parker Drilling Co.* | | 5,900 | | 63,897 |
10
| | | | |
| | | Shares | | Value ($) |
Schlumberger Ltd. | | 32,900 | | 3,196,235 |
Transocean, Inc.* | | 42,830 | | 2,984,823 |
| | | | |
| | | | 14,690,377 |
| | | | |
Oil, Gas & Consumable Fuels 5.8% | | | | |
Berry Petroleum Co. “A” | | 700 | | 40,040 |
BP PLC (ADR) | | 44,800 | | 2,877,056 |
Cabot Oil & Gas Corp. | | 10,400 | | 469,040 |
Chevron Corp. | | 78,400 | | 4,450,768 |
Comstock Resources, Inc.* | | 10,900 | | 332,559 |
ConocoPhillips | | 84,940 | | 4,941,809 |
Devon Energy Corp. | | 59,400 | | 3,714,876 |
Energy Partners Ltd.* | | 14,800 | | 322,492 |
EOG Resources, Inc. | | 51,000 | | 3,741,870 |
ExxonMobil Corp. | | 118,700 | | 6,667,379 |
Frontier Oil Corp. | | 9,500 | | 356,535 |
Giant Industries, Inc.* | | 5,100 | | 264,996 |
Harvest Natural Resources, Inc.* | | 26,100 | | 231,768 |
KCS Energy, Inc.* | | 12,200 | | 295,484 |
Marathon Oil Corp. | | 41,100 | | 2,505,867 |
Penn Virginia Corp. | | 6,700 | | 384,580 |
PetroChina Co., Ltd. (ADR) | | 9,600 | | 786,816 |
PetroQuest Energy, Inc.* | | 25,800 | | 213,624 |
Remington Oil & Gas Corp.* | | 3,300 | | 120,450 |
Royal Dutch Shell PLC “A” (ADR) | | 42,000 | | 2,582,580 |
Swift Energy Co.* | | 8,700 | | 392,109 |
Valero Energy Corp. | | 48,600 | | 2,507,760 |
XTO Energy, Inc. | | 37,766 | | 1,659,438 |
| | | | |
| | | | 39,859,896 |
| | | | |
Financials 9.7% | | | | |
Banks 4.0% | | | | |
AmSouth Bancorp. | | 89,600 | | 2,348,416 |
BancFirst Corp. | | 600 | | 47,400 |
Bank of America Corp. | | 160,400 | | 7,402,460 |
Center Financial Corp. | | 15,900 | | 400,044 |
City Holding Co. | | 3,700 | | 133,015 |
Corus Bankshares, Inc. | | 2,200 | | 123,794 |
CVB Financial Corp. | | 3,775 | | 76,670 |
Fidelity Bancshares, Inc. | | 5,350 | | 174,945 |
First Community Bancorp. | | 4,200 | | 228,354 |
First Niagara Financial Group, Inc. | | 4,400 | | 63,668 |
First Place Financial Corp. | | 1,100 | | 26,455 |
FirstFed Financial Corp.* | | 3,100 | | 169,012 |
Fremont General Corp. | | 16,100 | | 374,003 |
Frontier Financial Corp. | | 2,050 | | 65,600 |
Hanmi Financial Corp. | | 11,000 | | 196,460 |
Macatawa Bank Corp. | | 900 | | 32,742 |
Midwest Banc Holdings, Inc. | | 4,400 | | 97,900 |
Oriental Financial Group, Inc. | | 31,400 | | 388,104 |
Pacific Capital Bancorp. | | 3,200 | | 113,856 |
PFF Bancorp., Inc. | | 4,450 | | 135,814 |
PNC Financial Services Group, Inc. | | 35,000 | | 2,164,050 |
Prosperity Bancshares, Inc. | | 8,500 | | 244,290 |
Republic Bancorp., Inc. | | 450 | | 5,355 |
Sterling Bancshares, Inc. | | 21,400 | | 330,416 |
SunTrust Banks, Inc. | | 17,900 | | 1,302,404 |
SVB Financial Group* | | 10,700 | | 501,188 |
TierOne Corp. | | 7,600 | | 223,516 |
Umpqua Holdings Corp. | | 1,000 | | 28,530 |
US Bancorp. | | 57,300 | | 1,712,697 |
Wachovia Corp. | | 78,900 | | 4,170,654 |
Wells Fargo & Co. | | 60,800 | | 3,820,064 |
West Coast Bancorp. | | 1,700 | | 44,965 |
11
| | | | |
| | | Shares | | Value ($) |
WSFS Financial Corp. | | 3,800 | | 232,750 |
| | | | |
| | | | 27,379,591 |
| | | | |
Capital Markets 1.7% | | | | |
Bear Stearns Companies, Inc. | | 16,400 | | 1,894,692 |
Investment Technology Group, Inc.* | | 9,300 | | 329,592 |
Lehman Brothers Holdings, Inc. | | 18,000 | | 2,307,060 |
Merrill Lynch & Co., Inc. | | 40,900 | | 2,770,157 |
Morgan Stanley | | 32,500 | | 1,844,050 |
Piper Jaffray Companies, Inc.* | | 12,400 | | 500,960 |
The Goldman Sachs Group, Inc. | | 15,100 | | 1,928,421 |
| | | | |
| | | | 11,574,932 |
| | | | |
Consumer Finance 0.3% | | | | |
American Express Co. | | 32,400 | | 1,667,304 |
| | | | |
Diversified Financial Services 1.9% | | | | |
Apollo Investment Corp. | | 6,060 | | 108,656 |
Citigroup, Inc. | | 118,732 | | 5,762,064 |
CompuCredit Corp.* | | 7,100 | | 273,208 |
Freddie Mac | | 33,200 | | 2,169,620 |
JPMorgan Chase & Co. | | 111,100 | | 4,409,559 |
Partners Trust Financial Group, Inc. | | 14,800 | | 178,340 |
Santander BanCorp | | 3,000 | | 75,360 |
TNS, Inc.* | | 13,600 | | 260,848 |
| | | | |
| | | | 13,237,655 |
| | | | |
Insurance 1.2% | | | | |
AFLAC, Inc. | | 81,800 | | 3,797,156 |
American International Group, Inc. | | 50,400 | | 3,438,792 |
Bristol West Holdings, Inc. | | 6,100 | | 116,083 |
Navigators Group, Inc.* | | 6,700 | | 292,187 |
Tower Group, Inc. | | 22,500 | | 494,550 |
Zenith National Insurance Corp. | | 3,000 | | 138,360 |
| | | | |
| | | | 8,277,128 |
| | | | |
Real Estate 0.6% | | | | |
Brandywine Realty Trust (REIT) | | 7,000 | | 195,370 |
Colonial Properties Trust (REIT) | | 4,700 | | 197,306 |
Commercial Net Lease Realty (REIT) | | 9,100 | | 185,367 |
Corporate Office Properties Trust (REIT) | | 4,900 | | 174,146 |
Cousins Properties, Inc. (REIT) | | 5,700 | | 161,310 |
EastGroup Properties, Inc. (REIT) | | 1,500 | | 67,740 |
FelCor Lodging Trust, Inc. (REIT) | | 12,000 | | 206,520 |
First Industrial Realty Trust, Inc. (REIT) | | 3,100 | | 119,350 |
Glenborough Realty Trust, Inc. (REIT) | | 4,000 | | 72,400 |
Glimcher Realty Trust (REIT) | | 3,800 | | 92,416 |
Heritage Property Investment Trust (REIT) | | 4,900 | | 163,660 |
Highwoods Properties, Inc. (REIT) | | 7,500 | | 213,375 |
Home Properties, Inc. (REIT) | | 4,500 | | 183,600 |
Jones Lang LaSalle, Inc. (REIT) | | 8,800 | | 443,080 |
Kilroy Realty Corp. (REIT) | | 2,800 | | 173,320 |
Lexington Corporate Properties Trust (REIT) | | 10,100 | | 215,130 |
LTC Properties, Inc. (REIT) | | 1,300 | | 27,339 |
Maguire Properties, Inc. (REIT) | | 200 | | 6,180 |
Nationwide Health Properties, Inc. (REIT) | | 10,300 | | 220,420 |
Newcastle Investment Corp. (REIT) | | 6,300 | | 156,555 |
OMEGA Healthcare Investors, Inc. (REIT) | | 2,500 | | 31,475 |
Parkway Properties, Inc. (REIT) | | 3,600 | | 144,504 |
12
| | | | |
| | | Shares | | Value ($) |
Pennsylvania Real Estate Investment Trust (REIT) | | 2,900 | | 108,344 |
Senior Housing Properties Trust (REIT) | | 11,700 | | 197,847 |
Sun Communities, Inc. (REIT) | | 1,600 | | 50,240 |
Taubman Centers, Inc. (REIT) | | 4,100 | | 142,475 |
Town & Country Trust (REIT) | | 1,200 | | 40,572 |
Urstadt Biddle Properties “A” (REIT) | | 1,200 | | 19,452 |
Washington Real Estate Investment Trust (REIT) | | 7,500 | | 227,625 |
| | | | |
| | | | 4,237,118 |
| | | | |
Health Care 8.1% | | | | |
Biotechnology 1.8% | | | | |
Albany Molecular Research, Inc.* | | 21,500 | | 261,225 |
Alkermes, Inc.* | | 17,900 | | 342,248 |
Amgen, Inc.* | | 30,300 | | 2,389,458 |
Digene Corp.* | | 7,900 | | 230,443 |
Genentech, Inc.* | | 56,300 | | 5,207,750 |
Geron Corp.* | | 19,800 | | 170,478 |
Gilead Sciences, Inc.* | | 66,700 | | 3,510,421 |
ImmunoGen, Inc.* | | 32,000 | | 164,160 |
| | | | |
| | | | 12,276,183 |
| | | | |
Health Care Equipment & Supplies 2.0% | | | | |
Align Technology, Inc.* | | 32,700 | | 211,569 |
Alliance Imaging, Inc.* | | 35,600 | | 211,820 |
American Medical Systems Holdings, Inc.* | | 18,800 | | 335,204 |
Baxter International, Inc. | | 119,600 | | 4,502,940 |
Boston Scientific Corp.* | | 46,700 | | 1,143,683 |
C.R. Bard, Inc. | | 18,700 | | 1,232,704 |
Cypress Bioscience, Inc.* | | 28,700 | | 165,886 |
DJ Orthopedics, Inc.* | | 3,000 | | 82,740 |
Integra LifeSciences Holdings* | | 9,300 | | 329,778 |
Medtronic, Inc. | | 47,000 | | 2,705,790 |
Mentor Corp. | | 7,400 | | 340,992 |
Vital Images, Inc.* | | 6,900 | | 180,435 |
Zimmer Holdings, Inc.* | | 38,600 | | 2,603,184 |
| | | | |
| | | | 14,046,725 |
| | | | |
Health Care Providers & Services 1.3% | | | | |
Chemed Corp. | | 5,200 | | 258,336 |
CorVel Corp.* | | 15,900 | | 301,941 |
LCA-Vision, Inc. | | 800 | | 38,008 |
Magellan Health Services, Inc.* | | 11,600 | | 364,820 |
MedCath Corp.* | | 12,500 | | 231,875 |
Odyssey HealthCare, Inc.* | | 14,200 | | 264,688 |
Pediatrix Medical Group, Inc.* | | 4,200 | | 371,994 |
Per-Se Technologies, Inc.* | | 11,900 | | 277,984 |
United Surgical Partners International, Inc.* | | 10,300 | | 331,145 |
UnitedHealth Group, Inc. | | 100,100 | | 6,220,214 |
| | | | |
| | | | 8,661,005 |
| | | | |
Pharmaceuticals 3.0% | | | | |
Abbott Laboratories | | 152,400 | | 6,009,132 |
Alpharma, Inc. “A” | | 10,000 | | 285,100 |
Bentley Pharmaceuticals, Inc.* | | 11,800 | | 193,638 |
Durect Corp.* | | 28,400 | | 143,988 |
Eli Lilly & Co. | | 22,000 | | 1,244,980 |
Encysive Pharmaceuticals, Inc.* | | 18,500 | | 145,965 |
Hi-Tech Pharmacal Co., Inc.* | | 3,300 | | 146,157 |
Johnson & Johnson | | 135,082 | | 8,118,428 |
Mylan Laboratories, Inc. | | 46,500 | | 928,140 |
13
| | | | |
| | | Shares | | Value ($) |
Pfizer, Inc. | | 37,425 | | 872,751 |
Progenics Pharmaceuticals, Inc.* | | 9,000 | | 225,090 |
Rigel Pharmaceuticals, Inc.* | | 19,400 | | 162,184 |
Salix Pharmaceuticals Ltd.* | | 11,500 | | 202,170 |
SuperGen, Inc.* | | 30,500 | | 154,025 |
United Therapeutics Corp.* | | 3,600 | | 248,832 |
Wyeth | | 41,700 | | 1,921,119 |
| | | | |
| | | | 21,001,699 |
| | | | |
Industrials 5.9% | | | | |
Aerospace & Defense 1.3% | | | | |
Honeywell International, Inc. | | 36,500 | | 1,359,625 |
Kaman Corp. | | 1,300 | | 25,597 |
L-3 Communications Holdings, Inc. | | 28,100 | | 2,089,235 |
Teledyne Technologies, Inc.* | | 12,100 | | 352,110 |
United Technologies Corp. | | 97,200 | | 5,434,452 |
| | | | |
| | | | 9,261,019 |
| | | | |
Air Freight & Logistics 0.7% | | | | |
FedEx Corp. | | 45,400 | | 4,693,906 |
| | | | |
Airlines 0.1% | | | | |
Continental Airlines, Inc. “B”* | | 11,200 | | 238,560 |
Republic Airways Holdings, Inc.* | | 24,900 | | 378,480 |
| | | | |
| | | | 617,040 |
| | | | |
Building Products 0.2% | | | | |
Eagle Materials, Inc. | | 3,600 | | 440,496 |
LSI Industries, Inc. | | 14,400 | | 225,504 |
Universal Forest Products, Inc. | | 6,700 | | 370,175 |
Willian Lyon Homes, Inc.* | | 2,700 | | 272,430 |
| | | | |
| | | | 1,308,605 |
| | | | |
Commercial Services & Supplies 0.5% | | | | |
Administaff, Inc. | | 5,700 | | 239,685 |
aQuantive, Inc.* | | 5,100 | | 128,724 |
Bright Horizons Family Solutions, Inc.* | | 1,700 | | 62,985 |
Clean Harbors, Inc.* | | 7,000 | | 201,670 |
Consolidated Graphics, Inc.* | | 2,600 | | 123,084 |
Electro Rent Corp.* | | 22,000 | | 328,020 |
infoUSA, Inc. | | 1,700 | | 18,581 |
John H. Harland Co. | | 9,700 | | 364,720 |
Labor Ready, Inc.* | | 14,700 | | 306,054 |
LoJack Corp.* | | 7,100 | | 171,323 |
Pitney Bowes, Inc. | | 38,000 | | 1,605,500 |
SOURCECORP, Inc.* | | 2,500 | | 59,950 |
TeleTech Holdings, Inc.* | | 23,100 | | 278,355 |
| | | | |
| | | | 3,888,651 |
| | | | |
Construction & Engineering 0.1% | | | | |
EMCOR Group, Inc.* | | 5,000 | | 337,650 |
Granite Construction, Inc. | | 10,100 | | 362,691 |
URS Corp.* | | 8,500 | | 319,685 |
| | | | |
| | | | 1,020,026 |
| | | | |
Electrical Equipment 0.4% | | | | |
C&D Technologies, Inc. | | 20,000 | | 152,400 |
Emerson Electric Co. | | 30,900 | | 2,308,230 |
Genlyte Group, Inc.* | | 4,700 | | 251,779 |
| | | | |
| | | | 2,712,409 |
| | | | |
Industrial Conglomerates 1.4% | | | | |
Blount International, Inc.* | | 22,600 | | 360,018 |
General Electric Co. | | 264,700 | | 9,277,735 |
| | | | |
| | | | 9,637,753 |
| | | | |
14
| | | | |
| | | Shares | | Value ($) |
Machinery 1.0% | | | | |
Cascade Corp. | | 4,900 | | 229,859 |
Caterpillar, Inc. | | 27,500 | | 1,588,675 |
Dover Corp. | | 48,100 | | 1,947,569 |
Ingersoll-Rand Co., Ltd. “A” | | 60,300 | | 2,434,311 |
JLG Industries, Inc. | | 8,000 | | 365,280 |
Mueller Industries, Inc. | | 300 | | 8,226 |
Sauer-Danfoss, Inc. | | 12,400 | | 233,244 |
| | | | |
| | | | 6,807,164 |
| | | | |
Road & Rail 0.1% | | | | |
Dollar Thrifty Automotive Group, Inc.* | | 2,200 | | 79,354 |
US Xpress Enterprises, Inc. “A”* | | 16,700 | | 290,246 |
| | | | |
| | | | 369,600 |
| | | | |
Trading Companies & Distributors 0.1% | | | | |
Applied Industrial Technologies, Inc. | | 11,200 | | 377,328 |
| | | | |
Information Technology 12.5% | | | | |
Communications Equipment 1.7% | | | | |
Avocent Corp.* | | 7,400 | | 201,206 |
Cisco Systems, Inc.* | | 315,100 | | 5,394,512 |
Comtech Telecommunications Corp.* | | 2,400 | | 73,296 |
Nokia Oyj (ADR) | | 207,100 | | 3,789,930 |
QUALCOMM, Inc. | | 57,700 | | 2,485,716 |
| | | | |
| | | | 11,944,660 |
| | | | |
Computers & Peripherals 2.5% | | | | |
Advanced Digital Information Corp.* | | 23,600 | | 231,044 |
Apple Computer, Inc.* | | 36,300 | | 2,609,607 |
Dell, Inc.* | | 57,900 | | 1,736,421 |
EMC Corp.* | | 220,800 | | 3,007,296 |
Hewlett-Packard Co. | | 109,400 | | 3,132,122 |
Imation Corp. | | 8,600 | | 396,202 |
Intergraph Corp.* | | 8,100 | | 403,461 |
International Business Machines Corp. | | 62,400 | | 5,129,280 |
Komag, Inc.* | | 7,200 | | 249,552 |
| | | | |
| | | | 16,894,985 |
| | | | |
Electronic Equipment & Instruments 0.2% | | | | |
Agilysys, Inc. | | 12,200 | | 222,284 |
Itron, Inc.* | | 6,400 | | 256,256 |
MTS Systems Corp. | | 7,900 | | 273,656 |
Plexus Corp.* | | 15,400 | | 350,196 |
Technitrol, Inc. | | 18,800 | | 321,480 |
Trident Microsystems, Inc.* | | 13,000 | | 234,000 |
| | | | |
| | | | 1,657,872 |
| | | | |
Internet Software & Services 0.5% | | | | |
CNET Networks, Inc.* | | 15,100 | | 221,819 |
EarthLink, Inc.* | | 17,200 | | 191,092 |
eResearchTechnology, Inc.* | | 5,100 | | 77,010 |
Google, Inc. “A”* | | 1,250 | | 518,575 |
InfoSpace, Inc.* | | 2,300 | | 59,386 |
j2 Global Communications, Inc.* | | 1,200 | | 51,288 |
Online Resources Corp.* | | 9,900 | | 109,395 |
ProQuest Co.* | | 4,500 | | 125,595 |
Websense, Inc.* | | 2,800 | | 183,792 |
Yahoo!, Inc.* | | 51,900 | | 2,033,442 |
| | | | |
| | | | 3,571,394 |
| | | | |
15
| | | | |
| | | Shares | | Value ($) |
IT Consulting & Services 1.4% | | | | |
Accenture Ltd. “A” | | 62,300 | | 1,798,601 |
Automatic Data Processing, Inc. | | 57,900 | | 2,657,031 |
Covansys Corp.* | | 14,500 | | 197,345 |
CSG Systems International, Inc.* | | 13,500 | | 301,320 |
First Data Corp. | | 45,000 | | 1,935,450 |
Fiserv, Inc.* | | 34,000 | | 1,471,180 |
Intrado, Inc.* | | 2,300 | | 52,946 |
Paychex, Inc. | | 23,800 | | 907,256 |
Sapient Corp.* | | 22,100 | | 125,749 |
StarTek, Inc. | | 18,100 | | 325,800 |
| | | | |
| | | | 9,772,678 |
| | | | |
Semiconductors & Semiconductor Equipment 3.8% | | | | |
Advanced Energy Industries, Inc.* | | 17,500 | | 207,025 |
Applied Materials, Inc. | | 201,000 | | 3,605,940 |
Broadcom Corp. “A”* | | 57,400 | | 2,706,410 |
Cymer, Inc.* | | 7,200 | | 255,672 |
Diodes, Inc.* | | 2,950 | | 91,598 |
Emulex Corp.* | | 15,200 | | 300,808 |
Fairchild Semiconductor International, Inc.* | | 19,700 | | 333,127 |
Intel Corp. | | 357,400 | | 8,920,704 |
IXYS Corp.* | | 18,000 | | 210,420 |
Kopin Corp.* | | 11,500 | | 61,525 |
Kulicke & Soffa Industries, Inc.* | | 13,800 | | 121,992 |
Linear Technology Corp. | | 51,400 | | 1,853,998 |
Maxim Integrated Products, Inc. | | 49,200 | | 1,783,008 |
Micrel, Inc.* | | 21,700 | | 251,720 |
MKS Instruments, Inc.* | | 13,200 | | 236,148 |
OmniVision Technologies, Inc.* | | 9,600 | | 191,616 |
Photronics, Inc.* | | 13,900 | | 209,334 |
Texas Instruments, Inc. | | 141,400 | | 4,534,698 |
| | | | |
| | | | 25,875,743 |
| | | | |
Software 2.4% | | | | |
Adobe Systems, Inc. | | 51,500 | | 1,903,440 |
Altiris, Inc.* | | 13,500 | | 228,015 |
Ansoft Corp.* | | 10,100 | | 343,905 |
Blackbaud, Inc. | | 18,100 | | 309,148 |
Electronic Arts, Inc.* | | 35,400 | | 1,851,774 |
Internet Security Systems, Inc.* | | 7,600 | | 159,220 |
Lawson Software, Inc.* | | 33,400 | | 245,490 |
Microsoft Corp. | | 357,900 | | 9,359,085 |
MicroStrategy, Inc., “A”* | | 22 | | 1,820 |
Oracle Corp.* | | 82,700 | | 1,009,767 |
Parametric Technology Corp.* | | 52,100 | | 317,810 |
Quality Systems, Inc.* | | 2,600 | | 199,576 |
SPSS, Inc.* | | 8,500 | | 262,905 |
Witness Systems, Inc.* | | 12,700 | | 249,809 |
| | | | |
| | | | 16,441,764 |
| | | | |
Materials 1.5% | | | | |
Chemicals 0.8% | | | | |
Air Products & Chemicals, Inc. | | 21,900 | | 1,296,261 |
E.I. du Pont de Nemours & Co. | | 52,700 | | 2,239,750 |
Ecolab, Inc. | | 43,400 | | 1,574,118 |
Terra Industries, Inc.* | | 8,500 | | 47,600 |
| | | | |
| | | | 5,157,729 |
| | | | |
Construction Materials 0.0% | | | | |
Texas Industries, Inc. | | 5,400 | | 269,136 |
| | | | |
Containers & Packaging 0.3% | | | | |
Silgan Holdings, Inc. | | 11,000 | | 397,320 |
| | | | |
16
| | | | |
| | | Shares | | Value ($) |
Sonoco Products Co. | | 61,900 | | 1,819,860 |
| | | | |
| | | | 2,217,180 |
| | | | |
Metals & Mining 0.4% | | | | |
Aleris International, Inc.* | | 8,000 | | 257,920 |
Carpenter Technology Corp. | | 4,900 | | 345,303 |
Century Aluminum Co.* | | 11,700 | | 306,657 |
Cleveland-Cliffs, Inc. | | 1,600 | | 141,712 |
Commercial Metals Co. | | 10,600 | | 397,924 |
Intermet Corp.* | | 1,269 | | 14,760 |
Metal Management, Inc. | | 8,200 | | 190,732 |
Quanex Corp. | | 7,400 | | 369,778 |
Reliance Steel & Aluminum Co. | | 6,100 | | 372,832 |
USEC, Inc. | | 10,100 | | 120,695 |
| | | | |
| | | | 2,518,313 |
| | | | |
Paper & Forest Products 0.0% | | | | |
Deltic Timber Corp. | | 5,400 | | 280,044 |
| | | | |
Telecommunication Services 1.0% | | | | |
Diversified Telecommunication Services 0.9% | | | | |
Alaska Communications Systems Group, Inc. | | 25,300 | | 257,048 |
AT&T, Inc. | | 99,100 | | 2,426,959 |
CT Communications, Inc. | | 11,600 | | 140,824 |
General Communication, Inc. “A”* | | 5,900 | | 60,947 |
Golden Telecom, Inc. | | 11,100 | | 288,156 |
North Pittsburgh Systems, Inc. | | 8,300 | | 156,621 |
Premiere Global Services, Inc.* | | 29,500 | | 239,835 |
Shenandoah Telecommunications Co. | | 1,600 | | 63,744 |
TALK America Holdings, Inc.* | | 23,200 | | 200,216 |
Verizon Communications, Inc. | | 79,200 | | 2,385,504 |
| | | | |
| | | | 6,219,854 |
| | | | |
Wireless Telecommunication Services 0.1% | | | | |
Centennial Communications Corp.* | | 15,200 | | 235,904 |
Dobson Communications Corp. ”A”* | | 29,800 | | 223,500 |
Syniverse Holdings, Inc.* | | 4,000 | | 83,600 |
UbiquiTel, Inc.* | | 18,900 | | 186,921 |
| | | | |
| | | | 729,925 |
| | | | |
Utilities 1.1% | | | | |
Electric Utilities 1.0% | | | | |
ALLETE, Inc. | | 200 | | 8,800 |
Cleco Corp. | | 5,000 | | 104,250 |
FPL Group, Inc. | | 41,200 | | 1,712,272 |
Otter Tail Corp. | | 4,700 | | 136,206 |
Progress Energy, Inc. | | 38,600 | | 1,695,312 |
Sierra Pacific Resources* | | 33,200 | | 432,928 |
Southern Co. | | 84,600 | | 2,921,238 |
| | | | |
| | | | 7,011,006 |
| | | | |
Gas Utilities 0.1% | | | | |
South Jersey Industries, Inc. | | 10,200 | | 297,228 |
| | | | |
Total Common Stocks (Cost $323,582,174) | | | | 400,070,665 |
| | | | |
17
| | | | |
| | | Principal Amount ($)(b) | | Value ($) |
Corporate Bonds 12.0% | | | | |
Consumer Discretionary 2.7% | | | | |
155 East Tropicana LLC, 8.75%, 4/1/2012 | | 135,000 | | 129,938 |
Adesa, Inc., 7.625%, 6/15/2012 | | 40,000 | | 39,800 |
| | |
| | | Principal Amount ($)(b) | | Value ($) |
Affinia Group, Inc., 9.0%, 11/30/2014 | | 220,000 | | 173,800 |
AMC Entertainment, Inc., 8.0%, 3/1/2014 | | 285,000 | | 257,925 |
AMFM, Inc., 8.0%, 11/1/2008 | | 500,000 | | 531,575 |
Auburn Hills Trust, 12.375%, 5/1/2020 | | 131,000 | | 194,788 |
AutoNation, Inc., 9.0%, 8/1/2008 | | 150,000 | | 161,063 |
Aztar Corp., 7.875%, 6/15/2014 | | 315,000 | | 329,962 |
Cablevision Systems Corp., Series B, 8.716%**, 4/1/2009 | | 60,000 | | 60,600 |
Caesars Entertainment, Inc.: | | | | |
8.875%, 9/15/2008 | | 85,000 | | 91,906 |
9.375%, 2/15/2007 | | 75,000 | | 78,094 |
Charter Communications Holdings LLC: | | | | |
9.625%, 11/15/2009 | | 80,000 | | 59,200 |
10.25%, 9/15/2010 | | 510,000 | | 507,450 |
144A, 11.0%, 10/1/2015 | | 541,000 | | 454,440 |
Comcast Cable Communications Holdings, Inc., 9.455%, 11/15/2022 | | 220,000 | | 288,243 |
Comcast MO of Delaware, Inc., 9.0%, 9/1/2008 | | 150,000 | | 163,885 |
Cooper-Standard Automotive, Inc., 8.375%, 12/15/2014 | | 215,000 | | 163,400 |
CSC Holdings, Inc.: | | | | |
7.25%, 7/15/2008 | | 75,000 | | 74,813 |
7.875%, 12/15/2007 | | 305,000 | | 310,337 |
DaimlerChrysler NA Holding Corp.: | | | | |
4.75%, 1/15/2008 | | 250,000 | | 247,719 |
Series E, 4.78%**, 10/31/2008 | | 389,000 | | 389,217 |
Dex Media East LLC/Financial, 12.125%, 11/15/2012 | | 723,000 | | 845,910 |
Dura Operating Corp., Series B, 8.625%, 4/15/2012 | | 240,000 | | 198,000 |
EchoStar DBS Corp., 6.625%, 10/1/2014 | | 90,000 | | 86,288 |
Foot Locker, Inc., 8.5%, 1/15/2022 | | 135,000 | | 142,763 |
Ford Motor Co., 7.45%, 7/16/2031 | | 45,000 | | 30,600 |
General Motors Corp., 8.25%, 7/15/2023 | | 35,000 | | 22,488 |
Goodyear Tire & Rubber Co., 11.0%, 3/1/2011 | | 335,000 | | 375,200 |
Gregg Appliances, Inc., 9.0%, 2/1/2013 | | 60,000 | | 54,300 |
GSC Holdings Corp., 144A, 8.0%, 10/1/2012 | | 275,000 | | 258,500 |
Harrah’s Operating Co., Inc.: | | | | |
5.625%, 6/1/2015 | | 668,000 | | 656,258 |
5.75%, 10/1/2017 | | 393,000 | | 382,505 |
Hertz Corp., 144A, 8.875%, 1/1/2014 | | 310,000 | | 315,812 |
ITT Corp., 7.375%, 11/15/2015 | | 80,000 | | 86,800 |
Jacobs Entertainment, Inc., 11.875%, 2/1/2009 | | 580,000 | | 615,525 |
Levi Strauss & Co.: | | | | |
8.804%**, 4/1/2012 | | 100,000 | | 100,750 |
12.25%, 12/15/2012 | | 30,000 | | 33,450 |
Liberty Media Corp.: | | | | |
7.875%, 7/15/2009 | | 10,000 | | 10,537 |
8.5%, 7/15/2029 | | 35,000 | | 34,661 |
Mandalay Resort Group: | | | | |
6.5%, 7/31/2009 | | 117,000 | | 118,316 |
Series B, 10.25%, 8/1/2007 | | 45,000 | | 47,981 |
Mediacom Broadband LLC, 144A, 8.5%, 10/15/2015 | | 95,000 | | 87,994 |
18
| | | | |
| | | Principal Amount ($)(b) | | Value ($) |
Mediacom LLC, 9.5%, 1/15/2013 | | 45,000 | | 43,931 |
MGM MIRAGE: | | | | |
6.0%, 10/1/2009 | | 235,000 | | 233,531 |
6.625%, 7/15/2015 | | 85,000 | | 84,788 |
8.375%, 2/1/2011 | | 275,000 | | 294,250 |
9.75%, 6/1/2007 | | 145,000 | | 152,794 |
MTR Gaming Group, Inc., Series B, 9.75%, 4/1/2010 | | 95,000 | | 101,413 |
NCL Corp., 10.625%, 7/15/2014 | | 120,000 | | 123,900 |
Norcraft Holdings/Capital, Step-up Coupon, 0% to 9/1/2008, 9.75% to 9/1/2012 | | 280,000 | | 198,800 |
Paxson Communications Corp., Step-up Coupon, 0% to 1/15/2006, 12.25% to 1/15/2009 | | 35,000 | | 37,056 |
Petro Stopping Centers, 9.0%, 2/15/2012 | | 185,000 | | 185,925 |
Pinnacle Entertainment, Inc., 8.75%, 10/1/2013 | | 280,000 | | 298,200 |
Premier Entertainment Biloxi LLC/Finance, 10.75%, 2/1/2012 | | 290,000 | | 279,850 |
PRIMEDIA, Inc.: | | | | |
8.875%, 5/15/2011 | | 100,000 | | 92,250 |
9.715%**, 5/15/2010 | | 310,000 | | 297,988 |
Renaissance Media Group LLC, 10.0%, 4/15/2008 | | 130,000 | | 130,163 |
Resorts International Hotel & Casino, Inc., 11.5%, 3/15/2009 | | 315,000 | | 348,862 |
Schuler Homes, Inc., 10.5%, 7/15/2011 | | 295,000 | | 317,125 |
SGS International, Inc., 144A, 12.0%, 12/15/2013 | | 80,000 | | 80,131 |
Simmons Bedding Co.: | | | | |
144A, Step-up Coupon, 0% to 12/15/2009, 10.0% to 12/15/2014 | | 335,000 | | 180,900 |
7.875%, 1/15/2014 | | 70,000 | | 64,750 |
Sinclair Broadcast Group, Inc., 8.75%, 12/15/2011 | | 560,000 | | 589,400 |
Sirius Satellite Radio, Inc., 144A, 9.625%, 8/1/2013 | | 350,000 | | 344,750 |
TCI Communications, Inc., 8.75%, 8/1/2015 | | 135,000 | | 163,579 |
Tele-Communications, Inc.: | | | | |
9.875%, 6/15/2022 | | 670,000 | | 909,672 |
10.125%, 4/15/2022 | | 28,000 | | 38,306 |
Time Warner, Inc.: | | | | |
6.625%, 5/15/2029 | | 95,000 | | 94,867 |
7.625%, 4/15/2031 | | 825,000 | | 918,760 |
Toys “R” Us, Inc.: | | | | |
6.875%, 8/1/2006 | | 40,000 | | 39,800 |
7.375%, 10/15/2018 | | 150,000 | | 108,000 |
Trump Entertainment Resorts, Inc., 8.5%, 6/1/2015 | | 610,000 | | 594,750 |
TRW Automotive, Inc., 11.0%, 2/15/2013 | | 425,000 | | 477,062 |
United Auto Group, Inc., 9.625%, 3/15/2012 | | 225,000 | | 236,813 |
Wheeling Island Gaming, Inc., 10.125%, 12/15/2009 | | 75,000 | | 78,656 |
XM Satellite Radio, Inc., Step-up Coupon, 0% to 12/31/2005, 14.0% to 12/31/2009 | | 415,000 | | 441,975 |
Young Broadcasting, Inc.: | | | | |
8.75%, 1/15/2014 | | 540,000 | | 475,875 |
10.0%, 3/1/2011 | | 60,000 | | 56,175 |
| | | | |
| | | | 18,327,840 |
| | | | |
19
| | | | |
| | | Principal Amount ($)(b) | | Value ($) |
Consumer Staples 0.4% | | | | |
Agrilink Foods, Inc., 11.875%, 11/1/2008 | | 40,000 | | 40,800 |
Alliance One International, Inc., 144A, 11.0%, 5/15/2012 | | 215,000 | | 189,200 |
Altria Group, Inc., 7.0%, 11/4/2013 | | 250,000 | | 273,561 |
Del Laboratories, Inc., 8.0%, 2/1/2012 | | 95,000 | | 75,050 |
Delhaize America, Inc.: | | | | |
8.05%, 4/15/2027 | | 30,000 | | 30,780 |
9.0%, 4/15/2031 | | 85,000 | | 99,927 |
GNC Corp., 8.5%, 12/1/2010 | | 25,000 | | 21,500 |
Harry & David Holdings, Inc., 9.41%**, 3/1/2012 | | 50,000 | | 50,375 |
Kraft Foods, Inc., 6.25%, 6/1/2012 | | 500,000 | | 527,472 |
North Atlantic Trading Co., 9.25%, 3/1/2012 | | 645,000 | | 425,700 |
Swift & Co.: | | | | |
10.125%, 10/1/2009 | | 110,000 | | 113,575 |
12.5%, 1/1/2010 | | 205,000 | | 215,762 |
Viskase Co., Inc., 11.5%, 6/15/2011 | | 385,000 | | 410,025 |
| | | | |
| | | | 2,473,727 |
| | | | |
Energy 0.6% | | | | |
Belden & Blake Corp., 8.75%, 7/15/2012 | | 330,000 | | 336,600 |
Chaparral Energy, Inc., 144A, 8.5%, 12/1/2015 | | 205,000 | | 212,175 |
Chesapeake Energy Corp.: | | | | |
6.5%, 8/15/2017 | | 100,000 | | 100,500 |
6.875%, 1/15/2016 | | 240,000 | | 246,000 |
Dynegy Holdings, Inc.: | | | | |
6.875%, 4/1/2011 | | 65,000 | | 64,025 |
7.125%, 5/15/2018 | | 100,000 | | 89,000 |
7.625%, 10/15/2026 | | 60,000 | | 53,400 |
8.75%, 2/15/2012 | | 30,000 | | 32,400 |
144A, 9.875%, 7/15/2010 | | 465,000 | | 509,756 |
El Paso Production Holding Corp., 7.75%, 6/1/2013 | | 150,000 | | 155,625 |
Frontier Oil Corp., 6.625%, 10/1/2011 | | 60,000 | | 61,200 |
Mission Resources Corp., 9.875%, 4/1/2011 | | 15,000 | | 15,750 |
Newpark Resources, Inc., Series B, 8.625%, 12/15/2007 | | 250,000 | | 250,000 |
NGC Corp. Capital Trust I, Series B, 8.316%, 6/1/2027 | | 300,000 | | 265,500 |
Sonat, Inc., 7.0%, 2/1/2018 | | 30,000 | | 28,500 |
Southern Natural Gas, 8.875%, 3/15/2010 | | 265,000 | | 283,209 |
Stone Energy Corp.: | | | | |
6.75%, 12/15/2014 | | 405,000 | | 383,738 |
8.25%, 12/15/2011 | | 205,000 | | 211,663 |
Transmeridian, 12.0%**, 12/15/2010 | | 80,000 | | 92,800 |
Williams Companies, Inc.: | | | | |
8.125%, 3/15/2012 | | 545,000 | | 594,050 |
8.75%, 3/15/2032 | | 180,000 | | 208,800 |
| | | | |
| | | | 4,194,691 |
| | | | |
Financials 3.3% | | | | |
Alamosa Delaware, Inc.: | | | | |
8.5%, 1/31/2012 | | 30,000 | | 32,438 |
11.0%, 7/31/2010 | | 105,000 | | 118,388 |
12.0%, 7/31/2009 | | 110,000 | | 120,313 |
American General Finance Corp.: | | | | |
Series H, 4.0%, 3/15/2011 | | 1,314,000 | | 1,243,048 |
20
| | | | |
| | | Principal Amount ($)(b) | | Value ($) |
Series I, 4.875%, 5/15/2010 | | 480,000 | | 475,877 |
American General Institutional Capital, 144A, 8.125%, 3/15/2046 | | 230,000 | | 298,381 |
American International Group, Inc., 144A, 5.05%, 10/1/2015 | | 700,000 | | 687,001 |
AmeriCredit Corp., 9.25%, 5/1/2009 | | 530,000 | | 557,825 |
Ashton Woods USA LLC, 144A, 9.5%, 10/1/2015 | | 230,000 | | 207,288 |
Bear Stearns Companies, Inc., 5.3%, 10/30/2015 | | 465,000 | | 463,966 |
Dow Jones CDX HY: | | | | |
Series 5-T2, 144A, 7.25%, 12/29/2010 | | 570,000 | | 563,587 |
Series 5-T3, 144A, 8.25%, 12/29/2010 | | 685,000 | | 686,712 |
Series 5-T1, 144A, 8.75%, 12/29/2010 (a) | | 1,975,050 | | 1,982,456 |
E*TRADE Financial Corp.: | | | | |
144A, 7.375%, 9/15/2013 | | 185,000 | | 187,313 |
7.875%, 12/1/2015 | | 225,000 | | 232,312 |
8.0%, 6/15/2011 | | 130,000 | | 135,200 |
ERAC USA Finance Co., 144A, 5.9%, 11/15/2015 | | 493,000 | | 501,479 |
ERP Operating LP, 6.95%, 3/2/2011 | | 211,000 | | 226,464 |
Exopack Holding Corp., 9.59%, 11/16/2006 | | 500,000 | | 500,000 |
Ford Motor Credit Co.: | | | | |
6.5%, 1/25/2007 | | 414,000 | | 400,533 |
6.875%, 2/1/2006 | | 877,000 | | 875,114 |
7.25%, 10/25/2011 | | 770,000 | | 665,169 |
7.375%, 10/28/2009 | | 690,000 | | 611,951 |
General Electric Capital Corp., Series A, 6.75%, 3/15/2032 | | 500,000 | | 586,925 |
General Motors Acceptance Corp.: | | | | |
4.375%, 12/10/2007 | | 134,000 | | 119,072 |
5.22%**, 3/20/2007 | | 100,000 | | 94,455 |
6.125%, 9/15/2006 | | 184,000 | | 178,729 |
6.125%, 2/1/2007 | | 1,377,000 | | 1,314,549 |
6.125%, 8/28/2007 | | 622,000 | | 576,580 |
6.875%, 9/15/2011 | | 350,000 | | 319,181 |
8.0%, 11/1/2031 (a) | | 2,124,000 | | 2,034,539 |
H&E Equipment/Finance, 11.125%, 6/15/2012 | | 235,000 | | 259,675 |
HSBC Bank USA, 5.625%, 8/15/2035 | | 374,000 | | 365,801 |
HSBC Finance Capital Trust IX, 5.911%, 11/30/2035 | | 800,000 | | 806,806 |
JPMorgan Chase Capital XV, 5.875%, 3/15/2035 | | 585,000 | | 581,625 |
Merrill Lynch & Co., Inc., Series C, 4.79%, 8/4/2010 | | 626,000 | | 618,959 |
Ohio Casualty Corp., 7.3%, 6/15/2014 | | 155,000 | | 166,597 |
Poster Financial Group, Inc., 8.75%, 12/1/2011 | | 280,000 | | 288,400 |
PXRE Capital Trust I, 8.85%, 2/1/2027 | | 135,000 | | 132,638 |
R.H. Donnelly Finance Corp., 10.875%, 12/15/2012 | | 255,000 | | 287,512 |
Radnor Holdings Corp., 11.0%, 3/15/2010 | | 195,000 | | 157,950 |
Stripes Acquisition LLC/Susser Finance Corp., 144A, 10.625%, 12/15/2013 | | 80,000 | | 81,200 |
21
| | | | |
| | | Principal Amount ($)(b) | | Value ($) |
The Goldman Sachs Group, Inc., 5.5%, 11/15/2014 | | 750,000 | | 760,641 |
TIG Capital Holdings Trust, 144A, 8.597%, 1/15/2027 | | 235,000 | | 186,825 |
Triad Acquisition Corp., 144A, 11.125%, 5/1/2013 | | 145,000 | | 143,550 |
UGS Corp., 10.0%, 6/1/2012 | | 200,000 | | 218,000 |
Universal City Development, 11.75%, 4/1/2010 | | 365,000 | | 409,256 |
Verizon Global Funding Corp., 7.75%, 12/1/2030 | | 170,000 | | 202,072 |
| | | | |
| | | | 22,664,352 |
| | | | |
Health Care 0.3% | | | | |
Accellent, Inc., 144A, 10.5%, 12/1/2013 | | 200,000 | | 205,000 |
Health Care Service Corp., 144A, 7.75%, 6/15/2011 | | 825,000 | | 923,381 |
HEALTHSOUTH Corp., 10.75%, 10/1/2008 (a) | | 440,000 | | 440,000 |
InSight Health Services Corp.: | | | | |
144A, 9.174%**, 11/1/2011 | | 55,000 | | 53,213 |
Series B, 9.875%, 11/1/2011 (a) | | 70,000 | | 52,850 |
Tenet Healthcare Corp., 144A, 9.25%, 2/1/2015 | | 460,000 | | 456,550 |
| | | | |
| | | | 2,130,994 |
| | | | |
Industrials 1.3% | | | | |
Aavid Thermal Technologies, Inc., 12.75%, 2/1/2007 | | 348,000 | | 357,570 |
Allied Security Escrow Corp., 11.375%, 7/15/2011 | | 210,000 | | 202,449 |
Allied Waste North America, Inc.: | | | | |
Series B, 5.75%, 2/15/2011 | | 115,000 | | 108,963 |
Series B, 9.25%, 9/1/2012 | | 295,000 | | 319,337 |
American Color Graphics, 10.0%, 6/15/2010 | | 210,000 | | 146,737 |
Avondale Mills, Inc., 144A, 11.065%**, 7/1/2012 | | 100,000 | | 97,000 |
BAE System 2001 Asset Trust, “B”, Series 2001, 144A, 7.156%, 12/15/2011 | | 365,118 | | 382,573 |
Beazer Homes USA, Inc.: | | | | |
6.875%, 7/15/2015 | | 20,000 | | 19,175 |
8.375%, 4/15/2012 | | 165,000 | | 171,600 |
8.625%, 5/15/2011 | | 200,000 | | 209,000 |
Browning-Ferris Industries: | | | | |
7.4%, 9/15/2035 | | 345,000 | | 305,325 |
9.25%, 5/1/2021 | | 20,000 | | 20,600 |
Case New Holland, Inc., 9.25%, 8/1/2011 | | 370,000 | | 395,900 |
Cenveo Corp., 7.875%, 12/1/2013 | | 165,000 | | 159,225 |
Collins & Aikman Floor Cover, Series B, 9.75%, 2/15/2010 | | 280,000 | | 246,400 |
Columbus McKinnon Corp., 10.0%, 8/1/2010 | | 105,000 | | 116,288 |
Compression Polymers Corp.: | | | | |
144A, 10.46%**, 7/1/2012 | | 70,000 | | 68,600 |
144A, 10.5%, 7/1/2013 | | 255,000 | | 247,350 |
Congoleum Corp., 8.625%, 8/1/2008* | | 190,000 | | 189,287 |
Cornell Companies, Inc., 10.75%, 7/1/2012 | | 105,000 | | 108,675 |
D.R. Horton, Inc., 5.375%, 6/15/2012 | | 1,355,000 | | 1,309,811 |
Dana Corp., 7.0%, 3/1/2029 (a) | | 260,000 | | 186,550 |
DRS Technologies, Inc., 6.875%, 11/1/2013 | | 50,000 | | 47,813 |
22
| | | | |
| | | Principal Amount ($)(b) | | Value ($) |
ISP Chemco, Inc., Series B, 10.25%, 7/1/2011 | | 390,000 | | 415,350 |
K. Hovnanian Enterprises, Inc.: | | | | |
6.25%, 1/15/2015 | | 370,000 | | 348,210 |
6.25%, 1/15/2016 | | 210,000 | | 194,843 |
8.875%, 4/1/2012 | | 270,000 | | 280,561 |
Kansas City Southern, 9.5%, 10/1/2008 | | 435,000 | | 470,887 |
Kinetek, Inc., Series D, 10.75%, 11/15/2006 | | 300,000 | | 288,000 |
Millennium America, Inc., 9.25%, 6/15/2008 | | 345,000 | | 372,169 |
Rainbow National Services LLC, 144A, 10.375%, 9/1/2014 | | 160,000 | | 179,200 |
Securus Technologies, Inc., 11.0%, 9/1/2011 | | 120,000 | | 102,000 |
Ship Finance International Ltd., 8.5%, 12/15/2013 | | 225,000 | | 210,375 |
Standard Pacific Corp., 6.5%, 8/15/2010 | | 150,000 | | 143,062 |
Technical Olympic USA, Inc.: | | | | |
7.5%, 3/15/2011 | | 75,000 | | 66,844 |
10.375%, 7/1/2012 | | 185,000 | | 181,994 |
The Brickman Group Ltd., Series B, 11.75%, 12/15/2009 | | 125,000 | | 138,437 |
United Rentals North America, Inc., 7.0%, 2/15/2014 | | 210,000 | | 196,350 |
Xerox Capital Trust I, 8.0%, 2/1/2027 | | 120,000 | | 123,600 |
| | | | |
| | | | 9,128,110 |
| | | | |
Information Technology 0.3% | | | | |
Activant Solutions, Inc.: | | | | |
144A, 10.054%**, 4/1/2010 | | 20,000 | | 20,625 |
10.5%, 6/15/2011 | | 165,000 | | 180,675 |
Eschelon Operating Co., 8.375% | | 126,000 | | 116,550 |
International Business Machines Corp., 8.375%, 11/1/2019 | | 250,000 | | 324,628 |
L-3 Communications Corp.: | | | | |
5.875%, 1/15/2015 | | 35,000 | | 33,950 |
144A, 6.375%, 10/15/2015 | | 75,000 | | 74,813 |
Lucent Technologies, Inc., 6.45%, 3/15/2029 | | 445,000 | | 381,587 |
Sanmina-SCI Corp.: | | | | |
6.75%, 3/1/2013 (a) | | 255,000 | | 242,569 |
10.375%, 1/15/2010 | | 403,000 | | 445,315 |
SS&C Technologies, Inc., 144A, 11.75%, 12/1/2013 | | 65,000 | | 66,625 |
SunGard Data Systems, Inc., 144A, 10.25%, 8/15/2015 | | 235,000 | | 235,000 |
| | | | |
| | | | 2,122,337 |
| | | | |
Materials 1.0% | | | | |
ARCO Chemical Co., 9.8%, 2/1/2020 | | 580,000 | | 651,050 |
Associated Materials, Inc.: | | | | |
Step-up Coupon, 0% to 3/1/2009, 11.25% to 3/1/2014 | | 260,000 | | 127,400 |
9.75%, 4/15/2012 | | 85,000 | | 82,025 |
Caraustar Industries, Inc., 9.875%, 4/1/2011 | | 375,000 | | 382,500 |
Constar International, Inc., 11.0%, 12/1/2012 | | 60,000 | | 43,800 |
Dayton Superior Corp.: | | | | |
10.75%, 9/15/2008 | | 145,000 | | 139,925 |
13.0%, 6/15/2009 | | 200,000 | | 151,000 |
23
| | | | |
| | | Principal Amount ($)(b) | | Value ($) |
GEO Specialty Chemicals, Inc., 12.565%**, 12/31/2009 | | 446,000 | | 370,180 |
Georgia-Pacific Corp.: | | | | |
8.0%, 1/15/2024 | | 355,000 | | 339,025 |
8.875%, 5/15/2031 | | 45,000 | | 45,113 |
Huntsman LLC, 11.625%, 10/15/2010 | | 312,000 | | 355,290 |
IMC Global, Inc., 10.875%, 8/1/2013 | | 400,000 | | 459,500 |
International Steel Group, Inc., 6.5%, 4/15/2014 | | 95,000 | | 95,000 |
Massey Energy Co.: | | | | |
6.625%, 11/15/2010 | | 95,000 | | 96,544 |
144A, 6.875%, 12/15/2013 | | 75,000 | | 75,656 |
MMI Products, Inc., Series B, 11.25%, 4/15/2007 | | 335,000 | | 314,900 |
Neenah Foundry Co.: | | | | |
144A, 11.0%, 9/30/2010 | | 495,000 | | 542,025 |
144A, 13.0%, 9/30/2013 | | 40,000 | | 40,800 |
Newmont Mining Corp., 5.875%, 4/1/2035 | | 1,094,000 | | 1,079,583 |
NewPage Corp., 10.5%**, 5/1/2012 | | 145,000 | | 143,550 |
Omnova Solutions, Inc., 11.25%, 6/1/2010 | | 385,000 | | 401,362 |
Oregon Steel Mills, Inc., 10.0%, 7/15/2009 | | 90,000 | | 96,300 |
Oxford Automotive, Inc., 144A, 12.0%, 10/15/2010* | | 257,130 | | 23,142 |
Portola Packaging, Inc., 8.25%, 2/1/2012 | | 125,000 | | 91,875 |
Rockwood Specialties Group, Inc., 10.625%, 5/15/2011 | | 51,000 | | 55,909 |
TriMas Corp., 9.875%, 6/15/2012 | | 370,000 | | 305,250 |
UAP Holding Corp., Step-up Coupon, 0% to 1/15/2008, 10.75% to 7/15/2012 | | 85,000 | | 73,631 |
United States Steel Corp., 9.75%, 5/15/2010 | | 273,000 | | 296,887 |
| | | | |
| | | | 6,879,222 |
| | | | |
Telecommunication Services 0.6% | | | | |
AirGate PCS, Inc., 7.9%**, 10/15/2011 | | 115,000 | | 118,738 |
American Cellular Corp., Series B, 10.0%, 8/1/2011 | | 85,000 | | 92,225 |
Bell Atlantic New Jersey, Inc., Series A, 5.875%, 1/17/2012 | | 745,000 | | 751,709 |
Cincinnati Bell, Inc.: | | | | |
7.25%, 7/15/2013 | | 230,000 | | 239,200 |
8.375%, 1/15/2014 | | 230,000 | | 226,262 |
Dobson Communications Corp., 8.875%, 10/1/2013 | | 120,000 | | 119,700 |
Insight Midwest LP, 9.75%, 10/1/2009 | | 45,000 | | 46,350 |
LCI International, Inc., 7.25%, 6/15/2007 | | 210,000 | | 211,050 |
Level 3 Financing, Inc., 10.75%, 10/15/2011 | | 35,000 | | 31,063 |
MCI, Inc., 8.735%, 5/1/2014 | | 570,000 | | 630,562 |
Nextel Communications, Inc., Series D, 7.375%, 8/1/2015 | | 855,000 | | 902,297 |
Nextel Partners, Inc., 8.125%, 7/1/2011 | | 150,000 | | 160,312 |
Qwest Corp.: | | | | |
7.25%, 9/15/2025 | | 155,000 | | 154,225 |
144A, 7.741%**, 6/15/2013 | | 50,000 | | 53,938 |
24
| | | | |
| | | Principal Amount ($)(b) | | Value ($) |
Rural Cellular Corp.: | | | | |
9.75%, 1/15/2010 | | 30,000 | | 30,300 |
9.875%, 2/1/2010 | | 30,000 | | 31,650 |
144A, 10.041%**, 11/1/2012 | | 30,000 | | 30,225 |
SBA Telecom, Inc., Step-up Coupon, 0% to 12/15/2007, 9.75% to 12/15/2011 | | 102,000 | | 94,605 |
Telex Communications Holdings, Inc., 11.5%, 10/15/2008 | | 15,000 | | 15,975 |
Triton PCS, Inc., 8.5%, 6/1/2013 | | 20,000 | | 18,600 |
Ubiquitel Operating Co., 9.875%, 3/1/2011 | | 95,000 | | 105,213 |
US Unwired, Inc., Series B, 10.0%, 6/15/2012 | | 155,000 | | 174,375 |
| | | | |
| | | | 4,238,574 |
| | | | |
Utilities 1.5% | | | | |
AES Corp., 144A, 8.75%, 5/15/2013 | | 495,000 | | 538,931 |
Allegheny Energy Supply Co. LLC, 144A, 8.25%, 4/15/2012 | | 525,000 | | 591,938 |
CC Funding Trust I, 6.9%, 2/16/2007 | | 179,000 | | 182,443 |
CMS Energy Corp.: | | | | |
8.5%, 4/15/2011 | | 245,000 | | 266,744 |
9.875%, 10/15/2007 | | 305,000 | | 326,350 |
Consumers Energy Co.: | | | | |
Series F, 4.0%, 5/15/2010 | | 1,590,000 | | 1,509,950 |
5.0%, 2/15/2012 | | 975,000 | | 953,782 |
DPL, Inc., 6.875%, 9/1/2011 | | 76,000 | | 80,085 |
Entergy Louisiana, Inc., 6.3%, 9/1/2035 | | 220,000 | | 215,378 |
Mirant North America LLC, 144A, 7.375%, 12/31/2013 | | 65,000 | | 65,731 |
Mission Energy Holding Co., 13.5%, 7/15/2008 | | 615,000 | | 713,400 |
NorthWestern Corp., 5.875%, 11/1/2014 | | 50,000 | | 50,094 |
NRG Energy, Inc., 8.0%, 12/15/2013 | | 408,000 | | 454,920 |
Pedernales Electric Cooperative, Series2002-A, 144A, 6.202%, 11/15/2032 | | 1,260,000 | | 1,382,901 |
Progress Energy, Inc., 6.75%, 3/1/2006 | | 1,495,000 | | 1,499,694 |
PSE&G Energy Holdings LLC, 10.0%, 10/1/2009 | | 635,000 | | 698,500 |
TXU Energy Co., 7.0%, 3/15/2013 | | 345,000 | | 367,654 |
| | | | |
| | | | 9,898,495 |
| | | | |
Total Corporate Bonds (Cost $82,977,546) | | | | 82,058,342 |
| | | | |
Foreign Bonds — US$ Denominated 3.2% | | | | |
Consumer Discretionary 0.3% | | | | |
Cablemas SA de CV, 144A, 9.375%, 11/15/2015 | | 30,000 | | 30,750 |
IESY Repository GmbH, 144A, 10.375%, 2/15/2015 | | 75,000 | | 78,000 |
Jafra Cosmetics International, Inc., 10.75%, 5/15/2011 | | 410,000 | | 448,950 |
Kabel Deutschland GmbH, 144A, 10.625%, 7/1/2014 | | 240,000 | | 252,600 |
Royal Caribbean Cruises Ltd., 8.75%, 2/2/2011 | | 422,000 | | 476,860 |
Shaw Communications, Inc., 8.25%, 4/11/2010 | | 160,000 | | 171,800 |
25
| | | | |
| | | Principal Amount ($)(b) | | Value ($) |
Telenet Group Holding NV, 144A, Step-up Coupon, 0% to 12/15/2008, 11.5% to 6/15/2014 | | 279,000 | | 228,780 |
Vitro SA de CV, Series A, 144A, 12.75%, 11/1/2013 | | 120,000 | | 113,400 |
| | | | |
| | | | 1,801,140 |
| | | | |
Energy 0.1% | | | | |
OAO Gazprom, 144A, 9.625%, 3/1/2013 | | 300,000 | | 361,875 |
Secunda International Ltd., 12.15%**, 9/1/2012 | | 110,000 | | 115,500 |
| | | | |
| | | | 477,375 |
| | | | |
Financials 1.1% | | | | |
BNP Paribas SA, 144A, 5.186%, 6/29/2049 | | 155,000 | | 150,371 |
Chuo Mitsui Trust & Banking Co., Ltd, 144A, 5.506%, 12/29/2049 | | 795,000 | | 770,365 |
Conproca SA de CV, 12.0%, 6/16/2010 | | 200,000 | | 238,000 |
DBS Capital Funding Corp., 144A, 7.657%, 3/31/2049 | | 198,000 | | 219,077 |
Doral Financial Corp., 5.004%**, 7/20/2007 | | 375,000 | | 364,516 |
Mizuho Financial Group (Cayman), 8.375%, 12/29/2049 | | 2,290,000 | | 2,481,215 |
National Capital Trust II, 144A, 5.486%, 12/29/2049 | | 383,000 | | 382,743 |
New ASAT (Finance) Ltd., 9.25%, 2/1/2011 | | 105,000 | | 72,450 |
Nordea Bank AB, 144A, 5.424%, 12/29/2049 | | 555,000 | | 550,159 |
Pemex Finance Ltd., “A1”, Series 2000-1, 9.03%, 2/15/2011 | | 725,000 | | 791,823 |
Royal Bank of Scotland Group PLC, Series 1, 9.118%, 3/31/2049 | | 50,000 | | 57,280 |
SPI Electricity & Gas Australia Holdings Property Ltd., 144A, 6.15%, 11/15/2013 | | 905,000 | | 966,084 |
Svenska Handelsbanken AB, 144A, 7.125%, 3/29/2049 | | 330,000 | | 337,505 |
| | | | |
| | | | 7,381,588 |
| | | | |
Health Care 0.0% | | | | |
Biovail Corp., 7.875%, 4/1/2010 | | 215,000 | | 222,794 |
| | | | |
Industrials 0.3% | | | | |
Grupo Transportacion Ferroviaria Mexicana SA de CV: | | | | |
144A, 9.375%, 5/1/2012 | | 120,000 | | 131,400 |
10.25%, 6/15/2007 | | 450,000 | | 474,750 |
12.5%, 6/15/2012 | | 163,000 | | 185,820 |
J. Ray McDermott SA, 144A, 11.5%, 12/15/2013 | | 240,000 | | 283,200 |
LeGrand SA, 8.5%, 2/15/2025 | | 115,000 | | 138,287 |
Stena AB, 9.625%, 12/1/2012 | | 95,000 | | 103,194 |
Tyco International Group SA, 7.0%, 6/15/2028 | | 553,000 | | 608,343 |
| | | | |
| | | | 1,924,994 |
| | | | |
Materials 0.8% | | | | |
Cascades, Inc., 7.25%, 2/15/2013 | | 435,000 | | 395,850 |
ISPAT Inland ULC, 9.75%, 4/1/2014 | | 249,000 | | 281,993 |
Novelis, Inc., 144A, 7.25%, 2/15/2015 | | 460,000 | | 428,950 |
Rhodia SA, 8.875%, 6/1/2011 (a) | | 345,000 | | 353,625 |
26
| | | | |
| | | Principal Amount ($)(b) | | Value ($) |
Sino-Forest Corp., 144A, 9.125%, 8/17/2011 | | 10,000 | | 10,725 |
Sociedad Concesionaria Autopista Central, 144A, 6.223%, 12/15/2026 | | 2,450,000 | | 2,572,083 |
Tembec Industries, Inc.: | | | | |
8.5%, 2/1/2011 | | 1,040,000 | | 577,200 |
8.625%, 6/30/2009 | | 455,000 | | 259,350 |
Vale Overseas Ltd., 8.25%, 1/17/2034 | | 178,000 | | 204,923 |
| | | | |
| | | | 5,084,699 |
| | | | |
Sovereign Bonds 0.1% | | | | |
Federative Republic of Brazil, 8.875%, 10/14/2019 | | 55,000 | | 61,627 |
Republic of Argentina: | | | | |
Zero Coupon, 12/15/2035 | | 2,177,924 | | 113,252 |
Step-up Coupon, 1.33% to 3/31/2009, 2.5% to 3/31/2019, 3.75% to 3/31/2029, 5.25% to 12/31/2038 | | 330,000 | | 108,900 |
8.28%, 12/31/2033 (PIK) | | 663,886 | | 552,685 |
United Mexican States, 8.375%, 1/14/2011 | | 60,000 | | 68,400 |
| | | | |
| | | | 904,864 |
| | | | |
Telecommunication Services 0.5% | | | | |
British Telecommunications PLC, 8.875%, 12/15/2030 | | 658,000 | | 880,366 |
Cell C Property Ltd., 144A, 11.0%, 7/1/2015 | | 185,000 | | 188,238 |
Embratel, Series B, 11.0%, 12/15/2008 | | 104,000 | | 117,780 |
Global Crossing UK Finance, 10.75%, 12/15/2014 | | 165,000 | | 151,800 |
Intelsat Bermuda Ltd., 144A, 8.695%**, 1/15/2012 | | 105,000 | | 106,706 |
Intelsat Ltd., 5.25%, 11/1/2008 | | 155,000 | | 141,244 |
Millicom International Cellular SA, 10.0%, 12/1/2013 | | 80,000 | | 82,600 |
Mobifon Holdings BV, 12.5%, 7/31/2010 | | 265,000 | | 307,400 |
Nortel Networks Ltd., 6.125%, 2/15/2006 | | 370,000 | | 370,000 |
Telecom Italia Capital: | | | | |
4.95%, 9/30/2014 | | 470,000 | | 448,891 |
5.25%, 11/15/2013 | | 655,000 | | 642,734 |
| | | | |
| | | | 3,437,759 |
| | | | |
Utilities 0.0% | | | | |
Scottish Power PLC, 5.81%, 3/15/2025 | | 170,000 | | 172,427 |
| | | | |
Total Foreign Bonds — US$ Denominated (Cost $21,241,448) | | | | 21,407,640 |
| | | | |
Foreign Bonds — Non US$ Denominated 0.1% | | | | |
Consumer Discretionary 0.0% | | | | |
IESY Repository GmbH, 144A, 8.75%, 2/15/2015 EUR | | 160,000 | | 187,056 |
| | | | |
Consumer Staples 0.0% | | | | |
Fage Dairy Industry SA, 144A, 7.5%, 1/15/2015 EUR | | 95,000 | | 97,568 |
| | | | |
Industrials 0.0% | | | | |
Grohe Holdings GmbH, 144A, 8.625%, 10/1/2014 EUR | | 85,000 | | 93,336 |
| | | | |
27
| | | | |
| | | Principal Amount ($)(b) | | Value ($) |
Sovereign Bonds 0.1% | | | | |
Republic of Argentina: | | | | |
Zero Coupon, 12/31/2035 EUR | | 988,353 | | 15,780 |
Zero Coupon, 12/31/2035 EUR | | 178,011 | | 10,223 |
5.83%, 12/31/2033 (PIK) ARS | | 333,075 | | 128,769 |
7.82%, 12/31/2033 (PIK) EUR | | 63,738 | | 63,009 |
| | | | |
| | | | 217,781 |
| | | | |
Total Foreign Bonds — Non US$ Denominated (Cost $599,103) | | | | 595,741 |
| | | | |
Asset Backed 1.8% | | | | |
Automobile Receivables 0.4% | | | | |
Hertz Vehicle Financing LLC, “A6”, Series 2005-2A, 144A, 5.08%, 11/25/2011 | | 1,347,000 | | 1,349,000 |
MMCA Automobile Trust: | | | | |
“A4”, Series 2002-4, 3.05%, 11/16/2009 | | 375,626 | | 372,203 |
“A4”, Series 2002-3, 3.57%, 8/17/2009 | | 175,122 | | 174,669 |
“A4”, Series 2002-2, 4.3%, 3/15/2010 | | 170,937 | | 170,437 |
“B”, Series 2002-2, 4.67%, 3/15/2010 | | 75,452 | | 74,450 |
“B”, Series 2002-1, 5.37%, 1/15/2010 | | 327,711 | | 326,839 |
| | | | |
| | | | 2,467,598 |
| | | | |
Credit Card Receivables 0.5% | | | | |
Citibank Credit Card Issuance Trust, “A6” Series 2003-A6, 2.9%, 5/17/2010 | | 2,000,000 | | 1,914,716 |
MBNA Credit Card Master Note Trust, “A7”, Series 2003-A7, 2.65%, 11/15/2010 | | 1,500,000 | | 1,426,301 |
| | | | |
| | | | 3,341,017 |
| | | | |
Home Equity Loans 0.6% | | | | |
Advanta Mortgage Loan Trust, “A6”, Series 2000-2, 7.72%, 3/25/2015 | | 251,420 | | 255,269 |
Countrywide Asset-Backed Certificates, “1AF2”, Series 2005-17, 5.363%, 5/25/2036 | | 689,000 | | 688,998 |
New Century Home Equity Loan Trust, “AII3”, Series 2004-A, 4.45%, 8/25/2034 | | 1,530,000 | | 1,519,590 |
Renaissance Home Equity Loan Trust, “AF6”, Series 2005-2, 4.781%, 8/25/2035 | | 450,000 | | 431,609 |
Residential Asset Securities Corp., “AI6”, Series 2000-KS1, 7.905%, 2/25/2031 | | 1,284,491 | | 1,290,076 |
| | | | |
| | | | 4,185,542 |
| | | | |
Manufactured Housing Receivables 0.0% | | | | |
Vanderbilt Acquisition Loan Trust, “A2”, Series 2002-1, 4.77%, 10/7/2018 | | 110,512 | | 110,420 |
Miscellaneous 0.3% | | | | |
PP&L Transition Bond Co. LLC, “A8”, Series 1999-1, 7.15%, 6/25/2009 | | 1,800,000 | | 1,894,465 |
| | | | |
Total Asset Backed (Cost $12,159,359) | | | | 11,999,042 |
| | | | |
| | |
| | | Principal Amount ($)(b) | | Value ($) |
Convertible Bond 0.1% | | | | |
Consumer Discretionary | | | | |
HIH Capital Ltd.: | | | | |
144A, Series DOM, 7.5%, 9/25/2006 | | 210,000 | | 207,900 |
144A, Series EURO, 7.5%, 9/25/2006 | | 185,000 | | 183,150 |
| | | | |
Total Convertible Bond (Cost $393,508) | | | | 391,050 |
| | | | |
28
| | | | |
| | | Shares | | Value ($) |
Warrants 0.0% | | | | |
Industrials | | | | |
MicroStrategy, Inc.* | | 96 | | 13 |
TravelCenters of America, Inc.* | | 59 | | 7 |
| | | | |
Total Warrants (Cost $251) | | | | 20 |
| | | | |
Preferred Stock 0.1% | | | | |
Financials | | | | |
Axis Capital Holdings Ltd., Series B, 7.5% | | 1,950 | | 202,922 |
Farm Credit Bank of Texas, Series 1 | | 198,000 | | 217,164 |
Market Capital Trust I, Series B, 8.71% | | 107,000 | | 115,011 |
Paxson Communications Corp., 14.25% (PIK) | | 20 | | 174,006 |
| | | | |
Total Preferred Stock (Cost $672,417) | | | | 709,103 |
| | | | |
| | |
| | | Principal Amount ($)(b) | | Value ($) |
US Government Sponsored Agencies 1.5% | | | | |
Federal Home Loan Mortgage Corp., 4.375%, 11/16/2007 (Cost $10,002,921) | | 10,000,000 | | 9,934,375 |
| | | | |
US Government Agency Sponsored Pass-Throughs 2.1% | | | | |
Federal Home Loan Mortgage Corp.: | | | | |
5.0%, with various maturities from 11/1/2035 until 12/1/2035 | | 534,999 | | 517,946 |
6.0%, with various maturities from 8/1/2035 until 10/1/2035 | | 2,285,894 | | 2,292,691 |
Federal National Mortgage Association: | | | | |
4.5%, with various maturities from 7/1/2018 until 9/1/2035 (h) | | 4,854,782 | | 4,647,190 |
5.0%, with various maturities from 4/1/2024 until 5/1/2034 (h) | | 3,322,738 | | 3,240,217 |
5.5%, with various maturities from 7/1/2023 until 1/1/2034 (h) | | 3,231,356 | | 3,214,897 |
6.0%, 1/1/2024 | | 197,850 | | 201,169 |
6.5%, 5/1/2017 | | 114,779 | | 117,927 |
7.13%, 1/1/2012 | | 192,514 | | 194,662 |
29
| | | | |
| | | Principal Amount ($)(b) | | Value ($) |
8.0%, 9/1/2015 | | 269,343 | | 287,627 |
| | | | |
Total US Government Agency Sponsored Pass-Throughs (Cost $14,936,784) | | | | 14,714,326 |
| | | | |
Commercial and Non-Agency Mortgage-Backed Securities 7.1% | | | | |
Adjustable Rate Mortgage Trust, “3A31”, Series 2005-10, 5.437%**, 1/25/2036 | | 1,000,000 | | 993,445 |
Bank of America Mortgage Securities, “2A6”, Series 2004-G, 4.657%**, 8/25/2034 | | 2,275,000 | | 2,250,428 |
Bear Stearns Adjustable Rate Mortgage Trust, “2A3”, Series 2005-4, 4.45%**, 8/25/2035 | | 705,000 | | 684,678 |
Bear Stearns Commercial Mortgage Securities, “AJ”, Series 2005-PW10, 5.464%, 12/11/2040 | | 1,630,000 | | 1,657,342 |
Chase Mortgage Finance Corp., “2A1”, Series 2004-S3, 5.25%, 3/25/2034 | | 681,160 | | 679,867 |
Citigroup Commercial Mortgage Trust, “A5”, Series 2004-C2, 4.733%, 10/15/2041 | | 2,000,000 | | 1,942,248 |
Citigroup Mortgage Loan Trust, Inc., “1CB2”, Series 2004-NCM2, 6.75%, 8/25/2034 | | 413,180 | | 425,446 |
Commercial Mortgage Acceptance Corp., “A3”, Series 1998-C2, 6.04%, 9/15/2030 | | 1,510,000 | | 1,544,612 |
Countrywide Alternative Loan Trust: | | | | |
“A1”, Series 2004-1T1, 5.0%, 2/25/2034 | | 940,903 | | 931,255 |
“1A5”, Series 2003-J1, 5.25%, 10/25/2033 | | 880,537 | | 877,801 |
“A2”, Series 2004-1T1, 5.5%, 2/25/2034 | | 621,878 | | 621,314 |
“4A3”, Series 2005-43, 5.763%**, 10/25/2035 | | 973,976 | | 974,897 |
“1A1”, Series 2004-J1, 6.0%, 2/25/2034 | | 391,892 | | 392,809 |
“A1”, Series 2004-35T2, 6.0%, 2/25/2035 | | 1,061,291 | | 1,064,171 |
Countrywide Home Loans, “A6”, Series 2003-57, 5.5%, 1/25/2034 | | 553,708 | | 553,043 |
DLJ Mortgage Acceptance Corp., “A1B”, Series 1997-CF2, 144A, 6.82%, 10/15/2030 | | 139,851 | | 142,858 |
First Union-Lehman Brothers Commercial Mortgage, “A3”, Series 1997-C1, 7.38%, 4/18/2029 | | 968,875 | | 984,342 |
GMAC Commercial Mortgage Securities, Inc., “A3”, Series 1997-C1, 6.869%, 7/15/2029 | | 77,766 | | 79,489 |
Greenwich Capital Commercial Funding Corp, “A4”, Series 2005-GG3, 4.799%, 8/10/2042 | | 2,000,000 | | 1,948,623 |
GS Mortgage Securities Corp. II: | | | | |
“AJ”, Series 2005-GG4, 4.782%, 7/10/2039 | | 900,000 | | 865,779 |
“C”, Series 1998-C1, 6.91%, 10/18/2030 | | 205,000 | | 213,769 |
GSR Mortgage Loan Trust, “4A5”, Series 2005-AR6, 4.556%**, 9/25/2035 | | 1,025,000 | | 1,000,112 |
| | |
| | | Principal Amount ($)(b) | | Value ($) |
JPMorgan Chase Commercial Mortgage Securities Corp., “A3”, Series 2001-CIBC, 6.26%, 3/15/2033 | | 2,145,000 | | 2,255,524 |
JPMorgan Mortgage Trust, “2A1”, Series 2005-A8, 4.969%, 11/25/2035 | | 952,961 | | 945,838 |
LB-UBS Commercial Mortgage Trust: | | | | |
“AM”, Series 2005-C3, 4.794%, 7/15/2040 | | 905,000 | | 877,072 |
“A2”, Series 2005-C2, 4.821%, 4/15/2030 | | 165,000 | | 163,447 |
Master Alternative Loans Trust: | | | | |
“5A1”, Series 2005-1, 5.5%, 1/25/2020 | | 1,175,734 | | 1,177,838 |
“3A1”, Series 2004-5, 6.5%, 6/25/2034 | | 292,266 | | 297,381 |
“5A1”, Series 2005-2, 6.5%, 12/25/2034 | | 443,879 | | 447,521 |
“8A1”, Series 2004-3, 7.0%, 4/25/2034 | | 198,092 | | 199,787 |
Master Asset Securitization Trust, “8A1”, Series 2003-6, 5.5%, 7/25/2033 | | 994,301 | | 977,522 |
Mortgage Capital Funding, Inc., “A3”, Series 1997-MC1, 7.288%, 7/20/2027 | | 207,262 | | 209,854 |
Residential Accredit Loans, Inc., “CB”, Series 2004-QS2, 5.75%, 2/25/2034 | | 1,075,194 | | 1,068,139 |
Residential Asset Mortgage Products, “2A6”, Series 2005-SP1, 5.25%, 9/25/2034 | | 1,250,300 | | 1,244,315 |
Residential Asset Securities Corp., “AI”, Series 2003-KS9, 4.71%, 11/25/2033 | | 1,845,000 | | 1,840,693 |
Structured Adjustable Rate Mortgage Loan Trust: | | | | |
“1A4”, Series 2005-22, 5.25%, 12/25/2035 | | 970,000 | | 967,196 |
“6A3”, Series 2005-21, 5.4%, 11/25/2035 | | 900,000 | | 894,100 |
“1A1”, Series 2005-17, 5.729%**, 8/25/2035 | | 1,678,871 | | 1,683,938 |
Structured Asset Securities Corp.: | | | | |
“4A1”, Series 2005-6, 5.0%, 5/25/2035 | | 181,418 | | 174,955 |
“2A1”, Series 2003-1, 6.0%, 2/25/2018 | | 132,439 | | 133,625 |
Wachovia Bank Commercial Mortgage Trust, “AMFX”, Series 2005-C20, 5.179%, 7/15/2042 | | 1,890,000 | | 1,878,166 |
Washington Mutual: | | | | |
“A6”, Series 2004-AR4, 3.804%**, 6/25/2034 | | 190,000 | | 182,557 |
“A6”, Series 2003-AR11, 3.985%, 10/25/2033 | | 885,000 | | 859,396 |
“A6”, Series 2003-AR10, 4.067%**, 10/25/2033 | | 1,620,000 | | 1,583,180 |
“A7”, Series 2004-AR9, 4.181%**, 8/25/2034 | | 1,325,000 | | 1,297,771 |
“1A6”, Series 2005-AR12, 4.844%**, 10/25/2035 | | 1,880,000 | | 1,849,805 |
“1A3”, Series 2005-AR16, 5.132%, 12/25/2035 | | 1,005,000 | | 992,036 |
Wells Fargo Mortgage Backed Securities Trust: | | | | |
“2A17”, Series 2005-AR10, 3.5%**, 6/25/2035 | | 230,000 | | 221,373 |
30
| | | | |
| | | Principal Amount ($)(b) | | Value ($) |
“2A14”, Series 2005-AR10, 4.11%**, 6/25/2035 | | 1,355,000 | | 1,317,054 |
“B1”, Series 2005-AR12, 4.326%**, 7/25/2035 | | 937,784 | | 901,951 |
“4A2”, Series 2005-AR16, 4.993%, 10/25/2035 | | 1,470,000 | | 1,450,253 |
| | | | |
Total Commercial and Non-Agency Mortgage-Backed Securities (Cost $49,480,906) | | | | 48,920,615 |
| | | | |
Collateralized Mortgage Obligations 4.9% | | | | |
Fannie Mae Whole Loan: | | | | |
“3A2B”, Series 2003-W10, 3.056%, 7/25/2037 | | 371,318 | | 368,959 |
“1A3”, Series 2004-W1, 4.49%, 11/25/2043 | | 575,631 | | 573,534 |
“1A3”, Series 2003-W18, 4.732%, 8/25/2043 | | 76,933 | | 76,706 |
“1A3”, Series 2003-W19, 4.783%, 11/25/2033 | | 396,053 | | 394,106 |
“1A1”, Series 2004-W15, 6.0%, 8/25/2044 | | 1,125,825 | | 1,137,734 |
Federal Home Loan Mortgage Corp.: | | | | |
“YN”, Series 2852, 3.75%, 6/15/2024 | | 410,000 | | 397,003 |
“NB”, Series 2750, 4.0%, 12/15/2022 | | 1,558,000 | | 1,527,569 |
“QC”, Series 2836, 5.0%, 9/15/2022 | | 2,220,000 | | 2,215,162 |
“TK”, Series 2693, 5.0%, 8/15/2027 | | 1,655,000 | | 1,642,127 |
“BG”, Series 2640, 5.0%, 2/15/2032 | | 510,000 | | 496,777 |
“JD”, Series 2778, 5.0%, 12/15/2032 | | 290,000 | | 279,968 |
“EG”, Series 2836, 5.0%, 12/15/2032 | | 455,000 | | 438,437 |
“TE”, Series 2780, 5.0%, 1/15/2033 | | 1,685,000 | | 1,627,876 |
“PD”, Series 2783, 5.0%, 1/15/2033 | | 975,000 | | 942,134 |
“NE”, Series 2802, 5.0%, 2/15/2033 | | 460,000 | | 444,382 |
“PD”, Series 2893, 5.0%, 2/15/2033 | | 370,000 | | 355,956 |
“OG”, Series 2889, 5.0%, 5/15/2033 | | 2,115,000 | | 2,041,504 |
“PE”, Series 2898, 5.0%, 5/15/2033 | | 1,715,000 | | 1,649,686 |
“XD”, Series 2941, 5.0%, 5/15/2033 | | 1,830,000 | | 1,758,472 |
“BG”, Series 2869, 5.0%, 7/15/2033 | | 213,000 | | 205,007 |
“PD”, Series 2939, 5.0%, 7/15/2033 | | 1,105,000 | | 1,062,160 |
“JG”, Series 2937, 5.0%, 8/15/2033 | | 1,705,000 | | 1,650,674 |
“KD”, Series 2915, 5.0%, 9/15/2033 | | 1,177,000 | | 1,132,005 |
“ND”, Series 2938, 5.0%, 10/15/2033 | | 170,000 | | 163,426 |
“KG”, Series 2987, 5.0%, 12/15/2034 | | 1,360,000 | | 1,305,923 |
“PE”, Series 2512, 5.5%, 2/15/2022 | | 420,000 | | 427,587 |
“BD”, Series 2453, 6.0%, 5/15/2017 | | 1,869,590 | | 1,915,793 |
| | |
| | | Principal Amount ($)(b) | | Value ($) |
“Z”, Series 2173, 6.5%, 7/15/2029 | | 67,594 | | 69,906 |
“H”, Series 2278, 6.5%, 1/15/2031 | | 51,284 | | 51,741 |
Federal National Mortgage Association: | | | | |
“TU”, Series 2003-122, 4.0%, 5/25/2016 | | 350,000 | | 345,459 |
“WB”, Series 2003-106, 4.5%, 10/25/2015 | | 1,870,000 | | 1,853,734 |
“NE”, Series 2004-52, 4.5%, 7/25/2033 | | 1,118,000 | | 1,048,518 |
“PE”, Series 2005-44, 5.0%, 7/25/2033 | | 365,000 | | 350,182 |
“QD”, Series 2005-29, 5.0%, 8/25/2033 | | 760,000 | | 729,251 |
“EG”, Series 2005-22, 5.0%, 11/25/2033 | | 1,042,000 | | 1,000,053 |
“PM”, Series 2001-60, 6.0%, 3/25/2030 | | 165,139 | | 165,317 |
“HM”, Series 2002-36, 6.5%, 12/25/2029 | | 46,456 | | 46,517 |
“A1”, Series 2002-93, 6.5%, 3/25/2032 | | 273,818 | | 277,998 |
“C”, Series 1997-M5, 6.74%, 8/25/2007 | | 390,000 | | 398,836 |
Government National Mortgage Association, “PD”, Series 2004-30, 5.0%, 2/20/2033 | | 1,115,000 | | 1,078,727 |
| | | | |
Total Collateralized Mortgage Obligations (Cost $34,347,361) | | | | 33,646,906 |
| | | | |
Municipal Bonds and Notes 1.7% | | | | |
Brockton, MA, General Obligation, Economic Development, Series A, 6.45%, 5/1/2017 (c) | | 560,000 | | 608,423 |
Broward County, FL, Airport Revenue, Airport Systems Revenue, Series J-2, 6.13%, 10/1/2007 (c) | | 1,000,000 | | 1,020,850 |
Charlotte-Mecklenberg, NC, Hospital Authority, Health Care System Revenue, ETM, 5.0%, 8/1/2015 | | 510,000 | | 513,142 |
Hoboken, NJ, General Obligation, Series B, 3.8%, 1/1/2008 (c) | | 185,000 | | 182,782 |
Illinois, Higher Education Revenue, Educational Facilities Authority, Series C, 7.1%, 7/1/2012 (c) | | 1,000,000 | | 1,118,890 |
Jersey City, NJ, Water & Sewer Revenue, Municipal Utilities Authority, Water Revenue, Series B, 4.91%, 5/15/2015 (c) | | 385,000 | | 381,985 |
Jicarilla, NM, Sales & Tax Special Revenue, Apache Nation Revenue, 144A, 5.2%, 12/1/2013 | | 215,000 | | 215,849 |
Mashantucket, CT, Special Assessment Revenue, Western Pequot Tribe Special Revenue, Series A, 144A, 6.57%, 9/1/2013 (c) | | 1,285,000 | | 1,358,939 |
Ohio, Sales & Special Tax Revenue, 7.6%, 10/1/2016 (c) | | 1,000,000 | | 1,039,520 |
Passaic County, NJ, County General Obligation, 5.0%, 2/15/2017 (c) | | 1,120,000 | | 1,127,347 |
31
| | | | | | |
| | | Principal Amount ($)(b) | | | Value ($) | |
Texas, American Campus Properties Student Housing Financing Ltd, 144A, 6.125%, 8/1/2023 (c) | | 1,040,000 | | | 1,122,025 | |
Union County, NJ, Improvement Authority, Student Loan Revenue, 5.29%, 4/1/2018 (c) | | 1,185,000 | | | 1,195,866 | |
Washington, State Economic Development Finance Authority Revenue, CSC Tacoma LLC Project, Series A, 3.5%, 10/1/2010 (c) | | 1,840,000 | | | 1,733,722 | |
Yazoo County, MS, Sales & Special Tax Revenue, Series B, 4.3%, 9/1/2010 (c) | | 355,000 | | | 347,272 | |
| | | | | | |
Total Municipal Bonds and Notes (Cost $11,930,483) | | | | | 11,966,612 | |
| | | | | | |
US Treasury Obligations 3.2% | | | | | | |
US Treasury Bills, 3.75%***, 1/19/2006 (d) | | 675,000 | | | 673,732 | |
US Treasury Bond, 6.0%, 2/15/2026 | | 3,275,000 | | | 3,861,942 | |
US Treasury Notes: | | | | | | |
3.375%, 2/15/2008 | | 4,728,000 | | | 4,630,669 | |
4.25%, 11/30/2007 | | 3,800,000 | | | 3,788,866 | |
4.5%, 11/15/2015 | | 3,265,000 | | | 3,291,783 | |
4.75%, 5/15/2014 | | 250,000 | | | 256,084 | |
5.0%, 8/15/2011 | | 5,380,000 | | | 5,552,956 | |
| | | | | | |
Total US Treasury Obligations (Cost $21,762,017) | | | | | 22,056,032 | |
| | | | | | |
| | |
| | | Units | | | Value ($) | |
Other Investments 0.0% | | | | | | |
Hercules, Inc. (Bond Unit), 6.5%, 6/30/2029 | | 230,000 | | | 172,500 | |
IdleAire Technologies Corp., 144A, Step-up Coupon, 0% to 12/15/2009, 13.0% to 12/15/2012 | | 220,000 | | | 161,307 | |
| | | | | | |
Total Other Investments (Cost $325,185) | | | | | 333,807 | |
| | | | | | |
| | |
| | | Shares | | | Value ($) | |
Securities Lending Collateral 1.5% | | | | | | |
Daily Assets Fund Institutional, 4.28% (e) (f) (Cost $10,432,555) | | 10,432,555 | | | 10,432,555 | |
| | | | | | |
Cash Equivalents 5.1% | | | | | | |
Cash Management QP Trust, 4.26% (g) (Cost $35,179,405) | | 35,179,405 | | | 35,179,405 | |
| | | | | | |
| | |
| | | % of Net Assets | | | Value ($) | |
Total Investment Portfolio (Cost $630,023,423)+ | | 102.6 | | | 704,416,236 | |
| | | | | | |
Other Assets and Liabilities, Net | | (2.6 | ) | | (17,333,597 | ) |
| | | | | | |
Net Assets | | 100.0 | | | 687,082,639 | |
| | | | | | |
32
Notes to DWS Balanced VIP Portfolio of Investments
| * | Non-income producing security. In the case of a bond, generally denotes that the issuer has defaulted on the payment of principal or the interest or has filed for bankruptcy. The following table represents bonds that are in default: |
| | | | | | | | | | | | | | | |
Securities | | Coupon | | | Maturity Date | | Principal Amount | | Acquisition Cost ($) | | Value ($) |
Congoleum Corp. | | 8.625 | % | | 8/1/2008 | | 190,000 | | USD | | | 190,156 | | | 189,287 |
Oxford Automotive, Inc. | | 12.0 | % | | 10/15/2010 | | 257,130 | | USD | | | 22,782 | | | 23,142 |
| | | | | | | | | | | | | | | |
| | | | | | | | | | | $ | 212,938 | | $ | 212,429 |
| | | | | | | | | | | | | | | |
| ** | Floating rate notes are securities whose yields vary with a designated market index or market rate, such as the coupon-equivalent of the US Treasury bill rate. These securities are shown at their current rate as of December 31, 2005. |
| *** | Annualized yield at time of purchase; not a coupon rate. |
| + | The cost for federal income tax purposes was $637,375,790. At December 31, 2005, net unrealized appreciation for all securities based on tax cost was $67,040,446. This consisted of aggregate gross unrealized appreciation for all securities in which there was an excess of value over tax cost of $76,484,775 and aggregate gross unrealized depreciation for all securities in which there was an excess of tax cost over value of $9,444,329. |
| (a) | All or a portion of these securities were on loan (see Notes to Financial Statements). The value of all securities loaned at December 31, 2005 amounted to $10,207,529 which is 1.5% of net assets. |
| (b) | Principal amount stated in US dollars unless otherwise noted. |
| (c) | Bond is insured by one of these companies: |
| | | |
Insurance Coverage | | As a % of Total
Investment Portfolio | |
Ambac Financial Group | | 0.7 | % |
Financial Guarantee Insurance Company | | 0.1 | % |
Financial Security Assurance, Inc. | | 0.3 | % |
MBIA Corp. | | 0.5 | % |
| (d) | At December 31, 2005, this security has been pledged, in whole or in part, to cover initial margin requirements for open futures contracts. |
| (e) | Daily Assets Fund Institutional, an affiliated fund, is managed by Deutsche Asset Management, Inc. The rate shown is the annualized seven-day yield at period end. |
| (f) | Represents collateral held in connection with securities lending. |
33
| (g) | Cash Management QP Trust, an affiliated fund, is managed by Deutsche Investment Management Americas Inc. The rate shown is the annualized seven-day yield at period end. |
| 144A: | Security exempt from registration under Rule 144A of the Securities Act of 1933. These securities may be resold in transactions exempt from registration, normally to qualified institutional buyers. |
| ADR: | American Depositary Receipt |
| ETM: | Bonds bearing the description ETM (escrow to maturity) are collateralized by US Treasury securities which are held in escrow and used to pay principal and interest on bonds so designated. |
| PIK: | Denotes that all or a portion of the income is paid in-kind. |
| REIT: | Real Estate Investment Trust |
Included in the portfolio are investments in mortgage or asset-backed securities which are interests in separate pools of mortgages or assets. Effective maturities of these investments may be shorter than stated maturities due to prepayments. Some separate investments in the Federal National Mortgage Association and Federal Home Loan Corp. issues which have similar coupon rates have been aggregated for presentation purposes in this investment portfolio.
At December 31, 2005, open futures contracts purchased were as follows:
| | | | | | | | | | | |
Futures | | Expiration Date | | Contracts | | Aggregated Face
Value ($) | | Value ($) | | Unrealized
Appreciation/
(Depreciation) ($) | |
10 Year Canada Government Bond | | 3/22/2006 | | 29 | | 2,842,739 | | 2,853,473 | | 10,734 | |
10 Year Federal Germany Bond | | 3/8/2006 | | 47 | | 6,726,245 | | 6,779,579 | | 53,334 | |
10 Year Japanese Government Bond | | 3/9/2006 | | 4 | | 4,673,856 | | 4,658,498 | | (15,358 | ) |
Russell 2000 Index | | 3/16/2006 | | 2 | | 690,409 | | 678,300 | | (12,109 | ) |
| | | | | | | | | | | |
Total net unrealized appreciation | | | | | | | | | | 36,601 | |
| | | | | | | | | | | |
At December 31, 2005, open futures contracts sold were as follows:
| | | | | | | | | | | |
Futures | | Expiration Date | | Contracts | | Aggregated Face
Value ($) | | Value ($) | | Unrealized Depreciation ($) | |
10 Year Australian Bond | | 3/15/2006 | | 29 | | 2,202,815 | | 2,255,614 | | (52,799 | ) |
10 Year US Treasury Note | | 3/22/2006 | | 58 | | 6,309,575 | | 6,345,562 | | (35,987 | ) |
10 Year United Kingdom Treasury Bond | | 3/29/2006 | | 29 | | 5,657,978 | | 5,710,429 | | (52,451 | ) |
| | | | | | | | | | | |
Total net unrealized depreciation | | | | | | | | | | (141,237 | ) |
| | | | | | | | | | | |
Currency Abbreviations
ARS Argentina Peso
EUR Euro
The accompanying notes are an integral part of the financial statements.
34
Financial Statements
| | | | |
| Statement of Assets and Liabilities | | | | |
| |
as of December 31, 2005 | | | | |
| |
Assets | | | | |
Investments: Investments in securities, at value (cost $584,411,463) — including $10,207,529 of securities loaned | | $ | 658,804,276 | |
Investment in Daily Assets Fund Institutional (cost $10,432,555)* | | | 10,432,555 | |
Investment in Cash Management QP Trust (cost $35,179,405) | | | 35,179,405 | |
Total investments in securities, at value (cost $630,023,423) | | | 704,416,236 | |
Foreign currency, at value (cost $194,656) | | | 195,054 | |
Receivable for investments sold | | | 1,045,566 | |
Dividends receivable | | | 363,703 | |
Interest receivable | | | 3,017,199 | |
Receivable for Portfolio shares sold | | | 19,901 | |
Receivable for daily variation margin on open futures contracts | | | 4,587 | |
Unrealized appreciation on forward foreign currency exchange contracts | | | 208,357 | |
Foreign taxes recoverable | | | 6,046 | |
Due from Advisor | | | 3,830 | |
Other assets | | | 22,414 | |
Total assets | | | 709,302,893 | |
Liabilities | | | | |
Due to custodian bank | | | 9,816,248 | |
Payable for investments purchased | | | 898,235 | |
Payable for Portfolio shares redeemed | | | 477,110 | |
Payable upon return of securities loaned | | | 10,432,555 | |
Net payable on closed forward foreign currency exchange contracts | | | 22,706 | |
Unrealized depreciation on forward foreign currency exchange contracts | | | 144,715 | |
Accrued management fee | | | 273,695 | |
Other accrued expenses and payables | | | 154,990 | |
Total liabilities | | | 22,220,254 | |
| | | | |
Net assets, at value | | $ | 687,082,639 | |
| | | | |
Net Assets | | | | |
Net assets consist of: | | | | |
Undistributed net investment income | | | 16,253,135 | |
Net unrealized appreciation (depreciation) on: | | | | |
Investments | | | 74,392,813 | |
Futures | | | (104,636 | ) |
Foreign currency related transactions | | | 64,026 | |
Accumulated net realized gain (loss) | | | (83,310,602 | ) |
Paid-in capital | | | 679,787,903 | |
| | | | |
Net assets, at value | | $ | 687,082,639 | |
| | | | |
Class A | | | | |
Net Asset Value, offering and redemption price per share ($653,468,367 ÷ 28,729,438 outstanding shares of beneficial interest, $.01 par value, unlimited number of shares authorized) | | $ | 22.75 | |
| | | | |
Class B | | | | |
Net Asset Value, offering and redemption price per share ($33,614,272 ÷ 1,479,683 outstanding shares of beneficial interest, $.01 par value, unlimited number of shares authorized) | | $ | 22.72 | |
| | | | |
| * | Represents collateral on securities loaned. |
35
Statement of Operations
for the year ended December 31, 2005
| | | | |
Investment Income | | | | |
Income: | | | | |
Dividends (net of foreign taxes withheld of $52,845) | | $ | 6,512,590 | |
Interest | | | 14,257,081 | |
Interest — Cash Management QP Trust | | | 985,033 | |
Mortgage dollar roll income | | | 8,167 | |
Securities lending income, including income from Daily Assets Fund Institutional, net of borrower rebates | | | 11,107 | |
Total Income | | | 21,773,978 | |
Expenses: | | | | |
Management fee | | | 3,294,501 | |
Custodian fees | | | 109,376 | |
Distribution service fees (Class B) | | | 82,992 | |
Record keeping fees (Class B) | | | 50,599 | |
Auditing | | | 48,698 | |
Legal | | | 6,390 | |
Trustees’ fees and expenses | | | 55,000 | |
Reports to shareholders | | | 100,507 | |
Other | | | 131,579 | |
Total expenses before expense reductions | | | 3,879,642 | |
Expense reductions | | | (117,893 | ) |
Total expenses after expense reductions | | | 3,761,749 | |
| | | | |
Net investment income (loss) | | | 18,012,229 | |
| | | | |
Realized and Unrealized Gain (Loss) on Investment Transactions | | | | |
Net realized gain (loss) from: | | | | |
Investments | | | 15,943,902 | |
Futures | | | 393,288 | |
Foreign currency related transactions | | | 48,014 | |
| | | | |
| | | 16,385,204 | |
| | | | |
Net unrealized appreciation (depreciation) during the period on: | | | | |
Investments | | | (2,066,610 | ) |
Futures | | | (102,802 | ) |
Foreign currency related transactions | | | 158,401 | |
| | | (2,011,011 | ) |
| | | | |
Net gain (loss) on investment transactions | | | 14,374,193 | |
| | | | |
Net increase (decrease) in net assets resulting from operations | | $ | 32,386,422 | |
| | | | |
The accompanying notes are an integral part of the financial statements.
36
Statement of Changes in Net Assets
| | | | | | | | |
| | | Years Ended December 31, | |
Increase (Decrease) in Net Assets | | 2005 | | | 2004 | |
Operations: | | | | | | | | |
Net investment income (loss) | | $ | 18,012,229 | | | $ | 14,447,088 | |
Net realized gain (loss) on investment transactions | | | 16,385,204 | | | | 39,912,342 | |
Net unrealized appreciation (depreciation) during the period on investment and foreign currency transactions | | | (2,011,011 | ) | | | (12,171,380 | ) |
Net increase (decrease) in net assets resulting from operations | | | 32,386,422 | | | | 42,188,050 | |
Distributions to shareholders from: | | | | | | | | |
Net investment income: | | | | | | | | |
Class A | | | (14,467,177 | ) | | | (10,706,370 | ) |
Class B | | | (715,158 | ) | | | (287,648 | ) |
Portfolio share transactions: | | | | | | | | |
Class A | | | | | | | | |
Proceeds from shares sold | | | 6,832,194 | | | | 8,149,762 | |
Net assets acquired in tax free reorganization | | | 118,997,707 | | | | — | |
Reinvestment of distributions | | | 14,467,177 | | | | 10,706,370 | |
Cost of shares redeemed | | | (125,051,390 | ) | | | (94,301,996 | ) |
Net increase (decrease) in net assets from Class A share transactions | | | 15,245,688 | | | | (75,445,864 | ) |
Class B | | | | | | | | |
Proceeds from shares sold | | | 5,663,125 | | | | 12,535,568 | |
Reinvestment of distributions | | | 715,158 | | | | 287,648 | |
Cost of shares redeemed | | | (6,295,649 | ) | | | (2,353,690 | ) |
Net increase (decrease) in net assets from Class B share transactions | | | 82,634 | | | | 10,469,526 | |
Increase (decrease) in net assets | | | 32,532,409 | | | | (33,782,306 | ) |
Net assets at beginning of period | | | 654,550,230 | | | | 688,332,536 | |
| | | | | | | | |
Net assets at end of period (including undistributed net investment income of $16,253,135 and $13,460,556, respectively) | | $ | 687,082,639 | | | $ | 654,550,230 | |
| | | | | | | | |
Other Information | | | | | | | | |
Class A | | | | | | | | |
Shares outstanding at beginning of period | | | 27,789,320 | | | | 31,305,397 | |
Shares sold | | | 311,313 | | | | 380,053 | |
Shares issued in tax free reorganization | | | 5,591,767 | | | | — | |
Shares issued to shareholders in reinvestment of distributions | | | 672,579 | | | | 499,597 | |
Shares redeemed | | | (5,635,541 | ) | | | (4,395,727 | ) |
Net increase (decrease) in Class A shares | | | 940,118 | | | | (3,516,077 | ) |
| | | | | | | | |
Shares outstanding at end of period | | | 28,729,438 | | | | 27,789,320 | |
| | | | | | | | |
Class B | | | | | | | | |
Shares outstanding at beginning of period | | | 1,477,597 | | | | 988,869 | |
Shares sold | | | 254,860 | | | | 584,945 | |
Shares issued to shareholders in reinvestment of distributions | | | 33,201 | | | | 13,398 | |
Shares redeemed | | | (285,975 | ) | | | (109,615 | ) |
Net increase (decrease) in Class B shares | | | 2,086 | | | | 488,728 | |
| | | | | | | | |
Shares outstanding at end of period | | | 1,479,683 | | | | 1,477,597 | |
| | | | | | | | |
The accompanying notes are an integral part of the financial statements.
37
Financial Highlights
| | | | | | | | | | | | | | | | | | | | |
Class A | | | | | | | | | | | | | | | | | | | | |
| | | | | |
Years Ended December 31, | | 2005 | | | 2004 | | | 2003 | | | 2002 | | | 2001a | |
Selected Per Share Data | | | | | | | | | | | | | | | | | | | | |
Net asset value, beginning of period | | $ | 22.37 | | | $ | 21.32 | | | $ | 18.66 | | | $ | 22.57 | | | $ | 25.91 | |
| | | | | | | | | | | | | | | | | | | | |
Income (loss) from investment operations: Net investment income (loss)b | | | .59 | | | | .47 | | | | .37 | | | | .47 | | | | .61 | |
Net realized and unrealized gain (loss) on investment transactions | | | .34 | | | | .93 | | | | 2.90 | | | | (3.81 | ) | | | (2.20 | ) |
Total from investment operations | | | .93 | | | | 1.40 | | | | 3.27 | | | | (3.34 | ) | | | (1.59 | ) |
Less distributions from: Net investment income | | | (.55 | ) | | | (.35 | ) | | | (.61 | ) | | | (.57 | ) | | | (.80 | ) |
Net realized gain on investment transactions | | | — | | | | — | | | | — | | | | — | | | | (.95 | ) |
Total distributions | | | (.55 | ) | | | (.35 | ) | | | (.61 | ) | | | (.57 | ) | | | (1.75 | ) |
| | | | | | | | | | | | | | | | | | | | |
Net asset value, end of period | | $ | 22.75 | | | $ | 22.37 | | | $ | 21.32 | | | $ | 18.66 | | | $ | 22.57 | |
| | | | | | | | | | | | | | | | | | | | |
Total Return (%) | | | 4.30c | | | | 6.64 | | | | 18.10 | | | | (15.17 | ) | | | (6.09 | ) |
Ratios to Average Net Assets and Supplemental Data | | | | | | | | | | | | | | | | | | | | |
Net assets, end of period ($ millions) | | | 653 | | | | 622 | | | | 667 | | | | 640 | | | | 861 | |
Ratio of expenses before expense reduction (%) | | | .55 | | | | .59 | | | | .59 | | | | .58 | | | | .58 | |
Ratio of expenses after expense reduction (%) | | | .53 | | | | .59 | | | | .59 | | | | .58 | | | | .58 | |
Ratio of net investment income (%) | | | 2.66 | | | | 2.18 | | | | 1.88 | | | | 2.32 | | | | 2.63 | |
Portfolio turnover rate (%) | | | 121d | | | | 131d | | | | 102d | | | | 140 | | | | 115 | |
| a | As required, effective January 1, 2001, the Portfolio adopted the provisions of the AICPA Audit and Accounting Guide for Investment Companies and began amortizing premium on debt securities. |
| b | Based on average shares outstanding during the period. |
| c | Total return would have been lower had certain expenses not been reduced. |
| d | The portfolio turnover rate including mortgage dollar roll transactions was 122%, 140% and 108% for the periods ended December 31, 2005, December 31, 2004 and December 31, 2003, respectively. |
| | | | | | | | | | | | | | | | |
Class B | | | | | | | | | | | | | | | | |
| | | | |
Years Ended December 31, | | 2005 | | | 2004 | | | 2003 | | | 2002a | |
Selected Per Share Data | | | | | | | | | | | | | | | | |
Net asset value, beginning of period | | $ | 22.33 | | | $ | 21.28 | | | $ | 18.64 | | | $ | 19.46 | |
| | | | | | | | | | | | | | | | |
Income (loss) from investment operations: | | | | | | | | | | | | | | | | |
Net investment income (loss)b | | | .51 | | | | .39 | | | | .28 | | | | .18 | |
Net realized and unrealized gain (loss) on investment transactions | | | .35 | | | | .92 | | | | 2.92 | | | | (1.00 | ) |
Total from investment operations | | | .86 | | | | 1.31 | | | | 3.20 | | | | (.82 | ) |
Less distributions from: | | | | | | | | | | | | | | | | |
Net investment income | | | (.47 | ) | | | (.26 | ) | | | (.56 | ) | | | — | |
| | | | | | | | | | | | | | | | |
Net asset value, end of period | | $ | 22.72 | | | $ | 22.33 | | | $ | 21.28 | | | $ | 18.64 | |
| | | | | | | | | | | | | | | | |
Total Return (%) | | | 3.90d | | | | 6.26 | | | | 17.66 | | | | (4.21 | )** |
Ratios to Average Net Assets and Supplemental Data | | | | | | | | | | | | | | | | |
Net assets, end of period ($ millions) | | | 34 | | | | 33 | | | | 21 | | | | .8 | |
Ratio of expenses before expense reductions (%) | | | .95 | | | | .97 | | | | .99 | | | | .86 | * |
Ratio of expenses after expense reductions (%) | | | .91 | | | | .97 | | | | .99 | | | | .86 | * |
Ratio of net investment income (%) | | | 2.28 | | | | 1.80 | | | | 1.48 | | | | 1.96 | * |
Portfolio turnover rate (%) | | | 121c | | | | 131c | | | | 102 | c | | | 140 | |
| a | For the period July 1, 2002 (commencement of operations of Class B shares) to December 31, 2002. |
| b | Based on average shares outstanding during the period. |
| c | The portfolio turnover rate including mortgage dollar roll transactions was 122%, 140% and 108% for the periods ended December 31, 2005, December 31, 2004 and December 31, 2003, respectively. |
| d | Total return would have been lower had certain expenses not been reduced. |
38
Performance Summary December 31, 2005
DWS Blue Chip VIP
All performance shown is historical, assumes reinvestment of all dividend and capital gain distributions and does not guarantee future results. Investment return and principal value fluctuate with changing market conditions so that, when redeemed, shares may be worth more or less than their original cost. Current performance may be lower or higher than the performance data quoted. Please visit www.dws-scudder.com for the Portfolio’s most recent month-end performance. Performance doesn’t reflect charges and fees (“contract charges”) associated with the separate account that invests in the Portfolio or any variable life insurance policy or variable annuity contract for which the Portfolio is an investment option. These charges and fees will reduce returns. While all share classes have the same underlying portfolio, their performance will differ.
This Portfolio is subject to stock market risk, meaning stocks in the Portfolio may decline in value for extended periods of time due to the activities and financial prospects of individual companies, or due to general market and economic conditions. It may focus its investments on certain economic sectors, thereby increasing its vulnerability to any single economic, political or regulatory development. This may result in greater share price volatility. Derivatives may be more volatile and less liquid than traditional securities, and the Portfolio could suffer losses on its derivative positions. Please read this Portfolio’s prospectus for specific details regarding its investments and risk profile.
Growth of an Assumed $10,000 Investment in DWS Blue Chip VIP from 5/1/1997 to 12/31/2005
¨ DWS Blue Chip VIP — Class A
¨ Russell 1000 Index
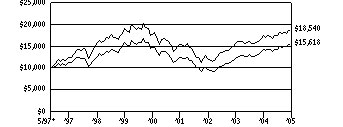
Yearly periods ended December 31
The Russell 1000 Index is an unmanaged index that measures the performance of the 1,000 largest companies in the Russell 3000 Index, which measures the performance of the 3,000 largest US companies based on total market capitalization. The Russell 1000 Index represents approximately 92% of the total market capitalization of the Russell 3000 Index. Index returns assume reinvested dividends and unlike Portfolio returns, do not reflect any fees or expenses. It is not possible to invest directly into an index.
Comparative Results
| | | | | | | | | | | | | | | | | | |
DWS Blue Chip VIP | | | | 1-Year | | | 3-Year | | | 5-Year | | | Life of Portfolio* | |
Class A | | Growth of $10,000 | | $ | 11,006 | | | $ | 16,251 | | | $ | 10,656 | | | $ | 15,618 | |
| | Average annual total return | | | 10.06 | % | | | 17.57 | % | | | 1.28 | % | | | 5.28 | % |
Russell 1000 Index | | Growth of $10,000 | | $ | 10,627 | | | $ | 15,377 | | | $ | 10,548 | | | $ | 18,540 | |
| | Average annual total return | | | 6.27 | % | | | 15.42 | % | | | 1.07 | % | | | 7.38 | % |
| | | | | |
DWS Blue Chip VIP | | | | | | | 1-Year | | | 3-Year | | | Life of Class** | |
Class B | | Growth of $10,000 | | | | | | $ | 10,968 | | | $ | 16,066 | | | $ | 14,613 | |
| | Average annual total return | | | | | | | 9.68 | % | | | 17.12 | % | | | 11.45 | % |
Russell 1000 Index | | Growth of $10,000 | | | | | | $ | 10,627 | | | $ | 15,377 | | | $ | 13,819 | |
| | Average annual total return | | | | | | | 6.27 | % | | | 15.42 | % | | | 9.68 | % |
The growth of $10,000 is cumulative.
| * | The Portfolio commenced operations on May 1, 1997. Index returns begin April 30, 1997. |
| ** | The Portfolio commenced offering Class B shares on July 1, 2002. Index returns begin June 30, 2002. |
39
Information About Your Portfolio’s Expenses
DWS Blue Chip VIP
As an investor of the Portfolio, you incur two types of costs: ongoing expenses and transaction costs. Ongoing expenses include management fees, distribution and service (12b-1) fees and other Portfolio expenses. Examples of transaction costs include sales charges (loads), redemption fees and account maintenance fees, which are not shown in this section. The following tables are intended to help you understand your ongoing expenses (in dollars) of investing in the Portfolio and to help you compare these expenses with the ongoing expenses of investing in other mutual funds. The tables are based on an investment of $1,000 made at the beginning of the six-month period ended December 31, 2005.
The tables illustrate your Portfolio’s expenses in two ways:
Actual Portfolio Return. This helps you estimate the actual dollar amount of ongoing expenses (but not transaction costs) paid on a $1,000 investment in the Portfolio using the Portfolio’s actual return during the period. To estimate the expenses you paid over the period, simply divide your account value by $1,000 (for example, an $8,600 account value divided by $1,000 = 8.6), then multiply the result by the number in the “Expenses Paid per $1,000” line under the share class you hold.
Hypothetical 5% Portfolio Return. This helps you to compare your Portfolio’s ongoing expenses (but not transaction costs) with those of other mutual funds using the Portfolio’s actual expense ratio and a hypothetical rate of return of 5% per year before expenses. Examples using a 5% hypothetical Portfolio return may be found in the shareholder reports of other mutual funds. The hypothetical account values and expenses may not be used to estimate the actual ending account balance or expenses you paid for the period.
Please note that the expenses shown in these tables are meant to highlight your ongoing expenses only and do not reflect any transaction costs. The “Expenses Paid per $1,000” line of the tables is useful in comparing ongoing expenses only and will not help you determine the relative total expense of owning different funds. If these transaction costs had been included, your costs would have been higher.
Expenses and Value of a $1,000 Investment for the six months ended December 31, 2005
| | | | | | |
Actual Portfolio Return | | Class A | | Class B |
Beginning Account Value 7/1/05 | | $ | 1,000.00 | | $ | 1,000.00 |
Ending Account Value 12/31/05 | | $ | 1,088.50 | | $ | 1,086.40 |
Expenses Paid per $1,000* | | $ | 3.68 | | $ | 5.89 |
| | |
Hypothetical 5% Portfolio Return | | Class A | | Class B |
Beginning Account Value 7/1/05 | | $ | 1,000.00 | | $ | 1,000.00 |
Ending Account Value 12/31/05 | | $ | 1,021.68 | | $ | 1,019.56 |
Expenses Paid per $1,000* | | $ | 3.57 | | $ | 5.70 |
| * | Expenses are equal to the Portfolio’s annualized expense ratio for each share class, multiplied by the average account value over the period, multiplied by the number of days in the most recent six-month period, then divided by 365. |
40
| | | | | | |
Annualized Expense Ratios | | Class A | | | Class B | |
DWS Variable Series II — DWS Blue Chip VIP | | .70 | % | | 1.12 | % |
For more information, please refer to the Portfolio’s prospectus.
These tables do not reflect charges and fees (“contract charges”) associated with the separate account that invests in the Portfolio or any variable life insurance policy or variable annuity contract for which the Portfolio is an investment option.
Management Summary December 31, 2005
DWS Blue Chip VIP
The US stock market was up modestly in 2005; the return of the S&P 500 Index was 4.91%. The Portfolio returned 10.06% (Class A shares, unadjusted for contract charges), ahead of the 6.27% return of its benchmark, the Russell 1000 Index.
The Portfolio’s solid performance resulted from a combination of value and growth factors among the nine stock selection signals that guide our stock selection, which uses a combination of quantitative processes and fundamental analysis applied across 24 distinct industry groups. Among these 24 industry groups, the Portfolio outperformed the index in 15 during the period. From a sector perspective, we achieved the strongest relative performance in energy, health care, materials and consumer discretionary. Holdings that performed especially well were energy companies Burlington Resources, Inc. and Sunoco, Inc., the latter of which was sold in October after the price increased to the point that it began to appear expensive relative to its peers. Other contributors to performance included copper producer Phelps Dodge Corp., in the materials group, and Apple Computer, Inc., in the information technology group. In retailing, performance benefited from Safeway, Inc. and Nordstrom, Inc., two holdings that were in the Portfolio during the year but were sold when our selection criteria indicated they no longer offered good value. Detractors included Cree, Inc., LifePoint Hospitals, Inc. and Ryder System, Inc. Except for Cree, a developer and supplier of semiconductors, which we sold in May, we continue to own these stocks, as we believe they offer good value relative to peers and have the potential for revenue and earnings growth.
Overall, we are pleased with the Portfolio’s performance and its current positioning. We believe our stock selection process provides a good balance between value and growth, and has proven to work well in many different market conditions.
Janet Campagna
Robert Wang
Portfolio Managers
Deutsche Investment Management Americas Inc.
All performance shown is historical, assumes reinvestment of all dividend and capital gain distributions, and does not guarantee future results. Investment return and principal value fluctuate with changing market conditions so that, when redeemed, shares may be worth more or less than their original cost. Current performance may be lower or higher than the performance data quoted. Please visit www.dws-scudder.com for the product’s most recent month-end performance. Performance doesn’t reflect charges and fees (“contract charges”) associated with the separate account that invests in the Portfolio or any variable life insurance policy or variable annuity contract for which the Portfolio is an investment option. These charges and fees will reduce returns.
Risk Considerations
This Portfolio is subject to stock market risk, meaning stocks in the Portfolio may decline in value for extended periods of time due to the activities and financial prospects of individual companies, or due to general market and economic conditions. It may focus its investments on certain economic sectors, thereby increasing its vulnerability to any single economic, political or regulatory development. This may result in greater share price volatility. Derivatives may be more volatile and less liquid than traditional securities, and the Portfolio could suffer losses on its derivative positions. Please read this Portfolio’s prospectus for specific details regarding its investments and risk profile.
41
The Standard & Poor’s 500 (S&P 500) Index is an unmanaged, capitalization-weighted index of 500 stocks. The index is designed to measure performance of the broad domestic economy through changes in the aggregate market value of 500 stocks representing all major industries.
The Russell 1000 Index is an unmanaged index that measures the performance of the 1,000 largest companies in the Russell 3000 Index, which measures the performance of the 3,000 largest US companies based on total market capitalization. The Russell 1000 Index represents approximately 92% of the total market capitalization of the Russell 3000 Index.
Index returns assume reinvestment of dividends and, unlike portfolio returns, do not reflect any fees or expenses. It is not possible to invest directly into an index.
Portfolio management market commentary is as of December 31, 2005, and may not come to pass. This information is subject to change at any time based on market and other conditions.
Portfolio Summary
DWS Blue Chip VIP
Asset Allocation
| | | | | | |
| | | 12/31/05 | | | 12/31/04 | |
Common Stocks | | 98 | % | | 96 | % |
Cash Equivalents | | 2 | % | | 4 | % |
| | | | | | |
| | 100 | % | | 100 | % |
| | | | | | |
Sector Diversification (As a % of Common Stocks)
| | | | | | |
| | | 12/31/05 | | | 12/31/04 | |
Financials | | 19 | % | | 19 | % |
Information Technology | | 17 | % | | 14 | % |
Health Care | | 15 | % | | 15 | % |
Consumer Discretionary | | 13 | % | | 12 | % |
Industrials | | 10 | % | | 13 | % |
Energy | | 9 | % | | 8 | % |
Consumer Staples | | 8 | % | | 8 | % |
Materials | | 4 | % | | 5 | % |
Utilities | | 3 | % | | 2 | % |
Telecommunication Services | | 2 | % | | 4 | % |
| | | | | | |
| | 100 | % | | 100 | % |
| | | | | | |
Asset allocation and sector diversification are subject to change.
For more complete details about the Portfolio’s investment portfolio, see page 36. A quarterly Fact Sheet is available upon request. Information concerning portfolio holdings of the Portfolio as of month end will be posted to www.dws-scudder.com on the 15th of the following month.
Following the Portfolio’s fiscal first and third quarter-end, a complete portfolio holdings listing is filed with the SEC on Form N-Q. The form will be available on the SEC’s Web site at www.sec.gov, and it also may be reviewed and copied at the SEC’s Public Reference Room in Washington, D.C. Information on the operation of the SEC’s Public Reference Room may be obtained by calling (800) SEC-0330.
42
Investment Portfolio December 31, 2005
DWS Blue Chip VIP
| | | | |
| | | Shares | | Value ($) |
Common Stocks 98.3% | | | | |
Consumer Discretionary 12.5% | | | | |
Auto Components 0.3% | | | | |
TRW Automotive Holdings Corp.* | | 41,600 | | 1,096,160 |
| | | | |
| | |
Hotels Restaurants & Leisure 2.2% | | | | |
Brinker International, Inc. | | 59,200 | | 2,288,672 |
Darden Restaurants, Inc. | | 15,000 | | 583,200 |
YUM! Brands, Inc. | | 98,000 | | 4,594,240 |
| | | | |
| | | | 7,466,112 |
| | | | |
Internet & Catalog Retail 0.6% | | | | |
eBay, Inc.* | | 44,100 | | 1,907,324 |
| | | | |
| | |
Media 3.4% | | | | |
Cablevision Systems Corp. (New York Group) “A”* | | 124,300 | | 2,917,321 |
McGraw-Hill Companies, Inc. | | 43,400 | | 2,240,742 |
R.H. Donnelley Corp.* | | 17,600 | | 1,084,512 |
Viacom, Inc. “B”* | | 162,500 | | 5,297,500 |
| | | | |
| | | | 11,540,075 |
| | | | |
Multiline Retail 1.7% | | | | |
Federated Department Stores, Inc. | | 56,100 | | 3,721,113 |
J.C. Penney Co., Inc. | | 19,100 | | 1,061,960 |
Target Corp. | | 20,200 | | 1,110,394 |
| | | | |
| | | | 5,893,467 |
| | | | |
Specialty Retail 2.2% | | | | |
American Eagle Outfitters, Inc. | | 129,500 | | 2,975,910 |
Barnes & Noble, Inc. | | 83,700 | | 3,571,479 |
Claire’s Stores, Inc. | | 30,000 | | 876,600 |
| | | | |
| | | | 7,423,989 |
| | | | |
Textiles, Apparel & Luxury Goods 2.1% | | | | |
Coach, Inc.* | | 105,600 | | 3,520,704 |
Polo Ralph Lauren Corp. | | 60,700 | | 3,407,698 |
| | | | |
| | | | 6,928,402 |
| | | | |
Consumer Staples 7.9% | | | | |
Beverages 2.3% | | | | |
PepsiCo, Inc. | | 128,800 | | 7,609,504 |
| | | | |
| | |
Food & Staples Retailing 1.2% | | | | |
Kroger Co.* | | 217,600 | | 4,108,288 |
Wal-Mart Stores, Inc. | | 100 | | 4,680 |
| | | | |
| | | | 4,112,968 |
| | | | |
Food Products 1.9% | | | | |
Pilgrim’s Pride Corp. | | 100,600 | | 3,335,896 |
Tyson Foods, Inc. “A” | | 186,000 | | 3,180,600 |
| | | | |
| | | | 6,516,496 |
| | | | |
Household Products 1.4% | | | | |
Procter & Gamble Co. | | 81,300 | | 4,705,644 |
| | | | |
| | |
Tobacco 1.1% | | | | |
Altria Group, Inc. | | 19,200 | | 1,434,624 |
Loews Corp. — Carolina Group | | 55,200 | | 2,428,248 |
| | | | |
| | | | 3,862,872 |
| | | | |
43
| | | | |
| | | Shares | | Value ($) |
Energy 8.9% | | | | |
Oil, Gas & Consumable Fuels | | | | |
Burlington Resources, Inc. | | 51,800 | | 4,465,160 |
ConocoPhillips | | 100,800 | | 5,864,544 |
ExxonMobil Corp. | | 214,440 | | 12,045,095 |
Occidental Petroleum Corp. | | 52,800 | | 4,217,664 |
Pogo Producing Co. | | 74,100 | | 3,690,921 |
XTO Energy, Inc. | | 1 | | 44 |
| | | | |
| | | | 30,283,428 |
| | | | |
Financials 19.0% | | | | |
Banks 5.3% | | | | |
Bank of America Corp. | | 14,700 | | 678,405 |
KeyCorp | | 55,200 | | 1,817,736 |
PNC Financial Services Group, Inc. | | 38,800 | | 2,399,004 |
US Bancorp. | | 187,400 | | 5,601,386 |
Wells Fargo & Co. | | 118,400 | | 7,439,072 |
| | | | |
| | | | 17,935,603 |
| | | | |
Capital Markets 3.1% | | | | |
Franklin Resources, Inc. | | 10,700 | | 1,005,907 |
Mellon Financial Corp. | | 90,200 | | 3,089,350 |
Merrill Lynch & Co., Inc. | | 9,300 | | 629,889 |
Morgan Stanley | | 28,200 | | 1,600,068 |
The Goldman Sachs Group, Inc. | | 33,800 | | 4,316,598 |
| | | | |
| | | | 10,641,812 |
| | | | |
Diversified Financial Services 4.1% | | | | |
Citigroup, Inc. | | 240,600 | | 11,676,318 |
Fannie Mae | | 25,400 | | 1,239,774 |
Moody’s Corp. | | 15,900 | | 976,578 |
| | | | |
| | | | 13,892,670 |
| | | | |
Insurance 4.8% | | | | |
AFLAC, Inc. | | 29,000 | | 1,346,180 |
American Financial Group, Inc. | | 19,200 | | 735,552 |
Hartford Financial Services Group, Inc. | | 5,400 | | 463,806 |
Loews Corp. | | 8,600 | | 815,710 |
MetLife, Inc. | | 98,800 | | 4,841,200 |
Philadelphia Consolidated Holding Corp.* | | 30,200 | | 2,920,038 |
W.R. Berkley Corp. | | 103,825 | | 4,944,147 |
| | | | |
| | | | 16,066,633 |
| | | | |
Real Estate 1.7% | | | | |
Apartment Investment & Management Co. “A” (REIT) | | 5,700 | | 215,859 |
AvalonBay Communities, Inc. (REIT) | | 5,900 | | 526,575 |
Boston Properties, Inc. (REIT) | | 4,300 | | 318,759 |
Camden Property Trust (REIT) | | 6,600 | | 382,272 |
CenterPoint Properties Trust (REIT) | | 5,200 | | 257,296 |
Equity Office Properties Trust (REIT) | | 33,700 | | 1,022,121 |
Equity Residential (REIT) | | 16,300 | | 637,656 |
General Growth Properties, Inc. (REIT) | | 12,300 | | 577,977 |
Pan Pacific Retail Properties, Inc. (REIT) | | 1,600 | | 107,024 |
Rayonier, Inc. | | 12,300 | | 490,155 |
44
| | | | |
| | | Shares | | Value ($) |
Simon Property Group, Inc. (REIT) | | 2,100 | | 160,923 |
Vornado Realty Trust (REIT) | | 10,800 | | 901,476 |
| | | | |
| | | | 5,598,093 |
| | | | |
Health Care 14.3% | | | | |
Biotechnology 2.3% | | | | |
Amgen, Inc.* | | 4,300 | | 339,098 |
Genzyme Corp.* | | 52,300 | | 3,701,794 |
Gilead Sciences, Inc.* | | 70,900 | | 3,731,467 |
| | | | |
| | | | 7,772,359 |
| | | | |
Health Care Equipment & Supplies 1.9% | | | | |
Baxter International, Inc. | | 103,400 | | 3,893,010 |
Hospira, Inc.* | | 57,400 | | 2,455,572 |
| | | | |
| | | | 6,348,582 |
| | | | |
Health Care Providers & Services 6.6% | | | | |
Aetna, Inc. | | 6,200 | | 584,722 |
AmerisourceBergen Corp. | | 101,200 | | 4,189,680 |
Community Health Systems, Inc.* | | 77,500 | | 2,971,350 |
Express Scripts, Inc.* | | 46,000 | | 3,854,800 |
LifePoint Hospitals, Inc.* | | 40,400 | | 1,515,000 |
Pharmaceutical Product Development, Inc. | | 22,900 | | 1,418,655 |
UnitedHealth Group, Inc. | | 104,800 | | 6,512,272 |
WellPoint, Inc.* | | 15,400 | | 1,228,766 |
| | | | |
| | | | 22,275,245 |
| | | | |
Pharmaceuticals 3.5% | | | | |
Allergan, Inc. | | 44,100 | | 4,761,036 |
Barr Pharmaceuticals, Inc.* | | 49,900 | | 3,108,271 |
Johnson & Johnson | | 13,382 | | 804,258 |
Merck & Co., Inc. | | 68,500 | | 2,178,985 |
Pfizer, Inc. | | 47,050 | | 1,097,206 |
| | | | |
| | | | 11,949,756 |
| | | | |
Industrials 9.7% | | | | |
Aerospace & Defense 5.6% | | | | |
Boeing Co. | | 81,700 | | 5,738,608 |
Lockheed Martin Corp. | | 87,000 | | 5,535,810 |
Raytheon Co. | | 84,100 | | 3,376,615 |
Rockwell Collins, Inc. | | 93,500 | | 4,344,945 |
| | | | |
| | | | 18,995,978 |
| | | | |
Air Freight & Logistics 1.2% | | | | |
Ryder System, Inc. | | 94,600 | | 3,880,492 |
| | | | |
Airlines 0.6% | | | | |
AMR Corp.* | | 52,500 | | 1,167,075 |
Southwest Airlines Co. | | 43,800 | | 719,634 |
| | | | |
| | | | 1,886,709 |
| | | | |
Commercial Services & Supplies 0.3% | | | | |
Republic Services, Inc. | | 24,500 | | 919,975 |
| | | | |
| | |
Industrial Conglomerates 1.5% | | | | |
General Electric Co. | | 137,900 | | 4,833,395 |
Teleflex, Inc. | | 5,600 | | 363,888 |
| | | | |
| | | | 5,197,283 |
| | | | |
Machinery 0.2% | | | | |
Toro Co. | | 17,000 | | 744,090 |
| | | | |
| | |
Road & Rail 0.3% | | | | |
Burlington Northern Santa Fe Corp. | | 15,100 | | 1,069,382 |
| | | | |
| | |
Information Technology 16.9% | | | | |
Communications Equipment 0.9% | | | | |
Corning, Inc.* | | 158,300 | | 3,112,178 |
| | | | |
45
| | | | |
| | | Shares | | Value ($) |
Computers & Peripherals 3.5% | | | | |
Apple Computer, Inc.* | | 61,700 | | 4,435,613 |
Hewlett-Packard Co. | | 174,400 | | 4,993,072 |
Network Appliance, Inc.* | | 87,500 | | 2,362,500 |
| | | | |
| | | | 11,791,185 |
| | | | |
Electronic Equipment & Instruments 1.0% | | | | |
Agilent Technologies, Inc.* | | 98,000 | | 3,262,420 |
| | | | |
| | |
Internet Software & Services 1.0% | | | | |
Google, Inc. “A”* | | 4,300 | | 1,783,898 |
Yahoo!, Inc.* | | 40,600 | | 1,590,708 |
| | | | |
| | | | 3,374,606 |
| | | | |
IT Consulting & Services 0.2% | | | | |
Paychex, Inc. | | 18,600 | | 709,032 |
| | | | |
| | |
Semiconductors & Semiconductor Equipment 6.3% | | | | |
Advanced Micro Devices, Inc.* | | 84,300 | | 2,579,580 |
Broadcom Corp. “A”* | | 25,200 | | 1,188,180 |
Freescale Semiconductor, Inc. “B”* | | 102,400 | | 2,577,408 |
Intel Corp. | | 286,400 | | 7,148,544 |
Lam Research Corp.* | | 64,600 | | 2,304,928 |
Micron Technology, Inc.* | | 120,700 | | 1,606,517 |
Texas Instruments, Inc. | | 124,000 | | 3,976,680 |
| | | | |
| | | | 21,381,837 |
| | | | |
Software 4.0% | | | | |
Cadence Design Systems, Inc.* | | 185,500 | | 3,138,660 |
Microsoft Corp. | | 393,100 | | 10,279,565 |
| | | | |
| | | | 13,418,225 |
| | | | |
Materials 4.2% | | | | |
Chemicals 0.3% | | | | |
Lyondell Chemical Co. | | 41,500 | | 988,530 |
| | | | |
| | |
Metals & Mining 3.9% | | | | |
Freeport-McMoRan Copper & Gold, Inc. “B” | | 64,400 | | 3,464,720 |
Phelps Dodge Corp. | | 24,700 | | 3,553,589 |
Southern Copper Corp. | | 47,400 | | 3,174,852 |
United States Steel Corp. | | 63,900 | | 3,071,673 |
| | | | |
| | | | 13,264,834 |
| | | | |
Telecommunication Services 1.8% | | | | |
Diversified Telecommunication Services 1.8% | | | | |
Verizon Communications, Inc. | | 205,300 | | 6,183,636 |
| | | | |
| | |
Wireless Telecommunication Services 0.0% | | | | |
United States Cellular Corp.* | | 1,100 | | 54,340 |
| | | | |
Utilities 3.1% | | | | |
Electric Utilities 2.0% | | | | |
Allegheny Energy, Inc.* | | 34,800 | | 1,101,420 |
FirstEnergy Corp. | | 110,300 | | 5,403,597 |
Southern Co. | | 8,000 | | 276,240 |
| | | | |
| | | | 6,781,257 |
| | | | |
Multi-Utilities 1.1% | | | | |
Dominion Resources, Inc. | | 14,700 | | 1,134,841 |
Sempra Energy | | 54,600 | | 2,448,264 |
| | | | |
| | | | 3,583,105 |
| | | | |
Total Common Stocks (Cost $302,116,906) | | | | 332,426,288 |
| | | | |
| | |
| | | Principal Amount ($) | | Value ($) |
US Treasury Obligations 0.2% | | | | |
US Treasury Bill, 3.75% **, 1/19/2006 (a) (Cost $728,631) | | 730,000 | | 728,631 |
| | | | |
| | |
| | | Shares | | Value ($) |
Cash Equivalents 1.4% | | | | |
Cash Management QP Trust, 4.26% (b) (Cost $4,842,086) | | 4,842,086 | | 4,842,086 |
| | | | |
| | |
| | | % of Net Assets | | Value ($) |
Total Investment Portfolio (Cost $307,687,623)+ | | 99.9 | | 337,997,005 |
Other Assets and Liabilities, Net | | 0.1 | | 175,955 |
| | | | |
Net Assets | | 100.0 | | 338,172,960 |
| | | | |
46
Notes to DWS Blue Chip VIP Portfolio of Investments
| + | The cost for federal income tax purposes was $309,324,185. At December 31, 2005, net unrealized appreciation for all securities based on tax cost was $28,672,820. This consisted of aggregate gross unrealized appreciation for all securities in which there was an excess of value over tax cost of $31,215,232 and aggregate gross unrealized depreciation for all securities in which there was an excess of tax cost over value of $2,542,412. |
| * | Non-income producing security. |
| ** | Annualized yield at time of purchase; not a coupon rate. |
| (a) | At December 31, 2005, this security has been pledged, in whole or in part, to cover initial margin requirements for open futures contracts. |
| (b) | Cash Management QP Trust, an affiliated fund, is managed by Deutsche Investment Management Americas Inc. The rate shown is the annualized seven-day yield at period end. |
REIT: Real Estate Investment Trust
At December 31, 2005, open futures contracts purchased were as follows:
| | | | | | | | | | | |
Futures | | Expiration Date | | Contracts | | Aggregate Face Value ($) | | Value ($) | | Unrealized
Depreciation ($) | |
S&P 500 Index | | 3/16/2006 | | 17 | | 5,380,123 | | 5,332,900 | | (47,223 | ) |
The accompanying notes are an integral part of the financial statements.
47
Financial Statements
Statement of Assets and Liabilities
as of December 31, 2005
| | | | |
Assets | | | | |
Investments: | | | | |
Investments in securities, at value (cost $302,845,537) | | $ | 333,154,919 | |
Investment in Cash Management QP Trust (cost $4,842,086) | | | 4,842,086 | |
Total investments in securities, at value (cost $307,687,623) | | | 337,997,005 | |
Cash | | | 15,678 | |
Dividends receivable | | | 477,042 | |
Interest receivable | | | 16,415 | |
Receivable for Portfolio shares sold | | | 141 | |
Receivable for investments sold | | | 29,619,583 | |
Other assets | | | 10,677 | |
| | | | |
Total assets | | | 368,136,541 | |
| | | | |
Liabilities | | | | |
Payable for investments purchased | | | 29,335,604 | |
Payable for Portfolio shares redeemed | | | 333,483 | |
Payable for daily variation margin on open futures contracts | | | 22,525 | |
Accrued management fee | | | 187,605 | |
Other accrued expenses and payables | | | 84,364 | |
| | | | |
Total liabilities | | | 29,963,581 | |
| | | | |
Net assets, at value | | $ | 338,172,960 | |
| | | | |
Net Assets | | | | |
Net assets consist of: | | | | |
Undistributed net investment income | | | 2,849,527 | |
Net unrealized appreciation (depreciation) on: | | | | |
Investments | | | 30,309,382 | |
Futures | | | (47,223 | ) |
Accumulated net realized gain (loss) | | | 16,326,100 | |
Paid-in capital | | | 288,735,174 | |
| | | | |
Net assets, at value | | $ | 338,172,960 | |
| | | | |
Class A | | | | |
Net Asset Value, offering and redemption price per share ($293,892,981 ÷ 19,752,422 outstanding shares of beneficial interest, $.01 par value, unlimited number of shares authorized) | | $ | 14.88 | |
Class B | | | | |
Net Asset Value, offering and redemption price per share ($44,279,979 ÷ 2,986,497 outstanding shares of beneficial interest, $.01 par value, unlimited number of shares authorized) | | $ | 14.83 | |
48
Statement of Operations
for the year ended December 31, 2005
| | | | |
Investment Income | | | | |
Income: | | | | |
Dividends | | $ | 5,218,731 | |
Interest — Cash Management QP Trust | | | 222,955 | |
Interest | | | 21,908 | |
Securities lending income, including income from Daily Assets Fund Institutional, net of borrower rebates | | | 75,791 | |
| | | | |
Total Income | | | 5,539,385 | |
| | | | |
Expenses: | | | | |
Management fee | | | 2,118,362 | |
Custodian fees | | | 20,537 | |
Distribution service fees (Class B) | | | 101,201 | |
Record keeping fees (Class B) | | | 58,190 | |
Auditing | | | 46,182 | |
Legal | | | 13,535 | |
Trustees’ fees and expenses | | | 7,945 | |
Reports to shareholders | | | 49,125 | |
Other | | | 21,581 | |
Total expenses before expense reductions | | | 2,436,658 | |
Expense reductions | | | (4,861 | ) |
Total expenses after expense reductions | | | 2,431,797 | |
| | | | |
Net investment income (loss) | | | 3,107,588 | |
| | | | |
Realized and Unrealized Gain (Loss) on Investment Transactions | | | | |
Net realized gain (loss) from: | | | | |
Investments | | | 34,680,553 | |
Futures | | | 216,233 | |
| | | 34,896,786 | |
Net unrealized appreciation (depreciation) during the period on: | | | | |
Investments | | | (5,949,656 | ) |
Futures | | | (275,526 | ) |
| | | (6,225,182 | ) |
| | | | |
Net gain (loss) on investment transactions | | | 28,671,604 | |
| | | | |
Net increase (decrease) in net assets resulting from operations | | $ | 31,779,192 | |
| | | | |
The accompanying notes are an integral part of the financial statements.
49
Statement of Changes in Net Assets
| | | | | | | | |
| | | Years Ended December 31, | |
| | | 2005 | | | 2004 | |
Increase (Decrease) in Net Assets | | | | | | | | |
Operations: | | | | | | | | |
Net investment income (loss) | | $ | 3,107,588 | | | $ | 2,928,100 | |
Net realized gain (loss) on investment transactions | | | 34,896,786 | | | | 38,719,019 | |
Net unrealized appreciation (depreciation) during the period on investment transactions | | | (6,225,182 | ) | | | 1,111,435 | |
Net increase (decrease) in net assets resulting from operations | | | 31,779,192 | | | | 42,758,554 | |
Distributions to shareholders from: | | | | | | | | |
Net investment income: | | | | | | | | |
Class A | | | (2,673,957 | ) | | | (1,626,701 | ) |
Class B | | | (231,257 | ) | | | (56,503 | ) |
Portfolio share transactions: | | | | | | | | |
Class A | | | | | | | | |
Proceeds from shares sold | | | 25,386,809 | | | | 28,844,570 | |
Reinvestment of distributions | | | 2,673,957 | | | | 1,626,701 | |
Cost of shares redeemed | | | (42,221,426 | ) | | | (26,173,350 | ) |
Net increase (decrease) in net assets from Class A share transactions | | | (14,160,660 | ) | | | 4,297,921 | |
Class B | | | | | | | | |
Proceeds from shares sold | | | 13,487,197 | | | | 16,893,828 | |
Reinvestment of distributions | | | 231,257 | | | | 56,503 | |
Cost of shares redeemed | | | (9,951,414 | ) | | | (1,310,947 | ) |
Net increase (decrease) in net assets from Class B share transactions | | | 3,767,040 | | | | 15,639,384 | |
Increase (decrease) in net assets | | | 18,480,358 | | | | 61,012,655 | |
Net assets at beginning of period | | | 319,692,602 | | | | 258,679,947 | |
| | | | | | | | |
Net assets at end of period (including undistributed net investment income of $2,849,527 and $2,788,284, respectively) | | $ | 338,172,960 | | | $ | 319,692,602 | |
| | | | | | | | |
Other Information | | | | | | | | |
Class A | | | | | | | | |
Shares outstanding at beginning of period | | | 20,734,323 | | | | 20,421,127 | |
Shares sold | | | 1,864,296 | | | | 2,286,747 | |
Shares issued to shareholders in reinvestment of distributions | | | 198,218 | | | | 132,360 | |
Shares redeemed | | | (3,044,415 | ) | | | (2,105,911 | ) |
Net increase (decrease) in Class A shares | | | (981,901 | ) | | | 313,196 | |
| | | | | | | | |
Shares outstanding at end of period | | | 19,752,422 | | | | 20,734,323 | |
| | | | | | | | |
Class B | | | | | | | | |
Shares outstanding at beginning of period | | | 2,700,912 | | | | 1,427,149 | |
Shares sold | | | 979,006 | | | | 1,373,668 | |
Shares issued to shareholders in reinvestment of distributions | | | 17,156 | | | | 4,597 | |
Shares redeemed | | | (710,577 | ) | | | (104,502 | ) |
Net increase (decrease) in Class B shares | | | 285,585 | | | | 1,273,763 | |
| | | | | | | | |
Shares outstanding at end of period | | | 2,986,497 | | | | 2,700,912 | |
| | | | | | | | |
The accompanying notes are an integral part of the financial statements.
50
Financial Highlights
Class A
| | | | | | | | | | | | | | | | | | | | |
Years Ended December 31, | | 2005 | | | 2004 | | | 2003 | | | 2002 | | | 2001 | |
Selected Per Share Data | | | | | | | | | | | | | | | | | | | | |
Net asset value, beginning of period | | $ | 13.65 | | | $ | 11.84 | | | $ | 9.37 | | | $ | 12.07 | | | $ | 14.41 | |
| | | | | | | | | | | | | | | | | | | | |
Income (loss) from investment operations: | | | | | | | | | | | | | | | | | | | | |
Net investment income (loss)a | | | .14 | | | | .13 | | | | .08 | | | | .07 | | | | .05 | |
Net realized and unrealized gain (loss) on investment transactions | | | 1.22 | | | | 1.76 | | | | 2.45 | | | | (2.73 | ) | | | (2.33 | ) |
Total from investment operations | | | 1.36 | | | | 1.89 | | | | 2.53 | | | | (2.66 | ) | | | (2.28 | ) |
Less distributions from: | | | | | | | | | | | | | | | | | | | | |
Net investment income | | | (.13 | ) | | | (.08 | ) | | | (.06 | ) | | | (.04 | ) | | | (.06 | ) |
| | | | | | | | | | | | | | | | | | | | |
Net asset value, end of period | | $ | 14.88 | | | $ | 13.65 | | | $ | 11.84 | | | $ | 9.37 | | | $ | 12.07 | |
| | | | | | | | | | | | | | | | | | | | |
Total Return (%) | | | 10.06 | | | | 16.04 | | | | 27.25 | | | | (22.11 | ) | | | (15.81 | ) |
Ratios to Average Net Assets and Supplemental Data | | | | | | | | | | | | | | | | | | | | |
Net assets, end of period ($ millions) | | | 294 | | | | 283 | | | | 242 | | | | 174 | | | | 240 | |
Ratio of expenses (%) | | | .70 | | | | .70 | | | | .71 | | | | .69 | | | | .69 | |
Ratio of net investment income (%) | | | 1.00 | | | | 1.08 | | | | .82 | | | | .65 | | | | .42 | |
Portfolio turnover rate (%) | | | 288 | | | | 249 | | | | 182 | | | | 195 | | | | 118 | |
| a | Based on average shares outstanding during the period. |
Class B
| | | | | | | | | | | | | | | | |
Years Ended December 31, | | 2005 | | | 2004 | | | 2003 | | | 2002a | |
Selected Per Share Data | | | | | | | | | | | | | | | | |
Net asset value, beginning of period | | $ | 13.60 | | | $ | 11.80 | | | $ | 9.35 | | | $ | 10.28 | |
| | | | | | | | | | | | | | | | |
Income (loss) from investment operations: | | | | | | | | | | | | | | | | |
Net investment income (loss)b | | | .09 | | | | .09 | | | | .04 | | | | .03 | |
Net realized and unrealized gain (loss) on investment transactions | | | 1.22 | | | | 1.74 | | | | 2.45 | | | | (.96 | ) |
Total from investment operations | | | 1.31 | | | | 1.83 | | | | 2.49 | | | | (.93 | ) |
Less distributions from: | | | | | | | | | | | | | | | | |
Net investment income | | | (.08 | ) | | | (.03 | ) | | | (.04 | ) | | | — | |
| | | | | | | | | | | | | | | | |
Net asset value, end of period | | $ | 14.83 | | | $ | 13.60 | | | $ | 11.80 | | | $ | 9.35 | |
| | | | | | | | | | | | | | | | |
Total Return (%) | | | 9.68 | | | | 15.55 | | | | 26.76 | | | | (9.05 | )** |
Ratios to Average Net Assets and Supplemental Data | | | | | | | | | | | | | | | | |
Net assets, end of period ($ millions) | | | .44 | | | | .37 | | | | .17 | | | | .4 | |
Ratio of expenses (%) | | | 1.09 | | | | 1.08 | | | | 1.10 | | | | .94 | * |
Ratio of net investment income (%) | | | .61 | | | | .70 | | | | .43 | | | | .61 | * |
Portfolio turnover rate (%) | | | 288 | | | | 249 | | | | 182 | | | | 195 | |
| a | For the period July 1, 2002 (commencement of operations of Class B shares) to December 31, 2002. |
| b | Based on average shares outstanding during the period. |
51
Performance Summary December 31, 2005
DWS Conservative Allocation VIP
All performance shown is historical, assumes reinvestment of all dividend and capital gain distributions and does not guarantee future results. Investment return and principal value fluctuate with changing market conditions so that, when redeemed, shares may be worth more or less than their original cost. Current performance may be lower or higher than the performance data quoted. Please visit www.dws-scudder.com for the Portfolio’s most recent month-end performance. Performance doesn’t reflect charges and fees (“contract charges”) associated with the separate account that invests in the Portfolio or any variable life insurance policy or variable annuity contract for which the Portfolio is an investment option. These charges and fees will reduce returns.
Diversification does not eliminate risk. The underlying portfolios invest in individual equity and bond funds whose yields and market values fluctuate, so that your investment may be worth more or less that its original cost. In addition, the underlying portfolios are subject to stock market risk, meaning stocks in the Portfolio may decline in value for extended periods of time due to the activities and financial prospects of individual companies, or due to general market and economic conditions. Investing in foreign securities presents certain unique risks not associated with domestic investments, such as currency fluctuation, political and economic changes, and market risks. Derivatives may be more volatile and less liquid than traditional securities, and the Portfolio could suffer losses on its derivative positions. Bond investments are subject to interest-rate risk such that when interest rates rise, the prices of the bonds, and thus the value of the Portfolio, can decline and the investor can lose principal value. Please read this Portfolio’s prospectus for specific details regarding its risk profile.
Portfolio returns shown for all periods reflect a fee waiver and/or expense reimbursement. Without this waiver/reimbursement, returns would have been lower.
Growth of an Assumed $10,000 Investment in DWS Conservative Allocation VIP from 8/16/2004 to 12/31/2005
¨ DWS Conservative Allocation VIP — Class B
¨ Lehman Brothers Aggregate Bond Inde
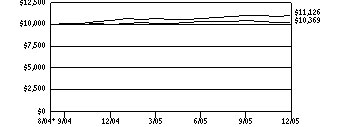
The Lehman Brothers Aggregate Bond (LBAB) Index is an unmanaged market value-weighted measure of treasury issues, corporate bond issues and mortgage securities.
Index returns assume reinvestment of all dividends and, unlike portfolio returns, do not reflect any fees or expenses. It is not possible to invest directly into an index.
| | | | | | | | | | |
Comparative Results | | | | | | | | | | |
| | | |
DWS Conservative Allocation VIP | | | | 1-Year | | | Life of Portfolio* | |
Class B | | Growth of $10,000 | | $ | 10,438 | | | $ | 11,126 | |
| | Average annual total return | | | 4.38 | % | | | 8.09 | % |
Lehman Brothers Aggregate Bond Index | | Growth of $10,000 | | $ | 10,243 | | | $ | 10,369 | |
| | Average annual total return | | | 2.43 | % | | | 2.75 | % |
The growth of $10,000 is cumulative.
| * | The Portfolio commenced operations on August 16, 2004. Index returns begin August 31, 2004. |
52
Information About Your Portfolio’s Expenses
DWS Conservative Allocation VIP
As an investor of the Portfolio, you incur two types of costs: ongoing expenses and transaction costs. Ongoing expenses include management fees, distribution and service (12b-1) fees and other Portfolio expenses. Examples of transaction costs include sales charges (loads), redemption fees and account maintenance fees, which are not shown in this section. The following tables are intended to help you understand your ongoing expenses (in dollars) of investing in the Portfolio and to help you compare these expenses with the ongoing expenses of investing in other mutual funds. In addition to the ongoing expenses which the Portfolio bears directly, the Portfolio’s shareholders indirectly bear the expense of the Underlying DWS Portfolios in which the Portfolio invests. The Portfolio’s estimated indirect expense from investing in the Underlying DWS Portfolios is based on its allocation of Underlying DWS Portfolios. In the most recent six-month period, the portfolio limited these expenses; had it not done so, expenses would have been higher. The tables are based on an investment of $1,000 made at the beginning of the six-month period ended December 31, 2005.
The tables illustrate your Portfolio’s expenses in two ways:
Actual Portfolio Return. This helps you estimate the actual dollar amount of ongoing expenses (but not transaction costs) paid on a $1,000 investment in the Portfolio using the Portfolio’s actual return during the period. To estimate the expenses you paid over the period, simply divide your account value by $1,000 (for example, an $8,600 account value divided by $1,000 = 8.6), then multiply the result by the number in the “Expenses Paid per $1,000” line under the share class you hold.
Hypothetical 5% Portfolio Return. This helps you to compare your Portfolio’s ongoing expenses (but not transaction costs) with those of other mutual funds using the Portfolio’s actual expense ratio and a hypothetical rate of return of 5% per year before expenses. Examples using a 5% hypothetical Portfolio return may be found in the shareholder reports of other mutual funds. The hypothetical account values and expenses may not be used to estimate the actual ending account balance or expenses you paid for the period.
Please note that the expenses shown in these tables are meant to highlight your ongoing expenses only and do not reflect any transaction costs. The “Expenses Paid per $1,000” line of the tables is useful in comparing ongoing expenses only and will not help you determine the relative total expense of owning different funds. If these transaction costs had been included, your costs would have been higher.
Direct Portfolio Expenses and Value of a $1,000 Investment for the six months ended December 31, 2005
| | | |
Actual Portfolio Return | | Class B |
Beginning Account Value 7/1/05 | | $ | 1,000.00 |
Ending Account Value 12/31/05 | | $ | 1,031.60 |
Expenses Paid per $1,000* | | $ | 3.84 |
| |
Hypothetical 5% Portfolio Return | | Class B |
Beginning Account Value 7/1/05 | | $ | 1,000.00 |
Ending Account Value 12/31/05 | | $ | 1,021.42 |
Expenses Paid per $1,000* | | $ | 3.82 |
Direct Portfolio Expenses and Estimated Indirect Underlying DWS Portfolio Expenses and Value of a $1,000 Investment for the six months ended December 31, 2005
| | | |
Actual Portfolio Return | | Class B |
Beginning Account Value 7/1/05 | | $ | 1,000.00 |
Ending Account Value 12/31/05 | | $ | 1,031.60 |
Expenses Paid per $1,000** | | $ | 7.22 |
| |
Hypothetical 5% Portfolio Return | | Class B |
Beginning Account Value 7/1/05 | | $ | 1,000.00 |
Ending Account Value 12/31/05 | | $ | 1,018.10 |
Expenses Paid per $1,000** | | $ | 7.17 |
| * | Expenses are equal to the Portfolio’s annualized expense ratio for the share class, multiplied by the average account value over the period, multiplied by the number of days in the most recent six-month period, then divided by 365. |
| ** | Expenses are equal to the Portfolio’s annualized expense ratio for the share class plus the estimated indirect expense from investing in underlying portfolios in which the Portfolio invests, multiplied by the average account value over the period, multiplied by the number of days in the most recent six-month period, then divided by 365. |
53
| | | |
Annualized Expense Ratios | | Class B | |
Direct Portfolio Expense Ratio | | .75 | % |
Estimated Indirect Expenses of Underlying DWS Portfolios | | .66 | % |
Estimated Net Annual Portfolio and Underlying DWS Portfolios Expenses | | 1.41 | % |
For more information, please refer to the Portfolio’s prospectus.
These tables do not reflect charges and fees (“contract charges”) associated with the separate account that invests in the portfolio or any variable life insurance policy or variable annuity contract for which the portfolio is an investment option.
Management Summary December 31, 2005
DWS Conservative Allocation VIP
The US economy posted positive growth for all four quarters of 2005, with concerns about inflation and the sustainability of the economic expansion seeming to abate as the year progressed. All major asset classes — equities, bonds and cash — had positive returns for the year, and returns of the various asset classes were generally close to one another.
For the 12 months ended December 31, 2005, DWS Conservative Allocation VIP had a return of 4.38% (Class B shares, unadjusted for contract charges). Since this Portfolio invests in underlying portfolios from a broad array of investment styles, performance is analyzed by comparing the Portfolio’s return with the returns of indices that represent the major asset classes. As anticipated, since this Portfolio invests in a blend of equity and bond securities, its return was above that of the major bond indices but below that of the equity indices. The portfolio slightly underperformed the average return of its Lipper Flexible Portfolio Funds category peers — most of which have a higher percentage of equities than DWS Conservative Allocation VIP portfolio.
The portfolio’s allocation between stocks and bonds remained close to its target of 40% equity and 60% fixed income during 2005, but with equities overweighted throughout the year. This overweight was positive for returns, as equities outperformed bonds. An especially positive factor in performance was an overweight in international equities, as foreign markets were stronger than the US market. Decisions regarding cash position had an important effect on performance of this portfolio. In June 2005, the target cash position was increased to 15%, with a corresponding reduction in the target position in bonds. (Cash and bonds together make up the 60% target for fixed-income securities in this portfolio.) During the first half of the year, the cash position was maintained below the target. Beginning in July, the cash position was moved above the new higher target. Both of these decisions were positive for performance, as rising short-term interest rates pushed the return on cash-equivalent securities up.
Within the fixed-income portion of the portfolio, performance of the high-yield portion was excellent, with returns significantly above the high-yield benchmark, the Credit Suisse First Boston High Yield Index. However, underperformance of the much larger investment-grade bond portion resulted in net underperformance in fixed income. In the equity portion of the portfolio, a slight bias toward value-oriented holdings established in July detracted from performance. Among underlying funds, the small-cap and growth holdings achieved the best results relative to the equity benchmarks, the Russell 1000 and Russell 2000 indexes.
Inna Okounkova Robert Wang
Co-Managers, Deutsche Investment Management Americas Inc.
54
All performance shown is historical, assumes reinvestment of all dividends and capital gain distributions, and does not guarantee future results. Investment return and principal value fluctuate with changing market conditions so that, when redeemed, shares may be worth more or less than their original cost. Current performance may be lower or higher than the performance data quoted. Please visit www.dws-scudder.com for the product’s most recent month-end performance. Performance doesn’t reflect charges and fees (“contract charges”) associated with the separate account that invests in the Portfolio or any variable life insurance policy or variable annuity contract for which the Portfolio is an investment option. These charges and fees will reduce returns.
Risk Considerations
Diversification does not eliminate risk. The underlying portfolios invest in individual equity and bond funds whose yields and market values fluctuate, so that your investment may be worth more or less that its original cost. In addition, the underlying portfolios are subject to stock market risk, meaning stocks in the Portfolio may decline in value for extended periods of time due to the activities and financial prospects of individual companies, or due to general market and economic conditions. Investing in foreign securities presents certain unique risks not associated with domestic investments, such as currency fluctuation, political and economic changes, and market risks. Derivatives may be more volatile and less liquid than traditional securities, and the Portfolio could suffer losses on its derivative positions. Bond investments are subject to interest-rate risk such that when interest rates rise, the prices of the bonds, and thus the value of the Portfolio, can decline and the investor can lose principal value. Please read this Portfolio’s prospectus for specific details regarding its risk profile.
The Russell 1000 Index is an unmanaged index that measures the performance of the 1,000 largest companies in the Russell 3000 Index, which represents approximately 92% of the total market capitalization of the Russell 3000 Index.
The Russell 2000 Index is an unmanaged capitalization-weighted measure of approximately 2,000 of the smallest companies in the Russell 3000 Index.
Credit Suisse (CS) First Boston High Yield Index is an unmanaged, unleveraged, trader-priced portfolio constructed to mirror the global high-yield debt market.
The Lipper Flexible Portfolio is a category that allocates its investments across various asset classes, including domestic common stocks, bonds, and money market instruments with a focus on total return.
Equities are represented by the Russell 1000 Index, which is a price-only index of the 1,000 largest capitalized companies domiciled in the United States. Bonds are represented by the Lehman Brothers Aggregate Bond Index which measures domestic taxable investment-grade bonds. Cash is represented by the rate of return of 3-month Treasury bills.
Index returns assume reinvestment of all dividends and, unlike portfolio returns, do not reflect any fees or expenses. It is not possible to invest directly into an index or Lipper category.
Portfolio management market commentary is as of December 31, 2005, and may not come to pass. This information is subject to change at any time based on market and other conditions.
Portfolio Summary
DWS Conservative Allocation VIP
| | | | | | |
Asset Allocation | | 12/31/05 | | | 12/31/04 | |
Equity Funds | | 43 | % | | 42 | % |
Fixed Income Funds | | 38 | % | | 56 | % |
Cash Equivalents | | 19 | % | | 2 | % |
| | 100 | % | | 100 | % |
Asset allocation is subject to change.
For more complete details about the Portfolio’s investment portfolio, see page 48. A quarterly Fact Sheet is available upon request. Information concerning portfolio holdings of the Portfolio as of month end will be posted to www.dws-scudder.com on the 15th of the following month.
Following the Portfolio’s fiscal first and third quarter-end, a complete portfolio holdings listing is filed with the SEC on Form N-Q. The form will be available on the SEC’s Web site at www.sec.gov, and it also may be reviewed and copied at the SEC’s Public Reference Room in Washington, D.C. Information on the operation of the SEC’s Public Reference Room may be obtained by calling (800) SEC-0330.
55
Investment Portfolio December 31, 2005
DWS Conservative Allocation VIP
| | | | |
| | | Shares | | Value ($) |
Equity Funds 43.0% | | | | |
DWS Blue Chip VIP “A” | | 152,244 | | 2,265,394 |
DWS Capital Growth VIP “A” | | 58,867 | | 994,854 |
DWS Davis Venture Value VIP “A” | | 93,980 | | 1,173,815 |
DWS Dreman High Return Equity VIP “A” | | 72,767 | | 975,806 |
DWS Dreman Small Cap Value VIP ”A” | | 70,295 | | 1,404,494 |
DWS Global Opportunities VIP “A” | | 1,679 | | 25,189 |
DWS Growth and Income VIP “A” | | 382,184 | | 3,714,831 |
DWS International Select Equity VIP “A” | | 9,107 | | 120,665 |
DWS International VIP “A” | | 100,267 | | 1,087,894 |
DWS Janus Growth Opportunities VIP “A” | | 169,822 | | 1,419,708 |
DWS Large Cap Value VIP “A” | | 173,652 | | 2,745,432 |
DWS MFS Strategic Value VIP “A” | | 114,693 | | 1,228,376 |
DWS Mid Cap Growth VIP “A” | | 25,293 | | 286,312 |
DWS RREEF Real Estate Securities VIP “A” | | 40,655 | | 674,055 |
DWS Small Cap Growth VIP “A” | | 68,335 | | 921,159 |
DWS Templeton Foreign Value VIP ”A” | | 68,563 | | 783,670 |
| | | | |
Total Equity Funds (Cost $18,648,679) | | | | 19,821,654 |
| | | | |
| | |
| | | Shares | | Value ($) |
Fixed Income Funds 37.6% | | | | |
DWS Core Fixed Income VIP “A” | | 1,323,908 | | 15,635,352 |
DWS Government & Agency Securities VIP “A” | | 2,782 | | 34,111 |
DWS High Income VIP “A” | | 160,437 | | 1,320,395 |
DWS Strategic Income VIP “A” | | 28,500 | | 327,745 |
| | | | |
Total Fixed Income Funds (Cost $17,388,324) | | | | 17,317,603 |
| | | | |
Cash Equivalents 18.2% | | | | |
Cash Management QP Trust, 4.26% (a) (Cost $8,389,113) | | 8,389,113 | | 8,389,113 |
| | | | |
| | |
| | | % of Net
Assets | | Value ($) |
Total Investment Portfolio (Cost $44,426,116)+ | | 98.8 | | 45,528,370 |
Other Assets and Liabilities, Net | | 1.2 | | 543,212 |
| | | | |
Net Assets | | 100.0 | | 46,071,582 |
| | | | |
Notes to DWS Conservative Allocation VIP Portfolio of Investments
| + | | The cost for federal income tax purposes was $44,455,253. At December 31, 2005, net unrealized appreciation for all securities based on tax cost was $1,073,117. This consisted of aggregate gross unrealized appreciation for all securities in which there was an excess of value over tax cost of $1,227,505 and aggregate gross unrealized depreciation for all securities in which there was an excess of tax cost over value of $154,388. |
| (a) | | Cash Management QP Trust, an affiliated fund, is managed by Deutsche Investment Management Americas Inc. The rate shown is the annualized seven-day yield at period end. |
The accompanying notes are an integral part of the financial statements.
56
Financial Statements
Statement of Assets and Liabilities
as of December 31, 2005
| | | |
Assets | | | |
Investments: | | | |
Investments in Underlying Affiliated Portfolios, at value (cost $36,037,003) | | $ | 37,139,257 |
Investment in Cash Management QP Trust (cost $8,389,113) | | | 8,389,113 |
Total investments in securities, at value (cost $44,426,116) | | | 45,528,370 |
Interest receivable | | | 29,302 |
Receivable for Portfolio shares sold | | | 559,108 |
Other assets | | | 931 |
Total assets | | | 46,117,711 |
Liabilities | | | |
Payable for Portfolio shares redeemed | | | 6,619 |
Accrued management fee | | | 1,481 |
Other accrued expenses and payables | | | 38,029 |
Total liabilities | | | 46,129 |
| | | |
Net assets, at value | | $ | 46,071,582 |
| | | |
Net Assets | | | |
Net assets consist of: | | | |
Undistributed net investment income | | | 595,467 |
Net unrealized appreciation (depreciation) on investments | | | 1,102,254 |
Accumulated net realized gain (loss) | | | 236,149 |
Paid-in capital | | | 44,137,712 |
| | | |
Net assets, at value | | $ | 46,071,582 |
| | | |
Class B | | | |
Net Asset Value, offering and redemption price per share ($46,071,582 ÷ 4,149,791 outstanding shares of beneficial interest, $.01 par value, unlimited number of shares authorized) | | $ | 11.10 |
| | | |
57
Statement of Operations
for the year ended December 31, 2005
Investment Income
| | | | |
Income: | | | | |
Income distributions from Underlying Affiliated Portfolios | | $ | 566,284 | |
Interest — Cash Management QP Trust | | | 145,202 | |
Total Income | | | 711,486 | |
Expenses: | | | | |
Management fee | | | 43,018 | |
Custodian and accounting fees | | | 68,373 | |
Distribution service fees (Class B) | | | 71,696 | |
Record keeping fees (Class B) | | | 44,325 | |
Auditing | | | 21,315 | |
Legal | | | 13,549 | |
Trustees’ fees and expenses | | | 511 | |
Reports to shareholders | | | 6,081 | |
Offering costs | | | 281 | |
Other | | | 743 | |
Total expenses before expense reductions | | | 269,892 | |
Expense reductions | | | (54,266 | ) |
Total expenses after expense reductions | | | 215,626 | |
| | | | |
Net investment income (loss) | | | 495,860 | |
| | | | |
Realized and Unrealized Gain (Loss) on Investment Transactions | | | | |
Net realized gain (loss) from investments | | | 103,592 | |
Capital gain distributions from Underlying Affiliated Portfolios | | | 241,064 | |
| | | 344,656 | |
Net unrealized appreciation (depreciation) during the period on investments | | | 667,693 | |
| | | | |
Net gain (loss) on investment transactions | | | 1,012,349 | |
| | | | |
Net increase (decrease) in net assets resulting from operations | | $ | 1,508,209 | |
| | | | |
The accompanying notes are an integral part of the financial statements.
58
Statement of Changes in Net Assets
| | | | | | | | |
Increase (Decrease) in Net Assets | | Year Ended December 31, 2005 | | | Period Ended December 31, 2004a | |
Operations: | | | | | | | | |
Net investment income (loss) | | $ | 495,860 | | | $ | (17,219 | ) |
Net realized gain (loss) on investment transactions | | | 344,656 | | | | 49,859 | |
Net unrealized appreciation (depreciation) during the period on investment transactions | | | 667,693 | | | | 434,561 | |
Net increase (decrease) in net assets resulting from operations | | | 1,508,209 | | | | 467,201 | |
Distributions to shareholders from: | | | | | | | | |
Net realized gains: | | | | | | | | |
Class B | | | (50,006 | ) | | | — | |
Portfolio share transactions: | | | | | | | | |
Class B | | | | | | | | |
Proceeds from shares sold | | | 34,270,431 | | | | 13,456,607 | |
Reinvestment of distributions | | | 50,006 | | | | — | |
Cost of shares redeemed | | | (3,329,092 | ) | | | (301,774 | ) |
Net increase (decrease) in net assets from Class B share transactions | | | 30,991,345 | | | | 13,154,833 | |
Increase (decrease) in net assets | | | 32,449,548 | | | | 13,622,034 | |
Net assets at beginning of period | | | 13,622,034 | | | | — | |
| | | | | | | | |
Net assets at end of period (including undistributed net investment income of $595,467 and $0, respectively) | | $ | 46,071,582 | | | $ | 13,622,034 | |
| | | | | | | | |
Other Information | | | | | | | | |
Class B | | | | | | | | |
Shares outstanding at beginning of period | | | 1,277,644 | | | | — | |
Shares sold | | | 3,174,980 | | | | 1,306,747 | |
Shares issued to shareholders in reinvestment of distributions | | | 4,753 | | | | — | |
Shares redeemed | | | (307,586 | ) | | | (29,103 | ) |
Net increase (decrease) in Class B shares | | | 2,872,147 | | | | 1,277,644 | |
| | | | | | | | |
Shares outstanding at end of period | | | 4,149,791 | | | | 1,277,644 | |
| | | | | | | | |
| a | For the period from August 16, 2004 (commencement of operations) to December 31, 2004. |
The accompanying notes are an integral part of the financial statements.
59
Financial Highlights
Class B
| | | | | | | | |
Years Ended December 31, | | 2005 | | | 2004a | |
Selected Per Share Data | | | | | | | | |
Net asset value, beginning of period | | $ | 10.66 | | | $ | 10.00 | |
| | | | | | | | |
Income (loss) from investment operations: | | | | | | | | |
Net investment income (loss)b | | | .19 | | | | (.03 | ) |
Net realized and unrealized gain (loss) on investment transactions | | | .28 | | | | .69 | |
Total from investment operations | | | .47 | | | | .66 | |
Less distributions from: | | | | | | | | |
Net realized gains on investment transactions | | | (.03 | ) | | | — | |
| | | | | | | | |
Net asset value, end of period | | $ | 11.10 | | | $ | 10.66 | |
| | | | | | | | |
Total Return (%)c,d | | | 4.38 | | | | 6.60 | ** |
Ratios to Average Net Assets and Supplemental Data | | | | | | | | |
Net assets, end of period ($millions) | | | 46 | | | | 14 | |
Ratio of expenses before expense reductions (%)e | | | .94 | | | | 2.96 | * |
Ratio of expenses after expense reductions (%)e | | | .75 | | | | .75 | * |
Ratio of net investment income (%) | | | 1.73 | | | | (.67 | )* |
Portfolio turnover rate (%) | | | 27 | | | | 18 | * |
| a | For the period from August 16, 2004 (commencement of operations) to December 31, 2004. |
| b | Based on average shares outstanding during the period. |
| c | Total return would have been lower had certain expenses not been reduced. |
| d | Total return would have been lower if the Advisor had not maintained some Underlying Portfolios’ expenses. |
| e | The Portfolio invests in other DWS Portfolios and indirectly bears its proportionate share of fees and expenses incurred by the Underlying DWS Portfolios in which the Portfolio is invested. |
60
Performance Summary December 31, 2005
DWS Core Fixed Income VIP
All performance shown is historical, assumes reinvestment of all dividend and capital gain distributions and does not guarantee future results. Investment return and principal value fluctuate with changing market conditions so that, when redeemed, shares may be worth more or less than their original cost. Current performance may be lower or higher than the performance data quoted. Please visit www.dws-scudder.com for the Portfolio’s most recent month-end performance. Performance doesn’t reflect charges and fees (“contract charges”) associated with the separate account that invests in the Portfolio or any variable life insurance policy or variable annuity contract for which the Portfolio is an investment option. These charges and fees will reduce returns. While all share classes have the same underlying portfolio, their performance will differ.
Investments by the Portfolio in lower-rated bonds present greater risk to principal and income than investments in higher-quality securities. This Portfolio invests in individual bonds whose yields and market values fluctuate so that your investment may be worth more or less than its original cost. Bond investments are subject to interest-rate risk such that when interest rates rise, the prices of the bonds, and thus the value of the Portfolio, can decline and the investor can lose principal value. Additionally, investing in foreign securities presents certain unique risks not associated with domestic investments, such as currency fluctuation and changes in political/economic conditions and market risks. All of these factors may result in greater share price volatility. Please see this Portfolio’s prospectus for specific details regarding its investments and risk profile.
A Treasury’s guarantee relates only to the prompt payment of principal and interest and does not remove market risks if the investment is sold prior to maturity.
Growth of an Assumed $10,000 Investment in DWS Core Fixed Income VIP from 5/1/1996 to 12/31/2005
¨ DWS Core Fixed Income VIP — Class A
¨ Lehman Brothers Aggregate Bond Index
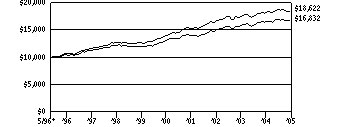
Yearly periods ended December 31
The Lehman Brothers Aggregate Bond (LBAB) Index is an unmanaged market value-weighted measure of Treasury issues, agency issues, corporate bond issues and mortgage securities.
Index returns assume reinvested dividends and, unlike Portfolio returns, do not reflect any fees or expenses. It is not possible to invest directly into an index.
Comparative Results
| | | | | | | | | | | | | | | | | | |
DWS Core Fixed Income VIP | | | | 1-Year | | | 3-Year | | | 5-Year | | | Life of Portfolio* | |
Class A | | Growth of $10,000 | | $ | 10,225 | | | $ | 11,236 | | | $ | 12,830 | | | $ | 16,832 | |
| | Average annual total return | | | 2.25 | % | | | 3.96 | % | | | 5.11 | % | | | 5.54 | % |
Lehman Brothers Aggregate Bond Index | | Growth of $10,000 | | $ | 10,243 | | | $ | 11,126 | | | $ | 13,303 | | | $ | 18,622 | |
| | Average annual total return | | | 2.43 | % | | | 3.62 | % | | | 5.87 | % | | | 6.64 | % |
| | | | | |
DWS Core Fixed Income VIP | | | | | | | 1-Year | | | 3-Year | | | Life of Class** | |
Class B | | Growth of $10,000 | | | | | | $ | 10,185 | | | $ | 11,108 | | | $ | 11,694 | |
| | Average annual total return | | | | | | | 1.85 | % | | | 3.56 | % | | | 4.57 | % |
Lehman Brothers Aggregate Bond Index | | Growth of $10,000 | | | | | | $ | 10,243 | | | $ | 11,126 | | | $ | 11,819 | |
| | Average annual total return | | | | | | | 2.43 | % | | | 3.62 | % | | | 4.89 | % |
The growth of $10,000 is cumulative.
| * | The Portfolio commenced operations on May 1, 1996. Index returns begins April 30, 1996. Total returns would have been lower for the Life of Portfolio period for Class A shares if the Portfolio’s expenses were not maintained. |
| ** | The Portfolio commenced offering Class B shares on July 1, 2002. Index returns begin June 30, 2002. |
61
Information About Your Portfolio’s Expenses
DWS Core Fixed Income VIP
As an investor of the Portfolio, you incur two types of costs: ongoing expenses and transaction costs. Ongoing expenses include management fees, distribution and service (12b-1) fees and other Portfolio expenses. Examples of transaction costs include sales charges (loads), redemption fees and account maintenance fees, which are not shown in this section. The following tables are intended to help you understand your ongoing expenses (in dollars) of investing in the Portfolio and to help you compare these expenses with the ongoing expenses of investing in other mutual funds. The tables are based on an investment of $1,000 made at the beginning of the six-month period ended December 31, 2005.
The tables illustrate your Portfolio’s expenses in two ways:
Actual Portfolio Return. This helps you estimate the actual dollar amount of ongoing expenses (but not transaction costs) paid on a $1,000 investment in the Portfolio using the Portfolio’s actual return during the period. To estimate the expenses you paid over the period, simply divide your account value by $1,000 (for example, an $8,600 account value divided by $1,000 = 8.6), then multiply the result by the number in the “Expenses Paid per $1,000” line under the share class you hold.
Hypothetical 5% Portfolio Return. This helps you to compare your Portfolio’s ongoing expenses (but not transaction costs) with those of other mutual funds using the Portfolio’s actual expense ratio and a hypothetical rate of return of 5% per year before expenses. Examples using a 5% hypothetical Portfolio return may be found in the shareholder reports of other mutual funds. The hypothetical account values and expenses may not be used to estimate the actual ending account balance or expenses you paid for the period.
Please note that the expenses shown in these tables are meant to highlight your ongoing expenses only and do not reflect any transaction costs. The “Expenses Paid per $1,000” line of the tables is useful in comparing ongoing expenses only and will not help you determine the relative total expense of owning different funds. If these transaction costs had been included, your costs would have been higher.
Expenses and Value of a $1,000 Investment for the six months ended December 31, 2005
| | | | | | |
Actual Portfolio Return | | Class A | | Class B |
Beginning Account Value 7/1/05 | | $ | 1,000.00 | | $ | 1,000.00 |
Ending Account Value 12/31/05 | | $ | 995.80 | | $ | 993.30 |
Expenses Paid per $1,000* | | $ | 3.42 | | $ | 5.53 |
| | |
Hypothetical 5% Portfolio Return | | Class A | | Class B |
Beginning Account Value 7/1/05 | | $ | 1,000.00 | | $ | 1,000.00 |
Ending Account Value 12/31/05 | | $ | 1,021.78 | | $ | 1,019.66 |
Expenses Paid per $1,000* | | $ | 3.47 | | $ | 5.60 |
| * | | Expenses are equal to the Portfolio’s annualized expense ratio for each share class, multiplied by the average account value over the period, multiplied by the number of days in the most recent six-month period, then divided by 365. |
| | | | | | |
Annualized Expense Ratios | | Class A | | | Class B | |
DWS Variable Series II — DWS Core Fixed Income VIP | | .68 | % | | 1.10 | % |
For more information, please refer to the Portfolio’s prospectus.
These tables do not reflect charges and fees (“contract charges”) associated with the separate account that invests in the Portfolio or any variable life insurance policy or variable annuity contract for which the Portfolio is an investment option.
62
Management Summary December 31, 2005
DWS Core Fixed Income VIP
Despite several rounds of bond market speculation to the contrary, the Federal Open Market Committee (the Fed) has remained surprisingly consistent in their tightening regimen, raising rates 25 basis points at every meeting in 2005. The Fed target rate finished the year 2.00% higher at 4.25%. The Treasury market, for its part, has been less consistent with periods of rate volatility. Still, the flattening yield curve trend continued and intensified in 2005, even ending the year slightly inverted as measured by the 2- to 10-year Treasuries (-2 basis points). Against this backdrop, the portfolio returned 2.25% (Class A shares, unadjusted for contract charges) for the year, compared with the 2.43% return of its benchmark, the Lehman Brothers Aggregate Bond Index.
Spread sector performance for the year was mixed. Credit, after outperforming treasuries every year since 2002, reversed course and underperformed by 85 basis points due largely to the meltdown in the Auto sector. Our underweight strategy in autos, therefore, benefited performance, as did our holdings in insurance and utilities. Mortgage-backed securities also underperformed comparable Treasuries. On balance, our mortgage-backed securities holdings detracted from returns, although our emphasis on more structured collateralized mortgae obligations, which are less prepayment sensitive than the pass-throughs that comprise the index, fared better as volatility increased. The other high quality sectors, asset-backed securities and collateralized mortgage-backed securities, delivered the best performance for the year, and our overweight to these sectors aided returns.
Gary W. Bartlett, CFA J. Christopher Gagnier Timothy C. Vile, CFA
Warren S. Davis, III William T. Lissenden
Thomas J. Flaherty Daniel R. Taylor, CFA
Portfolio Managers, Aberdeen Asset Management Inc., Subadvisor to the Portfolio
All performance shown is historical, assumes reinvestment of all dividend and capital gain distributions, and does not guarantee future results. Investment return and principal value fluctuate with changing market conditions so that, when redeemed, shares may be worth more or less than their original cost. Current performance may be lower or higher than the performance data quoted. Please visit www.dws-scudder.com for the product’s most recent month-end performance. Performance doesn’t reflect charges and fees (“contract charges”) associated with the separate account that invests in the Portfolio or any variable life insurance policy or variable annuity contract for which the Portfolio is an investment option. These charges and fees will reduce returns.
Risk Considerations
Investments by the Portfolio in lower-rated bonds present greater risk to principal and income than investments in higher-quality securities. This Portfolio invests in individual bonds whose yields and market values fluctuate so that your investment may be worth more or less than its original cost. Bond investments are subject to interest-rate risk such that when interest rates rise, the prices of the bonds, and thus the value of the Portfolio, can decline and the investor can lose principal value. Additionally, investing in foreign securities presents certain unique risks not associated with domestic investments, such as currency fluctuation and changes in political/economic conditions and market risks. All of these factors may result in greater share price volatility. Please see this Portfolio’s prospectus for specific details regarding its investments and risk profile.
A Treasury’s guarantee relates only to the prompt payment of principal and interest and does not remove market risks if the investment is sold prior to maturity.
The Lehman Brothers Aggregate Bond (LBAB) Index is an unmanaged, market-value-weighted measure of Treasury issues, agency issues, corporate bond issues and mortgage securities. Index returns assume reinvested dividends and, unlike portfolio returns, do not reflect any fees or expenses. It is not possible to invest directly into an index.
Yield, or coupon rate, is simply the interest paid by a bond at the time it matures (is paid back to the purchaser). A bond with a 10% coupon or interest rate yields 10% of its principal when it matures.
The yield curve is a graph with a left-to-right line that shows how high or low yields are, from the shortest to the longest maturities. Typically (and when the yield curve is characterized as “steep” this is especially true), the line rises from left to right as investors who are willing to tie up their money for a longer period of time are rewarded with higher yields.
Portfolio management market commentary is as of December 31, 2005, and may not come to pass. This information is subject to change at any time based on market and other conditions.
63
Portfolio Summary
DWS Core Fixed Income VIP
| | | | | | |
Asset Allocation (Excludes Securities Lending Collateral) | | 12/31/05 | | | 12/31/04 | |
Collateralized Mortgage Obligations | | 21 | % | | 24 | % |
Commercial and Non-Agency Mortgage Backed Securities | | 18 | % | | 11 | % |
Corporate Bonds | | 15 | % | | 16 | % |
US Treasury Obligations | | 15 | % | | 17 | % |
US Government Agency Sponsored Pass-Throughs | | 9 | % | | 7 | % |
Asset Backed | | 7 | % | | 8 | % |
Foreign Bonds — US$Denominated | | 5 | % | | 8 | % |
Municipal Bonds and Notes | | 5 | % | | 5 | % |
Cash Equivalents | | 5 | % | | 4 | % |
| | | | | | |
| | 100 | % | | 100 | % |
| | | | | | |
| | |
Corporate and Foreign Bonds Diversification (Excludes Cash Equivalents and Securities Lending Collateral) | | 12/31/05 | | | 12/31/04 | |
Financials | | 38 | % | | 45 | % |
Consumer Discretionary | | 17 | % | | 6 | % |
Utilities | | 13 | % | | 18 | % |
Telecommunication Services | | 9 | % | | 8 | % |
Materials | | 8 | % | | 4 | % |
Energy | | 7 | % | | 11 | % |
Industrials | | 6 | % | | 1 | % |
Health Care | | 2 | % | | 7 | % |
| | | | | | |
| | 100 | % | | 100 | % |
| | | | | | |
| | |
Quality (Excludes Securities Lending Collateral) | | 12/31/05 | | | 12/31/04 | |
US Government and Agencies | | 45 | % | | 49 | % |
AAA* | | 32 | % | | 26 | % |
AA | | 2 | % | | 3 | % |
A | | 7 | % | | 11 | % |
BBB | | 12 | % | | 11 | % |
BB | | 2 | % | | — | |
| | | | | | |
| | 100 | % | | 100 | % |
| | | | | | |
| * | Includes cash equivalents |
| | | | | | |
Effective Maturity (Excludes Cash Equivalents and Securities Lending Collateral) | | 12/31/05 | | | 12/31/04 | |
Under 1 year | | 10 | % | | 9 | % |
1-4.99 years | | 34 | % | | 46 | % |
5-9.99 years | | 43 | % | | 25 | % |
10-14.99 years | | 4 | % | | 10 | % |
15 years or greater | | 9 | % | | 10 | % |
| | | | | | |
| | 100 | % | | 100 | % |
| | | | | | |
Asset allocation, corporate and foreign bonds diversification, quality and effective maturity are subject to change.
Weighted average effective maturity: 5.4 years and 6.7 years, respectively.
The quality ratings represent the lower of Moody’s Investors Service, Inc. (“Moody’s”) or Standard & Poor’s Corporation (“S&P”) credit ratings. The ratings of Moody’s and S&P represent their opinions as to the quality of the securities they rate. Ratings are relative and subjective and are not absolute standards of quality. The Portfolio’s quality does not remove market risk.
For more complete details about the Portfolio’s investment portfolio, see page 56. A quarterly Fact Sheet is available upon request. Information concerning portfolio holdings of the Portfolio as of month end will be posted to www.dws-scudder.com on the 15th of the following month.
Following the Portfolio’s fiscal first and third quarter-end, a complete portfolio holdings listing is filed with the SEC on Form N-Q. The form will be available on the SEC’s Web site at www.sec.gov, and it also may be reviewed and copied at the SEC’s Public Reference Room in Washington, D.C. Information on the operation of the SEC’s Public Reference Room may be obtained by calling (800) SEC-0330.
64
Investment Portfolio December 31, 2005
DWS Core Fixed Income VIP
| | | | |
| | | Principal Amount ($) | | Value ($) |
Corporate Bonds 15.6% | | | | |
Consumer Discretionary 3.5% | | | | |
Auburn Hills Trust, 12.375%, 5/1/2020 | | 161,001 | | 239,397 |
Comcast Cable Communications Holdings, Inc., 9.455%, 11/15/2022 | | 110,000 | | 144,122 |
Comcast MO of Delaware, Inc., 9.0%, 9/1/2008 | | 490,000 | | 535,357 |
D.R. Horton, Inc., 5.375%, 6/15/2012 | | 2,091,000 | | 2,021,265 |
DaimlerChrysler NA Holding Corp.: | | | | |
4.75%, 1/15/2008 | | 892,000 | | 883,862 |
Series E, 4.78%*, 10/31/2008 (a) | | 643,000 | | 643,359 |
Harrah’s Operating Co., Inc., 5.625%, 6/1/2015 | | 1,752,000 | | 1,721,203 |
Mandalay Resort Group, 6.5%, 7/31/2009 (a) | | 202,000 | | 204,273 |
MGM MIRAGE: | | | | |
6.0%, 10/1/2009 | | 395,000 | | 392,531 |
6.625%, 7/15/2015 (a) | | 130,000 | | 129,675 |
News America, Inc., 144A, 6.4%, 12/15/2035 | | 770,000 | | 776,111 |
TCI Communications, Inc., 8.75%, 8/1/2015 | | 848,000 | | 1,027,517 |
Tele-Communications, Inc.: | | | | |
9.875%, 6/15/2022 | | 250,000 | | 339,430 |
10.125%, 4/15/2022 | | 363,000 | | 496,615 |
Time Warner, Inc.: | | | | |
6.625%, 5/15/2029 | | 510,000 | | 509,283 |
7.625%, 4/15/2031 | | 1,705,000 | | 1,898,772 |
| | | | |
| | | | 11,962,772 |
| | | | |
Energy 1.3% | | | | |
Chesapeake Energy Corp.: | | | | |
6.375%, 6/15/2015 | | 362,000 | | 362,000 |
6.625%, 1/15/2016 | | 226,000 | | 228,825 |
Enterprise Products Operating LP: | | | | |
Series B, 5.0%, 3/1/2015 (a) | | 517,000 | | 492,485 |
7.5%, 2/1/2011 | | 580,000 | | 630,996 |
Sempra Energy, 4.621%, 5/17/2007 | | 1,510,000 | | 1,499,299 |
Tri-State Generation & Transmission Association, 144A, 6.04%, 1/31/2018 | | 1,190,000 | | 1,225,212 |
| | | | |
| | | | 4,438,817 |
| | | | |
Financials 5.7% | | | | |
American General Finance Corp.: | | | | |
Series H, 4.0%, 3/15/2011 | | 1,417,000 | | 1,340,486 |
Series I, 4.875%, 5/15/2010 | | 735,000 | | 728,687 |
American International Group, Inc., 144A, 5.05%, 10/1/2015 | | 970,000 | | 951,987 |
ASIF Global Finance XVIII, 144A, 3.85%, 11/26/2007 | | 539,000 | | 528,591 |
Duke Capital LLC, 4.302%, 5/18/2006 | | 1,204,000 | | 1,201,135 |
Erac USA Finance Co.: | | | | |
144A, 5.9%, 11/15/2015 | | 330,000 | | 335,676 |
144A, 8.0%, 1/15/2011 | | 1,346,000 | | 1,503,801 |
65
| | | | |
| | | Principal Amount ($) | | Value ($) |
ERP Operating LP, 6.95%, 3/2/2011 | | 432,000 | | 463,661 |
Farmers Insurance Exchange, 144A, 8.625%, 5/1/2024 | | 940,000 | | 1,140,951 |
Ford Motor Credit Co.: | | | | |
6.5%, 1/25/2007 | | 1,041,000 | | 1,007,136 |
6.875%, 2/1/2006 | | 2,860,000 | | 2,853,851 |
General Motors Acceptance Corp.: | | | | |
6.125%, 9/15/2006 (a) | | 238,000 | | 231,183 |
6.125%, 8/28/2007 | | 785,000 | | 727,677 |
6.15%, 4/5/2007 | | 190,000 | | 179,465 |
HSBC Bank USA: | | | | |
5.625%, 8/15/2035 | | 780,000 | | 762,901 |
5.875%, 11/1/2034 | | 100,000 | | 100,894 |
HSBC Finance Corp., 5.0%, 6/30/2015 | | 330,000 | | 320,897 |
JPMorgan Chase Capital XV, 5.875%, 3/15/2035 | | 284,000 | | 282,362 |
JPMorgan Chase XVII, 5.85%, 8/1/2035 (a) | | 375,000 | | 371,026 |
Merrill Lynch & Co., Inc., Series C, 4.79%, 8/4/2010 | | 827,000 | | 817,698 |
PLC Trust, Series 2003-1, 144A, 2.709%, 3/31/2006 | | 250,215 | | 249,296 |
Reinsurance Group of America, Inc., 6.75%, 12/15/2065 | | 790,000 | | 797,010 |
The Goldman Sachs Group, Inc., 4.75%, 7/15/2013 | | 384,000 | | 372,468 |
ZFS Finance USA Trust I: 144A, 6.15%, 12/15/2065 (a) | | 1,000,000 | | 1,007,268 |
144A, 6.45%, 12/15/2065 | | 1,000,000 | | 1,013,900 |
| | | | |
| | | | 19,290,007 |
| | | | |
Health Care 0.5% | | | | |
Health Care Service Corp., 144A, 7.75%, 6/15/2011 | | 1,424,000 | | 1,593,812 |
| | | | |
Industrials 0.3% | | | | |
BAE System 2001 Asset Trust, “B”, Series 2001, 144A, 7.156%, 12/15/2011 | | 259,064 | | 271,449 |
K. Hovnanian Enterprises, Inc., 6.25%, 1/15/2015 | | 635,000 | | 597,603 |
Standard Pacific Corp., 6.5%, 8/15/2010 | | 255,000 | | 243,206 |
| | | | |
| | | | 1,112,258 |
| | | | |
Materials 0.6% | | | | |
Georgia-Pacific Corp., 8.875%, 5/15/2031 | | 952,000 | | 954,380 |
Newmont Mining Corp., 5.875%, 4/1/2035 | | 755,000 | | 745,051 |
Weyerhaeuser Co.: | | | | |
7.125%, 7/15/2023 (a) | | 95,000 | | 100,438 |
7.375%, 3/15/2032 | | 66,000 | | 73,373 |
| | | | |
| | | | 1,873,242 |
| | | | |
Telecommunication Services 1.0% | | | | |
Anixter International, Inc., 5.95%, 3/1/2015 | | 306,000 | | 276,908 |
Bell Atlantic New Jersey, Inc., Series A, 5.875%, 1/17/2012 | | 877,000 | | 884,898 |
66
| | | | |
| | | Principal Amount ($) | | Value ($) |
SBC Communications, Inc., 5.875%, 2/1/2012 | | 1,333,000 | | 1,370,482 |
Verizon Global Funding Corp., 7.75%, 12/1/2030 | | 796,000 | | 946,171 |
| | | | |
| | | | 3,478,459 |
| | | | |
Utilities 2.7% | | | | |
Centerior Energy Corp., Series B, 7.13%, 7/1/2007 | | 1,490,000 | | 1,536,925 |
Consumers Energy Co.: | | | | |
Series F, 4.0%, 5/15/2010 | | 1,655,000 | | 1,571,677 |
5.0%, 2/15/2012 | | 1,160,000 | | 1,134,756 |
Entergy Louisiana, Inc., 6.3%, 9/1/2035 | | 360,000 | | 352,437 |
Pedernales Electric Cooperative, Series 02-A, 144A, 6.202%, 11/15/2032 | | 1,715,000 | | 1,882,281 |
PSI Energy, Inc., 6.12%, 10/15/2035 | | 830,000 | | 848,781 |
TXU Energy Co., 7.0%, 3/15/2013 | | 585,000 | | 623,414 |
Xcel Energy, Inc., 7.0%, 12/1/2010 | | 1,240,000 | | 1,334,528 |
| | | | |
| | | | 9,284,799 |
| | | | |
Total Corporate Bonds (Cost $53,793,556) | | | | 53,034,166 |
| | | | |
Foreign Bonds — US$ Denominated 5.5% | | | | |
Energy 0.2% | | | | |
Petro-Canada, 5.95%, 5/15/2035 | | 680,000 | | 689,811 |
| | | | |
Financials 2.2% | | | | |
BNP Paribas SA, 144A, 5.186%, 6/29/2049 | | 300,000 | | 291,040 |
DBS Capital Funding Corp., 144A, 7.657%, 3/15/2049 | | 1,330,000 | | 1,471,581 |
Mantis Reef Ltd., 144A, 4.692%, 11/14/2008 | | 2,120,000 | | 2,082,959 |
Mizuho Financial Group, (Cayman), 8.375%, 12/29/2049 | | 2,670,000 | | 2,892,945 |
Resona Bank Ltd., 144A, 5.85%, 9/29/2049 | | 816,000 | | 812,552 |
| | | | |
| | | | 7,551,077 |
| | | | |
Industrials 1.0% | | | | |
Tyco International Group SA: | | | | |
6.75%, 2/15/2011 | | 1,900,000 | | 1,997,639 |
6.875%, 1/15/2029 | | 916,000 | | 998,387 |
7.0%, 6/15/2028 | | 356,000 | | 391,627 |
| | | | |
| | | | 3,387,653 |
| | | | |
Materials 1.1% | | | | |
Alcan, Inc., 5.75%, 6/1/2035 | | 74,000 | | 72,051 |
Celulosa Arauco y Constitucion SA, 5.625%, 4/20/2015 | | 1,295,000 | | 1,285,552 |
Sociedad Concesionaria Autopista Central, 144A, 6.223%, 12/15/2026 | | 1,915,000 | | 2,010,424 |
Vale Overseas Ltd., 8.25%, 1/17/2034 | | 295,000 | | 339,619 |
| | | | |
| | | | 3,707,646 |
| | | | |
Sovereign Bonds 0.0% | | | | |
United Mexican States, 8.375%, 1/14/2011 | | 65,000 | | 74,100 |
| | | | |
Telecommunication Services 1.0% | | | | |
British Telecommunications PLC, 8.875%, 12/15/2030 | | 1,065,000 | | 1,424,908 |
| | | | |
67
| | | | |
| | | Principal Amount ($) | | Value ($) |
Telecom Italia Capital: | | | | |
4.0%, 1/15/2010 | | 440,000 | | 419,077 |
4.95%, 9/30/2014 | | 685,000 | | 654,236 |
5.25%, 11/15/2013 | | 850,000 | | 834,083 |
| | | | |
| | | | 3,332,304 |
| | | | |
Total Foreign Bonds — US$ Denominated (Cost $18,664,154) | | | | 18,742,591 |
| | | | |
Asset Backed 7.5% | | | | |
Automobile Receivables 0.9% | | | | |
MMCA Automobile Trust: | | | | |
“A4”, Series 2002-4, 3.05%, 11/16/2009 | | 617,100 | | 611,476 |
“A4”, Series 2002-2, 4.3%, 3/15/2010 | | 784,011 | | 781,715 |
“B”, Series 2002-2, 4.67%, 3/15/2010 | | 486,668 | | 480,205 |
“B”, Series 2002-1, 5.37%, 1/15/2010 | | 438,264 | | 437,098 |
Onyx Acceptance Owner Trust, “A3”, Series 2003-D, 2.4%, 12/15/2007 | | 604,024 | | 602,429 |
| | | | |
| | | | 2,912,923 |
| | | | |
Home Equity Loans 6.6% | | | | |
Aegis Asset Backed Securities Trust: | | | | |
“N1”, Series 2005-5N, 144A, 4.5%, 12/25/2023 | | 1,407,099 | | 1,395,666 |
“N1”, Series 2005-3N, 144A, 4.75%, 8/25/2035 | | 915,743 | | 910,889 |
Countrywide Asset-Backed Certificates: | | | | |
“AF2”, Series 2005-7, 4.367%, 11/25/2035 | | 2,340,000 | | 2,303,891 |
“N1”, Series 2004-2N, 144A, 5.0%, 2/25/2035 | | 159,196 | | 158,405 |
Credit-Based Asset Servicing and Securities, “A3”, Series 2004-CB4, 4.632%, 5/25/2035 | | 1,512,718 | | 1,505,617 |
Encore Credit Receivables NIM Trust, “NOTE”, Series 2005-4, 144A, 4.5%, 1/25/2036 | | 1,362,184 | | 1,336,643 |
JPMorgan Mortgage Acquisition Corp., “A2F1”, Series 2005-FRE1, 5.375%, 10/25/2035 | | 1,562,870 | | 1,561,458 |
Master Asset Backed Securities Trust, “A1B”, Series 2005-AB1, 5.143%, 11/25/2035 | | 2,277,609 | | 2,272,597 |
Merrill Lynch Mortgage Investors, Inc., “A1A”, Series 2005-NCB, 5.451%, 7/25/2036 | | 1,531,429 | | 1,530,737 |
Novastar NIM Trust, “NOTE”, Series 2005-N1, 144A, 4.777%, 10/26/2035 | | 876,383 | | 873,553 |
Park Place Securities NIM Trust, “A”, Series 2005-WCW1, 144A, 4.25%, 9/25/2035 | | 1,106,127 | | 1,100,596 |
Renaissance Home Equity Loan Trust, “AF6”, Series 2005-2, 4.781%, 8/25/2035 | | 835,000 | | 800,874 |
Renaissance NIM Trust, “A”, Series 2004-A, 144A, 4.45%, 6/25/2034 | | 8,670 | | 8,654 |
Residential Asset Securities Corp., “AI6”, Series 2000-KS1, 7.905%, 2/25/2031 | | 1,215,405 | | 1,220,986 |
| | |
| | | Principal Amount ($) | | Value ($) |
Securitized Asset Backed NIM Trust, “NIM”, Series 2005-FR4, 144A, 6.0%, 1/25/2036 | | 2,520,847 | | 2,519,271 |
Terwin Mortgage Trust, “AF2”, Series 2005-14HE, 4.85%, 8/25/2036 | | 3,094,000 | | 3,064,027 |
| | | | |
| | | | 22,563,864 |
| | | | |
Total Asset Backed (Cost $25,694,021) | | | | 25,476,787 |
| | | | |
| | |
| | | Shares | | Value ($) |
Preferred Stocks 0.2% | | | | |
Farm Credit Bank of Texas, Series 1 | | 325,000 | | 356,457 |
Axis Capital Holdings Ltd., Series B, 7.5% | | 3,300 | | 343,406 |
| | | | |
Total Preferred Stocks (Cost $682,657) | | | | 699,863 |
| | | | |
68
| | | | |
| | | Principal Amount ($) | | Value ($) |
US Government Agency Sponsored Pass-Throughs 9.4% | | | | |
Federal Home Loan Mortgage Corp.: | | | | |
4.0%, 5/1/2019 | | 2,274,382 | | 2,174,167 |
5.0%, 3/1/2034 (f) | | 3,080,000 | | 2,980,861 |
6.0%, with various maturities from 12/1/2025 until 12/1/2034 | | 3,103,891 | | 3,145,732 |
Federal National Mortgage Association: | | | | |
4.5%, with various maturities from 7/1/2018 until 10/1/2033 (f) | | 4,327,077 | | 4,112,537 |
5.0%, with various maturities from 4/1/2025 until 2/1/2034 (f) | | 3,663,531 | | 3,578,072 |
5.5%, with various maturities from 7/1/2024 until 1/1/2025 (f) | | 5,440,642 | | 5,433,420 |
6.31%, 6/1/2008 | | 1,500,000 | | 1,530,207 |
6.5%, with various maturities from 3/1/2017 until 11/1/2035 | | 3,491,126 | | 3,582,023 |
7.0%, with various maturities from 11/1/2035 until 12/1/2035 | | 4,052,464 | | 4,228,071 |
7.13%, 1/1/2012 | | 1,105,835 | | 1,118,176 |
8.0%, 9/1/2015 | | 48,515 | | 51,809 |
| | | | |
Total US Government Agency Sponsored Pass-Throughs (Cost $32,300,935) | | | | 31,935,075 |
| | | | |
Commercial and Non-Agency Mortgage-Backed Securities 18.0% | | | | |
Adjustable Rate Mortgage Trust, “3A31”, Series 2005-10, 5.437%*, 1/25/2036 | | 1,265,000 | | 1,256,708 |
Banc of America Commercial Mortgage, Inc., “AJ”, Series 2005-1, 5.0%*, 11/10/2042 | | 2,270,000 | | 2,263,117 |
Bear Stearns Adjustable Rate Mortgage Trust, “2A3”, Series 2005-4, 4.45%*, 8/25/2035 | | 1,185,000 | | 1,150,841 |
Citicorp Mortgage Securities, Inc.: | | | | |
“A4”, Series 2003-3, 5.5%, 3/25/2033 | | 752,479 | | 751,619 |
| | |
| | | Principal Amount ($) | | Value ($) |
“1A1”, Series 2004-8, 5.5%, 10/25/2034 | | 1,326,269 | | 1,325,064 |
Citigroup Mortgage Loan Trust, Inc.: | | | | |
“1A2”, Series 2004-NCM-1, 6.5%, 7/25/2034 | | 1,123,899 | | 1,149,187 |
“1CB2”, Series 2004-NCM2, 6.75%, 8/25/2034 | | 1,433,796 | | 1,476,362 |
Countrywide Alternative Loan Trust: | | | | |
“A2”, Series 2003-6T2, 5.0%, 6/25/2033 | | 1,132,397 | | 1,128,672 |
“A2”, Series 2003-21T1, 5.25%, 12/25/2033 | | 1,636,441 | | 1,631,688 |
“A6”, Series 2004-14T2, 5.5%, 8/25/2034 | | 1,667,677 | | 1,665,983 |
“7A1”, Series 2004-J2, 6.0%, 12/25/2033 | | 447,182 | | 446,483 |
“1A1”, Series 2004-J1, 6.0%, 2/25/2034 | | 311,108 | | 311,836 |
First Union-Lehman Brothers Commercial Mortgage, “A3”, Series 1997-C1, 7.38%, 4/18/2029 | | 1,031,239 | | 1,047,701 |
GMAC Commercial Mortgage Securities, Inc., “A3”, Series 1997-C1, 6.869%, 7/15/2029 | | 451,643 | | 461,647 |
Greenwich Capital Commercial Funding Corp.: | | | | |
“AJ”, Series 2005-GG3, 4.859%, 8/10/2042 | | 845,000 | | 818,956 |
“B”, Series 2005-GG3, 4.894%, 8/10/2042 | | 1,410,000 | | 1,364,817 |
“AM”, Series 2005-GG5, 5.277%, 4/10/2037 | | 1,680,000 | | 1,688,895 |
GS Mortgage Securities Corp. II, “C”, Series 1998-C1, 6.91%, 10/18/2030 | | 1,260,000 | | 1,313,896 |
JP Morgan Mortgage Trust, “2A1”, Series 2005-A8, 4.969%, 11/25/2035 | | 1,482,924 | | 1,471,840 |
LB-UBS Commercial Mortgage Trust, “AJ”, Series 2005-C3, 4.843%, 7/15/2040 | | 3,095,000 | | 2,986,402 |
Master Alternative Loans Trust: | | | | |
“5A1”, Series 2005-1, 5.5%, 1/25/2020 | | 703,659 | | 704,918 |
“3A1”, Series 2004-5, 6.5%, 6/25/2034 | | 61,023 | | 62,091 |
“5A1”, Series 2005-2, 6.5%, 12/25/2034 | | 306,680 | | 309,196 |
“8A1”, Series 2004-3, 7.0%, 4/25/2034 | | 199,743 | | 201,452 |
Master Asset Securitization Trust: | | | | |
“8A1”, Series 2003-6, 5.5%, 7/25/2033 | | 782,165 | | 768,966 |
“2A7”, Series 2003-9, 5.5%, 10/25/2033 | | 1,313,800 | | 1,299,812 |
Merrill Lynch Mortgage Trust: | | | | |
“AM”, Series 2005-MCP1, 4.805%, 6/12/2043 | | 1,715,000 | | 1,662,696 |
“D” Series 2005-CKI1, 5.245%, 11/12/2037 | | 360,000 | | 355,466 |
Residential Accredit Loans, Inc., “CB”, Series 2004-QS2, 5.75%, 2/25/2034 | | 1,016,699 | | 1,010,028 |
Residential Asset Securitization Trust, “A1”, Series 2003-A11, 4.25%, 11/25/2033 | | 85,440 | | 85,188 |
69
| | | | |
| | | Principal Amount ($) | | Value ($) |
Structured Adjustable Rate Mortgage Loan Trust: | | | | |
“6A3”, Series 2005-21, 5.4%, 11/25/2035 | | 1,485,000 | | 1,475,266 |
“1A1”, Series 2005-18, 5.725%*, 9/25/2035 | | 1,493,367 | | 1,495,555 |
Structured Asset Securities Corp., “4A1”, Series 2005-6, 5.0%, 5/25/2035 | | 876,118 | | 844,906 |
Wachovia Bank Commercial Mortgage Trust, “AJ”, Series 2005-C20, 5.124%*, 7/15/2042 | | 3,135,000 | | 3,111,120 |
Washington Mutual: | | | | |
“A6”, Series 2004-AR4, 3.804%*, 6/25/2034 | | 1,695,000 | | 1,628,600 |
“A6”, Series 2003-AR11, 3.985%, 10/25/2033 | | 1,540,000 | | 1,495,446 |
“A7, Series 2004-AR9, 4.181%*, 8/25/2034 | | 1,393,000 | | 1,364,374 |
“2A1”, Series 2002-S8, 4.5%, 1/25/2018 | | 433,365 | | 430,769 |
“1A6”, Series 2005-AR12, 4.844%*, 10/25/2035 | | 3,125,000 | | 3,074,809 |
“1A1”, Series 2005-AR14, 5.082%*, 12/25/2035 | | 1,542,410 | | 1,532,792 |
“1A3”, Series 2005-AR16, 5.132%, 12/25/2035 | | 1,660,000 | | 1,638,587 |
“4A”, Series 2004-CB2, 6.5%, 8/25/2034 | | 220,535 | | 225,497 |
Wells Fargo Mortgage Backed Securities Trust: | | | | |
“2A17”, Series 2005-AR10, 3.5%*, 6/25/2035 | | 385,000 | | 370,559 |
“A6”, Series 2004-N, 4.0%, 8/25/2034 | | 2,350,000 | | 2,273,913 |
“2A14”, Series 2005-AR10, 4.11%*, 6/25/2035 | | 2,350,000 | | 2,284,189 |
“2A15”, Series 2005-AR10, 4.11%*, 6/25/2035 | | 3,155,000 | | 3,066,646 |
“1A6”, Series 2003-1, 4.5%, 2/25/2018 | | 302,247 | | 300,590 |
“4A2”, Series 2005-AR16, 4.993%, 10/25/2035 | | 2,385,000 | | 2,352,962 |
| | | | |
Total Commercial and Non-Agency Mortgage-Backed Securities (Cost $62,070,164) | | | | 61,138,107 |
| | | | |
Collateralized Mortgage Obligations 20.9% | | | | |
Fannie Mae Whole Loan: | | | | |
“2A3”, Series 2003-W3, 4.16%, 6/25/2042 | | 605,409 | | 601,847 |
“1A3”, Series 2003-W18, 4.732%, 8/25/2043 | | 330,528 | | 329,550 |
“A2”, Series 2004-W4, 5.0%, 6/25/2034 | | 2,115,000 | | 2,107,274 |
“1A1”, Series 2004-W15, 6.0%, 8/25/2044 | | 1,649,045 | | 1,666,488 |
Federal Home Loan Mortgage Corp.: | | | | |
“XG”, Series 2737, 4.0%, 11/15/2022 | | 1,050,000 | | 1,030,410 |
“NB”, Series 2750, 4.0%, 12/15/2022 | | 2,839,000 | | 2,783,549 |
“KB”, Series 2552, 4.25%, 6/15/2027 | | 1,220,640 | | 1,211,237 |
“LC”, Series 2682, 4.5%, 7/15/2032 | | 805,000 | | 761,759 |
“PE”, Series 2727, 4.5%, 7/15/2032 | | 2,395,000 | | 2,259,214 |
70
| | | | |
| | | Principal Amount ($) | | Value ($) |
“NP”, Series 2802, 4.5%, 1/15/2033 | | 1,770,000 | | 1,664,287 |
“HG”, Series 2543, 4.75%, 9/15/2028 | | 988,294 | | 983,812 |
“OL”, Series 2840, 5.0%, 11/15/2022 | | 2,335,000 | | 2,329,242 |
“PE”, Series 2721, 5.0%, 1/15/2023 | | 135,000 | | 129,562 |
“PQ”, Series 2844, 5.0%, 5/15/2023 | | 1,616,000 | | 1,616,794 |
“BU”, Series 2911, 5.0%, 9/15/2023 | | 2,403,000 | | 2,394,410 |
“EW”, Series 2545, 5.0%, 3/15/2029 | | 1,442,593 | | 1,438,683 |
“BG”, Series 2640, 5.0%, 2/15/2032 | | 2,060,000 | | 2,006,590 |
“PD”, Series 2844, 5.0%, 12/15/2032 | | 2,765,000 | | 2,664,769 |
“EG”, Series 2836, 5.0%, 12/15/2032 | | 2,770,000 | | 2,669,166 |
“PD”, Series 2783, 5.0%, 1/15/2033 | | 1,283,000 | | 1,239,752 |
“TE”, Series 2780, 5.0%, 1/15/2033 | | 1,785,000 | | 1,724,486 |
“NE”, Series 2802, 5.0%, 2/15/2033 | | 2,640,000 | | 2,550,366 |
“OE”, Series 2840, 5.0%, 2/15/2033 | | 2,780,000 | | 2,676,838 |
“PD”, Series 2890, 5.0%, 3/15/2033 | | 1,485,000 | | 1,428,619 |
“OG”, Series 2889, 5.0%, 5/15/2033 | | 1,770,000 | | 1,708,492 |
“PE”, Series 2898, 5.0%, 5/15/2033 | | 860,000 | | 827,248 |
“XD”, Series 2941, 5.0%, 5/15/2033 | | 1,055,000 | | 1,013,764 |
“PE”, Series 2864, 5.0%, 6/15/2033 | | 2,275,000 | | 2,199,016 |
“UE”, Series 2911, 5.0%, 6/15/2033 | | 3,055,000 | | 2,936,762 |
“BG”, Series 2869, 5.0%, 7/15/2033 | | 335,000 | | 322,429 |
“KD”, Series 2915, 5.0%, 9/15/2033 | | 1,341,000 | | 1,289,735 |
“NE”, Series 2921, 5.0%, 9/15/2033 | | 2,275,000 | | 2,187,600 |
“QE”, Series 2991, 5.0%, 8/15/2034 | | 2,530,000 | | 2,429,416 |
“PE”, Series 2378, 5.5%, 11/15/2016 | | 1,765,000 | | 1,790,398 |
“CH”, Series 2390, 5.5%, 12/15/2016 | | 440,000 | | 444,561 |
“PE”, Series 2512, 5.5%, 2/15/2022 | | 45,000 | | 45,813 |
“YA”, Series 2841, 5.5%, 7/15/2027 | | 2,405,715 | | 2,420,404 |
“BD”, Series 2453, 6.0%, 5/15/2017 | | 872,475 | | 894,037 |
“Z”, Series 2173, 6.5%, 7/15/2029 | | 288,809 | | 298,690 |
Federal National Mortgage Association: | | | | |
“WB”, Series 2003-106, 4.5%, 10/25/2015 | | 1,735,000 | | 1,719,908 |
“NE”, Series 2004-52, 4.5%, 7/25/2033 | | 1,282,000 | | 1,202,326 |
“PE”, Series 2005-44, 5.0%, 7/25/2033 | | 650,000 | | 623,612 |
“QD”, Series 2005-29, 5.0%, 8/25/2033 | | 435,000 | | 417,400 |
| | |
| | | Principal Amount ($) | | Value ($) |
“HE”, Series 2005-22, 5.0%, 10/25/2033 | | 1,540,000 | | 1,478,004 |
“ND”, Series 3036, 5.0%, 5/15/2034 | | 1,645,000 | | 1,579,680 |
“PG”, Series 2002-3, 5.5%, 2/25/2017 | | 500,000 | | 507,766 |
“QC”, Series 2002-11, 5.5%, 3/25/2017 | | 640,000 | | 649,342 |
“MC”, Series 2002-56, 5.5%, 9/25/2017 | | 713,781 | | 721,257 |
“VD”, Series 2002-56, 6.0%, 4/25/2020 | | 103,039 | | 103,451 |
“PM”, Series 2001-60, 6.0%, 3/25/2030 | | 89,844 | | 89,940 |
“A2”, Series 1998-M6, 6.32%, 8/15/2008 | | 755,090 | | 774,990 |
“HM”, Series 2002-36, 6.5%, 12/25/2029 | | 35,829 | | 35,875 |
| | | | |
Total Collateralized Mortgage Obligations (Cost $72,271,041) | | | | 70,980,620 |
| | | | |
Municipal Bonds and Notes 4.9% | | | | |
Brockton, MA, General Obligation, Economic Development, Series A, 6.45%, 5/1/2017 (b) | | 1,530,000 | | 1,662,299 |
California, Statewide Communities Development Authority Revenue, Series A-1, 4.0%, 11/15/2006 (b) | | 1,515,000 | | 1,503,092 |
Illinois, Higher Education Revenue, 7.05%, 7/1/2009 (b) | | 1,410,000 | | 1,509,067 |
Jersey City, NJ, Municipal Utilities Authority, Water Revenue, 4.55%, 5/15/2012 (b) | | 1,000,000 | | 978,790 |
Jicarilla, NM, Sales & Tax Special Revenue, Apache Nation Revenue, 144A, 5.2%, 12/1/2013 | | 945,000 | | 948,733 |
Los Angeles, CA, Community Redevelopment Agency, Financing Authority Revenue, Bunker Hill Project, 5.83%, 12/1/2017 (b) | | 2,500,000 | | 2,612,050 |
New York, General Obligation, Environmental Facilities Corp., 4.95%, 1/1/2013 (b) | | 1,500,000 | | 1,502,190 |
71
| | | | | | |
| | | Principal Amount ($) | | | Value ($) | |
Oklahoma City, OK, Airport Revenue, 5.2%, 10/1/2012 (b) | | 1,430,000 | | | 1,443,084 | |
Oregon, School Boards Association, Pension Deferred Interest, Series A, Zero Coupon, 6/30/2017 (b) | | 3,830,000 | | | 2,140,242 | |
Portland, OR, River District, Urban Renewal & Redevelopment, Series B, 3.35%, 6/15/2010 (b) | | 1,550,000 | | | 1,462,208 | |
Trenton, NJ, School District General Obligation, 4.3%, 4/1/2011 (b) | | 1,040,000 | | | 1,010,173 | |
| | | | | | |
Total Municipal Bonds and Notes (Cost $16,539,393) | | | | | 16,771,928 | |
| | | | | | |
US Treasury Obligations 14.8% | | | | | | |
US Treasury Bond, 6.0%, 2/15/2026 (a) | | 8,624,000 | | | 10,169,585 | |
US Treasury Notes: | | | | | | |
3.375%, 2/15/2008 (a) | | 9,543,000 | | | 9,346,548 | |
4.75%, 5/15/2014 (a) | | 8,400,000 | | | 8,604,422 | |
5.0%, 8/15/2011 (a) | | 21,442,000 | | | 22,131,317 | |
| | | | | | |
Total US Treasury Obligations (Cost $50,678,932) | | | | | 50,251,872 | |
| | | | | | |
| | |
| | | Shares | | | Value ($) | |
Securities Lending Collateral 16.1% | | | | | | |
Daily Assets Fund Institutional, 4.28%(c) (d) (Cost $54,947,630) | | 54,947,630 | | | 54,947,630 | |
| | | | | | |
Cash Equivalents 4.7% | | | | | | |
Cash Management QP Trust, 4.26%(e) (Cost $16,123,788) | | 16,123,788 | | | 16,123,788 | |
| | | | | | |
| | |
| | | % of Net Assets | | | Value ($) | |
Total Investment Portfolio (Cost $403,766,271)+ | | 117.6 | | | 400,102,427 | |
| | | | | | |
Other Assets and Liabilities, Net | | (17.6 | ) | | (59,835,567 | ) |
| | | | | | |
Net Assets | | 100.0 | | | 340,266,860 | |
| | | | | | |
72
Notes to DWS Core Fixed Income VIP Portfolio of Investments
| * | Floating rate notes are securities whose yields vary with a designated market index or market rate, such as the coupon-equivalent of the US Treasury bill rate. These securities are shown at their current rate as of December 31, 2005. |
| + | The cost for federal income tax purposes was $403,930,558. At December 31, 2005, net unrealized depreciation for all securities based on tax cost was $3,828,131. This consisted of aggregate gross unrealized appreciation for all securities in which there was an excess of value over tax cost of $1,441,908 and aggregate gross unrealized depreciation for all securities in which there was an excess of tax cost over value of $5,270,039. |
| (a) | All or a portion of these securities were on loan (See Notes to Financial Statements). The value of all securities loaned at December 31, 2005 amounted to $53,856,661 which is 15.8% of net assets. |
| (b) | Bond is insured by one of these companies: |
| | | |
Insurance Coverage | | As a % of
Total
Investment
Portfolio | |
Ambac Financial Group | | 1.1 | % |
Financial Guaranty Insurance Co. | | 1.6 | % |
Financial Security Assurance Inc. | | 1.0 | % |
MBIA Corp. | | 0.2 | % |
| (c) | Daily Assets Fund Institutional, an affiliated fund, is managed by Deutsche Asset Management, Inc. The rate shown is the annualized seven-day yield at period end. |
| (d) | Represents collateral held in connection with securities lending. |
| (e) | Cash Management QP Trust, an affiliated fund, is managed by Deutsche Investment Management Americas Inc. The rate shown is the annualized seven-day yield at period end. |
| (f) | Mortgage dollar rolls included. |
| 144A: | Security exempt from registration under Rule 144A of the Securities Act of 1933. These securities may be resold in transactions exempt from registration, normally to qualified institutional buyers. |
Included in the portfolio are investments in mortgage or asset-backed securities which are interests in separate pools of mortgages or assets. Effective maturities of these investments may be shorter than stated maturities due to prepayments. Some separate investments in the Federal National Mortgage Association and the Federal Home Loan Mortgage Corp. issues which have similar coupon rates have been aggregated for presentation purposes in the investment portfolio.
The accompanying notes are an integral part of the financial statements.
73
Financial Statements
Statement of Assets and Liabilities
as of December 31, 2005
| | | | |
Assets | | | | |
Investments: | | | | |
Investments in securities, at value (cost $332,694,853) — including $53,856,661 of securities loaned | | $ | 329,031,009 | |
Investment in Daily Assets Fund Institutional (cost $54,947,630)* | | | 54,947,630 | |
Investment in Cash Management QP Trust (cost $16,123,788) | | | 16,123,788 | |
Total investments in securities, at value (cost $403,766,271) | | | 400,102,427 | |
Cash | | | 290,090 | |
Interest receivable | | | 2,770,029 | |
Receivable for Portfolio shares sold | | | 303,562 | |
Other assets | | | 10,098 | |
| | | | |
Total assets | | | 403,476,206 | |
| | | | |
Liabilities | | | | |
Payable for investments purchased | | | 4,278,129 | |
Payable upon return of securities loaned | | | 54,947,630 | |
Payable for investments purchased — mortgage dollar rolls | | | 3,622,889 | |
Deferred mortgage dollar roll income | | | 903 | |
Accrued management fee | | | 167,653 | |
Payable for Portfolio shares redeemed | | | 41,002 | |
Other accrued expenses and payables | | | 151,140 | |
| | | | |
Total liabilities | | | 63,209,346 | |
| | | | |
Net assets, at value | | $ | 340,266,860 | |
| | | | |
Net Assets | | | | |
Net assets consist of: | | | | |
Undistributed net investment income | | | 11,525,027 | |
Net unrealized appreciation (depreciation) on investments | | | (3,663,844 | ) |
Accumulated net realized gain (loss) | | | (402,744 | ) |
Paid-in capital | | | 332,808,421 | |
| | | | |
Net assets, at value | | $ | 340,266,860 | |
| | | | |
Class A | | | | |
Net Asset Value, offering and redemption price per share ($251,626,427 ÷ 21,303,867 outstanding shares of beneficial interest, $.01 par value, unlimited number of shares authorized) | | $ | 11.81 | |
| | | | |
Class B | | | | |
Net Asset Value, offering and redemption price per share ($88,640,433 ÷ 7,523,292 outstanding shares of beneficial interest, $.01 par value, unlimited number of shares authorized) | | $ | 11.78 | |
| | | | |
| * | Represents collateral on securities loaned. |
74
Statement of Operations
for the year ended December 31, 2005
| | | | |
Investment Income | | | | |
Income: | | | | |
Interest | | $ | 14,029,550 | |
Mortgage dollar roll income | | | 46,816 | |
Interest — Cash Management QP Trust | | | 357,029 | |
Securities lending income, including income from Daily Assets Fund Institutional, net of borrower rebates | | | 92,963 | |
| | | | |
Total Income | | | 14,526,358 | |
| | | | |
Expenses: | | | | |
Management fee | | | 1,883,098 | |
Custodian fees | | | 21,344 | |
Distribution service fees (Class B) | | | 220,712 | |
Record keeping fees (Class B) | | | 131,719 | |
Auditing | | | 44,824 | |
Legal | | | 13,813 | |
Trustees’ fees and expenses | | | 16,581 | |
Reports to shareholders | | | 70,805 | |
Other | | | 49,371 | |
Total expenses before expense reductions | | | 2,452,267 | |
Expense reductions | | | (5,905 | ) |
| | | | |
Total expenses after expense reductions | | | 2,446,362 | |
| | | | |
Net investment income | | | 12,079,996 | |
| | | | |
Realized and Unrealized Gain (Loss) on Investment Transactions | | | | |
Net realized gain (loss) from investments | | | (353,676 | ) |
Net unrealized appreciation (depreciation) during the period on investments | | | (5,057,842 | ) |
Net gain (loss) on investment transactions | | | (5,411,518 | ) |
| | | | |
Net increase (decrease) in net assets resulting from operations | | $ | 6,668,478 | |
| | | | |
The accompanying notes are an integral part of the financial statements.
75
Statement of Changes in Net Assets
| | | | | | | | |
| | | Years Ended December 31, | |
| | | 2005 | | | 2004 | |
Increase (Decrease) in Net Assets | | | | | | | | |
Operations: | | | | | | | | |
Net investment income | | $ | 12,079,996 | | | $ | 9,852,018 | |
Net realized gain (loss) on investment transactions | | | (353,676 | ) | | | 2,613,421 | |
Net unrealized appreciation (depreciation) during the period on investment transactions | | | (5,057,842 | ) | | | (740,835 | ) |
| | | | | | | | |
Net increase (decrease) in net assets resulting from operations | | | 6,668,478 | | | | 11,724,604 | |
Distributions to shareholders from: | | | | | | | | |
Net investment income: | | | | | | | | |
Class A | | | (7,365,945 | ) | | | (6,899,791 | ) |
Class B | | | (2,666,763 | ) | | | (1,766,032 | ) |
Net realized gains: | | | | | | | | |
Class A | | | (1,950,232 | ) | | | (3,369,665 | ) |
Class B | | | (794,464 | ) | | | (976,642 | ) |
Portfolio share transactions: | | | | | | | | |
Class A | | | | | | | | |
Proceeds from shares sold | | | 81,598,580 | | | | 43,408,606 | |
Reinvestment of distributions | | | 9,316,177 | | | | 10,269,456 | |
Cost of shares redeemed | | | (45,087,748 | ) | | | (42,555,105 | ) |
Net increase (decrease) in net assets from Class A share transactions | | | 45,827,009 | | | | 11,122,957 | |
Class B | | | | | | | | |
Proceeds from shares sold | | | 9,590,439 | | | | 46,084,279 | |
Reinvestment of distributions | | | 3,461,227 | | | | 2,742,674 | |
Cost of shares redeemed | | | (10,890,122 | ) | | | (6,180,393 | ) |
Net increase (decrease) in net assets from Class B share transactions | | | 2,161,544 | | | | 42,646,560 | |
Increase (decrease) in net assets | | | 41,879,627 | | | | 52,481,991 | |
Net assets at beginning of period | | | 298,387,233 | | | | 245,905,242 | |
| | | | | | | | |
Net assets at end of period (including undistributed net investment income of $11,525,027 and $9,524,556, respectively) | | $ | 340,266,860 | | | $ | 298,387,233 | |
| | | | | | | | |
Other Information | | | | | | | | |
Class A | | | | | | | | |
Shares outstanding at beginning of period | | | 17,397,738 | | | | 16,493,825 | |
Shares sold | | | 6,905,327 | | | | 3,610,180 | |
Shares issued to shareholders in reinvestment of distributions | | | 808,696 | | | | 865,161 | |
Shares redeemed | | | (3,807,894 | ) | | | (3,571,428 | ) |
Net increase (decrease) in Class A shares | | | 3,906,129 | | | | 903,913 | |
| | | | | | | | |
Shares outstanding at end of period | | | 21,303,867 | | | | 17,397,738 | |
| | | | | | | | |
Class B | | | | | | | | |
Shares outstanding at beginning of period | | | 7,335,272 | | | | 3,731,351 | |
Shares sold | | | 808,980 | | | | 3,887,722 | |
Shares issued to shareholders in reinvestment of distributions | | | 300,193 | | | | 230,865 | |
Shares redeemed | | | (921,153 | ) | | | (514,666 | ) |
Net increase (decrease) in Class B shares | | | 188,020 | | | | 3,603,921 | |
| | | | | | | | |
Shares outstanding at end of period | | | 7,523,292 | | | | 7,335,272 | |
| | | | | | | | |
The accompanying notes are an integral part of the financial statements.
76
Financial Highlights
Class A
| | | | | | | | | | | | | | | | | | | | |
Years Ended December 31, | | 2005 | | | 2004 | | | 2003 | | | 2002 | | | 2001a | |
Selected Per Share Data | | | | | | | | | | | | | | | | | | | | |
Net asset value, beginning of period | | $ | 12.07 | | | $ | 12.16 | | | $ | 11.98 | | | $ | 11.48 | | | $ | 11.45 | |
| | | | | | | | | | | | | | | | | | | | |
Income (loss) from investment operations: | | | | | | | | | | | | | | | | | | | | |
Net investment incomeb | | | .47 | | | | .50 | | | | .45 | | | | .53 | | | | .62 | |
Net realized and unrealized gain (loss) on investment transactions | | | (.21 | ) | | | .05 | | | | .14 | | | | .37 | | | | .01 | |
Total from investment operations | | | .26 | | | | .55 | | | | .59 | | | | .90 | | | | .63 | |
Less distributions from: Net investment income | | | (.41 | ) | | | (.43 | ) | | | (.41 | ) | | | (.40 | ) | | | (.60 | ) |
Net realized gain on investment transactions | | | (.11 | ) | | | (.21 | ) | | | — | | | | — | | | | — | |
Total distributions | | | (.52 | ) | | | (.64 | ) | | | (.41 | ) | | | (.40 | ) | | | (.60 | ) |
| | | | | | | | | | | | | | | | | | | | |
Net asset value, end of period | | $ | 11.81 | | | $ | 12.07 | | | $ | 12.16 | | | $ | 11.98 | | | $ | 11.48 | |
| | | | | | | | | | | | | | | | | | | | |
Total Return (%) | | | 2.25 | | | | 4.53 | | | | 5.13 | | | | 8.01 | | | | 5.71 | |
Ratios to Average Net Assets and Supplemental Data | | | | | | | | | | | | | | | | | | | | |
Net assets, end of period ($ millions) | | | 252 | | | | 210 | | | | 201 | | | | 216 | | | | 134 | |
Ratio of expenses (%) | | | .67 | | | | .66 | | | | .66 | | | | .65 | | | | .64 | |
Ratio of net investment income (%) | | | 3.96 | | | | 4.18 | | | | 3.75 | | | | 4.57 | | | | 5.46 | |
Portfolio turnover rate (%) | | | 164c | | | | 185c | | | | 229c | | | | 267 | | | | 176 | |
| a | As required, effective January 1, 2001, the Portfolio has adopted the provisions of the AICPA Audit and Accounting Guide for Investment Companies and began amortizing premium on debt securities. |
| b | Based on average shares outstanding during the period. |
| c | The portfolio turnover rate including mortgage dollar roll transactions was 176%, 204% and 265% for the years ended December 31, 2005, December 31, 2004, and December 31, 2003, respectively. |
Class B
| | | | | | | | | | | | | | | | |
Years Ended December 31, | | 2005 | | | 2004 | | | 2003 | | | 2002a | |
Selected Per Share Data | | | | | | | | | | | | | | | | |
Net asset value, beginning of period | | $ | 12.04 | | | $ | 12.13 | | | $ | 11.96 | | | $ | 11.36 | |
| | | | | | | | | | | | | | | | |
Income (loss) from investment operations: | | | | | | | | | | | | | | | | |
Net investment incomeb | | | .42 | | | | .45 | | | | .40 | | | | .27 | |
Net realized and unrealized gain (loss) on investment transactions | | | (.21 | ) | | | .05 | | | | .15 | | | | .33 | |
Total from investment operations | | | .21 | | | | .50 | | | | .55 | | | | .60 | |
Less distributions from: | | | | | | | | | | | | | | | | |
Net investment income | | | (.36 | ) | | | (.38 | ) | | | (.38 | ) | | | — | |
Net realized gain on investment transactions | | | (.11 | ) | | | (.21 | ) | | | — | | | | — | |
Total distributions | | | (.47 | ) | | | (.59 | ) | | | (.38 | ) | | | — | |
| | | | | | | | | | | | | | | | |
Net asset value, end of period | | $ | 11.78 | | | $ | 12.04 | | | $ | 12.13 | | | $ | 11.96 | |
| | | | | | | | | | | | | | | | |
Total Return (%) | | | 1.85 | | | | 4.10 | | | | 4.76 | | | | 5.28 | ** |
Ratios to Average Net Assets and Supplemental Data | | | | | | | | | | | | | | | | |
Net assets, end of period ($ millions) | | | 89 | | | | 88 | | | | 45 | | | | 2 | |
Ratio of expenses (%) | | | 1.07 | | | | 1.03 | | | | 1.05 | | | | .92 | * |
Ratio of net investment income (%) | | | 3.56 | | | | 3.81 | | | | 3.36 | | | | 4.69 | * |
Portfolio turnover rate (%) | | | 164c | | | | 185c | | | | 229c | | | | 267 | |
| a | For the period from July 1, 2002 (commencement of operations of Class B shares) to December 31, 2002. |
| b | Based on average shares outstanding during the period. |
| c | The portfolio turnover rate including mortgage dollar roll transactions was 176%, 204% and 265% for the years ended December 31, 2005, December 31, 2004, and December 31, 2003, respectively. |
77
Performance Summary December 31, 2005
DWS Davis Venture Value VIP
All performance shown is historical, assumes reinvestment of all dividend and capital gain distributions and does not guarantee future results. Investment return and principal value fluctuate with changing market conditions so that, when redeemed, shares may be worth more or less than their original cost. Current performance may be lower or higher than the performance data quoted. Please visit www.dws-scudder.com for the Portfolio’s most recent month-end performance. Performance doesn’t reflect charges and fees (“contract charges”) associated with the separate account that invests in the Portfolio or any variable life insurance policy or variable annuity contract for which the Portfolio is an investment option. These charges and fees will reduce returns. While all share classes have the same underlying portfolio, their performance will differ.
The Portfolio is subject to stock market and equity risks, meaning stocks in the Portfolio may decline in value for extended periods of time due to the activities and financial prospects of individual companies, or due to general market and economic conditions. Please read this Portfolio’s prospectus for specific details regarding its investments and risk profile.
Portfolio returns shown for all periods reflect a fee waiver and/or expense reimbursement. Without this waiver/reimbursement, returns would have been lower.
Growth of an Assumed $10,000 Investment in DWS Davis Venture Value VIP from 5/1/2001 to 12/31/2005
¨ DWS Davis Venture Value VIP — Class A
¨ Russell 1000 Value Index
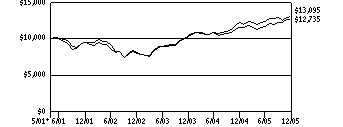
Russell 1000 Value Index is an unmanaged index, which consists of those stocks in the Russell 1000 Index with lower price-to-book ratios and lower forecasted-growth values. Index returns assume reinvested dividends and, unlike Portfolio returns, do not reflect any fees or expenses. It is not possible to invest directly into an index.
Comparative Results
| | | | | | | | | | | | | | |
DWS Davis Venture Value VIP | | 1-Year | | | 3-Year | | | Life of Portfolio* | |
Class A | | Growth of $10,000 | | $ | 10,964 | | | $ | 15,919 | | | $ | 12,735 | |
| | Average annual total return | | | 9.64 | % | | | 16.76 | % | | | 5.32 | % |
Russell 1000 Value Index | | Growth of $10,000 | | $ | 10,705 | | | $ | 16,216 | | | $ | 13,095 | |
| | Average annual total return | | | 7.05 | % | | | 17.49 | % | | | 5.95 | % |
| | | |
DWS Davis Venture Value VIP | | 1-Year | | | 3-Year | | | Life of Class** | |
Class B | | Growth of $10,000 | | $ | 10,923 | | | $ | 15,750 | | | $ | 14,752 | |
| | Average annual total return | | | 9.23 | % | | | 16.35 | % | | | 11.75 | % |
Russell 1000 Value Index | | Growth of $10,000 | | $ | 10,705 | | | $ | 16,216 | | | $ | 14,386 | |
| | Average annual total return | | | 7.05 | % | | | 17.49 | % | | | 10.95 | % |
The growth of $10,000 is cumulative.
| * | The Portfolio commenced operations on May 1, 2001. Index returns begin April 30, 2001. |
| ** | The Portfolio commenced offering Class B shares on July 1, 2002. Index returns begin June 30, 2002. |
78
Information About Your Portfolio’s Expenses
DWS Davis Venture Value VIP
As an investor of the Portfolio, you incur two types of costs: ongoing expenses and transaction costs. Ongoing expenses include management fees, distribution and service (12b-1) fees and other Portfolio expenses. Examples of transaction costs include sales charges (loads), redemption fees and account maintenance fees, which are not shown in this section. The following tables are intended to help you understand your ongoing expenses (in dollars) of investing in the Portfolio and to help you compare these expenses with the ongoing expenses of investing in other mutual funds. In the most recent six-month period, the Portfolio limited these expenses; had it not done so, expenses would have been higher. The tables are based on an investment of $1,000 made at the beginning of the six-month period ended December 31, 2005.
The tables illustrate your Portfolio’s expenses in two ways:
Actual Portfolio Return. This helps you estimate the actual dollar amount of ongoing expenses (but not transaction costs) paid on a $1,000 investment in the Portfolio using the Portfolio’s actual return during the period. To estimate the expenses you paid over the period, simply divide your account value by $1,000 (for example, an $8,600 account value divided by $1,000 = 8.6), then multiply the result by the number in the “Expenses Paid per $1,000” line under the share class you hold.
Hypothetical 5% Portfolio Return. This helps you to compare your Portfolio’s ongoing expenses (but not transaction costs) with those of other mutual funds using the Portfolio’s actual expense ratio and a hypothetical rate of return of 5% per year before expenses. Examples using a 5% hypothetical Portfolio return may be found in the shareholder reports of other mutual funds. The hypothetical account values and expenses may not be used to estimate the actual ending account balance or expenses you paid for the period.
Please note that the expenses shown in these tables are meant to highlight your ongoing expenses only and do not reflect any transaction costs. The “Expenses Paid per $1,000” line of the tables is useful in comparing ongoing expenses only and will not help you determine the relative total expense of owning different funds. If these transaction costs had been included, your costs would have been higher.
Expenses and Value of a $1,000 Investment for the six months ended December 31, 2005
| | | | | | |
Actual Portfolio Return | | Class A | | Class B |
Beginning Account Value 7/1/05 | | $ | 1,000.00 | | $ | 1,000.00 |
Ending Account Value 12/31/05 | | $ | 1,082.30 | | $ | 1,080.60 |
Expenses Paid per $1,000* | | $ | 4.88 | | $ | 6.87 |
| | |
Hypothetical 5% Portfolio Return | | Class A | | Class B |
Beginning Account Value 7/1/05 | | $ | 1,000.00 | | $ | 1,000.00 |
Ending Account Value 12/31/05 | | $ | 1,020.52 | | $ | 1,018.60 |
Expenses Paid per $1,000* | | $ | 4.74 | | $ | 6.67 |
| * | Expenses are equal to the Portfolio’s annualized expense ratio for each share class, multiplied by the average account value over the period, multiplied by the number of days in the most recent six-month period, then divided by 365. |
| | | | | | |
Annualized Expense Ratios | | Class A | | | Class B | |
DWS Variable Series II — DWS Davis Venture Value VIP | | .93 | % | | 1.31 | % |
For more information, please refer to the Portfolio’s prospectus.
These tables do not reflect charges and fees (“contract charges”) associated with the separate account that invests in the portfolio or any variable life insurance policy or variable annuity contract for which the portfolio is an investment option.
79
Management Summary December 31, 2005
DWS Davis Venture Value VIP
DWS Davis Venture Value VIP returned 9.64% (Class A shares, unadjusted for contract charges) for the year ended December 31, 2005, compared with 7.05% for the Portfolio’s benchmark, the Russell 1000 Value Index.
Energy companies were the most important contributors to the Portfolio’s performance over the year. All of the Portfolio’s energy company holdings performed well, with EOG Resources, Inc., Devon Energy Corp. and ConocoPhillips all among the top five contributors.
Insurance companies — the Portfolio’s largest industry group holdings — were the second most important contributors to the Portfolio’s performance. Progressive Corp. was among the Portfolio’s top five contributors to performance.
Other positive contributions to the Portfolio’s performance were the Portfolio’s significant investments in both diversified financial companies and consumer staple companies. Altria Group, Inc., a tobacco company, ranked among the Portfolio’s top five contributors to performance. Avon Products, Inc. (initially purchased in June 2005), a consumer staples company, ranked among the top five detractors from performance.
Detracting from the Portfolio’s performance were holdings in both the consumer discretionary sector and the industrial sector. Comcast Corp. Special “A”, a consumer discretionary company, and Tyco International Ltd., an industrial company, were among the top five detractors from performance.
The Portfolio had approximately 9% of its portfolio invested in foreign companies at December 31, 2005 — but those foreign holdings underperformed the Portfolio’s secondary benchmark (the S&P 500 Index) over the year.
Christopher C. Davis
Kenneth Charles Feinberg
Co-Managers
Davis Selected Advisers, L.P., Subadvisor to the Portfolio
All performance shown is historical, assumes reinvestment of all dividend and capital gain distributions and does not guarantee future results. Investment return and principal value fluctuate with changing market conditions so that, when redeemed, shares may be worth more or less than their original cost. Current performance may be lower or higher than the performance data quoted. Please visit www.dws-scudder.com for the Portfolio’s most recent month-end performance. Performance doesn’t reflect charges and fees (“contract charges”) associated with the separate account that invests in the Portfolio or any variable life insurance policy or variable annuity contract for which the Portfolio is an investment option. These charges and fees will reduce returns. While all share classes have the dame underlying portfolio, their performance will differ.
Risk Considerations
The Portfolio is subject to stock market and equity risks, meaning stocks in the Portfolio may decline in value for extended periods of time due to the activities and financial prospects of individual companies, or due to general market and economic conditions. Please read this Portfolio’s prospectus for specific details regarding its investments and risk profile.
Russell 1000 Value Index is an unmanaged index that consists of those stocks in the Russell 1000 Index with lower price-to-book ratios and lower forecasted-growth values.
The Standard & Poor’s 500 (S&P 500) Index is an unmanaged capitalization-weighted index of 500 stocks designed to measure performance of the broad domestic economy through changes in the aggregate market value of 500 stocks representing all major industries. The Standard & Poor’s (S&P) Financial Index is an unmanaged index that gauges the performance of financial companies within the S&P 500 Index.
Index returns assume reinvested dividends and, unlike portfolio returns, do not reflect any fees or expenses. It is not possible to invest directly into an index.
Portfolio management market commentary is as of December 31, 2005, and may not come to pass. This information is subject to change at any time based on market and other conditions.
In this report Davis Selected Advisers makes candid statements and observations regarding economic and market conditions; however, there is no guarantee that these statements, opinions or forecasts will prove to be correct. All investments involve some degree of risk, and there can be no assurance that the investment strategies will be successful. Market values will vary so that an investor may experience a gain or a loss.
80
Portfolio Summary
DWS Davis Venture Value VIP
| | | | | | |
Asset Allocation (Excludes Securities Lending Collateral) | | 12/31/05 | | | 12/31/04 | |
Common Stocks | | 99 | % | | 94 | % |
Cash Equivalents | | 1 | % | | 6 | % |
| | | | | | |
| | 100 | % | | 100 | % |
| | | | | | |
| | |
Sector Diversification (As a % of Common Stocks) | | 12/31/05 | | | 12/31/04 | |
Financials | | 45 | % | | 50 | % |
Consumer Staples | | 15 | % | | 12 | % |
Energy | | 11 | % | | 9 | % |
Industrials | | 8 | % | | 9 | % |
Consumer Discretionary | | 8 | % | | 7 | % |
Health Care | | 4 | % | | 4 | % |
Materials | | 4 | % | | 5 | % |
Information Technology | | 4 | % | | 3 | % |
Telecommunication Services | | 1 | % | | 1 | % |
| | | | | | |
| | 100 | % | | 100 | % |
| | | | | | |
Asset allocation and sector diversification are subject to change.
For more complete details about the Portfolio’s investment portfolio, see page 72. A quarterly Fact Sheet is available upon request. Information concerning portfolio holdings of the Portfolio as of month end will be posted to www.dws-scudder.com on the 15th of the following month.
Following the Portfolio’s fiscal first and third quarter-end, a complete portfolio holdings listing is filed with the SEC on Form N-Q. The form will be available on the SEC’s Web site at www.sec.gov, and it also may be reviewed and copied at the SEC’s Public Reference Room in Washington, D.C. Information on the operation of the SEC’s Public Reference Room may be obtained by calling (800) SEC-0330.
81
Investment Portfolio December 31, 2005
DWS Davis Venture Value VIP
| | | | |
| | | Shares | | Value ($) |
Common Stocks 99.1% | | | | |
Consumer Discretionary 7.7% | | | | |
Automobiles 1.4% | | | | |
Harley-Davidson, Inc. (a) | | 103,100 | | 5,308,619 |
| | | | |
Diversified Consumer Services 1.5% | | | | |
H&R Block, Inc. | | 232,000 | | 5,695,600 |
| | | | |
Household Durables 0.2% | | | | |
Hunter Douglas NV | | 11,263 | | 613,109 |
| | | | |
Internet & Catalog Retail 0.4% | | | | |
Expedia, Inc.* (a) | | 33,899 | | 812,220 |
IAC/InterActiveCorp.* (a) | | 33,899 | | 959,681 |
| | | | |
| | | | 1,771,901 |
| | | | |
Media 4.2% | | | | |
Comcast Corp. Special “A”* | | 383,200 | | 9,844,408 |
Gannett Co., Inc. | | 19,600 | | 1,187,172 |
Lagardere S.C.A. | | 54,700 | | 4,209,356 |
WPP Group PLC ADR (a) | | 18,200 | | 982,800 |
| | | | |
| | | | 16,223,736 |
| | | | |
Consumer Staples 14.9% | | | | |
Beverages 2.0% | | | | |
Diageo PLC (ADR) (a) | | 83,300 | | 4,856,390 |
Heineken Holding NV | | 98,200 | | 2,885,548 |
| | | | |
| | | | 7,741,938 |
| | | | |
Food & Staples Retailing 6.1% | | | | |
Costco Wholesale Corp. | | 329,300 | | 16,290,471 |
Wal-Mart Stores, Inc. | | 157,300 | | 7,361,640 |
| | | | |
| | | | 23,652,111 |
| | | | |
Food Products 0.8% | | | | |
The Hershey Co. | | 52,800 | | 2,917,200 |
| | | | |
Personal Products 0.8% | | | | |
Avon Products, Inc. | | 109,800 | | 3,134,790 |
| | | | |
Tobacco 5.2% | | | | |
Altria Group, Inc. | | 270,600 | | 20,219,232 |
| | | | |
Energy 10.5% | | | | |
Energy Equipment & Services 1.0% | | | | |
Transocean, Inc.* | | 53,600 | | 3,735,384 |
| | | | |
Oil, Gas & Consumable Fuels 9.5% | | | | |
ConocoPhillips | | 170,720 | | 9,932,490 |
Devon Energy Corp. | | 150,600 | | 9,418,524 |
EOG Resources, Inc. | | 128,600 | | 9,435,382 |
Occidental Petroleum Corp. | | 102,800 | | 8,211,664 |
| | | | |
| | | | 36,998,060 |
| | | | |
Financials 44.7% | | | | |
Banks 10.6% | | | | |
Commerce Bancorp, Inc. (a) | | 53,100 | | 1,827,171 |
Fifth Third Bancorp. | | 74,900 | | 2,825,228 |
Golden West Financial Corp. | | 190,400 | | 12,566,400 |
HSBC Holdings PLC | | 743,041 | | 11,927,499 |
Lloyds TSB Group PLC (ADR) (a) | | 75,900 | | 2,565,420 |
Wells Fargo & Co. | | 149,600 | | 9,399,368 |
| | | | |
| | | | 41,111,086 |
| | | | |
82
| | | | |
| | | Shares | | Value ($) |
Capital Markets 1.9% | | | | |
Ameriprise Financial, Inc. | | 97,120 | | 3,981,920 |
Morgan Stanley | | 43,500 | | 2,468,190 |
State Street Corp. | | 13,400 | | 742,896 |
| | | | |
| | | | 7,193,006 |
| | | | |
Consumer Finance 4.9% | | | | |
American Express Co. | | 366,600 | | 18,865,236 |
| | | | |
Diversified Financial Services 7.8% | | | | |
Citigroup, Inc. | | 190,400 | | 9,240,112 |
JPMorgan Chase & Co. | | 384,384 | | 15,256,201 |
Moody’s Corp. | | 96,400 | | 5,920,888 |
| | | | |
| | | | 30,417,201 |
| | | | |
Insurance 17.8% | | | | |
American International Group, Inc. | | 280,400 | | 19,131,692 |
Aon Corp. | | 98,800 | | 3,551,860 |
Berkshire Hathaway, Inc. “B”* | | 5,005 | | 14,692,178 |
Chubb Corp. | | 11,700 | | 1,142,505 |
Loews Corp. | | 89,100 | | 8,451,135 |
Markel Corp.* (a) | | 900 | | 285,345 |
Marsh & McLennan Companies, Inc. | | 93,300 | | 2,963,208 |
Principal Financial Group, Inc. | | 26,800 | | 1,271,124 |
Progressive Corp. | | 104,000 | | 12,145,120 |
Sun Life Financial, Inc. | | 16,200 | | 650,106 |
Transatlantic Holdings, Inc. (a) | | 72,237 | | 4,854,326 |
| | | | |
| | | | 69,138,599 |
| | | | |
Real Estate 1.7% | | | | |
CenterPoint Properties Trust (REIT) | | 131,600 | | 6,511,568 |
| | | | |
Health Care 4.4% | | | | |
Health Care Providers & Services | | | | |
Cardinal Health, Inc. | | 68,500 | | 4,709,375 |
Caremark Rx, Inc.* | | 91,800 | | 4,754,322 |
HCA, Inc. | | 149,400 | | 7,544,700 |
| | | | |
| | | | 17,008,397 |
| | | | |
Industrials 8.2% | | | | |
Air Freight & Logistics 0.6% | | | | |
United Parcel Service, Inc. “B” | | 30,200 | | 2,269,530 |
| | | | |
Commercial Services & Supplies 3.0% | | | | |
China Merchants Holdings International Co., Ltd | | 648,000 | | 1,404,036 |
Cosco Pacific Ltd. | | 554,000 | | 1,007,448 |
D&B Corp.* | | 49,900 | | 3,341,304 |
Iron Mountain, Inc.* (a) | | 144,700 | | 6,109,234 |
| | | | |
| | | | 11,862,022 |
| | | | |
Industrial Conglomerates 4.4% | | | | |
Tyco International Ltd. | | 588,262 | | 16,977,241 |
| | | | |
Road & Rail 0.2% | | | | |
Kuehne & Nagel International AG (Registered) | | 2,764 | | 779,317 |
| | | | |
Information Technology 3.8% | | | | |
Communications Equipment 0.3% | | | | |
Nokia Oyj (ADR) | | 53,600 | | 980,880 |
| | | | |
83
| | | | | | |
| | | Shares | | | Value ($) | |
Computers & Peripherals 2.2% | | | | | | |
Dell, Inc.* | | 118,100 | | | 3,541,819 | |
Hewlett-Packard Co. | | 82,700 | | | 2,367,701 | |
Lexmark International, Inc. “A”* (a) | | 60,200 | | | 2,698,766 | |
| | | | | | |
| | | | | 8,608,286 | |
| | | | | | |
Software 1.3% | | | | | | |
Microsoft Corp. | | 192,500 | | | 5,033,875 | |
| | | | | | |
Materials 3.9% | | | | | | |
Construction Materials 1.6% | | | | | | |
Martin Marietta Materials, Inc. | | 42,500 | | | 3,260,600 | |
Vulcan Materials Co. | | 44,400 | | | 3,008,100 | |
| | | | | | |
| | | | | 6,268,700 | |
| | | | | | |
Containers & Packaging 2.3% | | | | | | |
Sealed Air Corp.* (a) | | 159,600 | | | 8,964,732 | |
| | | | | | |
Telecommunication Services 1.0% | | | | | | |
Diversified Telecommunication Services 0.7% | | | | | | |
NTL, Inc.* (a) | | 13,200 | | | 898,656 | |
Telewest Global, Inc.* (a) | | 66,900 | | | 1,593,558 | |
| | | | | | |
| | | | | 2,492,214 | |
| | | | | | |
| | |
| | | Shares | | | Value ($) | |
Wireless Telecommunication Services 0.3% | | | | | | |
SK Telecom Co., Ltd. (ADR) (a) | | 62,200 | | | 1,262,038 | |
| | | | | | |
Total Common Stocks (Cost $288,225,236) | | | | | 383,755,608 | |
| | | | | | |
Securities Lending Collateral 4.6% | | | | | | |
Daily Assets Fund Institutional, 4.28% (b) (c) (Cost $17,878,804) | | 17,878,804 | | | 17,878,804 | |
| | | | | | |
Cash Equivalents 0.8% | | | | | | |
Cash Management QP Trust, 4.26% (d) (Cost $3,223,464) | | 3,223,464 | | | 3,223,464 | |
| | | | | | |
| | |
| | | % of Net Assets | | | Value ($) | |
Total Investment Portfolio (Cost $309,327,504)+ | | 104.5 | | | 404,857,876 | |
| | | | | | |
Other Assets and Liabilities, Net | | (4.5 | ) | | (17,415,132 | ) |
| | | | | | |
Net Assets | | 100.0 | | | 387,442,744 | |
| | | | | | |
84
Notes to DWS Davis Venture Value VIP Portfolio of Investments
| * | Non-income producing security. |
| + | The cost for federal income tax purposes was $309,718,350. At December 31, 2005, net unrealized appreciation for all securities based on tax cost was $95,139,526. This consisted of aggregate gross unrealized appreciation for all securities in which there was an excess of value over tax cost of $101,184,936 and aggregate gross unrealized depreciation for all securities in which there was an excess of tax cost over value of $6,045,410. |
| (a) | All or a portion of these securities were on loan (see Notes to Financial Statements). The value of all securities loaned at December 31, 2005 amounted to $17,442,457 which is 4.5% of net assets. |
| (b) | Daily Assets Fund Institutional, an affiliated fund, is managed by Deutsche Asset Management, Inc. The rate shown is the annualized seven-day yield at period end. |
| (c) | Represents collateral held in connection with securities lending. |
| (d) | Cash Management QP Trust, an affiliated fund, is managed by Deutsche Investment Management Americas Inc. The rate shown is the annualized seven-day yield at period end. |
ADR: American Depositary Receipt
REIT: Real Estate Investment Trust
The accompanying notes are an integral part of the financial statements.
85
Financial Statements
Statement of Assets and Liabilities
as of December 31, 2005
| | | | |
Assets | | | | |
Investments: | | | | |
Investments in securities, at value (cost $288,225,236) — including $17,442,457 of securities loaned | | $ | 383,755,608 | |
Investment in Daily Assets Fund Institutional (cost $17,878,804)* | | | 17,878,804 | |
Investment in Cash Management QP Trust (cost $3,223,464) | | | 3,223,464 | |
Total investments in securities, at value (cost $309,327,504) | | | 404,857,876 | |
Cash | | | 10,000 | |
Foreign currency, at value (cost $520,407) | | | 509,372 | |
Receivable for investments sold | | | 49,630 | |
Dividends receivable | | | 591,897 | |
Interest receivable | | | 18,116 | |
Foreign taxes recoverable | | | 4,555 | |
Other assets | | | 10,045 | |
Total assets | | | 406,051,491 | |
Liabilities | | | | |
Payable for Portfolio shares redeemed | | | 402,894 | |
Payable upon return of securities loaned | | | 17,878,804 | |
Accrued management fee | | | 219,047 | |
Other accrued expenses and payables | | | 108,002 | |
Total liabilities | | | 18,608,747 | |
| | | | |
Net assets, at value | | $ | 387,442,744 | |
| | | | |
Net Assets | | | | |
Net assets consist of: | | | | |
Undistributed net investment income | | | 2,254,802 | |
Net unrealized appreciation (depreciation) on: | | | | |
Investments | | | 95,530,372 | |
Foreign currency related transactions | | | (11,544 | ) |
Accumulated net realized gain (loss) | | | (6,442,086 | ) |
Paid-in capital | | | 296,111,200 | |
| | | | |
Net assets, at value | | $ | 387,442,744 | |
| | | | |
Class A | | | | |
Net Asset Value, offering and redemption price per share ($309,354,882 ÷ 24,763,248 outstanding shares of beneficial interest, $.01 par value, unlimited number of shares authorized) | | $ | 12.49 | |
| | | | |
Class B | | | | |
Net Asset Value, offering and redemption price per share ($78,087,862 ÷ 6,263,092 outstanding shares of beneficial interest, $.01 par value, unlimited number of shares authorized) | | $ | 12.47 | |
| | | | |
| * | Represents collateral on securities loaned. |
86
Statement of Operations
for the year ended December 31, 2005
Investment Income
| | | | |
Income: | | | | |
Dividends (net of foreign taxes withheld of $129,826) | | $ | 5,899,111 | |
Interest — Cash Management QP Trust | | | 251,330 | |
Securities lending income, including income from Daily Assets Fund Institutional, net of borrower rebates | | | 38,041 | |
Total Income | | | 6,188,482 | |
Expenses: | | | | |
Management fee | | | 3,353,292 | |
Custodian and accounting fees | | | 116,627 | |
Distribution service fees (Class B) | | | 177,310 | |
Record keeping fees (Class B) | | | 97,746 | |
Auditing | | | 46,948 | |
Legal | | | 15,169 | |
Trustees’ fees and expenses | | | 15,117 | |
Reports to shareholders | | | 56,009 | |
Other | | | 24,117 | |
Total expenses before expense reductions | | | 3,902,335 | |
Expense reductions | | | (199,632 | ) |
Total expenses after expense reductions | | | 3,702,703 | |
| | | | |
Net investment income (loss) | | | 2,485,779 | |
| | | | |
Realized and Unrealized Gain (Loss) on Investment Transactions | | | | |
Net realized gain (loss) from: | | | | |
Investments | | | 1,835,229 | |
Foreign currency related transactions | | | (14,089 | ) |
Net increase from payments by affiliates and net gains (losses) realized on the disposal of investments in violation of restrictions | | | — | |
| | | | |
| | | 1,821,140 | |
| | | | |
Net unrealized appreciation (depreciation) during the period on: | | | | |
Investments | | | 29,230,931 | |
Foreign currency related transactions | | | (22,344 | ) |
| | | 29,208,587 | |
| | | | |
Net gain (loss) on investment transactions | | | 31,029,727 | |
| | | | |
Net increase (decrease) in net assets resulting from operations | | $ | 33,515,506 | |
| | | | |
The accompanying notes are an integral part of the financial statements.
87
Statement of Changes in Net Assets
| | | | | | | | |
| | | Years Ended December 31, | |
Increase (Decrease) in Net Assets | | 2005 | | | 2004 | |
Operations: | | | | | | | | |
Net investment income (loss) | | $ | 2,485,779 | | | $ | 1,954,893 | |
Net realized gain (loss) on investment transactions | | | 1,821,140 | | | | (1,157,982 | ) |
Net unrealized appreciation (depreciation) during the period on investment transactions | | | 29,208,587 | | | | 32,686,703 | |
Net increase (decrease) in net assets resulting from operations | | | 33,515,506 | | | | 33,483,614 | |
Distributions to shareholders from: | | | | | | | | |
Net investment income: | | | | | | | | |
Class A | | | (2,091,774 | ) | | | (1,002,743 | ) |
Class B | | | (260,311 | ) | | | (15,708 | ) |
Portfolio share transactions: | | | | | | | | |
Class A | | | | | | | | |
Proceeds from shares sold | | | 36,365,583 | | | | 39,970,621 | |
Reinvestment of distributions | | | 2,091,774 | | | | 1,002,743 | |
Cost of shares redeemed | | | (22,500,564 | ) | | | (19,163,185 | ) |
Net increase (decrease) in net assets from Class A share transactions | | | 15,956,793 | | | | 21,810,179 | |
Class B | | | | | | | | |
Proceeds from shares sold | | | 11,711,444 | | | | 32,936,634 | |
Reinvestment of distributions | | | 260,311 | | | | 15,708 | |
Cost of shares redeemed | | | (6,187,073 | ) | | | (2,151,840 | ) |
Net increase (decrease) in net assets from Class B share transactions | | | 5,784,682 | | | | 30,800,502 | |
Increase (decrease) in net assets | | | 52,904,896 | | | | 85,075,844 | |
Net assets at beginning of period | | | 334,537,848 | | | | 249,462,004 | |
| | | | | | | | |
Net assets at end of period (including undistributed net investment lncome of $2,254,802 and $1,834,272, respectively) | | $ | 387,442,744 | | | $ | 334,537,848 | |
| | | | | | | | |
Other Information | | | | | | | | |
Class A | | | | | | | | |
Shares outstanding at beginning of period | | | 23,386,408 | | | | 21,351,155 | |
Shares sold | | | 3,107,848 | | | | 3,746,952 | |
Shares issued to shareholders in reinvestment of distributions | | | 184,135 | | | | 93,978 | |
Shares redeemed | | | (1,915,143 | ) | | | (1,805,677 | ) |
Net increase (decrease) in Class A shares | | | 1,376,840 | | | | 2,035,253 | |
| | | | | | | | |
Shares outstanding at end of period | | | 24,763,248 | | | | 23,386,408 | |
| | | | | | | | |
Class B | | | | | | | | |
Shares outstanding at beginning of period | | | 5,765,180 | | | | 2,848,268 | |
Shares sold | | | 1,002,803 | | | | 3,116,302 | |
Shares issued to shareholders in reinvestment of distributions | | | 22,895 | | | | 1,471 | |
Shares redeemed | | | (527,786 | ) | | | (200,861 | ) |
Net increase (decrease) in Class B shares | | | 497,912 | | | | 2,916,912 | |
| | | | | | | | |
Shares outstanding at end of period | | | 6,263,092 | | | | 5,765,180 | |
| | | | | | | | |
The accompanying notes are an integral part of the financial statements.
88
Financial Highlights
| | | | | | | | | | | | | | | | | | | | |
Class A | | | | | | | | | | | | | | | | | | | | |
| | | | | |
Years Ended December 31, | | 2005 | | | 2004 | | | 2003 | | | 2002 | | | 2001a | |
Selected Per Share Data | | | | | | | | | | | | | | | | | | | | |
Net asset value, beginning of period | | $ | 11.48 | | | $ | 10.31 | | | $ | 7.99 | | | $ | 9.50 | | | $ | 10.00 | |
| | | | | | | | | | | | | | | | | | | | |
Income (loss) from investment operations: | | | | | | | | | | | | | | | | | | | | |
Net investment income (loss)b | | | .09 | | | | .08 | | | | .06 | | | | .05 | | | | .03 | |
Net realized and unrealized gain (loss) on investment transactions | | | 1.01 | | | | 1.14 | | | | 2.31 | | | | (1.55 | ) | | | (.53 | ) |
Total from investment operations | | | 1.10 | | | | 1.22 | | | | 2.37 | | | | (1.50 | ) | | | (.50 | ) |
Less distributions from: | | | | | | | | | | | | | | | | | | | | |
Net investment income | | | (.09 | ) | | | (.05 | ) | | | (.05 | ) | | | (.01 | ) | | | — | |
| | | | | | | | | | | | | | | | | | | | |
Net asset value, end of period | | $ | 12.49 | | | $ | 11.48 | | | $ | 10.31 | | | $ | 7.99 | | | $ | 9.50 | |
| | | | | | | | | | | | | | | | | | | | |
Total Return (%) | | | 9.64c | | | | 11.83 | | | | 29.84 | | | | (15.79 | ) | | | (5.00 | )** |
Ratios to Average Net Assets and Supplemental Data | | | | | | | | | | | | | | | | | | | | |
Net assets, end of period ($ millions) | | | 309 | | | | 268 | | | | 220 | | | | 160 | | | | 109 | |
Ratio of expenses before expense reductions (%) | | | 1.02 | | | | 1.05 | | | | 1.01 | | | | 1.02 | | | | 1.09 | * |
Ratio of expenses after expense reductions (%) | | | .96 | | | | 1.05 | | | | 1.01 | | | | 1.02 | | | | 1.09 | * |
Ratio of net investment income (%) | | | .78 | | | | .74 | | | | .62 | | | | .62 | | | | .48 | * |
Portfolio turnover rate (%) | | | 8 | | | | 3 | | | | 7 | | | | 22 | | | | 15 | * |
| a | For the period from May 1, 2001 (commencement of operations) to December 31, 2001. |
| b | Based on average shares outstanding during the period. |
| c | Reimbursement of $621 due to disposal of investments in violation of restrictions had no effect on total return. |
| | | | | | | | | | | | | | | | |
Class B | | | | | | | | | | | | | | | | |
| | | | |
Years Ended December 31, | | 2005 | | | 2004 | | | 2003 | | | 2002a | |
Selected Per Share Data | | | | | | | | | | | | | | | | |
Net asset value, beginning of period | | $ | 11.46 | | | $ | 10.29 | | | $ | 7.98 | | | $ | 8.52 | |
| | | | | | | | | | | | | | | | |
Income (loss) from investment operations: | | | | | | | | | | | | | | | | |
Net investment income (loss)b | | | .04 | | | | .04 | | | | .02 | | | | .04 | |
Net realized and unrealized gain (loss) on investment transactions | | | 1.01 | | | | 1.13 | | | | 2.32 | | | | (.58 | ) |
Total from investment operations | | | 1.05 | | | | 1.17 | | | | 2.34 | | | | (.54 | ) |
Less distributions from: | | | | | | | | | | | | | | | | |
Net investment income | | | (.04 | ) | | | .00 | *** | | | (.03 | ) | | | — | |
| | | | | | | | | | | | | | | | |
Net asset value, end of period | | $ | 12.47 | | | $ | 11.46 | | | $ | 10.29 | | | $ | 7.98 | |
| | | | | | | | | | | | | | | | |
Total Return (%) | | | 9.23c | | | | 11.42 | | | | 29.42 | | | | (6.34 | )** |
Ratios to Average Net Assets and Supplemental Data | | | | | | | | | | | | | | | | |
Net assets, end of period ($ millions) | | | 78 | | | | 66 | | | | 29 | | | | .8 | |
Ratio of expenses before expense reductions (%) | | | 1.41 | | | | 1.44 | | | | 1.40 | | | | 1.27 | * |
Ratio of expenses after expense reductions (%) | | | 1.34 | | | | 1.44 | | | | 1.40 | | | | 1.27 | * |
Ratio of net investment income (%) | | | .40 | | | | .36 | | | | .23 | | | | 1.06 | * |
Portfolio turnover rate (%) | | | 8 | | | | 3 | | | | 7 | | | | 22 | |
| a | For the period July 1, 2002 (commencement of operations of Class B shares) to December 31, 2002. |
| b | Based on average shares outstanding during the period. |
| c | Reimbursement of $621 due to disposal of investments in violation of restrictions had no effect on total return. |
| *** | Amount is less than $.005. |
89
Performance Summary December 31, 2005
DWS Dreman Financial Services VIP
All performance shown is historical, assumes reinvestment of all dividend and capital gain distributions and does not guarantee future results. Investment return and principal value fluctuate with changing market conditions so that, when redeemed, shares may be worth more or less than their original cost. Current performance may be lower or higher than the performance data quoted. Please visit www.dws-scudder.com for the Portfolio’s most recent month-end performance. Performance doesn’t reflect charges and fees (“contract charges”) associated with the separate account that invests in the Portfolio or any variable life insurance policy or variable annuity contract for which the Portfolio is an investment option. These charges and fees will reduce returns. While all share classes have the same underlying portfolio, their performance will differ.
This Portfolio is subject to stock market risk. It may focus its investments on certain economic sectors, thereby increasing its vulnerability to any single economic, political or regulatory development. This may result in greater share price volatility. Additionally, this Portfolio is non-diversified and can take larger positions in fewer companies, increasing its overall potential risk. Please read this Portfolio’s prospectus for specific details regarding its investments and risk profile.
Growth of an Assumed $10,000 Investment in DWS Dreman Financial Services VIP from 5/4/1998 to 12/31/2005
¨ DWS Dreman Financial Services VIP — Class A
¨ S&P 500 Index
¨ S&P Financial Index
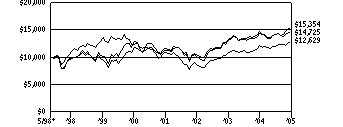
Yearly periods ended December 31
The Standard & Poor’s (S&P) 500 Index is an unmanaged capitalization-weighted index of 500 stocks designed to measure performance of the broad domestic economy through changes in the aggregate market value of 500 stocks representing all major industries. The Standard & Poor’s (S&P) Financial Index is an unmanaged index that gauges the performance of financial companies within the S&P 500 Index
Index returns assume reinvested dividends and, unlike Portfolio returns, do not reflect any fees or expenses. It is not possible to invest directly into an index.
Comparative Results
| | | | | | | | | | | | | | | | | | |
DWS Dreman Financial Services VIP | | 1-Year | | | 3-Year | | | 5-Year | | | Life of Portfolio* | |
Class A | | Growth of $10,000 | | $ | 9,993 | | | $ | 14,341 | | | $ | 12,483 | | | $ | 14,725 | |
| | Average annual total return | | | -.07 | % | | | 12.77 | % | | | 4.54 | % | | | 5.18 | % |
S&P 500 Index | | Growth of $10,000 | | $ | 10,491 | | | $ | 14,970 | | | $ | 10,275 | | | $ | 12,629 | |
| | Average annual total return | | | 4.91 | % | | | 14.39 | % | | | .54 | % | | | 3.09 | % |
S&P Financial Index | | Growth of $10,000 | | $ | 10,647 | | | $ | 15,471 | | | $ | 12,024 | | | $ | 15,354 | |
| | Average annual total return | | | 6.47 | % | | | 15.66 | % | | | 3.76 | % | | | 5.75 | % |
| | | |
DWS Dreman Financial Services VIP | | | 1-Year | | | 3-Year | | | Life of Class** | |
Class B | | Growth of $10,000 | | | | | | $ | 9,954 | | | $ | 14,176 | | | $ | 13,116 | |
| | Average annual total return | | | | | | | -.46 | % | | | 12.34 | % | | | 8.06 | % |
S&P 500 Index | | Growth of $10,000 | | | | | | $ | 10,491 | | | $ | 14,970 | | | $ | 13,428 | |
| | Average annual total return | | | | | | | 4.91 | % | | | 14.39 | % | | | 8.79 | % |
S&P Financial Index | | Growth of $10,000 | | | | | | $ | 10,647 | | | $ | 15,471 | | | $ | 13,792 | |
| | Average annual total return | | | | | | | 6.47 | % | | | 15.66 | % | | | 9.62 | % |
The growth of $10,000 is cumulative.
| * | The Portfolio commenced operations on May 4, 1998. Index returns begin April 30, 1998. |
| ** | The Portfolio commenced offering Class B shares on July 1, 2002. Index returns begin June 30, 2002. |
90
Information About Your Portfolio’s Expenses
DWS Dreman Financial Services VIP
As an investor of the Portfolio, you incur two types of costs: ongoing expenses and transaction costs. Ongoing expenses include management fees, distribution and service (12b-1) fees and other Portfolio expenses. Examples of transaction costs include sales charges (loads), redemption fees and account maintenance fees, which are not shown in this section. The following tables are intended to help you understand your ongoing expenses (in dollars) of investing in the Portfolio and to help you compare these expenses with the ongoing expenses of investing in other mutual funds. The tables are based on an investment of $1,000 made at the beginning of the six-month period ended December 31, 2005.
The tables illustrate your Portfolio’s expenses in two ways:
Actual Portfolio Return. This helps you estimate the actual dollar amount of ongoing expenses (but not transaction costs) paid on a $1,000 investment in the Portfolio using the Portfolio’s actual return during the period. To estimate the expenses you paid over the period, simply divide your account value by $1,000 (for example, an $8,600 account value divided by $1,000 = 8.6), then multiply the result by the number in the “Expenses Paid per $1,000” line under the share class you hold.
Hypothetical 5% Portfolio Return. This helps you to compare your Portfolio’s ongoing expenses (but not transaction costs) with those of other mutual funds using the Portfolio’s actual expense ratio and a hypothetical rate of return of 5% per year before expenses. Examples using a 5% hypothetical Portfolio return may be found in the shareholder reports of other mutual funds. The hypothetical account values and expenses may not be used to estimate the actual ending account balance or expenses you paid for the period.
Please note that the expenses shown in these tables are meant to highlight your ongoing expenses only and do not reflect any transaction costs. The “Expenses Paid per $1,000” line of the tables is useful in comparing ongoing expenses only and will not help you determine the relative total expense of owning different funds. If these transaction costs had been included, your costs would have been higher.
Expenses and Value of a $1,000 Investment for the six months ended December 31, 2005
| | | | | | |
Actual Portfolio Return | | Class A | | Class B |
Beginning Account Value 7/1/05 | | $ | 1,000.00 | | $ | 1,000.00 |
Ending Account Value 12/31/05 | | $ | 1,047.10 | | $ | 1,044.80 |
Expenses Paid per $1,000* | | $ | 4.70 | | $ | 6.85 |
| | |
Hypothetical 5% Portfolio Return | | Class A | | Class B |
Beginning Account Value 7/1/05 | | $ | 1,000.00 | | $ | 1,000.00 |
Ending Account Value 12/31/05 | | $ | 1,020.62 | | $ | 1,018.50 |
Expenses Paid per $1,000* | | $ | 4.63 | | $ | 6.77 |
| * | Expenses are equal to the Portfolio’s annualized expense ratio for each share class, multiplied by the average account value over the period, multiplied by the number of days in the most recent six-month period, then divided by 365. |
| | | | | | |
Annualized Expense Ratios | | Class A | | | Class B | |
DWS Variable Series II — DWS Dreman Financial Services VIP | | .91 | % | | 1.33 | % |
For more information, please refer to the Portfolio’s prospectus.
These tables do not reflect charges and fees (“contract charges”) associated with the separate account that invests in the portfolio or any variable life insurance policy or variable annuity contract for which the portfolio is an investment option.
91
Management Summary December 31, 2005
DWS Dreman Financial Services VIP
The equity market, as measured by the S&P 500 Index, had a return of 4.91% for 2005. Eight of the 10 industry sectors within the S&P 500 had positive returns for the year. Within the index, energy was the strongest sector, returning 31.35%; the financials sector, as represented by the S&P Financial Index, had a return of 6.47%. DWS Dreman Financial Services VIP finished the year almost exactly where it began, with a return of -0.07% (Class A shares, unadjusted for contract charges).
The Portfolio’s performance was disappointing mainly because of negative events specific to two of the largest holdings, Freddie Mac and Fannie Mae. These two companies, which are government-sponsored enterprises that operate mainly in the residential mortgage business, have been the subject of negative publicity because accounting irregularities have required them to restate earnings. We believe that their growth models are still credible, and we continue to hold significant positions in the stocks.
Another large holding, American International Group, Inc., hurt performance early in the year because of an accounting scandal, but it has since recovered, confirming our thesis that this leading international insurance and financial services firm has good prospects for long-term profitable growth.
Holdings that contributed to performance include Chubb Corp., a leading insurance firm; Franklin Resources, Inc., a global investment management firm; Prudential Financial Inc., a diversified financial services firm; National Bank of Canada; and investment banks Lehman Brothers Holdings, Inc. and The Goldman Sachs Group, Inc.
The Portfolio’s investment policy makes it possible to invest up to 20% of the fund’s assets outside the financial services sector. This enables us to take advantage of attractive investment opportunities in other sectors, while achieving additional diversification. We believe the combination of growing world demand for energy and a lack of investment in new energy resources over the last 20 years creates a major long-term opportunity. Therefore by the end of the period, we had invested 9% of the Portfolio in energy stocks.
David N. Dreman F. James Hutchinson
Lead Manager Portfolio Manager
Dreman Value Management, L.L.C., Subadvisor to the Portfolio
All performance shown is historical, assumes reinvestment of all dividend and capital gain distributions, and does not guarantee future results. Investment return and principal value fluctuate with changing market conditions so that, when redeemed, shares may be worth more or less than their original cost. Current performance may be lower or higher than the performance data quoted. Please visit www.dws-scudder.com for the product’s most recent month-end performance. Performance doesn’t reflect charges and fees (“contract charges”) associated with the separate account that invests in the Portfolio or any variable life insurance policy or variable annuity contract for which the Portfolio is an investment option. These charges and fees will reduce returns.
Risk Considerations
This Portfolio is subject to stock market risk. It may focus its investments on certain economic sectors, thereby increasing its vulnerability to any single economic, political or regulatory development. This may result in greater share price volatility. Additionally, this Portfolio is nondiversified and can take larger positions in fewer companies, increasing its overall potential risk. Please read this Portfolio’s prospectus for specific details regarding its investments and risk profile.
The Standard & Poor’s (S&P) 500 Index is an unmanaged, capitalization-weighted index of 500 stocks designed to measure performance of the broad domestic economy through changes in the aggregate market value of 500 stocks representing all major industries. The Standard & Poor’s (S&P) Financial Index is an unmanaged index that gauges the performance of financial companies within the S&P 500 Index. Index returns assume reinvested dividends and, unlike portfolio returns, do not reflect any fees or expenses. It is not possible to invest directly into an index.
Portfolio management market commentary is as of December 31, 2005, and may not come to pass. This information is subject to change at any time based on market and other conditions.
92
Portfolio Summary
DWS Dreman Financial Services VIP
| | | | | | |
Asset Allocation (Excludes Securities Lending Collateral and Cash Equivalents) | | 12/31/05 | | | 12/31/04 | |
Common Stocks | | 100 | % | | 100 | % |
| | | | | | |
| | | | | | |
Sector Diversification (As a % of Common Stocks) | | 12/31/05 | | | 12/31/04 | |
Energy | | 9 | % | | — | |
Consumer Staples | | 3 | % | | — | |
Financials: | | | | | | |
Banks | | 38 | % | | 45 | % |
Diversified Financial Services | | 22 | % | | 28 | % |
Capital Markets | | 13 | % | | 9 | % |
Insurance | | 12 | % | | 13 | % |
Consumer Finance | | 2 | % | | 5 | % |
Real Estate | | 1 | % | | — | |
| | | | | | |
| | 100 | % | | 100 | % |
| | | | | | |
Asset allocation and sector diversification are subject to change.
For more complete details about the Portfolio’s investment portfolio, see page 81. A quarterly Fact Sheet is available upon request. Information concerning portfolio holdings of the Portfolio as of month end will be posted to www.dws-scudder.com on the 15th of the following month.
Following the Portfolio’s fiscal first and third quarter-end, a complete portfolio holdings listing is filed with the SEC on Form N-Q. The form will be available on the SEC’s Web site at www.sec.gov, and it also may be reviewed and copied at the SEC’s Public Reference Room in Washington, D.C. Information on the operation of the SEC’s Public Reference Room may be obtained by calling (800) SEC-0330.
93
Investment Portfolio December 31, 2005
DWS Dreman Financial Services VIP
| | | | |
| | | Shares | | Value ($) |
Common Stocks 100.0% | | | | |
Consumer Staples 3.1% | | | | |
Tobacco | | | | |
Altria Group, Inc. | | 57,100 | | 4,266,512 |
| | | | |
Energy 9.4% | | | | |
Oil, Gas & Consumable Fuels | | | | |
Anadarko Petroleum Corp. | | 7,100 | | 672,725 |
Apache Corp. | | 9,100 | | 623,532 |
Burlington Resources, Inc. | | 9,100 | | 784,420 |
ConocoPhillips | | 79,700 | | 4,636,946 |
Devon Energy Corp. | | 10,600 | | 662,924 |
EnCana Corp. | | 25,800 | | 1,165,128 |
Occidental Petroleum Corp. | | 16,400 | | 1,310,032 |
Tesoro Corp. | | 22,400 | | 1,378,720 |
Valero Energy Corp. | | 32,800 | | 1,692,480 |
| | | | |
| | | | 12,926,907 |
| | | | |
Financials 87.5% | | | | |
Banks 37.4% | | | | |
Bank of America Corp. | | 203,920 | | 9,410,908 |
Fifth Third Bancorp. | | 44,100 | | 1,663,452 |
Hudson City Bancorp., Inc. | | 35,100 | | 425,412 |
Independence Community Bank Corp. | | 13,100 | | 520,463 |
KeyCorp | | 138,855 | | 4,572,495 |
Marshall & Ilsley Corp. | | 44,500 | | 1,915,280 |
Mercantile Bankshares Corp. | | 11,400 | | 643,416 |
National Bank of Canada | | 81,350 | | 4,221,284 |
National City Corp. | | 68,331 | | 2,293,872 |
PNC Financial Services Group, Inc. | | 47,340 | | 2,927,032 |
Regions Financial Corp. | | 59,072 | | 2,017,900 |
Sovereign Bancorp, Inc. | | 89,775 | | 1,940,936 |
US Bancorp. | | 140,320 | | 4,194,165 |
Wachovia Corp. | | 63,340 | | 3,348,152 |
Washington Mutual, Inc. | | 209,832 | | 9,127,692 |
Wells Fargo & Co. | | 36,410 | | 2,287,640 |
| | | | |
| | | | 51,510,099 |
| | | | |
Capital Markets 12.8% | | | | |
Ameriprise Financial, Inc. | | 13,890 | | 569,490 |
Bear Stearns Companies, Inc. | | 17,140 | | 1,980,184 |
Franklin Resources, Inc. | | 17,210 | | 1,617,912 |
Lehman Brothers Holdings, Inc. | | 17,200 | | 2,204,524 |
94
| | | | |
| | | Shares | | Value ($) |
Mellon Financial Corp. | | 95,300 | | 3,264,025 |
Morgan Stanley | | 98,480 | | 5,587,756 |
The Goldman Sachs Group, Inc. | | 19,400 | | 2,477,574 |
| | | | |
| | | | 17,701,465 |
| | | | |
Consumer Finance 2.4% | | | | |
American Express Co. | | 63,950 | | 3,290,867 |
| | | | |
Diversified Financial Services 22.3% | | | | |
CIT Group, Inc. | | 50,590 | | 2,619,550 |
Citigroup, Inc. | | 101,300 | | 4,916,089 |
Fannie Mae | | 167,480 | | 8,174,699 |
Freddie Mac | | 130,005 | | 8,495,827 |
JPMorgan Chase & Co. | | 122,124 | | 4,847,101 |
The PMI Group, Inc. | | 39,300 | | 1,614,051 |
| | | | |
| | | | 30,667,317 |
| | | | |
| | | | |
Insurance 11.8% | | | | |
Allstate Corp. | | 29,495 | | 1,594,795 |
American International Group, Inc. | | 172,573 | | 11,774,656 |
Chubb Corp. | | 18,630 | | 1,819,219 |
Prudential Financial, Inc. | | 14,690 | | 1,075,161 |
| | | | |
| | | | 16,263,831 |
| | | | |
Real Estate 0.8% | | | | |
NovaStar Financial, Inc. (REIT) (a) | | 39,500 | | 1,110,344 |
| | | | |
Total Common Stocks (Cost $107,620,603) | | | | 137,737,342 |
| | | | |
Securities Lending Collateral 0.7% | | | | |
Daily Assets Fund Institutional, 4.28% (b) (c) (Cost $1,020,625) | | 1,020,625 | | 1,020,625 |
Cash Equivalents 0.1% | | | | |
Cash Management QP Trust, 4.26% (d) (Cost $148,666) | | 148,666 | | 148,666 |
| | | | | | |
| | | % of Net Assets | | | Value ($) | |
Total Investment Portfolio (Cost $108,789,894)+ | | 100.8 | | | 138,906,633 | |
| | | | | | |
Other Assets and Liabilities, Net | | (0.8 | ) | | (1,089,105 | ) |
| | | | | | |
Net Assets | | 100.0 | | | 137,817,528 | |
| | | | | | |
Notes to DWS Dreman Financial Services VIP Portfolio of Investments
| + | The cost for federal income tax purposes was $110,050,124. At December 31, 2005, net unrealized appreciation for all securities based on tax cost was $28,856,509. This consisted of aggregate gross unrealized appreciation for all securities in which there was an excess of value over tax cost of $33,097,241 and aggregate gross unrealized depreciation for all securities in which there was an excess of tax cost over value of $4,240,732. |
| (a) | All or a portion of these securities were on loan (see Notes to Financial Statements). The value of all securities loaned at December 31, 2005 amounted to $997,905 which is 0.7% of net assets. |
| (b) | Daily Assets Fund Institutional, an affiliated fund, is managed by Deutsche Asset Management, Inc. The rate shown is the annualized seven-day yield at period end. |
| (c) | Represents collateral held in connection with securities lending. |
| (d) | Cash Management QP Trust, an affiliated fund, is managed by Deutsche Investment Management Americas Inc. The rate shown is the annualized seven-day yield at period end. |
REIT: Real Estate Investment Trust
The accompanying notes are an integral part of the financial statements.
95
Financial Statements
Statement of Assets and Liabilities
as of December 31, 2005
| | | |
Assets | | | |
Investments: | | | |
Investments in securities, at value (cost $107,620,603) — including $997,905 of securities loaned | | $ | 137,737,342 |
Investment in Daily Assets Fund Institutional (cost $1,020,625)* | | | 1,020,625 |
Investment in Cash Management QP Trust (cost $148,666) | | | 148,666 |
Total investments in securities, at value (cost $108,789,894) | | | 138,906,633 |
Cash | | | 26,450 |
Dividends receivable | | | 221,276 |
Interest receivable | | | 9,427 |
Other assets | | | 4,233 |
Total assets | | | 139,168,019 |
Liabilities | | | |
Payable for Portfolio shares redeemed | | | 168,753 |
Payable upon return of securities loaned | | | 1,020,625 |
Accrued management fee | | | 86,637 |
Other accrued expenses and payables | | | 74,476 |
| | | |
Total liabilities | | | 1,350,491 |
| | | |
Net assets, at value | | $ | 137,817,528 |
| | | |
Net Assets | | | |
Net assets consist of: | | | |
Undistributed net investment income | | | 2,884,898 |
Net unrealized appreciation (depreciation) on: | | | |
Investments | | | 30,116,739 |
Foreign currency related transactions | | | 71 |
Accumulated net realized gain (loss) | | | 186,463 |
Paid-in capital | | | 104,629,357 |
| | | |
Net assets, at value | | $ | 137,817,528 |
| | | |
Class A | | | |
Net Asset Value, offering and redemption price per share ($120,027,544 ÷ 9,007,093 outstanding shares of beneficial interest, $.01 par value, unlimited number of shares authorized) | | $ | 13.33 |
| | | |
Class B | | | |
Net Asset Value, offering and redemption price per share ($17,789,984 ÷ 1,337,909 outstanding shares of beneficial interest, $.01 par value, unlimited number of shares authorized) | | $ | 13.30 |
| | | |
| * | Represents collateral on securities loaned. |
96
Statement of Operations
for the year ended December 31, 2005
Investment Income
| | | | |
Income: | | | | |
Dividends (net of foreign taxes withheld of $23,565) | | $ | 4,139,850 | |
Interest — Cash Management QP Trust | | | 3,390 | |
Securities lending income, including income from Daily Assets Fund Institutional, net of borrower rebates | | | 151,200 | |
Total Income | | | 4,294,440 | |
Expenses: | | | | |
Management fee | | | 1,076,058 | |
Custodian and accounting fees | | | 95,589 | |
Distribution service fees (Class B) | | | 42,361 | |
Record keeping fees (Class B) | | | 25,055 | |
Auditing | | | 44,166 | |
Legal | | | 6,859 | |
Trustees’ fees and expenses | | | 6,302 | |
Reports to shareholders | | | 34,133 | |
Other | | | 20,307 | |
Total expenses before expense reductions | | | 1,350,830 | |
Expense reductions | | | (2,712 | ) |
Total expenses after expense reductions | | | 1,348,118 | |
| | | | |
Net investment income (loss) | | | 2,946,322 | |
| | | | |
Realized and Unrealized Gain (Loss) on Investment Transactions | | | | |
Net realized gain (loss) from: | | | | |
Investments | | | 6,474,234 | |
Foreign currency related transactions | | | (1,602 | ) |
| | | | |
| | | 6,472,632 | |
| | | | |
Net unrealized appreciation (depreciation) during the period on: | | | | |
Investments | | | (10,649,526 | ) |
Foreign currency related transactions | �� | | (1,487 | ) |
| | | (10,651,013 | ) |
| | | | |
Net gain (loss) on investment transactions | | | (4,178,381 | ) |
| | | | |
Net increase (decrease) in net assets resulting from operations | | $ | (1,232,059 | ) |
| | | | |
The accompanying notes are an integral part of the financial statements.
97
Statement of Changes in Net Assets
| | | | | | | | |
| | | Years Ended December 31, | |
| | | 2005 | | | 2004 | |
Increase (Decrease) in Net Assets | | | | | | | | |
Operations: | | | | | | | | |
Net investment income (loss) | | $ | 2,946,322 | | | $ | 2,737,075 | |
Net realized gain (loss) on investment transactions | | | 6,472,632 | | | | 1,313,816 | |
Net unrealized appreciation (depreciation) during the period on investment transactions | | | (10,651,013 | ) | | | 13,545,556 | |
Net increase (decrease) in net assets resulting from operations | | | (1,232,059 | ) | | | 17,596,447 | |
Distributions to shareholders from: | | | | | | | | |
Net investment income: | | | | | | | | |
Class A | | | (2,459,642 | ) | | | (2,233,509 | ) |
Class B | | | (250,229 | ) | | | (138,571 | ) |
Portfolio share transactions: | | | | | | | | |
Class A | | | | | | | | |
Proceeds from shares sold | | | 4,078,683 | | | | 9,238,024 | |
Reinvestment of distributions | | | 2,459,642 | | | | 2,233,509 | |
Cost of shares redeemed | | | (27,606,524 | ) | | | (23,157,778 | ) |
Net increase (decrease) in net assets from Class A share transactions | | | (21,068,199 | ) | | | (11,686,245 | ) |
Class B | | | | | | | | |
Proceeds from shares sold | | | 2,781,906 | | | | 7,389,810 | |
Reinvestment of distributions | | | 250,229 | | | | 138,571 | |
Cost of shares redeemed | | | (2,350,850 | ) | | | (1,105,504 | ) |
Net increase (decrease) in net assets from Class B share transactions | | | 681,285 | | | | 6,422,877 | |
Increase (decrease) in net assets | | | (24,328,844 | ) | | | 9,960,999 | |
Net assets at beginning of period | | | 162,146,372 | | | | 152,185,373 | |
| | | | | | | | |
Net assets at end of period (including undistributed net investment income of $2,884,898 and $2,663,849, respectively) | | $ | 137,817,528 | | | $ | 162,146,372 | |
| | | | | | | | |
Other Information | | | | | | | | |
Class A | | | | | | | | |
Shares outstanding at beginning of period | | | 10,645,952 | | | | 11,569,224 | |
Shares sold | | | 319,846 | | | | 730,584 | |
Shares issued to shareholders in reinvestment of distributions | | | 200,133 | | | | 176,982 | |
Shares redeemed | | | (2,158,838 | ) | | | (1,830,838 | ) |
Net increase (decrease) in Class A shares | | | (1,638,859 | ) | | | (923,272 | ) |
| | | | | | | | |
Shares outstanding at end of period | | | 9,007,093 | | | | 10,645,952 | |
| | | | | | | | |
Class B | | | | | | | | |
Shares outstanding at beginning of period | | | 1,281,273 | | | | 771,080 | |
Shares sold | | | 220,209 | | | | 586,845 | |
Shares issued to shareholders in reinvestment of distributions | | | 20,344 | | | | 10,971 | |
Shares redeemed | | | (183,917 | ) | | | (87,623 | ) |
Net increase (decrease) in Class B shares | | | 56,636 | | | | 510,193 | |
| | | | | | | | |
Shares outstanding at end of period | | | 1,337,909 | | | | 1,281,273 | |
| | | | | | | | |
The accompanying notes are an integral part of the financial statements.
98
Financial Highlights
Class A
| | | | | | | | | | | | | | | | | | | | |
Years Ended December 31, | | 2005 | | | 2004 | | | 2003 | | | 2002 | | | 2001 | |
Selected Per Share Data | | | | | | | | | | | | | | | | | | | | |
Net asset value, beginning of period | | $ | 13.60 | | | $ | 12.33 | | | $ | 9.79 | | | $ | 10.78 | | | $ | 11.53 | |
| | | | | | | | | | | | | | | | | | | | |
Income (loss) from investment operations: | | | | | | | | | | | | | | | | | | | | |
Net investment income (loss)a | | | .27 | | | | .23 | | | | .20 | | | | .15 | | | | .14 | |
Net realized and unrealized gain (loss) on investment transactions | | | (.30 | ) | | | 1.23 | | | | 2.50 | | | | (1.06 | ) | | | (.71 | ) |
| | | | | | | | | | | | | | | | | | | | |
Total from investment operations | | | (.03 | ) | | | 1.46 | | | | 2.70 | | | | (.91 | ) | | | (.57 | ) |
| | | | | | | | | | | | | | | | | | | | |
Less distributions from: | | | | | | | | | | | | | | | | | | | | |
Net investment income | | | (.24 | ) | | | (.20 | ) | | | (.16 | ) | | | (.08 | ) | | | (.13 | ) |
Net realized gain on investment transactions | | | — | | | | — | | | | — | | | | — | | | | (.05 | ) |
| | | | | | | | | | | | | | | | | | | | |
Total distributions | | | (.24 | ) | | | (.20 | ) | | | (.16 | ) | | | (.08 | ) | | | (.18 | ) |
| | | | | | | | | | | | | | | | | | | | |
Net asset value, end of period | | $ | 13.33 | | | $ | 13.60 | | | $ | 12.33 | | | $ | 9.79 | | | $ | 10.78 | |
| | | | | | | | | | | | | | | | | | | | |
Total Return (%) | | | (.07 | ) | | | 12.00 | | | | 28.13 | | | | (8.51 | ) | | | (4.86 | ) |
| | | | | | | | | | | | | | | | | | | | |
Ratios to Average Net Assets and Supplemental Data | | | | | | | | | | | | | | | | | | | | |
Net assets, end of period ($ millions) | | | 120 | | | | 145 | | | | 143 | | | | 120 | | | | 117 | |
Ratio of expenses | | | .89 | | | | .84 | | | | .86 | | | | .83 | | | | .86 | |
Ratio of net investment income (%) | | | 2.10 | | | | 1.79 | | | | 1.84 | | | | 1.44 | | | | 1.31 | |
Portfolio turnover rate (%) | | | 27 | | | | 8 | | | | 7 | | | | 13 | | | | 22 | |
| a | Based on average shares outstanding during the period. |
Class B
| | | | | | | | | | | | | | | | |
Years Ended December 31, | | 2005 | | | 2004 | | | 2003 | | | 2002a | |
Selected Per Share Data | | | | | | | | | | | | | | | | |
Net asset value, beginning of period | | $ | 13.57 | | | $ | 12.31 | | | $ | 9.78 | | | $ | 10.57 | |
| | | | | | | | | | | | | | | | |
Income (loss) from investment operations: | | | | | | | | | | | | | | | | |
Net investment income (loss)b | | | .21 | | | | .18 | | | | .14 | | | | .06 | |
Net realized and unrealized gain (loss) on investment transactions | | | (.29 | ) | | | 1.22 | | | | 2.53 | | | | (.85 | ) |
Total from investment operations | | | (.08 | ) | | | 1.40 | | | | 2.67 | | | | (.79 | ) |
Less distributions from: | | | | | | | | | | | | | | | | |
Net investment income | | | (.19 | ) | | | (.14 | ) | | | (.14 | ) | | | — | |
| | | | | | | | | | | | | | | | |
Net asset value, end of period | | $ | 13.30 | | | $ | 13.57 | | | $ | 12.31 | | | $ | 9.78 | |
| | | | | | | | | | | | | | | | |
Total Return (%) | | | (.46 | ) | | | 11.50 | | | | 27.73 | | | | (7.47 | )** |
Ratios to Average Net Assets and Supplemental Data | | | | | | | | | | | | | | | | |
Net assets, end of period ($ millions) | | | 18 | | | | 17 | | | | 9 | | | | .4 | |
Ratio of expenses (%) | | | 1.29 | | | | 1.22 | | | | 1.25 | | | | 1.08 | * |
Ratio of net investment income (%) | | | 1.70 | | | | 1.41 | | | | 1.45 | | | | 1.33 | * |
Portfolio turnover rate (%) | | | 27 | | | | 8 | | | | 7 | | | | 13 | |
| a | For the period from July 1, 2002 (commencement of operations of Class B shares) to December 31, 2002. |
| b | Based on average shares outstanding during the period. |
99
Performance Summary December 31, 2005
DWS Dreman High Return Equity VIP
All performance shown is historical, assumes reinvestment of all dividend and capital gain distributions and does not guarantee future results. Investment return and principal value fluctuate with changing market conditions so that, when redeemed, shares may be worth more or less than their original cost. Current performance may be lower or higher than the performance data quoted. Please visit www.dws-scudder.com for the Portfolio’s most recent month-end performance. Performance doesn’t reflect charges and fees (“contract charges”) associated with the separate account that invests in the Portfolio or any variable life insurance policy or variable annuity contract for which the Portfolio is an investment option. These charges and fees will reduce returns. While all share classes have the same underlying portfolio, their performance will differ.
The Portfolio may focus its investments on certain economic sectors, thereby increasing its vulnerability to any single economic, political or regulatory development. This may result in greater share price volatility. Please read this Portfolio’s prospectus for specific details regarding its investments and risk profile.
Growth of an Assumed $10,000 Investment in DWS Dreman High Return Equity VIP from 5/4/1998 to 12/31/2005
¨ DWS Dreman High Return Equity VIP — Class A
¨ S&P 500 Index
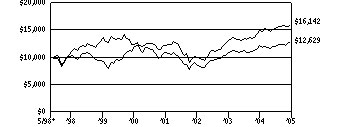
Yearly periods ended December 31
The Standard & Poor’s (S&P) 500 Index is an unmanaged capitalization-weighted index of 500 stocks. The index is designed to measure performance of the broad domestic economy through changes in the aggregate market value of 500 stocks representing all major industries. Index returns assume reinvested dividends and, unlike Portfolio returns, do not reflect any fees or expenses. It is not possible to invest directly into an index.
Comparative Results
| | | | | | | | | | | | | | | | | | |
DWS Dreman High Return Equity VIP | | | | 1-Year | | | 3-Year | | | 5-Year | | | Life of Portfolio* | |
Class A | | Growth of $10,000 | | $ | 10,792 | | | $ | 16,238 | | | $ | 13,535 | | | $ | 16,142 | |
| | Average annual total return | | | 7.92 | % | | | 17.54 | % | | | 6.24 | % | | | 6.45 | % |
| | | | | |
S&P 500 Index | | Growth of $10,000 | | $ | 10,491 | | | $ | 14,970 | | | $ | 10,275 | | | $ | 12,629 | |
| | Average annual total return | | | 4.91 | % | | | 14.39 | % | | | .54 | % | | | 3.09 | % |
| | | | | |
DWS Dreman High Return Equity VIP | | | | | | | 1-Year | | | 3-Year | | | Life of Class** | |
Class B | | Growth of $10,000 | | | | | | $ | 10,751 | | | $ | 16,063 | | | $ | 14,686 | |
| | Average annual total return | | | | | | | 7.51 | % | | | 17.11 | % | | | 11.61 | % |
| | | | | |
S&P 500 Index | | Growth of $10,000 | | | | | | $ | 10,491 | | | $ | 14,970 | | | $ | 13,428 | |
| | Average annual total return | | | | | | | 4.91 | % | | | 14.39 | % | | | 8.79 | % |
The growth of $10,000 is cumulative.
| * | The Portfolio commenced operations on May 4, 1998. Index returns begin April 30, 1998. |
| ** | The Portfolio commenced offering Class B shares on July 1, 2002. Index returns begin June 30, 2002. |
100
Information About Your Portfolio’s Expenses
DWS Dreman High Return Equity VIP
As an investor of the Portfolio, you incur two types of costs: ongoing expenses and transaction costs. Ongoing expenses include management fees, distribution and service (12b-1) fees and other Portfolio expenses. Examples of transaction costs include sales charges (loads), redemption fees and account maintenance fees, which are not shown in this section. The following tables are intended to help you understand your ongoing expenses (in dollars) of investing in the Portfolio and to help you compare these expenses with the ongoing expenses of investing in other mutual funds. The tables are based on an investment of $1,000 made at the beginning of the six-month period ended December 31, 2005.
The tables illustrate your Portfolio’s expenses in two ways:
Actual Portfolio Return. This helps you estimate the actual dollar amount of ongoing expenses (but not transaction costs) paid on a $1,000 investment in the Portfolio using the Portfolio’s actual return during the period. To estimate the expenses you paid over the period, simply divide your account value by $1,000 (for example, an $8,600 account value divided by $1,000 = 8.6), then multiply the result by the number in the “Expenses Paid per $1,000” line under the share class you hold.
Hypothetical 5% Portfolio Return. This helps you to compare your Portfolio’s ongoing expenses (but not transaction costs) with those of other mutual funds using the Portfolio’s actual expense ratio and a hypothetical rate of return of 5% per year before expenses. Examples using a 5% hypothetical Portfolio return may be found in the shareholder reports of other mutual funds. The hypothetical account values and expenses may not be used to estimate the actual ending account balance or expenses you paid for the period.
Please note that the expenses shown in these tables are meant to highlight your ongoing expenses only and do not reflect any transaction costs. The “Expenses Paid per $1,000” line of the tables is useful in comparing ongoing expenses only and will not help you determine the relative total expense of owning different funds. If these transaction costs had been included, your costs would have been higher.
Expenses and Value of a $1,000 Investment for the six months ended December 31, 2005
| | | | | | |
Actual Portfolio Return | | Class A | | Class B |
Beginning Account Value 7/1/05 | | $ | 1,000.00 | | $ | 1,000.00 |
Ending Account Value 12/31/05 | | $ | 1,053.40 | | $ | 1,051.00 |
Expenses Paid per $1,000* | | $ | 4.04 | | $ | 6.15 |
| | |
Hypothetical 5% Portfolio Return | | Class A | | Class B |
Beginning Account Value 7/1/05 | | $ | 1,000.00 | | $ | 1,000.00 |
Ending Account Value 12/31/05 | | $ | 1,021.27 | | $ | 1,019.21 |
Expenses Paid per $1,000* | | $ | 3.97 | | $ | 6.06 |
| * | Expenses are equal to the Portfolio’s annualized expense ratio for each share class, multiplied by the average account value over the period, multiplied by the number of days in the most recent six-month period, then divided by 365. |
| | | | | | |
Annualized Expense Ratios | | Class A | | | Class B | |
DWS Variable Series II — DWS Dreman High Return Equity VIP | | .78 | % | | 1.19 | % |
For more information, please refer to the Portfolio’s prospectus.
These tables do not reflect charges and fees (“contract charges”) associated with the separate account that invests in the portfolio or any variable life insurance policy or variable annuity contract for which the portfolio is an investment option.
101
Management Summary December 31, 2005
DWS Dreman High Return Equity VIP
Almost all measures of economic activity moved upward during 2005. Gross domestic product has increased at a rate of more than 3% for nearly three years. Employment, home ownership and consumer net worth increased, and consumer spending remained relatively strong, despite the effect of rising energy prices on consumer sentiment. Business trends were also positive during the year, with gains in corporate profits, business investment, manufacturing activity and productivity. Expressing concern about inflation, the US Federal Reserve Board (the Fed) continued to raise the federal funds rate1 during the year.
The equity market, as measured by the S&P 500 Index, had a return of 4.91% for the year ending December 31, 2005. The Portfolio, which returned 7.92% (Class A shares, unadjusted for contract charges) for the annual period, significantly outperformed its benchmark, the S&P 500 Index.
The most significant positive factor was a major overweight in energy stocks, as energy was by far the best-performing sector. Within the energy group, the top contributor to performance was Burlington Resources, Inc. Other energy stocks that performed especially well were Transocean, Inc.; Devon Energy Corp., EnCana Corp. and Kerr-McGee Corp. Also positive was our major overweight position in the tobacco industry. Tobacco holdings including Altria Group, Inc. and Reynolds American, Inc., performed especially well as recent court rulings indicated that settlements of pending litigation may be more favorable than had been anticipated.
Performance was hurt by an overweight in financials relative to the benchmark. Two large holdings, Freddie Mac and Fannie Mae, performed poorly because of accounting irregularities that required earnings restatements. We consider the market’s negative reaction to the issues facing these companies to be excessive, and we have maintained these positions.
We believe the Portfolio is positioned appropriately for a time of uncertainty in the economy and markets. We have confidence in our time-tested investing philosophy of seeking companies that are financially sound and that have solid growth prospects but have fallen out of favor with the investing public.
David N. Dreman
F. James Hutchinson
Co-Managers
Dreman Value Management L.L.C., Subadvisor to the Portfolio
All performance shown is historical, assumes reinvestment of all dividend and capital gain distributions, and does not guarantee future results. Investment return and principal value fluctuate with changing market conditions so that, when redeemed, shares may be worth more or less than their original cost. Current performance may be lower or higher than the performance data quoted. Please visit www.dws-scudder.com for the product’s most recent month-end performance. Performance doesn’t reflect charges and fees (“contract charges”) associated with the separate account that invests in the Portfolio or any variable life insurance policy or variable annuity contract for which the Portfolio is an investment option. These charges and fees will reduce returns.
Risk Considerations
The Portfolio may focus its investments on certain economic sectors, thereby increasing its vulnerability to any single economic, political or regulatory development. This may result in greater share price volatility. Please read this Portfolio’s prospectus for specific details regarding this product’s investments and risk profile.
The Standard & Poor’s 500 (S&P 500) Index is a capitalization-weighted index of 500 stocks. The index is designed to measure performance of the broad domestic economy through changes in the aggregate market value of 500 stocks representing all major industries. Index returns assume reinvestment of all dividends and, unlike portfolio returns, do not reflect fees or expenses. It is not possible to invest directly into an index.
| 1 | Federal funds rate — the overnight rate charged by banks when they borrow money from each other. Set by the Federal Open Market Committee (FOMC), the fed funds rate is the most sensitive — and closely watched — indicator concerning the direction of short-term interest rates. The FOMC is a key committee within the US Federal Reserve System, and meets every six weeks to review Fed policy on short-term rates. Based on current Fed policy, the FOMC may choose to raise or lower the fed funds rate to either add liquidity to the economy or remove it. |
Portfolio management market commentary is as of December 31, 2005, and may not come to pass. This information is subject to change at any time based on market and other conditions.
102
Portfolio Summary
DWS Dreman High Return Equity VIP
| | | | | | |
Asset Allocation (Excludes Securities Lending Collateral) | | 12/31/05 | | | 12/31/04 | |
Common Stocks | | 94 | % | | 92 | % |
Cash Equivalents | | 6 | % | | 8 | % |
| | | | | | |
| | 100 | % | | 100 | % |
| | | | | | |
| | |
Sector Diversification (As a % of Common Stocks) | | 12/31/05 | | | 12/31/04 | |
Financials | | 29 | % | | 34 | % |
Energy | | 21 | % | | 14 | % |
Consumer Staples | | 19 | % | | 21 | % |
Health Care | | 17 | % | | 17 | % |
Consumer Discretionary | | 6 | % | | 8 | % |
Industrials | | 5 | % | | 3 | % |
Information Technology | | 3 | % | | 3 | % |
| | | | | | |
| | 100 | % | | 100 | % |
| | | | | | |
Asset allocation and sector diversification are subject to change.
For more complete details about the Portfolio’s investment portfolio, see page 89. A quarterly Fact Sheet is available upon request. Information concerning portfolio holdings of the Portfolio as of month end will be posted to www.dws-scudder.com on the 15th of the following month.
Following the Portfolio’s fiscal first and third quarter-end, a complete portfolio holdings listing is filed with the SEC on Form N-Q. The form will be available on the SEC’s Web site at www.sec.gov, and it also may be reviewed and copied at the SEC’s Public Reference Room in Washington, D.C. Information on the operation of the SEC’s Public Reference Room may be obtained by calling (800) SEC-0330.
103
Investment Portfolio December 31, 2005
DWS Dreman High Return Equity VIP
| | | | |
| | | Shares | | Value ($) |
Common Stocks 93.6% | | | | |
Consumer Discretionary 5.8% | | | | |
Automobiles 0.3% | | | | |
Ford Motor Co. | | 345,000 | | 2,663,400 |
| | | | |
Multiline Retail 0.9% | | | | |
Federated Department Stores, Inc. | | 129,505 | | 8,590,066 |
| | | | |
Specialty Retail 4.6% | | | | |
Borders Group, Inc. | | 712,900 | | 15,448,543 |
Home Depot, Inc. | | 388,455 | | 15,724,659 |
Staples, Inc. | | 501,247 | | 11,383,319 |
| | | | |
| | | | 42,556,521 |
| | | | |
Consumer Staples 17.4% | | | | |
Food & Staples Retailing 0.6% | | | | |
Safeway, Inc. | | 232,650 | | 5,504,499 |
| | | | |
Tobacco 16.8% | | | | |
Altria Group, Inc. | | 1,121,820 | | 83,822,391 |
Imperial Tobacco Group PLC (ADR) | | 95,145 | | 5,755,321 |
Reynolds American, Inc. (a) | | 214,773 | | 20,474,310 |
Universal Corp. | | 266,570 | | 11,558,475 |
UST, Inc. | | 816,640 | | 33,343,411 |
| | | | |
| | | | 154,953,908 |
| | | | |
Energy 19.3% | | | | |
Energy Equipment & Services 0.2% | | | | |
Transocean, Inc.* | | 22,400 | | 1,561,056 |
| | | | |
Oil, Gas & Consumable Fuels 19.1% | | | | |
Anadarko Petroleum Corp. | | 47,500 | | 4,500,625 |
Apache Corp. | | 147,100 | | 10,079,292 |
Burlington Resources, Inc. | | 163,500 | | 14,093,700 |
Chevron Corp. | | 562,860 | | 31,953,562 |
ConocoPhillips | | 995,046 | | 57,891,776 |
Devon Energy Corp. | | 514,600 | | 32,183,084 |
El Paso Corp. | | 846,510 | | 10,293,562 |
EnCana Corp. | | 66,200 | | 2,989,592 |
Kerr-McGee Corp. | | 2,928 | | 266,038 |
Occidental Petroleum Corp. | | 148,700 | | 11,878,156 |
| | | | |
| | | | 176,129,387 |
| | | | |
Financials 27.1% | | | | |
Banks 7.6% | | | | |
Bank of America Corp. | | 521,636 | | 24,073,501 |
KeyCorp | | 294,000 | | 9,681,420 |
PNC Financial Services Group, Inc. | | 169,300 | | 10,467,819 |
Sovereign Bancorp, Inc. | | 493,600 | | 10,671,632 |
US Bancorp. | | 265,700 | | 7,941,773 |
Wachovia Corp. | | 140,000 | | 7,400,400 |
| | | | |
| | | | 70,236,545 |
| | | | |
Capital Markets 0.0% | | | | |
Piper Jaffray Companies, Inc.* | | 1,071 | | 43,268 |
| | | | |
Diversified Financial Services 16.7% | | | | |
CIT Group, Inc. | | 89,100 | | 4,613,598 |
Citigroup, Inc. | | 134,600 | | 6,532,138 |
104
| | | | | | |
| | | Shares | | | Value ($) | |
Fannie Mae | | 894,873 | | | 43,678,751 | |
Freddie Mac | | 853,641 | | | 55,785,440 | |
JPMorgan Chase & Co. | | 132,864 | | | 5,273,372 | |
Washington Mutual, Inc. | | 854,175 | | | 37,156,613 | |
| | | | | | |
| | | | | 153,039,912 | |
| | | | | | |
Insurance 2.8% | | | | | | |
American International Group, Inc. | | 331,300 | | | 22,604,599 | |
The St. Paul Travelers Companies, Inc. | | 70,605 | | | 3,153,925 | |
| | | | | | |
| | | | | 25,758,524 | |
| | | | | | |
Health Care 16.5% | | | | | | |
Health Care Equipment & Supplies 1.4% | | | | | | |
Becton, Dickinson & Co. | | 111,555 | | | 6,702,224 | |
Fisher Scientific International, Inc.* | | 102,100 | | | 6,315,906 | |
| | | | | | |
| | | | | 13,018,130 | |
| | | | | | |
Health Care Providers & Services 8.1% | | | | | | |
Cardinal Health, Inc. | | 119,400 | | | 8,208,750 | |
HCA, Inc. | | 296,200 | | | 14,958,100 | |
Laboratory Corp. of America Holdings* | | 343,075 | | | 18,474,589 | |
Medco Health Solutions, Inc.* | | 316,434 | | | 17,657,017 | |
Quest Diagnostics, Inc. | | 291,100 | | | 14,985,828 | |
| | | | | | |
| | | | | 74,284,284 | |
| | | | | | |
Pharmaceuticals 7.0% | | | | | | |
Bristol-Myers Squibb Co. | | 743,460 | | | 17,084,711 | |
Merck & Co., Inc. | | 525,195 | | | 16,706,453 | |
Pfizer, Inc. | | 931,930 | | | 21,732,608 | |
Wyeth | | 193,675 | | | 8,922,607 | |
| | | | | | |
| | | | | 64,446,379 | |
| | | | | | |
Industrials 4.7% | | | | | | |
Air Freight & Logistics 0.5% | | | | | | |
FedEx Corp. | | 45,000 | | | 4,652,550 | |
| | | | | | |
Industrial Conglomerates 3.2% | | | | | | |
3M Co. | | 125,200 | | | 9,703,000 | |
General Electric Co. | | 209,350 | | | 7,337,718 | |
Tyco International Ltd. | | 415,005 | | | 11,977,044 | |
| | | | | | |
| | | | | 29,017,762 | |
| | | | | | |
Machinery 1.0% | | | | | | |
PACCAR, Inc. | | 138,700 | | | 9,602,201 | |
| | | | | | |
Information Technology 2.8% | | | | | | |
IT Consulting & Services | | | | | | |
Electronic Data Systems Corp. | | 1,059,440 | | | 25,468,938 | |
| | | | | | |
Utilities 0.0% | | | | | | |
Multi-Utilities | | | | | | |
NiSource, Inc. | | 5,303 | | | 110,621 | |
| | | | | | |
Total Common Stocks (Cost $668,478,882) | | | | | 861,637,951 | |
| | | | | | |
Securities Lending Collateral 1.0% | | | | | | |
Daily Assets Fund Institutional, 4.28% (b) (c) (Cost $9,612,900) | | 9,612,900 | | | 9,612,900 | |
| | | | | | |
Cash Equivalents 6.0% | | | | | | |
Cash Management QP Trust, 4.26% (d) (Cost $55,136,790) | | 55,136,790 | | | 55,136,790 | |
| | | | | | |
| | |
| | | % of Net Assets | | | Value ($) | |
Total Investment Portfolio (Cost $733,228,572)+ | | 100.6 | | | 926,387,641 | |
| | | | | | |
Other Assets and Liabilities, Net | | (0.6 | ) | | (5,770,147 | ) |
| | | | | | |
| | | | | | |
Net Assets | | 100.0 | | | 920,617,494 | |
| | | | | | |
105
Notes to DWS Dreman High Return Equity VIP Portfolio of Investments
| + | The cost for federal income tax purposes was $734,465,757. At December 31, 2005, net unrealized appreciation for all securities based on tax cost was $191,921,884. This consisted of aggregate gross unrealized appreciation for all securities in which there was an excess of value over tax cost of $246,714,121 and aggregate gross unrealized depreciation for all securities in which there was an excess of tax cost over value of $54,792,237. |
| * | Non-income producing security. |
| (a) | All or a portion of these securities were on loan (see Notes to Financial Statements). The value of all securities loaned at December 31, 2005 amounted to $9,437,670 which is 1.0% of net assets. |
| (b) | Daily Assets Fund Institutional, an affiliated fund, is managed by Deutsche Asset Management, Inc. The rate shown is the annualized seven-day yield at period end. |
| (c) | Represents collateral held in connection with securities lending. |
| (d) | Cash Management QP Trust, an affiliated fund, is managed by Deutsche Investment Management Americas Inc. The rate shown is the annualized seven-day yield at period end. |
ADR: American Depositary Receipt
At December 31, 2005, open futures contracts purchased were as follows:
| | | | | | | | | | | |
Futures | | Expiration
Date | | Contracts | | Aggregated
Face
Value ($) | | Value ($) | | Net Unrealized
Depreciation
($) | |
S&P 500 Index | | 3/16/2006 | | 102 | | 32,492,714 | | 31,997,400 | | (495,314 | ) |
The accompanying notes are an integral part of the financial statements.
106
Financial Statements
Statement of Assets and Liabilities
as of December 31, 2005
| | | | |
Assets | | | | |
Investments: | | | | |
Investments in securities, at value (cost $668,478,882) — including $9,437,670 of securities loaned | | $ | 861,637,951 | |
Investment in Daily Assets Fund Institutional (cost $9,612,900)* | | | 9,612,900 | |
Investment in Cash Management QP Trust (cost $55,136,790) | | | 55,136,790 | |
Total investments in securities, at value (cost $733,228,572) | | | 926,387,641 | |
Cash | | | 10,000 | |
Margin deposit | | | 3,000,000 | |
Dividends receivable | | | 2,087,726 | |
Interest receivable | | | 193,720 | |
Receivable for Portfolio shares sold | | | 45,224 | |
Other assets | | | 28,556 | |
| | | | |
Total assets | | | 931,752,867 | |
| | | | |
Liabilities | | | | |
Payable for Portfolio shares redeemed | | | 615,085 | |
Payable upon return of securities loaned | | | 9,612,900 | |
Payable for daily variation margin on open futures contracts | | | 135,150 | |
Accrued management fee | | | 555,288 | |
Other accrued expenses and payables | | | 216,950 | |
Total liabilities | | | 11,135,373 | |
| | | | |
Net assets, at value | | $ | 920,617,494 | |
| | | | |
Net Assets | | | | |
Net assets consist of: | | | | |
Undistributed net investment income | | | 15,440,258 | |
Net unrealized appreciation (depreciation) on: | | | | |
Investments | | | 193,159,069 | |
Futures | | | (495,314 | ) |
Accumulated net realized gain (loss) | | | (7,359,180 | ) |
Paid-in capital | | | 719,872,661 | |
| | | | |
Net assets, at value | | $ | 920,617,494 | |
| | | | |
Class A | | | | |
Net Asset Value, offering and redemption price per share ($785,304,208 ÷ 58,564,793 outstanding shares of beneficial interest, $.01 par value, unlimited number of shares authorized) | | $ | 13.41 | |
| | | | |
Class B | | | | |
Net Asset Value, offering and redemption price per share ($135,313,286 ÷ 10,109,241 outstanding shares of beneficial interest, $.01 par value, unlimited number of shares authorized) | | $ | 13.39 | |
| | | | |
| * | Represents collateral on securities loaned. |
107
Statement of Operations
for the year ended December 31, 2005
| | | | |
Investment Income | | | | |
Income: | | | | |
Dividends (net of foreign taxes withheld of $22,931) | | $ | 21,189,452 | |
Interest — Cash Management QP Trust | | | 2,015,802 | |
Securities lending income, including income from Daily Assets Fund Institutional, net of borrower rebates | | | 17,505 | |
| | | | |
Total Income | | | 23,222,759 | |
| | | | |
Expenses: | | | | |
Management fee | | | 6,460,811 | |
Custodian and accounting fees | | | 132,062 | |
Distribution service fees (Class B) | | | 312,165 | |
Record keeping fees (Class B) | | | 177,001 | |
Auditing | | | 46,008 | |
Legal | | | 17,646 | |
Trustees’ fees and expenses | | | 42,080 | |
Reports to shareholders | | | 153,623 | |
Other | | | 42,087 | |
Total expenses before expense reductions | | | 7,383,483 | |
Expense reductions | | | (10,907 | ) |
Total expenses after expense reductions | | | 7,372,576 | |
| | | | |
Net investment income (loss) | | | 15,850,183 | |
| | | | |
Realized and Unrealized Gain (Loss) on Investment Transactions | | | | |
Net realized gain (loss) from: | | | | |
Investments | | | 13,081,559 | |
Futures | | | 909,310 | |
| | | | |
| | | 13,990,869 | |
| | | | |
Net unrealized appreciation (depreciation) during the period on: | | | | |
Investments | | | 39,170,908 | |
Futures | | | (1,298,451 | ) |
| | | 37,872,457 | |
| | | | |
Net gain (loss) on investment transactions | | | 51,863,326 | |
| | | | |
Net increase (decrease) in net assets resulting from operations | | $ | 67,713,509 | |
| | | | |
The accompanying notes are an integral part of the financial statements.
108
Statement of Changes in Net Assets
| | | | | | | | |
| | | Years Ended December 31, | |
| | | 2005 | | | 2004 | |
Increase (Decrease) in Net Assets | | | | | | | | |
Operations: | | | | | | | | |
Net investment income (loss) | | $ | 15,850,183 | | | $ | 14,881,437 | |
Net realized gain (loss) on investment transactions | | | 13,990,869 | | | | 11,147,529 | |
Net unrealized appreciation (depreciation) during the period on investment transactions | | | 37,872,457 | | | | 78,862,493 | |
Net increase (decrease) in net assets resulting from operations | | | 67,713,509 | | | | 104,891,459 | |
Distributions to shareholders from: | | | | | | | | |
Net investment income: | | | | | | | | |
Class A | | | (13,347,076 | ) | | | (11,297,007 | ) |
Class B | | | (1,660,448 | ) | | | (1,021,598 | ) |
Portfolio share transactions: Class A Proceeds from shares sold | | | 39,914,209 | | | | 38,718,500 | |
Reinvestment of distributions | | | 13,347,076 | | | | 11,297,007 | |
Cost of shares redeemed | | | (60,039,081 | ) | | | (55,620,546 | ) |
Net increase (decrease) in net assets from Class A share transactions | | | (6,777,796 | ) | | | (5,605,039 | ) |
Class B Proceeds from shares sold | | | 18,573,514 | | | | 42,816,407 | |
Reinvestment of distributions | | | 1,660,448 | | | | 1,021,598 | |
Cost of shares redeemed | | | (9,785,758 | ) | | | (4,506,330 | ) |
Net increase (decrease) in net assets from Class B share transactions | | | 10,448,204 | | | | 39,331,675 | |
Increase (decrease) in net assets | | | 56,376,393 | | | | 126,299,490 | |
Net assets at beginning of period | | | 864,241,101 | | | | 737,941,611 | |
| | | | | | | | |
Net assets at end of period (including undistributed net investment income of $15,440,258 and $14,597,599, respectively) | | $ | 920,617,494 | | | $ | 864,241,101 | |
| | | | | | | | |
Other Information | | | | | | | | |
Class A | | | | | | | | |
Shares outstanding at beginning of period | | | 59,052,129 | | | | 59,527,655 | |
Shares sold | | | 3,118,474 | | | | 3,370,933 | |
Shares issued to shareholders in reinvestment of distributions | | | 1,067,766 | | | | 1,011,370 | |
Shares redeemed | | | (4,673,576 | ) | | | (4,857,829 | ) |
Net increase (decrease) in Class A shares | | | (487,336 | ) | | | (475,526 | ) |
| | | | | | | | |
Shares outstanding at end of period | | | 58,564,793 | | | | 59,052,129 | |
| | | | | | | | |
Class B | | | | | | | | |
Shares outstanding at beginning of period | | | 9,286,484 | | | | 5,819,055 | |
Shares sold | | | 1,454,485 | | | | 3,763,080 | |
Shares issued to shareholders in reinvestment of distributions | | | 132,624 | | | | 91,377 | |
Shares redeemed | | | (764,352 | ) | | | (387,028 | ) |
Net increase (decrease) in Class B shares | | | 822,757 | | | | 3,467,429 | |
| | | | | | | | |
Shares outstanding at end of period | | | 10,109,241 | | | | 9,286,484 | |
| | | | | | | | |
The accompanying notes are an integral part of the financial statements.
109
Financial Highlights
Class A
| | | | | | | | | | | | | | | | | | | | |
Years Ended December 31, | | 2005 | | | 2004 | | | 2003 | | | 2002 | | | 2001 | |
Selected Per Share Data | | | | | | | | | | | | | | | | | | | | |
Net asset value, beginning of period | | $ | 12.65 | | | $ | 11.29 | | | $ | 8.76 | | | $ | 10.81 | | | $ | 10.77 | |
| | | | | | | | | | | | | | | | | | | | |
Income (loss) from investment operations: | | | | | | | | | | | | | | | | | | | | |
Net investment income (loss)a | | | .24 | | | | .23 | | | | .20 | | | | .21 | | | | .19 | |
Net realized and unrealized gain (loss) on investment transactions | | | .75 | | | | 1.32 | | | | 2.53 | | | | (2.13 | ) | | | (.01 | ) |
Total from investment operations | | | .99 | | | | 1.55 | | | | 2.73 | | | | (1.92 | ) | | | .18 | |
Less distributions from: | | | | | | | | | | | | | | | | | | | | |
Net investment income | | | (.23 | ) | | | (.19 | ) | | | (.20 | ) | | | (.09 | ) | | | (.14 | ) |
Net realized gain on investment transactions | | | — | | | | — | | | | — | | | | (.04 | ) | | | — | |
Total distributions | | | (.23 | ) | | | (.19 | ) | | | (.20 | ) | | | (.13 | ) | | | (.14 | ) |
| | | | | | | | | | | | | | | | | | | | |
Net asset value, end of period | | $ | 13.41 | | | $ | 12.65 | | | $ | 11.29 | | | $ | 8.76 | | | $ | 10.81 | |
| | | | | | | | | | | | | | | | | | | | |
Total Return (%) | | | 7.92 | | | | 13.95 | | | | 32.04 | | | | (18.03 | ) | | | 1.69 | |
Ratios to Average Net Assets and Supplemental Data | | | | | | | | | | | | | | | | | | | | |
Net assets, end of period ($ millions) | | | 785 | | | | 747 | | | | 672 | | | | 510 | | | | 443 | |
Ratio of expenses (%) | | | .78 | | | | .78 | | | | .79 | | | | .79 | | | | .82 | |
Ratio of net investment income (%) | | | 1.84 | | | | 1.96 | | | | 2.14 | | | | 2.21 | | | | 1.78 | |
Portfolio turnover rate (%) | | | 10 | | | | 9 | | | | 18 | | | | 17 | | | | 16 | |
| | | | | |
a Based on average shares outstanding during the period. | | | | | | | | | | | | | | | | | | | | |
Class B
| | | | | | | | | | | | | | | | |
Years Ended December 31, | | 2005 | | | 2004 | | | 2003 | | | 2002a | |
Selected Per Share Data | | | | | | | | | | | | | | | | |
Net asset value, beginning of period | | $ | 12.63 | | | $ | 11.27 | | | $ | 8.75 | | | $ | 9.57 | |
| | | | | | | | | | | | | | | | |
Income (loss) from investment operations: | | | | | | | | | | | | | | | | |
Net investment income (loss)b | | | .19 | | | | .18 | | | | .16 | | | | .18 | |
Net realized and unrealized gain (loss) on investment transactions | | | .75 | | | | 1.33 | | | | 2.53 | | | | (1.00 | ) |
Total from investment operations | | | .94 | | | | 1.51 | | | | 2.69 | | | | (.82 | ) |
Less distributions from: | | | | | | | | | | | | | | | | |
Net investment income | | | (.18 | ) | | | (.15 | ) | | | (.17 | ) | | | — | |
| | | | | | | | | | | | | | | | |
Net asset value, end of period | | $ | 13.39 | | | $ | 12.63 | | | $ | 11.27 | | | $ | 8.75 | |
| | | | | | | | | | | | | | | | |
Total Return (%) | | | 7.51 | | | | 13.53 | | | | 31.60 | | | | (8.57 | )** |
Ratios to Average Net Assets and Supplemental Data | | | | | | | | | | | | | | | | |
Net assets, end of period ($ millions) | | | 135 | | | | 117 | | | | 66 | | | | 2 | |
Ratio of expenses (%) | | | 1.17 | | | | 1.16 | | | | 1.18 | | | | 1.05 | * |
Ratio of net investment income (%) | | | 1.45 | | | | 1.58 | | | | 1.75 | | | | 4.30 | * |
Portfolio turnover rate (%) | | | 10 | | | | 9 | | | | 18 | | | | 17 | |
| a | For the period from July 1, 2002 (commencement of operations of Class B shares) to December 31, 2002. |
| b | Based on average shares outstanding during the period. |
110
Performance Summary December 31, 2005
DWS Dreman Small Cap Value VIP
All performance shown is historical, assumes reinvestment of all dividend and capital gain distributions and does not guarantee future results. Investment return and principal value fluctuate with changing market conditions so that, when redeemed, shares may be worth more or less than their original cost. Current performance may be lower or higher than the performance data quoted. Please visit www.dws-scudder.com for the Portfolio’s most recent month-end performance. Performance doesn’t reflect charges and fees (“contract charges”) associated with the separate account that invests in the Portfolio or any variable life insurance policy or variable annuity contract for which the Portfolio is an investment option. These charges and fees will reduce returns. While all share classes have the same underlying portfolio, their performance will differ.
This Portfolio is subject to stock market risk. Stocks of small companies involve greater risk than securities of larger, more-established companies, as they often have limited product lines, markets or financial resources and may be exposed to more erratic and abrupt market movements. The Portfolio may focus its investments on certain economic sectors, thereby increasing its vulnerability to any single economic, political, or regulatory development. This may result in greater share price volatility. Please read this Portfolio’s prospectus for specific details regarding this product’s investments and risk profile.
Growth of an Assumed $10,000 Investment in DWS Dreman Small Cap Value VIP from 5/1/1996 to 12/31/2005
¨ DWS Dreman Small Cap Value VIP — Class A
¨ Russell 2000 Value Index
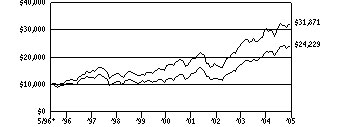
Yearly periods ended December 31
The Russell 2000 Value Index is an unmanaged index which measures the performance of those Russell 2000 companies with lower price-to-book ratios and lower forecasted growth values. Index returns assume reinvested dividends and, unlike Portfolio returns, do not reflect any fees or expenses. It is not possible to invest directly into an index.
Comparative Results
| | | | | | | | | | | | | | | | | | |
DWS Dreman Small Cap Value VIP | | | | 1-Year | | | 3-Year | | | 5-Year | | | Life of Portfolio* | |
Class A | | Growth of $10,000 | | $ | 11,025 | | | $ | 19,750 | | | $ | 20,584 | | | $ | 24,229 | |
| | Average annual total return | | | 10.25 | % | | | 25.47 | % | | | 15.53 | % | | | 9.59 | % |
Russell 2000 Value Index | | Growth of $10,000 | | $ | 10,471 | | | $ | 18,692 | | | $ | 18,878 | | | $ | 31,871 | |
| | Average annual total return | | | 4.71 | % | | | 23.18 | % | | | 13.55 | % | | | 12.74 | % |
| | | | | |
DWS Dreman Small Cap Value VIP | | | | | | | 1-Year | | | 3-Year | | | Life of Class** | |
Class B | | Growth of $10,000 | | | | | | $ | 10,978 | | | $ | 19,519 | | | $ | 16,407 | |
| | Average annual total return | | | | | | | 9.78 | % | | | 24.97 | % | | | 15.20 | % |
Russell 2000 Value Index | | Growth of $10,000 | | | | | | $ | 10,471 | | | $ | 18,692 | | | $ | 15,436 | |
| | Average annual total return | | | | | | | 4.71 | % | | | 23.18 | % | | | 13.21 | % |
The growth of $10,000 is cumulative.
| * | The Portfolio commenced operations on May 1, 1996. Index returns begin April 30, 1996. |
| ** | The Portfolio commenced offering Class B shares on July 1, 2002. Index returns begin June 30, 2002. |
111
Information About Your Portfolio’s Expenses
DWS Dreman Small Cap Value VIP
As an investor of the Portfolio, you incur two types of costs: ongoing expenses and transaction costs. Ongoing expenses include management fees, distribution and service (12b-1) fees and other Portfolio expenses. Examples of transaction costs include sales charges (loads), redemption fees and account maintenance fees, which are not shown in this section. The following tables are intended to help you understand your ongoing expenses (in dollars) of investing in the Portfolio and to help you compare these expenses with the ongoing expenses of investing in other mutual funds. The tables are based on an investment of $1,000 made at the beginning of the six-month period ended December 31, 2005.
The tables illustrate your Portfolio’s expenses in two ways:
Actual Portfolio Return. This helps you estimate the actual dollar amount of ongoing expenses (but not transaction costs) paid on a $1,000 investment in the Portfolio using the Portfolio’s actual return during the period. To estimate the expenses you paid over the period, simply divide your account value by $1,000 (for example, an $8,600 account value divided by $1,000 = 8.6), then multiply the result by the number in the “Expenses Paid per $1,000” line under the share class you hold.
Hypothetical 5% Portfolio Return. This helps you to compare your Portfolio’s ongoing expenses (but not transaction costs) with those of other mutual funds using the Portfolio’s actual expense ratio and a hypothetical rate of return of 5% per year before expenses. Examples using a 5% hypothetical Portfolio return may be found in the shareholder reports of other mutual funds. The hypothetical account values and expenses may not be used to estimate the actual ending account balance or expenses you paid for the period.
Please note that the expenses shown in these tables are meant to highlight your ongoing expenses only and do not reflect any transaction costs. The “Expenses Paid per $1,000” line of the tables is useful in comparing ongoing expenses only and will not help you determine the relative total expense of owning different funds. If these transaction costs had been included, your costs would have been higher.
Expenses and Value of a $1,000 Investment for the six months ended December 31, 2005
| | | | | | |
Actual Portfolio Return | | Class A | | Class B |
Beginning Account Value 7/1/05 | | $ | 1,000.00 | | $ | 1,000.00 |
Ending Account Value 12/31/05 | | $ | 1,070.70 | | $ | 1,068.60 |
Expenses Paid per $1,000* | | $ | 4.18 | | $ | 6.36 |
| | |
Hypothetical 5% Portfolio Return | | Class A | | Class B |
Beginning Account Value 7/1/05 | | $ | 1,000.00 | | $ | 1,000.00 |
Ending Account Value 12/31/05 | | $ | 1,021.17 | | $ | 1,019.06 |
Expenses Paid per $1,000* | | $ | 4.08 | | $ | 6.21 |
| * | Expenses are equal to the Portfolio’s annualized expense ratio for each share class, multiplied by the average account value over the period, multiplied by the number of days in the most recent six-month period, then divided by 365. |
| | | | | | |
Annualized Expense Ratios | | Class A | | | Class B | |
DWS Variable Series II — DWS Dreman Small Cap Value VIP | | .80 | % | | 1.22 | % |
For more information, please refer to the Portfolio’s prospectus.
These tables do not reflect charges and fees (“contract charges”) associated with the separate account that invests in the Portfolio or any variable life insurance policy or variable annuity contract for which the Portfolio is an investment option.
112
Management Summary December 31, 2005
DWS Dreman Small Cap Value VIP
Almost all measures of economic activity moved upward during 2005, although growth began to slow in the fourth quarter. Expressing concern about inflation, the US Federal Reserve Board (the Fed) continued to raise the federal funds rate1 during the year.
The Portfolio (Class A shares, unadjusted for contract charges) had a return of 10.25%, substantially outperforming its benchmark, the Russell 2000 Value Index, which returned 4.71%.
The decision that contributed most to performance was a significant overweight position in energy stocks, which benefited from rising oil prices. Energy holdings that performed especially well were Matrix Service Co., Grant Prideco Inc. and ATP Oil & Gas Corp. Additionally, the Portfolio’s performance relative to the Russell 2000 Value Index benefited from a restructuring during 2005 that reduced the energy weight in the Index, making our Portfolio comparatively more overweight in energy.
Performance benefited also from an overweight relative to our benchmark in materials. Our largest holding in this sector was also the best performing: Aleris International, Inc., an aluminum company that should benefit from growth of world economics.
Several holdings in the financial sector detracted from performance, most notably NovaStar Financial Inc., a real estate investment trust that invests in subprime mortgages. We continue to hold this stock, which we consider underpriced.
The small-cap market can be volatile, and this is especially true when there is so much uncertainty about interest rates, inflation and the direction of the economy. Based on our contrarian investment philosophy, we welcome opportunities to buy stocks of good companies with solid growth prospects at prices below what we see as their intrinsic value.
David N. Dreman
Nelson Woodard
Co-Managers
Dreman Value Management, L.L.C., Subadvisor to the Portfolio
All performance shown is historical, assumes reinvestment of all dividend and capital gain distributions, and does not guarantee future results. Investment return and principal value fluctuate with changing market conditions so that, when redeemed, shares may be worth more or less than their original cost. Current performance may be lower or higher than the performance data quoted. Please visit www.dws-scudder.com for the product’s most recent month-end performance. Performance doesn’t reflect charges and fees (“contract charges”) associated with the separate account that invests in the Portfolio or any variable life insurance policy or variable annuity contract for which the Portfolio is an investment option. These charges and fees will reduce returns.
Risk Considerations
This Portfolio is subject to stock market risk. Stocks of small companies involve greater risk than securities of larger, more-established companies, as they often have limited product lines, markets or financial resources and may be exposed to more erratic and abrupt market movements. The Portfolio may focus its investments on certain economic sectors, thereby increasing its vulnerability to any single economic, political, or regulatory development. This may result in greater share price volatility. Please read this Portfolio’s prospectus for specific details regarding this product's investments and risk profile.
The Russell 2000 Value Index is an unmanaged index that consists of those stocks in the Russell 2000 Index with lower price-to-book ratios and lower forecasted growth values.
Index returns assume reinvestment of dividends and, unlike portfolio returns, do not reflect any fees or expenses. It is not possible to invest directly into an index.
| 1 | Federal funds rate — the overnight rate charged by banks when they borrow money from each other. Set by the Federal Open Market Committee (FOMC), the fed funds rate is the most sensitive — and closely watched — indicator concerning the direction of short-term interest rates. The FOMC is a key committee within the US Federal Reserve System, and meets every six weeks to review Fed policy on short-term rates. Based on current Fed policy, the FOMC may choose to raise or lower the fed funds rate to either add liquidity to the economy or remove it. |
Portfolio management market commentary is as of December 31, 2005, and may not come to pass. This information is subject to change at any time based on market and other conditions.
113
Portfolio Summary
DWS Dreman Small Cap Value VIP
| | | | | | |
Asset Allocation | | 12/31/05 | | | 12/31/04 | |
Common Stocks | | 96 | % | | 95 | % |
Cash Equivalents | | 2 | % | | 3 | % |
Corporate Bonds | | 1 | % | | 1 | % |
Closed-End Investment Company | | 1 | % | | 1 | % |
| | | | | | |
| | 100 | % | | 100 | % |
| | | | | | |
| | | | | | |
Sector Diversification (As a % of Common Stocks) | | 12/31/05 | | | 12/31/04 | |
Industrials | | 25 | % | | 21 | % |
Financials | | 20 | % | | 28 | % |
Energy | | 16 | % | | 7 | % |
Health Care | | 9 | % | | 10 | % |
Materials | | 8 | % | | 10 | % |
Information Technology | | 8 | % | | 5 | % |
Utilities | | 8 | % | | 8 | % |
Consumer Discretionary | | 3 | % | | 6 | % |
Consumer Staples | | 3 | % | | 5 | % |
| | | | | | |
| | 100 | % | | 100 | % |
| | | | | | |
Asset allocation and sector diversification are subject to change.
For more complete details about the Portfolio’s investment portfolio, see page 98. A quarterly Fact Sheet is available upon request. Information concerning portfolio holdings of the Portfolio as of month end will be posted to www.dws-scudder.com on the 15th of the following month.
Following the Portfolio’s fiscal first and third quarter-end, a complete portfolio holdings listing is filed with the SEC on Form N-Q. The form will be available on the SEC’s Web site at www.sec.gov, and it also may be reviewed and copied at the SEC’s Public Reference Room in Washington, D.C. Information on the operation of the SEC’s Public Reference Room may be obtained by calling (800) SEC-0330.
114
Investment Portfolio December 31, 2005
DWS Dreman Small Cap Value VIP
| | | | |
| | | Shares | | Value ($) |
Common Stocks 94.7% | | | | |
Consumer Discretionary 2.5% | | | | |
Hotels Restaurants & Leisure 0.3% | | | | |
Alliance Gaming Corp.* | | 147,900 | | 1,925,658 |
| | | | |
Leisure Equipment & Products 0.4% | | | | |
Lakes Entertainment, Inc.* | | 308,700 | | 2,052,855 |
| | | | |
Specialty Retail 0.5% | | | | |
Mettler-Toledo International, Inc.* | | 55,400 | | 3,058,080 |
| | | | |
Textiles, Apparel & Luxury Goods 1.3% | | | | |
Phillips-Van Heusen Corp. | | 110,200 | | 3,570,480 |
Wolverine World Wide, Inc. | | 178,950 | | 4,019,217 |
| | | | |
| | | | 7,589,697 |
| | | | |
Consumer Staples 2.5% | | | | |
Food & Staples Retailing 0.0% | | | | |
Centerplate, Inc. (IDS) | | 20,700 | | 268,686 |
| | | | |
Food Products 1.9% | | | | |
Chiquita Brands International, Inc. | | 218,100 | | 4,364,181 |
Ralcorp Holdings, Inc.* | | 160,200 | | 6,393,582 |
| | | | |
| | | | 10,757,763 |
| | | | |
Tobacco 0.6% | | | | |
Universal Corp. | | 34,200 | | 1,482,912 |
Vector Group Ltd. | | 101,154 | | 1,837,968 |
| | | | |
| | | | 3,320,880 |
| | | | |
Energy 15.5% | | | | |
Energy Equipment & Services 7.3% | | | | |
Atwood Oceanics, Inc.* | | 15,500 | | 1,209,465 |
Cal Dive International, Inc.* | | 98,900 | | 3,549,521 |
Grant Prideco, Inc.* | | 178,400 | | 7,871,008 |
Grey Wolf, Inc.* | | 445,200 | | 3,441,396 |
Holly Corp. | | 45,300 | | 2,666,811 |
Matrix Service Co.* | | 159,200 | | 1,566,528 |
NS Group, Inc.* | | 24,800 | | 1,036,888 |
Offshore Logistics, Inc.* | | 53,500 | | 1,562,200 |
Oil States International, Inc.* | | 123,000 | | 3,896,640 |
Patterson-UTI Energy, Inc. | | 159,400 | | 5,252,230 |
RPC, Inc. | | 118,350 | | 3,117,339 |
Superior Energy Services, Inc.* | | 209,300 | | 4,405,765 |
Tidewater, Inc. | | 60,600 | | 2,694,276 |
| | | | |
| | | | 42,270,067 |
| | | | |
Oil, Gas & Consumable Fuels 8.2% | | | | |
ATP Oil & Gas Corp.* | | 88,500 | | 3,275,385 |
Bronco Drilling Co., Inc.* | | 45,800 | | 1,053,858 |
Carrizo Oil & Gas, Inc.* | | 150,700 | | 3,723,797 |
CNX Gas Corp. 144A* | | 111,900 | | 2,474,445 |
Compton Petroleum Corp.* | | 271,300 | | 3,990,907 |
Delta Petroleum Corp.* | | 111,600 | | 2,429,532 |
Denbury Resources, Inc.* | | 80,200 | | 1,826,956 |
Global Industries Ltd.* | | 247,700 | | 2,811,395 |
Parallel Petroleum Corp.* | | 117,400 | | 1,996,974 |
Petrohawk Energy Corp.* | | 485,500 | | 6,418,310 |
PetroQuest Energy, Inc.* | | 346,500 | | 2,869,020 |
Pioneer Drilling Co.* | | 273,100 | | 4,896,683 |
Quest Resource Corp.* | | 140,100 | | 1,849,320 |
Range Resources Corp. | | 187,600 | | 4,941,384 |
115
| | | | |
| | | Shares | | Value ($) |
Rosetta Resources, Inc. 144A* | | 130,700 | | 2,352,600 |
| | | | |
| | | | 46,910,566 |
| | | | |
Financials 18.6% | | | | |
Banks 3.2% | | | | |
AmericanWest Bancorp.* | | 26,200 | | 619,106 |
BankAtlantic Bancorp., Inc. “A” | | 91,000 | | 1,274,000 |
Centennial Bank Holdings, Inc.* | | 400,000 | | 4,948,000 |
International Bancshares Corp. | | 58,625 | | 1,721,230 |
NewAlliance Bancshares, Inc. | | 255,200 | | 3,710,608 |
PFF Bancorp., Inc. | | 81,500 | | 2,487,380 |
Provident Bankshares Corp. | | 49,350 | | 1,666,549 |
Sterling Financial Corp. | | 73,773 | | 1,842,850 |
| | | | |
| | | | 18,269,723 |
| | | | |
Diversified Financial Services 1.4% | | | | |
CBRE Realty Finance, Inc. 144A | | 200,000 | | 3,000,000 |
CMET Finance Holdings, Inc.* | | 7,200 | | 194,400 |
Commercial Capital Bancorp., Inc. | | 129,200 | | 2,211,904 |
Hercules Technology Growth Capital, Inc. | | 83,000 | | 995,170 |
NGP Capital Resources Co. | | 32,575 | | 427,710 |
Prospect Energy Corp. | | 80,256 | | 1,217,475 |
| | | | |
| | | | 8,046,659 |
| | | | |
Insurance 6.5% | | | | |
Amerisafe, Inc.* | | 225,500 | | 2,273,040 |
Arch Capital Group Ltd.* | | 82,200 | | 4,500,450 |
Aspen Insurance Holdings Ltd. | | 216,800 | | 5,131,656 |
Endurance Specialty Holdings Ltd. | | 93,600 | | 3,355,560 |
Meadowbrook Insurance Group, Inc.* | | 336,000 | | 1,962,240 |
Odyssey Re Holdings Corp. | | 120,600 | | 3,024,648 |
ProCentury Corp. | | 192,800 | | 2,072,600 |
Quanta Capital Holdings Ltd.* | | 312,500 | | 1,593,750 |
Selective Insurance Group, Inc. | | 131,200 | | 6,966,720 |
Specialty Underwriters’ Alliance, Inc.* | | 200,100 | | 1,232,616 |
Tower Group, Inc. | | 250,700 | | 5,510,386 |
| | | | |
| | | | 37,623,666 |
| | | | |
Real Estate 7.5% | | | | |
Capital Lease Funding, Inc. (REIT) | | 224,100 | | 2,359,773 |
Fieldstone Investment Corp. (REIT) | | 217,300 | | 2,577,178 |
Jer Investors Trust, Inc. (REIT)* | | 45,800 | | 776,310 |
KKR Financial Corp. (REIT) | | 491,150 | | 11,782,689 |
Newcastle Investment Corp. (REIT) | | 221,300 | | 5,499,305 |
NovaStar Financial, Inc. (REIT) | | 507,500 | | 14,265,825 |
Thomas Properties Group, Inc. (REIT) | | 229,100 | | 2,866,041 |
Vintage Wine Trust, Inc. (REIT) 144A | | 280,700 | | 2,807,000 |
| | | | |
| | | | 42,934,121 |
| | | | |
Health Care 8.6% | | | | |
Biotechnology 1.6% | | | | |
Charles River Laboratories International, Inc.* | | 143,300 | | 6,071,621 |
Serologicals Corp.* | | 165,300 | | 3,263,022 |
| | | | |
| | | | 9,334,643 |
| | | | |
116
| | | | |
| | | Shares | | Value ($) |
Health Care Equipment & Supplies 1.7% | | | | |
Kinetic Concepts, Inc.* | | 113,800 | | 4,524,688 |
Millipore Corp.* | | 35,200 | | 2,324,608 |
PerkinElmer, Inc. | | 108,400 | | 2,553,904 |
The Cooper Companies, Inc. | | 13,100 | | 672,030 |
| | | | |
| | | | 10,075,230 |
| | | | |
Health Care Providers & Services 4.3% | | | | |
Allied Healthcare International, Inc.* | | 439,000 | | 2,695,460 |
Hanger Orthopedic Group, Inc.* | | 263,100 | | 1,502,301 |
Kindred Healthcare, Inc.* | | 54,200 | | 1,396,192 |
LifePoint Hospitals, Inc.* | | 36,368 | | 1,363,800 |
Medco Health Solutions, Inc.* | | 45,718 | | 2,551,064 |
Odyssey HealthCare, Inc.* | | 255,200 | | 4,756,928 |
Option Care, Inc. | | 208,400 | | 2,784,224 |
Pediatrix Medical Group, Inc.* | | 46,700 | | 4,136,219 |
Triad Hospitals, Inc.* | | 84,500 | | 3,314,935 |
| | | | |
| | | | 24,501,123 |
| | | | |
Pharmaceuticals 1.0% | | | | |
Par Pharmaceutical Companies, Inc.* | | 140,900 | | 4,415,806 |
Perrigo Co. | | 90,000 | | 1,341,900 |
| | | | |
| | | | 5,757,706 |
| | | | |
Industrials 24.0% | | | | |
Aerospace & Defense 4.1% | | | | |
Applied Signal Technology, Inc. | | 94,723 | | 2,150,212 |
ARGON ST, Inc.* | | 78,100 | | 2,419,538 |
CAE, Inc. | | 628,800 | | 4,602,816 |
DRS Technologies, Inc. | | 87,300 | | 4,488,966 |
EDO Corp. | | 150,500 | | 4,072,530 |
Herley Industries, Inc.* | | 141,800 | | 2,341,118 |
K&F Industries Holdings, Inc.* | | 112,700 | | 1,731,072 |
Triumph Group, Inc.* | | 49,700 | | 1,819,517 |
| | | | |
| | | | 23,625,769 |
| | | | |
Building Products 0.7% | | | | |
Levitt Corp. “A” | | 99,000 | | 2,251,260 |
NCI Building Systems, Inc.* | | 44,900 | | 1,907,352 |
| | | | |
| | | | 4,158,612 |
| | | | |
Commercial Services & Supplies 2.7% | | | | |
Clean Harbors, Inc.* | | 67,000 | | 1,930,270 |
Covanta Holding Corp.* | | 269,400 | | 4,057,164 |
Duratek, Inc.* | | 324,100 | | 4,838,813 |
Nobel Learning Communities, Inc. | | 121,300 | | 1,145,072 |
WCA Waste Corp.* | | 469,700 | | 3,710,630 |
| | | | |
| | | | 15,681,949 |
| | | | |
Construction & Engineering 6.2% | | | | |
EMCOR Group, Inc.* | | 105,300 | | 7,110,909 |
Foster Wheeler Ltd.* | | 181,950 | | 6,692,121 |
Granite Construction, Inc. | | 76,300 | | 2,739,933 |
Perini Corp.* | | 62,700 | | 1,514,205 |
URS Corp.* | | 187,800 | | 7,063,158 |
Walter Industries, Inc. | | 111,900 | | 5,563,668 |
Washington Group International, Inc.* | | 92,200 | | 4,883,834 |
| | | | |
| | | | 35,567,828 |
| | | | |
Electrical Equipment 2.7% | | | | |
General Cable Corp.* | | 534,600 | | 10,531,620 |
Genlyte Group, Inc.* | | 52,000 | | 2,785,640 |
117
| | | | |
| | | Shares | | Value ($) |
Thomas & Betts Corp.* | | 45,900 | | 1,925,964 |
| | | | |
| | | | 15,243,224 |
| | | | |
Industrial Conglomerates 0.2% | | | | |
ESCO Technologies, Inc.* | | 24,200 | | 1,076,658 |
| | | | |
| | |
Machinery 3.8% | | | | |
Harsco Corp. | | 75,400 | | 5,090,254 |
Oshkosh Truck Corp. | | 75,800 | | 3,379,922 |
Terex Corp.* | | 107,800 | | 6,403,320 |
Valmont Industries | | 98,700 | | 3,302,502 |
Watts Water Technologies, Inc. “A” | | 115,900 | | 3,510,611 |
| | | | |
| | | | 21,686,609 |
| | | | |
Marine 0.9% | | | | |
GulfMark Offshore, Inc.* | | 81,000 | | 2,399,220 |
Hornbeck Offshore Services, Inc.* | | 84,500 | | 2,763,150 |
| | | | |
| | | | 5,162,370 |
| | | | |
Road & Rail 1.6% | | | | |
Genesee & Wyoming, Inc.* | | 130,350 | | 4,894,643 |
Laidlaw International, Inc. | | 174,900 | | 4,062,927 |
| | | | |
| | | | 8,957,570 |
| | | | |
Trading Companies & Distributors 1.1% | | | | |
Aviall, Inc.* | | 59,000 | | 1,699,200 |
WESCO International, Inc.* | | 114,700 | | 4,901,131 |
| | | | |
| | | | 6,600,331 |
| | | | |
Information Technology 7.5% | | | | |
Computers & Peripherals 0.9% | | | | |
Komag, Inc.* | | 154,500 | | 5,354,970 |
| | | | |
| | |
Electronic Equipment & Instruments 3.5% | | | | |
Aeroflex, Inc.* | | 400,900 | | 4,309,675 |
Anixter International, Inc. | | 165,100 | | 6,458,712 |
Plexus Corp.* | | 238,700 | | 5,428,038 |
Scansource, Inc.* | | 73,300 | | 4,008,044 |
| | | | |
| | | | 20,204,469 |
| | | | |
IT Consulting & Services 1.1% | | | | |
CACI International, Inc. “A”* | | 47,600 | | 2,731,288 |
Covansys Corp.* | | 245,900 | | 3,346,699 |
| | | | |
| | | | 6,077,987 |
| | | | |
Semiconductors & Semiconductor Equipment 0.5% | | | | |
MKS Instruments, Inc.* | | 90,600 | | 1,620,834 |
OmniVision Technologies, Inc.* | | 73,400 | | 1,465,064 |
| | | | |
| | | | 3,085,898 |
| | | | |
Software 1.5% | | | | |
InPhonic, Inc.* | | 375,900 | | 3,266,571 |
Sonic Solutions* | | 220,500 | | 3,331,755 |
TIBCO Software, Inc.* | | 255,400 | | 1,907,838 |
| | | | |
| | | | 8,506,164 |
| | | | |
Materials 8.1% | | | | |
Chemicals 0.5% | | | | |
Georgia Gulf Corp. | | 48,400 | | 1,472,328 |
NOVA Chemicals Corp. | | 39,400 | | 1,315,960 |
| | | | |
| | | | 2,788,288 |
| | | | |
Construction Materials 1.2% | | | | |
Florida Rock Industries, Inc. | | 95,242 | | 4,672,573 |
Headwaters, Inc.* | | 55,000 | | 1,949,200 |
| | | | |
| | | | 6,621,773 |
| | | | |
118
| | | | |
| | | Shares | | Value ($) |
Metals & Mining 6.4% | | | | |
Aleris International, Inc.* | | 169,100 | | 5,451,784 |
Goldcorp, Inc. | | 110,550 | | 2,463,054 |
Metal Management, Inc. | | 76,300 | | 1,774,738 |
Northwest Pipe Co.* | | 115,400 | | 3,092,720 |
Oregon Steel Mills, Inc.* | | 325,400 | | 9,573,268 |
Pan American Silver Corp.* | | 202,500 | | 3,813,075 |
RTI International Metals, Inc.* | | 193,900 | | 7,358,505 |
Uranium Resources, Inc.* | | 1,921,700 | | 1,268,322 |
Worthington Industries, Inc. | | 118,700 | | 2,280,227 |
| | | | |
| | | | 37,075,693 |
| | | | |
Telecommunication Services 0.2% | | | | |
Diversified Telecommunication Services | | | | |
Alaska Communications Systems Group, Inc. | | 133,400 | | 1,355,344 |
| | | | |
| | |
Utilities 7.2% | | | | |
Electric Utilities 1.5% | | | | |
Allegheny Energy, Inc.* | | 181,700 | | 5,750,805 |
Sierra Pacific Resources* | | 229,300 | | 2,990,072 |
| | | | |
| | | | 8,740,877 |
| | | | |
Gas Utilities 2.3% | | | | |
ONEOK, Inc. | | 128,200 | | 3,413,966 |
Southern Union Co.* | | 417,375 | | 9,862,571 |
| | | | |
| | | | 13,276,537 |
| | | | |
Independent Power Producers & Energy Traders 1.1% | | | | |
Dynegy, Inc. “A”* | | 1,244,900 | | 6,025,316 |
| | | | |
Multi-Utilities 2.3% | | | | |
CMS Energy Corp.* | | 106,200 | | 1,540,962 |
Ormat Technologies, Inc. | | 213,800 | | 5,588,732 |
TECO Energy, Inc. | | 172,000 | | 2,954,960 |
WPS Resources Corp. | | 54,700 | | 3,025,457 |
| | | | |
| | | | 13,110,111 |
| | | | |
Total Common Stocks (Cost $424,198,462) | | | | 544,681,470 |
| | | | |
| | |
| | | Principal Amount ($) | | Value ($) |
Corporate Bonds 1.3% | | | | |
Utilities | | | | |
Mirant Corp., 144A, 7.9%, 7/15/2009* (Cost $3,522,500) | | 6,000,000 | | 7,560,000 |
| | | | |
| | |
| | | Shares | | Value ($) |
Closed End Investment Company 0.6% | | | | |
Tortoise Energy Infrastructure Corp. (Cost $3,297,205) | | 132,100 | | 3,570,663 |
| | | | |
| | |
Exchange Traded Funds 0.1% | | | | |
PowerShares Lux Nanotech Portfolio (Cost $289,198) | | 18,200 | | 298,480 |
| | | | |
| | |
Cash Equivalents 1.9% | | | | |
Cash Management QP Trust, 4.26% (a) (Cost $11,160,666) | | 11,160,666 | | 11,160,666 |
| | | | |
| | |
| | | % of Net Assets | | Value ($) |
Total Investment Portfolio (Cost $442,468,031)+ | | 98.6 | | 567,271,279 |
| | | | |
Other Assets and Liabilities, Net | | 1.4 | | 8,052,007 |
| | | | |
Net Assets | | 100.0 | | 575,323,286 |
| | | | |
119
Notes to DWS Dreman Small Cap Value VIP Portfolio of Investments
| * | Non-income producing security. In the case of a bond, generally denotes that the issuer has defaulted on the payment of principal or the interest or has filed for bankruptcy. The following table represents bonds that are in default: |
| | | | | | | | | | | | | |
Security | | Coupon | | | Maturity Date | | Principal Amount | | Acquisition Cost ($) | | Value ($) |
Mirant Corp. | | 7.9 | % | | 7/15/2009 | | 6,000,000 | | USD | | 3,522,500 | | 7,560,000 |
| + | The cost for federal income tax purposes was $442,359,125. At December 31, 2005, net unrealized appreciation for all securities based on tax cost was $124,912,154. This consisted of aggregate gross unrealized appreciation for all securities in which there was an excess of value over tax cost of $141,555,434 and aggregate gross unrealized depreciation for all securities in which there was an excess of tax cost over value of $16,643,280. |
| (a) | Cash Management QP Trust, an affiliated fund, is managed by Deutsche Investment Management Americas Inc. The rate shown is the annualized seven-day yield at period end. |
144A: Security exempt from registration under Rule 144A of the Securities Act of 1933. These securities may be resold in transactions exempt from registration, normally to qualified institutional buyers.
IDS: Income Deposit Security
REIT: Real Estate Investment Trust
The accompanying notes are an integral part of the financial statements.
120
Financial Statements
Statement of Assets and Liabilities
as of December 31, 2005
| | | | |
| Assets | | | | |
Investments: | | | | |
Investments in securities, at value (cost $431,307,365) | | $ | 556,110,613 | |
Investment in Cash Management QP Trust (cost $11,160,666) | | | 11,160,666 | |
Total investments in securities, at value (cost $442,468,031) | | | 567,271,279 | |
Cash | | | 5,254 | |
Receivable for investments sold | | | 9,074,553 | |
Dividends receivable | | | 1,158,901 | |
Interest receivable | | | 45,633 | |
Receivable for Portfolio shares sold | | | 57,536 | |
Other assets | | | 18,218 | |
| | | | |
Total assets | | | 577,631,374 | |
| | | | |
| Liabilities | | | | |
Payable for investments purchased | | | 902,025 | |
Payable for Portfolio shares redeemed | | | 892,732 | |
Accrued management fee | | | 359,425 | |
Other accrued expenses and payables | | | 153,906 | |
| | | | |
Total liabilities | | | 2,308,088 | |
| | | | |
| Net assets, at value | | $ | 575,323,286 | |
| | | | |
| Net Assets | | | | |
Net assets consist of: | | | | |
Undistributed net investment income | | | 4,399,454 | |
Net unrealized appreciation (depreciation) on: | | | | |
Investments | | | 124,803,248 | |
Foreign currency related transactions | | | (42 | ) |
Accumulated net realized gain (loss) | | | 48,528,735 | |
Paid-in capital | | | 397,591,891 | |
| | | | |
Net assets, at value | | $ | 575,323,286 | |
| | | | |
Class A | | | | |
Net Asset Value, offering and redemption price per share ($492,551,412 ÷ 24,658,095 outstanding shares of beneficial interest, $.01 par value, unlimited number of shares authorized) | | $ | 19.98 | |
| | | | |
| Class B | | | | |
Net Asset Value, offering and redemption price per share ($82,771,874 ÷ 4,153,458 outstanding shares of beneficial interest, $.01 par value, unlimited number of shares authorized) | | $ | 19.93 | |
| | | | |
121
Statement of Operations
for the year ended December 31, 2005
| | | | |
Investment Income | | | |
Income: | | | | |
Dividends (net of foreign taxes withheld of $16,836) | | $ | 8,938,438 | |
Interest — Cash Management QP Trust | | | 603,541 | |
Total Income | | | 9,541,979 | |
Expenses: | | | | |
Management fee | | | 4,088,038 | |
Custodian fees | | | 27,349 | |
Distribution service fees (Class B) | | | 189,044 | |
Record keeping fees (Class B) | | | 109,304 | |
Auditing | | | 45,604 | |
Legal | | | 18,696 | |
Trustees’ fees and expenses | | | 24,273 | |
Reports to shareholders | | | 110,024 | |
Other | | | 31,290 | |
Total expenses before expense reductions | | | 4,643,622 | |
Expense reductions | | | (8,754 | ) |
Total expenses after expense reductions | | | 4,634,868 | |
| | | | |
Net investment income (loss) | | | 4,907,111 | |
| | | | |
| Realized and Unrealized Gain (Loss) on Investment Transactions | | | | |
Net realized gain (loss) from: | | | | |
Investments | | | 48,534,540 | |
Foreign currency related transactions | | | 231 | |
| | | 48,534,771 | |
Net unrealized appreciation (depreciation) during the period on: | | | | |
Investments | | | 198,766 | |
Foreign currency related transactions | | | 26 | |
| | | 198,792 | |
Net gain (loss) on investment transactions | | | 48,733,563 | |
| | | | |
Net increase (decrease) in net assets resulting from operations | | $ | 53,640,674 | |
| | | | |
The accompanying notes are an integral part of the financial statements.
122
Statement of Changes in Net Assets
| | | | | | | | |
| | | Years Ended December 31, | |
Increase (Decrease) in Net Assets | | 2005 | | | 2004 | |
Operations: | | | | | | | | |
Net investment income (loss) | | $ | 4,907,111 | | | $ | 4,034,360 | |
Net realized gain (loss) on investment transactions | | | 48,534,771 | | | | 63,112,019 | |
Net unrealized appreciation (depreciation) during the period on investment transactions | | | 198,792 | | | | 38,864,967 | |
| | | | | | | | |
Net increase (decrease) in net assets resulting from operations | | | 53,640,674 | | | | 106,011,346 | |
| | | | | | | | |
Distributions to shareholders from: | | | | | | | | |
Net investment income: | | | | | | | | |
| Class A | | | (3,388,867 | ) | | | (3,405,170 | ) |
| Class B | | | (268,871 | ) | | | (212,277 | ) |
Distributions to shareholders from: | | | | | | | | |
Net realized gains: | | | | | | | | |
| Class A | | | (41,035,260 | ) | | | — | |
| Class B | | | (6,476,182 | ) | | | — | |
Portfolio share transactions: | | | | | | | | |
| Class A | | | | | | | | |
Proceeds from shares sold | | | 48,442,270 | | | | 64,900,813 | |
Reinvestment of distributions | | | 44,424,127 | | | | 3,405,170 | |
Cost of shares redeemed | | | (69,095,690 | ) | | | (45,290,684 | ) |
| | | | | | | | |
Net increase (decrease) in net assets from Class A share transactions | | | 23,770,707 | | | | 23,015,299 | |
| | | | | | | | |
| Class B | | | | | | | | |
Proceeds from shares sold | | | 12,290,754 | | | | 29,315,151 | |
Reinvestment of distributions | | | 6,745,052 | | | | 212,277 | |
Cost of shares redeemed | | | (7,563,486 | ) | | | (3,011,503 | ) |
Net increase (decrease) in net assets from Class B share transactions | | | 11,472,320 | | | | 26,515,925 | |
Increase (decrease) in net assets | | | 37,714,521 | | | | 151,925,123 | |
Net assets at beginning of period | | | 537,608,765 | | | | 385,683,642 | |
| | | | | | | | |
Net assets at end of period (including undistributed net investment income of $4,399,454 and $3,681,177, respectively) | | $ | 575,323,286 | | | $ | 537,608,765 | |
| | | | | | | | |
| Other Information | | | | | | | | |
Class A Shares outstanding at beginning of period | | | 23,288,245 | | | | 22,038,819 | |
Shares sold | | | 2,554,460 | | | | 3,660,918 | |
Shares issued to shareholders in reinvestment of distributions | | | 2,463,900 | | | | 197,059 | |
Shares redeemed | | | (3,648,510 | ) | | | (2,608,551 | ) |
Net increase (decrease) in Class A shares | | | 1,369,850 | | | | 1,249,426 | |
| | | | | | | | |
Shares outstanding at end of period | | | 24,658,095 | | | | 23,288,245 | |
| | | | | | | | |
| Class B | | | | | | | | |
Shares outstanding at beginning of period | | | 3,531,644 | | | | 1,977,912 | |
Shares sold | | | 641,746 | | | | 1,706,542 | |
Shares issued to shareholders in reinvestment of distributions | | | 373,894 | | | | 12,277 | |
Shares redeemed | | | (393,826 | ) | | | (165,087 | ) |
Net increase (decrease) in Class B shares | | | 621,814 | | | | 1,553,732 | |
| | | | | | | | |
Shares outstanding at end of period | | | 4,153,458 | | | | 3,531,644 | |
| | | | | | | | |
The accompanying notes are an integral part of the financial statements.
123
Financial Highlights
| | | | | | | | | | | | | | | | | | | |
| Class A | | | | | | | | | | | | | | | | | | | |
| | | | | |
Years Ended December 31, | | 2005 | | | 2004 | | | 2003 | | | 2002 | | | 2001 |
| Selected Per Share Data | | | | | | | | | | | | | | | | | | | |
Net asset value, beginning of period | | $ | 20.05 | | | $ | 16.06 | | | $ | 11.66 | | | $ | 13.21 | | | $ | 11.23 |
| | | | | | | | | | | | | | | | | | | |
Income (loss) from investment operations: | | | | | | | | | | | | | | | | | | | |
Net investment income (loss)a | | | .19 | | | | .17 | | | | .19 | | | | .17 | | | | .09 |
Net realized and unrealized gain (loss) on investment transactions | | | 1.67 | | | | 3.98 | | | | 4.55 | | | | (1.67 | ) | | | 1.89 |
| Total from investment operations | | | 1.86 | | | | 4.15 | | | | 4.74 | | | | (1.50 | ) | | | 1.98 |
Less distributions from: | | | | | | | | | | | | | | | | | | | |
Net investment income | | | (.15 | ) | | | (.16 | ) | | | (.15 | ) | | | (.05 | ) | | | — |
Net realized gain on investment transactions | | | (1.78 | ) | | | — | | | | (.19 | ) | | | — | | | | — |
| Total distributions | | | (1.93 | ) | | | (.16 | ) | | | (.34 | ) | | | (.05 | ) | | | — |
| | | | | | | | | | | | | | | | | | | |
Net asset value, end of period | | $ | 19.98 | | | $ | 20.05 | | | $ | 16.06 | | | $ | 11.66 | | | $ | 13.21 |
| | | | | | | | | | | | | | | | | | | |
Total Return (%) | | | 10.25 | | | | 26.03 | | | | 42.15 | | | | (11.43 | ) | | | 17.63 |
| Ratios to Average Net Assets and Supplemental Data | | | | | | | | | | | | | | | | | | | |
Net assets, end of period ($ millions) | | | 493 | | | | 467 | | | | 354 | | | | 250 | | | | 194 |
Ratio of expenses (%) | | | .79 | | | | .79 | | | | .80 | | | | .81 | | | | .79 |
Ratio of net investment income (%) | | | .96 | | | | .96 | | | | 1.46 | | | | 1.28 | | | | .77 |
Portfolio turnover rate (%) | | | 61 | | | | 73 | | | | 71 | | | | 86 | | | | 57 |
a Based on average shares outstanding during the period. | | | | | | | | | | | | | | | | | | | |
| | | | | | | | | | | | | | | | |
| Class B | | | | | | | | | | | | | | | | |
| | | | |
Years Ended December 31, | | 2005 | | | 2004 | | | 2003 | | | 2002a | |
| Selected Per Share Data | | | | | | | | | | | | | | | | |
Net asset value, beginning of period | | $ | 20.01 | | | $ | 16.03 | | | $ | 11.65 | | | $ | 13.86 | |
| | | | | | | | | | | | | | | | |
Income (loss) from investment operations: | | | | | | | | | | | | | | | | |
Net investment income (loss)b | | | .11 | | | | .10 | | | | .13 | | | | .17 | |
Net realized and unrealized gain (loss) on investment transactions | | | 1.66 | | | | 3.97 | | | | 4.56 | | | | (2.38 | ) |
| Total from investment operations | | | 1.77 | | | | 4.07 | | | | 4.69 | | | | (2.21 | ) |
Less distributions from: | | | | | | | | | | | | | | | | |
Net investment income | | | (.07 | ) | | | (.09 | ) | | | (.12 | ) | | | — | |
Net realized gain on investment transactions | | | (1.78 | ) | | | — | | | | (.19 | ) | | | — | |
| Total distributions | | | (1.85 | ) | | | (.09 | ) | | | (.31 | ) | | | — | |
| | | | | | | | | | | | | | | | |
Net asset value, end of period | | $ | 19.93 | | | $ | 20.01 | | | $ | 16.03 | | | $ | 11.65 | |
| | | | | | | | | | | | | | | | |
Total Return (%) | | | 9.78 | | | | 25.52 | | | | 41.65 | | | | (15.95 | )** |
| Ratios to Average Net Assets and Supplemental Data | | | | | | | | | | | | | | | | |
Net assets, end of period ($ millions) | | | 83 | | | | 71 | | | | 32 | | | | 1 | |
Ratio of expenses (%) | | | 1.19 | | | | 1.16 | | | | 1.19 | | | | 1.06 | * |
Ratio of net investment income (%) | | | .56 | | | | .59 | | | | 1.07 | | | | 3.01 | * |
Portfolio turnover rate (%) | | | 61 | | | | 73 | | | | 71 | | | | 86 | |
| a | For the period from July 1, 2002 (commencement of operations of Class B shares) to December 31, 2002. |
| b | Based on average shares outstanding during the period. |
124
Performance Summary December 31, 2005
DWS Global Thematic VIP
All performance shown is historical, assumes reinvestment of all dividend and capital gain distributions and does not guarantee future results. Investment return and principal value fluctuate with changing market conditions so that, when redeemed, shares may be worth more or less than their original cost. Current performance may be lower or higher than the performance data quoted. Please visit www.dws-scudder.com for the Portfolio’s most recent month-end performance. Performance doesn’t reflect charges and fees (“contract charges”) associated with the separate account that invests in the Portfolio or any variable life insurance policy or variable annuity contract for which the Portfolio is an investment option. These charges and fees will reduce returns. While all share classes have the same underlying portfolio, their performance will differ.
This Portfolio is subject to stock market risk, meaning stocks in the portfolio may decline in value for extended periods of time due to the activities and financial prospects of individual companies, or due to general market and economic conditions. Additionally, investing in foreign securities presents certain unique risks not associated with domestic investments, such as currency fluctuation, political and economic changes and market risks. This may result in greater share price volatility. Please read this Portfolio’s prospectus for specific details regarding its investments and risk profile.
Portfolio returns shown for all periods reflect a fee waiver and/or expense reimbursement. Without this waiver/reimbursement, returns would have been lower.
Please keep in mind that high double-digit returns were primarily achieved during favorable market conditions. Investors should not expect that such favorable returns can be consistently achieved. A Portfolio’s performance, especially for very short time periods, should not be the sole factor in making your investment decision.
Growth of an Assumed $10,000 Investment in DWS Global Thematic VIP from 5/5/1998 to 12/31/2005
¨ DWS Global Thematic VIP — Class A
¨ MSCI World Index
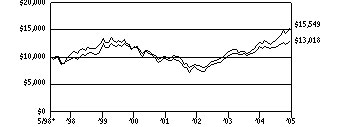
Yearly periods ended December 31
The Morgan Stanley Capital International (MSCI) World Index is an unmanaged capitalization weighted measure of global stock markets including the US, Canada, Europe, Australia and the Far East. The index is calculated using closing local market prices and converts to US dollars using the London close foreign exchange rates. Index returns assume reinvested dividends and, unlike Portfolio returns, do not reflect any fees or expenses. It is not possible to invest directly into an index.
Comparative Results
| | | | | | | | | | | | | | | | | | |
DWS Global Thematic VIP | | 1-Year | | | 3-Year | | | 5-Year | | | Life of Portfolio* | |
Class A | | Growth of $10,000 | | $ | 12,294 | | | $ | 18,220 | | | $ | 12,972 | | | $ | 15,549 | |
| | Average annual total return | | | 22.94 | % | | | 22.14 | % | | | 5.34 | % | | | 5.94 | % |
MSCI World Index | | Growth of $10,000 | | $ | 10,949 | | | $ | 16,719 | | | $ | 11,141 | | | $ | 13,018 | |
| | Average annual total return | | | 9.49 | % | | | 18.69 | % | | | 2.18 | % | | | 3.50 | % |
| | | | |
DWS Global Thematic VIP | | | | | 1-Year | | | 3-Year | | | Life of Class** | |
Class B | | Growth of $10,000 | | | | | | $ | 12,250 | | | $ | 18,062 | | | $ | 16,211 | |
| | Average annual total return | | | | | | | 22.50 | % | | | 21.78 | % | | | 14.81 | % |
MSCI World Index | | Growth of $10,000 | | | | | | $ | 10,949 | | | $ | 16,719 | | | $ | 14,689 | |
| | Average annual total return | | | | | | | 9.49 | % | | | 18.69 | % | | | 11.61 | % |
The growth of $10,000 is cumulative.
| * | The Portfolio commenced operations on May 5, 1998. Index returns begin April 30, 1998. |
| ** | The Portfolio commenced offering Class B shares on July 1, 2002. Index returns begin June 30, 2002. |
125
Information About Your Portfolio’s Expenses
DWS Global Thematic VIP
As an investor of the Portfolio, you incur two types of costs: ongoing expenses and transaction costs. Ongoing expenses include management fees, distribution and service (12b-1) fees and other Portfolio expenses. Examples of transaction costs include sales charges (loads), redemption fees and account maintenance fees, which are not shown in this section. The following tables are intended to help you understand your ongoing expenses (in dollars) of investing in the Portfolio and to help you compare these expenses with the ongoing expenses of investing in other mutual funds. In the most recent six-month period, the Portfolio limited these expenses; had it not done so, expenses would have been higher. The tables are based on an investment of $1,000 made at the beginning of the six-month period ended December 31, 2005.
The tables illustrate your Portfolio’s expenses in two ways:
Actual Portfolio Return. This helps you estimate the actual dollar amount of ongoing expenses (but not transaction costs) paid on a $1,000 investment in the Portfolio using the Portfolio’s actual return during the period. To estimate the expenses you paid over the period, simply divide your account value by $1,000 (for example, an $8,600 account value divided by $1,000 = 8.6), then multiply the result by the number in the “Expenses Paid per $1,000” line under the share class you hold.
Hypothetical 5% Portfolio Return. This helps you to compare your Portfolio’s ongoing expenses (but not transaction costs) with those of other mutual funds using the Portfolio’s actual expense ratio and a hypothetical rate of return of 5% per year before expenses. Examples using a 5% hypothetical Portfolio return may be found in the shareholder reports of other mutual funds. The hypothetical account values and expenses may not be used to estimate the actual ending account balance or expenses you paid for the period.
Please note that the expenses shown in these tables are meant to highlight your ongoing expenses only and do not reflect any transaction costs. The “Expenses Paid per $1,000” line of the tables is useful in comparing ongoing expenses only and will not help you determine the relative total expense of owning different funds. If these transaction costs had been included, your costs would have been higher.
Expenses and Value of a $1,000 Investment for the six months ended December 31, 2005
| | | | | | |
Actual Portfolio Return | | Class A | | Class B |
Beginning Account Value 7/1/05 | | $ | 1,000.00 | | $ | 1,000.00 |
Ending Account Value 12/31/05 | | $ | 1,196.40 | | $ | 1,193.50 |
Expenses Paid per $1,000* | | $ | 6.53 | | $ | 8.68 |
| | |
Hypothetical 5% Portfolio Return | | Class A | | Class B |
Beginning Account Value 7/1/05 | | $ | 1,000.00 | | $ | 1,000.00 |
Ending Account Value 12/31/05 | | $ | 1,019.16 | | $ | 1,017.29 |
Expenses Paid per $1,000* | | $ | 6.01 | | $ | 7.98 |
| * | Expenses are equal to the Portfolio’s annualized expense ratio for each share class, multiplied by the average account value over the period, multiplied by the number of days in the most recent six-month period, then divided by 365. |
| | | | | | |
Annualized Expense Ratios | | Class A | | | Class B | |
DWS Variable Series II — DWS Global Thematic VIP | | 1.18 | % | | 1.57 | % |
For more information, please refer to the Portfolio’s prospectus.
These tables do not reflect charges and fees (“contract charges”) associated with the separate account that invests in the portfolio or any variable life insurance policy or variable annuity contract for which the portfolio is an investment option.
126
Management Summary December 31, 2005
DWS Global Thematic VIP
The Portfolio’s 22.94% return (Class A shares, unadjusted for contract charges) outpaced both the 9.49% gain of the MSCI World Index and the 11.54% return of funds in Lipper’s Global Core category. DWS Global Thematic VIP ranked first among the 31 funds in its peer group in 2005. The Portfolio ranked 16 of 51 funds in the category for the three-year period ended December 31, 2005 and three of 22 funds in the category for the five-year period ended December 31, 2005. We believe this is a validation of our approach, which invests in fundamentally sound companies that we believe will benefit from longer-term themes in the world economy.
The top performing theme in 2005 was ultimate subcontractors, where most holdings are leveraged to oil and gas. Here, the strongest performers were the Russian oil companies LUKOIL (ADR) and OAO Gazprom (ADR) (REG S). Supply chain dominance, a theme incorporating companies that are becoming the leading partners for both suppliers and customers within their respective industries, made the second-largest contribution to performance. In terms of countries, we generated the best performance in the US, where a top contributor was the agro/biotech firm Monsanto Co., and in Japan, where our holdings in financials and real estate companies were boosted by investors’ hope for an end to deflation. Aside from energy, the sector in which our stock selection was strongest was financials, where Commerzbank AG (Germany) and Capitalia SpA (Italy) both benefited from restructuring initiatives. Notable detractors included William Morrison Supermarkets PLC and MFI Furniture Group PLC.
Instead of focusing on economic cycles and/or the direction of the financial markets, which we do not believe can be accurately predicted, we will continue attempting to identify the large inefficiencies and changes affecting the world economy.
Oliver Kratz
Lead Portfolio Manager
Deutsche Investment Management Americas Inc.
All performance shown is historical, assumes reinvestment of all dividend and capital gain distributions, and does not guarantee future results. Investment return and principal value fluctuate with changing market conditions so that, when redeemed, shares may be worth more or less than their original cost. Current performance may be lower or higher than the performance data quoted. Please visit www.dws-scudder.com for the product’s most recent month-end performance. Performance doesn’t reflect charges and fees (“contract charges”) associated with the separate account that invests in the Portfolio or any variable life insurance policy or variable annuity contract for which the Portfolio is an investment option. These charges and fees will reduce returns.
Risk Considerations
This Portfolio is subject to stock market risk, meaning stocks in the Portfolio may decline in value for extended periods of time due to the activities and financial prospects of individual companies, or due to general market and economic conditions. Additionally, investing in foreign securities presents certain unique risks not associated with domestic investments, such as currency fluctuation, political and economic changes and market risks. This may result in greater share price volatility. Please read this Portfolio’s prospectus for specific details regarding its investments and risk profile.
The Morgan Stanley Capital International (MSCI) World Index is an unmanaged, capitalization-weighted measure of global stock markets around the world, including North America, Europe, Australia and the Far East. The index is calculated using closing local market prices and converts to US dollars using the London close foreign exchange rates. Index returns assume reinvestment of dividends and, unlike portfolio returns, do not reflect any fees or expenses. It is not possible to invest directly into an index.
The Lipper Global Core category includes funds that, by portfolio practice, invest at least 75% of their equity assets in companies both inside and outside of the U.S. with market capitalizations (on a three-year weighted basis) greater than the 500th-largest company in the S&P/Citigroup World Broad Market Index. Large-cap core funds typically have an average price-to-cash flow sets in ratio, price-to-book ratio, and three-year sales-per-share growth value compared to the S&P/Citigroup World BMI. It is not possible to invest directly into a Lipper category.
Source: Lipper Inc. Rankings are historical and do not guarantee future results. Rankings are based on the Portfolio’s total return unadjusted for contract charges with distributions reinvested. If contract charges had been included, results might have been less favorable. Rankings are for Class A shares; other share classes may vary.
Lipper figures represent the average of the total returns reported by all of the mutual funds designated by Lipper, Inc. as falling into the category indicated.
Portfolio management market commentary is as of December 31, 2005, and may not come to pass. This information is subject to change at any time based on market and other conditions.
127
Portfolio Summary
DWS Global Thematic VIP
| | | | | | |
Asset Allocation (Excludes Securities Lending Collateral) | | 12/31/05 | | | 12/31/04 | |
Common Stocks | | 91 | % | | 89 | % |
Cash Equivalents | | 5 | % | | 8 | % |
Preferred Stocks | | 2 | % | | 1 | % |
Exchange Traded Funds | | 2 | % | | 2 | % |
| | | | | | |
| | 100 | % | | 100 | % |
| | | | | | |
| | |
Sector Diversification (As a % of Common and Preferred Stocks) | | 12/31/05 | | | 12/31/04 | |
Financials | | 28 | % | | 21 | % |
Energy | | 12 | % | | 13 | % |
Materials | | 11 | % | | 16 | % |
Information Technology | | 10 | % | | 11 | % |
Industrials | | 9 | % | | 12 | % |
Health Care | | 9 | % | | 9 | % |
Consumer Staples | | 8 | % | | 3 | % |
Consumer Discretionary | | 7 | % | | 6 | % |
Telecommunication Services | | 4 | % | | 2 | % |
Utilities | | 2 | % | | 7 | % |
| | | | | | |
| | 100 | % | | 100 | % |
| | | | | | |
| | |
Geographical Diversification (As a % of Common and Preferred Stocks) | | 12/31/05 | | | 12/31/04 | |
Continental Europe | | 27 | % | | 30 | % |
United States | | 22 | % | | 28 | % |
Asia (excluding Japan) | | 21 | % | | 13 | % |
Japan | | 9 | % | | 11 | % |
United Kingdom | | 7 | % | | 7 | % |
Latin America | | 4 | % | | 3 | % |
Canada | | 3 | % | | 6 | % |
Africa | | 2 | % | | 2 | % |
Middle East | | 2 | % | | — | |
Bermuda | | 2 | % | | — | |
Australia | | 1 | % | | — | |
| | | | | | |
| | 100 | % | | 100 | % |
| | | | | | |
Asset allocation, sector diversification and geographical diversification are subject to change.
For more complete details about the Portfolio’s investment portfolio, see page 109. A quarterly Fact Sheet is available upon request. Information concerning portfolio holdings of the Portfolio as of month end will be posted to www.dws-scudder.com on the 15th of the following month.
Following the Portfolio’s fiscal first and third quarter-end, a complete portfolio holdings listing is filed with the SEC on Form N-Q. The form will be available on the SEC’s Web site at www.sec.gov, and it also may be reviewed and copied at the SEC’s Public Reference Room in Washington, D.C. Information on the operation of the SEC’s Public Reference Room may be obtained by calling (800) SEC-0330.
128
Investment Portfolio December 31, 2005
DWS Global Thematic VIP
| | | | |
| | | Shares | | Value ($) |
| | | | |
Common Stocks 91.2% | | | | |
Australia 0.6% | | | | |
Macquarie Airports (Cost $699,143) | | 276,100 | | 641,636 |
| | | | |
Austria 0.4% | | | | |
Erste Bank der Oesterreichischen Sparkassen AG (Cost $292,505) | | 6,600 | | 366,260 |
| | | | |
Bermuda 1.7% | | | | |
Credicorp Ltd. | | 26,800 | | 610,772 |
Tyco International Ltd. | | 40,850 | | 1,178,931 |
| | | | |
(Cost $1,863,011) | | | | 1,789,703 |
| | | | |
Brazil 0.6% | | | | |
Natura Cosmeticos SA | | 2,800 | | 123,314 |
Tractebel Energia SA | | 25,400 | | 163,482 |
Votorantim Celulose e Papel SA (ADR) (a) | | 30,800 | | 378,532 |
| | | | |
(Cost $637,749) | | | | 665,328 |
| | | | |
Canada 3.0% | | | | |
Canadian National Railway Co. | | 17,200 | | 1,378,130 |
EnCana Corp. | | 16,550 | | 748,306 |
Goldcorp, Inc. | | 28,250 | | 629,425 |
Meridian Gold, Inc.* | | 15,700 | | 344,132 |
| | | | |
(Cost $1,071,727) | | | | 3,099,993 |
| | | | |
China 2.1% | | | | |
China Construction Bank “H”* | | 1,064,000 | | 367,079 |
China Petroleum & Chemical Corp. “H” | | 3,240,000 | | 1,598,344 |
China Shenhua Energy Co., Ltd. “H”* | | 234,000 | | 256,524 |
| | | | |
(Cost $1,844,280) | | | | 2,221,947 |
| | | | |
Finland 1.7% | | | | |
Neste Oil Oyj* | | 18,000 | | 508,888 |
Nokia Oyj (ADR) | | 17,500 | | 320,250 |
Nokian Renkaat Oyj | | 73,000 | | 920,423 |
| | | | |
(Cost $1,785,529) | | | | 1,749,561 |
| | | | |
France 4.0% | | | | |
Carrefour SA | | 8,577 | | 401,907 |
Credit Agricole SA | | 20,468 | | 644,815 |
Societe Generale | | 5,822 | | 716,148 |
Total SA | | 9,719 | | 2,441,642 |
| | | | |
(Cost $3,274,342) | | | | 4,204,512 |
| | | | |
Germany 5.9% | | | | |
Bayer AG | | 31,609 | | 1,320,619 |
Bayerische Motoren Werke AG | | 10,560 | | 463,198 |
Commerzbank AG | | 63,087 | | 1,943,400 |
E.ON AG | | 7,949 | | 822,412 |
Schering AG | | 12,500 | | 837,609 |
Stada Arzneimittel AG | | 23,459 | | 767,926 |
| | | | |
(Cost $4,605,107) | | | | 6,155,164 |
| | | | |
Hong Kong 2.9% | | | | |
China Mobile (Hong Kong) Ltd. | | 137,600 | | 650,409 |
Fountain Set (Holdings) Ltd. | | 996,000 | | 459,229 |
Global Bio-chem Technology Group Co., Ltd. | | 1,264,000 | | 554,268 |
129
| | | | |
| | | Shares | | Value ($) |
Hutchison Whampoa Ltd. | | 106,000 | | 1,010,285 |
The Link (REIT)* | | 184,000 | | 348,842 |
| | | | |
(Cost $2,582,132) | | | | 3,023,033 |
| | | | |
India 1.0% | | | | |
Infosys Technologies Ltd. | | 13,100 | | 871,975 |
Ranbaxy Laboratories Ltd. (GDR) | | 22,850 | | 182,571 |
| | | | |
(Cost $855,648) | | | | 1,054,546 |
| | | | |
Indonesia 0.4% | | | | |
PT Telekomunikasi Indonesia (ADR) (Cost $345,762) | | 18,000 | | 429,480 |
| | | | |
Israel 1.5% | | | | |
Check Point Software Technologies Ltd.* | | 36,400 | | 731,640 |
Teva Pharmaceutical Industries Ltd. (ADR) | | 19,500 | | 838,695 |
| | | | |
(Cost $1,398,129) | | | | 1,570,335 |
| | | | |
Italy 2.1% | | | | |
Assicurazioni Generali SpA | | 16,000 | | 559,180 |
Capitalia SpA | | 277,700 | | 1,607,680 |
| | | | |
(Cost $1,674,194) | | | | 2,166,860 |
| | | | |
Japan 8.5% | | | | |
FANUC Ltd. | | 15,800 | | 1,341,061 |
Komatsu Ltd. | | 56,000 | | 926,409 |
Mitsubishi Estate Co., Ltd. | | 54,000 | | 1,121,804 |
Mitsui Fudosan Co., Ltd. | | 61,000 | | 1,238,776 |
Mizuho Financial Group, Inc. | | 186 | | 1,476,203 |
Nomura Holdings, Inc. | | 73,000 | | 1,398,906 |
Shinsei Bank Ltd. | | 245,000 | | 1,416,797 |
| | | | |
(Cost $5,359,438) | | | | 8,919,956 |
| | | | |
Korea 5.7% | | | | |
Daewoo Shipbuilding & Marine Engineering Co., Ltd. | | 29,500 | | 797,437 |
LG.Philips LCD Co., Ltd. (ADR)* (a) | | 23,600 | | 506,456 |
POSCO (ADR) (a) | | 31,900 | | 1,579,369 |
Samsung Electronics Co., Ltd. | | 2,520 | | 1,623,277 |
SK Corp. | | 28,010 | | 1,441,158 |
| | | | |
(Cost $5,057,079) | | | | 5,947,697 |
| | | | |
Luxembourg 1.0% | | | | |
Tenaris SA (ADR) (Cost $1,061,026) | | 9,450 | | 1,082,025 |
| | | | |
Malaysia 0.9% | | | | |
AMMB Holdings Bhd. | | 420,000 | | 263,368 |
Resorts World Bhd. | | 154,700 | | 458,431 |
RHB Capital Bhd. | | 435,100 | | 254,418 |
| | | | |
(Cost $973,443) | | | | 976,217 |
| | | | |
Mexico 2.5% | | | | |
Fomento Economico Mexicano SA de CV (ADR) | | 26,250 | | 1,903,388 |
Grupo Televisa SA (ADR) | | 8,450 | | 680,225 |
| | | | |
(Cost $1,992,957) | | | | 2,583,613 |
| | | | |
Netherlands 0.5% | | | | |
ABN AMRO Holding NV (Cost $492,814) | | 19,734 | | 516,090 |
130
| | | | |
| | | Shares | | Value ($) |
Peru 0.5% | | | | |
Compania de Minas Buenaventura SA (ADR) (Cost $260,220) | | 19,800 | | 560,340 |
Russia 3.0% | | | | |
LUKOIL (ADR) | | 14,900 | | 879,100 |
Mobile TeleSystems (ADR) | | 9,350 | | 327,250 |
Novolipetsk Steel (GDR) 144A* | | 31,600 | | 451,880 |
OAO Gazprom (ADR) (REG S) (a) | | 10,200 | | 731,340 |
OAO Vimpel-Communications (ADR)* | | 8,450 | | 373,743 |
Pyaterochka Holding NV (GDR) 144A* | | 33,100 | | 478,295 |
| | | | |
(Cost $2,387,804) | | | | 3,241,608 |
| | | | |
Singapore 0.9% | | | | |
DBS Group Holdings Ltd. | | 66,000 | | 654,978 |
Singapore TeleCommunications Ltd. | | 160,060 | | 251,260 |
| | | | |
(Cost $679,538) | | | | 906,238 |
| | | | |
South Africa 2.2% | | | | |
Barloworld Ltd. | | 11,700 | | 204,378 |
Gold Fields Ltd. | | 43,500 | | 768,597 |
Lewis Group Ltd. | | 111,100 | | 824,186 |
Sappi Ltd. | | 44,300 | | 507,656 |
| | | | |
(Cost $1,908,210) | | | | 2,304,817 |
| | | | |
Sweden 1.0% | | | | |
Skandinaviska Enskilda Banken AB “A” (Cost $784,848) | | 51,800 | | 1,066,058 |
| | | | |
Switzerland 3.4% | | | | |
ABB Ltd.* | | 97,779 | | 948,733 |
Credit Suisse Group (Registered) | | 12,004 | | 612,053 |
Julius Baer Holding Ltd. (Registered) | | 16,027 | | 1,135,508 |
Novartis AG (Registered) | | 15,337 | | 805,920 |
| | | | |
(Cost $2,676,145) | | | | 3,502,214 |
| | | | |
Taiwan 4.0% | | | | |
AU Optronics Corp. (ADR)* | | 36,450 | | 547,115 |
Chunghwa Telecom Co., Ltd. (ADR) | | 39,900 | | 732,165 |
Mega Financial Holding Co., Ltd. | | 967,000 | | 628,926 |
Quanta Computer, Inc. | | 289,087 | | 405,980 |
SinoPac Financial Holdings Co., Ltd. | | 628,000 | | 303,225 |
Taiwan Semiconductor Manufacturing Co., Ltd. (ADR) | | 102,200 | | 1,012,802 |
Yuanta Core Pacific Securities Co. | | 752,000 | | 523,455 |
| | | | |
(Cost $3,882,422) | | | | 4,153,668 |
| | | | |
Thailand 1.6% | | | | |
Bangkok Bank PCL (Foreign Registered) | | 223,600 | | 626,789 |
Kasikornbank PCL (Foreign Registered) | | 149,500 | | 273,309 |
Krung Thai Bank PCL (Foreign Registered) | | 1,432,700 | | 384,149 |
PTT Chemical PCL (Foreign Registered)* | | 190,650 | | 376,421 |
| | | | |
(Cost $1,586,076) | | | | 1,660,668 |
| | | | |
Turkey 0.3% | | | | |
Turkcell Iletisim Hizmetleri AS (ADR) (Cost $263,005) | | 19,050 | | 292,608 |
| | | | |
131
| | | | | | |
| | | Shares | | | Value ($) | |
United Kingdom 7.1% | | | | | | |
Anglo American PLC | | 18,055 | | | 614,750 | |
GlaxoSmithKline PLC | | 59,204 | | | 1,496,331 | |
MFI Furniture Group PLC | | 195,336 | | | 268,861 | |
National Grid PLC | | 84,397 | | | 825,491 | |
Royal Bank of Scotland Group PLC | | 63,364 | | | 1,913,263 | |
Vodafone Group PLC | | 298,235 | | | 643,958 | |
William Morrison Supermarkets PLC | | 390,755 | | | 1,300,890 | |
Woolworths Group PLC | | 563,994 | | | 376,011 | |
| | | | | | |
(Cost $7,065,791) | | | | | 7,439,555 | |
| | | | | | |
United States 20.2% | | | | | | |
AFLAC, Inc. | | 19,900 | | | 923,758 | |
Avocent Corp.* | | 13,550 | | | 368,425 | |
Bunge Ltd. | | 30,050 | | | 1,701,130 | |
Caremark Rx, Inc.* | | 13,650 | | | 706,934 | |
Caterpillar, Inc. | | 12,050 | | | 696,129 | |
Cisco Systems, Inc.* | | 91,000 | | | 1,557,920 | |
Citigroup, Inc. | | 19,643 | | | 953,275 | |
Coca-Cola Co. | | 28,100 | | | 1,132,711 | |
E.I. du Pont de Nemours & Co. | | 17,500 | | | 743,750 | |
ExxonMobil Corp. | | 29,500 | | | 1,657,015 | |
General Mills, Inc. | | 16,150 | | | 796,518 | |
Johnson & Johnson | | 12,725 | | | 764,772 | |
Monsanto Co. | | 10,850 | | | 841,200 | |
Newmont Mining Corp. | | 19,800 | | | 1,057,320 | |
Oracle Corp.* | | 145,000 | | | 1,770,450 | |
Pfizer, Inc. | | 65,100 | | | 1,518,132 | |
Schlumberger Ltd. | | 8,475 | | | 823,346 | |
Symantec Corp.* | | 43,150 | | | 755,125 | |
The Goldman Sachs Group, Inc. | | 11,375 | | | 1,452,701 | |
Wyeth | | 19,800 | | | 912,256 | |
(Cost $19,001,211) | | | | | 21,132,867 | |
| | | | | | |
Total Common Stocks (Cost $78,361,285) | | | | | 95,424,597 | |
| | | | | | |
Preferred Stock 2.0% | | | | | | |
Germany | | | | | | |
Henkel KGaA | | 9,126 | | | 918,363 | |
Porsche AG | | 1,714 | | | 1,231,666 | |
| | | | | | |
Total Preferred Stock (Cost $2,040,864) | | | | | 2,150,029 | |
| | | | | | |
Exchange Traded Funds 1.9% | | | | | | |
iShares MSCI Malaysia Index Fund | | 82,500 | | | 562,650 | |
iShares Nasdaq Biotechnology Index Fund* (a) | | 17,900 | | | 1,382,596 | |
| | | | | | |
Total Exchange Traded Funds (Cost $1,831,229) | | | | | 1,945,246 | |
| | | | | | |
Securities Lending Collateral 3.8% | | | | | | |
Daily Assets Fund Institutional, 4.28% (b) (c) (Cost $3,962,725) | | 3,962,725 | | | 3,962,725 | |
| | | | | | |
Cash Equivalents 4.8% | | | | | | |
Cash Management QP Trust, 4.26% (d) (Cost $4,980,633) | | 4,980,633 | | | 4,980,633 | |
| | | | | | |
| | |
| | | % of Net Assets | | | Value ($) | |
Total Investment Portfolio (Cost $91,176,736)+ | | 103.7 | | | 108,463,230 | |
| | | | | | |
Other Assets and Liabilities, Net | | (3.7 | ) | | (3,816,858 | ) |
| | | | | | |
Net Assets | | 100.0 | | | 104,646,372 | |
| | | | | | |
132
Notes to DWS Global Thematic VIP Portfolio of Investments
| * | Non-income producing security. |
| + | The cost for federal income tax purposes was $91,390,913. At December 31, 2005, net unrealized appreciation for all securities based on tax cost was $17,072,317. This consisted of aggregate gross unrealized appreciation for all securities in which there was an excess of value over tax cost of $18,829,552 and aggregate gross unrealized depreciation for all securities in which there was an excess of tax cost over value of $1,757,235. |
| (a) | All or a portion of these securities were on loan (See Note to Financial Statements). The value of all securities loaned at December 31, 2005 amounted to $3,866,071 which is 3.7% of net assets. |
| (b) | Daily Assets Fund Institutional, an affiliated fund, is managed by Deutsche Asset Management, Inc. The rate shown is the annualized seven-day yield at period end. |
| (c) | Represents collateral held in connection with securities lending. |
| (d) | Cash Management QP Trust, an affiliated fund, is managed by Deutsche Investment Management Americas Inc. The rate shown is the annualized seven-day yield at period end. |
| 144A: | Security exempt from registration under Rule 144A of the Securities Act of 1933. These securities may be resold in transactions exempt from registration, normally to qualified institutional buyers. |
| ADR: | American Depositary Receipt |
| GDR: | Global Depositary Receipt |
| REIT: | Real Estate Investment Trust |
The accompanying notes are an integral part of the financial statements.
133
Financial Statements
Statement of Assets and Liabilities
as of December 31, 2005
| | | |
Assets | | | |
Investments: | | | |
Investments in securities, at value (cost $82,233,378) — including $3,866,071 of securities loaned | | $ | 99,519,872 |
Investment in Daily Assets Fund Institutional (cost $3,962,725)* | | | 3,962,725 |
Investment in Cash Management QP Trust (cost $4,980,633) | | | 4,980,633 |
Total investments in securities, at value (cost $91,176,736) | | | 108,463,230 |
Cash | | | 224,412 |
Foreign currency, at value (cost $104,408) | | | 106,572 |
Dividends receivable | | | 202,092 |
Interest receivable | | | 21,221 |
Receivable for Portfolio shares sold | | | 589,533 |
Foreign taxes recoverable | | | 10,401 |
Other assets | | | 2,933 |
| | | |
Total assets | | | 109,620,394 |
| | | |
Liabilities | | | |
Payable for investments purchased | | | 843,660 |
Payable upon return of securities loaned | | | 3,962,725 |
Payable for Portfolio shares redeemed | | | 9,229 |
Deferred foreign taxes payable | | | 43,128 |
Accrued management fee | | | 15,478 |
Other accrued expenses and payables | | | 99,802 |
Total liabilities | | | 4,974,022 |
| | | |
Net assets, at value | | $ | 104,646,372 |
| | | |
Net Assets | | | |
Net assets consist of: | | | |
Undistributed net investment income | | | 558,067 |
Net unrealized appreciation (depreciation) on: | | | |
Investments (net of foreign taxes of $43,128) | | | 17,243,366 |
Foreign currency related transactions | | | 1,125 |
Accumulated net realized gain (loss) | | | 8,556,682 |
Paid-in capital | | | 78,287,132 |
| | | |
Net assets, at value | | $ | 104,646,372 |
| | | |
Class A | | | |
Net Asset Value, offering and redemption price per share ($85,020,570 ÷ 5,887,898 outstanding shares of beneficial interest, $.01 par value, unlimited number of shares authorized) | | $ | 14.44 |
| | | |
Class B | | | |
Net Asset Value, offering and redemption price per share ($19,625,802 ÷ 1,359,840 outstanding shares of beneficial interest, $.01 par value, unlimited number of shares authorized) | | $ | 14.43 |
| | | |
| * | Represents collateral on securities loaned. |
134
Statement of Operations
for the year ended December 31, 2005
| | | | |
Investment Income | | | | |
Income: | | | | |
Dividends (net of foreign taxes withheld of $184,458) | | $ | 1,716,494 | |
Interest | | | 1,366 | |
Interest — Cash Management QP Trust | | | 130,598 | |
Securities lending income, including income from Daily Assets Fund Institutional, net of borrower rebates | | | 55,555 | |
Total Income | | | 1,904,013 | |
Expenses: | | | | |
Management fee | | | 841,064 | |
Custodian and accounting fees | | | 241,989 | |
Distribution service fees (Class B) | | | 38,339 | |
Record keeping fees (Class B) | | | 20,082 | |
Auditing | | | 56,174 | |
Legal | | | 12,526 | |
Trustees’ fees and expenses | | | 3,878 | |
Reports to shareholders | | | 17,393 | |
Other | | | 16,401 | |
Total expenses before expense reductions | | | 1,247,846 | |
Expense reductions | | | (116,133 | ) |
Total expenses after expense reductions | | | 1,131,713 | |
| | | | |
Net investment income (loss) | | | 772,300 | |
| | | | |
Realized and Unrealized Gain (Loss) on Investment Transactions | | | | |
Net realized gain (loss) from: | | | | |
Investments (net of foreign taxes of $43,629) | | | 13,370,409 | |
Foreign currency related transactions | | | (128,301 | ) |
| | | 13,242,108 | |
Net unrealized appreciation (depreciation) during the period on: | | | | |
Investments (net of deferred foreign taxes of $43,128) | | | 4,302,278 | |
Foreign currency related transactions | | | (5,308 | ) |
| | | 4,296,970 | |
| | | | |
Net gain (loss) on investment transactions | | | 17,539,078 | |
| | | | |
Net increase (decrease) in net assets resulting from operations | | $ | 18,311,378 | |
| | | | |
The accompanying notes are an integral part of the financial statements.
135
Statement of Changes in Net Assets
| | | | | | | | |
| | | Years Ended December 31, | |
Increase (Decrease) in Net Assets | | 2005 | | | 2004 | |
Operations: | | | | | | | | |
Net investment income (loss) | | $ | 772,300 | | | $ | 204,775 | |
Net realized gain (loss) on investment transactions | | | 13,242,108 | | | | 5,240,327 | |
Net unrealized appreciation (depreciation) during the period on investment transactions | | | 4,296,970 | | | | 3,765,688 | |
Net increase (decrease) in net assets resulting from operations | | | 18,311,378 | | | | 9,210,790 | |
Distributions to shareholders from: | | | | | | | | |
Net investment income: | | | | | | | | |
Class A | | | (188,888 | ) | | | (686,309 | ) |
Class B | | | — | | | | (57,902 | ) |
Portfolio share transactions: | | | | | | | | |
Class A | | | | | | | | |
Proceeds from shares sold | | | 15,806,082 | | | | 10,246,696 | |
Reinvestment of distributions | | | 188,888 | | | | 686,309 | |
Cost of shares redeemed | | | (8,739,580 | ) | | | (9,557,336 | ) |
Net increase (decrease) in net assets from Class A share transactions | | | 7,255,390 | | | | 1,375,669 | |
Class B | | | | | | | | |
Proceeds from shares sold | | | 5,152,763 | | | | 5,449,125 | |
Reinvestment of distributions | | | — | | | | 57,902 | |
Cost of shares redeemed | | | (1,457,434 | ) | | | (572,691 | ) |
Net increase (decrease) in net assets from Class B share transactions | | | 3,695,329 | | | | 4,934,336 | |
Increase (decrease) in net assets | | | 29,073,209 | | | | 14,776,584 | |
Net assets at beginning of period | | | 75,573,163 | | | | 60,796,579 | |
| | | | | | | | |
Net assets at end of period (including undistributed net investment income of $558,067 and $102,166, respectively) | | $ | 104,646,372 | | | $ | 75,573,163 | |
| | | | | | | | |
Other Information | | | | | | | | |
Class A | | | | | | | | |
Shares outstanding at beginning of period | | | 5,350,985 | | | | 5,262,148 | |
Shares sold | | | 1,229,117 | | | | 941,848 | |
Shares issued to shareholders in reinvestment of distributions | | | 15,980 | | | | 64,503 | |
Shares redeemed | | | (708,184 | ) | | | (917,514 | ) |
Net increase (decrease) in Class A shares | | | 536,913 | | | | 88,837 | |
| | | | | | | | |
Shares outstanding at end of period | | | 5,887,898 | | | | 5,350,985 | |
| | | | | | | | |
Class B | | | | | | | | |
Shares outstanding at beginning of period | | | 1,064,827 | | | | 588,861 | |
Shares sold | | | 406,987 | | | | 522,896 | |
Shares issued to shareholders in reinvestment of distributions | | | — | | | | 5,427 | |
Shares redeemed | | | (111,974 | ) | | | (52,357 | ) |
Net increase (decrease) in Class B shares | | | 295,013 | | | | 475,966 | |
| | | | | | | | |
Shares outstanding at end of period | | | 1,359,840 | | | | 1,064,827 | |
| | | | | | | | |
The accompanying notes are an integral part of the financial statements.
136
Financial Highlights
Class A
| | | | | | | | | | | | | | | | | | | | |
Years Ended December 31, | | 2005 | | | 2004 | | | 2003 | | | 2002 | | | 2001 | |
Selected Per Share Data | | | | | | | | | | | | | | | | | | | | |
Net asset value, beginning of period | | $ | 11.78 | | | $ | 10.39 | | | $ | 8.08 | | | $ | 9.64 | | | $ | 11.81 | |
| | | | | | | | | | | | | | | | | | | | |
Income (loss) from investment operations: | | | | | | | | | | | | | | | | | | | | |
Net investment income (loss)a | | | .12 | | | | .04 | | | | .09 | | | | .07 | | | | .08 | |
Net realized and unrealized gain (loss) on investment transactions | | | 2.58 | | | | 1.48 | | | | 2.25 | | | | (1.57 | ) | | | (1.90 | ) |
Total from investment operations | | | 2.70 | | | | 1.52 | | | | 2.34 | | | | (1.50 | ) | | | (1.82 | ) |
Less distributions from: | | | | | | | | | | | | | | | | | | | | |
Net investment income | | | (.04 | ) | | | (.13 | ) | | | (.03 | ) | | | (.06 | ) | | | — | |
Net realized gain on investment transactions | | | — | | | | — | | | | — | | | | — | | | | (.35 | ) |
Total distributions | | | (.04 | ) | | | (.13 | ) | | | (.03 | ) | | | (.06 | ) | | | (.35 | ) |
| | | | | | | | | | | | | | | | | | | | |
Net asset value, end of period | | $ | 14.44 | | | $ | 11.78 | | | $ | 10.39 | | | $ | 8.08 | | | $ | 9.64 | |
| | | | | | | | | | | | | | | | | | | | |
Total Return (%) | | | 22.94b | | | | 14.76 | | | | 29.13b | | | | (15.77 | ) | | | (15.48 | ) |
Ratios to Average Net Assets and Supplemental Data | | | | | | | | | | | | | | | | | | | | |
Net assets, end of period ($ millions) | | | 85 | | | | 63 | | | | 55 | | | | 43 | | | | 44 | |
Ratio of expenses before expense reductions (%) | | | 1.41 | | | | 1.44 | | | | 1.48 | | | | 1.32 | | | | 1.24 | |
Ratio of expenses after expense reductions (%) | | | 1.28 | | | | 1.43 | | | | 1.17 | | | | 1.32 | | | | 1.24 | |
Ratio of net investment income (%) | | | .98 | | | | .38 | | | | 1.02 | | | | .79 | | | | .76 | |
Portfolio turnover rate (%) | | | 95 | | | | 81 | | | | 65 | | | | 41 | | | | 52 | |
| a | Based on average shares outstanding during the period. |
| b | Total return would have been lower had certain expenses not been reduced. |
Class B
| | | | | | | | | | | | | | | |
Years Ended December 31, | | 2005 | | 2004 | | | 2003 | | | 2002a | |
Selected Per Share Data | | | | | | | | | | | | | | | |
Net asset value, beginning of period | | $ | 11.78 | | $ | 10.38 | | | $ | 8.06 | | | $ | 8.98 | |
| | | | | | | | | | | | | | | |
Income (loss) from investment operations: | | | | | | | | | | | | | | | |
Net investment income (loss)b | | | .07 | | | .00d | | | | .04 | | | | .02 | |
Net realized and unrealized gain (loss) on investment transactions | | | 2.58 | | | 1.48 | | | | 2.29 | | | | (.94 | ) |
| | | | | | | | | | | | | | | |
Total from investment operations | | | 2.65 | | | 1.48 | | | | 2.33 | | | | (.92 | ) |
| | | | | | | | | | | | | | | |
Less distributions from: | | | | | | | | | | | | | | | |
Net investment income | | | — | | | (.08 | ) | | | (.01 | ) | | | — | |
| | | | | | | | | | | | | | | |
Net asset value, end of period | | $ | 14.43 | | $ | 11.78 | | | $ | 10.38 | | | $ | 8.06 | |
| | | | | | | | | | | | | | | |
Total Return (%) | | | 22.50c | | | 14.33 | | | | 28.96c | | | | (10.24 | )** |
Ratios to Average Net Assets and Supplemental Data | | | | | | | | | | | | | | | |
Net assets, end of period ($ millions) | | | 20 | | | 13 | | | | 6 | | | | .2 | |
Ratio of expenses before expense reductions (%) | | | 1.79 | | | 1.84 | | | | 1.87 | | | | 1.60 | * |
Ratio of expenses after expense reductions (%) | | | 1.65 | | | 1.83 | | | | 1.64 | | | | 1.60 | * |
Ratio of net investment income (%) | | | .61 | | | .02 | | | | .55 | | | | .49 | * |
Portfolio turnover rate (%) | | | 95 | | | 81 | | | | 65 | | | | 41 | |
| a | For the period July 1, 2002 (commencement of operations of Class B shares) to December 31, 2002. |
| b | Based on average shares outstanding during the period. |
| c | Total return would have been lower had certain expenses not been reduced. |
| d | Amount is less than $.005 per share. |
137
Performance Summary December 31, 2005
DWS Government & Agency Securities VIP
All performance shown is historical, assumes reinvestment of all dividend and capital gain distributions and does not guarantee future results. Investment return and principal value fluctuate with changing market conditions so that, when redeemed, shares may be worth more or less than their original cost. Current performance may be lower or higher than the performance data quoted. Please visit www.dws-scudder.com for the Portfolio’s most recent month-end performance. Performance doesn’t reflect charges and fees (“contract charges”) associated with the separate account that invests in the Portfolio or any variable life insurance policy or variable annuity contract for which the Portfolio is an investment option. These charges and fees will reduce returns. While all share classes have the same underlying portfolio, their performance will differ.
The government guarantee relates only to the prompt payment of principal and interest and does not remove market risks. Additionally, yields will fluctuate in response to changing interest rates and may be affected by the prepayment of mortgage-backed securities. Bond investments are subject to interest-rate risk such that when interest rates rise, the prices of the bonds, and thus the value of the bond portfolio, can decline and the investor can lose principal value. Please read this Portfolio’s prospectus for specific details regarding its investments and risk profile.
Growth of an Assumed $10,000 Investment in DWS Government & Agency Securities VIP
¨ DWS Government & Agency Securities VIP — Class A
¨ Lehman Brothers GNMA Index

Yearly periods ended December 31
The Lehman Brothers GNMA Index is an unmanaged market-value-weighted measure of all fixed-rate securities backed by mortgage pools of the Government National Mortgage Association. Index returns assume reinvested dividends and, unlike Portfolio returns, do not reflect any fees or expenses. It is not possible to invest directly into an index.
Comparative Results
| | | | | | | | | | | | | | | | | | |
DWS Government & Agency Securities VIP | | 1-Year | | | 3-Year | | | 5-Year | | | 10-Year | |
Class A | | Growth of $10,000 | | $ | 10,257 | | | $ | 10,882 | | | $ | 12,639 | | | $ | 16,883 | |
| | Average annual total return | | | 2.57 | % | | | 2.86 | % | | | 4.80 | % | | | 5.38 | % |
Lehman Brothers GNMA Index | | Growth of $10,000 | | $ | 10,321 | | | $ | 11,077 | | | $ | 13,029 | | | $ | 18,237 | |
| | Average annual total return | | | 3.21 | % | | | 3.47 | % | | | 5.43 | % | | | 6.19 | % |
| | | | | | | | | | | | | | |
DWS Government & Agency Securities VIP | | 1-Year | | | 3-Year | | | Life of Class* | |
Class B | | Growth of $10,000 | | $ | 10,224 | | | $ | 10,761 | | | $ | 11,161 | |
| | Average annual total return | | | 2.24 | % | | | 2.47 | % | | | 3.19 | % |
Lehman Brothers GNMA Index | | Growth of $10,000 | | $ | 10,321 | | | $ | 11,077 | | | $ | 11,538 | |
| | Average annual total return | | | 3.21 | % | | | 3.47 | % | | | 4.17 | % |
The growth of $10,000 is cumulative.
| * | The Portfolio commenced offering Class B shares on July 1, 2002. Index returns begin June 30, 2002. |
138
Information About Your Portfolio’s Expenses
DWS Government & Agency Securities VIP
As an investor of the Portfolio, you incur two types of costs: ongoing expenses and transaction costs. Ongoing expenses include management fees, distribution and service (12b-1) fees and other Portfolio expenses. Examples of transaction costs include sales charges (loads), redemption fees and account maintenance fees, which are not shown in this section. The following tables are intended to help you understand your ongoing expenses (in dollars) of investing in the Portfolio and to help you compare these expenses with the ongoing expenses of investing in other mutual funds. The tables are based on an investment of $1,000 made at the beginning of the six-month period ended December 31, 2005.
The tables illustrate your Portfolio’s expenses in two ways:
Actual Portfolio Return. This helps you estimate the actual dollar amount of ongoing expenses (but not transaction costs) paid on a $1,000 investment in the Portfolio using the Portfolio’s actual return during the period. To estimate the expenses you paid over the period, simply divide your account value by $1,000 (for example, an $8,600 account value divided by $1,000 = 8.6), then multiply the result by the number in the “Expenses Paid per $1,000” line under the share class you hold.
Hypothetical 5% Portfolio Return. This helps you to compare your Portfolio’s ongoing expenses (but not transaction costs) with those of other mutual funds using the Portfolio’s actual expense ratio and a hypothetical rate of return of 5% per year before expenses. Examples using a 5% hypothetical Portfolio return may be found in the shareholder reports of other mutual funds. The hypothetical account values and expenses may not be used to estimate the actual ending account balance or expenses you paid for the period.
Please note that the expenses shown in these tables are meant to highlight your ongoing expenses only and do not reflect any transaction costs. The “Expenses Paid per $1,000” line of the tables is useful in comparing ongoing expenses only and will not help you determine the relative total expense of owning different funds. If these transaction costs had been included, your costs would have been higher.
Expenses and Value of a $1,000 Investment for the six months ended December 31, 2005
| | | | | | |
Actual Portfolio Return | | Class A | | Class B |
Beginning Account Value 7/1/05 | | $ | 1,000.00 | | $ | 1,000.00 |
Ending Account Value 12/31/05 | | $ | 1,007.40 | | $ | 1,005.80 |
Expenses Paid per $1,000* | | $ | 3.29 | | $ | 5.21 |
| | |
Hypothetical 5% Portfolio Return | | Class A | | Class B |
Beginning Account Value 7/1/05 | | $ | 1,000.00 | | $ | 1,000.00 |
Ending Account Value 12/31/05 | | $ | 1,021.93 | | $ | 1,020.01 |
Expenses Paid per $1,000* | | $ | 3.31 | | $ | 5.24 |
| * | Expenses are equal to the Portfolio’s annualized expense ratio for each share class, multiplied by the average account value over the period, multiplied by the number of days in the most recent six-month period, then divided by 365. |
| | | | | | |
Annualized Expense Ratios | | Class A | | | Class B | |
DWS Variable Series II — DWS Government & Agency Securities VIP | | .65 | % | | 1.03 | % |
For more information, please refer to the Portfolio’s prospectus.
These tables do not reflect charges and fees (“contract charges”) associated with the separate account that invests in the portfolio or any variable life insurance policy or variable annuity contract for which the portfolio is an investment option.
139
Management Summary December 31, 2005
DWS Government & Agency Securities VIP
The annual period was characterized by solid economic growth accompanied by generally contained increases in inflation. While oil hovered in the $60 per barrel range for much of the year, the market has not generally viewed high energy price levels as a cause for alarm with respect to the inflation outlook. Open markets and excess capacity continue to put downward pressure on prices, and the so-called core inflation rate (which excludes energy and food) has been subdued. This environment permitted the US Federal Reserve Board (the Fed) to maintain its policy of increasing short-term rates in a measured fashion. Despite the rise in short-term interest rates, longer-term rates were relatively stable over the period, as the financial markets displayed confidence that the Fed was pursuing a policy that would continue to curtail potential inflationary pressures. This period of mixed economic signals and stable long-term interest rates resulted in modest positive returns for mortgage-backed securities.
For the 12-month period ended December 31, 2005, the portfolio provided a total return of 2.57% (Class A shares, unadjusted for contract charges), compared with the 3.21% return of its benchmark, the Lehman Brothers GNMA Index.
During the early part of the period, we paid particular attention to identifying mortgages that we expected to maintain their yield in a wide variety of interest rate scenarios. These included lower-coupon mortgages as well as pools with smaller loan sizes or specific geographic profiles that have proven to be less sensitive to early redemptions, or prepayments, by home owners. As the year progressed, in anticipation of a stable interest rate environment and reduced prepayment risk, we emphasized higher-coupon mortgages and 30-year mortgages over 15-year instruments because of their yield advantage. This worked well for the portfolio, although in retrospect we would have benefited from even greater exposure to GNMAs versus conventional mortgages. Going forward, we will be monitoring the interest-rate environment closely as we seek to maintain an attractive dividend for investors.
William Chepolis, CFA
Lead Portfolio Manager
Deutsche Investment Management Americas Inc.
All performance shown is historical, assumes reinvestment of all dividend and capital gain distributions, and does not guarantee future results. Investment return and principal value fluctuate with changing market conditions so that, when redeemed, shares may be worth more or less than their original cost. Current performance may be lower or higher than the performance data quoted. Please visit www.dws-scudder.com for the product’s most recent month-end performance. Performance doesn’t reflect charges and fees (“contract charges”) associated with the separate account that invests in the Portfolio or any variable life insurance policy or variable annuity contract for which the Portfolio is an investment option. These charges and fees will reduce returns.
Risk Considerations
The government guarantee relates only to the prompt payment of principal and interest and does not remove market risks. Additionally, yields will fluctuate in response to changing interest rates and may be affected by the prepayment of mortgage-backed securities. Bond investments are subject to interest-rate risk such that when interest rates rise, the prices of the bonds, and thus the value of the bond fund, can decline and the investor can lose principal value. Please read this Portfolio’s prospectus for specific details regarding its investments and risk profile.
The Lehman Brothers GNMA Index is an unmanaged, market-value-weighted measure of all fixed-rate securities backed by mortgage pools of the Government National Mortgage Association. Index returns assume reinvestment of dividends and, unlike portfolio returns, do not reflect any fees or expenses. It is not possible to invest directly into an index.
Portfolio management market commentary is as of December 31, 2005, and may not come to pass. This information is subject to change at any time based on market and other conditions.
140
Portfolio Summary
DWS Government & Agency Securities VIP
| | | | | | |
Asset Allocation | | 12/31/05 | | | 12/31/04 | |
Agencies Backed by the Full Faith and Credit of the US Government (GNMA) | | 58 | % | | 57 | % |
Agencies Not Backed by the Full Faith and Credit of the US Government (FNMA, FHLMC) | | 32 | % | | 21 | % |
US Treasury Obligations | | 5 | % | | 4 | % |
Cash Equivalents | | 5 | % | | 18 | % |
| | 100 | % | | 100 | % |
| | | | | | |
Quality* | | 12/31/05 | | | 12/31/04 | |
AAA | | 100 | % | | 100 | % |
| * | Includes cash equivalents |
| | | | |
Interest Rate Sensitivity | | 12/31/05 | | 12/31/04 |
Average Maturity | | 5.9 years | | 4.6 years |
Average Duration | | 4.0 years | | 2.6 years |
Asset allocation, quality and interest rate sensitivity are subject to change.
The quality ratings represent the lower of Moody’s Investors Service, Inc. (“Moody’s”) or Standard & Poor’s Corporation (“S&P”) credit ratings. The ratings of Moody’s and S&P represent their opinions as to the quality of the securities they rate. Ratings are relative and subjective and are not absolute standards of quality. The Portfolio’s quality does not remove market risk.
For more complete details about the Portfolio’s investment portfolio, see page 119. A quarterly Fact Sheet is available upon request. Information concerning portfolio holdings of the Portfolio as of month end will be posted to www.dws-scudder.com on the 15th of the following month.
Following the Portfolio’s fiscal first and third quarter-end, a complete portfolio holdings listing is filed with the SEC on Form N-Q. The form will be available on the SEC’s Web site at www.sec.gov, and it also may be reviewed and copied at the SEC’s Public Reference Room in Washington, D.C. Information on the operation of the SEC’s Public Reference Room may be obtained by calling (800) SEC-0330.
141
Investment Portfolio December 31, 2005
DWS Government & Agency Securities VIP
| | | | | | |
| | | Principal Amount ($) | | | Value ($) | |
Agencies Backed by the Full Faith Credit of the US Government 55.8% | | | | | | |
Government National Mortgage Association: | | | | | | |
5.0%, with various maturities from 4/20/2033 until 2/15/2035 (c) | | 21,205,940 | | | 20,931,174 | |
5.5%, with various maturities from 12/15/2032 until 11/15/2035 (c) (d) | | 75,936,285 | | | 76,373,605 | |
6.0%, with various maturities from 12/20/2031 until 6/15/2035 (c) (d) | | 35,820,080 | | | 36,656,851 | |
6.5%, with various maturities from 3/15/2014 until 3/20/2035 (c) | | 18,465,157 | | | 19,214,890 | |
7.0%, with various maturities from 6/20/2017 until 10/15/2032 | | 4,083,283 | | | 4,279,816 | |
7.5%, with various maturities from 4/15/2026 until 7/15/2032 | | 3,169,173 | | | 3,333,248 | |
8.0%, with various maturities from 12/15/2026 until 11/15/2031 | | 997,251 | | | 1,067,829 | |
8.5%, with various maturities from 5/15/2016 until 12/15/2030 | | 150,866 | | | 163,080 | |
9.5%, with various maturities from 6/15/2013 until 12/15/2022 | | 69,057 | | | 75,978 | |
10.0%, with various maturities from 2/15/2016 until 3/15/2016 | | 25,131 | | | 27,959 | |
| | | | | | |
Total Agencies Backed by the Full Faith Credit of the US Government (Cost $163,329,106) | | | | | 162,124,430 | |
| | | | | | |
Agencies Not Backed by the Full Faith Credit of the US Government 30.2% | | | | | | |
Federal Home Loan Bank, 4.375%, 9/17/2010 | | 23,000,000 | | | 22,642,741 | |
Federal Home Loan Mortgage Corp.: | | | | | | |
4.5%, 5/1/2019 | | 73,018 | | | 71,162 | |
4.625%*, 2/1/2035 | | 864,003 | | | 851,596 | |
5.0%, with various maturities from 9/1/2033 until 8/1/2035 | | 11,162,796 | | | 10,817,629 | |
5.5%, with various maturities from 2/1/2017 until 11/1/2033 (c) | | 6,071,426 | | | 6,015,682 | |
6.5%, 9/1/2032 (c) | | 227,301 | | | 233,353 | |
7.0%, with various maturities from 5/1/2029 until 8/1/2035 | | 6,001,110 | | | 6,241,129 | |
7.5%, with various maturities from 1/1/2027 until 5/1/2032 | | 271,373 | | | 285,163 | |
8.0%, 11/1/2030 | | 5,161 | | | 5,504 | |
8.5%, 7/1/2030 | | 5,137 | | | 5,558 | |
Federal National Mortgage Association: | | | | | | |
4.538%*, 1/1/2035 | | 1,492,867 | | | 1,469,562 | |
4.554%*, 2/1/2035 | | 2,194,150 | | | 2,167,941 | |
4.62%*, 1/1/2035 | | 1,784,496 | | | 1,770,106 | |
4.674%*, 2/1/2035 | | 1,387,959 | | | 1,378,168 | |
4.742%*, 5/1/2035 | | 2,215,750 | | | 2,191,039 | |
5.0%, with various maturities from 4/1/2020 until 10/1/2033 | | 3,868,439 | | | 3,813,530 | |
5.5%, with various maturities from 1/1/2033 until 6/1/2035 | | 12,743,900 | | | 12,633,667 | |
6.0%, 9/1/2035 | | 7,217,661 | | | 7,285,327 | |
6.5%, with various maturities from 9/1/2030 until 6/1/2035 | | 4,269,523 | | | 4,385,156 | |
7.0%, with various maturities from 9/1/2013 until 7/1/2034 | | 996,811 | | | 1,039,999 | |
7.5%, with various maturities from 9/1/2028 until 3/1/2032 | | 2,194,309 | | | 2,300,062 | |
8.0%, 12/1/2024 | | 19,220 | | | 20,542 | |
| | | | | | |
Total Agencies Not Backed by the Full Faith Credit of the US Government (Cost $88,596,618) | | | | | 87,624,616 | |
| | | | | | |
| | |
US Treasury Obligations 5.2% | | | | | | |
US Treasury Bills, 3.75%**, 1/19/2006 (a) | | 165,000 | | | 164,691 | |
US Treasury Notes: | | | | | | |
4.0%, 8/31/2007 | | 3,000,000 | | | 2,980,077 | |
4.375%, 11/15/2008 | | 6,000,000 | | | 6,000,936 | |
4.5%, 11/15/2015 | | 6,000,000 | | | 6,049,218 | |
| | | | | | |
Total US Treasury Obligations (Cost $15,208,396) | | | | | 15,194,922 | |
| | | | | | |
| | |
Collateralized Mortgage Obligations 11.3% | | | | | | |
Federal Home Loan Mortgage Corp.: | | | | | | |
“PO”, Series 228, Principal Only, 0.99%, 2/1/2035 | | 2,249,016 | | | 1,780,008 | |
“ZC”, Series 2972, 4.5%, 5/15/2020 | | 492,542 | | | 489,914 | |
“PF”, Series 2962, 4.619%*, 3/15/2035 | | 4,157,994 | | | 4,149,487 | |
“IO”, Series 228, Interest Only, 6.0%***, 2/1/2035 | | 2,249,016 | | | 496,365 | |
Federal National Mortgage Association: | | | | | | |
“L0”, Series 2005-50, Principal Only, Zero Coupon, 6/25/2035 | | 1,614,347 | | | 1,383,061 | |
“IN”, Series 2003-84, Interest Only, 4.5%***, 4/25/2013 | | 3,244,876 | | | 178,685 | |
“PF”, Series 2005-59, 4.629%*, 5/25/2035 | | 3,079,011 | | | 3,076,739 | |
Government National Mortgage Association: | | | | | | |
“DA”, Series 2005-45, 4.55%*, 6/16/2035 | | 9,476,008 | | | 9,454,855 | |
“FB”, Series 2005-43, 4.57%*, 2/17/2032 | | 4,215,625 | | | 4,178,583 | |
“FA”, Series 2005-18, 4.57%*, 10/20/2032 | | 3,000,000 | | | 2,996,702 | |
“FH”, Series 1999-18, 4.62%*, 5/16/2029 | | 2,422,481 | | | 2,429,488 | |
“FB”, Series 2001-28, 4.87%*, 6/16/2031 | | 1,349,273 | | | 1,361,886 | |
“IB”, Series 2003-86, Interest Only, 5.0%***, 1/20/2029 | | 4,550,000 | | | 755,785 | |
| | | | | | |
Total Collateralized Mortgage Obligations (Cost $32,855,454) | | | | | 32,731,558 | |
| | | | | | |
| | |
| | | Shares | | | Value ($) | |
Cash Equivalents 5.3% | | | | | | |
Cash Management QP Trust, 4.26% (b) (Cost $15,412,261) | | 15,412,261 | | | 15,412,261 | |
| | |
| | | % of Net Assets | | | Value ($) | |
Total Investment Portfolio (Cost $315,401,835)+ | | 107.8 | | | 313,087,787 | |
| | | | | | |
Other Assets and Liabilities, Net | | (7.8 | ) | | (22,688,138 | ) |
| | | | | | |
Net Assets | | 100.0 | | | 290,399,649 | |
| | | | | | |
142
Notes to DWS Government & Agency Securities VIP Portfolio of Investments
| * | Floating rate notes are securities whose yields vary with a designated market index or market rate, such as the coupon-equivalent of the US Treasury bill rate. These securities are shown at their current rate as of December 31, 2005. |
| ** | Annualized yield at time of purchase; not a coupon rate. |
| *** | These securities are shown at their current rate as of December 31, 2005. |
| + | The cost for federal income tax purposes was $315,433,634. At December 31, 2005, net unrealized depreciation for all securities based on tax cost was $2,345,847. This consisted of aggregate gross unrealized appreciation for all securities in which there was an excess of value over tax cost of $616,612 and aggregate gross unrealized depreciation for all securities in which there was an excess of tax cost over value of $2,962,459. |
| (a) | At December 31, 2005, this security has been pledged, in whole or in part, to cover initial margin requirements for open futures contracts. |
| (b) | Cash Management QP Trust, an affiliated fund, is managed by Deutsche Investment Management Americas Inc. The rate shown is the annualized seven-day yield at period end. |
| (c) | Mortgage dollar rolls included. |
| (d) | When-issued or forward delivery pools included. |
Interest Only: Interest Only (IO) bonds represent the “interest only” portion of payments on a pool of underlying mortgages or mortgage-backed securities. IO securities are subject to prepayment risk of the pool of underlying mortgages.
Principal Only: Principal Only (PO) bonds represent the “principal only” portion of payments on a pool of underlying mortgages or mortgage-backed securities.
At December 31, 2005, open futures contracts purchased were as follows:
| | | | | | | | | | |
Futures | | Expiration | | Contracts | | Aggregate Face
Value ($) | | Market
Value ($) | | Net Unrealized
Appreciation ($) |
10 Year US Treasury Note | | 3/22/2006 | | 121 | | 13,096,717 | | 13,238,156 | | 141,439 |
At December 31, 2005, open futures contracts sold were as follows:
| | | | | | | | | | | |
Futures | | Expiration | | Contracts | | Aggregate Face
Value ($) | | Market
Value ($) | | Net Unrealized
Depreciation ($) | |
2 Year US Treasury Note | | 3/31/2006 | | 30 | | 6,153,649 | | 6,155,625 | | (1,976 | ) |
10 Year Interest Rate Swap | | 3/13/2006 | | 86 | | 9,220,793 | | 9,301,438 | | (80,645 | ) |
| | | | | | | | | | | |
Total net unrealized depreciation | | (82,621 | ) |
| | | | | | | | | | | |
Included in the portfolio are investments in mortgage or asset-backed securities which are interests in separate pools of mortgages or assets. Effective maturities of these investments may be shorter than stated maturities due to prepayments. Some separate investments in the Federal National Mortgage Association, Government National Mortgage Association and Federal Home Loan Mortgage Corp. issues which have similar coupon rates have been aggregated for presentation purposes in this investment portfolio.
The accompanying notes are an integral part of the financial statements.
143
Financial Statements
Statement of Assets and Liabilities
as of December 31, 2005
| | | | |
Assets | |
Investments Investments in securities, at value (cost $299,989,574) | | $ | 297,675,526 | |
Investments in Cash Management QP Trust, (cost $15,412,261) | | | 15,412,261 | |
Total investments in securities at value, cost ($315,401,835) | | | 313,087,787 | |
Receivable for investments sold | | | 42,445,941 | |
Interest receivable | | | 1,643,842 | |
Receivable for Portfolio shares sold | | | 185,467 | |
Other assets | | | 7,983 | |
| | | | |
Total assets | | | 357,371,020 | |
| | | | |
Liabilities | | | | |
Payable for investments purchased | | | 29,088,756 | |
Payable for when issued and forward delivery securities | | | 11,104,750 | |
Payable for investments purchased — mortgage dollar rolls | | | 26,330,493 | |
Deferred mortgage dollar roll income | | | 17,843 | |
Payable for Portfolio shares redeemed | | | 140,029 | |
Payable for daily variation margin on open futures contracts | | | 5,016 | |
Accrued management fee | | | 139,179 | |
Other accrued expenses and payables | | | 145,305 | |
Total liabilities | | | 66,971,371 | |
| | | | |
Net assets, at value | | $ | 290,399,649 | |
| | | | |
Net Assets | | | | |
Net assets consist of: | | | | |
Undistributed net investment income | | | 10,160,924 | |
Net unrealized appreciation (depreciation) on: | | | | |
Investments | | | (2,314,048 | ) |
Futures | | | 58,818 | |
Accumulated net realized gain (loss) | | | (116,321 | ) |
Paid-in capital | | | 282,610,276 | |
| | | | |
Net assets, at value | | $ | 290,399,649 | |
| | | | |
Class A | | | | |
Net Asset Value, offering and redemption price per share ($243,450,554 ÷ 19,851,802 outstanding shares of beneficial interest, $.01 par value, unlimited number of shares authorized) | | $ | 12.26 | |
| | | | |
Class B | | | | |
Net Asset Value, offering and redemption price per share ($46,949,095 ÷ 3,838,802 outstanding shares of beneficial interest, $.01 par value, unlimited number of shares authorized) | | $ | 12.23 | |
| | | | |
144
Statement of Operations
for the year ended December 31, 2005
| | | | |
Investment Income | | | | |
Income: Interest | | $ | 13,283,012 | |
Interest — Cash Management QP Trust | | | 718,047 | |
Mortgage dollar roll income | | | 950,158 | |
Total Income | | | 14,951,217 | |
Expenses: | | | | |
Management fee | | | 1,713,621 | |
Custodian fees | | | 21,736 | |
Distribution service fees (Class B) | | | 120,593 | |
Record keeping fees (Class B) | | | 63,716 | |
Auditing | | | 59,225 | |
Legal | | | 13,858 | |
Trustees’ fees and expenses | | | 14,404 | |
Reports to shareholders | | | 100,187 | |
Other | | | 54,408 | |
Total expenses before expense reductions | | | 2,161,748 | |
Expense reductions | | | (4,771 | ) |
Total expenses after expense reductions | | | 2,156,977 | |
| | | | |
Net investment income (loss) | | | 12,794,240 | |
| | | | |
Realized and Unrealized Gain (Loss) on Investment Transactions | | | | |
Net realized gain (loss) from: | | | | |
Investments | | | (579,280 | ) |
Futures | | | (206,932 | ) |
Net increase from payments by affiliates and net gains (looses) realized on the disposal of investments in violation of restrictions. | | | — | |
| | | (786,212 | ) |
Net unrealized appreciation (depreciation) during the period on: | | | | |
Investments | | | (4,362,726 | ) |
Futures | | | 38,486 | |
| | | (4,324,240 | ) |
| | | | |
Net gain (loss) on investment transactions | | | (5,110,452 | ) |
| | | | |
Net increase (decrease) in net assets resulting from operations | | $ | 7,683,788 | |
| | | | |
The accompanying notes are an integral part of the financial statements.
145
Statement of Changes in Net Assets
| | | | | | | | |
| | | Years Ended December 31, | |
| | | 2005 | | | 2004 | |
Increase (Decrease) in Net Assets | | | | | | | | |
Operations: | | | | | | | | |
Net investment income (loss) | | $ | 12,794,240 | | | $ | 12,286,972 | |
Net realized gain (loss) on investment transactions | | | (786,212 | ) | | | 1,566,054 | |
Net unrealized appreciation (depreciation) during the period on investment transactions | | | (4,324,240 | ) | | | (1,060,975 | ) |
Net increase (decrease) in net assets resulting from operations | | | 7,683,788 | | | | 12,792,051 | |
Distributions to shareholders from: | | | | | | | | |
Net investment income: | | | | | | | | |
Class A | | | (10,824,223 | ) | | | (8,701,916 | ) |
Class B | | | (1,736,774 | ) | | | (986,391 | ) |
Net realized gains: | | | | | | | | |
Class A | | | (2,099,899 | ) | | | (2,734,888 | ) |
Class B | | | (374,454 | ) | | | (359,519 | ) |
Portfolio share transactions: | | | | | | | | |
Class A | | | | | | | | |
Proceeds from shares sold | | | 24,046,411 | | | | 20,190,555 | |
Reinvestment of distributions | | | 12,924,122 | | | | 11,436,803 | |
Cost of shares redeemed | | | (67,354,142 | ) | | | (97,935,807 | ) |
Net increase (decrease) in net assets from Class A share transactions | | | (30,383,609 | ) | | | (66,308,449 | ) |
Class B | | | | | | | | |
Proceeds from shares sold | | | 3,998,526 | | | | 23,191,368 | |
Reinvestment of distributions | | | 2,111,228 | | | | 1,345,911 | |
Cost of shares redeemed | | | (7,544,629 | ) | | | (13,460,654 | ) |
Net increase (decrease) in net assets from Class B share transactions | | | (1,434,875 | ) | | | 11,076,625 | |
Increase (decrease) in net assets | | | (39,170,046 | ) | | | (55,222,487 | ) |
Net assets at beginning of period | | | 329,569,695 | | | | 384,792,182 | |
| | | | | | | | |
Net assets at end of period (including undistributed net investment income of $10,160,924 and $10,896,663, respectively) | | $ | 290,399,649 | | | $ | 329,569,695 | |
| | | | | | | | |
Other Information | | | | | | | | |
Class A | | | | | | | | |
Shares outstanding at beginning of period | | | 22,309,252 | | | | 27,631,433 | |
Shares sold | | | 1,970,071 | | | | 1,635,527 | |
Shares issued to shareholders in reinvestment of distributions | | | 1,082,422 | | | | 932,855 | |
Shares redeemed | | | (5,509,943 | ) | | | (7,890,563 | ) |
Net increase (decrease) in Class A shares | | | (2,457,450 | ) | | | (5,322,181 | ) |
| | | | | | | | |
Shares outstanding at end of period | | | 19,851,802 | | | | 22,309,252 | |
| | | | | | | | |
Class B | | | | | | | | |
Shares outstanding at beginning of period | | | 3,952,379 | | | | 3,055,787 | |
Shares sold | | | 326,302 | | | | 1,876,522 | |
Shares issued to shareholders in reinvestment of distributions | | | 176,820 | | | | 109,781 | |
Shares redeemed | | | (616,699 | ) | | | (1,089,711 | ) |
Net increase (decrease) in Class B shares | | | (113,577 | ) | | | 896,592 | |
| | | | | | | | |
Shares outstanding at end of period | | | 3,838,802 | | | | 3,952,379 | |
| | | | | | | | |
The accompanying notes are an integral part of the financial statements.
146
Financial Highlights
Class A
| | | | | | | | | | | | | | | | | | | | |
Years Ended December 31, | | 2005 | | | 2004 | | | 2003 | | | 2002 | | | 2001a | |
Selected Per Share Data | | | | | | | | | | | | | | | | | | | | |
Net asset value, beginning of period | | $ | 12.55 | | | $ | 12.54 | | | $ | 12.84 | | | $ | 12.32 | | | $ | 11.96 | |
| | | | | | | | | | | | | | | | | | | | |
Income (loss) from investment operations: | | | | | | | | | | | | | | | | | | | | |
Net investment incomeb | | | .51 | | | | .44 | | | | .31 | | | | .62 | | | | .61 | |
Net realized and unrealized gain (loss) on investment transactions | | | (.20 | ) | | | .03 | | | | (.04 | ) | | | .35 | | | | .25 | |
Total from investment operations | | | .31 | | | | .47 | | | | .27 | | | | .97 | | | | .86 | |
Less distributions from: | | | | | | | | | | | | | | | | | | | | |
Net investment income | | | (.50 | ) | | | (.35 | ) | | | (.35 | ) | | | (.45 | ) | | | (.50 | ) |
Net realized gain on investment transactions | | | (.10 | ) | | | (.11 | ) | | | (.22 | ) | | | — | | | | — | |
Total distributions | | | (.60 | ) | | | (.46 | ) | | | (.57 | ) | | | (.45 | ) | | | (.50 | ) |
| | | | | | | | | | | | | | | | | | | | |
Net asset value, end of period | | $ | 12.26 | | | $ | 12.55 | | | $ | 12.54 | | | $ | 12.84 | | | $ | 12.32 | |
| | | | | | | | | | | | | | | | | | | | |
Total Return (%) | | | 2.57e | | | | 3.75d | | | | 2.26 | | | | 8.05 | | | | 7.48 | |
Ratios to Average Net Assets and Supplemental Data | | | | | | | | | | | | | | | | | | | | |
Net assets, end of period ($ millions) | | | 243 | | | | 280 | | | | 347 | | | | 551 | | | | 305 | |
Ratio of expenses (%) | | | .63 | | | | .61 | | | | .61 | | | | .59 | | | | .60 | |
Ratio of net investment income (%) | | | 4.17 | | | | 3.59 | | | | 2.50 | | | | 4.96 | | | | 5.06 | |
Portfolio turnover rate (%) | | | 191c | | | | 226c | | | | 511c | | | | 534c | | | | 334 | |
| a | As required, effective January 1, 2001, the Portfolio has adopted the provisions of the AICPA Audit and Accounting Guide for Investment Companies and began amortizing premium on debt securities. |
| b | Based on average shares outstanding during the period. |
| c | The portfolio turnover rate including mortgage dollar roll transactions was 325%, 391%, 536% and 651% for the periods ended December 31, 2005, December 31, 2004, December 31, 2003 and December 31, 2002, respectively. |
| d | Reimbursement of $2,420 due to disposal of investments in violation of restrictions had no effect on total return. |
| e | Reimbursement of $234 due to disposal of investments in violation of restrictions had no effect on total return. |
Class B
| | | | | | | | | | | | | | | | |
Years Ended December 31, | | 2005 | | | 2004 | | | 2003 | | | 2002a | |
Selected Per Share Data | | | | | | | | | | | | | | | | |
Net asset value, beginning of period | | $ | 12.52 | | | $ | 12.51 | | | $ | 12.82 | | | $ | 12.36 | |
| | | | | | | | | | | | | | | | |
Income (loss) from investment operations: Net investment incomeb | | | .47 | | | | .40 | | | | .27 | | | | .31 | |
Net realized and unrealized gain (loss) on investment transactions | | | (.21 | ) | | | .02 | | | | (.04 | ) | | | .15 | |
Total from investment operations | | | .26 | | | | .42 | | | | .23 | | | | .46 | |
Less distributions from: Net investment income | | | (.45 | ) | | | (.30 | ) | | | (.32 | ) | | | — | |
Net realized gain on investment transactions | | | (.10 | ) | | | (.11 | ) | | | (.22 | ) | | | — | |
Total distributions | | | (.55 | ) | | | (.41 | ) | | | (.54 | ) | | | — | |
| | | | | | | | | | | | | | | | |
Net asset value, end of period | | $ | 12.23 | | | $ | 12.52 | | | $ | 12.51 | | | $ | 12.82 | |
| | | | | | | | | | | | | | | | |
Total Return (%) | | | 2.24e | | | | 3.36d | | | | 1.83 | | | | 3.72 | ** |
Ratios to Average Net Assets and Supplemental Data | | | | | | | | | | | | | | | | |
Net assets, end of period ($ millions) | | | 47 | | | | 49 | | | | 38 | | | | 3 | |
Ratio of expenses (%) | | | 1.02 | | | | 1.00 | | | | .98 | | | | .84 | * |
Ratio of net investment income (%) | | | 3.78 | | | | 3.21 | | | | 2.13 | | | | 4.95 | * |
Portfolio turnover rate (%) | | | 191c | | | | 226c | | | | 511c | | | | 534c | |
| a | For the period July 1, 2002 (commencement of operations of Class B shares) to December 31, 2002. |
| b | Based on average shares outstanding during the period. |
| c | The portfolio turnover rate including mortgage dollar roll transactions was 325%, 391%, 536% and 651% for the periods ended December 30, 2005, December 31, 2004, December 31, 2003 and December 31, 2002, respectively. |
| d | Reimbursement of $2,420 due to disposal of investments in violation of restrictions had no effect on total return. |
| e | Reimbursement of $234 due to disposal of investments in violation of restrictions had no effect on total return. |
147
Performance Summary December 31, 2005
DWS Growth Allocation VIP
All performance shown is historical, assumes reinvestment of all dividend and capital gain distributions and does not guarantee future results. Investment return and principal value fluctuate with changing market conditions so that, when redeemed, shares may be worth more or less than their original cost. Current performance may be lower or higher than the performance data quoted. Please visit www.dws-scudder.com for the Portfolio’s most recent month-end performance. Performance doesn’t reflect charges and fees (“contract charges”) associated with the separate account that invests in the Portfolio or any variable life insurance policy or variable annuity contract for which the Portfolio is an investment option. These charges and fees will reduce returns.
Diversification does not eliminate risk. The underlying portfolios invest in individual equity and bond funds whose yields and market values fluctuate, so that your investment may be worth more or less than its original cost. In addition, the underlying portfolios are subject to stock market risk, meaning stocks in the Portfolio may decline in value for extended periods of time due to the activities and financial prospects of individual companies, or due to general market and economic conditions. Investing in foreign securities presents certain unique risks not associated with domestic investments, such as currency fluctuation, political and economic changes, and market risks. Derivatives may be more volatile and less liquid than traditional securities, and the Portfolio could suffer losses on its derivative positions. Bond investments are subject to interest-rate risk such that when interest rates rise, the prices of the bonds, and thus the value of the Portfolio, can decline and the investor can lose principal value. Please read this Portfolio’s prospectus for specific details regarding its risk profile.
Portfolio returns shown for all periods reflect a fee waiver and/or expense reimbursement. Without this waiver/reimbursement, returns would have been lower.
Growth of an Assumed $10,000 Investment in DWS Growth Allocation VIP from 8/16/2004 to 12/31/2005
¨ DWS Growth Allocation VIP — Class B
¨ Russell 1000 Index
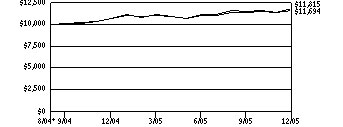
The Russell 1000 Index measures the performance of the 1,000 largest companies in the Russell 3000 Index, which represents approximately 92% of the total market capitalization of the Russell 3000 Index. Index returns assume reinvestment of all dividends and, unlike portfolio returns, do not reflect any fees or expenses. It is not possible to invest directly into an index.
Comparative Results
| | | | | | | | | | |
DWS Growth Allocation VIP | | 1-Year | | | Life of Portfolio* | |
Class B | | Growth of $10,000 | | $ | 10,602 | | | $ | 11,694 | |
| | Average annual total return | | | 6.02 | % | | | 12.08 | % |
Russell 1000 Index | | Growth of $10,000 | | $ | 10,627 | | | $ | 11,815 | |
| | Average annual total return | | | 6.27 | % | | | 13.33 | % |
The growth of $10,000 is cumulative.
| * | The Portfolio commenced operations on August 16, 2004. Index returns begin August 31, 2004. |
148
Information About Your Portfolio’s Expenses
DWS Growth Allocation VIP
As an investor of the Portfolio, you incur two types of costs: ongoing expenses and transaction costs. Ongoing expenses include management fees, distribution and service (12b-1) fees and other Portfolio expenses. Examples of transaction costs include sales charges (loads), redemption fees and account maintenance fees, which are not shown in this section. The following tables are intended to help you understand your ongoing expenses (in dollars) of investing in the Portfolio and to help you compare these expenses with the ongoing expenses of investing in other mutual funds. In addition to the ongoing expenses which the Portfolio bears directly, the Portfolio’s shareholders indirectly bear the expense of the Underlying DWS Portfolios in which the Portfolio invests. The Portfolio’s estimated indirect expense from investing in the Underlying DWS Portfolios is based on its allocation of Underlying DWS Portfolios. In the most recent six-month period, the Portfolio limited these expenses; had it not done so, expenses would have been higher. The tables are based on an investment of $1,000 made at the beginning of the six-month period ended December 31, 2005.
The tables illustrate your Portfolio’s expenses in two ways:
Actual Portfolio Return. This helps you estimate the actual dollar amount of ongoing expenses (but not transaction costs) paid on a $1,000 investment in the Portfolio using the Portfolio’s actual return during the period. To estimate the expenses you paid over the period, simply divide your account value by $1,000 (for example, an $8,600 account value divided by $1,000 = 8.6), then multiply the result by the number in the “Expenses Paid per $1,000” line under the share class you hold.
Hypothetical 5% Portfolio Return. This helps you to compare your Portfolio’s ongoing expenses (but not transaction costs) with those of other mutual funds using the Portfolio’s actual expense ratio and a hypothetical rate of return of 5% per year before expenses. Examples using a 5% hypothetical Portfolio return may be found in the shareholder reports of other mutual funds. The hypothetical account values and expenses may not be used to estimate the actual ending account balance or expenses you paid for the period.
Please note that the expenses shown in these tables are meant to highlight your ongoing expenses only and do not reflect any transaction costs. The “Expenses Paid per $1,000” line of the tables is useful in comparing ongoing expenses only and will not help you determine the relative total expense of owning different funds. If these transaction costs had been included, your costs would have been higher.
Direct Portfolio Expenses and Value of a $1,000 Investment for the six months ended December 31, 2005
| | | |
Actual Portfolio Return | | Class B |
Beginning Account Value 7/1/05 | | $ | 1,000.00 |
Ending Account Value 12/31/05 | | $ | 1,056.10 |
Expenses Paid per $1,000* | | $ | 3.01 |
| |
Hypothetical 5% Portfolio Return | | Class B |
Beginning Account Value 7/1/05 | | $ | 1,000.00 |
Ending Account Value 12/31/05 | | $ | 1,022.28 |
Expenses Paid per $1,000* | | $ | 2.96 |
Direct Portfolio Expenses and Estimated Indirect Underlying DWS Portfolio Expenses and Value of a $1,000 Investment for the six months ended December 31, 2005
| | | |
Actual Portfolio Return | | Class B |
Beginning Account Value 7/1/05 | | $ | 1,000.00 |
Ending Account Value 12/31/05 | | $ | 1,056.10 |
Expenses Paid per $1,000** | | $ | 6.58 |
| |
Hypothetical 5% Portfolio Return | | Class B |
Beginning Account Value 7/1/05 | | $ | 1,000.00 |
Ending Account Value 12/31/05 | | $ | 1,018.80 |
Expenses Paid per $1,000** | | $ | 6.46 |
| * | Expenses are equal to the Portfolio’s annualized expense ratio for the share class, multiplied by the average account value over the period, multiplied by the number of days in the most recent six-month period, then divided by 365. |
| ** | Expenses are equal to the Portfolio’s annualized expense ratio for the share class plus the estimated indirect expense from investing in underlying portfolios in which the Portfolio invests, multiplied by the average account value over the period, multiplied by the number of days in the most recent six-month period, then divided by 365. |
| | | |
Annualized Expense Ratios | | Class B | |
Direct Portfolio Expense Ratio | | .58 | % |
Estimated Indirect Expenses of Underlying DWS Portfolios | | .69 | % |
Estimated Net Annual Portfolio and Underlying DWS Portfolios Expenses | | 1.27 | % |
For more information, please refer to the Portfolio’s prospectus.
These tables do not reflect charges and fees (“contract charges”) associated with the separate account that invests in the portfolio or any variable life insurance policy or variable annuity contract for which the portfolio is an investment option.
149
Management Summary December 31, 2005
DWS Growth Allocation VIP
The US economy posted positive growth for all four quarters of 2005, with concerns about inflation and the sustainability of the economic expansion seeming to abate as the year progressed. All major asset classes — equities, bonds and cash — had positive returns for the year, and returns of the various asset classes were generally close to one another.
For the 12 months ended December 31, 2005, DWS Growth Allocation VIP had a return of 6.02% (Class B shares, unadjusted for contract charges). Since this Portfolio invests in underlying portfolios from a broad array of investment styles, performance is analyzed by comparing the Portfolio’s return with the returns of indices that represent the major asset classes. As anticipated, since this Portfolio invests in a blend of equity and bond securities, its return was above that of the major bond indices but below that of the equity indices. This Portfolio outperformed its Lipper peer group of Lipper Flexible Portfolio Funds category, which had an average return of 4.88%. The Portfolio’s strategic allocation of 75% equity and 25% fixed income contributed to performance relative to the peer group because the allocation for funds in the group averages 60% equities and 40% bonds.
The Portfolio’s allocation between stocks and bonds remained close to its target of 75% equity and 25% fixed income during 2005, but with equities above 75% in 11 months of the year. This overweight was positive for returns, as equities outperformed bonds. An especially positive factor in performance was an overweight in international equities through most of the year, as foreign markets were stronger than the US market; however, a reduction in the international position late in the year detracted from performance.
In the equity portion of the Portfolio, a slight bias toward value-oriented holdings established in July detracted from performance. Among underlying equity funds, large-cap funds contributed to positive relative performance, with seven of the 10 funds achieving performance above the Russell 1000 Index. Several of the growth-oriented funds that were overweight in energy, a sector that was strong during 2005, performed particularly well. The two small-cap portfolios did well, so that small cap made a net contribution to overall performance, even though small-cap stocks as a category underperformed large-cap stocks.
Within the fixed-income portion of the Portfolio (which comprises cash equivalents and bonds), performance of the high-yield portion was excellent, with returns significantly above the high-yield benchmark, the Credit Suisse First Boston High Yield Index. However, since this is a small position that was underweighted, the strong performance did not offset underperformance of the much larger investment-grade bond portion.
Inna Okounkova Robert Wang
Co-Managers, Deutsche Investment Management Americas Inc.
All performance shown is historical, assumes reinvestment of all dividend and capital gain distributions, and does not guarantee future results. Investment return and principal value fluctuate with changing market conditions so that, when redeemed, shares may be worth more or less than their original cost. Current performance may be lower or higher than the performance data quoted. Please visit www.dws-scudder.com for the product’s most recent month-end performance. Performance doesn’t reflect charges and fees (“contract charges”) associated with the separate account that invests in the Portfolio or any variable life insurance policy or variable annuity contract for which the Portfolio is an investment option. These charges and fees will reduce returns.
Risk Considerations
Diversification does not eliminate risk. The underlying portfolios invest in individual equity and bond funds whose yields and market values fluctuate, so that your investment may be worth more or less than its original cost. In addition, the underlying portfolios are subject to stock market risk, meaning stocks in the Portfolio may decline in value for extended periods of time due to the activities and financial prospects of individual companies, or due to general market and economic conditions. Investing in foreign securities presents certain unique risks not associated with domestic investments, such as currency fluctuation, political and economic changes, and market risks. Derivatives may be more volatile and less liquid than traditional securities, and the Portfolio could suffer losses on its derivative positions. Bond investments are subject to interest-rate risk such that when interest rates rise, the prices of the bonds, and thus the value of the Portfolio, can decline and the investor can lose principal value. Please read this Portfolio’s prospectus for specific details regarding its risk profile.
Credit Suisse (CS) First Boston High Yield Index is an unmanaged, unleveraged, trader-priced portfolio constructed to mirror the global high-yield debt market.
The Russell 1000 Index is an unmanaged index that measures the performance of the 1,000 largest companies in the Russell 3000 Index, which represents approximately 92% of the total market capitalization of the Russell 3000 Index.
The Lipper Flexible Portfolio is a category that allocates its investments across various asset classes, including domestic common stocks, bonds, and money market instruments with a focus on total return.
Equities are represented by the Russell 1000 Index, which is a price-only index of the 1,000 largest capitalized companies domiciled in the United States. Bonds are represented by the Lehman Brothers Aggregate Bond Index which measures domestic taxable investment-grade bonds. Cash is represented by the rate of return of 3-month Treasury bills.
Index returns assume reinvested dividends and, unlike portfolio returns, do not reflect any fees or expenses. It is not possible to invest directly into an index or Lipper category.
Portfolio management market commentary is as of December 31, 2005, and may not come to pass. This information is subject to change at any time based on market and other conditions.
150
Portfolio Summary
DWS Growth Allocation VIP
| | | | | | |
Asset Allocation | | 12/31/05 | | | 12/31/04 | |
Equity Funds | | 75 | % | | 73 | % |
Fixed Income Funds | | 14 | % | | 25 | % |
Cash Equivalents | | 11 | % | | 2 | % |
| | | | | | |
| | 100 | % | | 100 | % |
| | | | | | |
Asset allocation is subject to change.
For more complete details about the Portfolio’s investment portfolio, see page 129. A quarterly Fact Sheet is available upon request. Information concerning portfolio holdings of the Portfolio as of month end will be posted to www.dws-scudder.com on the 15th of the following month.
Following the Portfolio’s fiscal first and third quarter-end, a complete portfolio holdings listing is filed with the SEC on Form N-Q. The form will be available on the SEC’s Web site at www.sec.gov, and it also may be reviewed and copied at the SEC’s Public Reference Room in Washington, D.C. Information on the operation of the SEC’s Public Reference Room may be obtained by calling (800) SEC-0330.
151
Investment Portfolio December 31, 2005
DWS Growth Allocation VIP
| | | | |
| | | Shares | | Value ($) |
Equity Funds 75.4% | | | | |
DWS Blue Chip VIP “A” | | 1,078,695 | | 16,050,984 |
DWS Capital Growth VIP “A” | | 496,327 | | 8,387,928 |
DWS Davis Venture Value VIP “A” | | 793,087 | | 9,905,657 |
DWS Dreman High Return Equity VIP “A” | | 501,178 | | 6,720,793 |
DWS Dreman Small Cap Value VIP “A” | | 476,879 | | 9,528,045 |
DWS Global Opportunities VIP “A” | | 5,137 | | 77,052 |
DWS Growth and Income VIP “A” | | 3,041,589 | | 29,564,249 |
DWS International Select Equity VIP “A” | | 72,040 | | 954,524 |
DWS International VIP “A” | | 795,861 | | 8,635,091 |
DWS Janus Growth Opportunities VIP “A” | | 1,243,548 | | 10,396,065 |
DWS Large Cap Value VIP “A” | | 1,200,895 | | 18,986,151 |
DWS MFS Strategic Value VIP “A” | | 995,701 | | 10,663,963 |
DWS Mid Cap Growth VIP “A” | | 103,545 | | 1,172,134 |
DWS RREEF Real Estate Securities VIP “A” | | 308,398 | | 5,113,241 |
DWS Small Cap Growth VIP “A” | | 480,953 | | 6,483,241 |
DWS Templeton Foreign Value VIP “A” | | 537,340 | | 6,141,803 |
| | | | |
Total Equity Funds (Cost $140,987,890) | | | | 148,780,921 |
| | | | |
Fixed Income Funds 13.3% | | | | |
DWS Core Fixed Income VIP “A” | | 1,882,349 | | 22,230,543 |
DWS Government & Agency Securities VIP “A” | | 110,080 | | 1,349,577 |
DWS High Income VIP “A” | | 159,386 | | 1,311,744 |
DWS Strategic Income VIP “A” | | 113,998 | | 1,310,977 |
| | | | |
Total Fixed Income Funds (Cost $26,181,725) | | | | 26,202,841 |
| | | | |
Cash Equivalents 11.1% | | | | |
Cash Management QP Trust, 4.26% (a) (Cost $22,024,443) | | 22,024,442 | | 22,024,443 |
| | | | |
| | |
| | | % of Net Assets | | Value ($) |
Total Investment Portfolio (Cost $189,194,058)+ | | 99.8 | | 197,008,205 |
| | | | |
Other Assets and Liabilities, Net | | 0.2 | | 373,899 |
| | | | |
Net Assets | | 100.0 | | 197,382,104 |
| | | | |
Notes to DWS Growth Allocation VIP Portfolio of Investments
| + | The cost for federal income tax purposes was $189,304,861. At December 31, 2005, net unrealized appreciation for all securities based on tax cost was $7,703,344. This consisted of aggregate gross unrealized appreciation for all securities in which there was an excess of value over tax cost of $8,420,913 and aggregate gross unrealized depreciation for all securities in which there was an excess of tax cost over value of $717,569. |
| (a) | Cash Management QP Trust, an affiliated fund, is managed by Deutsche Investment Management Americas Inc. The rate shown is the annualized seven-day yield at period end. |
The accompanying notes are an integral part of the financial statements.
152
Financial Statements
Statement of Assets and Liabilities
as of December 31, 2005
| | | |
Assets |
Investments: | | | |
Investments in Underlying Affiliated Portfolios, at value (cost $167,169,615) | | $ | 174,983,762 |
Investment in Cash Management QP Trust (cost $22,024,443) | | | 22,024,443 |
Total investments in securities, at value (cost $189,194,058) | | | 197,008,205 |
Interest receivable | | | 74,953 |
Receivable for Portfolio shares sold | | | 441,076 |
Other assets | | | 3,836 |
| | | |
Total assets | | | 197,528,070 |
| | | |
Liabilities | | | |
Payable for Portfolio shares redeemed | | | 11,247 |
Accrued management fee | | | 16,706 |
Other accrued expenses and payables | | | 118,013 |
| | | |
Total liabilities | | | 145,966 |
| | | |
Net assets, at value | | $ | 197,382,104 |
| | | |
Net Assets | | | |
Net assets consist of: | | | |
Undistributed net investment income | | | 1,575,496 |
Net unrealized appreciation (depreciation) on investments | | | 7,814,147 |
Accumulated net realized gain (loss) | | | 1,522,296 |
Paid-in capital | | | 186,470,165 |
| | | |
Net assets, at value | | $ | 197,382,104 |
| | | |
Class B | | | |
Net Asset Value, offering and redemption price per share ($197,382,104 ÷ 16,920,311 outstanding shares of beneficial interest, $.01 par value, unlimited number of shares authorized) | | $ | 11.67 |
153
Statement of Operations
for the year ended December 31, 2005
| | | | |
Investment Income | | | | |
Income: | | | | |
Income distribution from Underlying Affiliated Portfolios | | $ | 1,402,778 | |
Interest — Cash Management QP Trust | | | 388,363 | |
| | | | |
Total Income | | | 1,791,141 | |
| | | | |
Expenses: | | | | |
Management fee | | | 166,261 | |
Custodian and accounting fees | | | 69,372 | |
Distribution service fees (Class B) | | | 277,101 | |
Record keeping fees (Class B) | | | 155,419 | |
Auditing | | | 17,967 | |
Legal | | | 15,122 | |
Trustees’ fees and expenses | | | 3,029 | |
Reports to shareholders | | | 12,395 | |
Offering costs | | | 587 | |
Other | | | 2,062 | |
Total expenses before expense reductions | | | 719,315 | |
Expense reductions | | | (55,420 | ) |
Total expenses after expense reductions | | | 663,895 | |
| | | | |
Net investment income (loss) | | | 1,127,246 | |
| | | | |
Realized and Unrealized Gain (Loss) on Investment Transactions | | | | |
Net realized gain (loss) from investments | | | 815,491 | |
Capital gain distributions from Underlying Affiliated Portfolios | | | 1,163,175 | |
| | | 1,978,666 | |
Net unrealized appreciation (depreciation) during the period on investments | | | 5,737,112 | |
Net gain (loss) on investment transactions | | | 7,715,778 | |
| | | | |
Net increase (decrease) in net assets resulting from operations | | $ | 8,843,024 | |
| | | | |
The accompanying notes are an integral part of the financial statements.
154
Statement of Changes in Net Assets
| | | | | | | | |
Increase (Decrease) in Net Assets | | Year Ended
December 31,
2005 | | | Period Ended
December 31,
2004a | |
Operations: | | | | | | | | |
Net investment income (loss) | | $ | 1,127,246 | | | $ | (51,234 | ) |
Net realized gain (loss) on investment transactions | | | 1,978,666 | | | | 143,332 | |
Net unrealized appreciation (depreciation) during the period on investment transactions | | | 5,737,112 | | | | 2,077,035 | |
Net increase (decrease) in net assets resulting from operations | | | 8,843,024 | | | | 2,169,133 | |
Distributions to shareholders from: | | | | | | | | |
Net realized gains: | | | | | | | | |
Class B | | | (144,613 | ) | | | — | |
Portfolio share transactions: | | | | | | | | |
Class B | | | | | | | | |
Proceeds from shares sold | | | 143,559,919 | | | | 45,093,561 | |
Reinvestment of distributions | | | 144,613 | | | | — | |
Cost of shares redeemed | | | (2,017,170 | ) | | | (266,363 | ) |
Net increase (decrease) in net assets from Class B share transactions | | | 141,687,362 | | | | 44,827,198 | |
Increase (decrease) in net assets | | | 150,385,773 | | | | 46,996,331 | |
Net assets at beginning of period | | | 46,996,331 | | | | — | |
| | | | | | | | |
Net assets at end of period (including undistributed net investment income of $1,575,496 and $0, respectively) | | $ | 197,382,104 | | | $ | 46,996,331 | |
| | | | | | | | |
Other Information | | | | | | | | |
Class B | | | | | | | | |
Shares outstanding at beginning of period | | | 4,262,187 | | | | — | |
Shares sold | | | 12,825,648 | | | | 4,287,740 | |
Shares issued to shareholders in reinvestment of distributions | | | 13,341 | | | | — | |
Shares redeemed | | | (180,865 | ) | | | (25,553 | ) |
Net increase (decrease) in Class B shares | | | 12,658,124 | | | | 4,262,187 | |
| | | | | | | | |
Shares outstanding at end of period | | | 16,920,311 | | | | 4,262,187 | |
| | | | | | | | |
| a | For the period from August 16, 2004 (commencement of operations) to December 31, 2004. |
The accompanying notes are an integral part of the financial statements.
155
Financial Highlights
Class B
| | | | | | | | |
Years Ended December 31, | | 2005 | | | 2004a | |
Selected Per Share Data | |
Net asset value, beginning of period | | $ | 11.03 | | | $ | 10.00 | |
Income (loss) from investment operations: | | | | | | | | |
Net investment income (loss)b | | | .11 | | | | (.03 | ) |
Net realized and unrealized gain (loss) on investment transactions | | | .55 | | | | 1.06 | |
Total from investment operations | | | .66 | | | | 1.03 | |
Less distributions from: | | | | | | | | |
Net realized gain on investment transactions | | | (.02 | ) | | | — | |
| | | | | | | | |
Net asset value, end of period | | $ | 11.67 | | | $ | 11.03 | |
| | | | | | | | |
Total Return (%)c,d | | | 6.02 | | | | 10.30 | ** |
Ratios to Average Net Assets and Supplemental Data | | | | | | | | |
Net assets, end of period ($ millions) | | | 197 | | | | 47 | |
Ratio of expenses before expense reductions (%)e | | | .65 | | | | 1.38 | * |
Ratio of expenses after expense reductions (%)e | | | .60 | | | | 0.75 | * |
Ratio of net investment income (%) | | | 1.01 | | | | (0.69 | )* |
Portfolio turnover rate (%) | | | 20 | | | | 15 | * |
| a | For the period from August 16, 2004 (commencement of operations) to December 31, 2004. |
| b | Based on average shares outstanding during the period. |
| c | Total return would have been lower had certain expenses not been reduced. |
| d | Total return would have been lower if the Advisor had not maintained some Underlying Portfolios’ expenses. |
| e | The Portfolio invests in other DWS Portfolios and indirectly bears its proportionate share of fees and expenses incurred by the Underlying DWS Portfolios in which the Portfolio is invested. |
156
Performance Summary December 31, 2005
DWS High Income VIP
All performance shown is historical, assumes reinvestment of all dividend and capital gain distributions and does not guarantee future results. Investment return and principal value fluctuate with changing market conditions so that, when redeemed, shares may be worth more or less than their original cost. Current performance may be lower or higher than the performance data quoted. Please visit www.dws-scudder.com for the Portfolio’s most recent month-end performance. Performance doesn’t reflect charges and fees (“contract charges”) associated with the separate account that invests in the Portfolio or any variable life insurance policy or variable annuity contract for which the Portfolio is an investment option. These charges and fees will reduce returns. While all share classes have the same underlying portfolio, their performance will differ.
Investing in foreign securities presents certain unique risks not associated with domestic investments, such as currency fluctuation, political and economic changes and market risks. Additionally, the Portfolio may invest in lower-quality and nonrated securities which present greater risk of loss of principal and interest than higher-quality securities. All of these factors may result in greater share price volatility. Bond investments are subject to interest-rate risk such that when interest rates rise, the prices of the bonds, and thus the value of the bond fund, can decline and the investor can lose principal value. Please read this Portfolio’s prospectus for specific details regarding its investments and risk profile.
Growth of an Assumed $10,000 Investment in DWS High Income VIP
¨ DWS High Income VIP — Class A
¨ Credit Suisse High Yield Index
¨ Citigroup Long-Term High Yield Bond Index
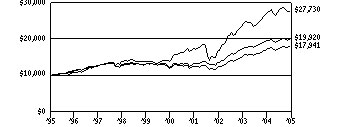
Yearly periods ended December 31
The Credit Suisse High Yield Index (CSFB) is an unmanaged index that is market- weighted, including publicly traded bonds having a rating below BBB by Standard & Poor’s and Moody’s. The Citigroup Long-Term High Yield Bond Index (formerly known as Salomon Smith Barney Long-Term High Yield Bond Index) is an unmanaged index that is on a total return basis with all dividends reinvested and is composed of high-yield bonds with a par value of $50 million or higher and a remaining maturity of ten years or longer rated BB+ or lower by Standard & Poor’s Corporation or Ba1 or lower by Moody’s Investors Service, Inc.
Index returns assume reinvested dividends and, unlike Portfolio returns, do not reflect any fees or expenses. It is not possible to invest directly into an index.
| | | | | | | | | | | | | | | | | | |
Comparative Results | |
DWS High Income VIP | | 1-Year | | | 3-Year | | | 5-Year | | | 10-Year | |
| Class A | | Growth of $10,000 | | $ | 10,389 | | | $ | 14,554 | | | $ | 14,891 | | | $ | 17,941 | |
| | Average annual total return | | | 3.89 | % | | | 13.32 | % | | | 8.29 | % | | | 6.02 | % |
| Credit Suisse High Yield Index | | Growth of $10,000 | | $ | 10,226 | | | $ | 14,647 | | | $ | 15,978 | | | $ | 19,920 | |
| | Average annual total return | | | 2.26 | % | | | 13.57 | % | | | 9.83 | % | | | 7.13 | % |
| Citigroup Long-Term High Yield Bond Index | | Growth of $10,000 | | $ | 10,223 | | | $ | 16,370 | | | $ | 19,382 | | | $ | 27,730 | |
| | Average annual total return | | | 2.23 | % | | | 17.86 | % | | | 14.15 | % | | | 10.74 | % |
| | | |
DWS High Income VIP | | | 1-Year | | | 3-Year | | | Life of Class* | |
| Class B | | Growth of $10,000 | | | | | | $ | 10,341 | | | $ | 14,389 | | | $ | 14,748 | |
| | Average annual total return | | | | | | | 3.41 | % | | | 12.89 | % | | | 11.74 | % |
| Credit Suisse High Yield Index | | Growth of $10,000 | | | | | | $ | 10,226 | | | $ | 14,647 | | | $ | 15,078 | |
| | Average annual total return | | | | | | | 2.26 | % | | | 13.57 | % | | | 12.42 | % |
| Citigroup Long-Term High Yield Bond Index | | Growth of $10,000 | | | | | | $ | 10,223 | | | $ | 16,370 | | | $ | 17,902 | |
| | Average annual total return | | | | | | | 2.23 | % | | | 17.86 | % | | | 18.06 | % |
The growth of $10,000 is cumulative.
| * | The Portfolio commenced offering Class B shares on July 1, 2002. Index returns begin June 30, 2002. |
157
Information About Your Portfolio’s Expenses
DWS High Income VIP
As an investor of the Portfolio, you incur two types of costs: ongoing expenses and transaction costs. Ongoing expenses include management fees, distribution and service (12b-1) fees and other Portfolio expenses. Examples of transaction costs include sales charges (loads), redemption fees and account maintenance fees, which are not shown in this section. The following tables are intended to help you understand your ongoing expenses (in dollars) of investing in the Portfolio and to help you compare these expenses with the ongoing expenses of investing in other mutual funds. The tables are based on an investment of $1,000 made at the beginning of the six-month period ended December 31, 2005.
The tables illustrate your Portfolio’s expenses in two ways:
Actual Portfolio Return. This helps you estimate the actual dollar amount of ongoing expenses (but not transaction costs) paid on a $1,000 investment in the Portfolio using the Portfolio’s actual return during the period. To estimate the expenses you paid over the period, simply divide your account value by $1,000 (for example, an $8,600 account value divided by $1,000 = 8.6), then multiply the result by the number in the “Expenses Paid per $1,000” line under the share class you hold.
Hypothetical 5% Portfolio Return. This helps you to compare your Portfolio’s ongoing expenses (but not transaction costs) with those of other mutual funds using the Portfolio’s actual expense ratio and a
hypothetical rate of return of 5% per year before expenses. Examples using a 5% hypothetical Portfolio return may be found in the shareholder reports of other mutual funds. The hypothetical account values and expenses may not be used to estimate the actual ending account balance or expenses you paid for the period.
Please note that the expenses shown in these tables are meant to highlight your ongoing expenses only and do not reflect any transaction costs. The “Expenses Paid per $1,000” line of the tables is useful in comparing ongoing expenses only and will not help you determine the relative total expense of owning different funds. If these transaction costs had been included, your costs would have been higher.
Expenses and Value of a $1,000 Investment for the six months ended December 31, 2005
| | | | | | |
Actual Portfolio Return | | Class A | | Class B |
Beginning Account Value 7/1/05 | | $ | 1,000.00 | | $ | 1,000.00 |
Ending Account Value 12/31/05 | | $ | 1,030.00 | | $ | 1,026.20 |
Expenses Paid per $1,000* | | $ | 3.74 | | $ | 5.82 |
| | |
Hypothetical 5% Portfolio Return | | Class A | | Class B |
Beginning Account Value 7/1/05 | | $ | 1,000.00 | | $ | 1,000.00 |
Ending Account Value 12/31/05 | | $ | 1,021.53 | | $ | 1,019.46 |
Expenses Paid per $1,000* | | $ | 3.72 | | $ | 5.80 |
| * | Expenses are equal to the Portfolio’s annualized expense ratio for each share class, multiplied by the average account value over the period, multiplied by the number of days in the most recent six-month period, then divided by 365. |
| | | | | | |
Annualized Expense Ratios | | Class A | | | Class B | |
DWS Variable Series II — DWS High Income VIP | | .73 | % | | 1.14 | % |
For more information, please refer to the Portfolio’s prospectus.
These tables do not reflect charges and fees (“contract charges”) associated with the separate account that invests in the Portfolio or any variable life insurance policy or variable annuity contract for which the Portfolio is an investment option.
158
Management Summary December 31, 2005
DWS High Income VIP
High-yield was one of the best-performing areas within the bond market in 2005. Despite concerns about rising interest rates, higher commodity prices and the impact of the Gulf Coast hurricanes, the market’s solid fundamental underpinnings remained in place. Helped by low interest rates and the strength of the US economy, high-yield companies generally maintained sound financial positions. Probably the best indication of solid fundamentals in the high yield market was the continuation of low defaults — at year-end Moody’s 12-month rolling default rate stood at 1.80%, lower than at the close of 2004.
The portfolio’s Class A shares produced a return of 3.89% in 2005 (Class A shares unadjusted for contract charges). We remained focused on adding value by doing fundamental research rather than making broad predictions about sector performance or interest rates. Overweight positions in General Motors Acceptance Corporation and emerging market bonds were positive contributors to return. An underweight in Adelphia Communications (not in the portfolio at the end of the reporting period) also helped, as did an overweight in middle-tier securities. However, overweight positions in Tembec Industries Inc. and GEO Specialty Chemicals detracted from results.
The robust economy continues to translate into sound fundamentals for the high-yield market. Still, we believe the low default environment the high-yield market currently enjoys will not last forever, meaning that good security selection is paramount at this point in the cycle.
Andrew P. Cestone
Lead Manager
Deutsche Investment Management Americas Inc.
All performance shown is historical, assumes reinvestment of all dividend and capital gain distributions, and does not guarantee future results. Investment return and principal value fluctuate with changing market conditions so that, when redeemed, shares may be worth more or less than their original cost. Current performance may be lower or higher than the performance data quoted. Please visit www.dws-scudder.com for the product’s most recent month-end performance. Performance doesn’t reflect charges and fees (“contract charges”) associated with the separate account that invests in the Portfolio or any variable life insurance policy or variable annuity contract for which the Portfolio is an investment option. These charges and fees will reduce returns.
Risk Considerations
Investing in foreign securities presents certain unique risks not associated with domestic investments, such as currency fluctuation, political and economic changes and market risks. Additionally, the Portfolio may invest in lower-quality and nonrated securities which present greater risk of loss of principal and interest than higher-quality securities. All of these factors may result in greater share price volatility. Bond investments are subject to interest-rate risk such that when interest rates rise, the prices of the bonds, and thus the value of the bond fund, can decline and the investor can lose principal value. Please read this Portfolio’s prospectus for specific details regarding its investments and risk profile.
The quality ratings represent the lower of Moody’s Investors Service, Inc. (“Moody’s”) or Standard & Poor’s Corporation (“S&P”) credit ratings. The ratings of Moody’s and S&P represent their opinions as to the quality of the securities they rate. Ratings are relative and subjective and are not absolute standards of quality. The Portfolio’s credit quality does not remove market risk.
Portfolio management market commentary is as of December 31, 2005, and may not come to pass. This information is subject to change at any time based on market and other conditions.
159
Portfolio Summary
DWS High Income VIP
| | | | | | |
Asset Allocation (Excludes Securities Lending Collateral) | | 12/31/05 | | | 12/31/04 | |
Corporate Bonds | | 80 | % | | 74 | % |
Foreign Bonds — US$ Denominated | | 13 | % | | 20 | % |
Cash Equivalents | | 2 | % | | 2 | % |
Foreign Bonds — Non US$ Denominated | | 1 | % | | 2 | % |
Asset Backed | | 1 | % | | 1 | % |
Convertible Bonds | | 1 | % | | 1 | % |
Loan Participations | | 1 | % | | — | |
Stocks | | 1 | % | | — | |
| | | | | | |
| | 100 | % | | 100 | % |
| | | | | | |
| | | | | | |
Corporate and Foreign Bond Sector Diversification (Excludes Cash Equivalents and Securities Lending Collateral) | | 12/31/05 | | | 12/31/04 | |
Consumer Discretionary | | 24 | % | | 24 | % |
Financials | | 15 | % | | 9 | % |
Industrials | | 14 | % | | 14 | % |
Materials | | 14 | % | | 16 | % |
Telecommunication Services | | 9 | % | | 14 | % |
Energy | | 8 | % | | 7 | % |
Utilities | | 6 | % | | 5 | % |
Information Technology | | 3 | % | | 2 | % |
Consumer Staples | | 3 | % | | 4 | % |
Health Care | | 3 | % | | 3 | % |
Sovereign Bonds | | 1 | % | | 2 | % |
| | | | | | |
| | 100 | % | | 100 | % |
| | | | | | |
Asset allocation and sector diversification are subject to change.
For more complete details about the Portfolio’s investment portfolio, see page 6. A quarterly Fact Sheet is available upon request. Information concerning portfolio holdings of the Portfolio as of month end will be posted to www.dws-scudder.com on the 15th of the following month.
Following the Portfolio’s fiscal first and third quarter-end, a complete portfolio holdings listing is filed with the SEC on Form N-Q. The form will be available on the SEC’s Web site at www.sec.gov, and it also may be reviewed and copied at the SEC’s Public Reference Room in Washington, D.C. Information on the operation of the SEC’s Public Reference Room may be obtained by calling (800) SEC-0330.
160
Investment Portfolio December 31, 2005
DWS High Income VIP
| | | | |
| | | Principal Amount ($)(a) | | Value ($) |
Corporate Bonds 79.1% | | | | |
Consumer Discretionary 20.4% | | | | |
155 East Tropicana LLC, 8.75%, 4/1/2012 (b) | | 855,000 | | 822,937 |
Adesa, Inc., 7.625%, 6/15/2012 | | 325,000 | | 323,375 |
Affinia Group, Inc., 9.0%, 11/30/2014 | | 1,310,000 | | 1,034,900 |
AMC Entertainment, Inc., 8.0%, 3/1/2014 (b) | | 1,635,000 | | 1,479,675 |
AutoNation, Inc., 9.0%, 8/1/2008 | | 940,000 | | 1,009,325 |
Aztar Corp., 7.875%, 6/15/2014 (b) | | 2,115,000 | | 2,215,462 |
Cablevision Systems Corp., Series B, 8.716%**, 4/1/2009 | | 390,000 | | 393,900 |
Caesars Entertainment, Inc.: | | | | |
8.875%, 9/15/2008 | | 485,000 | | 524,406 |
9.375%, 2/15/2007 | | 580,000 | | 603,925 |
Charter Communications Holdings LLC: | | | | |
9.625%, 11/15/2009 | | 500,000 | | 370,000 |
10.25%, 9/15/2010 (b) | | 3,210,000 | | 3,193,950 |
144A, 11.0%, 10/1/2015 | | 3,337,000 | | 2,803,080 |
Cooper-Standard Automotive, Inc., 8.375%, 12/15/2014 (b) | | 1,575,000 | | 1,197,000 |
CSC Holdings, Inc.: | | | | |
7.25%, 7/15/2008 | | 535,000 | | 533,663 |
7.875%, 12/15/2007 | | 1,869,000 | | 1,901,707 |
Dex Media East LLC/Financial, 12.125%, 11/15/2012 | | 4,832,000 | | 5,653,440 |
Dura Operating Corp., Series B, 8.625%, 4/15/2012 (b) | | 1,480,000 | | 1,221,000 |
EchoStar DBS Corp., 6.625%, 10/1/2014 | | 520,000 | | 498,550 |
Foot Locker, Inc., 8.5%, 1/15/2022 | | 920,000 | | 972,900 |
Ford Motor Co., 7.45%, 7/16/2031 (b) | | 240,000 | | 163,200 |
General Motors Corp., 8.25%, 7/15/2023 (b) | | 230,000 | | 147,775 |
Goodyear Tire & Rubber Co.: | | | | |
144A, 9.0%, 7/1/2015 | | 50,000 | | 49,250 |
11.25%, 3/1/2011 | | 2,075,000 | | 2,324,000 |
Gregg Appliances, Inc., 9.0%, 2/1/2013 | | 385,000 | | 348,425 |
GSC Holdings Corp., 144A, 8.0%, 10/1/2012 (b) | | 1,670,000 | | 1,569,800 |
Hertz Corp., 144A, 8.875%, 1/1/2014 (b) | | 1,885,000 | | 1,920,344 |
ITT Corp., 7.375%, 11/15/2015 | | 500,000 | | 542,500 |
Jacobs Entertainment, Inc., 11.875%, 2/1/2009 | | 3,605,000 | | 3,825,806 |
Levi Strauss & Co.: | | | | |
8.804%**, 4/1/2012 | | 820,000 | | 826,150 |
12.25%, 12/15/2012 | | 175,000 | | 195,125 |
Liberty Media Corp.: | | | | |
5.7%, 5/15/2013 (b) | | 50,000 | | 46,588 |
7.875%, 7/15/2009 (b) | | 45,000 | | 47,417 |
8.5%, 7/15/2029 (b) | | 205,000 | | 203,017 |
Mandalay Resort Group, Series B, 10.25%, 8/1/2007 | | 390,000 | | 415,838 |
Mediacom Broadband LLC, 144A, 8.5%, 10/15/2015 | | 605,000 | | 560,381 |
161
| | | | |
| | | Principal Amount ($)(a) | | Value ($) |
Mediacom LLC, 9.5%, 1/15/2013 (b) | | 295,000 | | 287,994 |
MGM MIRAGE: | | | | |
8.375%, 2/1/2011 (b) | | 1,675,000 | | 1,792,250 |
9.75%, 6/1/2007 | | 950,000 | | 1,001,062 |
MTR Gaming Group, Inc., Series B, 9.75%, 4/1/2010 | | 600,000 | | 640,500 |
NCL Corp., 10.625%, 7/15/2014 | | 755,000 | | 779,538 |
Norcraft Holdings/Capital, Step-up Coupon, 0% to 9/1/2008, 9.75% to 9/1/2012 | | 1,840,000 | | 1,306,400 |
Paxson Communications Corp., Step-up Coupon, 0% to 1/15/2006, 12.25% to 1/15/2009 (b) | | 210,000 | | 222,338 |
Petro Stopping Centers, 9.0%, 2/15/2012 (b) | | 1,161,000 | | 1,166,805 |
Pinnacle Entertainment, Inc., 8.75%, 10/1/2013 (b) | | 1,710,000 | | 1,821,150 |
Premier Entertainment Biloxi LLC/Finance, 10.75%, 2/1/2012 | | 1,788,000 | | 1,725,420 |
PRIMEDIA, Inc.: | | | | |
8.875%, 5/15/2011 | | 630,000 | | 581,175 |
9.715%**, 5/15/2010 (b) | | 1,915,000 | | 1,840,794 |
Renaissance Media Group LLC, 10.0%, 4/15/2008 | | 955,000 | | 956,194 |
Resorts International Hotel & Casino, Inc., 11.5%, 3/15/2009 | | 2,145,000 | | 2,375,587 |
Schuler Homes, Inc., 10.5%, 7/15/2011 (b) | | 1,455,000 | | 1,564,125 |
SGS International, Inc., 144A, 12.0%, 12/15/2013 | | 500,000 | | 500,822 |
Simmons Bedding Co.: | | | | |
144A, Step-up Coupon, 0% to 12/15/2009, 10.0% to 12/15/2014 (b) | | 2,100,000 | | 1,134,000 |
7.875%, 1/15/2014 (b) | | 450,000 | | 416,250 |
Sinclair Broadcast Group, Inc.: | | | | |
8.0%, 3/15/2012 | | 143,000 | | 147,290 |
8.75%, 12/15/2011 | | 3,135,000 | | 3,299,587 |
Sirius Satellite Radio, Inc., 144A, 9.625%, 8/1/2013 (b) | | 2,150,000 | | 2,117,750 |
Toys “R” Us, Inc.: | | | | |
6.875%, 8/1/2006 | | 245,000 | | 243,775 |
7.375%, 10/15/2018 | | 921,000 | | 663,120 |
Trump Entertainment Resorts, Inc., 8.5%, 6/1/2015 (b) | | 3,765,000 | | 3,670,875 |
TRW Automotive, Inc.: | | | | |
11.0%, 2/15/2013 (b) | | 2,440,000 | | 2,738,900 |
11.75%, 2/15/2013 EUR | | 380,000 | | 519,614 |
United Auto Group, Inc., 9.625%, 3/15/2012 | | 1,370,000 | | 1,441,925 |
Wheeling Island Gaming, Inc., 10.125%, 12/15/2009 | | 395,000 | | 414,256 |
XM Satellite Radio, Inc., Step-up Coupon, 0% to 12/31/2005, 14.0% to 12/31/2009 | | 2,501,934 | | 2,664,560 |
Young Broadcasting, Inc.: | | | | |
8.75%, 1/15/2014 (b) | | 3,375,000 | | 2,974,219 |
10.0%, 3/1/2011 (b) | | 425,000 | | 397,906 |
| | | | |
| | | | 81,344,992 |
| | | | |
162
| | | | |
| | | Principal Amount ($)(a) | | Value ($) |
Consumer Staples 2.7% | | | | |
Alliance One International, Inc., 144A, 11.0%, 5/15/2012 | | 1,345,000 | | 1,183,600 |
Birds Eye Foods, Inc., 11.875%, 11/1/2008 | | 578,000 | | 589,560 |
Del Laboratories, Inc., 8.0%, 2/1/2012 (b) | | 600,000 | | 474,000 |
Delhaize America, Inc.: | | | | |
8.05%, 4/15/2027 | | 190,000 | | 194,938 |
9.0%, 4/15/2031 | | 540,000 | | 634,834 |
GNC Corp., 8.5%, 12/1/2010 | | 160,000 | | 137,600 |
Harry & David Holdings, Inc., 9.41%**, 3/1/2012 | | 390,000 | | 392,925 |
North Atlantic Trading Co., 9.25%, 3/1/2012 | | 4,095,000 | | 2,702,700 |
Swift & Co.: | | | | |
10.125%, 10/1/2009 | | 685,000 | | 707,263 |
12.5%, 1/1/2010 | | 1,295,000 | | 1,362,987 |
Viskase Co., Inc., 11.5%, 6/15/2011 | | 2,380,000 | | 2,534,700 |
| | | | |
| | | | 10,915,107 |
| | | | |
Energy 6.4% | | | | |
Belden & Blake Corp., 8.75%, 7/15/2012 | | 2,045,000 | | 2,085,900 |
Chaparral Energy, Inc., 144A, 8.5%, 12/1/2015 (b) | | 1,310,000 | | 1,355,850 |
Chesapeake Energy Corp.: | | | | |
6.5%, 8/15/2017 | | 590,000 | | 592,950 |
6.875%, 1/15/2016 | | 1,350,000 | | 1,383,750 |
Dynegy Holdings, Inc.: | | | | |
6.875%, 4/1/2011 (b) | | 390,000 | | 384,150 |
7.125%, 5/15/2018 (b) | | 655,000 | | 582,950 |
7.625%, 10/15/2026 | | 435,000 | | 387,150 |
8.75%, 2/15/2012 (b) | | 185,000 | | 199,800 |
144A, 9.875%, 7/15/2010 | | 2,805,000 | | 3,074,981 |
El Paso Production Holding Corp., 7.75%, 6/1/2013 | | 955,000 | | 990,812 |
Frontier Oil Corp., 6.625%, 10/1/2011 | | 390,000 | | 397,800 |
Mission Resources Corp., 9.875%, 4/1/2011 | | 90,000 | | 94,500 |
Newpark Resources, Inc., Series B, 8.625%, 12/15/2007 | | 1,595,000 | | 1,595,000 |
NGC Corp. Capital Trust I, Series B, 8.316%, 6/1/2027 (b) | | 1,595,000 | | 1,411,575 |
Sonat, Inc., 7.0%, 2/1/2018 | | 195,000 | | 185,250 |
Southern Natural Gas, 8.875%, 3/15/2010 | | 1,615,000 | | 1,725,975 |
Stone Energy Corp.: | | | | |
6.75%, 12/15/2014 (b) | | 2,500,000 | | 2,368,750 |
8.25%, 12/15/2011 | | 1,290,000 | | 1,331,925 |
Transmeridian Exploration, Inc., 12.0%**, 12/15/2010 | | 455,000 | | 527,800 |
Williams Companies, Inc.: | | | | |
8.125%, 3/15/2012 (b) | | 3,300,000 | | 3,597,000 |
8.75%, 3/15/2032 | | 1,115,000 | | 1,293,400 |
| | | | |
| | | | 25,567,268 |
| | | | |
Financials 12.8% | | | | |
Alamosa Delaware, Inc.: | | | | |
8.5%, 1/31/2012 | | 200,000 | | 216,250 |
11.0%, 7/31/2010 | | 640,000 | | 721,600 |
12.0%, 7/31/2009 | | 668,000 | | 730,625 |
AmeriCredit Corp., 9.25%, 5/1/2009 | | 3,385,000 | | 3,562,712 |
163
| | | | |
| | | Principal Amount ($)(a) | | Value ($) |
Ashton Woods USA LLC, 144A, 9.5%, 10/1/2015 | | 1,430,000 | | 1,288,788 |
Atlantic Mutual Insurance Co., 144A, 8.15%, 2/15/2028 | | 385,000 | | 233,874 |
E*TRADE Financial Corp.: | | | | |
144A, 7.375%, 9/15/2013 (b) | | 1,355,000 | | 1,371,937 |
7.875%, 12/1/2015 | | 1,165,000 | | 1,202,863 |
8.0%, 6/15/2011 | | 665,000 | | 691,600 |
Exopack Holding Corp., 9.59%, 11/16/2006 | | 3,250,000 | | 3,250,000 |
Ford Motor Credit Co.: | | | | |
6.5%, 1/25/2007 | | 610,000 | | 590,157 |
7.25%, 10/25/2011 | | 4,820,000 | | 4,163,786 |
7.375%, 10/28/2009 | | 4,330,000 | | 3,840,216 |
General Motors Acceptance Corp.: | | | | |
5.22%**, 3/20/2007 | | 635,000 | | 599,792 |
6.875%, 9/15/2011 | | 2,180,000 | | 1,988,040 |
8.0%, 11/1/2031 (b) | | 13,543,000 | | 12,972,582 |
H&E Equipment/Finance, 11.125%, 6/15/2012 | | 1,525,000 | | 1,685,125 |
Poster Financial Group, Inc., 8.75%, 12/1/2011 (b) | | 1,720,000 | | 1,771,600 |
PXRE Capital Trust I, 8.85%, 2/1/2027 | | 1,090,000 | | 1,070,925 |
R.H. Donnelly Finance Corp., 10.875%, 12/15/2012 | | 1,605,000 | | 1,809,637 |
Radnor Holdings Corp., 11.0%, 3/15/2010 | | 1,260,000 | | 1,020,600 |
Stripes Acquisition LLC, 144A, 10.625%, 12/15/2013 | | 490,000 | | 497,350 |
TIG Capital Holdings Trust, 144A, 8.597%, 1/15/2027 | | 1,530,000 | | 1,216,350 |
Triad Acquisition Corp., 144A, 11.125%, 5/1/2013 | | 910,000 | | 900,900 |
UGS Corp., 10.0%, 6/1/2012 | | 1,215,000 | | 1,324,350 |
Universal City Development, 11.75%, 4/1/2010 | | 2,095,000 | | 2,349,019 |
| | | | |
| | | | 51,070,678 |
| | | | |
Health Care 2.0% | | | | |
Accellent, Inc., 144A, 10.5%, 12/1/2013 | | 1,245,000 | | 1,276,125 |
Eszopiclone Royalty Subordinated LLC, 12.0%, 3/15/2014 | | 450,000 | | 450,000 |
HEALTHSOUTH Corp., 10.75%, 10/1/2008 (b) | | 2,700,000 | | 2,700,000 |
InSight Health Services Corp.: | | | | |
144A, 9.174%**, 11/1/2011 | | 340,000 | | 328,950 |
Series B, 9.875%, 11/1/2011 (b) | | 458,000 | | 345,790 |
Tenet Healthcare Corp., 144A, 9.25%, 2/1/2015 | | 2,860,000 | | 2,838,550 |
| | | | |
| | | | 7,939,415 |
| | | | |
Industrials 11.2% |
Aavid Thermal Technologies, Inc., 12.75%, 2/1/2007 | | 2,228,000 | | 2,289,270 |
Allied Security Escrow Corp., 11.375%, 7/15/2011 | | 1,404,000 | | 1,353,516 |
Allied Waste North America, Inc.: | | | | |
Series B, 5.75%, 2/15/2011 (b) | | 735,000 | | 696,413 |
Series B, 9.25%, 9/1/2012 | | 1,750,000 | | 1,894,375 |
American Color Graphics, 10.0%, 6/15/2010 | | 1,340,000 | | 936,325 |
Avondale Mills, Inc., 144A, 11.065%**, 7/1/2012 | | 650,000 | | 630,500 |
164
| | | | |
| | | Principal Amount ($)(a) | | Value ($) |
Beazer Homes USA, Inc.: | | | | |
6.875%, 7/15/2015 (b) | | 85,000 | | 81,494 |
8.375%, 4/15/2012 | | 1,110,000 | | 1,154,400 |
8.625%, 5/15/2011 | | 1,225,000 | | 1,280,125 |
Browning-Ferris Industries: | | | | |
7.4%, 9/15/2035 | | 1,910,000 | | 1,690,350 |
9.25%, 5/1/2021 | | 430,000 | | 442,900 |
Case New Holland, Inc., 9.25%, 8/1/2011 | | 2,270,000 | | 2,428,900 |
Cenveo Corp., 7.875%, 12/1/2013 (b) | | 1,117,000 | | 1,077,905 |
Collins & Aikman Floor Cover, Series B, 9.75%, 2/15/2010 (b) | | 1,750,000 | | 1,540,000 |
Columbus McKinnon Corp., 10.0%, 8/1/2010 | | 648,000 | | 717,660 |
Compression Polymers Corp.: | | | | |
144A, 10.46%**, 7/1/2012 | | 485,000 | | 475,300 |
144A, 10.5%, 7/1/2013 | | 1,575,000 | | 1,527,750 |
Congoleum Corp., 8.625%, 8/1/2008* | | 1,200,000 | | 1,195,500 |
Cornell Companies, Inc., 10.75%, 7/1/2012 | | 650,000 | | 672,750 |
Dana Corp., 7.0%, 3/1/2029 (b) | | 1,603,000 | | 1,150,153 |
DRS Technologies, Inc., 6.875%, 11/1/2013 | | 305,000 | | 291,656 |
ISP Chemco, Inc., Series B, 10.25%, 7/1/2011 | | 2,730,000 | | 2,907,450 |
K. Hovnanian Enterprises, Inc.: | | | | |
6.25%, 1/15/2016 | | 1,320,000 | | 1,224,730 |
8.875%, 4/1/2012 | | 1,705,000 | | 1,771,688 |
Kansas City Southern, 9.5%, 10/1/2008 | | 2,725,000 | | 2,949,812 |
Kinetek, Inc., Series D, 10.75%, 11/15/2006 | | 2,190,000 | | 2,102,400 |
Millennium America, Inc., 9.25%, 6/15/2008 | | 2,330,000 | | 2,513,488 |
Rainbow National Services LLC, 144A, 10.375%, 9/1/2014 | | 1,050,000 | | 1,176,000 |
Securus Technologies, Inc., 11.0%, 9/1/2011 (b) | | 855,000 | | 726,750 |
Ship Finance International Ltd., 8.5%, 12/15/2013 | | 1,375,000 | | 1,285,625 |
Technical Olympic USA, Inc.: | | | | |
7.5%, 3/15/2011 (b) | | 560,000 | | 499,100 |
10.375%, 7/1/2012 | | 1,175,000 | | 1,155,906 |
The Brickman Group Ltd., Series B, 11.75%, 12/15/2009 | | 870,000 | | 963,525 |
United Rentals North America, Inc., 7.0%, 2/15/2014 (b) | | 1,290,000 | | 1,206,150 |
Xerox Capital Trust I, 8.0%, 2/1/2027 | | 810,000 | | 834,300 |
| | | | |
| | | | 44,844,166 |
| | | | |
Information Technology 2.8% |
Activant Solutions, Inc.: | | | | |
144A, 10.054%**, 4/1/2010 | | 55,000 | | 56,719 |
10.5%, 6/15/2011 | | 1,017,000 | | 1,113,615 |
144A, 10.53%, 4/1/2010 | | 150,000 | | 154,687 |
Echelon Operating Co., 8.375%, 3/15/2010 | | 934,000 | | 863,950 |
L-3 Communications Corp.: | | | | |
5.875%, 1/15/2015 | | 200,000 | | 194,000 |
144A, 6.375%, 10/15/2015 | | 540,000 | | 538,650 |
Lucent Technologies, Inc., 6.45%, 3/15/2029 (b) | | 2,540,000 | | 2,178,050 |
Sanmina-SCI Corp.: | | | | |
6.75%, 3/1/2013 (b) | | 1,615,000 | | 1,536,269 |
165
| | | | |
| | | Principal Amount ($)(a) | | Value ($) |
10.375%, 1/15/2010 | | 2,263,000 | | 2,500,615 |
SS&C Technologies, Inc., 144A, 11.75%, 12/1/2013 | | 365,000 | | 374,125 |
SunGard Data Systems, Inc., 144A, 10.25%, 8/15/2015 | | 1,590,000 | | 1,590,000 |
| | | | |
| | | | 11,100,680 |
| | | | |
Materials 9.3% | | | | |
ARCO Chemical Co., 9.8%, 2/1/2020 | | 3,665,000 | | 4,113,962 |
Associated Materials, Inc.: | | | | |
Step-up Coupon, 0% to 3/1/2009, 11.25% to 3/1/2014 (b) | | 1,615,000 | | 791,350 |
9.75%, 4/15/2012 | | 535,000 | | 516,275 |
Caraustar Industries, Inc., 9.875%, 4/1/2011 (b) | | 2,390,000 | | 2,437,800 |
Constar International, Inc., 11.0%, 12/1/2012 (b) | | 365,000 | | 266,450 |
Dayton Superior Corp.: | | | | |
10.75%, 9/15/2008 | | 930,000 | | 897,450 |
13.0%, 6/15/2009 (b) | | 1,545,000 | | 1,166,475 |
GEO Specialty Chemicals, Inc., 12.565%**, 12/31/2009 | | 2,744,000 | | 2,277,520 |
Georgia-Pacific Corp.: | | | | |
8.0%, 1/15/2024 (b) | | 2,290,000 | | 2,186,950 |
8.875%, 5/15/2031 | | 250,000 | | 250,625 |
Huntsman LLC, 11.625%, 10/15/2010 | | 1,992,000 | | 2,268,390 |
IMC Global, Inc., 10.875%, 8/1/2013 | | 2,450,000 | | 2,814,437 |
International Steel Group, Inc., 6.5%, 4/15/2014 | | 770,000 | | 770,000 |
Massey Energy Co.: | | | | |
6.625%, 11/15/2010 | | 590,000 | | 599,588 |
144A, 6.875%, 12/15/2013 | | 490,000 | | 494,288 |
MMI Products, Inc., Series B, 11.25%, 4/15/2007 | | 2,075,000 | | 1,950,500 |
Neenah Foundry Co.: | | | | |
144A, 11.0%, 9/30/2010 | | 2,432,000 | | 2,663,040 |
144A, 13.0%, 9/30/2013 | | 1,102,460 | | 1,124,509 |
NewPage Corp., 10.5%**, 5/1/2012 | | 1,105,000 | | 1,093,950 |
Omnova Solutions, Inc., 11.25%, 6/1/2010 | | 2,415,000 | | 2,517,637 |
Oregon Steel Mills, Inc., 10.0%, 7/15/2009 | | 645,000 | | 690,150 |
Oxford Automotive, Inc., 144A, 12.0%, 10/15/2010* | | 1,994,974 | | 179,548 |
Pliant Corp., 11.625%, 6/15/2009 (PIK)* | | 11 | | 12 |
Portola Packaging, Inc., 8.25%, 2/1/2012 (b) | | 705,000 | | 518,175 |
Rockwood Specialties Group, Inc., 10.625%, 5/15/2011 | | 300,000 | | 328,875 |
TriMas Corp., 9.875%, 6/15/2012 | | 2,291,000 | | 1,890,075 |
UAP Holding Corp., Step-up Coupon, 0% to 1/15/2008, 10.75% to 7/15/2012 | | 505,000 | | 437,456 |
United States Steel Corp., 9.75%, 5/15/2010 | | 1,579,000 | | 1,717,163 |
| | | | |
| | | | 36,962,650 |
| | | | |
Telecommunication Services 5.6% | | | | |
AirGate PCS, Inc., 7.9%**, 10/15/2011 | | 810,000 | | 836,325 |
166
| | | | |
| | | Principal Amount ($)(a) | | Value ($) |
American Cellular Corp., Series B, 10.0%, 8/1/2011 | | 535,000 | | 580,475 |
Cincinnati Bell, Inc.: | | | | |
7.25%, 7/15/2013 (b) | | 1,390,000 | | 1,445,600 |
8.375%, 1/15/2014 (b) | | 1,410,000 | | 1,387,087 |
Dobson Communications Corp., 8.875%, 10/1/2013 | | 735,000 | | 733,162 |
Insight Midwest LP, 9.75%, 10/1/2009 | | 615,000 | | 633,450 |
LCI International, Inc., 7.25%, 6/15/2007 | | 1,370,000 | | 1,376,850 |
Level 3 Financing, Inc., 10.75%, 10/15/2011 | | 255,000 | | 226,313 |
MCI, Inc., 8.735%, 5/1/2014 | | 3,645,000 | | 4,032,281 |
Nextel Communications, Inc., Series D, 7.375%, 8/1/2015 | | 5,225,000 | | 5,514,037 |
Nextel Partners, Inc., 8.125%, 7/1/2011 | | 965,000 | | 1,031,344 |
Qwest Corp.: | | | | |
7.25%, 9/15/2025 | | 985,000 | | 980,075 |
144A, 7.741%**, 6/15/2013 | | 405,000 | | 436,894 |
Rural Cellular Corp.: | | | | |
9.75%, 1/15/2010 | | 180,000 | | 181,800 |
9.875%, 2/1/2010 (b) | | 180,000 | | 189,900 |
144A, 10.041%**, 11/1/2012 | | 180,000 | | 181,350 |
SBA Telecom, Inc., Step-up Coupon, 0% to 12/15/2007, 9.75% to 12/15/2011 | | 642,000 | | 595,455 |
Telex Communications Holdings, Inc., 11.5%, 10/15/2008 | | 95,000 | | 101,175 |
Triton PCS, Inc., 8.5%, 6/1/2013 | | 155,000 | | 144,150 |
Ubiquitel Operating Co., 9.875%, 3/1/2011 | | 585,000 | | 647,887 |
US Unwired, Inc., Series B, 10.0%, 6/15/2012 | | 990,000 | | 1,113,750 |
| | | | |
| | | | 22,369,360 |
| | | | |
Utilities 5.9% | | | | |
AES Corp., 144A, 8.75%, 5/15/2013 | | 3,050,000 | | 3,320,687 |
Allegheny Energy Supply Co. LLC, 144A, 8.25%, 4/15/2012 | | 3,250,000 | | 3,664,375 |
CMS Energy Corp.: | | | | |
8.5%, 4/15/2011 (b) | | 1,505,000 | | 1,638,569 |
9.875%, 10/15/2007 | | 1,960,000 | | 2,097,200 |
DPL, Inc., 6.875%, 9/1/2011 | | 547,000 | | 576,401 |
Mirant North America LLC, 144A, 7.375%, 12/31/2013 | | 395,000 | | 399,444 |
Mission Energy Holding Co., 13.5%, 7/15/2008 | | 3,835,000 | | 4,448,600 |
NorthWestern Corp., 5.875%, 11/1/2014 | | 345,000 | | 345,649 |
NRG Energy, Inc., 8.0%, 12/15/2013 | | 2,315,000 | | 2,581,225 |
PSE&G Energy Holdings LLC, 10.0%, 10/1/2009 | | 4,000,000 | | 4,400,000 |
| | | | |
| | | | 23,472,150 |
| | | | |
Total Corporate Bonds (Cost $324,073,173) | | | | 315,586,466 |
| | | | |
Foreign Bonds — US$ Denominated 12.8% | | | | |
Consumer Discretionary 2.0% | | | | |
Cablemas SA de CV, 144A, 9.375%, 11/15/2015 | | 195,000 | | 199,875 |
167
| | | | |
| | | Principal Amount ($)(a) | | Value ($) |
IESY Repository GmbH, 144A, 10.375%, 2/15/2015 | | 335,000 | | 348,400 |
Jafra Cosmetics International, Inc., 10.75%, 5/15/2011 | | 2,455,000 | | 2,688,225 |
Kabel Deutschland GmbH, 144A, 10.625%, 7/1/2014 | | 1,470,000 | | 1,547,175 |
Shaw Communications, Inc., 8.25%, 4/11/2010 | | 1,010,000 | | 1,084,487 |
Telenet Group Holding NV, 144A, Step-up Coupon, 0% to 12/15/2008, 11.5% to 6/15/2014 | | 1,757,000 | | 1,440,740 |
Vitro SA de CV, Series A, 144A, 12.75%, 11/1/2013 (b) | | 740,000 | | 699,300 |
| | | | |
| | 8,008,202 |
| | | | |
Energy 0.8% | | | | |
Gaz Capital SA, 144A, 8.625%, 4/28/2034 | | 180,000 | | 227,700 |
OAO Gazprom, 144A, 9.625%, 3/1/2013 (b) | | 1,815,000 | | 2,189,344 |
Secunda International Ltd., 12.15%**, 9/1/2012 | | 698,000 | | 732,900 |
| | | | |
| | 3,149,944 |
| | | | |
Financials 1.3% | | | | |
Conproca SA de CV, 12.0%, 6/16/2010 | | 1,050,000 | | 1,249,500 |
Doral Financial Corp., 5.004%**, 7/20/2007 | | 2,335,000 | | 2,269,723 |
Galaxy Entertainment Finance Co., Ltd., 144A, 9.875%, 12/15/2012 | | 165,000 | | 167,475 |
New ASAT (Finance) Ltd., 9.25%, 2/1/2011 | | 666,000 | | 459,540 |
Telecom Personal SA, 10.0%, 10/15/2011 | | 1,000,000 | | 998,750 |
| | | | |
| | 5,144,988 |
| | | | |
Health Care 0.3% | | | | |
| | | | |
Biovail Corp., 7.875%, 4/1/2010 (b) | | 1,330,000 | | 1,378,213 |
| | | | |
Industrials 2.0% | | | | |
Grupo Transportacion Ferroviaria Mexicana SA de CV: | | | | |
144A, 9.375%, 5/1/2012 | | 765,000 | | 837,675 |
10.25%, 6/15/2007 (b) | | 2,835,000 | | 2,990,925 |
12.5%, 6/15/2012 | | 891,000 | | 1,015,740 |
J. Ray McDermott SA, 144A, 11.5%, 12/15/2013 | | 1,450,000 | | 1,711,000 |
LeGrand SA, 8.5%, 2/15/2025 | | 750,000 | | 901,875 |
Stena AB, 9.625%, 12/1/2012 | | 565,000 | | 613,731 |
Supercanal Holding SA, (REG S), 11.5%, 5/15/2005* | | 100,000 | | 15,000 |
| | | | |
| | | | 8,085,946 |
| | | | |
Materials 3.6% | | | | |
Cascades, Inc., 7.25%, 2/15/2013 (b) | | 2,760,000 | | 2,511,600 |
ISPAT Inland ULC, 9.75%, 4/1/2014 | | 1,555,000 | | 1,761,037 |
Novelis, Inc., 144A, 7.5%, 2/15/2015 | | 2,845,000 | | 2,652,962 |
Rhodia SA, 8.875%, 6/1/2011 | | 2,185,000 | | 2,239,625 |
Sino-Forest Corp., 144A, 9.125%, 8/17/2011 | | 35,000 | | 37,538 |
Tembec Industries, Inc.: | | | | |
8.5%, 2/1/2011 | | 6,490,000 | | 3,601,950 |
8.625%, 6/30/2009 | | 2,970,000 | | 1,692,900 |
| | | | |
| | 14,497,612 |
| | | | |
168
| | | | |
| | | Principal Amount ($)(a) | | Value ($) |
Sovereign Bonds 0.4% | | | | |
Federative Republic of Brazil, 8.875%, 10/14/2019 (b) | | 340,000 | | 380,970 |
Republic of Argentina: | | | | |
Zero Coupon, 12/15/2035 | | 2,769,758 | | 144,028 |
8.28%, 12/31/2033 (PIK) (b) | | 995,063 | | 828,390 |
Republic of Venezuela, 10.75%, 9/19/2013 | | 25,000 | | 30,750 |
| | | | |
| | | | 1,384,138 |
| | | | |
Telecommunication Services 2.4% | | | | |
Cell C Property Ltd., 144A, 11.0%, 7/1/2015 (b) | | 1,170,000 | | 1,190,475 |
Embratel, Series B, 11.0%, 12/15/2008 | | 572,000 | | 647,790 |
Global Crossing UK Finance, 10.75%, 12/15/2014 (b) | | 965,000 | | 887,800 |
Grupo Iusacell SA de CV, Series B, 10.0%, 7/15/2004* | | 285,000 | | 229,425 |
Intelsat Bermuda Ltd., 144A, 8.695%**, 1/15/2012 | | 600,000 | | 609,750 |
Intelsat Ltd., 5.25%, 11/1/2008 | | 950,000 | | 865,687 |
Millicom International Cellular SA, 10.0%, 12/1/2013 | | 495,000 | | 511,088 |
Mobifon Holdings BV, 12.5%, 7/31/2010 | | 2,100,000 | | 2,436,000 |
Nortel Networks Ltd., 6.125%, 2/15/2006 (b) | | 2,050,000 | | 2,050,000 |
| | | | |
| | | | 9,428,015 |
| | | | |
Total Foreign Bonds — US$ Denominated (Cost $53,549,667) | | | | 51,077,058 |
| | | | |
Foreign Bonds — Non US$ Denominated 1.1% | | | | |
Consumer Discretionary 0.3% | | | | |
IESY Repository GmbH, 144A, 8.75%, 2/15/2015 EUR | | 1,020,000 | | 1,192,483 |
| | | | |
Consumer Staples 0.1% | | | | |
Fage Dairy Industry SA, 144A, 7.5%, 1/15/2015 EUR | | 585,000 | | 600,815 |
| | | | |
Industrials 0.2% | | | | |
Grohe Holdings GmbH, 144A, 8.625%, 10/1/2014 EUR | | 720,000 | | 790,608 |
| | | | |
Sovereign Bonds 0.5% | | | | |
Republic of Argentina: | | | | |
Zero Coupon, 12/15/2035 EUR | | 4,787,937 | | 274,919 |
7.82%, 12/31/2033 (PIK) EUR | | 1,714,060 | | 1,694,445 |
| | | | |
| | | | 1,969,364 |
| | | | |
Total Foreign Bonds — Non US$ Denominated (Cost $4,645,067) | | | | 4,553,270 |
| | | | |
Asset Backed 0.6% | | | | |
Golden Tree High Yield Opportunities LP, “D1”, Series 1, 13.054%, 10/31/2007 (Cost $2,500,000) | | 2,500,000 | | 2,560,000 |
| | | | |
169
| | | | | | |
| | | Principal Amount ($)(a) | | | Value ($) | |
Convertible Bond 0.6% | | | | | | |
Consumer Discretionary | | | | | | |
HIH Capital Ltd.: | | | | | | |
144A, Series DOM, 7.5%, 9/25/2006 | | 1,620,000 | | | 1,603,800 | |
144A, Series EURO, 7.5%, 9/25/2006 | | 830,000 | | | 821,700 | |
| | | | | | |
Total Convertible Bond (Cost $2,426,053) | | | | | 2,425,500 | |
| | | | | | |
| | |
| | | Shares | | | Value ($) | |
Preferred Stocks 0.3% | | | | | | |
Paxson Communications Corp., 14.25% (PIK) (b) (Cost $1,318,018) | | 135 | | | 1,178,919 | |
| | | | | | |
| | |
| | | Principal Amount ($)(a) | | | Value ($) | |
Loan Participations 0.7% | |
Alliance Mortgage Cycle Loan, LIBOR plus 7.25, 12.25%**, 6/4/2010 | | 737,500 | | | 737,500 | |
Ineos Group Holdings PLC, LIBOR plus 5.15, 10.0%**, 12/16/2006 | | 2,000,000 | | | 2,000,000 | |
| | | | | | |
Total Loan Participations (Cost $2,737,500) | | | | | 2,737,500 | |
| | | | | | |
| | |
| | | Shares | | | Value ($) | |
Warrants 0.0% | |
Dayton Superior Corp. 144A* | | 95 | | | 0 | |
DeCrane Aircraft Holdings, Inc. 144A* | | 1,350 | | | 0 | |
TravelCenters of America, Inc.* | | 345 | | | 43 | |
| | | | | | |
Total Warrants (Cost $1,409) | | | | | 43 | |
| | | | | | |
| | |
| | | Units | | | Value ($) | |
Other Investments 0.5% | |
Hercules, Inc., (Bond Unit) | | 1,415,000 | | | 1,061,250 | |
IdleAire Technologies Corp. (Bond Unit), 144A | | 1,355,000 | | | 993,500 | |
SpinCycle, Inc., (Common Stock Unit)* | | 9,913 | | | 10,904 | |
SpinCycle, Inc., “F” (Common Stock Unit)* | | 69 | | | 76 | |
| | | | | | |
Total Other Investments (Cost $2,215,582) | | | | | 2,065,730 | |
| | | | | | |
| | |
| | | Shares | | | Value ($) | |
Common Stocks 0.1% | |
Catalina Restaurant Group, Inc.* | | 3,870 | | | 1,935 | |
GEO Specialty Chemicals, Inc.* | | 24,225 | | | 30,281 | |
GEO Specialty Chemicals, Inc., 144A* | | 2,206 | | | 2,758 | |
IMPSAT Fiber Networks, Inc.*(b) | | 24,432 | | | 168,824 | |
Intermet Corp.* | | 9,137 | | | 106,274 | |
| | | | | | |
Total Common Stocks (Cost $1,973,968) | | | | | 310,072 | |
| | | | | | |
Convertible Preferred Stocks 0.1% | | | | | | |
Consumer Discretionary | | | | | | |
Paxson Communications Corp. 144A, 9.75%, (PIK) (Cost $207,250) | | 30 | | | 207,750 | |
| | | | | | |
Securities Lending Collateral 15.5% | | | | | | |
Daily Assets Fund Institutional, 4.28%(c)(d) (Cost $61,812,770) | | 61,812,770 | | | 61,812,770 | |
| | | | | | |
Cash Equivalents 2.4% | | | | | | |
Cash Management QP Trust, 4.26%(e) (Cost $9,669,112) | | 9,669,112 | | | 9,669,112 | |
| | | | | | |
| | |
| | | % of Net Assets | | | Value ($) | |
Total Investment Portfolio (Cost $467,129,569)+ | | 113.8 | | | 454,184,190 | |
Other Assets and Liabilities, Net | | (13.8 | ) | | (54,946,905 | ) |
| | | | | | |
Net Assets | | 100.0 | | | 399,237,285 | |
| | | | | | |
170
Notes to DWS High Income VIP Portfolio of Investments
| + | The cost for federal income tax purposes was $467,275,847. At December 31, 2005, net unrealized depreciation for all securities based on tax cost was $13,091,657. This consisted of aggregate gross unrealized appreciation for all securities in which there was an excess of value over tax cost of $3,771,232 and aggregate gross unrealized depreciation for all securities in which there was an excess of tax cost over value of $16,862,889. |
| * | Non-income producing security. In the case of a bond, generally denotes that the issuer has defaulted on the payment of principal or the interest or has filed for bankruptcy. The following table represents bonds that are in default: |
| | | | | | | | | | | | | |
Securities | | Coupon | | | Maturity Date | | Principal Amount | | Acquisition Cost ($) | | Value ($) |
Congoleum Corp. | | 8.625 | % | | 8/1/2008 | | 1,200,000 | | USD | | 1,075,002 | | 1,195,500 |
Grupo Iusacell SA de CV, Series B | | 10.0 | % | | 7/15/2004 | | 285,000 | | USD | | 182,087 | | 229,425 |
Oxford Automotive, Inc. | | 12.0 | % | | 10/15/2010 | | 1,994,974 | | USD | | 1,495,951 | | 179,548 |
Pliant Corp. | | 11.625 | % | | 6/15/2009 | | 11 | | USD | | 11 | | 12 |
Supercanal Holding SA (Reg S) | | 11.5 | % | | 5/15/2005 | | 100,000 | | USD | | 10,000 | | 15,000 |
| | | | | | | | | | | | | |
| | | | | | | | | | | 2,763,051 | | 1,619,485 |
| | | | | | | | | | | | | |
| ** | Floating rate notes are securities whose yields vary with a designated market index or market rate, such as the coupon-equivalent of the US Treasury bill rate. These securities are shown at their current rate as of December 31, 2005. |
| (a) | Principal amount stated in US dollars unless otherwise noted. |
| (b) | All or a portion of these securities were on loan (See Notes to Financial Statements). The value of all securities loaned at December 31, 2005 amounted to $60,482,960 which is 15.2% of net assets. |
| (c) | Daily Assets Fund Institutional, an affiliated fund, is managed by Deutsche Asset Management, Inc. The rate shown is the annualized seven-day yield at period end. |
| (d) | Represents collateral held in connection with securities lending. |
| (e) | Cash Management QP Trust, an affiliated fund, is managed by Deutsche Investment Management Americas Inc. The rate shown is the annualized seven-day yield at period end. |
| 144A: | Security exempt from registration under Rule 144A of the Securities Act of 1933. These securities may be resold in transactions exempt from registration, normally to qualified institutional buyers. |
| LIBOR: | Represents the London InterBank Offered Rate. |
| PIK: | Denotes that all or a portion of the income is paid in-kind. |
Currency Abbreviation
EUR Euro
The accompanying notes are an integral part of the financial statements.
171
Financial Statements
Statement of Assets and Liabilities
as of December 31, 2005
| | | | |
Assets | | | | |
Investments: | | | | |
Investments in securities, at value (cost $395,647,687) — including $60,482,960 of securities loaned | | $ | 382,702,308 | |
Investment in Daily Assets Fund Institutional (cost $61,812,770)* | | | 61,812,770 | |
Investment in Cash Management QP Trust (cost $9,669,112) | | | 9,669,112 | |
Total investments in securities, at value (cost $467,129,569) | | | 454,184,190 | |
Cash | | | 939,625 | |
Foreign currency, at value (cost $1,182,564) | | | 1,184,841 | |
Receivable for investments sold | | | 95,391 | |
Interest receivable | | | 8,710,791 | |
Receivable for Portfolio shares sold | | | 1,828 | |
Unrealized appreciation on forward foreign currency exchange contracts | | | 6,698 | |
Due from Advisor | | | 27,576 | |
Other assets | | | 10,305 | |
Total assets | | | 465,161,245 | |
Liabilities | | | | |
Payable for investments purchased | | | 3,446,710 | |
Payable for Portfolio shares redeemed | | | 215,705 | |
Payable upon return of securities loaned | | | 61,812,770 | |
Unrealized depreciation on forward foreign currency exchange contracts | | | 53,306 | |
Accrued management fee | | | 204,429 | |
Other accrued expenses and payables | | | 191,040 | |
Total liabilities | | | 65,923,960 | |
| | | | |
Net assets, at value | | $ | 399,237,285 | |
| | | | |
Net Assets | | | | |
Net assets consist of: | | | | |
Undistributed net investment income | | | 29,781,622 | |
Net unrealized appreciation (depreciation) on: | | | | |
Investments | | | (12,945,379 | ) |
Foreign currency related transactions | | | (45,143 | ) |
Accumulated net realized gain (loss) | | | (112,190,764 | ) |
Paid-in capital | | | 494,636,949 | |
| | | | |
Net assets, at value | | $ | 399,237,285 | |
| | | | |
Class A | | | | |
Net Asset Value, offering and redemption price per share ($343,577,831 ÷ 41,769,600 outstanding shares of beneficial interest, $.01 par value, unlimited number of shares authorized) | | $ | 8.23 | |
| | | | |
Class B | | | | |
Net Asset Value, offering and redemption price per share ($55,659,454 ÷ 6,770,189 outstanding shares of beneficial interest, $.01 par value, unlimited number of shares authorized) | | $ | 8.22 | |
| | | | |
| * | Represents collateral on securities loaned. |
172
Statement of Operations
for the year ended December 31, 2005
| | | | |
Investment Income | | | | |
Income: | | | | |
Dividends (net of foreign taxes withheld of $114) | | $ | 311,021 | |
Interest | | | 36,013,635 | |
Interest — Cash Management QP Trust | | | 286,898 | |
Securities lending income, including income from Daily Assets Fund Institutional, net of borrower rebates | | | 312,938 | |
Total Income | | | 36,924,492 | |
Expenses: | | | | |
Management fee | | | 2,468,117 | |
Custodian fees | | | 46,276 | |
Distribution service fees (Class B) | | | 139,382 | |
Record keeping fees (Class B) | | | 80,344 | |
Auditing | | | 58,150 | |
Legal | | | 15,503 | |
Trustees’ fees and expenses | | | 18,805 | |
Reports to shareholders | | | 113,372 | |
Other | | | 194,008 | |
Total expenses before expense reductions | | | 3,133,957 | |
Expense reductions | | | (11,015 | ) |
Total expenses after expense reductions | | | 3,122,942 | |
| | | | |
Net investment income | | | 33,801,550 | |
| | | | |
Realized and Unrealized Gain (Loss) on Investment Transactions | | | | |
Net realized gain (loss) from: | | | | |
Investments | | | 1,001,061 | |
Foreign currency related transactions | | | 280,032 | |
| | | 1,281,093 | |
Net unrealized appreciation (depreciation) during the period on: | | | | |
Investments | | | (20,276,002 | ) |
Foreign currency related transactions | | | 822,389 | |
| | | (19,453,613 | ) |
| | | | |
Net gain (loss) on investment transactions | | | (18,172,520 | ) |
| | | | |
Net increase (decrease) in net assets resulting from operations | | $ | 15,629,030 | |
| | | | |
The accompanying notes are an integral part of the financial statements.
173
Statement of Changes in Net Assets
| | | | | | | | |
| | | Years Ended December 31, | |
Increase (Decrease) in Net Assets | | 2005 | | | 2004 | |
Operations: | | | | | | | | |
Net investment income | | $ | 33,801,550 | | | $ | 34,238,642 | |
Net realized gain (loss) on investment transactions | | | 1,281,093 | | | | 9,470,236 | |
Net unrealized appreciation (depreciation) on investment transactions during the period | | | (19,453,613 | ) | | | 5,291,376 | |
Net increase (decrease) in net assets resulting from operations | | | 15,629,030 | | | | 49,000,254 | |
Distributions to shareholders from: | | | | | | | | |
Net investment income: | | | | | | | | |
Class A | | | (33,565,659 | ) | | | (29,352,659 | ) |
Class B | | | (5,270,980 | ) | | | (3,056,845 | ) |
Portfolio share transactions: | | | | | | | | |
Class A | | | | | | | | |
Proceeds from shares sold | | | 75,871,095 | | | | 56,878,387 | |
Reinvestment of distributions | | | 33,565,659 | | | | 29,352,659 | |
Cost of shares redeemed | | | (139,459,552 | ) | | | (119,443,412 | ) |
Net increase (decrease) in net assets from Class A share transactions | | | (30,022,798 | ) | | | (33,212,366 | ) |
Class B | | | | | | | | |
Proceeds from shares sold | | | 14,544,739 | | | | 37,277,037 | |
Reinvestment of distributions | | | 5,270,980 | | | | 3,056,845 | |
Cost of shares redeemed | | | (17,547,469 | ) | | | (23,434,006 | ) |
Net increase (decrease) in net assets from Class B share transactions | | | 2,268,250 | | | | 16,899,876 | |
Increase (decrease) in net assets | | | (50,962,157 | ) | | | 278,260 | |
Net assets at beginning of period | | | 450,199,442 | | | | 449,921,182 | |
| | | | | | | | |
Net assets at end of period (including undistributed net investment income of $29,781,622 and $34,372,843, respectively) | | $ | 399,237,285 | | | $ | 450,199,442 | |
| | | | | | | | |
Other Information | | | | | | | | |
Class A | | | | | | | | |
Shares outstanding at beginning of period | | | 44,826,321 | | | | 48,977,744 | |
Shares sold | | | 9,379,235 | | | | 6,841,589 | |
Shares issued to shareholders in reinvestment of distributions | | | 4,275,880 | | | | 3,696,808 | |
Shares redeemed | | | (16,711,836 | ) | | | (14,689,820 | ) |
Net increase (decrease) in Class A shares | | | (3,056,721 | ) | | | (4,151,423 | ) |
| | | | | | | | |
Shares outstanding at end of period | | | 41,769,600 | | | | 44,826,321 | |
| | | | | | | | |
Class B | | | | | | | | |
Shares outstanding at beginning of period | | | 6,474,194 | | | | 4,421,727 | |
Shares sold | | | 1,758,405 | | | | 4,504,371 | |
Shares issued to shareholders in reinvestment of distributions | | | 669,756 | | | | 384,026 | |
Shares redeemed | | | (2,132,166 | ) | | | (2,835,930 | ) |
Net increase (decrease) in Class B shares | | | 295,995 | | | | 2,052,467 | |
| | | | | | | | |
Shares outstanding at end of period | | | 6,770,189 | | | | 6,474,194 | |
| | | | | | | | |
The accompanying notes are an integral part of the financial statements.
174
Financial Highlights
Class A
| | | | | | | | | | | | | | | | | | | | |
Years Ended December 31, | | 2005 | | | 2004 | | | 2003 | | | 2002 | | | 2001a | |
Selected Per Share Data | |
Net asset value, beginning of period | | $ | 8.78 | | | $ | 8.43 | | | $ | 7.40 | | | $ | 8.13 | | | $ | 9.16 | |
| | | | | | | | | | | | | | | | | | | | |
Income (loss) from investment operations: | | | | | | | | | | | | | | | | | | | | |
Net investment incomeb | | | .68 | | | | .67 | | | | .67 | | | | .75 | | | | .84 | |
Net realized and unrealized gain (loss) on investment transactions | | | (.38 | ) | | | .31 | | | | 1.03 | | | | (.74 | ) | | | (.59 | ) |
| | | | | | | | | | | | | | | | | | | | |
Total from investment operations | | | .30 | | | | .98 | | | | 1.70 | | | | .01 | | | | .25 | |
| | | | | | | | | | | | | | | | | | | | |
Less distributions from: | | | | | | | | | | | | | | | | | | | | |
Net investment income | | | (.85 | ) | | | (.63 | ) | | | (.67 | ) | | | (.74 | ) | | | (1.28 | ) |
| | | | | | | | | | | | | | | | | | | | |
Net asset value, end of period | | $ | 8.23 | | | $ | 8.78 | | | $ | 8.43 | | | $ | 7.40 | | | $ | 8.13 | |
| | | | | | | | | | | | | | | | | | | | |
Total Return (%) | | | 3.89 | | | | 12.42 | | | | 24.62 | | | | (.30 | ) | | | 2.63 | |
Ratios to Average Net Assets and Supplemental Data | | | | | | | | | | | | | | | | | | | | |
Net assets, end of period ($ millions) | | | 344 | | | | 393 | | | | 413 | | | | 329 | | | | 335 | |
Ratio of expenses (%) | | | .70 | | | | .66 | | | | .67 | | | | .66 | | | | .70 | |
Ratio of net investment income (%) | | | 8.27 | | | | 8.11 | | | | 8.62 | | | | 10.07 | | | | 9.89 | |
Portfolio turnover rate (%) | | | 100 | | | | 162 | | | | 165 | | | | 138 | | | | 77 | |
| a | As required, effective January 1, 2001, the Portfolio has adopted the provisions of the AICPA Audit and Accounting Guide for Investment Companies and began amortizing premium on debt securities. |
| b | Based on average shares outstanding during the period. |
Class B
| | | | | | | | | | | | | | | | |
Years Ended December 31, | | 2005 | | | 2004 | | | 2003 | | | 2002a | |
Selected Per Share Data | |
Net asset value, beginning of period | | $ | 8.77 | | | $ | 8.41 | | | $ | 7.39 | | | $ | 7.21 | |
| | | | | | | | | | | | | | | | |
Income (loss) from investment operations: | | | | | | | | | | | | | | | | |
Net investment incomeb | | | .65 | | | | .64 | | | | .64 | | | | .31 | |
Net realized and unrealized gain (loss) on investment transactions | | | (.39 | ) | | | .32 | | | | 1.03 | | | | (.13 | ) |
| | | | | | | | | | | | | | | | |
Total from investment operations | | | .26 | | | | .96 | | | | 1.67 | | | | .18 | |
| | | | | | | | | | | | | | | | |
Less distributions from: | | | | | | | | | | | | | | | | |
Net investment income | | | (.81 | ) | | | (.60 | ) | | | (.65 | ) | | | — | |
| | | | | | | | | | | | | | | | |
Net asset value, end of period | | $ | 8.22 | | | $ | 8.77 | | | $ | 8.41 | | | $ | 7.39 | |
| | | | | | | | | | | | | | | | |
Total Return (%) | | | 3.41 | | | | 12.08 | | | | 24.14 | | | | 2.50 | ** |
Ratios to Average Net Assets and Supplemental Data | | | | | | | | | | | | | | | | |
Net assets, end of period ($ millions) | | | 56 | | | | 57 | | | | 37 | | | | 1 | |
Ratio of expenses (%) | | | 1.10 | | | | 1.06 | | | | 1.06 | | | | .92 | * |
Ratio of net investment income (%) | | | 7.87 | | | | 7.71 | | | | 8.23 | | | | 8.78 | * |
Portfolio turnover rate (%) | | | 100 | | | | 162 | | | | 165 | | | | 138 | |
| a | For the period July 1, 2002 (commencement of operations of Class B shares) to December 31, 2002. |
| b | Based on average shares outstanding during the period. |
175
Performance Summary December 31, 2005
DWS Income Allocation VIP
All performance shown is historical, assumes reinvestment of all dividend and capital gain distributions and does not guarantee future results. Investment return and principal value fluctuate with changing market conditions so that, when redeemed, shares may be worth more or less than their original cost. Current performance may be lower or higher than the performance data quoted. Please visit www.dws-scudder.com for the Portfolio’s most recent month-end performance. Performance doesn’t reflect charges and fees (“contract charges”) associated with the separate account that invests in the Portfolio or any variable life insurance policy or variable annuity contract for which the Portfolio is an investment option. These charges and fees will reduce returns.
Diversification does not eliminate risk. The underlying portfolios invest in individual equity and bond funds whose yields and market values fluctuate, so that your investment may be worth more or less than its original cost. In addition, the underlying portfolios are subject to stock market risk, meaning stocks in the Portfolio may decline in value for extended periods of time due to the activities and financial prospects of individual companies, or due to general market and economic conditions. Investing in foreign securities presents certain unique risks not associated with domestic investments, such as currency fluctuation, political and economic changes, and market risks. Bond investments are subject to interest-rate risk such that when interest rates rise, the prices of the bonds, and thus the value of the Portfolio, can decline and the investor can lose principal value. Derivatives may be more volatile and less liquid than traditional securities, and the Portfolio could suffer losses on its derivative positions. Please read this Portfolio’s prospectus for specific details regarding its risk profile.
Portfolio returns shown for all periods reflect a fee waiver and/or expense reimbursement. Without this waiver/reimbursement, returns would have been lower.
Growth of an Assumed $10,000 Investment in DWS Income Allocation VIP from 8/16/2004 to 12/31/2005
¨ DWS Income Allocation VIP — Class B
¨ Lehman Brothers Aggregate Bond Index
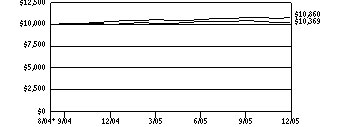
The Lehman Brothers Aggregate Bond (LBAB) Index is an unmanaged market value-weighted measure of treasury issues, corporate bond issues and mortgage securities.
Index returns assume reinvestment of all dividends and, unlike portfolio returns, do not reflect any fees or expenses. It is not possible to invest directly into an index.
Comparative Results
| | | | | | | | | | |
DWS Income Allocation VIP | | 1-Year | | | Life of Portfolio* | |
Class B | | Growth of $10,000 | | $ | 10,353 | | | $ | 10,860 | |
| | Average annual total return | | | 3.53 | % | | | 6.20 | % |
Lehman Brothers Aggregate Bond Index | | Growth of $10,000 | | $ | 10,243 | | | $ | 10,369 | |
| | Average annual total return | | | 2.43 | % | | | 2.75 | % |
The growth of $10,000 is cumulative.
| * | The Portfolio commenced operations on August 16, 2004. Index returns begin August 31, 2004. |
176
Information About Your Portfolio’s Expenses
DWS Income Allocation VIP
As an investor of the Portfolio, you incur two types of costs: ongoing expenses and transaction costs. Ongoing expenses include management fees, distribution and service (12b-1) fees and other Portfolio expenses. Examples of transaction costs include sales charges (loads), redemption fees and account maintenance fees, which are not shown in this section. The following tables are intended to help you understand your ongoing expenses (in dollars) of investing in the Portfolio and to help you compare these expenses with the ongoing expenses of investing in other mutual funds. In addition to the ongoing expenses which the Portfolio bears directly, the Portfolio’s shareholders indirectly bear the expense of the Underlying DWS Portfolios in which the Portfolio invests. The Portfolio’s estimated indirect expense from investing in the Underlying DWS Portfolios is based on its allocation of Underlying DWS Portfolios. In the most recent six-month period, the Portfolio limited these expenses; had it not done so, expenses would have been higher. The tables are based on an investment of $1,000 made at the beginning of the six-month period ended December 31, 2005.
The tables illustrate your Portfolio’s expenses in two ways:
Actual Portfolio Return. This helps you estimate the actual dollar amount of ongoing expenses (but not transaction costs) paid on a $1,000 investment in the Portfolio using the Portfolio’s actual return during the period. To estimate the expenses you paid over the period, simply divide your account value by $1,000 (for example, an $8,600 account value divided by $1,000 = 8.6), then multiply the result by the number in the “Expenses Paid per $1,000” line under the share class you hold.
Hypothetical 5% Portfolio Return. This helps you to compare your Portfolio’s ongoing expenses (but not transaction costs) with those of other mutual funds using the Portfolio’s actual expense ratio and a hypothetical rate of return of 5% per year before expenses. Examples using a 5% hypothetical Portfolio return may be found in the shareholder reports of other mutual funds. The hypothetical account values and expenses may not be used to estimate the actual ending account balance or expenses you paid for the period.
Please note that the expenses shown in these tables are meant to highlight your ongoing expenses only and do not reflect any transaction costs. The “Expenses Paid per $1,000” line of the tables is useful in comparing ongoing expenses only and will not help you determine the relative total expense of owning different funds. If these transaction costs had been included, your costs would have been higher.
Direct Portfolio Expenses and Value of a $1,000 Investment for the six months ended December 31, 2005
| | | |
Actual Portfolio Return | | Class B |
Beginning Account Value 7/1/05 | | $ | 1,000.00 |
Ending Account Value 12/31/05 | | $ | 1,018.80 |
Expenses Paid per $1,000* | | $ | 3.82 |
| |
Hypothetical 5% Portfolio Return | | Class B |
Beginning Account Value 7/1/05 | | $ | 1,000.00 |
Ending Account Value 12/31/05 | | $ | 1,021.42 |
Expenses Paid per $1,000* | | $ | 3.82 |
Direct Portfolio Expenses and Estimated Indirect Underlying DWS Portfolio Expenses and Value of a $1,000 Investment for the six months ended December 31, 2005
| | | |
Actual Portfolio Return | | Class B |
Beginning Account Value 7/1/05 | | $ | 1,000.00 |
Ending Account Value 12/31/05 | | $ | 1,018.80 |
Expenses Paid per $1,000** | | $ | 6.72 |
| |
Hypothetical 5% Portfolio Return | | Class B |
Beginning Account Value 7/1/05 | | $ | 1,000.00 |
Ending Account Value 12/31/05 | | $ | 1,018.55 |
Expenses Paid per $1,000** | | $ | 6.72 |
| * | Expenses are equal to the Portfolio’s annualized expense ratio for the share class, multiplied by the average account value over the period, multiplied by the number of days in the most recent six-month period, then divided by 365. |
| ** | Expenses are equal to the Portfolio’s annualized expense ratio for the share class plus the estimated indirect expense from investing in underlying portfolios in which the Portfolio invests, multiplied by the average account value over the period, multiplied by the number of days in the most recent six-month period, then divided by 365. |
| | | |
Annualized Expense Ratios | | Class B | |
Direct Portfolio Expense Ratio | | 0.75 | % |
Estimated Indirect Expenses of Underlying DWS Portfolios | | 0.57 | % |
Estimated Net Annual Portfolio and Underlying DWS Portfolios Expenses | | 1.32 | % |
For more information, please refer to the Portfolio’s prospectus.
These tables do not reflect charges and fees (“contract charges”) associated with the separate account that invests in the portfolio or any variable life insurance policy or variable annuity contract for which the portfolio is an investment option.
177
Management Summary December 31, 2005
DWS Income Allocation VIP
The US economy posted positive growth for all four quarters of 2005, with concerns about inflation and the sustainability of the economic expansion seeming to abate as the year progressed. All major asset classes — equities, bonds and cash — had positive returns for the year, and returns of the various asset classes were generally close to one another.
For the 12 months ended December 31, 2005, DWS Income Allocation VIP had a return of 3.53% (Class B shares, unadjusted for contract charges). Since this Portfolio invests in underlying portfolios from a broad array of investment styles, performance is analyzed by comparing the Portfolio’s return with the returns of indices that represent the major asset classes. As anticipated, since this Portfolio invests in a blend of equity and bond securities, its return was above that of its major bond indices but below that of the equity indices. The Portfolio slightly underperformed the average return of its Lipper Flexible Portfolio Funds category peers — most of which have a higher percentage of equities than DWS Income Allocation VIP portfolio.
The Portfolio’s allocation between stocks and bonds remained close to its target of 25% equity and 75% fixed income during 2005, but with equities overweighted throughout the year. This overweight was positive for returns, as equities outperformed bonds. An especially positive factor in performance was an overweight in international equities, as foreign markets were stronger than the US market. Decisions regarding cash position had an important effect on performance of this income-oriented Portfolio for the year. In June 2005, the target cash position was increased to 15%, with a corresponding reduction in the target position in bonds. (Cash and bonds together make up the 75% target for fixed-income securities in this Portfolio.) During the first half of the year, the cash position was maintained below the target. Beginning in July, the cash position was moved above the new higher target. Both of these decisions were positive for performance, as rising short-term interest rates pushed the return on cash-equivalent securities up.
Within the predominant fixed-income portion of the Portfolio, performance of the high-yield portion was excellent, but underperformance of the much larger investment-grade bond portion resulted in net underperformance in fixed-income. In the equity portion of the Portfolio, a slight bias toward value-oriented holdings established in July detracted from performance. Among underlying funds, the small-cap and growth holdings achieved the best results relative to the equity benchmarks, the Russell 1000 and Russell 2000 Indexes.
Inna Okounkova Robert Wang
Co-Managers, Deutsche Investment Management Americas Inc.
All performance shown is historical, assumes reinvestment of all dividend and capital gain distributions, and does not guarantee future results. Investment return and principal value fluctuate with changing market conditions so that, when redeemed, shares may be worth more or less than their original cost. Current performance may be lower or higher than the performance data quoted. Please visit www.dws-scudder.com for the product’s most recent month-end performance. Performance doesn’t reflect charges and fees (“contract charges”) associated with the separate account that invests in the Portfolio or any variable life insurance policy or variable annuity contract for which the Portfolio is an investment option. These charges and fees will reduce returns.
Risk Considerations
Diversification does not eliminate risk. The underlying portfolios invest in individual equity and bond funds whose yields and market values fluctuate, so that your investment may be worth more or less than its original cost. In addition, the underlying portfolios are subject to stock market risk, meaning stocks in the Portfolio may decline in value for extended periods of time due to the activities and financial prospects of individual companies, or due to general market and economic conditions. Investing in foreign securities presents certain unique risks not associated with domestic investments, such as currency fluctuation, political and economic changes, and market risks. Bond investments are subject to interest-rate risk such that when interest rates rise, the prices of the bonds, and thus the value of the Portfolio, can decline and the investor can lose principal value. Derivatives may be more volatile and less liquid than traditional securities, and the Portfolio could suffer losses on its derivative positions. Please read this Portfolio’s prospectus for specific details regarding its risk profile.
The Lipper Flexible Portfolio is a category that allocates its investments across various asset classes, including domestic common stocks, bonds, and money market instruments with a focus on total return.
The Russell 1000 Index is an unmanaged index that measures the performance of the 1,000 largest companies in the Russell 3000 Index, which represents approximately 92% of the total market capitalization of the Russell 3000 Index.
The Russell 2000 Index is an unmanaged capitalization-weighted measure of approximately 2,000 of the smallest companies in the Russell 3000 Index.
Equities are represented by the Russell 1000 Index, which is a price-only index of the 1,000 largest capitalized companies domiciled in the United States. Bonds are represented by the Lehman Brothers Aggregate Bond Index which measures domestic taxable investment-grade bonds. Cash is represented by the rate of return of 3-month Treasury bills.
Index returns assume reinvestment of all dividends and do not reflect fees or expenses. It is not possible to invest directly into an index or Lipper category.
Portfolio management market commentary is as of December 31, 2005, and may not come to pass. This information is subject to change at any time based on market and other conditions.
178
Portfolio Summary
DWS Income Allocation VIP
| | | | | | |
Asset Allocation | | 12/31/05 | | | 12/31/04 | |
Fixed Income Funds | | 56 | % | | 72 | % |
Equity Funds | | 25 | % | | 25 | % |
Cash Equivalents | | 19 | % | | 3 | % |
| | | | | | |
| | 100 | % | | 100 | % |
| | | | | | |
Asset allocation is subject to change.
For more complete details about the Portfolio’s investment portfolio, see page 21. A quarterly Fact Sheet is available upon request. Information concerning portfolio holdings of the Portfolio as of month end will be posted to www.dws-scudder.com on the 15th of the following month.
Following the Portfolio’s fiscal first and third quarter-end, a complete portfolio holdings listing is filed with the SEC on Form N-Q. The form will be available on the SEC’s Web site at www.sec.gov, and it also may be reviewed and copied at the SEC’s Public Reference Room in Washington, D.C. Information on the operation of the SEC’s Public Reference Room may be obtained by calling (800) SEC-0330.
179
Investment Portfolio December 31, 2005
DWS Income Allocation VIP
| | | | | | |
| | | Shares | | | Value ($) | |
Equity Funds 24.6% | |
DWS Blue Chip VIP “A” | | 23,280 | | | 346,408 | |
DWS Capital Growth VIP “A” | | 5,401 | | | 91,274 | |
DWS Davis Venture Value VIP “A” | | 14,483 | | | 180,893 | |
DWS Dreman High Return Equity VIP “A” | | 15,459 | | | 207,309 | |
DWS Dreman Small Cap Value VIP “A” | | 11,262 | | | 225,011 | |
DWS Global Opportunities VIP “A” | | 186 | | | 2,794 | |
DWS Growth and Income VIP “A” | | 58,515 | | | 568,764 | |
DWS International Select Equity VIP “A” | | 1,475 | | | 19,546 | |
DWS International VIP “A” | | 15,698 | | | 170,319 | |
DWS Janus Growth Opportunities VIP “A” | | 31,878 | | | 266,503 | |
DWS Large Cap Value VIP “A” | | 27,062 | | | 427,853 | |
DWS MFS Strategic Value VIP “A” | | 11,367 | | | 121,740 | |
DWS Mid Cap Growth VIP “A” | | 5,258 | | | 59,517 | |
DWS RREEF Real Estate Securities VIP “A” | | 5,212 | | | 86,423 | |
DWS Small Cap Growth VIP “A” | | 10,772 | | | 145,200 | |
DWS Templeton Foreign Value VIP “A” | | 10,405 | | | 118,935 | |
| | | | | | |
Total Equity Funds (Cost $2,852,508) | | | 3,038,489 | |
| | | | | | |
Fixed Income Funds 55.9% | | | | | | |
DWS Core Fixed Income VIP “A” | | 533,039 | | | 6,295,190 | |
DWS Government & Agency Securities VIP “A” | | 481 | | | 5,897 | |
DWS High Income VIP “A” | | 55,776 | | | 459,036 | |
DWS Strategic Income VIP “A” | | 9,984 | | | 114,816 | |
| | | | | | |
Total Fixed Income Funds (Cost $6,906,348) | | | 6,874,939 | |
| | | | | | |
Cash Equivalents 19.6% | | | | | | |
Cash Management QP Trust, 4.26% (a) (Cost $2,404,189) | | 2,404,189 | | | 2,404,189 | |
| | |
| | | % of Net Assets | | | Value ($) | |
Total Investment Portfolio (Cost $12,163,045)+ | | 100.1 | | | 12,317,617 | |
| | | | | | |
Other Assets and Liabilities, Net | | (0.1 | ) | | (24,198 | ) |
| | | | | | |
Net Assets | | 100.0 | | | 12,293,419 | |
| | | | | | |
Notes to DWS Income Allocation VIP Portfolio of Investments
| + | The cost for federal income tax purposes was $12,194,529. At December 31, 2005, net unrealized appreciation for all securities based on tax cost was $123,088. This consisted of aggregate gross unrealized appreciation for all securities in which there was an excess of value over tax cost of $190,239 and aggregate gross unrealized depreciation for all securities in which there was an excess of tax cost over value of $67,151. |
| (a) | Cash Management QP Trust, an affiliated fund, is managed by Deutsche Investment Management Americas Inc. The rate shown is the annualized seven-day yield at period end. |
The accompanying notes are an integral part of the financial statements.
180
Financial Statements
Statement of Assets and Liabilities
as of December 31, 2005
| | | |
Assets |
Investments: | | | |
Investments in Underlying Affiliated Portfolios, at value (cost $9,758,856) | | $ | 9,913,428 |
Investment in Cash Management QP Trust (cost $2,404,189) | | | 2,404,189 |
Total investments in securities, at value (cost $12,163,045) | | | 12,317,617 |
Interest receivable | | | 7,716 |
Other assets | | | 280 |
Total assets | | | 12,325,613 |
Liabilities | | | |
Payable for Portfolio shares redeemed | | | 2,236 |
Other accrued expenses and payables | | | 29,958 |
Total liabilities | | | 32,194 |
| | | |
Net assets, at value | | $ | 12,293,419 |
| | | |
Net Assets | | | |
Net assets consist of: | | | |
Undistributed net investment income | | | 236,972 |
Net unrealized appreciation (depreciation) on investments | | | 154,572 |
Accumulated net realized gain (loss) | | | 18,754 |
Paid-in capital | | | 11,883,121 |
| | | |
Net assets, at value | | $ | 12,293,419 |
| | | |
Class B | | | |
Net Asset Value, offering and redemption price per share ($12,293,419 ÷ 1,133,437 outstanding shares of beneficial interest, $.01 par value, unlimited number of shares authorized) | | $ | 10.85 |
181
Statement of Operations
for the year ended December 31, 2005
| | | |
Investment Income | | |
Income: | | | |
Income distributions from Underlying Affiliated Portfolios | | $ | 201,733 |
Interest — Cash Management QP Trust | | | 41,317 |
Total Income | | | 243,050 |
Expenses: | | | |
Management fee | | | 13,116 |
Custodian and accounting fees | | | 51,850 |
Distribution service fees (Class B) | | | 21,861 |
Record keeping fees (Class B) | | | 11,265 |
Auditing | | | 17,679 |
Legal | | | 13,832 |
Trustees’ fees and expenses | | | 61 |
Reports to shareholders | | | 2,965 |
| | | | |
Offering costs | | | 587 | |
Other | | | 702 | |
Total expenses before expense reductions | | | 133,918 | |
Expense reductions | | | (68,244 | ) |
| | | | |
Total expenses after expense reductions | | | 65,674 | |
| | | | |
Net investment income (loss) | | | 177,376 | |
| | | | |
Realized and Unrealized Gain (Loss) on Investment Transactions | | | | |
Net realized gains (loss) from investments | | | 20,522 | |
Capital gain distributions from Underlying Affiliated Portfolios | | | 59,010 | |
| | | | |
| | | 79,532 | |
| | | | |
Net unrealized appreciation (depreciation) during the period on investments | | | 127,168 | |
| | | | |
Net gain (loss) on investment transactions | | | 206,700 | |
| | | | |
Net increase (decrease) in net assets resulting from operations | | $ | 384,076 | |
| | | | |
The accompanying notes are an integral part of the financial statements.
182
Statement of Changes in Net Assets
| | | | | | | | |
Increase (Decrease) in Net Assets | | Year Ended
December 31, 2005 | | | Period Ended
December 31, 2004a | |
Operations: | | | | | | | | |
Net investment income (loss) | | $ | 177,376 | | | $ | (1,559 | ) |
Net realized gain (loss) on investment transactions | | | 79,532 | | | | 4,596 | |
Net unrealized appreciation (depreciation) during the period on investment transactions | | | 127,168 | | | | 27,404 | |
Net increase (decrease) in net assets resulting from operations | | | 384,076 | | | | 30,441 | |
Distributions to shareholders from: | | | | | | | | |
Net realized gain: | | | | | | | | |
Class B | | | (6,405 | ) | | | — | |
Portfolio share transactions: | | | | | | | | |
Class B Proceeds from shares sold | | | 12,600,777 | | | | 1,899,687 | |
Reinvestment of distributions | | | 6,405 | | | | — | |
Cost of shares redeemed | | | (2,552,118 | ) | | | (69,444 | ) |
Net increase (decrease) in net assets from Class B share transactions | | | 10,055,064 | | | | 1,830,243 | |
Increase (decrease) in net assets | | | 10,432,735 | | | | 1,860,684 | |
Net assets at beginning of period | | | 1,860,684 | | | | — | |
| | | | | | | | |
Net assets at end of period (including undistributed net investment income of $236,972 and $0, respectively) | | $ | 12,293,419 | | | $ | 1,860,684 | |
| | | | | | | | |
Other Information | | | | | | | | |
Class B | | | | | | | | |
Shares outstanding at beginning of period | | | 177,411 | | | | — | |
Shares sold | | | 1,194,054 | | | | 184,103 | |
Shares issued to shareholders in reinvestment of distributions | | | 615 | | | | — | |
Shares redeemed | | | (238,643 | ) | | | (6,692 | ) |
Net increase (decrease) in Class B shares | | | 956,026 | | | | 177,411 | |
| | | | | | | | |
Shares outstanding at end of period | | | 1,133,437 | | | | 177,411 | |
| | | | | | | | |
| a | For the period from August 16, 2004 (commencement of operations) to December 31, 2004. |
The accompanying notes are an integral part of the financial statements.
183
Financial Highlights
| | | | | | | | |
| Class B | | | | | | |
| | |
Years Ended December 31, | | 2005 | | | 2004a | |
Selected Per Share Data | | | | | | | | |
Net asset value, beginning of period | | $ | 10.49 | | | $ | 10.00 | |
| | | | | | | | |
Income (loss) from investment operations: | | | | | | | | |
Net investment income (loss)b | | | .21 | | | | (.02 | ) |
Net realized and unrealized gain (loss) on investment transactions | | | .16 | | | | .51 | |
Total from investment operations | | | .37 | | | | .49 | |
Less distributions from: | | | | | | | | |
Net realized gains on investment transactions | | | (.01 | ) | | | — | |
| | | | | | | | |
Net asset value, end of period | | $ | 10.85 | | | $ | 10.49 | |
| | | | | | | | |
Total Return (%)c,d | | | 3.53 | | | | 4.90 | ** |
Ratios to Average Net Assets and Supplemental Data | | | | | | | | |
Net assets, end of period ($ millions) | | | 12 | | | | 2 | |
Ratio of expenses before expense reductions (%)e | | | 1.53 | | | | 21.20 | * |
Ratio of expenses after expense reductions (%)e | | | .75 | | | | .75 | * |
Ratio of net investment income (%) | | | 2.03 | | | | (.63 | )* |
Portfolio turnover rate (%) | | | 46 | | | | 37 | * |
| a | For the period from August 16, 2004 (commencement of operations) to December 31, 2004. |
| b | Based on average shares outstanding during the period. |
| c | Total return would have been lower had certain expenses not been reduced. |
| d | Total return would have lower if the Advisor had not maintained some Underlying Portfolios’ expenses. |
| e | The Portfolio invests in other DWS Portfolios and indirectly bears its proportionate share of fees and expenses incurred by the Underlying DWS Portfolios in which the Portfolio is invested. |
184
Performance Summary December 31, 2005
DWS International Select Equity VIP
All performance shown is historical, assumes reinvestment of all dividend and capital gain distributions and does not guarantee future results. Investment return and principal value fluctuate with changing market conditions so that, when redeemed, shares may be worth more or less than their original cost. Current performance may be lower or higher than the performance data quoted. Please visit www.dws-scudder.com for the Portfolio’s most recent month-end performance. Performance doesn’t reflect charges and fees (“contract charges”) associated with the separate account that invests in the Portfolio or any variable life insurance policy or variable annuity contract for which the Portfolio is an investment option. These charges and fees will reduce returns. While all share classes have the same underlying portfolio, their performance will differ.
This Portfolio is subject to stock market risk, meaning stocks in the Portfolio may decline in value for extended periods of time due to the activities and financial prospects of individual companies, or due to general market and economic conditions. Additionally, investing in foreign securities presents certain unique risks not associated with domestic investments, such as currency fluctuation, political and economic changes and market risks. This may result in greater share price volatility. Please read this Portfolio’s prospectus for specific details regarding its investments and risk profile.
Growth of an Assumed $10,000 Investment in DWS International Select Equity VIP
¨ DWS International Select Equity VIP — Class A
¨ MSCI EAFE + EM Index
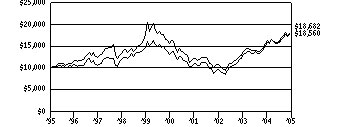
Yearly periods ended December 31
The MSCI EAFE + EM Index (Morgan Stanley Capital International Europe, Australasia, Far East + Emerging Markets Index) is an unmanaged index generally accepted as a benchmark for major overseas markets plus emerging markets. The index is calculated using closing local market prices and converts to US dollars using the London close foreign exchange rates. Index returns assume reinvested dividends and, unlike Portfolio returns, do not reflect any fees or expenses. It is not possible to invest directly into an index.
Comparative Results
| | | | | | | | | | | | | | | | | | |
DWS International Select Equity VIP | | 1-Year | | | 3-Year | | | 5-Year | | | 10-Year | |
Class A | | Growth of $10,000 | | $ | 11,451 | | | $ | 17,579 | | | $ | 11,494 | | | $ | 18,682 | |
| | Average annual total return | | | 14.51 | % | | | 20.69 | % | | | 2.82 | % | | | 6.45 | % |
MSCI EAFE + EM Index | | Growth of $10,000 | | $ | 11,641 | | | $ | 19,863 | | | $ | 13,635 | | | $ | 18,560 | |
| | Average annual total return | | | 16.41 | % | | | 25.70 | % | | | 6.40 | % | | | 6.38 | % |
| | | |
DWS International Select Equity VIP | | | 1-Year | | | 3-Year | | | Life of Class* | |
Class B | | Growth of $10,000 | | | | | | $ | 11,400 | | | $ | 17,385 | | | $ | 15,372 | |
| | Average annual total return | | | | | | | 14.00 | % | | | 20.24 | % | | | 13.07 | % |
MSCI EAFE + EM Index | | Growth of $10,000 | | | | | | $ | 11,641 | | | $ | 19,863 | | | $ | 17,097 | |
| | Average annual total return | | | | | | | 16.41 | % | | | 25.70 | % | | | 16.56 | % |
The growth of $10,000 is cumulative.
| * | The Portfolio commenced offering Class B shares on July 1, 2002. Index returns begin June 30, 2002. |
185
Information About Your Portfolio’s Expenses
DWS International Select Equity VIP
As an investor of the Portfolio, you incur two types of costs: ongoing expenses and transaction costs. Ongoing expenses include management fees, distribution and service (12b-1) fees and other Portfolio expenses. Examples of transaction costs include sales charges (loads), redemption fees and account maintenance fees, which are not shown in this section. The following tables are intended to help you understand your ongoing expenses (in dollars) of investing in the Portfolio and to help you compare these expenses with the ongoing expenses of investing in other mutual funds. The tables are based on an investment of $1,000 made at the beginning of the six-month period ended December 31, 2005.
The tables illustrate your Portfolio’s expenses in two ways:
Actual Portfolio Return. This helps you estimate the actual dollar amount of ongoing expenses (but not transaction costs) paid on a $1,000 investment in the Portfolio using the Portfolio’s actual return during the period. To estimate the expenses you paid over the period, simply divide your account value by $1,000 (for example, an $8,600 account value divided by $1,000 = 8.6), then multiply the result by the number in the “Expenses Paid per $1,000” line under the share class you hold.
Hypothetical 5% Portfolio Return. This helps you to compare your Portfolio’s ongoing expenses (but not transaction costs) with those of other mutual funds using the Portfolio’s actual expense ratio and a hypothetical rate of return of 5% per year before expenses. Examples using a 5% hypothetical Portfolio return may be found in the shareholder reports of other mutual funds. The hypothetical account values and expenses may not be used to estimate the actual ending account balance or expenses you paid for the period.
Please note that the expenses shown in these tables are meant to highlight your ongoing expenses only and do not reflect any transaction costs. The “Expenses Paid per $1,000” line of the tables is useful in comparing ongoing expenses only and will not help you determine the relative total expense of owning different funds. If these transaction costs had been included, your costs would have been higher.
Expenses and Value of a $1,000 Investment for the six months ended December 31, 2005
| | | | | | |
Actual Portfolio Return | | Class A | | Class B |
Beginning Account Value 7/1/05 | | $ | 1,000.00 | | $ | 1,000.00 |
Ending Account Value 12/31/05 | | $ | 1,156.20 | | $ | 1,153.70 |
Expenses Paid per $1,000* | | $ | 4.73 | | $ | 6.89 |
| | |
Hypothetical 5% Portfolio Return | | Class A | | Class B |
Beginning Account Value 7/1/05 | | $ | 1,000.00 | | $ | 1,000.00 |
Ending Account Value 12/31/05 | | $ | 1,020.82 | | $ | 1,018.80 |
Expenses Paid per $1,000* | | $ | 4.43 | | $ | 6.46 |
| * | Expenses are equal to the Portfolio’s annualized expense ratio for each share class, multiplied by the average account value over the period, multiplied by the number of days in the most recent six-month period, then divided by 365. |
| | | | | | |
Annualized Expense Ratios | | Class A | | | Class B | |
DWS Variable Series II — DWS International Select Equity VIP | | .87 | % | | 1.27 | % |
For more information, please refer to the Portfolio’s prospectus.
These tables do not reflect charges and fees (“contract charges”) associated with the separate account that invests in the portfolio or any variable life insurance policy or variable annuity contract for which the portfolio is an investment option.
186
Management Summary December 31, 2005
DWS International Select Equity VIP
International equities delivered strong performance in 2005 relative to most other asset classes. The MSCI EAFE Index returned 13.54% in US dollar terms and was even stronger in local currency terms with a gain of 29.00%. All developed regions reported positive returns, with Japan producing the largest gain of the countries in the MSCI EAFE Index. The Class A shares of the portfolio returned 14.51% (unadjusted for sales charges), compared to its benchmark, the MSCI EAFE + EMF Index, which returned 16.41%.
The portfolio’s return was bolstered by outperformance in seven of 10 market sectors. The most notable contributors came from our stock selection in the information technology (IT) and energy sectors. In IT, the worst-performing sector in the benchmark, the portfolio’s holdings delivered an aggregate return more than double that of the stocks in the benchmark. Here, Samsung Electronics Co., Ltd. and Indra Sistemas (not held in the portfolio as of December 31, 2005) produced robust results on the strength of better-than-expected earnings. Within energy, key holdings including Petroleo Brasileiro SA, Total SA and ENI SpA benefited from the rising price of oil. Additionally, the portfolio’s holdings in Japanese financials such as Mizuho Financial Group Inc., Mitsui Fudosan Co., Ltd. and Credit Saison Co., Ltd. were lifted by Japan’s economic recovery. On the negative side, our stock picks in the consumer discretionary sector underperformed. The largest detractor was Nokian Renkaat Oyj, a Finnish manufacturer of winter tires.
Looking ahead, management believes investors will increasingly reward those companies that can command higher prices for their products and services based on their brand, technological capability, market position or cost advantage, as well as those which have the ability to grow amid a potentially slower global macroeconomic environment.
Matthias Knerr, CFA
Manager
Deutsche Investment Management Americas Inc.
All performance shown is historical, assumes reinvestment of all dividend and capital gain distributions, and does not guarantee future results. Investment return and principal value fluctuate with changing market conditions so that, when redeemed, shares may be worth more or less than their original cost. Current performance may be lower or higher than the performance data quoted. Please visit www.dws-scudder.com for the product’s most recent month-end performance. Performance doesn’t reflect charges and fees (“contract charges”) associated with the separate account that invests in the Portfolio or any variable life insurance policy or variable annuity contract for which the Portfolio is an investment option. These charges and fees will reduce returns.
Risk Considerations
This Portfolio is subject to stock market risk, meaning stocks in the Portfolio may decline in value for extended periods of time due to the activities and financial prospects of individual companies, or due to general market and economic conditions. Additionally, investing in foreign securities presents certain unique risks not associated with domestic investments, such as currency fluctuation, political and economic changes and market risks. This may result in greater share price volatility. Please read this Portfolio’s prospectus for specific details regarding its investments and risk profile.
The MSCI EAFE + EM Index (Morgan Stanley Capital International Europe, Australasia, Far East + Emerging Markets Index) is an unmanaged index generally accepted as a benchmark for major overseas markets plus emerging markets. The index is calculated using closing local market prices and converts to US dollars using the London close foreign exchange rates.
The Morgan Stanley Capital International (MSCI) Europe, Australasia and Far East (EAFE) Index is an unmanaged, capitalization-weighted index that tracks international stock performance in the 21 developed markets of Europe , Australasia and the Far East. The index is calculated using closing local market prices and converts to US dollars using the London close foreign exchange rates.
Index returns assume reinvestment of dividends and, unlike Portfolio returns, do not reflect any fees or expenses. It is not possible to invest directly into an index.
Portfolio management market commentary is as of December 31, 2005, and may not come to pass. This information is subject to change at any time based on market and other conditions.
187
Portfolio Summary
DWS International Select Equity VIP
| | | | | | |
Asset Allocation (Excludes Securities Lending Collateral) | | 12/31/05 | | | 12/31/04 | |
Common Stocks | | 99 | % | | 99 | % |
Preferred Stocks | | 1 | % | | — | |
Cash Equivalents | | — | | | 1 | % |
| | | | | | |
| | 100 | % | | 100 | % |
| | | | | | |
| | | | | | |
Geographical Diversification (As a % of Common and Preferred Stocks) | | 12/31/05 | | | 12/31/04 | |
Continental Europe | | 48 | % | | 51 | % |
Japan | | 23 | % | | 19 | % |
United Kingdom | | 17 | % | | 18 | % |
Asia (excluding Japan) | | 6 | % | | 12 | % |
Australia | | 3 | % | | — | |
Latin America | | 3 | % | | — | |
| | | | | | |
| | 100 | % | | 100 | % |
| | | | | | |
| | | | | | |
Sector Diversification (As a % of Common and Preferred Stocks) | | 12/31/05 | | | 12/31/04 | |
Financials | | 30 | % | | 27 | % |
Consumer Discretionary | | 17 | % | | 14 | % |
Energy | | 11 | % | | 10 | % |
Industrials | | 10 | % | | 13 | % |
Health Care | | 9 | % | | 8 | % |
Materials | | 8 | % | | 5 | % |
Information Technology | | 6 | % | | 8 | % |
Consumer Staples | | 6 | % | | 4 | % |
Utilities | | 2 | % | | 3 | % |
Telecommunications Services | | 1 | % | | 8 | % |
| | | | | | |
| | 100 | % | | 100 | % |
| | | | | | |
Asset allocation, geographical diversification and sector diversifications are subject to change.
For more complete details about the Portfolio’s investment portfolio, see page 29. A quarterly Fact Sheet is available upon request. Information concerning portfolio holdings of the Portfolio as of month end will be posted to www.dws-scudder.com on the 15th of the following month.
Following the Portfolio’s fiscal first and third quarter-end, a complete portfolio holdings listing is filed with the SEC on Form N-Q. The form will be available on the SEC’s Web site at www.sec.gov, and it also may be reviewed and copied at the SEC’s Public Reference Room in Washington, D.C. Information on the operation of the SEC’s Public Reference Room may be obtained by calling (800) SEC-0330.
188
Investment Portfolio December 31, 2005
DWS International Select Equity VIP
| | | | |
| | | Shares | | Value ($) |
Common Stocks 98.5% |
Australia 2.6% |
Australia and New Zealand Banking Group Ltd. | | 194,000 | | 3,406,203 |
Macquarie Bank Ltd. | | 67,700 | | 3,382,345 |
| | | | |
(Cost $6,007,577) | | | | 6,788,548 |
| | | | |
Brazil 1.5% | | | | |
Petroleo Brasileiro SA (ADR) (Cost $2,430,879) | | 53,800 | | 3,834,326 |
| | | | |
Denmark 1.0% | | | | |
A P Moller — Maersk AS (Cost $2,416,836) | | 254 | | 2,627,864 |
| | | | |
Finland 5.0% | | | | |
Fortum Oyj | | 211,000 | | 3,956,878 |
Neste Oil Oyj* | | 81,250 | | 2,297,062 |
Nokia Oyj | | 139,500 | | 2,551,630 |
Nokian Renkaat Oyj | | 322,400 | | 4,064,991 |
| | | | |
(Cost $12,414,009) | | | | 12,870,561 |
| | | | |
France 11.8% | | | | |
BNP Paribas SA | | 85,762 | | 6,939,823 |
Pernod Ricard SA | | 30,169 | | 5,264,697 |
Schneider Electric SA | | 63,131 | | 5,631,718 |
Total SA | | 33,088 | | 8,312,485 |
Vivendi Universal SA | | 136,867 | | 4,287,495 |
| | | | |
(Cost $25,341,891) | | | | 30,436,218 |
| | | | |
Germany 13.0% | | | | |
Adidas-Salomon AG | | 27,867 | | 5,278,678 |
Allianz AG (Registered) | | 38,662 | | 5,856,062 |
Bayer AG | | 135,912 | | 5,678,380 |
Commerzbank AG | | 168,803 | | 5,199,989 |
E.ON AG | | 52,732 | | 5,455,706 |
Hypo Real Estate Holding AG | | 115,744 | | 6,026,549 |
| | | | |
(Cost $24,907,175) | | | | 33,495,364 |
| | | | |
Hong Kong 1.2% | | | | |
Esprit Holdings Ltd. (Cost $3,151,995) | | 454,046 | | 3,226,601 |
| | | | |
India 1.1% | | | | |
ICICI Bank Ltd. (ADR) (Cost $2,470,907) | | 97,800 | | 2,816,640 |
| | | | |
Ireland 3.0% | | | | |
Anglo Irish Bank Corp. PLC | | 255,700 | | 3,880,911 |
CRH PLC | | 135,558 | | 3,988,105 |
| | | | |
(Cost $5,294,132) | | | | 7,869,016 |
| | | | |
Italy 6.2% | | | | |
Banca Intesa SpA | | 1,164,800 | | 6,171,055 |
Eni SpA | | 262,760 | | 7,288,640 |
Safilo SpA* | | 448,700 | | 2,571,085 |
| | | | |
(Cost $12,084,226) | | | | 16,030,780 |
| | | | |
189
| | | | | | |
| | | Shares | | | Value ($) | |
Japan 22.6% | | | | | | |
AEON Co., Ltd. | | 245,000 | | | 6,232,247 | |
Canon, Inc. | | 107,800 | | | 6,307,033 | |
Credit Saison Co., Ltd. | | 78,800 | | | 3,935,490 | |
Daito Trust Construction Co., Ltd. | | 99,000 | | | 5,120,617 | |
Mitsubishi Corp. | | 368,000 | | | 8,144,147 | |
Mitsubishi UFJ Financial Group, Inc. | | 396 | | | 5,372,451 | |
Mitsui Fudosan Co., Ltd. | | 341,000 | | | 6,924,959 | |
Mizuho Financial Group, Inc. | | 546 | | | 4,333,370 | |
Sega Sammy Holdings, Inc. | | 156,000 | | | 5,224,912 | |
Toyota Motor Corp. | | 128,300 | | | 6,657,871 | |
| | | | | | |
(Cost $40,446,633) | | | | | 58,253,097 | |
| | | | | | |
Korea 3.5% | | | | | | |
POSCO (ADR) (a) | | 48,700 | | | 2,411,137 | |
Samsung Electronics Co., Ltd. (GDR), 144A | | 19,990 | | | 6,586,705 | |
| | | | | | |
(Cost $6,034,078) | | | | | 8,997,842 | |
| | | | | | |
Mexico 1.8% | |
Fomento Economico Mexicano SA de CV (ADR) (Cost $4,289,151) | | 63,300 | | | 4,589,883 | |
| | | | | | |
Russia 1.9% | |
Novolipetsk Steel (GDR) 144A* | | 167,100 | | | 2,389,530 | |
OAO Gazprom (ADR) (REG S) | | 36,000 | | | 2,581,200 | |
| | | | | | |
(Cost $4,920,911) | | | | | 4,970,730 | |
| | | | | | |
Switzerland 5.3% | |
Credit Suisse Group (Registered) | | 122,977 | | | 6,270,278 | |
Roche Holding AG (Genusschein) | | 48,919 | | | 7,345,017 | |
| | | | | | |
(Cost $8,498,569) | | | | | 13,615,295 | |
| | | | | | |
United Kingdom 17.0% | |
AstraZeneca PLC | | 54,967 | | | 2,675,408 | |
GlaxoSmithKline PLC | | 342,654 | | | 8,660,293 | |
Imperial Tobacco Group PLC | | 149,930 | | | 4,480,674 | |
Informa PLC | | 355,789 | | | 2,655,137 | |
Punch Taverns PLC | | 325,498 | | | 4,754,567 | |
Rio Tinto PLC | | 105,722 | | | 4,829,308 | |
Royal Bank of Scotland Group PLC | | 249,448 | | | 7,532,031 | |
Smiths Group PLC | | 267,992 | | | 4,822,902 | |
Vodafone Group PLC | | 1,618,432 | | | 3,494,565 | |
| | | | | | |
(Cost $38,115,931) | | | | | 43,904,885 | |
| | | | | | |
Total Common Stocks (Cost $198,824,900) | | | | | 254,327,650 | |
| | | | | | |
Preferred Stocks 1.1% | |
Germany | |
Fresenius Medical Care AG (Cost $2,578,202) | | 31,400 | | | 2,931,206 | |
| | | | | | |
Securities Lending Collateral 0.7% | |
Daily Assets Fund Institutional, 4.28% (b) (c) (Cost $1,828,178) | | 1,828,178 | | | 1,828,178 | |
| | | | | | |
Cash Equivalents 0.3% | |
Cash Management QP Trust 4.26% (d) (Cost $618,079) | | 618,079 | | | 618,079 | |
| | | | | | |
| | |
| | | % of Net Assets | | | Value ($) | |
Total Investment Portfolio (Cost $203,849,359)+ | | 100.6 | | | 259,705,113 | |
| | | | | | |
Other Assets and Liabilities, Net | | (0.6 | ) | | (1,478,080 | ) |
| | | | | | |
Net Assets | | 100.0 | | | 258,227,033 | |
| | | | | | |
190
Notes to DWS International Select Equity VIP Portfolio of Investments
| * | Non-income producing security. |
| + | The cost for federal income tax purposes was $208,792,097. At December 31, 2005, net unrealized appreciation for all securities based on tax cost was $50,913,016. This consisted of aggregate gross unrealized appreciation for all securities in which there was an excess of value over tax cost of $52,367,150 and aggregate gross unrealized depreciation for all securities in which there was an excess of tax cost over value of $1,454,134. |
| (a) | All or a portion of these securities were on loan (see Notes to Financial Statements). The value of all securities loaned at December 31, 2005 amounted to $1,775,330 which is 0.7% of net assets. |
| (b) | Daily Assets Fund Institutional, an affiliated fund, is managed by Deutsche Asset Management, Inc. The rate shown is the annualized seven-day yield at period end. |
| (c) | Represents collateral held in connection with securities lending. |
| (d) | Cash Management QP Trust, an affiliated fund, is managed by Deutsche Investment Management Americas Inc. The rate shown is the annualized seven-day yield at period end. |
| 144A: | Security exempt from registration under Rule 144A of the Securities Act of 1933. These securities may be resold in transactions exempt from registration, normally to qualified institutional buyers. |
| ADR: | American Depositary Receipt |
| GDR: | Global Depositary Receipt |
The accompanying notes are an integral part of the financial statements.
191
Financial Statements
Statement of Assets and Liabilities
as of December 31, 2005
| | | |
Assets | | | |
Investments: | | | |
Investments in securities, at value (cost $201,403,102) — including $1,775,330 of securities loaned | | $ | 257,258,856 |
Investment in Daily Assets Fund Institutional (cost $1,828,178)* | | | 1,828,178 |
Investment in Cash Management QP Trust (cost $618,079) | | | 618,079 |
Total investments in securities, at value (cost $203,849,359) | | | 259,705,113 |
Cash | | | 481 |
Foreign currency, at value (cost $36,862) | | | 36,874 |
Receivable for investments sold | | | 421,699 |
Dividends receivable | | | 460,532 |
Interest receivable | | | 9,236 |
Receivable for Portfolio shares sold | | | 15,060 |
Foreign taxes recoverable | | | 124,836 |
Other assets | | | 8,157 |
| | | |
Total assets | | | 260,781,988 |
| | | |
Liabilities | | | |
Payable for investments purchased | | | 36,547 |
Payable for Portfolio shares redeemed | | | 374,959 |
Payable upon return of securities loaned | | | 1,828,178 |
Accrued management fee | | | 178,477 |
Other accrued expenses and payables | | | 136,794 |
Total liabilities | | | 2,554,955 |
| | | |
Net assets, at value | | $ | 258,227,033 |
| | | |
| | | | |
Net Assets | | | | |
Net assets consist of: | | | | |
Undistributed net investment income | | | 1,038,108 | |
Net unrealized appreciation (depreciation) on: | | | | |
Investments | | | 55,855,754 | |
Foreign currency related transactions | | | 6,452 | |
Accumulated net realized gain (loss) | | | (22,678,316 | ) |
Paid-in capital | | | 224,005,035 | |
| | | | |
Net assets, at value | | $ | 258,227,033 | |
| | | | |
Class A | | | | |
Net Asset Value, offering and redemption price per share ($195,805,580 ÷ 14,778,650 outstanding shares of beneficial interest, $.01 par value, unlimited number of shares authorized) | | $ | 13.25 | |
| | | | |
Class B | | | | |
Net Asset Value, offering and redemption price per share ($62,421,453 ÷ 4,725,198 outstanding shares of beneficial interest, $.01 par value, unlimited number of shares authorized) | | $ | 13.21 | |
| | | | |
| * | Represents collateral on securities loaned. |
192
Statement of Operations
for the year ended December 31, 2005
| | | | |
Investment Income | | | | |
Income: | | | | |
Dividends (net of foreign taxes withheld of $733,522) | | $ | 5,641,648 | |
Interest | | | 42,592 | |
Interest — Cash Management QP Trust | | | 46,128 | |
Securities lending income, including income from Daily Assets Fund Institutional, net of borrower rebates | | | 176,291 | |
Total Income | | | 5,906,659 | |
Expenses: | | | | |
Management fee | | | 1,801,345 | |
Custodian fees | | | 137,190 | |
Distribution service fees (Class B) | | | 133,737 | |
Record keeping fees (Class B) | | | 72,388 | |
Auditing | | | 59,184 | |
Legal | | | 10,300 | |
Trustees’ fees and expenses | | | 8,701 | |
Reports to shareholders | | | 55,856 | |
Other | | | 22,574 | |
Total expenses before expense reductions | | | 2,301,275 | |
Expense reductions | | | (3,755 | ) |
Total expenses after expense reductions | | | 2,297,520 | |
| | | | |
Net investment income (loss) | | | 3,609,139 | |
| | | | |
Realized and Unrealized Gain (Loss) on Investment Transactions | | | | |
Net realized gain (loss) from: | | | | |
Investments | | | 26,993,086 | |
Foreign currency related transactions | | | (521,069 | ) |
| | | 26,472,017 | |
| | | | |
Net unrealized appreciation (depreciation) during the period on: | | | | |
Investments | | | 3,494,086 | |
Foreign currency related transactions | | | (197,122 | ) |
| | | 3,296,964 | |
| | | | |
Net gain (loss) on investment transactions | | | 29,768,981 | |
| | | | |
Net increase (decrease) in net assets resulting from operations | | $ | 33,378,120 | |
| | | | |
The accompanying notes are an integral part of the financial statements.
193
Statement of Changes in Net Assets
| | | | | | | | |
| | | Years Ended December 31, | |
| | | 2005 | | | 2004 | |
Increase (Decrease) in Net Assets | | | | | | | | |
Operations: | | | | | | | | |
Net investment income (loss) | | $ | 3,609,139 | | | $ | 2,816,586 | |
Net realized gain (loss) on investment transactions | | | 26,472,017 | | | | 10,653,908 | |
Net unrealized appreciation (depreciation) during the period on investment transactions | | | 3,296,964 | | | | 20,514,926 | |
Net increase (decrease) in net assets resulting from operations | | | 33,378,120 | | | | 33,985,420 | |
Distributions to shareholders from: | | | | | | | | |
Net investment income: | | | | | | | | |
Class A | | | (5,238,343 | ) | | | (1,616,136 | ) |
Class B | | | (1,218,036 | ) | | | (162,336 | ) |
Portfolio share transactions: | | | | | | | | |
Class A | | | | | | | | |
Proceeds from shares sold | | | 24,909,113 | | | | 40,441,379 | |
Reinvestment of distributions | | | 5,238,343 | | | | 1,616,136 | |
Cost of shares redeemed | | | (38,838,821 | ) | | | (30,593,940 | ) |
Net increase (decrease) in net assets from Class A share transactions | | | (8,691,365 | ) | | | 11,463,575 | |
Class B | | | | | | | | |
Proceeds from shares sold | | | 13,931,982 | | | | 25,663,873 | |
Reinvestment of distributions | | | 1,218,036 | | | | 162,336 | |
Cost of shares redeemed | | | (5,723,561 | ) | | | (3,432,245 | ) |
Net increase (decrease) in net assets from Class B share transactions | | | 9,426,457 | | | | 22,393,964 | |
Increase (decrease) in net assets | | | 27,656,833 | | | | 66,064,487 | |
Net assets at beginning of period | | | 230,570,200 | | | | 164,505,713 | |
| | | | | | | | |
Net assets at end of period (including undistributed net investment income of $1,038,108 and $3,173,342, respectively) | | $ | 258,227,033 | | | $ | 230,570,200 | |
| | | | | | | | |
Other Information | | | | | | | | |
Class A | | | | | | | | |
Shares outstanding at beginning of period | | | 15,442,740 | | | | 14,404,846 | |
Shares sold | | | 2,084,048 | | | | 3,811,740 | |
Shares issued to shareholders in reinvestment of distributions | | | 457,897 | | | | 154,506 | |
Shares redeemed | | | (3,206,035 | ) | | | (2,928,352 | ) |
Net increase (decrease) in Class A shares | | | (664,090 | ) | | | 1,037,894 | |
| | | | | | | | |
Shares outstanding at end of period | | | 14,778,650 | | | | 15,442,740 | |
| | | | | | | | |
Class B | | | | | | | | |
Shares outstanding at beginning of period | | | 3,923,204 | | | | 1,760,419 | |
Shares sold | | | 1,162,087 | | | | 2,466,794 | |
Shares issued to shareholders in reinvestment of distributions | | | 106,471 | | | | 15,520 | |
Shares redeemed | | | (466,564 | ) | | | (319,529 | ) |
Net increase (decrease) in Class B shares | | | 801,994 | | | | 2,162,785 | |
| | | | | | | | |
Shares outstanding at end of period | | | 4,725,198 | | | | 3,923,204 | |
| | | | | | | | |
The accompanying notes are an integral part of the financial statements.
194
Financial Highlights
Class A
| | | | | | | | | | | | | | | | | | | | |
Years Ended December 31, | | 2005 | | | 2004 | | | 2003 | | | 2002 | | | 2001 | |
Selected Per Share Data | | | | | | | | | | | | | | | | | | | | |
Net asset value, beginning of period | | $ | 11.91 | | | $ | 10.18 | | | $ | 7.96 | | | $ | 9.24 | | | $ | 14.73 | |
| | | | | | | | | | | | | | | | | | | | |
| Income (loss) from investment operations: | | | | | | | | | | | | | | | | | | | | |
Net investment income (loss)a | | | .20 | | | | .17 | | | | .10 | | | | .12 | | | | .05 | |
Net realized and unrealized gain (loss) on investment transactions | | | 1.48 | | | | 1.67 | | | | 2.23 | | | | (1.36 | ) | | | (3.46 | ) |
Total from investment operations | | | 1.68 | | | | 1.84 | | | | 2.33 | | | | (1.24 | ) | | | (3.41 | ) |
| Less distributions from: | | | | | | | | | | | | | | | | | | | | |
Net investment income | | | (.34 | ) | | | (.11 | ) | | | (.11 | ) | | | (.04 | ) | | | (.10 | ) |
Net realized gain on investment transactions | | | — | | | | — | | | | — | | | | — | | | | (1.98 | ) |
Total distributions | | | (.34 | ) | | | (.11 | ) | | | (.11 | ) | | | (.04 | ) | | | (2.08 | ) |
| | | | | | | | | | | | | | | | | | | | |
Net asset value, end of period | | $ | 13.25 | | | $ | 11.91 | | | $ | 10.18 | | | $ | 7.96 | | | $ | 9.24 | |
| | | | | | | | | | | | | | | | | | | | |
Total Return (%) | | | 14.51 | | | | 18.25 | | | | 29.83 | | | | (13.48 | ) | | | (24.43 | ) |
Ratios to Average Net Assets and Supplemental Data | | | | | | | | | | | | | | | | | | | | |
Net assets, end of period ($ millions) | | | 196 | | | | 184 | | | | 147 | | | | 120 | | | | 121 | |
Ratio of expenses (%) | | | .87 | | | | .89 | | | | .94 | | | | .85 | | | | .92 | |
Ratio of net investment income (%) | | | 1.59 | | | | 1.58 | | | | 1.17 | | | | 1.46 | | | | .44 | |
Portfolio turnover rate (%) | | | 93 | | | | 88 | | | | 139 | | | | 190 | | | | 145 | |
| a | Based on average shares outstanding during the period. |
Class B
| | | | | | | | | | | | | | | | |
Years Ended December 31, | | 2005 | | | 2004 | | | 2003 | | | 2002a | |
Selected Per Share Data | | | | | | | | | | | | | | | | |
Net asset value, beginning of period | | $ | 11.88 | | | $ | 10.15 | | | $ | 7.94 | | | $ | 8.98 | |
| | | | | | | | | | | | | | | | |
| Income (loss) from investment operations: | | | | | | | | | | | | | | | | |
Net investment income (loss)b | | | .15 | | | | .13 | | | | .06 | | | | .02 | |
Net realized and unrealized gain (loss) on investment transactions | | | 1.47 | | | | 1.67 | | | | 2.24 | | | | (1.06 | ) |
Total from investment operations | | | 1.62 | | | | 1.80 | | | | 2.30 | | | | (1.04 | ) |
Less distributions from: | | | | | | | | | | | | | | | | |
Net investment income | | | (.29 | ) | | | (.07 | ) | | | (.09 | ) | | | — | |
| | | | | | | | | | | | | | | | |
Net asset value, end of period | | $ | 13.21 | | | $ | 11.88 | | | $ | 10.15 | | | $ | 7.94 | |
| | | | | | | | | | | | | | | | |
Total Return (%) | | | 14.00 | | | | 17.84 | | | | 29.42 | | | | (11.58 | )** |
| | | | | | | | | | | | | | | | |
Ratios to Average Net Assets and Supplemental Data | | | | | | | | | | | | | | | | |
Net assets, end of period ($ millions) | | | 62 | | | | 47 | | | | 18 | | | | .4 | |
Ratio of expenses (%) | | | 1.26 | | | | 1.28 | | | | 1.33 | | | | 1.11 | * |
Ratio of net investment income (%) | | | 1.20 | | | | 1.19 | | | | .78 | | | | .54 | * |
Portfolio turnover rate (%) | | | 93 | | | | 88 | | | | 139 | | | | 190 | |
| a | For the period July 1, 2002 (commencement of operations of Class B shares) to December 31, 2002. |
| b | Based on average shares outstanding during the period. |
195
Performance Summary December 31, 2005
DWS Janus Growth & Income VIP
All performance shown is historical, assumes reinvestment of all dividend and capital gain distributions and does not guarantee future results. Investment return and principal value fluctuate with changing market conditions so that, when redeemed, shares may be worth more or less than their original cost. Current performance may be lower or higher than the performance data quoted. Please visit www.dws-scudder.com for the Portfolio’s most recent month-end performance. Performance doesn’t reflect charges and fees (“contract charges”) associated with the separate account that invests in the Portfolio or any variable life insurance policy or variable annuity contract for which the Portfolio is an investment option. These charges and fees will reduce returns. While all share classes have the same underlying portfolio, their performance will differ.
The Portfolio is subject to stock market risk, meaning stocks in the Portfolio may decline in value for extended periods of time due to the activities and financial prospects of individual companies, or due to general market and economic conditions. The Portfolio also invests in individual bonds whose yields and market values fluctuate so that your investment may be worth more or less than its original cost. Bond investments are subject to interest-rate risk such that when interest rates rise, the prices of the bonds, and thus the value of the Portfolio, can decline and the investor can lose principal value. Please read this Portfolio’s prospectus for specific details regarding its investments and risk profile.
Portfolio returns shown for all periods for Class B shares reflect a fee waiver and/or expense reimbursement. Without this waiver/reimbursement, returns for Class B shares would have been lower.
Growth of an Assumed $10,000 Investment in DWS Janus Growth & Income VIP from 10/29/1999 to 12/31/2005
¨ DWS Janus Growth & Income VIP — Class A
¨ Russell 1000 Growth Index
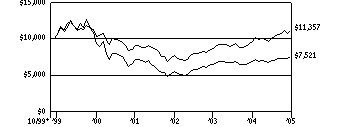
Yearly periods ended December 31
The Russell 1000 Growth Index is an unmanaged index composed of common stocks of larger US companies with higher price-to-book ratios and higher forecasted growth values. Index returns assume reinvested dividends and, unlike Portfolio returns, do not reflect any fees or expenses. It is not possible to invest directly into an index.
Comparative Results
| | | | | | | | | | | | | | | | | | |
DWS Janus Growth & Income VIP | | 1-Year | | | 3-Year | | | 5-Year | | | Life of Portfolio* | |
Class A | | Growth of $10,000 | | $ | 11,211 | | | $ | 15,548 | | | $ | 10,880 | | | $ | 11,357 | |
| | Average annual total return | | | 12.11 | % | | | 15.85 | % | | | 1.70 | % | | | 2.08 | % |
Russell 1000 Growth Index | | Growth of $10,000 | | $ | 10,526 | | | $ | 14,518 | | | $ | 8,332 | | | $ | 7,521 | |
| | Average annual total return | | | 5.26 | % | | | 13.23 | % | | | -3.58 | % | | | -4.52 | % |
| | | | |
DWS Janus Growth & Income VIP | | | | | 1-Year | | | 3-Year | | | Life of Class** | |
Class B | | Growth of $10,000 | | | | | | $ | 11,171 | | | $ | 15,381 | | | $ | 13,854 | |
| | Average annual total return | | | | | | | 11.71 | % | | | 15.43 | % | | | 9.76 | % |
Russell 1000 Growth Index | | Growth of $10,000 | | | | | | $ | 10,526 | | | $ | 14,518 | | | $ | 13,216 | |
| | Average annual total return | | | | | | | 5.26 | % | | | 13.23 | % | | | 8.29 | % |
The growth of $10,000 is cumulative.
| * | The Portfolio commenced operations October 29, 1999. Index returns begin October 31, 1999. Total returns would have been lower for the Life of Portfolio period for Class A shares if the Portfolio’s expenses were not maintained. |
| ** | The Portfolio commenced offering Class B shares on July 1, 2002. Index returns begin June 30, 2002. |
196
Information About Your Portfolio’s Expenses
DWS Janus Growth & Income VIP
As an investor of the Portfolio, you incur two types of costs: ongoing expenses and transaction costs. Ongoing expenses include management fees, distribution and service (12b-1) fees and other Portfolio expenses. Examples of transaction costs include sales charges (loads), redemption fees and account maintenance fees, which are not shown in this section. The following tables are intended to help you understand your ongoing expenses (in dollars) of investing in the Portfolio and to help you compare these expenses with the ongoing expenses of investing in other mutual funds. In the most recent six-month period, the Portfolio limited these expenses for Class B shares, had it not done so, expenses would have been higher. The tables are based on an investment of $1,000 made at the beginning of the six-month period ended December 31, 2005.
The tables illustrate your Portfolio’s expenses in two ways:
Actual Portfolio Return. This helps you estimate the actual dollar amount of ongoing expenses (but not transaction costs) paid on a $1,000 investment in the Portfolio using the Portfolio’s actual return during the period. To estimate the expenses you paid over the period, simply divide your account value by $1,000 (for example, an $8,600 account value divided by $1,000 = 8.6), then multiply the result by the number in the “Expenses Paid per $1,000” line under the share class you hold.
Hypothetical 5% Portfolio Return. This helps you to compare your Portfolio’s ongoing expenses (but not transaction costs) with those of other mutual funds using the Portfolio’s actual expense ratio and a hypothetical rate of return of 5% per year before expenses. Examples using a 5% hypothetical Portfolio return may be found in the shareholder reports of other mutual funds. The hypothetical account values and expenses may not be used to estimate the actual ending account balance or expenses you paid for the period.
Please note that the expenses shown in these tables are meant to highlight your ongoing expenses only and do not reflect any transaction costs. The “Expenses Paid per $1,000” line of the tables is useful in comparing ongoing expenses only and will not help you determine the relative total expense of owning different funds. If these transaction costs had been included, your costs would have been higher.
Expenses and Value of a $1,000 Investment for the six months ended December 31, 2005
| | | | | | |
Actual Portfolio Return | | Class A | | Class B |
Beginning Account Value 7/1/05 | | $ | 1,000.00 | | $ | 1,000.00 |
Ending Account Value 12/31/05 | | $ | 1,106.10 | | $ | 1,104.70 |
Expenses Paid per $1,000* | | $ | 4.57 | | $ | 6.58 |
| | | | | | |
Hypothetical 5% Portfolio Return | | Class A | | Class B |
Beginning Account Value 7/1/05 | | $ | 1,000.00 | | $ | 1,000.00 |
Ending Account Value 12/31/05 | | $ | 1,020.87 | | $ | 1,018.95 |
Expenses Paid per $1,000* | | $ | 4.38 | | $ | 6.31 |
| * | Expenses are equal to the Portfolio’s annualized expense ratio for each share class, multiplied by the average account value over the period, multiplied by the number of days in the most recent six-month period, then divided by 365. |
| | | | | | |
Annualized Expense Ratios | | Class A | | | Class B | |
DWS Variable Series II — DWS Janus Growth & Income VIP | | .86 | % | | 1.24 | % |
For more information, please refer to the Portfolio’s prospectus.
These tables do not reflect charges and fees (“contract charges”) associated with the separate account that invests in the portfolio or any variable life insurance policy or variable annuity contract for which the portfolio is an investment option.
197
Management Summary December 31, 2005
DWS Janus Growth & Income VIP
For the 12 months ended December 31, 2005, Class A shares of DWS Janus Growth & Income VIP returned 12.11% (Class A shares, unadjusted for contract charges). That exceeded the 5.26% return of the Portfolio’s primary benchmark, the Russell 1000 Growth Index.
The largest contributors to performance were Advanced Micro Devices, Inc., Suncor Energy, Inc., UnitedHealth Group, Inc., Samsung Electronics Co., Ltd. and EnCana Corp. These five positions alone contributed more than half of the Portfolio’s total positive return over 2005.
The largest detractors from performance were Tyco International, Ltd., Four Seasons Hotels, Ltd., British Sky Broadcasting Group PLC, Ltd, PETsMART, Inc. and Comcast Corp. Special “A.” Tyco International, in particular, stood out. In 2004, it was the single largest positive contributor to performance; in 2005, it was the single largest detractor. Although the stock’s return over the past year was a relatively modest -18.17% decline, our large position in it led to its affect on the Portfolio.
We would like to note that the top five performers gained more than the top five detractors lost by almost three to one. We view this as encouraging evidence that our best investment ideas were appropriately weighted near the top of the Portfolio.
Looking ahead, we believe that the Portfolio’s relative success or failure will depend on three factors: (1) an overweight position in technology, with a shift from semiconductors to enterprise software; (2) an overweight position in energy; and (3) an underweight position in healthcare services.1
Minyoung Sohn
Portfolio Manager, Janus Capital Management LLC, Subadvisor to the Portfolio
All performance shown is historical, assumes reinvestment of all dividend and capital gain distributions and does not guarantee future results. Investment return and principal value fluctuate with changing market conditions so that, when redeemed, shares may be worth more or less than their original cost. Current performance may be lower or higher than the performance data quoted. Please visit www.dws-scudder.com for the Portfolio’s most recent month-end performance. Performance doesn’t reflect charges and fees (“contract charges”) associated with the separate account that invests in the Portfolio or any variable life insurance policy or variable annuity contract for which the Portfolio is an investment option. These charges and fees will reduce returns. While all share classes have the same underlying portfolio, their performance will differ.
Risk Considerations
The Portfolio is subject to stock market risk, meaning stocks in the Portfolio may decline in value for extended periods of time due to the activities and financial prospects of individual companies, or due to general market and economic conditions. The Portfolio also invests in individual bonds whose yields and market values fluctuate so that your investment may be worth more or less than its original cost. Bond investments are subject to interest-rate risk such that when interest rates rise, the prices of the bonds, and thus the value of the Portfolio, can decline and the investor can lose principal value. Please read this Portfolio’s prospectus for specific details regarding its investments and risk profile.
The Russell 1000 Growth Index is an unmanaged index composed of common stocks of larger US companies with higher price-to-book ratios and higher forecasted growth values. Index returns assume reinvested dividends and, unlike Portfolio returns, do not reflect any fees or expenses. It is not possible to invest directly into an index.
| 1 | “Overweight” means the Portfolio holds a higher weighting in a given sector or security than the benchmark. “Underweight” means the Portfolio holds a lower weighting. |
Portfolio management market commentary is as of December 31, 2005, and may not come to pass. This information is subject to change at any time based on market and other conditions.
198
Portfolio Summary
DWS Janus Growth & Income VIP
| | | | | | |
Asset Allocation (Excludes Securities Lending Collateral) | | 12/31/05 | | | 12/31/04 | |
Common Stocks | | 89 | % | | 95 | % |
Convertible Preferred Stocks | | 6 | % | | — | |
Cash Equivalents | | 3 | % | | 2 | % |
Preferred Stocks | | 2 | % | | 3 | % |
| | | | | | |
| | 100 | % | | 100 | % |
| | | | | | |
| | | | | | |
Sector Diversification (As a % of Common and Preferred Stocks) | | 12/31/05 | | | 12/31/04 | |
Information Technology | | 28 | % | | 24 | % |
Energy | | 18 | % | | 9 | % |
Health Care | | 15 | % | | 15 | % |
Financials | | 13 | % | | 12 | % |
Consumer Discretionary | | 11 | % | | 18 | % |
Industrials | | 8 | % | | 14 | % |
Consumer Staples | | 7 | % | | 8 | % |
| | | | | | |
| | 100 | % | | 100 | % |
| | | | | | |
Asset allocation and sector diversification are subject to change.
For more complete details about the Portfolio’s investment portfolio, see page 38. A quarterly Fact Sheet is available upon request. Information concerning portfolio holdings of the Portfolio as of month end will be posted to www.dws-scudder.com on the 15th of the following month.
Following the Portfolio’s fiscal first and third quarter-end, a complete portfolio holdings listing is filed with the SEC on Form N-Q. The form will be available on the SEC’s Web site at www.sec.gov, and it also may be reviewed and copied at the SEC’s Public Reference Room in Washington, D.C. Information on the operation of the SEC’s Public Reference Room may be obtained by calling (800) SEC-0330.
199
Investment Portfolio December 31, 2005
DWS Janus Growth & Income VIP
| | | | |
| | | Shares | | Value ($) |
Common Stocks 88.2% | | | | |
Consumer Discretionary 10.2% | | | | |
Hotels Restaurants & Leisure 1.8% | | | | |
Four Seasons Hotels Ltd. (a) | | 32,680 | | 1,625,830 |
Harrah’s Entertainment, Inc. | | 33,685 | | 2,401,404 |
| | | | |
| | | | 4,027,234 |
| | | | |
Household Durables 1.2% | | | | |
Harman International Industries, Inc. | | 14,615 | | 1,430,078 |
NVR, Inc.* (a) | | 1,785 | | 1,253,070 |
| | | | |
| | | | 2,683,148 |
| | | | |
Leisure Equipment & Products 1.0% | | | | |
Marvel Entertainment, Inc.* (a) | | 141,887 | | 2,324,109 |
| | | | |
Media 4.1% | | | | |
British Sky Broadcasting Group PLC | | 444,341 | | 3,795,689 |
CCE Spinco, Inc.* | | 13,646 | | 178,766 |
Clear Channel Communications, Inc. | | 109,170 | | 3,433,396 |
Comcast Corp. Special “A”* | | 75,625 | | 1,942,806 |
| | | | |
| | | | 9,350,657 |
| | | | |
Specialty Retail 2.1% | | | | |
Best Buy Co., Inc. | | 30,030 | | 1,305,704 |
PETsMART, Inc. | | 89,260 | | 2,290,412 |
Tiffany & Co. | | 33,520 | | 1,283,481 |
| | | | |
| | | | 4,879,597 |
| | | | |
Consumer Staples 7.0% | | | | |
Beverages 2.2% | | | | |
PepsiCo, Inc. | | 84,067 | | 4,966,678 |
| | | | |
Food Products 1.3% | | | | |
Dean Foods Co.* | | 80,550 | | 3,033,513 |
| | | | |
Household Products 2.3% | | | | |
Procter & Gamble Co. | | 90,710 | | 5,250,295 |
| | | | |
Tobacco 1.2% | | | | |
Altria Group, Inc. | | 35,300 | | 2,637,616 |
| | | | |
Energy 16.3% | | | | |
Energy Equipment & Services 1.1% | | | | |
Halliburton Co. | | 38,330 | | 2,374,927 |
| | | | |
Oil, Gas & Consumable Fuels 15.2% | | | | |
Amerada Hess Corp. | | 23,055 | | 2,923,835 |
Apache Corp. | | 20,495 | | 1,404,317 |
EnCana Corp. | | 120,273 | | 5,431,529 |
EOG Resources, Inc. | | 22,200 | | 1,628,814 |
ExxonMobil Corp. | | 157,250 | | 8,832,733 |
Kinder Morgan, Inc. | | 27,420 | | 2,521,269 |
Petro-Canada | | 82,744 | | 3,320,579 |
Suncor Energy, Inc. | | 135,203 | | 8,527,751 |
| | | | |
| | | | 34,590,827 |
| | | | |
Financials 6.7% | | | | |
Banks 1.3% | | | | |
US Bancorp | | 103,887 | | 3,105,182 |
| | | | |
200
| | | | |
| | | Shares | | Value ($) |
Diversified Financial Services 5.4% | | | | |
Citigroup, Inc. | | 159,708 | | 7,750,629 |
JPMorgan Chase & Co. | | 112,325 | | 4,458,180 |
| | | | |
| | | | 12,208,809 |
| | | | |
Health Care 14.2% | | | | |
Biotechnology 0.9% | | | | |
Neurocrine Biosciences, Inc.* (a) | | 32,180 | | 2,018,651 |
| | | | |
Health Care Equipment & Supplies 0.3% | | | | |
Align Technology, Inc.* (a) | | 120,340 | | 778,600 |
| | | | |
Health Care Providers & Services 7.5% | | | | |
Aetna, Inc. | | 57,570 | | 5,429,427 |
Caremark Rx, Inc.* | | 58,080 | | 3,007,963 |
UnitedHealth Group, Inc. | | 138,580 | | 8,611,361 |
| | | | |
| | | | 17,048,751 |
| | | | |
Pharmaceuticals 5.5% | | | | |
Eli Lilly & Co. | | 34,890 | | 1,974,425 |
MGI Pharma, Inc.* (a) | | 50,210 | | 861,604 |
Roche Holding AG (Genusschein) | | 40,806 | | 6,126,878 |
Sanofi-Aventis (a) | | 40,103 | | 3,513,367 |
| | | | |
| | | | 12,476,274 |
| | | | |
Industrials 8.0% | | | | |
Aerospace & Defense 0.9% | | | | |
Honeywell International, Inc. | | 55,540 | | 2,068,865 |
| | | | |
Electrical Equipment 1.4% | | | | |
Rockwell Automation, Inc. | | 52,660 | | 3,115,366 |
| | | | |
Industrial Conglomerates 4.5% | | | | |
General Electric Co. | | 135,415 | | 4,746,296 |
Smiths Group PLC | | 127,661 | | 2,297,444 |
Tyco International Ltd. | | 114,440 | | 3,302,738 |
| | | | |
| | | | 10,346,478 |
| | | | |
Road & Rail 1.2% | | | | |
Canadian National Railway Co. | | 33,677 | | 2,693,823 |
Information Technology 25.8% | | | | |
Communications Equipment 2.2% | | | | |
Cisco Systems, Inc.* | | 163,430 | | 2,797,921 |
Nokia Oyj (ADR) | | 119,320 | | 2,183,556 |
| | | | |
| | | | 4,981,477 |
| | | | |
Computers & Peripherals 2.0% | | | | |
EMC Corp.* | | 70,710 | | 963,070 |
Hewlett-Packard Co. | | 122,180 | | 3,498,014 |
| | | | |
| | | | 4,461,084 |
| | | | |
Electronic Equipment & Instruments 3.6% | | | | |
Samsung Electronics Co., Ltd. (GDR), 144A | | 25,065 | | 8,258,917 |
| | | | |
Internet Software & Services 2.3% | | | | |
Yahoo!, Inc.* | | 132,345 | | 5,185,277 |
| | | | |
Semiconductors & Semiconductor Equipment 9.7% | | | | |
Advanced Micro Devices, Inc.* | | 421,735 | | 12,905,091 |
Linear Technology Corp. | | 60,040 | | 2,165,643 |
Maxim Integrated Products, Inc. | | 60,475 | | 2,191,614 |
201
| | | | | | |
| | | Shares | | | Value ($) | |
NVIDIA Corp.* | | 30,167 | | | 1,102,906 | |
Spansion, Inc. “A”* | | 71,810 | | | 999,595 | |
Texas Instruments, Inc. | | 82,430 | | | 2,643,530 | |
| | | | | | |
| | | | | 22,008,379 | |
| | | | | | |
Software 6.0% | | | | | | |
Electronic Arts, Inc.* | | 70,480 | | | 3,686,809 | |
Microsoft Corp. | | 219,170 | | | 5,731,295 | |
Oracle Corp.* | | 350,490 | | | 4,279,484 | |
| | | | | | |
| | | | | 13,697,588 | |
| | | | | | |
Total Common Stocks (Cost $145,635,266) | | | | | 200,572,122 | |
| | | | | | |
Preferred Stocks 2.2% | | | | | | |
Financials 1.3% | | | | | | |
Diversified Financial Services | | | | | | |
Merrill Lynch & Co., Inc. Series ECA, 144A, 20.0% | | 20,845 | | | 1,006,501 | |
Merrill Lynch & Co., Inc. Series VLO, 144A, 19.04% | | 16,795 | | | 1,812,516 | |
| | | | | | |
| | | | | 2,819,017 | |
| | | | | | |
Information Technology 0.9% | | | | | | |
Semiconductors & Semiconductor Equipment | | | | | | |
Samsung Electronics Co., Ltd. | | 4,350 | | | 2,098,502 | |
| | | | | | |
Total Preferred Stocks (Cost $4,282,907) | | | | | 4,917,519 | |
| | | | | | |
Convertible Preferred Stocks 5.9% | | | | | | |
Energy 1.0% | | | | | | |
Amerada Hess Corp., 7.00% | | 20,700 | | | 2,237,256 | |
| | | | | | |
| | |
| | | Shares | | | Value ($) | |
Financials 4.9% | | | | | | |
Lehman Brothers Holdings, Inc., 18.55% | | 11,905 | | | 1,754,202 | |
Lehman Brothers Holdings, Inc., 24.25% | | 94,161 | | | 1,729,737 | |
Morgan Stanley, 7.25% | | 17,785 | | | 941,182 | |
Morgan Stanley, 14.0%, 144A | | 124,620 | | | 854,893 | |
The Goldman Sachs Group, Inc., 8.50% | | 13,885 | | | 1,763,367 | |
The Goldman Sachs Group, Inc., Series B, 9.65% | | 6,865 | | | 731,775 | |
The Goldman Sachs Group, Inc., 9.0% | | 13,770 | | | 1,518,432 | |
The Goldman Sachs Group, Inc., Series B, 10.6% | | 20,465 | | | 969,243 | |
XL Capital Ltd., 6.50% | | 43,500 | | | 971,790 | |
| | | | | | |
| | | | | 11,234,621 | |
| | | | | | |
Total Convertible Preferred Stocks (Cost $12,049,504) | | | | | 13,471,877 | |
| | | | | | |
Securities Lending Collateral 4.7% | | | | | | |
Daily Assets Fund Institutional, 4.28% (b) (c) (Cost $10,615,908) | | 10,615,908 | | | 10,615,908 | |
| | | | | | |
Cash Equivalents 3.3% | | | | | | |
Cash Management QP Trust, 4.26% (d) (Cost $7,451,616) | | 7,451,616 | | | 7,451,616 | |
| | | | | | |
| | |
| | | % of Net Assets | | | Value ($) | |
Total Investment Portfolio (Cost $180,035,201)+ | | 104.3 | | | 237,029,042 | |
Other Assets and Liabilities, Net | | (4.3 | ) | | (9,726,314 | ) |
| | | | | | |
Net Assets | | 100.0 | | | 227,302,728 | |
| | | | | | |
Notes to DWS Janus Growth & Income VIP Portfolio of Investments
| * | Non-income producing security. |
| + | The cost for federal income tax purposes was $181,443,132. At December 31, 2005, net unrealized appreciation for all securities based on tax cost was $55,585,910. This consisted of aggregate gross unrealized appreciation for all securities in which there was an excess of value over tax cost of $60,613,860 and aggregate gross unrealized depreciation for all securities in which there was an excess of tax cost over value of $5,027,950. |
| (a) | All or a portion of these securities were on loan (see Notes to Financial Statements). The value of all securities loaned at December 31, 2005 amounted to $10,118,419 which is 4.4% of net assets. |
| (b) | Daily Assets Fund Institutional, an affiliated fund, is managed by Deutsche Asset Management, Inc. The rate shown is the annualized seven-day yield at period end. |
| (c) | Represents collateral held in connection with securities lending. |
| (d) | Cash Management QP Trust, an affiliated fund, is managed by Deutsche Investment Management Americas Inc. The rate shown is the annualized seven-day yield at period end. |
| 144A: | Security exempt from registration under Rule 144A of the Securities Act of 1933. These securities may be resold in transactions exempt from registration, normally to qualified institutional buyers. |
| ADR: | American Depositary Receipt |
| GDR: | Global Depositary Receipt |
The accompanying notes are an integral part of the financial statements.
202
Financial Statements
Statement of Assets and Liabilities
as of December 31, 2005
| | | |
Assets | | | |
Investments: | | | |
Investments in securities, at value (cost $161,967,677) — including $10,118,419 of securities loaned | | $ | 218,961,518 |
Investments in Daily Asset Fund Institutional, (cost $10,615,908)* | | | 10,615,908 |
Investment in Cash Management QP Trust (cost $7,451,616) | | | 7,451,616 |
Total investments in securities, at value (cost $180,035,201) | | | 237,029,042 |
Cash | | | 25,207 |
Receivable for investments sold | | | 102,026 |
Dividends receivable | | | 246,101 |
| | | | |
Interest receivable | | | 18,747 | |
Receivable for Portfolio shares sold | | | 629,501 | |
Foreign taxes recoverable | | | 12,421 | |
Net receivable on closed forward currency exchange contracts | | | 9,144 | |
Unrealized appreciation on forward foreign currency exchange contracts | | | 127,880 | |
Other assets | | | 7,008 | |
| | | | |
Total assets | | | 238,207,077 | |
| | | | |
Liabilities | | | | |
Unrealized depreciation on forward foreign currency exchange contracts | | | 614 | |
Payable for Portfolio shares redeemed | | | 57,148 | |
Payable upon return of securities loaned | | | 10,615,908 | |
Accrued management fee | | | 138,909 | |
Other accrued expenses and payables | | | 91,770 | |
Total liabilities | | | 10,904,349 | |
| | | | |
Net assets, at value | | $ | 227,302,728 | |
| | | | |
Net Assets | | | | |
Net assets consist of: | | | | |
Undistributed net investment income | | | 1,090,973 | |
Net unrealized appreciation (depreciation) on: | | | | |
Investments | | | 56,993,841 | |
Foreign currency related transactions | | | 135,024 | |
Accumulated net realized gain (loss) | | | (41,970,993 | ) |
Paid-in capital | | | 211,053,883 | |
| | | | |
Net assets, at value | | $ | 227,302,728 | |
| | | | |
Class A | | | | |
Net Asset Value, offering and redemption price per share ($194,987,493 ÷ 17,645,394 outstanding shares of beneficial interest, $.01 par value, unlimited number of shares authorized) | | $ | 11.05 | |
| | | | |
Class B | | | | |
Net Asset Value, offering and redemption price per share ($32,315,235 ÷ 2,946,169 outstanding shares of beneficial interest, $.01 par value, unlimited number of shares authorized) | | $ | 10.97 | |
| | | | |
| * | Represents collateral on securities loaned. |
203
Statement of Operations
for the year ended December 31, 2005
| | | |
Investment Income | | | |
Income: | | | |
Dividends (net of foreign taxes withheld of $66,895) | | $ | 2,743,446 |
Interest | | | 1,566 |
Interest — Cash Management QP Trust | | | 98,895 |
Securities lending income, including income from Daily Assets Fund Institutional, net of borrower rebates | | | 28,199 |
| | | |
Total Income | | | 2,872,106 |
| | | |
| | | | |
Expenses: | | | | |
Management fee | | | 1,712,762 | |
Custodian and accounting fees | | | 87,825 | |
Distribution service fees (Class B) | | | 70,642 | |
Record keeping fees (Class B) | | | 42,280 | |
Auditing | | | 45,361 | |
Legal | | | 24,368 | |
Trustees’ fees and expenses | | | 8,295 | |
Reports to shareholders | | | 42,166 | |
Other | | | 19,633 | |
Total expenses before expense reductions | | | 2,053,332 | |
Expense reductions | | | (10,046 | ) |
Total expenses after expense reductions | | | 2,043,286 | |
| | | | |
Net investment income (loss) | | | 828,820 | |
| | | | |
| |
Realized and Unrealized Gain (Loss) on Investment Transactions | | | | |
Net realized gain (loss) from: | | | | |
Investments | | | 9,081,162 | |
Foreign currency related transactions | | | 63,521 | |
| | | 9,144,683 | |
Net unrealized appreciation (depreciation) during the period on: | | | | |
Investments | | | 13,670,872 | |
Foreign currency related transactions | | | 430,678 | |
| | | 14,101,550 | |
| | | | |
Net gain (loss) on investment transactions | | | 23,246,233 | |
| | | | |
Net increase (decrease) in net assets resulting from operations | | $ | 24,075,053 | |
| | | | |
The accompanying notes are an integral part of the financial statements.
204
Statement of Changes in Net Assets
| | | | | | | | |
| | | Years Ended December 31, | |
Increase (Decrease) in Net Assets | | 2005 | | | 2004 | |
Operations: | | | | | | | | |
Net investment income (loss) | | $ | 828,820 | | | $ | 601,236 | |
Net realized gain (loss) on investment transactions | | | 9,144,683 | | | | 8,796,510 | |
Net unrealized appreciation (depreciation) during the period on investment transactions | | | 14,101,550 | | | | 12,728,179 | |
Net increase (decrease) in net assets resulting from operations | | | 24,075,053 | | | | 22,125,925 | |
Distributions to shareholders from: | | | | | | | | |
Net investment income: | | | | | | | | |
Class A | | | (419,512 | ) | | | — | |
Portfolio share transactions: | | | | | | | | |
Class A | | | | | | | | |
Proceeds from shares sold | | | 11,053,339 | | | | 6,502,623 | |
Reinvestment of distributions | | | 419,512 | | | | — | |
Cost of shares redeemed | | | (23,499,483 | ) | | | (28,062,645 | ) |
Net increase (decrease) in net assets from Class A share transactions | | | (12,026,632 | ) | | | (21,560,022 | ) |
| | | | | | | | |
Class B | | | | | | | | |
Proceeds from shares sold | | | 5,186,158 | | | | 11,312,331 | |
Cost of shares redeemed | | | (3,183,678 | ) | | | (1,739,333 | ) |
Net increase (decrease) in net assets from Class B share transactions | | | 2,002,480 | | | | 9,572,998 | |
Increase (decrease) in net assets | | | 13,631,389 | | | | 10,138,901 | |
Net assets at beginning of period | | | 213,671,339 | | | | 203,532,438 | |
| | | | | | | | |
Net assets at end of period (including undistributed net investment income of $1,090,973 and $618,144, respectively) | | $ | 227,302,728 | | | $ | 213,671,339 | |
| | | | | | | | |
| | |
Other Information | | | | | | | | |
Class A | | | | | | | | |
Shares outstanding at beginning of period | | | 18,888,001 | | | | 21,296,089 | |
Shares sold | | | 1,050,942 | | | | 722,385 | |
Shares issued to shareholders in reinvestment of distributions | | | 43,249 | | | | — | |
Shares redeemed | | | (2,336,798 | ) | | | (3,130,473 | ) |
Net increase (decrease) in Class A shares | | | (1,242,607 | ) | | | (2,408,088 | ) |
| | | | | | | | |
Shares outstanding at end of period | | | 17,645,394 | | | | 18,888,001 | |
| | | | | | | | |
Class B | | | | | | | | |
Shares outstanding at beginning of period | | | 2,758,937 | | | | 1,676,008 | |
Shares sold | | | 500,557 | | | | 1,276,437 | |
Shares redeemed | | | (313,325 | ) | | | (193,508 | ) |
Net increase (decrease) in Class B shares | | | 187,232 | | | | 1,082,929 | |
| | | | | | | | |
Shares outstanding at end of period | | | 2,946,169 | | | | 2,758,937 | |
| | | | | | | | |
The accompanying notes are an integral part of the financial statements.
205
Financial Highlights
| | | | | | | | | | | | | | | | | | | |
Class A | | | | | | | | | | | | | | | | | | | |
| | | | | |
Years Ended December 31, | | 2005 | | | 2004 | | 2003 | | | 2002*** | | | 2001a | |
Selected Per Share Data | | | | | | | | | | | | | | (Restated | ) | | | | |
Net asset value, beginning of period | | $ | 9.88 | | | $ | 8.86 | | $ | 7.18 | | | $ | 9.05 | | | $ | 10.40 | |
| | | | | | | | | | | | | | | | | | | |
Income (loss) from investment operations: | | | | | | | | | | | | | | | | | | | |
Net investment income (loss)b | | | .05 | | | | .03 | | | .03 | | | | .04 | | | | .08 | |
Net realized and unrealized gain (loss) on investment transactions | | | 1.14 | | | | .99 | | | 1.71 | | | | (1.86 | ) | | | (1.36 | ) |
Total from investment operations | | | 1.19 | | | | 1.02 | | | 1.74 | | | | (1.82 | ) | | | (1.28 | ) |
Less distributions from: | | | | | | | | | | | | | | | | | | | |
Net investment income | | | (.02 | ) | | | — | | | (.06 | ) | | | (.05 | ) | | | (.07 | ) |
| | | | | | | | | | | | | | | | | | | |
Net asset value, end of period | | $ | 11.05 | | | $ | 9.88 | | $ | 8.86 | | | $ | 7.18 | | | $ | 9.05 | |
| | | | | | | | | | | | | | | | | | | |
Total Return (%) | | | 12.11 | | | | 11.51 | | | 24.37 | | | | (20.22 | ) | | | (12.28 | ) |
Ratios to Average Net Assets and Supplemental Data | | | | | | | | | | | | | | | | | | | |
Net assets, end of period ($ millions) | | | 195 | | | | 187 | | | 189 | | | | 167 | | | | 179 | |
Ratio of expenses (%) | | | .92 | | | | 1.06 | | | 1.07 | | | | 1.04 | | | | 1.05 | |
Ratio of net investment income (loss) (%) | | | .45 | | | | .34 | | | .40 | | | | .54 | | | | .90 | |
Portfolio turnover rate (%) | | | 32 | | | | 52 | | | 46 | | | | 57 | | | | 48 | |
| a | As required, effective January 1, 2001, the Portfolio has adopted the provisions of the AICPA Audit and Accounting Guide for Investment Companies and began amortizing premium on debt securities. |
| b | Based on average shares outstanding during the period. |
| *** | Subsequent to December 31, 2002, these numbers have been restated to reflect an adjustment to the value of a security as of December 31, 2002. The effect of this adjustment for the year ended December 31, 2002 was to increase the net asset value per share by $0.03. The total return was also adjusted from -20.56% to -20.22% in accordance with this change. |
| | | | | | | | | | | | | | | |
Class B | | | | | | | | | | | | | | | |
| | | | |
Years Ended December 31, | | 2005 | | 2004 | | | 2003 | | | 2002a*** | |
Selected Per Share Data | | | | | | | | | | | | | | (Restated | ) |
Net asset value, beginning of period | | $ | 9.82 | | $ | 8.84 | | | $ | 7.17 | | | $ | 7.96 | |
| | | | | | | | | | | | | | | |
Income (loss) from investment operations: | | | | | | | | | | | | | | | |
Net investment income (loss)b | | | .01 | | | (.01 | ) | | | .00c | | | | .02 | |
Net realized and unrealized gain (loss) on investment transactions | | | 1.14 | | | .99 | | | | 1.71 | | | | (.81 | ) |
Total from investment operations | | | 1.15 | | | .98 | | | | 1.71 | | | | (.79 | ) |
Less distributions from: | | | | | | | | | | | | | | | |
Net investment income | | | — | | | — | | | | (.04 | ) | | | — | |
| | | | | | | | | | | | | | | |
Net asset value, end of period | | $ | 10.97 | | $ | 9.82 | | | $ | 8.84 | | | $ | 7.17 | |
| | | | | | | | | | | | | | | |
Total Return (%) | | | 11.71d | | | 11.09 | | | | 23.94 | | | | (9.92 | )** |
Ratios to Average Net Assets and Supplemental Data | | | | | | | | | | | | | | | |
Net assets, end of period ($ millions) | | | 32 | | | 27 | | | | 15 | | | | .4 | |
Ratio of expenses before expense reductions (%) | | | 1.32 | | | 1.44 | | | | 1.47 | | | | 1.29 | * |
Ratio of expenses after expense reductions (%) | | | 1.30 | | | 1.44 | | | | 1.47 | | | | 1.29 | * |
Ratio of net investment income (loss) (%) | | | .07 | | | (.04 | ) | | | (.01 | ) | | | .48 | * |
Portfolio turnover rate (%) | | | 32 | | | 52 | | | | 46 | | | | 57 | |
| a | For the period July 1, 2002 (commencement of operations of Class B shares) to December 31, 2002. |
| b | Based on average shares outstanding during the period. |
| c | Amount is less than $.005 per share. |
| d | Total return would have been lower had certain expenses not been reduced. |
| *** | Subsequent to December 31, 2002, these numbers have been restated to reflect an adjustment to the value of a security as of December 31, 2002. The effect of this adjustment for the year ended December 31, 2002 was to increase the net asset value per share by $0.03. The total return was also adjusted from -10.30% to -9.92% in accordance with this change. |
206
Performance Summary December 31, 2005
DWS Janus Growth Opportunities VIP
All performance shown is historical, assumes reinvestment of all dividend and capital gain distributions and does not guarantee future results. Investment return and principal value fluctuate with changing market conditions so that, when redeemed, shares may be worth more or less than their original cost. Current performance may be lower or higher than the performance data quoted. Please visit www.dws-scudder.com for the Portfolio’s most recent month-end performance. Performance doesn’t reflect charges and fees (“contract charges”) associated with the separate account that invests in the Portfolio or any variable life insurance policy or variable annuity contract for which the Portfolio is an investment option. These charges and fees will reduce returns. While all share classes have the same underlying portfolio, their performance will differ.
The Portfolio is subject to stock market risk, meaning stocks in the Portfolio may decline in value for extended periods of time due to the activities and financial prospects of individual companies, or due to general market and economic conditions. The Portfolio also invests in individual bonds, whose yields and market values fluctuate so that your investment may be worth more or less than its original cost. Bond investments are subject to interest rate risk such that when interest rates rise, the prices of bonds and thus the value of the bond fund can decline and the investor can lose principal value. The Portfolio may at times have significant exposure to certain industry groups, which may react similarly to market developments (resulting in greater price volatility). The Portfolio also may have significant exposure to foreign markets (which include risks such as currency fluctuation and political uncertainty). Please read this Portfolio’s prospectus for specific details regarding its investments and risk profile.
Portfolio returns shown for the 5-year and Life of Portfolio for Class A shares reflect a fee waiver and/or expense reimbursement. Without this waiver/reimbursement, returns would have been lower.
Growth of an Assumed $10,000 Investment in DWS Janus Growth Opportunities VIP
from 10/29/1999 to 12/31/2005
¨ DWS Janus Growth Opportunities VIP — Class A
¨ Russell 1000 Growth Index
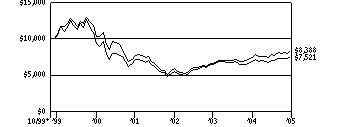
Yearly periods ended December 31
The Russell 1000 Growth Index is an unmanaged index composed of common stocks in the Russell 1000 Index with higher price-to-book ratios and higher forecasted growth values. Index returns assume reinvested dividends and, unlike Portfolio returns, do not reflect any fees or expenses. It is not possible to invest directly into an index.
| | | | | | | | | | | | | | | | | | |
Comparative Results | | | | | | | | | | | | | | | | | | |
DWS Janus Growth Opportunities VIP | | 1-Year | | | 3-Year | | | 5-Year | | | Life of Portfolio* | |
Class A | | Growth of $10,000 | | $ | 10,767 | | | $ | 15,362 | | | $ | 8,133 | | | $ | 8,388 | |
| | Average annual total return | | | 7.67 | % | | | 15.39 | % | | | -4.05 | % | | | -2.81 | % |
Russell 1000 Growth Index | | Growth of $10,000 | | $ | 10,526 | | | $ | 14,518 | | | $ | 8.332 | | | $ | 7,521 | |
| | Average annual total return | | | 5.26 | % | | | 13.23 | % | | | -3.58 | % | | | -4.52 | % |
| | | | |
DWS Janus Growth Opportunities VIP | | | | | 1-Year | | | 3-Year | | | Life of Class** | |
Class B | | Growth of $10,000 | | | | | | $ | 10,712 | | | $ | 15,174 | | | $ | 14,089 | |
| | Average annual total return | | | | | | | 7.12 | % | | | 14.91 | % | | | 10.29 | % |
Russell 1000 Growth Index | | Growth of $10,000 | | | | | | $ | 10,526 | | | $ | 14,518 | | | $ | 13,216 | |
| | Average annual total return | | | | | | | 5.26 | % | | | 13.23 | % | | | 8.29 | % |
The growth of $10,000 is cumulative.
| * | The Portfolio commenced operations on October 29, 1999. Index returns begin on October 31, 1999. |
| ** | The Portfolio commenced offering Class B shares on July 1, 2002. Index returns begin June 30, 2002. |
207
Information About Your Portfolio’s Expenses
DWS Janus Growth Opportunities VIP
As an investor of the Portfolio, you incur two types of costs: ongoing expenses and transaction costs. Ongoing expenses include management fees, distribution and service (12b-1) fees and other Portfolio expenses. Examples of transaction costs include sales charges (loads), redemption fees and account maintenance fees, which are not shown in this section. The following tables are intended to help you understand your ongoing expenses (in dollars) of investing in the Portfolio and to help you compare these expenses with the ongoing expenses of investing in other mutual funds. The tables are based on an investment of $1,000 made at the beginning of the six-month period ended December 31, 2005.
The tables illustrate your Portfolio’s expenses in two ways:
Actual Portfolio Return. This helps you estimate the actual dollar amount of ongoing expenses (but not transaction costs) paid on a $1,000 investment in the Portfolio using the Portfolio’s actual return during the period. To estimate the expenses you paid over the period, simply divide your account value by $1,000 (for example, an $8,600 account value divided by $1,000 = 8.6), then multiply the result by the number in the “Expenses Paid per $1,000” line under the share class you hold.
Hypothetical 5% Portfolio Return. This helps you to compare your Portfolio’s ongoing expenses (but not transaction costs) with those of other mutual funds using the Portfolio’s actual expense ratio and a hypothetical rate of return of 5% per year before expenses. Examples using a 5% hypothetical Portfolio return may be found in the shareholder reports of other mutual funds. The hypothetical account values and expenses may not be used to estimate the actual ending account balance or expenses you paid for the period.
Please note that the expenses shown in these tables are meant to highlight your ongoing expenses only and do not reflect any transaction costs. The “Expenses Paid per $1,000” line of the tables is useful in comparing ongoing expenses only and will not help you determine the relative total expense of owning different funds. If these transaction costs had been included, your costs would have been higher.
| | | | | | |
Expenses and Value of a $1,000 Investment for the six months ended December 31, 2005 | | | | | | |
| | |
Actual Portfolio Return | | Class A | | Class B |
Beginning Account Value 7/1/05 | | $ | 1,000.00 | | $ | 1,000.00 |
Ending Account Value 12/31/05 | | $ | 1,082.90 | | $ | 1,081.00 |
Expenses Paid per $1,000* | | $ | 4.46 | | $ | 6.61 |
| | |
Hypothetical 5% Portfolio Return | | Class A | | Class B |
Beginning Account Value 7/1/05 | | $ | 1,000.00 | | $ | 1,000.00 |
Ending Account Value 12/31/05 | | $ | 1,020.92 | | $ | 1,018.85 |
Expenses Paid per $1,000* | | $ | 4.33 | | $ | 6.41 |
| * | Expenses are equal to the Portfolio’s annualized expense ratio for each share class, multiplied by the average account value over the period, multiplied by the number of days in the most recent six-month period, then divided by 365. |
| | | | | | |
Annualized Expense Ratios | | Class A | | | Class B | |
DWS Variable Series II — DWS Janus Growth Opportunities VIP | | .85 | % | | 1.26 | % |
For more information, please refer to the Portfolio’s prospectus.
These tables do not reflect charges and fees (“contract charges”) associated with the separate account that invests in the portfolio or any variable life insurance policy or variable annuity contract for which the portfolio is an investment option.
208
Management Summary December 31, 2005
DWS Janus Growth Opportunities VIP
For the 12 months ended December 31, 2005, Class A shares (unadjusted for contract charges) of DWS Janus Growth Opportunities VIP returned 7.67%, compared to 5.26% for the portfolio’s benchmark, the Russell 1000 Growth Index.
The portfolio’s top contributors to performance during the period included healthcare, electronics and semiconductor stocks. UnitedHealth Group, Inc., an HMO operator and insurer, was our top contributor during the period. Other top performers included global communications leader Motorola, Inc. and chipmaker Texas Instruments, Inc.; we trimmed our positions in those stocks and booked profits as valuations climbed and risk/reward profiles diminished. Rio Tinto PLC, a diversified UK-based metals and minerals mining company, also performed well.
The portfolio’s top detractors from performance during the period were holdings within the consumer discretionary sector. Some stocks in the consumer discretionary sector lagged when gasoline prices pushed past $3 a gallon following Hurricane Katrina. For example, fears that future vacation plans would be curtailed combined with increased fuel expenses weighed on cruise line operator Royal Caribbean Cruises, so we decided to sell our position in the stock (albeit at a profit). However, our largest detractor from performance during the period was Lexmark International, a computer printer manufacturer with minimal performance correlation to Hurricane Katrina. Many investors believed Lexmark would be negatively affected by Dell’s potentially slashing prices to better compete with Hewlett Packard; this prompted us to liquidate our Lexmark position.
Going forward, we will continue to focus on companies that we believe can continue to post good growth rates — even in a slower economy — as well as companies offering a limited downside regardless of macroeconomic developments.
Marc Pinto
Portfolio Manager
Janus Capital Management LLC, Subadvisor to the Portfolio
All performance shown is historical, assumes reinvestment of all dividends and capital gain distribution, and does not guarantee future results. Investment return and principal value fluctuate with changing market conditions so that, when redeemed, shares may be worth more or less than their original cost. Current performance may be lower or higher than the performance data quoted. Please visit www.dws-scudder.com for the product’s most recent month-end performance. Performance doesn’t reflect charges and fees (“contract charges”) associated with the separate account that invests in the Portfolio or any variable life insurance policy or variable annuity contract for which the Portfolio is an investment option. These charges and fees will reduce returns.
Risk Considerations
The Portfolio is subject to stock market risk, meaning stocks in the Portfolio may decline in value for extended periods of time due to the activities and financial prospects of individual companies, or due to general market and economic conditions. The Portfolio also invests in individual bonds, whose yields and market values fluctuate so that your investment may be worth more or less than its original cost. Bond investments are subject to interest rate risk such that when interest rates rise, the prices of bonds and thus the value of the bond fund can decline and the investor can lose principal value. The Portfolio may at times have significant exposure to certain industry groups, which may react similarly to market developments (resulting in greater price volatility). The Portfolio also may have significant exposure to foreign markets (which include risks such as currency fluctuation and political uncertainty). Please read this Portfolio’s prospectus for specific details regarding its investments and risk profile.
The Russell 1000 Growth Index is an unmanaged index composed of common stocks in the Russell 1000 Index with higher price-to-book ratios and higher forecasted growth values. Index returns assume reinvested dividends and, unlike portfolio returns, do not reflect any fees or expenses. It is not possible to invest directly into an index.
Portfolio management market commentary is as of December 31, 2005, and may not come to pass. This information is subject to change at any time based on market and other conditions.
209
Portfolio Summary
DWS Janus Growth Opportunities VIP
| | | | | | |
Asset Allocation (Excludes Securities Lending Collateral) | | 12/31/05 | | | 12/31/04 | |
Common Stocks | | 99 | % | | 96 | % |
Cash Equivalents | | 1 | % | | 4 | % |
| | | | | | |
| | 100 | % | | 100 | % |
| | | | | | |
| | |
Sector Diversification (As a % of Common Stocks) | | 12/31/05 | | | 12/31/04 | |
Information Technology | | 27 | % | | 25 | % |
Health Care | | 21 | % | | 21 | % |
Consumer Discretionary | | 19 | % | | 20 | % |
Financials | | 8 | % | | 10 | % |
Industrials | | 8 | % | | 13 | % |
Energy | | 7 | % | | 5 | % |
Consumer Staples | | 6 | % | | 4 | % |
Materials | | 2 | % | | 2 | % |
Telecommunication Services | | 2 | % | | — | |
| | | | | | |
| | 100 | % | | 100 | % |
| | | | | | |
Asset allocation and sector diversification are subject to change.
For more complete details about the Portfolio’s investment portfolio, see page 47. A quarterly Fact Sheet is available upon request. Information concerning portfolio holdings of the Portfolio as of month end will be posted to www.dws-scudder.com on the 15th of the following month.
Following the Portfolio’s fiscal first and third quarter-end, a complete portfolio holdings listing is filed with the SEC on Form N-Q. The form will be available on the SEC’s Web site at www.sec.gov, and it also may be reviewed and copied at the SEC’s Public Reference Room in Washington, D.C. Information on the operation of the SEC’s Public Reference Room may be obtained by calling (800) SEC-0330.
210
Investment Portfolio December 31, 2005
DWS Janus Growth Opportunities VIP
| | | | |
| | | Shares | | Value ($) |
Common Stocks 98.6% | | | | |
Consumer Discretionary 18.9% | | | | |
Automobiles 1.8% | | | | |
Harley-Davidson, Inc. | | 53,440 | | 2,751,626 |
| | | | |
Diversified Consumer Services 1.3% | | | | |
Apollo Group, Inc. “A”* | | 32,450 | | 1,961,927 |
| | | | |
Hotels Restaurants & Leisure 2.3% | | | | |
Starbucks Corp.* | | 120,550 | | 3,617,705 |
| | | | |
Internet & Catalog Retail 3.3% | | | | |
Expedia, Inc.* | | 96,625 | | 2,315,135 |
IAC/InterActiveCorp.* | | 98,550 | | 2,789,950 |
| | | | |
| | | | 5,105,085 |
| | | | |
Media 0.7% | | | | |
XM Satellite Radio Holdings, Inc. “A”* | | 41,675 | | 1,136,894 |
| | | | |
Specialty Retail 6.9% | | | | |
Home Depot, Inc. | | 196,440 | | 7,951,891 |
Staples, Inc. | | 123,395 | | 2,802,301 |
| | | | |
| | | | 10,754,192 |
| | | | |
Textiles, Apparel & Luxury Goods 2.6% | | | | |
NIKE, Inc. “B” | | 46,385 | | 4,025,754 |
| | | | |
Consumer Staples 6.2% | | | | |
Beverages 3.4% | | | | |
PepsiCo, Inc. | | 89,355 | | 5,279,093 |
| | | | |
Household Products 2.8% | | | | |
Procter & Gamble Co. | | 74,960 | | 4,338,685 |
| | | | |
Energy 6.5% | | | | |
Energy Equipment & Services 1.3% | | | | |
Halliburton Co. | | 32,540 | | 2,016,178 |
| | | | |
Oil, Gas & Consumable Fuels 5.2% | | | | |
ExxonMobil Corp. | | 60,495 | | 3,398,004 |
Occidental Petroleum Corp. | | 58,330 | | 4,659,401 |
| | | | |
| | | | 8,057,405 |
| | | | |
Financials 7.5% | | | | |
Capital Markets 1.2% | | | | |
Morgan Stanley | | 33,710 | | 1,912,705 |
| | | | |
Consumer Finance 3.9% | | | | |
American Express Co. | | 117,540 | | 6,048,609 |
| | | | |
Diversified Financial Services 2.4% | | | | |
Fannie Mae | | 77,385 | | 3,777,162 |
| | | | |
Health Care 20.7% | | | | |
Biotechnology 4.2% | | | | |
Amgen, Inc.* | | 50,660 | | 3,995,048 |
Genentech, Inc.* | | 27,300 | | 2,525,250 |
| | | | |
| | | | 6,520,298 |
| | | | |
Health Care Equipment & Supplies 6.2% | | | | |
Biomet, Inc. | | 53,540 | | 1,957,958 |
Medtronic, Inc. | | 133,030 | | 7,658,537 |
| | | | |
| | | | 9,616,495 |
| | | | |
Health Care Providers & Services 6.2% | | | | |
Caremark Rx, Inc.* | | 51,280 | | 2,655,791 |
| | | | |
211
| | | | | | |
| | | Shares | | | Value ($) | |
UnitedHealth Group, Inc. | | 111,890 | | | 6,952,845 | |
| | | | | | |
| | | | | 9,608,636 | |
| | | | | | |
Pharmaceuticals 4.1% | | | | | | |
Eli Lilly & Co. | | 31,855 | | | 1,802,674 | |
Sanofi-Aventis (ADR) | | 102,470 | | | 4,498,433 | |
| | | | | | |
| | | | | 6,301,107 | |
| | | | | | |
Industrials 7.5% | | | | | | |
Air Freight & Logistics 1.4% | | | | | | |
FedEx Corp. | | 20,685 | | | 2,138,622 | |
| | | | | | |
Industrial Conglomerates 6.1% | | | | | | |
General Electric Co. | | 268,165 | | | 9,399,183 | |
| | | | | | |
Information Technology 27.2% | | | | | | |
Communications Equipment 6.3% | | | | | | |
Cisco Systems, Inc.* | | 133,250 | | | 2,281,240 | |
Motorola, Inc. | | 197,715 | | | 4,466,382 | |
QUALCOMM, Inc. | | 69,175 | | | 2,980,059 | |
| | | | | | |
| | | | | 9,727,681 | |
| | | | | | |
Computers & Peripherals 5.1% | | | | | | |
Dell, Inc.* | | 65,705 | | | 1,970,493 | |
Research In Motion Ltd.* | | 89,925 | | | 5,935,949 | |
| | | | | | |
| | | | | 7,906,442 | |
| | | | | | |
Electronic Equipment & Instruments 2.8% | | | | | | |
Samsung Electronics Co., Ltd. (GDR), 144A | | 13,094 | | | 4,314,473 | |
| | | | | | |
Internet Software & Services 4.5% | | | | | | |
Yahoo!, Inc.* | | 180,045 | | | 7,054,163 | |
| | | | | | |
Semiconductors & Semiconductor Equipment 4.2% | | | | | | |
Advanced Micro Devices, Inc.* | | 108,475 | | | 3,319,335 | |
Texas Instruments, Inc. | | 101,795 | | | 3,264,566 | |
| | | | | | |
| | | | | 6,583,901 | |
| | | | | | |
Software 4.3% | | | | | | |
Microsoft Corp. | | 172,440 | | | 4,509,306 | |
SAP AG (ADR) | | 46,280 | | | 2,085,840 | |
| | | | | | |
| | | | | 6,595,146 | |
| | | | | | |
Materials 2.5% | | | | | | |
Metals & Mining | | | | | | |
Rio Tinto PLC (ADR) | | 21,085 | | | 3,854,127 | |
| | | | | | |
Telecommunication Services 1.6% | | | | | | |
Wireless Telecommunication Services | | | | | | |
China Mobile (Hong Kong) Ltd. (ADR) (a) | | 102,815 | | | 2,471,673 | |
| | | | | | |
Total Common Stocks (Cost $124,879,602) | | | | | 152,874,967 | |
| | | | | | |
Securities Lending Collateral 1.0% | | | | | | |
Daily Assets Fund Institutional, 4.28% (b) (c) (Cost $1,494,900) | | 1,494,900 | | | 1,494,900 | |
| | | | | | |
Cash Equivalents 1.4% | | | | | | |
Cash Management QP Trust, 4.26% (d) (Cost $2,163,298) | | 2,163,298 | | | 2,163,298 | |
| | | | | | |
| | |
| | | % of Net Assets | | | Value ($) | |
Total Investment Portfolio (Cost $128,537,800)+ | | 101.0 | | | 156,533,165 | |
Other Assets and Liabilities, Net | | (1.0 | ) | | (1,576,371 | ) |
Net Assets | | 100.0 | | | 154,956,794 | |
212
Notes to DWS Janus Growth Opportunities VIP Portfolio of Investments
| * | Non-income producing security. |
| + | The cost for federal income tax purposes was $129,100,014. At December 31, 2005, net unrealized appreciation for all securities based on tax cost was $27,433,151. This consisted of aggregate gross unrealized appreciation for all securities in which there was an excess of value over tax cost of $28,436,377 and aggregate gross unrealized depreciation for all securities in which there was an excess of tax cost over value of $1,003,226. |
| (a) | All or a portion of these securities were on loan (see Notes to Financial Statements). The value of all securities loaned at December 31, 2005 amounted to $1,452,016 which is 0.9% of net assets. |
| (b) | Daily Assets Fund Institutional, an affiliated fund, is managed by Deutsche Asset Management, Inc. The rate shown is the annualized seven-day yield at period end. |
| (c) | Represents collateral held in connection with securities lending. |
| (d) | Cash Management QP Trust, an affiliated fund, is managed by Deutsche Investment Management Americas Inc. The rate shown is the annualized seven-day yield at period end. |
| 144A: | Security exempt from registration under Rule 144A of the Securities Act of 1933. These securities may be resold in transactions exempt from registration, normally to qualified institutional buyers. |
| ADR: | American Depositary Receipt |
| GDR: | Global Depositary Receipt |
The accompanying notes are an integral part of the financial statements.
213
Financial Statements
Statement of Assets and Liabilities
as of December 31, 2005
| | | | |
Assets | | | | |
Investments: | | | | |
Investments in securities, at value (cost $124,879,602) — including $1,452,016 of securities loaned | | $ | 152,874,967 | |
Investment in Daily Assets Fund Institutional (cost $1,494,900)* | | | 1,494,900 | |
Investment in Cash Management QP Trust (cost $2,163,298) | | | 2,163,298 | |
Total investments in securities, at value (cost $128,537,800) | | | 156,533,165 | |
Dividends receivable | | | 163,090 | |
Interest receivable | | | 13,661 | |
Foreign taxes recoverable | | | 51 | |
Other assets | | | 3,969 | |
| | | | |
Total assets | | | 156,713,936 | |
| | | | |
Liabilities | | | | |
Payable for Portfolio shares redeemed | | | 91,962 | |
Payable upon return of securities loaned | | | 1,494,900 | |
Accrued management fee | | | 96,737 | |
Other accrued expenses and payables | | | 73,543 | |
| | | | |
Total liabilities | | | 1,757,142 | |
| | | | |
Net assets, at value | | $ | 154,956,794 | |
| | | | |
Net Assets | | | | |
Net assets consist of: | | | | |
Undistributed net investment income | | | 66,503 | |
Net unrealized appreciation (depreciation) on investments | | | 27,995,365 | |
Accumulated net realized gain (loss) | | | (85,228,798 | ) |
Paid-in capital | | | 212,123,724 | |
| | | | |
Net assets, at value | | $ | 154,956,794 | |
| | | | |
Class A | | | | |
Net Asset Value, offering and redemption price per share ($144,116,012 ÷ 17,245,579 outstanding shares of beneficial interest, $.01 par value, unlimited number of shares authorized) | | $ | 8.36 | |
| | | | |
Class B | | | | |
Net Asset Value, offering and redemption price per share ($10,840,782 ÷ 1,310,790 outstanding shares of beneficial interest, $.01 par value, unlimited number of shares authorized) | | $ | 8.27 | |
| | | | |
| * | Represents collateral on securities loaned. |
214
Statement of Operations
for the year ended December 31, 2005
| | | | |
Investment Income | | | | |
Income: | | | | |
Dividends (net of foreign taxes withheld of $20,719) | | $ | 1,320,699 | |
Interest — Cash Management QP Trust | | | 181,005 | |
Securities lending income, including income from Daily Assets Fund Institutional, net of borrower rebates | | | 13,009 | |
| | | | |
Total Income | | | 1,514,713 | |
| | | | |
Expenses: | | | | |
Management fee | | | 1,202,829 | |
Custodian and accounting fees | | | 69,116 | |
Distribution service fees (Class B) | | | 22,312 | |
Record keeping fees (Class B) | | | 13,364 | |
Auditing | | | 45,765 | |
Legal | | | 13,572 | |
Trustees’ fees and expenses | | | 5,973 | |
Reports to shareholders | | | 24,012 | |
Total expenses before expense reductions | | | 1,396,943 | |
Expense reductions | | | (2,858 | ) |
| | | | |
Total expenses after expense reductions | | | 1,394,085 | |
| | | | |
Net investment income (loss) | | | 120,628 | |
| | | | |
Realized and Unrealized Gain (Loss) on Investment Transactions | | | | |
Net realized gain (loss) from: | | | | |
Investments | | | 9,044,548 | |
Net unrealized appreciation (depreciation) during the period on investments | | | 2,157,957 | |
| | | | |
Net gain (loss) on investment transactions | | | 11,202,505 | |
| | | | |
Net increase (decrease) in net assets resulting from operations | | $ | 11,323,133 | |
| | | | |
The accompanying notes are an integral part of the financial statements.
215
Statement of Changes in Net Assets
| | | | | | | | |
| | | Years Ended December 31, | |
| | | 2005 | | | 2004 | |
Increase (Decrease) in Net Assets | | | | | | | | |
Operations: | | | | | | | | |
Net investment income (loss) | | $ | 120,628 | | | $ | 390,838 | |
Net realized gain (loss) on investment transactions | | | 9,044,548 | | | | 2,198,797 | |
Net unrealized appreciation (depreciation) during the period on investment transactions | | | 2,157,957 | | | | 13,452,735 | |
Net increase (decrease) in net assets resulting from operations | | | 11,323,133 | | | | 16,042,370 | |
Distributions to shareholders from: | | | | | | | | |
Net investment income: | | | | | | | | |
Class A | | | (444,341 | ) | | | — | |
Portfolio share transactions: | | | | | | | | |
Class A | | | | | | | | |
Proceeds from shares sold | | | 21,843,431 | | | | 2,971,778 | |
Reinvestment of distributions | | | 444,341 | | | | — | |
Cost of shares redeemed | | | (20,249,635 | ) | | | (18,214,445 | ) |
Net increase (decrease) in net assets from Class A share transactions | | | 2,038,137 | | | | (15,242,667 | ) |
Class B | | | | | | | | |
Proceeds from shares sold | | | 5,338,867 | | | | 2,248,669 | |
Cost of shares redeemed | | | (3,553,140 | ) | | | (382,089 | ) |
Net increase (decrease) in net assets from Class B share transactions | | | 1,785,727 | | | | 1,866,580 | |
| | | | | | | | |
Increase (decrease) in net assets | | | 14,702,656 | | | | 2,666,283 | |
| | | | | | | | |
Net assets at beginning of period | | | 140,254,138 | | | | 137,587,855 | |
| | | | | | | | |
Net assets at end of period (including undistributed net investment income of $66,503 and $390,216, respectively) | | $ | 154,956,794 | | | $ | 140,254,138 | |
| | | | | | | | |
Other Information | | | | | | | | |
Class A | | | | | | | | |
Shares outstanding at beginning of period | | | 16,930,734 | | | | 19,085,611 | |
Shares sold | | | 2,847,686 | | | | 413,736 | |
Shares issued to shareholders in reinvestment of distributions | | | 59,088 | | | | — | |
Shares redeemed | | | (2,591,929 | ) | | | (2,568,613 | ) |
Net increase (decrease) in Class A shares | | | 314,845 | | | | (2,154,877 | ) |
| | | | | | | | |
Shares outstanding at end of period | | | 17,245,579 | | | | 16,930,734 | |
| | | | | | | | |
Class B | | | | | | | | |
Shares outstanding at beginning of period | | | 1,081,562 | | | | 812,791 | |
Shares sold | | | 672,131 | | | | 322,383 | |
Shares redeemed | | | (442,903 | ) | | | (53,612 | ) |
Net increase (decrease) in Class B shares | | | 229,228 | | | | 268,771 | |
| | | | | | | | |
Shares outstanding at end of period | | | 1,310,790 | | | | 1,081,562 | |
| | | | | | | | |
The accompanying notes are an integral part of the financial statements.
216
Financial Highlights
Class A
| | | | | | | | | | | | | | | | | | | |
Years Ended December 31, | | 2005 | | | 2004 | | 2003 | | | 2002 | | | 2001 | |
Selected Per Share Data | | | | | | | | | | | | | | | | | | | |
Net asset value, beginning of period | | $ | 7.79 | | | $ | 6.92 | | $ | 5.45 | | | $ | 7.86 | | | $ | 10.31 | |
| | | | | | | | | | | | | | | | | | | |
Income (loss) from investment operations: | | | | | | | | | | | | | | | | | | | |
Net investment income (loss)a | | | .01 | | | | .02 | | | (.01 | ) | | | (.01 | ) | | | (.03 | ) |
Net realized and unrealized gain (loss) on investment transactions | | | .59 | | | | .85 | | | 1.48 | | | | (2.40 | ) | | | (2.42 | ) |
Total from investment operations | | | .60 | | | | .87 | | | 1.47 | | | | (2.41 | ) | | | (2.45 | ) |
Less distributions from: | | | | | | | | | | | | | | | | | | | |
Net investment income | | | (.03 | ) | | | — | | | — | | | | — | | | | — | |
| | | | | | | | | | | | | | | | | | | |
Net asset value, end of period | | $ | 8.36 | | | $ | 7.79 | | $ | 6.92 | | | $ | 5.45 | | | $ | 7.86 | |
| | | | | | | | | | | | | | | | | | | |
Total Return (%) | | | 7.67 | | | | 12.57 | | | 26.97 | | | | (30.53 | ) | | | (23.76 | ) |
Ratios to Average Net Assets and Supplemental Data | | | | | | | | | | | | | | | | | | | |
Net assets, end of period ($ millions) | | | 144 | | | | 132 | | | 132 | | | | 118 | | | | 164 | |
Ratio of expenses before expense reductions (%) | | | .92 | | | | 1.06 | | | 1.07 | | | | 1.01 | | | | 1.11 | |
Ratio of expenses after expense reductions (%) | | | .92 | | | | 1.06 | | | 1.07 | | | | 1.01 | | | | 1.10 | |
Ratio of net investment income (%) | | | .10 | | | | .31 | | | (.17 | ) | | | (.10 | ) | | | (.31 | ) |
Portfolio turnover rate (%) | | | 46 | | | | 58 | | | 50 | | | | 48 | | | | 34 | |
| a | Based on average shares outstanding during the period. |
| | | | | | | | | | | | | | | | |
Class B Years Ended December 31, | | 2005 | | | 2004 | | | 2003 | | | 2002a | |
Selected Per Share Data | | | | | | | | | | | | | | | | |
Net asset value, beginning of period | | $ | 7.72 | | | $ | 6.88 | | | $ | 5.44 | | | $ | 5.87 | |
| | | | | | | | | | | | | | | | |
Income (loss) from investment operations: | | | | | | | | | | | | | | | | |
Net investment income (loss)b | | | (.02 | ) | | | (.01 | ) | | | (.04 | ) | | | (.01 | ) |
Net realized and unrealized gain (loss) on investment transactions | | | .57 | | | | .85 | | | | 1.48 | | | | (.42 | ) |
Total from investment operations | | | .55 | | | | .84 | | | | 1.44 | | | | (.43 | ) |
| | | | | | | | | | | | | | | | |
Net asset value, end of period | | $ | 8.27 | | | $ | 7.72 | | | $ | 6.88 | | | $ | 5.44 | |
| | | | | | | | | | | | | | | | |
Total Return (%) | | | 7.12 | | | | 12.21 | | | | 26.47 | | | | (7.33 | )** |
Ratios to Average Net Assets and Supplemental Data | | | | | | | | | | | | | | | | |
Net assets, end of period ($ millions) | | | 11 | | | | 8 | | | | 6 | | | | .2 | |
Ratio of expenses (%) | | | 1.31 | | | | 1.45 | | | | 1.46 | | | | 1.29 | * |
Ratio of net investment income (%) | | | (.29 | ) | | | (.08 | ) | | | (.56 | ) | | | (.49 | )* |
Portfolio turnover rate (%) | | | 46 | | | | 58 | | | | 50 | | | | 48 | |
| a | For the period July 1, 2002 (commencement of operations of Class B shares) to December 31, 2002. |
| b | Based on average shares outstanding during the period. |
217
Performance Summary December 31, 2005
DWS Large Cap Value VIP
All performance shown is historical, assumes reinvestment of all dividend and capital gain distributions and does not guarantee future results. Investment return and principal value fluctuate with changing market conditions so that, when redeemed, shares may be worth more or less than their original cost. Current performance may be lower or higher than the performance data quoted. Please visit www.dws-scudder.com for the Portfolio’s most recent month-end performance. Performance doesn’t reflect charges and fees (“contract charges”) associated with the separate account that invests in the Portfolio or any variable life insurance policy or variable annuity contract for which the Portfolio is an investment option. These charges and fees will reduce returns. While all share classes have the same underlying portfolio, their performance will differ.
The Portfolio is subject to stock market risk. It focuses its investments on certain economic sectors, thereby increasing its vulnerability to any single economic, political or regulatory development. This may result in greater share price volatility. Please read this Portfolio’s prospectus for specific details regarding its investments and risk profile.
Portfolio returns shown for all periods reflect a fee waiver and/or expense reimbursement. Without this waiver/reimbursement, returns would have been lower.
Growth of an Assumed $10,000 Investment in DWS Large Cap Value VIP from 5/1/1996 to 12/31/2005
¨ DWS Large Cap Value VIP — Class A
¨ Russell 1000 Value Index
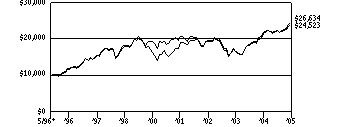
Yearly periods ended December 31
The Russell 1000 Value Index is an unmanaged index, which consists of those stocks in the Russell 1000 Index with lower price-to-book ratios and lower forecasted-growth values. Index returns assume reinvested dividends and, unlike Portfolio returns, do not reflect any fees or expenses. It is not possible to invest directly into an index.
| | | | | | | | | | | | | | | | | | |
Comparative Results | |
DWS Large Cap Value VIP | | | | 1-Year | | | 3-Year | | | 5-Year | | | Life of Portfolio* | |
Class A | | Growth of $10,000 | | $ | 10,197 | | | $ | 14,882 | | | $ | 12,888 | | | $ | 24,523 | |
| | Average annual total return | | | 1.97 | % | | | 14.17 | % | | | 5.21 | % | | | 9.73 | % |
Russell 1000 Value Index | | Growth of $10,000 | | $ | 10,705 | | | $ | 16,216 | | | $ | 12,933 | | | $ | 26,634 | |
| | Average annual total return | | | 7.05 | % | | | 17.49 | % | | | 5.28 | % | | | 10.67 | % |
| | | | | |
DWS Large Cap Value VIP | | | | | | | 1-Year | | | 3-Year | | | Life of Class** | |
Class B | | Growth of $10,000 | | | | | | $ | 10,158 | | | $ | 14,723 | | | $ | 12,947 | |
| | Average annual total return | | | | | | | 1.58 | % | | | 13.76 | % | | | 7.66 | % |
Russell 1000 Value Index | | Growth of $10,000 | | | | | | $ | 10,705 | | | $ | 16,216 | | | $ | 14,386 | |
| | Average annual total return | | | | | | | 7.05 | % | | | 17.49 | % | | | 10.95 | % |
The growth of $10,000 is cumulative.
| * | The Portfolio commenced operations on May 1, 1996. Index returns begin April 30, 1996. |
| ** | The Portfolio commenced offering Class B shares on July 1, 2002. Index returns begin June 30, 2002. |
218
Information About Your Portfolio’s Expenses
DWS Large Cap Value VIP
As an investor of the Portfolio, you incur two types of costs: ongoing expenses and transaction costs. Ongoing expenses include management fees, distribution and service (12b-1) fees and other Portfolio expenses. Examples of transaction costs include sales charges (loads), redemption fees and account maintenance fees, which are not shown in this section. The following tables are intended to help you understand your ongoing expenses (in dollars) of investing in the Portfolio and to help you compare these expenses with the ongoing expenses of investing in other mutual funds. In the most recent six-month period, the Portfolio limited these expenses; had it not done so, expenses would have been higher. The tables are based on an investment of $1,000 made at the beginning of the six-month period ended December 31, 2005.
The tables illustrate your Portfolio’s expenses in two ways:
Actual Portfolio Return. This helps you estimate the actual dollar amount of ongoing expenses (but not transaction costs) paid on a $1,000 investment in the Portfolio using the Portfolio’s actual return during the period. To estimate the expenses you paid over the period, simply divide your account value by $1,000 (for example, an $8,600 account value divided by $1,000 = 8.6), then multiply the result by the number in the “Expenses Paid per $1,000” line under the share class you hold.
Hypothetical 5% Portfolio Return. This helps you to compare your Portfolio’s ongoing expenses (but not transaction costs) with those of other mutual funds using the Portfolio’s actual expense ratio and a hypothetical rate of return of 5% per year before expenses. Examples using a 5% hypothetical Portfolio return may be found in the shareholder reports of other mutual funds. The hypothetical account values and expenses may not be used to estimate the actual ending account balance or expenses you paid for the period.
Please note that the expenses shown in these tables are meant to highlight your ongoing expenses only and do not reflect any transaction costs. The “Expenses Paid per $1,000” line of the tables is useful in comparing ongoing expenses only and will not help you determine the relative total expense of owning different funds. If these transaction costs had been included, your costs would have been higher.
Expenses and Value of a $1,000 Investment for the six months ended December 31, 2005
| | | | | | |
Actual Portfolio Return | | Class A | | Class B |
Beginning Account Value 7/1/05 | | $ | 1,000.00 | | $ | 1,000.00 |
Ending Account Value 12/31/05 | | $ | 1,038.80 | | $ | 1,036.80 |
Expenses Paid per $1,000* | | $ | 4.11 | | $ | 6.26 |
| | |
Hypothetical 5% Portfolio Return | | Class A | | Class B |
Beginning Account Value 7/1/05 | | $ | 1,000.00 | | $ | 1,000.00 |
Ending Account Value 12/31/05 | | $ | 1,021.17 | | $ | 1,019.06 |
Expenses Paid per $1,000* | | $ | 4.08 | | $ | 6.21 |
| * | Expenses are equal to the Portfolio’s annualized expense ratio for each share class, multiplied by the average account value over the period, multiplied by the number of days in the most recent six-month period, then divided by 365. |
| | | | | | |
Annualized Expense Ratios | | Class A | | | Class B | |
DWS Variable Series II — DWS Large Cap Value VIP | | .80 | % | | 1.22 | % |
For more information, please refer to the Portfolio’s prospectus.
These tables do not reflect charges and fees (“contract charges”) associated with the separate account that invests in the portfolio or any variable life insurance policy or variable annuity contract for which the portfolio is an investment option.
219
Management Summary December 31, 2005
DWS Large Cap Value VIP
Even with positive economic fundamentals in 2005, major US indices disappointed with low single digit returns. The return for the Portfolio’s Class A shares unadjusted for contract charges was 1.97% and has been hurt by our philosophical commitment to large-cap, high-quality securities that exemplify our approach. In the fourth quarter, Portfolio results were better and it may be the beginning of the return to our historic pattern of results as our Portfolio fundamentals, valuations and risk/rewards indicate unrealized potential for our holdings.
While the Portfolio benefited from the strong performance of its energy holdings, our focus on large integrated oil firms which, in our view, were more attractive in lieu of oil service companies held back relative results. At the sector level, we gained an advantage over the benchmark by prudently underweighing the poor-performing telecommunications sector. The greatest sector contributor was telecommunications where we had an underweight in this poor performing group. We believe there are better opportunities available than the telecom group, which we feel tends have weak balance sheets and questionable long-term earnings growth.
In 2006, as widely reported in the media and accepted by the industry, US economic fundamentals are expected to exhibit continued growth including strong consumer spending, employment, S&P profits, low interest rates and inflation. Investors may continue to be cautious and influenced by headlines or speculation keeping volatility high.
Finally, the Portfolio continues to have strong fundamentals, superior quality, low P/E ratio, and high dividend yield and earnings growth. Our risk/reward profile continues to suggest better than market opportunities going forward. We are confident in our investment approach and the strength of our process and holdings. We believe that as in the past the historic consistency and strength of the approach will be rewarded as it has been over time. Patience and discipline which enables reversion to the mean to work are the keys to success long-term.
Thomas F. Sassi Steve Scrudato
Lead Manager Portfolio Manager
Deutsche Investment Management Americas Inc.
All performance shown is historical, assumes reinvestment of all dividend and capital gain distributions, and does not guarantee future results. Investment return and principal value fluctuate with changing market conditions so that, when redeemed, shares may be worth more or less than their original cost. Current performance may be lower or higher than the performance data quoted. Please visit www.dws-scudder.com for the product’s most recent month-end performance. Performance doesn’t reflect charges and fees (“contract charges”) associated with the separate account that invests in the Portfolio or any variable life insurance policy or variable annuity contract for which the Portfolio is an investment option. These charges and fees will reduce returns.
Risk Considerations
The Portfolio is subject to stock market risk. It focuses its investments on certain economic sectors, thereby increasing its vulnerability to any single economic, political or regulatory development. This may result in greater share price volatility. Please read this Portfolio’s prospectus for specific details regarding its investments and risk profile.
Portfolio management market commentary is as of December 31, 2005, and may not come to pass. This information is subject to change at any time based on market and other conditions.
220
Portfolio Summary
DWS Large Cap Value VIP
| | | | | | |
Asset Allocation (Excludes Securities Lending Collateral) | | 12/31/05 | | | 12/31/04 | |
Common Stocks | | 95 | % | | 99 | % |
Cash Equivalents | | 5 | % | | 1 | % |
| | | | | | |
| | 100 | % | | 100 | % |
| | | | | | |
| | |
Sector Diversification (As a % of Common Stocks) | | 12/31/05 | | | 12/31/04 | |
Financials | | 25 | % | | 31 | % |
Information Technology | | 20 | % | | 15 | % |
Energy | | 16 | % | | 7 | % |
Industrials | | 9 | % | | 11 | % |
Health Care | | 7 | % | | 11 | % |
Consumer Discretionary | | 7 | % | | 9 | % |
Consumer Staples | | 6 | % | | 7 | % |
Utilities | | 4 | % | | 1 | % |
Materials | | 3 | % | | 7 | % |
Telecommunication Services | | 3 | % | | 1 | % |
| | | | | | |
| | 100 | % | | 100 | % |
| | | | | | |
Asset allocation and sector diversification are subject to change.
For more complete details about the Portfolio’s investment portfolio, see page 56. A quarterly Fact Sheet is available upon request. Information concerning portfolio holdings of the Portfolio as of month end will be posted to www.dws-scudder.com on the 15th of the following month.
Following the Portfolio’s fiscal first and third quarter-end, a complete portfolio holdings listing is filed with the SEC on Form N-Q. The form will be available on the SEC’s Web site at www.sec.gov, and it also may be reviewed and copied at the SEC’s Public Reference Room in Washington, D.C. Information on the operation of the SEC’s Public Reference Room may be obtained by calling (800) SEC-0330.
221
Investment Portfolio December 31, 2005
DWS Large Cap Value VIP
| | | | |
| | | Shares | | Value ($) |
Common Stocks 95.1% | | | | |
Consumer Discretionary 6.3% | | | | |
Multiline Retail 1.9% | | | | |
Federated Department Stores, Inc. | | 28,700 | | 1,903,671 |
Kohl’s Corp.* | | 79,200 | | 3,849,120 |
| | | | |
| | | | 5,752,791 |
| | | | |
Specialty Retail 4.4% | | | | |
Limited Brands, Inc. | | 150,500 | | 3,363,675 |
Lowe’s Companies, Inc. | | 60,800 | | 4,052,928 |
TJX Companies, Inc. | | 270,400 | | 6,281,392 |
| | | | |
| | | | 13,697,995 |
| | | | |
Consumer Staples 5.6% | | | | |
Food Products 2.6% | | | | |
General Mills, Inc. | | 90,500 | | 4,463,460 |
Unilever NV (NY Shares) | | 52,500 | | 3,604,125 |
| | | | |
| | | | 8,067,585 |
| | | | |
Household Products 3.0% | | | | |
Colgate-Palmolive Co. | | 91,900 | | 5,040,715 |
Kimberly-Clark Corp. | | 70,300 | | 4,193,395 |
| | | | |
| | | | 9,234,110 |
| | | | |
Energy 14.8% | | | | |
Energy Equipment & Services 2.1% | | | | |
Baker Hughes, Inc. | | 53,700 | | 3,263,886 |
Halliburton Co. | | 49,000 | | 3,036,040 |
| | | | |
| | | | 6,299,926 |
| | | | |
Oil, Gas & Consumable Fuels 12.7% | | | | |
BP PLC (ADR) | | 81,044 | | 5,204,646 |
Chevron Corp. | | 135,300 | | 7,680,981 |
ConocoPhillips | | 63,200 | | 3,676,976 |
ExxonMobil Corp. | | 214,700 | | 12,059,699 |
Marathon Oil Corp. | | 74,100 | | 4,517,877 |
PetroChina Co., Ltd. (ADR) (a) | | 17,300 | | 1,417,908 |
Royal Dutch Shell PLC “A” (ADR) | | 75,900 | | 4,667,091 |
| | | | |
| | | | 39,225,178 |
| | | | |
Financials 23.9% | | | | |
Banks 11.8% | | | | |
AmSouth Bancorp. | | 154,500 | | 4,049,445 |
Bank of America Corp. | | 205,426 | | 9,480,410 |
PNC Financial Services Group, Inc. | | 55,500 | | 3,431,565 |
SunTrust Banks, Inc. | | 32,300 | | 2,350,148 |
US Bancorp. | | 99,500 | | 2,974,055 |
Wachovia Corp. | | 136,000 | | 7,188,960 |
Wells Fargo & Co. | | 112,800 | | 7,087,224 |
| | | | |
| | | | 36,561,807 |
| | | | |
Capital Markets 3.0% | | | | |
Bear Stearns Companies, Inc. | | 27,300 | | 3,153,969 |
Merrill Lynch & Co., Inc. | | 42,200 | | 2,858,206 |
Morgan Stanley | | 58,700 | | 3,330,638 |
| | | | |
| | | | 9,342,813 |
| | | | |
Diversified Financial Services 6.2% | | | | |
Citigroup, Inc. | | 141,000 | | 6,842,730 |
Freddie Mac | | 59,700 | | 3,901,395 |
222
| | | | |
| | | Shares | | Value ($) |
JPMorgan Chase & Co. | | 207,800 | | 8,247,582 |
| | | | |
| | | | 18,991,707 |
| | | | |
Insurance 2.9% | | | | |
AFLAC, Inc. | | 66,500 | | 3,086,930 |
American International Group, Inc. | | 85,500 | | 5,833,665 |
| | | | |
| | | | 8,920,595 |
| | | | |
Health Care 7.1% | | | | |
Health Care Equipment & Supplies 1.7% | | | | |
Baxter International, Inc. | | 134,500 | | 5,063,925 |
| | | | |
Pharmaceuticals 5.4% | | | | |
Abbott Laboratories | | 172,300 | | 6,793,789 |
Johnson & Johnson | | 79,900 | | 4,801,990 |
Mylan Laboratories, Inc. | | 81,300 | | 1,622,748 |
Wyeth | | 75,400 | | 3,473,678 |
| | | | |
| | | | 16,692,205 |
| | | | |
Industrials 8.8% | | | | |
Aerospace & Defense 2.9% | | | | |
Honeywell International, Inc. | | 65,800 | | 2,451,050 |
L-3 Communications Holdings, Inc. | | 52,900 | | 3,933,115 |
United Technologies Corp. | | 44,800 | | 2,504,768 |
| | | | |
| | | | 8,888,933 |
| | | | |
Air Freight & Logistics 1.2% | | | | |
FedEx Corp. | | 36,900 | | 3,815,091 |
Commercial Services & Supplies 0.5% | | | | |
Pitney Bowes, Inc. | | 35,400 | | 1,495,650 |
Industrial Conglomerates 1.7% | | | | |
General Electric Co. | | 153,600 | | 5,383,680 |
Machinery 2.5% | | | | |
Dover Corp. | | 85,100 | | 3,445,699 |
Ingersoll-Rand Co., Ltd. “A” | | 105,400 | | 4,254,998 |
| | | | |
| | | | 7,700,697 |
| | | | |
Information Technology 18.7% | | | | |
Communications Equipment 4.2% | | | | |
Cisco Systems, Inc.* | | 380,900 | | 6,521,008 |
Nokia Oyj (ADR) | | 356,400 | | 6,522,120 |
| | | | |
| | | | 13,043,128 |
| | | | |
Computers & Peripherals 3.6% | | | | |
Hewlett-Packard Co. | | 193,197 | | 5,531,230 |
International Business Machines Corp. | | 67,600 | | 5,556,720 |
| | | | |
| | | | 11,087,950 |
| | | | |
IT Consulting & Services 3.0% | | | | |
Automatic Data Processing, Inc. | | 115,600 | | 5,304,884 |
First Data Corp. | | 92,000 | | 3,956,920 |
| | | | |
| | | | 9,261,804 |
| | | | |
Semiconductors & Semiconductor Equipment 6.4% | | | | |
Applied Materials, Inc. | | 380,100 | | 6,818,994 |
Intel Corp. | | 380,700 | | 9,502,272 |
Texas Instruments, Inc. | | 104,100 | | 3,338,487 |
| | | | |
| | | | 19,659,753 |
| | | | |
Software 1.5% | | | | |
Microsoft Corp. | | 182,000 | | 4,759,300 |
223
| | | | | | |
| | | Shares | | | Value ($) | |
Materials 3.1% | | | | | | |
Chemicals 2.1% | | | | | | |
Air Products & Chemicals, Inc. | | 38,600 | | | 2,284,734 | |
E.I. du Pont de Nemours & Co. | | 98,600 | | | 4,190,500 | |
| | | | | | |
| | | | | 6,475,234 | |
| | | | | | |
Containers & Packaging 1.0% | | | | | | |
Sonoco Products Co. | | 108,500 | | | 3,189,900 | |
Telecommunication Services 2.9% | | | | | | |
Diversified Telecommunication Services | | | | | | |
AT&T, Inc. | | 174,700 | | | 4,278,403 | |
Verizon Communications, Inc. | | 155,400 | | | 4,680,648 | |
| | | | | | |
| | | | | 8,959,051 | |
| | | | | | |
Utilities 3.9% | | | | | | |
Electric Utilities | | | | | | |
FPL Group, Inc. | | 77,100 | | | 3,204,276 | |
Progress Energy, Inc. | | 69,800 | | | 3,065,616 | |
Southern Co. | | 162,100 | | | 5,597,313 | |
| | | | | | |
| | | | | 11,867,205 | |
| | | | | | |
Total Common Stocks (Cost $253,272,189) | | | | | 293,438,013 | |
| | | | | | |
| | |
| | | Shares | | | Value ($) | |
Securities Lending Collateral 0.3% | | | | | | |
Daily Assets Fund Institutional, 4.28% (b) (c) (Cost $837,500) | | 837,500 | | | 837,500 | |
Cash Equivalents 5.1% | | | | | | |
Cash Management QP Trust, 4.26% (d) (Cost $15,574,214) | | 15,574,214 | | | 15,574,214 | |
| | |
| | | % of Net Assets | | | Value ($) | |
Total Investment Portfolio (Cost $269,683,903)+ | | 100.5 | | | 309,849,727 | |
Other Assets and Liabilities, Net | | (0.5 | ) | | (1,410,288 | ) |
| | | | | | |
Net Assets | | 100.0 | | | 308,439,439 | |
| | | | | | |
| * | Non-income producing security. |
| + | The cost for federal income tax purposes was $271,423,513. At December 31, 2005, net unrealized appreciation for all securities based on tax cost was $38,426,214. This consisted of aggregate gross unrealized appreciation for all securities in which there was an excess of value over tax cost of $40,528,084 and aggregate gross unrealized depreciation for all securities in which there was an excess of tax cost over value of $2,101,870. |
| (a) | All or a portion of these securities were on loan (see Notes to Financial Statements). The value of all securities loaned at December 31, 2005 amounted to $819,600 which is 0.3% of net assets. |
| (b) | Daily Assets Fund Institutional, an affiliated fund, is managed by Deutsche Asset Management, Inc. The rate shown is the annualized seven-day yield at period end. |
| (c) | Represents collateral held in connection with securities lending. |
| (d) | Cash Management QP Trust, an affiliated fund, is managed by Deutsche Investment Management Americas Inc. The rate shown is the annualized seven-day yield at period end. |
ADR: American Depositary Receipt
The accompanying notes are an integral part of the financial statements.
224
Financial Statements
Statement of Assets and Liabilities
as of December 31, 2005
| | | | |
Assets | | | | |
Investments: | | | | |
Investments in securities, at value (cost $253,272,189) — including $819,600 of securities loaned | | $ | 293,438,013 | |
Investment in Daily Assets Fund Institutional (cost $837,500)* | | | 837,500 | |
Investment in Cash Management QP Trust (cost $15,574,214) | | | 15,574,214 | |
Total investments in securities, at value (cost $269,683,903) | | | 309,849,727 | |
Dividends receivable | | | 288,188 | |
Interest receivable | | | 65,415 | |
Receivable for Portfolio shares sold | | | 455,993 | |
Foreign taxes recoverable | | | 5,246 | |
Other assets | | | 9,748 | |
| | | | |
Total assets | | | 310,674,317 | |
| | | | |
Liabilities | | | | |
Payable for Portfolio shares redeemed | | | 307,695 | |
Payable for investments purchased | | | 799,024 | |
Payable upon return of securities loaned | | | 837,500 | |
Accrued management fee | | | 194,799 | |
Other accrued expenses and payables | | | 95,860 | |
Total liabilities | | | 2,234,878 | |
| | | | |
Net assets, at value | | $ | 308,439,439 | |
| | | | |
Net Assets | | | | |
Net assets consist of: | | | | |
Undistributed net investment income | | | 4,759,802 | |
Net unrealized appreciation (depreciation) on investments | | | 40,165,824 | |
Accumulated net realized gain (loss) | | | (15,524,916 | ) |
Paid-in capital | | | 279,038,729 | |
| | | | |
Net assets, at value | | $ | 308,439,439 | |
| | | | |
Class A | | | | |
Net Asset Value, offering and redemption price per share ($267,956,008 – 16,949,748 outstanding shares of beneficial interest, $.01 par value, unlimited number of shares authorized) | | $ | 15.81 | |
Class B | | | | |
Net Asset Value, offering and redemption price per share ($40,483,431 + 2,564,460 outstanding shares of beneficial interest, $.01 par value, unlimited number of shares authorized) | | $ | 15.79 | |
| * | Represents collateral on securities loaned. |
225
| | | | |
Statement of Operations for the year ended December 31, 2005 | |
|
Investment Income | |
Income: | | | | |
Dividends (net of foreign taxes withheld of $96,906) | | $ | 7,036,089 | |
Interest — Cash Management QP Trust | | | 437,331 | |
Securities lending income, including income from Daily Assets Fund Institutional, net of borrower rebates | | | 31,589 | |
| | | | |
Total Income | | | 7,505,009 | |
| | | | |
Expenses: | | | | |
Management fee | | | 2,307,055 | |
Custodian fees | | | 15,679 | |
Distribution service fees (Class B) | | | 100,801 | |
Record keeping fees (Class B) | | | 61,577 | |
Auditing | | | 43,852 | |
Legal | | | 13,101 | |
Trustees’ fees and expenses | | | 13,203 | |
Reports to shareholders | | | 61,778 | |
Other | | | 14,777 | |
Total expenses before expense reductions | | | 2,631,823 | |
Expense reductions | | | (17,741 | ) |
Total expenses after expense reductions | | | 2,614,082 | |
| | | | |
Net investment income (loss) | | | 4,890,927 | |
| | | | |
Realized and Unrealized Gain (Loss) on Investment Transactions | | | | |
Net realized gain (loss) from investments | | | 11,041,062 | |
Net unrealized appreciation (depreciation) during the period on investments | | | (10,143,924 | ) |
| | | | |
Net gain (loss) on investment transactions | | | 897,138 | |
| | | | |
Net increase (decrease) in net assets resulting from operations | | $ | 5,788,065 | |
| | | | |
The accompanying notes are an integral part of the financial statements.
226
| | | | | | | | |
Statement of Changes in Net Assets | | | | | | | | |
| |
| | | Years Ended December 31, | |
Increase (Decrease) in Net Assets | | 2005 | | | 2004 | |
Operations: | | | | | | | | |
Net investment income (loss) | | $ | 4,890,927 | | | $ | 5,323,805 | |
Net realized gain (loss) on investment transactions | | | 11,041,062 | | | | 13,617,082 | |
Net unrealized appreciation (depreciation) during the period on investment transactions | | | (10,143,924 | ) | | | 9,876,005 | |
Net increase (decrease) in net assets resulting from operations | | | 5,788,065 | | | | 28,816,892 | |
Distributions to shareholders from: | | | | | | | | |
Net investment income: | | | | | | | | |
Class A | | | (4,761,672 | ) | | | (4,099,698 | ) |
Class B | | | (575,737 | ) | | | (305,336 | ) |
Portfolio share transactions: | | | | | | | | |
Class A | | | | | | | | |
Proceeds from shares sold | | | 36,091,471 | | | | 26,091,725 | |
Reinvestment of distributions | | | 4,761,672 | | | | 4,099,698 | |
Cost of shares redeemed | | | (47,266,915 | ) | | | (40,278,155 | ) |
Net increase (decrease) in net assets from Class A share transactions | | | (6,413,772 | ) | | | (10,086,732 | ) |
Class B | | | | | | | | |
Proceeds from shares sold | | | 4,068,880 | | | | 22,917,145 | |
| | | | | | | | |
Reinvestment of distributions | | | 575,737 | | | | 305,336 | |
Cost of shares redeemed | | | (4,564,820 | ) | | | (3,736,209 | ) |
Net increase (decrease) in net assets from Class B share transactions | | | 79,797 | | | | 19,486,272 | |
Increase (decrease) in net assets | | | (5,883,319 | ) | | | 33,811,398 | |
Net assets at beginning of period | | | 314,322,758 | | | | 280,511,360 | |
| | | | | | | | |
Net assets at end of period (including undistributed net investment income of $4,759,802 and $5,206,284, respectively) | | $ | 308,439,439 | | | $ | 314,322,758 | |
| | | | | | | | |
Other Information | | | | | | | | |
Class A | | | | | | | | |
Shares outstanding at beginning of period | | | 17,350,180 | | | | 18,033,776 | |
Shares sold | | | 2,330,962 | | | | 1,766,310 | |
Shares issued to shareholders in reinvestment of distributions | | | 312,241 | | | | 282,738 | |
Shares redeemed | | | (3,043,635 | ) | | | (2,732,644 | ) |
Net increase (decrease) in Class A shares | | | (400,432 | ) | | | (683,596 | ) |
| | | | | | | | |
Shares outstanding at end of period | | | 16,949,748 | | | | 17,350,180 | |
| | | | | | | | |
Class B | | | | | | | | |
Shares outstanding at beginning of period | | | 2,560,016 | | | | 1,221,656 | |
Shares sold | | | 261,484 | | | | 1,563,652 | |
Shares issued to shareholders in reinvestment of distributions | | | 37,679 | | | | 21,029 | |
Shares redeemed | | | (294,719 | ) | | | (246,321 | ) |
Net increase (decrease) in Class B shares | | | 4,444 | | | | 1,338,360 | |
| | | | | | | | |
Shares outstanding at end of period | | | 2,564,460 | | | | 2,560,016 | |
| | | | | | | | |
The accompanying notes are an integral part of the financial statements.
227
Financial Highlights
| | | | | | | | | | | | | | | | | | | | |
Class A Years Ended December 31, | | 2005 | | | 2004 | | | 2003 | | | 2002 | | | 2001 | |
Selected Per Share Data | | | | | | | | | | | | | | | | | | | | |
Net asset value, beginning of period | | $ | 15.79 | | | $ | 14.57 | | | $ | 11.24 | | | $ | 13.40 | | | $ | 13.40 | |
| | | | | | | | | | | | | | | | | | | | |
Income (loss) from investment operations: | | | | | | | | | | | | | | | | | | | | |
Net investment income (loss)a | | | .26 | | | | .27 | | | | .24 | | | | .23 | | | | .23 | |
Net realized and unrealized gain (loss) on investment transactions | | | .04 | | | | 1.18 | | | | 3.33 | | | | (2.20 | ) | | | .01 | |
| | | | | | | | | | | | | | | | | | | | |
Total from investment operations | | | .30 | | | | 1.45 | | | | 3.57 | | | | (1.97 | ) | | | .24 | |
| | | | | | | | | | | | | | | | | | | | |
Less distributions from: | | | | | | | | | | | | | | | | | | | | |
Net investment income | | | (.28 | ) | | | (.23 | ) | | | (.24 | ) | | | (.19 | ) | | | (.24 | ) |
| | | | | | | | | | | | | | | | | | | | |
Net asset value, end of period | | $ | 15.81 | | | $ | 15.79 | | | $ | 14.57 | | | $ | 11.24 | | | $ | 13.40 | |
| | | | | | | | | | | | | | | | | | | | |
Total Return (%) | | | 1.97b | | | | 10.07 | | | | 32.60 | | | | (14.98 | ) | | | 1.87 | |
Ratios to Average Net Assets and Supplemental Data | | | | | | | | | | | | | | | | | | | | |
Net assets, end of period ($ millions) | | | 268 | | | | 274 | | | | 263 | | | | 215 | | | | 257 | |
Ratio of expenses before expense reductions (%) | | | .80 | | | | .80 | | | | .80 | | | | .79 | | | | .79 | |
Ratio of expenses after expense reductions (%) | | | .80 | | | | .80 | | | | .80 | | | | .79 | | | | .79 | |
Ratio of net investment income (loss) (%) | | | 1.64 | | | | 1.84 | | | | 1.94 | | | | 1.84 | | | | 1.75 | |
Portfolio turnover rate (%) | | | 64 | | | | 40 | | | | 58 | | | | 84 | | | | 72 | |
| a | Based on average shares outstanding during the period. |
| b | Total return would have been lower had certain expenses not been reduced. |
| | | | | | | | | | | | | | | | |
| Class B | | | | | | | | | | | | | | | | |
| | | | |
Years Ended December 31, | | 2005 | | | 2004 | | | 2003 | | | 2002a | |
Selected Per Share Data | | | | | | | | | | | | | | | | |
Net asset value, beginning of period | | $ | 15.77 | | | $ | 14.55 | | | $ | 11.23 | | | $ | 12.77 | |
Income (loss) from investment operations: | | | | | | | | | | | | | | | | |
Net investment income (loss)b | | | .19 | | | | .22 | | | | .18 | | | | .15 | |
Net realized and unrealized gain (loss) on investment transactions | | | .05 | | | | 1.17 | | | | 3.35 | | | | (1.69 | ) |
| | | | | | | | | | | | | | | | |
Total from investment operations | | | .24 | | | | 1.39 | | | | 3.53 | | | | (1.54 | ) |
| | | | | | | | | | | | | | | | |
Less distributions from: | | | | | | | | | | | | | | | | |
Net investment income | | | (.22 | ) | | | (.17 | ) | | | (.21 | ) | | | — | |
| | | | | | | | | | | | | | | | |
Net asset value, end of period | | $ | 15.79 | | | $ | 15.77 | | | $ | 14.55 | | | $ | 11.23 | |
| | | | | | | | | | | | | | | | |
Total Return (%) | | | 1.58c | | | | 9.65 | | | | 32.19 | | | | (12.06 | )** |
Ratios to Average Net Assets and Supplemental Data | | | | | | | | | | | | | | | | |
Net assets, end of period ($ millions) | | | 40 | | | | 40 | | | | 18 | | | | .5 | |
Ratio of expenses before expense reductions (%) | | | 1.21 | | | | 1.18 | | | | 1.19 | | | | 1.04 | * |
Ratio of expenses after expense reductions (%) | | | 1.20 | | | | 1.18 | | | | 1.19 | | | | 1.04 | * |
Ratio of net investment income (loss) %) | | | 1.24 | | | | 1.46 | | | | 1.55 | | | | 2.74 | * |
Portfolio turnover rate (%) | | | 64 | | | | 40 | | | | 58 | | | | 84 | ** |
| a | For the period July 1, 2002 (commencement of operations of Class B shares) to December 31, 2002. |
| b | Based on average shares outstanding during the period. |
| c | Total return would have been lower had certain expenses not been reduced. |
228
Performance Summary December 31, 2005
DWS Mercury Large Cap Core VIP
All performance shown is historical, assumes reinvestment of all dividend and capital gain distributions and does not guarantee future results. Investment return and principal value fluctuate with changing market conditions so that, when redeemed, shares may be worth more or less than their original cost. Current performance may be lower or higher than the performance data quoted. Please visit www.dws-scudder.com for the Portfolio’s most recent month-end performance. Performance doesn’t reflect charges and fees (“contract charges”) associated with the separate account that invests in the Portfolio or any variable life insurance policy or variable annuity contract for which the Portfolio is an investment option. These charges and fees will reduce returns. While all share classes have the same underlying portfolio, their performance will differ.
This Portfolio is subject to stock market and equity risks, meaning stocks in the Portfolio may decline in value for extended periods of time due to the activities and financial prospects of individual companies, or due to general market and economic conditions. Please read this Portfolio’s prospectus for specific details regarding its investments and risk profile.
Portfolio returns shown for all periods reflect a fee waiver and/or expense reimbursement. Without this waiver/reimbursement, returns would have been lower.
Growth of an Assumed $10,000 Investment in DWS Mercury Large Cap Core VIP from 11/15/2004 to 12/31/2005
¨ DWS Mercury Large Cap Core VIP — Class A
¨ Russell 1000 Index
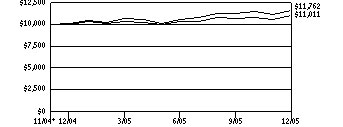
The Russell 1000 Index measures the performance of the 1,000 largest companies in the Russell 3000 Index, which represents approximately 92% of the total market capitalization of the Russell 3000 Index. Index returns assume reinvested dividends and, unlike Portfolio returns, do not reflect any fees or expenses. It is not possible to invest directly into an index.
Comparative Results
| | | | | | | | | | |
DWS Mercury Large Cap Core VIP | | | | 1-Year | | | Life of Portfolio* | |
Class A | | Growth of $10,000 | | $ | 11,320 | | | $ | 11,762 | |
| | Average annual total return | | | 13.20 | % | | | 15.55 | % |
Russell 1000 Index | | Growth of $10,000 | | $ | 10,627 | | | $ | 11,011 | |
| | Average annual total return | | | 6.27 | % | | | 9.30 | % |
| | | |
DWS Mercury Large Cap Core VIP | | | | 1-Year | | | Life of Class* | |
Class B | | Growth of $10,000 | | $ | 11,293 | | | $ | 11,733 | |
| | Average annual total return | | | 12.93 | % | | | 15.30 | % |
Russell 1000 Index | | Growth of $10,000 | | $ | 10,627 | | | $ | 11,011 | |
| | Average annual total return | | | 6.27 | % | | | 9.30 | % |
The growth of $10,000 is cumulative.
| * | The Portfolio and Class B commenced operations on November 15, 2004. Index returns begin November 30, 2004. |
229
Information About Your Portfolio’s Expenses
DWS Mercury Large Cap Core VIP
As an investor of the Portfolio, you incur two types of costs: ongoing expenses and transaction costs. Ongoing expenses include management fees, distribution and service (12b-1) fees and other Portfolio expenses. Examples of transaction costs include sales charges (loads), redemption fees and account maintenance fees, which are not shown in this section. The following tables are intended to help you understand your ongoing expenses (in dollars) of investing in the Portfolio and to help you compare these expenses with the ongoing expenses of investing in other mutual funds. In the most recent six-month period, the Portfolio limited these expenses; had it not done so, expenses would have been higher. The tables are based on an investment of $1,000 made at the beginning of the six-month period ended December 31, 2005.
The tables illustrate your Portfolio’s expenses in two ways:
Actual Portfolio Return. This helps you estimate the actual dollar amount of ongoing expenses (but not transaction costs) paid on a $1,000 investment in the Portfolio using the Portfolio’s actual return during the period. To estimate the expenses you paid over the period, simply divide your account value by $1,000 (for example, an $8,600 account value divided by $1,000 = 8.6), then multiply the result by the number in the “Expenses Paid per $1,000” line under the share class you hold.
Hypothetical 5% Portfolio Return. This helps you to compare your Portfolio’s ongoing expenses (but not transaction costs) with those of other mutual funds using the Portfolio’s actual expense ratio and a hypothetical rate of return of 5% per year before expenses. Examples using a 5% hypothetical Portfolio return may be found in the shareholder reports of other mutual funds. The hypothetical account values and expenses may not be used to estimate the actual ending account balance or expenses you paid for the period.
Please note that the expenses shown in these tables are meant to highlight your ongoing expenses only and do not reflect any transaction costs. The “Expenses Paid per $1,000” line of the tables is useful in comparing ongoing expenses only and will not help you determine the relative total expense of owning different funds. If these transaction costs had been included, your costs would have been higher.
Expenses and Value of a $1,000 Investment for the six months ended December 31, 2005
| | | | | | |
Actual Portfolio Return | | Class A | | Class B |
Beginning Account Value 7/1/05 | | $ | 1,000.00 | | $ | 1,000.00 |
Ending Account Value 12/31/05 | | $ | 1,087.00 | | $ | 1,085.20 |
Expenses Paid per $1,000* | | $ | 4.94 | | $ | 6.36 |
| | |
Hypothetical 5% Portfolio Return | | Class A | | Class B |
Beginning Account Value 7/1/05 | | $ | 1,000.00 | | $ | 1,000.00 |
Ending Account Value 12/31/05 | | $ | 1,020.47 | | $ | 1,019.11 |
Expenses Paid per $1,000* | | $ | 4.79 | | $ | 6.16 |
| * | Expenses are equal to the Portfolio’s annualized expense ratio for each share class, multiplied by the average account value over the period, multiplied by the number of days in the most recent six-month period, then divided by 365. |
| | | | | | |
Annualized Expense Ratios | | Class A | | | Class B | |
DWS Variable Series II — DWS Mercury Large Cap Core VIP | | .94 | % | | 1.21 | % |
For more information, please refer to the Portfolio’s prospectus.
These tables do not reflect charges and fees (“contract charges”) associated with the separate account that invests in the portfolio or any variable life insurance policy or variable annuity contract for which the portfolio is an investment option.
230
Management Summary December 31, 2005
DWS Mercury Large Cap Core VIP
DWS Mercury Large Cap Core VIP gained 13.20% for the 12-month period ended December 31, 2005 (Class A shares unadjusted for contract charges), while its benchmark, the Russell 1000 Index, returned 6.27%.
The Portfolio’s performance versus the benchmark benefited considerably from stock selection and an overweight1 in the energy sector. It also benefited from stock selection in the healthcare, consumer discretionary and financial sectors. However, stock selection in the information technology and consumer staples sectors, and an overweight in the consumer discretionary sector, detracted from relative return.
Four of the Portfolio’s 10 largest holdings contributed notably to the comparative performance for the year: ConocoPhillips, Hewlett-Packard Co., UnitedHealth Group Inc. and Motorola Inc. Our positions in Dell, Inc. and Pfizer, Inc. had a negative impact on the performance versus the benchmark.
As 2006 begins, we believe there may be a moderate deceleration in US economic growth to an approximate annualized rate of 3% as the effect of a weakening consumer demand is partially offset by capital spending. We believe that the slowing of the economy may lead to an increase in earnings disappointments. However, while an increase in market volatility is likely, we believe that overall the risk of recession is slight.
In recent months, we have brought our positions in several sectors more closely in line with their benchmark weights. However, we currently maintain the Portfolio’s overweight versus the benchmark in cyclical companies such as those in the information technology and energy sectors, the Portfolio’s underweight versus the benchmark in the financial and consumer staples sectors.
Bob Doll, CFA, CPA
Lead Portfolio Manager
Tasos Bouloutas Brenda Sklar
Dan Hansen Gregory Brunk
Portfolio Managers
Fund Asset Management L.P. (doing business as Mercury Advisors), Subadvisor to the Portfolio
All performance shown is historical, assumes reinvestment of all dividend and capital gain distributions and does not guarantee future results. Investment return and principal value fluctuate with changing market conditions so that, when redeemed, shares may be worth more or less than their original cost. Current performance may be lower or higher than the performance data quoted. Please visit www.dws-scudder.com for the Portfolio’s most recent month-end performance. Performance doesn’t reflect charges and fees (“contract charges”) associated with the separate account that invests in the Portfolio or any variable life insurance policy or variable annuity contract for which the Portfolio is an investment option. These charges and fees will reduce returns. While all share classes have the same underlying portfolio, their performance will differ.
Portfolio returns during the period reflect a fee waiver and/or expense reimbursement. Without this waiver/reimbursement, returns would have been lower.
Risk Considerations
The Portfolio is subject to stock market and equity risk, meaning stocks in the Portfolio may decline in value for extended periods of time due to the activities and financial prospects of individual companies, or due to general market and economic conditions. Please read this Portfolio’s prospectus for specific details regarding this product’s investments and risk profile.
The Russell 1000 Index measures the performance of the 1,000 largest companies in the Russell 3000 Index, which measures the performance of the 3,000 largest US companies based on total market capitalization.
| 1 | “Overweight” means the Portfolio holds a higher weighting in a given sector or security than the benchmark. “Underweight” means the Portfolio holds a lower weighting. |
Portfolio management market commentary is as of December 31, 2005, and may not come to pass. This information is subject to change at any time based on market and other conditions.
231
Portfolio Summary
DWS Mercury Large Cap Core VIP
| | | | | | |
Asset Allocation | | 12/31/05 | | | 12/31/04 | |
Common Stocks | | 99 | % | | 99 | % |
Cash Equivalents | | 1 | % | | 1 | % |
| | | | | | |
| | 100 | % | | 100 | % |
| | | | | | |
| | |
Sector Diversification (As a % of Common Stocks) | | 12/31/05 | | | 12/31/04 | |
Information Technology | | 25 | % | | 24 | % |
Health Care | | 20 | % | | 12 | % |
Energy | | 18 | % | | 11 | % |
Financials | | 12 | % | | 12 | % |
Consumer Discretionary | | 10 | % | | 18 | % |
Industrials | | 9 | % | | 8 | % |
Materials | | 2 | % | | 8 | % |
Consumer Staples | | 2 | % | | 4 | % |
Utilities | | 2 | % | | 3 | % |
| | | | | | |
| | 100 | % | | 100 | % |
| | | | | | |
Asset allocation and sector diversification are subject to change.
For more complete details about the Portfolio’s investment portfolio, see page 65. A quarterly Fact Sheet is available upon request. Information concerning portfolio holdings of the Portfolio as of month end will be posted to www.dws-scudder.com on the 15th of the following month.
Following the Portfolio’s fiscal first and third quarter-end, a complete portfolio holdings listing is filed with the SEC on Form N-Q. The form will be available on the SEC’s Web site at www.sec.gov, and it also may be reviewed and copied at the SEC’s Public Reference Room in Washington, D.C. Information on the operation of the SEC’s Public Reference Room may be obtained by calling (800) SEC-0330.
232
Investment Portfolio December 31, 2005
DWS Mercury Large Cap Core VIP
| | | | |
| | | Shares | | Value ($) |
Common Stocks 99.6% | | | | |
Consumer Discretionary 9.9% | | | | |
Auto Components 0.9% | | | | |
Goodyear Tire & Rubber Co.* | | 2,650 | | 46,057 |
| | | | |
Hotels Restaurants & Leisure 1.2% | | | | |
Darden Restaurants, Inc. | | 1,550 | | 60,264 |
| | | | |
Household Durables 0.7% | | | | |
Beazer Homes USA, Inc. | | 190 | | 13,840 |
NVR, Inc.* | | 15 | | 10,530 |
Ryland Group, Inc. | | 135 | | 9,737 |
| | | | |
| | | | 34,107 |
| | | | |
Leisure Equipment & Products 0.1% | | | | |
Hasbro, Inc. | | 70 | | 1,413 |
| | | | |
Multiline Retail 2.2% | | | | |
J.C. Penney Co., Inc. | | 1,000 | | 55,600 |
Nordstrom, Inc. | | 1,435 | | 53,669 |
| | | | |
| | | | 109,269 |
| | | | |
Specialty Retail 4.7% | | | | |
Advance Auto Parts, Inc.* | | 740 | | 32,160 |
American Eagle Outfitters, Inc. | | 290 | | 6,664 |
AutoNation, Inc.* | | 690 | | 14,994 |
Circuit City Stores, Inc. | | 2,025 | | 45,745 |
Office Depot, Inc.* | | 1,285 | | 40,349 |
Staples, Inc. | | 1,960 | | 44,511 |
Tiffany & Co. | | 1,255 | | 48,054 |
| | | | |
| | | | 232,477 |
| | | | |
| | | | | |
Textiles, Apparel & Luxury Goods 0.1% | | | | |
Polo Ralph Lauren Corp. | | 100 | | 5,614 |
| | | | |
Consumer Staples 1.9% | | | | |
Food & Staples Retailing 0.9% | | | | |
Kroger Co.* | | 2,275 | | 42,952 |
| | | | |
Food Products 0.2% | | | | |
Pilgrim’s Pride Corp. | | 315 | | 10,445 |
| | | | |
Household Products 0.5% | | | | |
Procter & Gamble Co. | | 455 | | 26,336 |
| | | | |
Tobacco 0.3% | | | | |
Altria Group, Inc. | | 160 | | 11,955 |
| | | | |
Energy 18.3% | | | | |
Energy Equipment & Services 0.5% | | | | |
Cooper Cameron Corp.* | | 590 | | 24,426 |
| | | | |
Oil, Gas & Consumable Fuels 17.8% | | | | |
Amerada Hess Corp. | | 360 | | 45,655 |
Anadarko Petroleum Corp. | | 610 | | 57,797 |
Apache Corp. | | 700 | | 47,964 |
Burlington Resources, Inc. | | 830 | | 71,546 |
Chevron Corp. | | 125 | | 7,096 |
ConocoPhillips | | 1,390 | | 80,870 |
Devon Energy Corp. | | 1,000 | | 62,540 |
ExxonMobil Corp. | | 3,080 | | 173,004 |
Kerr-McGee Corp. | | 560 | | 50,882 |
Marathon Oil Corp. | | 935 | | 57,007 |
Murphy Oil Corp. | | 45 | | 2,430 |
Newfield Exploration Co.* | | 155 | | 7,761 |
233
| | | | |
| | | Shares | | Value ($) |
Occidental Petroleum Corp. | | 760 | | 60,709 |
Pioneer Natural Resources Co. | | 995 | | 51,014 |
Sunoco, Inc. | | 680 | | 53,298 |
Tesoro Corp. | | 895 | | 55,087 |
| | | | |
| | | | 884,660 |
| | | | |
Financials 12.3% | | | | |
Banks 0.4% | | | | |
Bank of America Corp. | | 465 | | 21,459 |
| | | | |
Capital Markets 3.7% | | | | |
Charles Schwab Corp. | | 2,730 | | 40,049 |
Janus Capital Group, Inc. | | 1,100 | | 20,493 |
Lehman Brothers Holdings, Inc. | | 490 | | 62,803 |
The Goldman Sachs Group, Inc. | | 460 | | 58,747 |
| | | | |
| | | | 182,092 |
| | | | |
Diversified Financial Services 1.1% | | | | |
Citigroup, Inc. | | 1,000 | | 48,530 |
JPMorgan Chase & Co. | | 120 | | 4,763 |
| | | | |
| | | | 53,293 |
| | | | |
Insurance 7.1% | | | | |
American International Group, Inc. | | 170 | | 11,599 |
Aon Corp. | | 1,250 | | 44,937 |
MetLife, Inc. | | 1,100 | | 53,900 |
Progressive Corp. | | 150 | | 17,517 |
Prudential Financial, Inc. | | 850 | | 62,211 |
Safeco Corp. | | 675 | | 38,138 |
The St. Paul Travelers Companies, Inc. | | 1,365 | | 60,975 |
UnumProvident Corp. | | 2,100 | | 47,775 |
W.R. Berkley Corp. | | 372 | | 17,715 |
| | | | |
| | | | 354,767 |
| | | | |
Health Care 19.3% | | | | |
Biotechnology 2.8% | | | | |
Amgen, Inc.* | | 1,125 | | 88,717 |
Applera Corp. — Applied Biosystems Group | | 1,025 | | 27,224 |
Techne Corp.* | | 430 | | 24,145 |
| | | | |
| | | | 140,086 |
| | | | |
Health Care Equipment & Supplies 0.9% | | | | |
Becton, Dickinson & Co. | | 710 | | 42,657 |
| | | | |
Health Care Providers & Services 10.6% | | | | |
Aetna, Inc. | | 645 | | 60,830 |
AmerisourceBergen Corp. | | 1,320 | | 54,648 |
Caremark Rx, Inc.* | | 1,115 | | 57,746 |
CIGNA Corp. | | 430 | | 48,031 |
Express Scripts, Inc.* | | 660 | | 55,308 |
HCA, Inc. | | 990 | | 49,995 |
Humana, Inc.* | | 1,110 | | 60,306 |
McKesson Corp. | | 1,135 | | 58,555 |
UnitedHealth Group, Inc. | | 1,270 | | 78,918 |
| | | | |
| | | | 524,337 |
| | | | |
Pharmaceuticals 5.0% | | | | |
Allergan, Inc. | | 545 | | 58,838 |
Barr Pharmaceuticals, Inc.* | | 880 | | 54,815 |
Johnson & Johnson | | 395 | | 23,740 |
King Pharmaceuticals, Inc.* | | 1,960 | | 33,163 |
234
| | | | |
| | | Shares | | Value ($) |
Pfizer, Inc. | | 3,435 | | 80,104 |
| | | | 250,660 |
| | | | |
Industrials 9.1% | | | | |
Aerospace & Defense 2.1% | | | | |
Lockheed Martin Corp. | | 930 | | 59,176 |
Precision Castparts Corp. | | 365 | | 18,911 |
Raytheon Co. | | 640 | | 25,696 |
| | | | |
| | | | 103,783 |
| | | | |
Airlines 0.6% | | | | |
AMR Corp.* | | 1,415 | | 31,455 |
| | | | |
| | | | |
Commercial Services & Supplies 0.4% | | | | |
Corporate Executive Board Co. | | 220 | | 19,734 |
| | | | |
Electrical Equipment 0.8% | | | | |
Rockwell Automation, Inc. | | 675 | | 39,933 |
| | | | |
Industrial Conglomerates 1.9% | | | | |
General Electric Co. | | 2,710 | | 94,986 |
| | | | |
Machinery 2.1% | | | | |
Cummins, Inc. | | 560 | | 50,249 |
Joy Global, Inc. | | 442 | | 17,680 |
Terex Corp.* | | 610 | | 36,234 |
| | | | |
| | | | 104,163 |
| | | | |
Road & Rail 1.1% | | | | |
CSX Corp. | | 1,085 | | 55,085 |
| | | | |
Trading Companies & Distributors 0.1% | | | | |
MSC Industrial Direct Co. “A” | | 85 | | 3,419 |
| | | | |
Information Technology 25.1% | | | | |
Communications Equipment 1.7% | | | | |
Cisco Systems, Inc.* | | 900 | | 15,408 |
Motorola, Inc. | | 3,055 | | 69,012 |
| | | | |
| | | | 84,420 |
| | | | |
Computers & Peripherals 4.8% | | | | |
Dell, Inc.* | | 2,150 | | 64,479 |
Hewlett-Packard Co. | | 2,725 | | 78,017 |
International Business Machines Corp. | | 65 | | 5,343 |
NCR Corp.* | | 1,100 | | 37,334 |
Western Digital Corp.* | | 2,745 | | 51,084 |
| | | | |
| | | | 236,257 |
| | | | |
Electronic Equipment & Instruments 0.5% | | | | |
Jabil Circuit, Inc.* | | 710 | | 26,334 |
| | | | |
IT Consulting & Services 2.4% | | | | |
CheckFree Corp.* | | 875 | | 40,162 |
Computer Sciences Corp.* | | 220 | | 11,141 |
Fiserv, Inc.* | | 1,000 | | 43,270 |
Sabre Holdings Corp. | | 1,055 | | 25,436 |
| | | | |
| | | | 120,009 |
| | | | |
235
| | | | | | |
| | |
| | | Shares | | | Value ($) | |
Semiconductors & Semiconductor Equipment 7.5% | | | | | | |
Broadcom Corp. “A”* | | 430 | | | 20,274 | |
Intel Corp. | | 3,480 | | | 86,861 | |
Intersil Corp. “A” | | 2,040 | | | 50,755 | |
Lam Research Corp.* | | 1,320 | | | 47,098 | |
LSI Logic Corp.* | | 5,110 | | | 40,880 | |
Microchip Technology, Inc. | | 100 | | | 3,215 | |
NVIDIA Corp.* | | 1,405 | | | 51,367 | |
Texas Instruments, Inc. | | 2,200 | | | 70,554 | |
| | | | | | |
| | | | | 371,004 | |
| | | | | | |
Software 8.2% | | | | | | |
Autodesk, Inc. | | 1,265 | | | 54,332 | |
BEA Systems, Inc.* | | 4,875 | | | 45,825 | |
BMC Software, Inc.* | | 1,860 | | | 38,112 | |
Citrix Systems, Inc.* | | 1,665 | | | 47,919 | |
Compuware Corp.* | | 1,830 | | | 16,415 | |
Intuit, Inc.* | | 1,000 | | | 53,300 | |
McAfee, Inc.* | | 1,740 | | | 47,206 | |
Microsoft Corp. | | 1,775 | | | 46,416 | |
Red Hat, Inc.* | | 2,130 | | | 58,021 | |
| | | | | | |
| | | | | 407,546 | |
| | | | | | |
Materials 2.1% | | | | | | |
Chemicals 0.5% | | | | | | |
Eastman Chemical Co. | | 445 | | | 22,957 | |
| | | | | | |
Metals & Mining 1.5% | | | | | | |
Freeport-McMoRan Copper & Gold, Inc. “B” | | 410 | | | 22,058 | |
Nucor Corp. | | 790 | | | 52,709 | |
| | | | | | |
| | | | | 74,767 | |
| | | | | | |
Paper & Forest Products 0.1% | | | | | | |
MeadWestvaco Corp. | | 185 | | | 5,186 | |
| | | | | | |
Utilities 1.6% | | | | | | |
Electric Utilities 1.0% | | | | | | |
American Electric Power Co., Inc. | | 175 | | | 6,491 | |
Edison International | | 1,040 | | | 45,354 | |
| | | | | | |
| | | | | 51,845 | |
| | | | | | |
Multi-Utilities 0.6% | | | | | | |
CMS Energy Corp.* | | 1,930 | | | 28,004 | |
| | | | | | |
Total Common Stocks (Cost $4,485,764) | | | | | 4,940,213 | |
| | | | | | |
Cash Equivalents 1.1% | | | | | | |
Cash Management QP Trust, 4.26% (a) (Cost $56,737) | | 56,737 | | | 56,737 | |
| | | | | | |
| | |
| | | % of Net Assets | | | Value ($) | |
Total Investment Portfolio (Cost $4,542,501)+ | | 100.7 | | | 4,996,950 | |
Other Assets and Liabilities, Net | | (0.7 | ) | | (34,946 | ) |
| | | | | | |
Net Assets | | 100.0 | | | 4,962,004 | |
| | | | | | |
Notes to DWS Mercury Large Cap Core VIP Portfolio of Investments
| * | Non-income producing security. |
| + | The cost for federal income tax purposes was $4,544,205. At December 31, 2005, net unrealized appreciation for all securities based on tax cost was $452,745. This consisted of aggregate gross unrealized appreciation for all securities in which there was an excess of value over tax cost of $530,565 and aggregate gross unrealized depreciation for all securities in which there was an excess of tax cost over value of $77,820. |
| (a) | Cash Management QP Trust, an affiliated fund, is managed by Deutsche Investment Management Americas Inc. The rate shown is the annualized seven-day yield at period end. |
The accompanying notes are an integral part of the financial statements.
236
Financial Statements
Statement of Assets and Liabilities
as of December 31, 2005
| | | | |
Assets | | | | |
Investments: | | | | |
Investments in securities, at value (cost $4,485,764) | | $ | 4,940,213 | |
Investment in Cash Management QP Trust (cost $56,737) | | | 56,737 | |
Total investments in securities, at value (cost $4,542,501) | | | 4,996,950 | |
Dividends receivable | | | 3,512 | |
Interest receivable | | | 155 | |
Receivable for Portfolio shares sold | | | 4,774 | |
Due from Advisor | | | 26,823 | |
Other assets | | | 106 | |
Total assets | | | 5,032,320 | |
Liabilities | | | | |
Payable for Portfolio shares redeemed | | | 1,118 | |
Other accrued expenses and payables | | | 69,198 | |
Total liabilities | | | 70,316 | |
| | | | |
Net assets, at value | | $ | 4,962,004 | |
| | | | |
Net Assets | | | | |
Net assets consist of: Undistributed net investment income | | | 8 | |
Net unrealized appreciation (depreciation) on investments | | | 454,449 | |
Accumulated net realized gain (loss) | | | (12,198 | ) |
Paid-in capital | | | 4,519,745 | |
| | | | |
Net assets, at value | | $ | 4,962,004 | |
| | | | |
Class A | | | | |
Net Asset Value, offering and redemption price per share ($587,918 ÷ 50,351 outstanding shares of beneficial interest, $.01 par value, unlimited number of shares authorized) | | $ | 11.68 | |
| | | | |
Class B | | | | |
Net Asset Value, offering and redemption price per share ($4,374,086 ÷ 375,589 outstanding shares of beneficial interest, $.01 par value, unlimited number of shares authorized) | | $ | 11.65 | |
| | | | |
237
Statement of Operations
for the year ended December 31, 2005
| | | | |
Investment Income | | | | |
Income: | | | | |
Dividends | | $ | 29,622 | |
Interest — Cash Management QP Trust | | | 1,884 | |
Total Income | | | 31,506 | |
Expenses: | | | | |
Management fee | | | 26,156 | |
Custodian and accounting fees | | | 123,185 | |
Distribution service fees (Class B) | | | 5,900 | |
Record keeping fees (Class B) | | | 1,954 | |
Auditing | | | 24,982 | |
Legal | | | 10,048 | |
Trustees’ fees and expenses | | | 68 | |
Reports to shareholders | | | 3,582 | |
Offering cost | | | 3,467 | |
Other | | | 2,819 | |
Total expenses before expense reductions | | | 202,161 | |
Expense reductions | | | (168,447 | ) |
Total expenses after expense reductions | | | 33,714 | |
| | | | |
Net investment income (loss) | | | (2,208 | ) |
| | | | |
Realized and Unrealized Gain (Loss) on Investment Transactions | | | | |
Net realized gain (loss) from investments | | | (3,226 | ) |
Net unrealized appreciation (depreciation) during the period on investments | | | 410,675 | |
| | | | |
Net gain (loss) on investment transactions | | | 407,449 | |
| | | | |
Net increase (decrease) in net assets resulting from operations | | $ | 405,241 | |
| | | | |
The accompanying notes are an integral part of the financial statements.
238
Statement of Changes in Net Assets
| | | | | | | | |
Increase (Decrease) in Net Assets | | Year Ended
December 31,
2005 | | | Period Ended
December 31,
2004a | |
Operations: | | | | | | | | |
Net investment income (loss) | | $ | (2,208 | ) | | $ | 1,239 | |
Net realized gain (loss) on investment transactions | | | (3,226 | ) | | | 6,729 | |
Net unrealized appreciation (depreciation) during the period on investment transactions | | | 410,675 | | | | 43,774 | |
Net increase (decrease) in net assets resulting from operations | | | 405,241 | | | | 51,742 | |
Distributions to shareholders from: | | | | | | | | |
Net investment income: | | | | | | | | |
Class A | | | (725 | ) | | | — | |
Class B | | | (1,862 | ) | | | — | |
Net realized gains: | | | | | | | | |
Class A | | | (3,034 | ) | | | — | |
Class B | | | (11,251 | ) | | | — | |
Portfolio share transactions: | | | | | | | | |
Class A | | | | | | | | |
Proceeds from shares sold | | | — | | | | 499,964 | |
Reinvestment of distributions | | | 3,759 | | | | — | |
Net increase (decrease) in net assets from Class A share transactions | | | 3,759 | | | | 499,964 | |
Class B | | | | | | | | |
Proceeds from shares sold | | | 3,088,383 | | | | 1,008,929 | |
Reinvestment of distributions | | | 13,113 | | | | — | |
Cost of shares redeemed | | | (91,838 | ) | | | (417 | ) |
Net increase (decrease) in net assets from Class B share transactions | | | 3,009,658 | | | | 1,008,512 | |
Increase (decrease) in net assets | | | 3,401,786 | | | | 1,508,476 | |
Net assets at beginning of period | | | 1,560,218 | | | | — | |
| | | | | | | | |
Net assets at end of period (including undistributed net investment income of $8 and $2,481, respectively) | | $ | 4,962,004 | | | $ | 1,560,218 | |
| | | | | | | | |
Other Information | | | | | | | | |
Class A | | | | | | | | |
Shares outstanding at beginning of period | | | 50,000 | | | | — | |
Shares sold | | | — | | | | 50,000 | |
Shares issued to shareholders in reinvestment of distributions | | | 351 | | | | — | |
Net increase (decrease) in Class A shares | | | 351 | | | | 50,000 | |
| | | | | | | | |
Shares outstanding at end of period | | | 50,351 | | | | 50,000 | |
| | | | | | | | |
Class B | | | | | | | | |
Shares outstanding at beginning of period | | | 100,195 | | | | — | |
Shares sold | | | 282,413 | | | | 100,236 | |
Shares issued to shareholders in reinvestment of distributions | | | 1,195 | | | | — | |
Shares redeemed | | | (8,214 | ) | | | (41 | ) |
Net increase (decrease) in Class B shares | | | 275,394 | | | | 100,195 | |
| | | | | | | | |
Shares outstanding at end of period | | | 375,589 | | | | 100,195 | |
| | | | | | | | |
| a | For the period from November 15, 2004 (commencement of operations) to December 31, 2004. |
The accompanying notes are an integral part of the financial statements.
239
Financial Highlights
Class A
| | | | | | | | |
Years Ended December 31, | | 2005 | | | 2004a | |
Selected Per Share Data | | | | | | | | |
Net asset value, beginning of period | | $ | 10.39 | | | $ | 10.00 | |
Income (loss) from investment operations: | | | | | | | | |
Net investment income (loss)b | | | .02 | | | | .01 | |
Net realized and unrealized gain (loss) on investment transactions | | | 1.36 | | | | .38 | |
Total from investment operations | | | 1.38 | | | | .39 | |
Less distributions from: | | | | | | | | |
Net investment income | | | (.02 | ) | | | — | |
Net realized gain on investment transactions | | | (.07 | ) | | | — | |
Total distributions | | | (.09 | ) | | | — | |
| | | | | | | | |
Net asset value, end of period | | $ | 11.68 | | | $ | 10.39 | |
| | | | | | | | |
Total Return (%)c | | | 13.20 | | | | 3.90 | ** |
Ratios to Average Net Assets and Supplemental Data | | | | | | | | |
Net assets, end of period ($ millions) | | | 1 | | | | 1 | |
Ratio of expenses before expense reductions (%) | | | 6.67 | | | | 22.15 | * |
Ratio of expenses after expense reductions (%) | | | .97 | | | | 1.12 | * |
Ratio of net investment income (%) | | | .11 | | | | .79 | * |
Portfolio turnover rate (%) | | | 78 | | | | 104 | * |
| a | For the period from November 15, 2004 (commencement of operations) to December 31, 2004. |
| b | Based on average shares outstanding during the period. |
| c | Total return would have been lower had certain expenses not been reduced. |
| | | | | | | | |
Class B | | | | | | | | |
| | |
Years Ended December 31, | | 2005 | | | 2004a | |
Selected Per Share Data | | | | | | | | |
Net asset value, beginning of period | | $ | 10.39 | | | $ | 10.00 | |
Income (loss) from investment operations: | | | | | | | | |
Net investment income (loss)b | | | (.01 | ) | | | .01 | |
Net realized and unrealized gain (loss) on investment transactions | | | 1.36 | | | | .38 | |
Total from investment operations | | | 1.35 | | | | .39 | |
Less distributions from: | | | | | | | | |
Net investment income | | | (.02 | ) | | | — | |
Net realized gain on investment transactions | | | (.07 | ) | | | — | |
Total distributions | | | (.09 | ) | | | — | |
| | | | | | | | |
Net asset value, end of period | | $ | 11.65 | | | $ | 10.39 | |
| | | | | | | | |
Total Return (%)c | | | 12.93 | | | | 3.90 | ** |
Ratios to Average Net Assets and Supplemental Data | | | | | | | | |
Net assets, end of period ($ millions) | | | 4 | | | | 1 | |
Ratio of expenses before expense reductions (%) | | | 7.01 | | | | 22.55 | * |
Ratio of expenses after expense reductions (%) | | | 1.20 | | | | 1.11 | * |
Ratio of net investment income (%) | | | (.12 | ) | | | .80 | * |
Portfolio turnover rate (%) | | | 78 | | | | 104 | * |
| a | For the period from November 15, 2004 (commencement of operations) to December 31, 2004. |
| b | Based on average shares outstanding during the period. |
| c | Total return would have been lower had certain expenses not been reduced. |
240
Performance Summary December 31, 2005
DWS MFS Strategic Value VIP
All performance shown is historical, assumes reinvestment of all dividend and capital gain distributions and does not guarantee future results. Investment return and principal value fluctuate with changing market conditions so that, when redeemed, shares may be worth more or less than their original cost. Current performance may be lower or higher than the performance data quoted. Please visit www.dws-scudder.com for the Portfolio’s most recent month-end performance. Performance doesn’t reflect charges and fees (“contract charges”) associated with the separate account that invests in the Portfolio or any variable life insurance policy or variable annuity contract for which the Portfolio is an investment option. These charges and fees will reduce returns. While all share classes have the same underlying portfolio, their performance will differ.
The Portfolio is subject to stock market and equity risks, meaning stocks in the Portfolio may decline in value for extended periods of time due to the activities and financial prospects of individual companies, or due to general market and economic conditions. Please read this Portfolio’s prospectus for specific details regarding its investments and risk profile.
Portfolio returns shown for all periods reflect a fee waiver and/or expense reimbursement. Without this waiver/reimbursement, returns would have been lower.
Growth of an Assumed $10,000 Investment in DWS MFS Strategic Value VIP from 5/1/2002 to 12/31/2005
¨ DWS MFS Strategic Value VIP — Class A
¨ Russell 1000 Value Index
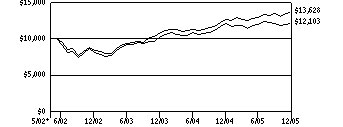
Russell 1000 Value Index is an unmanaged index, which consists of those stocks in the Russell 1000 Index with lower price-to-book ratios and lower forecasted-growth values. Index returns assume reinvested dividends and, unlike Portfolio returns, do not reflect any fees or expenses. It is not possible to invest directly into an index.
Comparative Results
| | | | | | | | | | | | | | |
DWS MFS Strategic Value VIP | | 1-Year | | | 3-Year | | | Life of Portfolio* | |
Class A | | Growth of $10,000 | | $ | 9,982 | | | $ | 14,905 | | | $ | 12,103 | |
| | Average annual total return | | | -.18 | % | | | 14.23 | % | | | 5.34 | % |
Russell 1000 Value Index | | Growth of $10,000 | | $ | 10,705 | | | $ | 16,216 | | | $ | 13,628 | |
| | Average annual total return | | | 7.05 | % | | | 17.49 | % | | | 8.81 | % |
| | | |
DWS MFS Strategic Value VIP | | 1-Year | | | 3-Year | | | Life of Class** | |
Class B | | Growth of $10,000 | | $ | 9,940 | | | $ | 14,744 | | | $ | 13,391 | |
| | Average annual total return | | | -.60 | % | | | 13.82 | % | | | 8.70 | % |
Russell 1000 Value Index | | Growth of $10,000 | | $ | 10,705 | | | $ | 16,216 | | | $ | 14,386 | |
| | Average annual total return | | | 7.05 | % | | | 17.49 | % | | | 10.95 | % |
The growth of $10,000 is cumulative.
| * | The Portfolio commenced operations on May 1, 2002. Index returns begin April 30, 2002. |
| ** | The Portfolio commenced offering Class B shares on July 1, 2002. Index returns begin June 30, 2002. |
241
Information About Your Portfolio’s Expenses
DWS MFS Strategic Value VIP
As an investor of the Portfolio, you incur two types of costs: ongoing expenses and transaction costs. Ongoing expenses include management fees, distribution and service (12b-1) fees and other Portfolio expenses. Examples of transaction costs include sales charges (loads), redemption fees and account maintenance fees, which are not shown in this section. The following tables are intended to help you understand your ongoing expenses (in dollars) of investing in the Portfolio and to help you compare these expenses with the ongoing expenses of investing in other mutual funds. In the most recent period, the Portfolio limited these expenses; had it not done so, expenses would have been higher. The tables are based on an investment of $1,000 made at the beginning of the six-month period ended December 31, 2005.
The tables illustrate your Portfolio’s expenses in two ways:
Actual Portfolio Return. This helps you estimate the actual dollar amount of ongoing expenses (but not transaction costs) paid on a $1,000 investment in the Portfolio using the Portfolio’s actual return during the period. To estimate the expenses you paid over the period, simply divide your account value by $1,000 (for example, an $8,600 account value divided by $1,000 = 8.6), then multiply the result by the number in the “Expenses Paid per $1,000” line under the share class you hold.
Hypothetical 5% Portfolio Return. This helps you to compare your Portfolio’s ongoing expenses (but not transaction costs) with those of other mutual funds using the Portfolio’s actual expense ratio and a hypothetical rate of return of 5% per year before expenses. Examples using a 5% hypothetical Portfolio return may be found in the shareholder reports of other mutual funds. The hypothetical account values and expenses may not be used to estimate the actual ending account balance or expenses you paid for the period.
Please note that the expenses shown in these tables are meant to highlight your ongoing expenses only and do not reflect any transaction costs. The “Expenses Paid per $1,000” line of the tables is useful in comparing ongoing expenses only and will not help you determine the relative total expense of owning different funds. If these transaction costs had been included, your costs would have been higher.
Expenses and Value of a $1,000 Investment for the six months ended December 31, 2005
| | | | | | |
Actual Portfolio Return | | Class A | | Class B |
Beginning Account Value 7/1/05 | | $ | 1,000.00 | | $ | 1,000.00 |
Ending Account Value 12/31/05 | | $ | 1,012.00 | | $ | 1,010.00 |
Expenses Paid per $1,000* | | $ | 4.97 | | $ | 6.94 |
| | |
Hypothetical 5% Portfolio Return | | Class A | | Class B |
Beginning Account Value 7/1/05 | | $ | 1,000.00 | | $ | 1,000.00 |
Ending Account Value 12/31/05 | | $ | 1,020.27 | | $ | 1,018.30 |
Expenses Paid per $1,000* | | $ | 4.99 | | $ | 6.97 |
| * | Expenses are equal to the Portfolio’s annualized expense ratio for each share class, multiplied by the average account value over the period, multiplied by the number of days in the most recent six-month period, then divided by 365. |
| | | | | | |
Annualized Expense Ratios | | Class A | | | Class B | |
DWS Variable Series II — DWS MFS Strategic Value VIP | | .98 | % | | 1.37 | % |
For more information, please refer to the Portfolio’s prospectus.
These tables do not reflect charges and fees (“contract charges”) associated with the separate account that invests in the portfolio or any variable life insurance policy or variable annuity contract for which the portfolio is an investment option.
242
Management Summary December 31, 2005
DWS MFS Strategic Value VIP
For the 12 months ended December 31, 2005, DWS MFS Strategic Value VIP returned - -0.18% (Class A shares, unadjusted for contract charges). In comparison, the Portfolio’s benchmark, the Russell 1000 Value Index, returned 7.05%.
Relative to the Portfolio’s benchmark, the sectors that detracted most from the Portfolio’s performance during the period were utilities and communications, technology, basic materials, and leisure. Stock selection held back relative results in all four sectors.
In utilities and communications, our positions in power producer Calpine1 (which is not a benchmark constituent) and telecommunications services provider Verizon Communications, Inc. detracted from relative performance.
In technology, although our overweight2 position contributed to relative performance, this was offset by stock selection within the sector. Our holdings of network security software company Symantec Corp. and global telecom equipment maker Nortel Networks Corp. (which is not a constituent of the benchmark) held back relative returns.
In basic materials, our holdings in newsprint maker Bowater, Inc. detracted from relative returns as the stock underperformed the benchmark.
Finally, in the leisure sector, advertising and marketing services company Interpublic Group1 and media giant Viacom, Inc. “B” were among the Portfolio’s top detractors for the period.
Another holding that held back results during the period was Tenet Healthcare Corp., which is in the poorly performing health services sector. Manufacturing conglomerate Tyco International Ltd., and clothing retailer The Gap, Inc. (neither of which are benchmark constituents) also dampened investment results.
The top contributors to the Portfolio during the period were energy, autos and housing, and financial services. Stock selection in the energy sector helped boost relative results. Drilling rig operator GlobalSantaFe Corp., offshore drilling company Noble Corp., and oilfield services provider BJ Services Co. (none of which are benchmark constituents) were among the Portfolio’s top contributors. Our holdings in oil and gas producer Devon Energy Corp. and oil and gas equipment manufacturer Cooper Cameron Corp. also contributed to relative returns. Finally, although positive relative contribution from the autos and housing and financial services sectors resulted primarily from superior stock selection, no individual stocks within either sector were among the Portfolio’s top contributors.
Other investments that aided relative results included our overweight positions in software developer Compuware Corp., consumer electronics retailer Circuit City Stores, Inc., and cell phone manufacturer Nokia Oyj (which is not a benchmark constituent). Our avoidance of poor-performing pharmaceutical giant Pfizer1 and our underweight in General Electric1 also helped.
Kenneth J. Enright, CFA Alan T. Langsner
Portfolio Managers
Massachusetts Financial Services Company, Subadvisor to the Portfolio
All performance shown is historical, assumes reinvestment of all dividend and capital gain distributions and does not guarantee future results. Investment return and principal value fluctuate with changing market conditions so that, when redeemed, shares may be worth more or less than their original cost. Current performance may be lower or higher than the performance data quoted. Please visit www.dws-scudder.com for the Portfolio’s most recent month-end performance. Performance doesn’t reflect charges and fees (“contract charges”) associated with the separate account that invests in the Portfolio or any variable life insurance policy or variable annuity contract for which the Portfolio is an investment option. These charges and fees will reduce returns. While all share classes have the same underlying portfolio, their performance will differ.
Risk Considerations
The Portfolio is subject to stock market and equity risks, meaning stocks in the Portfolio may decline in value for extended periods of time due to the activities and financial prospects of individual companies, or due to general market and economic conditions. Please read this Portfolio’s prospectus for specific details regarding its investments and risk profile.
Russell 1000 Value Index is an unmanaged index, which consists of those stocks in the Russell 1000 Index with lower price-to-book ratios and lower forecasted-growth values.
Index returns assume reinvested dividends and, unlike portfolio returns, do not reflect any fees or expenses. It is not possible to invest directly into an index.
| 1 | Security was not held in the Portfolio at the end of the period. |
| 2 | “Overweight” means the Portfolio holds a higher weighting in a given sector or security than the benchmark. “Underweight” means the Portfolio holds a lower weighting. |
Portfolio management market commentary is as of December 31, 2005, and may not come to pass. This information is subject to change at any time based on market and other conditions.
243
Portfolio Summary
DWS MFS Strategic Value VIP
| | | | | | |
Asset Allocation | | 12/31/05 | | | 12/31/04 | |
Common Stocks | | 97 | % | | 97 | % |
Cash Equivalents | | 3 | % | | 3 | % |
| | | | | | |
| | 100 | % | | 100 | % |
| | | | | | |
| | | | | | |
Sector Diversification (As a % of Common Stocks) | | 12/31/05 | | | 12/31/04 | |
Financials | | 23 | % | | 21 | % |
Information Technology | | 17 | % | | 11 | % |
Consumer Discretionary | | 17 | % | | 14 | % |
Health Care | | 10 | % | | 14 | % |
Energy | | 9 | % | | 8 | % |
Telecommunication Services | | 9 | % | | 12 | % |
Industrials | | 7 | % | | 6 | % |
Materials | | 5 | % | | 8 | % |
Consumer Staples | | 3 | % | | 4 | % |
Utilities | | — | | | 2 | % |
| | | | | | |
| | 100 | % | | 100 | % |
| | | | | | |
Asset allocation and sector diversification are subject to change.
For more complete details about the Portfolio’s investment portfolio, see page 75. A quarterly Fact Sheet is available upon request. Information concerning portfolio holdings of the Portfolio as of month end will be posted to www.dws-scudder.com on the 15th of the following month.
Following the Portfolio’s fiscal first and third quarter-end, a complete portfolio holdings listing is filed with the SEC on Form N-Q. The form will be available on the SEC’s Web site at www.sec.gov, and it also may be reviewed and copied at the SEC’s Public Reference Room in Washington, D.C. Information on the operation of the SEC’s Public Reference Room may be obtained by calling (800) SEC-0330.
244
Investment Portfolio December 31, 2005
DWS MFS Strategic Value VIP
| | | | |
| | | Shares | | Value ($) |
Common Stocks 97.8% | | | | |
Consumer Discretionary 16.3% | | | | |
Hotels Restaurants & Leisure 0.6% | | | | |
International Game Technology | | 11,050 | | 340,119 |
| | | | |
Leisure Equipment & Products 1.2% | | | | |
Mattel, Inc. | | 47,780 | | 755,879 |
| | | | |
Media 7.5% | | | | |
Knight Ridder, Inc. | | 12,880 | | 815,304 |
Viacom, Inc. “B”* | | 62,735 | | 2,045,161 |
Walt Disney Co. | | 72,500 | | 1,737,825 |
| | | | |
| | | | 4,598,290 |
| | | | |
Multiline Retail 1.9% | | | | |
Family Dollar Stores, Inc. | | 46,430 | | 1,151,000 |
| | | | |
Specialty Retail 5.1% | | | | |
Circuit City Stores, Inc. | | 29,620 | | 669,116 |
OfficeMax, Inc. | | 36,470 | | 924,879 |
The Gap, Inc. | | 85,670 | | 1,511,219 |
| | | | |
| | | | 3,105,214 |
| | | | |
Consumer Staples 3.1% | | | | |
Beverages 0.5% | | | | |
Molson Coors Brewing Co. “B” | | 4,870 | | 326,241 |
| | | | |
Food & Staples Retailing 1.6% | | | | |
Wal-Mart Stores, Inc. | | 20,390 | | 954,252 |
| | | | |
Personal Products 1.0% | | | | |
Estee Lauder Companies, Inc. “A” | | 18,670 | | 625,072 |
| | | | |
Energy 9.1% | | | | |
Energy Equipment & Services 6.7% | | | | |
BJ Services Co. | | 19,640 | | 720,199 |
Cooper Cameron Corp.* | | 17,180 | | 711,252 |
GlobalSantaFe Corp. | | 29,880 | | 1,438,722 |
Noble Corp. | | 17,570 | | 1,239,387 |
| | | | |
| | | | 4,109,560 |
| | | | |
Oil, Gas & Consumable Fuels 2.4% | | | | |
Devon Energy Corp. | | 23,540 | | 1,472,192 |
| | | | |
Financials 22.7% | | | | |
Banks 8.2% | | | | |
Bank of America Corp. | | 52,968 | | 2,444,473 |
PNC Financial Services Group, Inc. | | 41,360 | | 2,557,289 |
| | | | |
| | | | 5,001,762 |
| | | | |
Capital Markets 5.4% | | | | |
Mellon Financial Corp. | | 60,310 | | 2,065,618 |
Merrill Lynch & Co., Inc. | | 18,340 | | 1,242,168 |
| | | | |
| | | | 3,307,786 |
| | | | |
Diversified Financial Services 4.5% | | | | |
JPMorgan Chase & Co. | | 68,940 | | 2,736,229 |
| | | | |
Insurance 4.6% | | | | |
Allstate Corp. | | 26,130 | | 1,412,849 |
245
| | | | | | |
| | | Shares | | | Value ($) | |
Conseco, Inc.* | | 61,290 | | | 1,420,089 | |
| | | | | 2,832,938 | |
| | | | | | |
Health Care 10.1% | | | | | | |
Health Care Providers & Services 2.1% | | | | | | |
Tenet Healthcare Corp.* | | 163,510 | | | 1,252,487 | |
| | | | | | |
Pharmaceuticals 8.0% | | | | | | |
Merck & Co., Inc. | | 77,070 | | | 2,451,597 | |
Wyeth | | 52,560 | | | 2,421,439 | |
| | | | | 4,873,036 | |
| | | | | | |
Industrials 6.4% | | | | | | |
Building Products 2.9% | | | | | | |
Masco Corp. | | 59,070 | | | 1,783,323 | |
| | | | | | |
Industrial Conglomerates 3.5% | | | | | | |
Tyco International Ltd. | | 73,250 | | | 2,113,995 | |
| | | | | | |
Information Technology 16.7% | | | | | | |
Communications Equipment 6.0% | | | | | | |
Nokia Oyj (ADR) | | 66,770 | | | 1,221,891 | |
Nortel Networks Corp.* | | 795,130 | | | 2,433,098 | |
| | | | | | |
| | | | | 3,654,989 | |
| | | | | | |
Computers & Peripherals 2.2% | | | | | | |
Sun Microsystems, Inc.* | | 327,160 | | | 1,370,800 | |
| | | | | | |
Software 8.5% | | | | | | |
Compuware Corp.* | | 148,550 | | | 1,332,494 | |
Oracle Corp.* | | 99,340 | | | 1,212,941 | |
Symantec Corp.* | | 152,260 | | | 2,664,550 | |
| | | | | | |
| | | | | 5,209,985 | |
| | | | | | |
Materials 5.1% | | | | | | |
Containers & Packaging 3.6% | | | | | | |
Owens-Illinois, Inc.* | | 103,830 | | | 2,184,583 | |
| | | | | | |
Paper & Forest Products 1.5% | | | | | | |
Bowater, Inc. | | 29,630 | | | 910,234 | |
| | | | | | |
Telecommunication Services 8.3% | | | | | | |
Diversified Telecommunication Services 4.4% | | | | | | |
Verizon Communications, Inc. | | 88,970 | | | 2,679,776 | |
| | | | | | |
Wireless Telecommunication Services 3.9% | | | | | | |
Sprint Nextel Corp. | | 102,980 | | | 2,405,613 | |
| | | | | | |
Total Common Stocks (Cost $55,570,227) | | | | | 59,755,355 | |
| | | | | | |
Cash Equivalents 2.7% | | | | | | |
Cash Management QP Trust, 4.26% (a) (Cost $1,629,434) | | 1,629,434 | | | 1,629,434 | |
| | | | | | |
| | |
| | | % of Net Assets | | | Value ($) | |
Total Investment Portfolio (Cost $57,199,661)+ | | 100.5 | | | 61,384,789 | |
Other Assets and Liabilities, Net | | (0.5 | ) | | (311,552 | ) |
Net Assets | | 100.0 | | | 61,073,237 | |
Notes to DWS MFS Strategic Value VIP Portfolio of Investments
| * | Non-income producing security. |
| + | The cost for federal income tax purposes was $57,606,036. At December 31, 2005, net unrealized appreciation for all securities based on tax cost was $3,778,753. This consisted of aggregate gross unrealized appreciation for all securities in which there was an excess of value over tax cost of $6,531,444 and aggregate gross unrealized depreciation for all securities in which there was an excess of tax cost over value of $2,752,691. |
| (a) | Cash Management QP Trust, an affiliated fund, is managed by Deutsche Investment Management Americas Inc. The rate shown is the annualized seven-day yield at period end. |
ADR: American Depositary Receipt
The accompanying notes are an integral part of the financial statements.
246
Financial Statements
Statement of Assets and Liabilities
as of December 31, 2005
| | | | |
Assets | | | | |
Investments: | | | | |
Investments in securities, at value (cost $55,570,227) | | $ | 59,755,355 | |
Investment in Cash Management QP Trust (cost $1,629,434) | | | 1,629,434 | |
Total investments in securities, at value (cost $57,199,661) | | | 61,384,789 | |
Cash | | | 10,000 | |
Dividends receivable | | | 94,091 | |
Interest receivable | | | 8,271 | |
Receivable for Portfolio shares sold | | | 354,503 | |
Due from Advisor | | | 12,389 | |
Other assets | | | 1,614 | |
| | | | |
Total assets | | | 61,865,657 | |
| | | | |
Liabilities | | | | |
Payable for investments purchased | | | 725,297 | |
Payable for Portfolio shares redeemed | | | 1,462 | |
Other accrued expenses and payables | | | 65,661 | |
Total liabilities | | | 792,420 | |
| | | | |
Net assets, at value | | $ | 61,073,237 | |
| | | | |
Net Assets | | | | |
Net assets consist of: | | | | |
Undistributed net investment income | | | 222 | |
Net unrealized appreciation (depreciation) on investments | | | 4,185,128 | |
Accumulated net realized gain (loss) | | | (1,022,384 | ) |
Paid-in capital | | | 57,910,271 | |
| | | | |
Net assets, at value | | $ | 61,073,237 | |
| | | | |
Class A | | | | |
Net Asset Value, offering and redemption price per share ($28,109,386 ÷ 2,624,466 outstanding shares of beneficial interest, $.01 par value, unlimited number of shares authorized) | | $ | 10.71 | |
| | | | |
Class B | | | | |
Net Asset Value, offering and redemption price per share ($32,963,851 ÷ 3,070,582 outstanding shares of beneficial interest, $.01 par value, unlimited number of shares authorized) | | $ | 10.74 | |
| | | | |
247
Statement of Operations
for the year ended December 31, 2005
| | | | |
Investment Income | | | | |
Income: | | | | |
Dividends (net of foreign taxes withheld of $5,814) | | $ | 837,523 | |
Interest — Cash Management QP Trust | | | 28,134 | |
Securities lending income, including income from Daily Assets Fund Institutional, net of borrower rebates | | | 24,752 | |
| | | | |
Total Income | | | 890,409 | |
| | | | |
Expenses: | | | | |
Management fee | | | 474,497 | |
Custodian and accounting fees | | | 85,073 | |
Distribution service fees (Class B) | | | 82,714 | |
Record keeping fees (Class B) | | | 48,429 | |
Auditing | | | 37,508 | |
Legal | | | 8,264 | |
Trustees’ fees and expenses | | | 1,568 | |
Reports to shareholders | | | 13,060 | |
Other | | | 6,107 | |
Total expenses before expense reductions | | | 757,220 | |
Expense reductions | | | (100,482 | ) |
Total expenses after expense reductions | | | 656,738 | |
| | | | |
Net investment income (loss) | | | 233,671 | |
| | | | |
Realized and Unrealized Gain (Loss) on Investment Transactions | | | | |
Net realized gain (loss) from: | | | | |
Investments | | | 1,240,183 | |
Net unrealized appreciation (depreciation) during the period on investments | | | (1,671,904 | ) |
| | | | |
Net gain (loss) on investment transactions | | | (431,721 | ) |
| | | | |
Net increase (decrease) in net assets resulting from operations | | $ | (198,050 | ) |
| | | | |
The accompanying notes are an integral part of the financial statements.
248
Statement of Changes in Net Assets
| | | | | | | | |
| | | Years Ended December 31, | |
Increase (Decrease) in Net Assets | | 2005 | | | 2004 | |
Operations: | | | | | | | | |
Net investment income (loss) | | $ | 233,671 | | | $ | 255,765 | |
Net realized gain (loss) on investment transactions | | | 1,240,183 | | | | 2,454,847 | |
Net unrealized appreciation (depreciation) during the period on investment transactions | | | (1,671,904 | ) | | | 3,679,166 | |
Net increase (decrease) in net assets resulting from operations | | | (198,050 | ) | | | 6,389,778 | |
Distributions to shareholders from: | | | | | | | | |
Net investment income: | | | | | | | | |
Class A | | | (253,570 | ) | | | (35,768 | ) |
Class B | | | (205,735 | ) | | | (15,246 | ) |
Net realized gains: | | | | | | | | |
Class A | | | (1,699,452 | ) | | | (4,650 | ) |
Class B | | | (2,844,831 | ) | | | (10,656 | ) |
Tax return of capital: | | | | | | | | |
Class A | | | (181,408 | ) | | | — | |
Class B | | | (283,355 | ) | | | — | |
Portfolio share transactions: | | | | | | | | |
| | |
Class A | | | | | | | | |
Proceeds from shares sold | | | 16,760,892 | | | | 7,917,703 | |
Reinvestment of distributions | | | 2,134,430 | | | | 40,418 | |
Cost of shares redeemed | | | (3,925,053 | ) | | | (1,562,312 | ) |
Net increase (decrease) in net assets from Class A share transactions | | | 14,970,269 | | | | 6,395,809 | |
| | |
Class B | | | | | | | | |
Proceeds from shares sold | | | 3,634,423 | | | | 18,488,884 | |
Reinvestment of distributions | | | 3,333,921 | | | | 25,902 | |
Cost of shares redeemed | | | (4,465,113 | ) | | | (1,646,414 | ) |
Net increase (decrease) in net assets from Class B share transactions | | | 2,503,231 | | | | 16,868,372 | |
Increase (decrease) in net assets | | | 11,807,099 | | | | 29,587,639 | |
Net assets at beginning of period | | | 49,266,138 | | | | 19,678,499 | |
| | | | | | | | |
Net assets at end of period (including undistributed net investment income of $222 and $250,729, respectively) | | $ | 61,073,237 | | | $ | 49,266,138 | |
| | | | | | | | |
| | |
Other Information | | | | | | | | |
Class A | | | | | | | | |
Shares outstanding at beginning of period | | | 1,271,678 | | | | 688,664 | |
Shares sold | | | 1,496,713 | | | | 725,099 | |
Shares issued to shareholders in reinvestment of distributions | | | 197,394 | | | | 3,864 | |
Shares redeemed | | | (341,319 | ) | | | (145,949 | ) |
Net increase (decrease) in Class A shares | | | 1,352,788 | | | | 583,014 | |
| | | | | | | | |
Shares outstanding at end of period | | | 2,624,466 | | | | 1,271,678 | |
| | | | | | | | |
Class B | | | | | | | | |
Shares outstanding at beginning of period | | | 2,837,941 | | | | 1,236,034 | |
Shares sold | | | 320,047 | | | | 1,749,677 | |
Shares issued to shareholders in reinvestment of distributions | | | 306,318 | | | | 2,474 | |
Shares redeemed | | | (393,724 | ) | | | (150,244 | ) |
Net increase (decrease) in Class B shares | | | 232,641 | | | | 1,601,907 | |
| | | | | | | | |
Shares outstanding at end of period | | | 3,070,582 | | | | 2,837,941 | |
| | | | | | | | |
The accompanying notes are an integral part of the financial statements.
249
Financial Highlights
Class A
| | | | | | | | | | | | | | | | |
Years Ended December 31, | | 2005 | | | 2004 | | | 2003 | | | 2002a | |
Selected Per Share Data | | | | | | | | | | | | | | | | |
Net asset value, beginning of period | | $ | 12.00 | | | $ | 10.24 | | | $ | 8.12 | | | $ | 10.00 | |
| | | | | | | | | | | | | | | | |
Income (loss) from investment operations: | | | | | | | | | | | | | | | | |
Net investment income (loss)b | | | .08 | | | | .11 | | | | .06 | | | | .05 | |
Net realized and unrealized gain (loss) on investment transactions | | | (.12 | ) | | | 1.71 | | | | 2.10 | | | | (1.93 | ) |
| | | | | | | | | | | | | | | | |
Total from investment operations | | | (.04 | ) | | | 1.82 | | | | 2.16 | | | | (1.88 | ) |
| | | | | | | | | | | | | | | | |
Less distributions from: | | | | | | | | | | | | | | | | |
Net investment income | | | (.16 | ) | | | (.05 | ) | | | (.04 | ) | | | — | |
Net realized gain on investment transactions | | | (.99 | ) | | | (.01 | ) | | | — | | | | — | |
Tax return of capital | | | (.10 | ) | | | — | | | | — | | | | — | |
| | | | | | | | | | | | | | | | |
Total distributions | | | (1.25 | ) | | | (.06 | ) | | | (.04 | ) | | | — | |
| | | | | | | | | | | | | | | | |
Net asset value, end of period | | $ | 10.71 | | | $ | 12.00 | | | $ | 10.24 | | | $ | 8.12 | |
| | | | | | | | | | | | | | | | |
Total Return (%)c | | | (.18 | ) | | | 17.82 | | | | 26.74 | | | | (18.80 | )** |
Ratios to Average Net Assets and Supplemental Data | | | | | | | | | | | | | | | | |
Net assets, end of period ($ millions) | | | 28 | | | | 15 | | | | 7 | | | | 5 | |
Ratio of expenses before expense reductions (%) | | | 1.25 | | | | 1.42 | | | | 1.93 | | | | 2.71 | * |
Ratio of expenses after expense reductions (%) | | | 1.05 | | | | 1.14 | | | | 1.15 | | | | 1.15 | * |
Ratio of net investment income (loss) (%) | | | .73 | | | | 1.05 | | | | .67 | | | | .82 | * |
Portfolio turnover rate (%) | | | 59 | | | | 54 | | | | 40 | | | | 7 | |
| a | For the period from May 1, 2002 (commencement of operations) to December 31, 2002. |
| b | Based on average shares outstanding during the period. |
| c | Total return would have been lower had certain expenses not been reduced. |
Class B
| | | | | | | | | | | | | | | | |
Years Ended December 31, | | 2005 | | | 2004 | | | 2003 | | | 2002a | |
Selected Per Share Data | | | | | | | | | | | | | | | | |
Net asset value, beginning of period | | $ | 11.98 | | | $ | 10.22 | | | $ | 8.11 | | | $ | 8.93 | |
| | | | | | | | | | | | | | | | |
Income (loss) from investment operations: | | | | | | | | | | | | | | | | |
Net investment income (loss)b | | | .04 | | | | .07 | | | | .02 | | | | .04 | |
Net realized and unrealized gain (loss) on investment transactions | | | (.12 | ) | | | 1.71 | | | | 2.11 | | | | (.86 | ) |
| | | | | | | | | | | | | | | | |
Total from investment operations | | | (.08 | ) | | | 1.78 | | | | 2.13 | | | | (.82 | ) |
| | | | | | | | | | | | | | | | |
Less distributions from: | | | | | | | | | | | | | | | | |
Net investment income | | | (.07 | ) | | | (.01 | ) | | | (.02 | ) | | | — | |
Net realized gain on investment transactions | | | (.99 | ) | | | (.01 | ) | | | — | | | | — | |
Tax return of capital | | | (.10 | ) | | | — | | | | — | | | | — | |
| | | | | | | | | | | | | | | | |
Total distributions | | | (1.16 | ) | | | (.02 | ) | | | (.02 | ) | | | — | |
| | | | | | | | | | | | | | | | |
Net asset value, end of period | | $ | 10.74 | | | $ | 11.98 | | | $ | 10.22 | | | $ | 8.11 | |
| | | | | | | | | | | | | | | | |
Total Return (%)c | | | (.60 | ) | | | 17.40 | | | | 26.35 | | | | (9.18 | )** |
Ratios to Average Net Assets and Supplemental Data | | | | | | | | | | | | | | | | |
Net assets, end of period ($ millions) | | | 33 | | | | 34 | | | | 13 | | | | .3 | |
Ratio of expenses before expense reductions (%) | | | 1.65 | | | | 1.79 | | | | 2.32 | | | | 2.96 | * |
Ratio of expenses after expense reductions (%) | | | 1.45 | | | | 1.52 | | | | 1.54 | | | | 1.40 | * |
Ratio of net investment income (loss) (%) | | | .33 | | | | .67 | | | | .28 | | | | .87 | * |
Portfolio turnover rate (%) | | | 59 | | | | 54 | | | | 40 | | | | 7 | |
| a | For the period from July 1, 2002 (commencement of operations of Class B shares) to December 31, 2002. |
| b | Based on average shares outstanding during the period. |
| c | Total return would have been lower had certain expenses not been reduced. |
250
Performance Summary December 31, 2005
DWS Mid Cap Growth VIP
All performance shown is historical, assumes reinvestment of all dividend and capital gain distributions and does not guarantee future results. Investment return and principal value fluctuate with changing market conditions so that, when redeemed, shares may be worth more or less than their original cost. Current performance may be lower or higher than the performance data quoted. Please visit www.dws-scudder.com for the Portfolio’s most recent month-end performance. Performance doesn’t reflect charges and fees (“contract charges”) associated with the separate account that invests in the Portfolio or any variable life insurance policy or variable annuity contract for which the Portfolio is an investment option. These charges and fees will reduce returns. While all share classes have the same underlying portfolio, their performance will differ.
This Portfolio is subject to stock market risk, meaning stocks in the portfolio may decline in value for extended periods of time due to the activities and financial prospects of individual companies, or due to general market and economic conditions. Please read this Portfolio’s prospectus for specific details regarding its investments and risk profile. In addition, this Portfolio is nondiversified and can take larger positions in fewer companies, increasing its overall potential risk.
Portfolio returns shown for all periods reflect a fee waiver and/or expense reimbursement. Without this waiver/reimbursement, returns would have been lower.
Growth of an Assumed $10,000 Investment in DWS Mid Cap Growth VIP from 5/1/1999 to 12/31/2005
¨ DWS Mid Cap Growth VIP — Class A
¨ Russell 3000 Growth Index
¨ S&P 500 Index
¨ Russell Mid Cap Growth Index
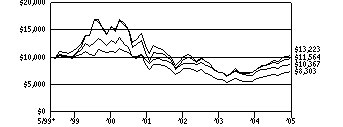
Yearly periods ended December 31
The Russell 3000 Growth Index is an unmanaged, capitalization-weighted index containing the growth stocks in the Russell 3000 Index with higher price-to-book ratios and higher forecasted growth values. The Standard & Poor’s (S&P) 500 Index is an unmanaged capitalization-weighted index of 500 stocks designed to measure performance of the broad domestic economy through changes in the aggregate market value of 500 stocks representing all major industries. Russell Midcap Growth Index is an unmanaged index that measures the performance of those Russell Midcap companies with higher price-to-book ratios and higher forecasted growth values. The stocks are also members of the Russell 1000 Growth Index.
Index returns assume reinvested dividends and, unlike Portfolio returns, do not reflect any fees or expenses. It is not possible to invest directly into an index.
Comparative Results
| | | | | | | | | | | | | | | | | | |
DWS Mid Cap Growth VIP | | 1-Year | | | 3-Year | | | 5-Year | | | Life of Portfolio* | |
Class A | | Growth of $10,000 | | $ | 11,504 | | | $ | 16,034 | | | $ | 8,698 | | | $ | 11,564 | |
| | Average annual total return | | | 15.04 | % | | | 17.04 | % | | | -2.75 | % | | | 2.21 | % |
Russell 3000 Growth Index | | Growth of $10,000 | | $ | 10,517 | | | $ | 14,728 | | | $ | 8,519 | | | $ | 8,303 | |
| | Average annual total return | | | 5.17 | % | | | 13.78 | % | | | -3.15 | % | | | -2.75 | % |
S&P 500 Index | | Growth of $10,000 | | $ | 10,491 | | | $ | 14,970 | | | $ | 10,275 | | | $ | 10,367 | |
| | Average annual total return | | | 4.91 | % | | | 14.39 | % | | | .54 | % | | | .54 | % |
Russell Mid Cap Growth Index | | Growth of $10,000 | | $ | 11,210 | | | $ | 18,474 | | | $ | 10,709 | | | $ | 13,223 | |
| | Average annual total return | | | 12.10 | % | | | 22.70 | % | | | 1.38 | % | | | 4.28 | % |
| | | | |
DWS Mid Cap Growth VIP | | | | | 1-Year | | | 3-Year | | | Life of Class** | |
Class B | | Growth of $10,000 | | | | | | $ | 11,465 | | | $ | 15,850 | | | $ | 15,061 | |
| | Average annual total return | | | | | | | 14.65 | % | | | 16.59 | % | | | 12.42 | % |
Russell 3000 Growth Index | | Growth of $10,000 | | | | | | $ | 10,517 | | | $ | 14,728 | | | $ | 13,340 | |
| | Average annual total return | | | | | | | 5.17 | % | | | 13.78 | % | | | 8.58 | % |
S&P 500 Index | | Growth of $10,000 | | | | | | $ | 10,491 | | | $ | 14,970 | | | $ | 13,428 | |
| | Average annual total return | | | | | | | 4.91 | % | | | 14.39 | % | | | 8.79 | % |
Russell Mid Cap Growth Index | | Growth of $10,000 | | | | | | $ | 11,210 | | | $ | 18,474 | | | $ | 16,702 | |
| | Average annual total return | | | | | | | 12.10 | % | | | 22.70 | % | | | 15.78 | % |
The growth of $10,000 is cumulative.
| * | The Portfolio commenced operations on May 1, 1999. Index returns begin April 30, 1999. |
| ** | The Portfolio commenced offering Class B shares on July 1, 2002. Index returns begin June 30, 2002. |
251
Information About Your Portfolio’s Expenses
DWS Mid Cap Growth VIP
As an investor of the Portfolio, you incur two types of costs: ongoing expenses and transaction costs. Ongoing expenses include management fees, distribution and service (12b-1) fees and other Portfolio expenses. Examples of transaction costs include sales charges (loads), redemption fees and account maintenance fees, which are not shown in this section. The following tables are intended to help you understand your ongoing expenses (in dollars) of investing in the Portfolio and to help you compare these expenses with the ongoing expenses of investing in other mutual funds. In the most recent six-month period, the Portfolio limited these expenses; had it not done so, expenses would have been higher. The tables are based on an investment of $1,000 made at the beginning of the six-month period ended December 31, 2005.
The tables illustrate your Portfolio’s expenses in two ways:
Actual Portfolio Return. This helps you estimate the actual dollar amount of ongoing expenses (but not transaction costs) paid on a $1,000 investment in the Portfolio using the Portfolio’s actual return during the period. To estimate the expenses you paid over the period, simply divide your account value by $1,000 (for example, an $8,600 account value divided by $1,000 = 8.6), then multiply the result by the number in the “Expenses Paid per $1,000” line under the share class you hold.
Hypothetical 5% Portfolio Return. This helps you to compare your Portfolio’s ongoing expenses (but not transaction costs) with those of other mutual funds using the Portfolio’s actual expense ratio and a hypothetical rate of return of 5% per year before expenses. Examples using a 5% hypothetical Portfolio return may be found in the shareholder reports of other mutual funds. The hypothetical account values and expenses may not be used to estimate the actual ending account balance or expenses you paid for the period.
Please note that the expenses shown in these tables are meant to highlight your ongoing expenses only and do not reflect any transaction costs. The “Expenses Paid per $1,000” line of the tables is useful in comparing ongoing expenses only and will not help you determine the relative total expense of owning different funds. If these transaction costs had been included, your costs would have been higher.
Expenses and Value of a $1,000 Investment for the six months ended December 31, 2005
| | | | | | |
Actual Portfolio Return | | Class A | | Class B |
Beginning Account Value 7/1/05 | | $ | 1,000.00 | | $ | 1,000.00 |
Ending Account Value 12/31/05 | | $ | 1,092.70 | | $ | 1,090.60 |
Expenses Paid per $1,000* | | $ | 5.01 | | $ | 6.90 |
| | |
Hypothetical 5% Portfolio Return | | Class A | | Class B |
Beginning Account Value 7/1/05 | | $ | 1,000.00 | | $ | 1,000.00 |
Ending Account Value 12/31/05 | | $ | 1,020.42 | | $ | 1,018.60 |
Expenses Paid per $1,000* | | $ | 4.84 | | $ | 6.67 |
| * | Expenses are equal to the Portfolio’s annualized expense ratio for each share class, multiplied by the average account value over the period, multiplied by the number of days in the most recent six-month period, then divided by 365. |
| | | | | | |
Annualized Expense Ratios | | Class A | | | Class B | |
DWS Variable Series II — DWS Mid Cap Growth VIP | | .95 | % | | 1.31 | % |
These tables do not reflect charges and fees (“contract charges”) associated with the separate account that invests in the portfolio or any variable life insurance policy or variable annuity contract for which the portfolio is an investment option.
For more information, please refer to the Portfolio’s prospectus.
These tables do not reflect charges and fees (“contract charges”) associated with the separate account that invests in the portfolio of any variable life insurance policy or variable annuity contract for which the portfolio is an investment option.
252
Management Summary December 31, 2005
DWS Mid Cap Growth VIP
For the 12-month period ended December 31, 2005, US the stock market was weighed down by concerns over rising interest rates and the possibility of a resurgence in inflation. On the plus side, the US economy appears to be somewhat stronger than what might be expected at this stage of an expansion. Gross domestic product has expanded for 16 consecutive quarters, beginning in the fourth quarter of 2001, and corporate profits are still increasing. Other positive signs in 2005 included increased business investment in capital projects and information technology. During the period, mid-cap stocks posted significantly higher returns than large-cap or small-cap stocks.
For its most recent fiscal year, the Portfolio returned 15.04% (Class A shares, unadjusted for contract charges), outperforming the 12.10% return of the Russell Midcap Growth Index.
During the 12-month period, stock selection within the financials and energy sectors boosted performance. In addition, our overweight in the health care area helped returns. Detractors from performance during the 12-month period included the Portfolio’s underweight in materials compared with the benchmark and stock selection in the information technology sector.
Samuel A. Dedio
Robert S. Janis
Co-Lead Portfolio Managers
Deutsche Investment Management Americas Inc.
All performance shown is historical, assumes reinvestment of all dividend and capital gain distributions, and does not guarantee future results. Investment return and principal value fluctuate with changing market conditions so that, when redeemed, shares may be worth more or less than their original cost. Current performance may be lower or higher than the performance data quoted. Please visit www.dws-scudder.com for the product’s most recent month-end performance. Performance doesn’t reflect charges and fees (“contract charges”) associated with the separate account that invests in the Portfolio or any variable life insurance policy or variable annuity contract for which the Portfolio is an investment option. These charges and fees will reduce returns.
Risk Considerations
This Portfolio is subject to stock market risk, meaning stocks in the Portfolio may decline in value for extended periods of time due to the activities and financial prospects of individual companies, or due to general market and economic conditions. It is nondiversified and can take larger positions in fewer companies, increasing its overall potential risk. In addition, this Portfolio is nondiversified and can take larger positions in fewer companies, increasing its overall potential risk. Please read this Portfolio’s prospectus for specific details regarding its investments and risk profile.
Russell Midcap Growth Index is an unmanaged index that measures the performance of those Russell Midcap companies with higher price-to-book ratios and higher forecasted growth values. The stocks are also members of the Russell 1000 Growth Index.
The Russell 3000 Growth Index is an unmanaged, capitalization-weighted index containing the growth stocks in the Russell 3000 Index with higher price-to-book ratios and higher forecasted growth values.
Mid-cap stocks are represented by the Russell Midcap Growth Index as defined above. Large-cap stocks are measured by the Russell 1000 Index which measures the performance of the 1,000 largest companies in the Russell 3000 Index. Small-cap stocks are measured by the Russell 2000 Index which is an unmanaged capitalization-weighted measure of approximately 2,000 of the smallest companies in the Russell 3000 Index.
Index returns assume reinvestment of dividends and, unlike portfolio returns, do not reflect any fees or expenses. It is not possible to invest directly into an index.
Portfolio management market commentary is as of December 31, 2005, and may not come to pass. This information is subject to change at any time based on market and other conditions.
253
Portfolio Summary
DWS Mid Cap Growth VIP
Asset Allocation (Excludes Securities Lending Collateral)
| | | | | | |
| | | 12/31/05 | | | 12/31/04 | |
Common Stocks | | 97 | % | | 97 | % |
Cash Equivalents | | 2 | % | | 3 | % |
Exchange Traded Funds | | 1 | % | | — | |
| | | | | | |
| | 100 | % | | 100 | % |
| | | | | | |
| | | | | | |
Sector Diversification (As a % of Common Stocks) | | 12/31/05 | | | 12/31/04 | |
Health Care | | 22 | % | | 26 | % |
Consumer Discretionary | | 22 | % | | 17 | % |
Information Technology | | 21 | % | | 25 | % |
Energy | | 11 | % | | 2 | % |
Industrials | | 10 | % | | 5 | % |
Financials | | 10 | % | | 13 | % |
Consumer Staples | | 3 | % | | 5 | % |
Telecommunication Services | | 1 | % | | 2 | % |
Materials | | — | | | 5 | % |
| | | | | | |
| | 100 | % | | 100 | % |
| | | | | | |
Asset allocation and sector diversification are subject to change.
For more complete details about the Portfolio’s investment portfolio, see page 86. A quarterly Fact Sheet is available upon request. Information concerning portfolio holdings of the Portfolio as of month end will be posted to www.dws-scudder.com on the 15th of the following month.
Following the Portfolio’s fiscal first and third quarter-end, a complete portfolio holdings listing is filed with the SEC on Form N-Q. The form will be available on the SEC’s Web site at www.sec.gov, and it also may be reviewed and copied at the SEC’s Public Reference Room in Washington, D.C. Information on the operation of the SEC’s Public Reference Room may be obtained by calling (800) SEC-0330.
254
Investment Portfolio December 31, 2005
DWS Mid Cap Growth VIP
| | | | |
| | | Shares | | Value ($) |
Common Stocks 97.0% | | | | |
Consumer Discretionary 21.0% | | | | |
Hotels Restaurants & Leisure 6.4% | | | | |
P.F. Chang’s China Bistro, Inc.* (a) | | 28,270 | | 1,403,040 |
Station Casinos, Inc. | | 18,920 | | 1,282,776 |
The Cheesecake Factory, Inc.* | | 38,920 | | 1,455,219 |
| | | | |
| | | | 4,141,035 |
| | | | |
Specialty Retail 6.1% | | | | |
Chico’s FAS, Inc.* | | 48,970 | | 2,151,252 |
Urban Outfitters, Inc.* (a) | | 68,900 | | 1,743,859 |
| | | | |
| | | | 3,895,111 |
| | | | |
Textiles, Apparel & Luxury Goods 8.5% | | | | |
Coach, Inc.* | | 56,600 | | 1,887,044 |
Polo Ralph Lauren Corp. | | 39,040 | | 2,191,706 |
Quicksilver, Inc.* (a) | | 97,860 | | 1,354,382 |
| | | | |
| | | | 5,433,132 |
| | | | |
Consumer Staples 3.0% | | | | |
Food & Staples Retailing 0.9% | | | | |
Herbalife Ltd.* (a) | | 18,200 | | 591,864 |
| | | | |
| | |
Household Products 2.1% | | | | |
Jarden Corp.* (a) | | 43,260 | | 1,304,289 |
| | | | |
| | |
Energy 10.7% | | | | |
Energy Equipment & Services 4.6% | | | | |
BJ Services Co. | | 24,450 | | 896,581 |
Noble Corp. | | 17,870 | | 1,260,550 |
Rowan Companies, Inc. | | 23,050 | | 821,502 |
| | | | |
| | | | 2,978,633 |
| | | | |
Oil, Gas & Consumable Fuels 6.1% | | | | |
Peabody Energy Corp. | | 24,320 | | 2,004,455 |
Ultra Petroleum Corp.* | | 33,630 | | 1,876,554 |
| | | | |
| | | | 3,881,009 |
| | | | |
Financials 9.2% | | | | |
Capital Markets 4.8% | | | | |
E*TRADE Financial Corp.* | | 86,010 | | 1,794,168 |
Legg Mason, Inc. | | 10,830 | | 1,296,243 |
| | | | |
| | | | 3,090,411 |
| | | | |
Diversified Financial Services 4.4% | | | | |
Affiliated Managers Group, Inc.*(a) | | 22,410 | | 1,798,403 |
Nuveen Investments “A” | | 23,900 | | 1,018,618 |
| | | | |
| | | | 2,817,021 |
| | | | |
Health Care 21.6% | | | | |
Biotechnology 6.1% | | | | |
Celgene Corp.* | | 26,690 | | 1,729,512 |
Genzyme Corp.* | | 17,840 | | 1,262,715 |
Invitrogen Corp.* | | 13,410 | | 893,643 |
| | | | |
| | | | 3,885,870 |
| | | | |
Health Care Equipment & Supplies 3.7% | | | | |
C.R. Bard, Inc. | | 18,040 | | 1,189,197 |
Fisher Scientific International, Inc.* | | 19,410 | | 1,200,702 |
| | | | |
| | | | 2,389,899 |
| | | | |
255
| | | | | | |
| | | Shares | | | Value ($) | |
Health Care Providers & Services 11.8% | | | | | | |
AMERIGROUP Corp.* | | 70,480 | | | 1,371,541 | |
Community Health Systems, Inc.* | | 33,510 | | | 1,284,773 | |
Coventry Health Care, Inc.* | | 28,180 | | | 1,605,133 | |
DaVita, Inc.* | | 26,760 | | | 1,355,126 | |
Omnicare, Inc. | | 33,550 | | | 1,919,731 | |
| | | | | | |
| | | | | 7,536,304 | |
| | | | | | |
Industrials 10.1% | | | | | | |
Construction & Engineering 1.1% | | | | | | |
Chicago Bridge & Iron Co., NV (New York Shares)(a) | | 28,260 | | | 712,435 | |
| | | | | | |
| | |
Electrical Equipment 3.7% | | | | | | |
Molex, Inc. “A” | | 39,490 | | | 971,059 | |
Roper Industries, Inc. | | 34,850 | | | 1,376,923 | |
| | | | | | |
| | | | | 2,347,982 | |
| | | | | | |
Machinery 5.3% | | | | | | |
Joy Global, Inc. | | 24,690 | | | 987,600 | |
Oshkosh Truck Corp. | | 30,580 | | | 1,363,562 | |
Terex Corp.* | | 17,940 | | | 1,065,636 | |
| | | | | | |
| | | | | 3,416,798 | |
| | | | | | |
Information Technology 20.3% | | | | | | |
Communications Equipment 2.0% | | | | | | |
Andrew Corp.* (a) | | 870 | | | 9,335 | |
Comverse Technologies, Inc.* | | 46,890 | | | 1,246,805 | |
| | | | | | |
| | | | | 1,256,140 | |
| | | | | | |
Computers & Peripherals 1.4% | | | | | | |
NCR Corp.* | | 26,720 | | | 906,877 | |
| | | | | | |
| | |
Electronic Equipment & Instruments 1.8% | | | | | | |
Cogent, Inc.* | | 51,300 | | | 1,163,484 | |
| | | | | | |
| | |
Internet Software & Services 1.5% | | | | | | |
VeriSign, Inc.* | | 44,770 | | | 981,358 | |
| | | | | | |
| | |
IT Consulting & Services 1.0% | | | | | | |
Cognizant Technology Solutions Corp. “A”* | | 12,650 | | | 636,927 | |
| | | | | | |
| | |
Semiconductors & Semiconductor Equipment 3.8% | | | | | | |
Broadcom Corp. “A”* | | 27,040 | | | 1,274,936 | |
Linear Technology Corp. | | 32,870 | | | 1,185,621 | |
| | | | | | |
| | | | | 2,460,557 | |
| | | | | | |
Software 8.8% | | | | | | |
Activision, Inc.* | | 88,743 | | | 1,219,329 | |
Business Objects SA (ADR)* (a) | | 36,430 | | | 1,472,136 | |
NAVTEQ Corp.* | | 29,900 | | | 1,311,713 | |
Salesforce.com, Inc.* (a) | | 50,750 | | | 1,626,538 | |
| | | | | | |
| | | | | 5,629,716 | |
| | | | | | |
Telecommunication Services 1.1% | | | | | | |
Wireless Telecommunication Services | | | | | | |
NII Holdings, Inc.* | | 15,860 | | | 692,765 | |
| | | | | | |
Total Common Stocks (Cost $49,404,421) | | | | | 62,149,617 | |
| | | | | | |
| | |
Exchange Traded Funds 1.5% | | | | | | |
iShares Russell Midcap Growth Index Fund (Cost $940,746) | | 10,200 | | | 958,392 | |
| | | | | | |
| | |
| | | Shares | | | Value ($) | |
Securities Lending Collateral 16.5% | | | | | | |
Daily Assets Fund Institutional, 4.28% (b) (c) (Cost $10,569,018) | | 10,569,018 | | | 10,569,018 | |
| | | | | | |
Cash Equivalents 2.0% | | | | | | |
Cash Management QP Trust, 4.26% (d) (Cost $1,293,926) | | 1,293,926 | | | 1,293,926 | |
| | | | | | |
| | | % of Net Assets | | | Value ($) | |
Total Investment Portfolio (Cost $62,208,111)+ | | 117.0 | | | 74,970,953 | |
Other Assets and Liabilities, Net | | (17.0 | ) | | (10,867,512 | ) |
| | | | | | |
Net Assets | | 100.0 | | | 64,103,441 | |
| | | | | | |
Notes to DWS Mid Cap Growth VIP Portfolio of Investments
| * | Non-income producing security. |
| + | The cost for federal income tax purposes was $62,302,764. At December 31, 2005, net unrealized appreciation for all securities based on tax cost was $12,668,189. This consisted of aggregate gross unrealized appreciation for all securities in which there was an excess of value over tax cost of $14,035,495 and aggregate gross unrealized depreciation for all securities in which there was an excess of tax cost over value of $1,367,306. |
| (a) | All or a portion of these securities were on loan (see Notes to Financial Statements). The value of all securities loaned at December 31, 2005 amounted to $10,219,659 which is 15.9% of net assets. |
| (b) | Daily Assets Fund Institutional, an affiliated fund, is managed by Deutsche Asset Management, Inc. The rate shown is the annualized seven-day yield at period end. |
| (c) | Represents collateral held in connection with securities lending. |
| (d) | Cash Management QP Trust, an affiliated fund, is managed by Deutsche Investment Management Americas Inc. The rate shown is the annualized seven-day yield at period end. |
| ADR: | American Depositary Receipt |
The accompanying notes are an integral part of the financial statements.
256
Financial Statements
Statement of Assets and Liabilities
as of December 31, 2005
| | | | |
Assets | | | | |
Investments: | | | | |
Investments in securities, at value (cost $50,345,167) — including $10,219,659 of securities loaned | | $ | 63,108,009 | |
Investment in Daily Assets Fund Institutional (cost $10,569,018)* | | | 10,569,018 | |
Investment in Cash Management QP Trust (cost $1,293,926) | | | 1,293,926 | |
Total investments in securities, at value (cost $62,208,111) | | | 74,970,953 | |
Receivable for investments sold | | | 265,389 | |
Dividends receivable | | | 7,098 | |
Interest receivable | | | 6,066 | |
Other assets | | | 1,758 | |
| | | | |
Total assets | | | 75,251,264 | |
| | | | |
Liabilities | | | | |
Payable for investments purchased | | | 391,707 | |
Payable for Portfolio shares redeemed | | | 101,569 | |
Payable upon return of securities loaned | | | 10,569,018 | |
Accrued management fee | | | 15,246 | |
Other accrued expenses and payables | | | 70,283 | |
| | | | |
Total liabilities | | | 11,147,823 | |
| | | | |
Net assets, at value | | $ | 64,103,441 | |
| | | | |
Net Assets | | | | |
Net assets consist of: | | | | |
Accumulated net investment loss | | | (4,048 | ) |
Net unrealized appreciation (depreciation) on investments | | | 12,762,842 | |
Accumulated net realized gain (loss) | | | (32,985,973 | ) |
Paid-in capital | | | 84,330,620 | |
| | | | |
Net assets, at value | | $ | 64,103,441 | |
| | | | |
| |
Class A | | | | |
Net Asset Value, offering and redemption price per share ($57,248,690 ÷ 5,056,911 outstanding shares of beneficial interest, $.01 par value, unlimited number of shares authorized) | | $ | 11.32 | |
| | | | |
| |
Class B | | | | |
Net Asset Value, offering and redemption price per share ($6,854,751 ÷ 612,639 outstanding shares of beneficial interest, $.01 par value, unlimited number of shares authorized) | | $ | 11.19 | |
| | | | |
| * | Represents collateral on securities loaned. |
257
Statement of Operations
| | | | |
for the year ended December 31, 2005 | | | | |
| |
Investment Income | | | | |
Income: | | | | |
Dividends (net of foreign taxes withheld of $127) | | $ | 221,238 | |
Interest — Cash Management QP Trust | | | 71,717 | |
Securities lending income, including income from Daily Assets Fund Institutional, net of borrower rebates | | | 11,833 | |
| | | | |
Total Income | | | 304,788 | |
| | | | |
Expenses: | | | | |
Management fee | | | 453,434 | |
Custodian and accounting fees | | | 71,985 | |
Distribution service fees (Class B) | | | 15,682 | |
Record keeping fees (Class B) | | | 9,109 | |
Auditing | | | 41,776 | |
Legal | | | 10,624 | |
Trustees’ fees and expenses | | | 4,499 | |
Reports to shareholders | | | 19,814 | |
Other | | | 6,634 | |
Total expenses before expense reductions | | | 633,557 | |
Expense reductions | | | (36,040 | ) |
Total expenses after expense reductions | | | 597,517 | |
| | | | |
Net investment income (loss) | | | (292,729 | ) |
| | | | |
Realized and Unrealized Gain (Loss) on Investment Transactions | | | | |
Net realized gain (loss) from investments | | | 6,195,328 | |
Net unrealized appreciation (depreciation) during the period on investments | | | 2,483,401 | |
| | | | |
Net gain (loss) on investment transactions | | | 8,678,729 | |
| | | | |
Net increase (decrease) in net assets resulting from operations | | $ | 8,386,000 | |
| | | | |
The accompanying notes are an integral part of the financial statements.
258
Statement of Changes in Net Assets
| | | | | | | | |
| | | Years Ended December 31, | |
Increase (Decrease) in Net Assets | | 2005 | | | 2004 | |
Operations: | | | | | | | | |
Net investment income (loss) | | $ | (292,729 | ) | | $ | (84,055 | ) |
Net realized gain (loss) on investment transactions | | | 6,195,328 | | | | 2,570,533 | |
Net unrealized appreciation (depreciation) during the period on investment transactions | | | 2,483,401 | | | | (452,406 | ) |
Net increase (decrease) in net assets resulting from operations | | | 8,386,000 | | | | 2,034,072 | |
Portfolio share transactions: | | | | | | | | |
Class A | | | | | | | | |
Proceeds from shares sold | | | 10,629,646 | | | | 4,965,372 | |
Cost of shares redeemed | | | (14,069,195 | ) | | | (9,699,886 | ) |
Net increase (decrease) in net assets from Class A share transactions | | | (3,439,549 | ) | | | (4,734,514 | ) |
Class B | | | | | | | | |
Proceeds from shares sold | | | 1,213,427 | | | | 2,601,994 | |
Cost of shares redeemed | | | (1,408,796 | ) | | | (435,771 | ) |
Net increase (decrease) in net assets from Class B share transactions | | | (195,369 | ) | | | 2,166,223 | |
Increase (decrease) in net assets | | | 4,751,082 | | | | (534,219 | ) |
Net assets at beginning of period | | | 59,352,359 | | | | 59,886,578 | |
| | | | | | | | |
Net assets at end of period (including accumulated net investment loss of $4,048 and $2,093, respectively) | | $ | 64,103,441 | | | $ | 59,352,359 | |
| | | | | | | | |
Other Information | | | | | | | | |
Class A | | | | | | | | |
Shares outstanding at beginning of period | | | 5,401,258 | | | | 5,923,874 | |
Shares sold | | | 1,010,050 | | | | 534,758 | |
Shares redeemed | | | (1,354,397 | ) | | | (1,057,374 | ) |
Net increase (decrease) in Class A shares | | | (344,347 | ) | | | (522,616 | ) |
| | | | | | | | |
Shares outstanding at end of period | | | 5,056,911 | | | | 5,401,258 | |
| | | | | | | | |
Class B | | | | | | | | |
Shares outstanding at beginning of period | | | 634,195 | | | | 405,258 | |
Shares sold | | | 115,791 | | | | 277,046 | |
Shares redeemed | | | (137,347 | ) | | | (48,109 | ) |
Net increase (decrease) in Class B shares | | | (21,556 | ) | | | 228,937 | |
| | | | | | | | |
| | | | | | | | |
Shares outstanding at end of period | | | 612,639 | | | | 634,195 | |
The accompanying notes are an integral part of the financial statements.
259
Financial Highlights
Class A
| | | | | | | | | | | | | | | | | | | | |
Years Ended December 31, | | 2005 | | | 2004 | | | 2003 | | | 2002 | | | 2001 | |
Selected Per Share Data | |
Net asset value, beginning of period | | $ | 9.84 | | | $ | 9.46 | | | $ | 7.06 | | | $ | 10.22 | | | $ | 13.20 | |
| | | | | | | | | | | | | | | | | | | | |
Income (loss) from investment operations: | | | | | | | | | | | | | | | | | | | | |
Net investment income (loss)a | | | (.05 | ) | | | (.01 | ) | | | (.05 | ) | | | (.01 | ) | | | .06 | |
Net realized and unrealized gain (loss) on investment transactions | | | 1.53 | | | | .39 | | | | 2.45 | | | | (3.11 | ) | | | (2.92 | ) |
Total from investment operations | | | 1.48 | | | | .38 | | | | 2.40 | | | | (3.12 | ) | | | (2.86 | ) |
Less distributions from: | | | | | | | | | | | | | | | | | | | | |
Net investment income | | | — | | | | — | | | | — | | | | (.04 | ) | | | (.12 | ) |
| | | | | | | | | | | | | | | | | | | | |
Net asset value, end of period | | $ | 11.32 | | | $ | 9.84 | | | $ | 9.46 | | | $ | 7.06 | | | $ | 10.22 | |
| | | | | | | | | | | | | | | | | | | | |
Total Return (%) | | | 15.04 | b | | | 4.02 | b | | | 33.99 | b | | | (30.66 | ) | | | (21.76 | ) |
Ratios to Average Net Assets and Supplemental Data | | | | | | | | | | | | | | | | | | | | |
Net assets, end of period ($ millions) | | | 57 | | | | 53 | | | | 56 | | | | 44 | | | | 71 | |
Ratio of expenses before expense reductions (%) | | | 1.01 | | | | 1.02 | | | | .98 | | | | .81 | | | | .86 | |
Ratio of expenses after expense reductions (%) | | | .95 | | | | .95 | | | | .95 | | | | .81 | | | | .86 | |
Ratio of net investment income (%) | | | (.45 | ) | | | (.11 | ) | | | (.57 | ) | | | (.19 | ) | | | .58 | |
Portfolio turnover rate (%) | | | 104 | | | | 103 | | | | 91 | | | | 71 | | | | 42 | |
| a | Based on average shares outstanding during the period. |
| b | Total return would have been lower had certain expenses not been reduced. |
Class B
| | | | | | | | | | | | | | | | |
Years Ended December 31, | | 2005 | | | 2004 | | | 2003 | | | 2002a | |
Selected Per Share Data | | | | | | | | | | | | | | | | |
Net asset value, beginning of period | | $ | 9.76 | | | $ | 9.42 | | | $ | 7.06 | | | $ | 7.43 | |
| | | | | | | | | | | | | | | | |
Income (loss) from investment operations: | | | | | | | | | | | | | | | | |
Net investment income (loss)b | | | (.09 | ) | | | (.05 | ) | | | (.09 | ) | | | (.02 | ) |
Net realized and unrealized gain (loss) on investment transactions | | | 1.52 | | | | .39 | | | | 2.45 | | | | (.35 | ) |
Total from investment operations | | | 1.43 | | | | .34 | | | | 2.36 | | | | (.37 | ) |
| | | | | | | | | | | | | | | | |
Net asset value, end of period | | $ | 11.19 | | | $ | 9.76 | | | $ | 9.42 | | | $ | 7.06 | |
| | | | | | | | | | | | | | | | |
Total Return (%) | | | 14.65 | c | | | 3.61 | c | | | 33.43 | c | | | (4.98 | )** |
Ratios to Average Net Assets and Supplemental Data | | | | | | | | | | | | | | | | |
Net assets, end of period ($ millions) | | | 7 | | | | 6 | | | | 4 | | | | .1 | |
Ratio of expenses before expense reductions (%) | | | 1.40 | | | | 1.41 | | | | 1.37 | | | | 1.06 | * |
Ratio of expenses after expense reductions (%) | | | 1.32 | | | | 1.34 | | | | 1.34 | | | | 1.06 | * |
Ratio of net investment income (%) | | | (.82 | ) | | | (.50 | ) | | | (.96 | ) | | | (.47 | )* |
Portfolio turnover rate (%) | | | 104 | | | | 103 | | | | 91 | | | | 71 | |
| a | For the period from July 1, 2002 (commencement of operations of Class B shares) to December 31, 2002. |
| b | Based on average shares outstanding during the period. |
| c | Total return would have been lower had certain expenses not been reduced. |
260
Performance Summary December 31, 2005
DWS Moderate Allocation VIP
All performance shown is historical, assumes reinvestment of all dividend and capital gain distributions and does not guarantee future results. Investment return and principal value fluctuate with changing market conditions so that, when redeemed, shares may be worth more or less than their original cost. Current performance may be lower or higher than the performance data quoted. Please visit www.dws-scudder.com for the Portfolio’s most recent month-end performance. Performance doesn’t reflect charges and fees (“contract charges”) associated with the separate account that invests in the Portfolio or any variable life insurance policy or variable annuity contract for which the Portfolio is an investment option. These charges and fees will reduce returns.
Diversification does not eliminate risk. The underlying portfolios invest in individual bonds whose yields and market values fluctuate, so that your investment may be worth more or less than its original cost. Bond investments are subject to interest-rate risk such that when interest rates rise, the prices of the bonds, and thus the value of the bond portfolio, can decline and the investor can lose principal value. In addition, the underlying portfolios are subject to stock market risk, meaning stocks in the Portfolio may decline in value for extended periods of time due to the activities and financial prospects of individual companies, or due to general market and economic conditions. Investing in foreign securities presents certain unique risks not associated with domestic investments, such as currency fluctuation, political and economic changes, and market risks. Derivatives may be more volatile and less liquid than traditional securities, and the Portfolio could suffer losses on its derivative positions. Please read this Portfolio’s prospectus for specific details regarding its risk profile.
Portfolio returns shown for all periods reflect a fee waiver and/or expense reimbursement. Without this waiver/reimbursement, returns would have been lower.
Growth of an Assumed $10,000 Investment in DWS Moderate Allocation VIP from 8/16/2004 to 12/31/2005
¨ DWS Moderate Allocation VIP — Class B
¨ Russell 1000 Index
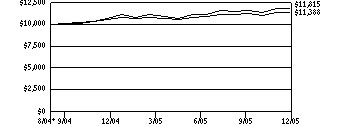
The Russell 1000 Index is an unmanaged index that measures the performance of the 1,000 largest companies in the Russell 3000 Index, which measures the performance of the 3,000 largest US companies based on total market capitalization. The Russell 1000 Index represents approximately 92% of the total market capitalization of the Russell 3000 Index. Index returns assume reinvested dividends and unlike Portfolio returns, do not reflect any fees or expenses. It is not possible to invest directly into an index.
Comparative Results
| | | | | | | | | | |
DWS Moderate Allocation VIP | | 1-Year | | | Life of
Portfolio* | |
Class B | | Growth of $10,000 | | $ | 10,506 | | | $ | 11,388 | |
| | Average annual total return | | | 5.06 | % | | | 9.94 | % |
Russell 1000 Index | | Growth of $10,000 | | $ | 10,627 | | | $ | 11,815 | |
| | Average annual total return | | | 6.27 | % | | | 13.33 | % |
The growth of $10,000 is cumulative.
| * | The Portfolio commenced operations on August 16, 2004. Index returns begin August 31, 2004. |
261
Information About Your Portfolio’s Expenses
DWS Moderate Allocation VIP
As an investor of the Portfolio, you incur two types of costs: ongoing expenses and transaction costs. Ongoing expenses include management fees, distribution and service (12b-1) fees and other Portfolio expenses. Examples of transaction costs include sales charges (loads), redemption fees and account maintenance fees, which are not shown in this section. The following tables are intended to help you understand your ongoing expenses (in dollars) of investing in the Portfolio and to help you compare these expenses with the ongoing expenses of investing in other mutual funds. In addition to the ongoing expenses which the Portfolio bears directly, the Portfolio’s shareholders indirectly bear the expense of the Underlying DWS Portfolios in which the Portfolio invests. The Portfolio’s estimated indirect expense from investing in the Underlying DWS Portfolios is based on its allocation of Underlying DWS Portfolios. In the most recent six-month period, the Portfolio limited these expenses; had it not done so, expenses would have been higher. The tables are based on an investment of $1,000 made at the beginning of the six-month period ended December 31, 2005.
The tables illustrate your Portfolio’s expenses in two ways:
Actual Portfolio Return. This helps you estimate the actual dollar amount of ongoing expenses (but not transaction costs) paid on a $1,000 investment in the Portfolio using the Portfolio’s actual return during the period. To estimate the expenses you paid over the period, simply divide your account value by $1,000 (for example, an $8,600 account value divided by $1,000 = 8.6), then multiply the result by the number in the “Expenses Paid per $1,000” line under the share class you hold.
Hypothetical 5% Portfolio Return. This helps you to compare your Portfolio’s ongoing expenses (but not transaction costs) with those of other mutual funds using the Portfolio’s actual expense ratio and a hypothetical rate of return of 5% per year before expenses. Examples using a 5% hypothetical Portfolio return may be found in the shareholder reports of other mutual funds. The hypothetical account values and expenses may not be used to estimate the actual ending account balance or expenses you paid for the period.
Please note that the expenses shown in these tables are meant to highlight your ongoing expenses only and do not reflect any transaction costs. The “Expenses Paid per $1,000” line of the tables is useful in comparing ongoing expenses only and will not help you determine the relative total expense of owning different funds. If these transaction costs had been included, your costs would have been higher.
Direct Portfolio Expenses and Value of a $1,000 Investment for the six months ended December 31, 2005
| | | |
Actual Portfolio Return | | Class B |
Beginning Account Value 7/1/05 | | $ | 1,000.00 |
Ending Account Value 12/31/05 | | $ | 1,043.10 |
Expenses Paid per $1,000* | | $ | 3.04 |
| |
Hypothetical 5% Portfolio Return | | Class B |
Beginning Account Value 7/1/05 | | $ | 1,000.00 |
Ending Account Value 12/31/05 | | $ | 1,022.23 |
Expenses Paid per $1,000* | | $ | 3.01 |
Direct Portfolio Expenses and Estimated Indirect Underlying DWS Portfolio Expenses and Value of a $1,000 Investment for the six months ended December 31, 2005
| | | |
Actual Portfolio Return | | Class B |
Beginning Account Value 7/1/05 | | $ | 1,000.00 |
Ending Account Value 12/31/05 | | $ | 1,043.10 |
Expenses Paid per $1,000** | | $ | 6.39 |
| |
Hypothetical 5% Portfolio Return | | Class B |
Beginning Account Value 7/1/05 | | $ | 1,000.00 |
Ending Account Value 12/31/05 | | $ | 1,018.95 |
Expenses Paid per $1,000** | | $ | 6.31 |
| * | Expenses are equal to the Portfolio’s annualized expense ratio for each share class, multiplied by the average account value over the period, multiplied by the number of days in the most recent six-month period, then divided by 365. |
| ** | Expenses are equal to the Portfolio’s annualized expense ratio for each class plus the estimated indirect expense from investing in underlying portfolios in which the Portfolio invests, multiplied by the average account value over the period, multiplied by the number of days in the most recent six-month period, then divided by 365. |
| | | |
Annualized Expense Ratios | | Class B | |
Direct Portfolio Expense Ratio | | .59 | % |
Estimated Indirect Expenses of Underlying DWS Portfolios | | .65 | % |
Estimated Net Annual Portfolio and Underlying DWS Portfolios Expenses | | 1.24 | % |
For more information, please refer to the Portfolio’s prospectus.
These tables do not reflect charges and fees (“contract charges”) associated with the separate account that invests in the portfolio or any variable life insurance policy or variable annuity contract for which the portfolio is an investment option.
262
Management Summary December 31, 2005
DWS Moderate Allocation VIP
The US economy posted positive growth for all four quarters of 2005, with concerns about inflation and the sustainability of the economic expansion seeming to abate as the year progressed. All major asset classes — equities, bonds and cash — had positive returns for the year, and returns of the various asset classes were generally close to one another.
For the 12 months ended December 31, 2005, DWS Moderate Allocation VIP portfolio had a return of 5.06% (Class B shares, unadjusted for contract charges). As anticipated, since this Portfolio invests in a blend of equity and bond securities, its return was above that of its major bond benchmarks but below that of its equity benchmarks. This performance placed the Portfolio slightly ahead of its average peer in the Lipper Flexible Portfolio Funds category, which had an average return of 4.88%.
The Portfolio’s allocation between stocks and bonds remained close to its target of 60% equity and 40% fixed income during 2005, but with equities above 60% in 11 months of the year. This overweight was positive for returns, as equities outperformed bonds. An especially positive factor in performance was an overweight in international equities through most of the year, as foreign markets were stronger than the US market; however, a reduction in the international position late in the year detracted.
In the equity portion of the Portfolio, a slight bias toward value-oriented holdings established in July detracted from performance. Among underlying equity portfolios, large-cap portfolios contributed to positive relative performance, with seven of the 10 portfolios achieving performance above that of the Russell 1000 Index. Several of the growth-oriented portfolios that were overweight in energy, a sector that was strong during 2005, performed particularly well. The two small-cap funds in the Portfolio outperformed their benchmarks, so that small cap holdings made a net contribution to overall performance, even though small-cap stocks as a category underperformed large-cap stocks.
Within the fixed-income portion of the Portfolio, performance of the high-yield portion was excellent, with returns significantly above the high-yield benchmark, the Credit Suisse High Yield Index. However, since this is a small position that was underweighted, the strong performance did not offset underperformance of the much larger investment-grade bond portion, so that the fixed-income position as a whole underperformed its benchmark.
Inna Okounkova Robert Wang
Co-Managers, Deutsche Investment Management Americas Inc.
All performance shown is historical, assumes reinvestment of all dividend and capital gain distributions, and does not guarantee future results. Investment return and principal value fluctuate with changing market conditions so that, when redeemed, shares may be worth more or less than their original cost. Current performance may be lower or higher than the performance data quoted. Please visit www.dws-scudder.com for the product’s most recent month-end performance. Performance doesn’t reflect charges and fees (“contract charges”) associated with the separate account that invests in the Portfolio or any variable life insurance policy or variable annuity contract for which the Portfolio is an investment option. These charges and fees will reduce returns.
Risk Considerations
Diversification does not eliminate risk. The underlying portfolios invest in individual bonds whose yields and market values fluctuate, so that your investment may be worth more or less than its original cost. Bond investments are subject to interest-rate risk such that when interest rates rise, the prices of the bonds, and thus the value of the bond investment, can decline and the investor can lose principal value. In addition, the underlying portfolios are subject to stock market risk, meaning stocks in the portfolio may decline in value for extended periods of time due to the activities and financial prospects of individual companies, or due to general market and economic conditions. Investing in foreign securities presents certain unique risks not associated with domestic investments, such as currency fluctuation, political and economic changes, and market risks. Derivatives may be more volatile and less liquid than traditional securities, and the portfolio could suffer losses on its derivative positions. Please read this Portfolio’s prospectus for specific details regarding its risk profile.
The Russell 1000 Index is an unmanaged index that measures the performance of the 1,000 largest companies in the Russell 3000 Index, which represents approximately 92% of the total market capitalization of the Russell 3000 Index.
Credit Suisse (CS) First Boston High Yield Index is an unmanaged, unleveraged, trader-priced portfolio constructed to mirror the global high-yield debt market. Index returns assume reinvestment of dividends and, unlike fund returns, do not reflect any fees or expenses.
The Lipper Flexible Portfolio is a category that allocates its investments across various asset classes, including domestic common stocks, bonds, and money market insturments with a focus on total return.
Equities are represented by the Russell 1000 Index, which is a price-only index of the 1,000 largest capitalized companies domiciled in the United States. Bonds are represented by the Lehman Brothers Aggregate Bond Index which measures domestic taxable investment-grade bonds. Cash is represented by the rate of return of 3-month Treasury bills.
Index and category returns assume reinvestment of all dividends and, unlike portfolio returns, do not reflect any fees or expenses. It is not possible to invest directly into an index or Lipper category.
Portfolio management market commentary is as of December 31, 2005, and may not come to pass. This information is subject to change at any time based on market and other conditions.
263
Portfolio Summary
DWS Moderate Allocation VIP
| | | | | | |
Asset Allocation | | 12/31/05 | | | 12/31/04 | |
Equity Funds | | 60 | % | | 58 | % |
Fixed Income Funds | | 29 | % | | 38 | % |
Cash Equivalents | | 11 | % | | 4 | % |
| | | | | | |
| | 100 | % | | 100 | % |
| | | | | | |
Asset allocation is subject to change.
For more complete details about the Portfolio’s investment portfolio, see page 96. A quarterly Fact Sheet is available upon request. Information concerning portfolio holdings of the Portfolio as of month end will be posted to www.dws-scudder.com on the 15th of the following month.
Following the Portfolio’s fiscal first and third quarter-end, a complete portfolio holdings listing is filed with the SEC on Form N-Q. The form will be available on the SEC’s Web site at www.sec.gov, and it also may be reviewed and copied at the SEC’s Public Reference Room in Washington, D.C. Information on the operation of the SEC’s Public Reference Room may be obtained by calling (800) SEC-0330.
264
Investment Portfolio December 31, 2005
DWS Moderate Allocation VIP
| | | | |
| | | Shares | | Value ($) |
Equity Funds 59.5% | | | | |
DWS Blue Chip VIP “A” | | 840,830 | | 12,511,544 |
DWS Capital Growth VIP “A” | | 337,469 | | 5,703,230 |
DWS Davis Venture Value VIP “A” | | 536,700 | | 6,703,384 |
DWS Dreman High Return Equity VIP “A” | | 350,496 | | 4,700,158 |
DWS Dreman Small Cap Value VIP “A” | | 371,736 | | 7,427,278 |
DWS Global Opportunities VIP “A” | | 5,445 | | 81,671 |
DWS Growth and Income VIP “A” | | 1,911,866 | | 18,583,339 |
DWS International Select Equity VIP “A” | | 40,472 | | 536,254 |
DWS International VIP “A” | | 436,857 | | 4,739,902 |
DWS Janus Growth Opportunities VIP “A” | | 942,397 | | 7,878,440 |
DWS Large Cap Value VIP “A” | | 883,489 | | 13,967,956 |
DWS MFS Strategic Value VIP “A” | | 623,059 | | 6,672,962 |
DWS Mid Cap Growth VIP “A” | | 77,142 | | 873,249 |
DWS RREEF Real Estate Securities VIP “A” | | 214,172 | | 3,550,965 |
DWS Small Cap Growth VIP “A” | | 337,202 | | 4,545,478 |
DWS Templeton Foreign Value VIP “A” | | 297,684 | | 3,402,532 |
| | | | |
Total Equity Funds (Cost $96,148,648) | | | | 101,878,342 |
| | | | |
Fixed Income Funds 29.1% | | | | |
DWS Core Fixed Income VIP “A” | | 3,599,831 | | 42,513,999 |
DWS Government & Agency Securities VIP “A” | | 246,429 | | 3,021,225 |
DWS High Income VIP “A” | | 415,441 | | 3,419,079 |
DWS Strategic Income VIP “A” | | 74,236 | | 853,713 |
| | | | |
Total Fixed Income Funds (Cost $49,933,898) | | | | 49,808,016 |
| | | | |
Cash Equivalents 11.3% | | | | |
Cash Management QP Trust, 4.26% (a) (Cost $19,440,002) | | 19,440,002 | | 19,440,002 |
| | | | |
| | |
| | | % of Net Assets | | Value ($) |
Total Investment Portfolio (Cost $165,522,548)+ | | 99.9 | | 171,126,360 |
| | | | |
Other Assets and Liabilities, Net | | 0.1 | | 188,848 |
| | | | |
Net Assets | | 100.0 | | 171,315,208 |
| | | | |
Notes to DWS Moderate Allocation VIP Portfolio of Investments
| + | The cost for federal income tax purposes was $165,567,138. At December 31, 2005, net unrealized appreciation for all securities based on tax cost was $5,559,222. This consisted of aggregate gross unrealized appreciation for all securities in which there was an excess of value over tax cost of $6,083,940 and aggregate gross unrealized depreciation for all securities in which there was an excess of tax cost over value of $524,718. |
| (a) | Cash Management QP Trust, an affiliated fund, is managed by Deutsche Investment Management Americas Inc. The rate shown is the annualized seven-day yield at period end. |
The accompanying notes are an integral part of the financial statements.
265
Financial Statements
Statement of Assets and Liabilities
as of December 31, 2005
| | | |
Assets | | | |
Investments: | | | |
Investments in Underlying Affiliated Portfolios, at value (cost $146,082,546) | | $ | 151,686,358 |
Investment in Cash Management QP Trust (cost $19,440,002) | | | 19,440,002 |
Total investments in securities, at value (cost $165,522,548) | | | 171,126,360 |
Interest receivable | | | 59,192 |
Receivable for Portfolio shares sold | | | 259,669 |
Other assets | | | 3,513 |
Total assets | | | 171,448,734 |
Liabilities | | | |
Payable for Portfolio shares redeemed | | | 12,988 |
Accrued management fee | | | 7,382 |
| | | |
Other accrued expenses and payables | | | 113,156 |
Total liabilities | | | 133,526 |
| | | |
Net assets, at value | | $ | 171,315,208 |
| | | |
Net Assets | | | |
Net assets consist of: | | | |
Undistributed net investment income | | | 1,492,734 |
Net unrealized appreciation (depreciation) on investments | | | 5,603,812 |
Accumulated net realized gain (loss) | | | 1,155,890 |
Paid-in capital | | | 163,062,772 |
| | | |
Net assets, at value | | $ | 171,315,208 |
| | | |
Class B | | | |
Net Asset Value, offering and redemption price per share ($171,315,208 ÷ 15,061,439 outstanding shares of beneficial interest, $.01 par value, unlimited number of shares authorized) | | $ | 11.37 |
| | | |
266
Statement of Operations
for the year ended December 31, 2005
| | | | |
Investment Income | |
Income: | | | | |
Income distributions from Underlying Affiliated Portfolios | | $ | 1,438,898 | |
Interest — Cash Management QP Trust | | | 315,569 | |
Total Income | | | 1,754,467 | |
Expenses: | | | | |
Management fee | | | 149,056 | |
Custodian and accounting fees | | | 79,998 | |
Distribution service fees (Class B) | | | 248,426 | |
Record keeping fees (Class B) | | | 134,933 | |
Auditing | | | 18,287 | |
Legal | | | 14,616 | |
Trustees’ fees and expenses | | | 2,605 | |
Reports to shareholders | | | 7,053 | |
Offering costs | | | 587 | |
Other | | | 1,900 | |
Total expenses before expense reductions | | | 657,461 | |
Expense reductions | | | (49,685 | ) |
Total expenses after expense reductions | | | 607,776 | |
| | | | |
Net investment income (loss) | | | 1,146,691 | |
| | | | |
Realized and Unrealized Gain (Loss) on Investment Transactions | | | | |
Net realized gain (loss) from investments | | | 628,433 | |
Capital gain distributions from Underlying Affiliated Portfolios | | | 886,546 | |
| | | | |
| | | 1,514,979 | |
| | | | |
Net unrealized appreciation (depreciation) during the period on investments | | | 4,147,334 | |
| | | | |
Net gain (loss) on investment transactions | | | 5,662,313 | |
| | | | |
Net increase (decrease) in net assets resulting from operations | | $ | 6,809,004 | |
| | | | |
The accompanying notes are an integral part of the financial statements.
267
Statement of Changes in Net Assets
| | | | | | | | |
Increase (Decrease) in Net Assets | | Year Ended
December 31,
2005 | | | Period Ended
December 31,
2004a | |
Operations: | | | | | | | | |
Net investment income (loss) | | $ | 1,146,691 | | | $ | (42,492 | ) |
Net realized gain (loss) on investment transactions | | | 1,514,979 | | | | 99,609 | |
Net unrealized appreciation (depreciation) during the period on investment transactions | | | 4,147,334 | | | | 1,456,478 | |
Net increase (decrease) in net assets resulting from operations | | | 6,809,004 | | | | 1,513,595 | |
Distributions to shareholders from: | | | | | | | | |
Net realized gains: | | | | | | | | |
Class B | | | (98,563 | ) | | | — | |
Portfolio share transactions: | | | | | | | | |
Class B | | | | | | | | |
Proceeds from shares sold | | | 129,422,492 | | | | 37,742,213 | |
Reinvestment of distributions | | | 98,563 | | | | — | |
Cost of shares redeemed | | | (3,450,269 | ) | | | (721,827 | ) |
Net increase (decrease) in net assets from Class B share transactions | | | 126,070,786 | | | | 37,020,386 | |
Increase (decrease) in net assets | | | 132,781,227 | | | | 38,533,981 | |
Net assets at beginning of period | | | 38,533,981 | | | | — | |
| | | | | | | | |
Net assets at end of period (including undistributed net investment income of $1,492,734 and $0, respectively) | | $ | 171,315,208 | | | $ | 38,533,981 | |
| | | | | | | | |
Other Information | | | | | | | | |
Class B Shares outstanding at beginning of period | | | 3,555,593 | | | | — | |
Shares sold | | | 11,805,548 | | | | 3,624,260 | |
Shares issued to shareholders in reinvestment of distributions | | | 9,229 | | | | — | |
Shares redeemed | | | (308,931 | ) | | | (68,667 | ) |
Net increase (decrease) in Class B shares | | | 11,505,846 | | | | 3,555,593 | |
| | | | | | | | |
Shares outstanding at end of period | | | 15,061,439 | | | | 3,555,593 | |
| | | | | | | | |
| a | For the period from August 16, 2004 (commencement of operations) to December 31, 2004. |
The accompanying notes are an integral part of the financial statements.
268
Financial Highlights
Class B
| | | | | | | | |
Years Ended December 31, | | 2005 | | | 2004a | |
Selected Per Share Data | | | | | | | | |
Net asset value, beginning of period | | $ | 10.84 | | | $ | 10.00 | |
| | | | | | | | |
Income (loss) from investment operations: | | | | | | | | |
Net investment income (loss)b | | | .12 | | | | (.03 | ) |
Net realized and unrealized gain (loss) on investment transactions | | | .43 | | | | .87 | |
Total from investment operations | | | .55 | | | | .84 | |
Less distributions from: | | | | | | | | |
Net realized gains | | | (.02 | ) | | | — | |
| | | | | | | | |
Net asset value, end of period | | $ | 11.37 | | | $ | 10.84 | |
| | | | | | | | |
Total Return (%)c,d | | | 5.06 | | | | 8.40 | ** |
Ratios to Average Net Assets and Supplemental Data | | | | | | | | |
Net assets, end of period ($ millions) | | | 171 | | | | 39 | |
Ratio of expenses before expense reductions (%)e | | | .66 | | | | 1.53 | * |
Ratio of expenses after expense reductions (%)e | | | .61 | | | | .75 | * |
Ratio of net investment income (%) | | | 1.15 | | | | (.68 | )* |
Portfolio turnover rate (%) | | | 14 | | | | 13 | * |
| a | For the period from August 16, 2004 (commencement of operations) to December 31, 2004. |
| b | Based on average shares outstanding during the period. |
| c | Total return would have been lower had certain expenses not been reduced. |
| d | Total return would have been lower if the Advisor had not maintained some Underlying Portfolio’s expenses. |
| e | The Portfolio invests in other DWS Portfolios and indirectly bears its proportionate share of fees and expenses incurred by the Underlying DWS Portfolios in which the Portfolio is invested. |
269
Performance Summary December 31, 2005
DWS Money Market VIP
All performance shown is historical, assumes reinvestment of all dividend and capital gain distributions and does not guarantee future results. Investment return and principal value fluctuate with changing market conditions so that, when redeemed, shares may be worth more or less than their original cost. Current performance may be lower or higher than the performance data quoted. Please visit www.dws-scudder.com for the Portfolio’s most recent month-end performance. Performance doesn’t reflect charges and fees (“contract charges”) associated with the separate account that invests in the Portfolio or any variable life insurance policy or variable annuity contract for which the Portfolio is an investment option. These charges and fees will reduce returns. While all share classes have the same underlying portfolio, their performance will differ.
Risk Considerations
An investment in this Portfolio is not insured or guaranteed by the Federal Deposit Insurance Corporation or by any other government agency. Although the Portfolio seeks to preserve the value of your investment at $1.00 per share, it is possible to lose money by investing in the Portfolio. Please read this Portfolio’s prospectus for specific details regarding its investment and risk profile.
| | | | | | |
Portfolio’s Class A Shares Yield | | 7-day current yield | | | 7-day compounded effective yield | |
December 31, 2005 | | 3.74 | % | | 3.81 | % |
December 31, 2004 | | 1.62 | % | | 1.63 | % |
| | | | | | |
Portfolio’s Class B Shares Yield | | 7-day current yield | | | 7-day compounded effective yield | |
December 31, 2005 | | 3.38 | % | | 3.43 | % |
December 31, 2004 | | 1.24 | % | | 1.25 | % |
Yields are historical, will fluctuate and do not guarantee future performance. The 7-day current yield refers to the income paid by the Portfolio over a 7-day period expressed as an annual percentage rate of the Portfolio’s shares outstanding. The 7-day compounded effective yield is the annualized yield based on the most recent 7 days of interest earnings with all income reinvested.
270
Information About Your Portfolio’s Expenses
DWS Money Market VIP
As an investor of the Portfolio, you incur two types of costs: ongoing expenses and transaction costs. Ongoing expenses include management fees, distribution and service (12b-1) fees and other Portfolio expenses. Examples of transaction costs include sales charges (loads), redemption fees and account maintenance fees, which are not shown in this section. The following tables are intended to help you understand your ongoing expenses (in dollars) of investing in the Portfolio and to help you compare these expenses with the ongoing expenses of investing in other mutual funds. The tables are based on an investment of $1,000 made at the beginning of the six-month period ended December 31, 2005.
The tables illustrate your Portfolio’s expenses in two ways:
Actual Portfolio Return. This helps you estimate the actual dollar amount of ongoing expenses (but not transaction costs) paid on a $1,000 investment in the Portfolio using the Portfolio’s actual return during the period. To estimate the expenses you paid over the period, simply divide your account value by $1,000 (for example, an $8,600 account value divided by $1,000 = 8.6), then multiply the result by the number in the “Expenses Paid per $1,000” line under the share class you hold.
Hypothetical 5% Portfolio Return. This helps you to compare your Portfolio’s ongoing expenses (but not transaction costs) with those of other mutual funds using the Portfolio’s actual expense ratio and a hypothetical rate of return of 5% per year before expenses. Examples using a 5% hypothetical Portfolio return may be found in the shareholder reports of other mutual funds. The hypothetical account values and expenses may not be used to estimate the actual ending account balance or expenses you paid for the period.
Please note that the expenses shown in these tables are meant to highlight your ongoing expenses only and do not reflect any transaction costs. The “Expenses Paid per $1,000” line of the tables is useful in comparing ongoing expenses only and will not help you determine the relative total expense of owning different funds. If these transaction costs had been included, your costs would have been higher.
Expenses and Value of a $1,000 Investment for the six months ended December 31, 2005
| | | | | | |
Actual Portfolio Return | | Class A | | Class B |
Beginning Account Value 7/1/05 | | $ | 1,000.00 | | $ | 1,000.00 |
Ending Account Value 12/31/05 | | $ | 1,016.50 | | $ | 1,014.60 |
Expenses Paid per $1,000* | | $ | 2.69 | | $ | 4.57 |
| | |
Hypothetical 5% Portfolio Return | | Class A | | Class B |
Beginning Account Value 7/1/05 | | $ | 1,000.00 | | $ | 1,000.00 |
Ending Account Value 12/31/05 | | $ | 1,022.53 | | $ | 1,020.67 |
Expenses Paid per $1,000* | | $ | 2.70 | | $ | 4.58 |
| * | Expenses are equal to the Portfolio’s annualized expense ratio for each share class, multiplied by the average account value over the period, multiplied by the number of days in the most recent six-month period, then divided by 365. |
| | | | | | |
Annualized Expense Ratios | | Class A | | | Class B | |
DWS Variable Series II — DWS Money Market VIP | | .53 | % | | .90 | % |
For more information, please refer to the Portfolio’s prospectus.
These tables do not reflect charges and fees (“contract charges”) associated with the separate account that invests in the portfolio or any variable life insurance policy or variable annuity contract for which the portfolio is an investment option.
271
Management Summary December 31, 2005
DWS Money Market VIP
During the 12-month period ended December 31, 2005, the US Federal Reserve Board (the Fed) continued its recent policy of increasing short-term interest rates in an attempt to head off a resurgence in inflation. The federal funds rate1 was raised to 4.25% in eight quarter-percentage-point increments in 2005. At the end of December 2005, the one-year LIBOR rate, an industry standard for measuring one-year money market rates, was close to a four-year high, at 4.84%.
For the 12-month period ended December 31, 2005, the Portfolio provided a total return of 2.80% (Class A shares, unadjusted for contract charges). Please see page 100 for standardized performance as of December 31, 2005.
For the period, our strategy was to keep the Portfolio’s average maturity relatively short in order to reduce risk, generally limiting our purchases to three-month-maturity issues and shorter. (Shorter-term securities are generally less risky than longer-term securities and are therefore potentially more attractive in a difficult environment.) From time to time, when the market offered more attractive yields at longer maturities, we added some longer-term issues. During the period, we maintained a target allocation of approximately 25% to 30% in floating-rate securities. Our decision to maintain this allocation helped performance during the period. There were no significant detractors from performance. Going forward, we will continue our insistence on the highest credit quality within the Portfolio and maintain our conservative investment strategies and standards.
A group of investment professionals is responsible for the day-to-day management of the Portfolio. These investment professionals have a broad range of experience managing money market funds.
Deutsche Investment Management Americas Inc.
All performance shown is historical, assumes reinvestment of all dividend and capital gain distributions and does not guarantee future results. Investment return and principal value fluctuate with changing market conditions so that, when redeemed, shares may be worth more or less than their original cost. Current performance may be lower or higher than the performance data quoted. Please visit www.dws-scudder.com for the Portfolio’s most recent month-end performance. Performance doesn’t reflect charges and fees (“contract charges”) associated with the separate account that invests in the Portfolio or any variable life insurance policy or variable annuity contract for which the Portfolio is an investment option. These charges and fees will reduce returns. The yield quotation more closely reflects the current earnings of the Portfolio than the total return quotation.
Risk Considerations
An investment in this Portfolio is not insured or guaranteed by the Federal Deposit Insurance Corporation or by any other government agency. Although the Portfolio seeks to preserve the value of your investment at $1.00 per share, it is possible to lose money by investing in the Portfolio. Please read this Portfolio’s prospectus for specific details regarding its investment and risk profile.
LIBOR, the London Interbank Offered Rate, is the most widely used benchmark or reference rate for short-term interest rates. LIBOR is the rate of interest at which banks borrow funds from other banks, in large volume, in the international market.
| 1 | Federal funds rate — the overnight rate charged by banks when they borrow money from each other. Set by the Federal Open Market Committee (FOMC), the fed funds rate is the most sensitive — and closely watched — indicator concerning the direction of short-term interest rates. The FOMC is a key committee within the US Federal Reserve System, and meets every six weeks to review Fed policy on short-term rates. Based on current Fed policy, the FOMC may choose to raise or lower the fed funds rate to either add liquidity to the economy or remove it. |
Portfolio management market commentary is as of December 31, 2005, and may not come to pass. This information is subject to change at any time based on market and other conditions.
272
Portfolio Summary
DWS Money Market VIP
| | | | | | |
Asset Allocation | | 12/31/05 | | | 12/31/04 | |
Commercial Paper | | 32 | % | | 41 | % |
Short Term Notes | | 30 | % | | 22 | % |
Certificates of Deposit and Bank Notes | | 25 | % | | 12 | % |
Repurchase Agreements | | 7 | % | | 8 | % |
Funding Agreement | | 4 | % | | 3 | % |
US Government Sponsored Agencies*** | | 2 | % | | 11 | % |
Promissory Notes | | — | | | 3 | % |
| | | | | | |
| | 100 | % | | 100 | % |
| | | | | | |
| *** | Not backed by the full faith and credit of the US Government. |
| | | | |
Weighted Average Maturity* | | | | |
DWS Variable Series II — DWS Money Market VIP | | 35 days | | 30 days |
First Tier Money Fund Average | | 38 days | | 36 days |
| * | The Portfolio is compared to its respective iMoneyNet category: Category includes only non-government retail funds that are not holding any second tier securities. Portfolio Holdings of First Tier funds include US Other Repos, Time Deposits, Domestic Bank Obligations, Foreign Bank Obligations, First Tier CP, Floating Rate Notes and Asset backed Commercial Paper. |
Asset allocation and weighted average maturity are subject to change.
For more complete details about the Portfolio’s investment portfolio, see page 104. A quarterly Fact Sheet is available upon request. Information concerning portfolio holdings of the Portfolio as of month end will be posted to www.dws-scudder.com on the 15th day of the following month.
Following the Portfolio’s fiscal first and third quarter-end, a complete portfolio holdings listing is filed with the SEC on Form N-Q. The form will be available on the SEC’s Web site at www.sec.gov, and it also may be reviewed and copied at the SEC’s Public Reference Room in Washington, D.C. Information on the operation of the SEC’s Public Reference Room may be obtained by calling (800) SEC-0330.
273
Investment Portfolio December 31, 2005
DWS Money Market VIP
| | | | |
| | | Principal Amount ($) | | Value ($) |
Certificates of Deposit and Bank Notes 25.2% |
Banco Bilbao Vizcaya Argentaria SA, 4.055%, 1/11/2006 | | 14,000,000 | | 13,998,762 |
Bank of Tokyo-Mitsubishi, 4.38%, 1/17/2006 | | 15,000,000 | | 15,000,000 |
Depfa Bank PLC, 3.22%, 2/6/2006 | | 3,000,000 | | 3,000,000 |
HBOS Treasury Services PLC, 3.8%, 7/10/2006 | | 3,000,000 | | 3,000,000 |
Norinchukin Bank: | | | | |
4.3%, 1/25/2006 | | 6,000,000 | | 6,000,000 |
4.3%, 1/31/2006 | | 9,000,000 | | 9,000,000 |
Societe Generale, 3.265%, 3/3/2006 | | 3,000,000 | | 3,000,000 |
Toronto Dominion Bank, 3.75%, 5/16/2006 | | 3,000,000 | | 2,999,891 |
UniCredito Italiano SpA, 3.8%, 6/15/2006 | | 3,000,000 | | 3,000,000 |
Wells Fargo Bank NA, 4.31%, 1/26/2006 | | 15,000,000 | | 15,000,000 |
| | | | |
Total Certificates of Deposit and Bank Notes (Cost $73,998,653) | | | | 73,998,653 |
| | | | |
Commercial Paper** 32.0% | | | | |
Abbey National PLC, 4.45%, 1/3/2006 | | 14,000,000 | | 13,996,539 |
Atlantis One Funding Corp., 3.93%, 3/1/2006 | | 3,000,000 | | 2,980,678 |
CIT Group, Inc., 4.21%, 2/8/2006 | | 14,000,000 | | 13,937,786 |
Giro Funding US Corp., 4.33%, 1/27/2006 | | 12,000,000 | | 11,962,473 |
Greyhawk Funding LLC, 4.205%, 2/1/2006 | | 14,000,000 | | 13,949,306 |
Lake Constance Funding LLC, 3.99%, 1/3/2006 | | 12,000,000 | | 11,997,340 |
Liberty Street Funding, 4.36%, 2/2/2006 | | 8,000,000 | | 7,968,996 |
Perry Global Funding LLC, Series A, 4.31%, 1/26/2006 | | 14,000,000 | | 13,958,097 |
Swedish National Housing Finance Corp., 3.925%, 3/2/2006 | | 3,000,000 | | 2,980,375 |
| | | | |
Total Commercial Paper (Cost $93,731,590) | | | | 93,731,590 |
| | | | |
US Government Sponsored Agencies*** 2.1% | | | | |
Federal National Mortgage Association: | | | | |
4.0%, 8/8/2006 | | 3,000,000 | | 3,000,000 |
4.03%, 7/21/2006 | | 3,000,000 | | 3,000,000 |
| | | | |
Total US Government Sponsored Agencies (Cost $6,000,000) | | | | 6,000,000 |
| | | | |
Funding Agreement 4.1% | | | | |
New York Life Insurance Co., 4.57%*, 9/19/2006 (Cost $12,000,000) | | 12,000,000 | | 12,000,000 |
| | | | |
Short Term Notes* 30.0% | | | | |
American Express Credit Corp., 4.32%, 1/9/2007 | | 6,000,000 | | 5,999,349 |
American Honda Finance Corp., 4.461%, 6/22/2006 | | 2,000,000 | | 2,000,000 |
BNP Paribas, 144A, 4.349%, 1/26/2007 | | 3,000,000 | | 3,000,000 |
Canadian Imperial Bank of Commerce, 4.5%, 12/4/2006 | | 6,000,000 | | 6,003,836 |
Greenwich Capital Holdings, Inc., 4.33%, 6/20/2006 | | 11,000,000 | | 11,000,000 |
International Business Machines Corp., 144A, 4.329%, 3/8/2006 | | 3,000,000 | | 3,000,000 |
K2 (USA) LLC, 4.32%, 2/1/2006 | | 16,000,000 | | 16,000,665 |
Links Finance LLC, 4.325%, 5/22/2006 | | 6,000,000 | | 5,999,762 |
M&I Marshall & Ilsley Bank, 144A, 4.349%, 12/15/2006 | | 4,000,000 | | 4,000,000 |
Merrill Lynch & Co., Inc.: | | | | |
4.36%, 5/5/2006 | | 3,000,000 | | 3,000,820 |
4.547%, 3/17/2006 | | 10,000,000 | | 10,001,500 |
Skandinaviska Enskila Banken, 144A, 4.38%, 7/18/2006 | | 3,000,000 | | 3,000,000 |
Tango Finance Corp., 144A, 4.08%, 9/18/2006 | | 15,000,000 | | 14,999,715 |
| | | | |
Total Short Term Notes (Cost $88,005,647) | | | | 88,005,647 |
| | | | |
Repurchase Agreements 6.5% | | | | |
State Street Bank & Trust Co., 3.20%, dated 12/30/2005, to be repurchased at $190,068 on 1/3/2006 (a) | | 190,000 | | 190,000 |
The Goldman Sachs Co., Inc., 4.33%, dated 12/30/2005, to be repurchased at $19,009,141 on 1/3/2006 (b) | | 19,000,000 | | 19,000,000 |
| | | | |
Total Repurchase Agreements (Cost $19,190,000) | | | | 19,190,000 |
| | | | |
| | | % of Net Assets | | Value ($) |
Total Investment Portfolio (Cost $292,925,890)+ | | 99.9 | | 292,925,890 |
| | | | |
Other Assets and Liabilities, Net | | 0.1 | | 287,145 |
| | | | |
Net Assets | | 100.0 | | 293,213,035 |
| | | | |
Notes to DWS Money Market VIP Portfolio of Investments
| + | The cost for federal income tax purposes was $292,925,890. |
| * | Floating rate notes are securities whose yields vary with a designated market index or market rate, such as the coupon-equivalent of the US Treasury bill rate. These securities are shown at their current rate as of December 31, 2005. |
| ** | Annualized yield at time of purchase; not a coupon rate. |
| *** | Not backed by the full faith and credit of the US Government. |
| (a) | Collateralized by $200,000 Federal Home Loan Mortgage Corp., Zero Coupon, maturing on 5/2/2006 with a value of $196,966. |
| (b) | Collateralized by $19,379,990, Federal National Mortgage Association, with various coupon rates from 3.88-4.91%, and various maturity dates from 10/1/2034 to 10/1/2035 with a value of $19,380,000. |
144A: Security exempt from registration under Rule 144A of the Securities Act of 1933. These securities may be resold in transactions exempt from registration, normally to qualified institutional buyers.
The accompanying notes are an integral part of the financial statements.
274
Financial Statements
Statement of Assets and Liabilities
as of December 31, 2005
| | | | |
Assets | | | | |
Investments: | | | | |
Investments in securities, at amortized cost (cost $273,735,890) | | $ | 273,735,890 | |
Repurchase agreements, at amortized cost (cost $19,190,000) | | | 19,190,000 | |
Total investments in securities, at amortized cost (cost $292,925,890) | | | 292,925,890 | |
Cash | | | 235 | |
Interest receivable | | | 957,625 | |
Receivable for Portfolio shares sold | | | 324,766 | |
Other assets | | | 8,798 | |
Total assets | | | 294,217,314 | |
Liabilities | | | | |
Dividends payable | | | 472,726 | |
Payable for Portfolio shares redeemed | | | 307,476 | |
Accrued management fee | | | 114,865 | |
Other accrued expenses and payables | | | 109,212 | |
| | | | |
Total liabilities | | | 1,004,279 | |
| | | | |
Net assets, at value | | $ | 293,213,035 | |
| | | | |
Net Assets | | | | |
Net assets consist of: | | | | |
Accumulated distributions in excess of net investment income | | | (40,899 | ) |
Paid-in capital | | | 293,253,934 | |
| | | | |
Net assets, at value | | $ | 293,213,035 | |
| | | | |
Class A | | | | |
Net Asset Value, offering and redemption price per share ($234,968,082 ÷ 235,000,612 outstanding shares of beneficial interest, $.01 par value, unlimited number of shares authorized) | | $ | 1.00 | |
Class B | | | | |
Net Asset Value, offering and redemption price per share ($58,244,953 ÷ 58,249,841 outstanding shares of beneficial interest, $.01 par value, unlimited number of shares authorized) | | $ | 1.00 | |
275
Statement of Operations
for the year ended December 31, 2005
| | | | |
Investment Income | | | | |
Income: | | | | |
Interest | | $ | 10,304,352 | |
Expenses: | | | | |
Management fee | | | 1,440,420 | |
Custodian fees | | | 21,483 | |
Distribution service fees (Class B) | | | 140,673 | |
Record keeping fees (Class B) | | | 68,021 | |
Auditing | | | 41,630 | |
Legal | | | 12,884 | |
Trustees’ fee and expenses | | | 12,637 | |
Reports to shareholders | | | 91,640 | |
Other | | | 17,743 | |
Total expenses, before expense reductions | | | 1,847,131 | |
Expense reductions | | | (5,083 | ) |
| | | | |
Total expenses, after expense reductions | | | 1,842,048 | |
| | | | |
Net investment income (loss) | | | 8,462,304 | |
Net realized gain (loss) on investment transactions | | | 1,179 | |
| | | | |
Net increase (decrease) in net assets resulting from operations | | $ | 8,463,483 | |
| | | | |
The accompanying notes are an integral part of the financial statements.
276
Statement of Changes in Net Assets
| | | | | | | | |
| | | Years Ended December 31, | |
Increase (Decrease) in Net Assets | | 2005 | | | 2004 | |
Operations: | | | | | | | | |
Net investment income | | $ | 8,462,304 | | | $ | 3,038,989 | |
Net realized gain (loss) on investment transactions | | | 1,179 | | | | 3,830 | |
Net increase (decrease) in net assets resulting from operations | | | 8,463,483 | | | | 3,042,819 | |
Distributions to shareholders from: | | | | | | | | |
Net investment income: | | | | | | | | |
Class A | | | (7,099,842 | ) | | | (2,746,531 | ) |
Class B | | | (1,362,462 | ) | | | (313,926 | ) |
Portfolio share transactions: | | | | | | | | |
Class A | | | | | | | | |
Proceeds from shares sold | | | 227,608,429 | | | | 220,350,001 | |
Reinvestment of distributions | | | 6,884,287 | | | | 2,679,083 | |
Cost of shares redeemed | | | (240,799,854 | ) | | | (308,224,544 | ) |
Net increase (decrease) in net assets from Class A share transactions | | | (6,307,138 | ) | | | (85,195,460 | ) |
Class B | | | | | | | | |
Proceeds from shares sold | | | 83,177,262 | | | | 69,563,948 | |
Reinvestment of distributions | | | 1,303,053 | | | | 295,489 | |
Cost of shares redeemed | | | (78,947,805 | ) | | | (83,569,264 | ) |
Net increase (decrease) in net assets from Class B share transactions | | | 5,532,510 | | | | (13,709,827 | ) |
Increase (decrease) in net assets | | | (773,449 | ) | | | (98,922,925 | ) |
Net assets at beginning of period | | | 293,986,484 | | | | 392,909,409 | |
| | | | | | | | |
Net assets at end of period (including accumulated distributions in excess of net investment income of $40,899 and $42,078, respectively) | | $ | 293,213,035 | | | $ | 293,986,484 | |
| | | | | | | | |
Other Information | | | | | | | | |
Class A | | | | | | | | |
Shares outstanding at beginning of period | | | 241,307,750 | | | | 326,503,210 | |
Shares sold | | | 227,608,429 | | | | 220,350,001 | |
Shares issued to shareholders in reinvestment of distributions | | | 6,884,287 | | | | 2,679,083 | |
Shares redeemed | | | (240,799,854 | ) | | | (308,224,544 | ) |
Net increase (decrease) in Class A shares | | | (6,307,138 | ) | | | (85,195,460 | ) |
| | | | | | | | |
Shares outstanding at end of period | | | 235,000,612 | | | | 241,307,750 | |
| | | | | | | | |
Class B | | | | | | | | |
Shares outstanding at beginning of period | | | 52,717,331 | | | | 66,427,158 | |
Shares sold | | | 83,177,262 | | | | 69,563,948 | |
Shares issued to shareholders in reinvestment of distributions | | | 1,303,053 | | | | 295,489 | |
Shares redeemed | | | (78,947,805 | ) | | | (83,569,264 | ) |
Net increase (decrease) in Class B shares | | | 5,532,510 | | | | (13,709,827 | ) |
| | | | | | | | |
Shares outstanding at end of period | | | 58,249,841 | | | | 52,717,331 | |
| | | | | | | | |
The accompanying notes are an integral part of the financial statements.
277
Financial Highlights
Class A
| | | | | | | | | | | | | | | | | | | | |
Years Ended December 31, | | 2005 | | | 2004 | | | 2003 | | | 2002 | | | 2001 | |
Selected Per Share Data | | | | | | | | | | | | | | | | | | | | |
Net asset value, beginning of period | | $ | 1.000 | | | $ | 1.000 | | | $ | 1.000 | | | $ | 1.000 | | | $ | 1.000 | |
| | | | | | | | | | | | | | | | | | | | |
Income from investment operations: | | | | | | | | | | | | | | | | | | | | |
Net investment income | | | .028 | | | | .009 | | | | .007 | | | | .013 | | | | .037 | |
Total from investment operations | | | .028 | | | | .009 | | | | .007 | | | | .013 | | | | .037 | |
Less distributions from: | | | | | | | | | | | | | | | | | | | | |
Net investment income | | | (.028 | ) | | | (.009 | ) | | | (.007 | ) | | | (.013 | ) | | | (.037 | ) |
| | | | | | | | | | | | | | | | | | | | |
Net asset value, end of period | | $ | 1.000 | | | $ | 1.000 | | | $ | 1.000 | | | $ | 1.000 | | | $ | 1.000 | |
| | | | | | | | | | | | | | | | | | | | |
Total Return (%) | | | 2.80 | | | | .91 | | | | .72 | | | | 1.35 | | | | 3.75 | |
Ratios to Average Net Assets and Supplemental Data | | | | | | | | | | | | | | | | | | | | |
Net assets, end of period ($ millions) | | | 235 | | | | 241 | | | | 326 | | | | 570 | | | | 671 | |
Ratio of expenses (%) | | | .52 | | | | .53 | | | | .54 | | | | .54 | | | | .55 | |
Ratio of net investment income (%) | | | 2.77 | | | | .88 | | | | .73 | | | | 1.35 | | | | 3.39 | |
Class B
| | | | | | | | | | | | | | | | |
Years Ended December 31, | | 2005 | | | 2004 | | | 2003 | | | 2002a | |
Selected Per Share Data | | | | | | | | | | | | | | | | |
Net asset value, beginning of period | | $ | 1.000 | | | $ | 1.000 | | | $ | 1.000 | | | $ | 1.000 | |
| | | | | | | | | | | | | | | | |
Income from investment operations: | | | | | | | | | | | | | | | | |
Net investment income | | | .024 | | | | .005 | | | | .004 | | | | .007 | |
Total from investment operations | | | .024 | | | | .005 | | | | .004 | | | | .007 | |
Less distributions from: | | | | | | | | | | | | | | | | |
Net investment income | | | (.024 | ) | | | (.005 | ) | | | (.004 | ) | | | (.007 | ) |
| | | | | | | | | | | | | | | | |
Net asset value, end of period | | $ | 1.000 | | | $ | 1.000 | | | $ | 1.000 | | | $ | 1.000 | |
| | | | | | | | | | | | | | | | |
Total Return (%) | | | 2.42 | | | | .52 | | | | .42 | | | | .67 | ** |
Ratios to Average Net Assets and Supplemental Data | | | | | | | | | | | | | | | | |
Net assets, end of period ($ millions) | | | 58 | | | | 53 | | | | 66 | | | | 3 | |
Ratio of expenses before expense reductions (%) | | | .89 | | | | .91 | | | | .93 | | | | .79 | * |
Ratio of expenses after expense reductions (%) | | | .89 | | | | .91 | | | | .92 | | | | .64 | * |
Ratio of net investment income (%) | | | 2.40 | | | | .50 | | | | .35 | | | | 1.11 | * |
| a | For the period from July 1, 2002 (commencement of operations of Class B shares) to December 31, 2002. |
278
Performance Summary December 31, 2005
DWS Oak Strategic Equity VIP
All performance shown is historical, assumes reinvestment of all dividend and capital gain distributions and does not guarantee future results. Investment return and principal value fluctuate with changing market conditions so that, when redeemed, shares may be worth more or less than their original cost. Current performance may be lower or higher than the performance data quoted. Please visit www.dws-scudder.com for the Portfolio’s most recent month-end performance. Performance doesn’t reflect charges and fees (“contract charges”) associated with the separate account that invests in the Portfolio or any variable life insurance policy or variable annuity contract for which the Portfolio is an investment option. These charges and fees will reduce returns. While all share classes have the same underlying portfolio, their performance will differ.
The Portfolio is subject to stock market risk, meaning stocks in the Portfolio may decline in value for extended periods of time due to the activities and financial prospects of individual companies, or due to general market and economic conditions. The Portfolio may concentrate investments in specific sectors, which creates special risk considerations. Please read this Portfolio’s prospectus for specific details regarding its investments and risk profile.
Portfolio returns for life of portfolio for Class A shares and for all periods shown for Class B shares reflect a fee waiver and/or expense reimbursement. Without this waiver/reimbursement, returns would have been lower.
Growth of an Assumed $10,000 Investment in DWS Oak Strategic Equity VIP from 5/1/2001 to 12/31/2005
¨ DWS Oak Strategic Equity VIP — Class A
¨ Russell 1000 Growth Index
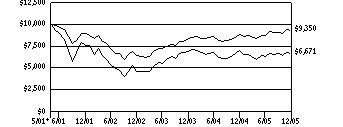
The Russell 1000 Growth Index is an unmanaged index which consists of those stocks in the Russell 1000 Index with higher price-to-book ratios and higher forecasted growth values. Index returns assume reinvested dividends and, unlike Portfolio returns, do not reflect any fees or expenses. It is not possible to invest directly into an index.
Comparative Results
| | | | | | | | | | | | | | |
DWS Oak Strategic Equity VIP | | 1-Year | | | 3-Year | | | Life of Portfolio* | |
Class A | | Growth of $10,000 | | $ | 9,599 | | | $ | 14,566 | | | $ | 6,671 | |
| | Average annual total return | | | -4.01 | % | | | 13.36 | % | | | -8.31 | % |
Russell 1000 Growth Index | | Growth of $10,000 | | $ | 10,526 | | | $ | 14,518 | | | $ | 9,350 | |
| | Average annual total return | | | 5.26 | % | | | 13.23 | % | | | -1.43 | % |
| | | |
DWS Oak Strategic Equity VIP | | 1-Year | | | 3-Year | | | Life of Class** | |
Class B | | Growth of $10,000 | | $ | 9,550 | | | $ | 14,367 | | | $ | 13,056 | |
| | Average annual total return | | | -4.50 | % | | | 12.84 | % | | | 7.92 | % |
Russell 1000 Growth Index | | Growth of $10,000 | | $ | 10,526 | | | $ | 14,518 | | | $ | 13,216 | |
| | Average annual total return | | | 5.26 | % | | | 13.23 | % | | | 8.29 | % |
The growth of $10,000 is cumulative.
| * | The Portfolio commenced operations on May 1, 2001. Index returns begin April 30, 2001. |
| ** | The Portfolio commenced offering Class B shares on July 1, 2002. Index returns begin June 30, 2002. |
279
Information About Your Portfolio’s Expenses
DWS Oak Strategic Equity VIP
As an investor of the Portfolio, you incur two types of costs: ongoing expenses and transaction costs. Ongoing expenses include management fees, distribution and service (12b-1) fees and other Portfolio expenses. Examples of transaction costs include sales charges (loads), redemption fees and account maintenance fees, which are not shown in this section. The following tables are intended to help you understand your ongoing expenses (in dollars) of investing in the Portfolio and to help you compare these expenses with the ongoing expenses of investing in other mutual funds. In the most recent six-month period, the portfolio limited these expenses for Class B shares; had it not done so, expenses would have been higher. The tables are based on an investment of $1,000 made at the beginning of the six-month period ended December 31, 2005.
The tables illustrate your Portfolio’s expenses in two ways:
Actual Portfolio Return. This helps you estimate the actual dollar amount of ongoing expenses (but not transaction costs) paid on a $1,000 investment in the Portfolio using the Portfolio’s actual return during the period. To estimate the expenses you paid over the period, simply divide your account value by $1,000 (for example, an $8,600 account value divided by $1,000 = 8.6), then multiply the result by the number in the “Expenses Paid per $1,000” line under the share class you hold.
Hypothetical 5% Portfolio Return. This helps you to compare your Portfolio’s ongoing expenses (but not transaction costs) with those of other mutual funds using the Portfolio’s actual expense ratio and a hypothetical rate of return of 5% per year before expenses. Examples using a 5% hypothetical Portfolio return may be found in the shareholder reports of other mutual funds. The hypothetical account values and expenses may not be used to estimate the actual ending account balance or expenses you paid for the period.
Please note that the expenses shown in these tables are meant to highlight your ongoing expenses only and do not reflect any transaction costs. The “Expenses Paid per $1,000” line of the tables is useful in comparing ongoing expenses only and will not help you determine the relative total expense of owning different funds. If these transaction costs had been included, your costs would have been higher.
Expenses and Value of a $1,000 Investment for the six months ended December 31, 2005
| | | | | | |
Actual Portfolio Return | | Class A | | Class B |
Beginning Account Value 7/1/05 | | $ | 1,000.00 | | $ | 1,000.00 |
Ending Account Value 12/31/05 | | $ | 1,057.10 | | $ | 1,054.50 |
Expenses Paid per $1,000* | | $ | 5.50 | | $ | 7.35 |
| | |
Hypothetical 5% Portfolio Return | | Class A | | Class B |
Beginning Account Value 7/1/05 | | $ | 1,000.00 | | $ | 1,000.00 |
Ending Account Value 12/31/05 | | $ | 1,019.86 | | $ | 1,018.05 |
Expenses Paid per $1,000* | | $ | 5.40 | | $ | 7.22 |
| * | Expenses are equal to the Portfolio’s annualized expense ratio for each share class, multiplied by the average account value over the period, multiplied by the number of days in the most recent six-month period, then divided by 365. |
| | | | | | |
Annualized Expense Ratios | | Class A | | | Class B | |
DWS Variable Series II — DWS Oak Strategic Equity VIP | | 1.06 | % | | 1.42 | % |
For more information, please refer to the Portfolio’s prospectus.
These tables do not reflect charges and fees (“contract charges”) associated with the separate account that invests in the portfolio or any variable life insurance policy or variable annuity contract for which the portfolio is an investment option.
280
Management Summary December 31, 2005
DWS Oak Strategic Equity VIP
DWS Oak Strategic Equity VIP returned -4.01% (Class A shares, unadjusted for contract charges) for the year ended December 31, 2005, compared with 5.26% by its benchmark, the Russell 1000 Growth Index.
Three-quarters of the Portfolio’s underperformance was due to stock selection. The other one-quarter of underperformance was due to sector selection.
Stock selection within the information technology (IT) sector was particularly damaging. The Portfolio’s holdings in Dell (not held in the Portfolio as of December 31, 2005) and Symantec Corp. hurt performance in this area the most. Stock selection within the consumer discretionary sector also detracted from performance, with eBay, Inc. falling 26% for the year.
Balancing underperformance, stock selection within the health care and financial sectors contributed to the Portfolio’s performance. Affymetrix, Inc., Amgen, Inc., Teva Pharmaceutical Industries, Ltd. and Charles Schwab Corp. were all up more than 20%.
In regard to sector selection, the Portfolio’s underweight in the energy sector and overweight1 in the IT sector were significant to performance. A strong rise in oil prices drove the Portfolio’s benchmark higher (even though the benchmark has a weighting of only 2.57% in the energy sector); but it drove the Portfolio (which did not have an investment in the energy sector) 92 basis points lower. The energy and IT sectors often perform inversely, and the Portfolio’s overweight in IT sector subtracted another 88 basis points. Balancing this, the Portfolio’s underweight in the underperforming consumer areas boosted performance.
As we look at the economy, we continue to believe the trend is away from physical assets, such as commodities, and toward intellectual assets, such as technology and medicine. We believe this is confirmed by the backdrop of low interest rates and inflation, which tend to make hard assets less attractive. That said, with the underinvestment that has occurred in some of these areas, such as energy, there are going to be times when they outperform the knowledge-based sectors, as they did in 2005.
James D. Oelschlager
Portfolio Manager
Oak Associates, Ltd., Subadvisor to the Portfolio
All performance shown is historical, assumes reinvestment of all dividend and capital gain distributions and does not guarantee future results. Investment return and principal value fluctuate with changing market conditions so that, when redeemed, shares may be worth more or less than their original cost. Current performance may be lower or higher than the performance data quoted. Please visit www.dws-scudder.com for the Portfolio’s most recent month-end performance. Performance doesn’t reflect charges and fees (“contract charges”) associated with the separate account that invests in the Portfolio or any variable life insurance policy or variable annuity contract for which the Portfolio is an investment option. These charges and fees will reduce returns. While all share classes have the same underlying portfolio, their performance will differ.
Risk Considerations
The Portfolio is subject to stock market risk, meaning stocks in the Portfolio may decline in value for extended periods of time due to the activities and financial prospects of individual companies, or due to general market and economic conditions. The Portfolio may concentrate investments in specific sectors, which creates special risk considerations. Please read this Portfolio’s prospectus for specific details regarding its investments and risk profile.
The Russell 1000 Growth Index is an unmanaged index which consists of those stocks in the Russell 3000 Index with higher price-to-book ratios and higher forecasted growth values. Index returns assume reinvested dividends and, unlike portfolio returns, do not reflect any fees or expenses. It is not possible to invest directly into an index.
| 1 | “Overweight” means the Portfolio holds a higher weighting in a given sector or security than the benchmark. “Underweight” means the Portfolio holds a lower weighting. |
Portfolio management market commentary is as of December 31, 2005, and may not come to pass. This information is subject to change at any time based on market and other conditions.
281
Portfolio Summary
DWS Oak Strategic Equity VIP
| | | | | | |
Asset Allocation (Excludes Securities Lending Collateral) | | 12/31/05 | | | 12/31/04 | |
Common Stocks | | 99 | % | | 99 | % |
Cash Equivalents | | 1 | % | | 1 | % |
| | | | | | |
| | 100 | % | | 100 | % |
| | | | | | |
| | | | | | |
Sector Diversification (As a % of Common Stocks) | | 12/31/05 | | | 12/31/04 | |
Information Technology | | 49 | % | | 56 | % |
Health Care | | 21 | % | | 15 | % |
Consumer Discretionary | | 12 | % | | 9 | % |
Financials | | 11 | % | | 14 | % |
Industrials | | 7 | % | | 6 | % |
| | | | | | |
| | 100 | % | | 100 | % |
| | | | | | |
Asset allocation and sector diversification are subject to change.
For more complete details about the Portfolio’s investment portfolio, see page 113. A quarterly Fact Sheet is available upon request. Information concerning portfolio holdings of the Portfolio as of month end will be posted to www.dws-scudder.com on the 15th of the following month.
Following the Portfolio’s fiscal first and third quarter-end, a complete portfolio holdings listing is filed with the SEC on Form N-Q. The form will be available on the SEC’s Web site at www.sec.gov, and it also may be reviewed and copied at the SEC’s Public Reference Room in Washington, D.C. Information on the operation of the SEC’s Public Reference Room may be obtained by calling (800) SEC-0330.
282
Investment Portfolio December 31, 2005
DWS Oak Strategic Equity VIP
| | | | |
| | | Shares | | Value ($) |
Common Stocks 99.1% | | | | |
Consumer Discretionary 11.7% | | | | |
Household Durables 2.0% | | | | |
Harman International Industries, Inc. | | 15,000 | | 1,467,750 |
| | | | |
Internet & Catalog Retail 9.7% | | | | |
Amazon.com, Inc.* | | 62,000 | | 2,923,300 |
eBay, Inc.* | | 101,200 | | 4,376,900 |
| | | | |
| | | | 7,300,200 |
| | | | |
Financials 10.8% | | | | |
Capital Markets 6.5% | | | | |
Charles Schwab Corp. | | 335,400 | | 4,920,318 |
| | | | |
Diversified Financial Services 4.3% | | | | |
Citigroup, Inc. | | 65,800 | | 3,193,274 |
| | | | |
Health Care 21.1% | | | | |
Biotechnology 8.6% | | | | |
Affymetrix, Inc.* (a) | | 57,000 | | 2,721,750 |
Amgen, Inc.* | | 47,300 | | 3,730,078 |
| | | | |
| | | | 6,451,828 |
| | | | |
Health Care Equipment & Supplies 4.8% | | | | |
Medtronic, Inc. | | 63,000 | | 3,626,910 |
| | | | |
Pharmaceuticals 7.7% | | | | |
Pfizer, Inc. | | 96,200 | | 2,243,384 |
Teva Pharmaceutical Industries Ltd. (ADR) | | 83,000 | | 3,569,830 |
| | | | |
| | | | 5,813,214 |
| | | | |
Industrials 7.3% | | | | |
Electrical Equipment 2.7% | | | | |
Rockwell Automation, Inc. | | 34,000 | | 2,011,440 |
| | | | |
Machinery 4.6% | | | | |
Caterpillar, Inc. | | 59,800 | | 3,454,646 |
| | | | |
Information Technology 48.2% | | | | |
Communications Equipment 14.5% | | | | |
Cisco Systems, Inc.* | | 204,600 | | 3,502,752 |
Juniper Networks, Inc.* | | 134,900 | | 3,008,270 |
QUALCOMM, Inc. | | 101,500 | | 4,372,620 |
| | | | |
| | | | 10,883,642 |
| | | | |
283
| | | | | | |
| | | Shares | | | Value ($) | |
Computers & Peripherals 2.5% | | | | | | |
Avid Technology, Inc.* (a) | | 35,000 | | | 1,916,600 | |
| | | | | | |
Electronic Equipment & Instruments 1.9% | | | | | | |
Symbol Technologies, Inc. | | 113,600 | | | 1,456,352 | |
| | | | | | |
Internet Software & Services 4.0% | | | | | | |
Google, Inc. “A”* | | 7,200 | | | 2,986,992 | |
| | | | | | |
IT Consulting & Services 4.5% | | | | | | |
Cognizant Technology Solutions Corp. “A”* | | 67,500 | | | 3,398,625 | |
| | | | | | |
Semiconductors & Semiconductor Equipment 13.0% | | | | | | |
Applied Materials, Inc. | | 193,400 | | | 3,469,596 | |
Linear Technology Corp. | | 93,100 | | | 3,358,117 | |
Maxim Integrated Products, Inc. | | 80,950 | | | 2,933,628 | |
| | | | | | |
| | | | | 9,761,341 | |
| | | | | | |
Software 7.8% | | | | | | |
Electronic Arts, Inc.* | | 65,000 | | | 3,400,150 | |
Symantec Corp.* | | 141,000 | | | 2,467,500 | |
| | | | | | |
| | | | | 5,867,650 | |
| | | | | | |
Total Common Stocks (Cost $67,105,407) | | | | | 74,510,782 | |
| | | | | | |
Securities Lending Collateral 5.4% | | | | | | |
Daily Assets Fund Institutional, 4.28% (b) (c) (Cost $4,093,342) | | 4,093,342 | | | 4,093,342 | |
| | | | | | |
Cash Equivalents 1.1% | | | | | | |
Cash Management QP Trust, 4.26% (d) (Cost $803,142) | | 803,142 | | | 803,142 | |
| | | | | | |
| | |
| | | % of Net Assets | | | Value ($) | |
Total Investment Portfolio (Cost $72,001,891)+ | | 105.6 | | | 79,407,266 | |
Other Assets and Liabilities, Net | | (5.6 | ) | | (4,202,995 | ) |
Net Assets | | 100.0 | | | 75,204,271 | |
Notes to DWS Oak Strategic Equity VIP Portfolio of Investments
| * | Non-income producing security. |
| + | The cost for federal income tax purposes was $72,010,417. At December 31, 2005, net unrealized appreciation for all securities based on tax cost was $7,396,849. This consisted of aggregate gross unrealized appreciation for all securities in which there was an excess of value over tax cost of $11,331,216 and aggregate gross unrealized depreciation for all securities in which there was an excess of tax cost over value of $3,934,367. |
| (a) | All or a portion of these securities were on loan (see Notes to Financial Statements). The value of all securities loaned at December 31, 2005 amounted to $4,029,642 which is 5.4% of net assets. |
| (b) | Daily Assets Fund Institutional, an affiliated fund, is managed by Deutsche Asset Management, Inc. The rate shown is the annualized seven-day yield at period end. |
| (c) | Represents collateral held in connection with securities lending. |
| (d) | Cash Management QP Trust, an affiliated fund, is managed by Deutsche Investment Management Americas Inc. The rate shown is the annualized seven-day yield at period end. |
| ADR: | American Depositary Receipt |
The accompanying notes are an integral part of the financial statements.
284
Financial Statements
Statement of Assets and Liabilities
as of December 31, 2005
| | | | |
Assets | | | | |
Investments: Investments in securities, at value (cost $67,105,407) — including $4,029,642 of securities loaned | | $ | 74,510,782 | |
Investment in Daily Assets Fund Institutional (cost $4,093,342)* | | | 4,093,342 | |
Investment in Cash Management QP Trust (cost $803,142) | | | 803,142 | |
Total investments in securities, at value (cost $72,001,891) | | | 79,407,266 | |
Dividends receivable | | | 25,074 | |
Interest receivable | | | 2,434 | |
Receivable for Portfolio shares sold | | | 40,626 | |
Other assets | | | 2,045 | |
Total assets | | | 79,477,445 | |
Liabilities | | | | |
Payable for Portfolio shares redeemed | | | 54,018 | |
Payable upon return of securities loaned | | | 4,093,342 | |
Accrued management fee | | | 53,534 | |
Other accrued expenses and payables | | | 72,280 | |
Total liabilities | | | 4,273,174 | |
| | | | |
Net assets, at value | | $ | 75,204,271 | |
| | | | |
Net Assets | | | | |
Net assets consist of: Accumulated distribution in excess of net investment income | | | (143 | ) |
Net unrealized appreciation (depreciation) on investments | | | 7,405,375 | |
Accumulated net realized gain (loss) | | | (9,744,999 | ) |
Paid-in capital | | | 77,544,038 | |
| | | | |
Net assets, at value | | $ | 75,204,271 | |
| | | | |
Class A Net Asset Value, offering and redemption price per share ($54,725,040 ÷ 8,210,458 outstanding shares of beneficial interest, $.01 par value, unlimited number of shares authorized) | | $ | 6.67 | |
Class B Net Asset Value, offering and redemption price per share ($20,479,231 ÷ 3,110,602 outstanding shares of beneficial interest, $.01 par value, unlimited number of shares authorized) | | $ | 6.58 | |
| * | Represents collateral on securities loaned. |
285
Statement of Operations
for the year ended December 31, 2005
| | | | |
Investment Income | | | | |
Income: Dividends (net of foreign taxes withheld of $1,435) | | $ | 573,804 | |
Interest — Cash Management QP Trust | | | 16,185 | |
Securities lending income, including income from Daily Assets Fund Institutional, net of borrower rebates | | | 4,067 | |
Total Income | | | 594,056 | |
Expenses: Management fee | | | 719,073 | |
Custodian and accounting fees | | | 59,948 | |
Distribution service fees (Class B) | | | 50,458 | |
Record keeping fees (Class B) | | | 30,698 | |
Auditing | | | 43,860 | |
Legal | | | 14,817 | |
Trustees’ fees and expenses | | | 4,003 | |
Reports to shareholders | | | 30,488 | |
Other | | | 6,989 | |
Total expenses before expense reductions | | | 960,334 | |
Expense reductions | | | (9,552 | ) |
Total expenses after expense reductions | | | 950,782 | |
| | | | |
Net investment income (loss) | | | (356,726 | ) |
| | | | |
Realized and Unrealized Gain (Loss) on Investment Transactions | | | | |
Net realized gain (loss) from investments | | | 1,188,803 | |
Net unrealized appreciation (depreciation) during the period on investments | | | (4,994,935 | ) |
Net gain (loss) on investment transactions | | | (3,806,132 | ) |
Net increase (decrease) in net assets resulting from operations | | $ | (4,162,858 | ) |
The accompanying notes are an integral part of the financial statements.
286
Statement of Changes in Net Assets
| | | | | | | | |
| | | Years Ended December 31, | |
Increase (Decrease) in Net Assets | | 2005 | | | 2004 | |
Operations: | | | | | | | | |
Net investment income (loss) | | $ | (356,726 | ) | | $ | 9,115 | |
Net realized gain (loss) on investment transactions | | | 1,188,803 | | | | (429,310 | ) |
Net unrealized appreciation (depreciation) during the period on investment transactions | | | (4,994,935 | ) | | | 935,994 | |
Net increase (decrease) in net assets resulting from operations | | | (4,162,858 | ) | | | 515,799 | |
Distributions to shareholders from: Net investment income: Class A | | | (9,542 | ) | | | — | |
Portfolio share transactions: Class A Proceeds from shares sold | | | 2,962,547 | | | | 11,773,909 | |
Reinvestment of distributions | | | 9,542 | | | | — | |
Cost of shares redeemed | | | (15,883,679 | ) | | | (16,798,283 | ) |
Net increase (decrease) in net assets from Class A share transactions | | | (12,911,590 | ) | | | (5,024,374 | ) |
Class B Proceeds from shares sold | | | 3,152,311 | | | | 12,325,908 | |
Cost of shares redeemed | | | (3,375,229 | ) | | | (1,539,908 | ) |
Net increase (decrease) in net assets from Class B share transactions | | | (222,918 | ) | | | 10,786,000 | |
Increase (decrease) in net assets | | | (17,306,908 | ) | | | 6,277,425 | |
Net assets at beginning of period | | | 92,511,179 | | | | 86,233,754 | |
| | | | | | | | |
Net assets at end of period (including accumulated distribution in excess of net investment income and undistributed net investment income of $143 and $3,260, respectively) | | $ | 75,204,271 | | | $ | 92,511,179 | |
| | | | | | | | |
Other Information | | | | | | | | |
Class A Shares outstanding at beginning of period | | | 10,189,476 | | | | 11,043,224 | |
Shares sold | | | 457,824 | | | | 1,718,999 | |
Shares issued to shareholders in reinvestment of distributions | | | 1,534 | | | | — | |
Shares redeemed | | | (2,438,376 | ) | | | (2,572,747 | ) |
Net increase (decrease) in Class A shares | | | (1,979,018 | ) | | | (853,748 | ) |
| | | | | | | | |
Shares outstanding at end of period | | | 8,210,458 | | | | 10,189,476 | |
| | | | | | | | |
Class B Shares outstanding at beginning of period | | | 3,140,946 | | | | 1,533,571 | |
Shares sold | | | 492,232 | | | | 1,851,499 | |
Shares redeemed | | | (522,576 | ) | | | (244,124 | ) |
Net increase (decrease) in Class B shares | | | (30,344 | ) | | | 1,607,375 | |
| | | | | | | | |
Shares outstanding at end of period | | | 3,110,602 | | | | 3,140,946 | |
| | | | | | | | |
The accompanying notes are an integral part of the financial statements.
287
Financial Highlights
Class A
| | | | | | | | | | | | | | | | | | | |
Years Ended December 31, | | 2005 | | | 2004 | | 2003 | | | 2002 | | | 2001a | |
Selected Per Share Data | | | | | | | | | | | | | | | | | | | |
Net asset value, beginning of period | | $ | 6.95 | | | $ | 6.86 | | $ | 4.58 | | | $ | 7.60 | | | $ | 10.00 | |
| | | | | | | | | | | | | | | | | | | |
Income (loss) from investment operations: | | | | | | | | | | | | | | | | | | | |
Net investment income (loss)b | | | (.02 | ) | | | .01 | | | (.03 | ) | | | (.02 | ) | | | (.02 | ) |
Net realized and unrealized gain (loss) on investment transactions | | | (.26 | ) | | | .08 | | | 2.31 | | | | (3.00 | ) | | | (2.38 | ) |
Total from investment operations | | | (.28 | ) | | | .09 | | | 2.28 | | | | (3.02 | ) | | | (2.40 | ) |
Less distributions from: Net investment income | | | .00d | | | | — | | | — | | | | — | | | | — | |
| | | | | | | | | | | | | | | | | | | |
Net asset value, end of period | | $ | 6.67 | | | $ | 6.95 | | $ | 6.86 | | | $ | 4.58 | | | $ | 7.60 | |
| | | | | | | | | | | | | | | | | | | |
Total Return (%) | | | (4.01 | ) | | | 1.31 | | | 49.78 | | | | (39.74 | ) | | | (24.00 | )c** |
Ratios to Average Net Assets and Supplemental Data | | | | | | | | | | | | | | | | | | | |
Net assets, end of period ($ millions) | | | 55 | | | | 71 | | | 76 | | | | 41 | | | | 44 | |
Ratio of expenses before expense reductions (%) | | | 1.10 | | | | 1.10 | | | 1.13 | | | | .96 | | | | 1.44 | * |
Ratio of expenses after expense reductions (%) | | | 1.10 | | | | 1.10 | | | 1.13 | | | | .96 | | | | 1.15 | * |
Ratio of net investment income (%) | | | (.35 | ) | | | .08 | | | (.48 | ) | | | (.30 | ) | | | (.43 | )* |
Portfolio turnover rate (%) | | | 19 | | | | 39 | | | 6 | | | | 16 | | | | 3 | * |
| a | For the period from May 1, 2001 (commencement of operations of Class A) to December 31, 2001. |
| b | Based on average shares outstanding during the period. |
| c | Total return would have been lower had certain expenses not been reduced. |
| d | Amount is less than $.005. |
Class B
| | | | | | | | | | | | | | | | |
Years Ended December 31, | | 2005 | | | 2004 | | | 2003 | | | 2002a | |
Selected Per Share Data | | | | | | | | | | | | | | | | |
Net asset value, beginning of period | | $ | 6.89 | | | $ | 6.83 | | | $ | 4.58 | | | $ | 5.04 | |
| | | | | | | | | | | | | | | | |
Income (loss) from investment operations: | | | | | | | | | | | | | | | | |
Net investment income (loss)b | | | (.04 | ) | | | (.02 | ) | | | (.06 | ) | | | (.02 | ) |
Net realized and unrealized gain (loss) on investment transactions | | | (.27 | ) | | | .08 | | | | 2.31 | | | | (.44 | ) |
Total from investment operations | | | (.31 | ) | | | .06 | | | | 2.25 | | | | (.46 | ) |
| | | | | | | | | | | | | | | | |
Net asset value, end of period | | $ | 6.58 | | | $ | 6.89 | | | $ | 6.83 | | | $ | 4.58 | |
| | | | | | | | | | | | | | | | |
Total Return (%) | | | (4.50 | )c | | | .88 | | | | 49.13 | | | | (9.13 | )** |
Ratios to Average Net Assets and Supplemental Data | | | | | | | | | | | | | | | | |
Net assets, end of period ($ millions) | | | 20 | | | | 22 | | | | 10 | | | | .4 | |
Ratio of expenses before expense reductions (%) | | | 1.50 | | | | 1.49 | | | | 1.52 | | | | 1.21 | * |
Ratio of expenses after expense reductions (%) | | | 1.46 | | | | 1.49 | | | | 1.52 | | | | 1.21 | * |
Ratio of net investment income (%) | | | (.71 | ) | | | (.20 | ) | | | (.87 | ) | | | (.68 | )* |
Portfolio turnover rate (%) | | | 19 | | | | 39 | | | | 6 | | | | 16 | |
| a | For the period July 1, 2002 (commencement of operations of Class B shares) to December 31, 2002. |
| b | Based on average shares outstanding during the period. |
| c | Total return would have been lower had certain expenses not been reduced. |
288
Performance Summary December 31, 2005
DWS Salomon Aggressive Growth VIP
All performance shown is historical, assumes reinvestment of all dividend and capital gain distributions and does not guarantee future results. Investment return and principal value fluctuate with changing market conditions so that, when redeemed, shares may be worth more or less than their original cost. Current performance may be lower or higher than the performance data quoted. Please visit www.dws-scudder.com for the Portfolio’s most recent month-end performance. Performance doesn’t reflect charges and fees (“contract charges”) associated with the separate account that invests in the Portfolio or any variable life insurance policy or variable annuity contract for which the Portfolio is an investment option. These charges and fees will reduce returns. While all share classes have the same underlying portfolio, their performance will differ.
Stocks of medium-sized companies involve greater risk as they often have limited product lines, markets, or financial resources and may be sensitive to erratic and abrupt market movements more so than securities of larger, more-established companies. Additionally, the Portfolio may also focus its investments on certain industry sectors, thereby increasing its vulnerability to any single industry or regulatory development. All of these factors may result in greater share price volatility. Please read this Portfolio’s prospectus for specific details regarding its investments and risk profile.
Portfolio returns shown for all periods reflect a fee waiver and/or expense reimbursement. Without this waiver/reimbursement, returns would have been lower.
Growth of an Assumed $10,000 Investment in DWS Salomon Aggressive Growth VIP from 5/1/2001 to 12/31/2005
¨ DWS Salomon Aggressive Growth VIP — Class A
¨ Russell 3000 Growth Index+
¨ Russell MidCap Growth Index
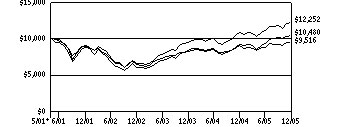
The Russell 3000 Growth Index+ is an unmanaged index that measures the performance of those Russell 3000 companies with higher price-to-book ratios and higher forecasted growth values. The stocks are also members of the Russell 3000 Growth Index. The Russell MidCap Growth Index is an unmanaged index that measures the performance of those Russell MidCap companies with higher price-to-book ratios and higher forecasted growth vales. The stocks are also members of the Russell 1000 Growth Index.
Index returns assume reinvested dividends and, unlike Portfolio returns, do not reflect any fees or expenses. It is not possible to invest directly into an index.
Comparative Results
| | | | | | | | | | | | | | |
DWS Salomon Aggressive Growth VIP | | 1-Year | | | 3-Year | | | Life of Portfolio* | |
Class A | | Growth of $10,000 Average annual total return | | $
| 11,354
13.54 |
% | | $
| 17,237
19.90 |
% | | $
| 10,480
1.01 |
% |
Russell 3000 Growth Index+ | | Growth of $10,000 Average annual total return | | $
| 10,517
5.17 |
% | | $
| 14,728
13.78 |
% | | $
| 9,516
-1.06 |
% |
Russell MidCap Growth Index | | Growth of $10,000 Average annual total return | | $
| 11,210
12.10 |
% | | $
| 18,474
22.70 |
% | | $
| 12,252
4.45 |
% |
| | | |
DWS Salomon Aggressive Growth VIP | | 1-Year | | | 3-Year | | | Life of Class** | |
Class B | | Growth of $10,000 Average annual total return | | $
| 11,322
13.22 |
% | | $
| 17,068
19.51 |
% | | $
| 15,914
14.20 |
% |
Russell 3000 Growth Index+ | | Growth of $10,000 Average annual total return | | $
| 10,517
5.17 |
% | | $
| 14,728
13.78 |
% | | $
| 13,340
8.58 |
% |
Russell MidCap Growth Index | | Growth of $10,000 Average annual total return | | $
| 11,210
12.10 |
% | | $
| 18,474
22.70 |
% | | $
| 16,702
15.78 |
% |
The growth of $10,000 is cumulative.
| * | The Portfolio commenced operations on May 1, 2001. Index returns begin April 30, 2001. |
| ** | The Portfolio commenced offering Class B shares on July 1, 2002. Index returns begin June 30, 2002. |
| + | On August 1, 2005, the Russell 3000 Growth Index replaced the Russell MidCap Growth Index as the portfolio’s benchmark index because the Advisor believes it is more appropriate to measure the portfolio’s performance against the Russell 3000 Growth Index as it more accurately reflects the portfolio’s new investment goal and strategy. |
289
Information About Your Portfolio’s Expenses
DWS Salomon Aggressive Growth VIP
As an investor of the Portfolio, you incur two types of costs: ongoing expenses and transaction costs. Ongoing expenses include management fees, distribution and service (12b-1) fees and other Portfolio expenses. Examples of transaction costs include sales charges (loads), redemption fees and account maintenance fees, which are not shown in this section. The following tables are intended to help you understand your ongoing expenses (in dollars) of investing in the Portfolio and to help you compare these expenses with the ongoing expenses of investing in other mutual funds. In the most recent six-month period, the Portfolio limited these expenses; had it not done so, expenses would have been higher. The tables are based on an investment of $1,000 made at the beginning of the six-month period ended December 31, 2005.
The tables illustrate your Portfolio’s expenses in two ways:
Actual Portfolio Return. This helps you estimate the actual dollar amount of ongoing expenses (but not transaction costs) paid on a $1,000 investment in the Portfolio using the Portfolio’s actual return during the period. To estimate the expenses you paid over the period, simply divide your account value by $1,000 (for example, an $8,600 account value divided by $1,000 = 8.6), then multiply the result by the number in the “Expenses Paid per $1,000” line under the share class you hold.
Hypothetical 5% Portfolio Return. This helps you to compare your Portfolio’s ongoing expenses (but not transaction costs) with those of other mutual funds using the Portfolio’s actual expense ratio and a hypothetical rate of return of 5% per year before expenses. Examples using a 5% hypothetical Portfolio return may be found in the shareholder reports of other mutual funds. The hypothetical account values and expenses may not be used to estimate the actual ending account balance or expenses you paid for the period.
Please note that the expenses shown in these tables are meant to highlight your ongoing expenses only and do not reflect any transaction costs. The “Expenses Paid per $1,000” line of the tables is useful in comparing ongoing expenses only and will not help you determine the relative total expense of owning different funds. If these transaction costs had been included, your costs would have been higher.
Expenses and Value of a $1,000 Investment for the six months ended December 31, 2005
| | | | | | |
Actual Portfolio Return | | Class A | | Class B |
Beginning Account Value 7/1/05 | | $ | 1,000.00 | | $ | 1,000.00 |
Ending Account Value 12/31/05 | | $ | 1,120.90 | | $ | 1,118.80 |
Expenses Paid per $1,000* | | $ | 5.51 | | $ | 7.58 |
| | |
Hypothetical 5% Portfolio Return | | Class A | | Class B |
Beginning Account Value 7/1/05 | | $ | 1,000.00 | | $ | 1,000.00 |
Ending Account Value 12/31/05 | | $ | 1,020.01 | | $ | 1,018.05 |
Expenses Paid per $1,000* | | $ | 5.24 | | $ | 7.22 |
| * | Expenses are equal to the Portfolio’s annualized expense ratio for each share class, multiplied by the average account value over the period, multiplied by the number of days in the most recent six-month period, then divided by 365. |
| | | | | | |
Annualized Expense Ratios | | Class A | | | Class B | |
DWS Variable Series II — DWS Salomon Aggressive Growth VIP | | 1.03 | % | | 1.42 | % |
For more information, please refer to the Portfolio’s prospectus.
These tables do not reflect charges and fees (“contract charges”) associated with the separate account that invests in the portfolio or any variable life insurance policy or variable annuity contract for which the portfolio is an investment option.
290
Management Summary December 31, 2005
DWS Salomon Aggressive Growth VIP
Class A shares of DWS Salomon Aggressive Growth VIP1 returned 13.54% (unadjusted for contract charges) for the 12-month period ended December 31, 2005. In comparison, the benchmark Russell 3000 Growth Index returned 5.17% for the same period.
After trading in a limited range for most of the year, the broad stock market staged a rally in the fourth quarter of 2005. This helped produce both quarterly and annual gains for the equity market.
Energy sector stocks were clearly the biggest winners for the past year, buoyed by crude oil’s temporary spike to over $70 per barrel in the wake of August’s Hurricane Katrina. The Portfolio held an overweight position in energy for the period, with a focus on oil production services and equipment stocks that boosted performance.
Despite a relative underweight position in information technology (IT), the Portfolio’s holdings in IT made a meaningful contribution to performance.
The Portfolio’s overweight position in health care, with a concentration in biotechnology and biopharmaceuticals, along with a significant holding in the managed care industry, also helped performance.
While the Portfolio’s financial sector holdings contributed to performance, holdings in the consumer discretionary sector, especially cable TV industry holdings, and industrials sector stocks detracted from performance for the period.
The Portfolio’s top ten holdings as of December 31, 2005 were Lehman Brothers Holdings, Inc., UnitedHealth Group, Inc., Anadarko Petroleum Corp., Forest Laboratories, Inc., Weatherford International Ltd., Genzyme Corp., Amgen, Inc., Biogen Idec, Inc., Chiron Corp. and Tyco International Ltd. (Asset allocation is subject to change.)
Richard Freeman
Portfolio Manager
Salomon Brothers Asset Management, Inc., Subadvisor to the Portfolio
All performance shown is historical, assumes reinvestment of all dividend and capital gain distribution, and does not guarantee future results. Investment return and principal fluctuate with changing market conditions so that, when redeemed, shares may be worth more or less than their original cost. Current performance may be lower or higher than the performance data quoted. Please visit www.dws-scudder.com for the product’s most recent month-end performance. Performance doesn’t reflect charges and fees (“contract fees”) associated with the separate account that invests in the Portfolio or any variable life insurance policy or variable annuity contract for which the Portfolio is an investment option. These charges and fees will reduce returns.
Risk Considerations
Stocks of medium-sized companies involve greater risk as they often have limited product lines, markets, or financial resources and may be sensitive to erratic and abrupt market movements more so than securities of larger, more-established companies. Additionally, the Portfolio may also focus its investments on certain industry sectors, thereby increasing its vulnerability to any single industry or regulatory development. All of these factors may result in greater share price volatility. Please read this Portfolio’s prospectus for specific details regarding its investments and risk profile.
| 1 | Prior to August 1, 2005 the underlying Portfolio was called the SVS INVESCO Dynamic Growth Portfolio and was managed by another portfolio manager. |
The Russell 3000 Growth Index is an unmanaged index that measures the performance of those Russell 3000 Index companies with higher price-to-book rations and higher forecasted growth values. Index returns assume reinvestment of dividends and, unlike portfolio returns, so not reflect any fees or expenses. It is not possible to invest directly in an index.
The Russell MidCap Growth Index is an unmanaged index that measures the performance of those Russell MidCap companies with higher price-to-book ratios and higher forecasted growth vales. The stocks are also members of the Russell 1000 Growth Index.
Index returns assume reinvested dividends and, unlike portfolio returns, do not reflect any fees or expenses. It is not possible to invest directly into an index.
Portfolio management market commentary is as of December 31, 2005, and may not come to pass. This information is subject to change at any time based on market and other conditions.
291
Portfolio Summary
DWS Salomon Aggressive Growth VIP
| | | | | | |
Asset Allocation | | 12/31/05 | | | 12/31/04 | |
Common Stocks | | 92 | % | | 94 | % |
Cash Equivalents | | 6 | % | | 5 | % |
Exchange Traded Funds | | 2 | % | | 1 | % |
| | | | | | |
| | 100 | % | | 100 | % |
| | | | | | |
| | | | | | |
Sector Diversification (As a % of Common Stocks) | | 12/31/05 | | | 12/31/04 | |
Health Care | | 37 | % | | 17 | % |
Information Technology | | 16 | % | | 22 | % |
Consumer Discretionary | | 15 | % | | 21 | % |
Energy | | 13 | % | | 6 | % |
Financials | | 10 | % | | 11 | % |
Industrials | | 9 | % | | 16 | % |
Telecommunication Services | | — | | | 3 | % |
Materials | | — | | | 3 | % |
Consumer Staples | | — | | | 1 | % |
| | | | | | |
| | 100 | % | | 100 | % |
| | | | | | |
Asset allocation and sector diversification are subject to change.
For more complete details about the Portfolio’s investment portfolio, see page 6. A quarterly Fact Sheet is available upon request. Information concerning portfolio holdings of the Portfolio as of month end will be posted to www.dws-scudder.com on the 15th of the following month.
Following the Portfolio’s fiscal first and third quarter-end, a complete portfolio holdings listing is filed with the SEC on Form N-Q. The form will be available on the SEC’s Web site at www.sec.gov, and it also may be reviewed and copied at the SEC’s Public Reference Room in Washington, D.C. Information on the operation of the SEC’s Public Reference Room may be obtained by calling (800) SEC-0330.
292
Investment Portfolio December 31, 2005
DWS Salomon Aggressive Growth VIP
| | | | |
| | | Shares | | Value ($) |
Common Stocks 91.5% | | | | |
Consumer Discretionary 14.1% | | | | |
Media 13.7% | | | | |
Cablevision Systems Corp. (New York Group) “A”* | | 39,000 | | 915,330 |
Comcast Corp. “A”* | | 6,000 | | 155,760 |
Comcast Corp. (Special) “A”* | | 67,000 | | 1,721,230 |
Discovery Holding Co. “A”* | | 8,000 | | 121,200 |
Liberty Global, Inc. “A”* | | 4,000 | | 90,000 |
Liberty Global, Inc. “C”* | | 4,100 | | 86,920 |
Liberty Media Corp. “A”* | | 102,000 | | 802,740 |
Time Warner, Inc. | | 84,500 | | 1,473,680 |
Viacom, Inc. “B”* | | 15,000 | | 489,000 |
Walt Disney Co. | | 31,500 | | 755,055 |
| | | | |
| | | | 6,610,915 |
| | | | |
Specialty Retail 0.4% | | | | |
Charming Shoppes, Inc.* | | 13,800 | | 182,160 |
| | | | |
Energy 11.9% | | | | |
Energy Equipment & Services 7.0% | | | | |
Grant Prideco, Inc.* | | 26,400 | | 1,164,768 |
Weatherford International Ltd.* | | 61,000 | | 2,208,200 |
| | | | |
| | | | 3,372,968 |
| | | | |
Oil, Gas & Consumable Fuels 4.9% | | | | |
Anadarko Petroleum Corp. | | 24,500 | | 2,321,375 |
| | | | |
Financials 9.0% | | | | |
Capital Markets 8.5% | | | | |
Lehman Brothers Holdings, Inc. | | 20,000 | | 2,563,400 |
Merrill Lynch & Co., Inc. | | 22,500 | | 1,523,925 |
| | | | |
| | | | 4,087,325 |
| | | | |
Diversified Financial Services 0.5% | | | | |
CIT Group, Inc. | | 4,300 | | 222,654 |
| | | | |
Health Care 34.3% | | | | |
Biotechnology 19.1% | | | | |
Amgen, Inc.* | | 27,500 | | 2,168,650 |
Biogen Idec, Inc.* | | 45,500 | | 2,062,515 |
Chiron Corp.* | | 44,500 | | 1,978,470 |
Genentech, Inc.* | | 2,500 | | 231,250 |
Genzyme Corp.* | | 30,800 | | 2,180,024 |
Millennium Pharmaceuticals, Inc.* | | 30,900 | | 299,730 |
Vertex Pharmaceuticals, Inc.* | | 9,000 | | 249,030 |
| | | | |
| | | | 9,169,669 |
| | | | |
Health Care Equipment & Supplies 0.5% | | | | |
Biosite, Inc.* | | 4,000 | | 225,160 |
| | | | |
Health Care Providers & Services 5.2% | | | | |
UnitedHealth Group, Inc. | | 40,000 | | 2,485,600 |
| | | | |
Pharmaceuticals 9.5% | | | | |
Alkermes, Inc.* | | 7,500 | | 143,400 |
Forest Laboratories, Inc.* | | 55,000 | | 2,237,400 |
ImClone Systems, Inc.* | | 20,000 | | 684,800 |
Johnson & Johnson | | 10,000 | | 601,000 |
293
| | | | |
| | | Shares | | Value ($) |
King Pharmaceuticals, Inc.* | | 25,000 | | 423,000 |
Teva Pharmaceutical Industries Ltd. (ADR) | | 4,000 | | 172,040 |
Valeant Pharmaceuticals International | | 17,000 | | 307,360 |
| | | | |
| | | | 4,569,000 |
| | | | |
Industrials 8.0% | | | | |
Aerospace & Defense 2.8% | | | | |
L-3 Communications Holdings, Inc. | | 18,200 | | 1,353,170 |
| | | | |
Industrial Conglomerates 4.0% | | | | |
Tyco International Ltd. | | 67,000 | | 1,933,620 |
| | | | |
Machinery 1.2% | | | | |
Pall Corp. | | 21,500 | | 577,490 |
| | | | |
Information Technology 14.2% | | | | |
Communications Equipment 2.7% | | | | |
C-COR, Inc.* | | 15,000 | | 72,900 |
Motorola, Inc. | | 43,300 | | 978,147 |
Nokia Oyj (ADR) | | 14,000 | | 256,200 |
| | | | |
| | | | 1,307,247 |
| | | | |
Computers & Peripherals 3.3% | | | | |
Maxtor Corp.* | | 62,500 | | 433,750 |
SanDisk Corp.* | | 18,000 | | 1,130,760 |
| | | | |
| | | | 1,564,510 |
| | | | |
Electronic Equipment & Instruments 0.0% | | | | |
Cogent, Inc.* | | 126 | | 2,858 |
Semiconductors & Semiconductor Equipment 7.2% | | | | |
Broadcom Corp. “A”* | | 17,000 | | 801,550 |
Cabot Microelectronics Corp.* | | 5,000 | | 146,650 |
Cirrus Logic, Inc.* | | 15,000 | | 100,200 |
Cree, Inc.* | | 5,500 | | 138,820 |
DSP Group, Inc.* | | 6,000 | | 150,360 |
Freescale Semiconductor, Inc. “B”* | | 4,000 | | 100,680 |
Intel Corp. | | 18,500 | | 461,760 |
Micron Technology, Inc.* | | 93,000 | | 1,237,830 |
RF Micro Devices, Inc.* | | 19,000 | | 102,790 |
Teradyne, Inc.* | | 15,500 | | 225,835 |
| | | | |
| | | | 3,466,475 |
| | | | |
Software 1.0% | | | | |
Advent Software, Inc.* | | 5,000 | | 144,550 |
Autodesk, Inc. | | 7,900 | | 339,305 |
| | | | 483,855 |
| | | | |
Total Common Stocks (Cost $41,163,214) | | | | 43,936,051 |
| | | | |
Exchange Traded Funds 2.0% | | | | |
Nasdaq-100 Index Tracking Stock (Cost $966,394) | | 24,500 | | 990,290 |
| | | | |
Cash Equivalents 6.1% | | | | |
Cash Management QP Trust, 4.26% (a) (Cost $2,913,689) | | 2,913,689 | | 2,913,689 |
| | | | |
| | |
| | | % of Net Assets | | Value ($) |
Total Investment Portfolio (Cost $45,043,297)+ | | 99.6 | | 47,840,030 |
| | | | |
Other Assets and Liabilities, Net | | 0.4 | | 186,212 |
| | | | |
Net Assets | | 100.0 | | 48,026,242 |
| | | | |
Notes to DWS Salomon Aggressive Growth VIP Portfolio of Investments
| * | Non-income producing security. |
| + | The cost for federal income tax purposes was $45,043,635. At December 31, 2005, net unrealized appreciation for all securities based on tax cost was $2,796,395. This consisted of aggregate gross unrealized appreciation for all securities in which there was an excess of value over tax cost of $4,014,439 and aggregate gross unrealized depreciation for all securities in which there was an excess of tax cost over value of $1,218,044. |
| (a) | Cash Management QP Trust, an affiliated fund, is managed by Deutsche Investment Management Americas Inc. The rate shown is the annualized seven-day yield at period end. |
| ADR: | American Depositary Receipt |
The accompanying notes are an integral part of the financial statements.
294
Financial Statements
Statement of Assets and Liabilities
as of December 31, 2005
| | | | |
Assets | | | | |
Investments: | | | | |
Investments in securities, at value (cost $42,129,608) | | $ | 44,926,341 | |
Investment in Cash Management QP Trust (cost $2,913,689) | | | 2,913,689 | |
Total investments in securities, at value (cost $45,043,297) | | | 47,840,030 | |
Cash | | | 10,000 | |
Dividends receivable | | | 20,464 | |
Interest receivable | | | 4,461 | |
Receivable for Portfolio share sold | | | 219,176 | |
Foreign taxes recoverable | | | 34 | |
Due from Advisor | | | 13,256 | |
Other assets | | | 1,348 | |
| | | | |
Total assets | | | 48,108,769 | |
| | | | |
Liabilities | | | | |
Payable for investments purchased | | | 1,920 | |
Accrued management fee | | | 4,372 | |
Other accrued expenses and payables | | | 76,235 | |
Total liabilities | | | 82,527 | |
| | | | |
Net assets, at value | | $ | 48,026,242 | |
| | | | |
Net Assets | | | | |
Net assets consist of: | | | | |
Accumulated net investment (loss) | | | (96 | ) |
Net unrealized appreciation (depreciation) on investments | | | 2,796,733 | |
Accumulated net realized gain (loss) | | | 8,377,555 | |
Paid-in capital | | | 36,852,050 | |
| | | | |
Net assets, at value | | $ | 48,026,242 | |
| | | | |
Class A | | | | |
Net Asset Value, offering and redemption price per share ($40,102,204 ÷ 3,827,569 outstanding shares of beneficial interest, $.01 par value, unlimited number of shares authorized) | | $ | 10.48 | |
| | | | |
Class B | | | | |
Net Asset Value, offering and redemption price per share ($7,924,038 ÷ 765,201 outstanding shares of beneficial interest, $.01 par value, unlimited number of shares authorized) | | $ | 10.36 | |
| | | | |
295
Statement of Operations
for the year ended December 31, 2005
| | | | |
Investment Income | | | | |
Income: | | | | |
Dividends (net of foreign taxes withheld of $714) | | $ | 205,820 | |
Interest | | | 1,950 | |
Interest — Cash Management QP Trust | | | 69,308 | |
Securities lending income, including income from Daily Assets Fund Institutional, net of borrower rebates | | | 3,336 | |
| | | | |
Total Income | | | 280,414 | |
| | | | |
Expenses: | | | | |
Management fee | | | 387,680 | |
Custodian and accounting fees | | | 93,465 | |
Distribution service fees (Class B) | | | 18,686 | |
Record keeping fees (Class B) | | | 10,854 | |
Auditing | | | 44,105 | |
Legal | | | 61,450 | |
Trustees’ fees and expenses | | | 1,621 | |
Reports to shareholders | | | 16,141 | |
Other | | | 7,952 | |
Total expenses before expense reductions | | | 641,954 | |
Expense reductions | | | (121,031 | ) |
Total expenses after expense reductions | | | 520,923 | |
| | | | |
Net investment income (loss) | | | (240,509 | ) |
| | | | |
| Realized and Unrealized Gain (Loss) on Investment Transactions | | | | |
Net realized gain (loss) from: | | | | |
Investments | | | 11,411,158 | |
Foreign currency related transactions | | | (3,917 | ) |
| | | 11,407,241 | |
Net unrealized appreciation (depreciation) during the period on: | | | | |
Investments | | | (5,770,378 | ) |
Foreign currency related transactions | | | (40 | ) |
| | | | |
| | | (5,770,418 | ) |
| | | | |
Net gain (loss) on investment transactions | | | 5,636,823 | |
| | | | |
Net increase (decrease) in net assets resulting from operations | | $ | 5,396,314 | |
| | | | |
The accompanying notes are an integral part of the financial statements.
296
Statement of Changes in Net Assets
| | | | | | | | |
| | | Years Ended December 31, | |
Increase (Decrease) in Net Assets | | 2005 | | | 2004 | |
Operations: | | | | | | | | |
Net investment income (loss) | | $ | (240,509 | ) | | $ | (298,559 | ) |
Net realized gain (loss) on investment transactions | | | 11,407,241 | | | | 4,643,201 | |
Net unrealized appreciation (depreciation) during the period on investment transactions | | | (5,770,418 | ) | | | 85,672 | |
Net increase (decrease) in net assets resulting from operations | | | 5,396,314 | | | | 4,430,314 | |
Portfolio share transactions: | | | | | | | | |
Class A | | | | | | | | |
Proceeds from shares sold | | | 6,159,388 | | | | 4,190,288 | |
Cost of shares redeemed | | | (5,441,650 | ) | | | (7,454,938 | ) |
Net increase (decrease) in net assets from Class A share transactions | | | 717,738 | | | | (3,264,650 | ) |
Class B | | | | | | | | |
Proceeds from shares sold | | | 1,219,223 | | | | 3,116,161 | |
Cost of shares redeemed | | | (1,500,940 | ) | | | (1,201,557 | ) |
Net increase (decrease) in net assets from Class B share transactions | | | (281,717 | ) | | | 1,914,604 | |
Increase (decrease) in net assets | | | 5,832,335 | | | | 3,080,268 | |
Net assets at beginning of period | | | 42,193,907 | | | | 39,113,639 | |
| | | | | | | | |
Net assets at end of period (including accumulated net investment loss of $96 and $213, respectively) | | $ | 48,026,242 | | | $ | 42,193,907 | |
| | | | | | | | |
| | |
Other Information | | | | | | | | |
Class A | | | | | | | | |
Shares outstanding at beginning of period | | | 3,784,410 | | | | 4,185,184 | |
Shares sold | | | 612,692 | | | | 493,942 | |
Shares redeemed | | | (569,533 | ) | | | (894,716 | ) |
Net increase (decrease) in Class A shares | | | 43,159 | | | | (400,774 | ) |
| | | | | | | | |
Shares outstanding at end of period | | | 3,827,569 | | | | 3,784,410 | |
| | | | | | | | |
Class B | | | | | | | | |
Shares outstanding at beginning of period | | | 793,650 | | | | 562,802 | |
Shares sold | | | 129,308 | | | | 370,510 | |
Shares redeemed | | | (157,757 | ) | | | (139,662 | ) |
Net increase (decrease) in Class B shares | | | (28,449 | ) | | | 230,848 | |
| | | | | | | | |
Shares outstanding at end of period | | | 765,201 | | | | 793,650 | |
| | | | | | | | |
The accompanying notes are an integral part of the financial statements.
297
Financial Highlights
Class A
| | | | | | | | | | | | | | | | | | | | |
Years Ended December 31, | | 2005 | | | 2004 | | | 2003 | | | 2002 | | | 2001a | |
Selected Per Share Data | | | | | | | | | | | | | | | | | | | | |
Net asset value, beginning of period | | $ | 9.23 | | | $ | 8.24 | | | $ | 6.08 | | | $ | 8.80 | | | $ | 10.00 | |
| | | | | | | | | | | | | | | | | | | | |
Income (loss) from investment operations: | | | | | | | | | | | | | | | | | | | | |
Net investment income (loss)b | | | (.05 | ) | | | (.06 | ) | | | (.06 | ) | | | (.05 | ) | | | (.02 | ) |
Net realized and unrealized gain (loss) on investment transactions | | | 1.30 | | | | 1.05 | | | | 2.22 | | | | (2.67 | ) | | | (1.18 | ) |
Total from investment operations | | | 1.25 | | | | .99 | | | | 2.16 | | | | (2.72 | ) | | | (1.20 | ) |
| | | | | | | | | | | | | | | | | | | | |
Net asset value, end of period | | $ | 10.48 | | | $ | 9.23 | | | $ | 8.24 | | | $ | 6.08 | | | $ | 8.80 | |
| | | | | | | | | | | | | | | | | | | | |
Total Return (%) | | | 13.54c | | | | 12.01c | | | | 35.53c | | | | (30.91 | ) | | | (12.00 | )c** |
Ratios to Average Net Assets and Supplemental Data | | | | | | | | | | | | | | | | | | | | |
Net assets, end of period ($ millions) | | | 40 | | | | 35 | | | | 34 | | | | 25 | | | | 23 | |
Ratio of expenses before expense reductions (%) | | | 1.44 | | | | 1.48 | | | | 1.46 | | | | 1.14 | | | | 1.97 | * |
Ratio of expenses after expense reductions (%) | | | 1.16 | | | | 1.30 | | | | 1.30 | | | | 1.14 | | | | 1.30 | * |
Ratio of net investment income (loss) (%) | | | (.50 | ) | | | (.71 | ) | | | (.85 | ) | | | (.71 | ) | | | (.40 | )* |
Portfolio turnover rate (%) | | | 166 | | | | 133 | | | | 115 | | | | 79 | | | | 40 | * |
| a | For the period from May 1, 2001 (commencement of operations) to December 31, 2001. |
| b | Based on average shares outstanding during the period. |
| c | Total return would have been lower had certain expenses not been reduced. |
Class B
| | | | | | | | | | | | | | | | |
Years Ended December 31, | | 2005 | | | 2004 | | | 2003 | | | 2002a | |
Selected Per Share Data | | | | | | | | | | | | | | | | |
Net asset value, beginning of period | | $ | 9.15 | | | $ | 8.21 | | | $ | 6.07 | | | $ | 6.51 | |
| | | | | | | | | | | | | | | | |
Income (loss) from investment operations: | | | | | | | | | | | | | | | | |
Net investment income (loss)b | | | (.09 | ) | | | (.09 | ) | | | (.09 | ) | | | (.03 | ) |
Net realized and unrealized gain (loss) on investment transactions | | | 1.30 | | | | 1.03 | | | | 2.23 | | | | (.41 | ) |
Total from investment operations | | | 1.21 | | | | .94 | | | | 2.14 | | | | (.44 | ) |
| | | | | | | | | | | | | | | | |
Net asset value, end of period | | $ | 10.36 | | | $ | 9.15 | | | $ | 8.21 | | | $ | 6.07 | |
| | | | | | | | | | | | | | | | |
Total Return (%) | | | 13.22c | | | | 11.45c | | | | 35.26c | | | | (6.76 | )** |
Ratios to Average Net Assets and Supplemental Data | | | | | | | | | | | | | | | | |
Net assets, end of period ($ millions) | | | 8 | | | | 7 | | | | 5 | | | | .1 | |
Ratio of expenses before expense reductions (%) | | | 1.84 | | | | 1.88 | | | | 1.85 | | | | 1.40 | * |
Ratio of expenses after expense reductions (%) | | | 1.55 | | | | 1.70 | | | | 1.69 | | | | 1.40 | * |
Ratio of net investment income (loss) (%) | | | (.89 | ) | | | (1.11 | ) | | | (1.24 | ) | | | (.82 | )* |
Portfolio turnover rate (%) | | | 166 | | | | 133 | | | | 115 | | | | 79 | |
| a | For the period July 1, 2002 (commencement of operations of Class B shares) to December 31, 2002. |
| b | Based on average shares outstanding during the period. |
| c | Total return would have been lower had certain expenses not been reduced. |
298
Performance Summary December 31, 2005
DWS Small Cap Growth VIP
All performance shown is historical, assumes reinvestment of all dividend and capital gain distributions and does not guarantee future results. Investment return and principal value fluctuate with changing market conditions so that, when redeemed, shares may be worth more or less than their original cost. Current performance may be lower or higher than the performance data quoted. Please visit www.dws-scudder.com for the Portfolio’s most recent month-end performance. Performance doesn’t reflect charges and fees (“contract charges”) associated with the separate account that invests in the Portfolio or any variable life insurance policy or variable annuity contract for which the Portfolio is an investment option. These charges and fees will reduce returns. While all share classes have the same underlying portfolio, their performance will differ.
This Portfolio is subject to stock market risk, meaning stocks in the Portfolio may decline in value for extended periods of time due to the activities and financial prospects of individual companies, or due to general market and economic conditions. Additionally, stocks of small companies involve greater risk than securities of larger, more-established companies, as they often have limited product lines, markets or financial resources and may be subject to more erratic and abrupt market movements. Finally, derivatives may be more volatile and less liquid than traditional securities and the Portfolio could suffer losses on its derivatives positions. Please read this Portfolio’s prospectus for specific details regarding its investments and risk profile.
Portfolio returns shown for all periods for Class B shares reflect a fee waiver and/or expense reimbursement. Without this waiver/reimbursement, returns for Class B shares would have been lower.
Growth of an Assumed $10,000 Investment in DWS Small Cap Growth VIP from 12/31/1995 to 12/31/2005
¨ DWS Small Cap Growth VIP — Class A
¨ Russell 2000 Growth Index
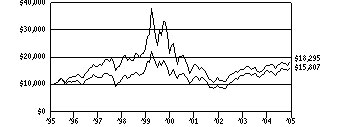
Yearly periods ended December 31
The Russell 2000 Growth Index is an unmanaged index (with no defined investment objective) of those securities in the Russell 2000 Index with a higher price-to-book ratio and higher forecasted growth values. Index returns assume reinvested dividends and, unlike Portfolio returns, do not reflect any fees or expenses. It is not possible to invest directly into an index.
Comparative Results
| | | | | | | | | | | | | | | | | | |
DWS Small Cap Growth VIP | | 1-Year | | | 3-Year | | | 5-Year | | | 10-Year | |
Class A | | Growth of $10,000 | | $ | 10,707 | | | $ | 15,803 | | | $ | 7,486 | | | $ | 18,295 | |
| | Average annual total return | | | 7.07 | % | | | 16.48 | % | | | -5.63 | % | | | 6.23 | % |
Russell 2000 Growth Index | | Growth of $10,000 | | $ | 10,415 | | | $ | 17,685 | | | $ | 11,195 | | | $ | 15,807 | |
| | Average annual total return | | | 4.15 | % | | | 20.93 | % | | | 2.28 | % | | | 4.69 | % |
| | | | |
DWS Small Cap Growth VIP | | | | | 1-Year | | | 3-Year | | | Life of Class* | |
| Class B | | Growth of $10,000 | | | | | | $ | 10,673 | | | $ | 15,634 | | | $ | 14,185 | |
| | Average annual total return | | | | | | | 6.73 | % | | | 16.06 | % | | | 10.51 | % |
Russell 2000 Growth Index | | Growth of $10,000 | | | | | | $ | 10,415 | | | $ | 17,685 | | | $ | 14,921 | |
| | Average annual total return | | | | | | | 4.15 | % | | | 20.93 | % | | | 12.11 | % |
The growth of $10,000 is cumulative.
| * | The Portfolio commenced offering Class B shares on July 1, 2002. Index returns begin June 30, 2002. |
299
Information About Your Portfolio’s Expenses
DWS Small Cap Growth VIP
As an investor of the Portfolio, you incur two types of costs: ongoing expenses and transaction costs. Ongoing expenses include management fees, distribution and service (12b-1) fees and other Portfolio expenses. Examples of transaction costs include sales charges (loads), redemption fees and account maintenance fees, which are not shown in this section. The following tables are intended to help you understand your ongoing expenses (in dollars) of investing in the Portfolio and to help you compare these expenses with the ongoing expenses of investing in other mutual funds. In the most recent six-month period, the Portfolio limited these expenses for Class B; had it not done so, expenses would have been higher. The tables are based on an investment of $1,000 made at the beginning of the six-month period ended December 31, 2005.
The tables illustrate your Portfolio’s expenses in two ways:
Actual Portfolio Return. This helps you estimate the actual dollar amount of ongoing expenses (but not transaction costs) paid on a $1,000 investment in the Portfolio using the Portfolio’s actual return during the period. To estimate the expenses you paid over the period, simply divide your account value by $1,000 (for example, an $8,600 account value divided by $1,000 = 8.6), then multiply the result by the number in the “Expenses Paid per $1,000” line under the share class you hold.
Hypothetical 5% Portfolio Return. This helps you to compare your Portfolio’s ongoing expenses (but not transaction costs) with those of other mutual funds using the Portfolio’s actual expense ratio and a hypothetical rate of return of 5% per year before expenses. Examples using a 5% hypothetical Portfolio return may be found in the shareholder reports of other mutual funds. The hypothetical account values and expenses may not be used to estimate the actual ending account balance or expenses you paid for the period.
Please note that the expenses shown in these tables are meant to highlight your ongoing expenses only and do not reflect any transaction costs. The “Expenses Paid per $1,000” line of the tables is useful in comparing ongoing expenses only and will not help you determine the relative total expense of owning different funds. If these transaction costs had been included, your costs would have been higher.
Expenses and Value of a $1,000 Investment for the six months ended December 31, 2005
| | | | | | |
Actual Portfolio Return | | Class A | | Class B |
Beginning Account Value 7/1/05 | | $ | 1,000.00 | | $ | 1,000.00 |
Ending Account Value 12/31/05 | | $ | 1,059.70 | | $ | 1,058.00 |
Expenses Paid per $1,000* | | $ | 3.74 | | $ | 5.65 |
| | |
Hypothetical 5% Portfolio Return | | Class A | | Class B |
Beginning Account Value 7/1/05 | | $ | 1,000.00 | | $ | 1,000.00 |
Ending Account Value 12/31/05 | | $ | 1,021.58 | | $ | 1,019.71 |
Expenses Paid per $1,000* | | $ | 3.67 | | $ | 5.55 |
| * | Expenses are equal to the Portfolio’s annualized expense ratio for each share class, multiplied by the average account value over the period, multiplied by the number of days in the most recent six-month period, then divided by 365. |
| | | | | | |
Annualized Expense Ratios | | Class A | | | Class B | |
DWS Variable Series II — DWS Small Cap Growth VIP | | .72 | % | | 1.09 | % |
For more information, please refer to the Portfolio’s prospectus.
These tables do not reflect charges and fees (“contract charges”) associated with the separate account that invests in the portfolio or any variable life insurance policy or variable annuity contract for which the portfolio is an investment option.
300
Management Summary December 31, 2005
DWS Small Cap Growth VIP
The stock market was weighed down by concerns over rising interest rates and the possibility of a resurgence in inflation during the 12-month period ended December 31, 2005. Expressing concern about inflation, the US Federal Reserve Board (the Fed) has been raising short-term interest rates steadily since June 2004, but long-term rates continue to remain near historical lows. On the plus side, the US economy appears to be somewhat stronger than what might be expected at this stage of an expansion. Gross domestic product has expanded for 16 consecutive quarters, beginning in the fourth quarter of 2001, and corporate profits are still increasing. Other positive signs in 2005, which contributed to performance, included increases in business investment in capital projects and information technology.
For its most recent fiscal year, the Portfolio returned 7.07% (Class A shares, unadjusted for contract charges), outperforming the 4.15% return of the Russell 2000 Growth Index.
During the 12-month period, the Portfolio benefited from strong stock selection within the health care, information technology and consumer discretionary sectors. Although the Portfolio’s energy holdings delivered strong positive returns, they underperformed their energy counterparts in the benchmark index. An underweight in industrials also detracted from performance. Going forward, the managers are optimistic that the Portfolio will perform well in the current market environment.
Samuel A. Dedio
Robert S. Janis
Co-Lead Portfolio Managers
Deutsche Investment Management Americas Inc.
All performance shown is historical, assumes reinvestment of all dividend and capital gain distributions, and does not guarantee future results. Investment return and principal value fluctuate with changing market conditions so that, when redeemed, shares may be worth more or less than their original cost. Current performance may be lower or higher than the performance data quoted. Please visit www.dws-scudder.com for the product’s most recent month-end performance. Performance doesn’t reflect charges and fees (“contract charges”) associated with the separate account that invests in the Portfolio or any variable life insurance policy or variable annuity contract for which the Portfolio is an investment option. These charges and fees will reduce returns.
Risk Considerations
This Portfolio is subject to stock market risk, meaning stocks in the Portfolio may decline in value for extended periods of time due to the activities and financial prospects of individual companies, or due to general market and economic conditions. Additionally, stocks of small companies involve greater risk than securities of larger, more-established companies, as they often have limited product lines, markets or financial resources and may be subject to more erratic and abrupt market movements. Finally, derivatives may be more volatile and less liquid than traditional securities and the Portfolio could suffer losses on its derivatives positions. Please read this Portfolio’s prospectus for specific details regarding this product’s investments and risk profile.
The Russell 2000 Growth Index is an unmanaged index (with no defined investment objective) of those securities in the Russell 2000 Index with a higher price-to-book ratio and higher forecasted growth values. Index returns assume reinvestment of all dividends and, unlike portfolio returns, do not reflect any fees or expenses. It is not possible to invest directly into an index.
Portfolio management market commentary is as of December 31, 2005, and may not come to pass. This information is subject to change at any time based on market and other conditions.
301
Portfolio Summary
DWS Small Cap Growth VIP
| | | | | | |
Asset Allocation (Excludes Security Lending Collateral) | | 12/31/05 | | | 12/31/04 | |
Common Stocks | | 99 | % | | 97 | % |
Cash Equivalent | | 1 | % | | 3 | % |
| | | | | | |
| | 100 | % | | 100 | % |
| | | | | | |
| | |
Sector Diversification (As a % of Common Stocks) | | 12/31/05 | | | 12/31/04 | |
Health Care | | 30 | % | | 24 | % |
Information Technology | | 23 | % | | 29 | % |
Consumer Discretionary | | 17 | % | | 22 | % |
Financials | | 12 | % | | 8 | % |
Energy | | 9 | % | | 3 | % |
Consumer Staples | | 4 | % | | 5 | % |
Industrials | | 4 | % | | 8 | % |
Telecommunication Services | | 1 | % | | — | |
Materials | | — | | | 1 | % |
| | | | | | |
| | 100 | % | | 100 | % |
| | | | | | |
Asset allocation and sector diversification are subject to change.
For more complete details about the Portfolio’s investment portfolio, see page 15. A quarterly Fact Sheet is available upon request. Information concerning portfolio holdings of the Portfolio as of month end will be posted to www.dws-scudder.com on the 15th of the following month.
Following the Portfolio’s fiscal first and third quarter-end, a complete portfolio holdings listing is filed with the SEC on Form N-Q. The form will be available on the SEC’s Web site at www.sec.gov, and it also may be reviewed and copied at the SEC’s Public Reference Room in Washington, D.C. Information on the operation of the SEC’s Public Reference Room may be obtained by calling (800) SEC-0330.
302
Investment Portfolio December 31, 2005
DWS Small Cap Growth VIP
| | | | |
| | | Shares | | Value ($) |
Common Stocks 99.1% | | | | |
Consumer Discretionary 16.5% | | | | |
Hotels Restaurants & Leisure 9.8% | | | | |
Buffalo Wild Wings, Inc.* (a) | | 95,000 | | 3,154,950 |
McCormick & Schmick’s Seafood Restaurants, Inc.* | | 118,600 | | 2,681,546 |
Orient-Express Hotels Ltd. “A” | | 155,800 | | 4,910,816 |
P.F. Chang’s China Bistro, Inc.* | | 126,100 | | 6,258,343 |
Red Robin Gourmet Burgers, Inc.* (a) | | 120,000 | | 6,115,200 |
Shuffle Master, Inc.* (a) | | 180,700 | | 4,542,798 |
| | | | |
| | | | 27,663,653 |
| | | | |
Textiles, Apparel & Luxury Goods 6.7% | | | | |
Gildan Activewear, Inc. “A”* | | 150,100 | | 6,431,785 |
Guess?, Inc.* | | 249,700 | | 8,889,320 |
The Warnaco Group, Inc.* | | 134,500 | | 3,593,840 |
| | | | |
| | | | 18,914,945 |
| | | | |
Consumer Staples 4.4% | | | | |
Food & Staples Retailing 2.1% | | | | |
Herbalife Ltd.* | | 182,400 | | 5,931,648 |
| | | | |
| | |
Household Products 2.3% | | | | |
Jarden Corp.*(a) | | 217,050 | | 6,544,058 |
| | | | |
| | |
Energy 9.1% | | | | |
Energy Equipment & Services 4.7% | | | | |
Atwood Oceanics, Inc.* | | 61,500 | | 4,798,845 |
Dresser-Rand Group, Inc.* | | 120,700 | | 2,918,526 |
Grey Wolf, Inc.* | | 726,000 | | 5,611,980 |
| | | | |
| | | | 13,329,351 |
| | | | |
Oil, Gas & Consumable Fuels 4.4% | | | | |
Bill Barrett Corp.* | | 174,700 | | 6,745,167 |
Comstock Resources, Inc.* | | 185,400 | | 5,656,554 |
| | | | |
| | | | 12,401,721 |
| | | | |
Financials 12.0% | | | | |
Banks 6.8% | | | | |
PrivateBancorp, Inc. | | 115,800 | | 4,119,006 |
Signature Bank* | | 206,500 | | 5,796,455 |
Texas Capital Bancshares, Inc.* | | 168,700 | | 3,780,567 |
Wintrust Financial Corp. | | 101,800 | | 5,588,820 |
| | | | |
| | | | 19,284,848 |
| | | | |
Consumer Finance 3.4% | | | | |
Euronet Worldwide, Inc.* | | 221,800 | | 6,166,040 |
Heartland Payment Systems, Inc.*(a) | | 157,900 | | 3,420,114 |
| | | | |
| | | | 9,586,154 |
| | | | |
Diversified Financial Services 1.8% | | | | |
National Financial Partners Corp. | | 94,700 | | 4,976,485 |
| | | | |
| | |
Health Care 29.7% | | | | |
Health Care Equipment & Supplies 8.2% | | | | |
American Medical Systems Holdings, Inc.* | | 244,100 | | 4,352,303 |
ArthroCare Corp.* | | 157,400 | | 6,632,836 |
303
| | | | | | |
| | | Shares | | | Value ($) | |
Hologic, Inc.* | | 127,800 | | | 4,846,176 | |
Schick Technologies, Inc.* | | 98,500 | | | 3,246,461 | |
Viasys Healthcare, Inc.* | | 155,100 | | | 3,986,070 | |
| | | | | | |
| | | | | 23,063,846 | |
| | | | | | |
Health Care Providers & Services 18.5% | | | | | | |
Amedisys, Inc.* (a) | | 169,000 | | | 7,138,560 | |
American Healthways, Inc.* (a) | | 126,500 | | | 5,724,125 | |
AMERIGROUP Corp.* | | 299,100 | | | 5,820,486 | |
Centene Corp.* | | 301,400 | | | 7,923,806 | |
Chemed Corp. | | 107,300 | | | 5,330,664 | |
Eclipsys Corp.* | | 242,000 | | | 4,581,060 | |
HealthExtras, Inc.* | | 153,500 | | | 3,852,850 | |
LCA-Vision, Inc. (a) | | 121,400 | | | 5,767,714 | |
Psychiatric Solutions, Inc.* | | 100,500 | | | 5,903,370 | |
| | | | | | |
| | | | | 52,042,635 | |
| | | | | | |
Pharmaceuticals 3.0% | | | | | | |
Adams Respiratory Therapeutics, Inc.*(a) | | 100,600 | | | 4,090,396 | |
ViroPharma, Inc.* | | 236,700 | | | 4,390,785 | |
| | | | | | |
| | | | | 8,481,181 | |
| | | | | | |
Industrials 3.7% | | | | | | |
Machinery | | | | | | |
Actuant Corp. “A” | | 118,900 | | | 6,634,620 | |
Watts Water Technologies, Inc. ”A” | | 125,600 | | | 3,804,424 | |
| | | | | | |
| | | | | 10,439,044 | |
| | | | | | |
Information Technology 23.1% | | | | | | |
Communications Equipment 2.4% | | | | | | |
Foundry Networks, Inc.* | | 488,500 | | | 6,746,185 | |
| | | | | | |
| | |
Electronic Equipment & Instruments 1.5% | | | | | | |
Cognex Corp. | | 139,400 | | | 4,194,546 | |
| | | | | | |
| | |
Internet Software & Services 4.3% | | | | | | |
Digital River, Inc.*(a) | | 221,300 | | | 6,581,462 | |
j2 Global Communications, Inc.*(a) | | 133,300 | | | 5,697,242 | |
| | | | | | |
| | | | | 12,278,704 | |
| | | | | | |
Semiconductors & Semiconductor Equipment 6.2% | | | | | | |
FormFactor, Inc.* | | 213,600 | | | 5,218,248 | |
Power Integrations, Inc.* | | 262,100 | | | 6,240,601 | |
Semtech Corp.* | | 324,800 | | | 5,930,848 | |
| | | | | | |
| | | | | 17,389,697 | |
| | | | | | |
Software 8.7% | | | | | | |
Hyperion Solutions Corp.* | | 180,300 | | | 6,458,346 | |
Kronos, Inc.* | | 99,200 | | | 4,152,512 | |
Mentor Graphics Corp.* | | 635,400 | | | 6,570,036 | |
THQ, Inc.* | | 307,250 | | | 7,327,913 | |
| | | | | | |
| | | | | 24,508,807 | |
| | | | | | |
Telecommunication Services 0.6% | | | | | | |
Wireless Telecommunication Services | | | | | | |
WiderThan Co., Ltd. (ADR)* | | 107,100 | | | 1,622,565 | |
| | | | | | |
Total Common Stocks (Cost $229,588,114) | | | | | 279,400,073 | |
| | | | | | |
Preferred Stocks 0.0% | | | | | | |
Information Technology | | | | | | |
Software | | | | | | |
FusionOne “D”*(b) (Cost $1,250,002) | | 230,203 | | | 0 | |
| | | | | | |
Securities Lending Collateral 16.1% | | | | | | |
Daily Assets Fund Institutional, 4.28%(c)(d) (Cost $45,223,925) | | 45,223,925 | | | 45,223,925 | |
| | | | | | |
Cash Equivalents 1.1% | | | | | | |
Cash Management QP Trust, 4.26%(e) (Cost $3,043,683) | | 3,043,683 | | | 3,043,683 | |
| | | | | | |
| | |
| | | % of Net Assets | | | Value ($) | |
Total Investment Portfolio (Cost $279,105,724)+ | | 116.3 | | | 327,667,681 | |
Other Assets and Liabilities, Net | | (16.3 | ) | | (45,832,173 | ) |
| | | | | | |
Net Assets | | 100.0 | | | 281,835,508 | |
| | | | | | |
304
Notes to DWS Small Cap Growth VIP Portfolio of Investments
| + | The cost for federal income tax purposes was $279,201,364. At December 31, 2005, net unrealized appreciation for all securities based on tax cost was $48,466,317. This consisted of aggregate gross unrealized appreciation for all securities in which there was an excess of value over tax cost of $52,589,521 and aggregate gross unrealized depreciation for all securities in which there was an excess of tax cost over value of $4,123,204. |
| * | Non-income producing security. |
| (a) | All or a portion of these securities were on loan (see Notes to Financial Statements). The value of all securities loaned at December 31, 2005 amounted to $43,751,161 which is 15.5% of net assets. |
| (b) | The Portfolio may purchase securities that are subject to legal or contractual restrictions on resale (“restricted securities”). Restricted securities are securities which have not been registered with the Securities and Exchange Commission under the Securities Act of 1933. The Portfolio may be unable to sell a restricted security and it may be more difficult to determine a market value for a restricted security. Moreover, if adverse market conditions were to develop during the period between the Portfolio’s decision to sell a restricted security and the point at which the Portfolio is permitted or able to sell such security, the Portfolio might obtain a price less favorable than the price that prevailed when it decided to sell. This investment practice, therefore, could have the effect of increasing the level of illiquidity of the Portfolio. The future value of these securities is uncertain and there may be changes in the estimated value of these securities. |
Schedule of Restricted Securities
| | | | | | | | | |
Restricted Security | | Acquisition Date | | Acquisition Cost ($) | | Value ($) | | As % of Net Assets | |
FusionOne “D” | | October 2000 | | 1,250,002 | | 0 | | 0 | % |
| (c) | Daily Assets Fund Institutional, an affiliated fund, is managed by Deutsche Asset Management, Inc. The rate shown is the annualized seven-day yield at period end. |
| (d) | Represents collateral held in connection with securities lending. |
| (e) | Cash Management QP Trust, an affiliated fund, is managed by Deutsche Investment Management Americas Inc. The rate shown is the annualized seven-day yield at period end. |
| ADR: | American Depositary Receipt |
The accompanying notes are an integral part of the financial statements.
305
Financial Statements
Statement of Assets and Liabilities
as of December 31, 2005
| | | | |
Assets | | | | |
Investments: | | | | |
Investments in securities, at value (cost $230,838,116) — including $43,751,161 of securities loaned | | $ | 279,400,073 | |
Investment in Daily Assets Fund Institutional (cost $45,223,925)* | | | 45,223,925 | |
Investment in Cash Management QP Trust (cost $3,043,683) | | | 3,043,683 | |
Total investments in securities, at value (cost $279,105,724) | | | 327,667,681 | |
Receivable for investments sold | | | 208,066 | |
Dividends receivable | | | 14,205 | |
Interest receivable | | | 32,196 | |
Receivable for Portfolio shares sold | | | 31,237 | |
Other assets | | | 8,540 | |
Total assets | | | 327,961,925 | |
Liabilities | | | | |
Payable for Fund shares redeemed | | | 652,450 | |
Payable upon return of securities loaned | | | 45,223,925 | |
Accrued management fee | | | 160,837 | |
Other accrued expenses and payables | | | 89,205 | |
Total liabilities | | | 46,126,417 | |
| | | | |
Net assets, at value | | $ | 281,835,508 | |
| | | | |
Net Assets | | | | |
Net assets consist of: | | | | |
Accumulated net investment loss | | | (11,255 | ) |
Net unrealized appreciation (depreciation) on investments | | | 48,561,957 | |
Accumulated net realized gain (loss) | | | (135,624,816 | ) |
Paid-in capital | | | 368,909,622 | |
| | | | |
Net assets, at value | | $ | 281,835,508 | |
| | | | |
Class A | | | | |
| Net Asset Value, offering and redemption price per share ($243,106,860 ÷ 18,035,147 outstanding shares of beneficial interest, $.01 par value, unlimited number of shares authorized) | | $ | 13.48 | |
| | | | |
Class B | | | | |
| Net Asset Value, offering and redemption price per share ($38,728,648 ÷ 2,908,589 outstanding shares of beneficial interest, $.01 par value, unlimited number of shares authorized) | | $ | 13.32 | |
| | | | |
| * | Represents collateral on securities loaned. |
306
Statement of Operations
for the year ended December 31, 2005
| | | | |
Investment Income | | | | |
Income: | | | | |
Dividends | | $ | 330,239 | |
Interest — Cash Management QP Trust | | | 190,158 | |
Securities lending income, including income from Daily Assets Fund Institutional, net of borrower rebates | | | 115,056 | |
Total Income | | | 635,453 | |
Expenses: | | | | |
Management fee | | | 1,681,135 | |
Custodian fees | | | 17,101 | |
Distribution service fees (Class B) | | | 85,045 | |
Record keeping fees (Class B) | | | 51,342 | |
Auditing | | | 59,636 | |
Legal | | | 9,966 | |
Trustees’ fees and expenses | | | 9,755 | |
Reports to shareholders | | | 64,028 | |
Other | | | 20,959 | |
Total expenses before expense reductions | | | 1,998,967 | |
Expense reductions | | | (14,458 | ) |
Total expenses after expense reductions | | | 1,984,509 | |
| | | | |
Net investment income (loss) | | | (1,349,056 | ) |
| | | | |
| |
Realized and Unrealized Gain (Loss) on Investment Transactions | | | | |
Net realized gain (loss) from investments | | | 24,013,018 | |
Net realized gains on investments not meeting investment guidelines of the Portfolio | | | 49,496 | |
Net unrealized appreciation (depreciation) during the period on investments | | | (117,156 | ) |
| | | | |
Net gain (loss) on investment transactions | | | 23,945,358 | |
| | | | |
Net increase (decrease) in net assets resulting from operations | | $ | 22,596,302 | |
| | | | |
The accompanying notes are an integral part of the financial statements.
307
Statement of Changes in Net Assets
| | | | | | | | |
| | | Years Ended December 31, | |
Increase (Decrease) in Net Assets | | 2005 | | | 2004 | |
Operations: | | | | | | | | |
Net investment income (loss) | | $ | (1,349,056 | ) | | $ | (1,143,378 | ) |
Net realized gain (loss) on investment transactions | | | 24,013,018 | | | | 9,898,921 | |
Net realized gains on investments not meeting investment guidelines of the Portfolio | | | 49,496 | | | | — | |
Net unrealized appreciation (depreciation) during the period on investment transactions | | | (117,156 | ) | | | 14,522,914 | |
Net increase (decrease) in net assets resulting from operations | | | 22,596,302 | | | | 23,278,457 | |
Portfolio share transactions: | | | | | | | | |
Class A | | | | | | | | |
Proceeds from shares sold | | | 24,384,647 | | | | 41,819,691 | |
Net assets acquired in tax free reorganization | | | 37,649,364 | | | | — | |
Cost of shares redeemed | | | (48,722,289 | ) | | | (62,320,969 | ) |
Net increase (decrease) in net assets from Class A share transactions | | | 13,311,722 | | | | (20,501,278 | ) |
Class B | | | | | | | | |
Proceeds from shares sold | | | 11,204,648 | | | | 11,462,792 | |
Net assets acquired in tax free reorganization | | | 7,786,470 | | | | — | |
Cost of shares redeemed | | | (11,469,498 | ) | | | (1,207,862 | ) |
Net increase (decrease) in net assets from Class B share transactions | | | 7,521,620 | | | | 10,254,930 | |
Increase (decrease) in net assets | | | 43,429,644 | | | | 13,032,109 | |
Net assets at beginning of period | | | 238,405,864 | | | | 225,373,755 | |
| | | | | | | | |
Net assets at end of period (including accumulated net investment loss of $11,255 and $1,853, respectively) | | $ | 281,835,508 | | | $ | 238,405,864 | |
| | | | | | | | |
| | |
Other Information | | | | | | | | |
Class A | | | | | | | | |
Shares outstanding at beginning of period | | | 16,708,714 | | | | 18,522,593 | |
Shares sold | | | 1,926,487 | | | | 3,534,946 | |
Shares issued in tax free reorganization | | | 3,256,621 | | | | — | |
Shares redeemed | | | (3,856,675 | ) | | | (5,348,825 | ) |
Net increase (decrease) in Class A shares | | | 1,326,433 | | | | (1,813,879 | ) |
| | | | | | | | |
Shares outstanding at end of period | | | 18,035,147 | | | | 16,708,714 | |
| | | | | | | | |
Class B | | | | | | | | |
Shares outstanding at beginning of period | | | 2,250,352 | | | | 1,358,975 | |
Shares sold | | | 951,158 | | | | 996,848 | |
Shares issued in tax free reorganization | | | 680,062 | | | | — | |
Shares redeemed | | | (972,983 | ) | | | (105,471 | ) |
Net increase (decrease) in Class B shares | | | 658,237 | | | | 891,377 | |
| | | | | | | | |
Shares outstanding at end of period | | | 2,908,589 | | | | 2,250,352 | |
| | | | | | | | |
The accompanying notes are an integral part of the financial statements.
308
Financial Highlights
Class A
| | | | | | | | | | | | | | | | | | | | |
Years Ended December 31, | | 2005 | | | 2004 | | | 2003 | | | 2002 | | | 2001 | |
Selected Per Share Data | | | | | | | | | | | | | | | | | | | | |
Net asset value, beginning of period | | $ | 12.59 | | | $ | 11.34 | | | $ | 8.53 | | | $ | 12.80 | | | $ | 21.64 | |
| | | | | | | | | | | | | | | | | | | | |
Income (loss) from investment operations: | | | | | | | | | | | | | | | | | | | | |
Net investment income (loss)a | | | (.06 | ) | | | (.05 | ) | | | (.04 | ) | | | (.02 | ) | | | (.02 | ) |
Net realized and unrealized gain (loss) on investment transactions | | | .95 | | | | 1.30 | | | | 2.85 | | | | (4.25 | ) | | | (6.27 | ) |
Total from investment operations | | | .89 | | | | 1.25 | | | | 2.81 | | | | (4.27 | ) | | | (6.29 | ) |
Less distributions from: | | | | | | | | | | | | | | | | | | | | |
Net realized gain on investment transactions | | | — | | | | — | | | | — | | | | — | | | | (2.52 | ) |
Return of capital | | | — | | | | — | | | | — | | | | — | | | | (.03 | ) |
Total distributions | | | — | | | | — | | | | — | | | | — | | | | (2.55 | ) |
| | | | | | | | | | | | | | | | | | | | |
Net asset value, end of period | | $ | 13.48 | | | $ | 12.59 | | | $ | 11.34 | | | $ | 8.53 | | | $ | 12.80 | |
| | | | | | | | | | | | | | | | | | | | |
Total Return (%) | | | 7.07 | b | | | 11.02 | | | | 32.94 | | | | (33.36 | ) | | | (28.91 | ) |
Ratios to Average Net Assets and Supplemental Data | | | | | | | | | | | | | | | | | | | | |
Net assets, end of period ($ millions) | | | 243 | | | | 210 | | | | 210 | | | | 154 | | | | 232 | |
Ratio of expenses (%) | | | .72 | | | | .71 | | | | .69 | | | | .71 | | | | .68 | |
Ratio of net investment income (loss) (%) | | | (.47 | ) | | | (.47 | ) | | | (.41 | ) | | | (.24 | ) | | | (.12 | ) |
Portfolio turnover rate (%) | | | 94 | | | | 117 | | | | 123 | | | | 68 | | | | 143 | |
| a | Based on average shares outstanding during the period. |
| b | In 2005, the Portfolio realized a gain of $49,496 on the disposal of an investment not meeting the Portfolio’s investment restrictions. This gain had no effect on the total return. |
Class B
| | | | | | | | | | | | | | | | |
Years Ended December 31, | | 2005 | | | 2004 | | | 2003 | | | 2002a | |
Selected Per Share Data | | | | | | | | | | | | | | | | |
Net asset value, beginning of period | | $ | 12.48 | | | $ | 11.29 | | | $ | 8.52 | | | $ | 9.39 | |
| | | | | | | | | | | | | | | | |
Income (loss) from investment operations: | | | | | | | | | | | | | | | | |
Net investment income (loss)b | | | (.11 | ) | | | (.10 | ) | | | (.09 | ) | | | (.02 | ) |
Net realized and unrealized gain (loss) on investment transactions | | | .95 | | | | 1.29 | | | | 2.86 | | | | (.85 | ) |
Total from investment operations | | | .84 | | | | 1.19 | | | | 2.77 | | | | (.87 | ) |
| | | | | | | | | | | | | | | | |
Net asset value, end of period | | $ | 13.32 | | | $ | 12.48 | | | $ | 11.29 | | | $ | 8.52 | |
| | | | | | | | | | | | | | | | |
Total Return (%) | | | 6.73 | d | | | 10.54 | | | | 32.51 | | | | (9.27 | )** |
Ratios to Average Net Assets and Supplemental Data | | | | | | | | | | | | | | | | |
Net assets, end of period ($ millions) | | | 39 | | | | 28 | | | | 15 | | | | .5 | |
Ratio of expenses before expense reductions (%) | | | 1.12 | | | | 1.10 | | | | 1.08 | | | | .96 | * |
Ratio of expenses after expense reductions (%) | | | 1.09 | | | | 1.09 | | | | 1.08 | | | | .96 | * |
Ratio of net investment income (loss) (%) | | | (.84 | ) | | | (.85 | ) | | | (.80 | ) | | | (.39 | )* |
Portfolio turnover rate (%) | | | 94 | | | | 117 | | | | 123 | | | | 68 | |
| a | For the period July 1, 2002 (commencement of operations of Class B shares) to December 31, 2002. |
| b | Based on average shares outstanding during the period. |
| c | Total return would have been lower had certain expenses not been reduced. |
| d | In 2005, the Portfolio realized a gain of $49,496 on the disposal of an investment not meeting the Portfolio’s investment restrictions. This gain had no effect on the total return. |
309
Performance Summary December 31, 2005
DWS Strategic Income VIP
All performance shown is historical, assumes reinvestment of all dividend and capital gain distributions and does not guarantee future results. Investment return and principal value fluctuate with changing market conditions so that, when redeemed, shares may be worth more or less than their original cost. Current performance may be lower or higher than the performance data quoted. Please visit www.dws-scudder.com for the Portfolio’s most recent month-end performance. Performance doesn’t reflect charges and fees (“contract charges”) associated with the separate account that invests in the Portfolio or any variable life insurance policy or variable annuity contract for which the Portfolio is an investment option. These charges and fees will reduce returns. While all share classes have the same underlying portfolio, their performance will differ.
The Portfolio invests in individual bonds whose yields and market values fluctuate so that your investment may be worth more or less than its original cost. Bond investments are subject to interest-rate risk such that when interest rates rise, the price of the bonds, and thus the value of the bond fund, can decline and the investor can lose principal value. Additionally, investments by the Portfolio in lower-rated bonds present greater risk to principal and income than investments in higher-quality securities. Finally, investing in foreign securities presents certain unique risks not associated with domestic investments, such as currency fluctuation, political and economic changes and market risks. All of these factors may result in greater share price volatility. Please read this Portfolio’s prospectus for specific details regarding its investments and risk profile.
Portfolio returns shown for all periods for Class B shares reflect a fee waiver and/or expense reimbursement. Without this waiver/reimbursement, returns would have been lower.
Growth of an Assumed $10,000 Investment in DWS Strategic Income VIP from 5/1/1997 to 12/31/2005
¨ DWS Strategic Income VIP — Class A
¨ Citigroup World Government Bond Index
¨ JP Morgan Emerging Markets Bond Plus Index
¨ Merrill Lynch High Yield Master Index
¨ Lehman Brothers US Treasury Index
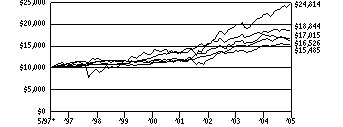
Yearly periods ended December 31
The Citigroup World Government Bond Index (formerly known as Salomon Smith Barney World Government Bond Index) is an unmanaged index comprised of government bonds from 18 developed countries (including the US) with maturities greater than one year. JP Morgan Emerging Markets Bond Plus Index is an unmanaged foreign securities index of US dollar- and other external-currency-denominated Brady bonds, loans, Eurobonds and local market debt instruments traded in emerging markets. The Merrill Lynch High Yield Master Index is an unmanaged index which tracks the performance of below investment grade US dollar- denominated corporate bonds publicly issued in the US domestic market. Lehman Brothers US Treasury Index is an unmanaged index reflecting the performance of all public obligations and does not focus on one particular segment of the Treasury market.
Index returns assume reinvested dividends and, unlike Portfolio returns, do not reflect any fees or expenses. It is not possible to invest directly into an index.
Comparative Results
| | | | | | | | | | | | | | | | | | |
DWS Strategic Income VIP | | 1-Year | | | 3-Year | | | 5-Year | | | Life of Portfolio* | |
Class A | | Growth of $10,000 | | $ | 10,238 | | | $ | 11,991 | | | $ | 14,044 | | | $ | 15,485 | |
| | Average annual total return | | | 2.38 | % | | | 6.24 | % | | | 7.03 | % | | | 5.18 | % |
Citigroup World Government Bond Index | | Growth of $10,000 | | $ | 9,312 | | | $ | 11,809 | | | $ | 13,971 | | | $ | 16,526 | |
| | Average annual total return | | | -6.88 | % | | | 5.70 | % | | | 6.92 | % | | | 5.97 | % |
JP Morgan Emerging Markets Bond Plus Index | | Growth of $10,000 | | $ | 11,186 | | | $ | 16,107 | | | $ | 18,255 | | | $ | 24,814 | |
| | Average annual total return | | | 11.86 | % | | | 17.22 | % | | | 12.79 | % | | | 11.05 | % |
Merrill Lynch High Yield Master Index | | Growth of $10,000 | | $ | 10,283 | | | $ | 14,491 | | | $ | 15,214 | | | $ | 17,015 | |
| | Average annual total return | | | 2.83 | % | | | 13.16 | % | | | 8.76 | % | | | 6.32 | % |
Lehman Brothers US Treasury Index | | Growth of $10,000 | | $ | 10,284 | | | $ | 12,091 | | | $ | 15,207 | | | $ | 18,844 | |
| | Average annual total return | | | 2.84 | % | | | 6.53 | % | | | 8.74 | % | | | 7.58 | % |
The growth of $10,000 is cumulative.
| * | The Portfolio commenced operations on May 1, 1997. Index returns begin April 30, 1997. |
Comparative Results
| | | | | | | | | | |
DWS Strategic Income VIP | | 1-Year | | | Life of Class** | |
Class B | | Growth of $10,000 | | $ | 10,192 | | | $ | 11,363 | |
| | Average annual total return | | | 1.92 | % | | | 4.91 | % |
Citigroup World Government Bond Index | | Growth of $10,000 | | $ | 9,312 | | | $ | 11,317 | |
| | Average annual total return | | | -6.88 | % | | | 4.75 | % |
JP Morgan Emerging Markets Bond Plus Index | | Growth of $10,000 | | $ | 11,186 | | | $ | 14,091 | |
| | Average annual total return | | | 11.86 | % | | | 13.71 | % |
Merrill Lynch High Yield Master Index | | Growth of $10,000 | | $ | 10,283 | | | $ | 12,835 | |
| | Average annual total return | | | 2.83 | % | | | 9.81 | % |
Lehman Brothers US Treasury Index | | Growth of $10,000 | | $ | 10,284 | | | $ | 11,788 | |
| | Average annual total return | | | 2.84 | % | | | 6.36 | % |
The growth of $10,000 is cumulative.
| ** | The Portfolio commenced offering Class B shares on May 1, 2003. Index returns begin April 30, 2003. |
310
Information About Your Portfolio’s Expenses
DWS Strategic Income VIP
As an investor of the Portfolio, you incur two types of costs: ongoing expenses and transaction costs. Ongoing expenses include management fees, distribution and service (12b-1) fees and other Portfolio expenses. Examples of transaction costs include sales charges (loads), redemption fees and account maintenance fees, which are not shown in this section. The following tables are intended to help you understand your ongoing expenses (in dollars) of investing in the Portfolio and to help you compare these expenses with the ongoing expenses of investing in other mutual funds. In the most recent six-month period, the Portfolio limited these expenses for Class B shares; had it not done so, expenses for Class B shares would have been higher. The tables are based on an investment of $1,000 made at the beginning of the six-month period ended December 31, 2005.
The tables illustrate your Portfolio’s expenses in two ways:
Actual Portfolio Return. This helps you estimate the actual dollar amount of ongoing expenses (but not transaction costs) paid on a $1,000 investment in the Portfolio using the Portfolio’s actual return during the period. To estimate the expenses you paid over the period, simply divide your account value by $1,000 (for example, an $8,600 account value divided by $1,000 = 8.6), then multiply the result by the number in the “Expenses Paid per $1,000” line under the share class you hold.
Hypothetical 5% Portfolio Return. This helps you to compare your Portfolio’s ongoing expenses (but not transaction costs) with those of other mutual funds using the Portfolio’s actual expense ratio and a hypothetical rate of return of 5% per year before expenses. Examples using a 5% hypothetical Portfolio return may be found in the shareholder reports of other mutual funds. The hypothetical account values and expenses may not be used to estimate the actual ending account balance or expenses you paid for the period.
Please note that the expenses shown in these tables are meant to highlight your ongoing expenses only and do not reflect any transaction costs. The “Expenses Paid per $1,000” line of the tables is useful in comparing ongoing expenses only and will not help you determine the relative total expense of owning different funds. If these transaction costs had been included, your costs would have been higher.
Expenses and Value of a $1,000 Investment for the six months ended December 31, 2005
| | | | | | |
Actual Portfolio Return | | Class A | | Class B |
Beginning Account Value 7/1/05 | | $ | 1,000.00 | | $ | 1,000.00 |
Ending Account Value 12/31/05 | | $ | 1,009.70 | | $ | 1,007.00 |
Expenses Paid per $1,000* | | $ | 4.61 | | $ | 6.12 |
| | |
Hypothetical 5% Portfolio Return | | Class A | | Class B |
Beginning Account Value 7/1/05 | | $ | 1,000.00 | | $ | 1,000.00 |
Ending Account Value 12/31/05 | | $ | 1,020.62 | | $ | 1,019.11 |
Expenses Paid per $1,000* | | $ | 4.63 | | $ | 6.16 |
| * | Expenses are equal to the Portfolio’s annualized expense ratio for each share class, multiplied by the average account value over the period, multiplied by the number of days in the most recent six-month period, then divided by 365. |
| | | | | | |
Annualized Expense Ratios | | Class A | | | Class B | |
DWS Variable Series II — DWS Strategic Income VIP | | .91 | % | | 1.21 | % |
For more information, please refer to the Portfolio’s prospectus.
These tables do not reflect charges and fees (“contract charges”) associated with the separate account that invests in the portfolio or any variable life insurance policy or variable annuity contract for which the portfolio is an investment option.
311
Management Summary December 31, 2005
DWS Strategic Income VIP
For the year, performance of the bond markets was mixed. Credit markets began to show more volatility as a result of investors’ concerns over rising interest rates, higher commodity prices, credit-specific events, and natural global disasters. Despite these concerns, emerging markets debt and high-yield continued to exhibit sound fundamentals and outperformed most other fixed income asset classes. As interest rates continued to rise, the US Treasury yield curve flattened, and the US dollar non-hedged performance of international bonds trailed returns of other bond markets due primarily to strength in the US dollar.
The Portfolio posted a 2.38% total return for the period ending December 31, 2005 (Class A shares, unadjusted for contract charges). This compares with the portfolio benchmarks’ returns of 11.86% for the JP Morgan Emerging Markets Bond Plus Index, 2.83% for the Merrill Lynch High Yield Master Index, 2.84% for the Lehman Brothers US Treasury Index and -6.88% for the Citigroup World Government Bond Index (US dollar terms — unhedged). (Please see page 20 for standardized performance as of December 31, 2005.)
During the year, we modestly decreased our exposure to high-yield bonds in view of the narrower yield advantage they provided, and consequently we increased our allocation to emerging market bonds. Our allocation to emerging markets and high-yield helped returns. In addition to the high-yield and emerging markets sectors, the Portfolio is also invested in high quality sovereign, agency and provincial bonds. These include US Treasury bonds, as well as debt of the United Kingdom, countries within the European Union and Yen-denominated bonds. Our Yen and euro exposure detracted from returns, as these currencies depreciated against the US dollar for the year.
William Chepolis, CFA
Andrew P. Cestone Robert Wang
Lead Portfolio Manager Portfolio Managers
Deutsche Investment Management Americas Inc
All performance shown is historical, assumes reinvestment of all dividend and capital gain distributions, and does not guarantee future results. Investment return and principal value fluctuate with changing market conditions so that, when redeemed, shares may be worth more or less than their original cost. Current performance may be lower or higher than the performance data quoted. Please visit www.dws-scudder.com for the product’s most recent month-end performance. Performance doesn’t reflect charges and fees (“contract charges”) associated with the separate account that invests in the Portfolio or any variable life insurance policy or variable annuity contract for which the Portfolio is an investment option. These charges and fees will reduce returns.
Risk Considerations
The Portfolio invests in individual bonds whose yields and market values fluctuate so that your investment may be worth more or less than its original cost. Bond investments are subject to interest-rate risk such that when interest rates rise, the prices of the bonds, and thus the value of the bond investment, can decline and the investor can lose principal value. Additionally, investments by the Portfolio in lower-rated bonds present greater risk to principal and income than investments in higher-quality securities. Finally, investing in foreign securities presents certain unique risks not associated with domestic investments, such as currency fluctuation, political and economic changes and market risks. All of these factors may result in greater share price volatility. Please read this Portfolio’s prospectus for specific details regarding its investments and risk profile.
The JP Morgan Emerging Markets Bond Plus Index is an unmanaged foreign securities index of US dollar and other external-currency-denominated Brady bonds, loans, Eurobonds and local market debt instruments traded in emerging markets.
The Merrill Lynch High Yield Master Index is an unmanaged index which tracks the performance of below-investment-grade US dollar-denominated corporate bonds publicly issued in the United States domestic market.
The Lehman Brothers US Treasury Index is an unmanaged index reflecting the performance of all public obligations and does not focus on one particular segment of the Treasury market.
The Citigroup World Government Bond Index (formerly known as Salomon Smith Barney World Government Bond Index) is an unmanaged index comprised of government bonds from 18 developed countries, including the US, with maturities greater than one year.
Index returns assume reinvestment of dividends and, unlike portfolio returns, do not reflect fees or expenses. It is not possible to invest directly into an index.
Portfolio management market commentary is as of December 31, 2005, and may not come to pass. This information is subject to change at any time based on market and other conditions.
312
Portfolio Summary
DWS Strategic Income VIP
| | | | | | |
Asset Allocation (Excludes Securities Lending Collateral) | | 12/31/05 | | | 12/31/04 | |
Corporate Bonds | | 35 | % | | 40 | % |
Foreign Bonds — US$ Denominated | | 24 | % | | 21 | % |
Foreign Bonds — Non US$ Denominated | | 18 | % | | 19 | % |
US Treasury Obligations | | 15 | % | | 13 | % |
Cash Equivalents | | 5 | % | | 2 | % |
US Government Sponsored Agencies | | 2 | % | | 4 | % |
Other | | 1 | % | | 1 | % |
| | | | | | |
| | 100 | % | | 100 | % |
| | | | | | |
| | |
Quality (Excludes Securities Lending Collateral) | | 12/31/05 | | | 12/31/04 | |
AAA* | | 31 | % | | 30 | % |
AA | | 1 | % | | 2 | % |
A | | 4 | % | | 4 | % |
BBB | | 6 | % | | 5 | % |
BB | | 20 | % | | 16 | % |
B | | 25 | % | | 31 | % |
CCC | | 5 | % | | 6 | % |
Below CC | | — | | | 1 | % |
Not Rated | | 8 | % | | 5 | % |
| | | | | | |
| | 100 | % | | 100 | % |
| | | | | | |
| * | Includes cash equivalents |
| | | | |
Interest Rate Sensitivity | | 12/31/05 | | 12/31/04 |
Average maturity | | 7.6 years | | 7.5 years |
Average duration | | 5.0 years | | 5.4 years |
Asset allocation, quality and interest rate sensitivity are subject to change.
The quality ratings represent the lower of Moody’s Investors Service, Inc. (“Moody’s”) or Standard & Poor’s Corporation (“S&P”) credit ratings. The ratings of Moody’s and S&P represent their opinions as to the quality of the securities they rate. Ratings are relative and subjective and are not absolute standards of quality. The Portfolio’s credit quality does not remove market risk.
For more complete details about the Portfolio’s investment portfolio, see page 25. A quarterly Fact Sheet is available upon request. Information concerning portfolio holdings of the Portfolio as of month end will be posted to www.dws-scudder.com on the 15th of the following month.
Following the Portfolio’s fiscal first and third quarter-end, a complete portfolio holdings listing is filed with the SEC on Form N-Q. The form will be available on the SEC’s Web site at www.sec.gov, and it also may be reviewed and copied at the SEC’s Public Reference Room in Washington, D.C. Information on the operation of the SEC’s Public Reference Room may be obtained by calling (800) SEC-0330.
313
Investment Portfolio December 31, 2005
DWS Strategic Income VIP
| | | | |
| | | Principal Amount ($)(a) | | Value ($) |
Corporate Bonds 34.2% | | | | |
Consumer Discretionary 8.4% | | | | |
155 East Tropicana LLC, 8.75%, 4/1/2012 | | 85,000 | | 81,812 |
Adesa, Inc., 7.625%, 6/15/2012 | | 30,000 | | 29,850 |
Affinia Group, Inc., 9.0%, 11/30/2014 | | 135,000 | | 106,650 |
AMC Entertainment, Inc., 8.0%, 3/1/2014 (b) | | 170,000 | | 153,850 |
AutoNation, Inc., 9.0%, 8/1/2008 | | 100,000 | | 107,375 |
Aztar Corp., 7.875%, 6/15/2014 (b) | | 205,000 | | 214,737 |
Cablevision Systems Corp., Series B, 8.716%**, 4/1/2009 | | 40,000 | | 40,400 |
Caesars Entertainment, Inc.: | | | | |
8.875%, 9/15/2008 | | 50,000 | | 54,063 |
9.375%, 2/15/2007 | | 55,000 | | 57,269 |
Charter Communications Holdings LLC: | | | | |
9.625%, 11/15/2009 | | 50,000 | | 37,000 |
10.25%, 9/15/2010 | | 330,000 | | 328,350 |
144A, 11.0%, 10/1/2015 | | 346,000 | | 290,640 |
Cooper-Standard Automotive, Inc., 8.375%, 12/15/2014 (b) | | 145,000 | | 110,200 |
CSC Holdings, Inc.: | | | | |
7.25%, 7/15/2008 | | 50,000 | | 49,875 |
7.875%, 12/15/2007 | | 190,000 | | 193,325 |
Dex Media East LLC/Financial, 12.125%, 11/15/2012 | | 466,000 | | 545,220 |
Dura Operating Corp., Series B, 8.625%, 4/15/2012 (b) | | 155,000 | | 127,875 |
EchoStar DBS Corp., 6.625%, 10/1/2014 | | 55,000 | | 52,731 |
Foot Locker, Inc., 8.5%, 1/15/2022 | | 80,000 | | 84,600 |
Ford Motor Co., 7.45%, 7/16/2031 (b) | | 25,000 | | 17,000 |
General Motors Corp., 8.25%, 7/15/2023 (b) | | 25,000 | | 16,063 |
Goodyear Tire & Rubber Co., 11.25%, 3/1/2011 | | 205,000 | | 229,600 |
Gregg Appliances, Inc., 9.0%, 2/1/2013 | | 40,000 | | 36,200 |
GSC Holdings Corp., 144A, 8.0%, 10/1/2012 (b) | | 170,000 | | 159,800 |
Hertz Corp., 144A, 8.875%, 1/1/2014 | | 195,000 | | 198,656 |
ITT Corp., 7.375%, 11/15/2015 | | 50,000 | | 54,250 |
Jacobs Entertainment, Inc., 11.875%, 2/1/2009 | | 370,000 | | 392,663 |
Levi Strauss & Co.: | | | | |
9.28% **, 4/1/2012 | | 75,000 | | 75,563 |
12.25%, 12/15/2012 | | 20,000 | | 22,300 |
Liberty Media Corp., 8.5%, 7/15/2029 (b) | | 20,000 | | 19,807 |
Mandalay Resort Group, Series B, 10.25%, 8/1/2007 | | 35,000 | | 37,319 |
Mediacom Broadband LLC, 144A, 8.5%, 10/15/2015 | | 60,000 | | 55,575 |
Mediacom LLC, 9.5%, 1/15/2013 (b) | | 30,000 | | 29,288 |
MGM MIRAGE: | | | | |
8.375%, 2/1/2011 (b) | | 175,000 | | 187,250 |
9.75%, 6/1/2007 | | 95,000 | | 100,106 |
MTR Gaming Group, Inc., Series B, 9.75%, 4/1/2010 | | 60,000 | | 64,050 |
314
| | | | |
| | | Principal Amount ($)(a) | | Value ($) |
NCL Corp., 10.625%, 7/15/2014 | | 75,000 | | 77,437 |
Norcraft Holdings/Capital, Step-up Coupon, 0% to 9/1/2008, 9.75% to 9/1/2012 | | 180,000 | | 127,800 |
Paxson Communications Corp., Step-up Coupon, 0% to 1/15/2006, 12.25% to 1/15/2009 (b) | | 20,000 | | 21,175 |
Petro Stopping Centers, 9.0%, 2/15/2012 (b) | | 120,000 | | 120,600 |
Pinnacle Entertainment, Inc., 8.75%, 10/1/2013 (b) | | 180,000 | | 191,700 |
Premier Entertainment Biloxi LLC/Finance, 10.75%, 2/1/2012 | | 185,000 | | 178,525 |
PRIMEDIA, Inc.: | | | | |
8.875%, 5/15/2011 | | 65,000 | | 59,963 |
9.715%**, 5/15/2010 (b) | | 200,000 | | 192,250 |
Renaissance Media Group LLC, 10.0%, 4/15/2008 | | 85,000 | | 85,106 |
Resorts International Hotel & Casino, Inc., 11.5%, 3/15/2009 | | 195,000 | | 215,962 |
Schuler Homes, Inc., 10.5%, 7/15/2011 | | 140,000 | | 150,500 |
SGS International, Inc., 144A, 12.0%, 12/15/2013 | | 50,000 | | 50,082 |
Simmons Bedding Co.: | | | | |
144A, Step-up Coupon, 0% to 12/15/2009, 10.0% to 12/15/2014(b) | | 215,000 | | 116,100 |
7.875%, 1/15/2014 (b) | | 45,000 | | 41,625 |
Sinclair Broadcast Group, Inc.: | | | | |
8.0%, 3/15/2012 | | 125,000 | | 128,750 |
8.75%, 12/15/2011 | | 215,000 | | 226,287 |
Sirius Satellite Radio, Inc., 144A, 9.625%, 8/1/2013 | | 215,000 | | 211,775 |
Toys “R” Us, Inc.: | | | | |
6.875%, 8/1/2006 | | 25,000 | | 24,875 |
7.375%, 10/15/2018 | | 95,000 | | 68,400 |
Trump Entertainment Resorts, Inc., 8.5%, 6/1/2015 (b) | | 390,000 | | 380,250 |
TRW Automotive, Inc.: | | | | |
11.0%, 2/15/2013 | | 255,000 | | 286,237 |
11.75%, 2/15/2013 EUR | | 35,000 | | 47,859 |
United Auto Group, Inc., 9.625%, 3/15/2012 | | 140,000 | | 147,350 |
Wheeling Island Gaming, Inc., 10.125%, 12/15/2009 | | 45,000 | | 47,194 |
XM Satellite Radio, Inc., Step-up Coupon, 0% to 12/31/2005, 14.0% to 12/31/2009 | | 251,321 | | 267,657 |
Young Broadcasting, Inc.: | | | | |
8.75%, 1/15/2014 (b) | | 345,000 | | 304,031 |
10.0%, 3/1/2011 (b) | | 40,000 | | 37,450 |
| | | | |
| | | | 8,168,252 |
| | | | |
Consumer Staples 1.1% | | | | |
Alliance One International, Inc., 144A, 11.0%, 5/15/2012 | | 140,000 | | 123,200 |
Birds Eye Foods, Inc., 11.875%, 11/1/2008 | | 15,000 | | 15,300 |
Del Laboratories, Inc., 8.0%, 2/1/2012 (b) | | 60,000 | | 47,400 |
315
| | | | |
| | | Principal Amount ($)(a) | | Value ($) |
Delhaize America, Inc.: | | | | |
8.05%, 4/15/2027 | | 20,000 | | 20,520 |
9.0%, 4/15/2031 | | 55,000 | | 64,659 |
GNC Corp., 8.5%, 12/1/2010 | | 15,000 | | 12,900 |
Harry & David Holdings, Inc., 9.41%**, 3/1/2012 | | 35,000 | | 35,262 |
North Atlantic Trading Co., 9.25%, 3/1/2012 | | 415,000 | | 273,900 |
Swift & Co.: | | | | |
10.125%, 10/1/2009 | | 70,000 | | 72,275 |
12.5%, 1/1/2010 | | 130,000 | | 136,825 |
Viskase Co., Inc., 11.5%, 6/15/2011 | | 245,000 | | 260,925 |
| | | | |
| | | | 1,063,166 |
| | | | |
Energy 2.8% | | | | |
Belden & Blake Corp., 8.75%, 7/15/2012 | | 210,000 | | 214,200 |
Chaparral Energy, Inc., 144A, 8.5%, 12/1/2015 | | 135,000 | | 139,725 |
Chesapeake Energy Corp.: | | | | |
6.5%, 8/15/2017 | | 65,000 | | 65,325 |
6.875%, 1/15/2016 (b) | | 145,000 | | 148,625 |
Dynegy Holdings, Inc.: | | | | |
6.875%, 4/1/2011 (b) | | 40,000 | | 39,400 |
7.125%, 5/15/2018 (b) | | 65,000 | | 57,850 |
7.625%, 10/15/2026 | | 40,000 | | 35,600 |
8.75%, 2/15/2012 (b) | | 20,000 | | 21,600 |
144A, 9.875%, 7/15/2010 | | 290,000 | | 317,912 |
El Paso Production Holding Corp., 7.75%, 6/1/2013 | | 100,000 | | 103,750 |
Frontier Oil Corp., 6.625%, 10/1/2011 | | 40,000 | | 40,800 |
Mission Resources Corp., 9.875%, 4/1/2011 | | 10,000 | | 10,500 |
Newpark Resources, Inc., Series B, 8.625%, 12/15/2007 | | 160,000 | | 160,000 |
NGC Corp. Capital Trust I, Series B, 8.316%, 6/1/2027 | | 200,000 | | 177,000 |
Sonat, Inc., 7.0%, 2/1/2018 | | 20,000 | | 19,000 |
Southern Natural Gas, 8.875%, 3/15/2010 | | 175,000 | | 187,025 |
Stone Energy Corp.: | | | | |
6.75%, 12/15/2014 (b) | | 255,000 | | 241,613 |
8.25%, 12/15/2011 | | 130,000 | | 134,225 |
Transmeridian Exploration, Inc., 12.0%**, 12/15/2010 | | 45,000 | | 52,200 |
Williams Companies, Inc.: | | | | |
8.125%, 3/15/2012 | | 355,000 | | 386,950 |
8.75%, 3/15/2032 | | 115,000 | | 133,400 |
| | | | |
| | | | 2,686,700 |
| | | | |
Financials 6.7% | | | | |
Alamosa Delaware, Inc.: | | | | |
8.5%, 1/31/2012 | | 20,000 | | 21,625 |
11.0%, 7/31/2010 | | 65,000 | | 73,288 |
12.0%, 7/31/2009 | | 65,000 | | 71,094 |
AmeriCredit Corp., 9.25%, 5/1/2009 | | 340,000 | | 357,850 |
Ashton Woods USA LLC, 144A, 9.5%, 10/1/2015 | | 145,000 | | 130,681 |
Atlantic Mutual Insurance Co., 144A, 8.15%, 2/15/2028 | | 35,000 | | 21,261 |
E*TRADE Financial Corp.: | | | | |
144A, 7.375%, 9/15/2013 (b) | | 125,000 | | 126,562 |
7.875%, 12/1/2015 | | 120,000 | | 123,900 |
8.0%, 6/15/2011 | | 90,000 | | 93,600 |
316
| | | | |
| | | Principal Amount ($)(a) | | Value ($) |
Ford Motor Credit Co.: | | | | |
6.5%, 1/25/2007 (b) | | 65,000 | | 62,886 |
7.25%, 10/25/2011 (b) | | 490,000 | | 423,289 |
7.375%, 10/28/2009 (b) | | 440,000 | | 390,230 |
General Motors Acceptance Corp.: | | | | |
5.22%**, 3/20/2007 | | 65,000 | | 61,396 |
6.875%, 9/15/2011 | | 220,000 | | 200,628 |
8.0%, 11/1/2031 (b) | | 1,371,000 | | 1,313,255 |
H&E Equipment/Finance, 11.125%, 6/15/2012 | | 150,000 | | 165,750 |
Poster Financial Group, Inc., 8.75%, 12/1/2011 | | 175,000 | | 180,250 |
PXRE Capital Trust I, 8.85%, 2/1/2027 | | 95,000 | | 93,338 |
R.H. Donnelly Finance Corp., 10.875%, 12/15/2012 | | 165,000 | | 186,037 |
Radnor Holdings Corp., 11.0%, 3/15/2010 | | 125,000 | | 101,250 |
Stripes Acquisition LLC, 144A, 10.625%, 12/15/2013 | | 50,000 | | 50,750 |
Tennessee Valley Authority, Series A, 6.79%, 5/23/2012 | | 1,500,000 | | 1,660,006 |
TIG Capital Holdings Trust, 144A, 8.597%, 1/15/2027 | | 140,000 | | 111,300 |
Triad Acquisition Corp., 144A, 11.125%, 5/1/2013 | | 95,000 | | 94,050 |
UGS Corp., 10.0%, 6/1/2012 | | 130,000 | | 141,700 |
Universal City Development, 11.75%, 4/1/2010 | | 215,000 | | 241,069 |
| | | | |
| | | | 6,497,045 |
| | | | |
Health Care 0.8% | | | | |
Accellent, Inc., 144A, 10.5%, 12/1/2013 | | 130,000 | | 133,250 |
HEALTHSOUTH Corp., 10.75%, 10/1/2008 (b) | | 280,000 | | 280,000 |
InSight Health Services Corp.: | | | | |
144A, 9.174%**, 11/1/2011 | | 35,000 | | 33,863 |
Series B, 9.875%, 11/1/2011 (b) | | 50,000 | | 37,750 |
Tenet Healthcare Corp., 144A, 9.25%, 2/1/2015 | | 295,000 | | 292,787 |
| | | | |
| | | | 777,650 |
| | | | |
Industrials 4.6% | | | | |
Aavid Thermal Technologies, Inc., 12.75%, 2/1/2007 | | 225,000 | | 231,187 |
Allied Security Escrow Corp., 11.375%, 7/15/2011 | | 135,000 | | 130,146 |
Allied Waste North America, Inc.: | | | | |
Series B, 5.75%, 2/15/2011 (b) | | 75,000 | | 71,063 |
Series B, 9.25%, 9/1/2012 | | 182,000 | | 197,015 |
American Color Graphics, 10.0%, 6/15/2010 | | 135,000 | | 94,331 |
Avondale Mills, Inc., 144A, 11.065%**, 7/1/2012 | | 70,000 | | 67,900 |
Beazer Homes USA, Inc.: | | | | |
6.875%, 7/15/2015 (b) | | 20,000 | | 19,175 |
8.375%, 4/15/2012 | | 95,000 | | 98,800 |
8.625%, 5/15/2011 | | 130,000 | | 135,850 |
Browning-Ferris Industries: | | | | |
7.4%, 9/15/2035 | | 205,000 | | 181,425 |
9.25%, 5/1/2021 | | 20,000 | | 20,600 |
Case New Holland, Inc., 9.25%, 8/1/2011 | | 235,000 | | 251,450 |
Cenveo Corp., 7.875%, 12/1/2013 (b) | | 115,000 | | 110,975 |
Collins & Aikman Floor Cover, Series B, 9.75%, 2/15/2010 (b) | | 179,000 | | 157,520 |
317
| | | | |
| | | Principal Amount ($)(a) | | Value ($) |
Columbus McKinnon Corp., 10.0%, 8/1/2010 | | 65,000 | | 71,988 |
Compression Polymers Corp.: | | | | |
144A, 10.5%, 7/1/2013 | | 165,000 | | 160,050 |
144A, 11.44%**, 7/1/2012 | | 45,000 | | 44,100 |
Congoleum Corp., 8.625%, 8/1/2008* | | 125,000 | | 124,531 |
Cornell Companies, Inc., 10.75%, 7/1/2012 | | 65,000 | | 67,275 |
Dana Corp., 7.0%, 3/1/2029 (b) | | 165,000 | | 118,387 |
DRS Technologies, Inc., 6.875%, 11/1/2013 | | 30,000 | | 28,688 |
ISP Chemco, Inc., Series B, 10.25%, 7/1/2011 | | 255,000 | | 271,575 |
K. Hovnanian Enterprises, Inc.: | | | | |
6.25%, 1/15/2016 (b) | | 135,000 | | 125,257 |
8.875%, 4/1/2012 | | 175,000 | | 181,845 |
Kansas City Southern, 9.5%, 10/1/2008 | | 275,000 | | 297,687 |
Kinetek, Inc., Series D, 10.75%, 11/15/2006 | | 200,000 | | 192,000 |
Millennium America, Inc., 9.25%, 6/15/2008 | | 230,000 | | 248,112 |
Rainbow National Services LLC, 144A, 10.375%, 9/1/2014 | | 110,000 | | 123,200 |
Securus Technologies, Inc., 11.0%, 9/1/2011(b) | | 75,000 | | 63,750 |
Ship Finance International Ltd., 8.5%, 12/15/2013 | | 140,000 | | 130,900 |
Technical Olympic USA, Inc.: | | | | |
7.5%, 3/15/2011 (b) | | 50,000 | | 44,563 |
10.375%, 7/1/2012 | | 120,000 | | 118,050 |
The Brickman Group Ltd., Series B, 11.75%, 12/15/2009 | | 80,000 | | 88,600 |
United Rentals North America, Inc., 7.0%, 2/15/2014(b) | | 130,000 | | 121,550 |
Xerox Capital Trust I, 8.0%, 2/1/2027(b) | | 85,000 | | 87,550 |
| | | | |
| | | | 4,477,095 |
| | | | |
Information Technology 1.1% | | | | |
Activant Solutions, Inc.: | | | | |
144A, 10.054%**, 4/1/2010 | | 15,000 | | 15,469 |
10.5%, 6/15/2011 | | 105,000 | | 114,975 |
Eschelon Operating Co., 8.375%, 3/15/2010 | | 83,000 | | 76,775 |
L-3 Communications Corp.: | | | | |
5.875%, 1/15/2015 | | 20,000 | | 19,400 |
144A, 6.375%, 10/15/2015 | | 50,000 | | 49,875 |
Lucent Technologies, Inc., 6.45%, 3/15/2029 | | 260,000 | | 222,950 |
Sanmina-SCI Corp.: | | | | |
6.75%, 3/1/2013(b) | | 165,000 | | 156,956 |
10.375%, 1/15/2010 | | 234,000 | | 258,570 |
SS&C Technologies, Inc., 144A, 11.75%, 12/1/2013 | | 40,000 | | 41,000 |
SunGard Data Systems, Inc., 144A, 10.25%, 8/15/2015 | | 150,000 | | 150,000 |
| | | | |
| | | | 1,105,970 |
| | | | |
Materials 3.9% | | | | |
ARCO Chemical Co., 9.8%, 2/1/2020 | | 375,000 | | 420,937 |
Associated Materials, Inc.: | | | | |
Step-up Coupon, 0% to 3/1/2009, 11.25% to 3/1/2014 | | 165,000 | | 80,850 |
9.75%, 4/15/2012 | | 55,000 | | 53,075 |
318
| | | | |
| | | Principal Amount ($)(a) | | Value ($) |
Caraustar Industries, Inc., 9.875%, 4/1/2011(b) | | 250,000 | | 255,000 |
Constar International, Inc., 11.0%, 12/1/2012(b) | | 40,000 | | 29,200 |
Dayton Superior Corp.: | | | | |
10.75%, 9/15/2008 | | 95,000 | | 91,675 |
13.0%, 6/15/2009(b) | | 140,000 | | 105,700 |
GEO Specialty Chemicals, Inc., 12.565%**, 12/31/2009 | | 283,000 | | 234,890 |
Georgia-Pacific Corp.: | | | | |
8.0%, 1/15/2024(b) | | 230,000 | | 219,650 |
8.875%, 5/15/2031 | | 25,000 | | 25,063 |
Huntsman LLC, 11.625%, 10/15/2010 | | 203,000 | | 231,166 |
IMC Global, Inc., 10.875%, 8/1/2013 | | 253,000 | | 290,634 |
International Steel Group, Inc., 6.5%, 4/15/2014 | | 70,000 | | 70,000 |
Massey Energy Co.: | | | | |
6.625%, 11/15/2010 | | 60,000 | | 60,975 |
144A, 6.875%, 12/15/2013 | | 50,000 | | 50,438 |
MMI Products, Inc., Series B, 11.25%, 4/15/2007 | | 210,000 | | 197,400 |
Neenah Foundry Co.: | | | | |
144A, 11.0%, 9/30/2010 | | 255,000 | | 279,225 |
144A, 13.0%, 9/30/2013 | | 94,000 | | 95,880 |
NewPage Corp., 10.5%**, 5/1/2012 | | 100,000 | | 99,000 |
Omnova Solutions, Inc., 11.25%, 6/1/2010 | | 245,000 | | 255,412 |
Oregon Steel Mills, Inc., 10.0%, 7/15/2009 | | 60,000 | | 64,200 |
Oxford Automotive, Inc., 144A, 12.0%, 10/15/2010* | | 159,598 | | 14,364 |
Pliant Corp., 11.625%, 6/15/2009 (PIK)* | | 10 | | 11 |
Portola Packaging, Inc., 8.25%, 2/1/2012(b) | | 70,000 | | 51,450 |
Rockwood Specialties Group, Inc., 10.625%, 5/15/2011 | | 33,000 | | 36,176 |
TriMas Corp., 9.875%, 6/15/2012(b) | | 240,000 | | 198,000 |
UAP Holding Corp., Step-up Coupon, 0% to 1/15/2008, 10.75% to 7/15/2012 | | 55,000 | | 47,644 |
United States Steel Corp., 9.75%, 5/15/2010 | | 165,000 | | 179,437 |
| | | | |
| | | | 3,737,452 |
| | | | |
Telecommunication Services 2.3% | | | | |
AirGate PCS, Inc., 7.9%**, 10/15/2011 | | 75,000 | | 77,437 |
American Cellular Corp., Series B, 10.0%, 8/1/2011 | | 55,000 | | 59,675 |
Cincinnati Bell, Inc.: | | | | |
7.25%, 7/15/2013(b) | | 145,000 | | 150,800 |
8.375%, 1/15/2014(b) | | 150,000 | | 147,562 |
Dobson Communications Corp., 8.875%, 10/1/2013 | | 75,000 | | 74,813 |
Insight Midwest LP, 9.75%, 10/1/2009 | | 50,000 | | 51,500 |
LCI International, Inc., 7.25%, 6/15/2007 | | 135,000 | | 135,675 |
Level 3 Financing, Inc., 10.75%, 10/15/2011 | | 25,000 | | 22,188 |
MCI, Inc., 8.735%, 5/1/2014 | | 370,000 | | 409,312 |
Nextel Communications, Inc., Series D, 7.375%, 8/1/2015 | | 535,000 | | 564,595 |
319
| | | | |
| | | Principal Amount ($)(a) | | Value ($) |
Nextel Partners, Inc., 8.125%, 7/1/2011 | | 100,000 | | 106,875 |
Qwest Corp.: | | | | |
7.25%, 9/15/2025 | | 100,000 | | 99,500 |
144A, 7.741%**, 6/15/2013 | | 35,000 | | 37,756 |
Rural Cellular Corp.: | | | | |
9.75%, 1/15/2010(b) | | 20,000 | | 20,200 |
9.875%, 2/1/2010(b) | | 20,000 | | 21,100 |
144A, 10.041%**, 11/1/2012 | | 20,000 | | 20,150 |
SBA Telecom, Inc., Step-up Coupon, 0% to 12/15/2007, 9.75% to 12/15/2011 | | 65,000 | | 60,288 |
Telex Communications Holdings, Inc., 11.5%, 10/15/2008 | | 10,000 | | 10,650 |
Triton PCS, Inc., 8.5%, 6/1/2013 | | 15,000 | | 13,950 |
Ubiquitel Operating Co., 9.875%, 3/1/2011 | | 60,000 | | 66,450 |
US Unwired, Inc., Series B, 10.0%, 6/15/2012 | | 100,000 | | 112,500 |
| | | | |
| | | | 2,262,976 |
| | | | |
Utilities 2.5% | | | | |
AES Corp., 144A, 8.75%, 5/15/2013 | | 315,000 | | 342,956 |
Allegheny Energy Supply Co. LLC, 144A, 8.25%, 4/15/2012 | | 340,000 | | 383,350 |
CMS Energy Corp.: | | | | |
8.5%, 4/15/2011(b) | | 160,000 | | 174,200 |
9.875%, 10/15/2007 | | 205,000 | | 219,350 |
DPL, Inc., 6.875%, 9/1/2011 | | 50,000 | | 52,688 |
Mirant North America LLC, 144A, 7.375%, 12/31/2013(b) | | 40,000 | | 40,450 |
Mission Energy Holding Co., 13.5%, 7/15/2008 | | 395,000 | | 458,200 |
NorthWestern Corp., 5.875%, 11/1/2014 | | 35,000 | | 35,066 |
NRG Energy, Inc., 8.0%, 12/15/2013 | | 234,000 | | 260,910 |
PSE&G Energy Holdings LLC, 10.0%, 10/1/2009 | | 410,000 | | 451,000 |
| | | | |
| | | | 2,418,170 |
| | | | |
Total Corporate Bonds (Cost $33,592,995) | | | | 33,194,476 |
| | | | |
Foreign Bonds — US$ Denominated 23.4% | | | | |
Consumer Discretionary 0.8% | | | | |
Cablemas SA de CV, 144A, 9.375%, 11/15/2015 | | 20,000 | | 20,500 |
Jafra Cosmetics International, Inc., 10.75%, 5/15/2011 | | 255,000 | | 279,225 |
Kabel Deutschland GmbH, 144A, 10.625%, 7/1/2014 | | 150,000 | | 157,875 |
Shaw Communications, Inc., 8.25%, 4/11/2010 | | 105,000 | | 112,744 |
Telenet Group Holding NV, 144A, Step-up Coupon, 0% to 12/15/2008, 11.5% to 6/15/2014 | | 178,000 | | 145,960 |
Vitro SA de CV, Series A, 144A, 12.75%, 11/1/2013(b) | | 75,000 | | 70,875 |
| | | | |
| | | | 787,179 |
| | | | |
Energy 1.6% | | | | |
OAO Gazprom, 144A, 9.625%, 3/1/2013(b) | | 200,000 | | 241,250 |
Pemex Project Funding Master Trust: | | | | |
Series REG S, 8.0%, 11/15/2011 | | 250,000 | | 280,250 |
Series REG S, 9.5%, 9/15/2027 | | 435,000 | | 574,200 |
320
| | | | |
| | | Principal Amount ($)(a) | | Value ($) |
Petroliam Nasional Berhad: | | | | |
7.625%, 10/15/2026 | | 40,000 | | 49,916 |
7.75%, 8/15/2015 | | 80,000 | | 95,613 |
Petronas Capital Ltd., Series REG S, 7.875%, 5/22/2022 | | 160,000 | | 200,064 |
Secunda International Ltd., 12.15%**, 9/1/2012 | | 75,000 | | 78,750 |
| | | | |
| | | | 1,520,043 |
| | | | |
Financials 0.4% | | | | |
Conproca SA de CV, 12.0%, 6/16/2010 | | 100,000 | | 119,000 |
Doral Financial Corp., 5.004%**, 7/20/2007 | | 240,000 | | 233,291 |
New ASAT (Finance) Ltd., 9.25%, 2/1/2011 | | 65,000 | | 44,850 |
| | | | |
| | | | 397,141 |
| | | | |
Health Care 0.1% | | | | |
| | | | |
Biovail Corp., 7.875%, 4/1/2010(b) | | 140,000 | | 145,075 |
| | | | |
Industrials 0.9% | | | | |
Grupo Transportacion Ferroviaria Mexicana SA de CV: | | | | |
144A, 9.375%, 5/1/2012 | | 80,000 | | 87,600 |
10.25%, 6/15/2007 | | 290,000 | | 305,950 |
12.5%, 6/15/2012 | | 95,000 | | 108,300 |
J. Ray McDermott SA, 144A, 11.5%, 12/15/2013 | | 155,000 | | 182,900 |
LeGrand SA, 8.5%, 2/15/2025 | | 75,000 | | 90,187 |
Stena AB, 9.625%, 12/1/2012 | | 55,000 | | 59,744 |
| | | | |
| | | | 834,681 |
| | | | |
Materials 1.5% | | | | |
Cascades, Inc., 7.25%, 2/15/2013 | | 280,000 | | 254,800 |
ISPAT Inland ULC, 9.75%, 4/1/2014(b) | | 147,000 | | 166,478 |
Novelis, Inc., 144A, 7.5%, 2/15/2015 | | 295,000 | | 275,087 |
Rhodia SA, 8.875%, 6/1/2011 | | 225,000 | | 230,625 |
Sino-Forest Corp., 144A, 9.125%, 8/17/2011 | | 10,000 | | 10,725 |
Tembec Industries, Inc.: | | | | |
8.5%, 2/1/2011 | | 670,000 | | 371,850 |
8.625%, 6/30/2009 | | 300,000 | | 171,000 |
| | | | |
| | | | 1,480,565 |
| | | | |
Sovereign Bonds 16.9% | | | | |
Aries Vermogensverwaltung GmbH, Series C, REG S, 9.6%, 10/25/2014 | | 500,000 | | 644,745 |
Central Bank of Nigeria, Series WW, 6.25%, 11/15/2020 | | 500,000 | | 497,500 |
Dominican Republic, Series REG S, 9.5%, 9/27/2011 | | 450,425 | | 475,198 |
Egypt Government AID Bonds, 4.45%, 9/15/2015 | | 1,200,000 | | 1,175,868 |
Federative Republic of Brazil: | | | | |
Floating Rate Note Debt Conversion Bond, LIBOR plus .8125%, Series 30YR, 5.188% **, 4/15/2024 | | 140,000 | | 136,332 |
Floating Rate Note Debt Conversion Bond, LIBOR Plus .875%, Series 18 YR, 5.25% **, 4/15/2012 | | 160,591 | | 158,584 |
8.75%, 2/4/2025 | | 200,000 | | 221,000 |
8.875%, 10/14/2019(b) | | 35,000 | | 39,218 |
321
| | | | |
| | | Principal Amount ($)(a) | | Value ($) |
11.0%, 1/11/2012 | | 230,000 | | 280,600 |
11.0%, 8/17/2040 | | 435,000 | | 560,715 |
14.5%, 10/15/2009 | | 220,000 | | 282,150 |
Government of Ukraine, Series REG S, 7.65%, 6/11/2013 | | 350,000 | | 377,685 |
Kingdom of Morocco, Series A, 4.813%**, 1/2/2009 | | 196,000 | | 195,608 |
Republic of Argentina: | | | | |
Step-up Coupon, 1.33% to 3/31/2009, 2.5% to 3/31/2019, 3.75% to 3/31/2029, 5.25% to 12/31/2038 | | 940,000 | | 310,200 |
Zero Coupon, 12/15/2035 | | 3,164,012 | | 164,529 |
8.28%, 12/31/2033 (PIK)(b) | | 798,999 | | 665,167 |
Republic of Bulgaria, 8.25%, 1/15/2015 | | 115,000 | | 138,874 |
Republic of Colombia: | | | | |
8.25%, 12/22/2014(b) | | 235,000 | | 260,850 |
10.0%, 1/23/2012 | | 210,000 | | 249,900 |
10.75%, 1/15/2013 | | 60,000 | | 74,400 |
Republic of Ecuador, Step-up Coupon, 9.0% to 8/15/2006, 10.0% to 8/15/2030 | | 230,000 | | 210,450 |
Republic of Guatemala: | | | | |
Series REG S, 8.125%, 10/6/2034 | | 70,000 | | 76,300 |
Series REG S, 9.25%, 8/1/2013 | | 225,000 | | 261,563 |
Republic of Indonesia, Series REG S, 7.25%, 4/20/2015 | | 170,000 | | 174,463 |
Republic of Panama: | | | | |
7.125%, 1/29/2026 | | 106,000 | | 107,325 |
9.375%, 1/16/2023 | | 570,000 | | 713,925 |
Republic of Peru: | | | | |
7.35%, 7/21/2025 | | 575,000 | | 566,375 |
9.875%, 2/6/2015 | | 130,000 | | 156,000 |
Republic of Philippines: | | | | |
8.0%, 1/15/2016 | | 340,000 | | 355,300 |
9.375%, 1/18/2017 | | 390,000 | | 446,550 |
9.5%, 2/2/2030 | | 170,000 | | 199,750 |
9.875%, 1/15/2019 | | 205,000 | | 243,181 |
Republic of Serbia, Step-up Coupon, 3.75% to 11/1/2009, 6.75% to 11/1/2024 | | 220,000 | | 195,800 |
Republic of South Africa, 6.5%, 6/2/2014 | | 185,000 | | 200,031 |
Republic of Turkey: | | | | |
7.25%, 3/15/2015(b) | | 250,000 | | 263,125 |
7.375%, 2/5/2025 | | 340,000 | | 351,050 |
11.75%, 6/15/2010 | | 420,000 | | 514,500 |
12.375%, 6/15/2009 | | 300,000 | | 361,875 |
Republic of Uruguay: | | | | |
7.25%, 2/15/2011 | | 80,000 | | 81,400 |
9.25%, 5/17/2017 | | 80,000 | | 91,000 |
Republic of Venezuela: | | | | |
9.375%, 1/13/2034 | | 300,000 | | 355,500 |
10.75%, 9/19/2013 | | 845,000 | | 1,039,350 |
Russian Federation, Step-up Coupon, 5.0% to 3/31/2007, 7.5% to 3/31/2030 | | 845,000 | | 953,920 |
Russian Ministry of Finance: | | | | |
Series V, 3.0%, 5/14/2008 | | 385,000 | | 365,134 |
Series VII, 3.0%, 5/14/2011 | | 400,000 | | 355,760 |
Socialist Republic of Vietnam, 144A, 6.875%, 1/15/2016 | | 425,000 | | 443,062 |
322
| | | | |
| | | Principal Amount ($)(a) | | Value ($) |
United Mexican States, Series A, 6.625%, 3/3/2015 | | 360,000 | | 394,200 |
| | | | |
| | | | 16,386,012 |
| | | | |
Telecommunication Services 1.0% | | | | |
Cell C Property Ltd., 144A, 11.0%, 7/1/2015(b) | | 120,000 | | 122,100 |
Embratel, Series B, 11.0%, 12/15/2008 | | 75,000 | | 84,938 |
Global Crossing UK Finance, 10.75%, 12/15/2014(b) | | 90,000 | | 82,800 |
Grupo Iusacell SA de CV, Series B, 10.0%, 7/15/2004*(b) | | 30,000 | | 24,150 |
Intelsat Bermuda Ltd., 144A, 8.695%**, 1/15/2012 | | 65,000 | | 66,056 |
Intelsat Ltd., 5.25%, 11/1/2008 | | 100,000 | | 91,125 |
Millicom International Cellular SA, 10.0%, 12/1/2013 | | 50,000 | | 51,625 |
Mobifon Holdings BV, 12.5%, 7/31/2010 | | 195,000 | | 226,200 |
Nortel Networks Ltd., 6.125%, 2/15/2006 | | 250,000 | | 250,000 |
| | | | |
| | | | 998,994 |
| | | | |
Utilities 0.2% | | | | |
Intergas Finance BV, Series REG S, 6.875%, 11/4/2011 | | 185,000 | | 190,004 |
| | | | |
Total Foreign Bonds — US$ Denominated (Cost $21,853,010) | | | | 22,739,694 |
| | | | |
Foreign Bonds — Non US$ Denominated 18.0% | | | | |
Consumer Discretionary 0.1% | | | | |
IESY Repository GmbH, 144A, 8.75%, 2/15/2015 EUR | | 100,000 | | 116,910 |
| | | | |
Consumer Staples 0.1% | | | | |
Fage Dairy Industry SA, 144A, 7.5%, 1/15/2015 EUR | | 65,000 | | 66,757 |
| | | | |
Financials 4.2% | | | | |
KFW Bankengruppe, 5.0%, 7/4/2011 EUR | | 3,180,000 | | 4,107,489 |
| | | | |
Industrials 0.1% | | | | |
Grohe Holdings GmbH, 144A, 8.625%, 10/1/2014 EUR | | 50,000 | | 54,903 |
| | | | |
Sovereign Bonds 13.5% | | | | |
Federative Republic of Brazil, 8.5%, 9/24/2012 EUR | | 130,000 | | 177,763 |
Government of Malaysia, 4.305%, 2/27/2009 MYR | | 400,000 | | 108,045 |
Government of Ukraine, Series REG S, 4.95%, 10/13/2015 EUR | | 245,000 | | 288,025 |
Mexican Bonds, Series M-20, 10.0%, 12/5/2024 MXN | | 3,810,000 | | 405,828 |
Province of Ontario, 1.875%, 1/25/2010 JPY | | 140,000,000 | | 1,244,968 |
Republic of Argentina: | | | | |
Step-up Coupon, 1.2% to 3/31/2009, 2.26% to 3/31/2019, 3.38% to 3/31/2029, 4.74% to 12/31/2038 EUR | | 160,000 | | 61,563 |
Zero Coupon, 12/15/2035 ARS | | 3,155,178 | | 62,542 |
5.83%, 12/31/2033 (PIK) ARS | | 964,375 | | 372,834 |
7.82%, 12/31/2033 (PIK) EUR | | 47,804 | | 47,257 |
323
| | | | | | |
| | | Principal Amount ($)(a) | | | Value ($) | |
Republic of Germany, Series 94, 6.25%, 1/4/2024 EUR | | 1,910,000 | | | 3,077,736 | |
Republic of Greece, 4.65%, 4/19/2007 EUR | | 2,105,000 | | | 2,549,555 | |
Republic of Peru, 7.5%, 10/14/2014 EUR | | 30,000 | | | 40,223 | |
Republic of Turkey, 20.0%, 10/17/2007 TRY | | 35 | | | 30 | |
Republic of Uruguay, 10.5%, 10/20/2006 UYU | | 4,200,000 | | | 215,100 | |
United Kingdom Treasury Bond, 4.75%, 9/7/2015 GBP | | 2,500,000 | | | 4,521,395 | |
| | | | | | |
| | | | | 13,172,864 | |
| | | | | | |
Total Foreign Bonds — Non US$ Denominated (Cost $16,866,784) | | | | | 17,518,923 | |
| | | | | | |
US Treasury Obligations 14.3% | | | | | | |
US Treasury Bond: | | | | | | |
5.375%, 2/15/2031(b)(f) | | 540,000 | | | 606,572 | |
6.0%, 2/15/2026(b) | | 1,375,000 | | | 1,621,426 | |
8.5%, 2/15/2020(b) | | 760,000 | | | 1,066,137 | |
10.375%, 11/15/2012(b)(f) | | 3,350,000 | | | 3,702,273 | |
US Treasury Notes: | | | | | | |
4.75%, 11/15/2008(b) | | 285,000 | | | 287,737 | |
5.75%, 8/15/2010(b)(f) | | 3,000,000 | | | 3,173,789 | |
6.125%, 8/15/2007 | | 3,375,000 | | | 3,464,383 | |
| | | | | | |
Total US Treasury Obligations (Cost $13,860,457) | | | | | 13,922,317 | |
| | | | | | |
US Government Sponsored Agencies 2.5% | | | | | | |
Federal Home Loan Mortgage Corp., 5.125%, 7/15/2012(b) (Cost $2,372,729) | | 2,350,000 | | | 2,392,960 | |
| | | | | | |
Convertible Bond 0.3% | | | | | | |
Consumer Discretionary | | | | | | |
HIH Capital Ltd.: | | | | | | |
144A, Series DOM, 7.5%, 9/25/2006 | | 155,000 | | | 153,450 | |
144A, Series EURO, 7.5%, 9/25/2006 | | 105,000 | | | 103,950 | |
| | | | | | |
Total Convertible Bond (Cost $258,142) | | | | | 257,400 | |
| | | | | | |
| | |
| | | Shares | | | Value ($) | |
Preferred Stocks 0.1% | | | | | | |
Paxson Communications Corp., 14.25% (PIK) (Cost $81,339) | | 10 | | | 90,106 | |
| | | | | | |
| | |
| | | Principal Amount ($)(a) | | | Value ($) | |
Loan Participation 0.1% | | | | | | |
| Republic of Algeria, Floating Rate Debt Conversion Bond, LIBOR plus .8125, 4.813% **, 3/4/2010 (Cost $91,074) | | 94,500 | | | 94,406 | |
| | | | | | |
| | |
| | | Shares | | | Value ($) | |
Warrants 0.0% | | | | | | |
Dayton Superior Corp. 144A* | | 10 | | | 0 | |
TravelCenters of America, Inc* | | 25 | | | 3 | |
| | | | | | |
Total Warrants (Cost $101) | | | | | 3 | |
| | | | | | |
| | |
| | | Units | | | Value ($) | |
Other Investments 0.2% | | | | | | |
Hercules, Inc., (Bond Unit) 6.5%, 6/30/2029 | | 150,000 | | | 112,500 | |
| IdleAire Technologies Corp. (Bond Unit), 144A, Step-up Coupon, 0% to 12/15/2008, 13.0% to 12/15/2012 | | 140,000 | | | 102,650 | |
| | | | | | |
Total Other Investments (Cost $220,548) | | | | | 215,150 | |
| | | | | | |
| | |
| | | Shares | | | Value ($) | |
Common Stocks 0.0% | | | | | | |
GEO Specialty Chemicals, Inc.* | | 2,058 | | | 2,573 | |
Intermet Corp.* | | 760 | | | 8,840 | |
| | | | | | |
Total Common Stocks (Cost $31,681) | | | | | 11,413 | |
| | | | | | |
Securities Lending Collateral 20.8% | | | | | | |
| | | | | | |
Daily Assets Fund Institutional, 4.28% (c) (d) (Cost $20,210,660) | | 20,210,660 | | | 20,210,660 | |
| | | | | | |
Cash Equivalents 5.1% | | | | | | |
| | | | | | |
Cash Management QP Trust, 4.26% (e) (Cost $4,913,796) | | 4,913,796 | | | 4,913,796 | |
| | | | | | |
| | |
| | | % of Net Assets | | | Value ($) | |
Total Investment Portfolio (Cost $114,353,316)+ | | 119.0 | | | 115,561,304 | |
Other Assets and Liabilities, Net | | (19.0 | ) | | (18,400,376 | ) |
| | | | | | |
Net Assets | | 100.0 | | | 97,160,928 | |
| | | | | | |
324
Notes to DWS Strategic Income VIP Portfolio of Investments
| * | Non-income producing security. In the case of a bond, generally denotes that the issuer has defaulted on the payment of principal or interest. The following table represents bonds that are in default. |
| | | | | | | | | | | | | | | |
Securities | | Coupon | | | Maturity Date | | Principal Amount | | Acquisition Cost ($) | | Value ($) |
Congoleum Corp. | | 8.625 | % | | 8/1/2008 | | 125,000 | | USD | | | 105,994 | | | 124,531 |
Grupo Iusacell SA de CV | | 10.0 | % | | 7/15/2004 | | 30,000 | | USD | | | 21,475 | | | 24,150 |
Oxford Automotive, Inc. | | 12.0 | % | | 10/15/2010 | | 159,598 | | USD | | | 14,988 | | | 14,364 |
Pliant Corp. | | 11.625 | % | | 6/15/2009 | | 10 | | USD | | | 10 | | | 11 |
| | | | | | | | | | | | | | | |
| | | | | | | | | | | $ | 142,467 | | $ | 163,056 |
| | | | | | | | | | | | | | | |
| ** | Floating rate notes are securities whose yields vary with a designated market index or market rate, such as the coupon-equivalent of the US Treasury bill rate. These securities are shown at their current rate as of December 31, 2005. |
| + | The cost for federal income tax purposes was $114,710,912. At December 31, 2005, net unrealized appreciation for all securities based on tax cost was $850,392. This consisted of aggregate gross unrealized appreciation for all securities in which there was an excess of value over tax cost of $2,445,798 and aggregate gross unrealized depreciation for all securities in which there was an excess of tax cost over value of $1,595,406. |
| (a) | Principal amount stated in US dollars unless otherwise noted. |
| (b) | All or a portion of these securities were on loan (see Notes to Financial Statements). The value of all securities loaned at December 31, 2005 amounted to $19,780,513 which is 20.4% of net assets. |
| (c) | Daily Assets Fund Institutional, an affiliated fund, is managed by Deutsche Asset Management, Inc. The rate shown is the annualized seven-day yield at period end. |
| (d) | Represents collateral held in connection with securities lending. |
| (e) | Cash Management QP Trust, an affiliated fund, is managed by Deutsche Investment Management Americas Inc. The rate shown is the annualized seven-day yield at period end. |
| (f) | At December 31, 2005, this security, in part or in whole, has been segregated to cover initial margin requirements for open future contracts. |
| 144A: | Security exempt from registration under Rule 144A of the Securities Act of 1933. These securities may be resold in transactions exempt from registration, normally to qualified institutional buyers. |
| LIBOR: | Represents the London InterBank Offered Rate. |
| PIK: | Denotes that all or a portion of the income is paid in-kind. |
| At | December 31, 2005, open futures contracts purchased were as follows: |
| | | | | | | | | | | |
Futures | | Expiration Date | | Contracts | | Aggregate Face Value ($) | | Value ($) | | Unrealized Appreciation/
(Depreciation) ($) | |
10 Year Canada Government Bond | | 3/22/2006 | | 21 | | 2,058,571 | | 2,066,308 | | 7,737 | |
10 Year Federal Germany Bond | | 3/8/2006 | | 34 | | 4,865,794 | | 4,904,376 | | 38,582 | |
10 Year Japanese Government Bond | | 3/9/2006 | | 3 | | 3,505,392 | | 3,493,874 | | (11,518 | ) |
| | | | | | | | | | | |
Total net unrealized appreciation | | | | | | | | | | 34,801 | |
| | | | | | | | | | | |
At December 31, 2005, open futures contracts sold short were as follows:
| | | | | | | | | | | |
Futures | | Expiration Date | | Contracts | | Aggregate Face Value ($) | | Value ($) | | Unrealized
Depreciation ($) | |
10 Year Australian Bond | | 3/15/2006 | | 21 | | 1,595,116 | | 1,633,376 | | (38,260 | ) |
10 Year US Treasury Bond | | 3/22/2006 | | 42 | | 4,569,003 | | 4,595,063 | | (26,060 | ) |
UK Treasury Bond | | 3/29/2006 | | 21 | | 4,097,157 | | 4,135,138 | | (37,981 | ) |
| | | | | | | | | | | |
Total net unrealized depreciation | | | | | | | | | | (102,301 | ) |
| | | | | | | | | | | |
At December 31, 2005, open credit default swap contract purchased was as follows:
| | | | | | | | | | |
Effective/Expiration Date | | Notional Amount ($) | | Cash Flows Paid by the Portfolio | | | Underlying Debt Obligation | | Net Unrealized
Depreciation ($) | |
| 10/18/2005 12/20/2010 | | 4,345,000+ | | Fixed — 3.95 | % | | Dow Jones CDX High Yield 100 | | (134,856 | ) |
Counterparty:
Currency Abbreviations
ARS Argentine Peso
EUR Euro
GBP British Pound
JPY Japanese Yen
MXN Mexican Peso
MYR Malaysian Ringgitt
TRY New Turkish Lira
UYU Uraguary Peso
The accompanying notes are an integral part of the financial statements.
325
Financial Statements
Statement of Assets and Liabilities
as of December 31, 2005
| | | | |
Assets | | | | |
Investments: | | | | |
Investments in securities, at value (cost $89,228,860) — including $19,780,513 of securities loaned | | $ | 90,436,848 | |
Investment in Daily Assets Fund Institutional (cost $20,210,660)* | | | 20,210,660 | |
Investment in Cash Management QP Trust (cost $4,913,796) | | | 4,913,796 | |
Total investments in securities, at value (cost $114,353,316) | | | 115,561,304 | |
Cash | | | 171,149 | |
Foreign currency, at value (cost $299,908) | | | 300,249 | |
Receivable for investments sold | | | 9,301 | |
Interest receivable | | | 1,905,490 | |
Receivable for Portfolio shares sold | | | 9,912 | |
Receivable for daily variation on open futures contracts | | | 5,231 | |
Foreign taxes recoverable | | | 2,164 | |
Unrealized appreciation on forward currency exchange contracts | | | 111,514 | |
Due from Advisor | | | 2,298 | |
Other assets | | | 2,467 | |
Total assets | | | 118,081,079 | |
Liabilities | | | | |
Payable for investments purchased | | | 131,232 | |
Payable upon return of securities loaned | | | 20,210,660 | |
Payable for Portfolio shares redeemed | | | 89,171 | |
Net payable on closed forward foreign currency exchange contracts | | | 159,838 | |
Unrealized depreciation on forward foreign currency exchange contracts | | | 90,019 | |
Unrealized depreciation on credit default swap contracts | | | 134,856 | |
Accrued management fee | | | 47,186 | |
Other accrued expenses and payables | | | 57,189 | |
Total liabilities | | | 20,920,151 | |
| | | | |
Net assets, at value | | $ | 97,160,928 | |
| | | | |
| Net Assets | | | | |
Net assets consist of: | | | | |
Undistributed net investment income | | | 4,603,670 | |
Net unrealized appreciation (depreciation) on: | | | | |
Investments | | | 1,207,988 | |
Credit default swaps | | | (134,856 | ) |
Foreign currency related transactions | | | (129,973 | ) |
Futures | | | (67,500 | ) |
Accumulated net realized gain (loss) | | | 550,593 | |
Paid-in capital | | | 91,131,006 | |
| | | | |
Net assets, at value | | $ | 97,160,928 | |
| | | | |
Class A | | | | |
| Net Asset Value, offering and redemption price per share ($70,804,886 ÷ 6,158,201 outstanding shares of beneficial interest, $.01 par value, unlimited number of shares authorized) | | $ | 11.50 | |
| | | | |
Class B | | | | |
| Net Asset Value, offering and redemption price per share ($26,356,042 ÷ 2,304,696 outstanding shares of beneficial interest, $.01 par value, unlimited number of shares authorized) | | $ | 11.44 | |
| | | | |
| * | Represents collateral on securities loaned. |
326
Statement of Operations
for the year ended December 31, 2005
| | | | |
Investment Income | | | | |
Income: | | | | |
Dividends | | $ | 31,504 | |
Interest | | | 5,569,498 | |
Interest — Cash Management QP Trust | | | 207,414 | |
Securities lending income, including income from Daily Assets Fund Institutional, net of borrower rebates | | | 48,556 | |
| | | | |
Total Income | | | 5,856,972 | |
| | | | |
Expenses: | | | | |
Management fee | | | 586,283 | |
Custodian fees | | | 48,640 | |
Distribution service fees (Class B) | | | 58,999 | |
Record keeping fees (Class B) | | | 28,221 | |
Auditing | | | 53,790 | |
Legal | | | 12,752 | |
Trustees’ fees and expenses | | | 3,544 | |
Reports to shareholders | | | 25,200 | |
Other | | | 65,777 | |
Total expenses before expense reductions | | | 883,206 | |
Expense reductions | | | (11,628 | ) |
Total expenses after expense reductions | | | 871,578 | |
| | | | |
Net investment income | | | 4,985,394 | |
| | | | |
Realized and Unrealized Gain (Loss) on Investment Transactions | | | | |
Net realized gain (loss) from: | | | | |
Investments | | | 1,049,114 | |
Credit default swaps | | | (130,575 | ) |
Futures | | | 96,220 | |
Foreign currency related transactions | | | (659,699 | ) |
| | | | |
| | | 355,060 | |
| | | | |
Net unrealized appreciation (depreciation) during the period on: | | | | |
Investments | | | (3,500,120 | ) |
Credit default swaps | | | (134,856 | ) |
Futures | | | (125,539 | ) |
Foreign currency related transactions | | | 471,669 | |
| | | (3,288,846 | ) |
| | | | |
Net gain (loss) on investment transactions | | | (2,933,786 | ) |
| | | | |
Net increase (decrease) in net assets resulting from operations | | $ | 2,051,608 | |
| | | | |
The accompanying notes are an integral part of the financial statements.
327
Statement of Changes in Net Assets
| | | | | | | | |
Increase (Decrease) in Net Assets | | Years Ended December 31, | |
| | 2005 | | | 2004 | |
Operations: | | | | | | | | |
Net investment income | | $ | 4,985,394 | | | $ | 3,680,243 | |
Net realized gain (loss) on investment transactions | | | 355,060 | | | | 2,282,802 | |
Net unrealized appreciation (depreciation) during the period on investment transactions | | | (3,288,846 | ) | | | 390,098 | |
Net increase (decrease) in net assets resulting from operations | | | 2,051,608 | | | | 6,353,143 | |
Distributions to shareholders from: | | | | | | | | |
Net investment income: | | | | | | | | |
Class A | | | (5,064,114 | ) | | | — | |
Class B | | | (1,726,009 | ) | | | — | |
Net realized gains: | | | | | | | | |
Class A | | | (149,856 | ) | | | (2,822,807 | ) |
Class B | | | (53,955 | ) | | | (547,427 | ) |
Portfolio share transactions: | | | | | | | | |
Class A | | | | | | | | |
Proceeds from shares sold | | | 19,392,981 | | | | 13,206,141 | |
Reinvestment of distributions | | | 5,213,970 | | | | 2,822,807 | |
Cost of shares redeemed | | | (12,247,000 | ) | | | (17,995,166 | ) |
Net increase (decrease) in net assets from Class A share transactions | | | 12,359,951 | | | | (1,966,218 | ) |
Class B | | | | | | | | |
Proceeds from shares sold | | | 7,141,190 | | | | 13,821,690 | |
Reinvestment of distributions | | | 1,779,964 | | | | 547,427 | |
Cost of shares redeemed | | | (2,685,538 | ) | | | (2,371,956 | ) |
Net increase (decrease) in net assets from Class B share transactions | | | 6,235,616 | | | | 11,997,161 | |
Increase (decrease) in net assets | | | 13,653,241 | | | | 13,013,852 | |
Net assets at beginning of period | | | 83,507,687 | | | | 70,493,835 | |
| | | | | | | | |
Net assets at end of period (including undistributed net investment income of $4,603,670 and $7,007,553, respectively) | | $ | 97,160,928 | | | $ | 83,507,687 | |
| | | | | | | | |
Other Information | | | | | | | | |
Class A | | | | | | | | |
Shares outstanding at beginning of period | | | 5,069,464 | | | | 5,264,429 | |
Shares sold | | | 1,677,930 | | | | 1,130,086 | |
Shares issued to shareholders in reinvestment of distributions | | | 468,040 | | | | 247,832 | |
Shares redeemed | | | (1,057,233 | ) | | | (1,572,883 | ) |
Net increase (decrease) in Class A shares | | | 1,088,737 | | | | (194,965 | ) |
| | | | | | | | |
Shares outstanding at end of period | | | 6,158,201 | | | | 5,069,464 | |
| | | | | | | | |
Class B | | | | | | | | |
Shares outstanding at beginning of period | | | 1,758,421 | | | | 701,718 | |
Shares sold | | | 619,274 | | | | 1,213,237 | |
Shares issued to shareholders in reinvestment of distributions | | | 160,213 | | | | 48,231 | |
Shares redeemed | | | (233,212 | ) | | | (204,765 | ) |
Net increase (decrease) in Class B shares | | | 546,275 | | | | 1,056,703 | |
| | | | | | | | |
Shares outstanding at end of period | | | 2,304,696 | | | | 1,758,421 | |
| | | | | | | | |
The accompanying notes are an integral part of the financial statements.
328
Financial Highlights
Class A
| | | | | | | | | | | | | | | | | | | | |
Years Ended December 31, Selected Per Share Data | | 2005 | | | 2004 | | | 2003 | | | 2002 | | | 2001a | |
Net asset value, beginning of period | | $ | 12.25 | | | $ | 11.82 | | | $ | 11.10 | | | $ | 10.27 | | | $ | 9.86 | |
| | | | | | | | | | | | | | | | | | | | |
Income (loss) from investment operations: | | | | | | | | | | | | | | | | | | | | |
Net investment incomeb | | | .65 | | | | .58 | | | | .41 | | | | .45 | | | | .48 | |
Net realized and unrealized gain (loss) on investment transactions | | | (.39 | ) | | | .39 | | | | .47 | | | | .68 | | | | .03 | |
Total from investment operations | | | .26 | | | | .97 | | | | .88 | | | | 1.13 | | | | .51 | |
Less distributions from: | | | | | | | | | | | | | | | | | | | | |
Net investment income | | | (.98 | ) | | | — | | | | (.15 | ) | | | (.30 | ) | | | (.10 | ) |
Net realized gain on investment transactions | | | (.03 | ) | | | (.54 | ) | | | (.01 | ) | | | — | | | | — | |
Total distributions | | | (1.01 | ) | | | (.54 | ) | | | (.16 | ) | | | (.30 | ) | | | (.10 | ) |
| | | | | | | | | | | | | | | | | | | | |
Net asset value, end of period | | $ | 11.50 | | | $ | 12.25 | | | $ | 11.82 | | | $ | 11.10 | | | $ | 10.27 | |
| | | | | | | | | | | | | | | | | | | | |
Total Return (%) | | | 2.38 | | | | 8.60 | | | | 7.85 | | | | 11.30 | | | | 5.23 | |
Ratios to Average Net Assets and Supplemental Data | | | | | | | | | | | | | | | | | | | | |
Net assets, end of period ($ millions) | | | 71 | | | | 62 | | | | 62 | | | | 60 | | | | 21 | |
Ratio of expenses (%) | | | .88 | | | | .84 | | | | .83 | | | | .73 | | | | .66 | |
Ratio of net investment income (%) | | | 5.61 | | | | 4.99 | | | | 3.60 | | | | 4.26 | | | | 4.76 | |
Portfolio turnover rate (%) | | | 120 | | | | 210 | | | | 160 | | | | 65 | | | | 27 | |
| a | As required, effective January 1, 2001, the Portfolio has adopted the provisions of the AICPA Audit and Accounting Guide for Investment Companies and began amortizing premium on debt securities. |
| b | Based on average shares outstanding during the period. |
Class B
| | | | | | | | | | | | |
Years Ended December 31, Selected Per Share Data | | 2005 | | | 2004 | | | 2003a | |
Net asset value, beginning of period | | $ | 12.17 | | | $ | 11.78 | | | $ | 11.44 | |
| | | | | | | | | | | | |
Income (loss) from investment operations: | | | | | | | | | | | | |
Net investment incomeb | | | .61 | | | | .53 | | | | .17 | |
Net realized and unrealized gain (loss) on investment transactions | | | (.38 | ) | | | .40 | | | | .17 | |
Total from investment operations | | | .23 | | | | .93 | | | | .34 | |
Less distributions from: | | | | | | | | | | | | |
Net investment income | | | (.93 | ) | | | — | | | | — | |
Net realized gain on investment transactions | | | (.03 | ) | | | (.54 | ) | | | — | |
Total distributions | | | (.96 | ) | | | (.54 | ) | | | — | |
| | | | | | | | | | | | |
Net asset value, end of period | | $ | 11.44 | | | $ | 12.17 | | | $ | 11.78 | |
| | | | | | | | | | | | |
Total Return (%) | | | 1.92 | c | | | 8.27 | | | | 2.97 | ** |
Ratios to Average Net Assets and Supplemental Data | | | | | | | | | | | | |
Net assets, end of period ($ millions) | | | 26 | | | | 21 | | | | 8 | |
Ratio of expenses before expense reductions (%) | | | 1.25 | | | | 1.22 | | | | 1.26 | * |
Ratio of expenses after expense reductions (%) | | | 1.21 | | | | 1.22 | | | | 1.26 | * |
Ratio of net investment income (%) | | | 5.28 | | | | 4.61 | | | | 1.80 | * |
Portfolio turnover rate (%) | | | 120 | | | | 210 | | | | 160 | |
| a | For the period from May 1, 2003 (commencement of operations of Class B shares) to December 31, 2003. |
| b | Based on average shares outstanding during the period. |
| c | Total return would have been lower had certain expenses not been reduced. |
329
Performance Summary December 31, 2005
DWS Technology VIP
All performance shown is historical, assumes reinvestment of all dividend and capital gain distributions and does not guarantee future results. Investment return and principal value fluctuate with changing market conditions so that, when redeemed, shares may be worth more or less than their original cost. Current performance may be lower or higher than the performance data quoted. Please visit www.dws-scudder.com for the Portfolio’s most recent month-end performance. Performance doesn’t reflect charges and fees (“contract charges”) associated with the separate account that invests in the Portfolio or any variable life insurance policy or variable annuity contract for which the Portfolio is an investment option. These charges and fees will reduce returns. While all share classes have the same underlying portfolio, their performance will differ.
Investments by the Portfolio in small companies present greater risk of loss than investments in larger, more established companies. Concentration of the Portfolio’s investment in technology stocks may present a greater risk than investments in a more diversified Portfolio. Investments by the Portfolio in emerging technology companies present greater risk than investments in more-established technology companies. This Portfolio is non-diversified and can take larger positions in fewer companies, increasing its overall potential risk. Please read this Portfolio’s prospectus for specific details regarding its investments and risk profile.
Portfolio returns shown for the 3-year and the Life of Class for Class B shares reflect a fee waiver and/or expense reimbursement. Without this waiver/reimbursement, returns would have been lower.
| | |
| Growth of an Assumed $10,000 Investment in DWS Technology VIP from 5/1/1999 to 12/31/2005 |
| |
| ¨ DWS Technology VIP — Class A | | |
| |
| ¨ Goldman Sachs Technology Index | | |
| |
| |
| ¨ Russell 1000 Growth Index | | |

Yearly periods ended December 31
The Goldman Sachs Technology Index is an unmanaged capitalization-weighted index based on a universe of technology-related stocks.
The Russell 1000 Growth Index is an unmanaged index that consists of those stocks in the Russell 1000 Index with higher price-to-book ratios and higher forecasted growth values.
Index returns assume reinvested dividends and, unlike Portfolio returns, do not reflect any fees or expenses. It is not possible to invest directly into an index.
Comparative Results
| | | | | | | | | | | | | | | | | | |
DWS Technology VIP | | | | 1-Year | | | 3-Year | | | 5-Year | | | Life of Portfolio* | |
| Class A | | Growth of $10,000 | | $ | 10,374 | | | $ | 15,501 | | | $ | 6,758 | | | $ | 9,418 | |
| | Average annual total return | | | 3.74 | % | | | 15.73 | % | | | -7.54 | % | | | -.90 | % |
Goldman Sachs Technology Index | | Growth of $10,000 | | $ | 10,203 | | | $ | 16,189 | | | $ | 6,906 | | | $ | 7,089 | |
| | Average annual total return | | | 2.03 | % | | | 17.42 | % | | | -7.14 | % | | | -5.03 | % |
Russell 1000 Growth Index | | Growth of $10,000 | | $ | 10,526 | | | $ | 14,518 | | | $ | 8,332 | | | $ | 8,082 | |
| | Average annual total return | | | 5.26 | % | | | 13.23 | % | | | -3.58 | % | | | -3.14 | % |
| | | | | | | | | | | | | | |
DWS Technology VIP | | | | 1-Year | | | 3-Year | | | Life of Class** | |
Class B | | Growth of $10,000 | | $ | 10,327 | | | $ | 15,318 | | | $ | 14,591 | |
| | Average annual total return | | | 3.27 | % | | | 15.28 | % | | | 11.40 | % |
Goldman Sachs Technology Index | | Growth of $10,000 | | $ | 10,203 | | | $ | 16,189 | | | $ | 14,431 | |
| | Average annual total return | | | 2.03 | % | | | 17.42 | % | | | 11.02 | % |
Russell 1000 Growth Index | | Growth of $10,000 | | $ | 10,526 | | | $ | 14,518 | | | $ | 13,216 | |
| | Average annual total return | | | 5.26 | % | | | 13.23 | % | | | 8.29 | % |
The growth of $10,000 is cumulative.
| * | The Portfolio commenced operations on May 1, 1999. Index returns begin April 30, 1999. |
| ** | The Portfolio commenced offering Class B shares on July 1, 2002. Index returns begin June 30, 2002. |
330
Information About Your Portfolio’s Expenses
DWS Technology VIP
As an investor of the Portfolio, you incur two types of costs: ongoing expenses and transaction costs. Ongoing expenses include management fees, distribution and service (12b-1) fees and other Portfolio expenses. Examples of transaction costs include sales charges (loads), redemption fees and account maintenance fees, which are not shown in this section. The following tables are intended to help you understand your ongoing expenses (in dollars) of investing in the Portfolio and to help you compare these expenses with the ongoing expenses of investing in other mutual funds. The tables are based on an investment of $1,000 made at the beginning of the six-month period ended December 31, 2005.
The tables illustrate your Portfolio’s expenses in two ways:
Actual Portfolio Return. This helps you estimate the actual dollar amount of ongoing expenses (but not transaction costs) paid on a $1,000 investment in the Portfolio using the Portfolio’s actual return during the period. To estimate the expenses you paid over the period, simply divide your account value by $1,000 (for example, an $8,600 account value divided by $1,000 = 8.6), then multiply the result by the number in the “Expenses Paid per $1,000” line under the share class you hold.
Hypothetical 5% Portfolio Return. This helps you to compare your Portfolio’s ongoing expenses (but not transaction costs) with those of other mutual funds using the Portfolio’s actual expense ratio and a hypothetical rate of return of 5% per year before expenses. Examples using a 5% hypothetical Portfolio return may be found in the shareholder reports of other mutual funds. The hypothetical account values and expenses may not be used to estimate the actual ending account balance or expenses you paid for the period.
Please note that the expenses shown in these tables are meant to highlight your ongoing expenses only and do not reflect any transaction costs. The “Expenses Paid per $1,000” line of the tables is useful in comparing ongoing expenses only and will not help you determine the relative total expense of owning different funds. If these transaction costs had been included, your costs would have been higher.
Expenses and Value of a $1,000 Investment for the six months ended December 31, 2005
| | | | | | |
Actual Portfolio Return | | Class A | | Class B |
Beginning Account Value 7/1/05 | | $ | 1,000.00 | | $ | 1,000.00 |
Ending Account Value 12/31/05 | | $ | 1,107.10 | | $ | 1,104.30 |
Expenses Paid per $1,000* | | $ | 4.62 | | $ | 6.79 |
| | |
Hypothetical 5% Portfolio Return | | Class A | | Class B |
Beginning Account Value 7/1/05 | | $ | 1,000.00 | | $ | 1,000.00 |
Ending Account Value 12/31/05 | | $ | 1,020.82 | | $ | 1,018.75 |
Expenses Paid per $1,000* | | $ | 4.43 | | $ | 6.51 |
| * | Expenses are equal to the Portfolio’s annualized expense ratio for each share class, multiplied by the average account value over the period, multiplied by the number of days in the most recent six-month period, then divided by 365. |
| | | | | | |
Annualized Expense Ratios | | Class A | | | Class B | |
DWS Variable Series II — DWS Technology VIP | | .87 | % | | 1.28 | % |
For more information, please refer to the Portfolio’s prospectus.
These tables do not reflect charges and fees (“contract charges”) associated with the separate account that invests in the portfolio or any variable life insurance policy or variable annuity contract for which the portfolio is an investment option.
331
Management Summary December 31, 2005
DWS Technology VIP
The technology sector delivered a modestly positive return in 2005, masking significant intraperiod volatility and an exceptionally wide dispersion in returns among the best and worst performers. In this potentially challenging environment, DWS Technology VIP (Class A shares, unadjusted for contract charges) returned 3.74%, comfortably ahead of the 2.03% return of its benchmark, the Goldman Sachs Technology Index. The Portfolio underperformed versus the Russell 1000 Growth Index which returned 5.26%.
The largest positive contribution to return came from the substantial outperformance of our stock picks in semiconductors. Here, the Portfolio was underweight in the largest stocks in the sector in favor of companies with strong product cycles — such as Advanced Micro Devices, Inc. (3.4% of net assets as of December 31, 2005) and Broadcom Corp. (1.4%) — as well as restructuring stories such as National Semiconductor Corp. (0.9%). Performance was also boosted by an overweight in communications equipment stocks, which outperformed, and strong stock selection in the Internet sector. Unfortunately, an underweight in Apple Computer, Inc. (2.6%), one of the strongest stocks in the benchmark, detracted significantly from returns. The underperformance of our stock picks in the software sector also detracted from returns.
As we move into 2006, our belief is that the fundamentals of the technology sector are solid but not spectacular. While we believe that technology can outperform the broader market in the long-term, we do not foresee outsized returns on an absolute basis given the slow, steady recovery we have been experiencing over the past few years. In this environment, we intend to continue to focus on managing risk by emphasizing companies with strong market positions, robust balance sheets and favorable growth prospects.
Ian Link, CFA Kelly P. Davis
Lead Manager Brian S. Peters, CFA
Portfolio Managers
Deutsche Investment Management Americas Inc.
Percentages in parnetheses represent percentages of the Portfolio’s total net assets as of December 31, 2005.
All performance shown is historical, assumes reinvestment of all dividend and capital gain distributions, and does not guarantee future results. Investment return and principal value fluctuate with changing market conditions so that, when redeemed, shares may be worth more or less than their original cost. Current performance may be lower or higher than the performance data quoted. Please visit www.dws-scudder.com for the product’s most recent month-end performance. Performance doesn’t reflect charges and fees (“contract charges”) associated with the separate account that invests in the Portfolio or any variable life insurance policy or variable annuity contract for which the Portfolio is an investment option. These charges and fees will reduce returns.
Risk Considerations
Investments by the Portfolio in small companies present greater risk of loss than investments in larger, more established companies. Concentration of the Portfolio’s investment in technology stocks may present a greater risk than investments in a more diversified portfolio. Investments by the Portfolio in emerging technology companies present greater risk than investments in more established technology companies. This Portfolio is non-diversified and can take larger positions in fewer companies, increasing its overall potential risk. Please read this Portfolio’s prospectus for specific details regarding this product’s investments and risk profile.
The Goldman Sachs Technology Index is an unmanaged, capitalization-weighted index based on a universe of technology-related stocks.
The Russell 1000 Growth Index is an unmanaged index that consists of those stocks in the Russell 1000 Index with higher price-to-book ratios and higher forecasted growth values.
Index returns assume reinvestment of all dividends and, unlike portfolio returns, do not reflect any fees or expenses. It is not possible to invest directly into an index.
Portfolio management market commentary is as of December 31, 2005, and may not come to pass. This information is subject to change at any time based on market and other conditions.
332
Portfolio Summary
DWS Technology VIP
| | | | | | |
Asset Allocation (Excludes Securities Lending Collateral) | | 12/31/05 | | | 12/31/04 | |
Common Stocks | | 95 | % | | 91 | % |
Cash Equivalents | | 5 | % | | 9 | % |
| | | | | | |
| | 100 | % | | 100 | % |
| | | | | | |
| | | | | | |
Sector Diversification (As a % of Common Stocks) | | 12/31/05 | | | 12/31/04 | |
Information Technology | | 95 | % | | 96 | % |
Consumer Discretionary | | 5 | % | | 3 | % |
Health Care | | — | | | 1 | % |
| | | | | | |
| | 100 | % | | 100 | % |
| | | | | | |
Asset allocation and sector diversification are subject to change.
For more complete details about the Portfolio’s investment portfolio, see page 42. A quarterly Fact Sheet is available upon request. Information concerning portfolio holdings of the Portfolio as of month end will be posted to www.dws-scudder.com on the 15th of the following month.
Following the Portfolio’s fiscal first and third quarter-end, a complete portfolio holdings listing is filed with the SEC on Form N-Q. The form will be available on the SEC’s Web site at www.sec.gov, and it also may be reviewed and copied at the SEC’s Public Reference Room in Washington, D.C. Information on the operation of the SEC’s Public Reference Room may be obtained by calling (800) SEC-0330.
333
Investment Portfolio December 31, 2005
DWS Technology VIP
| | | | |
| | | Shares | | Value ($) |
Common Stocks 95.0% | | | | |
Consumer Discretionary 4.2% | | | | |
Internet & Catalog Retail | | | | |
eBay, Inc.* | | 210,600 | | 9,108,450 |
| | | | |
Information Technology 90.5% | | | | |
Communications Equipment 15.0% | | | | |
Avocent Corp.* (a) | | 129,900 | | 3,531,981 |
Cisco Systems, Inc.* | | 347,600 | | 5,950,912 |
Corning, Inc.* | | 254,500 | | 5,003,470 |
Lucent Technologies, Inc.* | | 809,900 | | 2,154,334 |
Motorola, Inc. | | 236,484 | | 5,342,174 |
Nokia Oyj (ADR) | | 195,700 | | 3,581,310 |
QUALCOMM, Inc. | | 130,016 | | 5,601,089 |
Scientific-Atlanta, Inc. | | 23,900 | | 1,029,373 |
| | | | |
| | | | 32,194,643 |
| | | | |
Computers & Peripherals 20.5% | | | | |
Apple Computer, Inc.* | | 77,700 | | 5,585,853 |
Dell, Inc.* | | 282,225 | | 8,463,928 |
EMC Corp.* | | 675,300 | | 9,197,586 |
Hewlett-Packard Co. | | 106,700 | | 3,054,821 |
Hon Hai Precision Industry Co., Ltd. | | 230,000 | | 1,261,176 |
International Business Machines Corp. | | 79,100 | | 6,502,020 |
Network Appliance, Inc.* | | 96,600 | | 2,608,200 |
QLogic Corp.* | | 107,210 | | 3,485,397 |
SanDisk Corp.* | | 20,900 | | 1,312,938 |
Sun Microsystems, Inc.* | | 662,300 | | 2,775,037 |
| | | | |
| | | | 44,246,956 |
| | | | |
Electronic Equipment & Instruments 1.1% | | | | |
AU Optronics Corp. (ADR) (a) | | 90,610 | | 1,360,056 |
Cheng Uei Precision Industry Co., Ltd. | | 332,000 | | 1,077,118 |
| | | | |
| | | | 2,437,174 |
| | | | |
Internet Software & Services 8.8% | | | | |
Google, Inc. “A”* | | 23,800 | | 9,873,668 |
Yahoo!, Inc.* | | 235,700 | | 9,234,726 |
| | | | |
| | | | 19,108,394 |
| | | | |
IT Consulting & Services 6.7% | | | | |
Affiliated Computer Services, Inc. “A”* | | 37,000 | | 2,189,660 |
Automatic Data Processing, Inc. | | 150,530 | | 6,907,822 |
Cognizant Technology Solutions Corp. “A”* | | 105,500 | | 5,311,925 |
| | | | |
| | | | 14,409,407 |
| | | | |
Semiconductors & Semiconductor Equipment 24.0% | | | | |
Advanced Micro Devices, Inc.* | | 239,400 | | 7,325,640 |
Applied Materials, Inc. | | 309,900 | | 5,559,606 |
Broadcom Corp. “A”* | | 62,658 | | 2,954,325 |
Intel Corp. | | 555,189 | | 13,857,517 |
334
| | | | | | |
| | | Shares | | | Value ($) | |
Intersil Corp. “A” | | 124,400 | | | 3,095,072 | |
Maxim Integrated Products, Inc. | | 158,934 | | | 5,759,768 | |
Micron Technology, Inc.* (a) | | 107,400 | | | 1,429,494 | |
National Semiconductor Corp. (a) | | 73,600 | | | 1,912,128 | |
Spansion, Inc. “A”* | | 83,500 | | | 1,162,320 | |
Sumco Corp.* | | 14,800 | | | 776,801 | |
Taiwan Semiconductor Manufacturing Co., Ltd. | | 664,000 | | | 1,264,222 | |
Texas Instruments, Inc. | | 205,900 | | | 6,603,213 | |
| | | | | | |
| | | | | 51,700,106 | |
| | | | | | |
Software 14.4% | | | | | | |
Activision, Inc.* | | 296,766 | | | 4,077,565 | |
Business Objects SA (ADR)* (a) | | 175,400 | | | 7,087,914 | |
Computer Associates International, Inc. | | 74,900 | | | 2,111,431 | |
Microsoft Corp. | | 183,046 | | | 4,786,653 | |
Oracle Corp.* | | 420,400 | | | 5,133,084 | |
Patni Computer Systems Ltd. (ADR)* (a) | | 10,400 | | | 241,072 | |
Quest Software, Inc.* (a) | | 150,000 | | | 2,188,500 | |
Symantec Corp.* | | 192,677 | | | 3,371,847 | |
Take-Two Interactive Software, Inc.* (a) | | 113,600 | | | 2,010,720 | |
| | | | | | |
| | | | | 31,008,786 | |
| | | | | | |
Materials 0.3% | | | | | | |
Metals & Mining | | | | | | |
SODIFF Advanced Materials Co., Ltd. | | 28,944 | | | 577,598 | |
| | | | | | |
Total Common Stocks (Cost $172,973,040) | | | | | 204,791,514 | |
| | | | | | |
Call Options Purchased 0.0% | | | | | | |
Intel Corp. Expiring 1/16/2006, Strike Price, $25.0 (Cost $61,903) | | 860 | | | 51,600 | |
| | | | | | |
Securities Lending Collateral 5.3% | | | | | | |
Daily Assets Fund Institutional, 4.28% (b) (c) (Cost $11,500,547) | | 11,500,547 | | | 11,500,547 | |
| | | | | | |
Cash Equivalents 4.5% | | | | | | |
Cash Management QP Trust, 4.26% (d) (Cost $9,671,342) | | 9,671,342 | | | 9,671,342 | |
| | | | | | |
| | |
| | | % of Net Assets | | | Value ($) | |
Total Investment Portfolio (Cost $194,206,832)+ | | 104.8 | | | 226,015,003 | |
| | | | | | |
Other Assets and Liabilities, Net | | (4.8 | ) | | (10,412,262 | ) |
| | | | | | |
Net Assets | | 100.0 | | | 215,602,741 | |
| | | | | | |
Notes to DWS Technology VIP Portfolio of Investments
| * | Non-income producing security. |
| + | The cost for federal income tax purposes was $210,884,745. At December 31, 2005, net unrealized appreciation for all securities based on tax cost was $15,130,258. This consisted of aggregate gross unrealized appreciation for all securities in which there was an excess of value over tax cost of $28,273,058 and aggregate gross unrealized depreciation for all securities in which there was an excess of tax cost over value of $13,142,800. |
| (a) | All or a portion of these securities were on loan (see Notes to Financial Statements). The value of all securities loaned at December 31, 2005 amounted to $11,144,411 which is 5.2% of net assets. |
| (b) | Daily Assets Fund Institutional, an affiliated fund, is managed by Deutsche Asset Management, Inc. The rate shown is the annualized seven-day yield at period end. |
| (c) | Represents collateral held in connection with securities lending. |
| (d) | Cash Management QP Trust, an affiliated fund, is managed by Deutsche Investment Management Americas Inc. The rate shown is the annualized seven-day yield at period end. |
| ADR: | American Depositary Receipt |
At December 31, 2005, open written options were as follows:
| | | | | | | | | |
Written Options | | Expiration Date | | Number of
Contracts | | Strike Price | | Value ($) | |
Call Options | | | | | | | | | |
Yahoo! Inc. (Premiums received $69,716) | | 1/21/2006 | | 403 | | 42.5 | | (17,732 | ) |
The accompanying notes are an integral part of the financial statements.
335
Financial Statements
Statement of Assets and Liabilities
as of December 31, 2005
| | | | |
Assets | | | | |
Investments: | | | | |
Investments in securities, at value (cost $173,034,943) — including $11,144,411 of securities loaned | | $ | 204,843,114 | |
Investment in Daily Assets Fund Institutional (cost $11,500,547)* | | | 11,500,547 | |
Investment in Cash Management QP Trust (cost $9,671,342) | | | 9,671,342 | |
Total investments in securities, at value (cost $194,206,832) | | | 226,015,003 | |
Foreign currency, at value (cost $56,400) | | | 57,591 | |
Receivable for investments sold | | | 958,971 | |
Dividends receivable | | | 56,508 | |
Interest receivable | | | 44,795 | |
Receivable for Portfolio shares sold | | | 513,727 | |
Foreign taxes recoverable | | | 274 | |
Other assets | | | 6,864 | |
| | | | |
Total assets | | | 227,653,733 | |
| | | | |
Liabilities | | | | |
Payable for investments purchased | | | 300,775 | |
Payable for Portfolio shares redeemed | | | 3,659 | |
Payable upon return of securities loaned | | | 11,500,547 | |
Written options, at value (premiums received $69,716) | | | 17,732 | |
Accrued management fee | | | 139,037 | |
Other accrued expenses and payables | | | 89,242 | |
Total liabilities | | | 12,050,992 | |
| | | | |
Net assets, at value | | $ | 215,602,741 | |
| | | | |
Net Assets | | | | |
Net assets consist of: | | | | |
Accumulated distributions in excess of net investment income | | | (402 | ) |
Net unrealized appreciation (depreciation) on: | | | | |
Investments | | | 31,808,171 | |
Written options | | | 51,984 | |
Foreign currency related transactions | | | 1,193 | |
Accumulated net realized gain (loss) | | | (271,637,475 | ) |
Paid-in capital | | | 455,379,270 | |
| | | | |
Net assets, at value | | $ | 215,602,741 | |
| | | | |
Class A | | | | |
Net Asset Value, offering and redemption price per share ($199,181,092 ÷ 21,420,473 outstanding shares of beneficial interest, $.01 par value, unlimited number of shares authorized) | | $ | 9.30 | |
| | | | |
Class B | | | | |
Net Asset Value, offering and redemption price per share ($16,421,649 ÷ 1,782,726 outstanding shares of beneficial interest, $.01 par value, unlimited number of shares authorized) | | $ | 9.21 | |
| | | | |
| * | Represents collateral on securities loaned. |
336
Statement of Operations
for the year ended December 31, 2005
| | | | |
Investment Income | |
Income: Dividends (net of foreign taxes withheld of $27,464) | | $ | 776,548 | |
Interest | | | 2,573 | |
Interest — Cash Management QP Trust | | | 266,204 | |
Securities lending income, including income from Daily Assets Fund Institutional, net of borrower rebates | | | 22,980 | |
| | | | |
Total Income | | | 1,068,305 | |
| | | | |
Expenses: | | | | |
Management fee | | | 1,609,872 | |
Custodian and accounting fees | | | 110,875 | |
Distribution service fees (Class B) | | | 37,898 | |
Record keeping fees (Class B) | | | 22,257 | |
Auditing | | | 46,540 | |
Legal | | | 13,238 | |
Trustees’ fees and expenses | | | 10,020 | |
Reports to shareholders | | | 42,955 | |
Other | | | 16,148 | |
Total expenses before expense reductions | | | 1,909,803 | |
Expense reductions | | | (3,696 | ) |
Total expenses after expense reductions | | | 1,906,107 | |
| | | | |
Net investment income (loss) | | | (837,802 | ) |
| | | | |
Realized and Unrealized Gain (Loss) on Investment Transactions | |
Net realized gain (loss) from: | | | | |
Investments | | | 11,625,908 | |
Written options | | | 1,541,327 | |
Foreign currency related transactions | | | (146,548 | ) |
| | | | |
| | | 13,020,687 | |
| | | | |
Net unrealized appreciation (depreciation) during the period on: | | | | |
Investments | | | (6,121,456 | ) |
Written options | | | (74,442 | ) |
Foreign currency related transactions | | | (6,521 | ) |
| | | | |
| | | (6,202,419 | ) |
| | | | |
Net gain (loss) on investment transactions | | | 6,818,268 | |
| | | | |
Net increase (decrease) in net assets resulting from operations | | $ | 5,980,466 | |
| | | | |
The accompanying notes are an integral part of the financial statements.
337
Statement of Changes in Net Assets
| | | | | | | | |
| | | Years Ended December 31, | |
Increase (Decrease) in Net Assets | | 2005 | | | 2004 | |
Operations: | | | | | | | | |
Net investment income (loss) | | $ | (837,802 | ) | | $ | 1,003,070 | |
Net realized gain (loss) | | | 13,020,687 | | | | 14,690,748 | |
Net unrealized appreciation (depreciation) during the period on investment transactions | | | (6,202,419 | ) | | | (12,924,302 | ) |
Net increase (decrease) in net assets resulting from operations | | | 5,980,466 | | | | 2,769,516 | |
Distributions to shareholders from: | | | | | | | | |
Net investment income: | | | | | | | | |
Class A | | | (979,061 | ) | | | — | |
Class B | | | (18,255 | ) | | | — | |
| Portfolio share transactions: | | | | | | | | |
Class A | | | | | | | | |
Proceeds from shares sold | | | 13,734,734 | | | | 32,575,554 | |
Reinvestment of distributions | | | 979,061 | | | | — | |
Cost of shares redeemed | | | (50,111,493 | ) | | | (61,621,741 | ) |
Net increase (decrease) in net assets from Class A share transactions | | | (35,397,698 | ) | | | (29,046,187 | ) |
Class B | | | | | | | | |
Proceeds from shares sold | | | 2,549,674 | | | | 7,002,084 | |
Reinvestment of distributions | | | 18,255 | | | | — | |
Cost of shares redeemed | | | (2,984,180 | ) | | | (1,720,967 | ) |
Net increase (decrease) in net assets from Class B share transactions | | | (416,251 | ) | | | 5,281,117 | |
Increase (decrease) in net assets | | | (30,830,799 | ) | | | (20,995,554 | ) |
Net assets at beginning of period | | | 246,433,540 | | | | 267,429,094 | |
| | | | | | | | |
Net assets at end of period (including accumulated distributions in excess of net investment and undistributed net investment income of $402 and $950,616, respectively) | | $ | 215,602,741 | | | $ | 246,433,540 | |
| | | | | | | | |
Other Information | | | | | | | | |
Class A | | | | | | | | |
Shares outstanding at beginning of period | | | 25,536,462 | | | | 29,035,542 | |
Shares sold | | | 1,583,343 | | | | 3,753,123 | |
Shares issued to shareholders in reinvestment of distributions | | | 119,107 | | | | — | |
Shares redeemed | | | (5,818,439 | ) | | | (7,252,203 | ) |
Net increase (decrease) in Class A shares | | | (4,115,989 | ) | | | (3,499,080 | ) |
| | | | | | | | |
Shares outstanding at end of period | | | 21,420,473 | | | | 25,536,462 | |
| | | | | | | | |
Class B | | | | | | | | |
Shares outstanding at beginning of period | | | 1,832,122 | | | | 1,217,540 | |
Shares sold | | | 296,780 | | | | 821,254 | |
Shares issued to shareholders in reinvestment of distributions | | | 2,234 | | | | — | |
Shares redeemed | | | (348,410 | ) | | | (206,672 | ) |
Net increase (decrease) in Class B shares | | | (49,396 | ) | | | 614,582 | |
| | | | | | | | |
Shares outstanding at end of period | | | 1,782,726 | | | | 1,832,122 | |
| | | | | | | | |
The accompanying notes are an integral part of the financial statements.
338
Financial Highlights
| | | | | | | | | | | | | | | | | | | |
Class A | | | | | | | | | | | | | | | | | | | |
| | | | | |
Years Ended December 31, | | 2005 | | | 2004 | | 2003 | | | 2002 | | | 2001 | |
Selected Per Share Data | | | | | | | | | | | | | | | | | | | |
Net asset value, beginning of period | | $ | 9.01 | | | $ | 8.84 | | $ | 6.02 | | | $ | 9.36 | | | $ | 13.87 | |
| | | | | | | | | | | | | | | | | | | |
Income (loss) from investment operations: | | | | | | | | | | | | | | | | | | | |
Net investment income (loss)a | | | (.03 | ) | | | .04 | | | (.04 | ) | | | (.03 | ) | | | .01 | |
Net realized and unrealized gain (loss) on investment transactions | | | .36 | | | | .13 | | | 2.86 | | | | (3.30 | ) | | | (4.50 | ) |
Total from investment operations | | | .33 | | | | .17 | | | 2.82 | | | | (3.33 | ) | | | (4.49 | ) |
Less distributions from: | | | | | | | | | | | | | | | | | | | |
Net investment income | | | (.04 | ) | | | — | | | — | | | | (.01 | ) | | | (.02 | ) |
| | | | | | | | | | | | | | | | | | | |
Net asset value, end of period | | $ | 9.30 | | | $ | 9.01 | | $ | 8.84 | | | $ | 6.02 | | | $ | 9.36 | |
| | | | | | | | | | | | | | | | | | | |
Total Return (%) | | | 3.74 | | | | 1.92 | | | 46.84 | | | | (35.52 | ) | | | (32.39 | ) |
Ratios to Average Net Assets and Supplemental Data | | | | | | | | | | | | | | | | | | | |
Net assets, end of period ($ millions) | | | 199 | | | | 230 | | | 257 | | | | 219 | | | | 351 | |
Ratio of expenses (%) | | | .86 | | | | .83 | | | .86 | | | | .80 | | | | .81 | |
Ratio of net investment income (%) | | | (.36 | ) | | | .43 | | | (.50 | ) | | | (.37 | ) | | | .12 | |
Portfolio turnover rate (%) | | | 135 | | | | 112 | | | 66 | | | | 64 | | | | 56 | |
| a | Based on average shares outstanding during the period. |
| | | | | | | | | | | | | | | |
Class B | | | | | | | | | | | | | | | |
| | | | |
Years Ended December 31, | | 2005 | | | 2004 | | 2003 | | | 2002a | |
Selected Per Share Data | | | | | | | | | | | | | | | |
Net asset value, beginning of period | | $ | 8.93 | | | $ | 8.80 | | $ | 6.01 | | | $ | 6.32 | |
| | | | | | | | | | | | | | | |
Income (loss) from investment operations: | | | | | | | | | | | | | | | |
Net investment income (loss)b | | | (.07 | ) | | | .01 | | | (.07 | ) | | | (.02 | ) |
Net realized and unrealized gain (loss) on investment transactions | | | .36 | | | | .12 | | | 2.86 | | | | (.29 | ) |
Total from investment operations | | | .29 | | | | .13 | | | 2.79 | | | | (.31 | ) |
Less distributions from: | | | | | | | | | | | | | | | |
Net investment income | | | (.01 | ) | | | — | | | — | | | | — | |
| | | | | | | | | | | | | | | |
Net asset value, end of period | | $ | 9.21 | | | $ | 8.93 | | $ | 8.80 | | | $ | 6.01 | |
| | | | | | | | | | | | | | | |
Total Return (%) | | | 3.27 | | | | 1.48 | | | 46.42 | | | | (4.75 | )** |
Ratios to Average Net Assets and Supplemental Data | | | | | | | | | | | | | | | |
Net assets, end of period ($ millions) | | | 16 | | | | 16 | | | 11 | | | | .3 | |
Ratio of expenses before expense reductions (%) | | | 1.26 | | | | 1.22 | | | 1.25 | | | | 1.06 | * |
Ratio of expenses after expense reductions (%) | | | 1.26 | | | | 1.21 | | | 1.25 | | | | 1.06 | * |
Ratio of net investment income (%) | | | (.76 | ) | | | .05 | | | (.89 | ) | | | (.79 | )* |
Portfolio turnover rate (%) | | | 135 | | | | 112 | | | 66 | | | | 64 | |
| a | For the period from July 1, 2002 (commencement of operations of Class B shares) to December 31, 2002. |
| b | Based on average shares outstanding during the period. |
339
Performance Summary December 31, 2005
DWS Templeton Foreign Value VIP
All performance shown is historical, assumes reinvestment of all dividend and capital gain distributions and does not guarantee future results. Investment return and principal value fluctuate with changing market conditions so that, when redeemed, shares may be worth more or less than their original cost. Current performance may be lower or higher than the performance data quoted. Please visit www.dws-scudder.com for the Portfolio’s most recent month-end performance. Performance doesn’t reflect charges and fees (“contract charges”) associated with the separate account that invests in the Portfolio or any variable life insurance policy or variable annuity contract for which the Portfolio is an investment option. These charges and fees will reduce returns. While all share classes have the same underlying portfolio, their performance will differ.
This Portfolio is subject to stock market risk, meaning stocks in the Portfolio may decline in value for extended periods of time due to the activities and financial prospects of individual companies, or due to general market and economic conditions. Additionally, investing in foreign securities presents certain unique risks not associated with domestic investments, such as currency fluctuation, political and economic changes and market risks. This may result in greater share price volatility. Please read this Portfolio’s prospectus for specific details regarding its investments and risk profile.
Portfolio returns shown for all periods reflect a fee waiver and/or expense reimbursement. Without this waiver/reimbursement, returns would have been lower.
Growth of an Assumed $10,000 Investment in DWS Templeton Foreign Value VIP from 11/15/2004 to 12/31/2005
¨ DWS Templeton Foreign Value VIP — Class A
¨ MSCI World ex-US Index

The MSCI World ex-US Index is a free float-adjusted market capitalization index that is designed to measure global developed market equity performance. The index is calculated using closing local market prices and converts to US dollars using the London close foreign exchange rates. As of May 2005 the MSCI World Index consisted of the following 22 developed market country indices: Australia, Austria, Belgium, Canada, Denmark, Finland, France, Germany, Greece, Hong Kong, Ireland, Italy, Japan, Netherlands, New Zealand, Norway, Portugal, Singapore, Spain, Sweden, Switzerland and the United Kingdom.
Index returns assume reinvested dividends and, unlike Portfolio returns, do not reflect any fees or expenses. It is not possible to invest directly into an index.
Comparative Results
| | | | | | | | | | |
DWS Templeton Foreign Value VIP | | 1-Year | | | Life of Portfolio* | |
Class A | | Growth of $10,000 | | $ | 10,961 | | | $ | 11,575 | |
| | Average annual total return | | | 9.61 | % | | | 13.92 | % |
MSCI World ex-US Index | | Growth of $10,000 | | $ | 11,447 | | | $ | 11,931 | |
| | Average annual total return | | | 14.47 | % | | | 17.70 | % |
| | |
DWS Templeton Foreign Value VIP | | 1-Year | | | Life of Portfolio* | |
Class B | | Growth of $10,000 | | $ | 10,939 | | | $ | 11,552 | |
| | Average annual total return | | | 9.39 | % | | | 13.71 | % |
MSCI World ex-US Index | | Growth of $10,000 | | $ | 11,447 | | | $ | 11,931 | |
| | Average annual total return | | | 14.47 | % | | | 17.70 | % |
The growth of $10,000 is cumulative.
| * | The Portfolio commenced operations on November 15, 2004. Index returns begin November 30, 2004. |
340
Information About Your Portfolio’s Expenses
DWS Templeton Foreign Value VIP
As an investor of the Portfolio, you incur two types of costs: ongoing expenses and transaction costs. Ongoing expenses include management fees, distribution and service (12b-1) fees and other Portfolio expenses. Examples of transaction costs include sales charges (loads), redemption fees and account maintenance fees, which are not shown in this section. The following tables are intended to help you understand your ongoing expenses (in dollars) of investing in the Portfolio and to help you compare these expenses with the ongoing expenses of investing in other mutual funds. In the most recent six-month period, the Portfolio limited these expenses; had it not done so, expenses would have been higher. The tables are based on an investment of $1,000 made at the beginning of the six-month period ended December 31, 2005.
The tables illustrate your Portfolio’s expenses in two ways:
Actual Portfolio Return. This helps you estimate the actual dollar amount of ongoing expenses (but not transaction costs) paid on a $1,000 investment in the Portfolio using the Portfolio’s actual return during the period. To estimate the expenses you paid over the period, simply divide your account value by $1,000 (for example, an $8,600 account value divided by $1,000 = 8.6), then multiply the result by the number in the “Expenses Paid per $1,000” line under the share class you hold.
Hypothetical 5% Portfolio Return. This helps you to compare your Portfolio’s ongoing expenses (but not transaction costs) with those of other mutual funds using the Portfolio’s actual expense ratio and a hypothetical rate of return of 5% per year before expenses. Examples using a 5% hypothetical Portfolio return may be found in the shareholder reports of other mutual funds. The hypothetical account values and expenses may not be used to estimate the actual ending account balance or expenses you paid for the period.
Please note that the expenses shown in these tables are meant to highlight your ongoing expenses only and do not reflect any transaction costs. The “Expenses Paid per $1,000” line of the tables is useful in comparing ongoing expenses only and will not help you determine the relative total expense of owning different funds. If these transaction costs had been included, your costs would have been higher.
Expenses and Value of a $1,000 Investment for the six months ended December 31, 2005
| | | | | | |
Actual Portfolio Return | | Class A | | Class B |
Beginning Account Value 7/1/05 | | $ | 1,000.00 | | $ | 1,000.00 |
Ending Account Value 12/31/05 | | $ | 1,118.40 | | $ | 1,117.20 |
Expenses Paid per $1,000* | | $ | 6.14 | | $ | 7.20 |
| | |
Hypothetical 5% Portfolio Return | | Class A | | Class B |
Beginning Account Value 7/1/05 | | $ | 1,000.00 | | $ | 1,000.00 |
Ending Account Value 12/31/05 | | $ | 1,019.41 | | $ | 1,018.40 |
Expenses Paid per $1,000* | | $ | 5.85 | | $ | 6.87 |
| * | Expenses are equal to the Portfolio’s annualized expense ratio for each share class, multiplied by the average account value over the period, multiplied by the number of days in the most recent six-month period, then divided by 365. |
| | | | | | |
Annualized Expense Ratios | | Class A | | | Class B | |
DWS Variable Series II — DWS Templeton Foreign Value VIP | | 1.15 | % | | 1.35 | % |
For more information, please refer to the Portfolio’s prospectus.
These tables do not reflect charges and fees (“contract charges”) associated with the separate account that invests in the portfolio or any variable life insurance policy or variable annuity contract for which the portfolio is an investment option.
341
Management Summary December 31, 2005
DWS Templeton Foreign Value VIP
For the 12 months ended December 31, 2005, Class A shares of DWS Templeton Foreign Value VIP returned 9.61% (Class A shares, unadjusted for sales charges), compared with 14.47% for its benchmark, the Morgan Stanley Capital International (MSCI) All Countries World (ex-US) Index.
Let’s look first at the global economic environment during the period. During 2005, the global economy overcame fears of derailment generated by higher energy costs; it advanced at a solid clip, with signs of firming recoveries in Europe and Japan. At the same time, inflation (excluding the volatile energy and food sectors) remained relatively subdued worldwide. And, despite short-term interest rate hikes in the United States and Europe, interest rates remained fairly accommodative.
The global equity markets performed strongly during 2005, particularly outside the United States. The energy and materials sectors led equity market performance, and the telecommunications services and consumer-related sectors lagged.
DWS Templeton Foreign Value VIP benefited from an overweight1 (relative to the MSCI World ex-US Index) in the industrials sector during the period. Several holdings in the financials sector also boosted the Portfolio’s performance.
On the other hand, an underweight in the energy sector hindered relative performance. Several holdings in the materials sectors also weighed on performance. In addition, the Portfolio’s overweight in telecommunication services, the worst-performing sector in the MSCI World ex-US Index for the period, hurt performance.
Also detracting from the Portfolio’s performance was the US dollar’s appreciation versus most foreign currencies. Investments in securities with non-US currency exposure lost value as the dollar strengthened.
At Templeton, our investment focus has always centered on individual companies and longer-term returns. We are confident that regardless of the macroeconomic climate we might encounter, we should continue to find “bargain” investment opportunities. This has been our experience for more than 60 years.
Antonio Docal, CFA
Lead Portfolio Manager
Templeton Investment Counsel LLC, Subadvisor to the Portfolio
All performance shown is historical, assumes reinvestment of all dividend and capital gain distributions and does not guarantee future results. Investment return and principal value fluctuate with changing market conditions so that, when redeemed, shares may be worth more or less than their original cost. Current performance may be lower or higher than the performance data quoted. Please visit www.dws-scudder.com for the Portfolio’s most recent month-end performance. Performance doesn’t reflect charges and fees (“contract charges”) associated with the separate account that invests in the Portfolio or any variable life insurance policy or variable annuity contract for which the Portfolio is an investment option. These charges and fees will reduce returns. While all share classes have the same underlying portfolio, their performance will differ.
Risk Considerations
This Portfolio is subject to stock market risk, meaning stocks in the Portfolio may decline in value for extended periods of time due to the activities and financial prospects of individual companies, or due to general market and economic conditions. Additionally, investing in foreign securities presents certain unique risks not associated with domestic investments, such as currency fluctuation, political and economic changes and market risks. This may result in greater share price volatility. Please read this Portfolio’s prospectus for specific details regarding its investments and risk profile.
The MSCI World ex-US Index is a free float-adjusted market capitalization index that is designed to measure global developed market equity performance. The index is calculated using closing local market prices and converts to US dollars using the London close foreign exchange rates. As of May 2005 the MSCI World Index consisted of the following 22 developed market country indices: Australia, Austria, Belgium, Canada, Denmark, Finland, France, Germany, Greece, Hong Kong, Ireland, Italy, Japan, Netherlands, New Zealand, Norway, Portugal, Singapore, Spain, Sweden, Switzerland and the United Kingdom.
Index returns assume reinvested dividends and, unlike portfolio returns, do not reflect any fees or expenses. It is not possible to invest directly into an index.
| 1 | “Overweight” means the Portfolio holds a higher weighting in a given sector or security than the benchmark. “Underweight” means the Portfolio holds a lower weighting. |
Portfolio management market commentary is as of December 31, 2005, and may not come to pass. This information is subject to change at any time based on market and other conditions.
342
Portfolio Summary
DWS Templeton Foreign Value VIP
| | | | | | |
Asset Allocation | | 12/31/05 | | | 12/31/04 | |
Common Stocks | | 95 | % | | 95 | % |
Cash Equivalents | | 5 | % | | 5 | % |
| | | | | | |
| | 100 | % | | 100 | % |
| | | | | | |
| | | | | | |
Geographical Diversification (As a % of Common Stocks) | | 12/31/05 | | | 12/31/04 | |
Europe (excluding United Kingdom) | | 46 | % | | 44 | % |
United Kingdom | | 21 | % | | 24 | % |
Japan | | 12 | % | | 11 | % |
Pacific Basin | | 11 | % | | 10 | % |
Latin America | | 2 | % | | 2 | % |
Australia | | 2 | % | | 3 | % |
Other | | 6 | % | | 6 | % |
| | | | | | |
| | 100 | % | | 100 | % |
| | | | | | |
| | | | | | |
Sector Diversification (As a % of Common Stocks) | | 12/31/05 | | | 12/31/04 | |
Financials | | 22 | % | | 23 | % |
Consumer Discretionary | | 15 | % | | 13 | % |
Industrials | | 14 | % | | 14 | % |
Telecommunications Services | | 12 | % | | 10 | % |
Materials | | 11 | % | | 11 | % |
Health Care | | 7 | % | | 6 | % |
Information Technology | | 6 | % | | 6 | % |
Energy | | 5 | % | | 7 | % |
Utilities | | 4 | % | | 5 | % |
Consumer Staples | | 4 | % | | 5 | % |
| | | | | | |
| | 100 | % | | 100 | % |
| | | | | | |
Asset allocation, geographical and sector diversification are subject to change.
For more complete details about the Portfolio’s investment portfolio, see page 51. A quarterly Fact Sheet is available upon request. Information concerning portfolio holdings of the Portfolio as of month end will be posted to www.dws-scudder.com on the 15th of the following month.
Following the Portfolio’s fiscal first and third quarter-end, a complete portfolio holdings listing is filed with the SEC on Form N-Q. The form will be available on the SEC’s Web site at www.sec.gov, and it also may be reviewed and copied at the SEC’s Public Reference Room in Washington, D.C. Information on the operation of the SEC’s Public Reference Room may be obtained by calling (800) SEC-0330.
343
Investment Portfolio December 31, 2005
DWS Templeton Foreign Value VIP
| | | | |
| | | Shares | | Value ($) |
Common Stocks 95.2% | | | | |
Australia 1.8% | | | | |
Alumina Ltd. | | 29,582 | | 160,914 |
National Australia Bank Ltd. | | 8,806 | | 209,164 |
| | | | |
(Cost $330,476) | | | | 370,078 |
| | | | |
Bermuda 0.9% | | | | |
ACE Ltd.* (Cost $162,979) | | 3,650 | | 195,056 |
| | | | |
Brazil 1.2% | | | | |
Companhia Vale do Rio Doce (ADR) | | 2,720 | | 98,600 |
Empresa Brasiliera de Aeronautica SA (Preferred) (ADR) | | 3,780 | | 147,798 |
| | | | |
(Cost $187,692) | | | | 246,398 |
| | | | |
Canada 2.7% | | | | |
Alcan, Inc. | | 3,810 | | 156,536 |
BCE, Inc. | | 6,440 | | 154,400 |
Domtar, Inc. | | 43,900 | | 253,404 |
| | | | |
(Cost $544,069) | | | | 564,340 |
| | | | |
Cayman Islands 0.8% | | | | |
XL Capital Ltd. “A” (Cost $182,758) | | 2,590 | | 174,514 |
| | | | |
China 0.8% | | | | |
China Telecom Corp., Ltd. “H” (Cost $153,987) | | 428,000 | | 155,939 |
| | | | |
Denmark 0.5% | | | | |
Vestas Wind Systems AS* (Cost $108,784) | | 6,880 | | 112,993 |
| | | | |
Finland 2.2% | | | | |
Stora Enso Oyj | | 13,240 | | 179,155 |
UPM-Kymmene Oyj | | 14,400 | | 282,318 |
| | | | |
(Cost $473,252) | | | | 461,473 |
| | | | |
France 8.2% | | | | |
Accor SA | | 3,131 | | 172,218 |
Axa | | 9,062 | | 292,459 |
Compagnie Generale des Etablissements Michelin “B” | | 3,282 | | 184,486 |
France Telecom SA | | 10,290 | | 255,707 |
Sanofi-Aventis | | 3,258 | | 285,429 |
Suez SA | | 4,949 | | 154,095 |
Total SA | | 869 | | 218,313 |
Valeo SA | | 3,854 | | 143,316 |
| | | | |
(Cost $1,613,164) | | | | 1,706,023 |
| | | | |
Germany 7.4% | | | | |
BASF AG | | 2,645 | | 202,634 |
Bayerische Motoren Werke AG | | 4,535 | | 198,921 |
Celesio AG | | 1,336 | | 114,926 |
Deutsche Post AG | | 9,509 | | 230,558 |
E.ON AG | | 3,125 | | 323,316 |
Muenchener Rueckversicherungs-Gesellschaft AG (Registered) | | 1,280 | | 173,330 |
Siemens AG (Registered) | | 3,420 | | 293,143 |
| | | | |
(Cost $1,391,462) | | | | 1,536,828 |
| | | | |
344
| | | | |
| | | Shares | | Value ($) |
Hong Kong 2.6% | | | | |
Cheung Kong Holdings Ltd. | | 19,000 | | 195,179 |
Hutchison Whampoa Ltd. | | 20,000 | | 190,620 |
Swire Pacific Ltd. “A” | | 16,500 | | 147,898 |
| | | | |
(Cost $508,667) | | | | 533,697 |
Israel 0.9% | | | | |
Check Point Software Technologies Ltd.* (Cost $198,558) | | 8,960 | | 180,096 |
| | | | |
Italy 2.5% | | | | |
Eni SpA | | 8,940 | | 247,985 |
UniCredito Italiano SpA | | 37,810 | | 260,522 |
| | | | |
(Cost $440,848) | | | | 508,507 |
| | | | |
Japan 11.8% | | | | |
East Japan Railway Co. | | 26 | | 178,793 |
Fuji Photo Film Co., Ltd. | | 5,800 | | 191,801 |
Hitachi Ltd. | | 22,000 | | 148,302 |
KDDI Corp. | | 35 | | 201,806 |
Mabuchi Motor Co., Ltd. | | 4,399 | | 244,316 |
NEC Corp. | | 14,000 | | 87,133 |
Nintendo Co., Ltd. | | 1,700 | | 205,410 |
Nippon Telegraph & Telephone Corp. | | 37 | | 168,160 |
Nomura Holdings, Inc. | | 13,400 | | 256,785 |
Olympus Corp. | | 6,000 | | 157,714 |
Sompo Japan Insurance, Inc. | | 12,000 | | 162,293 |
Sony Corp. | | 6,100 | | 249,307 |
Takeda Chemical Industries Ltd. | | 3,500 | | 189,342 |
| | | | |
(Cost $2,146,885) | | | | 2,441,162 |
| | | | |
Korea 5.2% | | | | |
Kookmin Bank (ADR) | | 3,690 | | 275,680 |
Korea Electric Power Corp. (ADR) | | 5,220 | | 101,738 |
POSCO (ADR) | | 2,280 | | 112,883 |
Samsung Electronics Co., Ltd. (GDR), 144A | | 1,447 | | 476,786 |
SK Telecom Co., Ltd. (ADR) | | 5,080 | | 103,073 |
| | | | |
(Cost $815,130) | | | | 1,070,160 |
| | | | |
Mexico 0.9% | | | | |
Telefonos de Mexico SA de CV “L” (ADR) (Cost $140,726) | | 7,430 | | 183,372 |
| | | | |
Netherlands 7.1% | | | | |
Akzo Nobel NV | | 4,317 | | 200,092 |
ING Groep NV | | 8,633 | | 299,464 |
Koninklijke (Royal) Philips Electronics NV | | 8,506 | | 264,344 |
Reed Elsevier NV | | 9,725 | | 135,858 |
Royal Dutch Shell PLC “B” | | 5,295 | | 169,265 |
Unilever NV | | 3,367 | | 230,601 |
Wolters Kluwer NV | | 8,063 | | 163,042 |
| | | | |
(Cost $1,322,545) | | | | 1,462,666 |
| | | | |
Norway 2.3% | | | | |
Norske Skogindustrier ASA | | 14,887 | | 236,565 |
Telenor ASA | | 24,220 | | 237,739 |
| | | | |
(Cost $431,150) | | | | 474,304 |
| | | | |
345
| | | | | | |
| | | Shares | | | Value ($) | |
Portugal 1.1% | | | | | | |
Portugal Telecom SGPS SA (Registered) (Cost $233,204) | | 23,022 | | | 233,037 | |
| | | | | | |
Singapore 0.9% | | | | | | |
DBS Group Holdings Ltd. (Cost $166,652) | | 18,000 | | | 178,631 | |
| | | | | | |
Spain 3.8% | | | | | | |
Banco Santander Central Hispano SA | | 21,066 | | | 278,081 | |
Iberdrola SA | | 4,868 | | | 133,073 | |
Repsol YPF SA | | 7,565 | | | 220,950 | |
Telefonica SA (ADR) | | 3,602 | | | 162,162 | |
| | | | | | |
(Cost $745,553) | | | | | 794,266 | |
| | | | | | |
Sweden 3.8% | | | | | | |
Atlas Copco AB “A” | | 9,240 | | | 205,863 | |
Nordea Bank AB | | 20,809 | | | 216,092 | |
Securitas AB “B” | | 14,530 | | | 241,420 | |
Volvo AB “B” | | 2,830 | | | 133,405 | |
| | | | | | |
(Cost $690,866) | | | | | 796,780 | |
| | | | | | |
Switzerland 4.4% | | | | | | |
Lonza Group AG (Registered) | | 3,611 | | | 220,939 | |
Nestle SA (Registered) | | 784 | | | 234,475 | |
Swiss Re (Registered) | | 2,994 | | | 219,187 | |
UBS AG (Registered) | | 2,493 | | | 237,338 | |
| | | | | | |
(Cost $824,861) | | | | | 911,939 | |
| | | | | | |
Taiwan 1.5% | | | | | | |
Chunghwa Telecom Co., Ltd. (ADR) | | 8,940 | | | 164,049 | |
Compal Electronics, Inc. (GDR), 144A | | 28,860 | | | 146,611 | |
| | | | | | |
(Cost $309,775) | | | | | 310,660 | |
| | | | | | |
United Kingdom 19.9% | | | | | | |
Alliance Unichem PLC | | 11,797 | | | 162,476 | |
BAE Systems PLC | | 39,131 | | | 257,013 | |
Boots Group PLC | | 18,188 | | | 189,319 | |
BP PLC | | 17,829 | | | 189,877 | |
British Airways PLC* | | 31,780 | | | 182,623 | |
British Sky Broadcasting Group PLC | | 40,623 | | | 347,013 | |
Cadbury Schweppes PLC | | 19,040 | | | 180,007 | |
Compass Group PLC | | 88,888 | | | 337,215 | |
GKN PLC | | 18,816 | | | 93,234 | |
GlaxoSmithKline PLC | | 9,542 | | | 241,166 | |
HSBC Holdings PLC (Hong Kong Registered) | | 12,800 | | | 205,364 | |
National Grid PLC | | 16,509 | | | 161,479 | |
Pearson PLC | | 12,449 | | | 147,252 | |
Rentokil Initial PLC | | 64,712 | | | 182,036 | |
Rolls-Royce Group PLC* | | 28,289 | | | 208,069 | |
Royal Bank of Scotland Group PLC | | 9,095 | | | 274,622 | |
Shire PLC | | 13,244 | | | 169,530 | |
Smiths Group PLC | | 8,459 | | | 152,232 | |
Vodafone Group PLC | | 141,902 | | | 306,399 | |
Yell Group PLC | | 13,897 | | | 128,278 | |
| | | | | | |
(Cost $4,022,418) | | | | | 4,115,204 | |
| | | | | | |
Total Common Stocks (Cost $18,146,461) | | | | | 19,718,123 | |
| | | | | | |
Cash Equivalents 5.6% | | | | | | |
Cash Management QP Trust, 4.26%(a) (Cost $1,150,780) | | 1,150,780 | | | 1,150,780 | |
| | | | | | |
| | |
| | | % of Net
Assets | | | Value ($) | |
Total Investment Portfolio (Cost $19,297,241)+ | | 100.8 | | | 20,868,903 | |
Other Assets and Liabilities, Net | | (0.8 | ) | | (160,439 | ) |
| | | | | | |
Net Assets | | 100.0 | | | 20,708,464 | |
| | | | | | |
Notes to DWS Templeton Foreign Value VIP Portfolio of Investments
| * | Non-income producing security. |
| + | The cost for federal income tax purposes was $19,329,198. At December 31, 2005, net unrealized appreciation for all securities based on tax cost was $1,539,705. This consisted of aggregate gross unrealized appreciation for all securities in which there was an excess of value over tax cost of $1,825,832 and aggregate gross unrealized depreciation for all securities in which there was an excess of tax cost over value of $286,127. |
| (a) | Cash Management QP Trust, an affiliated fund, is managed by Deutsche Investment Management Americas Inc. The rate shown is the annualized seven-day yield at period end. |
| 144A: | Security exempt from registration under Rule 144A of the Securities Act of 1933. These securities may be resold in transactions exempt from registration, normally to qualified institutional buyers. |
| ADR: | American Depositary Receipt |
| GDR: | Global Depositary Receipt |
The accompanying notes are an integral part of the financial statements.
346
Financial Statements
Statement of Assets and Liabilities
as of December 31, 2005
| | | | |
Assets | | | | |
Investments: | | | | |
Investments in securities, at value (cost $18,146,461) | | $ | 19,718,123 | |
Investment in Cash Management QP Trust (cost $1,150,780) | | | 1,150,780 | |
Total investments in securities, at value (cost $19,297,241) | | | 20,868,903 | |
Cash | | | 9,921 | |
Foreign currency, at value (cost $97,522) | | | 97,227 | |
Receivable for investments sold | | | 1,504 | |
Dividends receivable | | | 33,775 | |
Interest receivable | | | 3,090 | |
Receivable for Portfolio shares sold | | | 4,689 | |
Foreign taxes recoverable | | | 3,461 | |
Due from Advisor | | | 59,208 | |
Other assets | | | 395 | |
| | | | |
Total assets | | | 21,082,173 | |
| | | | |
Liabilities | | | | |
Payable for investments purchased | | | 303,186 | |
Payable for Portfolio shares redeemed | | | 1,342 | |
Other accrued expenses and payables | | | 69,181 | |
Total liabilities | | | 373,709 | |
| | | | |
Net assets, at value | | $ | 20,708,464 | |
| | | | |
Net Assets | | | | |
Net assets consist of: | | | | |
Distributions in excess of net investment income | | | (9,319 | ) |
Net unrealized appreciation (depreciation) on: | | | | |
Investments | | | 1,571,662 | |
Foreign currency related transactions | | | (269 | ) |
Accumulated net realized gain (loss) | | | 58,313 | |
Paid-in capital | | | 19,088,077 | |
| | | | |
Net assets, at value | | $ | 20,708,464 | |
| | | | |
| |
Class A | | | | |
Net Asset Value, offering and redemption price per share ($13,345,371 ÷ 1,167,164 outstanding shares of beneficial interest, $.01 par value, unlimited number of shares authorized) | | $ | 11.43 | |
| | | | |
| |
Class B | | | | |
Net Asset Value, offering and redemption price per share ($7,363,093 ÷ 643,963 outstanding shares of beneficial interest, $.01 par value, unlimited number of shares authorized) | | $ | 11.43 | |
| | | | |
347
Statement of Operations
for the year ended December 31, 2005
| | | | |
Investment Income | | | | |
Income: | | | | |
Dividends (net of foreign taxes withheld of $31,660) | | $ | 282,644 | |
Interest — Cash Management QP Trust | | | 30,337 | |
Total Income | | | 312,981 | |
Expenses: | | | | |
Management fee | | | 112,526 | |
Custodian and accounting fees | | | 177,764 | |
Distribution service fees (Class B) | | | 11,702 | |
Record keeping fees (Class B) | | | 1,741 | |
Auditing | | | 25,001 | |
Legal | | | 9,877 | |
Trustees’ fees and expenses | | | 13 | |
Reports to shareholders | | | 4,204 | |
Offering cost | | | 6,193 | |
Other | | | 5,840 | |
Total expenses before expense reductions | | | 354,861 | |
Expense reductions | | | (209,277 | ) |
Total expenses after expense reductions | | | 145,584 | |
| | | | |
Net investment income (loss) | | | 167,397 | |
| | | | |
| |
Realized and Unrealized Gain (Loss) on Investment Transactions | | | | |
Net realized gain (loss) from: | | | | |
Investments | | | 151,924 | |
Foreign currency related transactions | | | (22,628 | ) |
| | | 129,296 | |
Net unrealized appreciation (depreciation) during the period on: | | | | |
Investments | | | 1,275,604 | |
Foreign currency related transactions | | | (297 | ) |
| | | 1,275,307 | |
| | | | |
Net gain (loss) on investment transactions | | | 1,404,603 | |
| | | | |
Net increase (decrease) in net assets resulting from operations | | $ | 1,572,000 | |
| | | | |
The accompanying notes are an integral part of the financial statements.
348
Statement of Changes in Net Assets
| | | | | | | | |
Increase (Decrease) in Net Assets | | Year Ended December 31, 2005 | | | Period Ended December 31, 2004a | |
Operations: | | | | | | | | |
Net investment income (loss) | | $ | 167,397 | | | $ | 2,020 | |
Net realized gain (loss) on investment transactions | | | 129,296 | | | | (8,340 | ) |
Net unrealized appreciation (depreciation) during the period on investment transactions | | | 1,275,307 | | | | 296,086 | |
Net increase (decrease) in net assets resulting from operations | | | 1,572,000 | | | | 289,766 | |
Distributions to shareholders from: | | | | | | | | |
Net investment income: | | | | | | | | |
Class A | | | (109,492 | ) | | | — | |
Class B | | | (45,602 | ) | | | — | |
Net realized gains: | | | | | | | | |
Class A | | | (57,627 | ) | | | — | |
Class B | | | (31,845 | ) | | | — | |
Portfolio share transactions: | | | | | | | | |
Class A | | | | | | | | |
Proceeds from shares sold | | | 11,598,184 | | | | 2,500,000 | |
Reinvestment of distributions | | | 167,119 | | | | — | |
Cost of shares redeemed | | | (1,908,590 | ) | | | — | |
Net increase (decrease) in net assets from Class A share transactions | | | 9,856,713 | | | | 2,500,000 | |
Class B | | | | | | | | |
Proceeds from shares sold | | | 4,140,045 | | | | 2,758,419 | |
Reinvestment of distributions | | | 77,446 | | | | — | |
Cost of shares redeemed | | | (241,047 | ) | | | (312 | ) |
Net increase (decrease) in net assets from Class B share transactions | | | 3,976,444 | | | | 2,758,107 | |
Increase (decrease) in net assets | | | 15,160,591 | | | | 5,547,873 | |
Net assets at beginning of period | | | 5,547,873 | | | | — | |
| | | | | | | | |
Net assets at end of period (including distributions in excess of net investment income and accumulated net investment loss of $9,319 and $3,133, respectively) | | $ | 20,708,464 | | | $ | 5,547,873 | |
| | | | | | | | |
Other Information | | | | | | | | |
Class A | | | | | | | | |
Shares outstanding at beginning of period | | | 250,000 | | | | — | |
Shares sold | | | 1,074,821 | | | | 250,000 | |
Shares reissued to shareholders in reinvestment of distributions | | | 14,621 | | | | — | |
Shares redeemed | | | (172,278 | ) | | | — | |
Net increase (decrease) in Class A shares | | | 917,164 | | | | 250,000 | |
| | | | | | | | |
Shares outstanding at end of period | | | 1,167,164 | | | | 250,000 | |
| | | | | | | | |
Class B | | | | | | | | |
Shares outstanding at beginning of period | | | 275,227 | | | | — | |
Shares sold | | | 383,957 | | | | 275,257 | |
Shares reissued to shareholders in reinvestment of distributions | | | 6,776 | | | | — | |
Shares redeemed | | | (21,997 | ) | | | (30 | ) |
Net increase (decrease) in Class B shares | | | 368,736 | | | | 275,227 | |
| | | | | | | | |
Shares outstanding at end of period | | | 643,963 | | | | 275,227 | |
| | | | | | | | |
| a | For the period from November 15, 2004 (commencement of operations) to December 31, 2004. |
The accompanying notes are an integral part of the financial statements.
349
Financial Highlights
Class A
| | | | | | | | |
Years Ended December 31, | | 2005 | | | 2004a | |
Selected Per Share Data | |
Net asset value, beginning of period | | $ | 10.56 | | | $ | 10.00 | |
| | | | | | | | |
Income (loss) from investment operations: | | | | | | | | |
Net investment income (loss)b | | | .17 | | | | .01 | |
Net realized and unrealized gain (loss) on investment transactions | | | .85 | | | | .55 | |
Total from investment operations | | | 1.02 | | | | .56 | |
Less distributions from: | | | | | | | | |
Net investment income | | | (.10 | ) | | | — | |
Net realized gain on investment transactions | | | (.05 | ) | | | — | |
Total distributions | | | (.15 | ) | | | — | |
| | | | | | | | |
Net asset value, end of period | | $ | 11.43 | | | $ | 10.56 | |
| | | | | | | | |
Total Return (%)c | | | 9.61 | | | | 5.60 | ** |
Ratios to Average Net Assets and Supplemental Data | | | | | | | | |
Net assets, end of period ($ millions) | | | 13 | | | | 3 | |
Ratio of expenses before expense reductions (%) | | | 2.88 | | | | 7.34 | * |
Ratio of expenses after expense reductions (%) | | | 1.15 | | | | 1.14 | * |
Ratio of net investment income (%) | | | 1.49 | | | | .41 | * |
Portfolio turnover rate (%) | | | 15 | | | | — | |
| a | For the period from November 15, 2004 (commencement of operations) to December 31, 2004. |
| b | Based on average shares outstanding during the period. |
| c | Total return would have been lower had certain expenses not been reduced. |
Class B
| | | | | | | | |
Years Ended December 31, | | 2005 | | | 2004a | |
Selected Per Share Data | | | | | | | | |
Net asset value, beginning of period | | $ | 10.56 | | | $ | 10.00 | |
| | | | | | | | |
Income (loss) from investment operations: | | | | | | | | |
Net investment income (loss)b | | | .14 | | | | — | |
Net realized and unrealized gain (loss) on investment transactions | | | .85 | | | | .56 | |
Total from investment operations | | | .99 | | | | .56 | |
Less distributions from: | | | | | | | | |
Net investment income | | | (.07 | ) | | | — | |
Net realized gain on investment transactions | | | (.05 | ) | | | — | |
Total distributions | | | (.12 | ) | | | — | |
| | | | | | | | |
Net asset value, end of period | | $ | 11.43 | | | $ | 10.56 | |
| | | | | | | | |
Total Return (%)c | | | 9.39 | | | | 5.60 | ** |
Ratios to Average Net Assets and Supplemental Data | | | | | | | | |
Net assets, end of period ($ millions) | | | 7 | | | | 3 | |
Ratio of expenses before expense reductions (%) | | | 3.17 | | | | 7.74 | * |
Ratio of expenses after expense reductions (%) | | | 1.35 | | | | 1.34 | * |
Ratio of net investment income (%) | | | 1.29 | | | | .21 | * |
Portfolio turnover rate (%) | | | 15 | | | | — | |
| a | For the period from November 15, 2004 (commencement of operations) to December 31, 2004. |
| b | Based on average shares outstanding during the period. |
| c | Total return would have been lower had certain expenses not been reduced. |
350
Performance Summary December 31, 2005
DWS Turner Mid Cap Growth VIP
All performance shown is historical, assumes reinvestment of all dividend and capital gain distributions and does not guarantee future results. Investment return and principal value fluctuate with changing market conditions so that, when redeemed, shares may be worth more or less than their original cost. Current performance may be lower or higher than the performance data quoted. Please visit www.dws-scudder.com for the Portfolio’s most recent month-end performance. Performance doesn’t reflect charges and fees (“contract charges”) associated with the separate account that invests in the Portfolio or any variable life insurance policy or variable annuity contract for which the Portfolio is an investment option. These charges and fees will reduce returns. While all share classes have the same underlying portfolio, their performance will differ.
The Portfolio is subject to stock market risk, meaning stocks in the Portfolio may decline in value for extended periods of time due to the activities and financial prospects of individual companies, or due to general market and economic conditions. Please read this Portfolio’s prospectus for specific details regarding this product’s investments and risk profile.
Portfolio returns shown for life of portfolio period for Class A shares and for all periods shown for Class B shares reflect a fee waiver and/or expense reimbursement. Without this waiver/reimbursement, returns would have been lower.
Growth of an Assumed $10,000 Investment in DWS Turner Mid Cap Growth VIP from 5/1/2001 to 12/31/2005
¨ DWS Turner Mid Cap Growth VIP — Class A
¨ Russell Midcap Growth Index
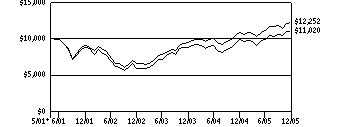
The Russell Midcap Growth Index measures the performance of those Russell Midcap companies with higher price-to-book ratios and higher forecasted growth values. Index returns assume reinvestment of dividends and unlike portfolio returns, do not reflect any fees or expenses. It is not possible to invest directly in an index.
Comparative Results
| | | | | | | | | | | | | | |
DWS Turner Mid Cap Growth VIP | | 1-Year | | | 3-Year | | | Life of Portfolio* | |
Class A | | Growth of $10,000 | | $ | 11,176 | | | $ | 18,428 | | | $ | 11,020 | |
| | Average annual total return | | | 11.76 | % | | | 22.60 | % | | | 2.10 | % |
Russell Midcap Growth Index | | Growth of $10,000 | | $ | 11,210 | | | $ | 18,474 | | | $ | 12,252 | |
| | Average annual total return | | | 12.10 | % | | | 22.70 | % | | | 4.45 | % |
| | | |
DWS Turner Mid Cap Growth VIP | | 1-Year | | | 3-Year | | | Life of Class** | |
Class B | | Growth of $10,000 | | $ | 11,125 | | | $ | 18,224 | | | $ | 16,485 | |
| | Average annual total return | | | 11.25 | % | | | 22.15 | % | | | 15.36 | % |
Russell Midcap Growth Index | | Growth of $10,000 | | $ | 11,210 | | | $ | 18,474 | | | $ | 16,702 | |
| | Average annual total return | | | 12.10 | % | | | 22.70 | % | | | 15.78 | % |
The growth of $10,000 is cumulative.
| * | The Portfolio commenced operations on May 1, 2001. Index returns begin April 30, 2001. |
| ** | The Portfolio commenced offering Class B shares on July 1, 2002. Index returns begin June 30, 2002. |
351
Information About Your Portfolio’s Expenses
DWS Turner Mid Cap Growth VIP
As an investor of the Portfolio, you incur two types of costs: ongoing expenses and transaction costs. Ongoing expenses include management fees, distribution and service (12b-1) fees and other Portfolio expenses. Examples of transaction costs include sales charges (loads), redemption fees and account maintenance fees, which are not shown in this section. The following tables are intended to help you understand your ongoing expenses (in dollars) of investing in the Portfolio and to help you compare these expenses with the ongoing expenses of investing in other mutual funds. In the most recent six-month period, the Portfolio limited these expenses in Class B; had it not done so, expenses would have been higher. The tables are based on an investment of $1,000 made at the beginning of the six-month period ended December 31, 2005.
The tables illustrate your Portfolio’s expenses in two ways:
Actual Portfolio Return. This helps you estimate the actual dollar amount of ongoing expenses (but not transaction costs) paid on a $1,000 investment in the Portfolio using the Portfolio’s actual return during the period. To estimate the expenses you paid over the period, simply divide your account value by $1,000 (for example, an $8,600 account value divided by $1,000 = 8.6), then multiply the result by the number in the “Expenses Paid per $1,000” line under the share class you hold.
Hypothetical 5% Portfolio Return. This helps you to compare your Portfolio’s ongoing expenses (but not transaction costs) with those of other mutual funds using the Portfolio’s actual expense ratio and a hypothetical rate of return of 5% per year before expenses. Examples using a 5% hypothetical Portfolio return may be found in the shareholder reports of other mutual funds. The hypothetical account values and expenses may not be used to estimate the actual ending account balance or expenses you paid for the period.
Please note that the expenses shown in these tables are meant to highlight your ongoing expenses only and do not reflect any transaction costs. The “Expenses Paid per $1,000” line of the tables is useful in comparing ongoing expenses only and will not help you determine the relative total expense of owning different funds. If these transaction costs had been included, your costs would have been higher.
Expenses and Value of a $1,000 Investment for the six months ended December 31, 2005
| | | | | | |
Actual Portfolio Return | | Class A | | Class B |
Beginning Account Value 7/1/05 | | $ | 1,000.00 | | $ | 1,000.00 |
Ending Account Value 12/31/05 | | $ | 1,112.00 | | $ | 1,110.20 |
Expenses Paid per $1,000* | | $ | 5.70 | | $ | 7.61 |
| | |
Hypothetical 5% Portfolio Return | | Class A | | Class B |
Beginning Account Value 7/1/05 | | $ | 1,000.00 | | $ | 1,000.00 |
Ending Account Value 12/31/05 | | $ | 1,019.81 | | $ | 1,018.00 |
Expenses Paid per $1,000* | | $ | 5.45 | | $ | 7.27 |
| * | Expenses are equal to the Portfolio’s annualized expense ratio for each share class, multiplied by the average account value over the period, multiplied by the number of days in the most recent six-month period, then divided by 365. |
| | | | | | |
Annualized Expense Ratios | | Class A | | | Class B | |
DWS Variable Series II — DWS Turner Mid Cap Growth VIP | | 1.07 | % | | 1.43 | % |
For more information, please refer to the Portfolio’s prospectus.
These tables do not reflect charges and fees (“contract charges”) associated with the separate account that invests in the portfolio or any variable life insurance policy or variable annuity contract for which the portfolio is an investment option.
352
Management Summary December 31, 2005
DWS Turner Mid Cap Growth VIP
In 2005, corporate earnings were strong. The same can’t be said for the stock market during 2005, however; it, as represented by the Standard & Poor’s 500 Index, gained just 4.91%. This confounded the expectations of some market strategists.
During this period, DWS Turner Mid Cap Growth VIP gained 11.76% (Class A shares, unadjusted for contract charges), versus a 12.10 % gain for the Russell Midcap Growth Index.
Five of the Portfolio’s 10 sector positions beat their corresponding index sectors. Contributing the most to performance were growth-oriented holdings in the utility, consumer discretionary and energy sectors, a combined 38% weighting in the Portfolio. Holdings that added value included wireless telecommunications, apparel/footwear and oil/gas production stocks.
Detracting the most from performance was the healthcare sector, an 18% weighting in the Portfolio.
Holdings in the pharmaceuticals industry also detracted from performance.
We remain optimistic about the near-term outlook for the stock market. Our bottom-up fundamental analysis tells us that the recent strong earnings of corporate America should persist. Also, companies are intent on capitalizing on their fastest growing products and services, controlling costs, improving productivity, buying back shares and raising dividends. All in all, then, we see a favorable backdrop for continued stock market gains in the new year.
Christopher K. McHugh
William C. McVail
Robert E. Turner
Portfolio Managers
Turner Investment Partners, Inc., Subadvisor to the Portfolio
All performance shown is historical, assumes reinvestment of all dividend and capital gain distributions and does not guarantee future results. Investment return and principal value fluctuate with changing market conditions so that, when redeemed, shares may be worth more or less than their original cost. Current performance may be lower or higher than the performance data quoted. Please visit www.dws-scudder.com for the Portfolio’s most recent month-end performance. Performance doesn’t reflect charges and fees (“contract charges”) associated with the separate account that invests in the Portfolio or any variable life insurance policy or variable annuity contract for which the Portfolio is an investment option. These charges and fees will reduce returns. While all share classes have the same underlying portfolio, their performance will differ.
Risk Considerations
The Portfolio is subject to stock market risk, meaning stocks in the Portfolio may decline in value for extended periods of time due to the activities and financial prospects of individual companies, or due to general market and economic conditions. Please read this Portfolio’s prospectus for specific details regarding this product’s investments and risk profile.
The Standard & Poor’s 500 Index is an unmanaged group of large-company stocks. Index returns assume reinvestment of dividends and unlike Portfolio returns, do not reflect any fees or expenses. It is not possible to invest directly in an index.
The Russell Midcap Growth Index measures the performance of those Russell Midcap companies with higher price-to-book ratios and higher forecasted growth values. Index returns assume reinvestment of dividends and, unlike portfolio returns, do not reflect any fees or expenses. It is not possible to invest directly into an index.
Portfolio management market commentary is as of December 31, 2005, and may not come to pass. This information is subject to change at any time based on market and other conditions.
353
Portfolio Summary
DWS Turner Mid Cap Growth VIP
| | | | | | |
Asset Allocation (Excludes Securities Lending Collateral) | | 12/31/05 | | | 12/31/04 | |
Common Stocks | | 96 | % | | 99 | % |
Cash Equivalents | | 4 | % | | 1 | % |
| | | | | | |
| | 100 | % | | 100 | % |
| | | | | | |
| | |
Sector Diversification (As a % of Common Stocks) | | 12/31/05 | | | 12/31/04 | |
Information Technology | | 25 | % | | 31 | % |
Consumer Discretionary | | 17 | % | | 18 | % |
Health Care | | 17 | % | | 19 | % |
Industrials | | 14 | % | | 11 | % |
Financials | | 10 | % | | 9 | % |
Energy | | 10 | % | | 5 | % |
Materials | | 3 | % | | 3 | % |
Telecommunication Services | | 2 | % | | 2 | % |
Consumer Staples | | 2 | % | | 2 | % |
| | | | | | |
| | 100 | % | | 100 | % |
| | | | | | |
Asset allocation and sector diversification are subject to change.
For more complete details about the Portfolio’s investment portfolio, see page 60. A quarterly Fact Sheet is available upon request. Information concerning portfolio holdings of the Portfolio as of month end will be posted to www.dws-scudder.com on the 15th of the following month.
Following the Portfolio’s fiscal first and third quarter-end, a complete portfolio holdings listing is filed with the SEC on Form N-Q. The form will be available on the SEC’s Web site at www.sec.gov, and it also may be reviewed and copied at the SEC’s Public Reference Room in Washington, D.C. Information on the operation of the SEC’s Public Reference Room may be obtained by calling (800) SEC-0330.
354
Investment Portfolio December 31, 2005
DWS Turner Mid Cap Growth VIP
| | | | |
| | | Shares | | Value ($) |
Common Stocks 95.6% | | | | |
Consumer Discretionary 16.6% | | | | |
Auto Components 0.6% | | | | |
Johnson Controls, Inc. | | 11,530 | | 840,652 |
| | | | |
Hotels Restaurants & Leisure 3.1% | | | | |
Scientific Games Corp. “A”* | | 45,170 | | 1,232,238 |
Starwood Hotels & Resorts Worldwide, Inc. | | 34,720 | | 2,217,219 |
Station Casinos, Inc. | | 16,590 | | 1,124,802 |
| | | | |
| | | | 4,574,259 |
| | | | |
Household Durables 1.1% | | | | |
Harman International Industries, Inc. | | 17,180 | | 1,681,063 |
| | | | |
Media 2.9% | | | | |
Getty Images, Inc.* (a) | | 15,480 | | 1,381,899 |
Sirius Satellite Radio, Inc.* (a) | | 340,180 | | 2,279,206 |
XM Satellite Radio Holdings, Inc. “A”* | | 25,210 | | 687,729 |
| | | | |
| | | | 4,348,834 |
| | | | |
Multiline Retail 1.1% | | | | |
Nordstrom, Inc. | | 43,070 | | 1,610,818 |
| | | | |
Specialty Retail 5.1% | | | | |
Chico’s FAS, Inc.* | | 46,640 | | 2,048,895 |
Circuit City Stores, Inc. | | 41,620 | | 940,196 |
GameStop Corp. “A”* (a) | | 24,910 | | 792,636 |
Tiffany & Co. (a) | | 30,800 | | 1,179,332 |
Urban Outfitters, Inc.* (a) | | 38,590 | | 976,713 |
Williams-Sonoma, Inc.* | | 38,130 | | 1,645,310 |
| | | | |
| | | | 7,583,082 |
| | | | |
Textiles, Apparel & Luxury Goods 2.7% | | | | |
Coach, Inc.* | | 83,880 | | 2,796,559 |
Polo Ralph Lauren Corp. | | 23,450 | | 1,316,483 |
| | | | |
| | | | 4,113,042 |
| | | | |
Consumer Staples 2.0% | | | | |
Beverages 0.9% | | | | |
Hansen Natural Corp.* (a) | | 16,680 | | 1,314,551 |
| | | | |
Food & Staples Retailing 1.1% | | | | |
Whole Foods Market, Inc. | | 21,820 | | 1,688,650 |
| | | | |
Energy 9.3% | | | | |
Energy Equipment & Services 2.1% | | | | |
Cal Dive International, Inc.* | | 19,100 | | 685,499 |
Grant Prideco, Inc.* | | 19,290 | | 851,075 |
National-Oilwell Varco, Inc.* | | 24,650 | | 1,545,555 |
| | | | |
| | | | 3,082,129 |
| | | | |
Oil, Gas & Consumable Fuels 7.2% | | | | |
Chesapeake Energy Corp. (a) | | 26,650 | | 845,605 |
Newfield Exploration Co.* | | 21,550 | | 1,079,008 |
Peabody Energy Corp. | | 12,420 | | 1,023,656 |
Range Resources Corp. (a) | | 73,614 | | 1,938,993 |
Southwestern Energy Co.* | | 38,480 | | 1,382,971 |
Sunoco, Inc. | | 21,530 | | 1,687,521 |
Ultra Petroleum Corp.* | | 19,550 | | 1,090,890 |
XTO Energy, Inc. | | 38,136 | | 1,675,696 |
| | | | |
| | | | 10,724,340 |
| | | | |
355
| | | | |
| | | Shares | | Value ($) |
Financials 9.6% | | | | |
Banks 0.5% | | | | |
Colonial BancGroup, Inc. | | 29,080 | | 692,686 |
| | | | |
Capital Markets 2.6% | | | | |
Mellon Financial Corp. | | 50,110 | | 1,716,268 |
T. Rowe Price Group, Inc. | | 30,280 | | 2,181,068 |
| | | | |
| | | | 3,897,336 |
| | | | |
Diversified Financial Services 5.0% | | | | |
Affiliated Managers Group, Inc.* (a) | | 21,954 | | 1,761,808 |
Ameritrade Holding Corp.* | | 65,670 | | 1,576,080 |
Chicago Mercantile Exchange Holdings, Inc. | | 5,090 | | 1,870,524 |
Moody’s Corp. | | 22,860 | | 1,404,061 |
Nasdaq Stock Market, Inc.* | | 23,310 | | 820,046 |
| | | | |
| | | | 7,432,519 |
| | | | |
Insurance 0.7% | | | | |
HCC Insurance Holdings, Inc. | | 33,110 | | 982,705 |
| | | | |
Real Estate 0.8% | | | | |
CB Richard Ellis Group, Inc. “A”* | | 20,600 | | 1,212,310 |
| | | | |
Health Care 15.9% | | | | |
Biotechnology 3.9% | | | | |
Biogen Idec, Inc.* | | 25,350 | | 1,149,116 |
Celgene Corp.* | | 20,840 | | 1,350,432 |
Cephalon, Inc.* (a) | | 12,460 | | 806,660 |
MedImmune, Inc.* | | 39,330 | | 1,377,337 |
Protein Design Labs, Inc.* | | 41,260 | | 1,172,609 |
| | | | |
| | | | 5,856,154 |
| | | | |
Health Care Equipment & Supplies 2.8% | | | | |
Dade Behring Holdings, Inc. | | 36,600 | | 1,496,574 |
Intuitive Surgical, Inc.* | | 6,280 | | 736,456 |
ResMed, Inc.* | | 27,050 | | 1,036,285 |
Varian Medical Systems, Inc.* | | 17,450 | | 878,433 |
| | | | |
| | | | 4,147,748 |
| | | | |
Health Care Providers & Services 5.0% | | | | |
Cerner Corp.* (a) | | 14,780 | | 1,343,650 |
Community Health Systems, Inc.* | | 17,090 | | 655,230 |
DaVita, Inc.* | | 20,670 | | 1,046,729 |
Express Scripts, Inc.* | | 19,370 | | 1,623,206 |
Omnicare, Inc. | | 36,690 | | 2,099,402 |
Pharmaceutical Product Development, Inc. | | 12,070 | | 747,736 |
WellPoint, Inc.* | | 1 | | 74 |
| | | | |
| | | | 7,516,027 |
| | | | |
Pharmaceuticals 4.2% | | | | |
Allergan, Inc. | | 19,490 | | 2,104,141 |
Barr Pharmaceuticals, Inc.* | | 25,560 | | 1,592,132 |
Sepracor, Inc.* (a) | | 13,580 | | 700,728 |
Shire Pharmaceuticals Group PLC (ADR) (a) | | 30,270 | | 1,174,173 |
United Therapeutics Corp.* (a) | | 9,350 | | 646,272 |
| | | | |
| | | | 6,217,446 |
| | | | |
356
| | | | |
| | | Shares | | Value ($) |
Industrials 13.0% | | | | |
Aerospace & Defense 1.6% | | | | |
Ceradyne, Inc.* (a) | | 20,230 | | 886,074 |
Precision Castparts Corp. | | 28,280 | | 1,465,187 |
| | | | |
| | | | 2,351,261 |
| | | | |
Air Freight & Logistics 1.6% | | | | |
C.H. Robinson Worldwide, Inc. | | 33,470 | | 1,239,394 |
UTI Worldwide, Inc. | | 12,260 | | 1,138,218 |
| | | | |
| | | | 2,377,612 |
| | | | |
Commercial Services & Supplies 2.9% | | | | |
aQuantive, Inc.* (a) | | 30,630 | | 773,101 |
Manpower, Inc. | | 26,580 | | 1,235,970 |
Monster Worldwide, Inc.* | | 55,660 | | 2,272,041 |
| | | | |
| | | | 4,281,112 |
| | | | |
Construction & Engineering 0.7% | | | | |
McDermott International, Inc.* | | 22,150 | | 988,112 |
| | | | |
Electrical Equipment 1.6% | | | | |
AMETEK, Inc. | | 23,140 | | 984,376 |
Roper Industries, Inc. | | 36,800 | | 1,453,968 |
| | | | |
| | | | 2,438,344 |
| | | | |
Machinery 2.9% | | | | |
Actuant Corp. “A” | | 10,420 | | 581,436 |
Joy Global, Inc. | | 43,985 | | 1,759,400 |
Oshkosh Truck Corp. | | 24,550 | | 1,094,684 |
Terex Corp.* | | 14,610 | | 867,834 |
| | | | |
| | | | 4,303,354 |
| | | | |
Road & Rail 0.7% | | | | |
Norfolk Southern Corp. | | 21,950 | | 984,019 |
| | | | |
Trading Companies & Distributors 1.0% | | | | |
WESCO International, Inc.* | | 36,660 | | 1,566,482 |
| | | | |
Information Technology 23.6% | | | | |
Communications Equipment 3.6% | | | | |
Comverse Technologies, Inc.* | | 27,900 | | 741,861 |
F5 Networks, Inc.* | | 35,320 | | 2,019,951 |
Foundry Networks, Inc.* | | 82,570 | | 1,140,292 |
JDS Uniphase Corp.* (a) | | 594,350 | | 1,402,666 |
| | | | |
| | | | 5,304,770 |
| | | | |
Computers & Peripherals 1.5% | | | | |
ATI Technologies, Inc.* | | 49,840 | | 846,782 |
Network Appliance, Inc.* | | 49,440 | | 1,334,880 |
| | | | |
| | | | 2,181,662 |
| | | | |
Electronic Equipment & Instruments 2.6% | | | | |
Agilent Technologies, Inc.* | | 52,580 | | 1,750,389 |
Cogent, Inc.* (a) | | 47,190 | | 1,070,269 |
Itron, Inc.* (a) | | 12,280 | | 491,691 |
Trident Microsystems, Inc.* (a) | | 33,510 | | 603,180 |
| | | | |
| | | | 3,915,529 |
| | | | |
Internet Software & Services 3.5% | | | | |
Akamai Technologies, Inc.* (a) | | 75,680 | | 1,508,302 |
CNET Networks, Inc.* (a) | | 110,800 | | 1,627,652 |
Openwave Systems, Inc.* (a) | | 68,210 | | 1,191,629 |
ValueClick, Inc.* (a) | | 52,280 | | 946,791 |
| | | | |
| | | | 5,274,374 |
| | | | |
357
| | | | | | |
| | | Shares | | | Value ($) | |
IT Consulting & Services 1.3% | | | | | | |
Global Payments, Inc. | | 24,790 | | | 1,155,462 | |
MPS Group, Inc.* | | 57,760 | | | 789,579 | |
| | | | | | |
| | | | | 1,945,041 | |
| | | | | | |
Semiconductors & Semiconductor Equipment 10.4% | | | | | | |
Advanced Micro Devices, Inc.* | | 88,570 | | | 2,710,242 | |
ASML Holding NV (New York Registered Shares)* (a) | | 65,200 | | | 1,309,216 | |
Broadcom Corp. “A”* | | 68,630 | | | 3,235,904 | |
KLA-Tencor Corp. | | 49,270 | | | 2,430,489 | |
Lam Research Corp.* | | 19,730 | | | 703,966 | |
Micron Technology, Inc.* (a) | | 119,310 | | | 1,588,016 | |
Silicon Laboratories, Inc.* (a) | | 43,180 | | | 1,582,979 | |
SiRF Technology Holdings, Inc.* (a) | | 26,380 | | | 786,124 | |
Varian Semiconductor Equipment Associates, Inc.* (a) | | 26,320 | | | 1,156,238 | |
| | | | | | |
| | | | | 15,503,174 | |
| | | | | | |
Software 0.7% | | | | | | |
Red Hat, Inc.* | | 19,160 | | | 521,918 | |
Salesforce.com, Inc.* (a) | | 14,500 | | | 464,725 | |
| | | | | | |
| | | | | 986,643 | |
| | | | | | |
Materials 3.2% | | | | | | |
Construction Materials 0.4% | | | | | | |
Florida Rock Industries, Inc. | | 11,740 | | | 575,964 | |
| | | | | | |
Metals & Mining 2.8% | | | | | | |
Allegheny Technologies, Inc. (a) | | 34,590 | | | 1,248,007 | |
CONSOL Energy, Inc. | | 21,120 | | | 1,376,602 | |
Freeport-McMoRan Copper & Gold, Inc. “B” | | 28,040 | | | 1,508,552 | |
| | | | | | |
| | | | | 4,133,161 | |
| | | | | | |
Telecommunication Services 2.4% | | | | | | |
Wireless Telecommunication Services | | | | | | |
Crown Castle International Corp.* | | 34,330 | | | 923,820 | |
NII Holdings, Inc.* | | 61,300 | | | 2,677,584 | |
| | | | | 3,601,404 | |
| | | | | | |
Total Common Stocks (Cost $112,297,094) | | | | | 142,228,369 | |
| | | | | | |
Securities Lending Collateral 18.7% | | | | | | |
Daily Assets Fund Institutional, 4.28% (b) (c) (Cost $27,863,138) | | 27,863,138 | | | 27,863,138 | |
Cash Equivalents 3.9% | | | | | | |
| | | | | | |
Cash Management QP Trust, 4.26% (d) (Cost $5,741,167) | | 5,741,167 | | | 5,741,167 | |
| | | | | | |
| | |
| | | % of Net Assets | | | Value ($) | |
Total Investment Portfolio (Cost $145,901,399)+ | | 118.2 | | | 175,832,674 | |
| | | | | | |
| Other Assets and Liabilities, Net | | (18.2 | ) | | (27,014,184 | ) |
| | | | | | |
| Net Assets | | 100.0 | | | 148,818,490 | |
| | | | | | |
Notes to DWS Turner Mid Cap Growth VIP Portfolio of Investments
| * | Non-income producing security. |
| + | The cost for federal income tax purposes was $145,919,877. At December 31, 2005, net unrealized appreciation for all securities based on tax cost was $29,912,797. This consisted of aggregate gross unrealized appreciation for all securities in which there was an excess of value over tax cost of $31,029,734 and aggregate gross unrealized depreciation for all securities in which there was an excess of tax cost over value of $1,116,937. |
| (a) | All or a portion of these securities were on loan (see Notes to Financial Statements). The value of all securities loaned at December 31, 2005 amounted to $26,923,208 which is 18.1% of net assets. |
| (b) | Daily Assets Fund Institutional, an affiliated fund, is managed by Deutsche Asset Management, Inc. The rate shown is the annualized seven-day yield at period end. |
| (c) | Represents collateral held in connection with securities lending. |
| (d) | Cash Management QP Trust, an affiliated fund, is managed by Deutsche Investment Management Americas Inc. The rate shown is the annualized seven-day yield at period end. |
| ADR: | American Depositary Receipt |
The accompanying notes are an integral part of the financial statements.
358
Financial Statements
Statement of Assets and Liabilities
as of December 31, 2005
| | | | |
Assets | | | | |
Investments: | | | | |
Investments in securities, at value (cost $112,297,094) — including $26,923,208 of securities loaned | | $ | 142,228,369 | |
Investment in Daily Assets Fund Institutional (cost $27,863,138)* | | | 27,863,138 | |
Investment in Cash Management QP Trust (cost $5,741,167) | | | 5,741,167 | |
Total investments in securities, at value (cost $145,901,399) | | | 175,832,674 | |
Cash | | | 617,907 | |
Receivable for investments sold | | | 1,420,884 | |
Dividends receivable | | | 62,980 | |
Interest receivable | | | 25,971 | |
Other assets | | | 4,306 | |
Total assets | | | 177,964,722 | |
Liabilities | | | | |
Payable upon return of securities loaned | | | 27,863,138 | |
Payable for investments purchased | | | 958,223 | |
Payable for Portfolio shares redeemed | | | 131,838 | |
Accrued management fee | | | 106,193 | |
Other accrued expenses and payables | | | 86,840 | |
Total liabilities | | | 29,146,232 | |
| | | | |
Net assets, at value | | $ | 148,818,490 | |
| | | | |
Net Assets | | | | |
Net assets consist of: | | | | |
Accumulated net investment loss | | | (86 | ) |
Net unrealized appreciation (depreciation) on investments | | | 29,931,275 | |
Accumulated net realized gain (loss) | | | 11,657,906 | |
Paid-in capital | | | 107,229,395 | |
| | | | |
Net assets, at value | | $ | 148,818,490 | |
| | | | |
Class A | | | | |
Net Asset Value, offering and redemption price per share ($121,631,079 ÷ 11,034,621 outstanding shares of beneficial interest, $.01 par value, unlimited number of shares authorized) | | $ | 11.02 | |
| | | | |
Class B | | | | |
Net Asset Value, offering and redemption price per share ($27,187,411 ÷ 2,497,836 outstanding shares of beneficial interest, $.01 par value, unlimited number of shares authorized) | | $ | 10.88 | |
| | | | |
| * | Represents collateral on securities loaned. |
359
Statement of Operations
for the year ended December 31, 2005
| | | | |
Investment Income | | | | |
Income: | | | | |
Dividends (net of foreign taxes withheld of $498) | | $ | 628,787 | |
Interest — Cash Management QP Trust | | | 68,963 | |
Securities lending income, including income from Daily Assets Fund Institutional, net of borrower rebates | | | 52,492 | |
Total Income | | | 750,242 | |
Expenses: | | | | |
Management fee | | | 1,287,229 | |
Custodian and accounting fees | | | 115,609 | |
Distribution service fees (Class B) | | | 60,306 | |
Record keeping fees (Class B) | | | 34,105 | |
Auditing | | | 45,362 | |
Legal | | | 9,745 | |
Trustees’ fees and expenses | | | 5,721 | |
Reports to shareholders | | | 34,223 | |
Other | | | 16,094 | |
Total expenses before expense reductions | | | 1,608,394 | |
Expense reductions | | | (9,279 | ) |
Total expenses after expense reductions | | | 1,599,115 | |
| | | | |
Net investment income (loss) | | | (848,873 | ) |
| | | | |
Realized and Unrealized Gain (Loss) on Investment Transactions | | | | |
Net realized gain (loss) from investments | | | 15,832,540 | |
Foreign currency related transactions | | | (24 | ) |
| | | 15,832,516 | |
Net unrealized appreciation (depreciation) during the period on investments | | | (148,045 | ) |
| | | | |
Net gain (loss) on investment transactions | | | 15,684,471 | |
| | | | |
Net increase (decrease) in net assets resulting from operations | | $ | 14,835,598 | |
| | | | |
The accompanying notes are an integral part of the financial statements.
360
Statement of Changes in Net Assets
| | | | | | | | |
| | | Years Ended December 31, | |
Increase (Decrease) in Net Assets | | 2005 | | | 2004 | |
Operations: | | | | | | | | |
Net investment income (loss) | | $ | (848,873 | ) | | $ | (1,138,786 | ) |
Net realized gain (loss) on investment transactions | | | 15,832,516 | | | | 10,201,612 | |
Net unrealized appreciation (depreciation) during the period on investment transactions | | | (148,045 | ) | | | 4,371,388 | |
Net increase (decrease) in net assets resulting from operations | | | 14,835,598 | | | | 13,434,214 | |
Portfolio share transactions: | | | | | | | | |
Class A | | | | | | | | |
Proceeds from shares sold | | | 10,529,915 | | | | 14,595,440 | |
Cost of shares redeemed | | | (18,562,756 | ) | | | (17,916,695 | ) |
Net increase (decrease) in net assets from Class A share transactions | | | (8,032,841 | ) | | | (3,321,255 | ) |
Class B Proceeds from shares sold | | | 6,985,137 | | | | 9,964,790 | |
Cost of shares redeemed | | | (5,854,761 | ) | | | (2,100,980 | ) |
Net increase (decrease) in net assets from Class B share transactions | | | 1,130,376 | | | | 7,863,810 | |
Increase (decrease) in net assets | | | 7,933,133 | | | | 17,976,769 | |
Net assets at beginning of period | | | 140,885,357 | | | | 122,908,588 | |
| | | | | | | | |
Net assets at end of period (including accumulated net investment loss of $86 and $301, respectively) | | $ | 148,818,490 | | | $ | 140,885,357 | |
| | | | | | | | |
Other Information | | | | | | | | |
Class A | | | | | | | | |
Shares outstanding at beginning of period | | | 11,918,058 | | | | 12,352,137 | |
Shares sold | | | 997,835 | | | | 1,622,749 | |
Shares redeemed | | | (1,881,272 | ) | | | (2,056,828 | ) |
Net increase (decrease) in Class A shares | | | (883,437 | ) | | | (434,079 | ) |
| | | | | | | | |
Shares outstanding at end of period | | | 11,034,621 | | | | 11,918,058 | |
| | | | | | | | |
Class B | | | | | | | | |
Shares outstanding at beginning of period | | | 2,386,654 | | | | 1,499,883 | |
Shares sold | | | 684,539 | | | | 1,126,297 | |
Shares redeemed | | | (573,357 | ) | | | (239,526 | ) |
Net increase (decrease) in Class B shares | | | 111,182 | | | | 886,771 | |
| | | | | | | | |
Shares outstanding at end of period | | | 2,497,836 | | | | 2,386,654 | |
| | | | | | | | |
The accompanying notes are an integral part of the financial statements.
361
Financial Highlights
Class A
| | | | | | | | | | | | | | | | | | | | |
Years Ended December 31, | | 2005 | | | 2004 | | | 2003 | | | 2002 | | | 2001a | |
Selected Per Share Data | | | | | | | | | | | | | | | | | | | | |
Net asset value, beginning of period | | $ | 9.86 | | | $ | 8.88 | | | $ | 5.98 | | | $ | 8.82 | | | $ | 10.00 | |
| | | | | | | | | | | | | | | | | | | | |
| Income (loss) from investment operations: | | | | | | | | | | | | | | | | | | | | |
Net investment income (loss)b | | | (.05 | ) | | | (.07 | ) | | | (.06 | ) | | | (.06 | ) | | | (.04 | ) |
Net realized and unrealized gain (loss) on investment transactions | | | 1.21 | | | | 1.05 | | | | 2.96 | | | | (2.78 | ) | | | (1.14 | ) |
Total from investment operations | | | 1.16 | | | | .98 | | | | 2.90 | | | | (2.84 | ) | | | (1.18 | ) |
| | | | | | | | | | | | | | | | | | | | |
Net asset value, end of period | | $ | 11.02 | | | $ | 9.86 | | | $ | 8.88 | | | $ | 5.98 | | | $ | 8.82 | |
| | | | | | | | | | | | | | | | | | | | |
Total Return (%) | | | 11.76 | | | | 11.04 | | | | 48.49 | | | | (32.20 | ) | | | (11.80 | )c** |
Ratios to Average Net Assets and Supplemental Data | | | | | | | | | | | | | | | | | | | | |
Net assets, end of period ($ millions) | | | 122 | | | | 118 | | | | 110 | | | | 61 | | | | 48 | |
Ratio of expenses before expense reductions (%) | | | 1.11 | | | | 1.19 | | | | 1.18 | | | | 1.13 | | | | 1.82 | * |
Ratio of expenses after expense reductions (%) | | | 1.11 | | | | 1.19 | | | | 1.18 | | | | 1.13 | | | | 1.30 | * |
Ratio of net investment income (loss) (%) | | | (.56 | ) | | | (.82 | ) | | | (.90 | ) | | | (.82 | ) | | | (.76 | )* |
Portfolio turnover rate (%) | | | 151 | | | | 174 | | | | 155 | | | | 225 | | | | 205 | * |
| a | For the period from May 1, 2001 (commencement of operations) to December 31, 2001. |
| b | Based on average shares outstanding during the period. |
| c | Total return would have been lower had certain expenses not been reduced. |
Class B
| | | | | | | | | | | | | | | | |
Years Ended December 31, | | 2005 | | | 2004 | | | 2003 | | | 2002a | |
Selected Per Share Data | | | | | | | | | | | | | | | | |
Net asset value, beginning of period | | $ | 9.78 | | | $ | 8.84 | | | $ | 5.97 | | | $ | 6.60 | |
| | | | | | | | | | | | | | | | |
| Income (loss) from investment operations: | | | | | | | | | | | | | | | | |
Net investment income (loss)b | | | (.09 | ) | | | (.10 | ) | | | (.09 | ) | | | (.02 | ) |
Net realized and unrealized gain (loss) on investment transactions | | | 1.19 | | | | 1.04 | | | | 2.96 | | | | (.61 | ) |
Total from investment operations | | | 1.10 | | | | .94 | | | | 2.87 | | | | (.63 | ) |
| | | | | | | | | | | | | | | | |
Net asset value, end of period | | $ | 10.88 | | | $ | 9.78 | | | $ | 8.84 | | | $ | 5.97 | |
| | | | | | | | | | | | | | | | |
Total Return (%) | | | 11.25c | | | | 10.63 | | | | 48.07 | | | | (9.55 | )** |
Ratios to Average Net Assets and Supplemental Data | | | | | | | | | | | | | | | | |
Net assets, end of period ($ millions) | | | 27 | | | | 23 | | | | 13 | | | | .6 | |
Ratio of expenses before expense reductions (%) | | | 1.51 | | | | 1.56 | | | | 1.57 | | | | 1.38 | * |
Ratio of expenses after expense reductions (%) | | | 1.48 | | | | 1.56 | | | | 1.57 | | | | 1.38 | * |
Ratio of net investment income (loss) (%) | | | (.93 | ) | | | (1.19 | ) | | | (1.29 | ) | | | (.81 | )* |
Portfolio turnover rate (%) | | | 151 | | | | 174 | | | | 155 | | | | 225 | |
| a | For the period July 1, 2002 (commencement of operations of Class B shares) to December 31, 2002. |
| b | Based on an average shares outstanding during the period. |
| c | Total return would have been lower had certain expenses not been reduced. |
362
Notes to Financial Statements
A. Significant Accounting Policies
DWS Variable Series II (formerly Scudder Variable Series II) (the “Trust”) is registered under the Investment Company Act of 1940, as amended (the “1940 Act”), as an open-end, diversified management investment company organized as a Massachusetts business trust. The Trust offers twenty-nine portfolios (the “portfolio(s)”), including four portfolios that invest primarily in existing DWS Portfolios (formerly Scudder Portfolios) (“Underlying Portfolios”). Each Underlying Portfolio’s accounting policies and investment holdings are outlined in the Underlying Portfolio’s financials statements and are available upon request.
Multiple Classes of Shares of Beneficial Interest. The Trust offers two classes of shares (Class A shares and Class B shares) except DWS Income Allocation VIP, DWS Moderate Allocation VIP, DWS Growth Allocation VIP and DWS Conservative Allocation VIP, which offer Class B shares only. Sales of Class B shares are subject to record keeping fees up to 0.15% and Rule 12b-1 fees under the 1940 Act equal to an annual rate of 0.25%, of the average daily net assets of the Class B shares of the applicable portfolio. Class A shares are not subject to such fees.
Investment income, realized and unrealized gains and losses, and certain portfolio-level expenses and expense reductions, if any, are borne pro rata on the basis of relative net assets by the holders of all classes of shares except that each class bears certain expenses unique to that class (including the applicable 12b-1 fee and record keeping fee). Differences in class-level expenses may result in payment of different per share dividends by class. All shares have equal rights with respect to voting subject to class-specific arrangements.
The Trust’s financial statements are prepared in accordance with accounting principles generally accepted in the United States of America which require the use of management estimates. Actual results could differ from those estimates. The policies described below are followed consistently by the Trust in the preparation of its financial statements.
Security Valuation. DWS Money Market VIP values all securities utilizing the amortized cost method permitted in accordance with Rule 2a-7 under the 1940 Act and certain conditions therein. Under this method, which does not take into account unrealized capital gains or losses on securities, an instrument is initially valued at its cost and thereafter assumes a constant accretion/amortization to maturity of any discount or premium.
Investments in securities and Underlying Portfolios are stated at value determined as of the close of regular trading on the New York Stock Exchange on each day the exchange is open for trading. Equity securities are valued at the most recent sale price or official closing price reported on the exchange (US or foreign) or over-the-counter market on which the security is traded most extensively. Securities for which no sales are reported are valued at the calculated mean between the most recent bid and asked quotations on the relevant market or, if a mean cannot be determined, at the most recent bid quotation.
Debt securities are valued by independent pricing services approved by the Trustees of the portfolios. If the pricing services are unable to provide valuations, the securities are valued at the most recent bid quotation or evaluated price, as applicable, obtained from a broker-dealer. Such services may use various pricing techniques which take into account appropriate factors such as yield, quality, coupon rate, maturity, type of issue, trading characteristics and other data, as well as broker quotes.
Money market instruments purchased with an original or remaining maturity of sixty days or less, maturing at par, are valued at amortized cost. Investments in open-end investment companies and Cash Management QP Trust are valued at their net asset value each business day.
Investments in the Underlying Portfolios are valued at the net asset value per share of each class of the Underlying Portfolios as of the close of regular trading on the New York Stock Exchange on each day the exchange is open for trading.
Securities and other assets for which market quotations are not readily available or for which the above valuation procedures are deemed not to reflect fair value are valued in a manner that is intended to reflect their fair value as determined in accordance with procedures approved by the Trustees. The portfolios may use a fair valuation model to value international equity securities in order to adjust for events which may occur between the close of the foreign exchanges and the close of the New York Stock Exchange.
Foreign Currency Translations. The books and records of the Trust are maintained in US dollars. Investment securities and other assets and liabilities denominated in a foreign currency are translated into US dollars at the prevailing exchange rates at period end. Purchases and sales of investment securities, income and expenses are translated into US dollars at the prevailing exchange rates on the respective dates of the transactions.
Net realized and unrealized gains and losses on foreign currency transactions represent net gains and losses between trade and settlement dates on securities transactions, the disposition of forward foreign currency exchange contracts and foreign currencies and the difference between the amount of net investment income accrued and the US dollar amount actually received. That portion of both realized and unrealized gains and losses on investments that results from fluctuations in foreign currency exchange rates is not separately disclosed but is included with net realized and unrealized gains and losses on investment securities.
363
Repurchase Agreements. The portfolios may enter into repurchase agreements with certain banks and broker/dealers whereby the portfolios, through their custodian or sub-custodian bank, receive delivery of the underlying securities, the amount of which at the time of purchase and each subsequent business day is required to be maintained at such a level that the value is equal to at least the principal amount of the repurchase price plus accrued interest. The custodian bank holds the collateral in a separate account until the agreement matures. If the value of the securities falls below the principal amount of the repurchase agreement plus accrued interest, the financial institution deposits additional collateral by the following business day. If the financial institution either fails to deposit the required additional collateral or fails to repurchase the securities as agreed, the portfolios have the right to sell the securities and recover any resulting loss from the financial institution. If the financial institution enters into bankruptcy, the portfolios’ claims on the collateral may be subject to legal proceedings.
Securities Lending. Each portfolio, except DWS Money Market VIP, DWS Income Allocation VIP, DWS Moderate Allocation VIP, DWS Growth Allocation VIP, DWS Conservative Allocation VIP, DWS Mercury Large Cap Core VIP and DWS Templeton Foreign Value VIP, may lend securities to financial institutions. The portfolios retain beneficial ownership of the securities they have loaned and continue to receive interest and dividends paid by the securities and to participate in any changes in their market value. The portfolio requires the borrowers of the securities to maintain collateral with the portfolio consisting of liquid, unencumbered assets having a value at least equal to the value of the securities loaned. The portfolio may invest the cash collateral into a joint trading account in an affiliated money market fund pursuant to Exemptive Orders issued by the SEC. The portfolios receive compensation for lending their securities either in the form of fees or by earning interest on invested cash collateral net fees paid to a lending agent. Either the portfolios or the borrower may terminate the loan. The portfolios are subject to all investment risks associated with the value of any cash collateral received, including, but not limited to, interest rate, credit and liquidity risk associated with such investments.
Credit Default Swap Contracts. A credit default swap is a contract between a buyer and a seller of protection against a pre-defined credit event. The portfolio may buy or sell credit default swap contracts to seek to increase the portfolio’s income, to add leverage to the portfolio, or to hedge the risk of default on portfolio securities. As a seller in the credit default swap contract, the portfolio would be required to pay the par (or other agreed-upon) value of the referenced debt obligation to the counterparty in the event of a default by a third party, such as a US or foreign corporate issuer, on the debt obligation, which would likely result in a loss to the portfolio. In return, the Portfolio would receive from the counterparty a periodic stream of payments over the term of the contract provided that no event of default has occurred. If no default occurs, the Portfolio would keep the stream of payments and would have no payment obligations. The portfolio may also buy credit default swap contracts in order to hedge against the risk of default of debt securities, in which case the portfolio would function as the counterparty referenced above. This would involve the risk that the contract may expire worthless. It would also involve credit risk — that the seller may fail to satisfy its payment obligations to the portfolio in the event of a default. When the Portfolio sells a credit default swap contract it will “cover” its commitment. This may be achieved by, among other methods, maintaining cash or liquid assets equal to the aggregate notional value of the underlying debt obligations for all outstanding credit default swap contracts sold by the portfolio.
Credit default swap contracts are marked to market daily based upon quotations from the counterparty and the change in value, if any, is recorded daily as unrealized gain or loss. An upfront payment made by the DWS Strategic Income VIP is recorded as an asset on the statement of assets and liabilities. An upfront payment received by the DWS Strategic Income VIP is recorded as a liability on the statement of assets and liabilities. Under the terms of the credit default swap contracts, the portfolio receives or makes payments semi-annually based on a specified interest rate on a fixed notional amount. These payments are recorded as a realized gain or loss on the statement of operations. Payments received or made as a result of a credit event or termination of the contract are recognized, net of a proportional amount of the upfront payment, as realized gains or losses.
Options. An option contract is a contract in which the writer of the option grants the buyer of the option the right to purchase from (call option), or sell to (put option), the writer a designated instrument at a specified price within a specified period of time. Certain options, including options on indices, will require cash settlement by the portfolio if the option is exercised. The portfolios may enter into option contracts in order to hedge against potential adverse price movements in the value of portfolio assets; as a temporary substitute for selling selected investments; to lock in the purchase price of a security or currency which it expects to purchase in the near future; as a temporary substitute for purchasing selected investments; and to enhance potential gain.
The liability representing the portfolio’s obligation under an exchange traded written option or investment in a purchased option is valued at the last sale price or, in the absence of a sale, the mean between the closing bid and asked prices or at the most recent asked price (bid for purchased options) if no bid and asked price are available. Over-the-counter written or purchased options are valued using dealer-supplied quotations. Gain or loss is recognized when the option contract expires or is closed.
If the portfolio writes a covered call option, the portfolio foregoes, in exchange for the premium, the opportunity to profit during the option period from an increase in the market value of the underlying security above the exercise price. If the portfolio writes a put option it accepts the risk of a decline in the value of the underlying security below the exercise price. Over-the-counter options have the risk of the potential inability of counterparties to meet the terms of their contracts. The portfolio’s maximum exposure to purchased options is limited to the premium initially paid. In addition, certain risks may arise upon entering into option contracts including the risk that an illiquid secondary market will limit the portfolio’s ability to close out an option contract prior to the expiration date and that a change in the value of the option contract may not correlate exactly with changes in the value of the securities or currencies hedged.
364
Futures Contracts. A futures contract is an agreement between a buyer or seller and an established futures exchange or its clearinghouse in which the buyer or seller agrees to take or make a delivery of a specific amount of a financial instrument at a specified price on a specific date (settlement date). The portfolios may enter into futures contracts as a hedge against anticipated interest rate, currency or equity market changes and for duration management, risk management and return enhancement purposes.
Upon entering into a futures contract, the portfolio is required to deposit with a financial intermediary an amount (“initial margin”) equal to a certain percentage of the face value indicated in the futures contract. Subsequent payments (“variation margin”) are made or received by the portfolio dependent upon the daily fluctuations in the value of the underlying security and are recorded for financial reporting purposes as unrealized gains or losses by the portfolio. When entering into a closing transaction, the portfolio will realize a gain or loss equal to the difference between the value of the futures contract to sell and the futures contract to buy. Futures contracts are valued at the most recent settlement price.
Certain risks may arise upon entering into futures contracts, including the risk that an illiquid secondary market will limit the portfolio’s ability to close out a futures contract prior to the settlement date and that a change in the value of a futures contract may not correlate exactly with the changes in the value of the securities or currencies hedged. When utilizing futures contracts to hedge, the portfolio gives up the opportunity to profit from favorable price movements in the hedged positions during the term of the contract.
Forward Foreign Currency Exchange Contracts. A forward foreign currency exchange contract (forward currency contract) is a commitment to purchase or sell a foreign currency at the settlement date at a negotiated rate. The portfolios may enter into forward currency contracts in order to hedge its exposure to changes in foreign currency exchange rates on its foreign currency denominated portfolio holdings and to facilitate transactions in foreign currency denominated securities.
Forward currency contracts are valued at the prevailing forward exchange rate of the underlying currencies and unrealized gain (loss) is recorded daily. Sales and purchases of forward currency contracts having the same settlement date and broker are offset and any gain (loss) is realized on the date of offset; otherwise, gain (loss) is realized on settlement date. Realized and unrealized gains and losses which represent the difference between the value of a forward currency contract to buy and a forward currency contract to sell are included in net realized and unrealized gain (loss) from foreign currency related transactions.
Certain risks may arise upon entering into forward currency contracts from the potential inability of counterparties to meet the terms of their contracts. Additionally, when utilizing forward currency contracts to hedge, the portfolio gives up the opportunity to profit from favorable exchange rate movements during the term of the contract.
Loan Participations/Assignments. The portfolios may invest in US dollar-denominated fixed and floating rate loans (“Loans”) arranged through private negotiations between a foreign sovereign entity and one or more financial institutions (“Lenders”). The portfolios invest in such Loans in the form of participations in Loans (“Participations”) or assignments of all or a portion of loans from third parties (“Assignments”). Participations typically result in the portfolios having a contractual relationship only with the Lender, not with the sovereign borrower. The portfolios have the right to receive payments of principal, interest and any fees to which they are entitled from the Lender selling the Participation and only upon receipt by the Lender of the payments from the borrower. In connection with purchasing Participations, the portfolios generally have no right to enforce compliance by the borrower with the terms of the loan agreement relating to the Loan, nor any rights of set-off against the borrower, and the portfolios will not benefit directly from any collateral supporting the Loan in which it has purchased the Participation. As a result, the portfolios assume the credit risk of both the borrower and the Lender that is selling the Participation.
Mortgage Dollar Rolls. DWS Core Fixed Income VIP, DWS Government & Agency Securities VIP and DWS Balanced VIP entered into mortgage dollar rolls in which each portfolio sells to a bank or broker/dealer (the “counterparty”) mortgage-backed securities for delivery in the current month and simultaneously contracts to repurchase similar, but not identical, securities on a fixed date. The counterparty receives all principal and interest payments, including prepayments, made on the security while it is the holder. Each portfolio receives compensation as consideration for entering into the commitment to repurchase. The compensation is paid in the form of a lower price for the security upon its repurchase, or alternatively, a fee. Mortgage dollar rolls may be renewed with a new sale and repurchase price and a cash settlement made at each renewal without physical delivery of the securities subject to the contract.
Mortgage dollar rolls may be treated for purposes of the 1940 Act as borrowings by each portfolio because they involve the sale of a security coupled with an agreement to repurchase. A mortgage dollar roll involves costs to each portfolio. For example, while each portfolio receives compensation as consideration for agreeing to repurchase the security, each portfolio forgoes the right to receive all principal and interest payments while the counterparty holds the security. These payments to the counterparty may exceed the compensation received by each portfolio, thereby effectively charging each portfolio interest on its borrowings. Further, although each portfolio can estimate the amount of expected principal prepayment over the term of the mortgage dollar roll, a variation in the actual amount of prepayment could increase or decrease the cost of each portfolio’s borrowing.
Certain risks may arise upon entering into mortgage dollar rolls from the potential inability of counterparties to meet the terms of their commitments. Additionally, the value of such securities may change adversely before each portfolio is able to repurchase them. There can be no assurance that each portfolio’s use of the cash that it receives from a mortgage dollar roll will provide a return that exceeds its borrowing costs.
365
When-Issued/Delayed Delivery Securities. Several of the portfolios may purchase securities with delivery or payment to occur at a later date beyond the normal settlement period. At the time the portfolio enters into a commitment to purchase a security, the transaction is recorded and the value of the security is reflected in the net asset value. The price of such security and the date when the security will be delivered and paid for are fixed at the time the transaction is negotiated. The value of the security may vary with market fluctuations. No interest accrues to the portfolio until payment takes place. At the time the portfolio enters into this type of transaction it is required to segregate cash or other liquid assets at least equal to the amount of the commitment.
Certain risks may arise upon entering into when-issued or delayed delivery securities from the potential inability of counterparties to meet the terms of their contracts or if the issuer does not issue the securities due to political, economic, or other factors. Additionally, losses may arise due to changes in the value of the underlying securities.
Federal Income Taxes. The portfolios’ policy is to comply with the requirements of the Internal Revenue Code, as amended, which are applicable to regulated investment companies and to distribute all of its taxable and tax-exempt income to its shareholders. Accordingly, the portfolios paid no federal income taxes and no federal income tax provision was required.
At December 31, 2005, the following portfolios have utilized and had an approximate net tax basis capital loss carryforward which may be applied against any realized net taxable capital gains of each succeeding year until fully utilized or until the following expiration dates, whichever occurs first:
| | | | | | |
Portfolio | | Capital Loss Carryforward ($) | | Expiration
Date | | Capital Loss Carryforwards Utilized ($) |
DWS Balanced VIP* | | 4,703,100 | | 12/31/2008 | | 15,537,732 |
| | 6,354,400 | | 12/31/2009 | | |
| | 18,679,700 | | 12/31/2010 | | |
| | 46,269,100 | | 12/31/2011 | | |
DWS Blue Chip VIP | | — | | — | | 16,510,800 |
DWS Davis Venture Value VIP | | 3,600,000 | | 12/31/2010 | | 900,000 |
| | 1,400,000 | | 12/31/2011 | | |
| | 1,100,000 | | 12/31/2012 | | |
DWS Dreman Financial Services VIP | | — | | — | | 5,323,000 |
DWS Dreman High Return Equity VIP | | 6,700,000 | | 12/31/2011 | | 12,700,000 |
DWS Global Thematic VIP | | — | | — | | 4,736,665 |
DWS Government & Agency Securities VIP | | 14,000 | | 12/31/2013 | | — |
DWS High Income VIP | | 3,945,000 | | 12/31/2007 | | 878,427 |
| | 16,114,000 | | 12/31/2008 | | |
| | 22,935,000 | | 12/31/2009 | | |
| | 55,108,000 | | 12/31/2010 | | |
| | 13,877,000 | | 12/31/2011 | | |
DWS International Select Equity VIP** | | 6,900,000 | | 12/31/2009 | | 27,700,000 |
| | 10,600,000 | | 12/31/2010 | | |
| | 4,401,000 | | 12/31/2011 | | |
DWS Janus Growth & Income VIP | | 3,482,000 | | 12/31/2009 | | 9,032,000 |
| | 29,907,000 | | 12/31/2010 | | |
| | 6,934,000 | | 12/31/2011 | | |
DWS Janus Growth Opportunities VIP | | 22,695,000 | | 12/31/2009 | | 8,734,800 |
| | 42,499,000 | | 12/31/2010 | | |
| | 19,473,000 | | 12/31/2011 | | |
DWS Large Cap Value VIP | | 7,347,000 | | 12/31/2010 | | 10,601,000 |
| | 6,438,000 | | 12/31/2011 | | |
DWS Mid Cap Growth VIP | | 8,893,000 | | 12/31/2010 | | 6,246,916 |
| | 23,998,000 | | 12/31/2011 | | |
DWS Oak Strategic Equity VIP | | 3,525,000 | | 12/31/2010 | | 1,197,000 |
| | 2,522,000 | | 12/31/2011 | | |
| | 3,689,000 | | 12/31/2012 | | |
DWS Salomon Aggressive Growth VIP | | — | | — | | 2,700,000 |
DWS Small Cap Growth VIP | | 59,486,000 | | 12/31/2009 | | 24,129,000 |
| | 71,888,400 | | 12/31/2010 | | |
| | 4,154,600 | | 12/31/2011 | | |
DWS Technology VIP | | 87,259,000 | | 12/31/2009 | | 8,093,000 |
| | 93,499,000 | | 12/31/2010 | | |
| | 71,516,000 | | 12/31/2011 | | |
DWS Turner Mid Cap Growth VIP | | — | | — | | 3,770,000 |
| * | Certain of these losses may be subject to limitations under Sections 381-384 of the Internal Revenue Code. |
| ** | Certain of these losses may be subject to limitations under Sections 381-383 of the Internal Revenue Code. |
366
For the period from November 1, 2005 through December 31, 2005, the following portfolios incurred approximate net realized capital losses as follows:
| | |
Portfolio | | Net Realized Capital Loss ($) |
DWS Core Fixed Income VIP | | 293,200 |
DWS Government & Agency Securities VIP | | 12,000 |
DWS High Income VIP | | 40,500 |
DWS Janus Growth & Income VIP | | 240,400 |
DWS Mercury Large Cap Core VIP | | 10,500 |
DWS MFS Strategic Value VIP | | 616,000 |
DWS Technology VIP | | 2,685,000 |
As permitted by tax regulations, the portfolios intend to elect to defer these losses and treat them as arising in the fiscal year ended December 31, 2006.
Distribution of Income and Gains. Distributions of net investment income, if any, for all portfolios except the DWS Money Market VIP, are made annually. Net realized gains from investment transactions, in excess of available capital loss carryforwards, would be taxable to the portfolio if not distributed and, therefore, will be distributed to shareholders at least annually. All of the net investment income of the DWS Money Market VIP is declared as a daily dividend and is distributed to shareholders monthly.
The timing and characterization of certain income and capital gains distributions are determined annually in accordance with federal tax regulations which may differ from accounting principles generally accepted in the United States of America. As a result, net investment income (loss) and net realized gain (loss) on investment transactions for a reporting period may differ significantly from distributions during such period. Accordingly, a portfolio may periodically make reclassifications among certain of its capital accounts without impacting the net asset value of the portfolio.
At December 31, 2005, the portfolios’ components of distributable earnings on a tax basis were as follows:
| | | | | | | | | | |
Portfolio | | Undistributed Ordinary Income ($) | | Undistributed Net Long-Term
Capital Gains ($) | | Capital Loss
Carryforwards ($) | | | Unrealized Appreciation
(Depreciation) on Investments ($) | |
DWS Balanced VIP | | 16,309,424 | | — | | (76,006,300 | ) | | 67,040,446 | |
DWS Blue Chip VIP | | 11,833,742 | | 8,925,855 | | — | | | 28,672,820 | |
DWS Conservative Allocation VIP | | 708,948 | | 151,805 | | — | | | 1,073,117 | |
DWS Core Fixed Income VIP | | 11,528,171 | | 54,769 | | — | | | (3,828,131 | ) |
DWS Davis Venture Value VIP | | 2,254,777 | | — | | (6,100,000 | ) | | 95,139,526 | |
DWS Dreman Financial Services VIP | | 2,884,953 | | 1,446,693 | | — | | | 28,856,509 | |
DWS Dreman High Return Equity VIP | | 15,444,856 | | — | | (6,700,000 | ) | | 191,921,884 | |
DWS Dreman Small Cap Value VIP | | 5,506,651 | | 47,312,546 | | — | | | 124,542,214 | |
DWS Global Thematic VIP | | 1,314,634 | | 8,014,353 | | — | | | 17,072,317 | |
DWS Government & Agency Securities VIP | | 10,459,567 | | — | | (14,000 | ) | | (2,282,709 | ) |
DWS Growth Allocation VIP | | 2,466,981 | | 741,615 | | — | | | 7,703,344 | |
DWS High Income VIP | | 29,763,859 | | — | | (111,979,000 | ) | | (13,091,657 | ) |
DWS Income Allocation VIP | | 287,149 | | — | | — | | | 123,088 | |
DWS International Select Equity VIP | | 5,174,107 | | — | | (21,876,000 | ) | | 50,913,016 | |
DWS Janus Growth & Income VIP | | 1,218,239 | | — | | (40,323,000 | ) | | 55,585,910 | |
DWS Janus Growth Opportunities VIP | | 66,147 | | — | | (84,667,000 | ) | | 27,433,151 | |
DWS Large Cap Value VIP | | 4,766,169 | | — | | (13,785,000 | ) | | 38,426,214 | |
DWS Mercury Large Cap Core VIP | | — | | — | | — | | | 452,745 | |
DWS Mid Cap Growth VIP | | — | | — | | (32,891,000 | ) | | 12,668,189 | |
DWS MFS Strategic Value VIP | | — | | — | | — | | | 3,778,753 | |
DWS Moderate Allocation VIP | | 2,151,112 | | 542,102 | | — | | | 5,559,222 | |
DWS Oak Strategic Equity VIP | | — | | — | | (9,736,000 | ) | | 7,396,849 | |
DWS Salomon Aggressive Growth VIP | | 1,030,058 | | 7,347,835 | | — | | | 2,796,395 | |
DWS Small Cap Growth VIP | | — | | — | | (135,529,000 | ) | | 48,466,317 | |
DWS Strategic Income VIP | | 5,311,786 | | 25,142 | | — | | | 850,392 | |
DWS Technology VIP | | 41,529 | | — | | (252,274,000 | ) | | 15,130,258 | |
DWS Templeton Foreign Value VIP | | 686 | | 80,265 | | — | | | 1,539,705 | |
DWS Turner Mid Cap Growth VIP | | — | | 11,676,383 | | — | | | 29,912,797 | |
367
In addition, the tax character of distributions paid by the portfolios is summarized as follows:
| | | | | | | | |
| | | Distributions from ordinary income ($)*
Years Ended December 31, | | Distributions from long-term capital gains ($)
Years Ended December 31, |
Portfolio | | 2005 | | 2004 | | 2005 | | 2004 |
DWS Balanced VIP | | 15,182,335 | | 10,994,018 | | — | | — |
DWS Blue Chip VIP | | 2,905,214 | | 1,683,204 | | — | | — |
DWS Conservative Allocation VIP | | 47,583 | | — | | 2,423 | | — |
DWS Core Fixed Income VIP | | 11,142,235 | | 11,368,699 | | 1,635,169 | | 1,643,431 |
DWS Davis Venture Value VIP | | 2,352,085 | | 1,018,451 | | — | | — |
DWS Dreman Financial Services VIP | | 2,709,871 | | 2,372,080 | | — | | — |
DWS Dreman High Return Equity VIP | | 15,007,524 | | 12,318,605 | | — | | — |
DWS Dreman Small Cap Value VIP | | 3,657,738 | | 3,617,447 | | 47,511,442 | | — |
DWS Global Thematic VIP | | 188,888 | | 744,211 | | — | | — |
DWS Government & Agency Securities VIP | | 15,012,462 | | 12,782,714 | | 22,888 | | — |
DWS Growth Allocation VIP | | 130,703 | | — | | 13,910 | | — |
DWS High Income VIP | | 38,836,639 | | 32,409,504 | | — | | — |
DWS Income Allocation VIP | | 6,214 | | — | | 191 | | — |
DWS International Select Equity VIP | | 6,456,379 | | 1,778,472 | | — | | — |
DWS Janus Growth & Income VIP | | 419,512 | | — | | — | | — |
DWS Janus Growth Opportunities VIP | | 444,341 | | — | | — | | — |
DWS Large Cap Value VIP | | 5,337,409 | | 4,405,034 | | — | | — |
DWS Moderate Allocation VIP | | 89,661 | | — | | 8,902 | | — |
DWS Mercury Large Cap Core VIP | | 16,872 | | — | | — | | — |
DWS MFS Strategic Value VIP** | | 2,709,671 | | 51,014 | | 2,293,917 | | 15,306 |
DWS Money Market VIP | | 8,462,304 | | 3,060,457 | | — | | — |
DWS Oak Strategic Equity VIP | | 9,542 | | — | | — | | — |
DWS Strategic Income VIP | | 6,790,122 | | 2,582,795 | | 203,812 | | 787,439 |
DWS Technology VIP | | 997,316 | | — | | — | | — |
DWS Templeton Foreign Value VIP | | 244,566 | | — | | — | | — |
| * | For tax purposes, short-term capital gain distributions are considered ordinary income distributions. |
| ** | For the year ended December 31, 2005, the DWS MFS Strategic Value Fund had tax return of capital distributions of $464,763. |
Expenses. Expenses arising in connection with a specific portfolio are allocated to that portfolio. Trust expenses are allocated between the portfolios in proportion to their relative net assets.
Offering Costs. Offering costs for DWS Income Allocation VIP, DWS Moderate Allocation VIP, DWS Growth Allocation VIP, DWS Conservative Allocation VIP, DWS Mercury Large Cap Core VIP and DWS Templeton Foreign Value VIP were paid in connection with the offering of shares and were amortized over one year.
Contingencies. In the normal course of business, the portfolios may enter into contracts with service providers that contain general indemnification clauses. The portfolios’ maximum exposure under these arrangements is unknown as this would involve future claims that may be made against the portfolios that have not yet been made. However, based on experience, the portfolios expect the risk of loss to be remote.
Other. Investment transactions are accounted for on a trade date plus one basis for daily net asset value calculations. However, for financial reporting purposes, investment transactions are reported on trade date. Interest income is recorded on the accrual basis. Dividend income is recorded on the ex-dividend date net of foreign withholding taxes. Certain dividends from foreign securities may be recorded subsequent to the ex-dividend date as soon as the portfolio is informed of such dividends. Realized gains and losses from investment transactions are recorded on an identified cost basis. All discounts and premiums are accreted/amortized for both tax and financial reporting purposes for all portfolios, with the exception of securities in default of principal. Distributions of income and capital gains from the Underlying Portfolios are recorded on the ex-dividend date.
368
B. Purchases and Sales of Securities
During the year ended December 31, 2005, purchases and sales of investment transactions (excluding short-term investments) were as follows:
| | | | |
Portfolio | | Purchases ($) | | Sales ($) |
DWS Balanced VIP | | | | |
excluding US Treasury Obligations and mortgage dollar roll transactions | | 564,179,281 | | 641,790,302 |
US Treasury Obligations | | 227,887,877 | | 228,481,650 |
mortgage dollar roll transactions | | 11,702,903 | | 11,705,275 |
DWS Blue Chip VIP | | 915,450,155 | | 920,653,818 |
DWS Conservative Allocation VIP | | 29,681,214 | | 6,703,756 |
DWS Core Fixed Income VIP | | | | |
excluding US Treasury Obligations and mortgage dollar roll transactions | | 261,943,870 | | 180,986,168 |
US Treasury Obligations | | 317,110,531 | | 318,080,615 |
mortgage dollar roll transactions | | 38,278,312 | | 36,897,226 |
DWS Davis Venture Value VIP | | 66,697,783 | | 28,361,784 |
DWS Dreman Financial Services VIP | | 39,251,598 | | 59,229,856 |
DWS Dreman High Return Equity VIP | | 100,918,804 | | 83,463,805 |
DWS Dreman Small Cap Value VIP | | 323,329,761 | | 332,554,054 |
DWS Global Thematic VIP | | 88,858,059 | | 76,328,779 |
DWS Government & Agency Securities VIP | | | | |
excluding US Treasury Obligations and mortgage dollar roll transactions | | 560,312,909 | | 546,074,198 |
US Treasury Obligations | | 75,146,790 | | 73,072,859 |
mortgage dollar roll transactions | | 414,625,809 | | 449,677,191 |
DWS Growth Allocation VIP | | 141,782,866 | | 20,465,320 |
DWS High Income VIP | | | | |
excluding US Treasury Obligations | | 396,243,599 | | 429,682,232 |
US Treasury Obligations | | 1,495,158 | | 1,471,714 |
DWS Income Allocation VIP | | 11,512,881 | | 3,399,696 |
DWS International Select Equity VIP | | 224,320,881 | | 218,210,814 |
DWS Janus Growth & Income VIP | | 66,716,951 | | 79,842,911 |
DWS Janus Growth Opportunities VIP | | 73,229,422 | | 66,081,830 |
DWS Large Cap Value VIP | | 186,984,470 | | 204,485,550 |
DWS Mercury Large Cap Core VIP | | 5,306,587 | | 2,273,576 |
DWS MFS Strategic Value VIP | | 41,163,100 | | 29,239,881 |
DWS Mid Cap Growth VIP | | 60,638,427 | | 63,831,983 |
DWS Moderate Allocation VIP | | 121,539,078 | | 12,873,947 |
DWS Oak Strategic Equity VIP | | 15,224,500 | | 29,011,910 |
DWS Salomon Aggressive Growth VIP | | 67,458,808 | | 68,469,309 |
DWS Small Cap Growth VIP | | 239,637,041 | | 262,188,537 |
DWS Strategic Income VIP | | | | |
excluding US Treasury Securities | | 91,237,880 | | 81,330,995 |
US Treasury Securities | | 23,200,073 | | 19,343,507 |
DWS Technology VIP | | 278,975,656 | | 303,973,728 |
DWS Templeton Foreign Value VIP | | 14,679,015 | | 1,700,854 |
DWS Turner Mid Cap Growth VIP | | 203,409,892 | | 217,046,771 |
For the year ended December 31, 2005, transactions for written options on securities were as follows for the DWS Technology VIP:
| | | | | | |
| | | Contract Amounts | | | Premium ($) | |
Beginning of period | | 2,074 | | | 332,731 | |
Written | | 25,242 | | | 3,230,766 | |
Closed | | (10,597 | ) | | (1,788,637 | ) |
Exercised | | (11,102 | ) | | (1,279,980 | ) |
Expired | | (5,214 | ) | | (425,164 | ) |
End of period | | 403 | | | 69,716 | |
369
C. Related Parties
Management Agreement. Under the Management Agreement with Deutsche Investment Management Americas Inc. (“DeIM” or the “Advisor”), an indirect, wholly owned subsidiary of Deutsche Bank AG, the Advisor directs the investments of the portfolios in accordance with its investment objectives, policies and restrictions. The Advisor determines the securities, instruments and other contracts relating to investments to be purchased, sold or entered into by the portfolios. In addition to portfolio management services, the Advisor provides certain administrative services in accordance with the Management Agreement. Accordingly, for the year ended December 31, 2005, the fees pursuant to the Management Agreement were equivalent to the annual effective rates shown below of the portfolios’ average daily net assets:
| | | |
Portfolio | | Annual Management Fee Rate | |
DWS Blue Chip VIP | | 0.65 | % |
DWS Core Fixed Income VIP | | 0.60 | % |
DWS Government & Agency Securities VIP | | 0.55 | % |
DWS High Income VIP | | 0.60 | % |
DWS International Select Equity VIP | | 0.75 | % |
DWS Large Cap Value VIP | | 0.75 | % |
DWS Strategic Income VIP | | 0.65 | % |
DWS Dreman Small Cap Value VIP | | 0.75 | % |
For the period from January 1, 2005, through September 30, 2005, the Advisor agreed to limit its fees and reimburse expenses of each class of the DWS Strategic Income VIP to the extent necessary to maintain the annual expenses of Class A at 1.05% and Class B at 1.30%. Effective October 1, 2005 through September 30, 2006, the Advisor agreed to limit its fees and reimburse expenses of DWS Strategic Income VIP to the extent necessary to maintain the annual expenses of Class B at 1.199% (excluding certain expenses such as extraordinary expenses, taxes, brokerage, interest and fund accounting outsourcing fee savings).
In addition, for the year ended December 31, 2005, the Advisor waived $5,796 of record keeping fees for Class B shares of the DWS Strategic Income VIP.
For the year ended December 31, 2005, the Advisor agreed to limit its fees and reimburse expenses of each class of DWS Large Cap Value VIP to the extent necessary to maintain annual expenses of Class A at 0.80% and Class B at 1.20%. For the year ended December 31, 2005, the Advisor waived $12,690 of management fee and the fee pursuant to the Management Agreement was equivalent to an annual effective rate of 0.75% of the portfolio’s average daily net assets.
In addition, for the year ended December 31, 2005, the Advisor waived $536 of record keeping fees for Class B shares of the DWS Large Cap Value VIP.
For the period from January 1, 2005 through May 1, 2005, the DWS Small Cap Growth VIP paid a monthly investment management fee of 0.65%, based on the average daily net assets of the portfolio.
370
Effective May 2, 2005, the DWS Small Cap Growth VIP pays a monthly investment management fee, based on the average daily net assets of the portfolio, computed and accrued daily and payable monthly, of 1/12 of the annual rates shown below:
| | | |
Average Daily Net Assets of the Portfolio | | Annual Management Fee Rate | |
$0-$250 million | | 0.650 | % |
next $750 million | | 0.625 | % |
over $1 billion | | 0.600 | % |
Effective May 2, 2005 through April 30, 2008, the Advisor agreed to limit its fees and reimburse expenses of DWS Small Cap Growth VIP to the extent necessary to maintain the annual expense of Class A at 0.72% and Class B at 1.09% (excluding certain expenses such as extraordinary expenses, taxes, brokerage, interest and fund accounting outsourcing fee savings). The fee pursuant to the Management Agreement was equivalent to the annual effective rate of 0.65% of the portfolio’s average daily net assets.
For the year ended December 31, 2005, the Advisor waived $9,538 of record keeping fees for Class B shares of the DWS Small Cap Growth VIP.
For the period from January 1, 2005 through May 1, 2005, the DWS Balanced VIP paid a monthly investment management fee of 0.55%, based on the average daily net assets of the portfolio.
Effective May 2, 2005, the DWS Balanced VIP pays a monthly investment management fee, based on the average daily net assets of the portfolio, computed and accrued daily and payable monthly, of 1/12 of the annual rates shown below:
| | | |
Average Daily Net Assets of the Portfolio | | Annual Management Fee Rate | |
$0-$250 million | | 0.470 | % |
next $750 million | | 0.445 | % |
over $1 billion | | 0.410 | % |
Effective May 2, 2005 through April 30, 2008, the Advisor agreed to limit its fees and reimburse expenses of DWS Balanced VIP to the extent necessary to maintain the annual expenses of Class A at 0.51% and Class B at 0.89% (excluding certain expenses such as extraordinary expenses, taxes, brokerage, interest and fund accounting outsourcing fee savings). Accordingly, for the year ended December 31, 2005, the Advisor waived $99,176 of management fee and the fee pursuant to the Management Agreement was equivalent to an annual effective rate of 0.47% of the portfolio’s average daily net assets.
In addition, for the year ended December 31, 2005, the Advisor waived $8,199 of record keeping fees for Class B shares of the DWS Balanced VIP.
The DWS Money Market VIP pays a monthly investment management fee, based on the average daily net assets of the portfolio, computed and accrued daily and payable monthly, of 1/12 of the annual rates shown below:
| | | |
Average Daily Net Assets of the Portfolio | | Annual Management Fee Rate | |
$0-$215 million | | 0.500 | % |
next $335 million | | 0.375 | % |
next $250 million | | 0.300 | % |
over $800 million | | 0.250 | % |
Accordingly, for the year ended December 31, 2005, the fee pursuant to the Management Agreement was equivalent to the annual effective rate of 0.46% of the DWS Money Market VIP’s average daily net assets.
The DWS Mid Cap Growth VIP, DWS Technology VIP, DWS Dreman Financial Services VIP and DWS Dreman High Return Equity VIP each pay a monthly investment management fee, based on the average daily net assets of each portfolio, computed and accrued daily and payable monthly, of 1/12 of the annual rates shown below:
| | | |
Average Daily Net Assets of the Portfolio | | Annual Management Fee Rate | |
$0-$250 million | | 0.75 | % |
next $750 million | | 0.72 | % |
next $1.5 billion | | 0.70 | % |
next $2.5 billion | | 0.68 | % |
next $2.5 billion | | 0.65 | % |
next $2.5 billion | | 0.64 | % |
next $2.5 billion | | 0.63 | % |
over $12.5 billion | | 0.62 | % |
371
For the period from January 1, 2005 through September 30, 2005, the Advisor agreed to limit its fees and reimburse expenses of each class of the DWS Mid Cap Growth VIP to the extent necessary to maintain the annual expenses of Class A at 0.95% and Class B at 1.35%. Effective October 1, 2005 through September 30, 2006, the Advisor agreed to limit its fees and reimburse expenses of DWS Mid Cap Growth VIP to the extent necessary to maintain the annual expenses of Class B at 1.308% (excluding certain expenses such as extraordinary expenses, taxes, brokerage, interest and fund accounting outsourcing fee savings). Accordingly, for the year ended December 31, 2005, the Advisor waived $32,030 of management fee and the fee pursuant to the Management Agreement was equivalent to an annual effective rate of 0.70% of the portfolio’s average daily net assets.
In addition, for the year ended December 31, 2005, the Advisor waived $2,113 of record keeping fees for Class B shares of the DWS Mid Cap Growth VIP.
Accordingly, for the year ended December 31, 2005, the fees pursuant to the Management Agreement were equivalent to the annual effective rates shown below of each portfolios’ average daily net assets:
| | | |
Portfolio | | Effective Rate | |
DWS Dreman Financial Services VIP | | 0.75 | % |
DWS Dreman High Return Equity VIP | | 0.73 | % |
DWS Mid Cap Growth VIP | | 0.70 | % |
DWS Technology VIP | | 0.75 | % |
DWS Salomon Aggressive Growth VIP and DWS Turner Mid Cap Growth VIP each paid a monthly investment management fee, based on the average daily net assets of each portfolio, computed and accrued daily and payable monthly, of 1/12 of the annual rates shown below:
| | | |
Average Daily Net Assets of the Portfolio | | Annual Management Fee Rate | |
$0-$250 million | | 1.000 | % |
next $250 million | | 0.975 | % |
next $500 million | | 0.950 | % |
next $1.5 billion | | 0.925 | % |
over $2.5 billion | | 0.900 | % |
Effective August 1, 2005, the DWS Salomon Aggressive Growth VIP pays a monthly investment management fee, based on average daily net assets of the portfolio, computed and accrued daily and payable monthly, of 1/12 of the annual rates shown below:
| | | |
Average Daily Net Assets of the Portfolio | | Annual Management Fee Rate | |
$0-$250 million | | 0.800 | % |
next $500 million | | 0.775 | % |
next $750 million | | 0.750 | % |
next $1.5 billion | | 0.725 | % |
Effective October 1, 2005, the DWS Turner Mid Cap Growth VIP pays a monthly investment management fee, based on average daily net assets of the portfolio, computed and accrued daily and payable monthly, of 1/12 of the annual rates shown below:
| | | |
Average Daily Net Assets of the Portfolio | | Annual Management Fee Rate | |
$0-$250 million | | 0.800 | % |
next $200 million | | 0.785 | % |
next $500 million | | 0.770 | % |
over $1 billion | | 0.755 | % |
372
For the period from January 1, 2005 to July 31, 2005, the Advisor agreed to limit its fees and reimburse expenses of each class of the DWS Salomon Aggressive Growth VIP to the extent necessary to maintain the annual expenses of Class A at 1.30% and Class B at 1.70%. Effective August 1, 2005 through September 30, 2005, the Advisor agreed to limit its fees and reimburse expenses of the DWS Salomon Aggressive Growth VIP to the extent necessary to maintain annual expenses of Class A at 1.10% and Class B at 1.50%. Effective October 1, 2005 through September 30, 2006, the Advisor agreed to limit its fees and reimburse expenses of the DWS Salomon Aggressive Growth VIP to the extent necessary to maintain the annual expense of Class A at 0.908% and Class B at 1.308% (excluding certain expenses such as extraordinary expenses, taxes, brokerage, interest and fund accounting outsourcing fee savings). Accordingly, for the year ended December 31, 2005, the Advisor waived $119,238 of management fees. Effective August 1, 2005, the Advisor was changed from Invesco/AIM to Salomon Brothers Asset Management and the name was changed to DWS Salomon Aggressive Growth VIP.
In addition, for the period from January 1, 2005 through September 30, 2005, the Advisor agreed to limit its fees and reimburse expenses of each class of the DWS Turner Mid Cap Growth VIP to the extent necessary to maintain the annual expenses of Class A at 1.30% and Class B at 1.70%. Effective October 1, 2005 through September 30, 2006, the Advisor agreed to limit its fees and reimburse expenses of the DWS Turner Mid Cap Growth VIP to the extent necessary to maintain the annual expense of Class B at 1.337% (excluding certain expenses such as extraordinary expenses, taxes, brokerage, interest and fund accounting fee savings).
For the year ended December 31, 2005, the Advisor waived $6,545 of record keeping fees for Class B shares of the DWS Turner Mid Cap Growth VIP.
Accordingly, for the year ended December 31, 2005, the fees pursuant to the Management Agreement were equivalent to the annual effective rates of 0.63% and 0.95% of the portfolios’ average daily net assets of the DWS Salomon Aggressive Growth VIP and DWS Turner Mid Cap Growth VIP, respectively.
DWS Davis Venture Value VIP, DWS Janus Growth & Income VIP, DWS Janus Growth Opportunities VIP and DWS Oak Strategic Equity VIP each paid a monthly investment management fee, based on the average daily net assets of each portfolio, computed and accrued daily and payable monthly, of 1/12 of the annual rates shown below:
| | | |
Average Daily Net Assets of the Portfolio | | Annual Management Fee Rate | |
$0-$250 million | | 0.950 | % |
next $250 million | | 0.925 | % |
next $500 million | | 0.900 | % |
next $1.5 billion | | 0.875 | % |
over $2.5 billion | | 0.850 | % |
Effective May 1, 2005, the DWS Janus Growth & Income VIP and DWS Janus Growth Opportunities VIP each pay a monthly investment management fee based on the average daily net assets of each portfolio, computed and accrued daily and payable monthly, of 1/12 of the annual rates shown below:
| | | |
Average Daily Net Assets of the Portfolio | | Annual Management Fee Rate | |
$0-$250 million | | 0.750 | % |
next $750 million | | 0.725 | % |
next $1.5 billion | | 0.700 | % |
over $2.5 billion | | 0.675 | % |
Accordingly, for the year ended December 31, 2005, the fees pursuant to the Management Agreement were equivalent to the annual effective rates shown below of the portfolios’ average daily net assets:
| | | |
Portfolio | | Effective Rate | |
DWS Janus Growth & Income VIP | | 0.81 | % |
DWS Janus Growth Opportunities VIP | | 0.81 | % |
373
For the period from January 1, 2005 through September 30, 2005, the Advisor agreed to limit the fees and reimburse each class of the DWS Janus Growth & Income VIP to the extent necessary to maintain annual operating expenses of Class A at 1.15% and Class B at 1.55%. Effective May 2, 2005, through April 30, 2006, the Advisor agreed to limit the fees and reimburse expenses of the DWS Janus Growth & Income VIP to the extent necessary to maintain annual operating expenses of Class A at 0.95%. Effective May 2, 2005, through September 30, 2005, the Advisor agreed to limit the fees and reimburse expenses of the DWS Janus Growth & Income VIP to the extent necessary to maintain annual operating expenses of Class B at 1.35%. Effective October 1, 2005, through September 30, 2006, the Advisor agreed to limit the fees and reimburse expenses of the DWS Janus Growth & Income VIP to the extent necessary to maintain annual expenses of Class B at 1.253% (excluding certain expenses such as extraordinary expense, taxes, brokerage, interest and fund accounting outsourcing fee savings). Accordingly, for the year ended December 31, 2005, the Advisor waived $6,113 of record keeping fees for Class B shares of the portfolio.
For the period from January 1, 2005 through September 30, 2005, the Advisor agreed to limit its fees and reimburse expenses of each class of the DWS Davis Venture Value VIP to the extent necessary to maintain the annual expenses of Class A at 1.15% and Class B at 1.55%. Effective October 1, 2005 through September 30, 2006, the Advisor agreed to limit its fees and reimburse expenses of DWS Davis Venture Value VIP to the extent necessary to maintain the annual expenses of Class A at 0.853% and Class B at 1.253% (excluding certain expenses such as extraordinary expenses, taxes, brokerage, interest and fund accounting outsourcing fee savings). Accordingly, for the year ended December 31, 2005, the Advisor waived $187,410 of management fees.
In addition, for the year ended December 31, 2005, the Advisor waived $7,238 of record keeping fees for Class B shares of the DWS Davis Venture Value VIP.
For the period from January 1, 2005 through September 30, 2005, the Advisor agreed to limit its fees and reimburse expenses of each class of the DWS Oak Strategic Equity VIP to the extent necessary to maintain the annual expenses of Class A at 1.15% and Class B at 1.55%. Effective October 1, 2005 through September 30, 2006, the Advisor agreed to limit its fees and reimburse expenses of DWS Oak Strategic Equity VIP to the extent necessary to maintain the annual expenses of Class B at 1.301% (excluding certain expenses such as extraordinary expenses, taxes, brokerage, interest and fund accounting outsourcing fee savings).
For the year ended December 31, 2005, the Advisor waived $7,449 of record keeping fees for Class B shares of the DWS Oak Strategic Equity VIP.
Effective October 1, 2005, the DWS Oak Strategic Equity VIP pays a monthly investment management fee, based on average daily net assets of the portfolio, computed and accrued daily and payable monthly, of 1/12 of the annual rates shown below:
| | | |
Average Daily Net Assets of the Portfolio | | Annual
Management
Fee Rate | |
$0-$250 million | | 0.750 | % |
next $200 million | | 0.735 | % |
next $500 million | | 0.720 | % |
over $1 billion | | 0.705 | % |
Accordingly, for the year ended December 31, 2005, the fees pursuant to the Management Agreement were equivalent to the annual effective rates shown below of the portfolios’ average daily net assets:
| | | |
Portfolio | | Effective Rate | |
DWS Davis Venture Value VIP | | 0.89 | % |
DWS Oak Strategic Equity VIP | | 0.90 | % |
The DWS Global Thematic VIP pays a monthly investment management fee, based on the average daily net assets of the portfolio, computed and accrued daily and payable monthly, of 1/12 of the annual rates shown below:
| | | |
Average Daily Net Assets of the Portfolio | | Annual
Management
Fee Rate | |
$0-$250 million | | 1.00 | % |
next $500 million | | 0.95 | % |
next $750 million | | 0.90 | % |
next $1.5 billion | | 0.85 | % |
over $3 billion | | 0.80 | % |
For the period from January 1, 2005 through September 30, 2005, the Advisor agreed to limit its fees and reimburse expenses of each class of the DWS Global Thematic VIP to the extent necessary to maintain the annual expenses of Class A at 1.56% and Class B at 1.96%. Effective October 1, 2005 through September 30, 2006, the Advisor agreed to limit its fees and reimburse expenses of DWS Global Thematic VIP to the extent necessary to maintain the annual expenses of Class A at 1.04% and Class B at 1.44% (excluding certain expenses such as extraordinary expenses, taxes, brokerage, interest and fund accounting outsourcing fee savings). Accordingly, for the year ended December 31, 2005, the Advisor waived $112,367 of management fees and the fee pursuant to the Management Agreement was equivalent to an annual effective rate of 0.87% of the portfolio’s average daily net assets.
In addition, for the year ended December 31, 2005, the Advisor waived $1,700 of record keeping fees for Class B shares of the DWS Global Thematic VIP.
374
The DWS MFS Strategic Value VIP pays a monthly investment management fee, based on the average daily net assets of the portfolio, computed and accrued daily and payable monthly, of 1/12 of the annual rates shown below:
| | | |
Average Daily Net Assets of the Portfolio | | Annual Management Fee Rate | |
$0-$250 million | | 0.950 | % |
next $250 million | | 0.925 | % |
next $500 million | | 0.900 | % |
next $500 million | | 0.825 | % |
next $1 billion | | 0.800 | % |
over $2.5 billion | | 0.775 | % |
For the period from January 1, 2005, through September 30, 3005, the Advisor agreed to limit its fees and reimburse expenses of each class of the DWS MFS Strategic Value VIP to the extent necessary to maintain the annual expenses of Class A at 1.15% and Class B at 1.55%. Effective October 1, 2005 through September 30, 2006, the Advisor agreed to limit it fees and reimburse expenses of the DWS MFS Strategic Value VIP to the extent necessary to maintain the annual operating expense of Class A at 0.86% and Class B at 1.26%. (excluding certain expenses such as extraordinary expenses, taxes, brokerage, interest and fund accounting outsourcing fee savings). Accordingly, for year ended December 31, 2005, the Advisor waived $98,710 of management fee and the fee pursuant to the Management Agreement was equivalent to an annual effective rate of 0.75% of the portfolio’s average daily net assets.
The DWS Mercury Large Cap Core VIP pays a monthly investment management fee based on the average daily net assets of the portfolio, computed and accrued daily and payable monthly, of 1/12 of the annual rates shown below:
| | | |
Average Daily Net Assets of the Portfolio | | Annual Management Fee Rate | |
$0-$250 million | | 0.900 | % |
next $250 million | | 0.850 | % |
next $500 million | | 0.800 | % |
next $1 billion | | 0.750 | % |
next $500 million | | 0.700 | % |
over $2.5 billion | | 0.650 | % |
For the period from January 1, 2005 through September 30, 2005, the Advisor agreed to limit its fees and reimburse expenses of each class of the DWS Mercury Large Cap Core VIP to the extent necessary to maintain the annual expenses of Class A at 1.00% and Class B at 1.20%. Effective October 1, 2005 through September 30, 2006, the Advisor agreed to limit its fees and reimburse expenses of DWS Mercury Large Cap Core VIP to the extent necessary to maintain the annual expenses of Class A at 0.873% and Class B at 1.20% (excluding certain expenses such as extraordinary expenses, taxes, brokerage, interest and fund accounting outsourcing fee savings). Accordingly, for the year ended December 31, 2005, the Advisor waived $26,156 of management fee and the fee pursuant to the Management Agreement was equivalent to an annual effective rate of 0.00% of the portfolio’s average daily net assets.
In addition, for the year ended December 31, 2005, the Advisor waived $1,954 of record keeping fees for Class B shares of the portfolio and $40,416 of other expenses.
The DWS Templeton Foreign Value VIP pays a monthly investment management fee based on the average daily net assets of the portfolio, computed and accrued daily and payable monthly, of 1/12 of the annual rates shown below:
| | | |
Average Daily Net Assets of the Portfolio | | Annual Management Fee Rate | |
$0-$250 million | | 0.950 | % |
next $250 million | | 0.900 | % |
next $500 million | | 0.850 | % |
next $500 million | | 0.800 | % |
next $1 billion | | 0.750 | % |
over $2.5 billion | | 0.700 | % |
375
For the year ended December 31, 2005, the Advisor agreed to limit its fees and reimburse expenses of each class of the DWS Templeton Foreign Value VIP to the extent necessary to maintain the annual expenses of Class A at 1.14% and Class B at 1.34% (excluding certain expenses such as extraordinary expenses, taxes, brokerage, interest and fund accounting outsourcing fee savings). For the year ended December 31, 2005, the Advisor waived $112,526 of management fees. Accordingly, for the year ended December 31, 2005, the fee pursuant to the Management Agreement was equivalent to an annual effective rate of 0.00% of DWS Templeton Foreign Value VIP’s average daily net assets.
In addition, for the year ended December 31, 2005, the Advisor waived $1,741 of record keeping fees for Class B shares of the DWS Templeton Foreign Value VIP.
The DWS Income Allocation VIP, DWS Moderate Allocation VIP, DWS Growth Allocation VIP and DWS Conservative Allocation VIP pay a monthly investment management fee based on the average daily net assets of each portfolio, computed and accrued daily and payable monthly, of 1/12 of the annual rates shown below:
| | | |
Average Daily Net Assets of the Portfolio | | Annual Management Fee Rate | |
$0-$500 million | | 0.150 | % |
next $500 million | | 0.140 | % |
next $500 million | | 0.130 | % |
next $1 billion | | 0.120 | % |
over $2.5 billion | | 0.110 | % |
The Advisor has agreed to waive 0.05% of average daily net assets of the portfolio against the monthly investment management fee of Class B of the DWS Income Allocation VIP, DWS Moderate Allocation VIP, DWS Growth Allocation VIP and DWS Conservative Allocation VIP. For the year ended December 31, 2005, the Advisor waived $4,372, $49,685, $55,420 and $14,339 of management fees for the DWS Income Allocation VIP, DWS Moderate Allocation VIP, DWS Growth Allocation VIP and DWS Conservative Allocation VIP, respectively.
In addition, for the year ended December 31, 2005, the Advisor waived $8,744 of management fees for the DWS Income Allocation VIP.
Through April 30, 2006, the Advisor, underwriter and accounting agent have each contractually agreed to waive their respective fees and reimburse expenses of Class B of the DWS Income Allocation VIP, DWS Moderate Allocation VIP, DWS Growth Allocation VIP and DWS Conservative Allocation VIP to the extent necessary to maintain each portfolio’s direct operating expenses at 0.75% of average daily net assets (excluding certain expenses such as extraordinary expenses, taxes, brokerage and interest). For the year ended December 31, 2005, the Advisor waived $11,265 and $39,927 of record keeping fees for the DWS Income Allocation VIP and DWS Conservative Allocation VIP, respectively.
Accordingly, for the year ended December 31, 2005, the fee pursuant to the Management Agreement was equivalent to an annual effective rate of 0.00%, 0.10%, 0.10% and 0.10%, of DWS Income Allocation VIP’s, DWS Moderate Allocation VIP’s, DWS Growth Allocation VIP’s and DWS Conservative Allocation VIP’s average daily net assets, respectively.
DWS Income Allocation VIP, DWS Moderate Allocation VIP, DWS Growth Allocation VIP and DWS Conservative Allocation VIP do not invest in the Underlying Portfolios for the purpose of exercising management or control; however, investments within the set limits may represent a significant portion of an Underlying Portfolio. At December 31, 2005, the DWS portfolios held the following percentage of the Underlying Portfolios’ outstanding shares as follows:
| | | |
Portfolio | | DWS Core Fixed Income VIP | |
DWS Conservative Allocation VIP | | 5 | % |
DWS Growth Allocation VIP | | 7 | % |
DWS Moderate Allocation VIP | | 12 | % |
| |
Portfolio | | DWS Blue Chip VIP | |
DWS Growth Allocation VIP | | 5 | % |
| |
Portfolio | | DWS Janus Growth Opportunities VIP | |
DWS Growth Allocation VIP | | 7 | % |
DWS Moderate Allocation VIP | | 5 | % |
| |
Portfolio | | DWS Templeton Foreign Value VIP | |
DWS Growth Allocation VIP | | 30 | % |
DWS Moderate Allocation VIP | | 16 | % |
| |
Portfolio | | Scudder RREEF Real Estate
Securities VIP | |
DWS Growth Allocation VIP | | 12 | % |
DWS Moderate Allocation VIP | | 8 | % |
| |
Portfolio | | DWS MFS Strategic
Value VIP | |
DWS Growth Allocation VIP | | 17 | % |
DWS Moderate Allocation VIP | | 11 | % |
| |
Portfolio | | DWS Growth & Income VIP | |
DWS Growth Allocation VIP | | 9 | % |
DWS Moderate Allocation VIP | | 5 | % |
| |
Portfolio | | DWS Large Cap Value VIP | |
DWS Growth Allocation VIP | | 6 | % |
DWS Moderate Allocation VIP | | 5 | % |
376
On December 1, 2005, Aberdeen Asset Management PLC (“Aberdeen PLC”) acquired from Deutsche Bank AG, the parent company of the Advisor, parts of its asset management business and related assets based in London and Philadelphia. As of December 2, 2005, and pursuant to a written contract with the Advisor (the “Sub-Advisory Agreement”), Aberdeen PLC serves as subadvisor to DWS Core Fixed Income VIP. Aberdeen PLC is paid by the Advisor for its services. Please see Note L for details regarding the change in subadvisor prior to period end.
Prior to September 30, 2005, Deutsche Asset Management Investment Services Limited (“DeAMIS”) served as sub-advisor to the DWS International Select Equity, DWS Strategic Income and DWS Balanced VIPs and was paid by the Advisor for its services.
Dreman Value Management, L.L.C. serves as sub-advisor to the DWS Dreman Financial Services, DWS Dreman High Return Equity and DWS Dreman Small Cap Value VIPs and is paid by the Advisor for its services.
INVESCO Institutional (N.A.) Inc. served as sub-advisor to the DWS Salomon Aggressive Growth VIP and was paid by the Advisor for its services. Effective August 1, 2005, Salomon Brothers Asset Management Inc. became the sub-advisor to the portfolio and the portfolio’s name was changed to DWS Salomon Aggressive Growth VIP.
Janus Capital Management, L.L.C., formerly Janus Capital Corporation, serves as sub-advisor to the DWS Janus Growth & Income and DWS Janus Growth Opportunities VIPs and is paid by the Advisor for its services.
Turner Investment Partners, Inc. serves as sub-advisor to the DWS Turner Mid Cap Growth VIP and is paid by the Advisor for its services.
Oak Associates, Ltd. serves as sub-advisor to the DWS Oak Strategic Equity VIP and is paid by the Advisor for its services.
Davis Selected Advisers, L.P., serves as sub-advisor to the DWS Davis Venture Value VIP and is paid by the Advisor for its services.
Massachusetts Financial Services Company (“MFS”) serves as sub-advisor to the DWS MFS Strategic Value VIP and is paid by the Advisor for its services.
Fund Asset Management, L.P., a division of Merrill Lynch Investment Managers (“MLIM”), serves as sub-advisor to the DWS Mercury Large Cap Core VIP and is paid by the Advisor for its services.
Templeton Investment Counsel L.L.C. serves as sub-advisor to the DWS Templeton Foreign Value VIP and is paid by the Advisor for its services.
Service Provider Fees. DWS Scudder Fund Accounting Corporation (“DWS-SFAC”), a subsidiary of the Advisor, is responsible for determining the daily net asset value per share and maintaining the portfolio and general accounting records of each portfolio. In turn, DWS-SFAC has delegated certain fund accounting functions to a third-party service provider. For the year ended December 31, 2005, DWS-SFAC received the following fee for its services for the following portfolios:
| | | | | | |
Portfolio | | Total Aggregated | | Waived ($) | | Unpaid at December 31, 2005 ($) |
DWS Conservative Allocation VIP | | 61,714 | | — | | 3,100 |
DWS Davis Venture Value VIP | | 85,936 | | — | | 7,908 |
DWS Dreman Financial Services VIP | | 80,307 | | — | | 11,078 |
DWS Dreman High Return Equity VIP | | 131,840 | | — | | 11,543 |
DWS Global Thematic VIP | | 111,026 | | — | | 8,428 |
DWS Growth Allocation VIP | | 62,705 | | — | | 5,249 |
DWS Income Allocation VIP | | 45,388 | | 22,002 | | 10,727 |
DWS Janus Growth & Income VIP | | 70,775 | | — | | 6,829 |
DWS Janus Growth Opportunities VIP | | 58,944 | | — | | 5,787 |
DWS Mercury Large Cap Core VIP | | 99,304 | | 99,304 | | — |
DWS MFS Strategic Value VIP | | 72,872 | | — | | 5,858 |
DWS Mid Cap Growth VIP | | 62,902 | | — | | 5,623 |
DWS Moderate Allocation VIP | | 73,338 | | — | | 4,148 |
DWS Oak Strategic Equity VIP | | 53,346 | | — | | 4,520 |
DWS Salomon Aggressive Growth VIP | | 79,855 | | — | | 3,120 |
DWS Technology VIP | | 78,641 | | — | | 6,461 |
DWS Templeton Foreign Value VIP | | 102,741 | | 92,526 | | — |
DWS Turner Mid Cap Growth VIP | | 94,542 | | — | | 9,447 |
377
Distribution Service Agreement. Under the Distribution Service Agreement, in accordance with Rule 12b-1 under the 1940 Act, DWS Scudder Investments Service Company (“DWS-SISC”) receives a fee (“Distribution Service Fee”) of 0.25% of average daily net assets of Class B shares. For the year ended December 31, 2005, the Distribution Service Fee was as follows:
| | | | | | |
Portfolio | | Total Aggregated | | Waived ($) | | Unpaid at December 31, 2005 ($) |
DWS Balanced VIP | | 82,992 | | — | | 7,009 |
DWS Blue Chip VIP | | 101,201 | | — | | 9,106 |
DWS Conservative Allocation VIP | | 71,696 | | — | | 5,437 |
DWS Core Fixed Income VIP | | 220,712 | | — | | 16,924 |
DWS Davis Venture Value VIP | | 177,310 | | — | | 16,146 |
DWS Dreman Financial Services VIP | | 42,361 | | — | | 3,703 |
DWS Dreman High Return Equity VIP | | 312,165 | | — | | 27,861 |
DWS Dreman Small Cap Value VIP | | 189,045 | | — | | 16,717 |
DWS Global Thematic VIP | | 38,339 | | — | | 3,983 |
DWS Government & Agency Securities VIP | | 120,593 | | — | | 9,901 |
DWS Growth Allocation VIP | | 277,101 | | — | | 40,041 |
DWS High Income VIP | | 139,382 | | — | | 11,558 |
DWS Income Allocation VIP | | 21,861 | | 21,861 | | — |
DWS International Select Equity VIP | | 133,737 | | — | | 12,631 |
DWS Janus Growth & Income VIP | | 70,642 | | — | | 6,642 |
DWS Janus Growth Opportunities VIP | | 22,312 | | — | | 2,143 |
DWS Large Cap Value VIP | | 100,801 | | — | | 8,454 |
DWS Mercury Large Cap Core VIP | | 5,900 | | 579 | | — |
DWS Mid Cap Growth VIP | | 15,682 | | — | | 1,509 |
DWS MFS Strategic Value VIP | | 82,714 | | — | | 3,791 |
DWS Moderate Allocation VIP | | 248,426 | | — | | 33,738 |
DWS Money Market VIP | | 140,673 | | — | | 13,454 |
DWS Oak Strategic Equity VIP | | 50,458 | | — | | 4,285 |
DWS Salomon Aggressive Growth VIP | | 18,686 | | — | | 1,948 |
DWS Small Cap Growth VIP | | 85,045 | | — | | 8,149 |
DWS Strategic Income VIP | | 58,999 | | 2,527 | | 3,902 |
DWS Technology VIP | | 37,898 | | — | | 3,494 |
DWS Templeton Foreign Value VIP | | 11,702 | | 2,484 | | — |
DWS Turner Mid Cap Growth VIP | | 60,306 | | — | | 5,613 |
Typesetting and Filing Service Fees. Under an agreement with DeIM, DeIM is compensated for providing typesetting and regulatory filing services to the portfolios. For the year ended December 31, 2005, the amounts charged to the portfolios by DeIM included in reports to shareholders were as follows:
| | | | |
Portfolio | | Total Aggregated | | Unpaid at December 31, 2005 ($) |
DWS Balanced VIP | | 3,789 | | 1,216 |
DWS Blue Chip VIP | | 3,789 | | 1,216 |
DWS Conservative Allocation VIP | | 3,392 | | 1,216 |
DWS Core Fixed Income VIP | | 3,789 | | 1,216 |
DWS Davis Venture Value VIP | | 3,789 | | 1,216 |
DWS Dreman Financial Services VIP | | 3,789 | | 1,216 |
DWS Dreman High Return Equity VIP | | 3,789 | | 1,216 |
DWS Dreman Small Cap Value VIP | | 3,789 | | 1,216 |
DWS Global Thematic VIP | | 3,789 | | 1,216 |
DWS Government & Agency Securities VIP | | 3,789 | | 1,216 |
DWS Growth Allocation VIP | | 3,392 | | 1,216 |
DWS High Income VIP | | 3,789 | | 1,216 |
DWS Income Allocation VIP | | 3,392 | | 1,216 |
DWS International Select Equity VIP | | 3,789 | | 1,216 |
DWS Janus Growth & Income VIP | | 3,789 | | 1,216 |
DWS Janus Growth Opportunities VIP | | 3,789 | | 1,216 |
DWS Large Cap Value VIP | | 3,789 | | 1,216 |
DWS Mercury Large Cap Core VIP | | 3,789 | | 1,216 |
DWS MFS Strategic Value VIP | | 3,789 | | 1,216 |
DWS Mid Cap Growth VIP | | 3,789 | | 1,216 |
DWS Moderate Allocation VIP | | 3,392 | | 1,216 |
DWS Money Market VIP | | 3,789 | | 1,216 |
DWS Oak Strategic Equity VIP | | 3,789 | | 1,216 |
DWS Salomon Aggressive Growth VIP | | 3,789 | | 1,216 |
DWS Small Cap Growth VIP | | 3,789 | | 1,216 |
DWS Strategic Income VIP | | 3,789 | | 1,216 |
DWS Technology VIP | | 3,789 | | 1,216 |
DWS Templeton Foreign Value VIP | | 3,789 | | 1,216 |
DWS Turner Mid Cap Growth VIP | | 3,789 | | 1,216 |
378
Trustees’ Fees and Expenses. The portfolios paid each Trustee not affiliated with the Advisor retainer fees plus specified amounts for attended board and committee meetings.
Cash Management QP Trust. Pursuant to an Exemptive Order issued by the SEC, the portfolios may invest in the Cash Management QP Trust (the “QP Trust”) and other affiliated funds managed by the Advisor. The QP Trust seeks to provide as high a level of current income as is consistent with the preservation of capital and the maintenance of liquidity. The QP Trust does not pay the Advisor a management fee for the affiliated funds’ investments in the QP Trust.
D. Investing in High Yield Securities
Investing in high yield securities may involve greater risks and considerations not typically associated with investing in US Government bonds and other high quality fixed-income securities. These securities are non-investment grade securities, often referred to as “junk bonds.” Economic downturns may disrupt the high yield market and impair the ability of issuers to repay principal and interest. Also, an increase in interest rates would likely have an adverse impact on the value of such obligations. Moreover, high yield securities may be less liquid due to the extent that there is no established retail secondary market and because of a decline in the value of such securities.
E. Investing in Emerging Markets
Investing in emerging markets may involve special risks and considerations not typically associated with investing in the United States of America. These risks include revaluation of currencies, high rates of inflation, repatriation restrictions on income and capital, and future adverse political, social and economic developments. Moreover, securities issued in these markets may be less liquid, subject to government ownership controls, delayed settlements and their prices more volatile than those of comparable securities in the United States of America.
F. Expense Reductions
For the year ended December 31, 2005, the Advisor agreed to reimburse the portfolios which represents a portion of the fee savings expected to be realized by the Advisor related to the outsourcing by the Advisor of certain administrative services to an unaffiliated service provider in the following amounts:
| | |
Portfolio | | Amount ($) |
DWS Balanced VIP | | 8,766 |
DWS Blue Chip VIP | | 4,709 |
DWS Core Fixed Income VIP | | 4,410 |
DWS Davis Venture Value VIP | | 4,934 |
DWS Dreman Financial Services VIP | | 2,678 |
DWS Dreman High Return Equity VIP | | 10,685 |
DWS Dreman Small Cap Value VIP | | 7,225 |
DWS Global Thematic VIP | | 2,066 |
DWS Government & Agency Securities VIP | | 4,406 |
DWS High Income VIP | | 5,625 |
DWS International Select Equity VIP | | 3,755 |
DWS Janus Growth & Income VIP | | 3,379 |
DWS Janus Growth Opportunities VIP | | 2,785 |
DWS Large Cap Value VIP | | 4,434 |
DWS MFS Strategic Value VIP | | 1,733 |
DWS Mid Cap Growth VIP | | 1,850 |
DWS Money Market VIP | | 4,524 |
DWS Oak Strategic Equity VIP | | 2,030 |
DWS Salomon Aggressive Growth VIP | | 1,653 |
DWS Small Cap Growth VIP | | 4,200 |
DWS Strategic Income VIP | | 2,160 |
DWS Technology VIP | | 3,446 |
DWS Turner Mid Cap Growth VIP | | 2,620 |
379
In addition, the portfolios have entered into arrangements with their custodian whereby credits realized as a result of uninvested cash balances were used to reduce a portion of the portfolios’ expenses. During the year ended December 31, 2005, the portfolios’ custodian fees were reduced under these arrangements as follows:
| | |
Portfolio | | Amount ($) |
DWS Balanced VIP | | 1,752 |
DWS Blue Chip VIP | | 152 |
DWS Core Fixed Income VIP | | 1,495 |
DWS Davis Venture Value VIP | | 50 |
DWS Dreman Financial Services VIP | | 34 |
DWS Dreman High Return Equity VIP | | 222 |
DWS Dreman Small Cap Value VIP | | 1,529 |
DWS Government & Agency Securities VIP | | 365 |
DWS High Income VIP | | 5,390 |
DWS Janus Growth & Income VIP | | 554 |
DWS Janus Growth Opportunities VIP | | 73 |
DWS Large Cap Value VIP | | 81 |
DWS Mercury Large Cap Core VIP | | 38 |
DWS MFS Strategic Value VIP | | 39 |
DWS Mid Cap Growth VIP | | 47 |
DWS Money Market VIP | | 559 |
DWS Oak Strategic Equity VIP | | 73 |
DWS Salomon Aggressive Growth VIP | | 140 |
DWS Small Cap Growth VIP | | 720 |
DWS Strategic Income VIP | | 1,145 |
DWS Technology VIP | | 250 |
DWS Turner Mid Cap Growth VIP | | 114 |
G. Forward Foreign Currency Exchange Contracts
As of December 31, 2005, the following portfolios had entered into the following forward foreign currency exchange contracts resulting in the following:
DWS Balanced VIP
| | | | | | | | | | |
| Contracts to Deliver | | In Exchange For | | Settlement Date | | Unrealized
Appreciation (US$) |
| USD | | 4,652,627 | | CAD | | 5,468,000 | | 1/27/2006 | | 55,095 |
| USD | | 192,550 | | CAD | | 228,000 | | 1/27/2006 | | 3,748 |
| CHF | | 4,000 | | USD | | 3,108 | | 1/27/2006 | | 55 |
| CHF | | 3,347,000 | | USD | | 2,631,662 | | 1/27/2006 | | 77,314 |
| CHF | | 126,000 | | USD | | 96,272 | | 1/27/2006 | | 112 |
| EUR | | 1,016,000 | | USD | | 1,220,617 | | 1/27/2006 | | 15,928 |
| EUR | | 288,000 | | USD | | 349,128 | | 1/27/2006 | | 7,641 |
| USD | | 96,271 | | GBP | | 56,000 | | 1/27/2006 | | 64 |
| EUR | | 5,306 | | USD | | 6,437 | | 1/12/2006 | | 150 |
| JPY | | 263,461,000 | | USD | | 2,276,455 | | 1/27/2006 | | 34,755 |
| NZD | | 264,000 | | USD | | 181,769 | | 1/27/2006 | | 1,958 |
| NZD | | 120,000 | | USD | | 82,042 | | 1/27/2006 | | 309 |
| NZD | | 328,000 | | USD | | 232,972 | | 1/27/2006 | | 9,570 |
| USD | | 30,414 | | MXN | | 329,025 | | 2/10/2006 | | 379 |
| USD | | 65,322 | | MXN | | 704,036 | | 2/10/2006 | | 567 |
| MXN | | 499,000 | | USD | | 47,310 | | 2/10/2006 | | 610 |
| EUR | | 35,133 | | USD | | 41,801 | | 2/15/2006 | | 102 |
| | | | | | | | | | |
| Total unrealized appreciation | | | | 208,357 |
| | | | | | | | | | |
| | | | | | | | | | | |
| Contracts to Deliver | | In Exchange For | | Settlement Date | | Unrealized
Depreciation (US$) | |
| USD | | 975,950 | | AUD | | 1,310,000 | | 1/27/2006 | | (16,485 | ) |
| USD | | 68,876 | | AUD | | 94,000 | | 1/27/2006 | | (29 | ) |
| USD | | 384,233 | | AUD | | 514,000 | | 1/27/2006 | | (7,771 | ) |
| CAD | | 2,225,000 | | USD | | 1,891,508 | | 1/27/2006 | | (24,125 | ) |
| EUR | | 91,000 | | USD | | 107,325 | | 1/27/2006 | | (575 | ) |
| USD | | 2,496,241 | | GBP | | 1,406,000 | | 1/27/2006 | | (77,532 | ) |
| JPY | | 82,963,000 | | USD | | 692,651 | | 1/27/2006 | | (13,253 | ) |
| USD | | 26,148 | | MXN | | 278,567 | | 2/10/2006 | | (78 | ) |
| MXN | | 1,311,628 | | USD | | 121,054 | | 2/10/2006 | | (1,696 | ) |
| EUR | | 254,299 | | USD | | 299,583 | | 2/15/2006 | | (2,240 | ) |
| EUR | | 100,969 | | USD | | 119,469 | | 2/15/2006 | | (368 | ) |
| EUR | | 52,610 | | USD | | 61,879 | | 2/15/2006 | | (563 | ) |
| | | | | | | | | | | |
| Total unrealized depreciation | | | | (144,715 | ) |
| | | | | | | | | | | |
380
DWS High Income VIP
| | | | | | | | | | |
| Contracts to Deliver | | In Exchange For | | Settlement Date | | Unrealized
Appreciation (US$) |
| USD | | 211,396 | | MXN | | 2,286,945 | | 2/10/2006 | | 2,633 |
| USD | | 397,574 | | MXN | | 4,285,053 | | 2/10/2006 | | 3,453 |
| EUR | | 210,800 | | USD | | 250,806 | | 2/15/2006 | | 612 |
| | | | | | | | | | |
| Total unrealized appreciation | | | | 6,698 |
| | | | | | | | | | |
| | | | | | | | | | | |
| Contracts to Deliver | | In Exchange For | | Settlement Date | | Unrealized
Depreciation (US$) | |
| USD | | 167,611 | | MXN | | 1,785,644 | | 2/10/2006 | | (497 | ) |
| MXN | | 8,357,642 | | USD | | 711,349 | | 2/10/2006 | | (10,821 | ) |
| EUR | | 4,056,494 | | USD | | 4,778,839 | | 2/15/2006 | | (35,729 | ) |
| EUR | | 458,600 | | USD | | 542,629 | | 2/15/2006 | | (1,673 | ) |
| EUR | | 189,394 | | USD | | 222,762 | | 2/15/2006 | | (2,026 | ) |
| EUR | | 530,000 | | USD | | 626,486 | | 2/15/2006 | | (2,560 | ) |
| | | | | | | | | | | |
| Total unrealized depreciation | | | | (53,306 | ) |
| | | | | | | | | | | |
DWS Janus Growth & Income VIP
| | | | | | | | | | |
| Contracts to Deliver | | In Exchange For | | Settlement Date | | Unrealized
Appreciation (US$) |
| CHF | | 955,000 | | USD | | 758,237 | | 1/27/2006 | | 29,405 |
| CHF | | 400,000 | | USD | | 316,331 | | 1/27/2006 | | 11,060 |
| EUR | | 790,000 | | USD | | 969,363 | | 1/27/2006 | | 32,646 |
| CHF | | 925,000 | | USD | | 748,988 | | 2/23/2006 | | 41,303 |
| EUR | | 325,000 | | USD | | 398,824 | | 2/27/2006 | | 13,466 |
| | | | | | | | | | |
| Total unrealized appreciation | | | | 127,880 |
| | | | | | | | | | |
| | | | | | | | | | | |
| Contracts to Deliver | | In Exchange For | | Settlement Date | | Unrealized
Depreciation (US$) | |
| EUR | | 200,000 | | USD | | 237,920 | | 5/11/2006 | | (614 | ) |
| | | | | | | | | | | |
| Total unrealized depreciation | | | | (614 | ) |
| | | | | | | | | | | |
DWS Strategic Income VIP
| | | | | | | | | | | |
| Contracts to Deliver | | In Exchange For | | Settlement Date | | Unrealized
Appreciation (US$) | |
| EUR | | 46,706 | | USD | | 56,657 | | 1/12/2006 | | 1,324 | |
| USD | | 52,023 | | AUD | | 71,000 | | 1/27/2006 | | 54 | |
| USD | | 1,990,215 | | CAD | | 2,339,000 | | 1/27/2006 | | 17,502 | |
| USD | | 154,547 | | CAD | | 183,000 | | 1/27/2006 | | 2,534 | |
| CHF | | 1,806,000 | | USD | | 1,403,263 | | 1/27/2006 | | 26,041 | |
| CHF | | 578,000 | | USD | | 454,467 | | 1/27/2006 | | 13,695 | |
| CHF | | 114,000 | | USD | | 87,103 | | 1/27/2006 | | 169 | |
| EUR | | 977,300 | | USD | | 1,174,123 | | 1/27/2006 | | 15,087 | |
| JPY | | 191,583,100 | | USD | | 1,655,389 | | 1/27/2006 | | 24,691 | |
| NZD | | 192,000 | | USD | | 132,196 | | 1/27/2006 | | 1,103 | |
| NZD | | 88,000 | | USD | | 60,164 | | 1/27/2006 | | 80 | |
| NZD | | 269,000 | | USD | | 191,065 | | 1/27/2006 | | 7,399 | |
| USD | | 19,503 | | MXN | | 210,990 | | 2/10/2006 | | 243 | |
| USD | | 43,183 | | MXN | | 465,430 | | 2/10/2006 | | 375 | |
| MXN | | 944,000 | | USD | | 89,500 | | 2/10/2006 | | 1,153 | |
| EUR | | 21,958 | | USD | | 26,126 | | 2/15/2006 | | 64 | |
| | | | | | | | | | | |
| Total unrealized appreciation | | | | 111,514 | |
| | | | | | | | | | | |
| | | |
| Contracts to Deliver | | In Exchange For | | Settlement Date | | Unrealized
Depreciation (US$) | |
| USD | | 707,750 | | AUD | | 950,000 | | 1/27/2006 | | (10,948 | ) |
| USD | | 336,391 | | AUD | | 450,000 | | 1/27/2006 | | (6,327 | ) |
| EUR | | 62,000 | | USD | | 73,123 | | 1/27/2006 | | (407 | ) |
| USD | | 1,800,276 | | GBP | | 1,014,000 | | 1/27/2006 | | (57,782 | ) |
| USD | | 89,395 | | GBP | | 52,000 | | 1/27/2006 | | (36 | ) |
| JPY | | 64,674,000 | | USD | | 539,958 | | 1/27/2006 | | (10,528 | ) |
| EUR | | 143,000 | | USD | | 169,143 | | 2/8/2006 | | (517 | ) |
| EUR | | 196,901 | | USD | | 233,263 | | 2/8/2006 | | (347 | ) |
| USD | | 16,262 | | MXN | | 173,248 | | 2/10/2006 | | (48 | ) |
| MXN | | 849,668 | | USD | | 78,418 | | 2/10/2006 | | (1,100 | ) |
| EUR | | 176,356 | | USD | | 207,759 | | 2/15/2006 | | (1,553 | ) |
| EUR | | 52,610 | | USD | | 62,146 | | 2/15/2006 | | (296 | ) |
| EUR | | 35,750 | | USD | | 42,300 | | 2/15/2006 | | (130 | ) |
| | | | | | | | | | | |
| Total unrealized depreciation | | | | (90,019 | ) |
| | | | | | | | | | | |
381
Currency Abbreviations
AUD Australian Dollar
CAD Canadian Dollar
CHF Swiss Franc
EUR Euro
GBP British Pound
JPY Japanese Yen
MXN Mexican Peso
NZD New Zealand Dollar
USD United States Dollar
H. Ownership of the Portfolios
At December 31, 2005, the beneficial ownership in the portfolios was as follows:
DWS Balanced VIP: Three Participating Insurance Companies were owners of record of 10% or more of the total outstanding Class A shares of the portfolio, each owning 40%, 25% and 17%. Two Participating Insurance Companies were owners of record of 10% or more of the total outstanding Class B shares of the portfolio, each owning 73% and 26%.
DWS Blue Chip VIP: Two Participating Insurance Companies were owners of record of 10% or more of the total outstanding Class A shares of the portfolio, each owning 54% and 32%. Two Participating Insurance Companies were owners of record of 10% or more of the total outstanding Class B shares of the portfolio, each owning 73% and 26%.
DWS Conservative Allocation VIP: Two Participating Insurance Companies were owners of record of 10% or more of the total outstanding Class B shares of the portfolio, each owning 72% and 28%.
DWS Core Fixed Income VIP: Three Participating Insurance Companies were owners of record of 10% or more of the total outstanding Class A shares of the portfolio, each owning 32%, 31% and 26%. Two Participating Insurance Companies were the owners of record of 10% or more of the total outstanding Class B shares of the portfolio, each owning 83% and 17%.
DWS Davis Venture Value VIP: Two Participating Insurance Companies were owners of record of 10% or more of the total outstanding Class A shares of the portfolio, each owning 73% and 20%. Two Participating Insurance Companies were owners of record of 10% or more of the total outstanding Class B shares of the portfolio, each owning 72% and 28%.
DWS Dreman Financial Services VIP: Two Participating Insurance Companies were owners of record of 10% or more of the total outstanding Class A shares of the portfolio, each owning 58% and 39%. Two Participating Insurance Companies were owners of record of 10% or more of the total outstanding Class B shares of the portfolio, each owning 74% and 26%.
DWS Dreman High Return Equity VIP: Two Participating Insurance Companies were owners of record of 10% or more of the total outstanding Class A shares of the portfolio, each owning 67% and 26%. Two Participating Insurance Companies were the owners of record of 10% or more of the total outstanding Class B shares of the portfolio, each owning 81% and 17%.
DWS Dreman Small Cap Value VIP: Three Participating Insurance Companies were owners of record of 10% or more of the total outstanding Class A shares of the portfolio, each owning 56%, 25% and 15%. Two Participating Insurance Companies were owners of record of 10% or more of the total outstanding Class B shares of the portfolio, each owning 75% and 21%.
DWS Global Thematic VIP: Two Participating Insurance Companies were owners of record of 10% or more of the total outstanding Class A shares of the portfolio, each owning 63% and 35%. Two Participating Insurance Companies were owners of record of 10% or more of the total outstanding Class B shares of the portfolio, each owning 68% and 32%.
DWS Government & Agency Securities VIP: Three Participating Insurance Companies were owners of record of 10% or more of the total outstanding Class A shares of the portfolio, each owning 41%, 34% and 18%. One Participating Insurance Company was the owner of record of 10% or more of the total outstanding Class B shares of the portfolio, owning 88%.
382
DWS Growth Allocation VIP: Two Participating Insurance Companies were owners of record of 10% or more of the total outstanding Class B shares of the portfolio, each owning 85% and 15%.
DWS High Income VIP: Three Participating Insurance Companies were owners of record of 10% or more of the total outstanding Class A shares of the portfolio, each owning 37%, 32% and 26%. Two Participating Insurance Companies were owners of record of 10% or more of the total outstanding Class B shares of the portfolio, each owning 77% and 22%.
DWS Income Allocation VIP: Two Participating Insurance Companies were owners of record of 10% or more of the total outstanding Class B shares of the portfolio, each owning 62% and 38%.
DWS International Select Equity VIP: Three Participating Insurance Companies were owners of record of 10% or more of the total outstanding Class A shares of the portfolio, each owning 45%, 28% and 25%. Two Participating Insurance Companies were owners of record of 10% or more of the total outstanding Class B shares of the portfolio, each owning 58% and 42%.
DWS Janus Growth & Income VIP: Two Participating Insurance Companies were owners of record of 10% or more of the total outstanding Class A shares of the portfolio, each owning 69% and 29%. Two Participating Insurance Companies were owners of record of 10% or more of the total outstanding Class B shares of the portfolio, owning 84% and 16%.
DWS Janus Growth Opportunities VIP: Three Participating Insurance Companies were owners of record of 10% or more of the total outstanding Class A shares of the portfolio, each owning 60%, 26% and 13%. One Participating Insurance Company was the owner of record of 10% or more of the total outstanding Class B shares of the portfolio, owning 88%.
DWS Large Cap Value VIP: Four Participating Insurance Companies were owners of record of 10% or more of the total outstanding Class A shares of the portfolio, each owning 39%, 31%, 15% and 12%. Two Participating Insurance Companies were owners of record of 10% or more of the total outstanding Class B shares of the portfolio, each owning 82% and 18%.
DWS Mercury Large Cap Core VIP: One Participating Insurance Company was the owner of record of 10% or more of the total outstanding Class A shares of the portfolio, owning 100%. Three Participating Insurance Companies were owners of record of 10% or more of the total outstanding Class B shares of the portfolio, each owning 57%, 30% and 13%.
DWS MFS Strategic Value VIP: Three Participating Insurance Companies were owners of record of 10% or more of the total outstanding Class A shares of the portfolio, each owning, 62%, 22% and 11%. Two Participating Insurance Companies were the owners of record of 10% or more of the total outstanding Class B shares of the portfolio, each owning 87% and 13%.
DWS Mid Cap Growth VIP: Two Participating Insurance Companies were owners of record of 10% or more of the total outstanding Class A shares of the portfolio, each owning 65% and 29%. Two Participating Insurance Companies were owners of record of 10% or more of the total outstanding Class B shares of the portfolio, each owning 80% and 19%.
DWS Moderate Allocation VIP: Two Participating Insurance Companies were owners of record of 10% or more of the total outstanding Class B shares of the portfolio, each owning 80% and 20%.
DWS Money Market VIP: Three Participating Insurance Companies were owners of record of 10% or more of the total outstanding Class A shares of the portfolio, each owning 42%, 33% and 24%. Two Participating Insurance Companies were owners of record of 10% or more of the total outstanding Class B shares of the portfolio, each owning 66% and 34%.
383
DWS Oak Strategic Equity VIP: Two Participating Insurance Companies were owners of record of 10% or more of the total outstanding Class A shares of the portfolio, each owning 80% and 20%. Two Participating Insurance Companies were owners of record of 10% or more of the total outstanding Class B shares of the portfolio, each owning 77% and 23%.
DWS Salomon Aggressive Growth VIP: Two Participating Insurance Companies were owners of record of 10% or more of the total outstanding Class A shares of the portfolio, each owning 82% and 17%. One Participating Insurance Company was the owner of record of 10% or more of the total outstanding Class B shares of the portfolio, owning 87%.
DWS Small Cap Growth VIP: Three Participating Insurance Companies were owners of record of 10% or more of the total outstanding Class A shares of the portfolio, each owning 47%, 22% and 21%. Two Participating Insurance Companies were owners of record of 10% or more of the total outstanding Class B shares of the portfolio, each owning 83% and 17%.
DWS Strategic Income VIP: Two Participating Insurance Companies were owners of record of 10% or more of the total outstanding Class A shares of the portfolio, each owning 53% and 40%. Two Participating Insurance Companies were owners of record of 10% or more of the outstanding Class B shares of the portfolio, each owning 62% and 37%.
DWS Technology VIP: Two Participating Insurance Companies were owners of record of 10% or more of the total outstanding Class A shares of the portfolio, each owning 63% and 33%. Two Participating Insurance Companies were owners of record of 10% or more of the outstanding Class B shares of the portfolio, each owning 78% and 21%.
DWS Templeton Foreign Value VIP: Two Participating Insurance Companies were owners of record of 10% or more of the total outstanding Class A shares of the portfolio, each owning 77% and 22%. Three Participating Insurance Companies were owners of record of 10% or more of the total outstanding Class B shares of the portfolio, each owning 42%, 39% and 18%.
DWS Turner Mid Cap Growth VIP: Two Participating Insurance Companies were owners of record of 10% or more of the total outstanding Class A shares of the portfolio, each owning 80% and 20%. Two Participating Insurance Companies were the owners of record of 10% or more of the total outstanding Class B shares of the portfolio, each owning 83% and 17%.
384
I. Line of Credit
The Trust and several other affiliated funds (the “Participants”) share in a $1.1 billion revolving credit facility administered by J.P. Morgan Chase Bank for temporary or emergency purposes, including the meeting of redemption requests that otherwise might require the untimely disposition of securities. The Participants are charged an annual commitment fee which is allocated, based upon net assets, among each of the Participants. Interest is calculated at the Federal Funds Rate plus 0.5 percent. The facility borrowing limit for each portfolio as a percent of net assets is as follows:
| | | |
Portfolio | | Facility Borrowing Limit | |
DWS Balanced VIP | | 33 | % |
DWS Blue Chip VIP | | 33 | % |
DWS Conservative Allocation VIP | | 5 | % |
DWS Core Fixed Income VIP | | 33 | % |
DWS Davis Venture Value VIP | | 33 | % |
DWS Dreman Financial Services VIP | | 33 | % |
DWS Dreman High Return Equity VIP | | 33 | % |
DWS Dreman Small Cap Value VIP | | 33 | % |
DWS Global Thematic VIP | | 33 | % |
DWS Government & Agency Securities VIP | | 33 | % |
DWS Growth Allocation VIP | | 5 | % |
DWS High Income VIP | | 33 | % |
DWS Income Allocation VIP | | 5 | % |
DWS International Select Equity VIP | | 33 | % |
DWS Janus Growth & Income VIP | | 33 | % |
DWS Janus Growth Opportunities VIP | | 33 | % |
DWS Large Cap Value VIP | | 33 | % |
DWS Mercury Large Cap Core VIP | | 33 | % |
DWS MFS Strategic Value VIP | | 33 | % |
DWS Mid Cap Growth VIP | | 33 | % |
DWS Moderate Allocation VIP | | 5 | % |
DWS Money Market VIP | | 33 | % |
DWS Oak Strategic Equity VIP | | 33 | % |
DWS Salomon Aggressive Growth VIP | | 33 | % |
DWS Small Cap Growth VIP | | 33 | % |
DWS Strategic Income VIP | | 33 | % |
DWS Technology VIP | | 5 | % |
DWS Templeton Foreign Value VIP | | 33 | % |
DWS Turner Mid Cap Growth VIP | | 33 | % |
J. Regulatory Matters and Litigation
Market Timing Related Regulatory and Litigation Matters. Since at least July 2003, federal, state and industry regulators have been conducting ongoing inquiries and investigations (“inquiries”) into the mutual fund industry, and have requested information from numerous mutual fund companies, including DWS Scudder. The DWS funds’ advisors have been cooperating in connection with these inquiries and are in discussions with the regulators concerning proposed settlements. Publicity about mutual fund practices arising from these industry-wide inquiries serves as the general basis of a number of private lawsuits against the DWS funds. These lawsuits, which previously have been reported in the press, involve purported class action and derivative lawsuits, making various allegations and naming as defendants various persons, including certain DWS funds, the funds’ investment advisors and their affiliates, and certain individuals, including in some cases fund Trustees/Directors, officers, and other parties. Each DWS fund’s investment advisor has agreed to indemnify the applicable DWS funds in connection with these lawsuits, or other lawsuits or regulatory actions that may be filed making allegations similar to these lawsuits regarding market timing, revenue sharing, fund valuation or other subjects arising from or related to the pending inquiries. It is not possible to determine with certainty what the outcome of these inquiries will be or what the effect, if any, would be on the funds or their advisors.
With respect to the lawsuits, based on currently available information, the funds’ investment advisors believe the likelihood that the pending lawsuits will have a material adverse financial impact on a DWS fund is remote and such actions are not likely to materially affect their ability to perform under their investment management agreements with the DWS funds.
385
With respect to the regulatory matters, Deutsche Asset Management (“DeAM”) has advised the funds as follows:
DeAM expects to reach final agreements with regulators early in 2006 regarding allegations of improper trading in the DWS funds. DeAM expects that it will reach settlement agreements with the Securities and Exchange Commission, the New York Attorney General and the Illinois Secretary of State providing for payment of disgorgement, penalties, and investor education contributions totaling approximately $134 million. Approximately $127 million of this amount would be distributed to shareholders of the affected DWS funds in accordance with a distribution plan to be developed by an independent distribution consultant. DeAM does not believe that any of the DWS funds will be named as respondents or defendants in any proceedings. The funds’ investment advisors do not believe these amounts will have a material adverse financial impact on them or materially affect their ability to perform under their investment management agreements with the DWS funds. The above-described amounts are not material to Deutsche Bank, and they have already been reserved.
Based on the settlement discussions thus far, DeAM believes that it will be able to reach a settlement with the regulators on a basis that is generally consistent with settlements reached by other advisors, taking into account the particular facts and circumstances of market timing at DeAM and at the legacy Scudder and Kemper organizations prior to their acquisition by DeAM in April 2002. Among the terms of the expected settled orders, DeAM would be subject to certain undertakings regarding the conduct of its business in the future, including maintaining existing management fee reductions for certain funds for a period of five years. DeAM expects that these settlements would resolve regulatory allegations that it violated certain provisions of federal and state securities laws (i) by entering into trading arrangements that permitted certain investors to engage in market timing in certain DWS funds and (ii) by failing more generally to take adequate measures to prevent market timing in the DWS funds, primarily during the 1999-2001 period. With respect to the trading arrangements, DeAM expects that the settlement documents will include allegations related to one legacy DeAM arrangement, as well as three legacy Scudder and six legacy Kemper arrangements. All of these trading arrangements originated in businesses that existed prior to the current DeAM organization, which came together in April 2002 as a result of the various mergers of the legacy Scudder, Kemper and Deutsche fund groups, and all of the arrangements were terminated prior to the start of the regulatory investigations that began in the summer of 2003. No current DeAM employee approved the trading arrangements.
There is no certainty that the final settlement documents will contain the foregoing terms and conditions. The independent Trustees/Directors of the DWS funds have carefully monitored these regulatory investigations with the assistance of independent legal counsel and independent economic consultants. Additional information announced by DeAM regarding the terms of the expected settlements will be made available at www.dws-scudder.com/regulatory_settlements, which will also disclose the terms of any final settlement agreements once they are announced.
Other Regulatory Matters. DeAM is also engaged in settlement discussions with the Enforcement Staffs of the SEC and the NASD regarding DeAM’s practices during 2001-2003 with respect to directing brokerage commissions for portfolio transactions by certain DWS funds to broker-dealers that sold shares in the DWS funds and provided enhanced marketing and distribution for shares in the DWS funds. In addition, on January 13, 2006, DWS Scudder Distributors, Inc. received a Wells notice from the Enforcement Staff of the NASD regarding DWS Scudder Distributors’ payment of non-cash compensation to associated persons of NASD member firms, as well as DWS Scudder Distributors’ procedures regarding non-cash compensation regarding entertainment provided to such associated persons. Additional information announced by DeAM regarding the terms of the expected settlements will be made available at www.dws-scudder.com/regulatory_settlements, which will also disclose the terms of any final settlement agreements once they are announced.
K. Acquisition of Assets
On April 29, 2005, the DWS Small Cap Growth VIP acquired all of the net assets of Scudder Variable Series I 21st Century Growth Portfolio pursuant to a plan of reorganization approved by shareholders on April 20, 2005. The acquisition was accomplished by a tax-free exchange of
386
7,739,831 Class A shares and 1,627,657 Class B shares of the Scudder Variable Series I 21st Century Growth Portfolio for 3,256,621 Class A shares and 680,062 Class B shares of the DWS Small Cap Growth VIP outstanding on April 29, 2005. Scudder Variable Series I 21st Century Growth Portfolio’s net assets at that date of $45,435,834, including $4,404,910 of net unrealized appreciation, were combined with those of the DWS Small Cap Growth VIP. The aggregate net assets of the DWS Small Cap Growth VIP immediately before the acquisition were $209,671,733. The combined net assets of the DWS Small Cap Growth VIP immediately following the acquisitions were $255,107,567.
On April 29, 2005, the DWS Balanced VIP acquired all of the net assets of Scudder Variable Series I Balanced Portfolio pursuant to a plan of reorganization approved by shareholders on April 20, 2005. The acquisition was accomplished by a tax-free exchange of 10,773,456 Class A shares of the Scudder Variable Series I Balanced Portfolio for 5,591,767 Class A shares of the DWS Balanced VIP outstanding on April 29, 2005. Scudder Variable Series I Balanced Portfolio’s net assets at that date of $118,997,707, including $9,126,657 of net unrealized appreciation, were combined with those of the DWS Balanced VIP. The aggregate net assets of the DWS Balanced VIP immediately before the acquisition were $598,273,318. The combined net assets of the DWS Balanced VIP immediately following the acquisitions were $717,271,025.
L. Payments made by Affiliates and Investment Restriction Violations
During the year ended December 31, 2005, the Advisor fully reimbursed the DWS Balanced VIP, DWS High Income VIP, the DWS Strategic Income VIP and DWS Technology VIP $3,830, $27,576, $2,298 and $3,842, respectively, for losses incurred on a trade executed incorrectly.
In addition, the Advisor fully reimbursed the DWS Davis Venture Value VIP and DWS Government & Agency Securities VIP $621 and $234, respectively, for losses incurred in violation of investment restrictions. During the period, the DWS Small Cap Growth VIP realized a gain of $49,496 on the disposal of an investment not meeting the Portfolio’s investment restrictions.
M. Other
Prior to September 30, 2005, Deutsche Asset Management Investment Services Ltd. (“DeAMIS”), an affiliate of the Advisor, served as subadvisor with respect to the investment and reinvestment of assets of DWS International Select Equity VIP, DWS Strategic Income VIP and DWS Balanced VIP. DeAMIS was sold to Aberdeen Asset Management PLC (“Aberdeen”). The Portfolio’s Board allowed the subadvisory agreement with DeAMIS, due for renewal on September 30, 2005 to expire and only the advisory agreement with DeIM was approved for continuation. Aberdeen plays no role in managing the portfolios. Additionally, effective December 2, 2005, pursuant to an investment subadvisory agreement between Aberdeen and the Advisor, Aberdeen acts as the subadvisor for DWS Core Fixed Income VIP. As subadvisor, Aberdeen, under the supervision of the Board of Trustees and the Advisor, makes the portfolio’s investment decisions, buys and sells securities for the portfolio, and conducts the research that leads to these purchase and sale decisions. Aberdeen is also responsible for selecting brokers and dealers and for negotiating brokerage commissions and dealer charges. Aberdeen provides a full range of international investment advisory services to institutional and retail clients. Aberdeen will be paid for its services by the Advisor from its fee as investment advisor to the portfolio.
N. Subsequent Event
Effective February 6, 2006, Scudder Investments changed its name to DWS Scudder and the Scudder funds were renamed DWS funds. The DWS Scudder name represents the alignment of Scudder with all of Deutsche Bank’s mutual fund operations around the globe. In addition, the Web site for all Scudder funds changed to www.dws-scudder.com.
387
Report of Independent Registered Public Accounting Firm
To the Board of Trustees and Shareholders of DWS Variable Series II:
We have audited the accompanying statements of assets and liabilities of DWS Variable Series II (formerly Scudder Variable Series II) (the “Trust”), comprising the DWS Balanced VIP (formerly Scudder Total Return Portfolio), DWS Blue Chip VIP (formerly Scudder Blue Chip Portfolio), DWS Conservative Allocation VIP (formerly Scudder Income & Growth Strategy Portfolio), DWS Core Fixed Income VIP (formerly Scudder Fixed Income Portfolio), DWS Davis Venture Value VIP (formerly SVS Davis Venture Value Portfolio), DWS Dreman Financial Services VIP (formerly SVS Dreman Financial Services Portfolio), DWS Dreman High Return Equity VIP (formerly SVS Dreman High Return Equity Portfolio), DWS Dreman Small Cap Value VIP (formerly SVS Dreman Small Cap Value Portfolio), DWS Global Thematic VIP (formerly Scudder Global Blue Chip Portfolio), DWS Government & Agency Securities VIP (formerly Scudder Government & Agency Securities Portfolio), DWS Growth Allocation VIP (formerly Scudder Growth Strategy Portfolio), DWS High Income VIP (formerly Scudder High Income Portfolio), DWS Income Allocation VIP (formerly Scudder Conservative Income Strategy Portfolio), DWS International Select Equity VIP (formerly Scudder International Select Equity Portfolio), DWS Janus Growth & Income VIP (formerly SVS Janus Growth and Income Portfolio), DWS Janus Growth Opportunities VIP (formerly SVS Janus Growth Opportunities Portfolio), DWS Large Cap Value VIP (formerly Scudder Large Cap Value Portfolio), DWS Mercury Large Cap Core VIP (formerly Scudder Mercury Large Cap Core Portfolio), DWS MFS Strategic Value VIP (formerly SVS MFS Strategic Value Portfolio), DWS Mid Cap Growth VIP (formerly Scudder Mid Cap Growth Portfolio and formerly Scudder Aggressive Growth Portfolio), DWS Moderate Allocation VIP (formerly Scudder Growth & Income Strategy Portfolio), DWS Money Market VIP (formerly Scudder Money Market Portfolio), DWS Oak Strategic Equity VIP (formerly SVS Oak Strategic Equity Portfolio), DWS Salomon Aggressive Growth VIP (formerly Scudder Aggressive Growth Portfolio and formerly SVS INVESCO Dynamic Growth Portfolio), DWS Small Cap Growth VIP (formerly Scudder Small Cap Growth Portfolio), DWS Strategic Income VIP (formerly Scudder Strategic Income Portfolio), DWS Technology VIP (formerly Scudder Technology Growth Portfolio), DWS Templeton Foreign Value VIP (formerly Scudder Templeton Foreign Value Portfolio), and DWS Turner Mid Cap Growth VIP (formerly SVS Turner Mid Cap Growth Portfolio) (collectively, the “Portfolios”), including the portfolios of investments, as of December 31, 2005, and the related statements of operations for the year then ended, the statements of changes in net assets for each of the two years in the period then ended, and the financial highlights for each of the periods indicated therein. These financial statements and financial highlights are the responsibility of the Trust’s management. Our responsibility is to express an opinion on these financial statements and financial highlights based on our audits.
We conducted our audits in accordance with the standards of the Public Company Accounting Oversight Board (United States). Those standards require that we plan and perform the audit to obtain reasonable assurance about whether the financial statements and financial highlights are free of material misstatement. We were not engaged to perform an audit of the Trust’s internal control over financial reporting. Our audits included consideration of internal control over financial reporting as a basis for designing audit procedures that are appropriate in the circumstances, but not for the purpose of expressing an opinion on the effectiveness of the Trust’s internal control over financial reporting. Accordingly, we express no such opinion. An audit also includes examining, on a test basis, evidence supporting the amounts and disclosures in the financial statements and financial highlights, assessing the accounting principles used and significant estimates made by management, and evaluating the overall financial statement presentation. Our procedures included confirmation of securities owned as of December 31, 2005, by correspondence with the custodian and brokers or by other appropriate auditing procedures where replies from brokers were not received. We believe that our audits provide a reasonable basis for our opinion.
388
In our opinion, the financial statements and financial highlights referred to above present fairly, in all material respects, the financial position of the aforementioned portfolios of the DWS Variable Series II at December 31, 2005, the results of their operations for the year then ended, the changes in their net assets for each of the two years in the period then ended, and the financial highlights for each of the periods indicated therein, in conformity with U.S. generally accepted accounting principles.
|
|
 |
| Boston, Massachusetts |
| February 16, 2006 |
Tax Information (Unaudited)
The following portfolios paid distributions from net long-term capital gains during the year ended December 31, 2005 as follows:
| | | | | |
Portfolio | | Distribution Per Share ($) | | % Representing
15% Rate Gains | |
DWS Core Fixed Income VIP | | .06 | | 100 | % |
DWS Dreman Small Cap Value VIP | | 1.78 | | 100 | % |
DWS Government & Agency Securities VIP | | .001 | | 100 | % |
DWS MFS Strategic Value VIP | | .5518 | | 100 | % |
DWS Strategic Income VIP | | .03 | | 100 | % |
The following portfolios designated as capital gain dividends for its year ended December 31, 2005:
| | | | | |
Portfolio | | Capital Gain ($) | | % Representing
15% Rate Gains | |
DWS Blue Chip VIP | | 9,819,000 | | 100 | % |
DWS Conservative Allocation VIP | | 167,000 | | 100 | % |
DWS Core Fixed Income VIP | | 93,200 | | 100 | % |
DWS Dreman Financial Services | | 1,600,000 | | 100 | % |
DWS Dreman Small Cap Value VIP | | 52,300,000 | | 100 | % |
DWS Global Thematic VIP | | 8,816,000 | | 100 | % |
DWS Growth Allocation VIP | | 820,000 | | 100 | % |
DWS Income Allocation VIP | | 191 | | 100 | % |
DWS MFS Strategic Value VIP | | 500,000 | | 100 | % |
DWS Moderate Allocation VIP | | 600,000 | | 100 | % |
DWS Salomon Aggressive Growth VIP | | 8,100,000 | | 100 | % |
DWS Strategic Income VIP | | 32,000 | | 100 | % |
DWS Turner Mid Cap Growth VIP | | 12,844,000 | | 100 | % |
DWS Templeton Foreign Value VIP | | 88,300 | | 100 | % |
For corporate shareholders, the following percentage of income dividends paid during the following portfolios’ fiscal year ended December 31, 2005 qualified for the dividends received deduction:
| | |
Portfolio | | % |
DWS Balanced VIP | | 43 |
DWS Blue Chip VIP | | 100 |
DWS Conservative Allocation VIP | | 100 |
DWS Davis Venture Value VIP | | 100 |
DWS Dreman Financial Services VIP | | 100 |
DWS Dreman High Return Equity VIP | | 100 |
DWS Dreman Small Cap Value VIP | | 100 |
DWS Global Thematic VIP | | 100 |
DWS Growth Allocation VIP | | 100 |
DWS Janus Growth and Income VIP | | 100 |
DWS Janus Growth Opportunities VIP | | 100 |
DWS Large Cap Value VIP | | 100 |
DWS Mercury Large Cap Core VIP | | 100 |
DWS MFS Strategic Value VIP | | 100 |
DWS Oak Strategic Equity VIP | | 100 |
DWS Technology VIP | | 71 |
DWS Templeton Foreign Value VIP | | 38 |
389
DWS Global Thematic VIP paid foreign taxes of $170,000 and earned $454,040 of foreign source income during the year ended December 31, 2005. Pursuant to section 853 of the Internal Revenue Code, the portfolio designates $0.03 per share as foreign taxes paid and $0.07 per share as income earned from foreign sources for the year ended December 31, 2005.
DWS International Select Equity VIP paid foreign taxes of $678,821 and earned $4,638,967 of foreign source income during the year ended December 31, 2005. Pursuant to Section 853 of the Internal Revenue Code, the portfolio designates $0.04 per share as foreign taxes paid and $0.24 per share as income earned from foreign sources for the year ended December 31, 2005.
DWS Templeton Foreign Value VIP paid foreign taxes of $21,600 and earned $139,100 of foreign source income during the year ended December 31, 2005. Pursuant to Section 853 of the Internal Revenue Code, the portfolio designates $0.02 per share as foreign taxes paid and $0.08 per share as income earned from foreign sources for the year ended December 31, 2005.
Please consult a tax advisor if you have questions about federal or state income tax laws, or on how to prepare your tax returns. If you have specific questions about your account, please call (800) 621-1048.
Proxy Voting
A description of the Trust’s policies and procedures for voting proxies for portfolio securities and information about how the Trust voted proxies related to its portfolio securities during the 12-month period ended June 30 is available on our Web site — www.dws-scudder.com (type “proxy voting” in the search field) — or on the SEC’s Web site — www.sec.gov. To obtain a written copy of the Trust’s policies and procedures without charge, upon request, call us toll free at (800) 621-1048.
Shareholder Meeting Results
A Special Meeting of Shareholders (the “Meeting”) of DWS Salomon Aggressive Growth VIP (the “Portfolio”) was held on October 21, 2005 at the offices of Deutsche Investment Management Americas Inc. (“DeIM”), which is part of Deutsche Asset Management, 345 Park Avenue, New York, NY 10154. At the Meeting, the following matters were voted upon by the shareholders (the resulting votes are presented below).
1. To approve a new Investment Management Agreement between DWS Variable Series II, on behalf of the Portfolio, and DeIM:
Number of Votes:
| | | | |
| Affirmative | | Against | | Abstain |
| 3,983,737 | | 94,156 | | 333,050 |
390
2. To approve a new Sub-advisory Agreement between DeIM and Salomon Brothers Asset Management Inc.:
Number of Votes:
| | | | |
| Affirmative | | Against | | Abstain |
| 3,962,802 | | 112,845 | | 335,296 |
A Special Meeting of Shareholders (the “Meeting”) of DWS Core Fixed Income VIP (the “Portfolio”) was held on November 18, 2005, at the offices of DeIM, 345 Park Avenue, New York, NY 10154. At the meeting, the following matters were voted upon by the shareholders (the resulting votes are presented below).
1. To approve an Amended and Restated Investment Management Agreement between DWS Variable Series II, on behalf of the Portfolio, and DeIM:
Number of Votes:
| | | | |
| Affirmative | | Against | | Abstain |
| 18,762,395 | | 363,523 | | 1,458,292 |
2. To approve a new Sub-advisory Agreement between DeIM and Aberdeen Asset Management, Inc.:
Number of Votes:
| | | | |
| Affirmative | | Against | | Abstain |
| 18,733,967 | | 364,585 | | 1,485,657 |
Investment Management Agreement Approval
The Board of Trustees, including the Independent Trustees, approved the renewal of each Portfolio’s investment management agreement (each an “Agreement”) with Deutsche Investment Management Americas Inc. (“DeIM” or the “Advisor”) in September 2005. As part of its review process, the Board requested and evaluated all information it deemed reasonably necessary to evaluate the Agreements. Over the course of several months, the Contract Review Committee, in coordination with the Equity Oversight Committee and the Fixed Income Oversight Committee, as applicable, and the Operations Committee of the Board, reviewed comprehensive materials received from the Advisor, independent third parties and independent counsel. The Board also received extensive information throughout the year regarding performance and operating results of each Portfolio. After their review of the information received, the Committees presented their findings and recommendations to the Independent Trustees as a group. The Independent Trustees then reviewed the Committees’ findings and recommendations and presented their recommendations to the full Board.
In connection with the contract review process, the various Committees and the Board considered the factors discussed below, among others. The Board also considered that the Advisor and its predecessors have managed each Portfolio since its inception, and the Board believes that a long-term relationship with a capable, conscientious advisor is in the best interests of each of the Portfolios. The Board considered, generally, that shareholders invested in a Portfolio, or approved the investment management agreement for a Portfolio, knowing that the Advisor managed the Portfolio and knowing the investment management fee schedule. In connection with recent and ongoing efforts by Deutsche Bank to restructure its US mutual fund business, which resulted in turnover of senior management and other personnel of the Advisor, the Board considered Deutsche Bank’s commitment that it will devote to the Advisor and its affiliates all attention and resources that are necessary to provide the Portfolios with top-quality investment management and shareholder, administrative and product distribution services.
391
Nature, Quality and Extent of Services. The Board considered the nature, extent and quality of services provided under the Agreements, including portfolio management services and administrative services. The Board considered the experience and skills of senior management and investment personnel, the resources made available to such personnel, the ability of the Advisor to attract and retain high-quality personnel, and the organizational depth and stability of the Advisor. For certain Funds, the Board considered the delegation of day-to-day portfolio management responsibility to a sub-advisor. The Board reviewed each Portfolio’s performance over short-term and, as applicable, long-term periods, and compared those returns to various agreed-upon performance measures, including market indices and peer groups. The Board considered whether investment results were consistent with a Portfolio’s investment objective and policies. The Board also noted that it has put a process into place of identifying “Focus Funds” (e.g., funds performing poorly relative to their peer group), and receives more frequent reporting and information from the Advisor regarding such funds, along with the Advisor’s remedial plans to address underperformance. The Board believes this process is an effective manner of addressing poorly performing funds at this time.
On the basis of this evaluation and the ongoing review of investment results by the Equity Oversight Committee and Fixed-Income Oversight Committee, as applicable, the Board concluded that the nature, quality and extent of services provided by the Advisor historically have been and continue to be satisfactory and unless otherwise noted below, each Portfolio’s performance over time was satisfactory.
Fees and Expenses. The Board considered each Portfolio’s management fee rate, operating expenses and total expense ratios, and compared management fees to a peer group and total expenses to a broader peer universe based on information and data supplied by Lipper Inc. (“Lipper”). For purposes of this comparison, the Board relied on historical data compiled by Lipper for the peer funds and the Advisor’s estimate of current expenses for each Portfolio (including, as applicable, the effect of a Portfolio’s then-current expense cap). The information provided to the Board showed that, unless otherwise noted below, each Portfolio’s management fee rate was below the median of its peer group and that each Portfolio’s total expense ratio was below the median of its peer universe. The Board also considered each Portfolio’s management fee rate as compared to fees charged by the Advisor and certain of its affiliates for comparable mutual funds and, as applicable, for similarly managed institutional accounts. With respect to institutional accounts, the Board noted that (i) both the mix of services provided and the level of responsibility required under an Agreement were significantly greater as compared to the Advisor’s obligations for similarly managed institutional accounts; and (ii) the management fees of institutional accounts are less relevant to the Board’s consideration because they reflect significantly different competitive forces from those in the mutual fund marketplace. With respect to the other comparable DWS Funds, the Board considered differences in fund and fee structures among the DWS Funds and, as applicable, among the various legacy organizations. When applicable, the Board took into account the Advisor’s commitment to cap total expenses for certain classes through specified periods.
On the basis of the information provided, the Board concluded that management fees were reasonable and appropriate in light of the nature, quality and extent of services provided by the Advisor.
Profitability. The Board reviewed detailed information regarding revenues received by the Advisor under each Agreement. The Board considered the estimated costs and pre-tax profits realized by the Advisor from advising the DWS Funds, as well as estimates of the pre-tax profits attributable to managing each Portfolio in particular. The Board also received information regarding the estimated enterprise-wide profitability of the DWS organization with respect to all fund services in totality and by fund. The Board reviewed DeIM’s methodology in allocating its costs to the management of each Portfolio. Although the Board noted the inherently subjective nature of any allocation methodology,
392
the Board received an attestation report from an accounting firm affirming that the allocation methods were consistently applied and were based upon practices commonly used in the investment management industry. Based on the information provided, the Board concluded that the pre-tax profits realized by DeIM in connection with the management of each Portfolio, were not unreasonable. For DWS Mid Cap Growth VIP, DWS Global Thematic VIP, DWS Mercury Large Cap Core VIP, DWS MFS Strategic Value VIP and DWS Templeton Foreign Value VIP, the Board noted that, based on the information provided, the Advisor operated each Portfolio at a loss.
Economies of Scale. The Board considered whether there are economies of scale with respect to the management of each Portfolio and whether each Portfolio benefits from any economies of scale. The Board considered whether the management fee schedule under each Agreement is reasonable in relation to the asset size of the Portfolio. The Board noted that the management fee schedule for seventeen of the Portfolios included breakpoints designed to share economies of scale with the shareholders. The Board concluded that each management fee schedule reflects an appropriate level of sharing of any economies of scale.
Other Benefits to DeIM and Its Affiliates. The Board also considered the character and amount of other incidental benefits received by DeIM and its affiliates, including fees received by the Advisor for administrative services provided to each Portfolio. The Board also considered benefits to DeIM related to brokerage and soft-dollar allocations, which pertain primarily to funds investing in equity securities. The Board considered that, during the past year, the Advisor agreed to cease allocating brokerage to acquire research services from third-party service providers. The Board concluded that management fees were reasonable in light of these fallout benefits.
Regulatory Matters. The Board also considered information regarding ongoing inquiries of the Advisor regarding market timing, late trading and other matters by federal and state regulators and private lawsuits on related topics. Among other matters, the Board considered the Advisor’s commitment to indemnify the DWS Funds against regulatory actions or lawsuits arising from such inquiries. The Board also considered management’s representation that such actions will not materially impact the Advisor’s ability to perform under the Agreements or materially impact the Portfolios.
In connection with the factors described above, the Board considered factors specific to a particular Portfolio, as discussed below.
DWS Mid Cap Growth VIP (formerly Scudder Mid Cap Growth Portfolio)
Nature, Quality and Extent of Services. The Board noted that effective October 28, 2005, the Portfolio would adopt a new investment objective and strategy and, accordingly, changed its name to Scudder Mid Cap Growth Portfolio.
The Board noted the relative underperformance of the Portfolio, and took into account the factors contributing to such performance and steps being taken by the Advisor to improve performance, including the Portfolio’s adoption of a new investment objective and strategy.
Fees and Expenses. The information provided to the Board showed that the Portfolio’s total expense ratio was in the fourth quartile for Class B shares. The Board examined the total expense ratio of Class B shares less 12b-1 plan and recordkeeping expenses and noted that total expenses remained in the fourth quartile. The Board took note of the Advisor’s commitment to cap total expenses through April 30, 2006.
In light of the fourth quartile ranking of the total expenses for Class B shares, the Board recommended that the Advisor cap expenses of Class B shares (less 12b-1 plan and recordkeeping expenses) at a level within the third quartile. The Board noted that although the Portfolio’s total expense ratio for Class B shares was above the median for the peer universe, such ratio (after the
393
recommended expense cap) was within an acceptable range of the peer universe, and consistent with reasonable expectations in light of the nature, quality and extent of services provided by the Advisor.
DWS Davis Venture Value VIP (formerly SVS Davis Venture Value Portfolio)
Fees and Expenses. The information provided to the Board showed that the Portfolio’s management fee rate was above the median of the peer group and that the Portfolio’s total expense ratio was above the median of the peer universe but below the fourth quartile for Class A shares and in the fourth quartile for Class B shares. The Board examined the total expense ratio of Class B shares less 12b-1 plan and recordkeeping expenses and noted that the expense ratio remained in the fourth quartile. The Board took into account the Advisor’s commitment to cap total expenses through April 30, 2006.
In light of the fourth quartile ranking of total expenses for Class B shares, the Board recommended that the Advisor cap total expenses (less 12b-1 plan and recordkeeping expenses) for Class B shares at a level within the third quartile. The Board noted that although the Portfolio’s management fee rate was above the median for the peer group and the total expense ratios for Class A and B shares were above the median of the peer universe, such expenses (after the recommended expense cap) were within an acceptable range of the peer group and peer universe, respectively, and consistent with reasonable expectations in light of the nature, quality and extent of services provided by the Advisor.
DWS Dreman High Return Equity VIP (formerly SVS Dreman High Return Equity Portfolio)
Fees and Expenses. The information provided to the Board showed that the Portfolio’s management fee rate was above the median of the peer group but below the fourth quartile, and that the Portfolio’s total expense ratios were below the median of the peer universe for Class A shares and in the fourth quartile for Class B shares. The Board examined the total expense ratio of Class B shares less 12b-1 plan and recordkeeping expenses and noted that the expense ratio was below the fourth quartile. The Board took into account the Advisor’s commitment to cap total expenses through April 30, 2006.
The Board noted that although the Portfolio’s management fee rate was above the median for the peer group and the total expense ratio for Class B shares was above the median of the peer universe, such expenses were within an acceptable range of the peer group and peer universe, respectively, and consistent with reasonable expectations in light of the nature, quality and extent of services provided by the Advisor.
DWS Dreman Small Cap Value VIP (formerly SVS Dreman Small Cap Value Portfolio)
Fees and Expenses. The information provided to the Board showed that the Portfolio’s total expense ratio was above the median of the peer universe, but below the fourth quartile, for Class B shares. The Board took into account the Advisor’s commitment to cap total expenses through April 30, 2006.
The Board noted that although the Portfolio’s total expense ratio for Class B shares was above the median for the peer universe, such expenses were within an acceptable range of the peer universe and consistent with reasonable expectations in light of the nature, quality and extent of services provided by the Advisor.
DWS Global Thematic VIP (formerly Scudder Global Blue Chip Portfolio)
Fees and Expenses. The information provided to the Board showed that the Portfolio’s management fee rate was above the median of the peer group but below the fourth quartile, and that the Portfolio’s total expense ratio was in the fourth quartile of the peer universe for Class A and Class B shares. The Board examined the total expense ratio of Class B shares less 12b-1 plan and recordkeeping expenses and noted that the expense ratio remained in the fourth quartile. The Board took into account the Advisor’s commitment to cap total expenses through April 30, 2006.
394
In light of the fourth quartile ranking of total expenses for Class A and Class B shares, the Board recommended that the Advisor cap total expenses of Class A and Class B shares (less 12b-1 plan and recordkeeping expenses) at a level within the third quartile. The Board noted that although the Portfolio’s management fee rate was above the median for the peer group and total expenses for Class A and B shares were above the median for the peer universe, such expenses (after the recommended expense cap) were within an acceptable range of the peer group and peer universe, respectively, and consistent with reasonable expectations in light of the nature, quality and extent of services provided by the Advisor.
DWS International Select Equity VIP (formerly Scudder International Select Equity Portfolio)
Nature, Quality and Extent of Services. The Board noted that, in the past, the Advisor delegated a portion of the Portfolio’s assets, to be invested in foreign securities, for management by Deutsche Asset Management Investment Services Limited (“DeAMIS”), an affiliate of the Advisor, pursuant to a sub-advisory agreement. In light of Deutsche Bank’s agreement to sell DeAMIS, the Advisor recommended that the Board not renew the sub-advisory agreement with DeAMIS, but, rather, proposed that the assets previously managed by DeAMIS be managed by the Advisor utilizing the Advisor’s existing resources. The Board received information related to the resources and capabilities of the Advisor in managing foreign securities. The Board concluded that the Advisor has the resources and capabilities to manage the foreign securities portion of the Portfolio previously managed by DeAMIS.
Fees and Expenses. The information provided to the Board showed that the Portfolio’s total expense ratio was above the median but below the fourth quartile of the peer universe for Class B shares.
The Board noted that although the Portfolio’s total expense ratio for Class B shares was above the median for the peer universe, such expenses were within an acceptable range of the peer universe and consistent with reasonable expectations in light of the nature, quality and extent of services provided by the Advisor.
DWS Salomon Aggressive Growth VIP (formerly Scudder Salomon Aggressive Growth Portfolio)
Nature, Quality and Extent of Services. The Board noted that, previously, the Advisor delegated management of the Portfolio’s assets to INVESCO Institutional N.A. (“INVESCO”), pursuant to a sub-advisory agreement. Effective August 1, 2005, the Board terminated the sub-advisory agreement with INVESCO and approved an interim sub-advisory agreement with Salomon Brothers Asset Management Inc. (“Salomon”) pending shareholder approval of the new agreement. The Board considered changes in the investment objective and strategy of the Portfolio in connection with the recent change in sub-advisor.
Fees and Expenses. The Board noted that, effective August 1, 2005, the Portfolio adopted a lower management fee schedule. The information provided to the Board showed that the Portfolio’s management fee rate (adjusted for the new management fee schedule) was above the median of the peer group and that the Portfolio’s total expense ratio was in the fourth quartile of the peer universe for Class A and Class B shares. The Board examined the total expense ratio for Class B shares less 12b-1 plan and recordkeeping expenses and noted that the expense ratio remained in the fourth quartile. The Board also took into account the Advisor’s commitment to cap expenses through April 30, 2006.
In light of the fourth quartile ranking of total expenses for Class A and Class B shares, the Board recommended that the Advisor cap total expenses for Class A shares and Class B shares (less 12b-1 plan and recordkeeping expenses) at a level within the third quartile. The Board noted that although the Portfolio’s management fee rate was above the median for the peer group and total expenses for Class A and B shares were above the median for the peer universe, such expenses (after the
395
recommended expense caps) were within an acceptable range of the peer group and peer universe, respectively, and consistent with reasonable expectations in light of the nature, quality and extent of services provided by the Advisor.
DWS Janus Growth & Income VIP (formerly SVS Janus Growth And Income Portfolio)
Fees and Expenses. The Board noted that the Advisor agreed to reduce the Portfolio’s management fee rate, effective May 1, 2005. The information provided to the Board, which reflected the management fee reduction, showed that the Portfolio’s management fee rate was above the median of the peer group but below the fourth quartile, and that the Portfolio’s total expense ratio was in the fourth quartile of the peer universe for Class B shares. The Board examined the total expense ratio of Class B shares less 12b-1 plan and recordkeeping expenses and noted that the expense ratio remained in the fourth quartile. The Board took into account the Advisor’s commitment to cap total expenses through April 30, 2006.
In light of the fourth quartile ranking of total expenses for Class B shares, the Board recommended that the Advisor cap total expenses (less 12b-1 plan and recordkeeping expenses) for Class B shares at a level within the third quartile. The Board noted that although the Portfolio’s management fee rate was above the median for the peer group and total expenses were above the median for Class B shares, such expenses (after the recommended expense cap) were within an acceptable range of the peer group and peer universe, respectively, and consistent with reasonable expectations in light of the nature, quality and extent of services provided by the Advisor.
DWS Janus Growth Opportunities VIP (formerly SVS Janus Growth Opportunities Portfolio)
Fees and Expenses. The Board noted that the Advisor agreed to reduce the Portfolio’s management fee rate, effective May 1, 2005. The information provided to the Board showed that the Portfolio’s total expense ratio was in the fourth quartile of the peer universe for Class B shares. The Board examined the total expense ratio of Class B shares less 12b-1 plan and recordkeeping expenses and noted that the expense ratio for Class B shares was below the fourth quartile.
The Board noted that although the Portfolio’s total expense ratio for Class B shares was above the median for the peer universe, such ratio was within an acceptable range of the peer universe and consistent with reasonable expectations in light of the nature, quality and extent of services provided by the Advisor.
DWS Large Cap Value VIP (formerly Scudder Large Cap Value Portfolio)
Nature, Quality and Extent of Services. The Board noted the short-term relative underperformance of the Portfolio, and took into account the factors contributing to such performance, the Portfolio’s favorable long-term performance, and steps being taken by the Advisor to improve performance.
Fees and Expenses. The information provided to the Board showed that the Portfolio’s management fee rate was above the median of the peer group but below the fourth quartile, and that the Portfolio’s total expense ratio was above the median but below the fourth quartile of the peer universe for Class B shares.
The Board noted that although the Portfolio’s management fees were above the median of the peer group and total expenses for Class B shares were above the median of peer universe, respectively, such expenses were within an acceptable range of the peer group and peer universe, respectively, and consistent with reasonable expectations in light of the nature, quality and extent of services provided by the Advisor.
396
DWS Mercury Large Cap Core VIP (formerly Scudder Mercury Large Cap Core Portfolio)
Nature, Quality and Extent of Services. The Board noted that comparative performance information was not available due to the Portfolio’s limited operating history.
Fees and Expenses. The information provided to the Board showed that the Portfolio’s total expense ratio was above the median but below the fourth quartile of the peer universe for Class A shares and in the fourth quartile of the peer universe for Class B shares. The Board examined the total expense ratio of Class B shares less 12b-1 plan and recordkeeping expenses and noted that the expense ratio of Class B shares remained in the fourth quartile.
Given that the Advisor’s estimates of current expenses provided to the Board for Class A and B shares were impacted by the current expense caps, and in light of the fourth quartile ranking of total expenses for Class B shares, the Board recommended that the expense cap for Class A shares be extended through September 30, 2006, and that the Advisor cap expenses for Class B shares through September 30, 2006 at a level within the third quartile. The Board noted that although the Portfolio’s total expense ratios for Class A and B shares were above the median for its peer universe, such expenses (after the recommended expense caps) were within an acceptable range of the peer universe and consistent with reasonable expectations in light of the small size and short operating history of the Portfolio and the nature, quality and extent of services provided by the Advisor.
DWS MFS Strategic Value VIP (formerly SVS MFS Strategic Value Portfolio)
Fees and Expenses. The information provided to the Board showed that the Portfolio’s total expense ratio was in the fourth quartile of the peer universe for Class A shares and Class B shares. The Board examined the total expense ratio for Class B shares less 12b-1 plan and recordkeeping expenses and noted that the expense ratio for Class B shares remained in the fourth quartile. The Board took into account the Advisor’s commitment to cap total expenses through April 30, 2006.
In light of the fourth quartile ranking of total expenses for Class A shares and Class B shares, the Board recommended that the Advisor cap total expenses for Class A and Class B shares (less 12b-1 plan and recordkeeping expenses) at a level within the third quartile. The Board noted that although the Portfolio’s total expense ratios for Class A and B shares were above the median for the peer universe, such expenses (after the recommended expense caps) were within an acceptable range of the peer universe, and consistent with reasonable expectations in light of the nature, quality and extent of services provided by the Advisor.
DWS Oak Strategic Equity VIP (formerly SVS Oak Strategic Equity Portfolio)
Nature, Quality and Extent of Services. The Board noted the short-term relative underperformance of the Portfolio, but considered that the Portfolio has performed at high levels over time and that such volatility is consistent with the Portfolio’s investment strategy.
Fees and Expenses. The information provided to the Board showed that the Portfolio’s management fee rate was in the fourth quartile of the peer group, and that the Portfolio’s total expense ratio was in the fourth quartile of the peer universe for Class A and Class B shares. The Board noted that, in response to questions of the Independent Trustees regarding the levels of management fee rates and total expenses, the Advisor agreed to a lower management fee schedule and lower expense caps effective with the renewal of the Agreement. The Board examined the total expense ratio for Class A and B shares (taking into effect the lower management fee) and less 12b-1 plan and recordkeeping expenses for Class B shares, and noted that the expense ratio for Class B shares remained in the fourth quartile.
In light of the fourth quartile ranking of total expenses for Class B shares, the Board recommended that the Advisor cap the total expense ratio (less 12b-1 plan and recordkeeping expenses) at a level within the third quartile. The Board noted that although the Portfolio’s total expense ratios for Class
397
A and B shares were above the median for the peer universe, such expenses (after the recommended expense cap) were within an acceptable range of the peer universe, and consistent with reasonable expectations in light of the nature, quality and extent of services provided by the Advisor.
DWS Small Cap Growth VIP (formerly Scudder Small Cap Growth Portfolio)
Nature, Quality and Extent of Services. The Board noted the long-term relative underperformance of the Portfolio, and took into account the factors contributing to such performance and steps being taken by the Advisor to improve performance.
Fees and Expenses. The Board noted that the Portfolio adopted a lower management fee schedule in connection with the acquisition of the assets and liabilities of DWS Variable Series I — 21st Century Growth Portfolio in May 2005 (the “21st Century Merger”). The information provided to the Board showed that the Portfolio’s management fee rate (taking into account the effect of the 21st Century Merger) was below the median of the peer group and that the Portfolio’s total expense ratios for Class A and Class B shares were below the median of the peer universe. The Board took into account the Advisor’s commitment to cap total expenses through April 30, 2008 in connection with the 21st Century Merger.
DWS Technology VIP (formerly Scudder Technology Growth Portfolio)
Nature, Quality and Extent of Services. The Board noted the short-term relative underperformance of the Portfolio, and took into account the factors contributing to such performance and steps being taken by the Advisor to improve performance.
Fees and Expenses. The information provided to the Board showed that the Portfolio’s total expense ratio was above the median but below the fourth quartile for Class B shares.
The Board noted that although the Portfolio’s total expense ratio for Class B shares was above the median for the peer universe, such ratio was within an acceptable range of the peer universe, and consistent with reasonable expectations in light of the nature, quality and extent of services provided by the Advisor.
DWS Templeton Foreign Value VIP (formerly Scudder Templeton Foreign Value Portfolio)
Nature, Quality and Extent of Services. The Board noted that comparative performance information was not available due to the Portfolio’s limited operating history.
Fees and Expenses. The information provided to the Board showed that the Portfolio’s total expense ratio was in the fourth quartile for Class B shares. The Board examined the total expenses ratio for Class B shares less 12b-1 plan and recordkeeping expenses and noted that the expense ratio for Class B shares was below the fourth quartile.
Given that the Advisor’s estimates of current expenses provided to the Board for Class A and Class B shares were impacted by the current expense caps, the Board recommended that the expense caps be extended through September 30, 2006 for Class A and Class B shares. The Board noted that although the Portfolio’s total expense ratio for Class B shares was above the median for the peer universe, such expenses (after the recommended expense cap) were within an acceptable range of the peer universe and consistent with reasonable expectations in light of the small size and short operating history of the Portfolio and the nature, quality and extent of services provided by the Advisor.
398
DWS Balanced VIP (formerly Scudder Total Return Portfolio)
Nature, Quality and Extent of Services. The Board noted that, in the past, the Advisor delegated management of the portion of the Portfolio’s assets, to be invested in foreign securities, to Deutsche Asset Management Investment Services Limited (“DeAMIS”), an affiliate of the Advisor, pursuant to a sub-advisory agreement. In light of Deutsche Bank’s agreement to sell DeAMIS, the Advisor recommended that the Board not renew the sub-advisory agreement with DeAMIS, but, rather, proposed that the assets previously managed by DeAMIS be managed by the Advisor utilizing the Advisor’s existing resources. The Board received information related to the resources and capabilities of the Advisor in managing foreign securities. The Board concluded that the Advisor has the resources and capabilities to manage the foreign securities portion of the Portfolio previously managed by DeAMIS.
The Board noted the relative underperformance of the Portfolio, and took into account the factors contributing to such performance and steps being taken by the Advisor to improve performance.
Fees and Expenses. The Board noted that the Portfolio adopted a lower management fee schedule in connection with the acquisition of the assets and liabilities of DWS Variable Series I — Balanced Portfolio in May 2005 (the “Balanced Fund Merger”). The information provided to the Board showed that the Portfolio’s management fee rate (taking into account the effects of the Balanced Fund Merger) was below the median of the peer group and that the Portfolio’s total expense ratio was below the median of the peer universe for Class A shares and above the median but below the fourth quartile for Class B shares. The Board took into account the Advisor’s commitment to cap total expenses for Class A shares through April 30, 2008 in connection with the Balanced Fund Merger and to cap total expenses for Class B shares through April 30, 2006.
The Board noted that although the Portfolio’s total expense ratio for Class B shares was above the median for the peer universe, such ratio was within an acceptable range of the peer universe, and consistent with reasonable expectations in light of the nature, quality and extent of services provided by the Advisor.
DWS Turner Mid Cap Growth VIP (formerly SVS Turner Mid Cap Growth Portfolio)
Nature, Quality and Extent of Services. The Board noted the short-term relative underperformance of the Portfolio, and took into account the factors contributing to such performance and steps being taken by the Advisor and Turner to improve performance.
Fees and Expenses. The information provided to the Board showed that the Portfolio’s management fee rate was in the fourth quartile of the peer group, and that the Portfolio’s total expense ratio was in the fourth quartile of the peer universe for Class A and Class B shares. The Board noted that, in response to questions of the Independent Trustees regarding the levels of the management fee rate and total expenses, the Advisor agreed to a lower management fee schedule and lower expense caps effective with the renewal of the Agreement. The Board examined the total expense ratio for Class A and B shares (taking into effect the lower management fee) and less 12b-1 plan and recordkeeping expenses for Class B shares, and noted that the expense ratio for Class B shares remained in the fourth quartile.
In light of the fourth quartile ranking of total expenses for Class B shares, the Board recommended that the Advisor cap the total expense ratio (less 12b-1 plan and recordkeeping expenses) at a level within the third quartile. The Board noted that although the Portfolio’s revised management fee rate and the total expense ratios for Class A and B shares were above the median for the peer group and peer universe, respectively, such expenses (after the recommended expense cap) were within an acceptable range of the peer group and peer universe, respectively, and consistent with reasonable expectations in light of the nature, quality and extent of services provided by the Advisor.
DWS Income Allocation VIP (formerly Scudder Conservative Income Strategy Portfolio)
399
DWS Growth Allocation VIP (formerly Scudder Growth Strategy Portfolio)
DWS Moderate Allocation VIP (formerly Scudder Growth & Income Strategy Portfolio)
DWS Conservative Allocation VIP (formerly Scudder Income & Growth Strategy Portfolio)
Nature, Quality and Extent of Services. The Board considered that the Portfolio is a fund-of-funds and that investment management services consisted primarily of asset allocation services. The Board noted that the Portfolio commenced operations on August 16, 2004 and that comparative performance results were not available due to the limited operating history of the Portfolio.
Fees and Expenses. The Board noted that the comparative Lipper peer group and peer universe information included many mutual funds that were not structured as funds-of-funds. As a result, the information provided to the Board showed that the Portfolio’s management fee rate was below the median of the peer group and that the Portfolio’s total expense ratio was below the median of the peer universe. Based upon questions from the Independent Trustees, the Advisor produced additional comparative information on other funds-of-funds selected by the Advisor. Based upon that data, the Board observed that the Portfolio’s management fees for the asset allocation service were above the median. The Board took into account the Advisor’s commitment to cap total expenses through April 30, 2006.
Given that the Advisor’s estimate of current expenses provided to the Board was impacted by a voluntary cap on management fees, the Board recommended that the Advisor make such cap contractual through September 30, 2006.
Profitability. The Board did not receive profitability information with respect to the Portfolio, but did receive such information with respect to the funds in which the Portfolio invests.
DWS Core Fixed Income VIP (formerly Scudder Fixed Income Portfolio)
Nature, Quality and Extent of Services. The Board noted the Advisor’s representation that in connection with Deutsche Bank’s agreement to sell Deutsche Asset Management Investment Services Limited, an affiliate of the Advisor, to Aberdeen Asset Management PLC (“Aberdeen”), it expects that substantially all the members of the portfolio management team that currently manages the fixed income portion of the Portfolio will undertake employment with Aberdeen. The Board also noted the Advisor’s recommendation to retain Aberdeen as subadvisor, with no increase in fees.
Fees and Expenses. The information provided to the Board showed that the Portfolio’s management fee rate was above the median of the peer group but below the fourth quartile, and that the Portfolio’s total expense ratio was in the fourth quartile of the peer universe for Class B shares. The Board examined the total expense ratio of Class B shares less 12b-1 plan and recordkeeping expenses and noted that the expense ratio for Class B shares was below the fourth quartile. The Board took into account the Advisor’s commitment to cap total expenses through April 30, 2006.
The Board noted that, although the Portfolio’s management fee rate was above the median of the peer group and the total expense ratio for Class B shares was above the median of the peer universe, such management fee rate and total expense ratio were within an acceptable range of the peer group and peer universe, respectively, and consistent with reasonable expectations in light of the nature, quality and extent of services provided by the Advisor.
DWS Government & Agency Securities VIP (formerly Scudder Government & Agency Securities Portfolio)
Fees and Expenses. The information provided to the Board showed that the Portfolio’s total expense ratio was in the fourth quartile of the peer universe for Class B shares. The Board examined the total
400
expense ratio of Class B shares less 12b-1 plan and recordkeeping expenses and noted that the expense ratio for Class B shares was below the fourth quartile.
The Board noted that, although the Portfolio’s total expense ratio for Class B shares was above the median of the peer universe, such ratio was within an acceptable range of the peer universe and consistent with reasonable expectations in light of the nature, quality and extent of services provided by the Advisor.
DWS High Income VIP (formerly Scudder High Income Portfolio)
Fees and Expenses. The information provided to the Board showed that the Portfolio’s total expense ratio was in the fourth quartile of the peer universe for Class B shares. The Board examined the total expense ratio for Class B shares less 12b-1 plan and recordkeeping expenses and noted that the expense ratio was below the fourth quartile.
The Board noted that, although the Portfolio’s total expense ratio for Class B shares was above the median of the peer universe, such ratio was within an acceptable range of the peer universe and consistent with reasonable expectations in light of the nature, quality and extent of services provided by the Advisor.
DWS Strategic Income VIP (formerly Scudder Strategic Income Portfolio)
Nature, Quality and Extent of Services. The Board noted that, in the past, the Advisor delegated management of the portion of the Portfolio’s assets, to be invested in foreign securities, to Deutsche Asset Management Investment Services Limited (“DeAMIS”), an affiliate of the Advisor, pursuant to a sub-advisory agreement. In light of Deutsche Bank’s agreement to sell DeAMIS, the Advisor recommended that the Board not renew the sub-advisory agreement with DeAMIS, but, rather, proposed that the assets previously managed by DeAMIS be managed by the Advisor utilizing the Advisor’s existing resources. The Board received information related to the resources and capabilities of the Advisor in managing foreign securities. The Board concluded that the Advisor has the resources and capabilities to manage the foreign securities portion of the Portfolio previously managed by DeAMIS.
Fees and Expenses. The information provided to the Board showed that the Portfolio’s total expense ratio was in the fourth quartile of the peer universe for Class B shares. The Board examined the total expenses for Class B shares less 12b-1 plan and recordkeeping expenses and noted that the expense ratio for Class B shares remained in the fourth quartile. The Board took into account the Advisor’s commitment to cap total expenses through April 30, 2006.
In light of the fourth quartile ranking of total expenses for Class B shares, the Board recommended that total expenses (less 12b-1 plan and recordkeeping expenses) for Class B shares be capped at a level within the third quartile. The Board noted that, although the Portfolio’s total expense ratio for Class B shares was above the median of the peer universe, such ratio (after the recommended expense cap) was within an acceptable range of the peer universe and consistent with reasonable expectations in light of the nature, quality and extent of services provided by the Advisor.
DWS Money Market VIP (formerly Scudder Money Market Portfolio)
Nature, Quality and Extent of Services. The Board reviewed the Portfolio’s gross and net performance over short-term and long-term periods and compared those returns to various agreed-upon performance measures, including peer groups focusing, for this purpose, primarily on gross performance. The Board concluded that the Portfolio’s gross performance over time was satisfactory.
Fees and Expenses. The information provided to the Board showed that the Portfolio’s management fee
401
rate was above the median of the peer group, but below the fourth quartile, and that the Portfolio’s total expense ratio was in the fourth quartile of the peer universe for Class B shares. The Board examined the total expense ratio less 12b-1 plan and recordkeeping expenses for Class B shares and noted that the expense ratio was below the fourth quartile.
The Board noted that although the Portfolio’s management fee rate was above the median of the peer group and the total expense ratio for Class B shares was above the median of the peer universe, such expenses were within an acceptable range of the peer group and peer universe, respectively, and consistent with reasonable expectations in light of the nature, quality and extent of services provided by the Advisor.
Based on all of the information considered and the conclusions reached, the Board (including a majority of the Independent Trustees) determined that the terms of each Agreement continue to be fair and reasonable and that the continuation of each Agreement is in the best interests of each Portfolio. No single factor was determinative in the Board’s analysis.
Board Considerations in Connection with the Annual Review of the Sub-Advisory Agreement for each of the following “Portfolios”:
DWS Davis Venture Value VIP
DWS Dreman High Return Equity VIP
DWS Dreman Small Cap Value VIP
DWS Janus Growth & Income VIP
DWS Janus Growth Opportunities VIP
DWS Mercury Large Cap Core VIP
DWS MFS Strategic Value VIP
DWS Oak Strategic Equity VIP
DWS Templeton Foreign Value VIP
DWS Turner Mid Cap Growth VIP
The Board of Trustees, including the Independent Trustees, approved the renewal of each Portfolio’s sub-advisory agreement (the “Sub-Advisory Agreement”) between Deutsche Investment Management Americas Inc. (“DeIM” or the “Advisor”) and each Portfolio’s sub-advisor (each a “Sub-Advisor”) in September 2005. As part of its review process, the Board requested and evaluated all information it deemed reasonably necessary to evaluate each Sub-Advisory Agreement. The review process followed by the Board is described in detail above. In connection with the renewal of the Sub-Advisory Agreements, the various Committees and the Board considered the factors described below, among others.
Nature, Quality and Extent of Services. The Board considered the nature, extent and quality of services provided under each Sub-Advisory Agreement. The Board considered the reputation, qualifications and background of each Sub-Advisor, investment approach of each Sub-Advisor, the experience and skills of investment personnel responsible for the day-to-day management of each Portfolio, and the resources made available to such personnel. The Board considered short-term and longer-term performance of each Portfolio (as described above).
402
On the basis of this evaluation and the ongoing review of investment results by the Equity Oversight Committee, the Board concluded that the nature, quality and extent of services provided by each Sub-Advisor historically have been and continue to be satisfactory and that, except as discussed below, each Portfolio’s performance during the tenure of the Sub-Advisor was satisfactory.
With respect to DWS Oak Strategic Equity VIP, the Board noted that although the short-term performance of the Portfolio was disappointing, the Portfolio has performed at high levels over time and such volatility is consistent with the Portfolio’s investment strategy. With respect to DWS Turner Mid Cap Growth VIP, the Board noted the disappointing short-term performance of the Portfolio, and took into account the factors contributing to such underperformance, steps being taken to improve performance and also considered favorable year-to-date performance.
Fees; Profitability and Economies of Scale. The Board considered the sub-advisory fee rate of each Sub-Advisory Agreement and how it related to the overall management fee structure of the Portfolio. With respect to the Portfolios subadvised by Janus Capital Management LLC (“Janus”), the Board noted that Janus agreed to reduce its sub-advisory fees, effective May 1, 2005. With respect to the Portfolios subadvised by Dreman Value Management, L.L.C. (“Dreman”), the Board considered the terms of a relationship agreement between the Advisor and Dreman. The Board considered that each sub-advisory fee rate was negotiated at arm’s length between the Advisor and Sub-Advisor, an unaffiliated third party, and that the Advisor compensates each Sub-Advisor from its fees. Accordingly, the Board considered the estimated profitability of the Advisor and did not consider estimated profitability of each Sub-Advisor. The Board evaluated whether the overall management fees payable by each Portfolio were designed to share economies of scale.
As part of its review of the investment management agreement with DeIM, the Board considered whether there will be economies of scale with respect to the overall fee structure of each Portfolio and whether the Portfolio will benefit from any economies of scale. With respect to DWS Oak Strategic Equity VIP, DWS Turner Mid Cap Growth VIP and the Portfolios subadvised by Janus, the Board noted that the Advisor agreed to reduce each Portfolio’s management fee, effective October 1, 2005 for DWS Oak Strategic Equity VIP and DWS Turner Mid Cap Growth VIP, and May 1, 2005 for the Portfolios subadvised by Janus. The Board noted that most investment management agreements with DeIM included breakpoints and concluded that the overall structure was designed to share economies of scale with shareholders.
Other Benefits to the Sub-Advisor. The Board also considered the character and amount of other incidental benefits received by each Sub-Advisor and their affiliates. For the Portfolios subadvised by Dreman, this includes benefits received by Dreman in connection with executing brokerage transactions for the Portfolios. For all other sub-advised Portfolios, the Board noted that each Sub-Advisor agreed to adhere to DeIM’s Soft Dollar Policy for the Portfolios, which includes an agreement not to use Portfolio brokerage transactions to pay for research services generated by parties other than the executing broker-dealer. The Board concluded that the sub-advisory fees were reasonable in light of these fallout benefits.
Based on all of the information considered and the conclusions reached, the Board (including a majority of the Independent Trustees) determined that the terms of each Sub-Advisory Agreement continue to be fair and reasonable and that the continuation of each Sub-Advisory Agreement is in the best interests of each Portfolio. No single factor was determinative in the Board’s analysis.
Trustees and Officers
The following table presents certain information regarding the Trustees and Officers of the fund as of December 31, 2005. Each individual’s year of birth is set forth in parentheses after his or her name. Unless otherwise noted, (i) each individual has engaged in the principal occupation(s) noted in the table for at least the most recent five years, although not necessarily in the same capacity, and (ii)
403
the address of each individual is c/o Deutsche Asset Management, 222 South Riverside Plaza, Chicago, Illinois 60606. Each Trustee’s term of office extends until the next shareholders’ meeting called for the purpose of electing Trustees and until the election and qualification of a successor, or until such Trustee sooner dies, retires, resigns or is removed as provided in the governing documents of the fund.
Independent Trustees
| | | | |
Name, Year of Birth,
Position(s) Held with the Fund and Length of Time Served1 | | Principal Occupation(s) During Past 5 Years and Other Directorships Held | | Number of Funds in
Fund
Complex
Overseen |
Shirley D. Peterson (1941) Chairperson, 2004-present Trustee, 1995-present | | Retired; formerly, President, Hood College (1995-2000); prior thereto, Partner, Steptoe & Johnson (law firm); Commissioner, Internal Revenue Service; Assistant Attorney General (Tax), US Department of Justice. Directorships: Federal Mogul Corp. (supplier of automotive components and subsystems); AK Steel (steel production); Goodyear Tire & Rubber Co. (April 2004-present) ; Champion Enterprises, Inc. (manufactured home building); Wolverine World Wide, Inc. (designer, manufacturer and marketer of footwear) (April 2005-present); Trustee, Bryn Mawr College. Former Directorship: Bethlehem Steel Corp. | | 71 |
| | |
John W. Ballantine (1946) Trustee, 1999-present | | Retired; formerly, Executive Vice President and Chief Risk Management Officer, First Chicago NBD Corporation/The First National Bank of Chicago (1996-1998); Executive Vice President and Head of International Banking (1995-1996). Directorships: First Oak Brook Bancshares, Inc.; Oak Brook Bank; Healthways, Inc. (provider of disease and care management services); Portland General Electric (utility company) | | 71 |
| | |
Donald L. Dunaway (1937) Trustee, 1980-present | | Retired; formerly, Executive Vice President, A.O. Smith Corporation (diversified manufacturer) (1963-1994) | | 71 |
| | |
James R. Edgar (1946) Trustee, 1999-present | | Distinguished Fellow, University of Illinois, Institute of Government and Public Affairs (1999-present); formerly, Governor, State of Illinois (1991-1999). Directorships: Kemper Insurance Companies; John B. Sanfilippo & Son, Inc. (processor/packager/marketer of nuts, snacks and candy products); Horizon Group Properties, Inc.; Youbet.com (online wagering platform); Alberto-Culver Company (manufactures, distributes and markets health and beauty care products) | | 71 |
| | |
Paul K. Freeman (1950) Trustee, 2002-present | | President, Cook Street Holdings (consulting); Senior Visiting Research Scholar, Graduate School of International Studies, University of Denver; Consultant, World Bank/Inter-American Development Bank; formerly, Project Leader, International Institute for Applied Systems Analysis (1998-2001); Chief Executive Officer, The Eric Group, Inc. (environmental insurance) (1986-1998) | | 71 |
| | |
Robert B. Hoffman (1936) Trustee, 1981-present | | Retired; formerly, Chairman, Harnischfeger Industries, Inc. (machinery for the mining and paper industries) (1999-2000); prior thereto, Vice Chairman and Chief Financial Officer, Monsanto Company (agricultural, pharmaceutical and nutritional/food products) (1994-1999). Directorships: RCP Advisors, LLC (a private equity investment advisory firm) | | 71 |
| | |
William McClayton (1944) Trustee, 2004-present | | Managing Director of Finance and Administration, DiamondCluster International, Inc. (global management consulting firm) (2001-present); formerly, Partner, Arthur Andersen LLP (1986-2001). Formerly: Trustee, Ravinia Festival; Board of Managers, YMCA of Metropolitan Chicago | | 71 |
| | |
Robert H. Wadsworth (1940) Trustee, 2004-present | | President, Robert H. Wadsworth Associates, Inc. (consulting firm) (1983-present). Director, The European Equity Fund, Inc. (since 1986), The New Germany Fund, Inc. (since 1992), The Central Europe and Russia Fund, Inc. (since 1990). Formerly, Trustee of New York Board Scudder Funds; President and Trustee, Trust for Investment Managers (registered investment company) (1999-2002). President, Investment Company Administration, L.L.C. (1992*-2001); President, Treasurer and Director, First Fund Distributors, Inc. (June 1990-January 2002); Vice President, Professionally Managed Portfolios (May 1991-January 2002) and Advisors Series Trust (October 1996-January 2002) (registered investment companies) | | 74 |
| * | Inception date of the corporation which was the predecessor to the L.L.C. |
404
Interested Trustee and Officers2
| | | | |
Name, Year of Birth, Position(s)
Held with the Fund and Length of
Time Served1 | | Principal Occupation(s) During Past 5 Years and Other Directorships Held | | Number of Funds in Fund Complex Overseen |
William N. Shiebler4 (1942) Trustee, 2004-present | | Vice Chairman, Deutsche Asset Management (“DeAM”) and a member of the DeAM Global Executive Committee (since 2002); Vice Chairman of Putnam Investments, Inc. (1999); Director and Senior Managing Director of Putnam Investments, Inc. and President, Chief Executive Officer, and Director of Putnam Mutual Funds Inc. (1990-1999) | | 120 |
Vincent J. Esposito4 (1956) President, 2005-present | | Managing Director3, Deutsche Asset Management (since 2003); President and Chief Executive Officer of The Central Europe and Russia Fund, Inc., The European Equity Fund, Inc., The New Germany Fund, Inc. (since 2003) (registered investment companies); Vice Chairman and Director of The Brazil Fund, Inc. (2004-present); formerly, Managing Director, Putnam Investments (1991-2002) | | n/a |
| | |
Philip J. Collora (1945) Vice President and Assistant Secretary, 1986-present | | Director3, Deutsche Asset Management | | n/a |
| | |
Paul H. Schubert4 (1963) Chief Financial Officer, 2004-present Treasurer, 2005-present | | Managing Director3, Deutsche Asset Management (since July 2004); formerly, Executive Director, Head of Mutual Fund Services and Treasurer for UBS Family of Funds (1998-2004); Vice President and Director of Mutual Fund Finance at UBS Global Asset Management (1994-1998) | | n/a |
| | |
John Millette5 (1962) Secretary, 2001-present | | Director3, Deutsche Asset Management | | n/a |
| | |
Patricia DeFilippis4 (1963) Assistant Secretary, 2005-present | | Vice President, Deutsche Asset Management (since June 2005); Counsel, New York Life Investment Management LLC (2003-2005); legal associate, Lord, Abbett & Co. LLC (1998-2003) | | n/a |
| | |
Elisa D. Metzger4,6 (1962) Assistant Secretary 2005-present | | Director3, Deutsche Asset Management (since September 2005); Counsel, Morrison and Foerster LLP (1999-2005) | | n/a |
| | |
Caroline Pearson5 (1962) Assistant Secretary, 1998-present | | Managing Director3, Deutsche Asset Management | | n/a |
| | |
Scott M. McHugh5 (1971) Assistant Treasurer, 2005-present | | Director3, Deutsche Asset Management | | n/a |
| | |
Kathleen Sullivan D’Eramo5 (1957) Assistant Treasurer, 2003-present | | Director3, Deutsche Asset Management | | n/a |
| | |
John Robbins4 (1966) Anti-Money Laundering Compliance Officer, 2005-present | | Managing Director3, Deutsche Asset Management (since 2005); formerly, Chief Compliance Officer and Anti-Money Laundering Compliance Officer for GE Asset Management (1999-2005) | | n/a |
| | |
Philip Gallo4 (1962) Chief Compliance Officer, 2004-present | | Managing Director3, Deutsche Asset Management (2003-present); formerly, Co-Head of Goldman Sachs Asset Management Legal (1994-2003) | | n/a |
| 1 | Length of time served represents the date that each Trustee was first elected to the common board of Trustees which oversees a number of investment companies, including the fund, managed by the Advisor. For the Officers of the fund, the length of time served represents the date that each officer was first elected to serve as an officer of any fund overseen by the aforementioned common board of Trustees. |
| 2 | As a result of their respective positions held with the Advisor, these individuals are considered “interested persons” of the Advisor within the meaning of the 1940 Act. Interested persons receive no compensation from the fund. |
| 3 | Executive title, not a board directorship |
405
| 4 | Address: 345 Park Avenue, New York, New York 10154 |
| 5 | Address: Two International Place, Boston, Massachusetts 02110 |
| 6 | Elected on November 15, 2005 |
The fund’s Statement of Additional Information (“SAI”) includes additional information about the Trustees. The SAI is available, without charge, upon request. If you would like to request a copy of the SAI, you may do so by calling the following toll-free number: 1-800-621-1048.

About the Fund’s Advisor
DWS Scudder is part of Deutsche Asset Management, which is the marketing name in the US for the asset management activities of Deutsche Bank AG, Deutsche Bank Trust Company Americas, Deutsche Asset Management, Inc., Deutsche Investment Management Americas Inc. and DWS Trust Company.
An investment in DWS Money Market VIP is not insured or guaranteed by the Federal Deposit Insurance Corporation or any other government agency. Although DWS Money Market VIP seeks to preserve the value of your investment at $1.00 per share, it is possible to lose money by investing in the Portfolio.
The views expressed in this report reflect those of the portfolio managers only through the end of the period of the report as stated on the cover. The managers’ views are subject to change at any time based on market and other conditions and should not be construed as a recommendation.
This information must be preceded or accompanied by a current prospectus.
Portfolio changes should not be considered recommendations for action by individual investors.
DWS Scudder Distributors, Inc.
222 South Riverside Plaza
Chicago, IL 60606
(800) 778-1482
VS2-2 (2/06) 42921
406
DWS VARIABLE SERIES II
PART C – OTHER INFORMATION
Item 15. Indemnification.
Article VIII of the Registrant’s Amended and Restated Agreement and Declaration of Trust (Exhibit (1)(a) hereto, which is incorporated herein by reference) provides in effect that the Registrant will indemnify its officers and trustees under certain circumstances. However, in accordance with Section 17(h) and 17(i) of the Investment Company Act of 1940 and its own terms, said Article of the Amended and Restated Agreement and Declaration of Trust does not protect any person against any liability to the Registrant or its shareholders to which such Trustee would otherwise be subject by reason of willful misfeasance, bad faith, gross negligence, or reckless disregard of the duties involved in the conduct of his or her office.
Each of the trustees who is not an “interested person” (as defined under the Investment Company Act of 1940) of Registrant (a “Non-interested Trustee”) has entered into an indemnification agreement with Registrant, which agreement provides that the Registrant shall indemnify the Non-interested Trustee against certain liabilities which such Trustee may incur while acting in the capacity as a trustee, officer or employee of the Registrant to the fullest extent permitted by law, now or in the future, and requires indemnification and advancement of expenses unless prohibited by law. The indemnification agreement cannot be altered without the consent of the Non-interested Trustee and is not affected by amendment of the Amended and Restated Agreement and Declaration of Trust. In addition, the indemnification agreement adopts certain presumptions and procedures which may make the process of indemnification and advancement of expenses more timely, efficient and certain. In accordance with Section 17(h) of the Investment Company Act of 1940, the indemnification agreement does not protect a Non-interested Trustee against any liability to the Registrant or its shareholders to which such Trustee would otherwise be subject by reason of willful misfeasance, bad faith, gross negligence, or reckless disregard of the duties involved in the conduct of his or her office.
The Registrant has purchased insurance policies insuring its officers and trustees against certain liabilities which such officers and trustees may incur while acting in such capacities and providing reimbursement to the Registrant for sums which it may be permitted or required to pay to its officers and trustees by way of indemnification against such liabilities, subject to certain deductibles.
On April 5, 2002, Zurich Scudder Investments, Inc. (“Scudder”), the investment adviser, now known as Deutsche Investment Management Americas Inc. (“DeIM”), was acquired by Deutsche Bank AG, not including certain U.K. Operations (the “Transaction”). In connection with the Trustees’ evaluation of the Transaction, Deutsche Bank agreed to indemnify, defend and hold harmless Registrant and the trustees who were not “interested persons” of Scudder, Deutsche Bank or Registrant (the “Independent Trustees”) for and against any liability and claims and expenses based upon or arising from, whether in whole or in part, or directly or indirectly, any untrue statement or alleged untrue statement of a material fact made to the Independent Trustees by Deutsche Bank in connection with the Independent Trustees’ consideration of the Transaction, or any omission or alleged omission of a material fact necessary in order to make statements made, in light of the circumstances under which they were made, not misleading.
DeIM, the investment advisor, has also agreed, subject to applicable law and regulation, to indemnify and hold harmless the Registrant against any loss, damage, liability and expense, including, without limitation, the advancement and payment, as incurred, of reasonable fees and expenses of counsel (including counsel to the Registrant and counsel to the Non-interested Trustees) and consultants, whether retained by the Registrant or the Non-interested Trustees, and other customary costs and expenses
C-1
incurred by the Registrant in connection with any litigation or regulatory action related to possible improper market timing or other improper trading activity or possible improper marketing and sales activity in the Registrant (“Private Litigation and Enforcement Actions”). In the event that this indemnification is unavailable to the Registrant for any reason, then DeIM has agreed to contribute to the amount paid or payable by the Registrant as a result of any loss, damage, liability or expense in such proportion as is appropriate to reflect the relative fault of DeIM and the Registrant with respect to the matters which resulted in such loss, damage, liability or expense, as well as any other relevant equitable considerations; provided; however, if no final determination is made in such action or proceeding as to the relative fault of DeIM and the Registrant, then DeIM shall pay the entire amount of such loss, damage, liability or expense.
In recognition of its undertaking to indemnify the Registrant, DeIM has also agreed, subject to applicable law and regulation, to indemnify and hold harmless each of the Non-interested Trustees against any and all loss, damage, liability and expense, including without limitation the advancement and payment as incurred of reasonable fees and expenses of counsel and consultants, and other customary costs and expenses incurred by the Non-interested Trustees, arising from the Private Litigation and Enforcement, including without limitation:
1. all reasonable legal and other expenses incurred by the Non-interested Trustees in connection with the Private Litigation and Enforcement Actions, and any actions that may be threatened or commenced in the future by any person (including any governmental authority), arising from or similar to the matters alleged in the Private Litigation and Enforcement Actions, including without limitation expenses related to the defense of, service as a witness in, or monitoring of such proceedings or actions;
2. all liabilities and expenses incurred by any Non-interested Trustee in connection with any judgment resulting from, or settlement of, any such proceeding, action or matter;
3. any loss or expense incurred by any Non-interested Trustee as a result of the denial of, or dispute about, any insurance claim under, or actual or purported rescission or termination of, any policy of insurance arranged by DeIM (or by a representative of DeIM acting as such, acting as a representative of the Registrant or of the Non-interested Trustee or acting otherwise) for the benefit of the Non-interested Trustee, to the extent that such denial, dispute or rescission is based in whole or in part upon any alleged misrepresentation made in the application for such policy or any other alleged improper conduct on the part of DeIM, any of its corporate affiliates, or any of their directors, officers or employees;
4. any loss or expense incurred by any Non-interested Trustee, whether or not such loss or expense is otherwise covered under the terms of a policy of insurance, but for which the Non-interested Trustee is unable to obtain advancement of expenses or indemnification under that policy of insurance, due to the exhaustion of policy limits which is due in whole or in part to DeIM or any affiliates thereof having received advancement of expenses or indemnification under that policy for or with respect to a matter which is the subject of the indemnification agreement; provided, however, the total amount which DeIM will be obligated to pay under this provision for all loss or expense, will not exceed the amount that DeIM and any of its affiliate actually receive under that policy or insurance for or with respect to a matter which is the subject of the indemnification agreement; and
5. all liabilities and expenses incurred by any Non-interested Trustee in connection with any proceeding or action to enforce his or her rights under the agreement, unless DeIM prevails on the merits of any such dispute in a final, nonappealable court order.
C-2
DeIM is not required to pay costs or expenses or provide indemnification to or for any individual Non-interested Trustee (i) with respect to any particular proceeding or action as to which the Board of the Registrant has determined that such Non-interested Trustee ultimately will not be entitled to indemnification with respect thereto, or (ii) for any liability of the Non-interested Trustee to the Registrant or its shareholders to which such Non-interested Trustee would otherwise be subject by reason of willful misfeasance, bad faith, gross negligence, or reckless disregard of the Non-interested Trustee’s duties as a Trustee of the Registrant as determined in a final adjudication in such proceeding or action. In addition, to the extent that DeIM has paid costs or expenses under the agreement to any individual Non-interested Trustee with respect to a particular proceeding or action, and there is a final adjudication in such proceeding or action of the Non-interested Trustee’s liability to the Registrant or its shareholders by reason of willful misfeasance, bad faith, gross negligence, or reckless disregard of the Non-interested Trustee’s duties as a Trustee of the Registrant, such Non-interested Trustee has undertaken to repay such costs or expenses to DeIM.
Item 16. Exhibits.
| | | | |
| Exhibit 1 | | 1. | | Amended and Restated Agreement and Declaration of Trust, dated April 24, 1998. (Incorporated by reference to Post-Effective Amendment No. 22 to the Registration Statement, filed April 28, 1998.) |
| | |
| | 2. | | Certificate of Amendment of Declaration of Trust, dated March 31, 1999. (Incorporated by reference to Post-Effective Amendment No. 24 to the Registration Statement, filed on April 29, 1999.) |
| | |
| | 3. | | Amended and Restated Establishment and Designation of Series of Shares of Beneficial Interest dated March 31, 1999. (Incorporated by reference to Post-Effective Amendment No. 27 to the Registration Statement, filed on September 1, 1999.) |
| | |
| | 4. | | Amended and Restated Establishment and Designation of Series of Shares of Beneficial Interest dated July 14, 1999. (Incorporated by reference to Post-Effective Amendment No. 27 to the Registration Statement, filed on September 1, 1999.) |
| | |
| | 5. | | Amended and Restated Establishment and Designation of Series of Shares of Beneficial Interest dated September 29, 1999. (Incorporated by reference to Post-Effective Amendment No. 29 to the Registration Statement, filed on October 29, 1999.) |
| | |
| | 6. | | Redesignation of Series dated May 1, 2000. (Incorporated by reference to Post-Effective Amendment No. 32 to the Registration Statement, filed on May 1, 2000.) |
| | |
| | 7. | | Amended and Restated Establishment and Designation of Series of Shares of Beneficial Interest dated January 24, 2001. (Incorporated by reference to Post-Effective Amendment No. 33 to the Registration Statement, filed on February 15, 2001.) |
C-3
| | | | |
| | 8. | | Amended and Restated Establishment and Designation of Series of Shares of Beneficial Interest dated March 28, 2001. (Incorporated by reference to Post-Effective Amendment No. 36 to the Registration Statement, filed on May 1, 2002.) |
| | |
| | 9. | | Redesignation of Series dated November 29, 2000. (Incorporated by reference to Post-Effective Amendment No. 33 to the Registration Statement, filed on February 15, 2001.) |
| | |
| | 10. | | Amended and Restated Establishment and Designation of Series of Shares of Beneficial Interest dated March 20, 2002. (Incorporated by reference to Post-Effective Amendment No. 36 to the Registration Statement, filed on May 1, 2002.) |
| | |
| | 11. | | Certificate of Amendment of Declaration of Trust, dated November 29, 2000. (Incorporated by reference to Post-Effective Amendment No. 33 to the Registration Statement, filed on February 15, 2001.) |
| | |
| | 12. | | Redesignation of Series for SVS Dreman Small Cap Value Portfolio, dated January 15, 2002. (Incorporated by reference to Post-Effective Amendment No. 35 to the Registration statement, filed on February 13, 2002.) |
| | |
| | 13. | | Establishment and Designation of Series of Shares of Beneficial Interest for SVS MFS Strategic Value Portfolio dated March 20, 2002. (Incorporated by reference to Post-Effective Amendment No. 36 to the Registration Statement, filed on May 1, 2002.) |
| | |
| | 14. | | Establishment and Designation of Class of Shares of Beneficial Interest dated November 28, 2001. (Incorporated by reference to Post-Effective Amendment No. 36 to the Registration Statement, filed on May 1, 2002.) |
| | |
| | 15. | | Amended and Restated Establishment and Designation of Series of Shares of Beneficial Interest, dated January 15, 2003. (Incorporated by reference to Post-Effective Amendment No. 38 to the Registration Statement, filed on February 28, 2003.) |
| | |
| | 16. | | Establishment and Designation of Classes of Shares of Beneficial Interest, No Par Value Going Forth, dated January 15, 2003. (Incorporated by reference to Post-Effective Amendment No. 38 to the Registration Statement, filed on February 28, 2003.) |
| | |
| | 17. | | Redesignation of Series of Shares of Beneficial Interest as Scudder High Income Portfolio, dated September 2002. (Incorporated by reference to Post-Effective Amendment No. 39 to the Registration Statement, filed on April 30, 2003.) |
| | |
| | 18. | | Establishment and Designation of Classes of Shares of Beneficial Interest, as Scudder Strategic Income Portfolio, dated January 15, 2003. (Incorporated by reference to Post-Effective Amendment No. 39 to the Registration Statement, filed on April 30, 2003.) |
C-4
| | | | |
| | 19. | | Redesignation of Series of Shares of Beneficial Interest as Scudder Fixed Income Portfolio, dated January 15, 2003. (Incorporated by reference to Post-Effective Amendment No. 39 to the Registration Statement, filed on April 30, 2003.) |
| | |
| | 20. | | Amended and Restated Establishment and Designation of Classes of Series of Shares of Beneficial Interest dated March 17, 2004. (Incorporated by reference to Post-Effective Amendment No. 45 to the Registration Statement, filed on April 1, 2004.) |
| | |
| | 21. | | Redesignation of Series as Scudder Government & Agency Securities Portfolio, dated March 17, 2004. (Incorporated by reference to Post-Effective Amendment No. 54 to the Registration Statement, filed on November 15, 2004.) |
| | |
| | 22. | | Amended and Restated Establishment and Designation of Series of Shares of Beneficial Interest dated November 12, 2004. (Incorporated by reference to Post-Effective Amendment No. 56 to the Registration Statement, filed on February 25, 2005.) |
| | |
| | 23. | | Redesignation of Series, dated July 20, 2005. (Incorporated by reference to Post-Effective Amendment No. 58 to the Registration Statement, filed on March 2, 2006.) |
| | |
| | 24. | | Redesignation of Series of each portfolio of Scudder Variable Series II, dated December 30, 2005. (Incorporated by reference to Post-Effective Amendment No. 59 to the Registration Statement, filed on May 1, 2006.) |
| | |
| | 25. | | Redesignation of Series as DWS Legg Mason Aggressive Growth VIP, dated March 8, 2006. (Incorporated by reference to Post-Effective Amendment No. 59 to the Registration Statement, filed on May 1, 2006.) |
| | |
| | 26. | | Certificate of Amendment to Declaration of Trust, dated November 16, 2005. (Incorporated by reference to Post-Effective Amendment No. 59 to the Registration Statement, filed on May 1, 2006.) |
| | |
| Exhibit 2 | | 1. | | By-laws. (Incorporated by reference to Post-Effective Amendment No. 14 to the Registration Statement, filed on April 27, 1995.) |
| | |
| | 2. | | Amended By-laws dated November 30, 2000. (Incorporated by reference to Post-Effective Amendment No. 36 to the Registration Statement, filed on May 1, 2002.) |
| | |
| Exhibit 3 | | | | Not Applicable. |
| | |
| Exhibit 4 | | | | Form of Agreement and Plan of Reorganization is filed herein as Exhibit A to Part A of this Registration Statement on Form N-14. |
| | |
| Exhibit 5 | | | | Text of Share Certificate. (Incorporated by reference to Post-Effective Amendment No. 14 to the Registration Statement, filed on April 27, 1995.) |
C-5
| | | | |
| Exhibit 6 | | 1. | | Investment Management Agreement between the Registrant, on behalf of Scudder Aggressive Growth Portfolio and Deutsche Investment Management Americas Inc. dated April 5, 2002. (Incorporated by reference to Post-Effective Amendment No. 36 to the Registration Statement, filed on May 1, 2002.) |
| | |
| | 2. | | Investment Management Agreement between the Registrant, on behalf of Scudder Blue Chip Portfolio and Deutsche Investment Management Americas Inc. dated April 5, 2002. (Incorporated by reference to Post-Effective Amendment No. 36 to the Registration Statement, filed on May 1, 2002.) |
| | |
| | 3. | | Investment Management Agreement between the Registrant, on behalf of Scudder Contrarian Value Portfolio and Deutsche Investment Management Americas Inc. dated April 5, 2002. (Incorporated by reference to Post-Effective Amendment No. 36 to the Registration Statement, filed on May 1, 2002.) |
| | |
| | 4. | | Investment Management Agreement between the Registrant, on behalf of Scudder Global Blue Chip Portfolio and Deutsche Investment Management Americas Inc. dated April 5, 2002. (Incorporated by reference to Post-Effective Amendment No. 36 to the Registration Statement, filed on May 1, 2002.) |
| | |
| | 5. | | Investment Management Agreement between the Registrant, on behalf of Scudder Government Securities Portfolio and Deutsche Investment Management Americas Inc. dated April 5, 2002. (Incorporated by reference to Post-Effective Amendment No. 36 to the Registration Statement, filed on May 1, 2002.) |
| | |
| | 6. | | Investment Management Agreement between the Registrant, on behalf of Scudder High Yield Portfolio and Deutsche Investment Management Americas Inc. dated April 5, 2002. (Incorporated by reference to Post-Effective Amendment No. 36 to the Registration Statement, filed on May 1, 2002.) |
| | |
| | 7. | | Investment Management Agreement between the Registrant, on behalf of Scudder Investment Grade Bond Portfolio and Deutsche Investment Management Americas Inc. dated April 5, 2002. (Incorporated by reference to Post-Effective Amendment No. 36 to the Registration Statement, filed on May 1, 2002.) |
| | |
| | 8. | | Investment Management Agreement between the Registrant, on behalf of Scudder Money Market Portfolio and Deutsche Investment Management Americas Inc. dated April 5, 2002. (Incorporated by reference to Post-Effective Amendment No. 36 to the Registration Statement, filed on May 1, 2002.) |
| | |
| | 9. | | Investment Management Agreement between the Registrant, on behalf of Scudder Small Cap Growth Portfolio and Deutsche Investment Management Americas Inc. dated April 5, 2002. (Incorporated by reference to Post-Effective Amendment No. 36 to the Registration Statement, filed on May 1, 2002.) |
| | |
| | 10. | | Investment Management Agreement between the Registrant, on behalf of Scudder Strategic Income Portfolio and Deutsche Investment Management Americas Inc. dated April 5, 2002. (Incorporated by reference to Post-Effective Amendment No. 36 to the Registration Statement, filed on May 1, 2002.) |
C-6
| | | | |
| | 11. | | Investment Management Agreement between the Registrant, on behalf of Scudder Technology Growth Portfolio and Deutsche Investment Management Americas Inc. dated April 5, 2002. (Incorporated by reference to Post-Effective Amendment No. 36 to the Registration Statement, filed on May 1, 2002.) |
| | |
| | 12. | | Investment Management Agreement between the Registrant, on behalf of Scudder Total Return Portfolio and Deutsche Investment Management Americas Inc. dated April 5, 2002. (Incorporated by reference to Post-Effective Amendment No. 36 to the Registration Statement, filed on May 1, 2002.) |
| | |
| | 13. | | Investment Management Agreement between the Registrant, on behalf of SVS Venture Value Portfolio and Deutsche Investment Management Americas Inc. dated April 5, 2002. (Incorporated by reference to Post-Effective Amendment No. 36 to the Registration Statement, filed on May 1, 2002.) |
| | |
| | 14. | | Investment Management Agreement between the Registrant, on behalf of SVS Dreman Financial Services Portfolio and Deutsche Investment Management Americas Inc. dated April 5, 2002. (Incorporated by reference to Post-Effective Amendment No. 36 to the Registration Statement, filed on May 1, 2002.) |
| | |
| | 15. | | Investment Management Agreement between the Registrant, on behalf of SVS Dreman High Return Equity Portfolio and Deutsche Investment Management Americas Inc. dated April 5, 2002. (Incorporated by reference to Post-Effective Amendment No. 36 to the Registration Statement, filed on May 1, 2002.) |
| | |
| | 16. | | Investment Management Agreement between the Registrant, on behalf of Scudder Small Cap Growth Value Portfolio and Deutsche Investment Management Americas Inc. dated April 5, 2002. (Incorporated by reference to Post-Effective Amendment No. 36 to the Registration Statement, filed on May 1, 2002.) |
| | |
| | 17. | | Investment Management Agreement between the Registrant, on behalf of SVS Focused Large Cap Growth Portfolio and Deutsche Investment Management Americas Inc. dated April 5, 2002. (Incorporated by reference to Post-Effective Amendment No. 36 to the Registration Statement, filed on May 1, 2002.) |
| | |
| | 18. | | Investment Management Agreement between the Registrant, on behalf of SVS Dynamic Growth Portfolio and Deutsche Investment Management Americas Inc. dated April 5, 2002. (Incorporated by reference to Post-Effective Amendment No. 36 to the Registration Statement, filed on May 1, 2002.) |
| | |
| | 19. | | Investment Management Agreement between the Registrant, on behalf of SVS Growth and Income Portfolio and Deutsche Investment Management Americas Inc. dated April 5, 2002. (Incorporated by reference to Post-Effective Amendment No. 36 to the Registration Statement, filed on May 1, 2002.) |
| | |
| | 20. | | Investment Management Agreement between the Registrant, on behalf of SVS Growth Opportunities Portfolio and Deutsche Investment Management Americas Inc. dated April 5, 2002. (Incorporated by reference to Post-Effective Amendment No. 36 to the Registration Statement, filed on May 1, 2002.) |
C-7
| | | | |
| | 21. | | Investment Management Agreement between the Registrant, on behalf of SVS Strategic Equity Portfolio and Deutsche Investment Management Americas Inc. dated April 5, 2002. (Incorporated by reference to Post-Effective Amendment No. 36 to the Registration Statement, filed on May 1, 2002.) |
| | |
| | 22. | | Investment Management Agreement between the Registrant, on behalf of SVS Mid Cap Growth Portfolio and Deutsche Investment Management Americas Inc. dated April 5, 2002. (Incorporated by reference to Post-Effective Amendment No. 36 to the Registration Statement, filed on May 1, 2002.) |
| | |
| | 23. | | Investment Management Agreement between the Registrant, on behalf of SVS MFS Strategic Value Portfolio and Deutsche Investment Management Americas Inc. dated May 1, 2002. (Incorporated by reference to Post-Effective Amendment No. 38 to the Registration Statement, filed on February 28, 2003.) |
| | |
| | 24. | | Investment Management Agreement between the Registrant, on behalf of Scudder Conservative Income Strategy Portfolio, and Deutsche Investment Management Americas Inc. dated January 14, 2004. (Incorporated by reference to Post-Effective Amendment No. 46 to the Registration Statement, filed on April 28, 2004.) |
| | |
| | 25. | | Investment Management Agreement between the Registrant, on behalf of Scudder Growth & Income Strategy Portfolio, and Deutsche Investment Management Americas Inc. dated April 1, 2004. (Incorporated by reference to Post-Effective Amendment No. 46 to the Registration Statement, filed on April 28, 2004.) |
| | |
| | 26. | | Investment Management Agreement between the Registrant, on behalf of Scudder Growth Strategy Portfolio, and Deutsche Investment Management Americas Inc. dated January 14, 2004. (Incorporated by reference to Post-Effective Amendment No. 46 to the Registration Statement, filed on April 28, 2004.) |
| | |
| | 27. | | Investment Management Agreement between the Registrant, on behalf of Scudder Income & Growth Strategy Portfolio, and Deutsche Investment Management Americas Inc. dated April 1, 2004. (Incorporated by reference to Post-Effective Amendment No. 46 to the Registration Statement, filed on April 28, 2004.) |
| | |
| | 28. | | Subadvisory Agreement between Scudder Kemper Investments, Inc. and Scudder Investments (U.K.) Limited, dated September 7, 1998, for Kemper International Portfolio. (Incorporated by reference to Post-Effective Amendment No. 23 to the Registration Statement, filed on February 12, 1999.) |
| | |
| | 29. | | Subadvisory Agreement between Scudder Kemper Investments, Inc. and Eagle Asset Management, dated October 29, 1999, for KVS Focused Large Cap Growth Portfolio. (Incorporated by reference to Post-Effective Amendment No. 30 to the Registration Statement, filed on February 25, 1999.) |
C-8
| | | | |
| | 30. | | Subadvisory Agreement between Scudder Kemper Investments, Inc. Janus Capital Corporation, dated October 29, 1999, for KVS Growth Opportunities Portfolio. (Incorporated by reference to Post-Effective Amendment No. 30 to the Registration Statement, filed on February 25, 1999.) |
| | |
| | 31. | | Subadvisory Agreement between Deutsche Investment Management Americas, Inc. and Dreman Value Management, L.L.C. dated April 5, 2002, for SVS Dreman High Return Equity Portfolio. (Incorporated by reference to Post-Effective Amendment No. 39 to the Registration Statement, filed on April 30, 2003.) |
| | |
| | 32. | | Subadvisory Agreement between Deutsche Investment Management Americas, Inc. and Davis Select Advisors L.P. dated April 5, 2002, for SVS Davis Venture Value Portfolio. (Incorporated by reference to Post-Effective Amendment No. 39 to the Registration Statement, filed on April 30, 2003.) |
| | |
| | 33. | | Subadvisory Agreement between Deutsche Investment Management Americas Inc. and Deutsche Asset Management Investment Services Limited dated September 2, 2002, for Scudder Strategic Income Portfolio. (Incorporated by reference to Post-Effective Amendment No. 39 to the Registration Statement, filed on April 30, 2003.) |
| | |
| | 34. | | Subadvisory Agreement between Deutsche Investment Management Americas, Inc. and Deutsche Asset Management Investment Services Limited dated September 30, 2002, for Scudder International Select Equity Portfolio. (Incorporated by reference to Post-Effective Amendment No. 39 to the Registration Statement, filed on April 30, 2003.) |
| | |
| | 35. | | Subadvisory Agreement between Deutsche Investment Management Americas Inc. and Dreman Value Management, L.L.C., dated April 5, 2002, for SVS Dreman Financial Services Portfolio. (Incorporated by reference to Post-Effective Amendment No. 38 to the Registration Statement, filed on February 28, 2003.) |
| | |
| | 36. | | Subadvisory Agreement between Deutsche Investment Management Americas Inc. and Dreman Value Management, L.L.C., dated April 5, 2002, for SVS Dreman Small Cap Value Portfolio. (Incorporated by reference to Post-Effective Amendment No. 38 to the Registration Statement, filed on February 28, 2003.) |
| | |
| | 37. | | Subadvisory Agreement between Deutsche Investment Management Americas Inc. and Janus Capital Management L.L.C., dated April 5, 2002, for SVS Growth And Income Portfolio. (Incorporated by reference to Post-Effective Amendment No. 38 to the Registration Statement, filed on February 28, 2003.) |
| | |
| | 38. | | Subadvisory Agreement between Deutsche Investment Management Americas Inc. and Janus Capital Management LLC, dated April 5, 2002, for SVS Growth Opportunities Portfolio. (Incorporated by reference to Post-Effective Amendment No. 38 to the Registration Statement, filed on February 28, 2003.) |
C-9
| | | | |
| | 39. | | Subadvisory Agreement between Deutsche Investment Management Americas Inc. and Massachusetts Financial Services Company, dated May 1, 2002, for SVS MFS Strategic Value Portfolio. (Incorporated by reference to Post-Effective Amendment No. 38 to the Registration Statement, filed on February 28, 2003.) |
| | |
| | 40. | | Subadvisory Agreement between Deutsche Investment Management Americas Inc. and Oak Associates, Ltd., dated April 5, 2002, for SVS Strategic Equity Portfolio. (Incorporated by reference to Post-Effective Amendment No. 38 to the Registration Statement, filed on February 28, 2003.) |
| | |
| | 41. | | Subadvisory Agreement between Deutsche Investment Management Americas Inc. and Turner Investment Partners, Inc., dated April 5, 2002, for SVS Mid Cap Growth Portfolio. (Incorporated by reference to Post-Effective Amendment No. 38 to the Registration Statement, filed on February 28, 2003.) |
| | |
| | 42. | | Subadvisory Agreement between Deutsche Investment Management Americas Inc. and Deutsche Asset Management Investment Services Limited, dated September 30, 2002, for Scudder International Select Equity Portfolio. (Incorporated by reference to Post-Effective Amendment No. 39 to the Registration Statement, filed on April 30, 2003.) |
| | |
| | 43. | | Investment Sub-Advisory Agreement between Deutsche Investment Management Americas Inc. and Fund Asset Management, L.P., dated November 15, 2004, for Scudder Mercury Large Cap Core Portfolio. (Incorporated by reference to Post-Effective Amendment No. 56 to the Registration Statement, filed on February 25, 2005.) |
| | |
| | 44. | | Investment Sub-Advisory Agreement between Deutsche Investment Management Americas Inc. and Templeton Investment Counsel, L.L.C., dated November 15, 2004, for Scudder Templeton Foreign Value Portfolio. (Incorporated by reference to Post-Effective Amendment No. 56 to the Registration Statement, filed on February 25, 2005.) |
| | |
| | 45. | | Investment Management Agreement between the Registrant, on behalf of Scudder Mercury Large Cap Core Portfolio and Deutsche Investment Management Americas Inc., dated November 15, 2004. (Incorporated by reference to Post-Effective Amendment No. 56 to the Registration Statement, filed on February 25, 2005.) |
| | |
| | 46. | | Investment Management Agreement between the Registrant, on behalf of Scudder Templeton Foreign Value Portfolio and Deutsche Investment Management Americas Inc., dated November 15, 2004. (Incorporated by reference to Post-Effective Amendment No. 56 to the Registration Statement, filed on February 25, 2005.) |
C-10
| | | | |
| | 47. | | Investment Management Agreement between the Registrant, on behalf of Scudder Conservative Income Strategy Portfolio and Deutsche Investment Management Americas Inc., dated August 16, 2004. (Incorporated by reference to Post-Effective Amendment No. 56 to the Registration Statement, filed on February 25, 2005.) |
| | |
| | 48. | | Investment Management Agreement between the Registrant, on behalf of Scudder Income & Growth Strategy Portfolio and Deutsche Investment Management Americas Inc., dated August 16, 2004. (Incorporated by reference to Post-Effective Amendment No. 56 to the Registration Statement, filed on February 25, 2005.) |
| | |
| | 49. | | Investment Management Agreement between the Registrant, on behalf of Scudder Growth & Income Strategy Portfolio and Deutsche Investment Management Americas Inc., dated August 16, 2004. (Incorporated by reference to Post-Effective Amendment No. 56 to the Registration Statement, filed on February 25, 2005.) |
| | |
| | 50. | | Investment Management Agreement between the Registrant, on behalf of Scudder Growth Strategy Portfolio and Deutsche Investment Management Americas Inc., dated August 16, 2004. (Incorporated by reference to Post-Effective Amendment No. 56 to the Registration Statement, filed on February 25, 2005.) |
| | |
| | 51. | | Investment Management Agreement between the Registrant, on behalf of Scudder Money Market Portfolio, dated October 1, 2004. (Incorporated by reference to Post-Effective Amendment No. 57 to the Registration Statement, filed on April 29, 2005.) |
| | |
| | 52. | | Investment Management Agreement between the Registrant, on behalf of SVS Janus Growth And Income Portfolio, dated April 5, 2002, as amended and restated. (Incorporated by reference to Post-Effective Amendment No. 57 to the Registration Statement, filed on April 29, 2005.) |
| | |
| | 53. | | Investment Management Agreement between the Registrant, on behalf of SVS Janus Growth Opportunities Portfolio, dated April 5, 2002, as amended and restated. (Incorporated by reference to Post-Effective Amendment No. 57 to the Registration Statement, filed on April 29, 2005.) |
| | |
| | 54. | | Investment Sub-Advisory Agreement between Deutsche Investment Management Americas Inc. and Salomon Brothers Asset Management Inc., dated December 1, 2005. (Incorporated by reference to Post-Effective Amendment No. 58 to the Registration Statement, filed on March 2, 2006.) |
| | |
| | 55. | | Investment Management Agreement between the Registrant, on behalf of Scudder Salomon Aggressive Growth Portfolio, and Deutsche Investment Management Americas Inc., dated October 21, 2005. (Incorporated by reference to Post-Effective Amendment No. 58 to the Registration Statement, filed on March 2, 2006.) |
C-11
| | | | |
| | 56. | | Investment Management Agreement between the Registrant, on behalf of Scudder Total Return Portfolio, and Deutsche Investment Management Americas Inc., dated May 2, 2005. (Incorporated by reference to Post-Effective Amendment No. 58 to the Registration Statement, filed on March 2, 2006.) |
| | |
| | 57. | | Investment Management Agreement between the Registrant, on behalf of Scudder Small Cap Growth Portfolio, and Deutsche Investment Management Americas Inc., dated May 2, 2005. (Incorporated by reference to Post-Effective Amendment No. 58 to the Registration Statement, filed on March 2, 2006.) |
| | |
| Exhibit 7 | | | | Underwriting and Distribution Services Agreement between Scudder Variable Series II and Scudder Distributors, Inc., dated April 5, 2002. (Incorporated by reference to Post-Effective Amendment No. 38 to the Registration Statement, filed on February 28, 2003.) |
| | |
| Exhibit 8 | | | | Not Applicable. |
| | |
| Exhibit 9 | | 1. | | Custody Agreement between the Registrant, on behalf of Kemper Money Market Portfolio, Kemper Total Return Portfolio, Kemper High Yield Portfolio, Kemper Growth Portfolio, Kemper Government Securities Portfolio, Kemper International Portfolio, Kemper Small Cap Growth Portfolio, Kemper Investment Grade Bond Portfolio, Kemper Value+Growth Portfolio, Kemper Horizon 20+ Portfolio, Kemper Horizon 10+ Portfolio, Kemper Horizon 5 Portfolio, Kemper Contrarian Portfolio, Kemper Small Cap Value Portfolio, Kemper Blue Chip Portfolio and Kemper Global Income Portfolio, and Investors Fiduciary Trust Company, dated March 1, 1995. (Incorporated herein by reference to Post-Effective Amendment No. 14 to the Registration Statement, filed on April 27, 1995.) |
| | |
| | 2. | | Foreign Custodian Agreement between Chase Manhattan Bank and Kemper Investors Fund, dated January 2, 1990. (Incorporated herein by reference to Post-Effective Amendment No. 14 to the Registration Statement, filed on April 27, 1995.) |
| | |
| | 3. | | Custody Agreement between the Registrant, on behalf of KVS Dreman High Return Equity Portfolio and KVS Dreman Financial Services Portfolio, and State Street Bank and Trust Company, dated April 24, 1998. (Incorporated by reference to Post-Effective Amendment No. 23 to the Registration Statement, filed on February 12, 1999.) |
| | |
| | 4. | | Custody Agreement between the Registrant, on behalf of Kemper International Growth and Income Portfolio and Kemper Global Blue Chip Portfolio, and Brown Brothers Harriman & Co., dated May 1, 1998. (Incorporated by reference to Post-Effective Amendment No. 23 to the Registration Statement, filed on February 12, 1999.) |
C-12
| | | | |
| | 5. | | Addendum to the Custody Agreement between the Registrant, on behalf of Kemper Aggressive Growth Portfolio and Kemper Technology Growth Portfolio, and State Street Bank and Trust Company, dated May 1, 1999. (Incorporated herein by reference to Post-Effective Amendment No. 24 to the Registration Statement, filed on April 29, 1999.) |
| | |
| | 6. | | Amendment to Custodian Contract between State Street Bank and Trust Company and Kemper Variable Series, dated January 5, 2001. (Incorporated by reference to Post-Effective Amendment No. 34 to the Registration Statement, filed on April 30, 2001.) |
| | |
| | 7. | | Master Custodian Agreement dated April 13, 2004. (Incorporated by reference to Post-Effective Amendment No. 56 to the Registration Statement, filed on February 25, 2005.) |
| | |
| | 8. | | Master Custodian Agreement, dated March 17, 2004, between the Registrant and State Street Bank and Trust Company. (Incorporated by reference to Post-Effective Amendment No. 58 to the Registration Statement, filed on March 2, 2006.) |
| | |
| Exhibit 10 | | 1. | | Master Distribution Plan for Class B Shares, as approved on November 28, 2001. (Incorporated by reference to Post-Effective Amendment No. 39 to the Registration Statement, filed on April 30, 2003.) |
| | |
| | 2. | | Supplement to Master Distribution Plan for Class B Shares, as approved on January 15, 2003 for Scudder Strategic Income Portfolio. (Incorporated by reference to Post-Effective Amendment No. 39 to the Registration Statement, filed on April 30, 2003.) |
| | |
| | 3. | | Plan Pursuant to Rule 18f-3 as approved on November 28, 2001. (Incorporated by reference to Post-Effective Amendment No. 39 to the Registration Statement, filed on April 30, 2003.) |
| | |
| Exhibit 11 | | | | Opinion and Consent of Vedder, Price, Kaufman & Kammholz, P.C., filed herein. |
| | |
| Exhibit 12 | | | | Form of Tax Opinion and Consent of Willkie Farr & Gallagher LLP, filed herein. |
| | |
| Exhibit 13 | | 1. | | Agency Agreement between Kemper Investors Fund and Investors Fiduciary Trust Company, dated March 24, 1987. (Incorporated herein by reference to Post-Effective Amendment No. 14 to the Registration Statement, filed on April 27, 1995.) |
| | |
| | 2. | | Agency Agreement between Scudder Variable Series II and Scudder Investments Service Company, dated July 1, 2001. (Incorporated by reference to Post-Effective Amendment No. 35 to the Registration statement, filed on February 13, 2002.) |
| | |
| | 3. | | Supplement to Agency Agreement. (Incorporated by reference to Post-Effective Amendment No. 24 to the Registration Statement, filed on April 29, 1999.) |
C-13
| | | | |
| | 4. | | Fund Accounting Services Agreements between the Registrant, on behalf of Kemper Money Market Portfolio, Kemper Total Return Portfolio, Kemper High Yield Portfolio, Kemper Growth Portfolio, Kemper Government Securities Portfolio, Kemper International Portfolio, Kemper Small Cap Growth Portfolio, Kemper Investment Grade Bond Portfolio, Kemper Value+Growth Portfolio, Kemper Horizon 20+ Portfolio, Kemper Horizon 10+ Portfolio, Kemper Horizon 5 Portfolio, Kemper Value Portfolio, Kemper Small Cap Value Portfolio, Kemper Blue Chip Portfolio and Kemper Global Income Portfolio, and Scudder Fund Accounting Corporation, dated December 31, 1997. (Incorporated herein by reference to Post-Effective Amendment No. 21 to the Registration Statement, filed on March 26, 1998.) |
| | |
| | 5. | | Fund Accounting Services Agreements between the Registrant, on behalf of KVS Dreman High Return Equity Portfolio, KVS Dreman Financial Services Portfolio, Kemper Global Blue Chip Portfolio and Kemper International Growth and Income Portfolio, and Scudder Fund Accounting Corporation, dated May 1, 1998. (Incorporated by reference to Post-Effective Amendment No. 23 to the Registration Statement, filed on February 12, 1999.) |
| | |
| | 6. | | Fund Accounting Services Agreement between the Registrant, on behalf of Kemper Aggressive Growth Portfolio, and Scudder Fund Accounting Corporation, dated May 1, 1999. (Incorporated by reference to Post-Effective Amendment No. 24 to the Registration Statement, filed on April 29, 1999.) |
| | |
| | 7. | | Fund Accounting Services Agreement between the Registrant, on behalf of Kemper Technology Growth Portfolio, and Scudder Fund Accounting Corporation, dated May 1, 1999. (Incorporated by reference to Post-Effective Amendment No. 24 to the Registration Statement, filed on April 29, 1999.) |
| | |
| | 8. | | Fund Accounting Services Agreement between the Registrant, on behalf of KVS Focused Large Cap Growth Portfolio, and Scudder Fund Accounting Corporation, dated October 29, 1999. (Incorporated by reference to Post-Effective Amendment No. 30 to the Registration Statement, filed on February 25, 1999. |
| | |
| | 9. | | Fund Accounting Services Agreement between the Registrant, on behalf of KVS Growth and Income Portfolio, and Scudder Fund Accounting Corporation, dated October 29, 1999. (Incorporated by reference to Post-Effective Amendment No. 30 to the Registration Statement, filed on February 25, 1999.) |
| | |
| | 10. | | Fund Accounting Services Agreement between the Registrant, on behalf of KVS Growth Opportunities Portfolio, and Scudder Fund Accounting Corporation, dated October 29, 1999. (Incorporated by reference to Post-Effective Amendment No. 30 to the Registration Statement, filed on February 25, 1999.) |
| | |
| | 11. | | Fund Accounting Services Agreement between the Registrant, on behalf of SVS Dynamic Growth Portfolio, and Scudder Fund Accounting Corporation, dated May 1, 2001. (Incorporated by reference to Post-Effective Amendment No. 34 to the Registration Statement, filed on April 30, 2001.) |
C-14
| | | | |
| | 12. | | Fund Accounting Services Agreement between the Registrant, on behalf of SVS Mid Cap Growth Portfolio, and Scudder Fund Accounting Corporation, dated May 1, 2001. (Incorporated by reference to Post-Effective Amendment No. 34 to the Registration Statement, filed on April 30, 2001.) |
| | |
| | 13. | | Fund Accounting Services Agreement between the Registrant, on behalf of SVS Strategic Equity Portfolio, and Scudder Fund Accounting Corporation, dated May 1, 2001. (Incorporated by reference to Post-Effective Amendment No. 34 to the Registration Statement, filed on April 30, 2001.) |
| | |
| | 14. | | Fund Accounting Services Agreement between the Registrant, on behalf of SVS Venture Value Portfolio, and Scudder Fund Accounting Corporation, dated May 1, 2001. (Incorporated by reference to Post-Effective Amendment No. 34 to the Registration Statement, filed on April 30, 2001.) |
| | |
| | 15. | | Fund Accounting Service Agreement between the Registrant, on behalf of SVS MFS Strategic Value Portfolio, and Scudder Fund Accounting Corporation, dated May 1, 2002. (Incorporated by reference to Post-Effective Amendment No. 39 to the Registration Statement, filed on April 30, 2003.) |
| | |
| | 16. | | Letter of Indemnity to the Scudder Funds dated September 10, 2004. (Incorporated by reference to Post-Effective Amendment No. 52 to the Registrant’s Registration Statement on Form N-1A, filed on October 12, 2004.) |
| | |
| | 17. | | Letter of Indemnity to the Scudder Funds dated September 10, 2004. (Incorporated by reference to Post-Effective Amendment No. 52 to the Registrant’s Registration Statement on Form N-1A, filed on October 12, 2004.) |
| | |
| | 18. | | Letter of Indemnity to the Independent Directors/Trustees dated September 10, 2004. (Incorporated by reference to Post-Effective Amendment No. 52 to the Registrant’s Registration Statement on Form N-1A, filed on October 12, 2004.) |
| | |
| | 19. | | Letters of Indemnity to the Scudder Funds dated September 10, 2004; and Letter of Indemnity to the Independent Directors/Trustees dated September 10, 2004. (Incorporated by reference to Post-Effective Amendment No. 56 to the Registration Statement, filed on February 25, 2005.) |
| | |
| Exhibit 14 | | | | Consent of Ernst & Young LLP, filed herein. |
| | |
| Exhibit 15 | | | | Not Applicable. |
| | |
| Exhibit 16 | | | | Powers of Attorney, previously filed on June 19, 2006. |
| | |
| Exhibit 17 | | | | Form of Proxy is filed herein and appears following Part A of this Registration Statement on Form N-14. |
Item 17. Undertakings.
(1) The undersigned registrant agrees that prior to any public reoffering of the securities registered through the use of a prospectus which is a part of this registration statement by any person or party who is deemed to be an underwriter within the meaning of Rule 145(c) of the Securities Act, the
C-15
reoffering prospectus will contain the information called for by the applicable registration form for reofferings by persons who may be deemed underwriters, in addition to the information called for by the other items of the applicable form.
(2) The undersigned registrant agrees that every prospectus that is filed under paragraph (1) above will be filed as a part of an amendment to the registration statement and will not be used until the amendment is effective, and that, in determining any liability under the 1933 Act, each post-effective amendment shall be deemed to be a new registration statement for the securities offered therein, and the offering of the securities at that time shall be deemed to be the initial bona fide offering of them.
C-16
SIGNATURES
As required by the Securities Act of 1933, this pre-effective amendment to the Registration Statement has been signed on behalf of the registrant, in the City of New York, and State of New York, on the 19th day of July, 2006.
| | |
| DWS VARIABLE SERIES II |
| |
| By: | | /s/ Michael Clark |
| | Michael Clark |
| | Chief Executive Officer |
As required by the Securities Act of 1933, this pre-effective amendment to the Registration Statement has been signed below by the following persons in the capacities and on the dates indicated.
| | | | |
Signature | | Title | | Date |
/s/ Michael Clark Michael Clark | | Chief Executive Officer | | July 19, 2006 |
| | |
/s/ Paul Schubert Paul Schubert | | Chief Financial Officer and Principal Accounting Officer | | July 19, 2006 |
| | |
John W. Ballantine* John W. Ballantine | | Trustee | | |
| | |
Donald L. Dunaway* Donald L. Dunaway | | Trustee | | |
| | |
James R. Edgar* James R. Edgar | | Trustee | | |
| | |
Paul K. Freeman* Paul K. Freeman | | Trustee | | |
| | |
Robert B. Hoffman* Robert B. Hoffman | | Trustee | | |
| | |
William McClayton* William McClayton | | Trustee | | |
| | |
Shirley D. Peterson* Shirley D. Peterson | | Trustee | | |
| | |
Robert H. Wadsworth* Robert H. Wadsworth | | Trustee | | |
C-17
| | | | |
Signature | | Title | | Date |
*By /s/ John Millette John Millette** Secretary | | | | July 19, 2006 |
| ** | Attorney-in-fact pursuant to the powers of attorney previously filed as exhibit 16. |
C-18
INDEX OF EXHIBITS
| | |
Exhibit Number | | Exhibit Title |
| 11 | | Opinion and Consent of Vedder, Price, Kaufman & Kammholz, P.C. |
| |
| 12 | | Form of Tax Opinion and Consent of Willkie Farr & Gallagher LLP. |
| |
| 14 | | Consent of Ernst & Young LLP |
C-19