Table of Contents
UNITED STATES
SECURITIES AND EXCHANGE COMMISSION
Washington, D.C. 20549
FORM N-CSR
CERTIFIED SHAREHOLDER REPORT OF REGISTERED
MANAGEMENT INVESTMENT COMPANIES
Investment Company Act file number: 811-05009
COLORADO BONDSHARES —
A TAX-EXEMPT FUND
(Exact name of registrant as specified in its charter)
1200 17TH STREET, SUITE 850
DENVER, COLORADO 80202-5808
(Address of principal executive offices) (Zip code)
FRED R. KELLY, JR.
1200 17TH STREET, SUITE 850
DENVER, COLORADO 80202-5808
(Name and address of agent for service)
Registrant’s telephone number, including area code: 303-572-6990
Date of fiscal year end: 09/30
Date of reporting period: 09/30/2012
Table of Contents
| ITEM 1. | REPORTS TO STOCKHOLDERS | |
| ITEM 2. | CODE OF ETHICS | |
| ITEM 3. | AUDIT COMMITTEE FINANCIAL EXPERT | |
| ITEM 4. | PRINCIPAL ACCOUNTANT FEES AND SERVICES | |
| ITEM 5. | AUDIT COMMITTEE OF LISTED REGISTRANTS | |
| ITEM 6. | INVESTMENTS | |
| ITEM 7. | DISCLOSURE OF PROXY VOTING POLICIES AND PROCEDURES FOR CLOSED-END MANAGEMENT INVESTMENT COMPANIES | |
| ITEM 8. | PORTFOLIO MANAGERS OF CLOSED-END MANAGEMENT INVESTMENT COMPANIES | |
| ITEM 9. | PURCHASES OF EQUITY SECURITIES BY CLOSED-END MANAGEMENT INVESTMENT COMPANY AND AFFILIATED PURCHASERS | |
| ITEM 10. | SUBMISSION OF MATTERS TO A VOTE OF SECURITY HOLDERS | |
| ITEM 11. | CONTROLS AND PROCEDURES | |
| ITEM 12. | EXHIBITS | |
| (a)(2)(i) | ||
(99.302) Interim President’s (Principal Executive Officer) Section 302 Certification | ||
| (a)(2)(ii) | ||
(99.302) Interim Treasurer’s (Principal Financial Officer) Section 302 Certification | ||
| (b) | ||
(99.906) Combined Interim President & Treasurer (Principal Executive Officer and Principal Financial Officer) Section 906 Certification | ||
Table of Contents
ITEM 1. REPORTS TO STOCKHOLDERS.
Table of Contents
November 29, 2012
Dear Shareholder:
Today as I write this, we as a nation, stand at the precipice of the fiscal cliff. If Congress does not act, bad things will happen. All of the political pundits assure us that they will not be the one who causes us to step over the edge and fall into the abyss that lies below. But with the time clock ticking it seems virtually impossible that there is sufficient time left to come up with a well-reasoned solution that avoids calamity. That leaves us with two possible scenarios, neither one of which is good. One is that the solution will be thrown together in some dark room between desperate parties without having properly considered all the unforeseen consequences. The other is that the politicians will follow the example of their European brethren and “kick the can down the road” to be resolved some other day. Except this time if they “kick the can,” Moody’s Investor Services has threatened to downgrade, again, the rating of the federal government. The last time this happened, it caused a sell-off in the stock market and a buying spree in our country’s IOUs, operating under the “cleanest dirty shirt” theory. I don’t remember ever learning that in economics. I mistakenly was thinking that any “dirty shirt” was not ideal.
Given the gravity of the situation, it seems trivial to focus on our own situation here at the Fund. But on second thought what else would we do? You deserve to know how we are trying to make some sense out of the madness and chart a course.
Our course was set years ago when we consciously decided to lock in some good returns in half the portfolio and stay liquid in the other half. While the percentages have changed slightly, this strategy has served us well in the volatile times that we have been through and those that we may face coming up. By doing it the way we have, we were always destined to be half right, never all wrong. During 2012, the strategy wasn’t quite as effective as in previous years because our caution held back both our earnings and the appreciation of the holdings and our competitors did better because of it. Still, we managed to distribute income of $0.41/share, which was very competitive. Depending on what happens over the next month, we may catch up in the total performance statistics. In any event, we have reserved our options and we have “kept our powder dry” for future use when the rules are a little clearer.
The year has been a busy one as we have been working through a couple of legal skirmishes and we hope at the end to have established some important legal precedents in Colorado municipal bond law that further clarifies rules that everyone in the industry thought were already clear enough. It’s not a way that I would have chosen to spend the time but as long as we are spending it let’s try to get something positive from the effort.
In addition, we have spent over $100,000,000 in the local economy over the last year to help jump start the Colorado recovery and generate additional earnings for shareholders which I think we are all going to need in a higher tax, less deductions era.
Table of Contents
One of the nasty little secrets that may come out of these back room negotiations in Washington could be a change in how municipal bonds are treated under the tax law. The industry has faced taxability questions before but this time the threat seems a little more real. One of the proposals is to limit the benefit that any one tax payer can get from tax free income to 28%, similar to a minimum tax concept. We can’t know whether this will happen or how it would impact all shareholders. Some may not be impacted much at all, others more so. This change if it occurs would likely be phased in over time and would likely not affect existing bonds. It makes absolutely no sense to raise the borrowing costs of struggling municipalities. But from an investors view, the truth is that the tax equivalent yield on municipal bonds is sufficiently higher than other instruments that even with some tax being paid, the end result still favors municipal bond holders.
It’s possible to contemplate that higher tax rates and grandfathering existing bonds could lead to greater demand and upward surging prices of the securities that the Fund already owns. I don’t think that they are going to get all the details hammered out by year end so we probably have more time for analysis.
I hate to sign off with so many things up in the air but that’s how it is right now. No matter what happens, with all of these subjects, the Fund is uniquely well positioned because of its liquidity to deal with them. It shouldn’t be necessary to sell into a bad market and if opportunities arise, we will be aggressively buying.
We at Colorado BondShares want you to know how much we deeply appreciate your support and offer a heartfelt thank you in these times of disquiet.
Sincerely,

Fred R. Kelly, Jr.
Portfolio Manager
Table of Contents
MANAGEMENT’S DISCUSSION OF FUND PERFORMANCE
Throughout the world, economic news has been, in a word, discouraging. Europe continues to present considerable risk with no apparent viable solutions at hand, Mideast tensions are escalating and the federal forecast is beleaguered with ominous whisperings of the fiscal cliff, the costs of natural disaster, sluggish job growth and, of course, another scandal in Washington. The good news? In spite of all the negative spin, Colorado has shown strong performance. A recent report (The Colorado Outlook – Economic and Fiscal Review, June 2012) went so far as to speculate that “if the current headwinds and downside risks abate, or if Colorado proves to be resilient against the national and global slowdown, the economy and thus revenue will perform better than forecast.” So far, Colorado has been outperforming “the nation overall and many other states.” The report goes on to cautiously indicate that the supply/demand ratio in the housing market may be coming into balance with multifamily housing leading that sector. The vacancy rate for apartments, aggregated from the seven largest cities in Colorado fell to 5.2% as of period ended June 2012. That is the lowest since period ended March 31, 2001. Those low vacancy rates have, in turn, stimulated more multifamily construction activity. Housing in both multifamily and single-family are significant components of the municipal bond industry.
Fixed income investors around the world are desperately looking for more sources of income above what is offered in U.S. Treasuries and low yield bank C.D.s. Even a bond that is expected to default has found investors willing to accept 7% as a reasonable return. There was unprecedented involvement by the U.S. Treasury and the Federal Reserve Bank to further manage fiscal policy by pegging interest rates and promising a two year hiatus for higher rates. In this environment, bond prices have been, again, unusually volatile and interest rates on rated bonds dropped precipitously, making munis the best performing asset class. During fiscal year 2012, liquidity continued to improve but still has not gotten back to pre-2008 levels. Markets are functioning more normally and volumes of financings while a fraction of what they were previously are expected to be on the rise. Even California municipalities in bankruptcy are finding homes for their debt. All the while the media is carrying stories of a bond bubble being created. And money has flowed into fixed income mutual funds like never before. New bond issues are over-subscribed and it is questionable whether the prices paid reflect tangible value. Such conditions are reminiscent of other market tops which we have witnessed. So, it is not a time to throw caution to the winds.
This year’s performance was mixed. The Fund’s fiscal year for total return (principal appreciation plus income) performance record was at the bottom of the standings when compared to peers in the single-state intermediate municipal bond fund category and also compared to the national funds. Sometimes maintaining a conservative posture is painful. For the fiscal year ended September 30, 2012 the Fund experienced a total return of 5.64% at net asset value; the return was comprised of an investment income component of 4.58% and principal appreciation of 1.06%. From a pure income basis, the Fund ranks closer to the top of its noted peer group. Other funds enjoyed a more robust appreciation of rated bonds for the fourth year in a row while the non-rated sector showed a more modest response. Other funds also used leverage to enhance their yields which the Fund did not. However, the Fund’s income distribution performed above average compared to our single-state competitors and our comparative performance on this metric over the three-year period of 2008, 2009 and 2010 was excellent. According to Thomson Reuters, the Fund previously has ranked as a top-performer in eight out of the last thirteen calendar years (1999, 2001, 2003, 2005, 2006, 2007, 2008 and 2010). The Fund competed well with the other Colorado municipal bond funds in the ten and fifteen-year total return performance category at net asset value with returns of 5.17% and 5.55%, respectively, demonstrating its consistency over a longer time frame. The average annual total
1
Table of Contents
returns at the maximum offering price (including sales charges and reinvestment of all dividends and distributions) are 0.62%, 3.23%, 3.29%, 4.66% for the one, three, five and ten-year periods ended September 30, 2012, respectively.
A key factor which contributed to the Fund’s stability was management’s determination to maintain a shorter average duration (time period during which securities are likely to be held by the portfolio), among the lowest in our peer group. The Fund carried a disproportionately high weighting of short-term bonds in the portfolio, designed to lessen the exposure to market risk in a time when it seemed likely for interest rates to rise and spreads to widen.
While the strategy of buying short maturities helped to protect principal, it did not maximize the current income stream. Even so, distributions $0.41/share in fiscal year 2012 compared favorably to $0.40/share and $0.41/share in fiscal years 2010 and 2011, respectively. It is management’s philosophy that it is easier to recoup lost income than it is to recover principal losses. Until the risks posed by rising interest rates have abated, management will continue to exercise this methodology. Much of this year’s income may be attributed to longer term holdings being principally invested in non-rated tax-exempt bonds, with coupon rates that exceed average coupons currently available in the market. Non-rated securities are generally subject to greater credit risk than rated issues; but proper analysis by management may effectively mitigate these risks. It should be stated that past performance is not necessarily indicative of future performance, but it is one of many important factors to consider when evaluating a potential investment.
2
Table of Contents
PERFORMANCE SUMMARY (Unaudited)
COMPARISON OF CHANGE IN VALUE OF A $10,000 INVESTMENT IN COLORADO BONDSHARES(1)
THE LIPPER GENERAL MUNICIPAL DEBT FUND INDEX(4)
AND THE BARCLAYS CAPITAL MUNICIPAL BOND TOTAL RETURN INDEX(5)
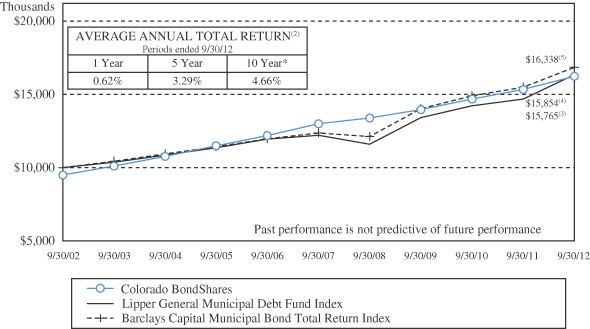
| (1) | Total return is the percentage change in the value of a hypothetical investment that has occurred in the indicated period of time, taking into account the imposition of the sales charge and other fees and assuming the reinvestment of all dividends and distributions. Past performance is not indicative of future performance. The graph does not reflect the deduction of taxes that a shareholder would pay on Fund distributions or the redemption of shares of the Fund. |
| * | Fiscal year ended September 30, 2007 includes an interest payment of approximately $3.8 million representing four years of unpaid interest relating to the Fund’s holding of United Airlines/Denver International Airport bonds that is a non-recurring event outside of the control of the Fund. |
| (2) | Average annual total return reflects the hypothetical annually compounded return that would have produced the same cumulative total return if the Fund’s performance had been constant over the entire period. Average annual total returns for the one-year, five-year and ten-year periods ended September 30, 2012 are 0.62%, 3.29%, and 4.66%, respectively. Average annual total includes the imposition of the sales charge and assumes the reinvestment of all dividends and distributions. Past |
3
Table of Contents
| performance is not indicative of future performance. The table does not reflect the deduction of taxes that a shareholder would pay on Fund distributions or the redemption of shares of the Fund. |
| (3) | Includes reinvestment of dividends and adjustment for the maximum sales charge of 4.75%. |
| (4) | The Lipper General Municipal Debt Fund Index is a non-weighted index of the 30 largest funds that invest at least 65% of assets in municipal debt issues in the top four credit ratings. The Lipper General Municipal Debt Fund Index reflects no deductions for fees, expenses or taxes, includes reinvestment of dividends but does not reflect any adjustment for sales charge. |
| (5) | The Barclays Capital Municipal Bond Total Return Index is considered representative of the broad market for investment grade, tax-exempt and fixed-rate bonds with long-term maturities (greater than two years) selected from issues larger than $50 million. You cannot invest directly in this index. This index is not professionally managed and does not pay any commissions, expenses or taxes. If this index did pay commissions, expenses or taxes, its returns would be lower. The Fund selected the Barclay Index to compare the returns of the Fund to an appropriate broad-based securities market index. You should note, however, that there are some fundamental differences between the portfolio of securities invested in by the Fund and the securities represented by the Barclay Index. Unlike the Fund which invests primarily in not-rated securities on issues of any size, the Barclay Index only includes securities with a rating of at least “Baa” by Moody’s Investor Services, Inc. from an issue size of no less than $50 million. Some of these differences between the portfolio of the Fund and the securities represented by the Barclay Index may cause the performance of the Fund to differ from the performance of the Barclay Index. |
4
Table of Contents
FUND EXPENSES (unaudited)
The following examples are intended to help you understand the ongoing costs (in dollars) of investing in the Fund and compare these costs with those of other mutual funds. The examples (actual and hypothetical 5% return) are based on an investment of $1,000 made at the beginning of the period shown and held for the entire period.
As a shareholder of Colorado BondShares — A Tax-Exempt Fund (the “Fund”) you can incur two types of costs:
| • | Sales charges (front loads) on fund purchases and |
| • | Ongoing fund costs, including management fees, administrative services, and other fund expenses. All mutual funds have operating expenses. Operating expenses, which are deducted from the Fund’s gross income, directly reduce the investment return of the Fund. |
Actual Fund Expenses
The first line of the table below provides information about actual account values and actual expenses. You may use the information in this line, together with the amount you invested, to estimate the expenses that you paid over the period. Simply divide your account value by $1,000 (for example, an $8,600 account value divided by $1,000 = 8.6), then multiply the result by the number in the first line under the heading entitled “Expenses Paid During Period” to estimate the expenses you paid on your account during this period.
Hypothetical Example for Comparison Purposes
The second line of the table below provides information about hypothetical account values and hypothetical expenses based on the Fund’s actual expense ratio and an assumed rate of return of 5% per year before expenses, which is not the Fund’s actual return. The hypothetical account values and expenses may not be used to estimate the actual ending account balance or expenses you paid for the period. You may use this information to compare the ongoing cost of investing in the Fund and other funds. To do so, compare this 5% hypothetical example with the 5% hypothetical examples that appear in shareholder reports of other funds.
Six Months Ended September 30, 2012
Colorado BondShares — A Tax-Exempt Fund | Beginning Account Value 04/01/12 | Ending Account Value 09/30/12 | Expenses Paid During Period1 | |||||||||
Based on Actual Fund Return | $ | 1,000.00 | $ | 1,027.81 | $ | 2.94 | ||||||
Based on Hypothetical 5% Annual Return Before Expenses | $ | 1,000.00 | $ | 1,022.10 | $ | 2.93 | ||||||
| (1) | The expenses shown in this table are equal to the Fund’s annualized expense ratio of 0.58% for fiscal year ended September 30, 2012, multiplied by the average account value over the period, multiplied by 183/366 to reflect the one-half year period. |
Please note that expenses shown in the table are meant to highlight your ongoing costs only and do not reflect any transactional costs, such as sales charges (loads), redemption fees or exchange fees. Therefore, the second line of the table is useful in comparing ongoing costs only, and will not help you determine the relative total costs of owning different funds. In addition, if transactional costs were included, your costs would have been higher. You can find more information about the Fund’s expenses in the Financial Statements section of this report. For additional information on operating costs please see the Fund’s prospectus.
5
Table of Contents
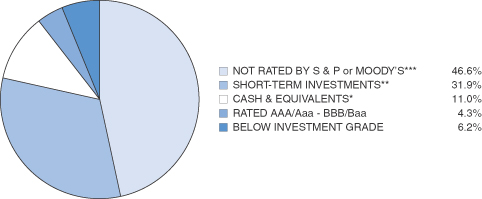
CREDIT QUALITY (unaudited)
Colorado BondShares — A Tax-Exempt Fund
Based on a Percentage of Total Net Assets as of September 30, 2012
SECTOR BREAKDOWN (unaudited)
Colorado BondShares — A Tax-Exempt Fund
Based on a Percentage of Total Net Assets as of September 30, 2012
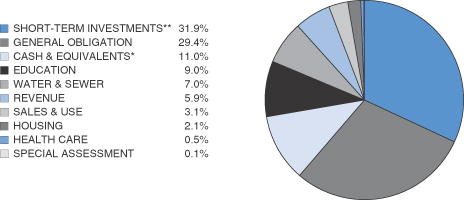
* Cash & equivalents include cash, receivables less liabilities.
** Short-term investments include securities with a maturity date or redemption feature of one year or less, as identified in the Schedule of Investments.
*** This category includes 3.6% of pre-refunded bonds which are securities that are collateralized by an amount sufficient to pay both principal and interest. Total pre-refunded bonds as a percentage of total net assets were 10.4%, as of September 30, 2012.
6
Table of Contents
Report of Independent Registered Public Accounting Firm
To the Shareholders and Board of Trustees of Colorado BondShares — A Tax-Exempt Fund:
In our opinion, the accompanying statement of assets and liabilities, including the schedule of investments, and the related statements of operations and of changes in net assets and the financial highlights present fairly, in all material respects, the financial position of Colorado BondShares — A Tax-Exempt Fund (the “Fund”) at September 30, 2012, the results of its operations for the year then ended, the changes in its net assets for each of the two years in the period then ended and the financial highlights for each of the four years in the period then ended, in conformity with accounting principles generally accepted in the United States of America. These financial statements and financial highlights (hereafter referred to as the “financial statements”) are the responsibility of the Fund’s management; our responsibility is to express an opinion on these financial statements based on our audits. We conducted our audits of these financial statements in accordance with the standards of the Public Company Accounting Oversight Board (United States). Those standards require that we plan and perform the audit to obtain reasonable assurance about whether the financial statements are free of material misstatement. An audit includes examining, on a test basis, evidence supporting the amounts and disclosures in the financial statements, assessing the accounting principles used and significant estimates made by management, and evaluating the overall financial statement presentation. We believe that our audits, which included confirmation of securities at September 30, 2012 by correspondence with the custodian, provide a reasonable basis for our opinion. The financial statements for the Fund as of September 30, 2008 and for the year then ended, including the financial highlights for the two years then ended, were audited by other auditors whose report dated November 26, 2008 expressed an unqualified opinion on those statements.

Denver, Colorado
November 29, 2012
7
Table of Contents
Colorado BondShares
A Tax-Exempt Fund
Schedule of Investments
September 30, 2012
Face Amount | Value | |||||||||
| Colorado Municipal Bonds — 55.8% | ||||||||||
| 1,600,000 | Aberdeen Metropolitan District No. 1 G.O. (LTD Tax Convertible to Unlimited Tax) | $ | 1,599,856 | |||||||
| 780,000 | Adonea Metropolitan District No. 2 LTD Tax (Convertible to Unlimited Tax) G.O. | 691,821 | ||||||||
| 2,138,000 | Antelope Heights Metropolitan District G.O. (LTD Tax Convertible to Unlimited Tax) | 2,347,930 | ||||||||
| 2,000,000 | Arista Metropolitan District Special Revenue Series 2005, 6.75% due 12/1/2035 | 1,668,700 | ||||||||
| 6,000,000 | Arista Metropolitan District Subordinate (Convertible to Parity) Special Revenue | 4,728,240 | ||||||||
| 1,492,000 | BNC Metropolitan District No.1 G.O. (LTD Tax Convertible to Unlimited Tax) | 1,538,789 | ||||||||
| 1,000,000 | Beacon Pointe Metropolitan District LTD Tax (Convertible to Unlimited Tax) G.O. | 1,016,430 | ||||||||
| 700,000 | Beebe Draw Farms Metropolitan District G.O. Series 1998, 7.00% due 10/1/2018 | 700,420 | ||||||||
| 4,315,000 | Boulder County Development Revenue (Boulder College of Massage Therapy Project) | 3,315,430 | ||||||||
| 2,162,000 | Bradburn Metropolitan District No. 2 G.O. (LTD Tax Convertible to Unlimited Tax) | 2,187,166 | ||||||||
| 2,025,000 | Bradburn Metropolitan District No. 3 G.O. LTD Tax Series 2010, 7.50% due 12/1/2039 | 2,091,602 | ||||||||
| 600,000 | Buffalo Run Mesa Metropolitan District LTD Tax G.O. Series 2004, 5.00% to yield 5.793% due 12/1/2034(j) | 540,000 | ||||||||
| 500,000 | Castle Oaks Metropolitan District G.O. LTD Tax Series 2005, 6.00% due 12/1/2025 | 467,140 | ||||||||
| 6,465,662 | Colorado Centre Metropolitan District LTD Tax and Special Revenue Series 1992B, 0.00% due 1/1/2032(a)(g)(i)(j) | 3,394,473 | ||||||||
| 2,009,520 | Colorado Centre Metropolitan District LTD Tax and Special Revenue Series 1992A, principal only, due 1/1/2027(e)(i)(j) | 2,009,520 | ||||||||
| 2,008,335 | Colorado Centre Metropolitan District LTD Tax and Special Revenue Series 1992A, interest only, 9.00% due 1/1/2027(f)(i)(j) | 1,606,668 | ||||||||
| 1,665,000 | Colorado Educational and Cultural Facilities Authority Charter School Revenue (Brighton Charter School Project) Series 2006, 6.00% due 11/1/2036 | 1,232,866 | ||||||||
| 5,410,000 | Colorado Educational and Cultural Facilities Authority Student Housing Revenue (Inn at Auraria LLC Project) Series 2005A, 5.875% due 7/1/2023(a) | 3,641,958 | ||||||||
| 785,000 | Colorado Educational and Cultural Facilities Authority Charter School Revenue Refunding and Improvement (Elbert County Charter School Project) Series 2004, 7.375% to yield 7.45% due 3/1/2035 | 771,851 | ||||||||
8
Table of Contents
Colorado BondShares
A Tax-Exempt Fund
Schedule of Investments — (Continued)
Face Amount | Value | |||||||||
| Colorado Municipal Bonds — (Continued) | ||||||||||
| 5,500,000 | Colorado Educational and Cultural Facilities Authority Charter School Revenue (Liberty Common Middle High School Project) A Charter School Chartered Through Poudre School District R-1 Series 2011, 5.50% due 12/15/2015 | $ | 5,516,775 | |||||||
| 7,160,000 | Colorado Educational and Cultural Facilities Authority (Union Colony Elementary School Project) A Charter School Chartered Through Weld County School District 6 Charter School Revenue Series 2012A, 5.65% due 3/1/2016 | 7,180,979 | ||||||||
| 15,900,000 | Colorado Educational and Cultural Facilities Authority (Jefferson Academy Project) A Charter School Chartered Through Jefferson County School District No. R-1 Charter School Revenue Refunding and Improvement Series 2012, 5.65% due 6/15/2017 | 15,963,282 | ||||||||
| 9,835,000 | Colorado Educational and Cultural Facilities Authority (STEM School Project) A Charter School Chartered Through Douglas County School District Re 1 Charter School Revenue Series 2012A, 5.70% due 6/15/2017 | 9,865,784 | ||||||||
| 25,650,000 | Colorado Educational and Cultural Facilities Authority (Skyview Academy Project) A Charter School Chartered Through Douglas County School District No. Re 1 Charter School Revenue Series 2012, 5.60% due 7/1/2017 | 25,728,232 | ||||||||
| 8,530,000 | Colorado Educational and Cultural Facilities Authority (Westgate Community School Project) A Charter School Chartered Through Adams 12 Five Star Schools Charter School Revenue Series 2012A, 5.75% due 7/1/2017 | 8,548,851 | ||||||||
| 3,755,000 | Colorado Housing and Finance Authority Economic Development Revenue (Micro Business Development Corporation Project) Series 2005, 6.75% due | 1,877,500 | ||||||||
| 23,270,000 | Colorado Springs Urban Renewal Authority Tax Increment Revenue (University Village Project) Series 2008A Senior, 7.00% to yield 7.00% – 9.00% due 12/1/2029 | 15,716,791 | ||||||||
| 7,435,000 | Colorado Springs Urban Renewal Authority Tax Increment Revenue (University Village Project) Series 2008B Subordinate (Convertible to Senior), 7.50% due | 5,021,673 | ||||||||
| 2,000,000 | Confluence Metropolitan District (in the town of Avon) Tax Supported Revenue | 1,957,360 | ||||||||
| 3,455,000 | Conservatory Metropolitan District G.O. (LTD Tax Convertible to Unlimited Tax) | 3,809,276 | ||||||||
| 3,679,000 | Conservatory Metropolitan District G.O. (LTD Tax Convertible to Unlimited Tax) | 4,007,829 | ||||||||
| 1,030,000 | Country Club Highlands Metropolitan District G.O. Limited Tax Series 2007, 7.25% due 12/1/2037(j) | 515,000 | ||||||||
| 200,000 | Denver Convention Center Hotel Authority Convention Center Hotel Senior Revenue Refunding Series 2006, 4.50% to yield 8.481% due 12/1/2022 | 202,528 | ||||||||
| 1,865,000 | Denver (City and County of) Subordinate Multifamily Housing Revenue (Capitol Heights Apartments) Series 1999C, 8.00% due 5/1/2032(j) | 5,299,994 | ||||||||
9
Table of Contents
Colorado BondShares
A Tax-Exempt Fund
Schedule of Investments — (Continued)
Face Amount | Value | |||||||||
| Colorado Municipal Bonds — (Continued) | ||||||||||
| 690,000 | Denver (City and County of) Single Family Home Mortgage Revenue (Metro Mayors Caucus Single Family Mortgage Bond Program) Series 2001A, 6.30% to yield 5.80% due 11/1/2032 | $ | 753,935 | |||||||
| 7,115,000 | East Cherry Creek Valley Water and Sanitation District Water Activity Enterprise, Inc. Step Rate Water Revenue Series 2004, 6.00% due 11/15/2023(c) | 7,114,004 | ||||||||
| 31,650,000 | Ebert Metropolitan District LTD Tax G.O. Refunding Series 2004A, 8.00% to yield 5.05% due 12/1/2034(b) | 36,222,159 | ||||||||
| 4,500,000 | Elbert and Highway 86 Commercial Metropolitan District Public Improvement Fee Revenue Series 2008A, 7.50% due 12/1/2032 | 3,040,650 | ||||||||
| 620,000 | Fort Lupton Golf Course Revenue Anticipation Warrants Senior Series 1996A, 8.50% due 12/15/2015(a) | 1,798 | ||||||||
| 3,330,000 | Fronterra Village Metropolitan District No. 2 G.O. (LTD Tax Convertible to Unlimited Tax) Refunding & Improvement Series 2007, 4.375% – 5.00% to yield 4.552% – 7.135% due 12/1/2017-2034 | 3,174,946 | ||||||||
| 2,000,000 | Granby Ranch Metropolitan District LTD Tax G.O. Series 2006, 6.75% due 12/1/2036 | 2,022,440 | ||||||||
| 1,000,000 | High Plains Metropolitan District LTD Tax (Convertible to Unlimited Tax) G.O. | 928,620 | ||||||||
| 1,006,000 | Jeffco Business Center Metropolitan District No. 1 LTD Tax G.O. Series 2000, 8.00% to yield 20.907% due 5/1/2020(j) | 1,006,000 | ||||||||
| 475,000 | Lafayette City Center GID LTD Tax G.O. Series 1999, 5.75% to yield 7.60% due 12/1/2018 | 460,342 | ||||||||
| 4,215,000 | Madre Metropolitan District No. 2 G.O. (LTD Tax Convertible to Unlimited Tax) | 3,455,836 | ||||||||
| 2,500,000 | Madre Metropolitan District No. 2 G.O. (LTD Tax Convertible to Unlimited Tax) | 1,871,300 | ||||||||
| 6,245,000 | Maher Ranch Metropolitan District No. 4 G.O. LTD Tax Series 2003, 7.80% due 12/1/2027(b) | 6,918,211 | ||||||||
| 1,945,000 | Maher Ranch Metropolitan District No. 4 G.O. LTD Tax Series 2006, 7.00% due 12/1/2036(b) | 2,129,386 | ||||||||
| 17,485,000 | Marin Metropolitan District LTD Tax G.O. Series 2008, 7.75% due 12/1/2028(j) | 14,862,250 | ||||||||
| 11,580,000 | Meadows Metropolitan District No. 1 G.O. LTD Tax Series 1989 A (reissued on 12/29/1993), 7.999% due 6/1/2029(k) | 11,845,298 | ||||||||
| 11,565,000 | Meadows Metropolitan District No. 2 G.O. LTD Tax Series 1989 B (reissued on 12/29/1993), 7.999% due 6/1/2029(k) | 11,829,954 | ||||||||
| 11,515,000 | Meadows Metropolitan District No. 7 G.O. LTD Tax Series 1989 C (reissued on 12/29/1993), 7.999% due 6/1/2029(k) | 11,778,809 | ||||||||
10
Table of Contents
Colorado BondShares
A Tax-Exempt Fund
Schedule of Investments — (Continued)
Face Amount | Value | |||||||||
| Colorado Municipal Bonds — (Continued) | ||||||||||
| 260,000 | Mount Carbon Metropolitan District LTD Tax and Revenue Refunding Series 2004A, 7.00% to yield 7.075% due 6/1/2043 | $ | 160,477 | |||||||
| 2,000,000 | Mount Carbon Metropolitan District LTD Tax and Revenue Refunding Series 2004B, 7.00% to yield 7.075% due 6/1/2043 | 1,234,440 | ||||||||
| 565,000 | Mount Carbon Metropolitan District LTD Tax and Revenue Refunding Series 2004C, due 6/1/2043(e)(j) | 40 | ||||||||
| 1,000,000 | Mountain Shadows Metropolitan District G.O. (LTD Tax Convertible to Unlimited Tax) Series 2007, 5.50% due 12/1/2027(j) | 500,000 | ||||||||
| 2,540,000 | Murphy Creek Metropolitan District No. 3 G.O. (LTD Tax Convertible to Unlimited Tax) Refunding and Improvement Series 2006, 6.00% to yield 7.90% due 12/1/2026 | 1,263,701 | ||||||||
| 1,380,000 | Murphy Creek Metropolitan District No. 3 G.O. (LTD Tax Convertible to Unlimited Tax) Refunding and Improvement Series 2006, 6.125% to yield 7.90% due 12/1/2035 | 679,443 | ||||||||
| 1,500,000 | Neu Towne Metropolitan District G.O. (LTD Tax Convertible to Unlimited Tax) | 451,485 | ||||||||
| 4,585,000 | Northwest Metropolitan District No. 3 G.O. (LTD Tax Convertible to Unlimited Tax) Series 2005, 6.125% to yield 12.00% due 12/1/2025 | 4,578,352 | ||||||||
| 16,500,000 | Northwest Metropolitan District No. 3 G.O. (LTD Tax Convertible to Unlimited Tax) Series 2005, 6.25% to yield 13.00% due 12/1/2035 | 16,240,455 | ||||||||
| 2,000,000 | Plaza Metropolitan District No. 1 Public Improvement Fee/Tax Increment Supported Revenue Series 2003, 7.70% to yield 7.653% due 12/1/2017(j) | 2,160,000 | ||||||||
| 20,800,000 | Plaza Metropolitan District No. 1 Public Improvement Fee/Tax Increment Supported Revenue Series 2003, 8.00% to yield 7.971% – 10.00% due 12/1/2025(j) | 22,464,000 | ||||||||
| 4,830,000 | Plaza Metropolitan District No. 1 Public Improvement Fee/Tax Increment Supported Revenue Series 2003, 7.60% to yield 7.547% due 12/1/2016(j) | 5,216,400 | ||||||||
| 5,000,000 | Plaza Metropolitan District No. 1 Subordinate Public Improvement Fee/Tax Increment Supported Revenue Series 2005, 8.125% to yield 9.163% due 12/1/2025 | 4,999,800 | ||||||||
| 2,340,000 | Potomac Farms Metropolitan District G.O. Refunding and Improvement (LTD Tax Convertible to Unlimited Tax) Series 2007A, 7.25% due 12/1/2037 | 1,962,324 | ||||||||
| 440,000 | Potomac Farms Metropolitan District G.O. Refunding and Improvement (LTD Tax Convertible to Unlimited Tax) Series 2007A, 7.625% due 12/1/2023 | 416,728 | ||||||||
| 9,000,000 | Ravenna Metropolitan District G.O. LTD Tax Series 2007, 7.00% due 12/1/2037(j)(l) | 6,750,000 | ||||||||
| 3,500,000 | Reata North Metropolitan District LTD TAX G.O. Series 2007, 5.50% to yield 9.00% due 12/1/2032 | 2,792,930 | ||||||||
| 13,350,000 | Reata South Metropolitan District LTD TAX G.O. Series 2007A, 7.25% due 6/1/2037 | 12,780,756 | ||||||||
| 4,640,000 | Rendezvous Residential Metropolitan District G.O. LTD Tax Series 2002, 8.00% due 12/1/2021(b) | 5,007,070 | ||||||||
11
Table of Contents
Colorado BondShares
A Tax-Exempt Fund
Schedule of Investments — (Continued)
Face Amount | Value | |||||||||
| Colorado Municipal Bonds — (Continued) | ||||||||||
| 945,000 | Riverdale Peaks II Metropolitan District G.O. (LTD Tax Convertible to Unlimited Tax) Series 2005, 6.40% due 12/1/2025(j)(l) | $ | 472,500 | |||||||
| 1,135,000 | Riverdale Peaks II Metropolitan District G.O. (LTD Tax Convertible to Unlimited Tax) Series 2005, 6.50% due 12/1/2035(j)(l) | 567,500 | ||||||||
| 807,000 | Routt County LID No. 2002-1 Special Assessment Series 2004A, 6.50% to yield 6.59% due 8/1/2024 | 809,001 | ||||||||
| 906,622 | Roxborough Village Metropolitan District Series 1993C, 9.84% due 12/31/2032(i)(j) | 543,973 | ||||||||
| 97,130 | Roxborough Village Metropolitan District Series 1993A, 9.00% due 12/31/2016(i) | 102,804 | ||||||||
| 274,951 | Roxborough Village Metropolitan District Series 1993B, principal only, 0.00% due 12/31/2021(e)(i)(j) | 146,964 | ||||||||
| 286,868 | Roxborough Village Metropolitan District Series 1993B, interest only, 10.41% due 12/31/2042(f)(i)(j) | 44,465 | ||||||||
| 1,960,000 | Serenity Ridge Metropolitan District No. 2 Series 2004, 7.375% due 12/1/2024 | 947,405 | ||||||||
| 500,000 | Silver Peaks Metropolitan District No. 2 G.O. (LTD Tax Convertible to Unlimited Tax) Series 2006, 5.75% due 12/1/2036 | 374,505 | ||||||||
| 3,750,000 | Solitude Metropolitan District Senior G.O. LTD Tax Series 2006, 7.00% due 12/1/2026 | 3,760,200 | ||||||||
| 8,000,000 | Southglenn Metropolitan District Subordinate Convertible Capital Appreciation Special Revenue Series 2008, 8.125% due 12/15/2030 | 8,243,120 | ||||||||
| 2,000,000 | Southlands Metropolitan District No. 1 G.O. (LTD Tax Convertible to Unlimited Tax) Series 2004, 7.125% to yield 7.18% due 12/1/2034(b) | 2,290,800 | ||||||||
| 375,000 | Southlands Metropolitan District No. 1 G.O. (LTD Tax Convertible to Unlimited Tax) Series 2004, 6.75% to yield 6.80% due 12/1/2016(b) | 411,994 | ||||||||
| 1,000,000 | Southlands Metropolitan District No. 1 G.O. (LTD Tax Convertible to Unlimited Tax) Series 2004, 7.00% to yield 7.05% due 12/1/2024(b) | 1,142,930 | ||||||||
| 3,012,007 | Sterling Hills West Metropolitan District G.O. LTD Tax Series 2004, 7.50% due 12/1/2021(b) | 3,496,338 | ||||||||
| 9,000,000 | Stone Ridge Metropolitan District No. 2 G.O. (LTD Tax Convertible to Unlimited Tax) Series 2007, 7.25% due 12/1/2031 | 2,300,400 | ||||||||
| 500,000 | Tallyn’s Reach Metropolitan District No. 2 LTD Tax G.O. Series 2004, 6.375% to yield 7.95% due 12/1/2023 | 503,345 | ||||||||
| 1,195,000 | Traditions Metropolitan District No. 2 G.O. (LTD Tax Convertible to Unlimited Tax) Series 2006, 5.75% to yield 7.63% due 12/1/2036 | 1,152,589 | ||||||||
| 10,470,000 | United Water & Sanitation District Revenue Refunding and Improvement Series 2004A, 6.00% due 12/1/2013(j) | 9,352,013 | ||||||||
| 2,450,000 | United Water & Sanitation District Revenue Series 2004B, 6.00% to yield 6.05% due 3/1/2014(j) | 2,174,399 | ||||||||
12
Table of Contents
Colorado BondShares
A Tax-Exempt Fund
Schedule of Investments — (Continued)
Face Amount | Value | |||||||||
| Colorado Municipal Bonds — (Continued) | ||||||||||
| 20,400,000 | United Water & Sanitation District (Lupton Lakes Water Storage Project and Water Activity Enterprise) Revenue Series 2006, 6.00% due 3/1/2021 | $ | 20,417,748 | |||||||
| 6,875,000 | United Water & Sanitation District Ravenna Project Water Activity Enterprise Capital Appreciation Subordinate Series 2007, 6.125% due 12/1/2037 | 6,303,069 | ||||||||
| 7,500,000 | Valagua Metropolitan District G.O. LTD Tax Series 2008, 7.75% due 12/1/2037 | 5,015,325 | ||||||||
| 2,250,000 | Waterfront Metropolitan District LTD Tax (Convertible to Unlimited Tax) G.O. Refunding & Improvement Series 2007, 4.25% to yield 7.794% due 12/1/2032 | 1,814,152 | ||||||||
| 500,000 | Wheatlands Metropolitan District No. 2 G.O. (LTD Tax Convertible to Unlimited Tax) Series 2005, 6.00% due 12/1/2025 | 467,140 | ||||||||
| 1,245,000 | Wheatlands Metropolitan District No. 2 G.O. (LTD Tax Convertible to Unlimited Tax) Series 2008, 8.25% due 12/15/2035 | 1,266,402 | ||||||||
| 2,043,000 | Wildgrass Metropolitan District G.O. (LTD Tax Convertible to Unlimited Tax) Refunding Series 2007, 6.20% to yield 5.25% due 12/1/2034 | 2,090,929 | ||||||||
|
| |||||||||
Total Colorado Municipal Bonds (amortized cost $441,786,512) | $ | 432,049,063 | ||||||||
|
| |||||||||
| Short-Term Municipal Bonds — 35.9% | ||||||||||
| 6,665,000 | Bachelor Gulch Metropolitan District G.O. Variable Rate Series 2004, 0.20% due 12/1/2023 (LOC 6) | $ | 6,665,000 | |||||||
| 3,830,000 | Base Village Metropolitan District No. 2 LTD Tax Variable Rate Senior Series 2008A, 0.20% due 12/1/2038 (LOC 6) | 3,830,000 | ||||||||
| 5,580,000 | Brighton Crossing Metropolitan District No. 4 Variable Rate Series 2004, 1.68% 12/1/2034 (LOC 7) | 5,580,000 | ||||||||
| 5,220,000 | Bromley Park Metropolitan District No. 2 G.O. (LTD Tax Convertible to Unlimited Tax) Series 2002B, 8.00% due 12/1/2022(b) | 5,438,718 | ||||||||
| 3,891,000 | Bromley Park Metropolitan District No. 2 G.O. (LTD Tax Convertible to Unlimited Tax) Series 2003, 8.00% due 12/1/2028(b) | 4,058,780 | ||||||||
| 11,100,000 | Broomfield Urban Renewal Authority Tax Increment Revenue (Broomfield Event Center Project) Series 2005, 0.85%, due 12/1/2030 (LOC 8) | 11,100,000 | ||||||||
| 485,000 | Castle Pines North Metropolitan District LTD Tax G.O. Variable Rate Refunding | 485,000 | ||||||||
| 7,985,000 | Castle Pines North Finance Corporation Variable Rate Certificates of Participation Series 2009, 0.24% due 12/1/2033 (LOC 1) | 7,985,000 | ||||||||
| 29,545,000 | Castle Rock (Town of) Certificates of Participation Series 2008, 0.24% due 9/1/2037 (LOC 1) | 29,545,000 | ||||||||
| 1,900,000 | Colorado Educational and Cultural Facilities Authority Charter School Revenue (Belle Creek Charter School Project) Series 2002A, 7.625% to yield 7.75% due 3/15/2032(b) | 1,959,204 | ||||||||
13
Table of Contents
Colorado BondShares
A Tax-Exempt Fund
Schedule of Investments — (Continued)
Face Amount | Value | |||||||||
| Short-Term Municipal Bonds — (Continued) | ||||||||||
| 11,240,000 | Colorado Housing and Finance Authority Multi-Family/Project Class I Adjustable Rate 2008 Series C-3, 0.18% due 10/1/2038 (LOC 3) | $ | 11,240,000 | |||||||
| 6,290,000 | Colorado Housing and Finance Authority Single Family Mortgage Class I Adjustable Rate 2006 Series A-2, 0.18% due 11/1/2034 (LOC 3) | 6,290,000 | ||||||||
| 9,750,000 | Colorado Housing and Finance Authority Single Family Mortgage Class I Adjustable Rate 2005 Series B-2, 0.18% due 5/1/2034 (LOC 4) | 9,750,000 | ||||||||
| 7,670,000 | Colorado Housing and Finance Authority Single Family Mortgage Class I Adjustable Rate 2001 Series AA-3, 0.17% due 5/1/2036 (LOC 5) | 7,670,000 | ||||||||
| 6,100,000 | Colorado Housing and Finance Authority Adjustable Rate Multi-Family Housing Insured Mortgage Revenue 2002 Series AA, 0.17% due 10/1/2030 (LOC 5) | 6,100,000 | ||||||||
| 9,700,000 | Colorado Housing and Finance Authority Single Family Mortgage Class I Adjustable Rate 2006 Series C-2, 0.17% due 11/1/2034 (LOC 3) | 9,700,000 | ||||||||
| 8,300,000 | Colorado Springs (City of) Variable Rate Demand Utilities System Improvement Revenue Series 2010C, 0.18% due 11/1/2040 (LOC 9) | 8,300,000 | ||||||||
| 800,000 | Commerce City Northern Infrastructure GID G.O. Variable Rate Refunding (LTD Tax Convertible to Unlimited Tax) Series 2002, 0.20% due 12/1/2031 (LOC 6) | 800,000 | ||||||||
| 15,550,000 | Commerce City Northern Infrastructure GID G.O. Variable Rate Series 2006, 0.20% due 12/1/2028 (LOC 6) | 15,550,000 | ||||||||
| 1,000,000 | Commerce City Northern Infrastructure GID G.O. Variable Rate Series 2008, 0.20% due 12/1/2038 (LOC 6) | 1,000,000 | ||||||||
| 27,845,000 | Cornerstar Metropolitan District Special Revenue Variable Rate Series 2007, 1.68% due 12/1/2037 (LOC 7) | 27,845,000 | ||||||||
| 14,355,000 | Cornerstone Metropolitan District No. 2 Subordinate Variable Rate LTD Tax G.O. Refunding Series 2010B, 0.28% due 12/1/2046 (LOC 10) | 14,355,000 | ||||||||
| 1,500,000 | City and County of Denver Adjustable Rate Economic Development Revenue (The Western Stock Show Association Project) Series 1999, 0.25% due 7/1/2029 | 1,500,000 | ||||||||
| 10,540,000 | EagleBend Affordable Housing Corporation Taxable Convertible Variable Rate Multifamily Housing Project Revenue Refunding Series 2006A, 0.20% due 7/1/2021 (LOC 6) | 10,540,000 | ||||||||
| 4,425,000 | Fronterra Village Metropolitan District No. 2 G.O. (LTD Tax Convertible to Unlimited Tax) Series 2003, 8.00% due 12/1/2023(b) | 4,481,552 | ||||||||
| 5,750,000 | Grand Elk Ranch GID LTD Tax G.O. Series 2003, 8.00% due 12/1/2023(b) | 5,942,395 | ||||||||
| 3,440,000 | Meridian Ranch Metropolitan District G.O. LTD Tax Variable Rate Refunding | 3,440,000 | ||||||||
| 3,000,000 | Meridian Ranch Metropolitan District G.O. LTD Tax Variable Rate Series 2011, 0.20% due 12/1/2040 (LOC 6) | 3,000,000 | ||||||||
14
Table of Contents
Colorado BondShares
A Tax-Exempt Fund
Schedule of Investments — (Continued)
Face Amount | Value | |||||||||
| Short-Term Municipal Bonds — (Continued) | ||||||||||
| 6,300,000 | Town of Mountain Village Housing Authority Housing Facilities Revenue (Village Court Apartments Project) Series 2000, 0.20% due 11/1/2040 (LOC 6) | $ | 6,300,000 | |||||||
| 3,360,000 | Park 70 Metropolitan District G.O. Variable Rate (LTD Tax Convertible to Unlimited Tax) Series 2008, 0.80% due 12/1/2037 (LOC 6) | 3,359,933 | ||||||||
| 900,000 | Parker Automotive Metropolitan District G.O. Variable Rate (LTD Tax Convertible to Unlimited Tax) Series 2005, 0.20% due 12/1/2034 (LOC 6) | 900,000 | ||||||||
| 1,275,000 | Santee Sioux Nation Tribal Health Care Revenue (Indian Health Service Joint Venture Construction Program Project) Series 2009, 7.75% due 10/1/2012 | 1,275,293 | ||||||||
| 7,500,000 | Sheridan Redevelopment Agency Variable Rate Tax Increment Refunding Revenue (South Santa Fe Drive Corridor Redevelopment Project) Series 2011A-1, 0.27% due 12/1/2029 (LOC 9) | 7,500,000 | ||||||||
| 30,560,000 | Solaris Metropolitan District No. 1 Property Tax Revenue Variable Rate Series 2008, 0.38% due 12/1/2038 (LOC 2) | 30,560,000 | ||||||||
| 3,400,000 | Southglenn Metropolitan District (In the City of Centennial) Special Revenue Variable Rate Series 2007, 1.05% due 12/1/2030 (LOC 8) | 3,400,000 | ||||||||
|
| |||||||||
Total Short-Term Municipal Bonds (amortized cost $276,727,168) | $ | 277,445,875 | ||||||||
|
| |||||||||
| Colorado Capital Appreciation and Zero Coupon Bonds — 5.1% | ||||||||||
| 11,175,000 | Bromley Park Metropolitan District No. 2 G.O. LTD Tax Convertible Zero Coupon Series 2007B, 7.00% due 12/15/2037(d) | $ | 10,985,249 | |||||||
| 520,000 | Colorado Health Facilities Authority Zero Coupon Retirement Housing Revenue (Liberty Heights Project) 1990 Subordinate Series B, 6.97% due 7/15/2020(b)(d) | 447,335 | ||||||||
| 7,470,000 | Conifer Metropolitan District Jefferson County Supplemental Interest Coupons | 2,779,139 | ||||||||
| 14,000,000 | PV Water and Sanitation Metropolitan District Capital Appreciation Revenue | 5,600,000 | ||||||||
| 3,875,000 | Ravenna Metropolitan District Supplemental “B” Interest Registered Coupons, 8.25% due 12/1/2012-12/1/2023(d)(l) | 2,586,594 | ||||||||
| 4,390,000 | Traditions Metropolitan District No. 2 Subordinate G.O. (LTD Tax Convertible to Unlimited Tax) Convertible Capital Appreciation Series 2008, 8.50% due 12/15/2037(d) | 3,995,910 | ||||||||
| 9,035,000 | United Water & Sanitation District Ravenna Project Water Activity Enterprise Capital Appreciation Revenue Refunding Series 2009, 6.50% due 12/15/2016(d) | 7,712,908 | ||||||||
| 2,286,030 | United Water & Sanitation District Ravenna Project Water Activity Enterprise Capital Appreciation Subordinate Series 2006B, 7.00% due 12/15/2011(d) | 2,286,030 | ||||||||
15
Table of Contents
Colorado BondShares
A Tax-Exempt Fund
Schedule of Investments — (Continued)
Face Amount | Value | |||||||||||
| Colorado Capital Appreciation and Zero Coupon Bonds — (Continued) | ||||||||||||
| 6,530,000 | Wildwing Metropolitan District No. 1 Capital Appreciation Revenue Series 2008, 7.50% due 12/1/2023(d) |
| $ | 2,907,548 | ||||||||
|
| |||||||||||
Total Colorado Capital Appreciation and Zero Coupon Bonds (amortized cost $43,336,378) |
| $ | 39,300,713 | |||||||||
|
| |||||||||||
| Other Municipal Bonds — 2.4% | ||||||||||||
| 4,904,915 | Freddie Mac Multifamily Variable Rate Certificates Series M001 Class B, 30.08% due 4/1/2037(g)(j) |
| $ | 4,904,915 | ||||||||
| 561,000 | The Industrial Development Authority of the City of Kansas City, Missouri Multi-family Housing Revenue (Alexandria Apartments) Series 2005A, 6.75% due 1/1/2028 |
| 576,972 | |||||||||
| 957,000 | The Industrial Development Authority of the City of St. Louis, Missouri Senior Housing Revenue (Grant School Apartments) Series 2005A, 6.75% due 5/1/2027 |
| 962,713 | |||||||||
| 1,560,000 | Oglala Sioux Tribe (Pine Ridge, South Dakota) Essential Governmental Function Revenue and Refunding Series 2012, 5.00% due 10/1/2022(j) |
| 1,560,000 | |||||||||
| 3,915,000 | Santee Sioux Nation Tribal Health Care Revenue (Indian Health Service Joint Venture Construction Program Project) Series 2009, 8.00% due 10/1/2014 |
| 4,109,301 | |||||||||
| 5,000,000 | Uinta County School District Number 6 G.O. Refunding Series 2006, 7.00% to yield 4.40% due 12/1/2020 |
| 6,250,650 | |||||||||
|
| |||||||||||
Total Other Municipal Bonds (amortized cost $17,781,523) |
| $ | 18,364,551 | |||||||||
|
| |||||||||||
| Colorado Taxable Bonds/Certificates/Notes — 0.8% | ||||||||||||
| 2,100,212 | 777 F High Street LLC, Tax Lien Receipt Certificates, 9.00% due 10/15/2012(j)(m) |
| $ | 2,100,212 | ||||||||
| 4,150,000 | Pioneer Metropolitan District No. 3 LTD Tax G.O. Taxable Series 2012, 11.00% due 12/1/2037(j) |
| 4,150,000 | |||||||||
| 227,347 | Note receivable from Tabernash Meadows, LLC, a Colorado limited liability company, 24.00% due 2/9/2002(a)(j) |
| 206,520 | |||||||||
|
| |||||||||||
Total Colorado Taxable Certificates/Notes (amortized cost $6,477,559) |
| $ | 6,456,732 | |||||||||
|
| |||||||||||
Total investments, at value (amortized cost 786,109,140) | 89.0% | $ | 773,616,934 | |||||||||
Other assets net of liabilities | 11.0% | 95,759,349 | ||||||||||
|
|
|
| |||||||||
Net assets | 100.0% | $ | 869,376,283 | |||||||||
|
|
|
| |||||||||
See accompanying notes to Schedule of Investments
16
Table of Contents
Colorado BondShares
A Tax-Exempt Fund
Schedule of Investments — (Continued)
| (a) | Defaulted or non-income producing based upon the financial condition of the issuer (see footnote 2 in notes to financial statements). |
| (b) | Originally issued as general obligation bonds but are now pre-refunded and are secured by an escrow fund consisting entirely of direct U.S. Government obligations. |
| (c) | Represents securities whose blended characteristics are reflective of a zero coupon bond and a step rate bond. Interest rate shown represents effective yield at acquisition. |
| (d) | Interest rate shown for capital appreciation and zero coupon bonds represents the effective yield at the date of acquisition. |
| (e) | Principal-only certificate represents the right to receive the principal payments on the underlying debt security upon maturity. The price of this security is typically more volatile than that of coupon-bearing bonds of the same maturity. |
| (f) | Interest-only certificate represents the right to receive semi-annual interest payments on the underlying debt security. The principal amount of the underlying security represents the notional amount on which current interest is calculated. The interest rate shown represents the effective yield at the date of acquisition. |
| (g) | Interest rate disclosed for cash flow bond represents the effective yield at September 30, 2012. Income on this security is derived from the cash flow of the issuer. |
| (h) | Represents current interest rate for a step rate bond. No step rate bonds were owned by the Fund at September 30, 2012. |
| (i) | Terms of security have been restructured since the original issuance. The total face amount of all such restructured securities approximates $12,049,088 and a value of $7,848,867 or less than 1.0% of net assets, as of September 30, 2012. |
| (j) | Securities valued at fair value (see footnote 2 in notes to financial statements). |
| (k) | See footnote 7 in notes to financial statements for further information on purchase accrued interest related to these bonds. |
| (l) | The Fund has entered into a forbearance agreement under which it agrees that the issuer may pay a reduced rate of interest in lieu of the contract rate for a period of time (see footnote 2 in notes to financial statements). |
| (m) | Tax lien receipt certificates. |
See accompanying notes to financial statements.
17
Table of Contents
Colorado BondShares
A Tax-Exempt Fund
Schedule of Investments — (unaudited) — (Continued)
| (LOC) | These securities are Variable Rate Demand Obligations (“VRDO”) with scheduled principal and interest payments that have a guaranteed liquidity provider in the form of a letter of credit. These obligations bear interest at a rate that resets daily or weekly (see footnote 2 in notes to financial statements). The numbered list below corresponds to the liquidity provider associated with the respective LOC. |
1. Wells Fargo Bank, N. A.
2. Keybank, N. A.
3. FHLB Topeka
4. Barclays Bank PLC
5. Fannie Mae/Freddie Mac
6. US Bank, N. A.
7. Compass Bank
8. BNP Paribas
9. JPMorgan Chase Bank, N.A.
10. Bank of America, N.A.
The following abbreviations are used in the descriptions of securities included in the Schedule of Investments:
G.O. — General Obligation
GID — General Improvement District
LID — Local Improvement District
LTD — Limited
See accompanying notes to financial statements.
18
Table of Contents
Colorado BondShares
A Tax-Exempt Fund
Statement of Assets and Liabilities
September 30, 2012
| ASSETS | ||||
Investments, at value (amortized cost $786,109,140) | $ | 773,616,934 | ||
— see accompanying schedule | ||||
Cash | 17,046,562 | |||
Interest receivable | 35,633,292 | |||
Purchase accrued (note 7) | 44,427,202 | |||
Receivable for shares of beneficial interest sold | 826,456 | |||
|
| |||
TOTAL ASSETS | 871,550,446 | |||
|
| |||
| LIABILITIES | ||||
Payables and other liabilities: | ||||
Dividends payable | 1,365,288 | |||
Payable for shares of beneficial interest redeemed | 124,270 | |||
Management fees payable | 353,895 | |||
Accrued expenses payable | 330,710 | |||
|
| |||
TOTAL LIABILITIES | 2,174,163 | |||
|
| |||
NET ASSETS | $ | 869,376,283 | ||
|
| |||
COMPOSITION OF NET ASSETS | ||||
Paid-in capital | $ | 881,665,283 | ||
Accumulated net realized gain | 203,206 | |||
Net unrealized depreciation of investments | (12,492,206 | ) | ||
|
| |||
NET ASSETS | $ | 869,376,283 | ||
|
| |||
NET ASSET PRICE AND REDEMPTION PRICE PER SHARE | $ | 9.24 | ||
|
| |||
MAXIMUM OFFERING PRICE PER SHARE | $ | 9.70 | ||
|
| |||
See accompanying notes to financial statements.
19
Table of Contents
Colorado BondShares
A Tax-Exempt Fund
Statement of Operations
For the Fiscal Year Ended September 30, 2012
INVESTMENT INCOME | ||||
Interest | $ | 40,948,795 | ||
EXPENSES | ||||
Management fees (note 4) | 4,101,366 | |||
Custodian fees (note 5) | 77,387 | |||
Legal and auditing fees | 216,518 | |||
Portfolio pricing fees | 20,130 | |||
Registration fees | 7,062 | |||
Shareholders’ reports | 90,681 | |||
Transfer agency expenses (note 4) | 172,622 | |||
Trustees’ fees | 13,052 | |||
Other | 51,792 | |||
|
| |||
Total expenses | 4,750,610 | |||
Custody credits (note 5) | (3,644 | ) | ||
|
| |||
Net expenses | 4,746,966 | |||
|
| |||
NET INVESTMENT INCOME | 36,201,829 | |||
|
| |||
REALIZED AND UNREALIZED GAIN ON INVESTMENTS | ||||
Net realized gain on investments | 166,457 | |||
Net unrealized appreciation on investments | 8,451,582 | |||
|
| |||
NET REALIZED AND UNREALIZED GAIN ON INVESTMENTS | 8,618,039 | |||
|
| |||
NET INCREASE IN NET ASSETS RESULTING FROM OPERATIONS | $ | 44,819,868 | ||
|
|
See accompanying notes to financial statements.
20
Table of Contents
Colorado BondShares
A Tax-Exempt Fund
Statements of Changes in Net Assets
For the Fiscal Years Ended September 30
| 2012 | 2011 | |||||||
FROM OPERATIONS: | ||||||||
Net investment income | $ | 36,201,829 | $ | 36,667,342 | ||||
Net realized gain on investments | 166,457 | 102,098 | ||||||
Unrealized appreciation (depreciation) on investments | 8,451,582 | (5,148,629 | ) | |||||
|
|
|
| |||||
Net increase in net assets resulting from operations | 44,819,868 | 31,620,811 | ||||||
|
|
|
| |||||
FROM DISTRIBUTIONS TO SHAREHOLDERS: (note 2) | ||||||||
Dividends to shareholders from net investment income | (36,201,829 | ) | (36,667,342 | ) | ||||
Net realized gain to shareholders from investment transactions | (29,531 | ) | (24,611 | ) | ||||
|
|
|
| |||||
Total distributions to shareholders | (36,231,360 | ) | (36,691,953 | ) | ||||
|
|
|
| |||||
FROM BENEFICIAL INTEREST TRANSACTIONS: | ||||||||
Proceeds from sale of shares | 114,956,715 | 66,226,744 | ||||||
Reinvested dividends and distributions | 23,061,626 | 23,185,865 | ||||||
Redemption of shares | (61,575,748 | ) | (149,346,212 | ) | ||||
|
|
|
| |||||
Increase (decrease) in net assets derived from beneficial interest transactions | 76,442,593 | (59,933,603 | ) | |||||
|
|
|
| |||||
Net increase (decrease) in net assets | 85,031,101 | (65,004,745 | ) | |||||
NET ASSETS: | ||||||||
Beginning of period | 784,345,182 | 849,349,927 | ||||||
|
|
|
| |||||
End of period | $ | 869,376,283 | $ | 784,345,182 | ||||
|
|
|
| |||||
See accompanying notes to financial statements.
21
Table of Contents
Colorado BondShares
A Tax-Exempt Fund
Financial Highlights
| For Fiscal Years Ended September 30 | ||||||||||||||||||||||||
| 2012 | 2011 | 2010 | 2009 | 2008 | 2007 | |||||||||||||||||||
For a share outstanding throughout the period | ||||||||||||||||||||||||
Net Asset Value, beginning of period | $ | 9.15 | $ | 9.19 | $ | 9.15 | $ | 9.24 | $ | 9.51 | $ | 9.45 | ||||||||||||
|
|
|
|
|
|
|
|
|
|
|
| |||||||||||||
Income From Investment Operations | ||||||||||||||||||||||||
Net investment income(1) | 0.41 | 0.41 | 0.40 | 0.43 | 0.49 | 0.55 | ||||||||||||||||||
Net gain or (loss) on investments (both realized and unrealized) | 0.09 | (0.04 | ) | 0.04 | (0.07 | ) | (0.26 | ) | 0.05 | |||||||||||||||
|
|
|
|
|
|
|
|
|
|
|
| |||||||||||||
Increase from investment operations | 0.50 | 0.37 | 0.44 | 0.36 | 0.23 | 0.60 | ||||||||||||||||||
Less Distributions | ||||||||||||||||||||||||
Dividends to shareholders from net investment income | (0.41 | ) | (0.41 | ) | (0.40 | ) | (0.44 | ) | (0.48 | ) | (0.54 | ) | ||||||||||||
Distributions from realized capital gains | — | — | — | $ | (0.01 | ) | $ | (0.02 | ) | — | ||||||||||||||
|
|
|
|
|
|
|
|
|
|
|
| |||||||||||||
Total Distributions | (0.41 | ) | (0.41 | ) | (0.40 | ) | (0.45 | ) | (0.50 | ) | (0.54 | ) | ||||||||||||
|
|
|
|
|
|
|
|
|
|
|
| |||||||||||||
Net increase (decrease) in net asset value | 0.09 | (0.04 | ) | 0.04 | (0.09 | ) | (0.27 | ) | 0.06 | |||||||||||||||
|
|
|
|
|
|
|
|
|
|
|
| |||||||||||||
Net Asset Value, end of period | $ | 9.24 | $ | 9.15 | $ | 9.19 | $ | 9.15 | $ | 9.24 | $ | 9.51 | ||||||||||||
|
|
|
|
|
|
|
|
|
|
|
| |||||||||||||
Total Return, at Net Asset Value(2) | 5.64 | % | 4.17 | % | 4.95 | % | 4.02 | % | 2.53 | % | 6.59 | %(*) | ||||||||||||
|
|
|
|
|
|
|
|
|
|
|
| |||||||||||||
Ratios/Supplemental Data: | ||||||||||||||||||||||||
Ratios to average net assets: | ||||||||||||||||||||||||
Net investment income | 4.42 | % | 4.56 | % | 4.37 | % | 4.80 | % | 5.23 | % | 5.78 | % | ||||||||||||
Total expenses | 0.58 | % | 0.58 | % | 0.57 | % | 0.55 | % | 0.57 | % | 0.61 | % | ||||||||||||
Net expenses | 0.58 | % | 0.58 | % | 0.57 | % | 0.55 | % | 0.55 | % | 0.56 | % | ||||||||||||
Net assets, end of period (000s) | $ | 869,376 | $ | 784,345 | $ | 849,349 | $ | 794,629 | $ | 755,102 | $ | 577,654 | ||||||||||||
|
|
|
|
|
|
|
|
|
|
|
| |||||||||||||
Portfolio turnover rate(3) | 8.66 | % | 4.67 | % | 2.73 | % | 7.39 | % | 7.04 | % | 13.75 | % | ||||||||||||
|
|
|
|
|
|
|
|
|
|
|
| |||||||||||||
| (1) | Net investment income per share was calculated using an average shares method. |
| (2) | Assumes a hypothetical initial investment on the business day before the first day of the fiscal period, with all dividends reinvested in additional shares on the reinvestment date, and redemption at the net asset value calculated on the last business day of the fiscal period. Sales charges are not reflected in the total returns. |
| (*) | The total return for fiscal year ended September 30, 2007 includes an interest payment of approximately $3.8 million representing four years of unpaid interest relating to the Fund’s holding of United Airlines/Denver International Airport bonds that is a non-recurring event outside of the control of the Fund. |
| (3) | The portfolio turnover rate is computed by dividing the lesser of purchases or sales of portfolio securities for a period by the monthly average of the value of portfolio securities owned during the period. Sales of securities include the proceeds of securities which have been called, or for which payment has been made through redemption or maturity. Securities with a maturity date of one year or less at the time of acquisition are excluded from the calculation. Cost of purchases and proceeds from sales of investment securities (excluding short-term securities) for the period ended September 30, 2012 were $81,563,580 and $41,477,944, respectively. |
See accompanying notes to financial statements.
22
Table of Contents
Colorado BondShares
A Tax-Exempt Fund
Notes to Financial Statements
| (1) | Organization |
Colorado BondShares — A Tax-Exempt Fund (the “Fund”) is registered under the Investment Company Act of 1940, as amended, as a diversified, open-end management company. The Fund’s investment objectives are to maximize income exempt from federal income taxes and from personal income taxes of the State of Colorado to the extent consistent with the preservation of capital and to seek opportunities for capital appreciation. The Fund’s investment adviser is Freedom Funds Management Company (“Freedom Funds”). The following is a summary of significant accounting policies consistently followed by the Fund.
| (2) | Summary of Significant Accounting Policies |
The preparation of financial statements have been prepared in conformity with accounting principles generally accepted in the United States of America. This requires management to make estimates and assumptions that affect the reported amounts of assets and liabilities and disclosure of contingent assets and liabilities at the date of the financial statements and the reported amounts of income and expenses during the reporting period. Actual results could differ from those estimates. These financial statements reflect all adjustments which are, in the opinion of management, necessary to a fair statement of the results for the reporting period. The following summarizes the significant accounting policies of the Fund:
| (a) | Investment Valuation and Risk |
Securities for which there is no last sales price are valued by an independent pricing service based on evaluated prices which considers such factors as transactions in bonds, quotations from bond dealers, market transactions in comparable securities and various relationships between securities, or are fair valued by management.
Fixed-income securities owned by the Fund are subject to interest-rate risk, credit risk, prepayment risk and market risk. The Fund invests in not rated securities which may be subject to a greater degree of credit risk and risk of loss of income and principal and may be more sensitive to economic conditions than lower yielding, higher rated fixed income securities. The Fund concentrates its investments in Colorado and, therefore, may be impacted by specific events, issuers or factors affecting Colorado. The Fund has more credit risk related to the economic conditions of Colorado than a portfolio with a broader geographical diversification.
Securities for which market quotations are not readily available (or management considers otherwise are no longer valid or reliable) are valued at fair value determined in accordance with procedures approved by the Board of Trustees. This can occur in the event of, among other things, natural disasters, acts of terrorism, market disruptions, intra-day trading halts, and extreme market volatility. The determination of fair value involves subjective judgments. As a result, using fair value to price a security may result in a price materially different from the prices used by other mutual funds to determine net asset value or the price that may be realized upon the actual sale of the security. Short-term holdings are valued at current market quotations or amortized cost whichever management believes best approximates fair value.
23
Table of Contents
Colorado BondShares
A Tax-Exempt Fund
Notes to Financial Statements — (Continued)
ASC 820 Fair Value Measurements and Disclosures establishes a fair value hierarchy that classifies securities based on valuation techniques used to measure fair value and distinguish between observable inputs (market data obtained from independent sources) and the reporting entities own assumptions which are not readily observable to market participants. The fair value hierarchy gives the highest priority to quoted prices (unadjusted) in active markets for identical assets or liabilities (Level 1) and the lowest priority to unobservable inputs (Level 3).
Level 1 Inputs: Quoted prices (unadjusted) in active markets for identical assets or liabilities that the reporting entity has the ability to access at the measurement date.
Level 2 Inputs: Inputs other than quoted prices included within Level 1 that are observable for the asset or liability, either directly or indirectly. If the asset or liability has a specified (contractual) term, a Level 2 input must be observable for substantially the full term of the asset or liability.
Level 3 Inputs: Significant unobservable inputs for the asset or liability including management’s own assumptions. Unobservable inputs shall be used to measure fair value to the extent that observable inputs are not available.
The following table summarizes the valuation of the Fund’s investments as defined by ASC 820 hierarchy levels as of September 30, 2012:
Valuation Inputs Summary
| Colorado Municipal Bonds | Short-Term Municipal Bonds | Colorado Capital Appreciation and Zero Coupon Bonds | Other Municipal Bonds | Colorado Taxable Certificates/Notes | Total Securities September 30, 2012 | |||||||||||||||||||
Level 1 Securities | — | — | — | — | — | — | ||||||||||||||||||
Level 2 Securities | 345,523,731 | 277,445,875 | 30,921,574 | 11,899,636 | — | 665,790,816 | ||||||||||||||||||
Level 3 Securities | 86,525,332 | — | 8,379,139 | 6,464,915 | 6,456,732 | 107,826,118 | ||||||||||||||||||
|
|
|
|
|
|
|
|
|
|
|
| |||||||||||||
Totals | 432,049,063 | 277,445,875 | 39,300,713 | 18,364,551 | 6,456,732 | 773,616,934 | ||||||||||||||||||
|
|
|
|
|
|
|
|
|
|
|
| |||||||||||||
24
Table of Contents
Colorado BondShares
A Tax-Exempt Fund
Notes to Financial Statements — (Continued)
| Colorado Municipal Bonds | Colorado Capital Appreciation and Zero Coupon Bonds | Other Municipal Bonds | Colorado Taxable Certificates/Notes | Totals | ||||||||||||||||
Level 3 Beginning Balance September 30, 2011 | 105,103,424 | 8,403,939 | 4,904,915 | 2,306,732 | 120,719,010 | |||||||||||||||
Unrealized Losses | (10,605,176 | ) | (24,800 | ) | — | — | (10,629,976 | ) | ||||||||||||
Unrealized Gains | 3,105,771 | — | — | — | 3,105,771 | |||||||||||||||
Realized Losses | (23,323 | ) | — | — | — | (23,323 | ) | |||||||||||||
Realized Gains | 2,406,566 | — | — | — | 2,406,566 | |||||||||||||||
Purchases | 1,480,000 | — | 1,560,000 | 4,150,000 | 7,190,000 | |||||||||||||||
Sales | (16,037,803 | ) | — | — | — | (16,037,803 | ) | |||||||||||||
Transfers In to Level 3* | 40,739,453 | — | — | — | 40,739,453 | |||||||||||||||
Transfers Out of Level 3* | (39,643,580 | ) | — | — | — | (39,643,580 | ) | |||||||||||||
|
|
|
|
|
|
|
|
|
| |||||||||||
Balance as of | 86,525,332 | 8,379,139 | 6,464,915 | 6,456,732 | 107,826,118 | |||||||||||||||
|
|
|
|
|
|
|
|
|
| |||||||||||
| * | Transferred from Level 2 to Level 3 because of a lack, or change of observable inputs or reduced market data reliability. Transferred from Level 3 to Level 2 are the result of observable inputs becoming available or increased market data reliability. The Fund’s policy is to recognize transfers into and out of Level 3 when management becomes aware of a change to significant observable input or market data reliability. |
From September 30, 2011 to September 30, 2012, there were no Level 1 Securities.
PURCHASE ACCRUED (note 7)
Purchase Accrued Beginning Balance September 30, 2011 | 44,026,872 | |||
Unrealized Losses | — | |||
Unrealized Gains | — | |||
Realized Losses | — | |||
Realized Gains | — | |||
Purchases | — | |||
Sales | — | |||
Transfers In to | — | |||
Transfers Out of | — | |||
|
| |||
Ending Balance September 30, 2012 | 44,026,872 | |||
|
|
The purchase accrued receivable of $44,427,202 at September 30, 2012 is comprised of $44,026,872 for the Meadows Metropolitan Districts No. 1, 2 and 7; the $440,330 difference is attributable to other municipal bonds.
25
Table of Contents
Colorado BondShares
A Tax-Exempt Fund
Notes to Financial Statements — (Continued)
Significant Unobservable Inputs Quantitative Disclosure
Level 3 Securities* | Fair Value September 30, 2012 | Valuation Technique(s) | Unobservable Inputs** | Low | High | Weighted Average | ||||||||||||||||
Colorado Municipal Bonds | 86,525,332 | discounted cash flow | probability of default | 0.00% | 100.00% | 7.51 | % | |||||||||||||||
| consensus pricing | Bond Dealer #1 | 15.50% | 284.18% | 101.27 | % | |||||||||||||||||
| Bond Dealer #2 | 15.50% | 108.00% | 83.66 | % | ||||||||||||||||||
Colorado Capital Appreciation and Zero Coupon Bonds | 8,379,139 | discounted cash flow | probability of default | 100.00% | 100.00% | 100.00 | % | |||||||||||||||
| consensus pricing | Bond Dealer #1 | 37.20% | 40.00% | 39.07 | % | |||||||||||||||||
| Bond Dealer #2 | 37.20% | 37.20% | 37.20 | % | ||||||||||||||||||
Other Municipal Bonds | 6,464,915 | discounted cash flow | probability of default | 0.00% | 5.00% | 1.21 | % | |||||||||||||||
| consensus pricing | Bond Dealer #1 | 100.00% | 100.00% | 100.00 | % | |||||||||||||||||
| Bond Dealer #2 | 100.00% | 100.00% | 100.00 | % | ||||||||||||||||||
Colorado Taxable Certificates/Notes | 6,456,732 | discounted cash flow | probability of default | 5.00% | 100.00% | 9.66 | % | |||||||||||||||
| consensus pricing | Bond Dealer #1 | 90.84% | 100.00% | 99.71 | % | |||||||||||||||||
| Bond Dealer #2 | 91.00% | 100.00% | 99.71 | % | ||||||||||||||||||
|
| |||||||||||||||||||||
Total Level 3 Securities at September 30, 2012 | 107,826,118 | |||||||||||||||||||||
|
| |||||||||||||||||||||
The significant unobservable inputs used in the fair value measurement of the Fund’s securities are collateral value, probability of default, and loss severity in the event of default. Significant increases (decreases) in any of those inputs in isolation would result in a significantly lower (higher) fair value measurement.
*The inputs for these securities are not readily available or cannot be reasonably estimated and are generally those inputs described in Note 2(a). The appropriateness of fair values for these securities is based on results of back testing, broker due diligence, unchanged price review and consideration of macro or security specific events.
**Other unobservable inputs used in the discounted cash flow technique include collateral value and loss severity. These unobservable inputs are specific to the characteristics of each security being valued.
| (b) | Income Tax Information and Distributions to Shareholders |
The Fund intends to comply with the requirements of Subchapter M of the Internal Revenue Code, as amended, applicable to regulated investment companies and to distribute all its net investment income and any net realized gain on investments not offset by capital loss carryforwards to shareholders. The Fund distributes investment income monthly and due to the tax-exempt nature of its investments the income is generally non-taxable to the shareholders. The Fund distributes net realized capital gains, if any, to its
26
Table of Contents
Colorado BondShares
A Tax-Exempt Fund
Notes to Financial Statements — (Continued)
shareholders at least annually. Income distributions and capital gain distributions are determined in accordance with income tax regulations, which may differ from generally accepted accounting principles. These differences are primarily due to the differing treatment of tax allocations.
Management has reviewed the Fund’s tax position for all open tax years. As of September 30, 2012, the Fund did not have a liability for any unrecognized tax benefits. The fund recognizes interest and penalties, if any, related to unrecognized tax benefits as income tax expense in the Statement of Operations. The Fund has no examinations in progress.
The tax components of undistributed net tax-exempt income, net ordinary income and net long-term capital gains at September 30, 2012 the Fund’s tax year end, were as follows:
| 2012 | ||||
Undistributed net tax-exempt income | $ | — | ||
Undistributed net ordinary income* | 5,294 | |||
Undistributed net long-term capital gains | 152,400 | |||
| * | Net ordinary income consists of taxable market discount income and net short-term capital gains, if any. |
The tax character of distributions paid during the Fund’s tax years ended September 30, 2012 and September 30, 2011 was designated for purposes of the dividends paid deduction as follows:
| 2012 | 2011 | |||||||
Distributions from net tax-exempt income* | $ | 36,016,844 | $ | 36,455,892 | ||||
Distributions from net ordinary income** | 351,231 | 198,612 | ||||||
Distributions from net long-term capital gains | 29,531 | — | ||||||
| * | The Fund hereby designates this amount paid during the fiscal year ended September 30, 2012, as Exempt Interest Dividends. |
| ** | Net ordinary income consists of taxable market discount income, taxable interest income and net short-term gains, if any. |
At September 30, 2012, the cost and unrealized appreciation (depreciation) of investments, as determined on a federal income tax basis , were as follows:
Cost of investments | $ | 786,109,140 | ||
|
| |||
Gross unrealized appreciation | $ | 35,093,236 | ||
Gross unrealized depreciation | (47,585,442 | ) | ||
|
| |||
Net unrealized depreciation of investments | $ | (12,492,206 | ) | |
|
|
27
Table of Contents
Colorado BondShares
A Tax-Exempt Fund
Notes to Financial Statements — (Continued)
For tax purposes, capital losses may be carried over to offset future capital gains, if any. Under the Regulated Investment Company Modernization Act of 2010, capital losses incurred by the Fund in taxable years beginning after December 22, 2010 are not subject to expiration and such losses retain their character as either short-term or long-term, rather than being considered short-term as under previous law. Post-enactment capital losses must be fully utilized prior to utilizing any losses incurred in pre-enactment tax years. At September 30, 2012, the Fund did not have any capital loss carryforwards.
| (c) | Defaulted or Non-income Producing Investments |
The Fund discontinues the accrual of interest income on municipal bonds when the securities become delinquent as to payment of principal or interest, or when the Fund’s investment adviser determines that an uncertainty exists as to the realization of all or a portion of the principal balance. The face amount of bonds for which the accrual of interest income has been discontinued approximates $37,948,009 and such bonds have a value of $17,501,388 or 2.01% of net assets, as of September 30, 2012. These securities have been identified in the accompanying Schedule of Investments.
The Fund has entered into forbearance agreements with two districts under which it agrees that the issuer may pay a reduced rate of interest in lieu of the contract rate for a period of time. Total face amount of the bonds for which the Fund has entered into forbearance agreements are $14,955,000 and has a value of $10,376,594 or 1.2% of net assets, as of September 30, 2012. These securities have been identified in the Schedule of Investments.
| (d) | Investment Transactions and Revenue Recognition |
Investment transactions are accounted for on the date the investments are purchased or sold (trade date). Purchases and sales of securities, other than short-term securities, aggregated to $81,563,580 and $41,477,944 respectively.
Dividends to shareholders are declared each business day and paid monthly. Distributions to shareholders are recorded on the ex-dividend date. Realized gains and losses from investment transactions are calculated using the identified-cost basis, which is the same basis the Fund uses for federal income tax purposes. Interest income is recorded on the accrual basis.
Variable Rate Demand Obligations (“VRDO”) purchased by the Fund are floating rate obligations that have a nominal long-term maturity but have a coupon rate that is reset periodically (e.g., daily, or weekly). The investor has the option to put the issue back to the trustee or tender agent at any time with specified (e.g., seven days’) notice, accordingly the Fund treats these obligations as short-term holdings. On September 30, 2012, the interest rates paid on these obligations ranged from 0.17% to 1.68%.
| (e) | Classification of Distributions to Shareholders |
The character of distributions made during the year from net investment income or net realized gains may differ from its ultimate characterization for federal income tax purposes. Also, due to timing of dividend distributions, the fiscal year in which amounts are distributed may differ from the fiscal year in which the income or realized gain was recorded by the Fund.
28
Table of Contents
Colorado BondShares
A Tax-Exempt Fund
Notes to Financial Statements — (Continued)
| (f) | Securities Purchased on a When-Issued Basis |
The Fund may purchase securities on a when-issued basis with payment and delivery scheduled for a future date. These transactions are subject to market fluctuations and may increase or decrease in value prior to the delivery date. The Fund maintains segregated assets with a value equal to or greater than the amount of its purchases commitments. The Fund did not have any when-issued securities at September 30, 2012.
| (3) | Shares of Beneficial Interest |
The Fund has an unlimited number of no par value shares of beneficial interest authorized. Transactions in shares of beneficial interest were as follows:
| Year Ended September 30, 2012 | Year Ended September 30, 2011 | |||||||||||||||
| Shares | Amount | Shares | Amount | |||||||||||||
Shares sold | 12,490,395 | $ | 114,956,715 | 7,301,240 | $ | 66,226,744 | ||||||||||
Dividends reinvested | 2,507,632 | 23,061,626 | 2,560,973 | 23,185,865 | ||||||||||||
|
|
|
|
|
|
|
| |||||||||
| 14,998,027 | 138,018,341 | 9,862,213 | 89,412,609 | |||||||||||||
Shares redeemed | (6,696,300 | ) | (61,575,748 | ) | (16,523,705 | ) | (149,346,212 | ) | ||||||||
|
|
|
|
|
|
|
| |||||||||
Net (decrease) increase in shares outstanding | 8,301,727 | $ | 76,442,593 | (6,661,492 | ) | $ | (59,933,603 | ) | ||||||||
|
|
|
|
|
|
|
| |||||||||
| (4) | Management Fees and Other Transactions with Affiliates |
Management fees paid to Freedom Funds were in accordance with the investment advisory agreement with the Fund which provides for an annual fee equivalent to 0.5% of the net assets of the Fund. Freedom Funds pays all expenses associated with advertising, marketing, and distributing the Fund’s shares and serves as the transfer agent, dividend disbursing agent, and registrar for the Fund. Freedom Funds provided certain transfer agency and shareholder services as part of the management fee arrangement for the period ended September 30, 2012. Transfer agency expenses on the Statement of Operations represent direct expenses charged to the Fund by third parties.
Allen Insurance, an affiliate of the investment adviser, acted as agent for the Fidelity Bond and the Errors and Omissions insurance policy maintained by the Fund and as a result received compensation in the form of commissions. The policies were provided by Traveler’s Insurance Company and all the commissions referred to above were paid by Travelers. Allen Insurance received no compensation directly from the assets of the Fund.
The Fund does not have any Trustees who are affiliated with the Advisor or Distributor. The Board of Trustees appointed a Chief Compliance Officer to the Fund in accordance with federal securities regulations. The Fund does not reimburse the Advisor for any compensation or fees associated with the Chief Compliance Officer.
29
Table of Contents
Colorado BondShares
A Tax-Exempt Fund
Notes to Financial Statements — (Continued)
| (5) | Custody Credits |
Expenses paid indirectly by the Fund represent earnings credits on cash balances maintained with the Fund’s custodian bank, UMB Bank, N.A. The earnings credits resulted in offsetting custodian fees of $3,644 for the period ended September 30, 2012.
| (6) | Indemnification |
From time to time the Fund may be involved in certain disputes and legal actions arising in the ordinary course of its business. While it is not feasible to predict or determine the outcome of these proceedings, in management’s opinion, based on a review with legal counsel, none of these disputes and legal actions is expected to have a material impact on its financial position or results of operations. However, litigation is subject to inherent uncertainties, and an adverse result in these matters may arise from time to time that may harm the Fund’s business.
In the normal course of business, the Fund enters into contracts that contain a variety of representations which provide general indemnifications. The Fund’s maximum exposure under these arrangements is unknown, as this would involve future claims that may be made against the Fund that have not yet occurred. However, based on experience, the Fund expects the risk of loss to be remote.
| (7) | Purchase Accrued Interest |
Purchase accrued interest is typically a component of a municipal bond purchase and is paid on settlement date. The accrual period begins on the last interest payment date (or original issue date) and runs through the day immediately preceding the settlement date. The Fund has purchased three bonds from the Meadows Metropolitan Districts No. 1, 2 and 7 with an aggregate balance of purchase accrued of $44,026,872 (99.1% of the September 30, 2012 balance of $44,427,202). Approximately $27,439,905 of additional interest has accrued on the purchase accrued interest since its purchase in 2007. This additional accrued interest has been fair valued in accordance with ASC 820 at approximately $20,251,942 and is included in other assets net of liabilities in the Schedule of Investments. This amount bears interest at the rate of 7.999% and will be received over an uncertain period of years. The value of the Meadows bonds is contained within three separate line items of the financial statements which all relate to a single set of bonds that cannot be sold separately.
| (8) | New Accounting Pronouncements |
In May 2011, the FASB issued Accounting Standards Update, “Fair Value Measurement: Amendments to Achieve Common Fair Value Measurement and Disclosure Requirements”. The Accounting Standards Update requires quantitative and qualitative disclosure relating to significant unobservable inputs regarding Level 3 fair valued securities. This disclosure is effective for interim and annual periods beginning after December 15, 2011.
| (9) | Subsequent Events |
Management has evaluated the possibility of subsequent events in the Fund’s financial statements through the date of issuance. Management has determined that there are no material events that would require disclosure in the Fund’s financial statements through this date.
30
Table of Contents
Trustees Approve Advisory Agreement (Unaudited)
The Board of Trustees (the “Trustees”) of Colorado BondShares — A Tax-Exempt Fund unanimously approved the continuance of the Fund’s Investment Advisory and Service Agreement with Freedom Funds Management Company (“Freedom Funds”) at a meeting held on September 25, 2012. In approving the Advisory Agreement, the Trustees, including the disinterested trustees, considered the reasonableness of the advisory fee in light of the extent and quality of the advisory services provided and any additional benefits received by Freedom Funds or its affiliates in connection with providing services to the Fund, compared the fees charged by Freedom Funds to those paid by similar funds, and analyzed the expenses incurred by Freedom Funds with respect to the Fund. The Trustees also considered the Fund’s performance relative to a selected peer group, the expense ratio of the Fund in comparison to other funds of comparable size, and other factors. The Trustees determined that the Fund’s advisory fee structure was fair and reasonable in relation to the services provided and that approving the agreement was in the best interests of the Fund and its shareholders. Matters considered by the Trustees in connection with its consideration of the Advisory Agreement included, among other things, the following:
1. Investment Adviser Services
Freedom Funds manages the assets of the Fund, including making purchases and sales of portfolio securities consistent with the Fund’s investment objectives and policies. In addition, Freedom Funds administers the Fund’s daily business affairs such as providing accurate accounting records, computing accrued income and expenses of the Fund, computing the daily net asset value of the Fund, assuring proper dividend disbursements, proper financial information to investors, and notices of all shareholders’ meetings, and providing sufficient office space, storage, telephone services, and personnel to accomplish these responsibilities. In considering the nature, extent and quality of the services provided by Freedom Funds, the Trustees believe that the services provided by Freedom Funds have provided the Fund with superior results. At the same time, Freedom Fund’s fee structure is equal to or lower than all but two of the comparable funds. The Trustees noted the Fund’s focus is inherently more labor intensive. Under the circumstances, the Trustees found the fee structure to be justified.
2. Investment Performance
The Trustees reviewed the performance of the Fund compared to other, similar funds, and reported that the current (as of September 24, 2012) net asset value was $9.24 per share and the current distribution yield (based on net asset value) was 4.08% (also as of September 24, 2012). Since the overall structure of the portfolio was satisfactory and the performance of the Fund, measured in terms of distribution yield, was ahead of the other members of its peer group of Colorado funds (higher than the distribution yield of six comparable Colorado municipal bond funds), no changes to either the type of assets or manner of operations were recommended.
3. Expense Ratios
The Trustees reviewed the performance (measured by distribution yield), fees and expense ratios of six Colorado municipal bond funds (such six being the only such funds known to the Trustees at the time). The Fund was at the top of the list in terms of current yield, it had one of the lowest expense ratios. The Trustees considered the fact that the Fund’s unique focus on unrated bonds, while geared toward producing superior
31
Table of Contents
investment results, often required additional expenses. While expenses can vary with non-rated bonds (principally as a result of litigation with respect to defaulted issues), the Trustees noted the Fund’s performance for the current year.
4. Management Fees and Expenses
The Trustees reviewed the investment advisory fee rates payable by the Fund to Freedom Funds. As part of its review, the Trustees considered the estimated advisory fees and the Fund’s estimated total expense ratio for the one-year period ending September 30, 2012 as compared to a group of six comparable Colorado municipal bond funds identified by Freedom Funds. After reviewing the foregoing information, and in light of the nature, extent and quality of the services provided by Freedom Funds, the Trustees concluded that the advisory fees charged by Freedom Funds for the advisory and related services to the Fund and the Fund’s total expense ratio are reasonable. The management fee is one half of one percent of total net assets managed. Such fee is payable to Freedom Funds on a monthly basis. This fee is comparable to the group of six competing Colorado municipal bond funds identified by Freedom Funds and is consistent with national funds many times the Fund’s size.
5. Profitability
The Trustees reviewed the level of profits realized by Freedom Funds and relevant affiliates thereof in providing investment and administrative services to the Fund. The Trustees considered the level of profits realized without regard to revenue sharing or other payments by Freedom Funds and its affiliates to third parties in respect to distribution of the Fund’s securities. The Trustees also considered other direct or indirect benefits received by Freedom Funds and its affiliates in connection with its relationship with the Fund and found that there were none. The Trustees concluded that, in light of the foregoing factors and the nature, extent and quality of the services provided by Freedom Funds, the profits realized by Freedom Funds are reasonable.
6. Economies of Scale
In reviewing advisory fees and profitability, the Trustees also considered the extent to which Freedom Funds and its affiliates, on the one hand, and the Fund, on the other hand, can expect to realize benefits from economies of scale as the assets of the Fund increase. The Trustees acknowledged the difficulty in accurately measuring the benefits resulting from the economies of scale with respect to the management of any specific fund or group of funds, particularly in an environment where costs are rising due to changing regulations. The Trustees reviewed data summarizing the increases and decreases in the assets of the Fund over various time periods, and evaluated the extent to which the total expense ratio of the Fund and Freedom Fund’s profitability may have been effected by such increases or decreases. Between October 2011 and September 24, 2012, total net assets of the Fund under management by Freedom Funds increased about 10% (from around $784 million to $863 million). To the extent that the Fund has been able to obtain information, it appears that redemptions of Fund shares have occurred as a result of factors other than the performance of the Fund, such as tax payments and estate settlements. As a result, the redemptions of Fund’s shares do not appear to follow any pattern and redemptions do not seem to be occurring as a result of any dissatisfaction with the Fund’s performance. The number of shares of the Fund that have been redeemed has been less than the number of new shares issued by the Fund, and as a result the Fund continues to grow at what the Trustees determined was a healthy level and the fund is nearing its all-time high in terms of total assets.
32
Table of Contents
Based upon the foregoing, the Trustees concluded that the benefits from the economies of scale are currently being shared equitably by Freedom Funds and the Fund. The Trustees also concluded that the structure of the advisory fee can be expected to cause Freedom Funds, its affiliates and the Fund to continue to share such benefits equitably and that breakpoints need not be instituted at this time.
After requesting and reviewing these and other factors that they deemed relevant, the Trustees concluded that the continuation of the Advisory Agreement was in the best interest of the Fund and its shareholders.
Freedom Funds also serves as the transfer agent, shareholder servicing agent and dividend disbursing agent for the Fund, pursuant to a Transfer Agency and Service Agreement (the “Service Agreement”). Freedom Fund’s duties under the Service Agreement include processing purchase and redemption transactions, establishing and maintaining shareholder accounts and records, disbursing dividends declared by the Fund and all other customary services of a transfer agent, shareholder servicing agent and dividend disbursing agent. As compensation for these services, the Fund may pay Freedom Funds at a rate intended to represent Freedom Fund’s cost of providing such services. This fee would be in addition to the investment advisory fee payable to Freedom Funds under the Advisory Agreement.
33
Table of Contents
Officers and Trustees of the Fund (unaudited)
The following tables list the trustees and officers of the Fund, together with their address, age, positions held with the Fund, the term of each office held and the length of time served in each office, principal business occupations during the past five years and other directorships, if any, held by each trustee and officer. Each trustee and officer has served in that capacity for the Fund continuously since originally elected or appointed. The Board supervises the business activities of the Fund. Each trustee serves as a trustee until termination of the Fund unless the Trustee dies, resigns, retires, or is removed.
Name, Address and Age | Position held with the Fund and Length of Time Served | Principal Occupation | Other Directorships Held By Director | |||
| Non-Interested Trustees | ||||||
Bruce G. Ely 1200 17th Street, Suite 850 Denver CO 80202 Age: 61 | Trustee since July 2002 | Mr. Ely is currently a Regional Director for Cutwater Asset Management, a wholly owned subsidiary of MBIA, Inc. | None | |||
James R. Madden 1200 17th Street, Suite 850 Denver CO 80202 Age: 68 | Trustee since September 2004 | Mr. Madden has owned Madden Enterprises, a real estate company that owns and leases commercial buildings and real estate, for the past thirty years. He is also a stockholder and director of Community National Bank in western Kansas. He has been a bank director for 25 years. | None | |||
| Interested Trustees* | ||||||
George N. Donnelly 1200 17th Street, Suite 850 Denver CO 80202 Age: 65 | Chairman of the Board of Trustees, Trustee since inception of the Fund in 1987 and Interim President, Secretary and Treasurer of the Fund since September 26, 2008 | Mr. Donnelly was a Senior Regional Vice President for Phoenix Life Insurance Company until his retirement in January 2010. | None | |||
*George N. Donnelly is an “interested person” of the Fund as defined in the Investment Company Act of 1940 (the “1940 Act”) by virtue of his position as both an officer and a trustee of the Fund as described in the table above. None of the trustees nor the officers of the Fund has any position with the Investment Adviser, the principal underwriter of the Fund, the distribution agent of the Fund, the service agent of the Fund or the custodian of the Fund, or any affiliates thereof. There is no family relationship between any officers and trustees of the Fund.
34
Table of Contents
Compensation
The Board met three times during the fiscal year ended September 30, 2012. The following tables show the compensation paid by the Fund to each of the trustees during that year:
Name of Person, Position(s) with the Fund | Aggregate Compensation | Pension or Retirement As Part of Fund Expenses | Total compensation | |||||||||
| Non-Interested Trustees | ||||||||||||
Bruce G. Ely, Trustee | $ | 1,600 | N/A | $ | 1,600 | |||||||
James R. Madden, Trustee | 2,400 | N/A | 2,400 | |||||||||
Interested Trustees | ||||||||||||
George N. Donnelly, Trustee, Interim President, Secretary and Treasurer | 2,400 | N/A | 2,400 | |||||||||
No officer or trustee of the Fund received remuneration from the Fund in excess of $60,000 for services to the Fund during the fiscal year ended September 30, 2012. The officers and trustees of the Fund, as a group, received $6,400 in compensation from the Fund for services to the Fund during the 2012 fiscal year.
Other Information (Unaudited)
Proxy Voting Record
The Fund does not invest in equity securities. Accordingly, there were no matters relating to a portfolio security considered during the 12 months ended June 30, 2012 with respect to which the Fund was entitled to vote. Applicable regulations require us to inform you that the foregoing proxy voting information is available on the SEC website at http://www.sec.gov or you may call us at 1-800-572-0069.
Quarterly Statement of Investments
The Fund files a complete statement of investments with the Securities and Exchange Commission for the first and third quarters for each fiscal year on Form N-Q. Shareholders may view the filed Form N-Q by visiting the Commission’s website at http://www.sec.gov. The filed form may also be viewed and copied at the Commission’s Public Reference Room in Washington, DC. Information regarding the operations of the Public Reference Room may be obtained by calling 1-800-732-0330 or you may call us at 1-800-572-0069.
35
Table of Contents
(This page intentionally left blank)
Table of Contents
Officers and Trustees
George N. Donnelly, Chairman of the Board of Trustees, Interim President, Secretary, Treasurer and Trustee
Bruce G. Ely, Trustee
James R. Madden, Trustee
Fred R. Kelly, Jr., Portfolio Manager
Investment Adviser
Freedom Funds Management Company
Transfer, Shareholder Servicing, and Dividend Disbursing Agent
Freedom Funds Management Company
Distributor
SMITH HAYES Financial Services Corporation
Custodian of Portfolio Securities
UMB Bank, N.A.
Independent Registered Public Accounting Firm
PricewaterhouseCoopers LLP
Legal Counsel
Kutak Rock LLP
This report is submitted for the general information of the shareholders of Colorado BondShares — A Tax-Exempt Fund. This report must be preceded or accompanied by a Prospectus of the Fund. The prospectus contains information concerning the investment policies and expenses of the portfolio in addition to other pertinent information. Shares of Colorado BondShares — A Tax-Exempt Fund are not deposits or obligations of any bank, are not guaranteed by any bank, are not insured by the FDIC or any other agency, and involve investment risks, including possible loss of the principal amount invested.
FEDERAL INCOME TAX INFORMATION
(unaudited)
The Fund hereby designates the following amount for the Fund’s fiscal year ended September 30, 2012:
Exempt interest dividends: 99.0%
Individual shareholders should refer to their Form 1099s or other tax information, which will be mailed in February 2013, to determine the calendar year amounts to be included on their 2012 tax returns. Shareholders should consult their tax advisers.
In early 2013, shareholders will receive information regarding all dividends and distributions paid to them by the Fund during calendar year 2012. Regulations of the U. S. Treasury Department require the Fund to report this information to the Internal Revenue Service.
Table of Contents

A Tax-Exempt Fund
ANNUAL REPORT
September 30, 2012
Table of Contents
(a) The registrant, as of the end of the period covered by this report, has adopted a code of ethics (as defined in Item 2 of Form N-CSR), that applies to its President (Principal Executive Officer) and Treasurer (Principal Financial Officer).
(c) There have been no amendments to the code of ethics during the period covered by this report.
(d) The registrant has not granted, during the period covered by this report, any waivers, including an implicit waiver, from the code of ethics.
(f)(3) A copy of the registrant’s code of ethics is available upon request and without charge by calling or writing the registrant at 1200 Seventeenth Street, Suite 850, Denver, Colorado 80202, telephone (303) 572-6990 or (800) 572-0069 (outside Denver).
ITEM 3. AUDIT COMMITTEE FINANCIAL EXPERT.
(a) The registrant’s board of trustees has determined that the registrant does not have an “audit committee financial expert” as such term is defined by the Securities and Exchange Commission pursuant to Item 3 of Form N-CSR, as no single individual appears to meet all of the independence and the financial training/experience qualifications outlined in the instructions to Form N-CSR. The board of trustees, which serves as the audit committee, has determined that it collectively has experience evaluating financial statements and understanding internal control over financial reporting and the audit committee function and has sufficient financial expertise to adequately perform its duties without the addition of an expert.
ITEM 4. PRINCIPAL ACCOUNTANT FEES AND SERVICES.
The following table shows the amount of fees and reimbursable expenses that PricewaterhouseCoopers LLP, the registrant’s independent registered public accounting firm, billed to the registrant during the registrant’s last two fiscal years. For the reporting periods, the audit committee approved in advance all services that PricewaterhouseCoopers LLP provided to the registrant.
The aggregate fees billed by the registrant’s independent registered public accounting firm, for professional services in the registrant’s fiscal years ended September 30, 2012 and 2011 are as follows:
| 2012 | 2011 | |||||||
(a) Audit Fees | $ | 155,000 | $ | 109,200 | ||||
(b) Audit-Related Fees | $ | 0 | $ | 0 | ||||
(c) Tax Fees | $ | 0 | $ | 0 | ||||
(d) All Other Fees | $ | 0 | $ | 0 | ||||
The above “Audit Fees” were billed for amounts related to the audit of the registrant’s financial statements and services normally provided by the accountant in connection with statutory and regulatory filings.
(e)(1) The board of trustees serves as the audit committee and pre-approves all audit and non-audit services to be provided by the registrant’s independent registered public accounting firm.
(e)(2) Not applicable.
(f) Not applicable.
(g) No non-audit fees were billed by the registrant’s independent registered public accounting firm for services rendered to the registrant and the registrant’s investment adviser and any entity controlling, controlled by, or under common control with the adviser that provides ongoing services to the registrant for the fiscal years ended September 30, 2012 and 2011.
Table of Contents
(h) The registrant’s independent registered public accounting firm did not provide any non-audit services to the registrant in the registrant’s fiscal years ended September 30, 2012 and 2011.
ITEM 5. AUDIT COMMITTEE OF LISTED REGISTRANTS.
Not applicable.
(a) Please see the Schedule of Investments contained in the Annual Report included under Item 1 of this Form N-CSR.
(b) Not applicable.
ITEM 7. DISCLOSURE OF PROXY VOTING POLICIES AND PROCEDURES FOR CLOSED-END MANAGEMENT INVESTMENT COMPANIES.
Not applicable.
ITEM 8. PORTFOLIO MANAGERS OF CLOSED-END MANAGEMENT INVESTMENT COMPANIES.
Not applicable.
ITEM 9. PURCHASES OF EQUITY SECURITIES BY CLOSED-END MANAGEMENT INVESTMENT COMPANY AND AFFILIATED PURCHASERS.
Not applicable.
ITEM 10. SUBMISSION OF MATTERS TO A VOTE OF SECURITY HOLDERS.
The registrant has not adopted procedures by which shareholders may recommend nominees to the registrant’s board of trustees.
ITEM 11. CONTROLS AND PROCEDURES.
(a) The registrant has adopted and maintained disclosure controls and procedures (as such term is defined in Rules 30a-3(c) under the Investment Company Act of 1940, as amended (the “Act”)) that are designed to ensure that information required to be disclosed in the registrant’s reports under the Act, is recorded, processed, summarized and reported within the time periods required under the SEC’s rules and forms and that the information is accumulated and communicated to the registrant’s management, including its principal executive officer and principal financial officer to allow for timely decisions regarding required disclosure.
As required by Rule 30a-3(b) of the Act, the registrant carried out an evaluation under the supervision and with the participation of its management, including its principal executive officer and principal financial officer, of the effectiveness of the design and operation of the registrant’s disclosure controls and procedures within the 90-day period prior to the filing date of this report. Based on the foregoing, the registrant’s principal executive officer and principal financial officer have concluded that the registrant’s disclosure controls and procedures were effective, as of that date.
(b) There were no changes in the registrant’s internal control over financial reporting (as defined in Rule 30a-3(d) under the Act) during the period covered by this report that has materially affected, or is reasonably likely to materially affect, the registrant’s internal control over financial reporting.
Table of Contents
(a)(1) | �� | Not applicable (See Item 2(f)(3) of this report). |
(a)(2)(i) | ||
(99.302) | Interim President’s (Principal Executive Officer) Section 302 Certification | |
(a)(2)(ii) | ||
(99.302) | Interim Treasurer’s (Principal Financial Officer) Section 302 Certification | |
(a)(3) | Not applicable. | |
(b) | ||
(99.906) | Combined Interim President & Treasurer (Principal Executive Officer and Principal Financial Officer) Section 906 Certification |
Table of Contents
Signatures
Pursuant to the requirements of the Securities Exchange Act of 1934 and the Investment Company Act of 1940, the registrant has duly caused this report to be signed on its behalf by the undersigned, thereunto duly authorized.
(Registrant) Colorado BondShares — A Tax-Exempt Fund
| By (Signature and Title) | /s/ George N. Donnelly | |
George N. Donnelly Interim President, Secretary and Treasurer |
Date: December 10, 2012
Pursuant to the requirements of the Securities Exchange Act of 1934 and the Investment Company Act of 1940, this report has been signed below by the following persons on behalf of the registrant and in the capacities and on the dates indicated.
/s/ George N. Donnelly |
George N. Donnelly Interim President, Secretary and Treasurer (Principal Executive Officer and Principal Financial Officer) Date: December 10, 2012 |