Table of Contents
UNITED STATES
SECURITIES AND EXCHANGE COMMISSION
Washington, D.C. 20549
FORM N-CSR
CERTIFIED SHAREHOLDER REPORT OF REGISTERED
MANAGEMENT INVESTMENT COMPANIES
Investment Company Act file number: 811-05009
COLORADO BONDSHARES —
A TAX-EXEMPT FUND
(Exact name of registrant as specified in its charter)
1200 17TH STREET, SUITE 850
DENVER, COLORADO 80202-5808
(Address of principal executive offices) (Zip code)
FRED R. KELLY, JR.
1200 17TH STREET, SUITE 850
DENVER, COLORADO 80202-5808
(Name and address of agent for service)
Registrant’s telephone number, including area code: 303-572-6990
Date of fiscal year end: 09/30
Date of reporting period: 09/30/2021
Table of Contents
Table of Contents
ITEM 1. REPORTS TO STOCKHOLDERS.
Table of Contents
November 22, 2021
Dear Shareholders,
For those of us old enough to remember the 1970’s and the inflation we experienced, it’s hard not to fear a return to those days. Even though the similarities between then and now are unmistakable and unsettling, there are also huge differences worth noting. Everyone is bracing for higher rates but usually when all are in agreement, they end up being wrong. Granted, massive spending on the part of the Federal government ordinarily translates into inflationary pressures. However, one dollar spent by government does not necessarily equate to one dollar of gain in the economy. Today we only get a $0.25 benefit because the dollars, for the most part, are not being spent on factors of production that grow the economy. In the 1970’s that number was closer to $0.70 so there was a much stronger inflationary impact from spending and there was much less government borrowing in those days. There is such a thing as diminishing returns; the first stimulus works but every time thereafter is less effective until there is virtually no positive effect, which is where we are right now. It’s like driving your automobile. From a standing start, the acceleration is steady and responsive. Once you get up to top speed you can push on the accelerator as much as you want and there is no further gain. If you continue “pedal to the metal” you will soon need to re-fuel and your engine will eventually fail.
Like the car, money also has velocity. Ordinarily in a new business start-up, the owners go to their bank and obtain a loan to finance what they need to begin providing goods and services. The bank books the loan, earning interest and the business, ideally, runs at a profit. What started out as a single deposit at the bank becomes a loan, a building, furniture, fixtures, salaries, etc.; all of which have to be acquired somewhere and the money gets spread around. This overly simplified example describes the multiplier effect and, by extension, the velocity of money. Today, in contrast, the government borrows the money and distributes it to the people. The people, unable to buy anything, deposit it in the bank. Unable to put it to work in the form of loans, the bank purchases U.S. Treasuries at a low yield and pays taxes back to the Treasury; no velocity of money, little growth in GDP, diminished demand for products. In effect, this massive liquidity exerts tremendous downward pressure on interest rates because everyone with spare change is competing to “buy yield.” Also, as government becomes an even greater part of the economy, private industry, which does contribute to GDP, comprises less of the total, making matters even worse. Even though I do not endorse all of the spending, I believe it is possible to have relatively low rates concurrent with inflation. We will have increases periodically but under the current circumstances, rates
Table of Contents
will only go where the Federal Reserve wants them to go. This is only possible because the U.S. is the world’s reserve currency and we issue dollar denominated debt. And, next year’s cheaper products are sitting in containers just off the west coast. They are within easy reach, someday.
On a more seasonal note, our “shelves” are fully stocked for the Christmas season and the price of our shares is reasonable. We only come in the color of money and may be the only thing in the world not available on Amazon. Deliveries for existing shareholders can be made with a phone call or you can do what I typically do and wait until the last minute to order because we will be here, as always.
Attached for your review, is our annual report. All things considered, this may be our best year ever. Using our definition of redistribution of wealth, we sent out $63,836,562 in dividends, gained $0.17 per share in value and spent $232,077,453 in meritorious Colorado projects that, we hope, will make all of us proud.
Thank you very much for your business.
Sincerely,

Fred R. Kelly, Jr.
Portfolio Manager
Table of Contents
Officers and Trustees George N. Donnelly, Chairman of the Board of Trustees, Interim President, Secretary, Treasurer and Trustee Bruce G. Ely, Trustee James R. Madden, Trustee Fred R. Kelly, Jr., Portfolio Manager
Investment Adviser Freedom Funds Management Company
Transfer, Shareholder Servicing, and Dividend Disbursing Agent Freedom Funds Management Company
Distributor Colorado Financial Service Corporation
Custodian of Portfolio Securities UMB Bank, N.A.
Independent Registered Public Accounting Firm Plante & Moran, PLLC
Special Legal Counsel Kutak Rock LLP
This report is submitted for the general information of the shareholders of Colorado BondShares — A Tax-Exempt Fund. This report must be preceded or accompanied by a Prospectus of the Fund. The prospectus contains information concerning the investment policies and expenses of the portfolio in addition to other pertinent information. Shares of Colorado BondShares — A Tax-Exempt Fund are not deposits or obligations of any bank, are not guaranteed by any bank, are not insured by the FDIC or any other agency, and involve investment risks, including possible loss of the principal amount invested. |
FEDERAL INCOME TAX INFORMATION
(unaudited)
The Fund hereby designates the following amount for the Fund’s fiscal year ended September 30, 2021:
Exempt interest dividends: 93.09%
In early 2022, shareholders will receive information regarding all dividends and distributions paid to them by the Fund during calendar year 2021. Regulations of the U.S. Treasury Department require the Fund to report this information to the Internal Revenue Service.
Individual shareholders should refer to their Form 1099s or other tax information to determine the calendar year amounts to be included on their 2021 tax returns. Shareholders should consult their tax advisers.
Table of Contents
MANAGEMENT’S DISCUSSION OF FUND PERFORMANCE
Fiscal year 2021 was another memorable one, and in many regards, it was a notable improvement from 2020. Helped by the distribution of the vaccines and a deeper understanding of how the virus is transmitted, how to best treat those infected by it, and who is most vulnerable to it, the world started taking steps back to normalcy. However, life going forward will likely be different than life before the arrival of the virus as its emergence and subsequent lockdowns have caused people to rethink and rearrange many aspects of their lives, including how one purchases goods (online versus in a store), how much one frequents the office (daily, weekly, or not at all), and where one lives (in congested coastal cities or in less densely populated areas). Even though COVID has altered and is altering many aspects of our economy and lifestyle, the positions of Colorado BondShares – A Tax-Exempt Fund (“Fund”) continued to perform strongly as they were conservatively underwritten, are robustly collateralized, and are focused on foundational elements of our society, such as housing and schools.
Although some sectors continue to struggle, on the aggregate, the US economy has roared back from the COVID-19 induced recession. The economy was initially boosted by the fiscal stimulus package and subsequently boosted by unleashing the pent-up demand that accumulated during the lockdown. Satisfying this recent demand has emerged as a new problem as supply shocks have rippled across various parts of the economy, driven by labor shortages, the inability to source components, and shipping and trucking bottlenecks. This situation resulted in prices increasing, which is raising concern that inflation will be the next problem confronting the US economy. Inflation is influenced by many factors, making it a complex situation. Currently, the supply and demand dynamic for many goods is imbalanced, such as used cars. This situation could persist in the short-term as the supply chain is reconfigured and shortages arise. However, over the long-term, profit-maximizing companies will bring on new supply in areas where prices are unjustifiably high, thereby suppressing prices eventually. Additionally, offshoring and technology are two long-term trends that have strong disinflationary effects. Finally, even though the quantitative easing programs being executed by the global central bankers is creating a large amount of money, it is mostly confined to the financial system, primarily inflating the prices of financial assets and not significantly affecting the prices of everyday goods.
Colorado’s economy continues to perform strongly and has benefited from some of the trends that emerged from COVID. At a top level, the state economy has almost recovered all the jobs that it lost from the pandemic even though the recovery has not been uniform across sectors. The hospitality industry has been the slowest to recover while other industries, like professional services, have surpassed their pre-COVID employment peaks. The growth in Colorado’s economy is driven by many of the state’s underlying characteristics, such as active lifestyle, more affordable housing than the coastal cities, and low tax regime. These aspects continue to attract new companies to Colorado and motivate others to expand their existing operations. Recent announcements include York Space Systems’ decision to build a new 115,000 SF factory in Denver, Fidelity’s decision to hire another 375 individuals at its office in Colorado, and Cogent Biosciences’ decision to open a research hub in Boulder. These corporate decisions are being heavily influenced by the ability to access talent in Colorado, which is creating a clustering effect. Although Colorado has a very diverse economy, it has large concentrations of energy, technology, and space companies. These clusters will lure more companies to Colorado in the future to collaborate with and hire talent from the existing ecosystem. This trend should continue and will likely get stronger as these clusters grow.
1
Table of Contents
A large portion of the Fund’s investments are indirectly secured by real estate, particularly residential real estate. This asset class continues to perform well, driven by the large supply and demand imbalance in the market. Due to its active lifestyle and its strong economy, Colorado keeps attracting people. This trend accelerated during COVID, as many people relocated to Colorado after given the ability to work remotely. The new supply of homes has not been great enough to meet this increased demand as well. A lengthy home permitting process and shortages of land, labor, and materials have limited the local building industry’s ability to deliver supply. This shortage is best reflected by the inventory of homes available for sale, which remains at historically low levels. This imbalance is also reflected in the apartment market, which had a vacancy rate under 4% in 3Q’21, a 20-year low. The lack of homes on the market and robust demand strongly pushed up home prices again over the year. Some believe that prices at these levels are unsustainable and that another housing bust is around the corner. An examination of the characteristics of this boom versus the previous one weakens that argument. The last housing boom was characterized by oversupply and unstable financing, highlighted by a resetting of adjustable-rate mortgages, while this boom is driven by elevated demand, a dearth of supply, and reasonable lending at low interest rates. Unless there is a change in the supply and demand dynamic, prices are likely to continue increasing into the future. This has been the case in other cities facing a similar situation, such as Toronto, Dublin, and Hong Kong.
In addition to housing, many of the Fund’s investments are indirectly secured by other types of real estate, including apartments, office buildings, and industrial warehouses. The pricing for these assets continues to be robust as well, benefiting from many of the characteristics supporting the Colorado economy and housing market. As people have shifted the way that they purchase goods from the mall to online, absorption of industrial real estate, which warehouses and distributes those goods, has skyrocketed, pushing up rents and values. In the office market, despite the recent work-from-home trend, many sophisticated investors are betting that Denver’s office buildings will thrive over the long-term, highlighted by the sale of 1551 Wewatta Street in the central business district for approximately $800 PSF, a record for the market. Finally, the value of apartment buildings continues to push higher, as rents increase and investors’ desire to augment their exposure to Colorado grows. The Pullman, a luxury apartment with large suites,
recently sold for approximately $1 million a unit, which is another record for the market. Similar to housing, the pricing for these assets is likely to continue to appreciate, supported by the underlying fundamentals of the Colorado economy.
The Fund also has a notable allocation to bonds secured by charter schools. This sector has many favorable characteristics. Charter schools receive funding on a per pupil basis. In order to boost/maintain funding, the school’s administrators need to increase/sustain enrollment, which is often correlated to their students achieving high test scores. This creates accountability with the teachers and school administrators, which drives them to excel at teaching while being mindful of costs. Additionally, these bonds are typically collateralized by real estate, providing another layer of downside protection. The charter school bonds have performed well during the pandemic as administrators adjusted policies, curriculums, and teaching methods to the new environment, which allowed many charter schools to offer in-class teaching during much of the pandemic. These adjustments kept enrollments steady.
The municipal bond market performed very well during 2021. It mimicked the performance across most other parts of the bond market, including investment grade and high yield. During the year, the spreads of these bonds grinded lower and now hover around historically low levels. The strength of these markets is being driven by the recovering economy, low interest rates, and the massive amount of bonds purchased by the global central bankers. Interest rates are a critical variable in the pricing of financial assets, including the bonds owned by the Fund. Some have raised concerns that interest rates will increase notably going
2
Table of Contents
forward. Although a moderate increase in rates is a possibility, a sizable increase in rates for a sustained period is unlikely. Given that an outsized portion of the western economies are dependent on elevated and increasing asset prices and that a large amount of debt secures these assets, the central bankers will struggle with raising interest rates meaningfully as doing so would adversely impact asset prices, thus slowing down the economy. Going forward, periods of volatility are likely and moments of heightened volatility are a possibility, but over the long-term, rates will likely stay low as raising them would cause too much harm.
During the fiscal year ending September 30, 2021, the Fund returned 5.91%, again showcasing its stabilitiy and consistency. This was accomplished by focusing the Fund’s investments in bonds secured by stable and growing cash flows and structured with added security to minimize the downside. Unlike many of its peers, the Fund does not use leverage. Although leverage boosts returns during good times, it also magnifies mistakes and risky exposures during bad times. The Fund also typically maintains a reasonably sized balance of cash in order to capitalize on unexpected opportunities, which often times consist of securities trading at attractive discounts. Finally, the Fund has maintained an average duration that is shorter than its peer group in order to mitigate the risk of a sharp and unexpected rise in interest rates. Implementing this strategy has helped the Fund outperform over time. According to Morningstar, over the past ten years, the Fund has consistently been ranked as one of the best performing municipal bond funds in the US and has often been ranked as the best performing municipal bond fund in the US, exhibiting the merits and effectiveness of this strategy.
The Fund maintained its strategy of allocating a sizable amount of its portfolio to short-term investments. Although these investments have lower coupons than many long-term securities, they provide additional protection against market uncertainty, particularly interest rate shocks. Management believes that it is easier to recover lost income than lost principal. In addition to that conservative positioning, many municipal bond issuers in Colorado took advantage of the low rate environment to refinance existing issues, which put downward pressures on coupons. Finally, the Fund’s cash balance increased over the year as investor inflows were robust and management was focused on only investing capital into high-quality transactions. Despite these factors, the Fund’s distribution has been steady over the past few years after adjusting for realized capital gains. The Fund distributed $0.39 per share of income during fiscal year 2021. The slight increase from its 2020 dividend was entirely driven by the distribution of a capital gain. Management understands the importance of the Fund’s distribution and will continue to look for ways to maximize it without exposing the Fund to excessive or imprudent risks.
3
Table of Contents
PERFORMANCE SUMMARY (Unaudited)
COMPARISON OF CHANGE IN VALUE OF A $10,000 INVESTMENT IN
COLORADO BONDSHARES(1)
THE LIPPER GENERAL MUNICIPAL DEBT FUND INDEX(4)
AND THE BLOOMBERG BARCLAY MUNICIPAL BOND TOTAL RETURN INDEX(5)
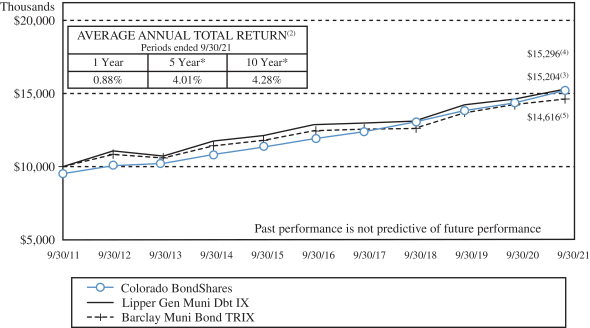
| (1) | Total return is the percentage change in the value of a hypothetical investment that has occurred in the indicated period of time, taking into account the imposition of the sales charge and other fees and assuming the reinvestment of all dividends and distributions. Past performance is not indicative of future performance. The graph does not reflect the deduction of taxes that a shareholder would pay on Fund distributions or the redemption of shares of the Fund. |
| * | Fiscal year ended September 30, 2016 includes a principal write down of approximately $14.5 million due to an adverse decision by the Colorado State Court of Appeal on the Marin Metropolitan District bonds that is a non-recurring event outside of the control of the Fund. |
| (2) | Average annual total return reflects the hypothetical annually compounded return that would have produced the same cumulative total return if the Fund’s performance had been constant over the entire period. Average annual total returns for the one-year, five-year and ten-year periods ended September 30, 2021 are 0.88%, 4.01%, and 4.28%, respectively. Average annual total includes the imposition of the sales charge and assumes the reinvestment of all dividends and distributions. Past |
4
Table of Contents
| performance is not indicative of future performance. The table does not reflect the deduction of taxes that a shareholder would pay on Fund distributions or the redemption of shares of the Fund. |
| (3) | Includes reinvestment of dividends and adjustment for the maximum sales charge of 4.75%. |
| (4) | The Lipper General Municipal Debt Fund Index is a non-weighted index of the 30 largest funds that invest at least 65% of assets in municipal debt issues in the top four credit ratings. The Lipper General Municipal Debt Fund Index reflects no deductions for fees, expenses or taxes, includes reinvestment of dividends but does not reflect any adjustment for sales charge. |
| (5) | The Bloomberg Barclay Municipal Bond Total Return Index which replaced the Barclays Capital Municipal Bond Total Return Index (the “Barclay Index”) is considered representative of the broad market for investment grade, tax-exempt and fixed-rate bonds with long-term maturities (greater than two years) selected from issues larger than $50 million. You cannot invest directly in this index. This index is not professionally managed and does not pay any commissions, expenses or taxes. If this index did pay commissions, expenses or taxes, its returns would be lower. The Fund selected the Bloomberg Barclay Index to compare the returns of the Fund to an appropriate broad-based securities market index. You should note, however, that there are some fundamental differences between the portfolio of securities invested in by the Fund and the securities represented by the Bloomberg Barclay Index. Unlike the Fund which invests primarily in not rated securities on issues of any size, the Bloomberg Barclay Index only includes securities with a rating of at least “Baa” by Moody’s Investor Services, Inc. from an issue size of no less than $50 million. Some of these differences between the portfolio of the Fund and the securities represented by the Bloomberg Barclay Index may cause the performance of the Fund to differ from the performance of the Bloomberg Barclay Index. |
5
Table of Contents
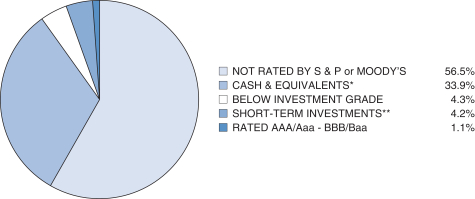
CREDIT QUALITY (unaudited)
Colorado BondShares — A Tax-Exempt Fund
Based on a Percentage of Total Net Assets as of September 30, 2021
SECTOR BREAKDOWN (unaudited)
Colorado BondShares — A Tax-Exempt Fund
Based on a Percentage of Total Net Assets as of September 30, 2021
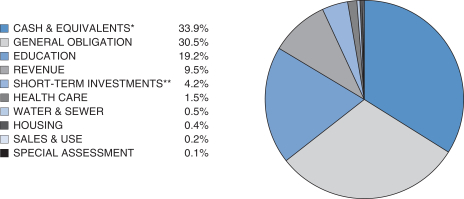
* Cash & equivalents include cash and receivables less liabilities.
** Short-term investments include securities with a maturity date or redemption feature of one year or less, as identified in the Schedule of Investments.
6
Table of Contents
Officers and Trustees of the Fund
The following tables list the trustees and officers of the Fund, together with their address, age, positions held with the Fund, the term of each office held and the length of time served in each office, principal business occupations during the past five years and other directorships, if any, held by each trustee and officer. Each trustee and officer has served in that capacity for the Fund continuously since originally elected or appointed. The Board of Trustees supervises the business activities of the Fund. Each trustee serves as a trustee until termination of the Fund unless the trustee dies, resigns, retires, or is removed. The Statement of Additional Information of the Fund includes additional information about Fund trustees and is available, without charge, upon request. Shareholders may call (800) 572-0069 to request the Statement of Additional Information.
Name, Address and Age | Position held with | Principal Occupation | Other Directorships | |||
| Non-Interested Trustees | ||||||
Bruce G. Ely 1200 17th Street, Suite 850 Denver CO 80202 Age: 70 | Trustee since July 2002 | Mr. Ely was a Regional Director for Cutwater Asset Management, a wholly owned subsidiary of MBIA, Inc., until his retirement in September 2013. | None | |||
James R. Madden 1200 17th Street, Suite 850 Denver CO 80202 Age: 77 | Trustee since September 2004 | Mr. Madden has owned Madden Enterprises, a real estate company that owns and leases commercial buildings and real estate, for the past thirty years. He is also a stockholder and director of The Community Bank in western Kansas. He has been a bank director for 25 years. | None | |||
| Interested Trustees* | ||||||
George N. Donnelly 1200 17th Street, Suite 850 Denver CO 80202 Age: 74 | Chairman of the Board of Trustees, Trustee since inception of the Fund in 1987 and Interim President, Secretary and Treasurer of the Fund since September 26, 2008 | Mr. Donnelly was a Senior Regional Vice President for Phoenix Life Insurance Company until his retirement in January 2010. | None | |||
* George N. Donnelly is an “interested person” of the Fund as defined in the Investment Company Act of 1940 (the “1940 Act”) by virtue of his position as both an officer and a trustee of the Fund as described in the table above. None of the trustees nor the officers of the Fund have any position with the Investment Adviser, the principal underwriter of the Fund, the distribution agent of the Fund, the service agent of the Fund or the custodian of the Fund, or any affiliates thereof. There is no family relationship between any officers and trustees of the Fund.
7
Table of Contents
Compensation
The Board met three times during the fiscal year ended September 30, 2021. The following tables show the compensation paid by the Fund to each of the trustees during that year:
Name of Person, Position(s) with the Fund | Aggregate Compensation from Fund | Pension or Retirement Benefits Accrued As Part of Fund Expenses | Total Compensation from Fund Paid to Such Person | |||||||||
Non-Interested Trustees | ||||||||||||
Bruce G. Ely, Trustee | $ | 3,000 | N/A | $ | 3,000 | |||||||
James R. Madden, Trustee | 3,000 | N/A | 3,000 | |||||||||
Interested Trustees | ||||||||||||
George N. Donnelly, Trustee, Interim President, Secretary and Treasurer | 2,000 | N/A | 2,000 | |||||||||
No officer or trustee of the Fund received remuneration from the Fund in excess of $60,000 for services to the Fund during the fiscal year ended September 30, 2021. The officers and trustees of the Fund, as a group, received $8,000 in compensation from the Fund for services to the Fund during the 2021 fiscal year.
Other Information
Proxy Voting Record
The Fund does not invest in equity securities. Accordingly, there were no matters relating to a portfolio security considered during the 12 months ended June 30, 2021 with respect to which the Fund was entitled to vote. Applicable regulations require us to inform you that the foregoing proxy voting information is available on the SEC website at http://www.sec.gov or you may call us at 1-800-572-0069.
Quarterly Statement of Investments
The Fund files a complete schedule of investments with the Securities and Exchange Commission for the first and third quarters of each fiscal year. For periods ending prior to March 31, 2019, this information was filed on Form N-Q. For periods ending on or after March 31, 2019, the Fund will file on Form N-PORT. Shareholders may view the filed Form N-Q and N-PORT by visiting the Commission’s website at http://www.sec.gov. The filed form may also be viewed and copied at the Commission’s Public Reference Room in Washington, DC. Information regarding the operations of the Public Reference Room may be obtained by calling 1-800-732-0330 or you may call us at 1-800-572-0069.
8
Table of Contents
Trustees Approve Advisory Agreement
The Board of Trustees (the “Trustees”) of Colorado BondShares — A Tax-Exempt Fund unanimously approved the continuance of the Fund’s Investment Advisory and Service Agreement with Freedom Funds Management Company (“Freedom Funds”) at a meeting held on September 30, 2021. In approving the Advisory Agreement, the Trustees, including the disinterested trustees, considered the reasonableness of the advisory fee in light of the extent and quality of the advisory services provided and any additional benefits received by Freedom Funds or its affiliates in connection with providing services to the Fund, compared the fees charged by Freedom Funds to those paid by similar funds, and analyzed the expenses incurred by Freedom Funds with respect to the Fund. The Trustees also considered the Fund’s performance relative to a selected peer group, the expense ratio of the Fund in comparison to other funds of comparable size, and other factors. The Trustees determined that the Fund’s advisory fee structure was fair and reasonable in relation to the services provided and that approving the agreement was in the best interests of the Fund and its shareholders. Matters considered by the Trustees in connection with its consideration of the Advisory Agreement included, among other things, the following:
1. Investment Adviser Services
Freedom Funds manages the assets of the Fund, including making purchases and sales of portfolio securities consistent with the Fund’s investment objectives and policies. In addition, Freedom Funds administers the Fund’s daily business affairs such as providing accurate accounting records, computing accrued income and expenses of the Fund, computing the daily net asset value of the Fund, assuring proper dividend disbursements, proper financial information to investors, and notices of all shareholders’ meetings, and providing sufficient office space, storage, telephone services, and personnel to accomplish these responsibilities. In considering the nature, extent and quality of the services provided by Freedom Funds, the Trustees believe that the services provided by Freedom Funds have provided the Fund with superior results. At the same time, Freedom Fund’s fee structure is equal to or lower than the comparable funds. The Trustees noted the Fund’s focus is inherently more labor intensive. Under the circumstances, the Trustees found the fee structure to be justified.
2. Investment Performance
The Trustees reviewed the performance of the Fund compared to other similar funds, and reported that the current (as of July 30, 2021) net asset value was $9.443 per share and the current distribution yield (based on net asset value) was 3.63% (also as of July 30, 2021). Since the overall structure of the portfolio was satisfactory and the performance of the Fund, measured in terms of distribution yield and total return, was comparable amongst its peer group, no changes to either the type of assets or manner of operations were recommended.
3. Expense Ratios
The Trustees reviewed the performance (measured by distribution yield), fees and expense ratios of all municipal bonds funds in our peer group. The Trustees considered the fact that the Fund’s unique focus on non-rated bonds, while geared toward producing superior investment results, often required additional expenses. While expenses can vary with non-rated bonds (principally as a result of litigation with respect to defaulted issues and higher monitoring costs occasioned by less readily available information), the Trustees noted the Fund’s performance for the current year.
9
Table of Contents
4. Management Fees and Expenses
The Trustees reviewed the investment advisory fee rates payable by the Fund to Freedom Funds. As part of its review, the Trustees considered the estimated advisory fees and the Fund’s estimated total expense ratio for the one-year period as of September 2021 as compared to other municipal bonds in its peer group identified by Freedom Funds. After reviewing the foregoing information, and in light of the nature, extent and quality of the services provided by Freedom Funds, the Trustees concluded that the advisory fees charged by Freedom Funds for the advisory and related services to the Fund and the Fund’s total expense ratio are reasonable. The management fee is one half of one percent of total net assets managed. Such fee is payable to Freedom Funds on a monthly basis. This fee is comparable to other municipal bond funds identified by Freedom Funds and is consistent with national funds many times the Fund’s size.
5. Profitability
The Trustees reviewed the level of profits realized by Freedom Funds and relevant affiliates thereof in providing investment and administrative services to the Fund. The Trustees considered the level of profits realized without regard to revenue sharing or other payments by Freedom Funds and its affiliates to third parties in respect to distribution of the Fund’s securities. The Trustees also considered other direct or indirect benefits received by Freedom Funds and its affiliates in connection with its relationship with the Fund and found that there were none. The Trustees concluded that, in light of the foregoing factors and the nature, extent and quality of the services provided by Freedom Funds, the profits realized by Freedom Funds are reasonable.
6. Economies of Scale
In reviewing advisory fees and profitability, the Trustees also considered the extent to which Freedom Funds and its affiliates, on the one hand, and the Fund, on the other hand, can expect to realize benefits from economies of scale as the assets of the Fund increase. The Trustees acknowledged the difficulty in accurately measuring the benefits resulting from the economies of scale with respect to the management of any specific fund or group of funds, particularly in an environment where costs are rising due to changing regulations. The Trustees reviewed data summarizing the increases and decreases in the assets of the Fund over various time periods, and evaluated the extent to which the total expense ratio of the Fund and Freedom Fund’s profitability may have been affected by such increases or decreases. Between October 2020 and September 27, 2021, total net assets of the Fund under management by Freedom Funds increased from $1,494.5 billion to $1,773.2 billion. The number of shares of the Fund that have been redeemed has been less than the number of new shares issued by the Fund, and as a result the Fund continues to grow at what the Trustees determined was a healthy level.
Based upon the foregoing, the Trustees concluded that the benefits from the economies of scale are currently being shared equitably by Freedom Funds and the Fund. The Trustees also concluded that the structure of the advisory fee can be expected to cause Freedom Funds, its affiliates and the Fund to continue to share such benefits equitably and that breakpoints need not be instituted at this time.
After requesting and reviewing these and other factors that they deemed relevant, the Trustees concluded that the continuation of the Advisory Agreement was in the best interest of the Fund and its shareholders.
10
Table of Contents
Freedom Funds also serves as the transfer agent, shareholder servicing agent and dividend disbursing agent for the Fund, pursuant to a Transfer Agency and Service Agreement (the “Service Agreement”).
Freedom Funds’ duties under the Service Agreement include processing purchase and redemption transactions, establishing and maintaining shareholder accounts and records, disbursing dividends declared by the Fund and all other customary services of a transfer agent, shareholder servicing agent and dividend disbursing agent. As compensation for these services, the Fund may pay Freedom Funds at a rate intended to represent Freedom Funds’ cost of providing such services. This fee would be in addition to the investment advisory fee payable to Freedom Funds under the Advisory Agreement.
11
Table of Contents
FUND EXPENSES (unaudited)
The following examples are intended to help you understand the ongoing costs (in dollars) of investing in the Fund and compare these costs with those of other mutual funds. The examples (actual and hypothetical 5% return) are based on an investment of $1,000 made at the beginning of the period shown and held for the entire period.
As a shareholder of Colorado BondShares — A Tax-Exempt Fund (the “Fund’) you can incur two types of costs:
| • | Sales charges (front loads) on fund purchases and |
| • | Ongoing fund costs, including management fees, administrative services, and other fund expenses. All mutual funds have operating expenses. Operating expenses, which are deducted from the Fund’s gross income, directly reduce the investment return of the Fund. |
Actual Fund Expenses
The first line of the table below provides information about actual account values and actual expenses. You may use the information in this line, together with the amount you invested, to estimate the expenses that you paid over the period. Simply divide your account value by $1,000 (for example, an $8,600 account value divided by $1,000 = 8.6), then multiply the result by the number in the first line under the heading entitled “Expenses Paid During Period” to estimate the expenses you paid on your account during this period.
Hypothetical Example for Comparison Purposes
The second line of the table below provides information about hypothetical account values and hypothetical expenses based on the Fund’s actual expense ratio and an assumed rate of return of 5% per year before expenses, which is not the Fund’s actual return. The hypothetical account values and expenses may not be used to estimate the actual ending account balance or expenses you paid for the period. You may use this information to compare the ongoing cost of investing in the Fund and other funds. To do so, compare this 5% hypothetical example with the 5% hypothetical examples that appear in shareholder reports of other funds.
Six Months Ended September 30, 2021
Colorado BondShares — A Tax- Exempt Fund | Beginning Account Value 04/01/21 | Ending Account Value 09/30/21 | Expenses Paid During Period(1) | ||||||||||||
Based on Actual Fund Return | $ | 1,000.00 | $ | 1,020.20 | $ | 3.09 | |||||||||
Based on Hypothetical 5% Annual Return Before Expenses | $ | 1,000.00 | $ | 1,021.95 | $ | 3.09 | |||||||||
| (1) | The expenses shown in this table are equal to the Fund’s annualized expense ratio of 0.61% for fiscal year ended September 30, 2021, multiplied by the average account value over the period, multiplied by 183/365 to reflect the one-half year period. |
Please note that expenses shown in the table are meant to highlight your ongoing costs only and do not reflect any transactional costs, such as sales charges (loads), redemption fees or exchange fees. Therefore, the second line of the table is useful in comparing ongoing costs only, and will not help you determine the relative total costs of owning different funds. In addition, if transactional costs were included, your costs would have been higher. You can find more information about the Fund’s expenses in the Financial Statements section of this report. For additional information on operating costs please see the Fund’s prospectus.
12
Table of Contents
Report of Independent Registered Public Accounting Firm
To the Shareholders and Board of Trustees of
Colorado BondShares — A Tax-Exempt Fund
Opinion on the Financial Statements
We have audited the accompanying statement of assets and liabilities, including the schedule of investments, of Colorado BondShares — A Tax-Exempt Fund (the “Fund”) as of September 30, 2021, and the related statement of operations for the year then ended, the statements of changes in net assets for each of the two years ended September 30, 2021 and 2020, and the financial highlights for each of the four years ended September 30, 2021, 2020, 2019, and 2018, and the related notes (collectively referred to as the “financial statements”). In our opinion, the financial statements referred to above present fairly, in all material respects, the financial position of Colorado BondShares — A Tax-Exempt Fund as of September 30, 2021, the results of its operations for the year then ended, the changes in net assets for each of the two years ended September 30, 2021 and 2020, and the financial highlights for each of the four years ended September 30, 2021, 2020, 2019, and 2018, in conformity with accounting principles generally accepted in the United States of America.
The accompanying financial highlights of the Fund for the year ended September 30, 2017, were audited by other auditors whose report dated November 26, 2017, expressed an unqualified opinion.
Basis for Opinion
The Fund’s management is responsible for these financial statements. Our responsibility is to express an opinion on the Fund’s financial statements based on our audits. We are a public accounting firm registered with the Public Company Accounting Oversight Board (United States) (“PCAOB”) and are required to be independent with respect to the Fund in accordance with the U.S. federal securities laws and the applicable rules and regulations of the Securities and Exchange Commission and the PCAOB.
We conducted our audits in accordance with the standards of the PCAOB. Those standards require that we plan and perform the audits to obtain reasonable assurance about whether the financial statements are free of material misstatement, whether due to error or fraud. The Fund is not required to have, nor were we engaged to perform, an audit of its internal control over financial reporting. As part of our audits we are required to obtain an understanding of internal control over financial reporting but not for the purpose of expressing an opinion on the effectiveness of the Fund’s internal control over financial reporting. Accordingly, we express no such opinion.
13
Table of Contents
Our audits included performing procedures to assess the risks of material misstatement of the financial statements, whether due to error or fraud, and performing procedures that respond to those risks. Such procedures included examining, on a test basis, evidence regarding the amounts and disclosures in the financial statements. Our audits also included evaluating the accounting principles used and significant estimates made by management, as well as evaluating the overall presentation of the financial statements. We believe that our audits, which included confirmation of securities at September 30, 2021 by correspondence with the custodian, provide a reasonable basis for our opinion.

Plante & Moran, PLLC
Denver, Colorado
November 23, 2021
We have served as the Fund’s auditor since 2014.
14
Table of Contents
Colorado BondShares
A Tax-Exempt Fund
Schedule of Investments
September 30, 2021
| Colorado Municipal Bonds 50.6% | Maturity | Coupon | Principal | Value | ||||||||||||
| Colorado 100.0% | ||||||||||||||||
ABERDEEN METROPOLITAN DISTRICT #1 | 12/1/2035 | 7.50% | $ | 1,600,000 | $ | 476,000 | ||||||||||
ANTHOLOGY WEST METROPOLITAN DISTRICT #4(g) | 12/15/2037 | 6.00% | 6,440,000 | 6,614,138 | ||||||||||||
ANTHOLOGY WEST METROPOLITAN DISTRICT #5, SER A | 12/1/2049 | 4.88% | 4,630,000 | 4,925,301 | ||||||||||||
ANTHOLOGY WEST METROPOLITAN DISTRICT #5, SER B SUBS(g) | 12/15/2049 | 7.63% | 698,000 | 722,088 | ||||||||||||
ASPEN STREET METROPOLITAN DISTRICT(g) | 12/1/2050 | 5.13% | 1,075,000 | 1,108,390 | ||||||||||||
BANNING LEWIS RANCH REGIONAL METROPOLITAN DISTRICT | 12/1/2048 | 5.38% | 2,500,000 | 2,678,550 | ||||||||||||
BANNING LEWIS RANCH REGIONAL METROPOLITAN DISTRICT, SERIES 2018B(g) | 12/15/2041 | 7.75% | 625,000 | 659,338 | ||||||||||||
BASE VILLAGE METROPOLITAN DISTRICT NO. 2(g) | 12/15/2048 | 6.50% | 3,500,000 | 2,955,400 | ||||||||||||
BELFORD NORTH METROPOLITAN DISTRICT, SER 2020 A SENIORS | 12/1/2050 | 5.50% | 4,000,000 | 4,357,360 | ||||||||||||
BELFORD NORTH METROPOLITAN DISTRICT, SER 2020 B SUBORDINATES(g) | 12/15/2050 | 8.50% | 3,475,000 | 3,585,714 | ||||||||||||
BENNETT CROSSING METROPOLITAN DISTRICT NO. 1 | 12/1/2049 | 6.13% | 6,160,000 | 6,704,482 | ||||||||||||
BENNETT RANCH METROPOLITAN DISTRICT NO. 1, SUBs(g) | 12/15/2051 | 7.50% | 1,221,000 | 1,225,628 | ||||||||||||
BENT GRASS METROPOLITAN DISTRICT | 12/1/2049 | 5.25% | 1,690,000 | 1,837,757 | ||||||||||||
BRADBURN METROPOLITAN DISTRICT NO. 2 JUNIOR LIEN SER C(g) | 12/15/2051 | 7.50% | 3,271,000 | 3,284,673 | ||||||||||||
BRAMMING FARM METROPOLITAN DISTRICT #1(d) | 12/1/2044 | 6.00% | 1,965,000 | 2,053,091 | ||||||||||||
BRENNAN METROPOLITIAN DISTRICT – SENIOR 2016A | 12/1/2046 | 5.25% | 1,177,000 | 1,221,679 | ||||||||||||
BRENNAN METROPOLITAN DISTRICT – SUBORDINATE 2016b(g) | 12/15/2046 | 7.50% | 516,000 | 538,843 | ||||||||||||
BRIGHTON CROSSING METROPOLITAN DISTRICT #4 – SENIOR 2017A | 12/1/2037 | 5.00% | 525,000 | 553,051 | ||||||||||||
BRIGHTON CROSSING METROPOLITAN DISTRICT NO. 4, SER 2017A | 12/1/2047 | 5.00% | 2,965,000 | 3,113,220 | ||||||||||||
BRIGHTON CROSSING METROPOLITAN DISTRICT #4 – SUBORDINATE 2017B(g) | 12/1/2047 | 7.00% | 670,000 | 695,346 | ||||||||||||
CASTLEVIEW METROPOLITAN DISTRICT NO. 2 | 12/1/2050 | 5.00% | 3,435,000 | 3,707,773 | ||||||||||||
CHERRY HILLS CITY METROPOLITAN DISTRICT(g) | 12/1/2047 | 5.00% | 1,380,000 | 1,482,920 | ||||||||||||
15
Table of Contents
Colorado BondShares
A Tax-Exempt Fund
Schedule of Investments — (Continued)
| Colorado Municipal Bonds (Continued) | Maturity | Coupon | Principal | Value | ||||||||||||
| Colorado (Continued) | ||||||||||||||||
CIELO METROPOLITAN DISTRICT(g) | 12/1/2050 | 5.25% | $ | 2,500,000 | $ | 2,607,150 | ||||||||||
CITY CTR WEST RSDL METROPOLITAN DISTRICT NO. 2 | 12/1/2049 | 5.00% | 1,040,000 | 1,117,168 | ||||||||||||
CITY CTR WEST RSDL METROPOLITAN DISTRICT NO. 2, SUBORDINATES(g) | 12/15/2049 | 7.75% | 1,425,000 | 1,475,189 | ||||||||||||
CITYSET METROPOLITAN DISTRICT #2 | 12/1/2030 | 3.50% | 6,075,000 | 6,467,384 | ||||||||||||
CITYSET METROPOLITAN DISTRICT #2 | 12/1/2040 | 4.38% | 8,360,000 | 8,976,884 | ||||||||||||
CITYSET METROPOLITAN DISTRICT #2 | 12/1/2045 | 4.50% | 3,180,000 | 3,410,041 | ||||||||||||
COLLIERS HILL METROPOLITAN DISTRICT #2 – SUBORDINATE 2017B(g) | 12/15/2047 | 8.50% | 3,501,000 | 3,590,381 | ||||||||||||
COLLIERS HILL METROPOLITAN DISTRICT NO. 3, SER A | 12/1/2040 | 5.25% | 8,300,000 | 9,055,051 | ||||||||||||
COLLIERS HILL METROPOLITAN DISTRICT NO. 3, SER A | 12/1/2048 | 5.50% | 18,250,000 | 19,893,778 | ||||||||||||
COLLIERS HILL METROPOLITAN DISTRICT NO. 3 SUB SER B(g) | 12/15/2043 | 8.50% | 2,213,000 | 2,191,445 | ||||||||||||
COLORADO CENTRE METROPOLITAN DISTRICT – SERIES B(g)(i) | 1/1/2032 | 0.00% | 6,571,179 | 3,417,013 | ||||||||||||
COLORADO CENTRE METROPOLITAN DISTRICT – SERIES 1992 P/O(e)(i) | 1/1/2027 | 0.00% | 2,071,119 | 1,900,190 | ||||||||||||
COLORADO CENTRE METROPOLITAN DISTRICT – SERIES 1992 I/O(f)(i) | 1/1/2027 | 9.00% | 2,069,093 | 1,489,747 | ||||||||||||
CECFA – SWALLOW ACADEMY CHARTER | 11/15/2027 | 5.35% | 3,365,000 | 3,428,834 | ||||||||||||
CECFA-NEW VISION CHARTER SCHOOL(m) | 6/1/2025 | 5.38% | 23,135,000 | 23,171,553 | ||||||||||||
CECFA – GRAND PEAK ACADEMY CHARTER SCHOOL(m) | 7/1/2025 | 5.60% | 20,905,000 | 20,922,978 | ||||||||||||
CECFA ADDENBROOKE CLASSICAL ACADEMY(m) | 6/1/2027 | 4.50% | 25,285,000 | 25,854,418 | ||||||||||||
CECFA IMAGINE CHARTER SCHOOL AT FIRESTONE(m) | 6/1/2027 | 4.50% | 17,380,000 | 18,233,358 | ||||||||||||
CECFA – MONARCH MONTESSORI CHARTER SCHOOL – EXCHANGE | 5/15/2025 | 4.75% | 8,325,000 | 8,377,281 | ||||||||||||
CECFA – ACADEMY OF ADVANCED LEARNING(m) | 6/1/2027 | 4.38% | 8,420,000 | 8,546,132 | ||||||||||||
CECFA CHAVEZ/HUERTA PREP ACADEMY(m) | 7/1/2027 | 4.38% | 36,525,000 | 37,178,067 | ||||||||||||
CECFA SWALLOWS CHARTER ACADEMY(m) | 11/15/2027 | 4.38% | 6,560,000 | 6,608,478 | ||||||||||||
CECFA VANGUARD CLASSICAL SCHOOL, SER A(m) | 7/1/2027 | 4.38% | 24,465,000 | 24,614,481 | ||||||||||||
700 KALAMATH LLC(a) | 12/1/2013 | 0.00% | 3,755,000 | 3,755,000 | ||||||||||||
16
Table of Contents
Colorado BondShares
A Tax-Exempt Fund
Schedule of Investments — (Continued)
| Colorado Municipal Bonds (Continued) | Maturity | Coupon | Principal | Value | ||||||||||||
| Colorado (Continued) | ||||||||||||||||
CHFA – CASEY’S POND SENIOR LIVING(l) | 6/1/2032 | 0.00% | $ | 8,110,000 | $ | 4,460,500 | ||||||||||
CHFA – CASEY’S POND SENIOR LIVING(l) | 6/1/2042 | 0.00% | 10,665,000 | 5,865,750 | ||||||||||||
CHFA – CASEY’S POND SENIOR LIVING(l) | 6/1/2047 | 0.00% | 8,600,000 | 4,730,000 | ||||||||||||
COLORADO INTERNATIONAL CENTER METROPOLITAN DISTRICT #3 | 12/1/2031 | 4.63% | 626,000 | 646,320 | ||||||||||||
CONIFER METROPOLITAN DISTRICT | 12/1/2030 | 0.00% | 10,000,000 | 4,000,000 | ||||||||||||
CONIFER METROPOLITAN DISTRICT | 12/1/2032 | 0.00% | 1,450,000 | 580,000 | ||||||||||||
CONIFER METROPOLITAN DISTRICT | 12/1/2033 | 0.00% | 1,550,000 | 620,000 | ||||||||||||
CONSTITUTION HEIGHTS METROPOLITAN DISTRICT | 12/1/2049 | 5.00% | 1,765,000 | 1,923,162 | ||||||||||||
COPPERLEAF METROPOLITAN DISTRICT #3 | 12/1/2037 | 5.00% | 1,000,000 | 1,082,350 | ||||||||||||
COUNTRY CLUB HIGHLANDS METROPOLITAN DISTRICT | 12/1/2037 | 7.25% | 1,030,000 | 947,600 | ||||||||||||
CUCHARES RANCH METROPOLITAN DISTRICT | 12/1/2045 | 5.00% | 2,039,000 | 2,105,308 | ||||||||||||
DACONO URBAN RENEWAL AUTHORITY(g) | 12/1/2039 | 6.25% | 4,013,000 | 4,277,577 | ||||||||||||
DENVER INTL BUSINESS CTR METROPOLITAN DISTRICT NO. 1 – SERIES 2019B SUB(g) | 12/1/2048 | 6.00% | 4,585,000 | 4,940,750 | ||||||||||||
DENVER WEST PROMENADE METROPOLITAN DISTRICT | 12/1/2031 | 5.13% | 500,000 | 518,030 | ||||||||||||
DENVER WEST PROMENADE METROPOLITAN DISTRICT | 12/15/2046 | 6.00% | 500,000 | 511,905 | ||||||||||||
E-86 METROPOLITAN DISTRICT(g) | 12/1/2051 | 5.13% | 1,015,000 | 1,040,071 | ||||||||||||
EAGLE BROOK METROPOLITAN DISTRICT(g) | 12/1/2051 | 5.00% | 1,600,000 | 1,665,088 | ||||||||||||
UNITED W & S – EAST CHERRY CREEK(c) | 11/15/2023 | 5.00% | 2,269,000 | 2,274,559 | ||||||||||||
ERIE FARM METROPOLITAN DISTRICT – SERIES 2016A | 12/1/2045 | 5.50% | 2,000,000 | 2,066,040 | ||||||||||||
ERIE HIGHLANDS METROPOLITAN DISTRICT NO2, SER 2018A | 12/1/2048 | 5.25% | 6,000,000 | 6,389,700 | ||||||||||||
ERIE HIGHLANDS METROPOLITAN DISTRICT NO 2, SER 2018B SUBORDINATES(g) | 12/15/2048 | 7.63% | 1,819,000 | 1,894,925 | ||||||||||||
FITZSIMONS VILLAGE METROPOLITAN DISTRICT NO. 1, SER B SUBS(g) | 12/15/2049 | 7.00% | 611,000 | 614,666 | ||||||||||||
FLATIRON MEADOWS METROPOLITAN DISTRICT | 12/1/2046 | 5.13% | 2,000,000 | 2,065,100 | ||||||||||||
FLYING HORSE METROPOLITAN DISTRICT NO. 2 SER 2020 SUBS(g)(m) | 12/15/2050 | 7.25% | 15,405,000 | 15,935,086 | ||||||||||||
FLYING HORSE METROPOLITAN DISTRICT NO 3(g) | 12/1/2049 | 6.00% | 2,965,000 | 3,143,374 | ||||||||||||
FOREST TRACE METROPOLITAN DISTRICT #3 – SUBORDINATE 2016B(g) | 12/15/2046 | 7.25% | 683,000 | 712,956 | ||||||||||||
17
Table of Contents
Colorado BondShares
A Tax-Exempt Fund
Schedule of Investments — (Continued)
| Colorado Municipal Bonds (Continued) | Maturity | Coupon | Principal | Value | ||||||||||||
| Colorado (Continued) | ||||||||||||||||
FORT LUPTON GOLF COURSE(a) | 12/15/2037 | 0.00% | $ | 620,000 | $ | 6,200 | ||||||||||
GOLDEN EAGLE ACRES METROPOLITAN DISTRICT NO. 2(g) | 12/1/2051 | 4.50% | 3,981,000 | 3,878,370 | ||||||||||||
GREAT WESTERN PARK METROPOLITAN DISTRICT #2 – SENIOR 2016A | 12/1/2026 | 4.00% | 556,000 | 574,159 | ||||||||||||
GREAT WESTERN PARK METROPOLITAN DISTRICT #2 – SUBORDINATE 2016B(g) | 12/15/2046 | 7.25% | 775,000 | 794,367 | ||||||||||||
GREEN GABLES METROPOLITAN DISTRICT #1 – SENIOR 2016A | 12/1/2046 | 5.30% | 1,241,000 | 1,287,587 | ||||||||||||
GREEN GABLES METROPOLITAN DISTRICT #1 – SUBORDINATE 2016B(g) | 12/15/2046 | 7.75% | 740,000 | 772,619 | ||||||||||||
GREEN GABLES METROPOLITAN DISTRICT NO. 2 SERIES 2018B SUBORDINATE(g) | 12/15/2048 | 8.25% | 1,689,000 | 1,763,654 | ||||||||||||
GREEN VALLEY RANCH EAST METROPOLITAN DISTRICT NO. 6 | 12/1/2050 | 5.88% | 3,325,000 | 3,663,186 | ||||||||||||
GREENWAYS METROPOLITAN DISTRICT NO. 1(g) | 12/1/2051 | 4.63% | 1,580,000 | 1,553,330 | ||||||||||||
HIDDEN CREEK METROPOLITAN DISTRICT(g) | 12/1/2045 | 4.63% | 1,145,000 | 1,114,955 | ||||||||||||
HIGHLANDS METROPOLITAN DISTRICT #2 – SENIOR 2016A | 12/1/2046 | 5.13% | 1,960,000 | 2,024,249 | ||||||||||||
HIGHLANDS METROPOLITAN DISTRICT #2 – SUBORDINATE 2016B(g) | 12/15/2046 | 7.50% | 1,269,000 | 1,305,103 | ||||||||||||
HIGHLANDS-MEAD METROPOLITAN DISTRICT | 12/1/2050 | 5.13% | 1,395,000 | 1,512,082 | ||||||||||||
HORIZON METROPOLITAN DISTRICT NO. 2(g) | 12/1/2051 | 0.00% | 1,700,000 | 1,713,260 | ||||||||||||
HUNTER’S OVERLOOK METROPOLITAN DISTRICT NO. 5, SUBS(g) | 12/15/2049 | 8.50% | 1,827,000 | 1,892,151 | ||||||||||||
HYLAND VILLAGE METROPOLITAN DISTRICT | 12/1/2027 | 8.00% | 4,770,000 | 2,385,000 | ||||||||||||
INDY OAK TOD METROPOLITAN DISTRICT SER A | 12/1/2050 | 5.50% | 1,075,000 | 1,183,253 | ||||||||||||
INDY OAK TOD METROPOLITAN DISTRICT SER B(g) | 12/15/2050 | 8.00% | 736,000 | 782,412 | ||||||||||||
INSPIRATION METROPOLITAN DISTRICT, SER D(m) | 12/15/2051 | 7.50% | 2,487,000 | 2,477,400 | ||||||||||||
IRON WORKS VILLAGE METROPOLITAN DISTRICT | 12/1/2048 | 5.88% | 1,500,000 | 1,616,745 | ||||||||||||
JAY GROVE METROPOLITAN DISTRICT(g) | 12/1/2051 | 4.25% | 1,225,000 | 1,190,516 | ||||||||||||
JEFFERSON CENTER METROPOLITAN DISTRICT NO. 1 SUB SER B(g) | 12/15/2050 | 5.75% | 7,500,000 | 8,036,625 | ||||||||||||
KARL’S FARM METROPOLITAN DISTRICT NO. 2, SER A | 12/1/2040 | 5.38% | 515,000 | 564,414 | ||||||||||||
KARL’S FARM METROPOLITAN DISTRICT NO. 2, SER A | 12/1/2050 | 5.63% | 1,415,000 | 1,548,293 | ||||||||||||
18
Table of Contents
Colorado BondShares
A Tax-Exempt Fund
Schedule of Investments — (Continued)
| Colorado Municipal Bonds (Continued) | Maturity | Coupon | Principal | Value | ||||||||||||
| Colorado (Continued) | ||||||||||||||||
LANTERNS METROPOLITAN DISTRICT No. 2(g) | 12/1/2050 | 4.50% | $ | 2,842,000 | $ | 2,761,543 | ||||||||||
LEGATO COMMUNITY AUTHORITY | 12/1/2036 | 4.00% | 2,130,000 | 2,216,691 | ||||||||||||
LEYDEN ROCK METROPOLITAN DISTRICT – SENIOR 2016A | 12/1/2025 | 4.00% | 500,000 | 517,990 | ||||||||||||
LEYDEN ROCK METROPOLITAN DISTRICT – SENIOR 2016A | 12/1/2033 | 4.38% | 2,905,000 | 3,011,265 | ||||||||||||
LEYDEN ROCK METROPOLITAN DISTRICT – SENIOR 2016A | 12/1/2045 | 5.00% | 1,525,000 | 1,582,294 | ||||||||||||
LEYDEN ROCK METROPOLITAN DISTRICT – SUBORDINATE 2016B(g) | 12/15/2045 | 7.25% | 1,195,000 | 1,247,293 | ||||||||||||
LEYDEN ROCK METROPOLITAN DISTRICT #10 – JUNIOR LIEN 2017C(g) | 12/15/2049 | 10.75% | 1,025,000 | 1,076,609 | ||||||||||||
LINCOLN MEADOWS METROPOLITAN DISTRICT | 12/1/2031 | 8.00% | 7,150,000 | 7,493,415 | ||||||||||||
LITTLETON VILLAGE METROPOLITAN DISTRICT #2 | 12/1/2045 | 5.38% | 1,670,000 | 1,722,438 | ||||||||||||
LITTLETON VILLAGE METROPOLITAN DISTRICT NO 2, SERIES 2018B SUBORDINATES(g) | 12/15/2028 | 7.63% | 1,140,000 | 1,205,789 | ||||||||||||
LORETTO HEIGHTS COMNTY AUTHORITY(g) | 12/1/2051 | 4.88% | 5,000,000 | 5,122,250 | ||||||||||||
MARIN METROPOLITAN DISTRICT(a)(j) | 12/1/2028 | 0.00% | 17,485,000 | 1,573,650 | ||||||||||||
MARVELLA METROPOLITAN DISTRICT – SENIOR 2016A | 12/1/2046 | 5.13% | 1,393,000 | 1,445,029 | ||||||||||||
MAYFIELD METROPOLITAN DISTRICT, SERIES 2020 A | 12/1/2050 | 5.75% | 1,190,000 | 1,313,248 | ||||||||||||
MAYFIELD METROPOLITAN DISTRICT, SERIES 2020 B SUBS(g) | 12/15/2050 | 8.25% | 622,000 | 660,943 | ||||||||||||
MEADOWS METROPOLITAN DISTRICT #1(k) | 6/1/2029 | 8.00% | 30,730,000 | 33,208,375 | ||||||||||||
MEADOWS METROPOLITAN DISTRICT #2(k) | 6/1/2029 | 8.00% | 23,830,000 | 25,751,890 | ||||||||||||
MEADOWS METROPOLITAN DISTRICT #7(k) | 6/1/2029 | 8.00% | 15,440,000 | 16,685,236 | ||||||||||||
MEADOWLARK METROPOLITAN DISTRICT SER A | 12/1/2040 | 4.88% | 520,000 | 560,841 | ||||||||||||
MEADOWLARK METROPOLITAN DISTRICT SER A | 12/1/2050 | 5.13% | 750,000 | 812,948 | ||||||||||||
MIDCITIES METROPOLITAN DISTRICT #2 – SUBORDINATE 2016B(g) | 12/15/2046 | 7.75% | 1,919,000 | 1,978,547 | ||||||||||||
MIRABELLE METROPOLITAN DISTRICT NO. 2 SER 2020A SENIORS | 12/1/2049 | 5.00% | 1,250,000 | 1,345,550 | ||||||||||||
MIRABELLE METROPOLITAN DISTRICT NO. 2, SER B SUBS(g) | 12/15/2049 | 7.38% | 1,473,000 | 1,514,215 | ||||||||||||
MOUNT CARBON METROPOLITAN DISTRICT – SERIES 2004A(g) | 6/1/2043 | 7.00% | 197,916 | 197,938 | ||||||||||||
19
Table of Contents
Colorado BondShares
A Tax-Exempt Fund
Schedule of Investments — (Continued)
| Colorado Municipal Bonds (Continued) | Maturity | Coupon | Principal | Value | ||||||||||||
| Colorado (Continued) | ||||||||||||||||
MOUNT CARBON METROPOLITAN DISTRICT – SERIES 2004B(g) | 6/1/2043 | 7.00% | $ | 1,410,000 | $ | 1,410,155 | ||||||||||
MOUNT CARBON METROPOLITAN DISTRICT – SERIES 2004C(e) | 6/1/2043 | 0.00% | 565,000 | 124,300 | ||||||||||||
MOUNTAIN SHADOWS METROPOLITAN DISTRICT – SUBORDINATE 2016B(g) | 12/15/2046 | 7.50% | 1,800,000 | 1,852,920 | ||||||||||||
MOUNTAIN SHADOWS METROPOLITAN DISTRICT – SUBORDINATE 2018C-1(g) | 12/15/2040 | 10.00% | 1,994,000 | 2,047,080 | ||||||||||||
MUEGGE FARMS METROPOLITAN DISTRICT #1(g) | 12/1/2051 | 5.00% | 3,000,000 | 2,935,860 | ||||||||||||
MURPHY CREEK METROPOLITAN DISTRICT #3 | 12/1/2026 | 6.00% | 2,540,000 | 2,540,000 | ||||||||||||
MURPHY CREEK METROPOLITAN DISTRICT #3 | 12/1/2035 | 6.13% | 1,880,000 | 1,880,000 | ||||||||||||
NINE MILE METROPOLITAN DISTRICT | 12/1/2030 | 4.63% | 1,125,000 | 1,237,016 | ||||||||||||
NINE MILE METROPOLITAN DISTRICT | 12/1/2040 | 5.13% | 2,500,000 | 2,763,050 | ||||||||||||
NORTH PINE VISTAS METROPOLITAN DISTRICT #2 – SENIOR 2016A | 12/1/2046 | 6.75% | 6,735,000 | 5,752,633 | ||||||||||||
NORTH PINE VISTAS METROPOLITAN DISTRICT #2 – SUBORDINATE 2016B(g) | 12/15/2046 | 8.50% | 1,810,000 | 1,582,031 | ||||||||||||
NORTH PINE VISTAS METROPOLITAN DISTRICT #3 – SENIOR 2016A | 12/1/2036 | 6.00% | 3,393,000 | 3,502,153 | ||||||||||||
NORTH PINE VISTAS METROPOLITAN DISTRICT #3 – SUBORDINATE 2016B(g) | 12/15/2046 | 8.25% | 1,188,000 | 1,224,507 | ||||||||||||
NORTH RANGE METROPOLITAN DISTRICT NO. 3, SER A | 12/1/2040 | 5.00% | 2,000,000 | 2,205,740 | ||||||||||||
OVERLOOK METROPOLITAN DISTRICT – SENIOR 2016A | 12/1/2046 | 5.50% | 1,500,000 | 1,557,540 | ||||||||||||
PAINTED PRAIRIE PUBLIC IMPROVEMENT AUTHORITY | 12/1/2029 | 4.00% | 1,000,000 | 1,077,780 | ||||||||||||
PALISADE METROPOLITAN DISTRICT #2 | 12/1/2031 | 4.38% | 2,229,000 | 2,300,841 | ||||||||||||
PALISADE PARK NORTH METROPOLITAN DISTRICT #1 – SENIOR 2016A | 12/1/2046 | 5.88% | 2,075,000 | 2,155,821 | ||||||||||||
PALISADE PARK NORTH METROPOLITAN DISTRICT #1 – SUBORDINATE 2016B(g) | 12/15/2046 | 8.00% | 525,000 | 541,364 | ||||||||||||
PALISADE PARK NORTH METROPOLITAN DISTRICT #2 – SENIOR 2018A | 12/1/2047 | 5.63% | 1,745,000 | 1,871,164 | ||||||||||||
PARKDALE COMMUNITY AUTHORITY SER A | 12/1/2040 | 5.00% | 2,140,000 | 2,326,308 | ||||||||||||
PARKDALE COMMUNITY AUTHORITY SER A | 12/1/2050 | 5.25% | 3,335,000 | 3,622,577 | ||||||||||||
PARKDALE COMMUNITY AUTHORITY SUB SER B(g) | 12/15/2050 | 7.75% | 2,424,000 | 2,520,451 | ||||||||||||
PARKER AUTOMOTIVE METROPOLITAN DISTRICT | 12/1/2045 | 5.00% | 1,983,000 | 2,154,351 | ||||||||||||
20
Table of Contents
Colorado BondShares
A Tax-Exempt Fund
Schedule of Investments — (Continued)
| Colorado Municipal Bonds (Continued) | Maturity | Coupon | Principal | Value | ||||||||||||
| Colorado (Continued) | ||||||||||||||||
PARKER AUTOMOTIVE METROPOLITAN DISTRICT SUB SERIES 2018B(g) | 12/15/2032 | 8.00% | $ | 3,785,000 | $ | 3,979,208 | ||||||||||
PIONEER CMNTY AUTH BRD | 12/15/2050 | 6.75% | 24,592,000 | 25,811,271 | ||||||||||||
PIONEER METROPOLITAN DISTRICT #3(g) | 12/1/2046 | 6.50% | 3,183,000 | 3,283,201 | ||||||||||||
THE PLAZA METROPOLITAN DISTRICT #1(m) | 12/1/2022 | 5.00% | 500,000 | 519,115 | ||||||||||||
THE PLAZA METROPOLITAN DISTRICT #1(m) | 12/1/2040 | 5.00% | 7,850,000 | 8,027,175 | ||||||||||||
PRONGHORN VALLEY METROPOLITAN DISTRICT, SER A | 12/1/2041 | 3.75% | 515,000 | 512,816 | ||||||||||||
PRONGHORN VALLEY METROPOLITAN DISTRICT, SER A | 12/1/2051 | 4.00% | 650,000 | 644,345 | ||||||||||||
PUBLIC FINANCE AUTH CHARTER SCHOOL-COLORADO SPRINGS(m) | 7/1/2029 | 4.95% | 6,515,000 | 6,612,269 | ||||||||||||
PUBLIC FINANCE AUTH CHARTER SCHOOL-FT COLLINS, A(m) | 7/1/2029 | 4.95% | 20,975,000 | 21,288,157 | ||||||||||||
PUBLIC FINANCE AUTH CHARTER SCHOOL-DOUGLAS CNTY(m) | 7/1/2029 | 4.95% | 14,620,000 | 14,838,277 | ||||||||||||
PUBLIC FINANCE AUTH CHARTER SCHOOL-DOUGLAS CNTY TXBL(m) | 7/1/2026 | 4.95% | 3,310,000 | 3,368,355 | ||||||||||||
PUBLIC FINANCE AUTH CHARTER SCHOOL-FT COLLINS(m) | 7/1/2029 | 4.95% | 10,720,000 | 10,880,050 | ||||||||||||
PUBLIC FINANCE AUTH CHARTER SCHOOL-WINDSOR(m) | 7/1/2029 | 4.95% | 13,210,000 | 13,407,225 | ||||||||||||
PFA AURORA CHARTER SCHOOL BC PROJ, SER B – FED EXEMPT/STATE TAXABLE(m) | 7/1/2029 | 4.75% | 18,365,000 | 18,479,598 | ||||||||||||
PUBLIC FINANCE AUTHORITY – COLORADO SKIES ACADEMY CHARTER SCHOOL, SER A(m) | 7/1/2025 | 5.63% | 10,290,000 | 10,296,483 | ||||||||||||
PFA DOUGLAS COUNTY CHARTER SCHOOL BC, SER 2020A(m) | 7/1/2029 | 4.65% | 30,830,000 | 30,991,858 | ||||||||||||
PUBLIC FINANCE AUTHORITY – MONUMENT ACADEMY SER. 2019A(m) | 6/1/2026 | 5.00% | 28,725,000 | 29,087,797 | ||||||||||||
RAVENNA METROPOLITAN DISTRICT CONV CABS – SUBORDINATE SERIES 2017B(d) | 12/15/2026 | 7.50% | 8,000,000 | 8,230,320 | ||||||||||||
REATA RIDGE VILLAGE METROPOLITAN DISTRICT NO. 2 | 12/1/2049 | 5.00% | 900,000 | 969,273 | ||||||||||||
RENDEZVOUS METROPOLITAN DISTRICT NO 4 – SUBORDINATE, SERIES 2018B(g) | 10/15/2048 | 8.00% | 1,189,000 | 1,228,534 | ||||||||||||
REX RANCH METROPOLITAN DISTRICT – SUBORDINATE 2018B(g) | 12/15/2047 | 7.88% | 445,000 | 466,858 | ||||||||||||
21
Table of Contents
Colorado BondShares
A Tax-Exempt Fund
Schedule of Investments — (Continued)
| Colorado Municipal Bonds (Continued) | Maturity | Coupon | Principal | Value | ||||||||||||
| Colorado (Continued) | ||||||||||||||||
RIVERDALE PEAKS II METROPOLITAN DISTRICT | 12/1/2025 | 6.40% | $ | 930,000 | $ | 465,000 | ||||||||||
RIVERDALE PEAKS II METROPOLITAN DISTRICT | 12/1/2035 | 6.50% | 1,135,000 | 567,500 | ||||||||||||
ROCK CREEK METROPOLITAN DISTRICT A-1(g) | 12/1/2041 | 4.50% | 2,230,000 | 2,250,628 | ||||||||||||
ROCK CREEK METROPOLITAN DISTRICT A-1(g) | 12/1/2050 | 4.75% | 3,880,000 | 3,916,976 | ||||||||||||
ROCK CREEK METROPOLITAN DISTRICT A-2 SUB CASH FLOW(g) | 12/1/2031 | 4.00% | 3,432,000 | 3,455,852 | ||||||||||||
ROSE HILL ACRES METROPOLITAN DISTRICT, SER A | 12/1/2050 | 5.00% | 2,990,000 | 3,248,007 | ||||||||||||
ROSE HILL ACRES METROPOLITAN DISTRICT, SER B SUB(g) | 12/15/2050 | 8.75% | 910,000 | 942,715 | ||||||||||||
ROXBOROUGH VILLAGE METROPOLITAN DISTRICT – SERIES 1993B I/O(f)(i) | 12/31/2042 | 0.00% | 242,645 | 26,691 | ||||||||||||
SABELL METROPOLITAN DISTRICT, SER 2020 B3 SUBS(g) | 12/15/2050 | 8.25% | 605,000 | 620,597 | ||||||||||||
SIERRA RIDGE METROPOLITAN DISTRICT #2 – SENIOR SERIES 2016A | 12/1/2031 | 4.50% | 1,000,000 | 1,032,600 | ||||||||||||
SIERRA RIDGE METROPOLITAN DISTRICT #2 – SUBORDINATE SERIES 2016B(g) | 12/15/2046 | 7.63% | 1,500,000 | 1,546,950 | ||||||||||||
SILVER PEAKS EAST METROPOLITAN DISTRICT(g) | 12/1/2051 | 5.00% | 5,410,000 | 5,238,178 | ||||||||||||
64TH AVENUE ARI AUTHORITY(g) | 12/1/2043 | 6.50% | 5,000,000 | 5,380,550 | ||||||||||||
SOLARIS METROPOLITIAN DISTRICT #3 – SUBORDINATE SERIES 2016B(g) | 12/15/2046 | 7.00% | 1,000,000 | 1,031,980 | ||||||||||||
SOLITUDE METROPOLITAN DISTRICT(j) | 12/1/2026 | 7.00% | 3,520,000 | 2,288,000 | ||||||||||||
SPRING VALLEY METROPOLITAN DISTRICT NO. 4 | 12/1/2040 | 5.00% | 1,410,000 | 1,535,758 | ||||||||||||
SPRING VALLEY METROPOLITAN DISTRICT NO. 4 | 12/1/2050 | 5.12% | 1,775,000 | 1,926,638 | ||||||||||||
SPRING VALLEY METROPOLITAN DISTRICT NO. 4 | 12/15/2050 | 7.63% | 2,811,000 | 2,919,308 | ||||||||||||
ST VRAIN LAKES METROPOLITAN DISTRICT #2 – SENIOR SERIES 2017A | 12/1/2037 | 5.00% | 1,500,000 | 1,588,740 | ||||||||||||
ST VRAIN LAKES METROPOLITAN DISTRICT #2 – SUBORDINATE SERIES 2017B(g) | 12/15/2047 | 7.63% | 1,083,000 | 1,138,125 | ||||||||||||
STC METROPOLITAN DISTRICT NO. 2, SER A | 12/1/2029 | 4.00% | 1,615,000 | 1,747,382 | ||||||||||||
STC METROPOLITAN DISTRICT NO. 2 | 12/1/2038 | 5.00% | 8,160,000 | 8,917,738 | ||||||||||||
STC METROPOLITAN DISTRICT, SER 2019 SUBS(g) | 12/15/2049 | 8.00% | 3,954,000 | 4,084,008 | ||||||||||||
STETSON RIDGE METROPOLITAN DISTRICT NO. 3, SUBs(g)(m) | 12/15/2042 | 7.50% | 345,000 | 358,886 | ||||||||||||
STONE RIDGE METROPOLITAN DISTRICT #2 | 12/1/2031 | 0.00% | 11,896,000 | 1,903,360 | ||||||||||||
22
Table of Contents
Colorado BondShares
A Tax-Exempt Fund
Schedule of Investments — (Continued)
| Colorado Municipal Bonds (Continued) | Maturity | Coupon | Principal | Value | ||||||||||||
| Colorado (Continued) | ||||||||||||||||
TABLE MOUNTAIN METROPOLITAN DISTRICT – SENIOR SERIES 2016A | 12/1/2045 | 5.25% | $ | 1,589,000 | $ | 1,641,246 | ||||||||||
TABLE MOUNTAIN METROPOLITAN DISTRICT – SUBORDINATE SERIES 2016B(g) | 12/15/2045 | 7.75% | 570,000 | 595,126 | ||||||||||||
TALLYN’S REACH METROPOLITAN DISTRICT #3 | 11/1/2038 | 5.13% | 2,070,000 | 2,269,134 | ||||||||||||
THOMPSON CROSSING METROPOLITAN DISTRICT NO #4 | 12/1/2039 | 5.00% | 1,410,000 | 1,531,302 | ||||||||||||
THOMPSON CROSSING METROPOLITAN DISTRICT NO. 4 | 12/1/2049 | 5.00% | 1,315,000 | 1,411,955 | ||||||||||||
TRAILS AT CROWFOOT METROPOLITAN DISTRICT NO 3(g) | 12/15/2049 | 9.00% | 3,135,000 | 3,253,095 | ||||||||||||
VDW METROPOLITAN DISTRICT #2 – SUBORDINATE SERIES 2016B(g) | 12/15/2045 | 7.25% | 1,459,000 | 1,507,483 | ||||||||||||
VALAGUA METROPOLITAN DISTRICT | 12/1/2037 | 0.00% | 11,500,000 | 2,196,500 | ||||||||||||
VILLAS EASTLAKE RESERVOIR METROPOLITAN DISTRICT – SUBORDINATE SERIES 2016B(g)(m) | 12/15/2046 | 8.00% | 355,000 | 371,018 | ||||||||||||
WESTCREEK METROPOLITAN DISTRICT NO 2 | 12/1/2048 | 5.38% | 1,300,000 | 1,398,657 | ||||||||||||
WESTOWN METROPOLITAN DISTRICT – SENIOR SERIES 2017A | 12/1/2047 | 5.00% | 1,392,000 | 1,464,481 | ||||||||||||
WHISPERING PINES METROPOLITAN DISTRICT #1 – SENIOR SERIES 2017A | 12/1/2037 | 5.00% | 2,000,000 | 2,103,620 | ||||||||||||
WHITE BUFFALO METROPOLITAN DISTRICT, NO. 3 | 12/1/2050 | 5.50% | 2,780,000 | 3,037,623 | ||||||||||||
WILD PLUM METROPOLITAN DISTRICT, SER A | 12/1/2049 | 5.00% | 595,000 | 644,468 | ||||||||||||
WILLOW SPRINGS METROPOLITAN DISTRICT, SER 2019B SUBORDINATES(g) | 12/15/2049 | 7.75% | 650,000 | 672,854 | ||||||||||||
WOODMEN HEIGHTS METROPOLITAN DISTRICT NO. 2 SER B-2 | 12/15/2040 | 7.50% | 3,358,000 | 3,477,511 | ||||||||||||
WYNDHAM HILL METROPOLITAN DISTRICT NO. 2 2020B SUBS(g) | 12/15/2049 | 7.63% | 9,600,000 | 10,205,952 | ||||||||||||
|
|
|
| |||||||||||||
Colorado (amortized cost $879,977,886) | 932,377,952 | 894,461,492 | ||||||||||||||
|
|
|
| |||||||||||||
Colorado Municipal Bonds | $ | 932,377,952 | $ | 894,461,492 | ||||||||||||
|
|
|
| |||||||||||||
23
Table of Contents
Colorado BondShares
A Tax-Exempt Fund
Schedule of Investments — (Continued)
| Other Municipal Bonds 6.9% | Maturity | Coupon | Principal | Value | ||||||||||||
| South Dakota 76.9% | ||||||||||||||||
FLANDREAU SANTEE SIOUX TRIBE(m) | 1/1/2036 | 5.75% | $ | 6,055,000 | $ | 5,515,863 | ||||||||||
FLANDREAU SANTEE SIOUX TRIBE(m) | 1/1/2026 | 5.00% | 2,765,000 | 2,702,760 | ||||||||||||
FLANDREAU SANTEE SIOUX TRIBE(m) | 1/1/2031 | 5.50% | 3,565,000 | 3,350,316 | ||||||||||||
FLANDREAU SANTEE SIOUX TRIBE TE SERIES 2018B(m) | 1/1/2038 | 6.00% | 6,120,000 | 6,308,374 | ||||||||||||
FLANDREAU SANTEE SIOUX TRIBE TE SERIES 2018C(m) | 1/1/2038 | 6.00% | 5,450,000 | 5,617,751 | ||||||||||||
FLANDREAU SANTEE SIOUX TRIBE TAXABLE SERIES 2018A(m) | 1/1/2023 | 8.28% | 875,000 | 885,631 | ||||||||||||
FLANDREAU SANTEE SIOUX TRIBE TAXABLE SERIES 2018A(m) | 1/1/2024 | 8.28% | 950,000 | 968,525 | ||||||||||||
FLANDREAU SANTEE SIOUX TRIBE TAXABLE SERIES 2018A(m) | 1/1/2025 | 8.28% | 1,030,000 | 1,053,752 | ||||||||||||
FLANDREAU SANTEE SIOUX TRIBE TAXABLE SERIES 2018A(m) | 1/1/2026 | 8.28% | 1,115,000 | 1,145,194 | ||||||||||||
FLANDREAU SANTEE SIOUX TRIBE TAXABLE SERIES 2018A(m) | 1/1/2027 | 8.28% | 1,205,000 | 1,244,163 | ||||||||||||
FLANDREAU SANTEE SIOUX TRIBE TAXABLE SERIES 2018A(m) | 1/1/2028 | 8.28% | 1,305,000 | 1,352,163 | ||||||||||||
FLANDREAU SANTEE SIOUX TRIBE TAXABLE SERIES 2018A(m) | 1/1/2033 | 8.28% | 8,670,000 | 9,122,314 | ||||||||||||
FLANDREAU SANTEE SIOUX TRIBE – TRIBAL HEALTHCARE(m) | 7/1/2025 | 5.75% | 740,000 | 745,861 | ||||||||||||
FLANDREAU SANTEE SIOUX TRIBE – TRIBAL HEALTHCARE(m) | 7/1/2026 | 5.75% | 785,000 | 792,693 | ||||||||||||
FLANDREAU SANTEE SIOUX TRIBE – TRIBAL HEALTHCARE(m) | 7/1/2027 | 5.75% | 830,000 | 839,611 | ||||||||||||
FLANDREAU SANTEE SIOUX TRIBE – TRIBAL HEALTHCARE(m) | 7/1/2028 | 5.75% | 875,000 | 886,611 | ||||||||||||
FLANDREAU SANTEE SIOUX TRIBE – TRIBAL HEALTHCARE(m) | 7/1/2029 | 5.75% | 930,000 | 943,820 | ||||||||||||
FLANDREAU SANTEE SIOUX TRIBE – TRIBAL HEALTHCARE(m) | 7/1/2030 | 5.75% | 980,000 | 996,052 | ||||||||||||
FLANDREAU SANTEE SIOUX TRIBE – TRIBAL HEALTHCARE(m) | 7/1/2031 | 5.75% | 1,040,000 | 1,057,035 | ||||||||||||
FLANDREAU SANTEE SIOUX TRIBE – TRIBAL HEALTHCARE(m) | 7/1/2032 | 5.75% | 1,095,000 | 1,112,936 | ||||||||||||
24
Table of Contents
Colorado BondShares
A Tax-Exempt Fund
Schedule of Investments — (Continued)
| Other Municipal Bonds (Continued) | Maturity | Coupon | Principal | Value | ||||||||||||
| South Dakota (Continued) | ||||||||||||||||
FLANDREAU SANTEE SIOUX TRIBE – TRIBAL HEALTHCARE(m) | 7/1/2033 | 5.75% | $ | 1,160,000 | $ | 1,179,001 | ||||||||||
FLANDREAU SANTEE SIOUX TRIBE – TRIBAL HEALTHCARE(m) | 7/1/2034 | 5.75% | 1,225,000 | 1,245,066 | ||||||||||||
FLANDREAU SANTEE SIOUX TRIBE – TRIBAL HEALTHCARE(m) | 7/1/2035 | 5.75% | 1,300,000 | 1,321,294 | ||||||||||||
FLANDREAU SANTEE SIOUX TRIBE – TRIBAL HEALTHCARE(m) | 7/1/2040 | 6.00% | 7,730,000 | 7,855,226 | ||||||||||||
FLANDREAU SANTEE SIOUX TRIBE – TRIBAL HEALTHCARE(m) | 7/1/2045 | 6.25% | 10,395,000 | 10,561,528 | ||||||||||||
LOWER BRULE SIOUX TRIBE(m) | 3/1/2025 | 5.88% | 1,160,000 | 1,111,489 | ||||||||||||
OGLALA SIOUX TRIBE OF PINE RIDGE | 10/1/2022 | 5.00% | 750,000 | 751,148 | ||||||||||||
OGLALA SIOUX TRIBE, SERIES 2018(m) | 7/1/2028 | 5.50% | 3,000,000 | 3,065,760 | ||||||||||||
OGLALA SIOUX TRIBE, SERIES 2018(m) | 7/1/2037 | 6.00% | 9,270,000 | 9,231,622 | ||||||||||||
OGLALA SIOUX TRIBE, SERIES 2018B(m) | 9/1/2041 | 6.50% | 6,210,000 | 6,316,439 | ||||||||||||
OGLALA SIOUX TRIBE OF PINE RIDGE(m) | 10/1/2024 | 5.50% | 1,985,000 | 1,986,290 | ||||||||||||
OGLALA SIOUX TRIBE, SERIES 2018C(m) | 10/1/2026 | 8.00% | 800,000 | 867,400 | ||||||||||||
OGLALA SIOUX TRIBE, SER 2019A(m) | 10/1/2027 | 4.50% | 2,370,000 | 2,352,818 | ||||||||||||
|
|
|
| |||||||||||||
South Dakota (amortized cost $93,724,208) | 93,735,000 | 94,486,504 | ||||||||||||||
|
|
|
| |||||||||||||
| Puerto Rico 9.7% | ||||||||||||||||
COMMONWEALTH OF PUERTO RICO(a) | 7/1/2035 | 8.00% | 2,500,000 | 2,128,125 | ||||||||||||
PUERTO RICO SALES TAX FINANCING CORP RESTRUCTURED SER 2019 A-1 | 7/1/2034 | 4.50% | 277,000 | 303,952 | ||||||||||||
PUERTO RICO SALES TAX FINANCING CORP RESTRUCTURED SER 2019 A-1 | 7/1/2040 | 4.55% | 140,000 | 157,328 | ||||||||||||
PUERTO RICO SALES TAX FINANCING CORP RESTRUCTURED SER 2019 A-1 | 7/1/2053 | 4.75% | 1,028,000 | 1,150,260 | ||||||||||||
PUERTO RICO SALES TAX FINANCING CORP RESTRUCTURED SER 2019 A-1 | 7/1/2058 | 5.00% | 2,600,000 | 2,949,076 | ||||||||||||
PUERTO RICO SALES TAX FINANCING CORP RESTRUCTURED SER 2019 A-1 | 7/1/2024 | 0.00% | 126,000 | 120,285 | ||||||||||||
PUERTO RICO SALES TAX FINANCING CORP RESTRUCTURED SER 2019 A-1 | 7/1/2027 | 0.00% | 267,000 | 240,973 | ||||||||||||
PUERTO RICO SALES TAX FINANCING CORP RESTRUCTURED SER 2019 A-1 | 7/1/2029 | 0.00% | 260,000 | 223,922 | ||||||||||||
PUERTO RICO SALES TAX FINANCING CORP RESTRUCTURED SER 2019 A-1 | 7/1/2031 | 0.00% | 336,000 | 267,735 | ||||||||||||
25
Table of Contents
Colorado BondShares
A Tax-Exempt Fund
Schedule of Investments — (Continued)
| Other Municipal Bonds (Continued) | Maturity | Coupon | Principal | Value | ||||||||||||
| Puerto Rico (Continued) | ||||||||||||||||
PUERTO RICO SALES TAX FINANCING CORP RESTRUCTURED SER 2019 A-1 | 7/1/2033 | 0.00% | $ | 378,000 | $ | 280,204 | ||||||||||
PUERTO RICO SALES TAX FINANCING CORP RESTRUCTURED SER 2019 A-1 | 7/1/2046 | 0.00% | 3,597,000 | 1,183,053 | ||||||||||||
PUERTO RICO SALES TAX FINANCING CORP RESTRUCTURED SER 2019 A-1 | 7/1/2051 | 0.00% | 2,930,000 | 696,490 | ||||||||||||
PUERTO RICO SALES TAX FING CORP TAX REV DTD 8/1/2019 4.329% SER A-2 7/1/2040 | 7/1/2040 | 4.33% | 1,424,000 | 1,579,088 | ||||||||||||
PUERTO RICO SALES TAX FING CORP TAX REV DTD 8/1/2019 4.536% SER A-2 7/1/2053 | 7/1/2053 | 4.54% | 43,000 | 47,552 | ||||||||||||
PUERTO RICO SALES TAX FING CORP TAX REV DTD 8/1/2019 4.784% SER A-2 7/1/2058 | 7/1/2058 | 4.78% | 571,000 | 640,125 | ||||||||||||
|
|
|
| |||||||||||||
Puerto Rico (amortized cost $9,633,453) | 16,477,000 | 11,968,168 | ||||||||||||||
|
|
|
| |||||||||||||
| Oregon 4.7% | ||||||||||||||||
MULTNOMAH CITY HOSPITAL FACILITY ODD FELLOWS(m) | 10/1/2023 | 5.45% | 5,815,000 | 5,815,000 | ||||||||||||
|
|
|
| |||||||||||||
Oregon (amortized cost $5,815,000) | 5,815,000 | 5,815,000 | ||||||||||||||
|
|
|
| |||||||||||||
| Arizona 4.1% | ||||||||||||||||
HERITAGE ACADEMY CHARTER SCHOOL MARICOPA COUNTY(m) | 7/1/2027 | 5.25% | 4,915,000 | 5,097,691 | ||||||||||||
|
|
|
| |||||||||||||
Arizona (amortized cost $4,915,000) | 4,915,000 | 5,097,691 | ||||||||||||||
|
|
|
| |||||||||||||
| Washington 1.8% | ||||||||||||||||
TACOMA CONSOLIDATED LID | 4/1/2043 | 5.75% | 2,185,000 | 2,196,646 | ||||||||||||
|
|
|
| |||||||||||||
Washington (amortized cost $2,045,947) | 2,185,000 | 2,196,646 | ||||||||||||||
|
|
|
| |||||||||||||
| California 1.5% | ||||||||||||||||
FREDDIE MAC(g)(j) | 1/1/2037 | 0.00% | 1,865,780 | 1,865,780 | ||||||||||||
|
|
|
| |||||||||||||
California (amortized cost $1,865,780) | 1,865,780 | 1,865,780 | ||||||||||||||
|
|
|
| |||||||||||||
| Missouri 0.8% | ||||||||||||||||
KANSAS CITY INDL DEV AUTH | 1/1/2028 | 6.75% | 180,000 | 180,716 | ||||||||||||
ST LOUIS INDL DEV AUTH SR HSG – SENIOR SERIES 2005A | 5/1/2027 | 6.75% | 834,000 | 830,506 | ||||||||||||
|
|
|
| |||||||||||||
Missouri (amortized cost $1,014,000) | 1,014,000 | 1,011,222 | ||||||||||||||
|
|
|
| |||||||||||||
26
Table of Contents
Colorado BondShares
A Tax-Exempt Fund
Schedule of Investments — (Continued)
| Other Municipal Bonds (Continued) | Maturity | Coupon | Principal | Value | ||||||||||||
| Oklahoma 0.4% | ||||||||||||||||
HASKELL CNTY PUBLIC FAC. | 4/1/2024 | 5.25% | $ | 450,000 | $ | 466,020 | ||||||||||
|
|
|
| |||||||||||||
Oklahoma (amortized cost $450,000) | 450,000 | 466,020 | ||||||||||||||
|
|
|
| |||||||||||||
Other Municipal Bonds | $ | 126,456,780 | $ | 122,907,031 | ||||||||||||
|
|
|
| |||||||||||||
| Short-Term Municipal Bonds 4.2% | ||||||||||||||||
| Multi-State 61.3% | ||||||||||||||||
FREDDIE MAC AMT (LOC 6) | 11/15/2036 | 0.08% | $ | 4,728,000 | $ | 4,728,000 | ||||||||||
FREDDIE MAC VR AMT (LOC 6) | 6/15/2036 | 0.08% | 21,640,000 | 21,640,000 | ||||||||||||
FREDDIE MAC VR (LOC 6) | 12/15/2045 | 0.08% | 18,795,000 | 18,795,000 | ||||||||||||
|
|
|
| |||||||||||||
Multi-State (amortized cost $45,163,000) | 45,163,000 | 45,163,000 | ||||||||||||||
|
|
|
| |||||||||||||
| Colorado 37.8% | ||||||||||||||||
BOULDER CO HSG AUTH MF BROADWAY EAST APTS (LOC 3) | 9/1/2037 | 0.10% | 1,560,000 | 1,560,000 | ||||||||||||
BOULDER COUNTY – BOULDER COLLEGE OF MASSAGE(a)(j) | 10/15/2031 | 0.00% | 4,315,000 | 4,315,000 | ||||||||||||
BROOMFIELD URBAN RENEWAL AUTHORITY (LOC 1) | 12/1/2030 | 0.09% | 8,270,000 | 8,270,000 | ||||||||||||
COLORADO HOUSING & FINANCE AUTHORITY – SERIES 2007A (LOC 3) | 1/1/2032 | 0.10% | 5,450,000 | 5,450,000 | ||||||||||||
COLORADO SPRINGS UTILITIES (LOC 3) | 11/1/2041 | 0.06% | 1,300,000 | 1,300,000 | ||||||||||||
JEFFCO BUSINESS CENTER METROPOLITAN DISTRICT #1(j) | 7/1/2022 | 0.00% | 1,006,000 | 1,006,000 | ||||||||||||
MESA COUNTY – ENSTROM CANDIES INC PROJ (LOC 7) | 7/1/2022 | 0.22% | 195,000 | 195,000 | ||||||||||||
RAVENNA METROPOLITAN DISTRICT CONV CABS – SERIES 2017 SUPPLEMENTAL B(d) | 12/1/2021 | 0.00% | 15,000 | 14,923 | ||||||||||||
ROXBOROUGH VILLAGE METROPOLITAN DISTRICT – SERIES 1993B P/O(e)(i) | 12/31/2021 | 0.00% | 24,707 | 22,237 | ||||||||||||
SHERIDAN REDEVLOPMENT AGENCY – SERIES 2011A-1 (LOC 5) | 12/1/2029 | 0.07% | 5,200,000 | 5,200,000 | ||||||||||||
SOUTHGLENN METROPOLITAN DISTRICT | 12/1/2021 | 3.00% | 533,000 | 533,885 | ||||||||||||
|
|
|
| |||||||||||||
Colorado (amortized cost $27,344,612) | 27,868,707 | 27,867,044 | ||||||||||||||
|
|
|
| |||||||||||||
27
Table of Contents
Colorado BondShares
A Tax-Exempt Fund
Schedule of Investments — (Continued)
| Short-Term Municipal Bonds (Continued) | Maturity | Coupon | Principal | Value | ||||||||||||
| South Dakota 1.0% | ||||||||||||||||
OGLALA SIOUX TRIBE, SERIES 2020(m) | 3/1/2022 | 4.00% | $ | 700,000 | $ | 700,637 | ||||||||||
|
|
|
| |||||||||||||
South Dakota (amortized cost $700,000) | 700,000 | 700,637 | ||||||||||||||
|
|
|
| |||||||||||||
Short-Term Municipal Bonds | $ | 73,731,707 | $ | 73,730,681 | ||||||||||||
|
|
|
| |||||||||||||
| Colorado Capital Appreciation and Zero Coupon Bonds 3.9% | ||||||||||||||||
| Colorado 100.0% | ||||||||||||||||
BELLA MESA METROPOLITAN DISTRICT CONV CABS SER A(m) | 12/1/2049 | 0.00% | $ | 3,780,000 | $ | 3,143,864 | ||||||||||
CONIFER METROPOLITAN DISTRICT(a)(d)(j) | 12/1/2031 | 0.00% | 7,470,000 | 2,988,000 | ||||||||||||
MAYFIELD METROPOLITAN DISTRICT, SER 2020C | 12/15/2050 | 3.00% | 766,000 | 273,891 | ||||||||||||
PV-ERU HOLDING TRUST(a)(m) | 2/14/2039 | 0.00% | 710,000 | 149,100 | ||||||||||||
PV-ERU HOLDING TRUST(a)(m) | 2/14/2039 | 0.00% | 3,122,000 | 655,620 | ||||||||||||
PV-ERU HOLDING TRUST(a)(m) | 2/14/2039 | 0.00% | 13,168,000 | 2,765,280 | ||||||||||||
PV-ERU HOLDING TRUST(a)(m) | 12/15/2037 | 0.00% | 14,000,000 | 2,940,000 | ||||||||||||
RAVENNA METROPOLITAN DISTRICT CONV CABS – SERIES 2017A(d) | 12/1/2046 | 5.00% | 33,685,000 | 35,258,426 | ||||||||||||
RAVENNA METROPOLITAN DISTRICT CONV CABS – SERIES 2017 SUPPLEMENTAL B(d) | 12/1/2022 | 0.00% | 170,000 | 163,725 | ||||||||||||
RAVENNA METROPOLITAN DISTRICT CONV CABS – SERIES 2017 SUPPLEMENTAL B(d) | 12/1/2023 | 0.00% | 325,000 | 302,832 | ||||||||||||
RAVENNA METROPOLITAN DISTRICT CONV CABS – SERIES 2017 SUPPLEMENTAL B(d) | 12/1/2024 | 0.00% | 490,000 | 440,020 | ||||||||||||
RAVENNA METROPOLITAN DISTRICT CONV CABS – SERIES 2017 SUPPLEMENTAL B(d) | 12/1/2025 | 0.00% | 585,000 | 499,789 | ||||||||||||
SOUTHSHORE METROPOLITAN DISTRICT NO. 2 SUB B(g) | 12/15/2041 | 4.13% | 9,690,000 | 11,186,136 | ||||||||||||
STC METROPOLITAN DISTRICT NO. 2, SER A | 12/1/2025 | 3.00% | 555,000 | 580,763 | ||||||||||||
STERLING RANCH METROPOLITAN DISTRICT #2 CONV CAB(d) | 12/1/2045 | 8.00% | 6,685,000 | 6,798,846 | ||||||||||||
WILDWING METROPOLITAN DISTRICT #1(d) | 12/1/2023 | 0.00% | 725,000 | 618,925 | ||||||||||||
|
|
|
| |||||||||||||
Colorado (amortized cost $72,627,068) | 95,926,000 | 68,765,217 | ||||||||||||||
|
|
|
| |||||||||||||
Colorado Capital Appreciation and Zero Coupon Bonds | $ | 95,926,000 | $ | 68,765,217 | ||||||||||||
|
|
|
| |||||||||||||
28
Table of Contents
Colorado BondShares
A Tax-Exempt Fund
Schedule of Investments — (Continued)
| Colorado Taxable Certificates/Notes/Bonds 0.5% | Maturity | Coupon | Principal | Value | ||||||||||||||||
| Colorado 100.0% | ||||||||||||||||||||
PUBLIC FINANCE AUTH CHARTER SCHOOL-COLORADO SPRINGS TXBL(m) |
| 7/1/2026 | 7.00% | $ | 5,885,000 | $ | 5,942,555 | |||||||||||||
PFA AURORA CHARTER SCHOOL BC PROJECT SER C – TAXABLE(m) |
| 7/1/2029 | 7.00% | 1,235,000 | 1,232,160 | |||||||||||||||
WOODMEN HEIGHTS METROPOLITAN DISTRICT NO. 2 SER B-1 TAXABLE BOTH ST & FED INITIALLY |
| 12/15/2040 | 6.25% | 1,830,000 | 1,975,412 | |||||||||||||||
TABERNASH POLE CREEK NOTE(a)(j) |
| 12/31/2021 | 0.00% | 227,347 | 88,199 | |||||||||||||||
|
|
|
| |||||||||||||||||
Colorado (amortized cost $9,177,347) |
| 9,177,347 | 9,238,326 | |||||||||||||||||
|
|
|
| |||||||||||||||||
Colorado Taxable Certificates/Notes/Bonds |
| $ | 9,177,347 | $ | 9,238,326 | |||||||||||||||
|
|
|
| |||||||||||||||||
Total investments, at value | 66.1 | % | $ | 1,169,102,747 | ||||||||||||||||
Other assets net of liabilities | 33.9 | % | 599,040,695 | |||||||||||||||||
|
|
|
| |||||||||||||||||
Net Assets | 100.0 | % | $ | 1,768,143,442 | ||||||||||||||||
|
|
|
| |||||||||||||||||
29
Table of Contents
Colorado BondShares
A Tax-Exempt Fund
Schedule of Investments — (Continued)
| (a) | Defaulted or non-income producing based upon the financial condition of the issuer (see note 2 in notes to financial statements). |
| (b) | Originally issued as general obligation bonds but are now pre-refunded and are secured by an escrow fund consisting entirely of direct U.S. Government obligations. No pre-refunded bonds were owned by the Fund at September 30, 2021. |
| (c) | Represents securities whose blended characteristics are reflective of a zero coupon bond and a step rate bond. Interest rate shown represents effective yield at acquisition. |
| (d) | Interest rate shown for capital appreciation and zero coupon bonds represents the effective yield at the date of acquisition. |
| (e) | Principal-only certificate represents the right to receive the principal payments on the underlying debt security upon maturity. The price of this security is typically more volatile than that of coupon-bearing bonds of the same maturity. |
| (f) | Interest-only certificate represents the right to receive semi-annual interest payments on the underlying debt security. The principal amount of the underlying security represents the notional amount on which current interest is calculated. The interest rate shown represents the effective yield at the date of acquisition. |
| (g) | Interest rate disclosed for cash flow bond represents the effective yield at September 30, 2021. Income on this security is derived from the cash flow of the issuer. |
| (h) | Represents current interest rate for a step rate bond. No step rate bonds were owned by the Fund at September 30, 2021. |
| (i) | Terms of security have been restructured since the original issuance. The total face amount of all such restructured securities approximates $10,978,743 and a value of $6,855,877 or less than 1.0% of net assets, as of September 30, 2021. |
| (j) | Securities valued at fair value (see note 2 in notes to financial statements). |
| (k) | See note 7 in notes to financial statements for further information on purchase accrued interest related to these bonds. |
| (l) | The Fund has entered into a forbearance agreement under which it agrees that the issuer may pay a reduced rate of interest in lieu of the contract rate for a period of time (see note 2 in notes to financial statements). |
| (m) | Security exempt from registration under Rule 144A of the Securities Act of 1933. Such securities may be sold in transactions exempt from registration, normally to qualified institutional buyers. At September 30, 2021, the aggregate value was $477,674,309, representing 27.02% of net assets. |
See accompanying notes to financial statements.
30
Table of Contents
Colorado BondShares
A Tax-Exempt Fund
Schedule of Investments — (Continued)
| (LOC) | These securities are Variable Rate Demand Obligations (“VRDO”) with scheduled principal and interest payments that have a guaranteed liquidity provider in the form of a letter of credit. These obligations bear interest at a rate that resets daily or weekly (see note 2 in notes to financial statements). The numbered list below corresponds to the liquidity provider associated with the respective LOC. |
1. BNP Paribas
2. FHLB Topeka
3. US Bank, N. A.
4. Royal Bank of Canada
5. JPMorgan Chase Bank, N.A.
6. Freddie Mac
7. Wells Fargo Bank, N.A.
The following abbreviations are used in the descriptions of securities included in the Schedule of Investments:
CABS — Capital Appreciation Bonds
CONV — Convertible
I/O — Interest Only
L/D — Local Improvement District
P/O — Principal Only
See accompanying notes to financial statements.
31
Table of Contents
Colorado BondShares
A Tax-Exempt Fund
Statement of Assets and Liabilities
September 30, 2021
| ASSETS |
| |||
Investments, at value (amortized cost 1,154,453,302) | $ | 1,169,102,747 | ||
— see accompanying schedule | ||||
Cash | 393,671,688 | |||
Interest receivable | 116,133,295 | |||
Purchase accrued interest (note 7) | 92,740,878 | |||
Receivable for shares of beneficial interest sold | 594,784 | |||
|
| |||
TOTAL ASSETS | 1,772,243,392 | |||
|
| |||
| LIABILITIES |
| |||
Payables and other liabilities: | ||||
Dividends payable | 2,571,218 | |||
Payable for shares of beneficial interest redeemed | 16,650 | |||
Management fees payable | 725,981 | |||
Accrued expenses payable | 786,101 | |||
|
| |||
TOTAL LIABILITIES | 4,099,950 | |||
|
| |||
NET ASSETS | $ | 1,768,143,442 | ||
|
| |||
COMPOSITION OF NET ASSETS | ||||
Paid-in capital | $ | 1,751,243,166 | ||
Accumulated net realized gain | 2,250,831 | |||
Net unrealized appreciation of investments | 14,649,445 | |||
|
| |||
NET ASSETS | $ | 1,768,143,442 | ||
|
| |||
NET ASSET PRICE AND REDEMPTION PRICE PER SHARE | $ | 9.39 | ||
|
| |||
MAXIMUM OFFERING PRICE PER SHARE | $ | 9.86 | ||
|
| |||
See accompanying notes to financial statements.
32
Table of Contents
Colorado BondShares
A Tax-Exempt Fund
Statement of Operations
For the Fiscal Year Ended September 30, 2021
INVESTMENT INCOME | ||||
Interest | $ | 73,724,741 | ||
EXPENSES | ||||
Management fees (note 4) | 8,145,630 | |||
Custodian fees (note 5) | 102,161 | |||
Legal and auditing fees | 130,305 | |||
Portfolio pricing fees | 114,451 | |||
Registration fees | 11,315 | |||
Shareholders’ reports | 93,805 | |||
Transfer agency expenses (note 4) | 311,678 | |||
Trustees’ fees | 12,045 | |||
Other | 1,040,628 | |||
|
| |||
Total expenses | 9,962,018 | |||
Custody credits (note 5) | (73,839 | ) | ||
|
| |||
Net expenses | 9,888,179 | |||
|
| |||
NET INVESTMENT INCOME | 63,836,562 | |||
|
| |||
REALIZED AND UNREALIZED GAIN (LOSS) ON INVESTMENTS | ||||
Net realized gain on investments | 2,539,720 | |||
Net unrealized appreciation (depreciation) on investments | 28,248,570 | |||
|
| |||
NET REALIZED AND UNREALIZED GAIN (LOSS) ON INVESTMENTS | 30,788,290 | |||
|
| |||
NET INCREASE IN NET ASSETS RESULTING FROM OPERATIONS | $ | 94,624,852 | ||
|
|
See accompanying notes to financial statements.
33
Table of Contents
Colorado BondShares
A Tax-Exempt Fund
Statements of Changes in Net Assets
For the Fiscal Year Ended September 30
| 2021 | 2020 | |||||||
FROM OPERATIONS: | ||||||||
Net investment income | $ | 63,836,562 | $ | 58,171,764 | ||||
Net realized gain on investments | 2,539,720 | 1,848,139 | ||||||
Unrealized appreciation (depreciation) on investments | 28,248,570 | (8,592,447 | ) | |||||
|
|
|
| |||||
Net increase in net assets resulting from operations | 94,624,852 | 51,427,456 | ||||||
|
|
|
| |||||
FROM DISTRIBUTIONS TO SHAREHOLDERS: (note 2) | ||||||||
Dividends to shareholders from net investment income | (63,836,562 | ) | (58,171,764 | ) | ||||
Net realized gain to shareholders from investment transactions | (2,933,082 | ) | (781,461 | ) | ||||
|
|
|
| |||||
Total distributions to shareholders | (66,769,644 | ) | (58,953,225 | ) | ||||
|
|
|
| |||||
FROM BENEFICIAL INTEREST TRANSACTIONS: | ||||||||
Proceeds from sale of shares | 284,305,602 | 191,605,128 | ||||||
Reinvested dividends and distributions | 47,782,882 | 41,141,389 | ||||||
Redemption of shares | (86,277,451 | ) | (153,440,867 | ) | ||||
|
|
|
| |||||
Increase in net assets derived from beneficial interest transactions | 245,811,033 | 79,305,650 | ||||||
|
|
|
| |||||
Net increase in net assets | 273,666,242 | 71,779,881 | ||||||
NET ASSETS: | ||||||||
Beginning of period | 1,494,477,200 | 1,422,697,319 | ||||||
|
|
|
| |||||
End of period | $ | 1,768,143,442 | $ | 1,494,477,200 | ||||
|
|
|
| |||||
See accompanying notes to financial statements.
34
Table of Contents
Colorado BondShares
A Tax-Exempt Fund
Financial Highlights
The financial highlights table is intended to help you understand the Fund’s financial performance. Certain information reflects financial results for a single Fund share. The total returns in the table represent the rate that an investor would have earned (or lost) on an investment in the Fund (assuming reinvestment of all dividends and distributions). Sales charges are not reflected in the total returns.
| For the Fiscal Year Ended September 30 | ||||||||||||||||||||
| 2021 | 2020 | 2019 | 2018 | 2017 | ||||||||||||||||
| For a share outstanding throughout the period | ||||||||||||||||||||
Net asset value, beginning of period | $ | 9.22 | $ | 9.25 | $ | 9.13 | $ | 9.05 | $ | 9.18 | ||||||||||
|
|
|
|
|
|
|
|
|
| |||||||||||
Income From Investment Operations | ||||||||||||||||||||
Net investment income(1) | 0.37 | 0.37 | 0.37 | 0.36 | 0.41 | |||||||||||||||
Net gain or (loss) on investments (both realized and unrealized) | 0.19 | (0.03 | ) | 0.17 | 0.10 | (0.06 | ) | |||||||||||||
|
|
|
|
|
|
|
|
|
| |||||||||||
Increase from investment operations | 0.56 | 0.34 | 0.54 | 0.46 | 0.35 | |||||||||||||||
Less Distributions | ||||||||||||||||||||
Dividends to shareholders from net investment income | (0.37 | ) | (0.37 | ) | (0.37 | ) | (0.36 | ) | (0.41 | ) | ||||||||||
Distributions from realized capital gains | $ | (0.02 | ) | $ | — | $ | (0.05 | ) | $ | (0.02 | ) | $ | (0.07 | ) | ||||||
|
|
|
|
|
|
|
|
|
| |||||||||||
Total Distributions | (0.39 | ) | (0.37 | ) | (0.42 | ) | (0.38 | ) | (0.48 | ) | ||||||||||
|
|
|
|
|
|
|
|
|
| |||||||||||
Net increase (decrease) in net asset value | 0.17 | (0.03 | ) | 0.12 | 0.08 | (0.13 | ) | |||||||||||||
|
|
|
|
|
|
|
|
|
| |||||||||||
Net Asset Value, end of period | $ | 9.39 | $ | 9.22 | $ | 9.25 | $ | 9.13 | $ | 9.05 | ||||||||||
|
|
|
|
|
|
|
|
|
| |||||||||||
Total Return, at Net Asset Value(2) | 5.91 | % | 3.83 | % | 6.09 | % | 5.29 | % | 4.03 | % | ||||||||||
|
|
|
|
|
|
|
|
|
| |||||||||||
Ratios/Supplemental Data: | ||||||||||||||||||||
Ratios to average net assets: | ||||||||||||||||||||
Net investment income | 3.92 | % | 4.02 | % | 4.02 | % | 4.00 | % | 4.54 | % | ||||||||||
Total expenses | 0.61 | % | 0.58 | % | 0.55 | % | 0.56 | % | 0.62 | % | ||||||||||
Net expenses | 0.61 | % | 0.57 | % | 0.55 | % | 0.56 | % | 0.61 | % | ||||||||||
Net assets, end of period (000s) | $ | 1,768,143 | $ | 1,494,477 | $ | 1,422,697 | $ | 1,265,958 | $ | 1,137,817 | ||||||||||
|
|
|
|
|
|
|
|
|
| |||||||||||
Portfolio turnover rate(3) | 10.66 | % | 22.54 | % | 9.62 | % | 27.02 | % | 8.77 | % | ||||||||||
|
|
|
|
|
|
|
|
|
| |||||||||||
| (1) | Net investment income per share was calculated using an average shares method. |
| (2) | Assumes a hypothetical initial investment on the business day before the first day of the fiscal period, with all dividends reinvested in additional shares on the reinvestment date, and redemption at the net asset value calculated on the last business day of the fiscal period. Sales charges are not reflected in the total returns. |
| (3) | The portfolio turnover rate is computed by dividing the lesser of purchases or sales of portfolio securities for a period by the monthly average of the value of portfolio securities owned during the period. Sales of securities include the proceeds of securities that have been called or for which payment has been made through redemption or maturity. Securities with a maturity date of one year or less at the time of acquisition are excluded from the calculation. Cost of purchases and proceeds from sales of investment securities (excluding short-term securities) for the period ended September 30, 2021 were $232,077,453 and $113,651,066 respectively. |
See accompanying notes to financial statements.
35
Table of Contents
Colorado BondShares
A Tax-Exempt Fund
Notes to Financial Statements
| (1) | Organization |
Colorado BondShares — A Tax-Exempt Fund (the “Fund”) is registered under the Investment Company Act of 1940, as amended, as a diversified, open-end management company. The Fund’s investment objectives are to maximize income exempt from federal income taxes and from personal income taxes of the State of Colorado to the extent consistent with the preservation of capital and to seek opportunities for capital appreciation. The Fund’s investment adviser is Freedom Funds Management Company (“Freedom Funds”).
| (2) | Summary of Significant Accounting Policies |
These financial statements have been prepared in conformity with accounting principles generally accepted in the United States of America. This requires management to make estimates and assumptions that affect the reported amounts of assets and liabilities and disclosure of contingent assets and liabilities at the date of the financial statements and the reported amounts of income and expenses during the reporting period. Actual results could differ from those estimates. These financial statements reflect all adjustments which are, in the opinion of management, necessary to a fair statement of financial position and results of operations for the reporting period. The following summarizes the significant accounting policies of the Fund:
| (a) | Investment Valuation and Risk |
Securities for which there is no last sales price are valued by an independent pricing service based on evaluated prices which considers such factors as transactions in bonds, quotations from bond dealers, market transactions in comparable securities and various relationships between securities, or are fair valued by management.
Securities for which market quotations are not readily available (or management considers otherwise are no longer valid or reliable) are valued at fair value determined in accordance with procedures approved by the Board of Trustees. This can occur in the event of, among other things, natural disasters, acts of terrorism, market disruptions, intra-day trading halts, and extreme market volatility. The determination of fair value involves subjective judgments. As a result, using fair value to price a security may result in a price materially different from the prices used by other mutual funds to determine net asset value or the price that may be realized upon the actual sale of the security. Short-term holdings are valued at current market quotations or amortized cost, whichever management believes best approximates fair value.
Fixed-income securities owned by the Fund are subject to interest-rate risk, credit risk, prepayment risk and market risk. The Fund invests in non-rated securities which may be subject to a greater degree of credit risk and risk of loss of income and principal and may be more sensitive to economic conditions than lower yielding, higher rated fixed income securities. The Fund concentrates its investments in Colorado and, therefore, may be impacted by specific events, issuers or factors affecting Colorado. The Fund has more credit risk related to the economic conditions of Colorado than a portfolio with a broader geographical diversification.
36
Table of Contents
Colorado BondShares
A Tax-Exempt Fund
Notes to Financial Statements — (Continued)
Accounting Standards Codification (“ASC”) 820 Fair Value Measurements and Disclosures establishes a fair value hierarchy that classifies securities based on valuation techniques used to measure fair value and distinguish between observable inputs (market data obtained from independent sources) and the reporting entities own assumptions, which are not readily observable to market participants. The fair value hierarchy gives the highest priority to quoted prices (unadjusted) in active markets for identical assets or liabilities (Level 1) and the lowest priority to unobservable inputs (Level 3).
Level 1 Inputs: Quoted prices (unadjusted) in active markets for identical assets or liabilities that the reporting entity has the ability to access at the measurement date.
Level 2 Inputs: Inputs other than quoted prices included within Level 1 that are observable for the asset or liability, either directly or indirectly. If the asset or liability has a specified (contractual) term, a Level 2 input must be observable for substantially the full term of the asset or liability.
Level 3 Inputs: Significant unobservable inputs for the asset or liability including management’s own assumptions. Unobservable inputs shall be used to measure fair value to the extent that observable inputs are not available.
The following table summarizes the valuation of the Fund’s investments as defined by ASC 820 hierarchy levels as of September 30, 2021:
Valuation Inputs Summary
| Colorado Municipal Bonds | Other Municipal Bonds | Short-Term Municipal Bonds | Colorado Capital Appreciation and Zero Coupon Bonds | Colorado Taxable Certificates/ Notes/ Bonds | Total Securities September 30, 2021 | |||||||||||||||||||
Level 1 Securities | $ | — | $ | — | $ | — | $ | — | $ | — | $ | — | ||||||||||||
Level 2 Securities | 890,599,842 | 121,041,251 | 68,409,681 | 65,777,217 | 9,150,127 | 1,154,978,118 | ||||||||||||||||||
Level 3 Securities | 3,861,650 | 1,865,780 | 5,321,000 | 2,988,000 | 88,199 | 14,124,629 | ||||||||||||||||||
|
|
|
|
|
|
|
|
|
|
|
| |||||||||||||
Totals | $ | 894,461,492 | $ | 122,907,031 | $ | 73,730,681 | $ | 68,765,217 | $ | 9,238,326 | $ | 1,169,102,747 | ||||||||||||
|
|
|
|
|
|
|
|
|
|
|
| |||||||||||||
37
Table of Contents
Colorado BondShares
A Tax-Exempt Fund
Notes to Financial Statements — (Continued)
| Colorado Municipal Bonds | Other Municipal Bonds | Short-Term Municipal Bonds | Colorado Capital Appreciation and Zero Coupon Bonds | Colorado Taxable Certificates/ Notes/Bonds | Totals | |||||||||||||||||||
Level 3 Beginning Balance September 30, 2020 | $ | 12,708,664 | $ | 4,904,915 | $ | 5,321,000 | $ | 2,988,000 | $ | 88,199 | $ | 26,010,778 | ||||||||||||
Unrealized Losses | — | — | — | — | — | — | ||||||||||||||||||
Unrealized Gains | — | — | — | — | — | — | ||||||||||||||||||
Realized Losses | — | — | — | — | — | — | ||||||||||||||||||
Realized Gains | — | — | — | — | — | — | ||||||||||||||||||
Purchases | 948 | — | — | — | — | 948 | ||||||||||||||||||
Sales | — | (3,039,135 | ) | — | — | — | (3,039,135 | ) | ||||||||||||||||
Transfers In to Level 3* | — | — | — | — | — | — | ||||||||||||||||||
Transfers Out of Level 3* | (8,847,962 | ) | — | — | — | — | (8,847,962 | ) | ||||||||||||||||
|
|
|
|
|
|
|
|
|
|
|
| |||||||||||||
Balance as of September 30, 2021 | $ | 3,861,650 | $ | 1,865,780 | $ | 5,321,000 | $ | 2,988,000 | $ | 88,199 | $ | 14,124,629 | ||||||||||||
|
|
|
|
|
|
|
|
|
|
|
| |||||||||||||
* Transfers from Level 2 to Level 3 are because of a lack, or change of observable inputs or reduced market data reliability. Transfers from Level 3 to Level 2 are the result of observable inputs becoming available or increased market data reliability. The Fund’s policy is to recognize transfers into and out of Level 3 when management becomes aware of a change to significant observable input or market data reliability.
From September 30, 2020 to September 30, 2021, there were no Level 1 Securities.
Significant Unobservable Inputs Quantitative Disclosure
Level 3 Securities* | Fair Value as of September 30, 2021 | Valuation | Unobservable | Low | High | Weighted Average | ||||||||||||||
Colorado Municipal Bonds | $ | 3,861,650 | discounted cash flow | probability of default | 5.00% | 5.00% | 5.00% | |||||||||||||
| consensus pricing | Bond Dealer #1 | 9.00% | 65.00% | 42.18% | ||||||||||||||||
Other Municipal Bonds | 1,865,780 | discounted cash flow | probability of default | 1.00% | 1.00% | 1.00% | ||||||||||||||
| consensus pricing | Bond Dealer #1 | 100.00% | 100.00% | 100.00% | ||||||||||||||||
Short-Term Municipal Bonds | 5,321,000 | discounted cash flow | probability of default | 5.00% | 10.00% | 5.95% | ||||||||||||||
| consensus pricing | Bond Dealer #1 | 100.01% | 100.01% | 100.01% | ||||||||||||||||
Colorado Capital Appreciation and Zero Coupon Bonds | 2,988,000 | discounted cash flow | probability of default | 100.00% | 100.00% | 100.00% | ||||||||||||||
| consensus pricing | Bond Dealer #1 | 40.01% | 40.01% | 40.01% | ||||||||||||||||
Colorado Taxable Certificates/Notes/Bonds | 88,199 | discounted cash flow | probability of default | 100.00% | 100.00% | 100.00% | ||||||||||||||
| consensus pricing | Bond Dealer #1 | 38.79% | 38.79% | 38.79% | ||||||||||||||||
|
| |||||||||||||||||||
Total Level 3 Securities at September 30, 2021 | $ | 14,124,629 | ||||||||||||||||||
|
| |||||||||||||||||||
38
Table of Contents
Colorado BondShares
A Tax-Exempt Fund
Notes to Financial Statements — (Continued)
The significant unobservable inputs used in the fair value measurement of the Fund’s securities are collateral value, probability of default, and loss severity in the event of default. Any changes in unobservable inputs may result in substantial changes to fair value measurements.
* The inputs for these securities are not readily available or cannot be reasonably estimated and are generally those inputs described in Note 2(a). The appropriateness of fair values for these securities is based on results of back testing, broker due diligence, unchanged price review and consideration of macro or security specific events.
** Other unobservable inputs used in the discounted cash flow technique include collateral value and loss severity. These unobservable inputs are specific to the characteristics of each security being valued.
| (b) | Cash |
The Fund continually monitors its positions with, and the credit quality of, the financial institutions with which it invests. As of September 30, 2021, and periodically throughout the year, the Fund has maintained balances in various operating accounts in excess of federally insured limits.
| (c) | Income Tax Information and Distributions to Shareholders |
The Fund intends to comply with the requirements of Subchapter M of the Internal Revenue Code, as amended, applicable to regulated investment companies and to distribute all its net investment income and any net realized gain on investments not offset by capital loss carryforwards to shareholders. The Fund distributes investment income monthly and due to the tax-exempt nature of its investments, the income is generally non-taxable to the shareholders. The Fund distributes net realized capital gains, if any, to its shareholders at least annually. Income distributions and capital gain distributions are determined in accordance with income tax regulations, which may differ from generally accepted accounting principles. These differences are primarily due to the differing treatment of tax allocations.
Management has reviewed the Fund’s tax position for all open tax years. As of September 30, 2021, the Fund did not have a liability for any unrecognized tax obligations. The fund recognizes interest and penalties, if any, related to unrecognized tax obligations as income tax expense in the Statement of Operations. The Fund has no examinations in progress.
The tax components of undistributed net tax-exempt income, net ordinary income and net long-term capital gains were as follows during the Fund’s tax years ended September 30, 2021 and September 30, 2020:
| 2021 | 2020 | |||||||
Undistributed net tax-exempt income | $ | — | $ | — | ||||
Undistributed net ordinary income* | 30,907 | 282,449 | ||||||
Undistributed net long-term capital gain | 1,328,605 | 1,514,478 | ||||||
* Net ordinary income consists of taxable market discount income and net short-term capital gains, if any.
39
Table of Contents
Colorado BondShares
A Tax-Exempt Fund
Notes to Financial Statements — (Continued)
The tax character of distributions paid during the Fund’s tax years ended September 30, 2021 and September 30, 2020 was designated for purposes of the dividends paid deduction as follows:
| 2021 | 2020 | |||||||
Distributions from net tax-exempt income* | $ | 61,931,323 | $ | 56,376,378 | ||||
Distributions from net ordinary income** | 2,204,096 | 1,632,937 | ||||||
Distributions from net long-term capital gain | 2,395,672 | 748,825 | ||||||
* The Fund hereby designates this amount paid during the fiscal year ended September 30, 2021, as Exempt Interest Dividends.
** Net ordinary income consists of taxable market discount income, taxable interest income and net short-term gains, if any.
At September 30, 2021, the cost and unrealized appreciation (depreciation) of investments, as determined on a federal income tax basis, were as follows:
Cost of investments | $ | 1,154,453,302 | ||
|
| |||
Gross unrealized appreciation | $ | 48,394,717 | ||
Gross unrealized depreciation | (33,745,272 | ) | ||
|
| |||
Net unrealized appreciation of investments | $ | 14,649,445 | ||
|
|
For tax purposes, capital losses may be carried over to offset future capital gains, if any. Under the Regulated Investment Company Modernization Act of 2010, capital losses incurred by the Fund in taxable years beginning after December 22, 2010 are not subject to expiration and such losses retain their character as either short-term or long-term, rather than being considered short-term as under previous law. Post-enactment capital losses must be fully utilized prior to utilizing any losses incurred in pre-enactment tax years. At September 30, 2021, the Fund did not have any capital loss carryforwards.
| (d) | Defaulted or Non-income Producing Investments |
The Fund discontinues the accrual of interest income on municipal bonds when the securities become delinquent as to payment of principal or interest, or when the Fund’s investment adviser determines that an uncertainty exists as to the realization of all or a portion of the principal balance. The face amount of bonds for which the accrual of interest income has been discontinued approximates $67,372,347 and such bonds have a value of $21,364,174 or 1.21% of net assets, as of September 30, 2021. These securities have been identified in the accompanying Schedule of Investments.
The Fund has entered into forbearance agreements with one district under which it agrees that the issuer may pay a reduced rate of interest in lieu of the contract rate for a period of time. Face amount of the bonds for which the Fund has entered into forbearance agreements total $27,375,000 and have a value of $15,056,250 or 0.85% of net assets, as of September 30, 2021. These securities have been identified in the Schedule of Investments.
40
Table of Contents
Colorado BondShares
A Tax-Exempt Fund
Notes to Financial Statements — (Continued)
| (e) | Investment Transactions and Revenue Recognition |
Investment transactions are accounted for on the date the investments are purchased or sold (trade date). Purchases and sales of securities, other than short-term securities, aggregated to $232,077,453 and $113,651,066 respectively.
Dividends to shareholders are declared each business day and paid monthly. Distributions to shareholders are recorded on the ex-dividend date. Realized gains and losses from investment transactions are calculated using the identified-cost basis, which is the same basis the Fund uses for federal income tax purposes. Interest income is recorded on the accrual basis.
Variable Rate Demand Obligations (“VRDO”) purchased by the Fund are floating rate obligations that have a nominal long-term maturity but have a coupon rate that is reset periodically (e.g., daily or weekly). The investor has the option to put the issue back to the trustee or tender agent at any time with specified (e.g., seven days) notice; accordingly the Fund treats these obligations as short-term holdings. On September 30, 2021, the interest rates paid on these obligations ranged from 0.06% to 0.22%.
| (f) | Classification of Distributions to Shareholders |
The character of distributions made during the year from net investment income or net realized gains may differ from its ultimate characterization for federal income tax purposes. Also, due to timing of dividend distributions, the fiscal year in which amounts are distributed may differ from the fiscal year in which the income or realized gain was recorded by the Fund.
| (g) | Securities Purchased on a When-Issued Basis |
The Fund may purchase securities on a when-issued basis with payment and delivery scheduled for a future date. These transactions are subject to market fluctuations and may increase or decrease in value prior to the delivery date. The Fund maintains segregated assets with a value equal to or greater than the amount of its purchase commitments. The Fund did not have any when-issued securities at September 30, 2021.
41
Table of Contents
Colorado BondShares
A Tax-Exempt Fund
Notes to Financial Statements — (Continued)
| (3) | Shares of Beneficial Interest |
The Fund has an unlimited number of no par value shares of beneficial interest authorized. Transactions in shares of beneficial interest were as follows:
| Years Ended September 30, | ||||||||||||||||
| 2021 | 2020 | |||||||||||||||
| Shares | Amount | Shares | Amount | |||||||||||||
Shares sold | 30,310,105 | $ | 284,304,913 | 20,938,233 | $ | 191,605,817 | ||||||||||
Dividends reinvested | 5,099,548 | 47,782,882 | 4,497,685 | 41,141,389 | ||||||||||||
|
|
|
|
|
|
|
| |||||||||
| 35,409,653 | 332,087,795 | 25,435,918 | 232,747,206 | |||||||||||||
Shares redeemed | (9,204,679 | ) | (86,276,679 | ) | (17,162,039 | ) | (153,441,639 | ) | ||||||||
|
|
|
|
|
|
|
| |||||||||
Net increase in shares outstanding | 26,204,974 | $ | 245,811,116 | 8,273,879 | $ | 79,305,567 | ||||||||||
|
|
|
|
|
|
|
| |||||||||
| (4) | Management Fees and Other Transactions with Affiliates |
Management fees paid to Freedom Funds were in accordance with the investment advisory agreement with the Fund which provides for an annual fee equivalent to 0.5% of the net assets of the Fund. Freedom Funds pays all expense associated with advertising, marketing, and distributing the Fund’s shares and serves as the transfer agent, dividend disbursing agent, and registrar for the Fund. Freedom Funds provided certain transfer agency and shareholder services as part of the management fee arrangement for the period ended September 30, 2021. Transfer agency expenses on the Statement of Operations represent direct expenses charged to the Fund by third parties.
Allen Insurance, an affiliate of the investment adviser, acted as agent for the Fidelity Bond and the Errors and Omissions insurance policy maintained by the Fund and as a result received compensation in the form of commissions. The policies were provided by Traveler’s Insurance Company and all the commissions referred to above were paid by Travelers. Allen Insurance received no compensation directly from the assets of the Fund.
The Fund does not have any Trustees who are affiliated with the Adviser or Distributor. The Board of Trustees appointed a Chief Compliance Officer to the Fund in accordance with federal securities regulations. The Fund does not reimburse the Adviser for any compensation or fees associated with the Chief Compliance Officer.
| (5) | Custody Credits |
Expenses paid indirectly by the Fund represent earnings credits on cash balances maintained with the Fund’s custodian bank, UMB Bank, N.A. The earnings credits resulted in offsetting custodian fees of $73,839 for the period ended September 30, 2021.
42
Table of Contents
Colorado BondShares
A Tax-Exempt Fund
Notes to Financial Statements — (Continued)
| (6) | Indemnification |
From time to time the Fund may be involved in certain disputes and legal actions arising in the ordinary course of its business. While it is not feasible to predict or determine the outcome of these proceedings, in management’s opinion, based on a review with legal counsel, none of these disputes and legal actions is expected to have a material impact on its financial position or results of operations. However, litigation is subject to inherent uncertainties, and an adverse result in these matters may arise from time to time that may harm the Fund’s business.
In the normal course of business, the Fund enters into contracts that contain a variety of representations which provide general indemnifications. The Fund’s maximum exposure under these arrangements is unknown, as this would involve future claims that may be made against the Fund that have not yet occurred. However, based on experience, the Fund expects the risk of loss to be remote.
| (7) | Purchase Accrued Interest |
Purchase accrued interest is typically a component of a municipal bond purchase and is paid on settlement date. The accrual period begins on the last interest payment date (or original issue date) and runs through the day immediately preceding the settlement date. The Fund has purchased three bonds from the Meadows Metropolitan Districts No. 1, 2 and 7 with an aggregate balance of purchase accrued of $90,436,317 (97.5% of the September 30, 2021 balance of $92,740,878). Approximately $184,183,988 of additional interest has accrued on the purchase accrued interest since its purchase in 2007. This additional accrued interest has been fair valued in accordance with ASC 820 at approximately $77,597,851 and is included in other assets net of liabilities in the Schedule of Investments. This amount bears interest at the rate of 7.999% and will be received over an uncertain period of years. The value of the Meadows bonds is contained within three separate line items of the financial statements which all relate to a single set of bonds that cannot be sold separately.
| (8) | Litigation |
The Fund is periodically involved in various legal proceedings. At September 30, 2021, the Fund has a litigation accrual of $203,044 for all pending litigation matters primarily for the purpose of paying lawyer fees. Possible additional amounts cannot be currently estimated but will be set aside as needed. Although there can be no assurances, based on information available, management believes that it is probable that the ultimate outcome of the action described below and other matters that are pending or threatened will not have a material effect on the Fund’s financial condition.
Marin Metropolitan District LTD Tax G.O. Series 2008 Bond
The Fund is the beneficial owner of bonds issued in 2008 (the “Bond”), by Marin Metropolitan District (the “District”), as described more fully in the Fund’s most recent schedule of portfolio holdings for the period ended June 30, 2021, on Form NPORT-EX filed with the Securities and Exchange Commission (“SEC”) on
43
Table of Contents
Colorado BondShares
A Tax-Exempt Fund
Notes to Financial Statements — (Continued)
August 27, 2021. The original principal amount of the Bonds was $30,485,000. The current principal amount of the Bonds is $17,485,000. The valuation of these Bonds as of June 30, 2021 was set forth in the schedule of investments included in the Fund’s above referenced Form N-PORT-EX.
On June 1, 2011, Landmark Towers Association, Inc. (“Landmark”), a homeowners association, filed an action on behalf of its members entitled Landmark Towers Ass’n, et al. v. UMB Bank, et al., Case Number 2011-CV-1076 in Arapahoe County District Court, Colorado (“Landmark Litigation”). The complaint filed in the Landmark Litigation sought a temporary restraining order, declaratory relief and permanent injunction against the District, the Fund, and UMB Bank (“UMB”), the trustee, alleging that the taxes imposed by the District pledged to pay the Bonds violated TABOR.
In August 2011, Landmark sought to freeze approximately $13,000,000 in original proceeds from the sale of the Bonds to the Fund, which moneys were held by UMB as trustee. The District Court denied Landmark’s efforts to freeze the $13,000,000 and allowed those moneys to be paid to the Fund, which reduced the principal amount of the Bonds to the current level.
In July and August of 2013, the District Court held a bench trial regarding Landmark’s claims for declaratory relief and permanent injunction. On September 6, 2013, the District Court issued an order (“Sept. 6 Order”) that the District was properly formed and that the election approving the taxes was proper, but nonetheless held that there were violations of TABOR relating to the property taxes. In particular, the District Court held that (1) bond proceeds were used to pay improper charges of the developer; (2) the taxes exceeded the maximum mill levy for debt service; and (3) the taxes did not benefit the Landmark taxpayers. After holding that the taxes did not provide a benefit to the Landmark taxpayers, the Court enjoined the District from imposing its taxes on the Landmark members for purposes of paying the Bonds (the “Injunction”). The Fund, the District, and UMB filed a motion for reconsideration of the Sept. 6 Order, which the District Court denied in an order dated October 31, 2013 (“Oct. 31 Order”).
While the Fund was not found to be responsible for damages based on the asserted TABOR violations, the District Court on March 10, 2014, entered an order allowing Landmark to pursue claims for fraudulent transfer and constructive trust that could result in the Fund being ordered to pay some or all of the tax refund obligations of the District.
In August 2014, the District Court held a four-day trial on the newly asserted claims against the Fund, and on September 10, 2014, the District Court issued an order (the “Sept. 10 Order”) denying each of the new claims asserted against the Fund. Landmark, however, filed a post-trial motion for reconsideration of the Sept. 10 Order, which motion was denied on November 12, 2014.
The Fund filed a Notice of Appeal of the Sept. 6 Order and the Oct. 31 Order, including the Injunction.
On April 21, 2016, the Colorado Court of Appeals issued an Opinion (the “April 2016 Opinion”), in which it concluded that the TABOR election held for approving the Bonds and the District’s ad valorem property taxes was invalid because eligible electors were denied the right to vote in the election and that ineligible electors voted in the election. Based on those decisions, the Court of Appeals upheld the injunction against the District, prohibiting it from levying taxes for payment of the Bonds.
44
Table of Contents
Colorado BondShares
A Tax-Exempt Fund
Notes to Financial Statements — (Continued)
The April 2016 Opinion created uncertainty in the Colorado public finance market in that it calls into question the process that is routinely used to qualify electors for special district elections in Colorado. Emergency legislation was introduced in the Colorado legislature to remove the uncertainty and any impact the April 2016 Opinion may have on other special district financings. The Colorado General Assembly unanimously passed the legislation, and it was signed by the Governor on May 18, 2016.
In a further effort to reduce any impact the April 2016 Opinion may have on the Colorado public finance market, the Fund filed a Petition for Rehearing with the Court of Appeals, asking it to withdraw a portion of its April 2016 Opinion as unnecessary. That Petition was filed on May 5, 2016, and was denied on May 12, 2016.
The Fund filed a petition with the Colorado Supreme Court to review the April 2016 Opinion on various grounds. On November 7, 2016, the Supreme Court granted the petition for review. On December 11, 2017, the Supreme Court reversed the April 2016 Opinion on the grounds that all claims challenging the election held by the District in 2007 were barred under C.R.S. § 1-11-213(4) (which requires an election contest to be filed no later than 10 days after the certification of the results of an election). The Supreme Court, however, remanded the case back to the Court of Appeals to decide issues that were not decided in the April 2016 Opinion.
On January 8, 2018, Landmark filed a Petition for Rehearing asking the Supreme Court to reconsider its decision to reverse the April 2016 Opinion. On January 22, 2018, the Supreme Court denied the Petition for Rehearing.
On May 5, 2018, the Court of Appeals issued an opinion on remanded issues (the “May 2018 Opinion”), concluding that the due process rights of the District taxpayers were violated and upholding the injunction that prevents the District from collecting taxes for repayment of the Bonds.
The Fund filed a petition with the Colorado Supreme Court to review the May 2018 Opinion on various grounds. The petition to the Colorado Supreme Court was fully briefed on August 31, 2018. The Colorado Supreme Court denied the petition for review on March 25, 2019.
Because the May 2018 Opinion was based on federal due process, on August 21, 2019, the Fund filed a Petition for Writ of Certiorari with the U.S. Supreme Court seeking review and reversal of the May 2018 Opinion. The U.S. Supreme Court denied the Petition for Writ of Certiorari on November 25, 2019.
There was a hearing held on June 18, 2020 in Arapahoe County Court for the parties to present their arguments regarding amount and responsibility for legal fees. The amount of reimburseable legal fees was set at $348,490.74 to be paid by the district from funds on hand. Colorado BondShares was not found to be responsible for any of the fees although the funds on hand by the district might otherwise have gone to pay debt service to Colorado BondShares. On July 16, 2021 the owner of the unimproved parcel petitioned the court to avoid responsibility for payment of property taxes, relying in large part on the prior decisions of the courts relating to the Landmark property. Colorado BondShares has filed a motion to dismiss the claims on several grounds, including that the owner’s claims are beyond the statute of limitations.
45
Table of Contents
Colorado BondShares
A Tax-Exempt Fund
Notes to Financial Statements — (Continued)
As a result of the foregoing, the tax revenues originally pledged to pay the Bonds have been reduced, and such reduction may have adverse effects on dividend distributions and net asset values of the Fund.
| (9) | Subsequent Events |
Management has evaluated the possibility of subsequent events in the Fund’s financial statements through the date of issuance. Management has determined that there are no material events that would require disclosure in the Fund’s financial statements through this date.
46
Table of Contents

A Tax-Exempt Fund
ANNUAL REPORT
September 30, 2021
Table of Contents
(a) The registrant, as of the end of the period covered by this report, has adopted a code of ethics (as defined in Item 2 of Form N-CSR), that applies to its President (Principal Executive Officer) and Treasurer (Principal Financial Officer).
(c) There have been no amendments to the code of ethics during the period covered by this report.
(d) The registrant has not granted, during the period covered by this report, any waivers, including an implicit waiver, from the code of ethics.
(f)(3) A copy of the registrant’s code of ethics is available upon request and without charge by calling or writing the registrant at 1200 Seventeenth Street, Suite 850, Denver, Colorado 80202, telephone (303) 572-6990 or (800) 572-0069 (outside Denver).
ITEM 3. AUDIT COMMITTEE FINANCIAL EXPERT.
(a) The registrant’s board of trustees has determined that the registrant does not have an “audit committee financial expert” as such term is defined by the Securities and Exchange Commission pursuant to Item 3 of Form N-CSR, as no single individual appears to meet all of the independence and the financial training/experience qualifications outlined in the instructions to Form N-CSR. The board of trustees, which serves as the audit committee, has determined that it collectively has experience evaluating financial statements and understanding internal control over financial reporting and the audit committee function and has sufficient financial expertise to adequately perform its duties without the addition of an expert.
ITEM 4. PRINCIPAL ACCOUNTANT FEES AND SERVICES.
The following table shows the amount of fees and reimbursable expenses that Plante & Moran, PLLC, the registrant’s independent registered public accounting firm, billed to the registrant during the registrant’s last two fiscal years. For the reporting periods, the audit committee approved in advance all services that Plante & Moran, PLLC provided to the registrant.
The aggregate fees billed by the registrant’s independent registered public accounting firm, for professional services in the registrant’s fiscal years ended September 30, 2021 and 2020 are as follows:
| 2021 | 2020 | |||||||
(a) Audit Fees | $ | 119,000 | $ | 112,000 | ||||
(b) Audit-Related Fees | $ | 0 | $ | 0 | ||||
(c) Tax Fees | $ | 0 | $ | 0 | ||||
(d) All Other Fees | $ | 0 | $ | 0 | ||||
The above “Audit Fees” were billed for amounts related to the audit of the registrant’s financial statements and services normally provided by the accountant in connection with statutory and regulatory filings.
(e)(1) The board of trustees serves as the audit committee and pre-approves all audit and non-audit services to be provided by the registrant’s independent registered public accounting firm.
(e)(2) Not applicable.
(f) Not applicable.
(g) No non-audit fees were billed by the registrant’s independent registered public accounting firm for services rendered to the registrant and the registrant’s investment adviser and any entity controlling, controlled by, or under common control with the adviser that provides ongoing services to the registrant for the fiscal years ended September 30, 2021 and 2020.
Table of Contents
(h) The registrant’s independent registered public accounting firm did not provide any non-audit services to the registrant in the registrant’s fiscal years ended September 30, 2021 and 2020.
ITEM 5. AUDIT COMMITTEE OF LISTED REGISTRANTS.
Not applicable.
(a) Please see the Schedule of Investments contained in the Annual Report included under Item 1 of this Form N-CSR.
(b) Not applicable.
ITEM 7. DISCLOSURE OF PROXY VOTING POLICIES AND PROCEDURES FOR CLOSED-END MANAGEMENT INVESTMENT COMPANIES.
Not applicable.
ITEM 8. PORTFOLIO MANAGERS OF CLOSED-END MANAGEMENT INVESTMENT COMPANIES.
Not applicable.
ITEM 9. PURCHASES OF EQUITY SECURITIES BY CLOSED-END MANAGEMENT INVESTMENT COMPANY AND AFFILIATED PURCHASERS.
Not applicable.
ITEM 10. SUBMISSION OF MATTERS TO A VOTE OF SECURITY HOLDERS.
The registrant has not adopted procedures by which shareholders may recommend nominees to the registrant’s board of trustees.
ITEM 11. CONTROLS AND PROCEDURES.
(a) The registrant has adopted and maintained disclosure controls and procedures (as such term is defined in Rules 30a-3(c) under the Investment Company Act of 1940, as amended (the “Act”)) that are designed to ensure that information required to be disclosed in the registrant’s reports under the Act, is recorded, processed, summarized and reported within the time periods required under the SEC’s rules and forms and that the information is accumulated and communicated to the registrant’s management, including its principal executive officer and principal financial officer to allow for timely decisions regarding required disclosure.
As required by Rule 30a-3(b) of the Act, the registrant carried out an evaluation under the supervision and with the participation of its management, including its principal executive officer and principal financial officer, of the effectiveness of the design and operation of the registrant’s disclosure controls and procedures within the 90-day period prior to the filing date of this report. Based on the foregoing, the registrant’s principal executive officer and principal financial officer have concluded that the registrant’s disclosure controls and procedures were effective, as of that date.
(b) There were no changes in the registrant’s internal control over financial reporting (as defined in Rule 30a-3(d) under the Act) during the period covered by this report that has materially affected, or is reasonably likely to materially affect, the registrant’s internal control over financial reporting.
ITEM 12. DISCLOSURE OF SECURITIES LENDING ACTIVITIES FOR CLOSED-END MANAGEMENT INVESTMENT COMPANIES.
Not applicable.
Table of Contents
(a)(1) | Not applicable (See Item 2(f)(3) of this report). | |
(a)(2)(i) | ||
(99.302) | Interim President’s (Principal Executive Officer) Section 302 Certification | |
(a)(2)(ii) | ||
(99.302) | Interim Treasurer’s (Principal Financial Officer) Section 302 Certification | |
(b) | ||
(99.906) | Combined Interim President & Treasurer (Principal Executive Officer and Principal Financial Officer) Section 906 Certification |
Table of Contents
Signatures
Pursuant to the requirements of the Securities Exchange Act of 1934 and the Investment Company Act of 1940, the registrant has duly caused this report to be signed on its behalf by the undersigned, thereunto duly authorized.
(Registrant) Colorado BondShares — A Tax-Exempt Fund
| By (Signature and Title) | /s/ George N. Donnelly | |
George N. Donnelly Interim President, Secretary and Treasurer |
Date: December 1, 2021
Pursuant to the requirements of the Securities Exchange Act of 1934 and the Investment Company Act of 1940, this report has been signed below by the following persons on behalf of the registrant and in the capacities and on the dates indicated.
/s/ George N. Donnelly |
George N. Donnelly Interim President, Secretary and Treasurer (Principal Executive Officer and Principal Financial Officer) Date: December 1, 2021 |