Exhibit 99.1
Dreams, Inc. Announces Quarterly and Nine Months Results
Quarterly Revenue Increases 5.7% to $15.2 million, Significant Cash Flow Improvements
PLANTATION, FL, November 12, 2009 – Dreams, Inc. (NYSE Amex: DRJ) announced today its quarterly and nine months financial results for the period ended September 30, 2009. Revenues for the quarter rose 5.7% to $15.2 million, from $14.4 million in the same period last year. *EBITDA for the quarter improved about 300% to a loss of $429,000, versus a loss of $1.7 million for the same period last year. Net losses for the quarter improved 78% to a loss of $786,000, versus a loss of $1.4 million for the same period last year. Revenues for the nine months decreased 9% to $42.3 million, from $46.5 million in the same period last year. *EBITDA for the nine months improved 20% to a loss of $2.5 million, versus a loss of $3.0 million in the same period last year. Net losses for the nine months were constant with a $2.8 million loss for this year, versus a $2.7 million loss for the same period last year.
The themes of our quarterly and nine month results were our cash flow improvements, our Internet revenue producing opportunities and our ability to reign in operating expenses,” stated, Ross Tannenbaum, Dreams President & CEO.
Cash Flow
“In fact, bothnet cash used in operating activities andnet cash provided by financing activities were negligible for the quarter with only $106,000 and $16,000, respectively. For the nine months ended September 30, 2009, these two important components of our consolidated statements of cash flows have been slashed by about $10.0 million each, versus the comparable period last year. Also,net cash used in investing activities is down $1.0 million for the first nine-months of the year, versus the same period last year.
Revenues
“We were down 9% of consolidated revenues for the nine months ended September 30, 2009, versus the comparable period last year, although we have begun to grow our revenues (5.7% for this most recent quarter) and believe we will continue to do so for the remainder of the year. This is due to our continued Internet growth through our on-line properties. The combination of organic growth with our main site, www.Fansedge.com, coupled with an ever expanding web syndication portfolio, has the Company positioned to deliver a strong holiday quarter. With these anticipated results, we expect to return to profitability in 2009. We are already seeing meaningful contributions from our most recent partnerships with the Philadelphia Eagles, JC Penney and Walmart. In fact, Internet sales have accounted for 57.6% of our consolidated revenues for the first nine months of the year, and 62.9% for the most recent quarter. We expect this trend will continue.
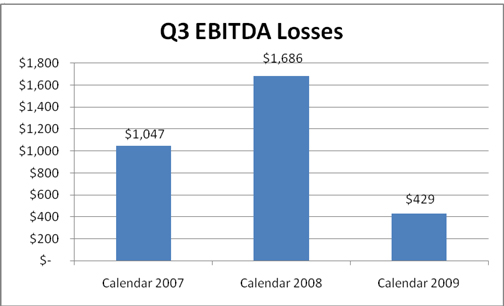
*EBITDA
“We have been proactive in instituting numerous corporate savings initiatives that have become the catalyst for improved economics. Hence, we are seeing considerable improvements in our *EBITDA results. *EBITDA for the quarter improved about 300% to a loss
1
of $429,000, versus a loss of $1.7 million for the same period last year. The quarterly results were impacted by a $109,000 non-cash operating expense associated with the granting of stock options to employees, officers and directors. Otherwise, our *EBITDA loss would have been a loss of $320,000. *EBITDA for the past nine months improved 20% to a loss of $2.5 million, versus a loss of $3.0 million in the same period last year. The ability to eradicate non-holiday quarter losses is a company-wide objective and we are clearly moving towards that goal.
(Dollars in thousands)
“New web syndication signings were dominant achievements during the third quarter of 2009. The Company announced its new partnerships with NCAA Football.com, JC Penney, the Washington Wizards, WalMart, and the Baseball Hall of Fame. We are uniquely positioned to grow our Internet presence in the sports licensed products industry. This is the fastest growing area of the Company and will remain its primary focus,” concluded Tannenbaum.
Dreams, Inc. trades under the ticker symbol: NYSE Amex: DRJ
www.Dreamscorp.com
2
Dreams, Inc. and Subsidiaries
Condensed Consolidated Statements of Operations – Unaudited
(Dollars in Thousands, except share amounts and earnings per share amounts)
| | | | | | | | | | | | | | | | |
| | | Nine Months Ended September 30, | | | Three Months Ended September 30, | |
| | | 2009 | | | 2008 | | | 2009 | | | 2008 | |
Revenues: | | | | | | | | | | | | | | | | |
Manufacturing/Distribution | | $ | 8,042 | | | $ | 12,774 $ | | | $ | 2,583 | | | $ | 3,168 | |
Retail | | | 33,979 | | | | 33,305 | | | | 12,582 | | | | 11,054 | |
Other | | | 242 | | | | 500 | | | | 61 | | | | 178 | |
| | | | | | | | | | | | | | | | |
Total Revenues | | $ | 42,263 | | | $ | 46,579 | | | $ | 15,226 | | | $ | 14,400 | |
Expenses: | | | | | | | | | | | | | | | | |
Cost of sales-mfg/distribution | | $ | 3,909 | | | $ | 7,386 | | | $ | 1,396 | | | $ | 1,921 | |
Cost of sales-retail | | | 18,263 | | | | 18,121 | | | | 6,676 | | | | 5,935 | |
Operating expenses | | | 22,660 | | | | 24,034 | | | | 7,583 | | | | 8,230 | |
Depreciation and amortization | | | 1,363 | | | | 905 | | | | 451 | | | | 364 | |
| | | | | | | | | | | | | | | | |
Total Expenses | | $ | 46,195 | | | $ | 50,446 | | | $ | 16,106 | | | $ | 16,450 | |
| | | | | | | | | | | | | | | | |
(Loss) before interest and taxes | | | (3,932 | ) | | | (3,867 | ) | | | (880 | ) | | | (2,050 | ) |
Interest expense, net | | | 785 | | | | 645 | | | | 413 | | | | 273 | |
Other expense | | | 8 | | | | 104 | | | | — | | | | 35 | |
| | | | | | | | | | | | | | | | |
(Loss) before income taxes | | | (4,725 | ) | | | (4,616 | ) | | | (1,293 | ) | | | (2,358 | ) |
Income tax benefit | | | 1,877 | | | | 1,869 | | | | 507 | | | | 1,004 | |
| | | | | | | | | | | | | | | | |
Net (loss) | | $ | (2,848 | ) | | $ | (2,747 | ) | | $ | (786 | ) | | $ | (1,354 | ) |
| | | | | | | | | | | | | | | | |
(Loss) per share: | | | | | | | | | | | | | | | | |
Basic: (Loss) per share | | $ | (0.07 | ) | | $ | (0.07 | ) | | $ | (0.02 | ) | | $ | (0.04 | ) |
Weighted average shares outstanding – Basic | | | 37,530,471 | | | | 37,551,403 | | | | 37,534,911 | | | | 37,533,238 | |
Diluted: (Loss) per share | | $ | (0.07 | ) | | $ | (0.07 | ) | | $ | (0.02 | ) | | $ | (0.04 | ) |
Weighted average shares outstanding – Diluted | | | 37,530,471 | | | | 37,709,494 | | | | 37,775,895 | | | | 37,662,780 | |
3
*EBITDA is a non-GAAP financial measurement that is defined as earnings before interest, tax, depreciation and amortization. We use this non-GAAP financial measure for financial and operational decision making and as a means to evaluate our performance. In our opinion, this non-GAAP measure provides meaningful supplemental information regarding our performance. We believe that both management and investors benefit from referring to this non-GAAP financial measure in assessing our performance and analyzing future periods. This non-GAAP financial measure also facilitates management’s internal comparisons to our historical performance. We believe this non-GAAP financial measures is useful to investors both because (1) they allow for greater transparency with respect to key metrics used by management in its financial and operational decision making and (2) they are used by institutional investors and the analyst community to help them analyze the health of our business.
Dreams, Inc. Investor Relations Contact Info:
David M. Greene, Senior Vice-President
Phone: 954-377-0002
Fax: 954-475-8785
dgreene@dreamscorp.com
Public Relations for Dreams, Inc.:
Boardroom Communications
Jennifer Clarin and/or Caren Berg
Phone: (954) 370-8999, Fax: (954) 370-8892
Email: cberg@boardroompr.com
# # #
Statements contained in this press release, which are not historical facts, are forward looking statements. The forward-looking statements in this press release are made pursuant to the safe harbor provisions of the Private Securities Litigation Reform Act of 1995. Such forward-looking statements involve known and unknown risks, uncertainties and other factors which may cause the actual results, performance or achievements of the Company to be materially different from any future results, performance or achievements expressed or implied by such forward-looking statements. Such statements are indicated by words or phrases such as “anticipates,” “projects,” “management believes,” “Dreams believes,” “intends,” “expects,” and similar words or phrases. Such factors include, among others, the following: competition; seasonality; success of operating initiatives; new product development and introduction schedules; acceptance of new product offerings; franchise sales; advertising and promotional efforts; adverse publicity; expansion of the franchise chain; availability, locations and terms of sites for franchise development; changes in business strategy or development plans; availability and terms of capital including the continuing availability of our credit facility with Comerica Bank or a similar facility with another financial institution; labor and employee benefit costs; changes in government regulations; and other factors particular to the Company.
4