UNITED STATES
SECURITIES AND EXCHANGE COMMISSION
Washington, D.C. 20549
FORM N-CSR
CERTIFIED SHAREHOLDER REPORT OF REGISTERED
MANAGEMENT INVESTMENT COMPANIES
| | |
| Investment Company Act file number: | | 811-05029 |
| |
| Name of Registrant: | | Legg Mason Income Trust, Inc. |
| |
| Address of Principal Executive Offices: | | 100 Light Street, Baltimore, MD 21202 |
| |
| Name and address of agent for service: | | Richard M. Wachterman, Esq. |
| | Legg Mason & Co., LLC |
| | 100 Light Street |
| | Baltimore, MD 21202 |
| |
| Registrant’s telephone number, including area code: | | (410) 539-0000 |
| |
| Date of fiscal year-end: | | December 31, 2007 |
| |
| Date of reporting period: | | June 30, 2007 |
Item 1. Report to Shareholders.

Semi-Annual Report to Shareholders
To Our Shareholders,
We are pleased to provide you with Legg Mason Income Trust’s semi-annual report for the six months ended June 30, 2007, combining reports for the Legg Mason Core Bond Fund, Investment Grade Income Portfolio and Limited Duration Bond Portfolio.
The following table summarizes key statistics for the Primary Class of each portfolio, as of June 30, 2007:
| | | | | | | | |
| | | SEC YieldA | | | Average Life | | Net Asset Value
Per Share |
Core Bond | | 5.04 | % | | 9.67 years | | $ | 9.58 |
Investment Grade | | 5.41 | % | | 10.85 years | | $ | 10.27 |
Limited Duration | | 5.16 | % | | 3.55 years | | $ | 10.18 |
For the six-month period ended June 30, 2007, total returns for the Primary Class of shares of the Core Bond, Investment Grade and Limited Duration Portfolios were +0.47%, +0.90% and +1.84%, respectively. Total returns for the Institutional Class of shares of the Investment Grade and Limited Duration Portfolios were +1.15% and +2.19%, respectively.
The performance data quoted represents past performance and does not guarantee future results. The performance stated may have been due to extraordinary market conditions, which may not be duplicated in the future. Current performance may be lower or higher than the performance data quoted. To obtain the most recent month-end performance information for the Primary Class please visit www.leggmasonfunds.com; for the Institutional Class please call 1-888-425-6432. The investment return and principal value of the Funds will fluctuate so that an investor’s shares, when redeemed, may be worth more or less than the original cost. Calculations assume reinvestment of dividends and capital gain distributions. Performance would have been lower if fees had not been waived in various periods.
Information about the Fund’s performance over longer periods of time is shown in the Performance Information section within this report. For more information about the Fund share classes included in this report, please contact your financial advisor.
Since June 30, the U.S. fixed-income markets have experienced a period of extreme volatility which has negatively impacted market liquidity conditions. Initially, the concern on the part of market participants was limited to the subprime segment of the mortgage-backed market. However, these concerns have since broadened to include a wide range of financial institutions and markets. As a result, other fixed income instruments have experienced increased price volatility.
A | SEC yields are for the 30 days ended June 30, 2007. Yields are subject to change at any time. |
1
Semi-Annual Report to Shareholders
Many of our shareholders regularly add to their Primary Class Fund holdings by authorizing automatic, monthly transfers from their bank of $50 or more checking or brokerage accounts. Dollar cost averaging is a convenient and sensible way to invest, as it encourages continued purchases over time regardless of fluctuating price levels. Of course, it does not ensure a profit nor protect against declines in the value of your investment. Your financial advisor will be happy to help you establish a dollar cost averaging plan should you wish to do so.
Sincerely,
| | | | | | |
| | /s/ John F. Curley, Jr. | | | | /s/ Mark R. Fetting |
| | John F. Curley, Jr. | | | | Mark R. Fetting |
| | Chairman | | | | President |
July 26, 2007
2
Semi-Annual Report to Shareholders
Expense Example
Core Bond Fund
As a shareholder of the Fund, you incur ongoing costs, including management fees, distribution and service (12b-1) fees, and other Fund expenses. These examples are intended to help you understand your ongoing costs (in dollars) of investing in the Fund and to compare these costs with the ongoing costs of investing in other mutual funds. Each example is based on an investment of $1,000 invested on January 1, 2007, and held through June 30, 2007.
Actual Expenses
The first line in the table below provides information about actual account values and actual expenses for the Fund. You may use the information in this line, together with the amount you invested, to estimate the expenses that you paid over the period. Simply divide your account value by $1,000 (for example, an $8,600 account value divided by $1,000 = 8.6), then multiply the result by the number in the first line under the heading entitled “Expenses Paid During the Period” to estimate the expenses you paid on your account if your shares were held for the entire period.
Hypothetical Example for Comparison Purposes
The second line in the table below provides information about hypothetical account values and hypothetical expenses based on the Fund’s actual expense ratio and an assumed rate of return of 5% per year before expenses, which is not the Fund’s actual return. The hypothetical account values and expenses may not be used to estimate the actual ending account balance or expenses you paid for the period. You may use this information to compare the ongoing costs of investing in the Fund and other funds. To do so, compare these 5% hypothetical examples with the 5% hypothetical examples that appear in the shareholder reports of other funds.
| | | | | | | | | |
| | | Beginning Account Value 1/1/07 | | Ending Account Value 6/30/07 | | Expenses PaidA
During the Period 1/1/07 to 6/30/07 |
Primary Class: | | | | | | | | | |
Actual | | $ | 1,000.00 | | $ | 1,004.70 | | $ | 4.97 |
Hypothetical (5% return before expenses) | | | 1,000.00 | | | 1,019.84 | | | 5.01 |
A | These calculations are based on expenses incurred in the most recent fiscal half-year. The dollar amounts shown as “Expenses Paid” are equal to the annualized expense ratio of 1.00% multiplied by the average value over the period, multiplied by the number of days in the most recent fiscal half-year (181), and divided by 365. |
3
Semi-Annual Report to Shareholders
Performance Information
Core Bond Fund
The graph on the following page compares the Fund’s total returns to that of a closely matched broad-based securities market index. The graph illustrates the cumulative total return of an initial $10,000 investment in the Fund’s Primary Class shares, for the periods indicated. The line for the Fund represents the total return after deducting all Fund investment management and other administrative expenses and the transaction costs of buying and selling securities. The line representing the securities market index does not take into account any transaction costs associated with buying and selling securities in the index or other administrative expenses. Both the Fund’s and the index’s results assume reinvestment of all dividends and distributions.
Total return measures investment performance in terms of appreciation or depreciation in a fund’s net asset value per share, plus dividends and any capital gain distributions. It assumes that dividends and distributions were reinvested at the time they were paid. Average annual returns tend to smooth out variations in a fund’s return, so that they differ from actual year-to-year results.
4
Semi-Annual Report to Shareholders
Growth of a $10,000 Investment—Primary Class
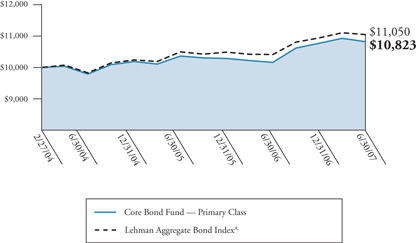
Periods Ended June 30, 2007
| | | | | | |
| | | Cumulative Total Return | | | Average Annual Total Return | |
One Year | | +6.50 | % | | +6.50 | % |
Life of Class* | | +8.23 | % | | +2.40 | % |
| * | Inception date: February 27, 2004 |
The performance data quoted represents past performance and does not guarantee future results. The performance stated may have been due to extraordinary market conditions, which may not be duplicated in the future. Current performance may be lower or higher than the performance data quoted. To obtain the most recent month-end performance information please visit www.leggmasonfunds.com. The investment return and principal value of the Fund will fluctuate so that an investor’s shares, when redeemed, may be worth more or less than the original cost. Calculations assume reinvestment of dividends and capital gain distributions. Performance would have been lower if fees had not been waived in various periods.
The graph and table do not reflect the deduction of taxes that a shareholder would pay on Fund distributions or the redemption of Fund shares.
A | A market value-weighted index that tracks the daily price, coupon, pay-downs, and total return performance of fixed rate, publicly placed, dollar-denominated, and nonconvertible investment grade debt issues with at least $100 million par amount outstanding and with at least one year to final maturity. Index returns are for the periods beginning February 29, 2004. |
5
Semi-Annual Report to Shareholders
Performance Information—Continued
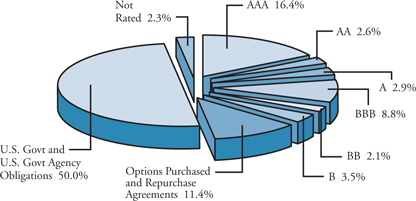
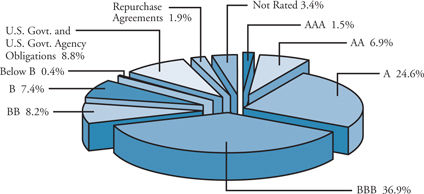
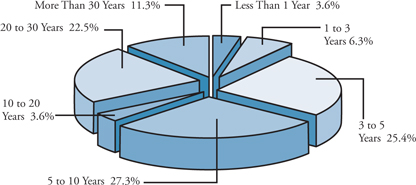
Portfolio Composition (as of June 30, 2007)B
Standard & Poor’s Debt RatingsC (as a percentage of the portfolio)
Maturity Schedule (as a percentage of the portfolio)

B | The Fund is actively managed. As a result, the composition of its portfolio holdings and sectors is subject to change at any time. |
C | Standard & Poor’s Ratings Services provide capital markets with credit ratings for the evaluation and assessment of credit risk. |
D | Preferred Stocks do not have a defined maturity date. |
6
Semi-Annual Report to Shareholders
Portfolio of Investments
Core Bond Fund
June 30, 2007 (Unaudited)
(Amounts in Thousands)
| | | | | | | | | | | | |
| | | Rate | | | Maturity Date | | Par/Shares | | Value | |
Long-Term Securities — 115.9% | | | | | | | | | | | | |
Corporate Bonds and Notes — 21.7% | | | | | | | | | | | | |
Aerospace and Defense—N.M. | | | | | | | | | | | | |
United Technologies Corp. | | 5.400 | % | | 5/1/35 | | $ | 20 | | $ | 18 | |
| | | | | | | | | | | | |
| | | | |
Airlines — 0.9% | | | | | | | | | | | | |
Delta Air Lines Inc. | | 6.619 | % | | 3/18/11 | | | 130 | | | 131 | |
JetBlue Airways Corp. | | 5.124 | % | | 8/15/16 | | | 274 | | | 274 | A |
JetBlue Airways Corp. | | 5.810 | % | | 11/15/16 | | | 300 | | | 302 | A |
| | | | | | | | | | | | |
| | | | | | | | | | | 707 | |
| | | | | | | | | | | | |
| | | | |
Automobiles — 1.4% | | | | | | | | | | | | |
DaimlerChrysler NA Holding Corp. | | 4.050 | % | | 6/4/08 | | | 95 | | | 94 | |
DaimlerChrysler NA Holding Corp. | | 7.200 | % | | 9/1/09 | | | 50 | | | 52 | |
General Motors Corp. | | 8.250 | % | | 7/15/23 | | | 1,000 | | | 911 | |
| | | | | | | | | | | | |
| | | | | | | | | | | 1,057 | |
| | | | | | | | | | | | |
| | | | |
Capital Markets — 0.7% | | | | | | | | | | | | |
Goldman Sachs Group LP | | 4.500 | % | | 6/15/10 | | | 70 | | | 68 | |
Lehman Brothers Holdings Inc. | | 5.250 | % | | 2/6/12 | | | 115 | | | 113 | |
Morgan Stanley | | 3.625 | % | | 4/1/08 | | | 30 | | | 30 | |
Morgan Stanley | | 5.625 | % | | 1/9/12 | | | 110 | | | 110 | |
Morgan Stanley | | 5.809 | % | | 10/18/16 | | | 40 | | | 40 | A |
The Bear Stearns Cos. Inc. | | 5.550 | % | | 1/22/17 | | | 150 | | | 142 | |
The Goldman Sachs Group Inc. | | 5.000 | % | | 1/15/11 | | | 40 | | | 39 | |
| | | | | | | | | | | | |
| | | | | | | | | | | 542 | |
| | | | | | | | | | | | |
| | | | |
Commercial Banks — 1.2% | | | | | | | | | | | | |
Bank One Corp. | | 2.625 | % | | 6/30/08 | | | 335 | | | 326 | |
Rabobank Capital Funding Trust II | | 5.260 | % | | 12/31/49 | | | 10 | | | 10 | B,C |
7
Semi-Annual Report to Shareholders
Portfolio of Investments—Continued
Core Bond Fund—Continued
| | | | | | | | | | | | |
| | | Rate | | | Maturity Date | | Par/Shares | | Value | |
Corporate Bonds and Notes—Continued | | | | | | | | | | | | |
Commercial Banks—Continued | | | | | | | | | | | | |
Rabobank Capital Funding Trust III | | 5.254 | % | | 10/21/49 | | $ | 20 | | $ | 19 | B,C |
SunTrust Capital VIII | | 6.100 | % | | 12/15/36 | | | 190 | | | 174 | C |
Wachovia Capital Trust III | | 5.800 | % | | 3/15/42 | | | 100 | | | 99 | C |
Wachovia Corp. | | 5.750 | % | | 6/15/17 | | | 170 | | | 168 | |
Wells Fargo Capital X | | 5.950 | % | | 12/15/36 | | | 100 | | | 93 | |
| | | | | | | | | | | | |
| | | | | | | | | | | 889 | |
| | | | | | | | | | | | |
| | | | |
Commercial Services and Supplies — 0.1% | | | | | | | | | | | | |
Waste Management Inc. | | 6.375 | % | | 11/15/12 | | | 85 | | | 87 | |
| | | | | | | | | | | | |
| | | | |
Consumer Finance — 3.6% | | | | | | | | | | | | |
American Express Co. | | 6.800 | % | | 9/1/66 | | | 40 | | | 41 | C |
Ford Motor Credit Co. | | 4.950 | % | | 1/15/08 | | | 40 | | | 40 | |
Ford Motor Credit Co. | | 6.625 | % | | 6/16/08 | | | 190 | | | 190 | |
Ford Motor Credit Co. | | 7.375 | % | | 10/28/09 | | | 590 | | | 586 | |
Ford Motor Credit Co. | | 7.375 | % | | 2/1/11 | | | 230 | | | 225 | |
Ford Motor Credit Co. | | 7.250 | % | | 10/25/11 | | | 210 | | | 202 | |
GMAC LLC | | 6.125 | % | | 8/28/07 | | | 230 | | | 230 | |
GMAC LLC | | 5.625 | % | | 5/15/09 | | | 685 | | | 670 | |
GMAC LLC | | 7.750 | % | | 1/19/10 | | | 110 | | | 111 | |
SLM Corp. | | 5.625 | % | | 8/1/33 | | | 490 | | | 382 | |
| | | | | | | | | | | | |
| | | | | | | | | | | 2,677 | |
| | | | | | | | | | | | |
| | | | |
Diversified Financial Services — 2.7% | | | | | | | | | | | | |
Air 2 US | | 8.027 | % | | 10/1/19 | | | 152 | | | 157 | B |
Bank of America Corp. | | 5.375 | % | | 8/15/11 | | | 160 | | | 159 | |
Citigroup Inc. | | 5.100 | % | | 9/29/11 | | | 230 | | | 226 | |
General Electric Capital Corp. | | 4.250 | % | | 1/15/08 | | | 70 | | | 70 | |
General Electric Capital Corp. | | 4.125 | % | | 9/1/09 | | | 90 | | | 88 | |
HSBC Finance Corp. | | 4.125 | % | | 11/16/09 | | | 225 | | | 218 | |
ILFC E-Capital Trust II | | 6.250 | % | | 12/21/65 | | | 20 | | | 19 | B,C |
Lilacs Repackaging 05-I | | 5.138 | % | | 1/15/64 | | | 490 | | | 470 | B |
Residential Capital Corp. | | 6.125 | % | | 11/21/08 | | | 50 | | | 50 | |
8
Semi-Annual Report to Shareholders
| | | | | | | | | | | | |
| | | Rate | | | Maturity Date | | Par/Shares | | Value | |
Corporate Bonds and Notes—Continued | | | | | | | | | | | | |
Diversified Financial Services—Continued | | | | | | | | | | | | |
Residential Capital Corp. | | 6.000 | % | | 2/22/11 | | $ | 290 | | $ | 281 | |
Residential Capital Corp. | | 6.500 | % | | 6/1/12 | | | 90 | | | 88 | |
Sigma Finance Inc. | | 8.000 | % | | 6/22/17 | | | 220 | | | 220 | B,D |
| | | | | | | | | | | | |
| | | | | | | | | | | 2,046 | |
| | | | | | | | | | | | |
| | | | |
Diversified Telecommunication Services — 0.2% | | | | | | | | | | | | |
AT&T Inc. | | 5.100 | % | | 9/15/14 | | | 90 | | | 86 | |
BellSouth Corp. | | 4.750 | % | | 11/15/12 | | | 10 | | | 9 | |
Verizon Global Funding Corp. | | 7.375 | % | | 9/1/12 | | | 35 | | | 38 | |
| | | | | | | | | | | | |
| | | | | | | | | | | 133 | |
| | | | | | | | | | | | |
| | | | |
Electric Utilities — 1.0% | | | | | | | | | | | | |
Duke Energy Corp. | | 6.250 | % | | 1/15/12 | | | 50 | | | 51 | |
Duke Energy Corp. | | 5.625 | % | | 11/30/12 | | | 90 | | | 90 | |
FirstEnergy Corp. | | 7.375 | % | | 11/15/31 | | | 105 | | | 114 | |
Pacific Gas and Electric Co. | | 6.050 | % | | 3/1/34 | | | 115 | | | 111 | |
Pacific Gas and Electric Co. | | 5.800 | % | | 3/1/37 | | | 20 | | | 19 | |
The Cleveland Electric Illuminating Co. | | 5.700 | % | | 4/1/17 | | | 5 | | | 5 | |
TXU Energy Co. | | 7.000 | % | | 3/15/13 | | | 320 | | | 330 | |
| | | | | | | | | | | | |
| | | | | | | | | | | 720 | |
| | | | | | | | | | | | |
| | | | |
Food and Staples Retailing — 0.9% | | | | | | | | | | | | |
CVS Lease Pass-Through Trust | | 6.036 | % | | 12/10/28 | | | 465 | | | 451 | B |
Wal-Mart Stores Inc. | | 3.375 | % | | 10/1/08 | | | 190 | | | 186 | |
| | | | | | | | | | | | |
| | | | | | | | | | | 637 | |
| | | | | | | | | | | | |
| | | | |
Gas Utilities—N.M. | | | | | | | | | | | | |
Southern Natural Gas Co. | | 5.900 | % | | 4/1/17 | | | 30 | | | 29 | B |
| | | | | | | | | | | | |
| | | | |
Health Care Providers and Services — 0.9% | | | | | | | | | | | | |
Cardinal Health Inc. | | 5.850 | % | | 12/15/17 | | | 160 | | | 155 | |
HCA Inc. | | 5.750 | % | | 3/15/14 | | | 615 | | | 521 | |
| | | | | | | | | | | | |
| | | | | | | | | | | 676 | |
| | | | | | | | | | | | |
9
Semi-Annual Report to Shareholders
Portfolio of Investments—Continued
Core Bond Fund—Continued
| | | | | | | | | | | | |
| | | Rate | | | Maturity Date | | Par/Shares | | Value | |
Corporate Bonds and Notes—Continued | | | | | | | | | | | | |
Independent Power Producers and Energy Traders — 0.4% | | | | | | | | | | | | |
TXU Corp. | | 5.550 | % | | 11/15/14 | | $ | 30 | | $ | 25 | |
TXU Corp. | | 6.500 | % | | 11/15/24 | | | 20 | | | 17 | |
TXU Corp. | | 6.550 | % | | 11/15/34 | | | 280 | | | 226 | |
| | | | | | | | | | | | |
| | | | | | | | | | | 268 | |
| | | | | | | | | | | | |
| | | | |
Insurance — 1.4% | | | | | | | | | | | | |
American International Group Inc. | | 6.250 | % | | 3/15/37 | | | 200 | | | 189 | |
ASIF Global Financing XIX | | 4.900 | % | | 1/17/13 | | | 20 | | | 19 | B |
MetLife Inc. | | 6.400 | % | | 12/15/36 | | | 470 | | | 435 | C |
The Travelers Cos. Inc. | | 6.250 | % | | 3/15/37 | | | 420 | | | 404 | C |
| | | | | | | | | | | | |
| | | | | | | | | | | 1,047 | |
| | | | | | | | | | | | |
| | | | |
IT Services—N.M. | | | | | | | | | | | | |
Electronic Data Systems Corp. | | 7.125 | % | | 10/15/09 | | | 10 | | | 10 | |
| | | | | | | | | | | | |
| | | | |
Leisure Equipment and Products — 0.7% | | | | | | | | | | | | |
Eastman Kodak Co. | | 7.250 | % | | 11/15/13 | | | 540 | | | 540 | |
| | | | | | | | | | | | |
| | | | |
Media — 0.8% | | | | | | | | | | | | |
Clear Channel Communications Inc. | | 4.625 | % | | 1/15/08 | | | 30 | | | 30 | |
Clear Channel Communications Inc. | | 4.250 | % | | 5/15/09 | | | 50 | | | 48 | |
Clear Channel Communications Inc. | | 6.250 | % | | 3/15/11 | | | 40 | | | 39 | |
Clear Channel Communications Inc. | | 5.500 | % | | 9/15/14 | | | 15 | | | 13 | |
Comcast Corp. | | 6.500 | % | | 1/15/15 | | | 170 | | | 174 | |
Comcast Corp. | | 6.500 | % | | 1/15/17 | | | 70 | | | 71 | |
Cox Communications Inc. | | 3.875 | % | | 10/1/08 | | | 70 | | | 69 | |
10
Semi-Annual Report to Shareholders
| | | | | | | | | | | | |
| | | Rate | | | Maturity Date | | Par/Shares | | Value | |
| | |
Corporate Bonds and Notes—Continued | | | | | | | | | | | | |
Media—Continued | | | | | | | | | | | | |
Time Warner Inc. | | 6.875 | % | | 5/1/12 | | $ | 75 | | $ | 78 | |
Time Warner Inc. | | 7.700 | % | | 5/1/32 | | | 75 | | | 81 | |
| | | | | | | | | | | | |
| | | | | | | | | | | 603 | |
| | | | | | | | | | | | |
| | | | |
Multi-Utilities — 0.2% | | | | | | | | | | | | |
Dominion Resources Inc. | | 4.750 | % | | 12/15/10 | | | 30 | | | 29 | |
Dominion Resources Inc. | | 5.700 | % | | 9/17/12 | | | 95 | | | 95 | |
| | | | | | | | | | | | |
| | | | | | | | | | | 124 | |
| | | | | | | | | | | | |
| | | | |
Multiline Retail — 0.2% | | | | | | | | | | | | |
Target Corp. | | 5.400 | % | | 10/1/08 | | | 155 | | | 155 | |
| | | | | | | | | | | | |
| | | | |
Oil, Gas and Consumable Fuels — 1.9% | | | | | | | | | | | | |
Anadarko Petroleum Corp. | | 5.760 | % | | 9/15/09 | | | 160 | | | 160 | A |
Anadarko Petroleum Corp. | | 6.450 | % | | 9/15/36 | | | 55 | | | 53 | |
Conoco Inc. | | 6.950 | % | | 4/15/29 | | | 90 | | | 98 | |
ConocoPhillips | | 4.750 | % | | 10/15/12 | | | 60 | | | 58 | |
Hess Corp. | | 7.875 | % | | 10/1/29 | | | 30 | | | 34 | |
Hess Corp. | | 7.300 | % | | 8/15/31 | | | 215 | | | 231 | |
Kerr-McGee Corp. | | 6.875 | % | | 9/15/11 | | | 300 | | | 312 | |
Kerr-McGee Corp. | | 6.950 | % | | 7/1/24 | | | 10 | | | 10 | |
Kinder Morgan Energy Partners LP | | 7.125 | % | | 3/15/12 | | | 65 | | | 68 | |
Kinder Morgan Energy Partners LP | | 5.000 | % | | 12/15/13 | | | 35 | | | 33 | |
Kinder Morgan Energy Partners LP | | 6.000 | % | | 2/1/17 | | | 100 | | | 98 | |
Pemex Project Funding Master Trust | | 6.625 | % | | 6/15/35 | | | 140 | | | 142 | |
XTO Energy Inc. | | 7.500 | % | | 4/15/12 | | | 145 | | | 156 | |
| | | | | | | | | | | | |
| | | | | | | | | | | 1,453 | |
| | | | | | | | | | | | |
| | | | |
Paper and Forest Products — 0.1% | | | | | | | | | | | | |
Weyerhaeuser Co. | | 6.750 | % | | 3/15/12 | | | 45 | | | 47 | |
| | | | | | | | | | | | |
11
Semi-Annual Report to Shareholders
Portfolio of Investments—Continued
Core Bond Fund—Continued
| | | | | | | | | | | |
| | | Rate | | | Maturity Date | | Par/Shares | | Value |
| |
Corporate Bonds and Notes—Continued | | | | | | | | | | | |
Pharmaceuticals — 0.1% | | | | | | | | | | | |
Wyeth | | 5.950 | % | | 4/1/37 | | $ | 110 | | $ | 105 |
| | | | | | | | | | | |
| | | | |
Thrifts and Mortgage Finance — 1.3% | | | | | | | | | | | |
Countrywide Financial Corp. | | 6.250 | % | | 5/15/16 | | | 600 | | | 590 |
Washington Mutual Bank | | 5.500 | % | | 1/15/13 | | | 220 | | | 215 |
Washington Mutual Inc. | | 5.250 | % | | 9/15/17 | | | 150 | | | 139 |
| | | | | | | | | | | |
| | | | | | | | | | | 944 |
| | | | | | | | | | | |
| | | | |
Tobacco — 0.2% | | | | | | | | | | | |
Altria Group Inc. | | 7.000 | % | | 11/4/13 | | | 155 | | | 164 |
| | | | | | | | | | | |
| | | | |
Wireless Telecommunication Services — 0.8% | | | | | | | | | | | |
Sprint Capital Corp. | | 8.375 | % | | 3/15/12 | | | 540 | | | 588 |
Sprint Capital Corp. | | 8.750 | % | | 3/15/32 | | | 30 | | | 34 |
Sprint Nextel Corp. | | 6.000 | % | | 12/1/16 | | | 10 | | | 9 |
| | | | | | | | | | | |
| | | | | | | | | | | 631 |
| | | | | | | | | | | |
| | | | |
Total Corporate Bonds and Notes | | | | | | | | | | | |
(Cost — $16,742) | | | | | | | | | | | 16,309 |
| | | | | | | | | | | |
| | | | |
Asset-Backed Securities — 2.6% | | | | | | | | | | | |
Fixed Rate Securities — 0.3% | | | | | | | | | | | |
Bank One Issuance Trust 2003-C1 | | 4.540 | % | | 9/15/10 | | | 200 | | | 199 |
| | | | | | | | | | | |
| | | | |
Indexed SecuritiesA — 1.7% | | | | | | | | | | | |
Ace Securities Corp. Home Equity Loan Trust, Series 2006-SL3 | | 5.420 | % | | 6/25/36 | | | 330 | | | 330 |
Bayview Financial Acquisition Trust 2004-C | | 5.740 | % | | 5/28/44 | | | 260 | | | 260 |
Brazos Higher Education Authority Inc. 2005-1 | | 5.376 | % | | 6/15/42 | | | 269 | | | 266 |
12
Semi-Annual Report to Shareholders
| | | | | | | | | | | | | |
| | | Rate | | | Maturity Date | | Par/Shares | | | Value | |
| | |
Asset-Backed Securities—Continued | | | | | | | | | | | | | |
Indexed Securities—Continued | | | | | | | | | | | | | |
Credit-Based Asset Servicing and Securitization 2005-RP1 | | 5.500 | % | | 1/25/35 | | $ | 22 | | | $ | 22 | B |
Lehman XS Trust 2007-8H A1 | | 5.450 | % | | 6/25/37 | | | 293 | | | | 298 | |
MSDWCC Heloc Trust 2005-1 | | 5.510 | % | | 7/25/17 | | | 31 | | | | 31 | |
Wachovia Asset Securitization Inc. 2002-HE1 | | 5.690 | % | | 9/27/32 | | | 61 | | | | 62 | |
| | | | | | | | | | | | | |
| | | | | | | | | | | | 1,269 | |
| | | | | | | | | | | | | |
| | | | |
Variable Rate SecuritiesD — 0.6% | | | | | | | | | | | | | |
Renaissance Home Equity Loan Trust 2007-2 AF5 | | 6.203 | % | | 6/25/37 | | | 460 | | | | 448 | |
| | | | | | | | | | | | | |
Total Asset-Backed Securities | | | | | | | | | | | | | |
(Cost — $1,928) | | | | | | | | | | | | 1,916 | |
| | | | | | | | | | | | | |
| | | | |
Mortgage-Backed Securities — 19.6% | | | | | | | | | | | | | |
Fixed Rate Securities — 5.9% | | | | | | | | | | | | | |
Asset Securitization Corp. 1996-D2 A1 | | 6.920 | % | | 2/14/29 | | | — | E | | | — | F |
Banc of America Commercial Mortgage Inc. 2005-3 A4 | | 4.668 | % | | 7/10/43 | | | 500 | | | | 465 | |
Banc of America Commercial Mortgage Inc. 2006-3 A4 | | 5.889 | % | | 7/10/44 | | | 370 | | | | 371 | |
Banc of America Commercial Mortgage Inc. 2007-1 A4 | | 5.451 | % | | 1/15/49 | | | 600 | | | | 580 | |
Countrywide Alternative Loan Trust 2004-2 CB | | 4.250 | % | | 3/25/34 | | | 177 | | | | 173 | |
GS Mortgage Securities Corp. II 2005-GG4 | | 4.680 | % | | 7/10/39 | | | 200 | | | | 191 | |
LB-UBS Commercial Mortgage Trust 2005-C3 A5 | | 4.739 | % | | 7/15/30 | | | 140 | | | | 131 | |
13
Semi-Annual Report to Shareholders
Portfolio of Investments—Continued
Core Bond Fund—Continued
| | | | | | | | | | | | |
| | | Rate | | | Maturity Date | | Par/Shares | | Value | |
| | |
Mortgage-Backed Securities—Continued | | | | | | | | | | | | |
Fixed Rate Securities—Continued | | | | | | | | | | | | |
LB-UBS Commercial Mortgage Trust 2005-C3 AAB | | 4.664 | % | | 7/15/30 | | $ | 200 | | $ | 191 | |
LB-UBS Commercial Mortgage Trust 2006-C7 A3 | | 5.347 | % | | 11/15/38 | | | 370 | | | 356 | |
MASTR Reperforming Loan Trust 2005-1 | | 7.000 | % | | 8/25/34 | | | 221 | | | 226 | B |
Morgan Stanley Capital I Series 2005-HQ6 | | 4.989 | % | | 8/13/42 | | | 240 | | | 228 | |
Prime Mortgage Trust 2006-DR1 2A1 | | 5.500 | % | | 5/25/35 | | | 936 | | | 916 | B |
Prime Mortgage Trust 2006-DR1 2A2 | | 6.000 | % | | 5/25/36 | | | 564 | | | 554 | B |
Washington Mutual MSC Mortgage Pass-Through Certificates Series 2004-RA1 | | 7.000 | % | | 3/25/34 | | | 65 | | | 66 | |
| | | | | | | | | | | | |
| | | | | | | | | | | 4,448 | |
| | | | | | | | | | | | |
| | | | |
Indexed SecuritiesA — 12.1% | | | | | | | | | | | | |
ABFS Mortgage Loan Trust 2003-2 | | 5.820 | % | | 4/25/34 | | | 56 | | | 56 | B |
Banc of America Funding Corp. 2005-E | | 5.729 | % | | 6/20/35 | | | 275 | | | 276 | |
Countrywide Alternative Loan Trust 2005-17 1A1 | | 5.580 | % | | 7/25/35 | | | 260 | | | 260 | |
Countrywide Alternative Loan Trust 2005-38 A3 | | 5.670 | % | | 9/25/35 | | | 259 | | | 260 | |
Countrywide Home Loans 2005-03 1A2 | | 5.610 | % | | 4/25/35 | | | 225 | | | 226 | |
Countrywide Home Loans 2005-09 1A1 | | 5.620 | % | | 5/25/35 | | | 221 | | | 221 | |
Countrywide Home Loans 2005-11 3A3 | | 6.271 | % | | 4/25/35 | | | 218 | | | 220 | |
14
Semi-Annual Report to Shareholders
| | | | | | | | | | | | |
| | | Rate | | | Maturity Date | | Par/Shares | | Value | |
| | |
Mortgage-Backed Securities—Continued | | | | | | | | | | | | |
Indexed Securities—Continued | | | | | | | | | | | | |
Countrywide Home Loans 2005-11 6A1 | | 5.620 | % | | 3/25/35 | | $ | 182 | | $ | 183 | |
DSLA Mortgage Loan Trust 2006-AR1 1A1A | | 5.947 | % | | 4/19/36 | | | 430 | | | 430 | |
Greenpoint Mortgage Funding Trust 2005-AR1 | | 5.540 | % | | 6/25/45 | | | 210 | | | 210 | |
Greenpoint Mortgage Funding Trust 2005-AR4 | | 5.580 | % | | 10/25/45 | | | 92 | | | 92 | |
GSMPS Mortgage Loan Trust 2005-RP2 | | 5.670 | % | | 3/25/35 | | | 247 | | | 246 | B |
Harborview Mortgage Loan Trust 2005-7 | | 6.226 | % | | 6/19/45 | | | 334 | | | 336 | |
Harborview Mortgage Loan Trust 2005-9 | | 5.660 | % | | 6/20/35 | | | 230 | | | 230 | |
IXIS Real Estate Capital Trust 2006-HE2 | | 5.380 | % | | 8/25/36 | | | 219 | | | 219 | |
Lehman XS Trust 2005-7N 1A1B | | 5.620 | % | | 12/25/35 | | | 225 | | | 226 | |
Lehman XS Trust 2006-GP2 1A1A | | 5.390 | % | | 6/25/46 | | | 454 | | | 454 | |
Structured Asset Mortgage Investments Inc. 2006-AR7 A1A | | 5.530 | % | | 8/25/36 | | | 539 | | | 539 | |
Thornburg Mortgage Securities Trust 2005-2 A1 | | 5.540 | % | | 7/25/45 | | | 133 | | | 134 | |
Thornburg Mortgage Securities Trust 2005-2 A2 | | 5.550 | % | | 7/25/45 | | | 322 | | | 322 | |
Thornburg Mortgage Securities Trust 2005-4 A4 | | 5.520 | % | | 12/25/35 | | | 537 | | | 537 | |
WaMu Mortgage Pass Through Certificates, Series 2007-0A5 1A | | 5.779 | % | | 6/25/47 | | | 689 | | | 689 | |
15
Semi-Annual Report to Shareholders
Portfolio of Investments—Continued
Core Bond Fund—Continued
| | | | | | | | | | | | |
| | | Rate | | | Maturity Date | | Par/Shares | | Value | |
| | |
Mortgage-Backed Securities—Continued | | | | | | | | | | | | |
Indexed Securities—Continued | | | | | | | | | | | | |
WaMu Mortgage Pass-Through Certificates, Series 2005-AR06 2A1A | | 5.550 | % | | 4/25/45 | | $ | 213 | | $ | 213 | |
WaMu Mortgage Pass-Through Certificates, Series 2005-AR08 1A1A | | 5.590 | % | | 7/25/45 | | | 179 | | | 179 | |
WaMu Mortgage Pass-Through Certificates, Series 2005-AR11 | | 5.640 | % | | 8/25/45 | | | 582 | | | 583 | |
WaMu Mortgage Pass-Through Certificates, Series 2005-AR13 A1A1 | | 5.610 | % | | 10/25/45 | | | 275 | | | 276 | |
WaMu Mortgage Pass-Through Certificates, Series 2005-AR19 A1A2 | | 5.610 | % | | 12/25/45 | | | 353 | | | 354 | |
WaMu Mortgage Pass-Through Certificates, Series, 2007-0A5 A1B | | 5.869 | % | | 5/25/47 | | | 700 | | | 699 | |
Zuni Mortgage Loan Trust 2006-OA1 | | 5.450 | % | | 8/25/36 | | | 372 | | | 372 | |
| | | | | | | | | | | | |
| | | | | | | | | | | 9,042 | |
| | | | | | | | | | | | |
| | | | |
Stripped Securities — 0.5% | | | | | | | | | | | | |
GE Capital Commercial Mortgage Corp. 2005-C4 | | 5.333 | % | | 11/10/45 | | | 360 | | | 350 | G1 |
Mach One Trust, Commercial Mortgage-Backed Securities 2004-1A | | 1.589 | % | | 5/28/40 | | | 1,172 | | | 39 | B,G1,I |
| | | | | | | | | | | | |
| | | | | | | | | | | 389 | |
| | | | | | | | | | | | |
16
Semi-Annual Report to Shareholders
| | | | | | | | | | | | |
| | | Rate | | | Maturity Date | | Par/Shares | | Value | |
| | |
Mortgage-Backed Securities—Continued | | | | | | | | | | | | |
Variable Rate SecuritiesD — 1.1% | | | | | | | | | | | | |
Bear Stearns ARM Trust, Mortgage Pass-Through Certificates, Series 2004-4 | | 3.517 | % | | 6/25/34 | | $ | 200 | | $ | 196 | |
Credit-Based Asset Servicing and Securitization 1999-3 | | 6.630 | % | | 1/3/29 | | | 51 | | | 49 | B |
IndyMac INDX Mortgage Loan Trust 2005-AR15 | | 5.099 | % | | 9/25/35 | | | 123 | | | 119 | |
JPMorgan Chase Commercial Mortgage Securities Corp., Series 2005-CB13 | | 5.472 | % | | 1/12/43 | | | 100 | | | 97 | |
JPMorgan Chase Commercial Mortgage Securities Corp., Series 2005-LDP4 | | 4.918 | % | | 10/15/42 | | | 200 | | | 188 | |
Merrill Lynch/Countrywide Commercial Mortgage 2007-6 A4 | | 5.485 | % | | 3/12/51 | | | 200 | | | 194 | |
| | | | | | | | | | | | |
| | | | | | | | | | | 843 | |
| | | | | | | | | | | | |
Total Mortgage-Backed Securities | | | | | | | | | | | | |
(Cost — $14,895) | | | | | | | | | | | 14,722 | |
| | | | | | | | | | | | |
| | | | |
U.S. Government and Agency Obligations — 16.7% | | | | | | | | | | | | |
Fixed Rate Securities — 11.1% | | | | | | | | | | | | |
Fannie Mae | | 6.625 | % | | 9/15/09 | | | 160 | | | 165 | |
Fannie Mae | | 5.200 | % | | 11/8/10 | | | 170 | | | 169 | |
Fannie Mae | | 5.625 | % | | 5/19/11 | | | 290 | | | 291 | |
Fannie Mae | | 4.610 | % | | 10/10/13 | | | 560 | | | 534 | |
Federal Home Loan Bank | | 3.875 | % | | 8/22/08 | | | 120 | | | 118 | |
Federal Home Loan Bank | | 5.400 | % | | 1/2/09 | | | 130 | | | 130 | |
Freddie Mac | | 4.750 | % | | 1/18/11 | | | 110 | | | 108 | |
Freddie Mac | | 5.250 | % | | 2/24/11 | | | 160 | | | 159 | |
Freddie Mac | | 5.625 | % | | 3/15/11 | | | 40 | | | 40 | |
Freddie Mac | | 4.650 | % | | 10/10/13 | | | 600 | | | 573 | |
Freddie Mac | | 5.450 | % | | 11/21/13 | | | 180 | | | 178 | |
17
Semi-Annual Report to Shareholders
Portfolio of Investments—Continued
Core Bond Fund—Continued
| | | | | | | | | | | | |
| | | Rate | | | Maturity Date | | Par/Shares | | Value | |
| | |
U.S. Government and Agency Obligations—Continued | | | | | | | | | | | | |
Fixed Rate Securities—Continued | | | | | | | | | | | | |
Freddie Mac | | 5.300 | % | | 5/12/20 | | $ | 690 | | $ | 659 | |
Freddie Mac | | 5.625 | % | | 11/23/35 | | | 210 | | | 196 | |
United States Treasury Bonds | | 4.500 | % | | 2/15/36 | | | 455 | | | 412 | |
United States Treasury Bonds | | 4.750 | % | | 2/15/37 | | | 1,830 | | | 1,725 | |
United States Treasury Notes | | 3.750 | % | | 5/15/08 | | | 40 | | | 40 | |
United States Treasury Notes | | 4.500 | % | | 3/31/09 | | | 60 | | | 60 | |
United States Treasury Notes | | 4.750 | % | | 2/15/10 | | | 310 | | | 309 | |
United States Treasury Notes | | 4.125 | % | | 8/15/10 | | | 100 | | | 98 | |
United States Treasury Notes | | 4.625 | % | | 10/31/11 | | | 1,200 | | | 1,186 | |
United States Treasury Notes | | 4.625 | % | | 12/31/11 | | | 150 | | | 148 | |
United States Treasury Notes | | 4.500 | % | | 3/31/12 | | | 240 | | | 236 | |
United States Treasury Notes | | 4.500 | % | | 4/30/12 | | | 290 | | | 285 | |
United States Treasury Notes | | 4.250 | % | | 8/15/14 | | | 560 | | | 536 | |
United States Treasury Notes | | 5.125 | % | | 5/15/16 | | | 13 | | | 13 | |
| | | | | | | | | | | | |
| | | | | | | | | | | 8,368 | |
| | | | | | | | | | | | |
| | | | |
Stripped Securities — 0.3% | | | | | | | | | | | | |
United States Treasury Bonds | | 0.000 | % | | 11/15/21 | | | 420 | | | 198 | G2 |
United States Treasury Strip Principal | | 0.000 | % | | 5/15/30 | | | 100 | | | 31 | G2 |
| | | | | | | | | | | | |
| | | | | | | | | | | 229 | |
| | | | | | | | | | | | |
| | | | |
Treasury Inflation-Protected SecuritiesJ — 5.3% | | | | | | | | | | | | |
United States Treasury Inflation-Protected Security | | 3.875 | % | | 1/15/09 | | | 25 | | | 26 | |
United States Treasury Inflation-Protected Security | | 2.000 | % | | 1/15/14 | | | 73 | | | 70 | |
United States Treasury Inflation-Protected Security | | 1.875 | % | | 7/15/15 | | | 159 | | | 150 | |
United States Treasury Inflation-Protected Security | | 2.000 | % | | 1/15/16 | | | 396 | | | 376 | |
United States Treasury Inflation-Protected Security | | 2.375 | % | | 1/15/17 | | | 871 | | | 850 | |
United States Treasury Inflation-Protected Security | | 2.375 | % | | 1/15/25 | | | 565 | | | 543 | |
18
Semi-Annual Report to Shareholders
| | | | | | | | | | | | |
| | | Rate | | | Maturity Date | | Par/Shares | | Value | |
| | |
U.S. Government and Agency Obligations—Continued | | | | | | | | | | | | |
Treasury Inflation-Protected Securities—Continued | | | | | | | | | | | | |
United States Treasury Inflation-Protected Security | | 2.000 | % | | 1/15/26 | | $ | 604 | | $ | 547 | |
United States Treasury Inflation-Protected Security | | 2.375 | % | | 1/15/27 | | | 1,066 | | | 1,023 | |
United States Treasury Inflation-Protected Security | | 3.875 | % | | 4/15/29 | | | 277 | | | 334 | |
United States Treasury Inflation-Protected Security | | 3.375 | % | | 4/15/32 | | | 58 | | | 67 | |
| | | | | | | | | | | | |
| | | | | | | | | | | 3,986 | |
| | | | | | | | | | | | |
Total U.S. Government and Agency Obligations | | | | | | | | | | | | |
(Cost — $12,865) | | | | | | | | | | | 12,583 | |
| | | | | | | | | | | | |
| | | | |
U.S. Government Agency Mortgage-Backed Securities — 48.5% | | | | | | | | | | | | |
Fixed Rate Securities — 47.5% | | | | | | | | | | | | |
Fannie Mae | | 5.500 | % | | 12/1/17 to 4/1/36 | | | 1,390 | | | 1,346 | |
Fannie Mae | | 5.000 | % | | 10/1/20 to 3/1/36 | | | 1,934 | | | 1,853 | |
Fannie Mae | | 6.000 | % | | 8/1/21 to 9/1/36 | | | 3,896 | | | 3,868 | |
Fannie Mae | | 5.500 | % | | 12/1/22 to 12/1/37 | | | 3,380 | | | 3,266 | K |
Fannie Mae | | 6.000 | % | | 12/1/22 to 12/1/37 | | | 3,100 | | | 3,063 | K |
Fannie Mae | | 4.500 | % | | 9/1/35 | | | 89 | | | 81 | |
Fannie Mae | | 5.000 | % | | 12/1/37 | | | 12,050 | | | 11,280 | K |
Fannie Mae | | 6.500 | % | | 12/1/37 | | | 4,790 | | | 4,833 | K |
Freddie Mac | | 4.500 | % | | 4/1/19 | | | 256 | | | 243 | |
Freddie Mac | | 5.000 | % | | 7/1/20 to 9/1/35 | | | 1,244 | | | 1,196 | |
Government National Mortgage Association | | 6.000 | % | | 11/15/28 to 12/15/33 | | | 635 | | | 633 | |
Government National Mortgage Association | | 6.500 | % | | 2/15/32 | | | 226 | | | 230 | |
Government National Mortgage Association | | 5.000 | % | | 8/15/33 to 5/15/34 | | | 834 | | | 790 | |
19
Semi-Annual Report to Shareholders
Portfolio of Investments—Continued
Core Bond Fund—Continued
| | | | | | | | | | | | |
| | | Rate | | | Maturity Date | | Par/Shares | | Value | |
| | |
U.S. Government Agency Mortgage-Backed Securities—Continued | | | | | | | | | | | | |
Fixed Rate Securities—Continued | | | | | | | | | | | | |
Government National Mortgage Association | | 5.500 | % | | 2/15/35 | | $ | 2,418 | | $ | 2,349 | |
Government National Mortgage Association | | 6.500 | % | | 12/1/37 | | | 700 | | | 711 | K |
| | | | | | | | | | | | |
| | | | | | | | | | | 35,742 | |
| | | | | | | | | | | | |
| | | | |
Indexed SecuritiesA — 1.0% | | | | | | | | | | | | |
Freddie Mac | | 5.920 | % | | 4/1/37 | | | 745 | | | 748 | |
| | | | | | | | | | | | |
Total U.S. Government Agency Mortgage-Backed Securities | | | | | | | | | | | | |
(Cost — $37,007) | | | | | | | | | | | 36,490 | |
| | | | | | | | | | | | |
| | | | |
Yankee BondsL — 6.5% | | | | | | | | | | | | |
Commercial Banks — 2.6% | | | | | | | | | | | | |
BNP Paribas NY | | 6.875 | % | | 3/1/09 | | | 110 | | | 112 | |
Eksportfinans ASA | | 5.500 | % | | 5/25/16 | | | 160 | | | 161 | |
Glitnir Banki Hf | | 6.330 | % | | 7/28/11 | | | 130 | | | 132 | B |
Glitnir Banki Hf | | 6.693 | % | | 6/15/16 | | | 120 | | | 124 | B,C |
Kaupthing Bank Hf | | 6.045 | % | | 4/12/11 | | | 270 | | | 272 | A,B |
Kaupthing Bank Hf | | 7.125 | % | | 5/19/16 | | | 440 | | | 465 | B |
Landsbanki Islands Hf | | 6.100 | % | | 8/25/11 | | | 230 | | | 233 | B |
Resona Preferred Global Securities | | 7.191 | % | | 7/30/49 | | | 140 | | | 143 | B,C |
RSHB Capital SA | | 6.299 | % | | 5/15/17 | | | 190 | | | 186 | B |
Shinsei Finance Cayman Ltd. | | 6.418 | % | | 7/20/49 | | | 100 | | | 97 | B,C |
| | | | | | | | | | | | |
| | | | | | | | | | | 1,925 | |
| | | | | | | | | | | | |
| | | | |
Diversified Financial Services — 0.8% | | | | | | | | | | | | |
Banagricola DPR Funding Ltd. | | 5.800 | % | | 3/15/10 | | | 139 | | | 139 | A,B |
MUFG Capital Finance 1 Ltd. | | 6.346 | % | | 7/29/49 | | | 100 | | | 98 | C |
SMFG Preferred Capital | | 6.078 | % | | 1/29/49 | | | 250 | | | 241 | B,C |
TNK-BP Finance SA | | 7.500 | % | | 7/18/16 | | | 140 | | | 144 | B |
| | | | | | | | | | | | |
| | | | | | | | | | | 622 | |
| | | | | | | | | | | | |
20
Semi-Annual Report to Shareholders
| | | | | | | | | | | | |
| | | Rate | | | Maturity Date | | Par/Shares | | Value | |
| | |
Yankee Bonds—Continued | | | | | | | | | | | | |
Diversified Telecommunication Services — 0.5% | | | | | | | | | | | | |
British Telecommunications PLC | | 8.625 | % | | 12/15/10 | | $ | 100 | | $ | 109 | |
Deutsche Telekom International Finance BV | | 5.750 | % | | 3/23/16 | | | 75 | | | 73 | |
Koninklijke (Royal) KPN NV | | 8.000 | % | | 10/1/10 | | | 80 | | | 86 | |
Telecom Italia Capital SpA | | 4.950 | % | | 9/30/14 | | | 70 | | �� | 65 | |
Telecom Italia Capital SpA | | 5.250 | % | | 10/1/15 | | | 20 | | | 18 | |
| | | | | | | | | | | | |
| | | | | | | | | | | 351 | |
| | | | | | | | | | | | |
| | | | |
Foreign Government — 0.6% | | | | | | | | | | | | |
Russian Federation | | 7.500 | % | | 3/31/30 | | | 51 | | | 56 | B |
United Mexican States | | 5.625 | % | | 1/15/17 | | | 4 | | | 4 | |
United Mexican States | | 6.750 | % | | 9/27/34 | | | 346 | | | 369 | |
| | | | | | | | | | | | |
| | | | | | | | | | | 429 | |
| | | | | | | | | | | | |
| | | | |
Gas Utilities — 0.2% | | | | | | | | | | | | |
Intergas Finance BV | | 6.375 | % | | 5/14/17 | | | 187 | | | 179 | B |
| | | | | | | | | | | | |
| | | | |
Industrial Conglomerates — 0.8% | | | | | | | | | | | | |
Tyco International Group SA | | 6.125 | % | | 11/1/08 | | | 10 | | | 10 | |
Tyco International Group SA | | 6.750 | % | | 2/15/11 | | | 40 | | | 42 | |
Tyco International Group SA | | 6.375 | % | | 10/15/11 | | | 75 | | | 77 | |
Tyco International Group SA | | 6.000 | % | | 11/15/13 | | | 100 | | | 103 | |
Tyco International Group SA | | 6.875 | % | | 1/15/29 | | | 310 | | | 358 | |
| | | | | | | | | | | | |
| | | | | | | | | | | 590 | |
| | | | | | | | | | | | |
| | | | |
Metals and Mining — 0.2% | | | | | | | | | | | | |
Vale Overseas Ltd. | | 6.875 | % | | 11/21/36 | | | 180 | | | 181 | |
| | | | | | | | | | | | |
| | | | |
Oil, Gas and Consumable Fuels — 0.8% | | | | | | | | | | | | |
Anadarko Finance Co. | | 7.500 | % | | 5/1/31 | | | 5 | | | 5 | |
ChevronTexaco Capital Co. | | 3.500 | % | | 9/17/07 | | | 140 | | | 140 | |
Conoco Funding Co. | | 6.350 | % | | 10/15/11 | | | 10 | | | 10 | |
Gazprom | | 6.212 | % | | 11/22/16 | | | 170 | | | 166 | B |
21
Semi-Annual Report to Shareholders
Portfolio of Investments—Continued
Core Bond Fund—Continued
| | | | | | | | | | | | | |
| | | Rate | | | Maturity Date | | Par/Shares | | | Value | |
| | |
Yankee Bonds—Continued | | | | | | | | | | | | | |
Oil, Gas and Consumable Fuels—Continued | | | | | | | | | | | | | |
Gazprom | | 6.510 | % | | 3/7/22 | | $ | 190 | | | $ | 188 | B |
Petrobras International Finance Co. | | 6.125 | % | | 10/6/16 | | | 130 | | | | 127 | |
| | | | | | | | | | | | | |
| | | | | | | | | | | | 636 | |
| | | | | | | | | | | | | |
Total Yankee Bonds | | | | | | | | | | | | | |
(Cost — $4,899) | | | | | | | | | | | | 4,913 | |
| | | | | | | | | | | | | |
| | | | |
Preferred Stocks — 0.3% | | | | | | | | | | | | | |
Fannie Mae | | 5.375 | % | | | | | — | E | | | 99 | M |
General Motors Corp. | | 5.250 | % | | | | | 7 | | | | 146 | M |
| | | | | | | | | | | | | |
Total Preferred Stocks | | | | | | | | | | | | | |
(Cost — $213) | | | | | | | | | | | | 245 | |
| | | | | | | | | | | | | |
Total Long-Term Securities (Cost — $88,549) | | | | | | | | | | | | 87,178 | |
| | |
Short-Term Securities — 15.3% | | | | | | | | | | | | | |
U.S. Government and Agency Obligations — 0.3% | | | | | | | | | | | | | |
Fannie Mae | | 0.000 | % | | 3/17/08 | | $ | 255 | | | | 246 | N,O |
| | | | | | | | | | | | | |
Options PurchasedP — 0.2% | | | | | | | | | | | | | |
Eurodollar Futures Call, December 2007, Strike Price $94.00 | | | | | | | | 16 | Q | | | 28 | |
Eurodollar Futures Call, September 2007, Strike Price $94.00 | | | | | | | | 57 | Q | | | 95 | |
Eurodollar Futures Call, September 2007, Strike Price $94.50 | | | | | | | | 19 | Q | | | 8 | |
Eurodollar Futures Call, September 2007, Strike Price $94.75 | | | | | | | | 10 | Q | | | 1 | |
22
Semi-Annual Report to Shareholders
| | | | | | | | | | | | |
| | | Rate | | Maturity Date | | Par/Shares | | | Value | |
| | |
Options Purchased—Continued | | | | | | | | | | | | |
Eurodollar Futures Put, September 2007, Strike Price $94.00 | | | | | | | 2 | Q | | $ | — | F |
U.S. Treasury Note Futures Call, August 2007, Strike Price $103.00 | | | | | | | 18 | Q | | | 22 | |
U.S. Treasury Note Futures Call, August 2007, Strike Price $104.50 | | | | | | | 4 | Q | | | 1 | |
| | | | | | | | | | | | |
| | | | | | | | | | | 155 | |
| | | | | | | | | | | | |
Repurchase Agreements — 14.8% | | | | | | | | | | | | |
Deutsche Bank AG | | | | | | | | | | | | |
5.2%, dated 6/29/07, to be repurchased at $5,558 on 7/2/07 (Collateral: $6,043 Freddie Mac notes, 5.0%, due 12/14/18 value $5,667) | | | | | | $ | 5,556 | | | | 5,556 | |
Merrill Lynch Government Securities Inc. | | | | | | | | | | | | |
5.15%, dated 6/29/07, to be repurchased at $5,557 on 7/2/07 (Collateral: $21,182 Fannie Mae zero-coupon bonds, due 11/15/30, value $5,666) | | | | | | | 5,555 | | | | 5,555 | |
| | | | | | | | | | | | |
| | | | | | | | | | | 11,111 | |
| | | | | | | | | | | | |
Total Short-Term Securities (Cost — $11,574) | | | | | | | | | | | 11,512 | |
| | |
Total Investments — 131.2% (Cost — $100,123)R | | | | | | | | | | | 98,690 | |
Other Assets Less Liabilities — (31.2)% | | | | | | | | | | | (23,485 | ) |
| | | | | | | | | | | | |
Net Assets — 100.0% | | | | | | | | | | $ | 75,205 | |
| | | | | | | | | | | | |
23
Semi-Annual Report to Shareholders
Portfolio of Investments—Continued
Core Bond Fund—Continued
| | | | | | | | |
| | | Expiration | | Actual
Contracts | | Appreciation/
(Depreciation) | |
| | |
Futures Contracts PurchasedP | | | | | | | | |
Eurodollar Futures | | September 2007 | | 8 | | $ | (3 | ) |
Eurodollar Futures | | December 2007 | | 37 | | | (11 | ) |
Eurodollar Futures | | March 2008 | | 34 | | | (2 | ) |
U.S. Treasury Bond Futures | | September 2007 | | 15 | | | 15 | |
U.S. Treasury Note Futures | | September 2007 | | 117 | | | (51 | ) |
| | | | | | | | |
| | | | | | $ | (52 | ) |
| | | | | | | | |
| | | |
Futures Contracts WrittenP | | | | | | | | |
U.S. Treasury Note Futures | | September 2007 | | 98 | | | (5 | ) |
U.S. Treasury Note Futures | | December 2007 | | 1 | | | (1 | ) |
| | | | | | | | |
| | | | | | $ | (6 | ) |
| | | | | | | | |
| | | |
Options WrittenP | | | | | | | | |
Eurodollar Futures Call, Strike Price $95.00 | | September 2007 | | 3 | | | — | F |
Eurodollar Futures Call, Strike Price $95.00 | | March 2008 | | 11 | | | (1 | ) |
Eurodollar Futures Call, Strike Price $95.25 | | September 2007 | | 21 | | | 5 | |
Eurodollar Futures Call, Strike Price $95.50 | | December 2007 | | 8 | | | 1 | |
Eurodollar Futures Put, Strike Price $94.75 | | September 2007 | | 15 | | | (2 | ) |
U.S. Treasury Bond Futures Call, Strike Price $108.00 | | July 2007 | | 5 | | | (2 | ) |
U.S. Treasury Bond Futures Call, Strike Price $109.00 | | August 2007 | | 37 | | | (9 | ) |
U.S. Treasury Bond Futures Call, Strike Price $110.00 | | August 2007 | | 2 | | | — | F |
U.S. Treasury Bond Futures Call, Strike Price $108.00 | | November 2007 | | 5 | | | (1 | ) |
U.S. Treasury Bond Futures Call, Strike Price $112.00 | | August 2007 | | 5 | | | 1 | |
U.S. Treasury Bond Futures Call, Strike Price $114.00 | | August 2007 | | 1 | | | — | F |
24
Semi-Annual Report to Shareholders
| | | | | | | | |
| | | Expiration | | Actual
Contracts | | Appreciation/
(Depreciation) | |
| | |
Options Written—Continued | | | | | | | | |
U.S. Treasury Bond Futures Call, Strike Price $115.00 | | August 2007 | | 2 | | $ | 1 | |
U.S. Treasury Bond Futures Put, Strike Price $104.00 | | August 2007 | | 5 | | | 1 | |
U.S. Treasury Bond Futures Put, Strike Price $105.00 | | August 2007 | | 20 | | | 6 | |
U.S. Treasury Note Futures Call, Strike Price $104.00 | | August 2007 | | 3 | | | — | F |
U.S. Treasury Note Futures Call, Strike Price $105.00 | | August 2007 | | 2 | | | — | F |
U.S. Treasury Note Futures Call, Strike Price $106.00 | | July 2007 | | 12 | | | (1 | ) |
U.S. Treasury Note Futures Call, Strike Price $106.00 | | August 2007 | | 34 | | | (8 | ) |
U.S. Treasury Note Futures Call, Strike Price $106.00 | | November 2007 | | 6 | | | (2 | ) |
U.S. Treasury Note Futures Call, Strike Price $107.00 | | August 2007 | | 8 | | | — | F |
U.S. Treasury Note Futures Call, Strike Price $107.00 | | November 2007 | | 28 | | | (6 | ) |
U.S. Treasury Note Futures Call, Strike Price $108.00 | | August 2007 | | 4 | | | — | F |
U.S. Treasury Note Futures Call, Strike Price $108.00 | | November 2007 | | 18 | | | — | F |
U.S. Treasury Bond Futures Call, Strike Price $108.00 | | August 2007 | | 3 | | | (1 | ) |
U.S. Treasury Note Futures Call, Strike Price $109.00 | | August 2007 | | 17 | | | 9 | |
U.S. Treasury Note Futures Call, Strike Price $110.00 | | August 2007 | | 16 | | | 5 | |
U.S. Treasury Note Futures Put, Strike Price $102.00 | | August 2007 | | 3 | | | — | F |
U.S. Treasury Note Futures Put, Strike Price $102.00 | | November 2007 | | 5 | | | 1 | |
25
Semi-Annual Report to Shareholders
Portfolio of Investments—Continued
Core Bond Fund—Continued
| | | | | | | | |
| | | Expiration | | Actual
Contracts | | Appreciation/
(Depreciation) | |
| | |
Options Written—Continued | | | | | | | | |
U.S. Treasury Note Futures Put, Strike Price $103.00 | | August 2007 | | 6 | | $ | 3 | |
U.S. Treasury Note Futures Put, Strike Price $103.00 | | November 2007 | | 3 | | | — | F |
U.S. Treasury Note Futures Put, Strike Price $104.00 | | July 2007 | | 8 | | | 2 | |
U.S. Treasury Note Futures Put, Strike Price $104.00 | | August 2007 | | 14 | | | 4 | |
U.S. Treasury Notes Futures Put, Strike Price $104.00 | | November 2007 | | 2 | | | — | F |
| | | | | | | | |
| | | | | | $ | 6 | |
| | | | | | | | |
N.M. — Not Meaningful.
A | Indexed Security—The rates of interest earned on these securities are tied to the London Interbank Offered Rate (“LIBOR”), the Consumer Price Index (“CPI”), or the one-year Treasury Bill Rate. The coupon rates are the rates as of June 30, 2007. |
B | Rule 144a Security—A security purchased pursuant to Rule 144a under the Securities Act of 1933 which may not be resold subject to that rule except to qualified institutional buyers. These securities, which the Fund’s investment adviser has determined to be liquid, represent 8.33% of net assets. |
C | Stepped Coupon Security—A security with a predetermined schedule of interest or dividend rate changes at which time it begins to accrue interest or pay dividends according to the predetermined schedule. |
D | The coupon rates shown on variable rate securities are the rates at June 30, 2007. These rates vary with the weighted average coupon of the underlying loans. |
E | Amount represents less than 0.50 Par/Shares. |
F | Amount represents less than $1. |
G | Stripped Security—Security with interest-only or principal-only payment streams, denoted by a 1 or 2, respectively. For interest-only securities, the amount shown as principal is the notional balance used to calculate the amount of interest due. |
I | Illiquid security valued at fair value under the procedures approved by the Board of Directors. |
J | Treasury Inflation-Protected Security—Treasury security whose principal value is adjusted daily in accordance with changes to the Consumer Price Index for All Urban Consumers. Interest is calculated on the basis of the current adjusted principal value. |
K | When-issued Security—Security purchased on a delayed delivery basis. Final settlement amount and maturity date have not yet been announced. |
L | Yankee Bond—A dollar-denominated bond issued in the U.S. by foreign entities. |
M | Convertible Security—Security may be converted into the issuer’s common stock. |
N | Zero coupon bond—A bond with no periodic interest payments which is sold at such a discount as to produce a current yield to maturity. |
26
Semi-Annual Report to Shareholders
O | All or a portion of this security is collateral to cover futures and options contracts written. |
P | Options and futures are described in more detail in the notes to financial statements. |
Q | Par represents actual number of contracts. |
R | Aggregate cost for the federal income tax purposes is substantially the same as book cost. At June 30, 2007, the aggregate gross unrealized appreciation and depreciation of investments for federal income tax purposes was substantially as follows: |
| | | | |
Gross unrealized appreciation | | $ | 223 | |
Gross unrealized depreciation | | $ | (1,656 | ) |
| | | | |
Net unrealized appreciation/(depreciation) | | $ | (1,433 | ) |
| | | | |
See notes to financial statements.
27
Semi-Annual Report to Shareholders
Statement of Assets and Liabilities
Core Bond Fund
June 30, 2007 (Unaudited)
(Amounts in Thousands)
| | | | | | | |
| | | | | | | | |
Assets: | | | | | | | |
Investment securities at market value (cost – $ 88,549) | | | | | $ | 87,178 | |
Short-term securities at value (cost – $ 11,574) | | | | | | 11,512 | |
Cash | | | | | | 2 | |
Receivable for securities sold | | | | | | 10,381 | |
Interest and dividends receivable | | | | | | 622 | |
Receivable for fund shares sold | | | | | | 295 | |
Futures variation margin receivable | | | | | | 12 | |
| | | | | | | |
Total assets | | | | | | 110,002 | |
| | |
Liabilities: | | | | | | | |
Payable for securities purchased | | $ | 34,277 | | | | |
Income distribution payable | | | 134 | | | | |
Payable for fund shares repurchased | | | 125 | | | | |
Options written (Proceeds – $ 125) | | | 119 | | | | |
Accrued expenses | | | 94 | | | | |
Accrued distribution and service fees | | | 31 | | | | |
Accrued management fee | | | 10 | | | | |
Swap contracts at value | | | 7 | | | | |
| | | | | | | |
Total liabilities | | | | | | 34,797 | |
| | | | | | | |
Net Assets | | | | | $ | 75,205 | |
| | | | | | | |
Net assets consist of: | | | | | | | |
Accumulated paid-in-capital | | | | | $ | 77,847 | |
Undistributed net investment income | | | | | | 34 | |
Accumulated net realized loss on investments, options and futures | | | | | | (1,189 | ) |
Net unrealized depreciation on investments, options, futures and swaps | | | | | | (1,487 | ) |
| | | | | | | |
Net Assets | | | | | $ | 75,205 | |
| | | | | | | |
| | |
Net Asset Value Per Share: | | | | | | | |
Primary Class (7,852 shares outstanding) | | | | | $ | 9.58 | |
| | | | | | | |
| | | | | | | | |
See notes to financial statements.
28
Semi-Annual Report to Shareholders
Statement of Operations
Core Bond Fund
For the Six Months Ended June 30, 2007 (Unaudited)
(Amounts in Thousands)
| | | | | | | | |
| | | | | | | | | |
Investment Income: | | | | | | | | |
Interest | | $ | 2,019 | | | | | |
Dividends | | | 7 | | | | | |
| | | | | | | | |
Total income | | | | | | $ | 2,026 | |
| | |
Expenses: | | | | | | | | |
Management fees | | | 166 | | | | | |
Distribution and service fees: | | | | | | | | |
Primary Class | | | 185 | | | | | |
Audit and legal fees | | | 31 | | | | | |
Custodian fees | | | 21 | | | | | |
Directors’ fees and expenses | | | 17 | | | | | |
Registration fees | | | 13 | | | | | |
Reports to shareholders | | | 19 | | | | | |
Transfer agent and shareholder servicing expense: | | | | | | | | |
Primary Class | | | 29 | | | | | |
Other expenses | | | 30 | | | | | |
| | | | | | | | |
| | | 511 | | | | | |
Less: Fees waived | | | (140 | ) | | | | |
Compensating balance credits | | | (2 | )A | | | | |
| | | | | | | | |
Net expenses | | | | | | | 369 | |
| | | | | | | | |
Net Investment Income | | | | | | | 1,657 | |
| | |
Net Realized and Unrealized Gain/(Loss) on Investments: | | | | | | | | |
Net realized gain/(loss) on: | | | | | | | | |
Investments | | | (448 | ) | | | | |
Options | | | 81 | | | | | |
Swaps | | | — | B | | | | |
Futures | | | 88 | | | | | |
| | | | | | | | |
| | | | | | | (279 | ) |
Change in unrealized appreciation/(depreciation) of investments, options, futures and swaps | | | | | | | (1,077 | ) |
| | | | | | | | |
Net Realized and Unrealized Loss on Investments | | | | | | | (1,356 | ) |
Change in Net Assets Resulting From Operations | | | | | | $ | 301 | |
A | See Note 1, Compensating Balance Credits, in the notes to financial statements. |
See notes to financial statements.
29
Semi-Annual Report to Shareholders
Statement of Changes in Net Assets
Core Bond Fund
(Amounts in Thousands)
| | | | | | | | |
| | | For the Six Months Ended June 30, 2007 | | | For The Year Ended December 31, 2006 | |
| | | (Unaudited) | | | | |
Change in Net Assets: | | | | | | | | |
Net investment income | | $ | 1,657 | | | $ | 2,992 | |
Net realized loss | | | (279 | ) | | | (141 | ) |
Change in unrealized appreciation/depreciation | | | (1,077 | ) | | | 402 | |
Change in net assets resulting from operations | | | 301 | | | | 3,253 | |
Distributions to shareholders from: | | | | | | | | |
Net investment income: | | | | | | | | |
Primary Class | | | (1,657 | ) | | | (2,992 | ) |
Change in net assets from fund share transactions: | | | | | | | | |
Primary Class | | | 4,211 | | | | 264 | |
Change in net assets | | | 2,855 | | | | 525 | |
| | |
Net Assets: | | | | | | | | |
Beginning of period | | | 72,350 | | | | 71,825 | |
End of period | | $ | 75,205 | | | $ | 72,350 | |
Undistributed net investment income | | $ | 34 | | | $ | 34 | |
See notes to financial statements.
30
Semi-Annual Report to Shareholders
Financial Highlights
Core Bond Fund
Contained below is per share operating performance data for a share of common stock outstanding, total investment return, ratios to average net assets and other supplemental data. This information has been derived from information provided in the financial statements.
Primary Class:
| | | | | | | | | | | | | | | | |
| | | Six Months Ended June 30, 2007 | | | Years Ended December 31, | |
| | | | 2006 | | | 2005 | | | 2004A | |
| | |
| | | (Unaudited) | | | | | | | | | | |
Net asset value, beginning of period | | $ | 9.75 | | | $ | 9.71 | | | $ | 9.95 | | | $ | 10.00 | |
| | | | | | | | | | | | | | | | |
Investment operations: | | | | | | | | | | | | | | | | |
Net investment income | | | .22 | B | | | .40 | B | | | .32 | | | | .18 | |
Net realized and unrealized gain/(loss) | | | (.17 | ) | | | .04 | | | | (.23 | ) | | | .00 | C |
| | | | | | | | | | | | | | | | |
Total from investment operations | | | .05 | | | | .44 | | | | .09 | | | | .18 | |
| | | | | | | | | | | | | | | | |
Distributions from: | | | | | | | | | | | | | | | | |
Net investment income | | | (.22 | ) | | | (.40 | ) | | | (.33 | ) | | | (.21 | ) |
Net realized gain on investments | | | — | | | | — | | | | (.00 | )C | | | (.02 | ) |
| | | | | | | | | | | | | | | | |
Total distributions | | | (.22 | ) | | | (.40 | ) | | | (.33 | ) | | | (.23 | ) |
| | | | | | | | | | | | | | | | |
Net asset value, end of period | | $ | 9.58 | | | $ | 9.75 | | | $ | 9.71 | | | $ | 9.95 | |
| | | | | | | | | | | | | | | | |
Total return | | | 0.47 | %D | | | 4.71 | % | | | .94 | % | | | 1.90 | %D |
| | | | |
Ratios to Average Net Assets:E | | | | | | | | | | | | | | | | |
Total expenses | | | 1.39 | %F | | | 1.44 | % | | | 1.38 | % | | | 1.56 | %F |
Expenses net of waivers, if any | | | 1.01 | %F | | | 1.02 | % | | | 1.00 | % | | | 1.00 | %F |
Expenses net of all reductions | | | 1.00 | %F | | | 1.00 | % | | | 1.00 | % | | | 1.00 | %F |
Net investment income | | | 4.49 | %F | | | 4.19 | % | | | 3.29 | % | | | 2.50 | %F |
| | | | |
Supplemental Data: | | | | | | | | | | | | | | | | |
Portfolio turnover rate | | | 201.5 | %D | | | 428.1 | % | | | 435.7 | % | | | 233.8 | %D |
Net assets, end of period (in thousands) | | $ | 75,205 | | | $ | 72,350 | | | $ | 71,825 | | | $ | 63,773 | |
| | | | | | | | | | | | | | | | | |
A | For the period February 27, 2004 (commencement of operations) to December 31, 2004. |
B | Computed using average daily shares outstanding. |
C | Amount represents less than $.01 per share. |
E | Total expenses reflects operating expenses prior to any voluntary expense waivers and/or compensating balance credits. Expenses net of waivers reflects total expenses before compensating balance credits but net of any voluntary expense waivers. Expenses net of all reductions reflects expenses less any compensating balance credits and/or voluntary expense waivers. |
See notes to financial statements.
31
Semi-Annual Report to Shareholders
Expense Example
Investment Grade Income Portfolio
As a shareholder of the Fund, you incur ongoing costs, including management fees, distribution and service (12b-1) fees on Primary Class shares; and other Fund expenses. These examples are intended to help you understand your ongoing costs (in dollars) of investing in the Fund and to compare these costs with the ongoing costs of investing in other mutual funds. Each example is based on an investment of $1,000 invested on January 1, 2007, and held through June 30, 2007.
Actual Expenses
The first line for each class in the table below provides information about actual account values and actual expenses for each class. You may use the information in this line, together with the amount you invested, to estimate the expenses that you paid over the period. Simply divide your account value by $1,000 (for example, an $8,600 account value divided by $1,000 = 8.6), then multiply the result by the number in the first line under the heading entitled “Expenses Paid During the Period” to estimate the expenses you paid on your account if your shares were held through the entire period.
Hypothetical Example for Comparison Purposes
The second line for each class in the table below provides information about hypothetical account values and hypothetical expenses based on the relevant class’s actual expense ratio and an assumed rate of return of 5% per year before expenses, which is not the class’s actual return. The hypothetical account values and expenses may not be used to estimate the actual ending account balance or expenses you paid for the period. You may use this information to compare the ongoing costs of investing in the Fund and other funds. To do so, compare these 5% hypothetical examples with the 5% hypothetical examples for the relevant class that appear in the shareholder reports of other funds.
| | | | | | | | | |
| | | Beginning Account Value
1/1/07 | | Ending Account Value
6/30/07 | | Expenses PaidA During the Period 1/1/07 to 6/30/07 |
Primary Class: | | | | | | | | | |
Actual | | $ | 1,000.00 | | $ | 1,009.00 | | $ | 4.98 |
Hypothetical (5% return before expenses) | | | 1,000.00 | | | 1,019.84 | | | 5.01 |
Institutional Class: | | | | | | | | | |
Actual | | $ | 1,000.00 | | $ | 1,011.50 | | $ | 2.49 |
Hypothetical (5% return before expenses) | | | 1,000.00 | | | 1,022.32 | | | 2.51 |
A | These calculations are based on expenses incurred in the most recent fiscal half-year. The dollar amounts shown as “Expenses Paid” are equal to the annualized expense ratios of 1.00% and 0.50% for the Primary Class and Institutional Class, respectively, multiplied by the average values over the period, multiplied by the number of days in the most recent fiscal half-year (181), and divided by 365. |
32
Semi-Annual Report to Shareholders
Performance Information
Investment Grade Income Portfolio
The graphs on the following pages compare the Fund’s total returns to that of a closely matched broad-based securities market index. The graphs illustrate the cumulative total return of an initial $10,000 investment in Primary Class shares and an initial $1,000,000 investment in Institutional Class shares of the Fund, for the periods indicated. The lines for the Fund represent the total return after deducting all Fund investment management and other administrative expenses and the transaction costs of buying and selling securities. The line representing the securities market index does not include any transaction costs associated with buying and selling securities in the index or other administrative expenses. Both the Fund’s and the index’s results assume reinvestment of all dividends and distributions.
Total return measures investment performance in terms of appreciation or depreciation in a fund’s net asset value per share, plus dividends and any capital gain distributions. It assumes that dividends and distributions were reinvested at the time they were paid. Average annual returns tend to smooth out variations in a fund’s return, so that they differ from actual year-to-year results.
33
Semi-Annual Report to Shareholders
Performance Information—Continued
Growth of a $10,000 Investment—Primary Class
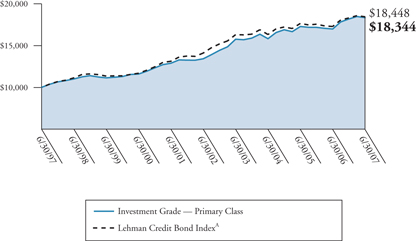
Periods Ended June 30, 2007
| | | | | | |
| | | Cumulative Total
Return | | | Average
Annual Total
Return | |
One Year | | +8.01 | % | | +8.01 | % |
Five Years | | +36.65 | % | | +6.44 | % |
Ten Years | | +83.44 | % | | +6.26 | % |
The performance data quoted represents past performance and does not guarantee future results. The performance stated may have been due to extraordinary market conditions, which may not be duplicated in the future. Current performance may be lower or higher than the performance data quoted. To obtain the most recent month-end performance information please visit www.leggmasonfunds.com. The investment return and principal value of the Fund will fluctuate so that an investor’s shares, when redeemed, may be worth more or less than the original cost. Calculations assume reinvestment of dividends and capital gain distributions. Performance would have been lower if fees had not been waived in various periods.
The graph and table do not reflect the deduction of taxes that a shareholder would pay on Fund distributions or the redemption of Fund shares.
A | This index consists of publicly issued U.S. corporate and specified foreign debentures and secured notes that meet the specified maturity, liquidity, and quality requirements. To qualify, bonds must be SEC-registered. The index includes both corporate (industrial, utility and finance) and non-corporate (sovereign, supranational, foreign agency, and foreign local government) sectors. |
34
Semi-Annual Report to Shareholders
Growth of a $1,000,000 Investment—Institutional Class
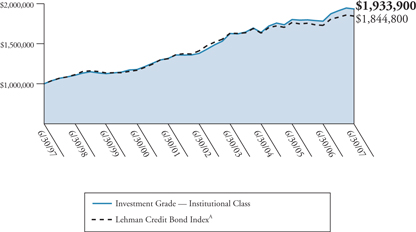
Periods Ended June 30, 2007
| | | | | | |
| | | Cumulative Total
Return | | | Average
Annual Total
Return | |
One Year | | +8.55 | % | | +8.55 | % |
Five Years | | +40.26 | % | | +7.00 | % |
Ten Years | | +93.39 | % | | +6.82 | % |
The performance data quoted represents past performance and does not guarantee future results. The performance stated may have been due to extraordinary market conditions, which may not be duplicated in the future. Current performance may be lower or higher than the performance data quoted. To obtain the most recent month-end performance information please call 1-888-425-6432. The investment return and principal value of the Fund will fluctuate so that an investor’s shares, when redeemed, may be worth more or less than the original cost. Calculations assume reinvestment of dividends and capital gain distributions. Performance would have been lower if fees had not been waived in various periods.
The graph and table do not reflect the deduction of taxes that a shareholder would pay on Fund distributions or the redemption of Fund shares.
35
Semi-Annual Report to Shareholders
Performance Information—Continued
Portfolio Composition (as of June 30, 2007)B
Standard & Poor’s Debt RatingsC (as a percentage of the portfolio)
Maturity Schedule (as a percentage of the portfolio)
B | The Fund is actively managed. As a result, the composition of its portfolio holdings and sectors is subject to change at any time |
C | Standard & Poor’s Ratings Services provide capital markets with credit ratings for the evaluation and assessment of credit risk. |
36
Semi-Annual Report to Shareholders
Portfolio of Investments
Investment Grade Income Portfolio
June 30, 2007 (Unaudited)
(Amounts in Thousands)
| | | | | | | | | | | | |
| | | Rate | | | Maturity Date | | Par | | Value | |
Long-Term Securities — 97.6% | | | | | | | | | | | | |
Corporate Bonds and Notes — 66.1% | | | | | | | | | | | | |
Aerospace and Defense — 0.2% | | | | | | | | | | | | |
L-3 Communications Corp. | | 7.625 | % | | 6/15/12 | | $ | 1,000 | | $ | 1,024 | |
| | | | | | | | | | | | |
| | | | |
Airlines — 0.2% | | | | | | | | | | | | |
Continental Airlines Inc. | | 7.256 | % | | 3/15/20 | | | 482 | | | 501 | |
Continental Airlines Inc. | | 6.545 | % | | 8/2/20 | | | 156 | | | 159 | |
| | | | | | | | | | | | |
| | | | | | | | | | | 660 | |
| | | | | | | | | | | | |
| | | | |
Automobiles — 1.7% | | | | | | | | | | | | |
DaimlerChrysler NA Holding Corp. | | 4.050 | % | | 6/4/08 | | | 160 | | | 158 | |
DaimlerChrysler NA Holding Corp. | | 7.200 | % | | 9/1/09 | | | 260 | | | 268 | |
DaimlerChrysler NA Holding Corp. | | 5.875 | % | | 3/15/11 | | | 300 | | | 301 | |
DaimlerChrysler NA Holding Corp. | | 7.300 | % | | 1/15/12 | | | 735 | | | 780 | |
DaimlerChrysler NA Holding Corp. | | 6.500 | % | | 11/15/13 | | | 290 | | | 299 | |
DaimlerChrysler NA Holding Corp. | | 8.500 | % | | 1/18/31 | | | 850 | | | 1,074 | |
Ford Motor Co. | | 7.450 | % | | 7/16/31 | | | 1,975 | | | 1,578 | |
Ford Motor Co. | | 8.900 | % | | 1/15/32 | | | 370 | | | 322 | |
General Motors Corp. | | 8.250 | % | | 7/15/23 | | | 650 | | | 592 | |
General Motors Corp. | | 8.375 | % | | 7/15/33 | | | 1,990 | | | 1,816 | |
| | | | | | | | | | | | |
| | | | | | | | | | | 7,188 | |
| | | | | | | | | | | | |
| | | | |
Beverages — 0.2% | | | | | | | | | | | | |
Foster’s Finance Corp. | | 4.875 | % | | 10/1/14 | | | 840 | | | 781 | A |
| | | | | | | | | | | | |
| | | | |
Building Products — N.M. | | | | | | | | | | | | |
American Standard Inc. | | 8.250 | % | | 6/1/09 | | | 37 | | | 39 | |
American Standard Inc. | | 7.625 | % | | 2/15/10 | | | 5 | | | 5 | |
| | | | | | | | | | | | |
| | | | | | | | | | | 44 | |
| | | | | | | | | | | | |
37
Semi-Annual Report to Shareholders
Portfolio of Investments—Continued
Investment Grade Income Portfolio—Continued
| | | | | | | | | | | | |
| | | Rate | | | Maturity Date | | Par | | Value | |
Corporate Bonds and Notes—Continued | | | | | | | | | | | | |
Capital Markets — 3.0% | | | | | | | | | | | | |
BankAmerica Capital III | | 5.926 | % | | 1/15/27 | | $ | 585 | | $ | 569 | B |
Lehman Brothers Holdings Inc. | | 5.750 | % | | 1/3/17 | | | 3,980 | | | 3,867 | |
Merrill Lynch and Co. Inc. | | 6.000 | % | | 2/17/09 | | | 800 | | | 807 | |
Merrill Lynch and Co. Inc. | | 5.700 | % | | 5/2/17 | | | 1,940 | | | 1,868 | |
Merrill Lynch and Co. Inc. | | 6.110 | % | | 1/29/37 | | | 910 | | | 854 | |
Morgan Stanley | | 5.050 | % | | 1/21/11 | | | 900 | | | 881 | |
Morgan Stanley | | 4.750 | % | | 4/1/14 | | | 65 | | | 61 | |
The Bear Stearns Cos. Inc. | | 5.500 | % | | 8/15/11 | | | 1,650 | | | 1,634 | |
The Bear Stearns Cos. Inc. | | 5.550 | % | | 1/22/17 | | | 320 | | | 302 | |
The Goldman Sachs Group Inc. | | 6.345 | % | | 2/15/34 | | | 2,025 | | | 1,931 | |
| | | | | | | | | | | | |
| | | | | | | | | | | 12,774 | |
| | | | | | | | | | | | |
| | | | |
Chemicals — 0.6% | | | | | | | | | | | | |
E.I. du Pont de Nemours and Co. | | 4.875 | % | | 4/30/14 | | | 1,100 | | | 1,048 | |
The Dow Chemical Co. | | 6.000 | % | | 10/1/12 | | | 750 | | | 758 | |
The Dow Chemical Co. | | 7.375 | % | | 11/1/29 | | | 800 | | | 866 | |
| | | | | | | | | | | | |
| | | | | | | | | | | 2,672 | |
| | | | | | | | | | | | |
| | | | |
Commercial Banks — 4.4% | | | | | | | | | | | | |
CBA Capital Trust I | | 5.805 | % | | 6/30/49 | | | 3,510 | | | 3,452 | A |
Comerica Capital Trust II | | 6.576 | % | | 2/20/37 | | | 990 | | | 926 | C |
KeyBank NA | | 5.800 | % | | 7/1/14 | | | 5 | | | 5 | |
Rabobank Capital Funding Trust II | | 5.260 | % | | 12/31/49 | | | 320 | | | 307 | A,C |
Rabobank Capital Funding Trust III | | 5.254 | % | | 10/21/49 | | | 3,120 | | | 2,921 | A,C |
RBS Capital Trust III | | 5.512 | % | | 9/30/49 | | | 4,020 | | | 3,864 | C |
SunTrust Bank | | 5.000 | % | | 9/1/15 | | | 770 | | | 727 | |
SunTrust Capital VIII | | 6.100 | % | | 12/15/36 | | | 1,550 | | | 1,419 | C |
UnionBanCal Corp. | | 5.250 | % | | 12/16/13 | | | 785 | | | 764 | |
Wachovia Capital Trust III | | 5.800 | % | | 3/15/42 | | | 520 | | | 518 | C |
Wachovia Corp. | | 5.625 | % | | 10/15/16 | | | 2,300 | | | 2,240 | |
Wachovia Corp. | | 5.750 | % | | 6/15/17 | | | 580 | | | 572 | |
Wells Fargo Capital X | | 5.950 | % | | 12/15/36 | | | 1,260 | | | 1,175 | C |
| | | | | | | | | | | | |
| | | | | | | | | | | 18,890 | |
| | | | | | | | | | | | |
38
Semi-Annual Report to Shareholders
| | | | | | | | | | | | |
| | | Rate | | | Maturity Date | | Par | | Value | |
Corporate Bonds and Notes—Continued | | | | | | | | | | | | |
Commercial Services and Supplies — 0.2% | | | | | | | | | | | | |
Waste Management Inc. | | 6.375 | % | | 11/15/12 | | $ | 310 | | $ | 317 | |
Waste Management Inc. | | 7.375 | % | | 5/15/29 | | | 690 | | | 727 | |
| | | | | | | | | | | | |
| | | | | | | | | | | 1,044 | |
| | | | | | | | | | | | |
| | | | |
Communications Equipment—N.M. | | | | | | | | | | | | |
Motorola Inc. | | 7.625 | % | | 11/15/10 | | | 135 | | | 142 | |
| | | | | | | | | | | | |
| | | | |
Computers and Peripherals — 0.4% | | | | | | | | | | | | |
International Business Machines Corp. | | 4.750 | % | | 11/29/12 | | | 1,750 | | | 1,692 | |
| | | | | | | | | | | | |
| | | | |
Consumer Finance — 5.9% | | | | | | | | | | | | |
American Express Co. | | 6.800 | % | | 9/1/66 | | | 3,100 | | | 3,197 | C |
Capital One Financial Corp. | | 7.125 | % | | 8/1/08 | | | 340 | | | 345 | |
Caterpillar Financial Services Corp. | | 4.500 | % | | 6/15/09 | | | 1,040 | | | 1,024 | |
Ford Motor Credit Co. | | 7.375 | % | | 10/28/09 | | | 2,970 | | | 2,948 | |
Ford Motor Credit Co. | | 7.375 | % | | 2/1/11 | | | 2,390 | | | 2,335 | |
Ford Motor Credit Co. | | 10.610 | % | | 6/15/11 | | | 6,828 | | | 7,376 | B |
Ford Motor Credit Co. | | 7.250 | % | | 10/25/11 | | | 2,410 | | | 2,320 | |
GMAC LLC | | 6.125 | % | | 8/28/07 | | | 2,680 | | | 2,682 | |
GMAC LLC | | 6.311 | % | | 11/30/07 | | | 320 | | | 319 | |
GMAC LLC | | 6.875 | % | | 9/15/11 | | | 750 | | | 738 | |
GMAC LLC | | 0.000 | % | | 6/15/15 | | | 40 | | | 22 | D |
GMAC LLC | | 8.000 | % | | 11/1/31 | | | 590 | | | 603 | |
Nelnet Inc. | | 7.400 | % | | 9/29/36 | | | 1,310 | | | 1,306 | C |
SLM Corp. | | 5.375 | % | | 5/15/14 | | | 630 | | | 540 | |
| | | | | | | | | | | | |
| | | | | | | | | | | 25,755 | |
| | | | | | | | | | | | |
| | | | |
Diversified Financial Services — 13.2% | | | | | | | | | | | | |
AGFC Capital Trust I | | 6.000 | % | | 1/15/67 | | | 860 | | | 822 | A,C |
AIG SunAmerica Global Financing VI | | 6.300 | % | | 5/10/11 | | | 5,170 | | | 5,295 | A |
American Express Travel Related Services Co. Inc. | | 5.250 | % | | 11/21/11 | | | 830 | | | 821 | A |
Associates Corp. of North America | | 8.150 | % | | 8/1/09 | | | 775 | | | 817 | |
Bank of America Corp. | | 4.750 | % | | 8/15/13 | | | 110 | | | 105 | |
39
Semi-Annual Report to Shareholders
Portfolio of Investments—Continued
Investment Grade Income Portfolio—Continued
| | | | | | | | | | | | |
| | | Rate | | | Maturity Date | | Par | | Value | |
Corporate Bonds and Notes—Continued | | | | | | | | | | | | |
Diversified Financial Services—Continued | | | | | | | | | | | | |
Bank of America Corp. | | 5.420 | % | | 3/15/17 | | $ | 3,100 | | $ | 2,972 | |
Beaver Valley II Funding | | 9.000 | % | | 6/1/17 | | | 1,078 | | | 1,201 | |
Capital One Bank | | 4.875 | % | | 5/15/08 | | | 150 | | | 149 | |
Capital One Bank | | 5.750 | % | | 9/15/10 | | | 870 | | | 874 | |
Capital One Bank | | 6.500 | % | | 6/13/13 | | | 690 | | | 709 | |
Capital One Capital IV | | 6.745 | % | | 2/17/37 | | | 1,100 | | | 1,012 | C |
Capmark Financial Group Inc. | | 5.875 | % | | 5/10/12 | | | 1,000 | | | 987 | A,E |
Chase Capital II | | 5.856 | % | | 2/1/27 | | | 1,980 | | | 1,900 | B |
Citigroup Inc. | | 6.125 | % | | 8/25/36 | | | 5,980 | | | 5,872 | |
Deutsche Bank Capital Funding Trust | | 5.628 | % | | 1/19/49 | | | 1,760 | | | 1,676 | A,C |
General Electric Capital Corp. | | 5.000 | % | | 4/10/12 | | | 6,190 | | | 6,042 | |
General Electric Capital Corp. | | 5.550 | % | | 5/4/20 | | | 590 | | | 572 | |
General Electric Capital Corp. | | 6.750 | % | | 3/15/32 | | | 5 | | | 5 | |
Glen Meadow Pass-Through Certificates | | 6.505 | % | | 2/12/67 | | | 860 | | | 846 | A,C |
HSBC Finance Capital Trust IX | | 5.911 | % | | 11/30/35 | | | 2,500 | | | 2,420 | C |
HSBC Finance Corp. | | 5.700 | % | | 6/1/11 | | | 1,280 | | | 1,283 | |
HSBC Finance Corp. | | 5.500 | % | | 1/19/16 | | | 1,610 | | | 1,551 | |
ILFC E-Capital Trust II | | 6.250 | % | | 12/21/65 | | | 2,320 | | | 2,263 | A,C |
JPMorgan Chase and Co. | | 4.891 | % | | 9/1/15 | | | 1,035 | | | 1,015 | C |
JPMorgan Chase and Co. | | 6.125 | % | | 6/27/17 | | | 5 | | | 5 | |
Mizuho Preferred Capital Co. LLC | | 8.790 | % | | 6/30/49 | | | 1,520 | | | 1,565 | A,C |
National Rural Utilities Cooperative Finance Corp. | | 7.250 | % | | 3/1/12 | | | 1,700 | | | 1,811 | |
Residential Capital Corp. | | 6.125 | % | | 11/21/08 | | | 1,340 | | | 1,328 | |
Residential Capital Corp. | | 6.000 | % | | 2/22/11 | | | 2,120 | | | 2,051 | |
Residential Capital Corp. | | 6.500 | % | | 6/1/12 | | | 660 | | | 644 | |
SB Treasury Co. LLC | | 9.400 | % | | 6/30/49 | | | 840 | | | 869 | A,C |
UBS Preferred Funding Trust V | | 6.243 | % | | 5/15/49 | | | 3,030 | | | 3,042 | C |
ZFS Finance USA Trust II | | 6.450 | % | | 12/15/65 | | | 4,990 | | | 4,840 | A,C |
| | | | | | | | | | | | |
| | | | | | | | | | | 57,364 | |
| | | | | | | | | | | | |
| | | | |
Diversified Telecommunication Services — 2.6% | | | | | | | | | | | | |
AT&T Corp. | | 8.000 | % | | 11/15/31 | | | 1,200 | | | 1,426 | |
AT&T Inc. | | 5.100 | % | | 9/15/14 | | | 1,910 | | | 1,822 | |
BellSouth Corp. | | 4.750 | % | | 11/15/12 | | | 830 | | | 793 | |
40
Semi-Annual Report to Shareholders
| | | | | | | | | | | |
| | | Rate | | | Maturity Date | | Par | | Value |
Corporate Bonds and Notes—Continued | | | | | | | | | | | |
Communications Equipment—Continued | | | | | | | | | | | |
Embarq Corp. | | 7.082 | % | | 6/1/16 | | $ | 930 | | $ | 935 |
Qwest Corp. | | 5.625 | % | | 11/15/08 | | | 550 | | | 548 |
Verizon Global Funding Corp. | | 6.875 | % | | 6/15/12 | | | 1,030 | | | 1,085 |
Verizon Global Funding Corp. | | 7.750 | % | | 6/15/32 | | | 375 | | | 420 |
Verizon Global Funding Corp. | | 5.850 | % | | 9/15/35 | | | 1,580 | | | 1,449 |
Verizon New York Inc. | | 6.875 | % | | 4/1/12 | | | 2,810 | | | 2,930 |
| | | | | | | | | | | |
| | | | | | | | | | | 11,408 |
| | | | | | | | | | | |
| | | | |
Electric Utilities — 3.8% | | | | | | | | | | | |
Alabama Power Co. | | 3.125 | % | | 5/1/08 | | | 920 | | | 903 |
Duke Energy Corp. | | 5.625 | % | | 11/30/12 | | | 270 | | | 270 |
Exelon Corp. | | 6.750 | % | | 5/1/11 | | | 1,370 | | | 1,411 |
FirstEnergy Corp. | | 6.450 | % | | 11/15/11 | | | 2,285 | | | 2,343 |
FirstEnergy Corp. | | 7.375 | % | | 11/15/31 | | | 3,650 | | | 3,951 |
Niagara Mohawk Power Corp. | | 7.750 | % | | 10/1/08 | | | 1,010 | | | 1,036 |
Pacific Gas and Electric Co. | | 6.050 | % | | 3/1/34 | | | 2,150 | | | 2,083 |
Tampa Electric Co. | | 6.375 | % | | 8/15/12 | | | 380 | | | 391 |
The Cleveland Electric Illuminating Co. | | 5.650 | % | | 12/15/13 | | | 940 | | | 921 |
The Cleveland Electric Illuminating Co. | | 7.880 | % | | 11/1/17 | | | 850 | | | 962 |
The Detroit Edison Co. | | 5.200 | % | | 10/15/12 | | | 1,260 | | | 1,234 |
TXU Energy Co. | | 7.000 | % | | 3/15/13 | | | 930 | | | 959 |
| | | | | | | | | | | |
| | | | | | | | | | | 16,464 |
| | | | | | | | | | | |
| | | | |
Energy Equipment and Services — 0.4% | | | | | | | | | | | |
CenterPoint Energy Resources Corp. | | 7.875 | % | | 4/1/13 | | | 1,010 | | | 1,102 |
Pride International Inc. | | 7.375 | % | | 7/15/14 | | | 800 | | | 802 |
| | | | | | | | | | | |
| | | | | | | | | | | 1,904 |
| | | | | | | | | | | |
| | | | |
Food and Staples Retailing — 0.9% | | | | | | | | | | | |
CVS Corp. | | 5.750 | % | | 8/15/11 | | | 820 | | | 820 |
Safeway Inc. | | 7.500 | % | | 9/15/09 | | | 600 | | | 624 |
Safeway Inc. | | 5.800 | % | | 8/15/12 | | | 750 | | | 750 |
41
Semi-Annual Report to Shareholders
Portfolio of Investments—Continued
Investment Grade Income Portfolio—Continued
| | | | | | | | | | | | |
| | | Rate | | | Maturity Date | | Par | | Value | |
Corporate Bonds and Notes—Continued | | | | | | | | | | | | |
Food and Staples Retailing—Continued | | | | | | | | | | | | |
The Kroger Co. | | 8.000 | % | | 9/15/29 | | $ | 1,000 | | $ | 1,078 | |
Wal-Mart Stores Inc. | | 6.875 | % | | 8/10/09 | | | 475 | | | 490 | |
| | | | | | | | | | | | |
| | | | | | | | | | | 3,762 | |
| | | | | | | | | | | | |
| | | | |
Food Products — 0.6% | | | | | | | | | | | | |
Ahold Finance USA Inc. | | 8.250 | % | | 7/15/10 | | | 960 | | | 1,025 | |
Kellogg Co. | | 6.600 | % | | 4/1/11 | | | 1,000 | | | 1,034 | |
Kellogg Co. | | 7.450 | % | | 4/1/31 | | | 650 | | | 737 | |
| | | | | | | | | | | | |
| | | | | | | | | | | 2,796 | |
| | | | | | | | | | | | |
| | | | |
Gas Utilities — 0.4% | | | | | | | | | | | | |
Panhandle Eastern Pipe Line Co. | | 4.800 | % | | 8/15/08 | | | 1,170 | | | 1,160 | |
Southern Natural Gas Co. | | 5.900 | % | | 4/1/17 | | | 480 | | | 464 | A |
| | | | | | | | | | | | |
| | | | | | | | | | | 1,624 | |
| | | | | | | | | | | | |
| | | | |
Health Care Equipment and Supplies — 0.5% | | | | | | | | | | | | |
Baxter International Inc. | | 5.900 | % | | 9/1/16 | | | 1,430 | | | 1,430 | |
Hospira Inc. | | 6.050 | % | | 3/30/17 | | | 840 | | | 827 | |
| | | | | | | | | | | | |
| | | | | | | | | | | 2,257 | |
| | | | | | | | | | | | |
| | | | |
Health Care Providers and Services — 3.3% | | | | | | | | | | | | |
Aetna Inc. | | 5.750 | % | | 6/15/11 | | | 1,490 | | | 1,499 | |
Cardinal Health Inc. | | 5.800 | % | | 10/15/16 | | | 1,100 | | | 1,065 | A |
Coventry Health Care Inc. | | 5.950 | % | | 3/15/17 | | | 1,150 | | | 1,122 | |
HCA Inc. | | 6.300 | % | | 10/1/12 | | | 1,790 | | | 1,656 | |
HCA Inc. | | 6.250 | % | | 2/15/13 | | | 2,130 | | | 1,922 | |
HCA Inc. | | 5.750 | % | | 3/15/14 | | | 150 | | | 127 | |
HCA Inc. | | 9.125 | % | | 11/15/14 | | | 1,100 | | | 1,156 | A |
HCA Inc. | | 9.250 | % | | 11/15/16 | | | 1,380 | | | 1,470 | A |
Humana Inc. | | 6.450 | % | | 6/1/16 | | | 600 | | | 604 | |
Quest Diagnostics Inc. | | 5.125 | % | | 11/1/10 | | | 790 | | | 774 | |
Universal Health Services Inc. | | 7.125 | % | | 6/30/16 | | | 1,450 | | | 1,501 | |
WellPoint Inc. | | 5.875 | % | | 6/15/17 | | | 1,560 | | | 1,541 | |
| | | | | | | | | | | | |
| | | | | | | | | | | 14,437 | |
| | | | | | | | | | | | |
| | | | |
Household Durables — 0.5% | | | | | | | | | | | | |
Centex Corp. | | 5.125 | % | | 10/1/13 | | | 420 | | | 389 | |
DR Horton Inc. | | 5.250 | % | | 2/15/15 | | | 610 | | | 546 | |
42
Semi-Annual Report to Shareholders
| | | | | | | | | | | | |
| | | Rate | | | Maturity Date | | Par | | Value | |
Corporate Bonds and Notes—Continued | | | | | | | | | | | | |
Household Durables—Continued | | | | | | | | | | | | |
Pulte Homes Inc. | | 6.250 | % | | 2/15/13 | | $ | 385 | | $ | 373 | |
The Black and Decker Corp. | | 5.750 | % | | 11/15/16 | | | 810 | | | 785 | |
| | | | | | | | | | | | |
| | | | | | | | | | | 2,093 | |
| | | | | | | | | | | | |
| | | | |
Household Products—N.M. | | | | | | | | | | | | |
The Procter and Gamble Co. | | 4.300 | % | | 8/15/08 | | | 200 | | | 198 | |
| | | | | | | | | | | | |
| | | | |
Independent Power Producers and Energy Traders — 0.9% | | | | | | | | | | | | |
Dynegy Holdings Inc. | | 8.750 | % | | 2/15/12 | | | 1,690 | | | 1,741 | |
TXU Corp. | | 6.500 | % | | 11/15/24 | | | 2,730 | | | 2,257 | |
| | | | | | | | | | | | |
| | | | | | | | | | | 3,998 | |
| | | | | | | | | | | | |
| | | | |
Insurance — 2.8% | | | | | | | | | | | | |
Ace Ina Holdings Inc. | | 5.700 | % | | 2/15/17 | | | 670 | | | 652 | |
Allstate Corp. | | 6.500 | % | | 5/15/57 | | | 1,300 | | | 1,229 | C |
ASIF Global Financing XIX | | 4.900 | % | | 1/17/13 | | | 90 | | | 87 | A |
Everest Reinsurance Holdings Inc. | | 6.600 | % | | 5/15/67 | | | 760 | | | 725 | C |
Liberty Mutual Group | | 5.750 | % | | 3/15/14 | | | 720 | | | 697 | A |
Liberty Mutual Group | | 7.800 | % | | 3/7/87 | | | 810 | | | 763 | A,C |
MetLife Inc. | | 6.400 | % | | 12/15/36 | | | 2,890 | | | 2,677 | C |
Prudential Financial Inc. | | 5.700 | % | | 12/14/36 | | | 920 | | | 843 | |
The Chubb Corp. | | 6.375 | % | | 3/29/67 | | | 910 | | | 890 | C |
The Travelers Cos. Inc. | | 6.250 | % | | 6/15/37 | | | 710 | | | 687 | |
The Travelers Cos. Inc. | | 6.250 | % | | 3/15/67 | | | 1,790 | | | 1,720 | C |
Willis North America Inc. | | 5.125 | % | | 7/15/10 | | | 760 | | | 738 | |
Willis North America Inc. | | 5.625 | % | | 7/15/15 | | | 660 | | | 615 | |
| | | | | | | | | | | | |
| | | | | | | | | | | 12,323 | |
| | | | | | | | | | | | |
| | | | |
IT Services — 0.4% | | | | | | | | | | | | |
Electronic Data Systems Corp. | | 7.125 | % | | 10/15/09 | | | 530 | | | 545 | |
Electronic Data Systems Corp. | | 6.500 | % | | 8/1/13 | | | 500 | | | 494 | E |
Electronic Data Systems Corp. | | 7.450 | % | | 10/15/29 | | | 570 | | | 581 | |
| | | | | | | | | | | | |
| | | | | | | | | | | 1,620 | |
| | | | | | | | | | | | |
43
Semi-Annual Report to Shareholders
Portfolio of Investments—Continued
Investment Grade Income Portfolio—Continued
| | | | | | | | | | | |
| | | Rate | | | Maturity Date | | Par | | Value |
Corporate Bonds and Notes—Continued | | | | | | | | | | | |
Leisure Equipment and Products — 0.3% | | | | | | | | | | | |
Eastman Kodak Co. | | 3.625 | % | | 5/15/08 | | $ | 975 | | $ | 948 |
Eastman Kodak Co. | | 7.250 | % | | 11/15/13 | | | 500 | | | 500 |
| | | | | | | | | | | |
| | | | | | | | | | | 1,448 |
| | | | | | | | | | | |
| | | | |
Media — 4.6% | | | | | | | | | | | |
Clear Channel Communications Inc. | | 4.400 | % | | 5/15/11 | | | 1,210 | | | 1,091 |
Clear Channel Communications Inc. | | 5.500 | % | | 9/15/14 | | | 500 | | | 427 |
Comcast Cable Communications Inc. | | 6.750 | % | | 1/30/11 | | | 960 | | | 994 |
Comcast Cable Holdings LLC | | 7.125 | % | | 2/15/28 | | | 180 | | | 185 |
Comcast Corp. | | 7.050 | % | | 3/15/33 | | | 1,800 | | | 1,858 |
Comcast Corp. | | 6.450 | % | | 3/15/37 | | | 1,100 | | | 1,060 |
Cox Communications Inc. | | 4.625 | % | | 1/15/10 | | | 1,410 | | | 1,377 |
CSC Holdings Inc. | | 7.625 | % | | 7/15/18 | | | 1,500 | | | 1,425 |
Liberty Media LLC | | 7.875 | % | | 7/15/09 | | | 1,000 | | | 1,037 |
Liberty Media LLC | | 8.500 | % | | 7/15/29 | | | 340 | | | 340 |
Liberty Media LLC | | 8.250 | % | | 2/1/30 | | | 120 | | | 116 |
News America Inc. | | 6.550 | % | | 3/15/33 | | | 1,495 | | | 1,458 |
Rogers Cable Inc. | | 6.250 | % | | 6/15/13 | | | 570 | | | 575 |
The Walt Disney Co. | | 6.200 | % | | 6/20/14 | | | 1,220 | | | 1,262 |
Time Warner Entertainment Co. LP | | 8.375 | % | | 7/15/33 | | | 505 | | | 586 |
Time Warner Inc. | | 6.875 | % | | 5/1/12 | | | 1,350 | | | 1,408 |
Time Warner Inc. | | 9.125 | % | | 1/15/13 | | | 1,130 | | | 1,298 |
Time Warner Inc. | | 7.700 | % | | 5/1/32 | | | 1,015 | | | 1,098 |
Viacom Inc. | | 7.700 | % | | 7/30/10 | | | 90 | | | 95 |
Viacom Inc. | | 5.750 | % | | 4/30/11 | | | 990 | | | 989 |
Viacom Inc. | | 5.625 | % | | 8/15/12 | | | 1,095 | | | 1,077 |
| | | | | | | | | | | |
| | | | | | | | | | | 19,756 |
| | | | | | | | | | | |
| | | | |
Metals and Mining — 1.1% | | | | | | | | | | | |
Freeport-McMoRan Copper & Gold Inc. | | 8.375 | % | | 4/1/17 | | | 4,330 | | | 4,622 |
| | | | | | | | | | | |
44
Semi-Annual Report to Shareholders
| | | | | | | | | | | | |
| | | Rate | | | Maturity Date | | Par | | Value | |
Corporate Bonds and Notes—Continued | | | | | | | | | | | | |
Multi-Utilities — 0.7% | | | | | | | | | | | | |
DTE Energy Co. | | 6.375 | % | | 4/15/33 | | $ | 350 | | $ | 346 | |
Sempra Energy | | 5.830 | % | | 5/21/08 | | | 1,685 | | | 1,685 | B |
Xcel Energy Inc. | | 7.000 | % | | 12/1/10 | | | 900 | | | 939 | |
| | | | | | | | | | | | |
| | | | | | | | | | | 2,970 | |
| | | | | | | | | | | | |
| | | | |
Multiline Retail — 0.6% | | | | | | | | | | | | |
Federated Retail Holdings Inc. | | 5.350 | % | | 3/15/12 | | | 360 | | | 354 | |
May Department Stores Co. | | 5.750 | % | | 7/15/14 | | | 1,070 | | | 1,026 | |
May Department Stores Co. | | 6.650 | % | | 7/15/24 | | | 490 | | | 460 | |
Target Corp. | | 5.875 | % | | 3/1/12 | | | 860 | | | 873 | |
| | | | | | | | | | | | |
| | | | | | | | | | | 2,713 | |
| | | | | | | | | | | | |
| | | | |
Oil, Gas and Consumable Fuels — 5.6% | | | | | | | | | | | | |
ConocoPhillips | | 4.750 | % | | 10/15/12 | | | 2,290 | | | 2,219 | |
Devon Financing Corp. ULC | | 7.875 | % | | 9/30/31 | | | 560 | | | 649 | |
Duke Capital LLC | | 6.250 | % | | 2/15/13 | | | 340 | | | 345 | |
El Paso Corp. | | 7.800 | % | | 8/1/31 | | | 1,660 | | | 1,681 | |
El Paso Corp. | | 7.750 | % | | 1/15/32 | | | 340 | | | 342 | |
Hess Corp. | | 7.875 | % | | 10/1/29 | | | 3,770 | | | 4,249 | |
Kerr-McGee Corp. | | 6.950 | % | | 7/1/24 | | | 390 | | | 405 | |
Kerr-McGee Corp. | | 7.875 | % | | 9/15/31 | | | 4,350 | | | 5,027 | |
Kinder Morgan Energy Partners LP | | 7.125 | % | | 3/15/12 | | | 1,430 | | | 1,504 | |
Pemex Project Funding Master Trust | | 5.960 | % | | 12/3/12 | | | 107 | | | 108 | A,B |
Pemex Project Funding Master Trust | | 6.625 | % | | 6/15/35 | | | 2,900 | | | 2,943 | |
Tennessee Gas Pipeline Co. | | 8.375 | % | | 6/15/32 | | | 1,000 | | | 1,173 | |
The Williams Cos. Inc. | | 7.625 | % | | 7/15/19 | | | 2,000 | | | 2,110 | |
Valero Energy Corp. | | 6.875 | % | | 4/15/12 | | | 565 | | | 592 | |
XTO Energy Inc. | | 6.100 | % | | 4/1/36 | | | 1,270 | | | 1,192 | |
| | | | | | | | | | | | |
| | | | | | | | | | | 24,539 | |
| | | | | | | | | | | | |
| | | | |
Paper and Forest Products — 0.3% | | | | | | | | | | | | |
Weyerhaeuser Co. | | 6.750 | % | | 3/15/12 | | | 1,120 | | | 1,159 | |
| | | | | | | | | | | | |
45
Semi-Annual Report to Shareholders
Portfolio of Investments—Continued
Investment Grade Income Portfolio—Continued
| | | | | | | | | | | | |
| | | Rate | | | Maturity Date | | Par | | Value | |
Corporate Bonds and Notes—Continued | | | | | | | | | | | | |
Pharmaceuticals — 0.6% | | | | | | | | | | | | |
Wyeth | | 6.950 | % | | 3/15/11 | | $ | 2,000 | | $ | 2,093 | E |
Wyeth | | 5.950 | % | | 4/1/37 | | | 440 | | | 420 | |
| | | | | | | | | | | | |
| | | | | | | | | | | 2,513 | |
| | | | | | | | | | | | |
| | | | |
Real Estate Investment Trusts — 1.2% | | | | | | | | | | | | |
Health Care REIT Inc. | | 5.875 | % | | 5/15/15 | | | 1,440 | | | 1,402 | |
iStar Financial Inc. | | 5.375 | % | | 4/15/10 | | | 10 | | | 10 | |
iStar Financial Inc. | | 5.950 | % | | 10/15/13 | | | 3,610 | | | 3,556 | |
| | | | | | | | | | | | |
| | | | | | | | | | | 4,968 | |
| | | | | | | | | | | | |
| | | | |
Road and Rail — 0.6% | | | | | | | | | | | | |
Burlington Northern Rail Road Co. | | 6.960 | % | | 3/22/09 | | | 105 | | | 106 | |
Burlington Northern Rail Road Co. | | 7.330 | % | | 6/23/10 | | | 89 | | | 92 | |
CSX Transportation Inc. | | 7.875 | % | | 5/15/43 | | | 252 | | | 288 | |
Norfolk Southern Corp. | | 7.875 | % | | 5/15/43 | | | 348 | | | 393 | |
Union Pacific Corp. | | 4.875 | % | | 1/15/15 | | | 1,740 | | | 1,623 | |
| | | | | | | | | | | | |
| | | | | | | | | | | 2,502 | |
| | | | | | | | | | | | |
| | | | |
Thrifts and Mortgage Finance — 1.3% | | | | | | | | | | | | |
BB&T Capital Trust II | | 6.750 | % | | 6/7/36 | | | 1,750 | | | 1,804 | |
Countrywide Financial Corp. | | 5.800 | % | | 6/7/12 | | | 2,210 | | | 2,194 | |
Washington Mutual Inc. | | 4.200 | % | | 1/15/10 | | | 700 | | | 679 | |
Washington Mutual Inc. | | 4.625 | % | | 4/1/14 | | | 1,000 | | | 919 | |
| | | | | | | | | | | | |
| | | | | | | | | | | 5,596 | |
| | | | | | | | | | | | |
| | | | |
Tobacco — 0.5% | | | | | | | | | | | | |
Altria Group Inc. | | 7.000 | % | | 11/4/13 | | | 1,385 | | | 1,469 | |
Reynolds American Inc. | | 7.875 | % | | 5/15/09 | | | 860 | | | 892 | |
| | | | | | | | | | | | |
| | | | | | | | | | | 2,361 | |
| | | | | | | | | | | | |
| | | | |
Wireless Telecommunication Services — 1.6% | | | | | | | | | | | | |
New Cingular Wireless Services Inc. | | 8.125 | % | | 5/1/12 | | | 570 | | | 627 | |
New Cingular Wireless Services Inc. | | 8.750 | % | | 3/1/31 | | | 980 | | | 1,222 | |
Nextel Communications Inc. | | 5.950 | % | | 3/15/14 | | | 469 | | | 447 | |
Nextel Communications Inc. | | 7.375 | % | | 8/1/15 | | | 1,600 | | | 1,599 | |
Sprint Capital Corp. | | 8.375 | % | | 3/15/12 | | | 1,860 | | | 2,026 | |
46
Semi-Annual Report to Shareholders
| | | | | | | | | | | |
| | | Rate | | | Maturity Date | | Par | | Value |
Corporate Bonds and Notes—Continued | | | | | | | | | | | |
Wireless Telecommunication Services—Continued | | | | | | | | | | | |
Sprint Capital Corp. | | 8.750 | % | | 3/15/32 | | $ | 5 | | $ | 5 |
Sprint Nextel Corp. | | 6.000 | % | | 12/1/16 | | | 990 | | | 939 |
| | | | | | | | | | | |
| | | | | | | | | | | 6,865 |
| | | | | | | | | | | |
| | | | |
Total Corporate Bonds and Notes | | | | | | | | | | | |
(Cost — $290,762) | | | | | | | | | | | 286,926 |
| | | | | | | | | | | |
| | | | |
U.S. Government and Agency Obligations — 8.6% | | | | | | | | | | | |
Fixed Rate Securities — 8.6% | | | | | | | | | | | |
Tennessee Valley Authority | | 5.375 | % | | 11/13/08 | | | 150 | | | 151 |
United States Treasury Bonds | | 4.500 | % | | 2/15/36 | | | 5,715 | | | 5,175 |
United States Treasury Notes | | 4.500 | % | | 3/31/09 | | | 1,470 | | | 1,459 |
United States Treasury Notes | | 4.750 | % | | 2/15/10 | | | 4,535 | | | 4,518 |
United States Treasury Notes | | 4.625 | % | | 12/31/11 | | | 9,730 | | | 9,609 |
United States Treasury Notes | | 4.625 | % | | 2/29/12 | | | 750 | | | 741 |
United States Treasury Notes | | 4.500 | % | | 4/30/12 | | | 14,560 | | | 14,289 |
United States Treasury Notes | | 3.625 | % | | 5/15/13 | | | 950 | | | 888 |
United States Treasury Notes | | 4.000 | % | | 2/15/15 | | | 350 | | | 328 |
| | | | | | | | | | | |
| | | | |
Total U.S. Government and Agency Obligations | | | | | | | | | | | |
(Cost — $37,506) | | | | | | | | | | | 37,158 |
| | | | | | | | | | | |
| | | | |
U.S. Government Agency Mortgage-Backed Securities—N.M. | | | | | | | | | | | |
Indexed SecuritiesB—N.M. | | | | | | | | | | | |
Freddie Mac | | 7.084 | % | | 9/1/24 | | | 59 | | | 60 |
| | | | | | | | | | | |
| | | | |
Total U.S. Government Agency Mortgage-Backed Securities | | | | | | | | | | | |
(Cost — $60) | | | | | | | | | | | 60 |
| | | | | | | | | | | |
| | | | |
Yankee BondsF — 22.9% | | | | | | | | | | | |
Automobiles — 0.3% | | | | | | | | | | | |
General Motors Nova Scotia Finance Co. | | 6.850 | % | | 10/15/08 | | | 1,160 | | | 1,154 |
| | | | | | | | | | | |
47
Semi-Annual Report to Shareholders
Portfolio of Investments—Continued
Investment Grade Income Portfolio—Continued
| | | | | | | | | | | | |
| | | Rate | | | Maturity Date | | Par | | Value | |
Yankee Bonds—Continued | | | | | | | | | | | | |
Beverages—0.3% | | | | | | | | | | | | |
Molson Coors Capital Finance | | 4.850 | % | | 9/22/10 | | $ | 1,305 | | $ | 1,274 | |
| | | | | | | | | | | | |
| | | | |
Commercial Banks — 9.7% | | | | | | | | | | | | |
AES El Salvador Trust | | 6.750 | % | | 2/1/16 | | | 2,080 | | | 2,058 | A |
ATF Capital BV | | 9.250 | % | | 2/21/14 | | | 2,280 | | | 2,428 | A |
Banco Mercantil del Norte SA | | 6.135 | % | | 10/13/16 | | | 2,030 | | | 2,027 | A,C |
BOI Capital Funding | | 5.571 | % | | 2/1/49 | | | 2,000 | | | 1,896 | A,C |
Glitnir Banki Hf | | 6.330 | % | | 7/28/11 | | | 1,100 | | | 1,120 | A |
Glitnir Banki Hf | | 6.693 | % | | 6/15/16 | | | 1,900 | | | 1,957 | A,C |
Glitnir Banki Hf | | 7.451 | % | | 12/14/49 | | | 700 | | | 727 | A,C |
HBOS Capital Funding LP | | 6.071 | % | | 6/30/49 | | | 1,490 | | | 1,483 | A,C |
HBOS Treasury Services PLC | | 4.000 | % | | 9/15/09 | | | 1,080 | | | 1,050 | A |
HSBC Capital Funding LP | | 4.610 | % | | 6/27/49 | | | 760 | | | 712 | A,C |
HSBK Europe BV | | 7.250 | % | | 5/3/17 | | | 1,640 | | | 1,610 | A |
ICICI Bank Ltd. | | 6.375 | % | | 4/30/22 | | | 702 | | | 667 | A,C |
Kaupthing Bank Hf | | 6.045 | % | | 4/12/11 | | | 1,440 | | | 1,451 | A,B |
Kaupthing Bank Hf | | 5.750 | % | | 10/4/11 | | | 1,340 | | | 1,335 | A |
Kaupthing Bank Hf | | 7.125 | % | | 5/19/16 | | | 3,585 | | | 3,787 | A |
Mizuho Financial Group | | 5.790 | % | | 4/15/14 | | | 3,565 | | | 3,559 | A |
Resona Preferred Global Securities | | 7.191 | % | | 7/30/49 | | | 2,880 | | | 2,945 | A,C |
RSHB Capital SA | | 7.175 | % | | 5/16/13 | | | 3,690 | | | 3,843 | A |
RSHB Capital SA | | 6.299 | % | | 5/15/17 | | | 570 | | | 558 | A |
Shinsei Finance Cayman Ltd. | | 6.418 | % | | 7/20/49 | | | 3,055 | | | 2,970 | A,C |
Sumitomo Mitsui Banking Corp. | | 5.625 | % | | 10/15/49 | | | 730 | | | 696 | A,C |
TuranAlem Finance BV | | 8.250 | % | | 1/22/37 | | | 1,709 | | | 1,645 | A |
VTB Capital SA for Vneshtorgbank | | 5.955 | % | | 8/1/08 | | | 1,560 | | | 1,562 | A,B |
| | | | | | | | | | | | |
| | | | | | | | | | | 42,086 | |
| | | | | | | | | | | | |
| | | | |
Consumer Finance — 0.8% | | | | | | | | | | | | |
Aiful Corp. | | 6.000 | % | | 12/12/11 | | | 2,685 | | | 2,676 | A |
HSBC Holdings PLC | | 5.250 | % | | 12/12/12 | | | 830 | | | 817 | |
| | | | | | | | | | | | |
| | | | | | | | | | | 3,493 | |
| | | | | | | | | | | | |
| | | | |
Diversified Financial Services — 0.7% | | | | | | | | | | | | |
Petroplus Finance Ltd. | | 7.000 | % | | 5/1/17 | | | 750 | | | 722 | A |
SMFG Preferred Capital | | 6.078 | % | | 1/25/49 | | | 230 | | | 221 | A,C |
TNK-BP Finance SA | | 7.500 | % | | 7/18/16 | | | 870 | | | 897 | A |
48
Semi-Annual Report to Shareholders
| | | | | | | | | | | | |
| | | Rate | | | Maturity Date | | Par | | Value | |
Yankee Bonds—Continued | | | | | | | | | | | | |
Diversified Financial Services—Continued | | | | | | | | | | | | |
TNK-BP Finance SA | | 6.625 | % | | 3/20/17 | | $ | 100 | | $ | 97 | A |
UFJ Finance Aruba AEC | | 6.750 | % | | 7/15/13 | | | 920 | | | 971 | |
| | | | | | | | | | | | |
| | | | | | | | | | | 2,908 | |
| | | | | | | | | | | | |
| | | | |
Diversified Telecommunication Services — 3.3% | | | | | | | | | | | | |
British Telecommunications PLC | | 8.625 | % | | 12/15/10 | | | 900 | | | 984 | E |
British Telecommunications PLC | | 9.125 | % | | 12/15/30 | | | 420 | | | 550 | E |
Deutsche Telekom International Finance BV | | 8.250 | % | | 6/15/30 | | | 1,400 | | | 1,678 | E |
Deutsche Telekom International Finance BV | | 9.250 | % | | 6/1/32 | | | 670 | | | 883 | |
France Telecom SA | | 7.750 | % | | 3/1/11 | | | 3,000 | | | 3,205 | E |
France Telecom SA | | 8.500 | % | | 3/1/31 | | | 340 | | | 427 | E |
Intelsat Bermuda Ltd. | | 8.872 | % | | 1/15/15 | | | 1,175 | | | 1,200 | B |
Koninklijke (Royal) KPN NV | | 8.000 | % | | 10/1/10 | | | 990 | | | 1,060 | |
Koninklijke (Royal) KPN NV | | 8.375 | % | | 10/1/30 | | | 655 | | | 734 | |
Telecom Italia Capital | | 7.200 | % | | 7/18/36 | | | 2,070 | | | 2,128 | |
Telefonica Emisiones S.A.U. | | 5.855 | % | | 2/4/13 | | | 790 | | | 788 | |
Telefonica Emisiones S.A.U. | | 7.045 | % | | 6/20/36 | | | 800 | | | 829 | |
| | | | | | | | | | | | |
| | | | | | | | | | | 14,466 | |
| | | | | | | | | | | | |
| | | | |
Electric Utilities — 0.9% | | | | | | | | | | | | |
Enersis SA | | 7.375 | % | | 1/15/14 | | | 850 | | | 901 | |
Enersis SA/Cayman Island | | 7.400 | % | | 12/1/16 | | | 1,211 | | | 1,303 | |
Hydro Quebec | | 7.500 | % | | 4/1/16 | | | 1,625 | | | 1,840 | |
| | | | | | | | | | | | |
| | | | | | | | | | | 4,044 | |
| | | | | | | | | | | | |
| | | | |
Food and Staples Retailing — 0.2% | | | | | | | | | | | | |
Delhaize Group | | 6.500 | % | | 6/15/17 | | | 860 | | | 863 | A |
| | | | | | | | | | | | |
| | | | |
Foreign Government — 2.2% | | | | | | | | | | | | |
Federative Republic of Brazil | | 8.875 | % | | 4/15/24 | | | 240 | | | 299 | |
Federative Republic of Brazil | | 10.125 | % | | 5/15/27 | | | 740 | | | 1,043 | |
Federative Republic of Brazil | | 7.125 | % | | 1/20/37 | | | 340 | | | 367 | |
Province of Nova Scotia | | 5.750 | % | | 2/27/12 | | | 1,000 | | | 1,015 | |
Republic of Colombia | | 7.375 | % | | 9/18/37 | | | 177 | | | 196 | |
Republic of Panama | | 7.125 | % | | 1/29/26 | | | 500 | | | 533 | |
49
Semi-Annual Report to Shareholders
Portfolio of Investments—Continued
Investment Grade Income Portfolio—Continued
| | | | | | | | | | | | |
| | | Rate | | | Maturity Date | | Par | | Value | |
Yankee Bonds—Continued | | | | | | | | | | | | |
Foreign Government—Continued | | | | | | | | | | | | |
Republic of Panama | | 6.700 | % | | 1/26/36 | | $ | 353 | | $ | 360 | |
Russian Federation | | 7.500 | % | | 3/31/30 | | | 32 | | | 35 | A,C |
United Mexican States | | 7.500 | % | | 4/8/33 | | | 182 | | | 211 | |
United Mexican States | | 6.750 | % | | 9/27/34 | | | 5,122 | | | 5,463 | |
| | | | | | | | | | | | |
| | | | | | | | | | | 9,522 | |
| | | | | | | | | | | | |
| | | | |
Gas Utilities — 0.2% | | | | | | | | | | | | |
Intergas Finance BV | | 6.375 | % | | 5/14/17 | | | 850 | | | 814 | A |
| | | | | | | | | | | | |
| | | | |
Industrial Conglomerates — 0.9% | | | | | | | | | | | | |
Tyco International Group SA | | 6.125 | % | | 11/1/08 | | | 60 | | | 61 | |
Tyco International Group SA | | 6.125 | % | | 1/15/09 | | | 20 | | | 20 | |
Tyco International Group SA | | 6.750 | % | | 2/15/11 | | | 230 | | | 241 | |
Tyco International Group SA | | 6.375 | % | | 10/15/11 | | | 420 | | | 433 | |
Tyco International Group SA | | 7.000 | % | | 6/15/28 | | | 554 | | | 645 | |
Tyco International Group SA | | 6.875 | % | | 1/15/29 | | | 2,051 | | | 2,367 | |
| | | | | | | | | | | | |
| | | | | | | | | | | 3,767 | |
| | | | | | | | | | | | |
| | | | |
Insurance — 0.5% | | | | | | | | | | | | |
Axa | | 8.600 | % | | 12/15/30 | | | 1,630 | | | 1,986 | |
XL Capital Ltd. | | 5.250 | % | | 9/15/14 | | | 20 | | | 19 | |
| | | | | | | | | | | | |
| | | | | | | | | | | 2,005 | |
| | | | | | | | | | | | |
| | | | |
Media — 0.2% | | | | | | | | | | | | |
British Sky Broadcasting Group PLC | | 6.875 | % | | 2/23/09 | | | 870 | | | 888 | |
| | | | | | | | | | | | |
| | | | |
Metals and Mining — 0.9% | | | | | | | | | | | | |
Vale Overseas Ltd. | | 6.875 | % | | 11/21/36 | | | 3,888 | | | 3,908 | |
| | | | | | | | | | | | |
| | | | |
Oil, Gas and Consumable Fuels — 1.4% | | | | | | | | | | | | |
Anadarko Finance Co. | | 6.750 | % | | 5/1/11 | | | 10 | | | 10 | |
Anadarko Finance Co. | | 7.500 | % | | 5/1/31 | | | 180 | | | 194 | |
Conoco Funding Co. | | 6.350 | % | | 10/15/11 | | | 520 | | | 536 | |
Gazprom | | 6.212 | % | | 11/22/16 | | | 2,099 | | | 2,045 | A |
50
Semi-Annual Report to Shareholders
| | | | | | | | | | | | |
| | | Rate | | | Maturity Date | | Par | | Value | |
Yankee Bonds—Continued | | | | | | | | | | | | |
Oil, Gas and Consumable Fuels—Continued | | | | | | | | | | | | |
Gazprom | | 6.510 | % | | 3/7/22 | | $ | 1,160 | | $ | 1,145 | A |
Petrobras International Finance Co. | | 6.125 | % | | 10/6/16 | | | 2,186 | | | 2,142 | |
| | | | | | | | | | | | |
| | | | | | | | | | | 6,072 | |
| | | | | | | | | | | | |
| | | | |
Thrifts and Mortgage Finance — 0.2% | | | | | | | | | | | | |
Northern Rock PLC | | 6.594 | % | | 6/28/49 | | | 850 | | | 854 | A,C |
| | | | | | | | | | | | |
| | | | |
Wireless Telecommunication Services — 0.2% | | | | | | | | | | | | |
Rogers Wireless Inc. | | 6.375 | % | | 3/1/14 | | | 1,000 | | | 1,011 | |
| | | | | | | | | | | | |
Total Yankee Bonds (Cost — $ 98,124) | | | | | | | | | | | 99,129 | |
| | | | | | | | | | | | |
Total Long-Term Securities (Cost — $426,452) | | | | | | | | | | | 423,273 | |
Short-Term Securities — 1.4% | | | | | | | | | | | | |
| | | | |
U.S. Government and Agency Obligations — 0.2% | | | | | | | | | | | | |
Fannie Mae | | 0.000 | % | | 7/3/07 | | | 75 | | | 75 | D |
Fannie Mae | | 0.000 | % | | 7/2/07 | | | 25 | | | 25 | D |
Fannie Mae | | 0.000 | % | | 3/17/08 | | | 586 | | | 565 | D,G |
| | | | | | | | | | | | |
| | | | | | | | | | | 665 | |
| | | | | | | | | | | | |
Repurchase Agreements — 1.2% | | | | | | | | | | | | |
Lehman Brothers Inc. | | | | | | | | | | | | |
5.1%, dated 6/29/07, to be repurchased at $2,798 on 7/2/07 (Collateral: $5,900 Resolution Funding Corp principal-only securities, due 10/15/20, value $ 2,853) | | | | | | | | 2,797 | | | 2,797 | |
Merrill Lynch Government Securities Inc. | | | | | | | | | | | | |
5.15%, dated 6/29/07, to be repurchased at $2,516 on 7/2/07 (Collateral: $9,590 Fannie Mae zero-coupon bonds, due 11/15/30, value $ 2,565) | | | | | | | | 2,515 | | | 2,515 | |
| | | | | | | | | | | | |
| | | | | | | | | | | 5,312 | |
| | | | | | | | | | | | |
| | | | |
Total Short-Term Securities (Cost — $ 5,977) | | | | | | | | | | | 5,977 | |
Total Investments — 99.0% (Cost — $ 432,429)H | | | | | | | | | | | 429,250 | |
Other Assets Less Liabilities — 1.0% | | | | | | | | | | | 4,294 | |
| | | | | | | | | | | | |
| | | | |
Net Assets — 100.0% | | | | | | | | | | $ | 433,544 | |
| | | | | | | | | | | | |
51
Semi-Annual Report to Shareholders
Portfolio of Investments—Continued
Investment Grade Income Portfolio—Continued
| | | | | | | | |
| | | Expiration | | Actual
Contracts | | Appreciation/
(Depreciation) | |
Futures Contracts PurchasedI | | | | | | | | |
Eurodollar Futures | | September 2007 | | 707 | | $ | (623 | ) |
U.S. Treasury Bond Futures | | September 2007 | | 20 | | | (30 | ) |
U.S. Treasury Note Futures | | September 2007 | | 260 | | | (166 | ) |
| | | | | | | | |
| | | | | | $ | (819 | ) |
| | | | | | | | |
| | | |
Futures Contracts WrittenI | | | | | | | | |
U.S. Treasury Note Futures | | September 2007 | | 319 | | $ | 231 | |
| | | | | | | | |
A | Rule 144a Security—A security purchased pursuant to Rule 144a under the Securities Act of 1933 which may not be resold subject to that rule except to qualified institutional buyers. These securities, which the Fund’s investment adviser has determined to be liquid, represent 19.77% of net assets. |
B | Indexed Security—The rates of interest earned on these securities are tied to the London Interbank Offered Rate (“LIBOR”), the Consumer Price Index (“CPI”), or the one-year Treasury Bill Rate. The coupon rates are the rates as of June 30, 2007. |
C | Stepped Coupon Security—A security with a predetermined schedule of interest or dividend rate changes at which time it begins to accrue interest or pay dividends according to the predetermined schedule. |
D | Zero coupon bond—A bond with no periodic interest payments which is sold at such a discount as to produce a current yield to maturity. |
E | Credit Linked Security—The rates of interest earned on these securities are tied to the credit rating assigned by Standard & Poor’s Rating Service and/or Moody’s Investors Services. |
F | Yankee Bond—A dollar-denominated bond issued in the U.S. by foreign entities. |
G | All or a portion of this security is collateral to cover futures and options contracts written. |
H | Aggregate cost for federal income tax purposes is substantially the same as book cost. At June 30, 2007, the aggregate gross unrealized appreciation and depreciation of investments for federal income tax purposes was substantially as follows: |
| | | | |
Gross unrealized appreciation | | $ | 5,832 | |
Gross unrealized depreciation | | $ | (9,011 | ) |
| | | | |
Net unrealized appreciation/(depreciation) | | $ | (3,179 | ) |
| | | | |
I | Futures are described in more detail in the notes to financial statements. |
See notes to financial statements.
52
Semi-Annual Report to Shareholders
Statement of Assets and Liabilities
Investment Grade Income Portfolio
June 30, 2007 (Unaudited)
(Amounts in Thousands)
| | | | | | | |
Assets: | | | | | | | |
Investment securities at market value (cost – $ 426,452) | | | | | $ | 423,273 | |
Short-term securities at value (cost – $ 5,977) | | | | | | 5,977 | |
Interest receivable | | | | | | 7,073 | |
Receivable for fund shares sold | | | | | | 1,149 | |
Due from manager | | | | | | 361 | |
Receivable for securities sold | | | | | | 256 | |
Other assets | | | | | | 1 | |
| | | | | | | |
Total assets | | | | | | 438,090 | |
| | |
Liabilities: | | | | | | | |
Payable for securities purchased | | $ | 1,843 | | | | |
Payable for fund shares repurchased | | | 1,052 | | | | |
Income distribution payable | | | 811 | | | | |
Accrued distribution and service fees | | | 657 | | | | |
Accrued expenses | | | 142 | | | | |
Futures variation margin payable | | | 41 | | | | |
| | | | | | | |
Total liabilities | | | | | | 4,546 | |
| | | | | | | |
Net Assets | | | | | $ | 433,544 | |
| | | | | | | |
Net assets consist of: | | | | | | | |
Accumulated paid-in-capital | | | | | $ | 436,932 | |
Overdistributed net investment income | | | | | | (114 | ) |
Accumulated net realized gain on investments and futures | | | | | | 493 | |
Net unrealized depreciation on investments and futures | | | | | | (3,767 | ) |
| | | | | | | |
Net Assets | | | | | $ | 433,544 | |
| | | | | | | |
Net Asset Value Per Share: | | | | | | | |
Primary Class (40,612 shares outstanding) | | | | | $ | 10.27 | |
| | | | | | | |
Institutional Class (1,597 shares outstanding) | | | | | $ | 10.28 | |
| | | | | | | |
See notes to financial statements.
53
Semi-Annual Report to Shareholders
Statement of Operations
Investment Grade Income Portfolio
For the Six Months Ended June 30, 2007 (Unaudited)
(Amounts in Thousands)
| | | | | | | | |
Investment Income: | | | | | | | | |
Interest | | | | | | $ | 12,994 | |
| | |
Expenses: | | | | | | | | |
Management fees | | $ | 1,277 | | | | | |
Distribution and service fees: | | | | | | | | |
Primary Class | | | 1,030 | | | | | |
Audit and legal fees | | | 30 | | | | | |
Custodian fees | | | 33 | | | | | |
Directors’ fees and expenses | | | 26 | | | | | |
Registration fees | | | 29 | | | | | |
Reports to shareholders | | | 38 | | | | | |
Transfer agent and shareholder servicing expense: | | | | | | | | |
Primary Class | | | 187 | | | | | |
Institutional Class | | | 6 | | | | | |
Other expenses | | | 21 | | | | | |
| | | | | | | | |
| | | 2,677 | | | | | |
Less: Fees waived | | | (574 | ) | | | | |
Expenses reimbursed by adviser | | | (6 | ) | | | | |
Compensating balance credits | | | (3 | ) | | | | |
| | | | | | | | |
Net expenses | | | | | | | 2,094 | |
| | | | | | | | |
Net Investment Income | | | | | | | 10,900 | |
| | |
Net Realized and Unrealized Gain/(Loss) on Investments: | | | | | | | | |
Net realized gain on: | | | | | | | | |
Investments | | | 193 | | | | | |
Futures | | | 410 | | | | | |
| | | | | | | | |
| | | | | | | 603 | |
Change in unrealized appreciation/depreciation of investments and futures | | | | | | | (8,590 | ) |
| | | | | | | | |
Net Realized and Unrealized Loss on Investments | | | | | | | (7,987 | ) |
| | |
Change in Net Assets Resulting From Operations | | | | | | $ | 2,913 | |
| | |
See notes to financial statements.
54
Semi-Annual Report to Shareholders
Statement of Changes in Net Assets
Investment Grade Income Portfolio
(Amounts in Thousands)
| | | | | | | | |
| | | For the Six Months Ended June 30,
2007 | | | For the Year Ended December 31,
2006 | |
| | | (Unaudited) | | | | |
Change in Net Assets: | | | | | | | | |
| | |
Net investment income | | $ | 10,900 | | | $ | 20,002 | |
| | |
Net realized gain | | | 603 | | | | 1,321 | |
| | |
Change in unrealized appreciation/depreciation | | | (8,590 | ) | | | 2,783 | |
| | |
| | |
Change in net assets resulting from operations | | | 2,913 | | | | 24,106 | |
| | |
Distributions to shareholders from: | | | | | | | | |
Net investment income: | | | | | | | | |
Primary Class | | | (10,515 | ) | | | (18,986 | ) |
Institutional Class | | | (383 | ) | | | (1,013 | ) |
Net realized gain on investments: | | | | | | | | |
Primary Class | | | (1,197 | ) | | | (15 | ) |
Institutional Class | | | (46 | ) | | | (1 | ) |
| | |
Change in net assets from fund share transactions: | | | | | | | | |
Primary Class | | | 21,162 | | | | 34,481 | |
Institutional Class | | | 4,852 | | | | (8,584 | ) |
| | |
Change in net assets | | | 16,786 | | | | 29,988 | |
| | |
Net Assets: | | | | | | | | |
| | |
Beginning of period | | | 416,758 | | | | 386,770 | |
| | |
End of period | | $ | 433,544 | | | $ | 416,758 | |
| | |
Overdistributed net investment income | | $ | (114 | ) | | $ | (116 | ) |
| | |
See notes to financial statements.
55
Semi-Annual Report to Shareholders
Financial Highlights
Investment Grade Income Portfolio
Contained below is per share operating performance data for a share of common stock outstanding, total investment return, ratios to average net assets and other supplemental data. This information has been derived from information provided in the financial statements.
Primary Class:
| | | | | | | | | | | | | | | | | | | | | | | | |
| | | Six Months Ended June 30,
2007 | | | Years Ended December 31, | |
| | | | 2006 | | | 2005 | | | 2004 | | | 2003 | | | 2002 | |
| | |
| | | (Unaudited) | | | | | | | | | | | | | | | | |
Net asset value, beginning of period | | $ | 10.49 | | | $ | 10.40 | | | $ | 10.81 | | | $ | 10.88 | | | $ | 10.42 | | | $ | 10.10 | |
| | | | | | | | | | | | | | | | | | | | | | | | |
Investment operations: | | | | | | | | | | | | | | | | | | | | | | | | |
Net investment income | | | .27 | A | | | .51 | A | | | .49 | | | | .49 | | | | .50 | | | | .54 | |
Net realized and unrealized gain/(loss) | | | (.19 | ) | | | .09 | | | | (.31 | ) | | | .18 | | | | .53 | | | | .32 | |
| | | | | | | | | | | | | | | | | | | | | | | | |
Total from investment operations | | | .08 | | | | .60 | | | | .18 | | | | .67 | | | | 1.03 | | | | .86 | |
| | | | | | | | | | | | | | | | | | | | | | | | |
Distributions from: | | | | | | | | | | | | | | | | | | | | | | | | |
Net investment income | | | (.27 | ) | | | (.51 | ) | | | (.49 | ) | | | (.49 | ) | | | (.50 | ) | | | (.54 | ) |
Net realized gain on investments | | | (.03 | ) | | | — | B | | | (.10 | ) | | | (.25 | ) | | | (.07 | ) | | | — | |
| | | | | | | | | | | | | | | | | | | | | | | | |
Total distributions | | | (.30 | ) | | | (.51 | ) | | | (.59 | ) | | | (.74 | ) | | | (.57 | ) | | | (.54 | ) |
| | | | | | | | | | | | | | | | | | | | | | | | |
Net asset value, end of period | | $ | 10.27 | | | $ | 10.49 | | | $ | 10.40 | | | $ | 10.81 | | | $ | 10.88 | | | $ | 10.42 | |
| | | | | | | | | | | | | | | | | | | | | | | | |
Total return | | | .90 | %C | | | 6.01 | % | | | 1.69 | % | | | 6.29 | % | | | 10.16 | % | | | 8.82 | % |
| | | | | | |
Ratios to Average Net Assets:D | | | | | | | | | | | | | | | | | | | | | | | | |
Total expenses | | | 1.27 | %E | | | 1.33 | % | | | 1.30 | % | | | 1.27 | % | | | 1.28 | % | | | 1.30 | % |
Expenses net of waivers, if any | | | 1.00 | %E | | | 1.00 | % | | | 1.00 | % | | | 1.00 | % | | | 1.00 | % | | | 1.00 | % |
Expenses net of all reductions | | | 1.00 | %E | | | 1.00 | % | | | 1.00 | % | | | 1.00 | % | | | 1.00 | % | | | 1.00 | % |
Net investment income | | | 5.11 | %E | | | 4.98 | % | | | 4.64 | % | | | 4.47 | % | | | 4.62 | % | | | 5.32 | % |
Supplemental Data: | | | | | | | | | | | | | | | | | | | | | | | | |
Portfolio turnover rate | | | 23.5 | %C | | | 65.7 | % | | | 51.1 | % | | | 74.9 | % | | | 78.2 | % | | | 131.0 | % |
Net assets, end of period (in thousands) | | $ | 417,136 | | | $ | 404,864 | | | $ | 366,329 | | | $ | 403,361 | | | $ | 408,685 | | | $ | 334,763 | |
| | |
A | Computed using average daily shares outstanding. |
B | Amount represents less than $.01 per share. |
D | Total expenses reflects operating expenses prior to any voluntary expense waivers and/or compensating balance credits. Expenses net of waivers reflects total expenses before compensating balance credits but net of any voluntary expense waivers. Expenses net of all reductions reflects expenses less any compensating balance credits and/or voluntary expense waivers. |
See notes to financial statements.
56
Semi-Annual Report to Shareholders
Institutional Class:
| | | | | | | | | | | | | | | | | | | | | | | | |
| | | Six Months Ended June 30, 2007 | | | Years Ended December 31, | |
| | | | 2006 | | | 2005 | | | 2004 | | | 2003 | | | 2002 | |
| | |
| | | (Unaudited) | | | | | | | | | | | | | | | | |
Net asset value, beginning of period | | $ | 10.49 | | | $ | 10.41 | | | $ | 10.82 | | | $ | 10.89 | | | $ | 10.43 | | | $ | 10.11 | |
| | | | | | | | | | | | | | | | | | | | | | | | |
Investment operations: | | | | | | | | | | | | | | | | | | | | | | | | |
Net investment income | | | .29 | A | | | .56 | A | | | .55 | | | | .54 | | | | .55 | | | | .59 | |
Net realized and unrealized gain/(loss) | | | (.18 | ) | | | .08 | | | | (.31 | ) | | | .17 | | | | .53 | | | | .31 | |
| | | | | | | | | | | | | | | | | | | | | | | | |
Total from investment operations | | | .11 | | | | .64 | | | | .24 | | | | .71 | | | | 1.08 | | | | .90 | |
| | | | | | | | | | | | | | | | | | | | | | | | |
Distributions from: | | | | | | | | | | | | | | | | | | | | | | | | |
Net investment income | | | (.29 | ) | | | (.56 | ) | | | (.55 | ) | | | (.53 | ) | | | (.55 | ) | | | (.58 | ) |
Net realized gain on investments | | | (.03 | ) | | | — | B | | | (.10 | ) | | | (.25 | ) | | | (.07 | ) | | | — | |
| | | | | | | | | | | | | | | | | | | | | | | | |
Total distributions | | | (.32 | ) | | | (.56 | ) | | | (.65 | ) | | | (.78 | ) | | | (.62 | ) | | | (.58 | ) |
| | | | | | | | | | | | | | | | | | | | | | | | |
Net asset value, end of period | | $ | 10.28 | | | $ | 10.49 | | | $ | 10.41 | | | $ | 10.82 | | | $ | 10.89 | | | $ | 10.43 | |
| | | | | | | | | | | | | | | | | | | | | | | | |
Total return | | | 1.15 | %C | | | 6.45 | % | | | 2.27 | % | | | 6.85 | % | | | 10.71 | % | | | 9.38 | % |
| | | | | | |
Ratios to Average Net Assets:D | | | | | | | | | | | | | | | | | | | | | | | | |
Total expenses | | | .77 | %E | | | .74 | % | | | .74 | % | | | .74 | % | | | .78 | % | | | .78 | % |
Expenses net of waivers, if any | | | .50 | %E | | | .50 | % | | | .44 | % | | | .47 | % | | | .50 | % | | | .48 | % |
Expenses net of all reductions | | | .50 | %E | | | .50 | % | | | .44 | % | | | .47 | % | | | .50 | % | | | .48 | % |
Net investment income | | | 5.61 | %E | | | 5.47 | % | | | 5.26 | % | | | 5.02 | % | | | 5.13 | % | | | 5.85 | % |
Supplemental Data: | | | | | | | | | | | | | | | | | | | | | | | | |
Portfolio turnover rate | | | 23.5 | %C | | | 65.7 | % | | | 51.1 | % | | | 74.9 | % | | | 78.2 | % | | | 131.0 | % |
Net assets, end of period (in thousands) | | $ | 16,408 | | | $ | 11,894 | | | $ | 20,441 | | | $ | 10,216 | | | $ | 5,895 | | | $ | 2,836 | |
| | |
See notes to financial statements.
57
Semi-Annual Report to Shareholders
Expense Example
Limited Duration Bond Portfolio
As a shareholder of the Fund, you incur ongoing costs, including management fees, distribution and service (12b-1) fees on Primary Class shares; and other Fund expenses. These examples are intended to help you understand your ongoing costs (in dollars) of investing in the Fund and to compare these costs with the ongoing costs of investing in other mutual funds. Each example is based on an investment of $1,000 invested on January 1, 2007, and held through June 30, 2007.
Actual Expenses
The first line for each class in the table below provides information about actual account values and actual expenses for each class. You may use the information in this line, together with the amount you invested, to estimate the expenses that you paid over the period. Simply divide your account value by $1,000 (for example, an $8,600 account value divided by $1,000 = 8.6), then multiply the result by the number in the first line under the heading entitled “Expenses Paid During the Period” to estimate the expenses you paid on your account if your shares were held for the entire period.
Hypothetical Example for Comparison Purposes
The second line for each class in the table below provides information about hypothetical account values and hypothetical expenses based on the relevant class’s actual expense ratio and an assumed rate of return of 5% per year before expenses, which is not the class’s actual return. The hypothetical account values and expenses may not be used to estimate the actual ending account balance or expenses you paid for the period. You may use this information to compare the ongoing costs of investing in the Fund and other funds. To do so, compare these 5% hypothetical examples with the 5% hypothetical examples for the relevant class that appear in the shareholder reports of other funds.
| | | | | | | | | |
| | | Beginning Account Value 1/1/07 | | Ending Account Value 6/30/07 | | Expenses PaidA During the Period 1/1/07 to 6/30/07 |
Primary Class: | | | | | | | | | |
Actual | | $ | 1,000.00 | | $ | 1,018.40 | | $ | 5.00 |
Hypothetical (5% return before expenses) | | | 1,000.00 | | | 1,019.84 | | | 5.01 |
Institutional Class: | | | | | | | | | |
Actual | | $ | 1,000.00 | | $ | 1,021.90 | | $ | 2.51 |
Hypothetical (5% return before expenses) | | | 1,000.00 | | | 1,022.32 | | | 2.51 |
A | These calculations are based on expenses incurred in the most recent fiscal half-year. The dollar amounts shown as “Expenses Paid” are equal to the annualized expense ratios of 1.00% and 0.50% for the Primary Class and Institutional Class respectively, multiplied by the average values over the period, multiplied by the number of days in the most recent fiscal half-year (181), and divided by 365. |
58
Semi-Annual Report to Shareholders
Performance Information
Limited Duration Bond Portfolio
The graphs on the following pages compare the Fund’s total returns to that of a closely matched broad-based securities market index. The lines illustrate the cumulative total return of an initial $10,000 investment in Primary Class shares and an initial $1,000,000 investment in Institutional Class shares of the Fund, for the periods indicated. The lines for the Fund represent the total return after deducting all Fund investment management and other administrative expenses and the transaction costs of buying and selling securities. The line representing the securities market index does not take into account any transaction costs associated with buying and selling securities in the index or other administrative expenses. Both the Fund’s and the index’s results assume reinvestment of all dividends and distributions.
Total return measures investment performance in terms of appreciation or depreciation in a fund’s net asset value per share, plus dividends and any capital gain distributions. It assumes that dividends and distributions were reinvested at the time they were paid. Average annual returns tend to smooth out variations in a fund’s return, so that they differ from actual year-to-year results.
59
Semi-Annual Report to Shareholders
Performance Information—Continued
Growth of a $10,000 Investment—Primary Class
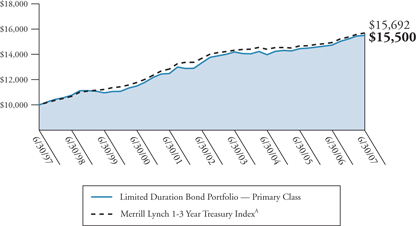
Periods Ended June 30, 2007
| | | | | | |
| | | Cumulative
Total Return | | | Average Annual
Total Return | |
One Year | | +5.17 | % | | +5.17 | % |
Five Years | | +16.21 | % | | +3.05 | % |
Ten Years | | +55.00 | % | | +4.48 | % |
The performance data quoted represents past performance and does not guarantee future results. The performance stated may have been due to extraordinary market conditions, which may not be duplicated in the future. Current performance may be lower or higher than the performance data quoted. To obtain the most recent month-end performance information please visit www.leggmasonfunds.com. The investment return and principal value of the Fund will fluctuate so that an investor’s shares, when redeemed, may be worth more or less than the original cost. Calculations assume reinvestment of dividends and capital gain distributions. Performance would have been lower if fees had not been waived in various periods.
The graph and table do not reflect the deduction of taxes that a shareholder would pay on Fund distributions or the redemption of Fund shares.
A | A total rate of return index based on daily closing prices and consisting of Treasury bills with a maturity of 1-3 years. |
60
Semi-Annual Report to Shareholders
Growth of a $1,000,000 Investment—Institutional Class
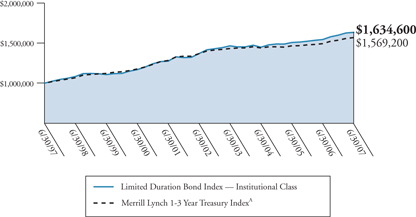
Periods Ended June 30, 2007
| | | | | | |
| | | Cumulative
Total Return | | | Average Annual
Total Return | |
One Year | | +5.80 | % | | +5.80 | % |
Five Years | | +19.34 | % | | +3.60 | % |
Ten Years | | +63.46 | % | | +5.04 | % |
The performance data quoted represents past performance and does not guarantee future results. The performance stated may have been due to extraordinary market conditions, which may not be duplicated in the future. Current performance may be lower or higher than the performance data quoted. To obtain the most recent month-end performance information please call 1-888-425-6432. The investment return and principal value of the Fund will fluctuate so that an investor’s shares, when redeemed, may be worth more or less than the original cost. Calculations assume reinvestment of dividends and capital gain distributions. Performance would have been lower if fees had not been waived in various periods.
The graph and table do not reflect the deduction of taxes that a shareholder would pay on Fund distributions or the redemption of Fund shares.
61
Semi-Annual Report to Shareholders
Performance Information—Continued
Portfolio Composition (as of June 30, 2007)B
Standard & Poor’s Debt RatingsC (as a percentage of the portfolio)
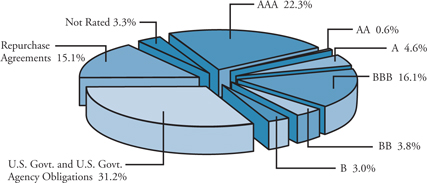
Maturity Schedule (as a percentage of the portfolio)
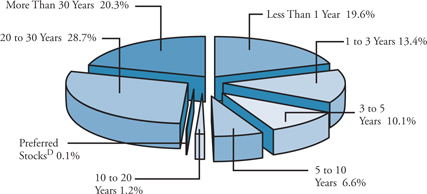
B | The Fund is actively managed. As a result, the composition of its portfolio holdings and sectors is subject to change at any time. |
C | Standard & Poor’s Ratings Services provide capital markets with credit ratings for the evaluation and assessment of credit risk. |
D | Preferred Stocks do not have a defined maturity date. |
62
Semi-Annual Report to Shareholders
Portfolio of Investments
Limited Duration Bond Portfolio
June 30, 2007 (Unaudited)
(Amounts in Thousands)
| | | | | | | | | | | | |
| | | Rate | | | Maturity Date | | Par/Shares | | Value | |
Long-Term Securities — 98.8% | | | | | | | | | | | | |
| | | | |
Corporate Bonds and Notes — 24.6% | | | | | | | | | | | | |
Airlines — 0.5% | | | | | | | | | | | | |
Northwest Airlines Inc. | | 6.110 | % | | 5/20/14 | | $ | 961 | | $ | 974 | A |
| | | | | | | | | | | | |
| | | | |
Capital Markets — 0.2% | | | | | | | | | | | | |
Goldman Sachs Capital III | | 6.130 | % | | 9/1/07 | | | 490 | | | 490 | A |
| | | | | | | | | | | | |
| | | | |
Commercial Banks — 1.7% | | | | | | | | | | | | |
HSBC Bank PLC | | 8.190 | % | | 7/20/12 | | | 1,000 | | | 1,000 | B,C |
SunTrust Capital VIII | | 6.100 | % | | 12/1/66 | | | 120 | | | 110 | D |
Wachovia Capital Trust III | | 5.800 | % | | 3/15/42 | | | 1,960 | | | 1,951 | D |
Wells Fargo Capital X | | 5.950 | % | | 12/15/36 | | | 300 | | | 280 | D |
| | | | | | | | | | | | |
| | | | | | | | | | | 3,341 | |
| | | | | | | | | | | | |
| | | | |
Commercial Services and Supplies — 0.6% | | | | | | | | | | | | |
Waste Management Inc. | | 7.375 | % | | 8/1/10 | | | 1,150 | | | 1,205 | |
| | | | | | | | | | | | |
| | | | |
Consumer Finance — 5.5% | | | | | | | | | | | | |
American Express Co. | | 6.800 | % | | 9/1/66 | | | 600 | | | 618 | D |
Ford Motor Credit Co. | | 6.190 | % | | 9/28/07 | | | 1,020 | | | 1,020 | A |
Ford Motor Credit Co. | | 6.625 | % | | 6/16/08 | | | 4,810 | | | 4,807 | |
GMAC LLC | | 6.510 | % | | 9/23/08 | | | 4,000 | | | 4,000 | A |
Nelnet Inc. | | 7.400 | % | | 9/29/36 | | | 380 | | | 379 | D |
| | | | | | | | | | | | |
| | | | | | | | | | | 10,824 | |
| | | | | | | | | | | | |
| | | | |
Diversified Financial Services — 1.8% | | | | | | | | | | | | |
AGFC Capital Trust I | | 6.000 | % | | 1/15/67 | | | 1,290 | | | 1,234 | C,D |
Capmark Financial Group Inc. | | 5.875 | % | | 5/10/12 | | | 400 | | | 395 | B,C |
Residential Capital Corp. | | 6.660 | % | | 11/21/08 | | | 2,000 | | | 2,005 | B |
| | | | | | | | | | | | |
| | | | | | | | | | | 3,634 | |
| | | | | | | | | | | | |
| | | | |
Diversified Telecommunication Services — 0.2% | | | | | | | | | | | | |
Verizon Global Funding Corp. | | 7.250 | % | | 12/1/10 | | | 400 | | | 422 | |
| | | | | | | | | | | | |
63
Semi-Annual Report to Shareholders
Portfolio of Investments—Continued
Limited Duration Bond Portfolio—Continued
| | | | | | | | | | | | |
| | | Rate | | | Maturity Date | | Par/Shares | | Value | |
Corporate Bonds and Notes—Continued | | | | | | | | | | | | |
Electric Utilities — 0.8% | | | | | | | | | | | | |
Alabama Power Co. | | 5.550 | % | | 8/25/09 | | $ | 1,000 | | $ | 1,003 | A |
Niagara Mohawk Power Corp. | | 7.750 | % | | 10/1/08 | | | 460 | | | 472 | |
| | | | | | | | | | | | |
| | | | | | | | | | | 1,475 | |
| | | | | | | | | | | | |
| | | | |
Health Care Equipment and Supplies — 0.3% | | | | | | | | | | | | |
Hospira Inc. | | 5.550 | % | | 3/30/12 | | | 500 | | | 496 | |
| | | | | | | | | | | | |
| | | | |
Health Care Providers and Services — 0.1% | | | | | | | | | | | | |
Quest Diagnostics Inc. | | 5.125 | % | | 11/1/10 | | | 180 | | | 176 | |
| | | | | | | | | | | | |
| | | | |
Hotels, Restaurants and Leisure — 0.2% | | | | | | | | | | | | |
Caesars Entertainment Inc. | | 7.500 | % | | 9/1/09 | | | 330 | | | 338 | |
Harrah’s Operating Co. Inc. | | 5.956 | % | | 2/8/08 | | | 150 | | | 150 | A,C |
| | | | | | | | | | | | |
| | | | | | | | | | | 488 | |
| | | | | | | | | | | | |
| | | | |
Independent Power Producers and Energy Traders — 0.6% | | | | | | | | | | | | |
TXU Corp. | | 4.800 | % | | 11/15/09 | | | 1,160 | | | 1,129 | |
| | | | | | | | | | | | |
| | | | |
Insurance — 0.2% | | | | | | | | | | | | |
Merna Re | | 7.110 | % | | 7/1/12 | | | 400 | | | 400 | A |
| | | | | | | | | | | | |
| | | | |
IT Services — 0.5% | | | | | | | | | | | | |
Electronic Data Systems Corp. | | 7.125 | % | | 10/15/09 | | | 1,000 | | | 1,029 | |
| | | | | | | | | | | | |
| | | | |
Leisure Equipment and Products — 0.1% | | | | | | | | | | | | |
Eastman Kodak Co. | | 7.250 | % | | 11/15/13 | | | 110 | | | 110 | |
| | | | | | | | | | | | |
64
Semi-Annual Report to Shareholders
| | | | | | | | | | | |
| | | Rate | | | Maturity Date | | Par/Shares | | Value |
Corporate Bonds and Notes—Continued | | | | | | | | | | | |
Media — 2.2% | | | | | | | | | | | |
Clear Channel Communications Inc. | | 6.625 | % | | 6/15/08 | | $ | 140 | | $ | 141 |
Clear Channel Communications Inc. | | 4.250 | % | | 5/15/09 | | | 790 | | | 764 |
Comcast Cable Communications Inc. | | 6.875 | % | | 6/15/09 | | | 1,100 | | | 1,126 |
Comcast MO of Delaware Inc. | | 9.000 | % | | 9/1/08 | | | 300 | | | 311 |
Liberty Media LLC | | 7.875 | % | | 7/15/09 | | | 1,110 | | | 1,151 |
Time Warner Inc. | | 5.500 | % | | 11/15/11 | | | 830 | | | 821 |
| | | | | | | | | | | |
| | | | | | | | | | | 4,314 |
| | | | | | | | | | | |
| | | | |
Multi-Utilities — 1.5% | | | | | | | | | | | |
CenterPoint Energy Inc. | | 5.875 | % | | 6/1/08 | | | 440 | | | 440 |
Dominion Resources Inc. | | 4.750 | % | | 12/15/10 | | | 500 | | | 488 |
Sempra Energy | | 5.830 | % | | 5/21/08 | | | 2,000 | | | 2,001 |
| | | | | | | | | | | |
| | | | | | | | | | | 2,929 |
| | | | | | | | | | | |
| | | | |
Multiline Retail — 0.2% | | | | | | | | | | | |
Federated Retail Holdings Inc. | | 5.350 | % | | 3/15/12 | | | 330 | | | 324 |
May Department Stores Co. | | 5.750 | % | | 7/15/14 | | | 110 | | | 106 |
| | | | | | | | | | | |
| | | | | | | | | | | 430 |
| | | | | | | | | | | |
| | | | |
Office Electronics — 0.2% | | | | | | | | | | | |
Xerox Corp. | | 5.500 | % | | 5/15/12 | | | 330 | | | 324 |
| | | | | | | | | | | |
65
Semi-Annual Report to Shareholders
Portfolio of Investments—Continued
Limited Duration Bond Portfolio—Continued
| | | | | | | | | | | | |
| | | Rate | | | Maturity Date | | Par/Shares | | Value | |
Corporate Bonds and Notes—Continued | | | | | | | | | | | | |
Oil, Gas and Consumable Fuels — 3.5% | | | | | | | | | | | | |
Apache Corp. | | 6.250 | % | | 4/15/12 | | $ | 520 | | $ | 533 | |
Devon Financing Corp. ULC | | 6.875 | % | | 9/30/11 | | | 350 | | | 366 | |
El Paso Natural Gas Co. | | 5.950 | % | | 4/15/17 | | | 590 | | | 572 | C |
Hess Corp. | | 6.650 | % | | 8/15/11 | | | 510 | | | 527 | |
Kinder Morgan Energy Partners LP | | 6.750 | % | | 3/15/11 | | | 810 | | | 838 | |
Pemex Project Funding Master Trust | | 5.960 | % | | 12/3/12 | | | 3,490 | | | 3,535 | A,C |
XTO Energy Inc. | | 5.650 | % | | 4/1/16 | | | 440 | | | 427 | |
| | | | | | | | | | | | |
| | | | | | | | | | | 6,798 | |
| | | | | | | | | | | | |
| | | | |
Paper and Forest Products — 0.1% | | | | | | | | | | | | |
Weyerhaeuser Co. | | 5.950 | % | | 11/1/08 | | | 170 | | | 171 | |
| | | | | | | | | | | | |
| | | | |
Real Estate Investment Trusts — 1.2% | | | | | | | | | | | | |
iStar Financial Inc. | | 5.700 | % | | 9/15/09 | | | 1,330 | | | 1,332 | A |
iStar Financial Inc. | | 5.650 | % | | 9/15/11 | | | 1,000 | | | 985 | |
| | | | | | | | | | | | |
| | | | | | | | | | | 2,317 | |
| | | | | | | | | | | | |
| | | | |
Thrifts and Mortgage Finance — 0.1% | | | | | | | | | | | | |
Residential Capital Corp. | | 6.457 | % | | 4/17/09 | | | 200 | | | 200 | A |
| | | | | | | | | | | | |
| | | | |
Tobacco — 1.5% | | | | | | | | | | | | |
Altria Group Inc. | | 5.625 | % | | 11/4/08 | | | 3,000 | | | 3,002 | |
| | | | | | | | | | | | |
66
Semi-Annual Report to Shareholders
| | | | | | | | | | | | |
| | | Rate | | | Maturity Date | | Par/Shares | | Value | |
Corporate Bonds and Notes—Continued | | | | | | | | | | | | |
Wireless Telecommunication Services — 0.8% | | | | | | | | | | | | |
Sprint Capital Corp. | | 6.125 | % | | 11/15/08 | | $ | 1,150 | | $ | 1,157 | |
Sprint Capital Corp. | | 6.375 | % | | 5/1/09 | | | 30 | | | 30 | |
Vodafone Group PLC | | 5.350 | % | | 2/27/12 | | | 450 | | | 442 | |
| | | | | | | | | | | | |
| | | | | | | | | | | 1,629 | |
| | | | | | | | | | | | |
Total Corporate Bonds and Notes (Cost — $48,502) | | | | | | | | | | | 48,307 | |
| | | | | | | | | | | | |
| | | | |
Asset-Backed Securities — 8.8% | | | | | | | | | | | | |
Fixed Rate Securities — 2.0% | | | | | | | | | | | | |
Countryplace Manufactured Housing Contract Trust 2007-1 A1 | | 5.484 | % | | 7/15/37 | | | 1,235 | | | 1,230 | C |
MBNA Practice Solutions Owner Trust 2005-2 | | 4.100 | % | | 5/15/09 | | | 1,063 | | | 1,060 | C |
Prestige Auto Receivables Trust 2005-1A | | 4.370 | % | | 6/16/12 | | | 1,120 | | | 1,107 | C |
Structured Asset Securities Corp. 2003-AL1 | | 3.357 | % | | 4/25/31 | | | 607 | | | 545 | C |
| | | | | | | | | | | | |
| | | | | | | | | | | 3,942 | |
| | | | | | | | | | | | |
| | | | |
Indexed SecuritiesA — 6.7% | | | | | | | | | | | | |
Asset Backed Funding Certificates 2002-WF2 | | 6.445 | % | | 5/25/32 | | | 221 | | | 222 | |
Bear Stearns Asset Backed Securities Inc. 2004-1 | | 5.840 | % | | 6/25/34 | | | 2,236 | | | 2,250 | |
Citigroup Mortgage Loan Trust Inc. 2007-SHL1 A | | 5.720 | % | | 11/25/46 | | | 1,911 | | | 1,912 | C |
Countrywide Home Equity Loan Trust 2004-O | | 5.600 | % | | 2/15/34 | | | 538 | | | 539 | |
Lehman XS Trust 2005-5N 3A1A | | 5.620 | % | | 11/25/35 | | | 1,722 | | | 1,726 | |
67
Semi-Annual Report to Shareholders
Portfolio of Investments—Continued
Limited Duration Bond Portfolio—Continued
| | | | | | | | | | | | |
| | | Rate | | | Maturity Date | | Par/Shares | | Value | |
Asset-Backed Securities—Continued | | | | | | | | | | | | |
Indexed Securities—Continued | | | | | | | | | | | | |
Long Beach Mortgage Loan Trust 2006-A A1 | | 5.410 | % | | 5/25/36 | | $ | 1,301 | | $ | 1,272 | |
RAAC Series 2005-RP1 | | 5.660 | % | | 7/25/37 | | | 485 | | | 485 | C |
Rental Car Finance Corp. 2004-1A | | 5.520 | % | | 6/25/09 | | | 3,000 | | | 3,002 | C |
Securitized Asset Backed Receivables LLC 2006-FR3 A2 | | 5.460 | % | | 5/25/36 | | | 1,700 | | | 1,700 | |
| | | | | | | | | | | | |
| | | | | | | | | | | 13,108 | |
| | | | | | | | | | | | |
| | | | |
Stripped Securities — 0.1% | | | | | | | | | | | | |
HSI Asset Securitization Corp. Trust 2006-OPT4 | | 1.500 | % | | 3/25/36 | | | 19,810 | | | 172 | E1 |
| | | | | | | | | | | | |
Total Asset-Backed Securities (Cost — $17,492) | | | | | | | | | | | 17,222 | |
| | | | | | | | | | | | |
| | | | |
Mortgage-Backed Securities — 18.4% | | | | | | | | | | | | |
Fixed Rate Securities — 1.9% | | | | | | | | | | | | |
BlackRock Capital Finance LP 1997-R3 | | 7.220 | % | | 11/25/28 | | | 27 | | | 27 | C |
Residential Asset Mortgage Products Inc. 2005-SL1 | | 8.000 | % | | 5/25/32 | | | 1,351 | | | 1,423 | |
Washington Mutual MSC Mortgage Pass-Through Certificates Series 2004-RA1 | | 7.000 | % | | 3/25/34 | | | 2,171 | | | 2,193 | |
| | | | | | | | | | | | |
| | | | | | | | | | | 3,643 | |
| | | | | | | | | | | | |
| | | | |
Indexed SecuritiesA — 14.1% | | | | | | | | | | | | |
Banc of America Mortgage Securities 2005-F | | 5.011 | % | | 7/25/35 | | | 2,067 | | | 2,040 | |
Bear Stearns Alt-A Trust 2007-1 1A1 | | 5.480 | % | | 1/25/47 | | | 2,351 | | | 2,350 | |
Bear Stearns ARM Trust 2004-10 | | 4.459 | % | | 1/25/35 | | | 633 | | | 629 | |
68
Semi-Annual Report to Shareholders
| | | | | | | | | | | | |
| | | Rate | | | Maturity Date | | Par/Shares | | Value | |
Mortgage-Backed Securities—Continued | | | | | | | | | | | | |
Indexed Securities—Continued | | | | | | | | | | | | |
Countrywide Alternative Loan Trust 2005-59 1A1 | | 5.649 | % | | 11/20/35 | | $ | 1,469 | | $ | 1,474 | |
Countrywide Alternative Loan Trust 2006-0A2 A5 | | 5.550 | % | | 5/20/46 | | | 1,852 | | | 1,852 | |
Countrywide Alternative Loan Trust 2007-AL1 A1 | | 5.570 | % | | 6/25/37 | | | 1,200 | | | 1,200 | |
Harborview Mortgage Loan Trust 2004-8 3A2 | | 5.720 | % | | 11/29/34 | | | 601 | | | 604 | |
HomeBanc Mortgage Trust 2004-2 A1 | | 5.690 | % | | 12/25/34 | | | 1,213 | | | 1,215 | |
HomeBanc Mortgage Trust 2005-1 A1 | | 5.570 | % | | 3/25/35 | | | 1,658 | | | 1,660 | |
Impac CMB Trust 2004-6 1A2 | | 5.710 | % | | 10/25/34 | | | 398 | | | 398 | |
JPMorgan Mortgage Trust 2003-A1 | | 4.341 | % | | 10/25/33 | | | 2,148 | | | 2,092 | |
MASTR Adjustable Rate Mortgages Trust 2004-13 | | 3.786 | % | | 11/21/34 | | | 3,000 | | | 2,939 | |
MASTR Specialized Loan Trust 2006-01 A | | 5.620 | % | | 1/25/36 | | | 703 | | | 703 | C |
Sequoia Mortgage Trust 2003-2 A2 | | 5.701 | % | | 6/20/33 | | | 427 | | | 427 | |
Thornburg Mortgage Securities Trust 2005-2 A4 | | 5.570 | % | | 7/25/45 | | | 2,117 | | | 2,119 | |
Thornburg Mortgage Securities Trust 2005-4 A2 | | 5.530 | % | | 12/25/35 | | | 1,890 | | | 1,890 | |
WaMu Alternative Mortgage Pass-Through Certificates 2006-AR01 A1B | | 5.640 | % | | 2/25/36 | | | 1,410 | | | 1,417 | |
69
Semi-Annual Report to Shareholders
Portfolio of Investments—Continued
Limited Duration Bond Portfolio—Continued
| | | | | | | | | | | | |
| | | Rate | | | Maturity Date | | Par/Shares | | Value | |
Mortgage-Backed Securities—Continued | | | | | | | | | | | | |
Indexed Securities—Continued | | | | | | | | | | | | |
WaMu Mortgage Pass-Through Certificates 2003-AR10 | | 4.058 | % | | 10/25/33 | | $ | 2,100 | | $ | 2,088 | |
WaMu Mortgage Pass-Through Certificates 2004-AR08 A1 | | 5.795 | % | | 6/25/44 | | | 688 | | | 690 | |
| | | | | | | | | | | | |
| | | | | | | | | | | 27,787 | |
| | | | | | | | | | | | |
| | | | |
Stripped Securities—N.M. | | | | | | | | | | | | |
Nomura Asset Acceptance Corp. Series 2006-AP1 AI0 | | 4.500 | % | | 1/25/36 | | | 192 | | | 3 | E1 |
| | | | | | | | | | | | |
| | | | |
Variable Rate SecuritiesF — 2.4% | | | | | | | | | | | | |
Banc of America Funding Corp. 2004-B | | 4.176 | % | | 12/20/34 | | | 772 | | | 771 | |
Citigroup Mortgage Loan Trust Inc. 2007-AR4 2A1A | | 5.536 | % | | 3/25/37 | | | 1,932 | | | 1,927 | |
Countrywide Alternative Loan Trust 2004-33 1A1 | | 4.963 | % | | 12/25/34 | | | 575 | | | 584 | |
Countrywide Alternative Loan Trust 2004-33 2A1 | | 4.951 | % | | 12/25/34 | | | 308 | | | 309 | |
Prime Mortgage Trust 2005-2 | | 7.389 | % | | 10/25/32 | | | 1,182 | | | 1,207 | |
| | | | | | | | | | | | |
| | | | | | | | | | | 4,798 | |
| | | | | | | | | | | | |
Total Mortgage-Backed Securities (Cost — $36,363) | | | | | | | | | | | 36,231 | |
| | | | | | | | | | | | |
70
Semi-Annual Report to Shareholders
| | | | | | | | | | | | |
| | | Rate | | | Maturity Date | | Par/Shares | | Value | |
U.S. Government and Agency Obligations — 6.3% | | | | | | | | | | | | |
Fixed Rate Securities — 2.4% | | | | | | | | | | | | |
Freddie Mac | | 5.000 | % | | 6/11/09 | | $ | 1,800 | | $ | 1,794 | |
United States Treasury Bonds | | 5.375 | % | | 2/15/31 | | | 190 | | | 195 | |
United States Treasury Notes | | 4.500 | % | | 5/15/10 | | | 2,100 | | | 2,078 | |
United States Treasury Notes | | 4.625 | % | | 10/31/11 | | | 570 | | | 563 | |
| | | | | | | | | | | | |
| | | | | | | | | | | 4,630 | |
| | | | | | | | | | | | |
| | | | |
Treasury Inflation-Protected SecuritiesG — 3.9% | | | | | | | | | | | | |
United States Treasury Inflation-Protected Security | | 2.500 | % | | 7/15/16 | | | 1,330 | | | 1,315 | |
United States Treasury Inflation-Protected Security | | 2.375 | % | | 1/15/17 | | | 4,191 | | | 4,092 | |
United States Treasury Inflation-Protected Security | | 2.375 | % | | 1/15/25 | | | 2,445 | | | 2,351 | |
| | | | | | | | | | | | |
| | | | | | | | | | | 7,758 | |
| | | | | | | | | | | | |
Total U.S. Government and Agency Obligations (Cost — $12,545) | | | | | | | | | | | 12,388 | |
| | | | | | | | | | | | |
| | | | |
U.S. Government Agency Mortgage-Backed Securities — 29.9% | | | | | | | | | | | | |
Fixed Rate Securities — 20.5% | | | | | | | | | | | | |
Fannie Mae | | 8.500 | % | | 6/1/10 to 8/1/11 | | | 7 | | | 7 | |
Fannie Mae | | 7.000 | % | | 1/1/13 to 1/1/33 | | | 4,105 | | | 4,257 | |
Fannie Mae | | 6.500 | % | | 7/1/13 to 10/1/32 | | | 1,280 | | | 1,299 | |
Fannie Mae | | 9.500 | % | | 7/1/14 | | | 19 | | | 20 | |
Fannie Mae | | 11.000 | % | | 12/1/15 | | | 38 | | | 41 | |
Fannie Mae | | 12.500 | % | | 1/1/18 to 4/1/18 | | | 27 | | | 29 | |
Fannie Mae | | 9.000 | % | | 11/1/21 | | | 84 | | | 89 | |
Fannie Mae | | 6.000 | % | | 11/1/27 | | | 0.3 | | | — | H |
Fannie Mae | | 5.500 | % | | 4/1/36 | | | 1,686 | | | 1,617 | |
Fannie Mae | | 5.000 | % | | 12/1/37 | | | 15,750 | | | 14,742 | I |
Fannie Mae | | 5.500 | % | | 12/1/37 | | | 2,450 | | | 2,358 | I |
Fannie Mae | | 6.000 | % | | 12/1/37 | | | 12,300 | | | 12,165 | I |
Freddie Mac | | 8.250 | % | | 2/1/08 | | | 0.2 | | | — | H |
Freddie Mac | | 8.500 | % | | 12/1/08 to 6/1/21 | | | 14 | | | 14 | |
71
Semi-Annual Report to Shareholders
Portfolio of Investments—Continued
Limited Duration Bond Portfolio—Continued
| | | | | | | | | | | | |
| | | Rate | | | Maturity Date | | Par/Shares | | Value | |
U.S. Government Agency Mortgage-Backed Securities—Continued | | | | | | | | | | | | |
Fixed Rate Securities—Continued | | | | | | | | | | | | |
Freddie Mac | | 9.750 | % | | 11/1/09 to 11/1/14 | | $ | 9 | | $ | 9 | |
Freddie Mac | | 9.000 | % | | 1/1/17 to 1/1/21 | | | 103 | | | 108 | |
Freddie Mac | | 8.000 | % | | 2/1/31 | | | 200 | | | 211 | |
Freddie Mac | | 7.000 | % | | 4/1/32 | | | 1,520 | | | 1,571 | |
Freddie Mac | | 5.000 | % | | 11/1/35 | | | 175 | | | 165 | |
Government National Mortgage Association | | 6.000 | % | | 5/15/14 to 11/15/28 | | | 230 | | | 231 | |
Government National Mortgage Association | | 9.000 | % | | 6/15/22 to 9/15/22 | | | 2 | | | 2 | |
Government National Mortgage Association | | 6.000 | % | | 12/1/37 | | | 1,300 | | | 1,293 | I |
| | | | | | | | | | | | |
| | | | | | | | | | | 40,228 | |
| | | | | | | | | | | | |
| | | | |
Indexed SecuritiesA — 9.3% | | | | | | | | | | | | |
Fannie Mae | | 4.329 | % | | 10/1/34 | | | 917 | | | 902 | |
Fannie Mae | | 4.218 | % | | 12/1/34 | | | 1,238 | | | 1,217 | |
Fannie Mae | | 4.330 | % | | 1/1/35 | | | 1,037 | | | 1,023 | |
Fannie Mae | | 4.855 | % | | 1/1/35 | | | 1,787 | | | 1,778 | |
Fannie Mae | | 4.781 | % | | 2/1/35 | | | 3,799 | | | 3,793 | |
Fannie Mae | | 4.542 | % | | 3/1/35 | | | 2,089 | | | 2,060 | |
Fannie Mae | | 4.951 | % | | 3/1/35 | | | 3,799 | | | 3,758 | |
Freddie Mac | | 4.356 | % | | 12/1/34 | | | 441 | | | 433 | |
Freddie Mac | | 4.467 | % | | 12/1/34 | | | 2,307 | | | 2,273 | |
Freddie Mac | | 4.086 | % | | 1/1/35 | | | 425 | | | 416 | |
Freddie Mac | | 4.127 | % | | 1/1/35 | | | 716 | | | 702 | |
| | | | | | | | | | | | |
| | | | | | | | | | | 18,355 | |
| | | | | | | | | | | | |
72
Semi-Annual Report to Shareholders
| | | | | | | | | | | | |
| | | Rate | | | Maturity Date | | Par/Shares | | Value | |
U.S. Government Agency Mortgage-Backed Securities—Continued | | | | | | | | | | | | |
Stripped Securities — 0.1% | | | | | | | | | | | | |
Government National Mortgage Association | | 3.125 | % | | 6/16/26 | | $ | 1,659 | | $ | 88 | E1 |
Government National Mortgage Association | | 3.175 | % | | 8/16/26 | | | 1,253 | | | 119 | E1 |
| | | | | | | | | | | | |
| | | | | | | | | | | 207 | |
| | | | | | | | | | | | |
Total U.S. Government Agency Mortgage-Backed Securities (Cost — $60,298) | | | | | | | | | | | 58,790 | |
| | | | | | | | | | | | |
| | | | |
Yankee BondsJ — 10.7% | | | | | | | | | | | | |
Commercial Banks — 3.0% | | | | | | | | | | | | |
Glitnir Banki Hf | | 5.795 | % | | 1/21/11 | | | 1,550 | | | 1,559 | A,C |
Glitnir Banki Hf | | 6.693 | % | | 6/15/16 | | | 50 | | | 51 | C,D |
Kaupthing Bank Hf | | 6.050 | % | | 4/12/11 | | | 1,000 | | | 1,008 | A,C |
Kaupthing Bank Hf | | 5.750 | % | | 10/4/11 | | | 420 | | | 418 | C |
Landsbanki Islands Hf | | 6.100 | % | | 8/25/11 | | | 620 | | | 628 | C |
Resona Preferred Global Securities | | 7.191 | % | | 12/29/49 | | | 830 | | | 849 | C,D |
TuranAlem Finance BV | | 6.730 | % | | 1/22/09 | | | 320 | | | 319 | A,C |
VTB Capital SA for Vneshtorgbank | | 5.955 | % | | 8/1/08 | | | 1,040 | | | 1,041 | A,C |
| | | | | | | | | | | | |
| | | | | | | | | | | 5,873 | |
| | | | | | | | | | | | |
| | | | |
Diversified Financial Services — 1.5% | | | | | | | | | | | | |
Aiful Corp. | | 5.000 | % | | 8/10/10 | | | 1,280 | | | 1,248 | C |
MUFG Capital Finance 1 Ltd. | | 6.346 | % | | 7/29/49 | | | 600 | | | 589 | D |
TNK-BP Finance SA | | 6.875 | % | | 7/18/11 | | | 1,090 | | | 1,102 | C |
| | | | | | | | | | | | |
| | | | | | | | | | | 2,939 | |
| | | | | | | | | | | | |
73
Semi-Annual Report to Shareholders
Portfolio of Investments—Continued
Limited Duration Bond Portfolio—Continued
| | | | | | | | | | | | |
| | | Rate | | | Maturity Date | | Par/Shares | | Value | |
Yankee Bonds—Continued | | | | | | | | | | | | |
Diversified Telecommunication Services — 2.7% | | | | | | | | | | | | |
British Telecommunications PLC | | 8.625 | % | | 12/15/10 | | $ | 1,520 | | $ | 1,661 | B |
Deutsche Telekom International Finance BV | | 8.000 | % | | 6/15/10 | | | 650 | | | 693 | B |
France Telecom SA | | 7.750 | % | | 3/1/11 | | | 570 | | | 609 | |
Koninklijke (Royal) KPN NV | | 8.000 | % | | 10/1/10 | | | 900 | | | 963 | |
Telefonica Emisiones S.A.U. | | 5.660 | % | | 6/19/09 | | | 600 | | | 602 | A |
Telefonica Emisiones S.A.U. | | 5.650 | % | | 2/4/13 | | | 790 | | | 790 | A |
| | | | | | | | | | | | |
| | | | | | | | | | | 5,318 | |
| | | | | | | | | | | | |
| | | | |
Energy Equipment and Services — 0.5% | | | | | | | | | | | | |
SP PowerAssets Ltd. | | 3.800 | % | | 10/22/08 | | | 1,000 | | | 979 | C |
| | | | | | | | | | | | |
| | | | |
Foreign Government — 0.4% | | | | | | | | | | | | |
Russian Federation | | 3.000 | % | | 5/14/08 | | | 890 | | | 870 | |
| | | | | | | | | | | | |
| | | | |
Health Care Equipment and Supplies — 0.2% | | | | | | | | | | | | |
Baxter Finco BV | | 4.750 | % | | 10/15/10 | | | 430 | | | 420 | |
| | | | | | | | | | | | |
| | | | |
Industrial Conglomerates — 0.8% | | | | | | | | | | | | |
Tyco International Group SA | | 6.375 | % | | 10/15/11 | | | 1,480 | | | 1,524 | |
| | | | | | | | | | | | |
| | | | |
Metals and Mining — 0.6% | | | | | | | | | | | | |
Vale Overseas Ltd. | | 6.250 | % | | 1/23/17 | | | 1,130 | | | 1,121 | |
| | | | | | | | | | | | |
| | | | |
Oil, Gas and Consumable Fuels — 1.0% | | | | | | | | | | | | |
Anadarko Finance Co. | | 6.750 | % | | 5/1/11 | | | 1,870 | | | 1,931 | |
| | | | | | | | | | | | |
Total Yankee Bonds (Cost — $21,020) | | | | | | | | | | | 20,975 | |
| | | | | | | | | | | | |
74
Semi-Annual Report to Shareholders
| | | | | | | | | | | | |
| | | Rate | | | Maturity Date | | Par/Shares | | Value | |
Preferred Stocks — 0.1% | | | | | | | | | | | | |
Home Ownership Funding Corp. | | 1.000 | % | | | | | 5 | | $ | 69 | C,D |
Home Ownership Funding Corp. II | | 1.000 | % | | | | | 14 | | | 193 | C,D |
| | | | | | | | | | | | |
Total Preferred Stocks (Cost — $1,537) | | | | | | | | | | | 262 | |
| | | | | | | | | | | | |
Total Long-Term Securities (Cost — $197,756) | | | | | | | | | | | 194,175 | |
| | |
Short-Term Securities — 17.7% | | | | | | | | | | | | |
U.S. Government and Agency Obligations — 0.1% | | | | | | | | | | | | |
Fannie Mae | | 0.000 | % | | 3/17/08 | | $ | 300 | | | 289 | K,L |
| | | | | | | | | | | | |
| | | | |
Repurchase Agreements — 17.6% | | | | | | | | | | | | |
Lehman Brothers Inc. | | | | | | | | | | | | |
5.1%, dated 6/29/07 to be repurchased at $17,007 on 7/02/07 (Collateral: $57,570 Resolution Funding Corp principal-only securities, due 1/15/30, value $17,340) | | | | | | | | 17,000 | | | 17,000 | |
Merrill Lynch Government Securities Inc. | | | | | | | | | | | | |
5.15%, dated 6/29/07 to be repurchased at $17,682 on 7/2/07 (Collateral: $17,682 Fannie Mae notes, 5.60%, due 2/1/17, value $18,027) | | | | | | | | 17,674 | | | 17,674 | |
| | | | | | | | | | | | |
| | | | | | | | | | | 34,674 | |
| | | | | | | | | | | | |
Total Short-Term Securities (Cost — $34,963) | | | | | | | | | | | 34,963 | |
| | |
Total Investments — 116.5% (Cost — $232,719) M | | | | | | | | | | | 229,138 | |
Other Assets Less Liabilities — (16.5)% | | | | | | | | | | | (32,494 | ) |
| | | | | | | | | | | | |
Net Assets — 100.0% | | | | | | | | | | $ | 196,644 | |
| | | | | | | | | | | | |
75
Semi-Annual Report to Shareholders
Portfolio of Investments—Continued
Limited Duration Bond Portfolio—Continued
| | | | | | | | |
| | | Expiration | | Actual
Contracts | | Depreciation | |
Futures Contracts PurchasedN | | | | | | | | |
U.S. Treasury Note Futures | | September 2007 | | 108 | | | (9 | ) |
| | | | | | | | |
| | | | | | $ | (9 | ) |
| | | | | | | | |
Futures Contracts WrittenN | | | | | | | | |
U.S. Treasury Note Futures | | September 2007 | | 56 | | | (63 | ) |
U.S. Treasury Note Futures | | September 2007 | | 221 | | | (19 | ) |
| | | | | | | | |
| | | | | | $ | (82 | ) |
| | | | | | | | |
N.M. Not Meaningful.
A | Indexed Security — The rates of interest earned on these securities are tied to the London Interbank Offered Rate (“LIBOR”), the Consumer Price Index (“CPI”), or the one-year Treasury Bill Rate. The coupon rates are the rates as of June 30, 2007. |
B | Credit Linked Security — The rates of interest earned on these securities are tied to the credit rating assigned by Standard & Poor’s Rating Service and/or Moody’s Investors Services. |
C | Rule 144a Security — A security purchased pursuant to Rule 144a under the Securities Act of 1933 which may not be resold subject to that rule except to qualified institutional buyers. These securities, which the Fund’s investment adviser has determined to be liquid, represent 13.44% of net assets. |
D | Stepped Coupon Security — A security with a predetermined schedule of interest or dividend rate changes at which time it begins to accrue interest or pay dividends according to the predetermined schedule. |
E | Stripped Security — Security with interest-only or principal-only payment streams, denoted by a 1 or 2, respectively. For interest-only securities, the amount shown as principal is the notional balance used to calculate the amount of interest due. |
F | The coupon rates shown on variable rate securities are the rates at June 30, 2007. These rates vary with the weighted average coupon of the underlying loans. |
G | Treasury Inflation-Protected Security — Treasury security whose principal value is adjusted daily in accordance with changes to the Consumer Price Index for All Urban Consumers. Interest is calculated on the basis of the current adjusted principal value. |
H | Amount represents less than $1. |
I | When-issued Security — Security purchased on a delayed delivery basis. Final settlement amount and maturity date have not yet been announced. |
J | Yankee Bond — A dollar-denominated bond issued in the U.S. by foreign entities. |
K | Zero coupon bond — A bond with no periodic interest payments which is sold at such a discount as to produce a current yield to maturity. |
L | All or a portion of this security is collateral to cover futures and options contracts written. |
76
Semi-Annual Report to Shareholders
M | Aggregated costs for federal income tax purposes is substantially the same as book cost. At June 30, 2007, the aggregate gross unrealized appreciation and depreciation of investments for federal income tax purposes was substantially as follows: |
| | | | |
Gross unrealized appreciation | | $ | 379 | |
Gross unrealized depreciation | | $ | (3,960 | ) |
| | | | |
Net unrealized appreciation/(depreciation) | | $ | (3,581 | ) |
| | | | |
N | Futures are described in more detail in the notes to financial statements. |
See notes to financial statements.
77
Semi-Annual Report to Shareholders
Statement of Assets and Liabilities
Limited Duration Bond Portfolio
June 30, 2007 (Unaudited)
(Amounts in Thousands)
| | | | | | | |
Assets: | | | | | | | |
Investment securities at market value (cost – $197,756) | | | | | $ | 194,175 | |
Short-term securities at value (cost – $34,963) | | | | | | 34,963 | |
Receivable for securities sold | | | | | | 9,841 | |
Interest receivable | | | | | | 1,401 | |
Receivable for fund shares sold | | | | | | 92 | |
Other assets | | | | | | 11 | |
| | | | | | | |
Total assets | | | | | | 240,483 | |
| | |
Liabilities: | | | | | | | |
Payable for securities purchased | | $ | 42,729 | | | | |
Payable for fund shares repurchased | | | 489 | | | | |
Income distribution payable | | | 326 | | | | |
Accrued management fee | | | 77 | | | | |
Accrued distribution and service fee | | | 63 | | | | |
Accrued expenses | | | 90 | | | | |
Futures variation margin payable | | | 65 | | | | |
| | | | | | | |
Total liabilities | | | | | | 43,839 | |
| | | | | | | |
Net Assets | | | | | $ | 196,644 | |
| | | | | | | |
Net assets consist of: | | | | | | | |
Accumulated paid-in-capital | | | | | $ | 211,589 | |
Overdistributed net investment income | | | | | | (65 | ) |
Accumulated net realized loss on investments, options and futures | | | | | | (11,208 | ) |
Net unrealized depreciation on investments and futures | | | | | | (3,672 | ) |
| | | | | | | |
Net Assets | | | | | $ | 196,644 | |
| | | | | | | |
Net Asset Value Per Share: | | | | | | | |
Primary Class (18,200 shares outstanding) | | | | | $ | 10.18 | |
| | | | | | | |
Institutional Class (1,110 shares outstanding) | | | | | $ | 10.19 | |
| | | | | | | |
See notes to financial statements.
78
Semi-Annual Report to Shareholders
Statement of Operations
Limited Duration Bond Portfolio
For the Six Months Ended June 30, 2007 (Unaudited)
(Amounts in Thousands)
| | | | | | | | |
Investment Income: | | | | | | | | |
Interest | | $ | 5,421 | | | | | |
Dividends | | | 5 | | | | | |
| | | | | | | | |
Total income | | | | | | $ | 5,426 | |
| | |
Expenses: | | | | | | | | |
Management fees | | | 446 | | | | | |
Distribution and service fees: | | | | | | | | |
Primary Class | | | 468 | | | | | |
Audit and legal fees | | | 27 | | | | | |
Custodian fees | | | 22 | | | | | |
Directors’ fees and expenses | | | 27 | | | | | |
Registration fees | | | 18 | | | | | |
Reports to shareholders | | | 23 | | | | | |
Transfer agent and shareholder servicing expense: | | | | | | | | |
Primary Class | | | 75 | | | | | |
Institutional Class | | | 7 | | | | | |
Other expenses | | | 17 | | | | | |
| | | | | | | | |
| | | 1,130 | | | | | |
Less: Fees waived | | | (158 | ) | | | | |
Expenses reimbursed by adviser | | | (7 | ) | | | | |
Compensating balance credits | | | (1 | ) | | | | |
| | | | | | | | |
Net expenses | | | | | | | 964 | |
| | | | | | | | |
Net Investment Income | | | | | | | 4,462 | |
| | |
Net Realized and Unrealized Gain/(Loss) on Investments: | | | | | | | | |
Net realized gain/(loss) on: | | | | | | | | |
Investments | | | (822 | ) | | | | |
Options | | | 82 | | | | | |
Futures | | | 94 | | | | | |
| | | | | | | | |
| | | | | | | (646 | ) |
Change in unrealized appreciation/depreciation of investments and futures | | | | | | | (33 | ) |
| | | | | | | | |
Net Realized and Unrealized Loss on Investments | | | | | | | (679 | ) |
| | |
Change in Net Assets Resulting From Operations | | | | | | $ | 3,783 | |
| | |
A | See note 1, Compensating Balance Credits, in the notes to financial statements. |
See notes to financial statements.
79
Semi-Annual Report to Shareholders
Statement of Changes in Net Assets
Limited Duration Bond Portfolio
(Amounts in Thousands)
| | | | | | | | |
| | | For the Six Months Ended June 30, 2007 | | | For The Year Ended December 31, 2006 | |
| | | (Unaudited) | | | | |
Change in Net Assets: | | | | | | | | |
| | |
Net investment income | | $ | 4,462 | | | $ | 9,028 | |
| | |
Net realized loss | | | (646 | ) | | | (384 | ) |
| | |
Change in unrealized appreciation/depreciation | | | (33 | ) | | | 886 | |
| | |
Change in net assets resulting from operations | | | 3,783 | | | | 9,530 | |
| | |
Distributions to shareholders from: | | | | | | | | |
Net investment income: | | | | | | | | |
Primary Class | | | (4,187 | ) | | | (8,477 | ) |
Institutional Class | | | (275 | ) | | | (703 | ) |
| | |
Change in net assets from fund share transactions: | | | | | | | | |
Primary Class | | | (5,906 | ) | | | (27,940 | ) |
Institutional Class | | | 294 | | | | (7,185 | ) |
| | |
Change in net assets | | | (6,291 | ) | | | (34,775 | ) |
| | |
Net Assets: | | | | | | | | |
| | |
Beginning of period | | | 202,935 | | | | 237,710 | |
| | |
End of period | | $ | 196,644 | | | $ | 202,935 | |
| | |
Overdistributed net investment income | | $ | (65 | ) | | $ | (65 | ) |
| | |
See notes to financial statements.
80
Semi-Annual Report to Shareholders
Financial Highlights
Limited Duration Bond Portfolio
Contained below is per share operating performance data for a share of common stock outstanding, total investment return, ratios to average net assets and other supplemental data. This information has been derived from information provided in the financial statements.
Primary Class:
| | | | | | | | | | | | | | | | | | | | | | | | |
| | | Six Months Ended June 30, 2007 | | | Years Ended December 31, | |
| | | 2006 | | | 2005 | | | 2004 | | | 2003 | | | 2002 | |
| | |
| | | (Unaudited) | | | | | | | | | | | | | | | | |
Net asset value, beginning of period | | $ | 10.22 | | | $ | 10.20 | | | $ | 10.36 | | | $ | 10.54 | | | $ | 10.70 | | | $ | 10.32 | |
| | | | | | | | | | | | | | | | | | | | | | | | |
Investment operations: | | | | | | | | | | | | | | | | | | | | | | | | |
Net investment income | | | .23 | A | | | .42 | A | | | .33 | | | | .29 | | | | .26 | | | | .41 | |
Net realized and unrealized gain/(loss) | | | (.04 | ) | | | .02 | | | | (.14 | ) | | | (.09 | ) | | | (.14 | ) | | | .38 | |
| | | | | | | | | | | | | | | | | | | | | | | | |
Total from investment operations | | | .19 | | | | .44 | | | | .19 | | | | .20 | | | | .12 | | | | .79 | |
| | | | | | | | | | | | | | | | | | | | | | | | |
Distributions from: | | | | | | | | | | | | | | | | | | | | | | | | |
Net investment income | | | (.23 | ) | | | (.42 | ) | | | (.35 | ) | | | (.37 | ) | | | (.28 | ) | | | (.41 | ) |
Net realized gain on investments | | | — | | | | — | | | | — | | | | (.01 | ) | | | — | | | | — | |
| | | | | | | | | | | | | | | | | | | | | | | | |
Total distributions | | | (.23 | ) | | | (.42 | ) | | | (.35 | ) | | | (.38 | ) | | | (.28 | ) | | | (.41 | ) |
| | | | | | | | | | | | | | | | | | | | | | | | |
Net asset value, end of period | | $ | 10.18 | | | $ | 10.22 | | | $ | 10.20 | | | $ | 10.36 | | | $ | 10.54 | | | $ | 10.70 | |
| | | | | | | | | | | | | | | | | | | | | | | | |
Total return | | | 1.84 | %B | | | 4.46 | % | | | 1.83 | % | | | 1.89 | % | | | 1.11 | % | | | 7.79 | % |
| | | | | | |
Ratios to Average Net Assets:C | | | | | | | | | | | | | | | | | | | | | | | | |
Total expenses | | | 1.17 | %D | | | 1.21 | % | | | 1.15 | % | | | 1.21 | % | | | 1.21 | % | | | 1.19 | % |
Expenses net of waivers, if any | | | 1.00 | %D | | | 1.00 | % | | | 1.00 | % | | | 1.00 | % | | | 1.00 | % | | | 1.00 | % |
Expenses net of all reductions | | | 1.00 | %D | | | 1.00 | % | | | 1.00 | % | | | 1.00 | % | | | 1.00 | % | | | 1.00 | % |
Net investment income | | | 4.47 | %D | | | 4.10 | % | | | 3.21 | % | | | 2.81 | % | | | 2.48 | % | | | 3.85 | % |
| | | | | | |
Supplemental Data: | | | | | | | | | | | | | | | | | | | | | | | | |
Portfolio turnover rate | | | 111.5 | %B | | | 237.2 | % | | | 81.6 | % | | | 238.0 | % | | | 487.3 | % | | | 204.1 | % |
Net assets, end of period (in thousands) | | $ | 185,337 | | | $ | 191,883 | | | $ | 219,497 | | | $ | 274,606 | | | $ | 326,844 | | | $ | 379,793 | |
| | |
A | Computed using average daily shares outstanding. |
C | Total expenses reflects operating expenses prior to any voluntary expense waivers and/or compensating balance credits. Expenses net of waivers reflects total expenses before compensating balance credits but net of any voluntary expense waivers. Expenses net of all reductions reflects expenses less any compensating balance credits and/or voluntary expense waivers. |
See notes to financial statements.
81
Semi-Annual Report to Shareholders
Financial Highlights—Continued
Limited Duration Bond Portfolio—Continued
Institutional Class:
| | | | | | | | | | | | | | | | | | | | | | | | |
| | | Six Months Ended June 30, 2007 | | | Years Ended December 31, | |
| | | 2006 | | | 2005 | | | 2004 | | | 2003 | | | 2002 | |
| | |
| | | (Unaudited) | | | | | | | | | | | | | | | | |
Net asset value, beginning of period | | $ | 10.22 | | | $ | 10.20 | | | $ | 10.37 | | | $ | 10.55 | | | $ | 10.70 | | | $ | 10.32 | |
| | | | | | | | | | | | | | | | | | | | | | | | |
Investment operations: | | | | | | | | | | | | | | | | | | | | | | | | |
Net investment income | | | .25 | A | | | .47 | A | | | .40 | | | | .35 | | | | .32 | | | | .46 | |
Net realized and unrealized gain/(loss) | | | (.03 | ) | | | .03 | | | | (.17 | ) | | | (.10 | ) | | | (.14 | ) | | | .38 | |
| | | | | | | | | | | | | | | | | | | | | | | | |
Total from investment operations | | | .22 | | | | .50 | | | | .23 | | | | .25 | | | | .18 | | | | .84 | |
| | | | | | | | | | | | | | | | | | | | | | | | |
Distributions from: | | | | | | | | | | | | | | | | | | | | | | | | |
Net investment income | | | (.25 | ) | | | (.48 | ) | | | (.40 | ) | | | (.42 | ) | | | (.33 | ) | | | (.46 | ) |
Net realized gain on investments | | | — | | | | — | | | | — | | | | (.01 | ) | | | — | | | | — | |
| | | | | | | | | | | | | | | | | | | | | | | | |
Total distributions | | | (.25 | ) | | | (.48 | ) | | | (.40 | ) | | | (.43 | ) | | | (.33 | ) | | | (.46 | ) |
| | | | | | | | | | | | | | | | | | | | | | | | |
Net asset value, end of period | | $ | 10.19 | | | $ | 10.22 | | | $ | 10.20 | | | $ | 10.37 | | | $ | 10.55 | | | $ | 10.70 | |
| | | | | | | | | | | | | | | | | | | | | | | | |
Total return | | | 2.19 | %B | | | 4.98 | % | | | 2.29 | % | | | 2.41 | % | | | 1.71 | % | | | 8.35 | % |
| | | | | | |
Ratios to Average Net Assets:C | | | | | | | | | | | | | | | | | | | | | | | | |
Total expenses | | | .71 | %D | | | .64 | % | | | .62 | % | | | .70 | % | | | .68 | % | | | .66 | % |
Expenses net of waivers, if any | | | .50 | %D | | | .50 | % | | | .46 | % | | | .48 | % | | | .46 | % | | | .47 | % |
Expenses net of all reductions | | | .50 | %D | | | .50 | % | | | .46 | % | | | .48 | % | | | .46 | % | | | .47 | % |
Net investment income | | | 4.97 | %D | | | 4.58 | % | | | 3.85 | % | | | 3.22 | % | | | 3.03 | % | | | 4.38 | % |
| | | | | | |
Supplemental Data: | | | | | | | | | | | | | | | | | | | | | | | | |
Portfolio turnover rate | | | 111.5 | %B | | | 237.2 | % | | | 81.6 | % | | | 238.0 | % | | | 487.3 | % | | | 204.1 | % |
Net assets, end of period (in thousands) | | $ | 11,307 | | | $ | 11,052 | | | $ | 18,213 | | | $ | 9,546 | | | $ | 7,740 | | | $ | 9,485 | |
| | |
See notes to financial statements.
82
Semi-Annual Report to Shareholders
Notes to Financial Statements
Income Trust, Inc.
(Amounts in Thousands) (Unaudited)
1. Organization and Significant Accounting Policies:
The Legg Mason Income Trust, Inc. (“Corporation”), consisting of the Core Bond Fund (“Core Bond”), the Investment Grade Income Portfolio (“Investment Grade”), and the Limited Duration Bond Portfolio, (“Limited Duration”) (each a “Fund”), is registered under the Investment Company Act of 1940 (“1940 Act”), as amended, as an open-end, diversified investment company.
The Investment Grade and Limited Duration Portfolios consist of two classes of shares: Primary Class and Institutional Class. The income and expenses of each of these Funds are allocated proportionately to the two classes of shares based on daily net assets, except for Rule 12b-1 distribution fees, which are charged only on Primary Class shares, and transfer agent and shareholder servicing expenses, which are determined separately for each class.
Preparation of the financial statements in accordance with accounting principles generally accepted in the United States of America requires management to make estimates and assumptions that affect the reported amounts and disclosures in the financial statements. Actual results could differ from those estimates. The following is a summary of significant accounting policies followed by the Fund in the preparation of its financial statements:
Security Valuation
Securities owned by the Funds for which market quotations are readily available are valued at current market value. Securities for which market quotations are not readily available are fair valued pursuant to procedures approved by and under the general oversight of the Board of Directors. In determining fair value, all relevant qualitative and quantitative factors known to a fund are considered. These factors are subject to change over time and are reviewed periodically. The values assigned to fair value investments are based on available information and do not necessarily represent amounts that might ultimately be realized, since such amounts depend on future developments inherent in long-term investments. Further, because of the inherent uncertainty of valuation, those estimated values may differ significantly from quoted or published values or from the values that would have been used had a ready market of the investments existed, and the differences could be material.
Security Transactions
Security transactions are accounted for as of the trade date. Realized gains and losses from security transactions are reported on an identified cost basis for both financial reporting and federal income tax purposes.
83
Semi-Annual Report to Shareholders
Notes to Financial Statements—Continued
Income Trust, Inc.—Continued
For the six months ended June 30, 2007, security transactions (excluding short-term investments) were as follows:
| | | | | | | | | | | | |
| | | Purchases | | Proceeds From Sales |
| | | U.S. Gov’t. Securities | | Other | | U.S. Gov’t. Securities | | Other |
Core Bond | | $ | 167,125 | | $ | 8,668 | | $ | 164,806 | | $ | 5,849 |
Investment Grade | | | 50,925 | | | 83,185 | | | 28,653 | | | 69,450 |
Limited Duration | | | 182,802 | | | 30,691 | | | 175,249 | | | 39,671 |
Repurchase Agreements
The Funds may engage in repurchase agreement transactions. Under the terms of a typical repurchase agreement, a fund takes possession of an underlying debt obligation subject to an obligation of the seller to repurchase, and a fund to resell, the obligation at an agreed-upon price and time, thereby determining the yield during a fund’s holding period. This arrangement results in a fixed rate of return that is not subject to market fluctuations during the fund’s holding period. The value of the collateral is at all times at least equal to the total amount of the repurchase obligation, including interest. In the event of counterparty default, a fund has the right to use the collateral to satisfy the terms of the repurchase agreement. However, there could be potential loss to the fund in the event the fund is delayed or prevented from exercising its right to dispose of the collateral securities, including the risk of a possible decline in the value of the collateral securities during the period in which the fund seeks to assert its rights. Each Fund’s investment adviser reviews the value of the collateral and the creditworthiness of those banks and dealers with which the Funds enter into repurchase agreements to evaluate potential risks.
Options and Futures
The current market value of an exchange traded option is the last sale price or, in the absence of a sale, the price obtained by reference to broker-dealer quotations. Futures contracts are valued daily at the settlement price established by the board of trade or exchange on which they are traded. Futures contracts are marked-to-market on a daily basis. As the contract’s value fluctuates, payments known as variation margin are made or received by the Fund each day, depending on the daily fluctuation in the value of the contract. The daily changes in contract value are recorded as unrealized gains or losses, and the Fund recognizes a gain or loss when the contract is closed.
Investment Income and Distributions to Shareholders
Interest income and expenses are recorded on the accrual basis. Bond premiums and discounts are amortized for financial reporting and federal income tax purposes. Dividend income and distributions to shareholders are allocated at the class level and are recorded on the
84
Semi-Annual Report to Shareholders
ex-dividend date. Dividends from net investment income are declared daily and paid monthly for each Fund. Net capital gain distributions, which are calculated at the Fund level, are declared and paid after the end of the tax year in which the gain is realized. An additional distribution may be made in December, to the extent necessary in order to comply with federal excise tax regulations. Distributions are determined in accordance with federal income tax regulations, which may differ from those determined in accordance with accounting principles generally accepted in the United States of America; accordingly, periodic reclassifications are made within the Funds’ capital accounts to reflect income and gains available for distribution under federal income tax regulations.
Compensating Balance Credits
The Funds have an arrangement with their custodian bank, whereby a portion of the custodian’s fee is paid indirectly by credits earned on each Fund’s cash on deposit with the bank. This deposit arrangement is an alternative to purchasing overnight investments.
Credit and Market Risk
Investments in structured securities collateralized by residential real estate mortgages are subject to certain credit and liquidity risks. When market conditions result in an increase in default rates of the underlying mortgages and the foreclosure values of underlying real estate properties are materially below the outstanding amount of these underlying mortgages, collection of accrued interest and principal on these investments may be doubtful. Such market conditions may significantly impair the value of these investments resulting in a lack of correlation between their credit ratings and values.
Other
In the normal course of business, the Funds enter into contracts that provide general indemnifications. Each Funds’ maximum exposure under these arrangements is dependent upon claims that may be made against the Funds in the future and, therefore, cannot be estimated; however, based on experience, the risk of material loss from such claims is considered remote.
2. Federal Income Taxes:
No provision for federal income or excise taxes is required since each Fund intends to continue to qualify as a regulated investment company and distribute substantially all of its taxable income to its shareholders. Because federal income tax regulations differ from accounting principles generally accepted in the United States of America, income and capital gain distributions determined in accordance with tax regulations may differ from net investment income and realized gains recognized for financial reporting purposes. Additionally, net short-term gains and net gains on foreign currency transactions are treated as ordinary income for tax purposes. Accordingly, the character of distributions and composition of net assets for tax purposes differs from those reflected in the accompanying financial statements.
85
Semi-Annual Report to Shareholders
Notes to Financial Statements—Continued
Income Trust, Inc.—Continued
3. Financial Instruments:
Options and Futures
As part of their investment programs, the Funds may utilize options and futures. Options may be written (sold) or purchased by the Funds. When a Fund purchases a put or call option, the premium paid is recorded as an investment and its value is marked-to-market daily. When a Fund writes a put or call option, an amount equal to the premium received by the Fund is recorded as a liability and its value is marked-to-market daily.
When options, whether written or purchased, expire, are exercised or are closed (by entering into a closing purchase or sale transaction), the Fund realizes a gain or loss as described in the chart below:
| | |
Purchased option: | | Impact on the Fund: |
| The option expires | | Realize a loss in the amount of the cost of the option. |
| |
| The option is closed through a closing sale transaction | | Realize a gain or loss depending on whether the proceeds from the closing sale transaction are greater or less than the cost of the option. |
| |
| The Fund exercises a call option | | The cost of the security purchased through the exercise of the option will be increased by the premium originally paid to purchase the option. |
| |
| The Fund exercises a put option | | Realize a gain or loss from the sale of the underlying security. The proceeds of that sale will be reduced by the premium originally paid to purchase the put option. |
| |
Written option: | | Impact on the Fund: |
| The option expires | | Realize a gain equal to the amount of the premium received. |
| |
| The option is closed through a closing purchase transaction | | Realize a gain or loss without regard to any unrealized gain or loss on the underlying security and eliminate the option liability. The Fund will realize a loss in this transaction if the cost of the closing purchase exceeds the premium received when the option was written. |
| |
| A written call option is exercised by the option purchaser | | Realize a gain or loss from the sale of the underlying security. The proceeds of that sale will be increased by the premium originally received when the option was written. |
86
Semi-Annual Report to Shareholders
| | |
Purchased option: | | Impact on the Fund: |
| A written put option is exercised by the option purchaser | | The amount of the premium originally received will reduce the cost of the security that the Fund purchased when the option was exercised. |
The risk associated with purchasing options is limited to the premium originally paid. Options written by a Fund involve, to varying degrees, risk of loss in excess of the option value reflected in the statement of net assets. The risk in writing a covered call option is that a Fund may forgo the opportunity of profit if the market price of the underlying security increases and the option is exercised. The risk in writing a put option is that a Fund may incur a loss if the market price of the underlying security decreases and the option is exercised. In addition, there is the risk a Fund may not be able to enter into a closing transaction because of an illiquid secondary market or, for over-the-counter options, because of the counterparty’s inability to perform.
Activity in written call and put options during the six months ended June 30, 2007, was as follows:
| | | | | | | | | | | | | | |
| | | Calls | | | Puts | |
| Core Bond Fund: | | Actual
Contracts | | | Premiums | | | Actual
Contracts | | | Premiums | |
Options outstanding at December 31, 2006 | | 155 | | | $ | 85 | | | 77 | | | $ | 33 | |
Options written | | 580 | | | | 224 | | | 154 | | | | 69 | |
Options closed | | (127 | ) | | | (64 | ) | | (73 | ) | | | (34 | ) |
Options expired | | (357 | ) | | | (158 | ) | | (68 | ) | | | (26 | ) |
Options exercised | | — | | | | — | | | (9 | ) | | | (4 | ) |
| | | | | | | | | | | | | | |
Options outstanding at June 30, 2007 | | 251 | | | $ | 87 | | | 81 | | | $ | 38 | |
| | | | | | | | | | | | | | |
| | |
| | | Calls | | | Puts | |
| Limited Duration Bond: | | Actual
Contracts | | | Premiums | | | Actual
Contracts | | | Premiums | |
Options outstanding at December 31, 2006 | | 151 | | | $ | 70 | | | 346 | | | $ | 93 | |
Options written | | 305 | | | | 89 | | | 402 | | | | 140 | |
Options closed | | (456 | ) | | | (159 | ) | | (672 | ) | | | (202 | ) |
Options expired | | — | | | | — | | | (76 | ) | | | (31 | ) |
Options exercised | | — | | | | — | | | — | | | | — | |
| | | | | | | | | | | | | | |
Options outstanding at June 30, 2007 | | — | | | $ | — | | | — | | | $ | — | |
| | | | | | | | | | | | | | |
87
Semi-Annual Report to Shareholders
Notes to Financial Statements—Continued
Income Trust, Inc.—Continued
Upon entering into a futures contract, each Fund is required to deposit with the broker cash or cash equivalents in an amount equal to a certain percentage of the contract amount. This is known as the “initial margin.” Subsequent payments (“variation margin”) are made or received by the Fund each day, depending on the daily fluctuation in the value of the contract. The daily changes in contract value are recorded as unrealized gains or losses and the Fund recognizes a realized gain or loss when the contract is closed. Futures contracts are valued daily at the settlement price established by the board of trade or exchange on which they are traded.
The Funds enter into futures contracts as a hedge against anticipated changes in interest rates. There are several risks in connection with the use of futures contracts as a hedging device. Futures contracts involve, to varying degrees, risk of loss in excess of the amounts reflected in the financial statements. The change in the value of futures contracts primarily corresponds with the value of their underlying instruments, which may not correlate with the change in the value of the hedged instruments. In addition, there is the risk that a Fund may not be able to enter into a closing transaction because of an illiquid secondary market.
The open futures positions and related appreciation or depreciation at June 30, 2007 are listed at the end of each Fund’s portfolio of investments.
Swap Agreements
The use of swaps involves risks that are different from those associated with ordinary portfolio securities transactions. Swap agreements may be considered to be illiquid. Although a Fund will not enter into any swap agreement unless the adviser believes that the other party to the transaction is creditworthy, a Fund does bear the risk of loss of the amount expected to be received under a swap agreement in the event of the default or bankruptcy of the agreement counterparty. The nature and risks of these financial instruments and the reasons for using them are set forth more fully in the Corporation’s prospectus and statement of additional information.
The Funds may invest in different types of swap agreements. Credit default swap contracts represent the exchange of commitments to provide a level of credit protection for a commitment to receive interest at a fixed rate based on the potential risk of default of the relevant underlying issuer. Interest rate swap contracts involve the exchange of commitments to pay and receive interest based on a notional principal amount. Total return swap contracts involve the exchange of commitments to pay and receive interest based on the total return of an index over a specified period.
88
Semi-Annual Report to Shareholders
The following is a summary of open credit default swap contracts outstanding as of June 30, 2007:
Core Bond Fund
| | | | | | | | | | | |
| Agreement With: | | Termination
Date | | The Fund
Agrees to Pay | | The Fund
Will Receive | | Contract
Notional
Amount | | Unrealized
Depreciation | |
Greenwich Capital Markets Inc. (CDX IG HVOL 8) | | June 20, 2012 | | Specified Amount upon credit event noticeA | | 0.75% Quarterly | | 200 | | (1 | ) |
| | | | | |
Greenwich Capital Markets Inc. (CDX IG HVOL 8) | | June 20, 2012 | | Specified Amount upon credit event noticeA | | 0.75% Quarterly | | 200 | | (1 | ) |
| | | | | |
Greenwich Capital Markets Inc. (CDX IG HVOL 8) | | June 20, 2012 | | Specified Amount upon credit event noticeA | | 0.75% Quarterly | | 200 | | 0 | |
| | | | | | | | | | | |
| | | | | | | | 600 | | (2 | ) |
| | | | | | | | | | | |
A | Upon bankruptcy or failure to make a scheduled interest payment, the Fund will pay $1,000. |
4. Transactions With Affiliates:
Each Fund has a management agreement with Legg Mason Fund Adviser, Inc. (“LMFA”). Pursuant to their respective agreements, LMFA provides the Funds with management and administrative services for which each Fund pays a fee, computed daily and payable monthly, at annual rates of each Fund’s average daily net assets. LMFA has contractually agreed to waive its fees to the extent Core Bond and Limited Duration’s expenses (exclusive of taxes, interest, brokerage and extraordinary expenses) exceed during any month certain annual rates. These contractual expense limitations are due to expire on April 30, 2008. LMFA has voluntarily agreed to waive fees to the extent that Investment Grade’s expenses (exclusive of taxes, interest, brokerage and extraordinary expenses) exceed during any month certain annual rates. This voluntary waiver is currently expected to continue until April 30, 2008, but may be terminated at any time. Pursuant to an agreement approved by the Board, Core Bond and Limited Duration have agreed to repay LMFA for waived fees and reimbursed expenses provided that payment does not cause operating expenses to exceed 1.00% of the Primary Class’s average net assets and 0.50% of the Institutional Class’s average net assets and the
89
Semi-Annual Report to Shareholders
Notes to Financial Statements—Continued
Income Trust, Inc.—Continued
payment is made within three years after the year in which LMFA earned the fee or incurred the expense. The following chart shows annual rates of managements fees, expense limits, and management fees waived, for each Fund:
| | | | | | | | | | | | | |
| Fund | | Management
Fee | | | Expense Limitation | | | Six Months Ended June 30, 2007 | | | Maximum Amount Subject to Recapture |
| | | | Management Fees Waived | | |
| |
Core Bond | | 0.45 | % | | 1.00 | % | | $ | (141 | ) | | $ | 776 |
Investment Grade | | | | | | | | | | | | | |
— Primary Class | | 0.60 | % | | 1.00 | % | | | (399 | ) | | | N/A |
— Institutional Class | | 0.60 | % | | 0.50 | % | | | (13 | ) | | | N/A |
Limited Duration | | | | | | | | | | | | | |
— Primary Class | | 0.45 | % | | 1.00 | % | | | (78 | ) | | | 1,308 |
—Institutional Class | | 0.45 | % | | 0.50 | % | | | (5 | ) | | | 68 |
Western Asset Management Company (“Adviser”) serves as investment adviser to the Funds. The Adviser is responsible for the actual investment activity of each Fund. LMFA pays the Adviser a fee, computed daily and payable monthly, at an annual rate of 40% of the management fee received by LMFA for Core Bond; and 40% of the management fee received for Investment Grade. For Limited Duration, LMFA pays the Adviser a fee, computed daily and payable monthly, of 0.20% of its average daily net assets, not to exceed the fee received by LMFA.
Legg Mason Investor Services, LLC (“LMIS”) serves as distributor of the Funds. LMIS receives an annual distribution fee and an annual service fee based on each Fund’s Primary Class’s average daily net assets, computed daily and payable monthly as shown in the table below. For the six months ended June 30, 2007, Legg Mason waived $162 and $75 of the distribution and service fees for Investment Grade and Limited Duration, respectively.
| | | | | | |
| Fund | | Distribution
Fee | | | Service
Fee | |
| | |
Core Bond | | 0.25 | % | | 0.25 | % |
Investment Grade | | 0.25 | % | | 0.25 | % |
Limited Duration | | 0.25 | % | | 0.25 | % |
LM Fund Services, Inc. (“LMFS”), a registered transfer agent, has an agreement with the Funds’ transfer agent to assist it with some of its duties. For this assistance, the transfer agent paid LMFS the following amounts during the six months ended June 30, 2007,: Core Bond, $8; Investment Grade, $33; and Limited Duration, $17.
90
Semi-Annual Report to Shareholders
LMFA, the Adviser, LMIS and LMFS are corporate affiliates and wholly owned subsidiaries of Legg Mason, Inc.
Under a Deferred Compensation Plan (“Plan”), directors may elect to defer receipt of all or a specified portion of their compensation. A participating director may select one or more funds in which his or her deferred director’s fees will be deemed to be invested. Deferred amounts remain in the fund until distributed in accordance with the Plan.
5. Line of Credit:
The Funds, along with certain other Legg Mason Funds, participate in a $400 million line of credit (“Credit Agreement”) to be used for temporary or emergency purposes. Pursuant to the Credit Agreement, each participating Fund is liable only for principal and interest payments related to borrowings made by that Fund. Borrowings under the Credit Agreement bear interest at a rate equal to the prevailing federal funds rate plus the federal funds rate margin. The Fund did not utilize the line of credit during the six months ended June 30, 2007.
6. Fund Share Transactions:
At June 30, 2007, there were 250,000 shares authorized at $.001 par value for the Core Bond Fund. At June 30, 2007, there were 100,000 shares authorized at $.001 par value for each of the Primary and Financial Intermediary Classes of the Investment Grade and Limited Duration Bond funds, and 50,000 shares authorized at $.001 par value for their Institutional Classes. Share transactions for the Funds were as follows:
Core Bond Fund
| | | | | | | | | | | | | | |
| | | Six Months Ended
June 30, 2007 | | | Year Ended
December 31, 2006 | |
| | | Shares | | | Amount | | | Shares | | | Amount | |
Primary Class | | | | | | | | | | | | | | |
Shares sold | | 1,534 | | | $ | 14,951 | | | 2,116 | | | $ | 20,412 | |
Shares issued on reinvestment | | 141 | | | | 1,375 | | | 285 | | | | 2,738 | |
Shares repurchased | | (1,243 | ) | | | (12,115 | ) | | (2,379 | ) | | | (22,886 | ) |
| | | | | | | | | | | | | | |
Net Increase | | 432 | | | $ | 4,211 | | | 22 | | | $ | 264 | |
| | | | | | | | | | | | | | |
91
Semi-Annual Report to Shareholders
Notes to Financial Statements—Continued
Income Trust, Inc.—Continued
Investment Grade Income Portfolio
| | | | | | | | | | | | | | |
| | | Six Months Ended
June 30, 2007 | | | Year Ended
December 31, 2006 | |
| | | Shares | | | Amount | | | Shares | | | Amount | |
Primary Class | | | | | | | | | | | | | | |
Shares sold | | 5,957 | | | $ | 62,537 | | | 11,858 | | | $ | 122,001 | |
Shares issued on reinvestment | | 924 | | | | 9,654 | | | 1,643 | | | | 16,875 | |
Shares repurchased | | (4,866 | ) | | | (51,029 | ) | | (10,116 | ) | | | (104,395 | ) |
| | | | | | | | | | | | | | |
Net Increase | | 2,015 | | | $ | 21,162 | | | 3,385 | | | $ | 34,481 | |
| | | | | | | | | | | | | | |
| | | | |
Institutional Class | | | | | | | | | | | | | | |
Shares sold | | 545 | | | $ | 5,711 | | | 945 | | | $ | 9,714 | |
Shares issued on reinvestment | | 37 | | | | 385 | | | 92 | | | | 939 | |
Shares repurchased | | (118 | ) | | | (1,244 | ) | | (1,868 | ) | | | (19,237 | ) |
| | | | | | | | | | | | | | |
Net Increase (Decrease) | | 464 | | | $ | 4,852 | | | (831 | ) | | $ | (8,584 | ) |
| | | | | | | | | | | | | | |
Limited Duration Bond Portfolio
| | | | | | | | | | | | | | |
| | | Six Months Ended
June 30, 2007 | | | Year Ended
December 31, 2006 | |
| | | Shares | | | Amount | | | Shares | | | Amount | |
Primary Class | | | | | | | | | | | | | | |
Shares sold | | 1,598 | | | $ | 16,336 | | | 2,693 | | | $ | 27,414 | |
Shares issued on reinvestment | | 349 | | | | 3,572 | | | 761 | | | | 7,746 | |
Shares repurchased | | (2,524 | ) | | | (25,814 | ) | | (6,199 | ) | | | (63,100 | ) |
| | | | | | | | | | | | | | |
Net Decrease | | (577 | ) | | $ | (5,906 | ) | | (2,745 | ) | | $ | (27,940 | ) |
| | | | | | | | | | | | | | |
| | | | |
Institutional Class | | | | | | | | | | | | | | |
Shares sold | | 107 | | | $ | 1,097 | | | 491 | | | $ | 4,987 | |
Shares issued on reinvestment | | 19 | | | | 188 | | | 54 | | | | 545 | |
Shares repurchased | | (97 | ) | | | (991 | ) | | (1,249 | ) | | | (12,717 | ) |
| | | | | | | | | | | | | | |
Net Increase (Decrease) | | 29 | | | $ | 294 | | | (704 | ) | | $ | (7,185 | ) |
| | | | | | | | | | | | | | |
7. Recent Accounting Pronouncements
In June 2006, the Financial Accounting Standards Board (“FASB”) issued FASB Interpretation 48 (“FIN 48” or the “Interpretation”), Accounting for Uncertainty in Income Taxes—an interpretation of FASB Statement 109. FIN 48 supplements FASB Statement 109, Accounting
92
Semi-Annual Report to Shareholders
for Income Taxes and establishes financial reporting rules regarding recognition, measurement, presentation, and disclosure in its financial statements of tax positions that a fund has taken or expects to take on a tax return. Management has evaluated the impact of FIN 48 on the Funds and has determined that the adoption of FIN 48 has not had a material impact on the Funds’ financial statements. FIN 48 became effective for fiscal periods beginning after December 15, 2006 with implementation for calendar year-end mutual funds required by June 29, 2007.
On September 20, 2006, the FASB released Statement of Financial Accounting Standards No. 157 “Fair Value Measurements” (“FAS 157”). FAS 157 establishes an authoritative definition of fair value, sets out a framework for measuring fair value, and requires additional disclosures about fair-value measurements. The application of FAS 157 is required for fiscal years beginning after November 15, 2007 and interim periods within those fiscal years. At this time, management is evaluating the implications of FAS 157 and its impact on the financial statements has not yet been determined.
8. Reorganization
The Board of Directors of Legg Mason Income Trust, Inc. (“Board”) has approved, subject to shareholder approval, an Agreement and Plan of Reorganization (“Plan”) with respect to its series, Legg Mason Core Bond Fund (“Core Bond Fund”). Under the Plan, Core Bond Fund would transfer all of its assets and liabilities to Legg Mason Partners Core Bond Fund (“LMP Core Bond Fund”), a series of Legg Mason Partners Income Trust. A shareholder meeting date of September 10, 2007 has been set for shareholders of record of Core Bond Fund as of July 2, 2007 to vote on the Plan. If the Plan is approved, it is anticipated that the proposed reorganization will be consummated by the end of September 2007.
93
Fund Information
Investment Manager
Legg Mason Fund Adviser, Inc.
Baltimore, MD
Investment Adviser
Western Asset Management Company
Pasadena, CA
Board of Directors
John F. Curley, Jr., Chairman
Mark R. Fetting, President
Dr. Ruby P. Hearn
Arnold L. Lehman
Robin J.W. Masters
Dr. Jill E. McGovern
Arthur S. Mehlman
G. Peter O’Brien
S. Ford Rowan
Robert M. Tarola
Officers
Marie K. Karpinski, Vice President and Chief Financial Officer
Gregory T. Merz, Vice President and Chief Legal Officer
Ted P. Becker, Vice President and Chief Compliance Officer
Erin K. Morris, Treasurer
Susan C. Curry, Assistant Treasurer
Richard M. Wachterman, Secretary
Peter J. Ciliberti, Assistant Secretary
Transfer and Shareholder Servicing Agent
Boston Financial Data Services
Braintree, MA
Custodian
State Street Bank & Trust Company
Boston, MA
Counsel
Kirkpatrick & Lockhart Preston Gates Ellis LLP
Washington, DC
Independent Registered Public Accounting Firm
PricewaterhouseCoopers LLP
Baltimore, MD
About the Legg Mason Funds
| | |
Equity Funds American Leading Companies Trust Classic Valuation Fund Growth Trust Special Investment Trust U.S. Small-Capitalization Value Trust Value Trust Specialty Funds Opportunity Trust Global Funds Emerging Markets Trust Global Income Trust International Equity Trust Taxable Bond Funds Core Bond Fund Investment Grade Income Portfolio Limited Duration Bond Portfolio Tax-Free Bond Funds Maryland Tax-Free Income Trust | | Legg Mason, Inc., based in Baltimore, Maryland, has built its reputation, at least in part, on the success of the Legg Mason Funds, introduced in 1979. The primary purpose of our funds is to enable investors to diversify their portfolios across various asset classes and, consequently, enjoy the stability and growth prospects generally associated with diversification. The success of our funds is contingent on the experience, discipline, and acumen of our fund managers. We believe the quality of our managers is crucial to investment success. Unlike many firms, which focus on a particular asset class or the fluctuations of the market, at Legg Mason we focus on providing a collection of top-notch managers in all the major asset classes. Information about the policies and procedures that each Fund uses to determine how to vote proxies relating to its portfolio securities is contained in the Statement of Additional Information, available without charge upon request by calling 1-800-822-5544 or on the Securities and Exchange Commission’s (“SEC”) website (http://www.sec.gov). Information regarding how each Fund voted proxies relating to portfolio securities during the most recent twelve-month period ended June 30 is also available on the SEC’s website or through the Legg Mason Funds’ website at www.leggmason.com/funds/about/aboutlmf.asp#Results. Each Fund files its complete schedule of portfolio holdings with the SEC for the first and third quarters of each fiscal year on Form N-Q. You may obtain a free copy of each Fund’s portfolio holdings as filed on Form N-Q, by contacting each Fund at the appropriate phone number, address or website listed below. Additionally, each Fund’s Form N-Q is available on the SEC’s website (http://www.sec.gov) or may be reviewed and copied at the SEC’s Public Reference Room in Washington, D.C. Information about the operation of the Public Reference Room may be obtained by calling 1-800-SEC-0330. |
| |
| |
| |
| |
| |
| |
This report must be preceded or accompanied by a free prospectus. Investors should consider each Fund’s investment objectives, risks, charges and expenses carefully before investing. The prospectus contains this and other important information about each Fund. For a free prospectus for these or any other Legg Mason fund, visit www.leggmasonfunds.com. Please read the prospectus carefully before investing.
| | |
| Legg Mason Funds | | Legg Mason Investor Services—Institutional |
| For Primary Class Shareholders | | For R, FI and I Class Shareholders |
| c/o BFDS | | c/o BFDS |
| P.O. Box 55214 | | P.O. Box 8037 |
| Boston, MA 02205-8504 | | Boston, MA 02206-8037 |
| 800-822-5544 | | 888-425-6432 |
| www.leggmasonfunds.com | | www.lminstitutionalfunds.com |
| | | | |
| | Legg Mason Investor Services, LLC, Distributor A Legg Mason, Inc. subsidiary | |  |
Item 2. Code of Ethics.
Not applicable for semiannual reports.
Item 3. Audit Committee Financial Expert.
Not applicable for semiannual reports.
Item 4. Principal Accountant Fees and Services.
Not applicable for semiannual reports.
Item 5. Audit Committee of Listed Registrants.
The Registrant is not a listed issuer as defined in Rule 10A-3 under the Securities Exchange Act of 1934.
Item 6. Schedule of Investments
The schedule of investments in securities of unaffiliated issuers is included as part of the report to shareholders filed under Item 1 of this Form.
Item 7. Disclosure of Proxy Voting Policies and Procedures for Closed-End Management Investment Companies.
Not applicable.
Item 8. Portfolio Managers of Closed-End Management Investment Companies.
Not applicable.
Item 9. Purchases of Equity Securities by Closed-End Management Investment Companies and Affiliated Purchasers.
Not applicable.
Item 10. Submission of Matters to a Vote of Security Holders.
Not applicable.
Item 11. Controls and Procedures.
(a) The Registrant’s principal executive and principal financial officers have concluded, based on their evaluation of the effectiveness of the design and operation of the Registrant’s disclosure controls and procedures (as defined in Rule 30a-3(c) under the Investment Company Act of 1940) as of a date within 90 days of the filing date of this report that the Registrant’s disclosure controls and procedures are effective, and that the disclosure controls and procedures are reasonably designed to ensure that the information required to be disclosed by the Registrant on Form N-CSR is recorded, processed, summarized and reported within the time periods specified in the SEC’s rules and forms and that information required to be disclosed is properly communicated to the Registrant’s management, including its principal executive and principal financial officers, as appropriate, to allow timely decisions regarding the required disclosures.
(b) There were no changes in the Registrant’s internal control over financial reporting (as defined in Rule 30a-3(d) under the Investment Company Act of 1940) during the Registrant’s second fiscal quarter of the period covered by this report that have materially affected, or are reasonably likely to materially affect, the Registrant’s internal control over financial reporting.
Item 12. Exhibits.
(a) (1) Not applicable for semiannual reports.
(a) (2) Separate certifications for the Registrant’s principal executive officer and principal financial officer are attached.
(b) Separate certifications for the Registrant’s principal executive officer and principal financial officer are attached.
SIGNATURES
Pursuant to the requirements of the Securities Exchange Act of 1934 and the Investment Company Act of 1940, the registrant has duly caused this report to be signed on its behalf by the undersigned, thereunto duly authorized.
|
| Legg Mason Income Trust, Inc. |
|
/s/ Mark R. Fetting |
Mark R. Fetting |
President, Legg Mason Income Trust, Inc. |
Date: August 28, 2007
Pursuant to the requirements of the Securities Exchange Act of 1934 and the Investment Company Act of 1940, this report has been signed below by the following persons on behalf of the registrant and in the capacities and on the dates indicated.
|
/s/ Mark R. Fetting |
Mark R. Fetting |
President, Legg Mason Income Trust, Inc. |
Date: August 28, 2007
|
/s/ Marie K. Karpinski |
Marie K. Karpinski |
Vice President and Chief Financial Officer, Legg Mason Income Trust, Inc. |
Date: August 17, 2007