UNITED STATES
SECURITIES AND EXCHANGE COMMISSION
Washington, D.C. 20549
FORM N-CSR
CERTIFIED SHAREHOLDER REPORT OF
REGISTERED MANAGEMENT INVESTMENT COMPANIES
| | |
Investment Company Act file number: | | 811-05029 |
Legg Mason Income Trust, Inc.
| | |
100 Light Street, Baltimore, MD | | 21202 |
| Address of Principal Executive Offices: | | |
Richard M. Wachterman, Esq.
Legg Mason & Co., LLC
100 Light Street
Baltimore, MD 21202
|
| Name and address of agent for service: |
Registrant’s telephone number, including area code: (410) 539-0000
Date of fiscal year end: December 31, 2008
Date of reporting period: December 31, 2008
| Item 1. | Report to Shareholders |
Page 1 of 8
| | |
| Annual Report to Shareholders | | 1 |
To Our Shareholders,
We are pleased to provide you with Legg Mason Income Trust’s annual report for the year ended December 31, 2008, combining reports for the Legg Mason Investment Grade Income Portfolio and Legg Mason Limited Duration Bond Portfolio.
The following table summarizes key statistics for the Primary Class of each portfolio, as of December 31, 2008:
| | | | | | | | |
| | | SEC YieldA | | | Average Life | | Net Asset Value
Per Share |
Investment Grade | | 12.29 | % | | 11.74 years | | $ | 6.96 |
Limited Duration | | 6.92 | % | | 4.96 years | | $ | 7.95 |
A | SEC yields reported are for the 30 days ended December 31, 2008. Yields are subject to change at any time. |
For the year ended December 31, 2008, total returns for the Primary Class of shares of the Investment Grade Income and Limited Duration Portfolios were -26.19% and -16.52%, respectively. Total returns for the Institutional Class of shares of the Investment Grade Income and Limited Duration Portfolios were -25.71% and -16.09%, respectively.
The performance data quoted represent past performance and do not guarantee future results. Current performance may be lower or higher than the performance data quoted. To obtain the most recent month-end performance information, please visit www.leggmason.com/individualinvestors. The investment return and principal value of the Funds will fluctuate so that an investor’s shares, when redeemed, may be worth more or less than the original cost. Calculations assume reinvestment of dividends and capital gain distributions. Performance would have been lower if fees had not been waived in various periods.
Information about each Fund’s performance over longer periods of time is shown in the respective Performance Information sections within this report. For more information about the Funds’ share classes included in this report, please contact your financial advisor.
PricewaterhouseCoopers LLP, the Funds’ independent registered public accounting firm, has completed its annual examination of the Funds, and audited financial statements for the fiscal year ended December 31, 2008 are included in this report.
Many Primary Class shareholders invest regularly in Fund shares on a dollar cost averaging basis. Most do so by authorizing automatic, monthly transfers of $50 or more from their bank checking or brokerage accounts. Dollar cost averaging is a convenient and sensible way to invest, as it encourages continued purchases over time regardless of fluctuating price levels. Of course, it does not ensure a profit nor protect against declines in the value of your investment. Your financial advisor will be happy to help you establish a dollar cost averaging account should you wish to do so.
| | |
2 | | Annual Report to Shareholders |
This is my first letter to you as Chairman of the Funds. In November, the Funds’ Board of Directors elected David Odenath as President and me as Chairman of the Board of Directors of the Funds. At that meeting, Jack Curley, who served as Chairman of all the Legg Mason Funds, retired after many years of exemplary service. Jack embodied the finest qualities of a good chairman; he was ethical, hard-working and perceptive. He had a deep understanding of mutual fund issues and always acted in the shareholders’ best interests. I have big shoes to fill and I will work hard to do so. We wish Jack all the best and thank him for his many years of service.
On behalf of the Board and the entire team at Legg Mason, we appreciate your support.
Sincerely,
| | | | |
| | |
 | | | |  |
| Mark R. Fetting | | | | David Odenath |
| Chairman | | | | President |
February 27, 2009
| | |
| Annual Report to Shareholders | | 3 |
Management’s Discussion of Fund Performance
Legg Mason Investment Grade Income Portfolio
Total returns for the Fund for various periods ended December 31, 2008 are presented below, along with those of comparative indices:
| | | | | | | | | | | | |
| | | | | | Average Annual Total Returns | |
| | | One
Year | | | Five
Years | | | Ten
Years | | | Since
InceptionA | |
Investment Grade: | | | | | | | | | | | | |
Primary Class | | –26.19 | % | | –2.92 | % | | +1.86 | % | | +5.39 | % |
Institutional Class | | –25.71 | % | | –2.41 | % | | +2.40 | % | | +3.65 | % |
Barclays Capital U.S. Credit Bond IndexB | | –3.08 | % | | +2.65 | % | | +4.85 | % | | +7.41 | % |
Lipper Corporate Debt Funds BBB Rated | | | | | | | | | | | | |
Category AverageC | | –9.44 | % | | +1.05 | % | | +3.61 | % | | +6.28 | % |
The performance data quoted represent past performance and do not guarantee future results. Current performance may be lower or higher than the performance data quoted. To obtain the most recent month-end performance information for the Primary and Institutional Classes, please visit www.leggmason.com/individualinvestors. The investment return and principal value of the Fund will fluctuate so that an investor’s shares, when redeemed, may be worth more or less than the original cost. Calculations assume reinvestment of dividends and capital gain distributions. Performance would have been lower if fees had not been waived in various periods.
The gross expense ratios for the Primary and Institutional Classes were 1.30% and 0.74%, respectively, as indicated in the Fund’s most current prospectus dated May 1, 2008 and do not reflect fee waivers or reimbursements. These expenses include management fees, 12b-1 distribution and service fees and other expenses.
The net expense ratios for the Primary and Institutional Classes were 1.00%, and 0.50%, respectively, as indicated in the Fund’s prospectus dated May 1, 2008 and reflect voluntary fee waivers and/or reimbursements, which are currently expected to continue until April 30, 2009, but which may be reduced or terminated at any time.
For the 12 months ended December 31, 2008, Primary Class shares of Legg Mason Investment Grade Income Portfolio returned -26.19%. The Fund’s unmanaged benchmark, the Barclays Capital U.S. Credit Bond Index (the “Index”), returned -3.08% for the same period. The Lipper Corporate Debt Funds BBB Rated Category Average returned -9.44% over the same time frame.
| | |
4 | | Annual Report to Shareholders |
Issue selection had a negative impact on relative performance due, in large part, to 19 of the portfolio’s 20 largest overweights underperforming. Sub-sector allocation also had a negative impact on relative performance due, in large part, to the portfolio’s overweights in basic Industry, Financials and Energy, which returned - -10.07%, -8.37% and -5.84%, respectively, as well as underweights to Non-Corporates, Consumer Noncyclicals and Capital Goods, which returned 6.68%, 4.12% and -1.27%, respectively. In addition, credit quality allocation had a negative impact on relative performance. This was due to the portfolio’s overweight to BBB-rated issues, which returned -8.67%, and an underweight to AAA-rated issues, which returned 8.15%.
Western Asset Management Company
January 20, 2009
A | The inception date of the Primary Class is August 7, 1987. The inception date of the Institutional Class is December 1, 1995. Index returns are for periods beginning July 31, 1987. Although it is not possible to invest in an index, it is possible to purchase investment vehicles designed to track the performance of certain indices. |
B | The Barclays Capital (formerly Lehman Brothers) U.S. Credit Bond Index is an index composed of corporate and non-corporate debt issues that are investment grade (rated Baa3/BBB- or higher). |
C | Lipper, Inc., a wholly-owned subsidiary of Reuters, provides independent insight on global collective investments. The Lipper Corporate Debt Funds BBB Rated Category Average is comprised of the Fund’s peer group of mutual funds. |
| | |
| Annual Report to Shareholders | | 5 |
Expense Example
Legg Mason Investment Grade Income Portfolio
As a shareholder of the Fund, you incur ongoing costs, including management fees, distribution and service (12b-1) fees on Primary Class shares; and other Fund expenses. These examples are intended to help you understand your ongoing costs (in dollars) of investing in the Fund and to compare these costs with the ongoing costs of investing in other mutual funds. Each example is based on an investment of $1,000 invested on July 1, 2008, and held through December 31, 2008. The ending values assume dividends were reinvested at the time they were paid.
Actual Expenses
The first line for each class in the table below provides information about actual account values and actual expenses for each class. You may use the information in this line, together with the amount you invested, to estimate the expenses that you paid over the period. Simply divide your account value by $1,000 (for example, an $8,600 account value divided by $1,000 = 8.6), then multiply the result by the number in the first line under the heading entitled “Expenses Paid During the Period” to estimate the expenses you paid on your account if your shares were held through the entire period.
Hypothetical Example for Comparison Purposes
The second line for each class in the table below provides information about hypothetical account values and hypothetical expenses based on the relevant class’s actual expense ratio and an assumed rate of return of 5% per year before expenses, which is not the class’s actual return. The hypothetical account values and expenses may not be used to estimate the actual ending account balance or expenses you paid for the period. You may use this information to compare the ongoing costs of investing in the Fund and other funds. To do so, compare these 5% hypothetical examples with the 5% hypothetical examples for the relevant class that appear in the shareholder reports of other funds.
| | | | | | | | | |
| | | Beginning
Account
Value
7/1/08 | | Ending
Account
Value
12/31/08 | | Expenses PaidA
During the
Period
7/1/08 to 12/31/08 |
Primary Class: | | | | | | | | | |
Actual | | $ | 1,000.00 | | $ | 761.30 | | $ | 4.43 |
Hypothetical (5% return before expenses) | | | 1,000.00 | | | 1,020.11 | | | 5.08 |
Institutional Class: | | | | | | | | | |
Actual | | $ | 1,000.00 | | $ | 764.40 | | $ | 2.22 |
Hypothetical (5% return before expenses) | | | 1,000.00 | | | 1,022.62 | | | 2.54 |
A | These calculations are based on expenses incurred in the most recent fiscal half-year. The dollar amounts shown as “Expenses Paid” are equal to the annualized expense ratios of 1.00%, and .50% for the Primary Class and Institutional Class, respectively, multiplied by the average values over the period, multiplied by the number of days in the most recent fiscal half-year (184), and divided by 366. |
| | |
6 | | Annual Report to Shareholders |
Performance Information
Legg Mason investment Grade Income Portfolio
The graphs on the following pages compare the Fund’s total returns to that of a closely matched broad-based securities market index. The graphs illustrate the cumulative total return of an initial $10,000 investment in Primary Class shares of the Fund and an initial $1,000,000 investment in Institutional Class shares of the Fund for the periods indicated. The lines for the Fund represent the total return after deducting all Fund investment management and other administrative expenses and the transaction costs of buying and selling securities. The lines representing the securities market index do not take into account any transaction costs associated with buying and selling portfolio securities in the index or other administrative expenses.
Total return measures investment performance in terms of appreciation or depreciation in a fund’s net asset value per share, plus dividends and any capital gain distributions. Both the Fund’s results and the index’s results assume reinvestment of all dividends and distributions at the time they were paid. Average annual returns tend to smooth out variations in a fund’s return, so that they differ from actual year-to-year results.
| | |
| Annual Report to Shareholders | | 7 |
Growth of a $10,000 Investment — Primary Class
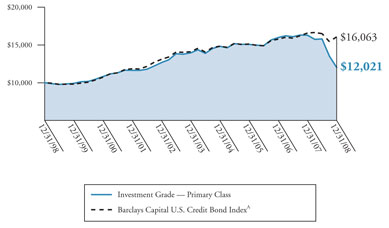
Periods Ended December 31, 2008
| | | | | | |
| | | Cumulative
Total Return | | | Average Annual
Total Return | |
One Year | | -26.19 | % | | -26.19 | % |
Five Years | | -13.78 | % | | -2.92 | % |
Ten Years | | +20.21 | % | | +1.86 | % |
The performance data quoted represent past performance and do not guarantee future results. The performance stated may have been due to extraordinary market conditions, which may not be duplicated in the future. Current performance may be lower or higher than the performance data quoted. To obtain the most recent month-end performance information please visit www.leggmason.com/individualinvestors. The investment return and principal value of the Fund will fluctuate so that an investor’s shares, when redeemed, may be worth more or less than the original cost. Calculations assume reinvestment of dividends and capital gain distributions. Performance would have been lower if fees had not been waived in various periods.
The graph and table do not reflect the deduction of taxes that a shareholder would pay on Fund distributions or the redemption of Fund shares.
A | This index consists of publicly issued US corporate and specified foreign debentures and secured notes that meet the specified maturity, liquidity, and quality requirements. To qualify, bonds must be SEC-registered. The index includes both corporate (industrial, utility and finance) and non-corporate (sovereign, supranational, foreign agency, and foreign local government) sectors. Formerly: Lehman Credit Bond Index. The name change is a result of Barclays’ purchase of Lehman Brothers in September 2008. |
| | |
8 | | Annual Report to Shareholders |
Performance Information — Continued
Growth of a $1,000,000 Investment — Institutional Class
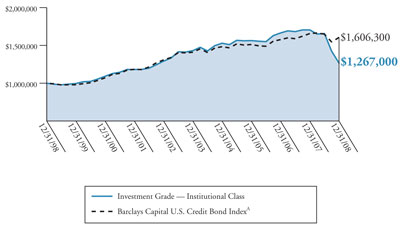
Periods Ended December 31, 2008
| | | | | | |
| | | Cumulative
Total Return | | | Average Annual
Total Return | |
One Year | | -25.71 | % | | -25.71 | % |
Five Years | | -11.46 | % | | -2.41 | % |
Ten Years | | +26.71 | % | | +2.40 | % |
The performance data quoted represent past performance and do not guarantee future results. The performance stated may have been due to extraordinary market conditions, which may not be duplicated in the future. Current performance may be lower or higher than the performance data quoted. To obtain the most recent month-end performance information please visit www.leggmason.com/individualinvestors. The investment return and principal value of the Fund will fluctuate so that an investor’s shares, when redeemed, may be worth more or less than the original cost. Calculations assume reinvestment of dividends and capital gain distributions. Performance would have been lower if fees had not been waived in various periods.
The graph and table do not reflect the deduction of taxes that a shareholder would pay on Fund distributions or the redemption of Fund shares.
| | |
| Annual Report to Shareholders | | 9 |
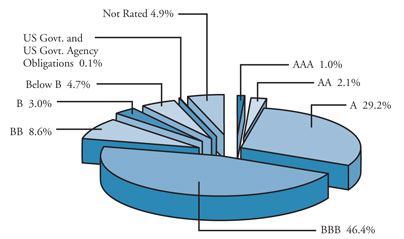
Portfolio Composition (as of December 31, 2008)B
Standard & Poor’s Debt RatingsC (as a percentage of the portfolio)
Maturity Schedule (as a percentage of the portfolio)
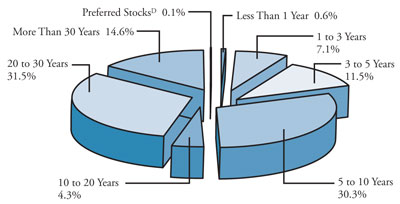
B | The Fund is actively managed. As a result, the composition of its portfolio holdings and sectors is subject to change at any time. The charts do not include derivatives such as Futures Contracts and Options Written. |
C | Standard & Poor’s Ratings Service provides capital markets with credit ratings for the evaluation and assessment of credit risk. These ratings are the opinions of S&P and not absolute measures of quality or guarantees of performance. |
D | Preferred Stocks do not have a defined maturity date. |
| | |
10 | | Annual Report to Shareholders |
Performance Information — Continued
Legg Mason Investment Grade
Spread Duration
December 31, 2008
Economic Exposure

Spread duration is defined as the change in value for a 100 basis point change in the spread relative to Treasuries. The spread over Treasuries is the annual risk- premium demanded by investors to hold non-Treasury securities. This chart highlights the market sector exposure of the portfolio and the exposure relative to the selected benchmark as of the end of the reporting period.
| LCBI | — Barclays U.S. Capital Credit Bond Index |
| IG Credit | — Investment Grade Credit |
| ABS | — Asset Backed Securities |
| | |
| Annual Report to Shareholders | | 11 |
Legg Mason Investment Grade
Effective Duration
December 31, 2008
Interest Rate Exposure
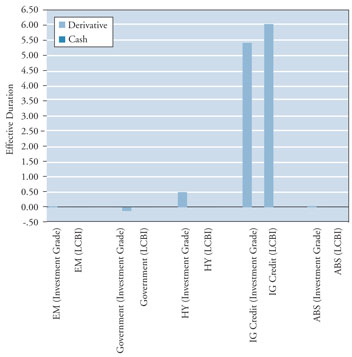
Effective duration is defined as the change in value for a 100 basis point change in Treasury yields. This chart highlights the interest rate exposure of the portfolio relative to the selected benchmark as of the end of the reporting period.
| LCBI | — Barclays U.S. Capital Credit Bond Index |
| IG Credit | — Investment Grade Credit |
| ABS | — Asset Backed Securities |
| | |
12 | | Annual Report to Shareholders |
Portfolio of Investments
Investment Grade Income Portfolio
December 31, 2008
| | | | | | | | | | | | |
| | | Rate | | | Maturity
Date | | Par/Shares | | Value | |
Long-Term Securities — 97.3% | | | | | | | | | | | | |
Corporate Bonds and Notes — 76.6% | | | | | | | | | | | | |
Aerospace and Defense — 1.1% | | | | | | | | | | | | |
L-3 Communications Corp. | | 7.625 | % | | 6/15/12 | | $ | 1,000,000 | | $ | 977,500 | |
United Technologies Corp. | | 6.125 | % | | 2/1/19 | | | 200,000 | | | 213,979 | |
United Technologies Corp. | | 5.400 | % | | 5/1/35 | | | 1,140,000 | | | 1,074,344 | |
| | | | | | | | | | | | |
| | | | | | | | | | | 2,265,823 | |
| | | | | | | | | | | | |
Airlines — 0.2% | | | | | | | | | | | | |
Continental Airlines Inc. | | 6.545 | % | | 2/2/19 | | | 149,004 | | | 119,203 | |
Continental Airlines Inc. | | 7.256 | % | | 3/15/20 | | | 427,062 | | | 328,838 | |
| | | | | | | | | | | | |
| | | | | | | | | | | 448,041 | |
| | | | | | | | | | | | |
Automobiles — 1.1% | | | | | | | | | | | | |
DaimlerChrysler NA Holding Corp. | | 8.500 | % | | 1/18/31 | | | 600,000 | | | 438,733 | |
Ford Motor Co. | | 7.450 | % | | 7/16/31 | | | 1,975,000 | | | 553,000 | |
Ford Motor Co. | | 8.900 | % | | 1/15/32 | | | 370,000 | | | 88,800 | |
General Motors Corp. | | 8.250 | % | | 7/15/23 | | | 650,000 | | | 107,250 | |
General Motors Corp. | | 8.375 | % | | 7/15/33 | | | 6,190,000 | | | 1,083,250 | |
| | | | | | | | | | | | |
| | | | | | | | | | | 2,271,033 | |
| | | | | | | | | | | | |
Beverages — 0.3% | | | | | | | | | | | | |
Foster’s Finance Corp. | | 4.875 | % | | 10/1/14 | | | 840,000 | | | 721,875 | A |
Building Products — N.M. | | | | | | | | | | | | |
American Standard Inc. | | 8.250 | % | | 6/1/09 | | | 37,000 | | | 37,225 | |
American Standard Inc. | | 7.625 | % | | 2/15/10 | | | 5,000 | | | 5,000 | |
| | | | | | | | | | | | |
| | | | | | | | | | | 42,225 | |
| | | | | | | | | | | | |
Capital Markets — 5.0% | | | | | | | | | | | | |
BankAmerica Capital III | | 5.323 | % | | 1/15/27 | | | 585,000 | | | 310,192 | B |
Goldman Sachs Capital II | | 5.793 | % | | 12/29/49 | | | 2,755,000 | | | 1,059,085 | C |
Lehman Brothers Holdings Capital Trust VII | | 5.857 | % | | 11/29/49 | | | 3,100,000 | | | 310 | C,D |
Lehman Brothers Holdings Inc. | | 6.500 | % | | 7/19/17 | | | 2,000,000 | | | 200 | D |
Merrill Lynch and Co. Inc. | | 6.050 | % | | 8/15/12 | | | 540,000 | | | 532,753 | |
| | |
| Annual Report to Shareholders | | 13 |
| | | | | | | | | | | | |
| | | Rate | | | Maturity
Date | | Par/Shares | | Value | |
Corporate Bonds and Notes — Continued | | | | | | | | | | | | |
Capital Markets — Continued | | | | | | | | | | | | |
Merrill Lynch and Co. Inc. | | 5.700 | % | | 5/2/17 | | $ | 2,400,000 | | $ | 2,126,294 | |
Merrill Lynch and Co. Inc. | | 6.400 | % | | 8/28/17 | | | 1,210,000 | | | 1,212,259 | |
Merrill Lynch and Co. Inc. | | 6.110 | % | | 1/29/37 | | | 910,000 | | | 818,022 | |
Morgan Stanley | | 5.050 | % | | 1/21/11 | | | 400,000 | | | 384,198 | |
Morgan Stanley | | 5.250 | % | | 11/2/12 | | | 750,000 | | | 682,106 | |
Morgan Stanley | | 4.750 | % | | 4/1/14 | | | 65,000 | | | 49,523 | |
Morgan Stanley | | 6.625 | % | | 4/1/18 | | | 1,050,000 | | | 921,154 | |
The Bear Stearns Cos. Inc. | | 6.400 | % | | 10/2/17 | | | 440,000 | | | 457,238 | |
The Bear Stearns Cos. Inc. | | 7.250 | % | | 2/1/18 | | | 590,000 | | | 646,555 | |
The Goldman Sachs Group Inc. | | 6.345 | % | | 2/15/34 | | | 2,025,000 | | | 1,469,449 | |
| | | | | | | | | | | | |
| | | | | | | | | | | 10,669,338 | |
| | | | | | | | | | | | |
Chemicals — 0.4% | | | | | | | | | | | | |
The Dow Chemical Co. | | 7.375 | % | | 11/1/29 | | | 800,000 | | | 753,422 | |
| | | | | | | | | | | | |
Commercial Banks — 7.4% | | | | | | | | | | | | |
CBA Capital Trust I | | 5.805 | % | | 6/30/49 | | | 3,510,000 | | | 2,356,509 | A |
Comerica Capital Trust II | | 6.576 | % | | 2/20/37 | | | 990,000 | | | 397,436 | C |
KeyBank NA | | 5.800 | % | | 7/1/14 | | | 5,000 | | | 4,401 | |
Rabobank Capital Funding Trust II | | 5.260 | % | | 12/31/49 | | | 320,000 | | | 169,290 | A,C |
Rabobank Capital Funding Trust III | | 5.254 | % | | 10/21/49 | | | 3,120,000 | | | 1,710,612 | A,C |
RBS Capital Trust III | | 5.512 | % | | 9/30/49 | | | 4,020,000 | | | 1,607,027 | C |
SunTrust Bank | | 5.000 | % | | 9/1/15 | | | 770,000 | | | 712,265 | |
SunTrust Capital VIII | | 6.100 | % | | 12/15/36 | | | 1,550,000 | | | 1,091,216 | C |
SunTrust Preferred Capital I | | 5.853 | % | | 12/15/49 | | | 1,100,000 | | | 594,000 | C |
UnionBanCal Corp. | | 5.250 | % | | 12/16/13 | | | 785,000 | | | 668,696 | |
Wachovia Capital Trust III | | 5.800 | % | | 3/15/42 | | | 2,580,000 | | | 1,522,200 | C |
Wachovia Corp. | | 5.625 | % | | 10/15/16 | | | 2,000,000 | | | 1,826,994 | |
Wachovia Corp. | | 5.750 | % | | 6/15/17 | | | 580,000 | | | 577,298 | |
| | |
14 | | Annual Report to Shareholders |
Portfolio of Investments — Continued
Investment Grade Income Portfolio — Continued
| | | | | | | | | | | | |
| | | Rate | | | Maturity
Date | | Par/Shares | | Value | |
Corporate Bonds and Notes — Continued | | | | | | | | | | | | |
Commercial Banks — Continued | | | | | | | | | | | | |
Wells Fargo Capital X | | 5.950 | % | | 12/15/36 | | $ | 1,260,000 | | $ | 1,079,880 | |
Wells Fargo Capital XIII | | 7.700 | % | | 12/29/49 | | | 1,500,000 | | | 1,237,966 | C |
| | | | | | | | | | | | |
| | | | | | | | | | | 15,555,790 | |
| | | | | | | | | | | | |
Commercial Services and Supplies — 0.3% | |
Waste Management Inc. | | 7.375 | % | | 5/15/29 | | | 690,000 | | | 588,889 | |
| | | | | | | | | | | | |
Consumer Finance — 7.1% | | | | | | | | | | | | |
American Express Co. | | 6.800 | % | | 9/1/66 | | | 3,930,000 | | | 2,034,368 | C |
Capital One Financial Corp. | | 6.750 | % | | 9/15/17 | | | 670,000 | | | 648,945 | |
Ford Motor Credit Co. | | 7.375 | % | | 2/1/11 | | | 2,390,000 | | | 1,817,504 | |
Ford Motor Credit Co. | | 7.246 | % | | 6/15/11 | | | 6,828,000 | | | 4,506,480 | B |
GMAC LLC | | 7.500 | % | | 12/31/13 | | | 2,687,000 | | | 1,961,510 | A |
GMAC LLC | | 0.000 | % | | 6/15/15 | | | 40,000 | | | 6,753 | E |
GMAC LLC | | 8.000 | % | | 12/31/18 | | | 348,000 | | | 174,000 | A |
GMAC LLC | | 8.000 | % | | 11/1/31 | | | 2,465,000 | | | 1,465,171 | A |
Nelnet Inc. | | 7.400 | % | | 9/29/36 | | | 1,310,000 | | | 392,796 | C |
SLM Corp. | | 5.000 | % | | 10/1/13 | | | 1,400,000 | | | 1,001,728 | |
SLM Corp. | | 8.450 | % | | 6/15/18 | | | 1,290,000 | | | 1,019,901 | |
| | | | | | | | | | | | |
| | | | | | | | | | | 15,029,156 | |
| | | | | | | | | | | | |
Diversified Financial Services — 10.9% | |
AGFC Capital Trust I | | 6.000 | % | | 1/15/67 | | | 860,000 | | | 205,408 | A,C |
AIG SunAmerica Global Financing VI | | 6.300 | % | | 5/10/11 | | | 5,170,000 | | | 4,445,528 | A |
BAC Capital Trust XI | | 6.625 | % | | 5/23/36 | | | 1,000,000 | | | 924,062 | |
BAC Capital Trust XIV | | 5.630 | % | | 3/15/49 | | | 2,730,000 | | | 1,093,791 | C |
Bank of America Corp. | | 8.000 | % | | 12/29/49 | | | 1,540,000 | | | 1,107,703 | C |
Beaver Valley II Funding | | 9.000 | % | | 6/1/17 | | | 996,000 | | | 933,740 | |
Capital One Bank | | 6.500 | % | | 6/13/13 | | | 690,000 | | | 614,865 | |
Capmark Financial Group Inc. | | 5.875 | % | | 5/10/12 | | | 1,000,000 | | | 340,991 | |
Chase Capital II | | 3.693 | % | | 2/1/27 | | | 1,980,000 | | | 1,034,411 | B |
Citigroup Capital XXI | | 8.300 | % | | 12/21/57 | | | 970,000 | | | 748,100 | C |
| | |
| Annual Report to Shareholders | | 15 |
| | | | | | | | | | | | |
| | | Rate | | | Maturity
Date | | Par/Shares | | Value | |
Corporate Bonds and Notes — Continued | |
Diversified Financial Services — Continued | |
Citigroup Inc. | | 6.125 | % | | 8/25/36 | | $ | 1,000,000 | | $ | 895,795 | |
Citigroup Inc. | | 8.400 | % | | 4/29/49 | | | 375,000 | | | 247,609 | C |
General Electric Capital Corp. | | 6.750 | % | | 3/15/32 | | | 5,000 | | | 5,316 | |
General Electric Capital Corp. | | 6.375 | % | | 11/15/67 | | | 2,040,000 | | | 1,282,281 | C |
Glen Meadow Pass-Through Certificates | | 6.505 | % | | 2/12/67 | | | 860,000 | | | 384,500 | A,C |
HSBC Finance Capital Trust IX | | 5.911 | % | | 11/30/35 | | | 2,500,000 | | | 1,046,010 | C |
HSBC Finance Corp. | | 5.500 | % | | 1/19/16 | | | 1,260,000 | | | 1,196,623 | |
ILFC E-Capital Trust II | | 6.250 | % | | 12/21/65 | | | 2,320,000 | | | 968,862 | A,C |
JPMorgan Chase and Co. | | 4.891 | % | | 9/1/15 | | | 1,035,000 | | | 1,039,958 | C |
JPMorgan Chase and Co. | | 6.125 | % | | 6/27/17 | | | 325,000 | | | 319,840 | |
TNK-BP Finance SA | | 7.875 | % | | 3/13/18 | | | 310,000 | | | 155,000 | A |
UBS Preferred Funding | | | | | | | | | | | | |
Trust V | | 6.243 | % | | 5/15/49 | | | 3,030,000 | | | 1,654,756 | C |
ZFS Finance USA Trust II | | 6.450 | % | | 12/15/65 | | | 4,990,000 | | | 2,330,574 | A,C |
| | | | | | | | | | | | |
| | | | | | | | | | | 22,975,723 | |
| | | | | | | | | | | | |
Diversified Telecommunication Services — 2.5% | |
AT&T Corp. | | 8.000 | % | | 11/15/31 | | | 1,200,000 | | | 1,507,362 | |
AT&T Inc. | | 5.100 | % | | 9/15/14 | | | 760,000 | | | 747,070 | |
AT&T Inc. | | 5.600 | % | | 5/15/18 | | | 500,000 | | | 509,072 | |
Embarq Corp. | | 7.082 | % | | 6/1/16 | | | 930,000 | | | 716,100 | |
Verizon Global Funding Corp. | | 7.750 | % | | 6/15/32 | | | 375,000 | | | 414,695 | |
Verizon Global Funding Corp. | | 5.850 | % | | 9/15/35 | | | 1,350,000 | | | 1,343,182 | |
| | | | | | | | | | | | |
| | | | | | | | | | | 5,237,481 | |
| | | | | | | | | | | | |
Electric Utilities — 4.1% | | | | | | | | | | | | |
Commonwealth Edison Co. | | 5.800 | % | | 3/15/18 | | | 1,590,000 | | | 1,437,055 | |
Energy Future Holdings Corp. | | 10.875 | % | | 11/1/17 | | | 130,000 | | | 92,300 | A |
| | |
16 | | Annual Report to Shareholders |
Portfolio of Investments — Continued
Investment Grade Income Portfolio — Continued
| | | | | | | | | | | | |
| | | Rate | | | Maturity
Date | | Par/Shares | | Value | |
Corporate Bonds and Notes — Continued | |
Electric Utilities — Continued | | | | | | | | | | | | |
Energy Future Holdings Corp. | | 11.250 | % | | 11/1/17 | | $ | 2,930,000 | | $ | 1,421,050 | A,F |
FirstEnergy Corp. | | 7.375 | % | | 11/15/31 | | | 2,565,000 | | | 2,426,531 | |
Pacific Gas and Electric Co. | | 6.050 | % | | 3/1/34 | | | 1,900,000 | | | 2,017,912 | |
The Cleveland Electric Illuminating Co. | | 7.880 | % | | 11/1/17 | | | 850,000 | | | 873,182 | |
The Detroit Edison Co. | | 5.200 | % | | 10/15/12 | | | 310,000 | | | 305,836 | |
| | | | | | | | | | | | |
| | | | | | | | | | | 8,573,866 | |
| | | | | | | | | | | | |
Energy Equipment and Services — 1.1% | |
CenterPoint Energy Resources Corp. | | 7.875 | % | | 4/1/13 | | | 1,010,000 | | | 935,557 | |
EEB International Ltd. | | 8.750 | % | | 10/31/14 | | | 790,000 | | | 732,725 | A |
Pride International Inc. | | 7.375 | % | | 7/15/14 | | | 800,000 | | | 744,000 | |
| | | | | | | | | | | | |
| | | | | | | | | | | 2,412,282 | |
| | | | | | | | | | | | |
Food and Staples Retailing — 0.6% | |
Safeway Inc. | | 6.250 | % | | 3/15/14 | | | 120,000 | | | 120,622 | |
The Kroger Co. | | 8.000 | % | | 9/15/29 | | | 1,000,000 | | | 1,129,665 | |
| | | | | | | | | | | | |
| | | | | | | | | | | 1,250,287 | |
| | | | | | | | | | | | |
Food Products — 0.8% | |
Ahold Finance USA Inc. | | 8.250 | % | | 7/15/10 | | | 960,000 | | | 954,796 | |
Tyson Foods Inc. | | 7.850 | % | | 4/1/16 | | | 1,040,000 | | | 769,600 | G |
| | | | | | | | | | | | |
| | | | | | | | | | | 1,724,396 | |
| | | | | | | | | | | | |
Gas Utilities — 0.2% | |
Southern Natural Gas Co. | | 5.900 | % | | 4/1/17 | | | 480,000 | | | 380,380 | A |
Health Care Equipment and Supplies — 0.3% | |
Hospira Inc. | | 6.050 | % | | 3/30/17 | | | 840,000 | | | 682,263 | |
| | | | | | | | | | | | |
Health Care Providers and Services — 5.5% | | | | | | | | | | | | |
Cardinal Health Inc. | | 5.800 | % | | 10/15/16 | | | 1,100,000 | | | 995,146 | |
Coventry Health Care Inc. | | 5.950 | % | | 3/15/17 | | | 1,150,000 | | | 599,544 | |
| | |
| Annual Report to Shareholders | | 17 |
| | | | | | | | | | | | |
| | | Rate | | | Maturity
Date | | Par/Shares | | Value | |
Corporate Bonds and Notes — Continued | | | | | | | | | | | | |
Health Care Providers and Services — Continued | | | | | | | | | | | | |
HCA Inc. | | 6.300 | % | | 10/1/12 | | $ | 1,790,000 | | $ | 1,261,950 | |
HCA Inc. | | 6.250 | % | | 2/15/13 | | | 2,130,000 | | | 1,331,250 | |
HCA Inc. | | 5.750 | % | | 3/15/14 | | | 150,000 | | | 90,750 | |
HCA Inc. | | 9.125 | % | | 11/15/14 | | | 1,100,000 | | | 1,020,250 | |
HCA Inc. | | 9.250 | % | | 11/15/16 | | | 1,380,000 | | | 1,266,150 | |
Humana Inc. | | 6.450 | % | | 6/1/16 | | | 600,000 | | | 474,388 | |
Quest Diagnostics Inc. | | 5.125 | % | | 11/1/10 | | | 565,000 | | | 548,435 | |
UnitedHealth Group Inc. | | 6.000 | % | | 11/15/17 | | | 1,610,000 | | | 1,439,234 | |
Universal Health Services Inc. | | 7.125 | % | | 6/30/16 | | | 1,450,000 | | | 1,251,536 | |
WellPoint Inc. | | 5.875 | % | | 6/15/17 | | | 1,560,000 | | | 1,419,810 | |
| | | | | | | | | | | | |
| | | | | | | | | | | 11,698,443 | |
| | | | | | | | | | | | |
Independent Power Producers and Energy Traders — 1.2% | |
Dynegy Holdings Inc. | | 8.750 | % | | 2/15/12 | | | 1,690,000 | | | 1,487,200 | |
TXU Corp. | | 6.500 | % | | 11/15/24 | | | 2,730,000 | | | 965,841 | |
| | | | | | | | | | | | |
| | | | | | | | | | | 2,453,041 | |
| | | | | | | | | | | | |
Industrial Conglomerates — 0.7% | | | | | | | | | | | | |
Tyco International Ltd. / Tyco International Finance SA | | 6.875 | % | | 1/15/21 | | | 2,051,000 | | | 1,585,983 | |
| | | | | | | | | | | | |
Insurance — 4.3% | | | | | | | | | | | | |
Ace Ina Holdings Inc. | | 5.700 | % | | 2/15/17 | | | 410,000 | | | 367,624 | |
Allstate Corp. | | 6.500 | % | | 5/15/57 | | | 1,450,000 | | | 815,348 | C |
American International Group Inc. | | 6.250 | % | | 3/15/37 | | | 230,000 | | | 85,968 | |
ASIF Global Financing XIX | | 4.900 | % | | 1/17/13 | | | 90,000 | | | 72,247 | A |
Everest Reinsurance Holdings Inc. | | 6.600 | % | | 5/15/37 | | | 760,000 | | | 310,177 | C |
Hartford Financial Services Group Inc. | | 8.125 | % | | 6/15/38 | | | 825,000 | | | 434,362 | C |
Liberty Mutual Group | | 5.750 | % | | 3/15/14 | | | 720,000 | | | 465,436 | A |
| | |
18 | | Annual Report to Shareholders |
Portfolio of Investments — Continued
Investment Grade Income Portfolio — Continued
| | | | | | | | | | | | |
| | | Rate | | | Maturity
Date | | Par/Shares | | Value | |
Corporate Bonds and Notes — Continued | | | | | | | | | | | | |
Insurance — Continued | | | | | | | | | | | | |
Liberty Mutual Group | | 7.800 | % | | 3/15/37 | | $ | 810,000 | | $ | 363,489 | A |
MetLife Inc. | | 6.400 | % | | 12/15/36 | | | 3,325,000 | | | 1,995,000 | C |
Prudential Financial Inc. | | 8.875 | % | | 6/15/38 | | | 910,000 | | | 586,249 | C |
The Chubb Corp. | | 6.375 | % | | 3/29/37 | | | 910,000 | | | 564,375 | C |
The Travelers Cos. Inc. | | 6.250 | % | | 3/15/37 | | | 1,790,000 | | | 1,172,516 | C |
The Travelers Cos. Inc. | | 6.250 | % | | 6/15/37 | | | 710,000 | | | 682,644 | |
Willis North America Inc. | | 5.125 | % | | 7/15/10 | | | 760,000 | | | 620,424 | |
Willis North America Inc. | | 5.625 | % | | 7/15/15 | | | 660,000 | | | 483,125 | |
| | | | | | | | | | | | |
| | | | | | | | | | | 9,018,984 | |
| | | | | | | | | | | | |
IT Services — 0.3% | | | | | | | | | | | | |
Electronic Data Systems Corp. | | 7.450 | % | | 10/15/29 | | | 570,000 | | | 617,492 | |
| | | | | | | | | | | | |
Leisure Equipment and Products — 0.6% | | | | | | | | | | | | |
Eastman Kodak Co. | | 7.250 | % | | 11/15/13 | | | 500,000 | | | 322,500 | |
Hasbro Inc. | | 6.300 | % | | 9/15/17 | | | 970,000 | | | 917,177 | I |
| | | | | | | | | | | | |
| | | | | | | | | | | 1,239,677 | |
| | | | | | | | | | | | |
Media — 3.7% | | | | | | | | | | | | |
Clear Channel Communications Inc. | | 4.400 | % | | 5/15/11 | | | 1,210,000 | | | 296,450 | |
Clear Channel Communications Inc. | | 5.500 | % | | 9/15/14 | | | 500,000 | | | 60,000 | |
Comcast Cable Holdings LLC | | 7.125 | % | | 2/15/28 | | | 180,000 | | | 170,225 | |
Comcast Corp. | | 6.950 | % | | 8/15/37 | | | 1,800,000 | | | 1,895,494 | |
Comcast Corp. | | 6.400 | % | | 5/15/38 | | | 750,000 | | | 748,247 | |
News America Inc. | | 6.550 | % | | 3/15/33 | | | 1,495,000 | | | 1,340,365 | |
Omnicom Group Inc. | | 0.000 | % | | 7/1/38 | | | 300,000 | | | 271,125 | E,J |
Time Warner Entertainment Co. LP | | 8.375 | % | | 7/15/33 | | | 505,000 | | | 509,610 | |
Time Warner Inc. | | 6.875 | % | | 5/1/12 | | | 500,000 | | | 480,348 | |
| | |
| Annual Report to Shareholders | | 19 |
| | | | | | | | | | | | |
| | | Rate | | | Maturity
Date | | Par/Shares | | Value | |
Corporate Bonds and Notes — Continued | | | | | | | | | | | | |
Media — Continued | | | | | | | | | | | | |
Time Warner Inc. | | 9.125 | % | | 1/15/13 | | $ | 1,130,000 | | $ | 1,119,837 | |
Time Warner Inc. | | 7.700 | % | | 5/1/32 | | | 1,015,000 | | | 1,016,251 | |
| | | | | | | | | | | | |
| | | | | | | | | | | 7,907,952 | |
| | | | | | | | | | | | |
Metals and Mining — 2.8% | | | | | | | | | | |
Alcoa Inc. | | 6.000 | % | | 7/15/13 | | | 260,000 | | | 235,088 | |
Freeport-McMoRan Copper & Gold Inc. | | 8.375 | % | | 4/1/17 | | | 4,520,000 | | | 3,706,400 | |
GTL Trade Finance Inc. | | 7.250 | % | | 10/20/17 | | | 2,232,000 | | | 1,872,335 | A |
| | | | | | | | | | | | |
| | | | | | | | | | | 5,813,823 | |
| | | | | | | | | | | | |
Multi-Utilities — 0.1% | | | | | | | | | | | | |
DTE Energy Co. | | 6.350 | % | | 6/1/16 | | | 270,000 | | | 241,970 | |
| | | | | | | | | | | | |
Multiline Retail — 0.9% | | | | | | | | | | | | |
Federated Retail Holdings Inc. | | 5.350 | % | | 3/15/12 | | | 435,000 | | | 323,106 | |
Macy’s Retail Holdings Inc. | | 5.875 | % | | 1/15/13 | | | 1,000,000 | | | 703,762 | |
May Department Stores Co. | | 5.750 | % | | 7/15/14 | | | 1,070,000 | | | 678,875 | |
May Department Stores Co. | | 6.650 | % | | 7/15/24 | | | 490,000 | | | 268,965 | |
| | | | | | | | | | | | |
| | | | | | | | | | | 1,974,708 | |
| | | | | | | | | | | | |
Oil, Gas and Consumable Fuels — 8.1% | | | | | | | | | | |
DCP Midstream LLC | | 6.750 | % | | 9/15/37 | | | 1,830,000 | | | 1,381,123 | A |
Devon Financing Corp. ULC | | 7.875 | % | | 9/30/31 | | | 560,000 | | | 616,618 | |
Duke Capital LLC | | 6.250 | % | | 2/15/13 | | | 340,000 | | | 323,508 | |
El Paso Corp. | | 7.800 | % | | 8/1/31 | | | 1,660,000 | | | 1,081,495 | |
El Paso Corp. | | 7.750 | % | | 1/15/32 | | | 340,000 | | | 220,701 | |
EOG Resources Inc. | | 5.875 | % | | 9/15/17 | | | 1,100,000 | | | 1,116,708 | |
Hess Corp. | | 7.875 | % | | 10/1/29 | | | 2,970,000 | | | 2,851,146 | |
KazMunaiGaz Exploration Production — GDR | | 8.375 | % | | 7/2/13 | | | 910,000 | | | 709,800 | A |
Kerr-McGee Corp. | | 6.950 | % | | 7/1/24 | | | 390,000 | | | 341,971 | |
| | |
20 | | Annual Report to Shareholders |
Portfolio of Investments — Continued
Investment Grade Income Portfolio — Continued
| | | | | | | | | | | | |
| | | Rate | | | Maturity
Date | | Par/Shares | | Value | |
Corporate Bonds and Notes — Continued | | | | | | | | | | | | |
Oil, Gas and Consumable Fuels — Continued | | | | | | | | | | |
Kinder Morgan Energy Partners LP | | 7.125 | % | | 3/15/12 | | $ | 1,430,000 | | $ | 1,381,097 | |
Pemex Project Funding Master Trust | | 6.625 | % | | 6/15/35 | | | 3,624,000 | | | 3,067,716 | |
Pemex Project Funding Master Trust | | 6.625 | % | | 6/15/35 | | | 260,000 | | | 220,090 | A |
Tennessee Gas Pipeline Co. | | 8.375 | % | | 6/15/32 | | | 1,000,000 | | | 862,891 | |
The Williams Cos. Inc. | | 7.625 | % | | 7/15/19 | | | 2,000,000 | | | 1,562,500 | |
Valero Energy Corp. | | 6.875 | % | | 4/15/12 | | | 390,000 | | | 392,196 | |
XTO Energy Inc. | | 6.100 | % | | 4/1/36 | | | 1,270,000 | | | 1,054,538 | |
| | | | | | | | | | | | |
| | | | | | | | | | | 17,184,098 | |
| | | | | | | | | | | | |
Paper and Forest Products — 0.4% | | | | | | | | | | | | |
Weyerhaeuser Co. | | 6.750 | % | | 3/15/12 | | | 870,000 | | | 778,780 | |
| | | | | | | | | | | | |
Pharmaceuticals — 0.2% | | | | | | | | | | | | |
Wyeth | | 5.950 | % | | 4/1/37 | | | 440,000 | | | 488,526 | |
| | | | | | | | | | | | |
Real Estate Investment Trusts (REITs) — 1.0% | | | | | | | | | | |
Health Care REIT Inc. | | 5.875 | % | | 5/15/15 | | | 1,440,000 | | | 994,228 | |
iStar Financial Inc. | | 5.375 | % | | 4/15/10 | | | 10,000 | | | 4,600 | |
iStar Financial Inc. | | 5.950 | % | | 10/15/13 | | | 3,610,000 | | | 1,137,150 | |
| | | | | | | | | | | | |
| | | | | | | | | | | 2,135,978 | |
| | | | | | | | | | | | |
Road and Rail — 0.2% | | | | | | | | | | | | |
Burlington Northern Rail Road Co. | | 7.330 | % | | 6/23/10 | | | 38,638 | | | 39,302 | |
Norfolk Southern Corp. | | 7.875 | % | | 5/15/43 | | | 348,000 | | | 345,415 | |
| | | | | | | | | | | | |
| | | | | | | | | | | 384,717 | |
| | | | | | | | | | | | |
Thrifts and Mortgage Finance — 0.7% | | | | | | | | | | |
BB&T Capital Trust II | | 6.750 | % | | 6/7/36 | | | 1,750,000 | | | 1,397,525 | |
| | | | | | | | | | | | |
| | |
| Annual Report to Shareholders | | 21 |
| | | | | | | | | | | | |
| | | Rate | | | Maturity
Date | | Par/Shares | | Value | |
| | | | | |
Corporate Bonds and Notes — Continued | | | | | | | | | | | | |
Tobacco — 1.1% | | | | | | | | | | | | |
Philip Morris International Inc. | | 6.875 | % | | 3/17/14 | | $ | 1,120,000 | | $ | 1,176,995 | |
Reynolds American Inc. | | 7.875 | % | | 5/15/09 | | | 860,000 | | | 851,561 | |
Reynolds American Inc. | | 7.625 | % | | 6/1/16 | | | 270,000 | | | 224,859 | |
| | | | | | | | | | | | |
| | | | | | | | | | | 2,253,415 | |
| | | | | | | | | | | | |
Wireless Telecommunication Services — 1.4% | | | | | | | | | | | | |
New Cingular Wireless Services Inc. | | 8.750 | % | | 3/1/31 | | | 980,000 | | | 1,225,084 | |
Nextel Communications Inc. | | 5.950 | % | | 3/15/14 | | | 469,000 | | | 196,980 | |
Nextel Communications Inc. | | 7.375 | % | | 8/1/15 | | | 1,600,000 | | | 672,000 | |
Sprint Capital Corp. | | 8.375 | % | | 3/15/12 | | | 360,000 | | | 288,000 | |
Sprint Capital Corp. | | 6.900 | % | | 5/1/19 | | | 920,000 | | | 653,200 | |
| | | | | | | | | | | | |
| | | | | | | | | | | 3,035,264 | |
| | | | | | | | | | | | |
Total Corporate Bonds and Notes (Cost — $230,142,996) | | | 161,792,646 | |
| | | | | | | | | | | | |
Mortgage-Backed Securities — 1.0% | | | | | | | | | | | | |
Variable Rate SecuritiesI —1.0% | | | | | | | | | | |
Thornburg Mortgage Securities Trust 2007-4 2A1 | | 6.216 | % | | 9/25/37 | | | 1,384,327 | | | 980,405 | |
Thornburg Mortgage Securities Trust 2007-4 3A1 | | 6.203 | % | | 9/25/37 | | | 1,317,919 | | | 1,011,128 | |
| | | | | | | | | | | | |
Total Mortgage-Backed Securities (Cost — $2,678,761) | | | | | | | | | | | 1,991,533 | |
| | | | | | | | | | | | |
U.S. Government Agency Mortgage-Backed Securities — N.M. | | | | | | | | | | | | |
Indexed SecuritiesB — N.M. | | | | | | | | | | | | |
Freddie Mac | | 5.111 | % | | 9/1/24 | | | 45,677 | | | 45,493 | J |
| | | | | | | | | | | | |
Total U.S. Government Agency Mortgage-Backed Securities
(Cost — $45,717) | | | | | | | | | | | 45,493 | |
| | | | | | | | | | | | |
| | |
22 | | Annual Report to Shareholders |
Portfolio of Investments — Continued
Investment Grade Income Portfolio — Continued
| | | | | | | | | | | | |
| | | Rate | | | Maturity
Date | | Par/Shares | | Value | |
Yankee BondsK — 19.6% | | | | | | | | | | | | |
Commercial Banks — 9.1% | | | | | | | | | | | | |
AES El Salvador Trust | | 6.750 | % | | 2/1/16 | | $ | 2,080,000 | | $ | 1,482,628 | A |
ATF Capital BV | | 9.250 | % | | 2/21/14 | | | 2,280,000 | | | 1,482,000 | A |
Banco Mercantil del Norte SA | | 6.135 | % | | 10/13/16 | | | 2,030,000 | | | 1,300,398 | A,C |
Barclays Bank PLC | | 7.434 | % | | 9/29/49 | | | 2,750,000 | | | 1,390,345 | A,C |
Barclays Bank PLC | | 7.700 | % | | 12/31/49 | | | 840,000 | | | 555,458 | A,C |
BOI Capital Funding | | 5.571 | % | | 2/1/49 | | | 2,000,000 | | | 439,614 | A,C |
Glitnir Banki Hf | | 6.330 | % | | 7/28/11 | | | 1,100,000 | | | 52,250 | A,D |
Glitnir Banki Hf | | 6.693 | % | | 6/15/16 | | | 1,900,000 | | | 285 | A,C,D |
Glitnir Banki Hf | | 7.451 | % | | 12/14/49 | | | 700,000 | | | 105 | A,C,D |
HBOS Capital Funding LP | | 6.071 | % | | 6/30/49 | | | 1,490,000 | | | 551,078 | A,C |
HSBC Capital Funding LP | | 4.610 | % | | 6/27/49 | | | 760,000 | | | 411,836 | A,C |
HSBK Europe BV | | 7.250 | % | | 5/3/17 | | | 1,640,000 | | | 885,600 | A |
ICICI Bank Ltd. | | 6.375 | % | | 4/30/22 | | | 702,000 | | | 368,629 | A,C |
ICICI Bank Ltd. | | 6.375 | % | | 4/30/22 | | | 170,000 | | | 89,610 | A,C |
Kaupthing Bank Hf | | 5.750 | % | | 10/4/11 | | | 1,340,000 | | | 80,400 | A,D |
Kaupthing Bank Hf | | 7.625 | % | | 2/28/15 | | | 1,700,000 | | | 102,000 | A,D,L |
Kaupthing Bank Hf | | 7.125 | % | | 5/19/16 | | | 3,585,000 | | | 26,887 | A,D |
Landsbanki Islands Hf | | 7.431 | % | | 12/31/49 | | | 2,250,000 | | | 337 | A,C,D |
Mizuho Financial Group | | 5.790 | % | | 4/15/14 | | | 3,565,000 | | | 3,165,695 | A |
Natixis | | 10.000 | % | | 4/29/49 | | | 1,270,000 | | | 589,166 | A,C |
Resona Preferred Global Securities | | 7.191 | % | | 7/30/49 | | | 2,520,000 | | | 1,199,742 | A,C |
Royal Bank of Scotland Group PLC | | 7.640 | % | | 3/31/49 | | | 200,000 | | | 79,657 | C |
RSHB Capital SA | | 7.175 | % | | 5/16/13 | | | 2,040,000 | | | 1,479,000 | A |
RSHB Capital SA | | 7.125 | % | | 1/14/14 | | | 1,700,000 | | | 1,139,000 | A |
RSHB Capital SA | | 6.299 | % | | 5/15/17 | | | 570,000 | | | 324,900 | A |
Shinsei Finance Cayman Ltd. | | 6.418 | % | | 7/20/49 | | | 3,385,000 | | | 707,979 | A,C |
| | |
| Annual Report to Shareholders | | 23 |
| | | | | | | | | | | | |
| | | Rate | | | Maturity
Date | | Par/Shares | | Value | |
Yankee Bonds — Continued | | | | | | | | | | | | |
Commercial Banks — Continued | | | | | | | | | | | | |
Sumitomo Mitsui Banking Corp. | | 5.625 | % | | 10/15/49 | | $ | 730,000 | | $ | 540,618 | A,C |
TuranAlem Finance BV | | 8.250 | % | | 1/22/37 | | | 1,709,000 | | | 734,870 | A |
TuranAlem Finance BV | | 8.250 | % | | 1/22/37 | | | 300,000 | | | 129,000 | A |
| | | | | | | | | | | | |
| | | | | | | | | | | 19,309,087 | |
| | | | | | | | | | | | |
Consumer Finance — 0.5% | | | | | | | | | | | | |
Aiful Corp. | | 6.000 | % | | 12/12/11 | | | 2,165,000 | | | 876,907 | A |
HSBC Holdings PLC | | 5.250 | % | | 12/12/12 | | | 105,000 | | | 105,497 | |
| | | | | | | | | | | | |
| | | | | | | | | | | 982,404 | |
| | | | | | | | | | | | |
Diversified Financial Services — 1.2% | | | | | | | | | | | | |
Lukoil International | | | | | | | | | | | | |
Finance BV | | 6.356 | % | | 6/7/17 | | | 982,000 | | | 599,020 | A |
Petroplus Finance Ltd. | | 7.000 | % | | 5/1/17 | | | 750,000 | | | 457,500 | A |
SMFG Preferred Capital | | 6.078 | % | | 1/29/49 | | | 230,000 | | | 155,165 | A,C |
TNK-BP Finance SA | | 7.500 | % | | 7/18/16 | | | 870,000 | | | 452,400 | A |
TNK-BP Finance SA | | 6.625 | % | | 3/20/17 | | | 100,000 | | | 48,000 | A |
UFJ Finance Aruba AEC | | 6.750 | % | | 7/15/13 | | | 920,000 | | | 899,206 | |
| | | | | | | | | | | | |
| | | | | | | | | | | 2,611,291 | |
| | | | | | | | | | | | |
Diversified Telecommunication Services — 2.8% | | | | | | | | | | | | |
British Telecommunications PLC | | 9.125 | % | | 12/15/30 | | | 420,000 | | | 446,435 | H |
Deutsche Telekom International Finance BV | | 8.750 | % | | 6/15/30 | | | 1,400,000 | | | 1,726,399 | H |
Deutsche Telekom International Finance BV | | 9.250 | % | | 6/1/32 | | | 670,000 | | | 852,670 | H |
Telecom Italia Capital | | 7.200 | % | | 7/18/36 | | | 2,070,000 | | | 1,593,900 | |
Telefonica Emisiones S.A.U. | | 7.045 | % | | 6/20/36 | | | 800,000 | | | 873,225 | |
VIP Finance Ireland Ltd | | 8.375 | % | | 4/30/13 | | | 680,000 | | | 435,200 | A |
| | | | | | | | | | | | |
| | | | | | | | | | | 5,927,829 | |
| | | | | | | | | | | | |
Food and Staples Retailing — 0.4% | | | | | | | | | | | | |
Delhaize Group | | 6.500 | % | | 6/15/17 | | | 860,000 | | | 780,875 | |
| | | | | | | | | | | | |
| | |
24 | | Annual Report to Shareholders |
Portfolio of Investments — Continued
Investment Grade Income Portfolio — Continued
| | | | | | | | | | | | |
| | | Rate | | | Maturity
Date | | Par/Shares | | Value | |
Yankee Bonds — Continued | | | | | | | | | | | | |
Gas Utilities — 0.2% | | | | | | | | | | | | |
Intergas Finance BV | | 6.375 | % | | 5/14/17 | | $ | 850,000 | | $ | 493,000 | A |
| | | | | | | | | | | | |
Insurance — 0.5% | | | | | | | | | | | | |
Axa | | 8.600 | % | | 12/15/30 | | | 1,630,000 | | | 1,067,288 | |
| | | | | | | | | | | | |
Metals and Mining — 1.1% | | | | | | | | | | | | |
Evraz Group SA | | 8.875 | % | | 4/24/13 | | | 540,000 | | | 275,400 | A |
Vale Overseas Ltd. | | 6.875 | % | | 11/21/36 | | | 2,178,000 | | | 1,976,971 | |
| | | | | | | | | | | | |
| | | | | | | | | | | 2,252,371 | |
| | | | | | | | | | | | |
Oil, Gas and Consumable Fuels — 2.9% | | | | | | | | | | | | |
Anadarko Finance Co. | | 6.750 | % | | 5/1/11 | | | 10,000 | | | 10,004 | |
Anadarko Finance Co. | | 7.500 | % | | 5/1/31 | | | 3,860,000 | | | 3,413,309 | |
Gazprom | | 6.212 | % | | 11/22/16 | | | 1,439,000 | | | 949,740 | A |
Gazprom | | 6.510 | % | | 3/7/22 | | | 1,160,000 | | | 690,200 | A |
Petrobras International Finance Co. | | 5.875 | % | | 3/1/18 | | | 1,280,000 | | | 1,150,720 | |
| | | | | | | | | | | | |
| | | | | | | | | | | 6,213,973 | |
| | | | | | | | | | | | |
Wireless Telecommunication Services — 0.9% | | | | | | | | | | | | |
America Movil SA de CV | | 5.625 | % | | 11/15/17 | | | 1,070,000 | | | 951,261 | |
Rogers Wireless Inc. | | 6.375 | % | | 3/1/14 | | | 1,000,000 | | | 950,598 | |
| | | | | | | | | | | | |
| | | | | | | | | | | 1,901,859 | |
| | | | | | | | | | | | |
Total Yankee Bonds (Cost — $75,931,825) | | | | | | | | | | | 41,539,977 | |
| | | | | | | | | | | | |
Preferred Stocks — 0.1% | | | | | | | | | | | | |
Fannie Mae | | 8.250 | % | | | | | 35,925 shs | | | 29,818 | C,J |
Freddie Mac | | 8.375 | % | | | | | 244,245 | | | 95,255 | C,J |
Preferred Blocker Inc. | | 9.000 | % | | | | | 616 | | | 154,000 | A |
| | | | | | | | | | | | |
Total Preferred Stocks (Cost — $4,615,075) | | | | | | | | | | | 279,073 | |
| | | | | | | | | | | | |
Total Long-Term Securities (Cost — $313,414,374) | | | | | | | | | | | 205,648,722 | |
| | | | | | | | | | | | |
| | |
| Annual Report to Shareholders | | 25 |
| | | | | | | | | | | | |
| | | Rate | | | Maturity
Date | | Par/Shares | | Value | |
Short-Term Securities — 0.1% | | | | | | | | | | | | |
U.S. Government and Agency Obligations — 0.1% | | | | | | | | | | | | |
Fannie Mae | | 0.000 | % | | 5/18/09 | | $ | 300,000 | | $ | 299,716 | E,J |
| | | | | | | | | | | | |
Total Short-Term Securities (Cost — $299,600) | | | | | | | | | | | 299,716 | |
| | | | | | | | | | | | |
Total Investments — 97.4% (Cost — $313,713,974)N | | | | | | | | | | | 205,948,438 | |
Other Assets Less Liabilities — 2.6% | | | | | | | | | | | 5,433,523 | |
| | | | | | | | | | | | |
Net Assets — 100.0% | | | | | | | | | | $ | 211,381,961 | |
| | | | | | | | | | | | |
| | |
26 | | Annual Report to Shareholders |
Portfolio of Investments — Continued
Investment Grade Income Portfolio — Continued
| | | | | | | | |
| | | Expiration | | Actual
Contracts | | Appreciation/
(Depreciation) | |
Futures Contracts PurchasedO | | | | | | | | |
Eurodollar Futures | | March 2009 | | 265 | | $ | 1,290,075 | |
U.S. Treasury Bond Futures | | March 2009 | | 1 | | | 13,440 | |
U.S. Treasury Note Futures | | March 2009 | | 291 | | | 944,295 | |
| | | | | | | | |
| | | | | | $ | 2,247,810 | |
| | | | | | | | |
Futures Contracts WrittenO | | | | | | | | |
U.S. Treasury Note Futures | | March 2009 | | 245 | | $ | (1,909,795 | ) |
| | | | | | | | |
N.M. Not Meaningful.
A | Rule 144a Security — A security purchased pursuant to Rule 144a under the Securities Act of 1933 which may not be resold under that rule except to qualified institutional buyers. These securities, which the Fund’s investment adviser has determined to be liquid, represent 23.45% of net assets. |
B | Indexed Security — The rates of interest earned on these securities are tied to the London Interbank Offered Rate (“LIBOR”), the Euro Interbank Offered Rate (“EURIBOR”) Index, the Consumer Price Index (“CPI”), the one-year Treasury Bill Rate or the ten-year Japanese Government Bond Rate. The coupon rates are the rates as of December 31, 2008. |
C | Stepped Coupon Security — A security with a predetermined schedule of interest or dividend rate changes at which time it begins to accrue interest or pay dividends according to the predetermined schedule. |
D | Bond is currently in default. |
E | Zero coupon bond — A bond with no periodic interest payments which is sold at such a discount as to produce a current yield to maturity. |
F | Pay-in-Kind (“PIK”) security — A security in which interest or dividends during the initial few years is paid in additional PIK securities rather than in cash. |
G | Credit Linked Security — The rates of interest earned on these securities are tied to the credit rating assigned by Standard & Poor’s Rating Service and/or Moody’s Investors Services. |
H | Convertible Security — Security may be converted into the issuer’s common stock. |
I | The coupon rates shown on variable rate securities are the rates at December 31, 2008. These rates vary with the weighted average coupon of the underlying loans. |
J | On September 7, 2008, the Federal Housing Finance Agency placed Fannie Mae and Freddie Mac into Conservatorship. |
K | Yankee Bond — A dollar-denominated bond issued in the U.S. by foreign entities. |
L | Illiquid security valued at fair value under the procedures approved by the Board of Directors. |
M | All or a portion of this security is collateral to cover futures and options contracts written. |
N | At December 31, 2008, the aggregate gross unrealized appreciation and depreciation of investments for federal income tax purposes were as follows: |
| | | | |
Gross unrealized appreciation | | $ | 1,259,425 | |
Gross unrealized depreciation | | | (109,029,768 | ) |
| | | | |
Net unrealized depreciation | | $ | (107,770,343 | ) |
| | | | |
O | Futures are described in more detail in the notes to financial statements. |
See notes to financial statements.
| | |
| Annual Report to Shareholders | | 27 |
Statement of Assets and Liabilities
Investment Grade Income Portfolio
December 31, 2008
| | | | | | | |
Assets: | | | | | | | |
Investment securities at market value (Cost – $313,414,374) | | | | | $ | 205,648,722 | |
Short-term securities at value (Cost – $299,600) | | | | | | 299,716 | |
Cash | | | | | | 108,092 | |
Receivable for securities sold | | | | | | 6,270,550 | |
Interest and dividends receivable | | | | | | 4,645,644 | |
Receivable for fund shares sold | | | | | | 328,220 | |
Futures variation margin receivable | | | | | | 207,765 | |
Other assets | | | | | | 1,226 | |
| | | | | | | |
Total assets | | | | | | 217,509,935 | |
Liabilities: | | | | | | | |
Payable for securities purchased | | $ | 3,833,796 | | | | |
Payable for fund shares repurchased | | | 2,059,799 | | | | |
Accrued distribution and service fees | | | 104,877 | | | | |
Accrued management fee | | | 6,124 | | | | |
Accrued expenses | | | 123,378 | | | | |
| | | | | | | |
Total liabilities | | | | | | 6,127,974 | |
| | | | | | | |
Net Assets | | | | | $ | 211,381,961 | |
| | | | | | | |
Net assets consist of: | | | | | | | |
Accumulated paid-in-capital | | | | | $ | 334,821,684 | |
Undistributed net investment income | | | | | | 216,024 | |
Accumulated net realized loss on investments and futures | | | | | | (16,228,226 | ) |
Net unrealized depreciation on investments and futures | | | | | | (107,427,521 | ) |
| | | | | | | |
Net Assets | | | | | $ | 211,381,961 | |
| | | | | | | |
Net Asset Value Per Share: | | | | | | | |
Primary Class (28,922,278 shares outstanding) | | | | | $ | 6.96 | |
| | | | | | | |
Institutional Class (1,427,647 shares outstanding) | | | | | $ | 6.97 | |
| | | | | | | |
See notes to financial statements.
| | |
28 | | Annual Report to Shareholders |
Statement of Operations
Investment Grade Income Portfolio
For the Year Ended December 31, 2008
| | | | | | | | |
Investment Income: | | | | | | | | |
Interest | | $ | 25,454,461 | | | | | |
Dividends | | | 119,560 | | | | | |
| | | | | | | | |
Total income | | | | | | $ | 25,574,021 | |
Expenses: | | | | | | | | |
Management fees | | | 1,973,193 | | | | | |
Distribution and service fees: | | | | | | | | |
Primary Class | | | 1,569,891 | | | | | |
Audit and legal fees | | | 70,459 | | | | | |
Custodian fees | | | 52,417 | | | | | |
Directors’ fees and expenses | | | 64,022 | | | | | |
Registration fees | | | 38,064 | | | | | |
Reports to shareholders: | | | | | | | | |
Primary Class | | | 77,779 | | | | | |
Institutional Class | | | 3,718 | | | | | |
Transfer agent and shareholder servicing expense: | | | | | | | | |
Primary Class | | | 237,022 | | | | | |
Institutional Class | | | 20,055 | | | | | |
Other expenses | | | 50,696 | | | | | |
| | | | | | | | |
| | | 4,157,316 | | | | | |
Less: Fees waived | | | (942,422 | ) | | | | |
Compensating balance credits | | | (676 | ) | | | | |
| | | | | | | | |
Net expenses | | | | | | | 3,214,218 | |
| | | | | | | | |
Net Investment Income | | | | | | | 22,359,803 | |
Net Realized and Unrealized Gain/(Loss) on Investments: | | | | | | | | |
Net realized gain/(loss) on: | | | | | | | | |
Investments | | | (15,718,934 | ) | | | | |
Futures | | | 238,839 | | | | | |
| | | | | | | | |
| | | | | | | (15,480,095 | ) |
Change in unrealized appreciation/(depreciation) of investments and futures | | | | | | | (97,822,130 | ) |
| | | | | | | | |
Net Realized and Unrealized Loss on Investments | | | | | | | (113,302,225 | ) |
| | | | | | | | |
Change in Net Assets Resulting From Operations | | | | | | $ | (90,942,422 | ) |
| | | | | | | | |
See notes to financial statements.
| | |
| Annual Report to Shareholders | | 29 |
Statement of Changes in Net Assets
Investment Grade Income Portfolio
| | | | | | | | |
| | | For the Years Ended
December 31, | |
| | | 2008 | | | 2007 | |
Change in Net Assets: | | | | | | | | |
Net investment income | | $ | 22,359,803 | | | $ | 23,270,259 | |
Net realized loss | | | (15,480,095 | ) | | | (636,366 | ) |
Change in unrealized appreciation/(depreciation) | | | (97,822,130 | ) | | | (14,426,794 | ) |
| | | | | | | | |
Change in net assets resulting from operations | | | (90,942,422 | ) | | | 8,207,099 | |
Distributions to shareholders from: | | | | | | | | |
Net investment income: | | | | | | | | |
Primary Class | | | (21,039,955 | ) | | | (21,444,590 | ) |
Institutional Class | | | (1,065,882 | ) | | | (1,750,021 | ) |
Net realized gain on investments: | | | | | | | | |
Primary Class | | | — | | | | (1,197,499 | ) |
Institutional Class | | | — | | | | (46,104 | ) |
Change in net assets from fund share transactions: | | | | | | | | |
Primary Class | | | (76,519,144 | ) | | | (3,651,630 | ) |
Institutional Class | | | (33,416,476 | ) | | | 37,490,814 | |
| | | | | | | | |
Change in net assets | | | (222,983,879 | ) | | | 17,608,069 | |
Net Assets: | | | | | | | | |
Beginning of year | | | 434,365,840 | | | | 416,757,771 | |
| | | | | | | | |
End of year | | $ | 211,381,961 | | | $ | 434,365,840 | |
| | | | | | | | |
Undistributed/(Overdistributed) net investment income | | $ | 216,024 | | | $ | (38,830 | ) |
| | | | | | | | |
See notes to financial statements.
| | |
30 | | Annual Report to Shareholders |
Financial Highlights
Investment Grade Income Portfolio
For a share of each class of capital stock outstanding:
Primary Class:
| | | | | | | | | | | | | | | | | | | | |
| | | Years Ended December 31, | |
| | | 2008 | | | 2007 | | | 2006 | | | 2005 | | | 2004 | |
Net asset value, beginning of year | | $ | 10.11 | | | $ | 10.49 | | | $ | 10.40 | | | $ | 10.81 | | | $ | 10.88 | |
| | | | | | | | | | | | | | | | | | | | |
Investment operations: | | | | | | | | | | | | | | | | | | | | |
Net investment income | | | .61 | A | | | .55 | A | | | .51 | A | | | .49 | | | | .49 | |
Net realized and unrealized gain/(loss) | | | (3.16 | ) | | | (.35 | ) | | | .09 | | | | (.31 | ) | | | .18 | |
| | | | | | | | | | | | | | | | | | | | |
Total from investment operations | | | (2.55 | ) | | | .20 | | | | .60 | | | | .18 | | | | .67 | |
| | | | | | | | | | | | | | | | | | | | |
Distributions from: | | | | | | | | | | | | | | | | | | | | |
Net investment income | | | (.60 | ) | | | (.55 | ) | | | (.51 | ) | | | (.49 | ) | | | (.49 | ) |
Net realized gain on investments | | | — | | | | (.03 | ) | | | — | B | | | (.10 | ) | | | (.25 | ) |
| | | | | | | | | | | | | | | | | | | | |
Total distributions | | | (.60 | ) | | | (.58 | ) | | | (.51 | ) | | | (.59 | ) | | | (.74 | ) |
| | | | | | | | | | | | | | | | | | | | |
Net asset value, end of year | | $ | 6.96 | | | $ | 10.11 | | | $ | 10.49 | | | $ | 10.40 | | | $ | 10.81 | |
| | | | | | | | | | | | | | | | | | | | |
Total return | | | (26.19 | )% | | | 1.93 | % | | | 6.01 | % | | | 1.69 | % | | | 6.29 | % |
Ratios to Average Net Assets:C | | | | | | | | | | | | | | | | | | | | |
Total expenses | | | 1.28 | % | | | 1.28 | % | | | 1.33 | % | | | 1.30 | % | | | 1.27 | % |
Expenses net of waivers, if any | | | 1.00 | % | | | 1.00 | % | | | 1.00 | % | | | 1.00 | % | | | 1.00 | % |
Expenses net of all reductions | | | 1.00 | % | | | 1.00 | % | | | 1.00 | % | | | 1.00 | % | | | 1.00 | % |
Net investment income | | | 6.78 | % | | | 5.32 | % | | | 4.98 | % | | | 4.64 | % | | | 4.47 | % |
Supplemental Data: | | | | | | | | | | | | | | | | | | | | |
Portfolio turnover rate | | | 15.3 | % | | | 47.2 | % | | | 65.7 | % | | | 51.1 | % | | | 74.9 | % |
Net assets, end of year (in thousands) | | $ | 201,437 | | | $ | 386,094 | | | $ | 404,864 | | | $ | 366,329 | | | $ | 403,361 | |
A | Computed using average daily shares outstanding. |
B | Amount less than $.01 per share. |
C | Total expenses reflects operating expenses prior to any voluntary expense waivers and/or compensating balance credits. Expenses net of waivers reflects total expenses before compensating balance credits but net of any voluntary expense waivers. Expenses net of all reductions reflects expenses less any compensating balance credits and/or voluntary expense waivers. |
See notes to financial statements.
| | |
| Annual Report to Shareholders | | 31 |
Financial Highlights
Investment Grade Income Portfolio
For a share of each class of capital stock outstanding:
Institutional Class:
| | | | | | | | | | | | | | | | | | | | |
| | | Years Ended December 31, | |
| | | 2008 | | | 2007 | | | 2006 | | | 2005 | | | 2004 | |
Net asset value, beginning of year | | $ | 10.11 | | | $ | 10.49 | | | $ | 10.41 | | | $ | 10.82 | | | $ | 10.89 | |
| | | | | | | | | | | | | | | | | | | | |
Investment operations: | | | | | | | | | | | | | | | | | | | | |
Net investment income | | | .65 | A | | | .61 | A | | | .56 | A | | | .55 | | | | .54 | |
Net realized and unrealized gain/(loss) | | | (3.14 | ) | | | (.36 | ) | | | .08 | | | | (.31 | ) | | | .17 | |
| | | | | | | | | | | | | | | | | | | | |
Total from investment operations | | | (2.49 | ) | | | .25 | | | | .64 | | | | .24 | | | | .71 | |
| | | | | | | | | | | | | | | | | | | | |
Distributions from: | | | | | | | | | | | | | | | | | | | | |
Net investment income | | | (.65 | ) | | | (.60 | ) | | | (.56 | ) | | | (.55 | ) | | | (.53 | ) |
Net realized gain on investments | | | — | | | | (.03 | ) | | | — | B | | | (.10 | ) | | | (.25 | ) |
| | | | | | | | | | | | | | | | | | | | |
Total distributions | | | (.65 | ) | | | (.63 | ) | | | (.56 | ) | | | (.65 | ) | | | (.78 | ) |
| | | | | | | | | | | | | | | | | | | | |
Net asset value, end of year | | $ | 6.97 | | | $ | 10.11 | | | $ | 10.49 | | | $ | 10.41 | | | $ | 10.82 | |
| | | | | | | | | | | | | | | | | | | | |
Total return | | | (25.71 | )% | | | 2.44 | % | | | 6.45 | % | | | 2.27 | % | | | 6.85 | % |
Ratios to Average Net Assets:C | | | | | | | | | | | | | | | | | | | | |
Total expenses | | | .85 | % | | | .74 | % | | | .74 | % | | | .74 | % | | | .74 | % |
Expenses net of waivers, if any | | | .50 | % | | | .50 | % | | | .50 | % | | | .44 | % | | | .47 | % |
Expenses net of all reductions | | | .50 | % | | | .50 | % | | | .50 | % | | | .44 | % | | | .47 | % |
Net investment income | | | 7.24 | % | | | 5.95 | % | | | 5.47 | % | | | 5.26 | % | | | 5.02 | % |
Supplemental Data: | | | | | | | | | | | | | | | | | | | | |
Portfolio turnover rate | | | 15.3 | % | | | 47.2 | % | | | 65.7 | % | | | 51.1 | % | | | 74.9 | % |
Net assets, end of year (in thousands) | | $ | 9,945 | | | $ | 48,272 | | | $ | 11,894 | | | $ | 20,441 | | | $ | 10,216 | |
See notes to financial statements.
| | |
32 | | Annual Report to Shareholders |
Management’s Discussion of Fund Performance
Legg Mason Limited Duration Bond Portfolio
Total returns for the Fund for various periods ended December 31, 2008 are presented below, along with those of comparative indices:
| | | | | | | | | | | | |
| | | | | | Average Annual Total Returns | |
| | | One
Year | | | Five
Years | | | Ten
Years | | | Since
InceptionA | |
| | | | |
Limited Duration Bond Portfolio:B | | | | | | | | | | | | |
Primary Class | | –16.52 | % | | –1.58 | % | | +1.54 | % | | +4.73 | % |
Institutional Class | | –16.09 | % | | –1.10 | % | | +2.07 | % | | +3.87 | % |
Merrill Lynch 1-3 Year Treasury IndexC | | +6.61 | % | | +4.06 | % | | +4.71 | % | | +6.07 | % |
Lipper Short-Intermediate Investment Grade
Debt Funds Category AverageD | | –2.82 | % | | +1.80 | % | | +3.78 | % | | +5.93 | % |
The performance data quoted represent past performance and do not guarantee future results. Current performance may be lower or higher than the performance data quoted. To obtain the most recent month-end performance information for the Primary and Institutional Classes, please visit www.legg-mason.com/individualinvestors. The investment return and principal value of the Fund will fluctuate so that an investor’s shares, when redeemed, may be worth more or less than the original cost. Calculations assume reinvestment of dividends and capital gain distributions. Performance would have been lower if fees had not been waived in various periods.
The gross expense ratios for the Primary and Institutional Classes were 1.18% and 0.72%, respectively, as indicated in the Fund’s most current prospectus dated May 1, 2008 and do not reflect fee waivers or reimbursements. These expenses include management fees, 12b-1 distribution and service fees and other expenses.
The net expense ratios for the Primary and Institutional Classes were 1.00% and 0.50%, respectively, as indicated in the Fund’s prospectus dated May 1, 2008 and reflect contractual fee waivers and/or reimbursements. As a result of contractual expense limitations, the ratio of expenses, other than interest, brokerage, taxes and extraordinary expenses, to average net assets will not exceed 1.00% for Primary Class shares and 0.50% for Institutional Class shares until April 30, 2009.
Strategies produced predominantly negative results over the past 12 months. Our tactically-driven durationE posture and yield curveF strategy contributed to performance as bond yields rallied over the year and the yield curve steepened. An emphasis on lower-quality credits and select financial issues was also a large detractor from performance as spreads soared in the wake of the subprime lending crisis, deteriorating
| | |
| Annual Report to Shareholders | | 33 |
liquidity conditions and slowing economic growth. Spreads widened to new all-time highs in mid-March, before partially recovering in April and May. These gains were given back later in the period, however, on deteriorating investor sentiment and poor earnings. The high-yield sector performed poorly on news of more ratings downgrades, rising defaults, and a volatile and declining stock market. A large overweight exposure to the mortgage-backed sector also detracted from performance as volatility remained high and negative housing news continued to damage market sentiment. We had diversified into a number of non-agency mortgage-backed issues that were particularly impacted and further detracted from performance due to a lack of liquidity, rising defaults and uncertainty in that marketplace.
Western Asset Management Company
January 20, 2009
A | The inception date of the Primary Class is August 7, 1987. The inception date of the Institutional Class is December 1, 1994. Index returns are for periods beginning July 31, 1987. Although it is not possible to invest in an index, it is possible to purchase investment vehicles designed to track the performance of certain indices. |
B | Prior to August 31, 2004, the Fund was known as Legg Mason U.S. Government Intermediate-Term Portfolio and followed a policy of investing at least 80% of its assets in securities issued or guaranteed by the U.S. Government, its agencies or instrumentalities, or repurchase agreements secured by such investments, with a dollar-weighted average portfolio maturity between three and ten years. The Fund’s performance prior to such change might have been better or worse had the Fund been managed in accordance with its current objective, policies and strategies. |
C | The Merrill Lynch 1-3 Year Treasury Index is a market capitalization-weighted index including all U.S. Treasury notes and bonds with maturities greater than or equal to one year and less than three years. |
D | Lipper, Inc., a wholly-owned subsidiary of Reuters, provides independent insight on global collective investments. The Lipper Short-Intermediate Investment Grade Debt Funds Category Average is comprised of the Fund’s peer group of mutual funds. |
E | Duration is the measure of the price sensitivity of a fixed-income security to an interest rate change of 100 basis points. Calculation is based on the weighted average of the present values for all cash flows. |
F | The yield curve is the graphical depiction of the relationship between the yield on bonds of the same credit quality but different maturities. |
| | |
34 | | Annual Report to Shareholders |
Expense Example
Legg Mason Limited Duration Bond Portfolio
As a shareholder of the Fund, you incur ongoing costs, including management fees, distribution and service (12b-1) fees on Primary Class shares; and other Fund expenses. These examples are intended to help you understand your ongoing costs (in dollars) of investing in the Fund and to compare these costs with the ongoing costs of investing in other mutual funds. Each example is based on an investment of $1,000 invested on July 1, 2008, and held through December 31, 2008. The ending values assume dividends were reinvested at the time they were paid.
Actual Expenses
The first line for each class in the table below provides information about actual account values and actual expenses for each class. You may use the information in this line, together with the amount you invested, to estimate the expenses that you paid over the period. Simply divide your account value by $1,000 (for example, an $8,600 account value divided by $1,000 = 8.6), then multiply the result by the number in the first line under the heading entitled “Expenses Paid During the Period” to estimate the expenses you paid on your account if your shares were held through the entire period.
Hypothetical Example for Comparison Purposes
The second line for each class in the table below provides information about hypothetical account values and hypothetical expenses based on the relevant class’s actual expense ratio and an assumed rate of return of 5% per year before expenses, which is not the class’s actual return. The hypothetical account values and expenses may not be used to estimate the actual ending account balance or expenses you paid for the period. You may use this information to compare the ongoing costs of investing in the Fund and other funds. To do so, compare these 5% hypothetical examples with the 5% hypothetical examples for the relevant class that appear in the shareholder reports of other funds.
| | | | | | | | | |
| | | Beginning
Account
Value
7/1/08 | | Ending
Account
Value
12/31/08 | | Expenses PaidA
During the
Period
7/1/08 to 12/31/08 |
Primary Class: | | | | | | | | | |
Actual | | $ | 1,000.00 | | $ | 861.50 | | $ | 4.68 |
Hypothetical (5% return before expenses) | | | 1,000.00 | | | 1,020.11 | | | 5.08 |
Institutional Class: | | | | | | | | | |
Actual | | $ | 1,000.00 | | $ | 863.70 | | $ | 2.34 |
Hypothetical (5% return before expenses) | | | 1,000.00 | | | 1,022.62 | | | 2.54 |
A | These calculations are based on expenses incurred in the most recent fiscal half-year. The dollar amounts shown as “Expenses Paid” are equal to the annualized expense ratios of 1.00% and 0.50% for the Primary Class and Institutional Class respectively, multiplied by the average values over the period, multiplied by the number of days in the most recent fiscal half-year (184), and divided by 366. |
| | |
| Annual Report to Shareholders | | 35 |
Performance Information
Legg Mason Limited Duration Bond Portfolio
The graphs on the following pages compare the Fund’s total returns to that of a closely matched broad-based securities market index. The lines illustrate the cumulative total return of an initial $10,000 investment in Primary Class shares and an initial $1,000,000 investment in Institutional Class shares of the Fund, for the periods indicated. The lines for the Fund represent the total return after deducting all Fund investment management and other administrative expenses and the transaction costs of buying and selling securities. The lines representing the securities market index do not take into account any transaction costs associated with buying and selling portfolio securities in the index or other administrative expenses.
Total return measures investment performance in terms of appreciation or depreciation in a fund’s net asset value per share, plus dividends and any capital gain distributions. Both the Fund’s results and the index’s results assume reinvestment of all dividends and distributions at the time they were paid. Average annual returns tend to smooth out variations in a fund’s return, so that they differ from actual year-to-year results.
| | |
36 | | Annual Report to Shareholders |
Performance Information — Continued
Growth of a $10,000 Investment — Primary Class
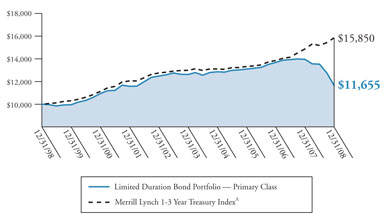
Periods Ended December 31, 2008
| | | | |
| | | Cumulative
Total Return | | Average Annual
Total Return |
| One Year | | –16.52% | | –16.52% |
| Five Years | | –7.65% | | –1.58% |
| Ten Years | | +16.55% | | +1.54% |
The performance data quoted represent past performance and do not guarantee future results. The performance stated may have been due to extraordinary market conditions, which may not be duplicated in the future. Current performance may be lower or higher than the performance data quoted. To obtain the most recent month-end performance information please visit www.leggmason.com/individualinvestors. The investment return and principal value of the Fund will fluctuate so that an investor’s shares, when redeemed, may be worth more or less than the original cost. Calculations assume reinvestment of dividends and capital gain distributions. Performance would have been lower if fees had not been waived in various periods.
The graph and table do not reflect the deduction of taxes that a shareholder would pay on Fund distributions or the redemption of Fund shares.
A | A total rate of return index based on daily closing prices and consisting of Treasury bills with a maturity of 1-3 years. |
| | |
| Annual Report to Shareholders | | 37 |
Growth of a $1,000,000 Investment — Institutional Class
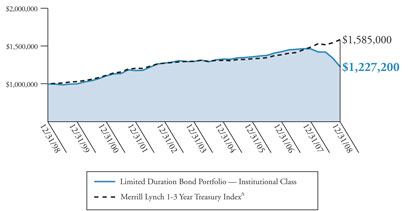
Periods Ended December 31, 2008
| | | | | | |
| | | Cumulative
Total Return | | | Average Annual
Total Return | |
| | |
One Year | | –16.09 | % | | –16.09 | % |
Five Years | | –5.36 | % | | –1.10 | % |
Ten Years | | +22.72 | % | | +2.07 | % |
The performance data quoted represent past performance and do not guarantee future results. The performance stated may have been due to extraordinary market conditions, which may not be duplicated in the future. Current performance may be lower or higher than the performance data quoted. To obtain the most recent month-end performance information please visit www.leggmason.com/individualinvestors. The investment return and principal value of the Fund will fluctuate so that an investor’s shares, when redeemed, may be worth more or less than the original cost. Calculations assume reinvestment of dividends and capital gain distributions. Performance would have been lower if fees had not been waived in various periods.
The graph and table do not reflect the deduction of taxes that a shareholder would pay on Fund distributions or the redemption of Fund shares.
| | |
38 | | Annual Report to Shareholders |
Performance Information — Continued
Portfolio Composition (as of December 31, 2008)B
Standard & Poor’s Debt RatingsC (as a percentage of the portfolio)
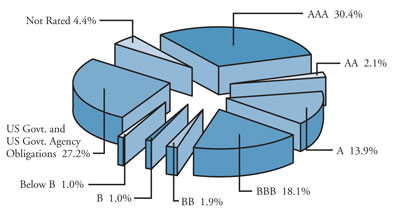
Maturity Schedule (as a percentage of the portfolio)
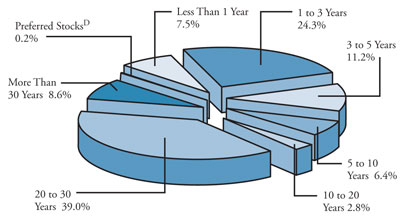
B | The Fund is actively managed. As a result, the composition of its portfolio holdings and sectors is subject to change at any time. The charts do not include derivatives such as Futures Contracts, Options Written. |
C | Standard & Poor’s Ratings Service provides capital markets with credit ratings for the evaluation and assessment of credit risk. These ratings are the opinions of S&P and not absolute measures of quality or guarantees of performance. |
D | Preferred Stocks do not have a defined maturity date. |
| | |
| Annual Report to Shareholders | | 39 |
Legg Mason Limited Duration
Spread Duration
December 31, 2008
Economic Exposure
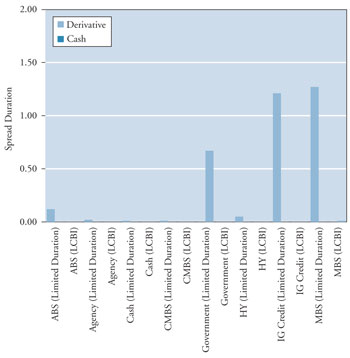
Spread duration is defined as the change in value for a 100 basis point change in the spread relative to Treasuries. The spread over Treasuries is the annual risk-premium demanded by investors to hold non-Treasury securities. This chart highlights the market sector exposure of the portfolio and the exposure relative to the selected benchmark as of the end of the reporting period.
| ABS | — Asset Backed Securities |
| LCBI | — Barclays U.S. Capital Credit Bond Index |
| CMBS | — Commercial Mortgage Backed Securities |
| IG Credit | — Investment Grade Credit |
| MBS | — Mortgage Backed Securities |
| | |
40 | | Annual Report to Shareholders |
Performance Information — Continued
Legg Mason Limited Duration
Effective Duration
December 31, 2008
Interest Rate Exposure
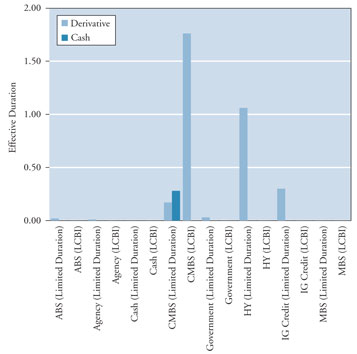
Effective duration is defined as the change in value for a 100 basis point change in Treasury yields. This chart highlights the interest rate exposure of the portfolio relative to the selected benchmark as of the end of the reporting period.
| ABS | — Asset Backed Securities |
| LCBI | — Barclays U.S. Capital Credit Bond Index |
| CMBS | — Commercial Mortgage Backed Securities |
| IG Credit | — Investment Grade Credit |
| MBS | — Mortgage Backed Securities |
| | |
| Annual Report to Shareholders | | 41 |
Portfolio of Investments
Limited Duration Bond Portfolio
December 31, 2008
| | | | | | | | | | | | |
| | | Rate | | | Maturity
Date | | Par/Shares | | Value | |
| | | | |
Long-Term Securities — 94.7% | | | | | | | | | | | | |
Corporate Bonds and Notes — 30.3% | | | | | | | | | | | | |
Aerospace and Defense — 0.4% | | | | | | | | | | | | |
United Technologies Corp. | | 5.375 | % | | 12/15/17 | | $ | 410,000 | | $ | 414,467 | |
| | | | | | | | | | | | |
Airlines — 1.5% | | | | | | | | | | | | |
Continental Airlines Inc. | | 7.056 | % | | 9/15/09 | | | 70,000 | | | 67,200 | |
Continental Airlines Inc. | | 6.900 | % | | 1/2/18 | | | 435,955 | | | 348,764 | |
Continental Airlines Inc. | | 6.545 | % | | 2/2/19 | | | 387,411 | | | 309,929 | |
Continental Airlines Inc. | | 6.703 | % | | 6/15/21 | | | 286,978 | | | 215,233 | |
Northwest Airlines Inc. | | 2.968 | % | | 5/20/14 | | | 845,819 | | | 592,074 | A |
| | | | | | | | | | | | |
| | | | | | | | | | | 1,533,200 | |
| | | | | | | | | | | | |
Capital Markets — 2.9% | | | | | | | | | | | | |
Goldman Sachs Capital II | | 5.793 | % | | 12/29/49 | | | 2,080,000 | | | 799,600 | B |
Lehman Brothers Holdings Capital Trust VII | | 5.857 | % | | 11/29/49 | | | 970,000 | | | 97 | C |
Lehman Brothers Holdings Inc. | | 6.500 | % | | 7/19/17 | | | 340,000 | | | 34 | C |
Merrill Lynch and Co. Inc. | | 6.050 | % | | 8/15/12 | | | 700,000 | | | 690,605 | |
Merrill Lynch and Co. Inc. | | 6.150 | % | | 4/25/13 | | | 720,000 | | | 713,440 | |
Morgan Stanley | | 6.600 | % | | 4/1/12 | | | 330,000 | | | 319,041 | |
The Bear Stearns Cos. Inc. | | 6.400 | % | | 10/2/17 | | | 200,000 | | | 207,836 | |
The Goldman Sachs Group Inc. | | 6.600 | % | | 1/15/12 | | | 350,000 | | | 345,333 | |
| | | | | | | | | | | | |
| | | | | | | | | | | 3,075,986 | |
| | | | | | | | | | | | |
Chemicals — 0.1% | | | | | | | | | | | | |
The Dow Chemical Co. | | 5.700 | % | | 5/15/18 | | | 90,000 | | | 79,957 | |
| | | | | | | | | | | | |
Commercial Banks — 4.1% | | | | | | | | | | | | |
HSBC Bank PLC | | 7.333 | % | | 7/20/12 | | | 1,000,000 | | | 505,000 | A,D |
HSBC Bank PLC | | 7.468 | % | | 8/20/12 | | | 70,000 | | | 37,569 | A |
Keycorp | | 2.646 | % | | 12/15/10 | | | 1,900,000 | | | 1,906,975 | A |
SunTrust Capital VIII | | 6.100 | % | | 12/15/36 | | | 120,000 | | | 84,481 | B |
| | |
42 | | Annual Report to Shareholders |
Portfolio of Investments — Continued
Limited Duration Bond Portfolio — Continued
| | | | | | | | | | | | |
| | | Rate | | | Maturity
Date | | Par/Shares | | Value | |
Corporate Bonds and Notes — Continued | | | | | | | | | | | | |
Commercial Banks — Continued | | | | | | | | | | | | |
Wachovia Capital Trust III | | 5.800 | % | | 8/29/49 | | $ | 1,960,000 | | $ | 1,156,400 | B |
Wells Fargo Capital X | | 5.950 | % | | 12/15/36 | | | 300,000 | | | 257,114 | B |
Wells Fargo Capital XIII | | 7.700 | % | | 12/29/49 | | | 350,000 | | | 288,859 | B |
| | | | | | | | | | | | |
| | | | | | | | | | | 4,236,398 | |
| | | | | | | | | | | | |
Commercial Services and Supplies — 0.6% | | | | | | | | | | | | |
Waste Management Inc. | | 7.375 | % | | 8/1/10 | | | 650,000 | | | 658,702 | |
| | | | | | | | | | | | |
Consumer Finance — 3.3% | | | | | | | | | | | | |
American Express Bank FSB | | 3.150 | % | | 12/9/11 | | | 1,900,000 | | | 1,915,126 | |
American Express Co. | | 6.800 | % | | 9/1/66 | | | 600,000 | | | 310,591 | B |
GMAC LLC | | 7.500 | % | | 12/31/13 | | | 8,530,000 | | | 622,690 | D |
Nelnet Inc. | | 7.400 | % | | 9/29/36 | | | 380,000 | | | 113,941 | B |
SLM Corp. | | 8.450 | % | | 6/15/18 | | | 590,000 | | | 466,466 | |
| | | | | | | | | | | | |
| | | | | | | | | | | 3,428,814 | |
| | | | | | | | | | | | |
Diversified Financial Services — 3.9% | | | | | | | | | | | | |
AGFC Capital Trust I | | 6.000 | % | | 1/15/67 | | | 860,000 | | | 205,409 | B,D |
Capmark Financial Group Inc. | | 5.875 | % | | 5/10/12 | | | 400,000 | | | 136,396 | E |
General Electric Capital Corp. | | 3.116 | % | | 12/9/11 | | | 2,000,000 | | | 2,033,960 | A |
General Electric Capital Corp. | | 6.375 | % | | 11/15/67 | | | 675,000 | | | 424,284 | B |
IBM International Group Capital LLC | | 5.050 | % | | 10/22/12 | | | 950,000 | | | 991,261 | |
ZFS Finance USA Trust III | | 3.146 | % | | 12/15/65 | | | 970,000 | | | 293,425 | A,D |
| | | | | | | | | | | | |
| | | | | | | | | | | 4,084,735 | |
| | | | | | | | | | | | |
Diversified Telecommunication Services — 0.4% Qwest Corp. | | 7.875 | % | | 9/1/11 | | | 230,000 | | | 211,600 | |
Verizon Communications Inc. | | 8.750 | % | | 11/1/18 | | | 150,000 | | | 175,983 | |
| | | | | | | | | | | | |
| | | | | | | | | | | 387,583 | |
| | | | | | | | | | | | |
| | |
| Annual Report to Shareholders | | 43 |
| | | | | | | | | | | |
| | | Rate | | | Maturity
Date | | Par/Shares | | Value |
Corporate Bonds and Notes — Continued | | | | | | | | | | | |
Electric Utilities — 0.5% | | | | | | | | | | | |
Pacific Gas and Electric Co. | | 4.800 | % | | 3/1/14 | | $ | 500,000 | | $ | 491,028 |
| | | | | | | | | | | |
Food and Staples Retailing — 0.5% | | | | | | | | | | | |
Wal-Mart Stores Inc. | | 5.800 | % | | 2/15/18 | | | 500,000 | | | 553,275 |
| | | | | | | | | | | |
Health Care Equipment and Supplies — 0.4% | | | | | | | | | | | |
Hospira Inc. | | 5.550 | % | | 3/30/12 | | | 500,000 | | | 473,734 |
| | | | | | | | | | | |
Health Care Providers and Services — 0.2% | | | | | | | | | | | |
Quest Diagnostics Inc. | | 5.125 | % | | 11/1/10 | | | 180,000 | | | 174,723 |
| | | | | | | | | | | |
IT Services — 1.0% | | | | | | | | | | | |
Electronic Data Systems Corp. | | 7.125 | % | | 10/15/09 | | | 1,000,000 | | | 1,016,625 |
| | | | | | | | | | | |
Leisure Equipment and Products — 0.1% | | | | | | | | | | | |
Eastman Kodak Co. | | 7.250 | % | | 11/15/13 | | | 110,000 | | | 70,950 |
| | | | | | | | | | | |
Media — 2.7% | | | | | | | | | | | |
Clear Channel Communications Inc. | | 4.250 | % | | 5/15/09 | | | 1,100,000 | | | 968,000 |
Comcast Cable Communications Inc. | | 6.875 | % | | 6/15/09 | | | 600,000 | | | 602,811 |
The Walt Disney Co. | | 4.700 | % | | 12/1/12 | | | 280,000 | | | 288,171 |
Time Warner Cable Inc. | | 8.250 | % | | 2/14/14 | | | 180,000 | | | 182,604 |
Time Warner Inc. | | 5.500 | % | | 11/15/11 | | | 830,000 | | | 779,880 |
| | | | | | | | | | | |
| | | | | | | | | | | 2,821,466 |
| | | | | | | | | | | |
Multi-Utilities — 0.3% | | | | | | | | | | | |
Dominion Resources Inc. | | 8.875 | % | | 1/15/19 | | | 300,000 | | | 323,517 |
| | | | | | | | | | | |
| | |
44 | | Annual Report to Shareholders |
Portfolio of Investments — Continued
Limited Duration Bond Portfolio — Continued
| | | | | | | | | | | | |
| | | Rate | | | Maturity
Date | | Par/Shares | | Value | |
Corporate Bonds and Notes — Continued | | | | | | | | | | | | |
Multiline Retail — 0.2% | | | | | | | | | | | | |
Federated Retail Holdings Inc. | | 5.350 | % | | 3/15/12 | | $ | 330,000 | | $ | 245,115 | |
| | | | | | | | | | | | |
Office Electronics — 0.3% Xerox Corp. | | 5.500 | % | | 5/15/12 | | | 330,000 | | | 276,556 | |
| | | | | | | | | | | | |
Oil, Gas and Consumable Fuels — 4.0% | | | | | | | | | | | | |
Apache Corp. | | 6.250 | % | | 4/15/12 | | | 520,000 | | | 544,573 | |
Devon Financing Corp. ULC | | 6.875 | % | | 9/30/11 | | | 350,000 | | | 353,206 | |
El Paso Natural Gas Co. | | 5.950 | % | | 4/15/17 | | | 590,000 | | | 468,827 | |
Energy Transfer Partners LP | | 9.700 | % | | 3/15/19 | | | 120,000 | | | 123,649 | |
Hess Corp. | | 6.650 | % | | 8/15/11 | | | 510,000 | | | 509,798 | |
Kinder Morgan Energy Partners LP | | 6.750 | % | | 3/15/11 | | | 810,000 | | | 787,839 | |
Occidental Petroleum Corp. | | 7.000 | % | | 11/1/13 | | | 690,000 | | | 753,097 | |
Pemex Project Funding Master Trust | | 2.820 | % | | 12/3/12 | | | 252,000 | | | 210,420 | A,D |
XTO Energy Inc. | | 5.650 | % | | 4/1/16 | | | 440,000 | | | 403,686 | |
| | | | | | | | | | | | |
| | | | | | | | | | | 4,155,095 | |
| | | | | | | | | | | | |
Real Estate Investment Trusts (REITs) — 1.0%iStar Financial Inc. | | 2.336 | % | | 9/15/09 | | | 1,330,000 | | | 758,100 | A |
iStar Financial Inc. | | 5.650 | % | | 9/15/11 | | | 1,000,000 | | | 320,000 | |
| | | | | | | | | | | | |
| | | | | | | | | | | 1,078,100 | |
| | | | | | | | | | | | |
Thrifts and Mortgage Finance — 1.1% | | | | | | | | | | | | |
Countrywide Financial Corp. | | 1.686 | % | | 3/24/09 | | | 610,000 | | | 605,037 | A |
Countrywide Financial Corp. | | 5.800 | % | | 6/7/12 | | | 600,000 | | | 584,792 | |
| | | | | | | | | | | | |
| | | | | | | | | | | 1,189,829 | |
| | | | | | | | | | | | |
| | |
| Annual Report to Shareholders | | 45 |
| | | | | | | | | | | | |
| | | Rate | | | Maturity
Date | | Par/Shares | | Value | |
Corporate Bonds and Notes — Continued | | | | | | | | | | | | |
Tobacco — 0.4% | | | | | | | | | | | | |
Philip Morris International Inc. | | 4.875 | % | | 5/16/13 | | $ | 400,000 | | $ | 401,145 | |
| | | | | | | | | | | | |
Wireless Telecommunication Services — 0.4% | | | | | | | | | | | | |
Sprint Capital Corp. | | 6.375 | % | | 5/1/09 | | | 30,000 | | | 29,813 | |
Vodafone Group PLC | | 5.350 | % | | 2/27/12 | | | 450,000 | | | 444,262 | |
| | | | | | | | | | | | |
| | | | | | | | | | | 474,075 | |
| | | | | | | | | | | | |
Total Corporate Bonds and Notes (Cost — $40,031,782) | | | | | | | | | | | 31,645,075 | |
| | | | | | | | | | | | |
Asset-Backed Securities — 8.9% | | | | | | | | | | | | |
Fixed Rate Securities — 2.0% | | | | | | | | | | | | |
Countryplace Manufactured Housing Contract Trust 2007-1 A1 | | 5.484 | % | | 7/15/37 | | | 60,601 | | | 59,721 | B,D |
Drive Auto Receivables Trust 2006-1 A4 | | 5.540 | % | | 12/16/13 | | | 900,000 | | | 828,314 | D |
Prestige Auto Receivables Trust 2005-1A | | 4.370 | % | | 6/16/12 | | | 438,340 | | | 401,513 | D |
Structured Asset Securities Corp. 2003-AL1 | | 3.357 | % | | 4/25/31 | | | 478,526 | | | 377,103 | D |
Wells Fargo Financial Auto Owner Trust 2005-A A4 | | 4.280 | % | | 5/15/12 | | | 386,844 | | | 376,557 | |
| | | | | | | | | | | | |
| | | | | | | | | | | 2,043,208 | |
| | | | | | | | | | | | |
Indexed SecuritiesA — 6.3% | | | | | | | | | | | | |
Asset Backed Funding Certificates 2002-WF2 | | 1.596 | % | | 5/25/32 | | | 221,263 | | | 198,550 | |
Asset Backed Funding Certificates 2004-OPT2 M1 | | 1.021 | % | | 8/25/33 | | | 400,000 | | | 241,869 | |
Bear Stearns Asset Backed Securities Inc. 2004-1 | | 0.991 | % | | 6/25/34 | | | 1,972,585 | | | 1,069,411 | |
Citigroup Mortgage Loan Trust Inc. 2007-SHL1 A | | 0.871 | % | | 11/25/46 | | | 1,467,646 | | | 549,046 | D |
| | |
46 | | Annual Report to Shareholders |
Portfolio of Investments — Continued
Limited Duration Bond Portfolio — Continued
| | | | | | | | | | | | |
| | | Rate | | | Maturity
Date | | Par/Shares | | Value | |
Asset-Backed Securities — Continued | | | | | | | | | | | | |
Indexed Securities — Continued | | | | | | | | | | | | |
Countrywide Asset-Backed Certificates 2007-13 2A1 | | 1.371 | % | | 10/25/47 | | $ | 907,779 | | $ | 668,420 | |
Countrywide Home Equity Loan Trust 2004-O | | 1.475 | % | | 2/15/34 | | | 366,545 | | | 107,312 | |
Lehman XS Trust 2005-5N 3A1A | | 0.771 | % | | 11/25/35 | | | 1,317,094 | | | 613,016 | |
Long Beach Mortgage Loan Trust 2006-A A1 | | 0.561 | % | | 5/25/36 | | | 1,006,369 | | | 58,636 | |
Nelnet Student Loan Trust 2008-4 A4 | | 5.015 | % | | 4/25/24 | | | 1,600,000 | | | 1,296,214 | |
RAAC Series 2005-RP1 | | 0.811 | % | | 7/25/37 | | | 178,386 | | | 174,929 | D |
Securitized Asset Backed Receivables LLC 2006- FR3 A2 | | 0.611 | % | | 5/25/36 | | | 621,451 | | | 540,711 | |
Specialty Underwriting & Residential Finance Trust 2001-BC4 M1 | | 1.071 | % | | 11/25/34 | | | 530,000 | | | 325,517 | |
Structured Asset Securities Corp. 2007-BC3 1A2 | | 0.611 | % | | 5/25/47 | | | 800,000 | | | 412,669 | |
WaMu Asset-Backed Certificates 2007-HE1 2A3 | | 0.621 | % | | 1/25/37 | | | 800,000 | | | 268,435 | |
| | | | | | | | | | | | |
| | | | | | | | | | | 6,524,735 | |
| | | | | | | | | | | | |
Variable Rate SecuritiesF — 0.6% | | | | | | | | | | | | |
Green Tree 2008-MH1 A1 | | 7.000 | % | | 4/25/38 | | | 780,195 | | | 682,670 | D |
| | | | | | | | | | | | |
Total Asset-Backed Securities (Cost — $14,921,115) | | | | | | | | | | | 9,250,613 | |
| | | | | | | | | | | | |
Mortgage-Backed Securities — 20.7% Fixed Rate Securities — 2.0% | | | | | | | | | | | | |
Residential Asset Mortgage Products Inc. 2005-SL1 | | 8.000 | % | | 5/25/32 | | | 1,041,429 | | | 732,581 | |
| | |
| Annual Report to Shareholders | | 47 |
| | | | | | | | | | | | |
| | | Rate | | | Maturity
Date | | Par/Shares | | Value | |
Mortgage-Backed Securities — Continued | | | | | | | | | | | | |
Fixed Rate Securities — Continued | | | | | | | | | | | | |
Washington Mutual MSC Mortgage Pass-Through Certificates Series 2004- RA1 | | 7.000 | % | | 3/25/34 | | $ | 1,566,516 | | $ | 1,401,543 | |
| | | | | | | | | | | | |
| | | | | | | | | | | 2,134,124 | |
| | | | | | | | | | | | |
Indexed SecuritiesA — 14.0% | | | | | | | | | | | | |
Banc of America Mortgage Securities 2005-F | | 5.007 | % | | 7/25/35 | | | 1,761,326 | | | 1,280,469 | |
Bayview Commercial Asset Trust 2005-2A A2 | | 0.821 | % | | 8/25/35 | | | 533,354 | | | 418,596 | D |
Bear Stearns Alt-A Trust 2007-1 1A1 | | 0.631 | % | | 1/25/47 | | | 1,631,573 | | | 579,559 | |
Bear Stearns ARM Trust 2004-10 | | 5.042 | % | | 1/25/35 | | | 264,284 | | | 194,066 | |
Countrywide Alternative Loan Trust 2005-59 1A1 | | 1.783 | % | | 11/20/35 | | | 1,235,349 | | | 617,526 | |
Countrywide Alternative Loan Trust 2006-0A2 A5 | | 0.738 | % | | 5/20/46 | | | 1,568,191 | | | 569,763 | |
Countrywide Alternative Loan Trust 2007-AL1 A1 | | 0.721 | % | | 6/25/37 | | | 420,396 | | | 158,856 | |
CS First Boston Mortgage Securities Corp. 2004-AR5 7A2 | | 4.604 | % | | 6/25/34 | | | 527,332 | | | 386,775 | |
First Horizon Alternative Mortgage Securities 2006-FA8 1A8 | | 0.841 | % | | 2/25/37 | | | 362,665 | | | 108,541 | |
Greenpoint Mortgage Funding Trust 2006-AR7 1A1B | | 0.591 | % | | 12/25/46 | | | 610,570 | | | 335,654 | |
Harborview Mortgage Loan Trust 2004-8 3A2 | | 0.981 | % | | 11/29/34 | | | 357,275 | | | 169,827 | |
HomeBanc Mortgage Trust 2004-2 A1 | | 0.841 | % | | 12/25/34 | | | 786,465 | | | 508,172 | |
| | |
48 | | Annual Report to Shareholders |
Portfolio of Investments — Continued
Limited Duration Bond Portfolio — Continued
| | | | | | | | | | | | |
| | | Rate | | | Maturity
Date | | Par/Shares | | Value | |
Mortgage-Backed Securities — Continued | | | | | | | | | | | | |
Indexed Securities — Continued | | | | | | | | | | | | |
HomeBanc Mortgage Trust 2005-1 A1 | | 0.721 | % | | 3/25/35 | | $ | 1,239,679 | | $ | 707,101 | |
Impac CMB Trust 2004-6 1A2 | | 1.251 | % | | 10/25/34 | | | 244,977 | | | 123,738 | |
IndyMac Inda Mortgage Loan Trust 2007-AR7 1A1 | | 6.217 | % | | 11/25/37 | | | 791,512 | | | 487,959 | |
JPMorgan Mortgage Trust 2004-A1 1A1 | | 4.347 | % | | 10/25/33 | | | 1,856,649 | | | 1,302,015 | |
JPMorgan Mortgage Trust 2004-A1 1A1 | | 4.794 | % | | 2/25/34 | | | 547,110 | | | 412,238 | |
MASTR Adjustable Rate Mortgages Trust 2004-13 | | 3.788 | % | | 11/21/34 | | | 3,000,000 | | | 1,920,062 | |
MASTR Adjustable Rate Mortgages Trust 2006-OA2 1A1 | | 3.279 | % | | 12/25/46 | | | 980,303 | | | 200,015 | |
MASTR Specialized Loan Trust 2006-01 A | | 0.771 | % | | 12/25/35 | | | 431,459 | | | 344,687 | D |
Sequoia Mortgage Trust 2003-2 A2 | | 4.859 | % | | 6/20/33 | | | 304,377 | | | 235,676 | |
Structured Asset Mortgage Investments Inc. 2006-AR2 A1 | | 0.701 | % | | 2/25/36 | | | 682,314 | | | 283,188 | |
Structured Asset Mortgage Investments Inc. 2006-AR7 A1A | | 0.681 | % | | 8/25/36 | | | 1,188,246 | | | 472,072 | |
WaMu Alternative Mortgage Pass-Through Certificates 2006-AR01 A1B | | 0.791 | % | | 2/25/36 | | | 1,174,807 | | | 285,050 | |
WaMu Mortgage Pass Through Certificates 2003-AR8 A | | 4.282 | % | | 8/25/33 | | | 411,330 | | | 306,816 | |
| | |
| Annual Report to Shareholders | | 49 |
| | | | | | | | | | | |
| | | Rate | | | Maturity
Date | | Par/Shares | | Value |
Mortgage-Backed Securities — Continued | | | | | | | | | | | |
Indexed Securities — Continued | | | | | | | | | | | |
WaMu Mortgage Pass-Through Certificates 2003-AR10 | | 4.672 | % | | 10/25/33 | | $ | 1,968,483 | | $ | 1,621,598 |
WaMu Mortgage Pass-Through Certificates 2004-AR08 A1 | | 1.858 | % | | 6/25/44 | | | 461,208 | | | 264,002 |
WaMu Mortgage Pass-Through Certificates 2006-AR4 DA | | 3.449 | % | | 6/25/46 | | | 789,543 | | | 252,654 |
| | | | | | | | | | | |
| | | | | | | | | | | 14,546,675 |
| | | | | | | | | | | |
Variable Rate SecuritiesF — 4.7% | | | | | | | | | | | |
Banc of America Funding Corp. 2004-B | | 5.258 | % | | 12/20/34 | | | 294,739 | | | 178,855 |
Chase Mortgage Finance Corp. 2007-A1 2A3 | | 4.137 | % | | 2/25/37 | | | 725,927 | | | 569,865 |
Citigroup Mortgage Loan Trust Inc. 2007-AR4 2A1A | | 5.471 | % | | 3/25/37 | | | 1,752,320 | | | 980,230 |
Citigroup Mortgage Loan Trust Inc. 2007-AR8 1A1A | | 5.727 | % | | 8/25/47 | | | 895,649 | | | 470,656 |
Countrywide Alternative Loan Trust 2004-33 1A1 | | 6.249 | % | | 12/25/34 | | | 162,469 | | | 92,400 |
Countrywide Alternative Loan Trust 2004-33 2A1 | | 5.395 | % | | 12/25/34 | | | 113,503 | | | 53,086 |
JPMorgan Mortgage Trust 2006-A2 5A1 | | 5.152 | % | | 11/25/33 | | | 288,250 | | | 217,346 |
Nomura Asset Acceptance Corp. 2004-AR4 1A1 | | 4.889 | % | | 12/25/34 | | | 921,399 | | | 540,587 |
Prime Mortgage Trust 2005-2 | | 7.399 | % | | 10/25/32 | | | 823,219 | | | 572,395 |
| | |
50 | | Annual Report to Shareholders |
Portfolio of Investments — Continued
Limited Duration Bond Portfolio — Continued
| | | | | | | | | | | | |
| | | Rate | | | Maturity Date | | Par/Shares | | Value | |
Mortgage-Backed Securities — Continued | | | | | | | | | | | | |
Variable Rate SecuritiesF — Continued | | | | | | | | | | | | |
Structured Adjustable Rate Mortgage Loan Trust 2005-12 3A1 | | 5.677 | % | | 6/25/35 | | $ | 598,525 | | $ | 409,751 | |
WaMu Mortgage Pass-Through Certificates 2004-AR14 A1 | | 4.255 | % | | 1/25/35 | | | 1,146,103 | | | 789,619 | |
| | | | | | | | | | | | |
| | | | | | | | | | | 4,874,790 | |
| | | | | | | | | | | | |
Total Mortgage-Backed Securities (Cost — $36,153,703) | | | | | | | | | | | 21,555,589 | |
| | | | | | | | | | | | |
U.S. Government and Agency Obligations — 8.1% | | | | | | | | | | | | |
Treasury Inflation-Protected SecuritiesG — 8.1% | | | | | | | | | | | | |
United States Treasury Inflation-Protected Security | | 0.875 | % | | 4/15/10 | | | 8,268,011 | | | 7,770,641 | |
United States Treasury Inflation-Protected Security | | 3.875 | % | | 4/15/29 | | | 527,136 | | | 651,054 | H |
| | | | | | | | | | | | |
Total U.S. Government and Agency Obligations (Cost — $8,801,098) | | | | | | | | | | | 8,421,695 | |
| | | | | | | | | | | | |
U.S. Government Agency Mortgage-Backed Securities — 15.4% | | | | | | | | | | | | |
Fixed Rate Securities — 10.2% | | | | | | | | | | | | |
Fannie Mae | | 8.500 | % | | 6/1/10 to 8/1/11 | | | 705 | | | 727 | I |
Fannie Mae | | 6.500 | % | | 7/1/13 to 10/1/32 | | | 928,836 | | | 966,807 | I |
Fannie Mae | | 9.500 | % | | 7/1/14 | | | 2,846 | | | 2,940 | I |
Fannie Mae | | 11.000 | % | | 12/1/15 | | | 15,320 | | | 16,966 | I |
Fannie Mae | | 12.500 | % | | 1/1/18 | | | 19,334 | | | 22,902 | I |
Fannie Mae | | 9.000 | % | | 11/1/21 | | | 62,679 | | | 67,236 | I |
Fannie Mae | | 7.000 | % | | 12/1/26 to 1/1/33 | | | 3,275,562 | | | 3,465,906 | I |
Fannie Mae | | 6.000 | % | | 11/1/27 to 7/1/38 | | | 291,349 | | | 300,239 | I |
Fannie Mae | | 5.000 | % | | 6/1/35 | | | 962,288 | | | 984,432 | I |
Fannie Mae | | 5.500 | % | | 4/1/36 | | | 1,475,953 | | | 1,483,534 | I |
Fannie Mae | | 6.000 | % | | 12/1/38 | | | 600,000 | | | 617,625 | I,J |
Freddie Mac | | 9.750 | % | | 11/1/09 | | | 18 | | | 18 | I |
Freddie Mac | | 9.000 | % | | 1/1/17 to 1/1/21 | | | 56,528 | | | 59,740 | I |
Freddie Mac | | 8.500 | % | | 6/1/21 | | | 1,563 | | | 1,672 | I |
| | |
| Annual Report to Shareholders | | 51 |
| | | | | | | | | | | | |
| | | Rate | | | Maturity Date | | Par/Shares | | Value | |
U.S. Government Agency Mortgage-Backed Securities — Continued | | | | | | | | | | | | |
Fixed Rate Securities — Continued | | | | | | | | | | | | |
Freddie Mac | | 8.000 | % | | 2/1/31 | | $ | 169,159 | | $ | 180,352 | I |
Freddie Mac | | 7.000 | % | | 4/1/32 | | | 1,161,813 | | | 1,220,985 | I |
Freddie Mac | | 5.000 | % | | 11/1/35 | | | 153,795 | | | 157,382 | I |
Government National Mortgage Association | | 6.000 | % | | 5/15/14 to 11/15/28 | | | 154,980 | | | 162,380 | |
Government National Mortgage Association | | 9.000 | % | | 6/15/22 to 9/15/22 | | | 1,449 | | | 1,551 | |
Government National Mortgage Association | | 6.000 | % | | 12/1/38 | | | 900,000 | | | 927,843 | J |
| | | | | | | | | | | | |
| | | | | | | | | | | 10,641,237 | |
| | | | | | | | | | | | |
Indexed SecuritiesA — 4.8% | | | | | | | | | | | | |
Fannie Mae | | 4.341 | % | | 10/1/34 | | | 660,950 | | | 663,231 | I |
Fannie Mae | | 4.329 | % | | 1/1/35 | | | 877,318 | | | 848,628 | I |
Fannie Mae | | 4.795 | % | | 2/1/35 | | | 467,434 | | | 472,978 | I |
Fannie Mae | | 4.961 | % | | 3/1/35 | | | 3,021,454 | | | 3,049,118 | I |
| | | | | | | | | | | | |
| | | | | | | | | | | 5,033,955 | |
| | | | | | | | | | | | |
Stripped Securities — 0.4% | | | | | | | | | | | | |
Government National Mortgage Association | | 7.438 | % | | 6/16/26 | | | 1,354,626 | | | 214,244 | K,L1 |
Government National Mortgage Association | | 7.488 | % | | 8/16/26 | | | 938,143 | | | 145,429 | K,L1 |
| | | | | | | | | | | | |
| | | | | | | | | | | 359,673 | |
| | | | | | | | | | | | |
Total U.S. Government Agency Mortgage-Backed Securities
(Cost — $16,351,516) | | | | | | | | | | | 16,034,865 | |
| | | | | | | | | | | | |
Yankee BondsM — 11.1% | | | | | | | | | | | | |
Beverages — 0.3% | | | | | | | | | | | | |
Diageo Capital PLC | | 5.200 | % | | 1/30/13 | | | 350,000 | | | 344,407 | |
| | | | | | | | | | | | |
Capital Markets — 0.9% | | | | | | | | | | | | |
Deutsche Bank AG | | 6.000 | % | | 9/1/17 | | | 900,000 | | | 954,948 | |
| | | | | | | | | | | | |
| | |
52 | | Annual Report to Shareholders |
Portfolio of Investments — Continued
Limited Duration Bond Portfolio — Continued
| | | | | | | | | | | | |
| | | Rate | | | Maturity
Date | | Par/Shares | | Value | |
Yankee Bonds — 11.1% | | | | | | | | | | | | |
Commercial Banks — 1.0% | | | | | | | | | | | | |
Glitnir Banki Hf | | 5.815 | % | | 1/21/11 | | $ | 1,550,000 | | $ | 73,625 | A,C,D |
Glitnir Banki Hf | | 6.693 | % | | 6/15/16 | | | 50,000 | | | 8 | B,C,D |
HSBC Bank PLC | | 7.718 | % | | 8/20/12 | | | 70,000 | | | 37,905 | A |
Kaupthing Bank Hf | | 4.958 | % | | 1/15/10 | | | 190,000 | | | 11,400 | A,C,D |
Kaupthing Bank Hf | | 5.750 | % | | 10/4/11 | | | 420,000 | | | 25,200 | C,D |
Kaupthing Bank Hf | | 7.625 | % | | 2/28/15 | | | 330,000 | | | 19,800 | C,D,K |
Landsbanki Islands Hf | | 6.100 | % | | 8/25/11 | | | 620,000 | | | 10,850 | C,D |
Landsbanki Islands Hf | | 7.431 | % | | 12/31/49 | | | 240,000 | | | 36 | B,C,D |
Resona Preferred Global Securities | | 7.191 | % | | 12/29/49 | | | 830,000 | | | 395,153 | B,D |
Shinsei Finance Cayman Ltd. | | 6.418 | % | | 1/29/49 | | | 640,000 | | | 133,857 | B,D |
TuranAlem Finance BV | | 5.434 | % | | 1/22/09 | | | 320,000 | | | 300,800 | A,D |
| | | | | | | | | | | | |
| | | | | | | | | | | 988,834 | |
| | | | | | | | | | | | |
Diversified Financial Services — 1.8% | | | | | | | | | | | | |
Aiful Corp. | | 5.000 | % | | 8/10/10 | | | 1,280,000 | | | 703,743 | D |
MUFG Capital Finance 1 Ltd. | | 6.346 | % | | 7/29/49 | | | 600,000 | | | 418,034 | B |
TNK-BP Finance SA | | 6.875 | % | | 7/18/11 | | | 1,090,000 | | | 795,700 | D |
| | | | | | | | | | | | |
| | | | | | | | | | | 1,917,477 | |
| | | | | | | | | | | | |
Diversified Telecommunication Services — 3.0% | | | | | | | | | | | | |
British Telecommunications PLC | | 8.625 | % | | 12/15/10 | | | 520,000 | | | 534,924 | E |
Deutsche Telekom International Finance BV | | 8.500 | % | | 6/15/10 | | | 650,000 | | | 669,548 | E |
France Telecom SA | | 7.750 | % | | 3/1/11 | | | 570,000 | | | 599,813 | |
Koninklijke (Royal) KPN NV | | 8.000 | % | | 10/1/10 | | | 680,000 | | | 686,258 | |
Telefonica Emisiones S.A.U. | | 3.356 | % | | 2/4/13 | | | 790,000 | | | 633,733 | A |
| | | | | | | | | | | | |
| | | | | | | | | | | 3,124,276 | |
| | | | | | | | | | | | |
Health Care Equipment and Supplies — 0.5% | | | | | | | | | | | | |
Baxter Finco BV | | 4.750 | % | | 10/15/10 | | | 520,000 | | | 518,530 | |
| | | | | | | | | | | | |
| | |
| Annual Report to Shareholders | | 53 |
| | | | | | | | | | | | |
| | | Rate | | | Maturity
Date | | Par/Shares | | Value | |
Yankee Bonds — 11.1% | | | | | | | | | | | | |
Industrial Conglomerates — 1.4% | | | | | | | | | | | | |
Tyco International Group SA | | 6.375 | % | | 10/15/11 | | $ | 1,480,000 | | $ | 1,454,757 | |
| | | | | | | | | | | | |
Insurance — 0.4% | | | | | | | | | | | | |
Merna Reinsurance Ltd. | | 3.218 | % | | 7/7/10 | | | 400,000 | | | 361,160 | A,D |
| | | | | | | | | | | | |
Metals and Mining — 1.0% | | | | | | | | | | | | |
Vale Overseas Ltd. | | 6.250 | % | | 1/23/17 | | | 1,130,000 | | | 1,065,364 | |
| | | | | | | | | | | | |
Oil, Gas and Consumable Fuels — 0.8% | | | | | | | | | | | | |
Anadarko Finance Co. | | 6.750 | % | | 5/1/11 | | | 870,000 | | | 870,311 | |
| | | | | | | | | | | | |
Total Yankee Bonds (Cost — $17,154,505) | | | | | | | | | | | 11,619,864 | |
| | | | | | | | | | | | |
Preferred Stocks — 0.2% | | | | | | | | | | | | |
Fannie Mae | | 8.250 | % | | | | | 15,950shs | | | 13,238 | B,I |
Freddie Mac | | 8.375 | % | | | | | 21,700 | | | 8,463 | B,I |
Home Ownership Funding Corp. | | 1.000 | % | | | | | 500 | | | 49,275 | D,F |
Home Ownership Funding Corp. II | | 1.000 | % | | | | | 1,400 | | | 137,970 | D,F |
| | | | | | | | | | | | |
Total Preferred Stocks (Cost — $2,478,698) | | | | | | | | | | | 208,946 | |
| | | | | | | | | | | | |
Total Long-Term Securities (Cost — $135,892,417) | | | | | | | | | | | 98,736,647 | |
| | | | | | | | | | | | |
Short-Term Securities — 3.1% | | | | | | | | | | | | |
U.S. Government and Agency Obligations — 3.1% | | | | | | | | | | | | |
Fannie Mae | | 0.000 | % | | 5/18/09 | | $ | 806,000 | | | 805,239 | I,N |
Federal Home Loan Bank | | 0.000 | % | | 3/26/09 | | | 2,500,000 | | | 2,499,598 | N |
| | | | | | | | | | | | |
| | | | | | | | | | | 3,304,837 | |
| | | | | | | | | | | | |
| | |
54 | | Annual Report to Shareholders |
Portfolio of Investments — Continued
Limited Duration Bond Portfolio — Continued
| | | | | | | | | | |
| | | Rate | | Maturity
Date | | Par/Shares | | | Value |
Short-Term Securities — Continued | | | | | | | | | | |
Options PurchasedO — N.M. | | | | | | | | | | |
U.S. Treasury Note Futures Put, February 2009, Strike Price $85.00 | | | | | | 59 | P | | $ | 922 |
| | | | | | | | | | |
Total Short-Term Securities (Cost — $3,306,190) | | | | | | | | | | 3,305,759 |
| | | | | | | | | | |
Total Investments — 97.8% (Cost — $139,198,607)Q | | | | | | | | | | 102,042,406 |
Other Assets Less Liabilities — 2.2% | | | | | | | | | | 2,246,605 |
| | | | | | | | | | |
Net Assets — 100.0% | | | | | | | | | $ | 104,289,011 |
| | | | | | | | | | |
| | |
| Annual Report to Shareholders | | 55 |
| | | | | | | | |
| | | Expiration | | Actual
Contracts | | Appreciation/
(Depreciation) | |
Futures Contracts PurchasedO | | | | | | | | |
Eurodollar Futures | | March 2009 | | 190 | | $ | 931,575 | |
Eurodollar Futures | | June 2009 | | 174 | | | 950,493 | |
Eurodollar Futures | | September 2009 | | 66 | | | 421,933 | |
Eurodollar Futures | | September 2010 | | 16 | | | (4,368 | ) |
U.S. Treasury Note Futures | | March 2009 | | 83 | | | 183,030 | |
U.S. Treasury Note Futures | | March 2009 | | 319 | | | 775,967 | |
| | | | | | | | |
| | | | | | $ | 3,258,630 | |
| | | | | | | | |
Futures Contracts WrittenO | | | | | | | | |
U.S. Treasury Bond Futures | | March 2009 | | 62 | | $ | (797,013 | ) |
U.S. Treasury Note Futures | | March 2009 | | 100 | | | (320,203 | ) |
| | | | | | | | |
| | | | | | $ | (1,117,216 | ) |
| | | | | | | | |
Options WrittenO | | | | | | | | |
Eurodollar Futures Call, Strike Price $97.63 | | September 2009 | | 66 | | $ | (142,917 | ) |
Eurodollar Futures Call, Strike Price $98.25 | | March 2009 | | 124 | | | (156,845 | ) |
U.S. Treasury Note Futures Call, Strike Price $117.00 | | February 2009 | | 32 | | | (49,410 | ) |
U.S. Treasury Note Futures Call, Strike Price $118.00 | | February 2009 | | 65 | | | (475,216 | ) |
U.S. Treasury Note Futures Put, Strike Price $110.00 | | February 2009 | | 65 | | | 79,175 | |
| | | | | | | | |
| | | | | | $ | (745,213 | ) |
| | | | | | | | |
N.M. Not Meaningful.
A | Indexed Security — The rates of interest earned on these securities are tied to the London Interbank Offered Rate (“LIBOR”), the Euro Interbank Offered Rate (“EURIBOR”) Index, the Consumer Price Index (“CPI”), the one-year Treasury Bill Rate or the ten-year Japanese Government Bond Rate. The coupon rates are the rates as of December 31, 2008. |
| | |
56 | | Annual Report to Shareholders |
Portfolio of Investments — Continued
Limited Duration Bond Portfolio — Continued
B | Stepped Coupon Security — A security with a predetermined schedule of interest or dividend rate changes at which time it begins to accrue interest or pay dividends according to the predetermined schedule. |
C | Bond is currently in default. |
D | Rule 144a Security — A security purchased pursuant to Rule 144a under the Securities Act of 1933 which may not be resold under that rule except to qualified institutional buyers. These securities, which the Fund’s investment adviser has determined to be liquid, represent 8.33% of net assets. |
E | Credit Linked Security — The rates of interest earned on these securities are tied to the credit rating assigned by Standard & Poor’s Rating Service and/or Moody’s Investors Services. |
F | The coupon rates shown on variable rate securities are the rates at December 31, 2008. These rates vary with the weighted average coupon of the underlying loans. |
G | Treasury Inflation-Protected Security — Treasury security whose principal value is adjusted daily in accordance with changes to the Consumer Price Index for All Urban Consumers. Interest is calculated on the basis of the current adjusted principal value. |
H | All or a portion of this security is collateral to cover futures and options contracts written. |
I | On September 7, 2008, the Federal Housing Finance Agency placed Fannie Mae and Freddie Mac into Conservatorship. |
J | When-issued Security — Security purchased on a delayed delivery basis. Final settlement amount and maturity date have not yet been announced. |
K | Illiquid security valued at fair value under the procedures approved by the Board of Directors. |
L | Stripped Security — Security with interest-only or principal-only payment streams, denoted by a 1 or 2, respectively. For interest-only securities, the amount shown as principal is the notional balance used to calculate the amount of interest due. |
M | Yankee Bond — A dollar-denominated bond issued in the U.S. by foreign entities. |
N | Zero coupon bond — A bond with no periodic interest payments which is sold at such a discount as to produce a current yield to maturity. |
O | Options and futures are described in more detail in the notes to financial statements. |
P | Par represents actual number of contracts. |
Q | At December 31, 2008, the aggregate gross unrealized appreciation and depreciation of investments for federal income tax purposes were as follows: |
| | | | |
Gross unrealized appreciation | | $ | 730,253 | |
Gross unrealized depreciation | | | (37,890,175 | ) |
| | | | |
Net unrealized depreciation | | $ | (37,159,922 | ) |
| | | | |
See notes to financial statements.
| | |
| Annual Report to Shareholders | | 57 |
Statement of Assets and Liabilities
Limited Duration Bond Portfolio
December 31, 2008
| | | | | | | |
Assets: | | | | | | | |
Investment securities at market value (Cost – $135,892,417) | | | | | $ | 98,736,647 | |
Short-term securities at value (Cost – $3,306,190) | | | | | | 3,305,759 | |
Cash | | | | | | 3,640,491 | |
Receivable for securities sold | | | | | | 2,822,973 | |
Interest receivable | | | | | | 886,608 | |
Receivable for fund shares sold | | | | | | 369,404 | |
Futures variation margin receivable | | | | | | 96,108 | |
Other assets | | | | | | 11,324 | |
| | | | | | | |
Total assets | | | | | | 109,869,314 | |
Liabilities: | | | | | | | |
Payable for securities purchased | | $ | 3,796,501 | | | | |
Options written (Proceeds – $299,403) | | | 1,044,616 | | | | |
Payable for fund shares repurchased | | | 570,713 | | | | |
Accrued management fees | | | 53,123 | | | | |
Accrued distribution and service fees | | | 24,802 | | | | |
Payable for Lehman settlements | | | 2,281 | | | | |
Accrued expenses | | | 88,267 | | | | |
| | | | | | | |
Total liabilities | | | | | | 5,580,303 | |
| | | | | | | |
Net Assets | | | | | $ | 104,289,011 | |
| | | | | | | |
Net assets consist of: | | | | | | | |
Accumulated paid-in-capital | | | | | $ | 150,880,774 | |
Overdistributed net investment income | | | | | | (200,722 | ) |
Accumulated net realized loss on investments, options and futures | | | | | | (10,631,041 | ) |
Net unrealized depreciation of investments, options and futures | | | | | | (35,760,000 | ) |
| | | | | | | |
Net Assets | | | | | $ | 104,289,011 | |
| | | | | | | |
Net Asset Value Per Share: | | | | | | | |
Primary Class (12,143,287 shares outstanding) | | | | | $ | 7.95 | |
| | | | | | | |
Institutional Class (970,198 shares outstanding) | | | | | $ | 7.95 | |
| | | | | | | |
See notes to financial statements.
| | |
58 | | Annual Report to Shareholders |
Statement of Operations
Limited Duration Bond Portfolio
For the Year Ended December 31, 2008
| | | | | | | | |
Investment Income: | | | | | | | | |
Interest | | $ | 7,587,066 | | | | | |
Dividends | | | 66,748 | | | | | |
| | | | | | | | |
Total income | | | | | | $ | 7,653,814 | |
Expenses: | | | | | | | | |
Management fees | | | 660,803 | | | | | |
Distribution and service fees: | | | | | | | | |
Primary Class | | | 683,571 | | | | | |
Audit and legal fees | | | 61,376 | | | | | |
Custodian fees | | | 39,473 | | | | | |
Directors’ fees and expenses | | | 56,778 | | | | | |
Registration fees | | | 34,278 | | | | | |
Reports to shareholders: | | | | | | | | |
Primary Class | | | 43,159 | | | | | |
Institutional Class | | | 436 | | | | | |
Transfer agent and shareholder servicing expense: | | | | | | | | |
Primary Class | | | 104,014 | | | | | |
Institutional Class | | | 17,591 | | | | | |
Other expenses | | | 39,489 | | | | | |
| | | | | | | | |
| | | 1,740,968 | | | | | |
Less: Fees waived | | | (322,885 | ) | | | | |
Compensating balance credits | | | (299 | ) | | | | |
| | | | | | | | |
Net expenses | | | | | | | 1,417,784 | |
| | | | | | | | |
Net Investment Income | | | | | | | 6,236,030 | |
Net Realized and Unrealized Gain/(Loss) on Investments: | | | | | | | | |
Net realized gain/(loss) on: | | | | | | | | |
Investments | | | (2,069,499 | ) | | | | |
Options | | | 239,961 | | | | | |
Futures | | | 745,695 | | | | | |
| | | | | | | | |
| | | | | | | (1,083,843 | ) |
Change in unrealized appreciation/(depreciation) of investments, options and futures | | | | | | | (29,246,464 | ) |
| | | | | | | | |
Net Realized and Unrealized Loss on Investments | | | | | | | (30,330,307 | ) |
| | | | | | | | |
Change in Net Assets Resulting From Operations | | | | | | $ | (24,094,277 | ) |
| | | | | | | | |
See notes to financial statements.
| | |
| Annual Report to Shareholders | | 59 |
Statement of Changes in Net Assets
Limited Duration Bond Portfolio
| | | | | | | | |
| | | For the Years Ended
December 31, | |
| | | 2008 | | | 2007 | |
Change in Net Assets: | | | | | | | | |
Net investment income | | $ | 6,236,030 | | | $ | 8,863,309 | |
Net realized loss | | | (1,083,843 | ) | | | (1,850,541 | ) |
Change in unrealized appreciation/(depreciation) | | | (29,246,464 | ) | | | (2,874,447 | ) |
| | | | | | | | |
Change in net assets resulting from operations | | | (24,094,277 | ) | | | 4,138,321 | |
Distributions to shareholders from: | | | | | | | | |
Net investment income: | | | | | | | | |
Primary Class | | | (6,092,645 | ) | | | (8,257,858 | ) |
Institutional Class | | | (503,244 | ) | | | (597,941 | ) |
Change in net assets from fund share transactions: | | | | | | | | |
Primary Class | | | (42,218,056 | ) | | | (20,301,062 | ) |
Institutional Class | | | (1,186,880 | ) | | | 467,488 | |
| | | | | | | | |
Change in net assets | | | (74,095,102 | ) | | | (24,551,052 | ) |
Net Assets: | | | | | | | | |
Beginning of year | | | 178,384,113 | | | | 202,935,165 | |
| | | | | | | | |
End of year | | $ | 104,289,011 | | | $ | 178,384,113 | |
| | | | | | | | |
(Overdistributed)/Undistributed net investment income | | $ | (200,722 | ) | | $ | 75,612 | |
| | | | | | | | |
See notes to financial statements.
| | |
60 | | Annual Report to Shareholders |
Financial Highlights
Limited Duration Bond Portfolio
For a share of each class of capital stock outstanding:
Primary Class:
| | | | | | | | | | | | | | | | | | | | |
| | | Years Ended December 31, | |
| | | 2008 | | | 2007 | | | 2006 | | | 2005 | | | 2004 | |
Net asset value, beginning of year | | $ | 9.97 | | | $ | 10.22 | | | $ | 10.20 | | | $ | 10.36 | | | $ | 10.54 | |
| | | | | | | | | | | | | | | | | | | | |
Investment operations: | | | | | | | | | | | | | | | | | | | | |
Net investment income | | | .39 | A | | | .46 | A | | | .42 | A | | | .33 | | | | .29 | |
Net realized and unrealized gain/(loss) | | | (1.99 | ) | | | (.25 | ) | | | .02 | | | | (.14 | ) | | | (.09 | ) |
| | | | | | | | | | | | | | | | | | | | |
Total from investment operations | | | (1.60 | ) | | | .21 | | | | .44 | | | | .19 | | | | .20 | |
| | | | | | | | | | | | | | | | | | | | |
Distributions from: | | | | | | | | | | | | | | | | | | | | |
Net investment income | | | (.42 | ) | | | (.46 | ) | | | (.42 | ) | | | (.35 | ) | | | (.37 | ) |
Net realized gain on investments | | | — | | | | — | | | | — | | | | — | | | | (.01 | ) |
| | | | | | | | | | | | | | | | | | | | |
Total distributions | | | (.42 | ) | | | (.46 | ) | | | (.42 | ) | | | (.35 | ) | | | (.38 | ) |
| | | | | | | | | | | | | | | | | | | | |
Net asset value, end of year | | $ | 7.95 | | | $ | 9.97 | | | $ | 10.22 | | | $ | 10.20 | | | $ | 10.36 | |
| | | | | | | | | | | | | | | | | | | | |
Total return | | | (16.52 | )% | | | 2.05 | % | | | 4.46 | % | | | 1.83 | % | | | 1.89 | % |
Ratios to Average Net Assets:B | | | | | | | | | | | | | | | | | | | | |
Total expenses | | | 1.22 | % | | | 1.18 | % | | | 1.21 | % | | | 1.15 | % | | | 1.21 | % |
Expenses net of waivers, if any | | | 1.00 | % | | | 1.00 | % | | | 1.00 | % | | | 1.00 | % | | | 1.00 | % |
Expenses net of all reductions | | | 1.00 | % | | | 1.00 | % | | | 1.00 | % | | | 1.00 | % | | | 1.00 | % |
Net investment income | | | 4.21 | % | | | 4.51 | % | | | 4.10 | % | | | 3.21 | % | | | 2.81 | % |
Supplemental Data: | | | | | | | | | | | | | | | | | | | | |
Portfolio turnover rate | | | 224.1 | % | | | 286.8 | % | | | 237.2 | % | | | 81.6 | % | | | 238.0 | % |
Net assets, end of year (in thousands) | | $ | 96,574 | | | $ | 167,195 | | | $ | 191,883 | | | $ | 219,497 | | | $ | 274,606 | |
A | Computed using average daily shares outstanding. |
B | Total expenses reflects operating expenses prior to any voluntary or contractual expense waivers and/or compensating balance credits. Expenses net of waivers reflects total expenses before compensating balance credits but net of any voluntary or contractual expense waivers. Expenses net of all reductions reflects expenses less any compensating balance credits and/or voluntary or contractual expense waivers. |
See notes to financial statements.
| | |
| Annual Report to Shareholders | | 61 |
Institutional Class:
| | | | | | | | | | | | | | | | | | | | |
| | | Years Ended December 31, | |
| | | 2008 | | | 2007 | | | 2006 | | | 2005 | | | 2004 | |
Net asset value, beginning of year | | $ | 9.97 | | | $ | 10.22 | | | $ | 10.20 | | | $ | 10.37 | | | $ | 10.55 | |
| | | | | | | | | | | | | | | | | | | | |
Investment operations: | | | | | | | | | | | | | | | | | | | | |
Net investment income | | | .43 | A | | | .51 | A | | | .47 | A | | | .40 | | | | .35 | |
Net realized and unrealized gain/(loss) | | | (1.99 | ) | | | (.25 | ) | | | .03 | | | | (.17 | ) | | | (.10 | ) |
| | | | | | | | | | | | | | | | | | | | |
Total from investment operations | | | (1.56 | ) | | | .26 | | | | .50 | | | | .23 | | | | .25 | |
| | | | | | | | | | | | | | | | | | | | |
Distributions from: | | | | | | | | | | | | | | | | | | | | |
Net investment income | | | (.46 | ) | | | (.51 | ) | | | (.48 | ) | | | (.40 | ) | | | (.42 | ) |
Net realized gain on investments | | | — | | | | — | | | | — | | | | — | | | | (.01 | ) |
| | | | | | | | | | | | | | | | | | | | |
Total distributions | | | (.46 | ) | | | (.51 | ) | | | (.48 | ) | | | (.40 | ) | | | (.43 | ) |
| | | | | | | | | | | | | | | | | | | | |
Net asset value, end of year | | $ | 7.95 | | | $ | 9.97 | | | $ | 10.22 | | | $ | 10.20 | | | $ | 10.37 | |
| | | | | | | | | | | | | | | | | | | | |
Total return | | | (16.09 | )% | | | 2.56 | % | | | 4.98 | % | | | 2.29 | % | | | 2.41 | % |
Ratios to Average Net Assets:B | | | | | | | | | | | | | | | | | | | | |
Total expenses | | | .77 | % | | | .72 | % | | | .64 | % | | | .62 | % | | | .70 | % |
Expenses net of waivers, if any | | | .50 | % | | | .50 | % | | | .50 | % | | | .46 | % | | | .48 | % |
Expenses net of all reductions | | | .50 | % | | | .50 | % | | | .50 | % | | | .46 | % | | | .48 | % |
Net investment income | | | 4.71 | % | | | 5.02 | % | | | 4.58 | % | | | 3.85 | % | | | 3.22 | % |
Supplemental Data: | | | | | | | | | | | | | | | | | | | | |
Portfolio turnover rate | | | 224.1 | % | | | 286.8 | % | | | 237.2 | % | | | 81.6 | % | | | 238.0 | % |
Net assets, end of year (in thousands) | | $ | 7,715 | | | $ | 11,189 | | | $ | 11,052 | | | $ | 18,213 | | | $ | 9,546 | |
See notes to financial statements.
| | |
62 | | Annual Report to Shareholders |
Notes to Financial Statements
Legg Mason Income Trust, Inc.
| 1. | Organization and Significant Accounting Policies: |
Legg Mason Income Trust, Inc. (“Corporation”), consisting of the Investment Grade Income Portfolio (“Investment Grade”), and the Limited Duration Bond Portfolio (“Limited Duration”) (each a “Fund”), is registered under the Investment Company Act of 1940 (“1940 Act”), as amended, as an open-end, diversified investment company.
Investment Grade and Limited Duration each consist of two classes of shares: Primary Class and Institutional Class. The income and expenses of each of these Funds are allocated proportionately to the two classes of shares based on daily net assets, except for Rule 12b-1 distribution fees, which are charged only on Primary Class shares, and transfer agent and shareholder servicing expenses, which are determined separately for each class.
Preparation of the financial statements in accordance with accounting principles generally accepted in the United States of America requires management to make estimates and assumptions that affect the reported amounts and disclosures in the financial statements. Actual results could differ from those estimates. The following is a summary of significant accounting policies followed by the Fund in the preparation of its financial statements:
Investment Valuation
The Funds’ securities are valued under policies approved by and under the general oversight of the Board of Directors. Effective January 1, 2008, the Funds adopted Statement of Financial Accounting Standards No. 157 (FAS 157). FAS 157 establishes a single definition of fair value, creates a three-tier hierarchy as a framework for reporting methods of measuring fair value based on inputs used to value the Fund’s investments, and requires additional disclosure about fair value. The hierarchy of inputs is summarized below.
| | • | | Level 1 — quoted prices in active markets for identical investments |
| | • | | Level 2 — other significant observable inputs (including quoted prices for similar investments, interest rates, prepayment speeds, credit risk, etc.) |
| | • | | Level 3 — significant unobservable inputs (including the Fund’s own assumptions in determining the fair value of investments) |
Debt securities are valued at the last quoted bid prices provided by an independent pricing service that are based on transactions in debt obligations, quotations from bond dealers, market transactions in comparable securities and various other relationships between securities. Equity securities for which market quotations are available are valued at the last sale price or official closing price on the primary market or exchange
| | |
| Annual Report to Shareholders | | 63 |
on which they trade. Publicly traded foreign government debt securities are typically traded internationally in the over-the-counter market and are valued at the bid price as of the close of business of that market. When prices are not readily available, or are determined not to reflect fair value, such as when the value of a security has been significantly affected by events after the close of the exchange or market on which the security is principally traded, but before a Fund calculates its net asset value, the Fund may value these securities at fair value as determined in accordance with the procedures approved by the Corporation’s Board of Directors.
The inputs or methodology used for valuing securities are not necessarily an indication of the risk associated with investing in these securities.
The following is a summary of the inputs used in valuing the Fund’s assets carried at fair value:
Legg Mason Investment Grade
| | | | | | | | | | | | |
| | | December 31,
2008 | | Quoted Prices
(Level 1) | | Other Significant
Observable
Inputs
(Level 2) | | Significant
Unobservable
Inputs
(Level 3) |
Investments in Securities | | $ | 205,948,438 | | $ | 125,073 | | $ | 205,721,365 | | $ | 102,000 |
Other Financial Instruments* | | | 338,015 | | | 338,015 | | | — | | | — |
| | | | | | | | | | | | |
Total | | $ | 206,286,453 | | $ | 463,088 | | $ | 205,721,365 | | $ | 102,000 |
| | | | | | | | | | | | |
| * | Other financial instruments include written options and futures. |
The following is a reconciliation between the beginning and ending balances of investments in which significant unobservable inputs (Level 3) were used in determining fair value:
| | | | |
| | | Investments
in Securities | |
Balance as of December 31, 2007 | | $ | — | |
Net purchases (sales) | | | 1,425,316 | |
Accrued Premiums/Discounts | | | 18,353 | |
Change in unrealized appreciation (depreciation) | | | (1,341,669 | ) |
| | | | |
Balance as of December 31, 2008 | | $ | 102,000 | |
| | | | |
| | |
64 | | Annual Report to Shareholders |
Notes to Financial Statements — Continued
Legg Mason Income Trust, Inc. — Continued
Legg Mason Limited Duration
| | | | | | | | | | | | |
| | | December 31,
2008 | | Quoted Prices
(Level 1) | | Other Significant
Observable Inputs
(Level 2) | | Significant
Unobservable
Inputs
(Level 3) |
Investments in Securities | | $ | 102,042,406 | | $ | 22,624 | | $ | 101,812,737 | | $ | 207,045 |
Other Financial Instruments* | | | 1,396,201 | | | 1,396,201 | | | — | | | — |
| | | | | | | | | | | | |
Total | | $ | 103,438,607 | | $ | 1,418,825 | | $ | 101,812,737 | | $ | 207,045 |
| | | | | | | | | | | | |
| * | Other financial instruments include written options and futures. |
The following is a reconciliation between the beginning and ending balances of investments in which significant unobservable inputs (Level 3) were used in determining fair value:
| | | | |
| | | Investments
in Securities | |
Balance as of December 31, 2007 | | $ | — | |
Net purchases (sales) | | | 276,362 | |
Accrued Premiums/Discounts | | | 2,874 | |
Change in unrealized appreciation (depreciation) | | | (259,436 | ) |
Transfers in and/or out of Level 3 | | | 187,245 | |
| | | | |
Balance as of December 31, 2008 | | $ | 207,045 | |
| | | | |
Security Transactions
Security transactions are accounted for as of the trade date. Realized gains and losses from security transactions are reported on an identified cost basis for both financial reporting and federal income tax purposes.
For the year ended December 31, 2008, security transactions (excluding short-term investments) were as follows:
| | | | | | | | | | | | |
| | | Purchases | | Proceeds From Sales |
| | | US Gov’t. Securities | | Other | | US Gov’t. Securities | | Other |
Investment Grade | | $ | 2,866,213 | | $ | 46,676,554 | | $ | 6,785,808 | | $ | 140,558,131 |
Limited Duration | | $ | 299,437,104 | | $ | 16,701,924 | | $ | 334,855,525 | | $ | 21,184,677 |
| | |
| Annual Report to Shareholders | | 65 |
Repurchase Agreements
Each Fund may enter into repurchase agreements with institutions that its investment adviser has determined are creditworthy. Each repurchase agreement is recorded at cost. Under the terms of a typical repurchase agreement, a fund takes possession of an underlying debt obligation subject to an obligation of the seller to repurchase, and of the fund to resell, the obligation at an agreed-upon price and time, thereby determining the yield during a fund’s holding period. When entering into repurchase agreements, it is each Fund’s policy that its custodian acting on the Fund’s behalf, or a third party custodian take possession of the underlying collateral securities, the market value of which, at all times, at least equals the principal amount of the repurchase transaction, including accrued interest. To the extent that any repurchase transaction exceeds one business day, the value of the collateral is marked to market daily in an effort to ensure the adequacy of the collateral. If the counterparty defaults, a Fund generally has the right to use the collateral to satisfy the terms of the repurchase transaction. However, if the market value of the collateral declines during the period in which a Fund seeks to assert its rights or if bankruptcy proceedings are commenced with respect to the seller of the security, realization on the collateral by a Fund may be delayed or limited.
Options and Futures
The current market value of an exchange traded option is the last sale price or, in the absence of a sale, the price obtained by reference to broker-dealer quotations. Futures contracts are valued daily at the settlement price established by the board of trade or exchange on which they are traded. Futures contracts are marked-to-market on a daily basis. As the contract’s value fluctuates, payments known as variation margin are made or received by each Fund each day, depending on the daily fluctuation in the value of the contract. The daily changes in contract value are recorded as unrealized gains or losses, and a Fund recognizes a gain or loss when the contract is closed.
Investment Income and Distributions to Shareholders
Interest income and expenses are recorded on the accrual basis. Bond premiums and discounts are amortized for financial reporting and federal income tax purposes. Dividend income and distributions to shareholders are allocated at the class level and are recorded on the ex-dividend date. Dividends from net investment income are declared daily and paid monthly for each Fund. Net capital gain distributions, which are calculated at the Fund level, are declared and paid annually in December, to the extent necessary in order to comply with federal excise tax regulations. Distributions are determined in accordance with federal income tax regulations, which may differ from those determined in accordance with accounting principles generally accepted in the United States of America; accordingly, periodic reclassifications are made within the Funds’ capital accounts to reflect income and gains available for distribution under federal income tax regulations.
| | |
66 | | Annual Report to Shareholders |
Notes to Financial Statements — Continued
Legg Mason Income Trust, Inc. — Continued
Compensating Balance Credits
The Funds have an arrangement with their custodian bank, whereby a portion of the custodian’s fee is paid indirectly by credits earned on each Fund’s cash on deposit with the bank. This deposit arrangement is an alternative to purchasing overnight investments.
Credit and Market Risk
Investments in structured securities collateralized by residential real estate mortgages are subject to certain credit and liquidity risks. When market conditions result in an increase in default rates of the underlying mortgages and the foreclosure values of underlying real estate properties are materially below the outstanding amounts of the respective underlying mortgages, collection of accrued interest and principal on these investments may be doubtful. Such market conditions may significantly impair the value of these investments resulting in a lack of correlation between their credit ratings and values.
Other
In the normal course of business, the Funds enter into contracts that provide general indemnifications. Each Fund’s maximum exposure under these arrangements is dependent upon claims that may be made against the Funds in the future and, therefore, cannot be estimated; however, based on experience, the risk of material loss from such claims is considered remote.
It is the Funds’ policy to comply with the federal income and excise tax requirements of the Internal Revenue Code of 1986, as amended, applicable to regulated investment companies. Accordingly, each Fund intends to distribute substantially all of its taxable income and net realized gains, if any, to shareholders each year. Therefore, no federal income tax provision is required in the Funds’ financial statements.
Management has analyzed each Fund’s tax positions taken on federal income tax returns for all open tax years and has concluded that as of December 31, 2008, no provision for income tax would be required in the Funds’ financial statements. The Funds’ federal and state income and federal excise tax returns for tax years for which the applicable statutes of limitations have not expired are subject to examination by the Internal Revenue Service and state departments of revenue.
| | |
| Annual Report to Shareholders | | 67 |
Reclassifications:
Accounting principles generally accepted in the United States of America require that certain components of net assets be adjusted to reflect permanent differences between financial and tax reporting. These reclassifications have no effect on net assets or net asset values per share. During the current year, the following reclassifications have been made:
| | | | | | | | | | | | | | |
Fund | | | | | Overdistributed/
Undistributed Net
Investment Income | | Accumulated Net
Realized Loss | | | Paid-in Capital | |
Investment Grade | | (a | ) | | $ | 888 | | $ | (888 | ) | | | — | |
Limited Duration Bond | | (a | ) | | | 83,525 | | | (83,525 | ) | | | — | |
| | (b | ) | | | — | | | 3,082,149 | | | $ | (3,082,149 | ) |
(a) | Reclassifications are primarily due to losses from mortgage-backed securities treated as capital losses for tax purposes. |
(b) | Reclassifications are primarily due to the expiration of a capital loss carryover. |
Distributions to Shareholders:
Subsequent to the fiscal year end, the Funds have made the following distributions:
| | | | | | |
| Record Date | | Investment Grade |
Payable Date | | Primary Class | | Institutional Class |
Daily 1/30/2009 | | $ | 0.044651 | | $ | 0.048341 |
| |
| Record Date | | Limited Duration Bond |
Payable Date | | Primary Class | | Institutional Class |
Daily 1/30/2009 | | $ | 0.013374 | | $ | 0.021312 |
The tax character of distributions paid during the fiscal year ended December 31, 2008 were as follows:
| | | | | | |
| | | Investment
Grade | | Limited Duration
Bond |
Distributions paid from: | | | | | | |
Ordinary Income | | $ | 22,105,837 | | $ | 6,595,889 |
| | |
68 | | Annual Report to Shareholders |
Notes to Financial Statements — Continued
Legg Mason Income Trust, Inc. — Continued
The tax character of distributions paid during the fiscal year ended December 31, 2007 were as follows:
| | | | | | |
| | | Investment Grade | | Limited Duration
Bond |
Distributions paid from: | | | | | | |
Ordinary Income | | $ | 23,195,204 | | $ | 8,855,799 |
Net Long-term Capital Gains | | | 1,243,010 | | | — |
| | | | | | |
Total Distributions Paid | | $ | 24,438,214 | | $ | 8,855,799 |
| | | | | | |
Accumulated Earnings on a Tax Basis:
As of December 31, 2008, the components of accumulated earnings on a tax basis were as follows:
| | | | | | | | |
| | | Investment Grade | | | Limited Duration
Bond | |
Undistributed ordinary income-net | | $ | 837,810 | | | $ | 12,722 | |
Capital loss carry forward(*) | | | (5,674,653 | ) | | | (8,058,382 | ) |
Other book/tax temporary differences | | | (11,170,552 | )(a) | | | (2,782,382 | )(c) |
Unrealized appreciation/(depreciation) | | | (107,432,328 | )(b) | | | (35,763,721 | )(b) |
| | | | | | | | |
Total accumulated earnings/(losses)-net | | $ | (123,439,723 | ) | | $ | (46,591,763 | ) |
| | | | | | | | |
| (*) | During the taxable year ended December 31, 2008, the following fund utilized the indicated amount of its capital loss carryovers available from a previous year: |
| | | |
Limited Duration Bond | | $ | 750,785 |
As of the taxable year ended December 31, 2008, the following capital loss carryforwards are available:
| | | | | | | | |
Year of Expiration | | Investment Grade | | | Limited Duration
Bond | |
12/31/2012 | | $ | — | | | $ | (4,535,866 | ) |
12/31/2013 | | | — | | | | (554,986 | ) |
12/31/2014 | | | — | | | | (1,406,678 | ) |
12/31/2015 | | | (750,316 | ) | | | (1,560,852 | ) |
12/31/2016 | | | (4,924,337 | ) | | | — | |
| | | | | | | | |
| | $ | (5,674,653 | ) | | $ | (8,058,382 | ) |
| | | | | | | | |
These amounts will be available to offset any future taxable capital gains.
(a) | Other book/tax temporary differences are attributable primarily to the realization for tax purposes of unrealized losses on certain futures contracts, the deferral of post-October capital losses for tax purposes, difference between book/tax accrual of interest income on securities in default and book/tax differences in the timing of the deductibility of various expenses. |
| | |
| Annual Report to Shareholders | | 69 |
(b) | The difference between book-basis and tax-basis unrealized appreciation/ (depreciation) is attributable primarily to the tax deferral of losses on wash sales. |
(c) | Other book/tax temporary differences are attributable primarily to the tax deferral of losses on straddles, the realization for tax purposes of unrealized gains on certain futures contracts, the deferral of post- October capital losses for tax purposes, differences between book/tax accrual of interest income on securities in default and book/tax differences in the timing of the deductibility of various expenses. |
Tax Cost of investments:
As of December 31,2008, the aggregate cost of investments for federal income tax purposes were as follows:
| | | |
Investment Grade | | $ | 313,718,781 |
Limited Duration Bond | | | 139,202,328 |
Options and Futures
As part of their investment programs, the Funds may utilize options and futures. Options may be written (sold) or purchased by the Funds. When a Fund purchases a put or call option, the premium paid is recorded as an investment and its value is marked-to-market daily. When a Fund writes a put or call option, an amount equal to the premium received by the Fund is recorded as a liability and its value is marked-to-market daily.
When options, whether written or purchased, expire, are exercised or are closed (by entering into a closing purchase or sale transaction), the Fund realizes a gain or loss as described in the chart below:
| | |
Purchased option: | | Impact on the Fund: |
The option expires | | Realize a loss in the amount of the cost of the option. |
The option is closed through a closing sale transaction | | Realize a gain or loss depending on whether the proceeds from the closing sale transaction are greater or less than the cost of the option. |
| |
The Fund exercises a call option | | The cost of the security purchased through the exercise of the option will be increased by the premium originally paid to purchase the option. |
| |
The Fund exercises a put option | | Realize a gain or loss from the sale of the underlying security. The proceeds of that sale will be reduced by the premium originally paid to purchase the put option. |
| | |
70 | | Annual Report to Shareholders |
Notes to Financial Statements — Continued
Legg Mason Income Trust, Inc. — Continued
| | |
Purchased option: | | Impact on the Fund: |
Written option: | | Impact on the Fund: |
| |
The option expires | | Realize a gain equal to the amount of the premium received. |
| |
The option is closed through a closing purchase transaction | | Realize a gain or loss without regard to any unrealized gain or loss on the underlying security and eliminate the option liability. The Fund will realize a loss in this transaction if the cost of the closing purchase exceeds the premium received when the option was written. |
| |
A written call option is exercised by the option purchaser | | Realize a gain or loss from the sale of the underlying security. The proceeds of that sale will be increased by the premium originally received when the option was written. |
| |
A written put option is exercised by the option purchaser | | The amount of the premium originally received will reduce the cost of the security that the Fund purchased when the option was exercised. |
The risk associated with purchasing options is limited to the premium originally paid. Options written by a Fund involve, to varying degrees, risk of loss in excess of the option value reflected in the statement of net assets. The most commonly realized risk in writing a covered call option is that a Fund may forgo the opportunity to profit if the market price of the underlying security increases and the option is exercised. The most commonly realized risk in writing a put option is that a Fund may incur a loss if the market price of the underlying security decreases and the option is exercised. In addition, there is the risk a Fund may not be able to enter into a closing transaction because of an illiquid secondary market or, for over-the-counter options, because of the counterparty’s inability or unwillingness to perform.
Activity in written call and put options during the year ended December 31, 2008, was as follows:
| | | | | | | |
Limited Duration: | | Actual
Contracts | | | Premiums | |
Options outstanding at December 31, 2007 | | 128 | | | $ | 80,610 | |
Options written | | 1,120 | | | | 642,897 | |
Options closed | | (745 | ) | | | (342,859 | ) |
Options expired | | (33 | ) | | | (12,773 | ) |
Options exercised | | (118 | ) | | | (68,472 | ) |
| | | | | | | |
Options outstanding at December 31, 2008 | | 352 | | | $ | 299,403 | |
| | | | | | | |
| | |
| Annual Report to Shareholders | | 71 |
Upon entering into a futures contract, each Fund is required to deposit with the broker cash or cash equivalents in an amount equal to a certain percentage of the contract amount. This is known as the “initial margin.” Subsequent payments (“variation margin”) are made or received by the Fund each day, depending on the daily fluctuation in the value of the contract. The daily changes in contract value are recorded as unrealized gains or losses. The Fund realizes a gain or loss when the contract is closed. Futures contracts are valued daily at the settlement price established by the board of trade or exchange on which they are traded.
The Funds enter into futures contracts as a hedge against anticipated changes in interest rates. There are several risks in connection with the use of futures contracts as a hedging device. Futures contracts involve, to varying degrees, risk of loss in excess of the amounts reflected in the financial statements. The change in the value of futures contracts primarily corresponds with the value of their underlying instruments, which may not correlate with the change in the value of the hedged instruments. In addition, there is the risk that a Fund may not be able to enter into a closing transaction because of an illiquid secondary market.
The open futures positions and related appreciation or depreciation at December 31, 2008 are listed at the end of each Fund’s portfolio of investments.
Swap Agreements
The Funds may invest in swaps for the purpose of managing their exposure to interest rate, credit or market risk, or for other purposes. The use of swaps involves risks that are different from those associated with ordinary portfolio transactions.
Each Fund may enter into credit default swap (“CDS”) contracts for investment purposes, to manage its credit risk or to add leverage. CDS agreements involve one party making a stream of payments to another party in exchange for the right to receive a specified return in the event of a default by a third party, typically corporate issuers or sovereign issuers of an emerging country, on a specified obligation or in the event of a write-down, principal shortfall, interest shortfall or default of all or part of the referenced entities comprising a credit index. Each Fund may use a CDS to provide a measure of protection against defaults of the issuers (i.e., to reduce risk where a Fund has exposure to the sovereign issuer) or to take an active long or short position with respect to the likelihood of a particular issuer’s default. As a seller of protection, the Fund generally receives an upfront payment or a stream of payments throughout the term of the swap provided that there is no credit event. If the Fund is a seller of protection and a credit event occurs, as defined under the terms of that particular swap agreement, the maximum potential amount of future payments (undiscounted) that the Fund could be required to make under a credit default swap agreement, would be an amount equal to the notional amount of the agreement. These amounts of potential
| | |
72 | | Annual Report to Shareholders |
Notes to Financial Statements — Continued
Legg Mason Income Trust, Inc. — Continued
payments will be partially offset by any recovery of values from the respective referenced obligations. As a seller of protection, the Fund effectively adds leverage to its portfolio because, in addition to its total net assets, the Fund would be subject to investment exposure on the notional amount of the swap. As a buyer of protection, the Fund generally receives an amount up to the notional value of the swap if a credit event occurs.
Implied spreads are the theoretical price a lender receives for credit default protection. When spreads rise, market perceived credit risk rises and when spreads fall, market perceived credit risk falls. The implied credit spread of a particular referenced entity reflects the cost of buying/selling protection and may include upfront payments required to enter into the agreement. Wider credit spreads and decreasing market values, when compared to the notional amount of the swap, represent a deterioration of the referenced entity’s credit soundness and a greater likelihood or risk of default or other credit event occurring as defined under the terms of the agreement. Credit spreads utilized in determining the period end market value of credit default swap agreements on corporate issues or sovereign issues of an emerging country are disclosed in the Notes to Financial Statements and serve as an indicator of the current status of the payment/ performance risk and represent the likelihood or risk of default for credit derivatives. For credit default swap agreements on asset-backed securities and credit indices, the quoted market prices and resulting values particularly in relation to the notional amount of the contract, as well as the annual payment rate serve as an indication of the current status of the payment/performance risk.
Payments received or made at the beginning of the measurement period are reflected as a premium or deposit, respectively, on the Statement of Assets and Liabilities. These upfront payments are amortized over the life of the swap and are recognized as realized gain or loss on the Statement of Operations. A liquidation payment received or made at the termination of the swap is recognized as realized gain or loss on the Statement of Operations. Net periodic payments received or paid by the Fund are recognized as realized gain or loss at the time of receipt or payment on the Statement of Operations.
Entering into a CDS agreement involves, to varying degrees, elements of credit, market and documentation risk in excess of the related amounts recognized on the Statement of Assets and Liabilities. Such risks involve the possibility that there will be no liquid market for these agreements, that the counterparty to the agreement may default on its obligation to perform or disagree as to the meaning of the contractual terms in the agreement, and that there will be unfavorable changes in net interest rates.
Swaps are marked to market daily, and changes in value are recorded as unrealized appreciation/(depreciation). Gains or losses are realized upon termination of the swap agreement. Periodic payments and premiums received or made by a Fund are recorded in the accompanying Statements of Operations as realized gains or losses, respectively.
| | |
| Annual Report to Shareholders | | 73 |
Collateral, in the form of restricted cash or securities, may be required to be held in segregated accounts with the Funds’ custodian in compliance with swap contracts. Risks may exceed amounts recognized on the statements of assets and liabilities. These risks include changes in the returns of the underlying instruments, failure of the counter-parties to perform under the contracts’ terms, and the possible lack of liquidity with respect to the swap agreements.
As of December 31, 2008, the Funds held no Swaps.
| 4. | Transactions With Affiliates: |
Each Fund has an investment management agreement with Legg Mason Fund Adviser, Inc. (“LMFA”). Pursuant to their respective agreements, LMFA provides the Funds with management and administrative services for which each Fund pays a fee, computed daily and payable monthly, at annual rates of each Fund’s average daily net assets shown in the table below. LMFA has contractually agreed to waive its fees to the extent Limited Duration’s expenses (exclusive of taxes, interest, brokerage and extraordinary expenses) exceed during any month certain annual rates of the Fund’s average daily net assets. These contractual expense limitations are due to expire on April 30, 2009. LMFA has voluntarily agreed to waive fees to the extent that Investment Grade’s expenses (exclusive of taxes, interest, brokerage and extraordinary expenses) exceed during any month certain annual rates. This voluntary waiver is currently expected to continue until April 30, 2009, but may be terminated at any time. Pursuant to an agreement approved by the Board, Limited Duration agreed to repay LMFA for waived fees and reimbursed expenses provided that payment does not cause operating expenses to exceed 1.00% of the Primary Class’s average net assets and 0.50% of the Institutional Class’s average net assets and the payment is made within three years after the year in which LMFA earned the fee or incurred the expense. The following chart shows annual rates of management fees, expense limits, and management fees waived, for each Fund:
| | | | | | | | | | | | | |
Fund | | Management
Fee | | | Expense
Limitation | | | Year Ended
December 31,
2008
Management
Fees Waived | | | Maximum
Amount
Subject to
Recapture |
Investment Grade | | | | | | | | | | | | | |
— Primary Class | | 0.60 | % | | 1.00 | % | | $ | (738,099 | ) | | $ | 2,422,595 |
— Institutional Class | | 0.60 | % | | 0.50 | % | | | (34,995 | ) | | | 135,719 |
Limited Duration | | | | | | | | | | | | | |
— Primary Class | | 0.45 | % | | 1.00 | % | | $ | (187,628 | ) | | $ | 659,385 |
— Institutional Class | | 0.45 | % | | 0.50 | % | | | (13,904 | ) | | | 47,263 |
Western Asset Management Company (“Adviser”) serves as investment adviser to the Funds. The Adviser is responsible for the actual investment activity of each Fund.
| | |
74 | | Annual Report to Shareholders |
Notes to Financial Statements — Continued
Legg Mason Income Trust, Inc. — Continued
LMFA pays the Adviser a fee, computed daily and payable monthly, at an annual rate of 40% of the management fee received by LMFA for Investment Grade. For Limited Duration, LMFA pays the Adviser a fee, computed daily and payable monthly, of 0.20% of the Fund’s average daily net assets, not to exceed the fee received by LMFA after any fee waivers.
Legg Mason Investor Services, LLC (“LMIS”) serves as distributor of the Funds. LMIS receives an annual distribution fee and an annual service fee based on each Fund’s Primary Class’s average daily net assets, computed daily and payable monthly as shown in the table below. For the year ended December 31, 2008, LMIS waived $152,873 and $108,020 of the distribution and service fees for Investment Grade and Limited Duration, respectively.
| | | | | | |
Fund | | Distribution
Fee | | | Service
Fee | |
Investment Grade | | 0.25 | % | | 0.25 | % |
Limited Duration | | 0.25 | % | | 0.25 | % |
LMFA, the Adviser, and LMIS are corporate affiliates and wholly owned subsidiaries of Legg Mason, Inc.
Under a Deferred Compensation Plan (“Plan”), directors may elect to defer receipt of all or a specified portion of their compensation. A participating director may select one or more funds in which his or her deferred director’s fees will be deemed to be invested. Deferred amounts remain in the funds until distributed in accordance with the Plan.
The Funds, along with certain other Legg Mason Funds, participate in a $400 million line of credit (“Credit Agreement”) to be used for temporary or emergency purposes. Pursuant to the Credit Agreement, each participating fund is liable only for principal and interest payments related to borrowings made by that fund. Borrowings under the Credit Agreement bear interest at a rate equal to the prevailing federal funds rate plus the federal funds rate margin. The Funds did not utilize the line of credit during the year ended December 31, 2008.
| | |
| Annual Report to Shareholders | | 75 |
| 6. | Fund Share Transactions: |
At December 31, 2008, there were 100,000,000 shares authorized at $.001 par value for each of the Primary and Financial Intermediary Classes of Investment Grade and Limited Duration, and 50,000,000 shares authorized at $.001 par value for each of their Institutional Classes. Share transactions for the Funds were as follows:
Investment Grade Income Portfolio
| | | | | | | | | | | | | | |
| | | Year Ended
December 31, 2008 | | | Year Ended
December 31, 2007 | |
| | | Shares | | | Amount | | | Shares | | | Amount | |
Primary Class | | | | | | | | | | | | | | |
Shares sold | | 5,602,244 | | | $ | 51,251,221 | | | 10,373,591 | | | $ | 107,619,637 | |
Shares issued on reinvestment | | 2,367,708 | | | | 20,528,846 | | | 1,914,513 | | | | 19,726,308 | |
Shares repurchased | | (17,235,188 | ) | | | (148,299,211) | | | (12,697,523 | ) | �� | | (130,997,575 | ) |
| | | | | | | | | | | | | | |
Net Decrease | | (9,265,236) | | | $ | (76,519,144) | | | (409,419 | ) | | $ | (3,651,630) | |
| | | | | | | | | | | | | | |
Institutional Class | | | | | | | | | | | | | | |
Shares sold | | 697,516 | | | $ | 5,974,142 | | | 4,021,567 | | | $ | 41,398,237 | |
Shares issued on reinvestment | | 119,333 | | | | 1,033,284 | | | 173,253 | | | | 1,772,017 | |
Shares repurchased | | (4,162,393 | ) | | | (40,423,902 | ) | | (555,055 | ) | | | (5,679,440 | ) |
| | | | | | | | | | | | | | |
Net Increase (Decrease) | | (3,345,544 | ) | | $ | (33,416,476 | ) | | 3,639,765 | | | $ | 37,490,814 | |
| | | | | | | | | | | | | | |
| | | | |
| Limited Duration Bond Portfolio | | | | | | | | | | | | | | |
| | | Year Ended
December 31, 2008 | | | Year Ended
December 31, 2007 | |
| | | Shares | | | Amount | | | Shares | | | Amount | |
Primary Class | | | | | | | | | | | | | | |
Shares sold | | 2,349,770 | | | $ | 21,834,372 | | | 2,517,235 | | | $ | 25,588,486 | |
Shares issued on reinvestment | | 660,072 | | | | 6,003,189 | | | 751,053 | | | | 7,616,464 | |
Shares repurchased | | (7,637,193 | ) | | | (70,055,617 | ) | | (5,274,330 | ) | | | (53,506,012 | ) |
| | | | | | | | | | | | | | |
Net Decrease | | (4,627,351 | ) | | $ | (42,218,056 | ) | | (2,006,042 | ) | | $ | (20,301,062 | ) |
| | | | | | | | | | | | | | |
Institutional Class | | | | | | | | | | | | | | |
Shares sold | | 694,527 | | | $ | 6,452,975 | | | 570,046 | | | $ | 5,775,650 | |
Shares issued on reinvestment | | 55,370 | | | | 501,071 | | | 44,813 | | | | 454,047 | |
Shares repurchased | | (901,485 | ) | | | (8,140,926 | ) | | (574,158 | ) | | | (5,762,209 | ) |
| | | | | | | | | | | | | | |
Net Increase (Decrease) | | (151,588) | | | $ | (1,186,880 | ) | | 40,701 | | | $ | 467,488 | |
| | | | | | | | | | | | | | |
| | |
76 | | Annual Report to Shareholders |
Notes to Financial Statements — Continued
Legg Mason Income Trust, Inc. — Continued
| 7. | Recent Accounting Pronouncements |
In March 2008, the FASB issued Statement of Financial Accounting Standards No. 161, Disclosures about Derivative Instruments and Hedging Activities (FAS 161). FAS 161 is effective for fiscal years and interim periods beginning after November 15, 2008. FAS 161 requires enhanced disclosures about each Fund’s derivative and hedging activities, including how such activities are accounted for and their effect on the Fund’s financial position, performance and cash flows. Management is currently evaluating the impact the adoption of FAS 161 will have on the Fund’s Financial Statements and related disclosures.
| | |
| Annual Report to Shareholders | | 77 |
Report of Independent Registered Public Accounting Firm
To the Board of Directors of Legg Mason Income Trust, Inc. and to the Shareholders of Investment Grade Income Portfolio and Limited Duration Bond Portfolio:
In our opinion, the accompanying statements of assets and liabilities, including the portfolios of investments, and the related statements of operations and of changes in net assets and the financial highlights present fairly, in all material respects, the financial position of Investment Grade Income Portfolio and Limited Duration Bond Portfolio (two of the Portfolios comprising Legg Mason Income Trust, Inc., the “Funds”) at December 31, 2008, the results of their operations, the changes in their net assets, and the financial highlights for each of the periods presented, in conformity with accounting principles generally accepted in the United States of America. These financial statements and financial highlights (hereafter referred to as “financial statements”) are the responsibility of the Funds’ management; our responsibility is to express an opinion on these financial statements based on our audits. We conducted our audits of these financial statements in accordance with the standards of the Public Company Accounting Oversight Board (United States). Those standards require that we plan and perform the audit to obtain reasonable assurance about whether the financial statements are free of material misstatement. An audit includes examining, on a test basis, evidence supporting the amounts and disclosures in the financial statements, assessing the accounting principles used and significant estimates made by management, and evaluating the overall financial statement presentation. We believe that our audits, which included confirmation of securities at December 31, 2008 by correspondence with the custodian and brokers, provide a reasonable basis for our opinion.
PricewaterhouseCoopers LLP
Baltimore, Maryland
February 27, 2009
| | |
78 | | Annual Report to Shareholders |
Important Tax Information (Unaudited)
The following information is provided with respect to the distributions paid during the taxable year ended December 31, 2008:
| | | |
| | | Limited Duration
Bond | |
| Record Date: | | Daily | |
Payable Date: | | Monthly | |
Ordinary Income: | | | |
Qualified Dividend Income for Individuals | | 0.80 | % |
| | | |
The following information is provided for shareholders who are not residents of the United States:
| | | | | | |
| | | Investment
Grade | | | Limited Duration
Bond | |
| Record Date: | | Daily | | | Daily | |
Payable Date: | | Monthly | | | Monthly | |
Qualified Interest Income | | 79.13 | % | | 88.77 | % |
| | | | | | |
Please retain this information for your records.
| | |
| Annual Report to Shareholders | | 79 |
Directors and Officers
The table below provides information about the Corporation’s directors and officers, including biographical information about their business experience and information about their relationships with Legg Mason, Inc. and its affiliates. The mailing address of each director and officer is 100 Light Street, Attn: Fund Secretary c/o Legal and Compliance Department, 32nd Floor, Baltimore, Maryland 21202.
| | | | | | | | |
Name,
(Year of Birth) and Position with Corporation | | Term of Office
and
Length of Time
ServedA | | Number of Funds in
Fund Complex
Overseen | | Other
Directorships
Held | | Principal Occupation(s)
During the Past Five Years |
| INDEPENDENT DIRECTORS:B |
Hearn,Ruby P. (1940) Director | | Since 2004 | | 14 | | None | | Senior Vice President Emerita of The Robert Wood Johnson Foundation (non-profit) since 2001. Formerly: Senior Vice President of The Robert Wood Johnson Foundation (1996-2001). |
| | | | |
Lehman, Arnold L. (1944) Lead Independent Director | | Since 1987 | | 14 | | None | | Director of the Brooklyn Museum since 1997; Trustee of American Federation of Arts since 1998. Formerly: Director of The Baltimore Museum of Art (1979-1997). |
| | | | |
Masters, Robin J.W. (1955)
Director | | Since 2002 | | 14 | | Director of Cheyne Capital International Limited (investment advisory firm). Director/Trustee of Legg Mason Asian Funds plc, Legg Mason Institutional Funds plc, Western Asset Fixed Income Funds plc, and Western Asset Debt Securities plc. | | Retired. Formerly: Chief Investment Officer of ACE Limited (insurance) (1986-2000). |
| | |
80 | | Annual Report to Shareholders |
Directors and Officers — Continued
| | | | | | | | |
Name, (Year of Birth) and Position with Corporation | | Term of Office and Length of Time ServedA | | Number of Funds in
Fund Complex Overseen | | Other Directorships Held | | Principal Occupation(s) During the Past Five Years |
McGovern, Jill E. (1944) Director | | Since 1989 | | 14 | | None | | Senior Consultant, American Institute for Contemporary German Studies (AICGS) since 2007. Formerly: Chief Executive Officer of The Marrow Foundation (non-profit) (1993- 2007); Executive Director of the Baltimore International Festival (1991-1993); Senior Assistant to the President of The Johns Hopkins University (1986-1990). |
| | | | |
Mehlman, Arthur S. (1942) Director | | Since 2002 | | Director/Trustee of all Legg Mason Funds consisting of 14 portfolios; Director/Trustee of the Royce Family of Funds consisting of 28 portfolios. | | Director of Municipal Mortgage & Equity, LLC. | | Retired. Formerly: Partner, KPMG LLP (international accounting firm) (1972-2002). |
| | | | |
O’Brien, G. Peter (1945) Director | | Since 2002 | | Director/Trustee of all Legg Mason Funds consisting of 14 portfolios; Director/Trustee of the Royce Family of Funds consisting of 28 portfolios. | | Director of Technology Investment Capital Corp. | | Retired. Trustee Emeritus of Colgate University; Board Member, Hill House, Inc. (residential home care); Board Member, Bridges School (pre-school). Formerly: Managing Director, Equity Capital Markets Group of Merrill Lynch & Co. (1971-1999). |
| | | | |
Rowan, S. Ford (1943) Director | | Since 2002 | | 14 | | None | | Chairman, National Center for Critical Incident Analysis, National Defense University, since 2004; Professional Lecturer in Organizational Sciences, The George Washington University, since 2008. Formerly: Consultant, Rowan & Blewitt Inc. (management consulting) (1984-2007). |
| | |
| Annual Report to Shareholders | | 81 |
| | | | | | | | |
Name, (Year of Birth) and Position with Corporation | | Term of Office and Length of Time
ServedA | | Number of Funds in
Fund Complex
Overseen | | Other Directorships Held | | Principal Occupation(s) During the Past Five Years |
Tarola, Robert M. (1950) Director | | Since 2004 | | 14 | | TeleTech Holdings, Inc. (business process outsourcing) | | President of Right Advisory, LLC (corporate finance and governance consulting) since 2008; Formerly: Senior Vice President and Chief Financial Officer of W. R. Grace & Co. (specialty chemicals and materials) (1999-2008), and of MedStar Health, Inc. (hospitals and healthcare) (1996 to 1999); Partner, PriceWaterhouse LLP (accounting and auditing) from (1984 to 1996) |
| INTERESTED DIRECTORS:C |
Fetting, Mark R. (1954) Chairman and Director | | Director since 2002 and Chairman since 2008. | | Chairman and Director/Trustee of all Legg Mason Funds consisting of 14 portfolios; Director/Trustee of the Royce Family of Funds consisting of 28 portfolios. | | None | | President, CEO, Chairman of Legg Mason, Inc. and Chairman of Legg Mason Funds since 2008. Formerly: President of all Legg Mason Funds (2001- 2008). Senior Executive Vice President of Legg Mason, Inc., Director and/or officer of various Legg Mason, Inc. affiliates (2000-2008). Division President and Senior Officer of Prudential Financial Group, Inc. and related companies, including fund boards and consulting services to subsidiary companies (1991- 2000); Partner, Greenwich Associates (financial consulting); Vice President, T. Rowe Price Group, Inc. |
| | |
82 | | Annual Report to Shareholders |
Directors and Officers — Continued
| | | | | | | | |
Name, (Year of Birth) and Position with Corporation | | Term of Office and Length of Time
ServedA | | Number of Funds in
Fund Complex
Overseen | | Other Directorships Held | | Principal Occupation(s) During the Past Five Years |
Odenath, David R. 1957 President and Director | | Since 2008 | | 14 | | None | | Senior Executive Vice President of Legg Mason, Inc. and President of Legg Mason Funds since 2008. Formerly: President of Prudential Annuities (since August 2002); Executive Vice President (since May 2003) of American Skandia Investment Services, Inc; Chief Executive Officer and Director (since May 2003) of American Skandia Life Assurance Corporation, American Skandia Information Services and Technology Corporation and Skandia U.S. Inc; President, Chief Executive Officer and Director (since May 2003) of American Skandia Marketing, Inc.; Formerly President, Chief Executive Officer, Chief Operating Officer and Officer-In-Charge (1999-2003) of PI; Senior Vice President (since June 1999) of Prudential; formerly Senior Vice President (August 1993- May 1999) of Paine Webber Group, Inc. |
| | |
| Annual Report to Shareholders | | 83 |
| | | | | | | | |
Name, (Year of Birth) and Position with Corporation | | Term of Office
and Length of Time
ServedA | | Number of
Funds in Fund
Complex
Overseen | | Other
Directorships
Held | | Principal Occupation(s) During the Past Five Years |
| EXECUTIVE OFFICERS: | | | | | | |
Karpinski, Marie K. (1949) Vice President and Chief Financial Officer | | Since 1987 | | 14 | | None | | Vice President and Chief Financial Officer of all Legg Mason Funds. Vice President and Treasurer of Legg Mason Fund Adviser, Inc.; Vice President and Principal Financial and Accounting Officer of Western Asset Funds, Inc., Western Asset Income Fund and Western Asset Premier Bond Fund; Treasurer and Principal Financial and Accounting Officer of Western Asset/Claymore U.S. Treasury Inflation Protected Securities Fund (2003-present), and Western Asset/Claymore U.S. Treasury Inflation Protected Securities Fund 2 (2004-present). |
| | | | |
Merz, Gregory T. (1958) Vice President and Chief Legal Officer | | Since 2003 | | 14 | | None | | Vice President and Deputy General Counsel of Legg Mason, Inc. since 2003. Formerly: Associate General Counsel, Fidelity Investments (1993- 2002). |
| | |
84 | | Annual Report to Shareholders |
Directors and Officers — Continued
| | | | | | | | |
Name, (Year of Birth) and Position with Corporation | | Term of Office
and Length of Time
ServedA | | Number of Funds in Fund Complex
Overseen | | Other
Directorships
Held | | Principal Occupation(s) During the Past Five Years |
Becker, Ted P. (1951) Vice President and Chief Compliance Officer | | Since 2007 | | 14 | | None | | Director of Global Compliance at Legg Mason (2006 to present); Managing Director of Compliance at Legg Mason & Co. (2005 to present); Chief Compliance Officer with certain mutual funds associated with Legg Mason & Co. (since 2006); Chief Compliance Officer of Legg Mason Partners Fund Adviser and certain affiliates; Managing Director of Compliance at Citigroup Asset Management (2002 to 2005). Prior to 2002, Managing Director- Internal Audit & Risk Review at Citigroup Inc. |
| | | | |
Wachterman, Richard M. (1947) Secretary | | Since 2004 | | 14 | | None | | Associate General Counsel of Legg Mason, Inc. since 2004. Formerly: Managing Director, Victory Capital Management, Inc. (investment management) (1993- 2003). |
| | |
| Annual Report to Shareholders | | 85 |
| | | | | | | | |
Name, (Year of Birth) and Position with Corporation | | Term of Office
and Length of Time
ServedA | | Number of Funds in
Fund Complex
Overseen | | Other
Directorships
Held | | Principal Occupation(s) During the Past Five Years |
Morris, Erin K. (1966) Treasurer | | Since 2006 | | 3 | | None | | Vice President and Manager, Global Funds Administration, Legg Mason & Co., LLC (2005-present); Assistant Vice President of Legg Mason Wood Walker, Incorporated (2002- 2005); Treasurer of Legg Mason Income Trust, Inc., Legg Mason Tax- Free Income Fund, Western Asset Income Fund, Western Asset Premier Bond Fund and Western Asset Funds, Inc. (2006-present); Assistant Treasurer, Legg Mason Partners Fund fixed income complex (2007-present). Western Asset/Claymore Inflation-Linked Securities & Income Fund (2003-present); Western Asset/Claymore Inflation-Linked Opportunities & Income Fund (2004-present); Assistant Treasurer, the Corporation, Western Asset Income Fund, Western Asset Premier Bond Fund, Legg Mason Income Trust, Inc. and Legg Mason Tax-Free Income Fund (2001- 2006): Manager, Funds Accounting, Legg Mason Wood Walker, Incorporated (2000- 2005). |
| | |
86 | | Annual Report to Shareholders |
Directors and Officers — Continued
ADDITIONAL INFORMATION ABOUT THE CORPORATION’S DIRECTORS AND OFFICERS IS CONTAINED IN THE STATEMENT OF ADDITIONAL INFORMATION, AVAILABLE WITHOUT CHARGE UPON REQUEST BY CALLING 1-800-822-5544 OR ON THE SECURITIES AND EXCHANGE COMMISSION WEBSITE (http://www.sec.gov).
A | Directors of the Corporation serve a term of indefinite length until their retirement, in accordance with the Board’s retirement policy, resignation or removal and stand for re-election by shareholders only as and when required by the 1940 Act. Officers of the Corporation are elected annually to serve until their successors are elected and qualified. |
B | Each of the Independent Directors serves on the standing committees of the Board of Directors, which include the Audit Committee (chair: Arthur Mehlman), the Nominating Committee (co-chairs: Peter O’Brien and Jill McGovern), and the Independent Directors Committee (chair: Arnold Lehman). |
C | Mr. Fetting and Mr. Odenath are considered to be interested persons, as defined in the 1940 Act, of the Corporation on the basis of their employment with the Funds’ adviser or their affiliated entities (including the Funds’ principal underwriter) or Legg Mason, Inc., the parent holding company of those entities, as well as their ownership of Legg Mason, Inc. stock. |
D | Officers of the Corporation are interested persons (as defined in the 1940 Act). |
| | |
| Annual Report to Shareholders | | 87 |
Board Consideration of Legg Mason Income Trust, Inc.’s Investment Advisory Agreements and Management Agreements
At its November 2008 meeting, the Board of Directors (the “Board”), including all of the Independent Directors, approved the continuation of the Management Agreements between Legg Mason Fund Adviser, Inc. (the “Manager”) and Legg Mason Income Trust, Inc., on behalf of Legg Mason Limited Duration Bond Portfolio and Legg Mason Investment Grade Income Portfolio (each, a “Fund”), and the Investment Advisory Agreements between the Manager and Western Asset Management Company (the “Adviser”) for each Fund (each an “Agreement”). In voting to approve the continuation of each Agreement, the Board considered whether continuance would be in the best interest of the relevant Fund and its shareholders, an evaluation largely based on the nature and quality of the services provided under each Agreement and the overall fairness of each Agreement to the relevant Fund. In considering each Agreement, the Board did not identify any single factor or item of information as all-important or controlling. Based on its evaluation of all material factors, including those described below, the Board concluded that the terms of each Agreement are reasonable and fair and that the continuation of each Agreement is in the best interest of the relevant Fund and its shareholders.
Prior to the Board action, the Independent Directors met as a committee, together with experienced 1940 Act counsel, to consider their recommendation as to continuance of each Agreement. As part of the process to consider each Agreement, legal counsel to each Fund requested certain information from the Manager and the Adviser on behalf of the Independent Directors, and in response, the Manager and the Adviser provided extensive reports that addressed specific factors designed to inform the Board’s consideration of each Agreement. Counsel also provided the Independent Directors and the Board with a memorandum detailing their responsibilities pertaining to the continuance of each Agreement.
In addition to the November meeting, the Independent Directors met in executive session in October 2008, at which time they reviewed and analyzed materials relating to each Agreement. The Independent Directors also retained independent consultants to assist them in their review and analysis of each Agreement. The Board meets at least another three times per year in order to oversee the Legg Mason Funds, including meetings at which the portfolio managers of each Fund or others make presentations and discuss performance, compliance and other applicable issues. The Board also drew upon its long association with the Manager, the Adviser and their personnel and the Board members’ familiarity with their culture and the manner in which the management entities have sought to strengthen and enhance themselves.
| | |
88 | | Annual Report to Shareholders |
With respect to the nature, scope and quality of the services provided, the Board considered the experience and commitment of the Manager’s and the Adviser’s personnel and their efforts to build and support a strong service team. The Board also considered the nature and quality of the Adviser’s investment process. In assessing performance, the Board compared the returns of each Fund to the average of an appropriate Lipper category, a specified benchmark index and a peer group of investment companies pursuing similar strategies, all over multiple time periods. The Board considered very carefully each Fund’s performance and discussed with the Manager and the Adviser steps that the Manager and the Adviser had taken, or intended to take, to improve performance. The Board considered whether a reduction in assets under management would adversely affect the resources available to the Manager and the Adviser. The Board also considered the level of service provided by the Manager to each Fund, including oversight of the transfer agent and the custodian and preparation of regulatory filings. The Board considered the Adviser’s procedures for executing portfolio transactions for each Fund. The Board also reviewed the Adviser’s policies and procedures for the selection of brokers and dealers and on obtaining research from brokers.
In determining whether the terms of each Agreement are reasonable and fair, the Board considered the terms and fee structure of each Agreement. In that connection, the Board considered the costs to the Manager and the Adviser in providing services to each Fund and profitability for the Manager and its affiliates from their overall association with each Fund. The Board reviewed information about the advisory fee schedule and overall expense ratio of each Fund and comparable fee schedules and expense ratios of a peer group of funds. In considering whether any economies of scale experienced by the Manager in providing services to each Fund were shared with that Fund, the Board noted that, while each Fund’s advisory fee structure does not provide for a reduction of payments, the current fees appear fair and reasonable in relation to the present asset size of each Fund and the Manager has contractually agreed to waive fees for Legg Mason Limited Duration Bond Portfolio and has voluntarily waived fees for Legg Mason Investment Grade Income Portfolio. The Board also compared the advisory fee schedule for each Fund to the advisory fees charged by the Manager and the Adviser to its other accounts managed in a similar style. In that connection, the Board considered the differences in the level of services provided and the differences in responsibility of the Manager and the Adviser to each Fund and to the other accounts. Finally, the Board considered other benefits accruing to the Manager, the Adviser and their affiliates by virtue of their relationship to each Fund.
After an evaluation of all material factors, including those in the foregoing discussion, the Board concluded that the continuation of each Agreement is in the best interest of the relevant Fund.
Fund Information
Investment Manager
Legg Mason Fund Adviser, Inc.
Baltimore, MD
Investment Adviser
Western Asset Management Company
Pasadena, CA
Board of Directors
Mark R. Fetting, Chairman
David R. Odenath, President
Dr. Ruby P. Hearn
Arnold L. Lehman
Robin J.W. Masters
Dr. Jill E. McGovern
Arthur S. Mehlman
G. Peter O’Brien
S. Ford Rowan
Robert M. Tarola
Officers
Marie K. Karpinski, Vice President and Chief Financial Officer
Gregory T. Merz, Vice President and Chief Legal Officer
Ted P. Becker, Vice President and Chief Compliance Officer
Erin K. Morris, Treasurer
Susan C. Curry, Assistant Treasurer
Richard M. Wachterman, Secretary
Peter J. Ciliberti, Assistant Secretary
Transfer and Shareholder Servicing Agent
Boston Financial Data Services
Braintree, MA
Custodian
State Street Bank & Trust Company
Boston, MA
Counsel
K&L Gates LLP
Washington, DC
Independent Registered Public Accounting Firm
PricewaterhouseCoopers LLP
Baltimore, MD
About the Legg Mason Funds
| | |
| |
Equity Funds American Leading Companies Trust Classic Valuation Fund Growth Trust Special Investment Trust US Small-Capitalization Value Trust Value Trust | | Legg Mason, Inc., based in Baltimore, Maryland, has built its reputation, at least in part, on the success of the Legg Mason Funds, introduced in 1979. The primary purpose of our funds is to enable investors to diversify their portfolios across various asset classes and, consequently, enjoy the stability and growth prospects generally associated with diversification. |
| |
Specialty Fund Opportunity Trust | | The success of our funds is contingent on the experience, discipline, and acumen of our fund managers. We believe the quality of our managers is crucial to investment success. Unlike many firms, which focus on a particular asset class or the fluctuations of the market, at Legg Mason we focus on providing a collection of top-notch managers in all the major asset classes. |
| |
Global Funds Emerging Markets Trust International Equity Trust Taxable Bond Funds Investment Grade Income Portfolio Limited Duration Bond Portfolio | | Information about the policies and procedures that each Fund uses to determine how to vote proxies relating to its portfolio securities is contained in the Statement of Additional Information, available without charge upon request by calling 1-800-822-5544 or on the Securities and Exchange Commission’s (“SEC”) website (http://www.sec.gov). Information regarding how each Fund voted proxies relating to portfolio securities during the most recent twelve-month period ended June 30 is also available on the SEC’s website or through the Legg Mason Funds’ website at www.leggmason.com/individualinvestors. |
| |
Tax-Free Bond Fund Maryland Tax-Free Income Trust | | Each Fund files its complete schedule of portfolio holdings with the SEC for the first and third quarters of each fiscal year on Form N-Q. You may obtain a free copy of each Fund’s portfolio holdings as filed on Form N-Q, by contacting each Fund at the appropriate phone number, address or website listed below. Additionally, each Fund’s Form N-Q is available on the SEC’s website (http://www.sec.gov) or may be reviewed and copied at the SEC’s Public Reference Room in Washington, D.C. Information about the operation of the Public Reference Room may be obtained by calling 1-800-SEC-0330. |
This report must be preceded or accompanied by a free prospectus. Investors should consider each Fund’s investment objectives, risks, charges and expenses carefully before investing. The prospectus contains this and other important information about each Fund. For a free prospectus for these or any other Legg Mason Fund,visit www.leggmason.comindividualinvestors. Please read the prospectus carefully before investing.
| | |
| Legg Mason Funds | | Legg Mason Investor Services — Institutional |
| For Primary, R Class Shareholders | | For FI, I and IS Class Shareholders |
| c/o BFDS | | c/o BFDS |
| P.O. Box 55214 | | P.O. Box 8037 |
| Boston, MA 02205-8504 | | Boston, MA 02206-8037 |
| 800-822-5544 | | 888-425-6432 |
| www.leggmason.com/individualinvestors | | www.lminstitutionalfunds.com |
| | | | |
| | Legg Mason Investor Services, LLC, Distributor A Legg Mason, Inc. subsidiary | |  |
LMF-056/A (02/09)/TN09-4345
| Item 2. | Code of Ethics Applicable to Registrant’s Principal Executive Officer and Principal Financial Officer |
| | (a) | Legg Mason Income Trust, Inc. (“Registrant”) has adopted a Code of Ethics, as defined in the instructions to Form N-CSR that applies to the Registrant’s President and Treasurer, which is designed to deter wrongdoing and to promote: |
| | • | | Honest and ethical conduct, including the ethical handling of actual or apparent conflicts of interest between personal and professional relationships; |
Page 2 of 8
| | • | | Full, fair, accurate, timely and understandable disclosure in reports and documents the Registrant files with, or submits to, the SEC or in other public communications made by the Registrant; |
| | • | | Compliance with applicable governmental laws, rules and regulations; |
| | • | | Prompt internal reporting of violations of the Code of Ethics to an appropriate person or persons identified in the Code of Ethics; and |
| | • | | Accountability for adherence to the Code of Ethics. |
| | (d) | The Registrant has not granted a waiver, including an implicit waiver, from a provision of the Code of Ethics to the Registrant’s principal executive officer, principal financial officer, principal accounting officer or controller, or persons performing similar functions during the period covered by this report. |
| | (f) | A copy of the Code of Ethics is attached as Exhibit 12(a)(1) to this Form N-CSR. |
| Item 3. | Audit Committee Financial Expert |
| | | | |
| (a) | | (1) | | The Registrant’s Board of Directors have determined that the Registrant has at least one Audit Committee financial expert serving on its Audit Committee. |
| | |
| (a) | | (2) | | The Audit Committee’s financial experts are Mr. Arthur S. Mehlman and Mr. Robert M. Tarola. They are “independent” as defined in Form N-CSR Item 3(a)(2). |
| Item 4. | Principal Accounting Fees and Services |
PricewaterhouseCoopers LLP
Fiscal Year Ended December 31, 2007 – $76,140
Fiscal Year Ended December 31, 2008 – $75,000
Page 3 of 8
There were no additional fees billed to the Registrant during either of the last two fiscal years in addition to those disclosed in Item 4(a).
There were no fees billed to the Registrant for assurance and related services that required preapproval by the Audit Committee pursuant to paragraph (c)(7)(ii) of Rule 2-01 of Regulation S-X during the Registrant’s last two fiscal years.
PricewaterhouseCoopers LLP
Fiscal Year Ended December 31, 2007 – $4,800
Fiscal Year Ended December 31, 2008 – $10,000
Services include preparation of federal and state income tax returns and preparation of excise tax returns.
There were no fees billed to the Registrant for tax services that required preapproval by the Audit Committee pursuant to paragraph (c)(7)(ii) of Rule 2-01 of Regulation S-X during the Registrant’s last two fiscal years.
There were no fees billed to the Registrant during either of the last two fiscal years in addition to those disclosed in Item 4(a) through Item 4(c) above.
There were no fees billed to the Registrant for services not included in Items 4(a) through 4(c) above that required preapproval by the Audit Committee pursuant to paragraph (c)(7)(ii) of Rule 2-01 of Regulation S-X during the Registrant’s last two fiscal years.
| | | | |
| (e) | | (1) | | The Audit Committee’s policy is to delegate to its chairperson the authority to preapprove items prior to the next meeting of the Committee. Such preapprovals are reported at the next quarterly meeting of the Audit Committee. |
| | |
| | (2) | | There were no services provided to the Registrant that were approved by the Audit Committee pursuant to paragraph (c)(7)(i)(C) of Rule 2-01 of Regulation S-X. |
Page 4 of 8
There were no fees billed to the Registrant for services where pre-approval by the Audit Committee pursuant to paragraph (c)(7)(i)(C) of Rule 2-01 of Regulation S-X during the Registrant’s last two fiscal years.
| | (f) | The percentage of hours expended by the principal accountant’s engagement to audit the Registrant’s financial statements for the most recent fiscal year that were attributed to work performed by persons other than the principal accountants’ full-time, permanent employees was zero. |
| | (g) | Non-Audit Fees for services rendered to Registrant or Registrant’s investment manager and any entity controlling, controlled by, or under common control with the investment manager. |
PricewaterhouseCoopers LLP
Fiscal Year Ended December 31, 2007 – $392,049
Fiscal Year Ended December 31, 2008 – $314,000
| | (h) | The members of the Registrant’s Audit Committee have considered whether the non-audit services that were rendered by the Registrant’s principal accountant to the Registrant’s investment adviser and any entity controlling, controlled by, or under common control with the investment adviser that provides ongoing services to the Registrant that were not pre-approved pursuant to paragraph (c)(7)(ii) of Rule 2-01 of Regulation S-X are compatible with maintaining the principal accountant’s independence. |
| Item 5. | Audit Committee of Listed Registrants |
The Registrant is not a listed issuer as defined in Rule 10A-3 under the Securities Exchange Act of 1934.
| Item 6. | Schedule of Investments |
The schedule of investments in securities of unaffiliated issuers is included in the annual report.
| Item 7. | Disclosure of Proxy Voting Policies and Procedures for Closed-End Management Investment Companies |
Not applicable.
| Item 8. | Portfolio Managers of Closed-End Management Investment Companies |
Not applicable.
Page 5 of 8
| Item 9. | Purchases of Equity Securities by Closed-End Management Investment Companies and Affiliated Purchasers |
Not applicable.
| Item 10. | Submission of Matters to a Vote of Security Holders |
The Nominating Committee will accept recommendations for nominations from shareholders. Shareholders may forward recommendations to the Fund Secretary at 100 Light Street, 32nd Floor, Baltimore, Maryland 21202, Attn.: Fund Secretary.
| Item 11. | Controls and Procedures |
| | (a) | The Registrant’s principal executive and principal financial officers have concluded, based on their evaluation of the effectiveness of the design and operation of the Registrant’s disclosure controls and procedures (as defined in Rule 30a-3(c) under the Investment Company Act of 1940) as of a date within 90 days of the filing date of this report, that the Registrant’s disclosure controls and procedures are reasonably designed to ensure that information required to be disclosed by the Registrant on Form N-CSR is recorded, processed, summarized and reported within the time periods specified in the SEC’s rule and forms and that information required to be disclosed by the Registrant in the reports that it files or submits on Form N-CSR is accumulated and communicated to the Registrant’s management, including its principal executive and principal financial officers, as appropriate to allow timely decisions regarding required disclosure. |
| | (b) | There were no changes in the Registrant’s internal control over financial reporting (as defined in Rule 30a-3(d) under the Investment Company Act of 1940) during the Registrant’s second fiscal quarter of the period covered by this report that have materially affected, or are reasonably likely to materially affect, the Registrant’s internal control over financial reporting. |
Page 6 of 8
| | (a) | File the exhibits listed below as part of this Form. |
| | (1) | The Registrant’s Code of Ethics applicable to Registrant’s principal executive officer and principal financial officer is attached hereto. |
| | (2) | Separate certifications for the Registrant’s chief executive officer and chief financial officer as required by Rule 30a-2(a) under the Investment Company Act of 1940 are attached hereto. |
| | (b) | Separate certifications for the Registrant’s chief executive officer and chief financial officer pursuant to Section 906 of the Sarbanes-Oxley Act of 2002 are attached hereto. |
Page 7 of 8
SIGNATURES
Pursuant to the requirements of the Securities Exchange Act of 1934 and the Investment Company Act of 1940, the Registrant has duly caused this report to be signed on its behalf by the undersigned, thereunto duly authorized.
| | |
| Legg Mason Income Trust, Inc. |
| |
| By: | | /s/ David R. Odenath |
| | David R. Odenath |
| | President, Legg Mason Income Trust, Inc. |
| Date: | | March 3, 2009 |
Pursuant to the requirements of the Securities Exchange Act of 1934 and the Investment Company Act of 1940, this report has been signed below by the following persons on behalf of the Registrant and in the capacities and on the dates indicated.
| | |
| By: | | /s/ David R. Odenath |
| | David R. Odenath |
| | President, Legg Mason Income Trust, Inc. |
| Date: | | March 3, 2009 |
| | |
| By: | | /s/ Marie K. Karpinski |
| | Marie K. Karpinski |
| | Vice President and Chief Financial Officer, Legg Mason Income Trust, Inc. |
| Date: | | March 3, 2009 |
Page 8 of 8