Living our values every day 2016 ANNUAL SHAREHOLDERS’ MEETING Thursday, April 21, 2016 Deane Center for the Performing Arts Grand Community Room Committed to our shareholders, our local families and businesses, our employees and our communities
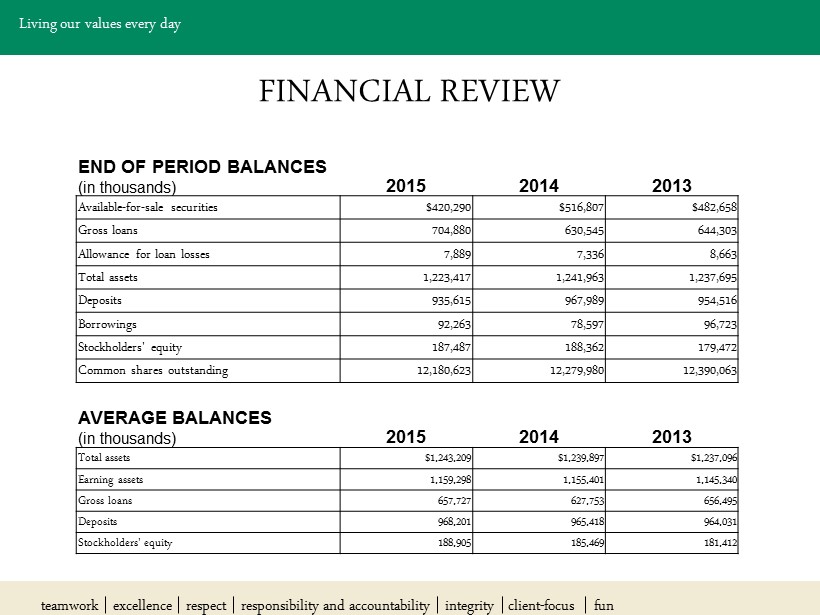
Living our values every day FINANCIAL REVIEW END OF PERIOD BALANCES (in thousands) 2015 2014 2013 Available - for - sale securities $420,290 $516,807 $482,658 Gross loans 704,880 630,545 644,303 Allowance for loan losses 7,889 7,336 8,663 Total assets 1,223,417 1,241,963 1,237,695 Deposits 935,615 967,989 954,516 Borrowings 92,263 78,597 96,723 Stockholders' equity 187,487 188,362 179,472 Common shares outstanding 12,180,623 12,279,980 12,390,063 AVERAGE BALANCES (in thousands) 2015 2014 2013 Total assets $1,243,209 $1,239,897 $1,237,096 Earning assets 1,159,298 1,155,401 1,145,340 Gross loans 657,727 627,753 656,495 Deposits 968,201 965,418 964,031 Stockholders' equity 188,905 185,469 181,412 teamwork excellence respect responsibility and accountability integrity client - focus fun
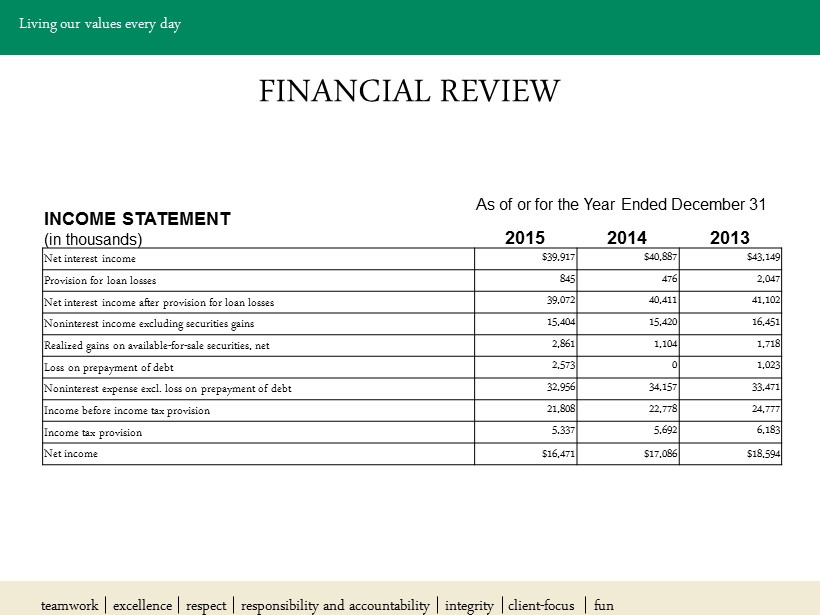
Living our values every day FINANCIAL REVIEW INCOME STATEMENT (in thousands) As of or for the Year Ended December 31 2015 2014 2013 Net interest income $39,917 $40,887 $43,149 Provision for loan losses 845 476 2,047 Net interest income after provision for loan losses 39,072 40,411 41,102 Noninterest income excluding securities gains 15,404 15,420 16,451 Realized gains on available - for - sale securities, net 2,861 1,104 1,718 Loss on prepayment of debt 2,573 0 1,023 Noninterest expense excl. loss on prepayment of debt 32,956 34,157 33,471 Income before income tax provision 21,808 22,778 24,777 Income tax provision 5,337 5,692 6,183 Net income $16,471 $17,086 $18,594 teamwork excellence respect responsibility and accountability integrity client - focus fun
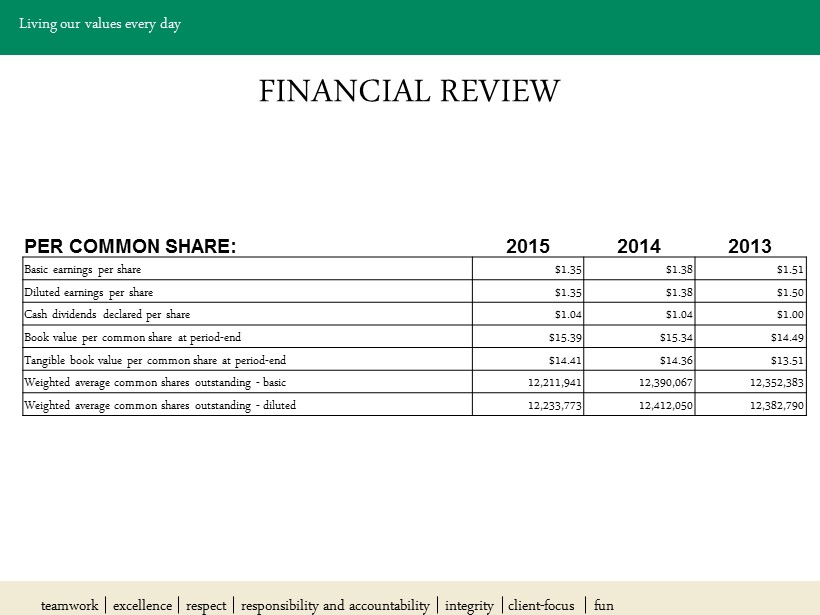
Living our values every day FINANCIAL REVIEW PER COMMON SHARE: 2015 2014 2013 Basic earnings per share $1.35 $1.38 $1.51 Diluted earnings per share $1.35 $1.38 $1.50 Cash dividends declared per share $1.04 $1.04 $1.00 Book value per common share at period - end $15.39 $15.34 $14.49 Tangible book value per common share at period - end $14.41 $14.36 $13.51 Weighted average common shares outstanding - basic 12,211,941 12,390,067 12,352,383 Weighted average common shares outstanding - diluted 12,233,773 12,412,050 12,382,790 teamwork excellence respect responsibility and accountability integrity client - focus fun
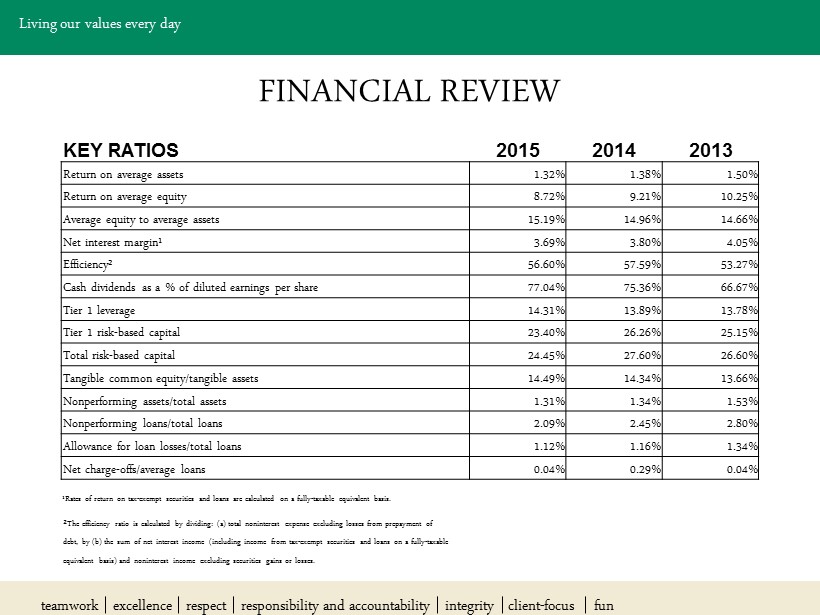
Living our values every day FINANCIAL REVIEW KEY RATIOS 2015 2014 2013 Return on average assets 1.32% 1.38% 1.50% Return on average equity 8.72% 9.21% 10.25% Average equity to average assets 15.19% 14.96% 14.66% Net interest margin¹ 3.69% 3.80% 4.05% Efficiency² 56.60% 57.59% 53.27% Cash dividends as a % of diluted earnings per share 77.04% 75.36% 66.67% Tier 1 leverage 14.31% 13.89% 13.78% Tier 1 risk - based capital 23.40% 26.26% 25.15% Total risk - based capital 24.45% 27.60% 26.60% Tangible common equity/tangible assets 14.49% 14.34% 13.66% Nonperforming assets/total assets 1.31% 1.34% 1.53% Nonperforming loans/total loans 2.09% 2.45% 2.80% Allowance for loan losses/total loans 1.12% 1.16% 1.34% Net charge - offs/average loans 0.04% 0.29% 0.04% ¹Rates of return on tax - exempt securities and loans are calculated on a fully - taxable equivalent basis. ² The efficiency ratio is calculated by dividing: (a) total noninterest expense excluding losses from prepayment of debt, by (b) the sum of net interest income (including income from tax - exempt securities and loans on a fully - taxable equivalent basis) and noninterest income excluding securities gains or losses. teamwork excellence respect responsibility and accountability integrity client - focus fun
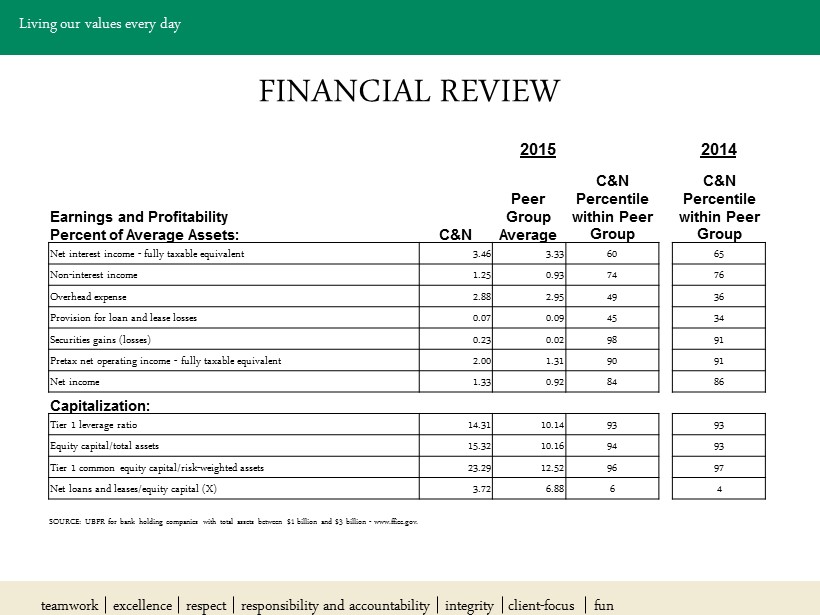
Living our values every day FINANCIAL REVIEW 2015 2014 C&N Peer Group Average C&N Percentile within Peer Group C&N Percentile within Peer Group Earnings and Profitability Percent of Average Assets: Net interest income - fully taxable equivalent 3.46 3.33 60 65 Non - interest income 1.25 0.93 74 76 Overhead expense 2.88 2.95 49 36 Provision for loan and lease losses 0.07 0.09 45 34 Securities gains (losses) 0.23 0.02 98 91 Pretax net operating income - fully taxable equivalent 2.00 1.31 90 91 Net income 1.33 0.92 84 86 Capitalization: Tier 1 leverage ratio 14.31 10.14 93 93 Equity capital/total assets 15.32 10.16 94 93 Tier 1 common equity capital/risk - weighted assets 23.29 12.52 96 97 Net loans and leases/equity capital (X) 3.72 6.88 6 4 SOURCE: UBPR for bank holding companies with total assets between $1 billion and $3 billion - www.ffiec.gov. teamwork excellence respect responsibility and accountability integrity client - focus fun
Living our values every day CEO COMMENTS Brad Scovill President & Chief Executive Officer teamwork excellence respect responsibility and accountability integrity client - focus fun
Living our values every day MISSION Creating value through lifelong relationships with: as their resource for customized financial solutions, expertise and partnership. • Shareholders • Customers • Employees • Community teamwork excellence respect responsibility and accountability integrity client - focus fun
Living our values every day VISION Every customer says “C&N is the ONLY bank I need.” teamwork excellence respect responsibility and accountability integrity client - focus fun
Living our values every day VALUES • Teamwork • Excellence • Respect • Responsibility and Accountability • Integrity • Client - Focus • Fun teamwork excellence respect responsibility and accountability integrity client - focus fun
Living our values every day STRONG FOUNDATION • History • Revenue Mix • Efficiency • Capital • Scale • Risk Profile teamwork excellence respect responsibility and accountability integrity client - focus fun

Living our values every day 2015 FOCUS • Current markets – penetration • Pace to business development • Capacity in key business lines • Delivery channels • Talent teamwork excellence respect responsibility and accountability integrity client - focus fun
Living our values every day CHALLENGING ENVIRONMENT • Economy • Interest Rates • Regulators • Technology • Talent teamwork excellence respect responsibility and accountability integrity client - focus fun
Living our values every day STRATEGIC GOALS • Leveraging capital to drive ROE • Grow Banking & Wealth assets • Sustainable risk profile • Employer of choice • Every customer says “C&N is the ONLY bank I need.” teamwork excellence respect responsibility and accountability integrity client - focus fun
Living our values every day 2016 FOCUS • Robust Sales & Relationship Management • Develop talent – at all levels • Technology • Strategic Risk Management teamwork excellence respect responsibility and accountability integrity client - focus fun
Living our values every day GROWTH • Long - term need to leverage capital • Revenue is the key • Existing markets first • Partnerships & Participations • New markets and acquisitions teamwork excellence respect responsibility and accountability integrity client - focus fun
Living our values every day SHAREHOLDER VALUE • Valuation • Attractive Dividend • Share repurchase • Investor Relations teamwork excellence respect responsibility and accountability integrity client - focus fun
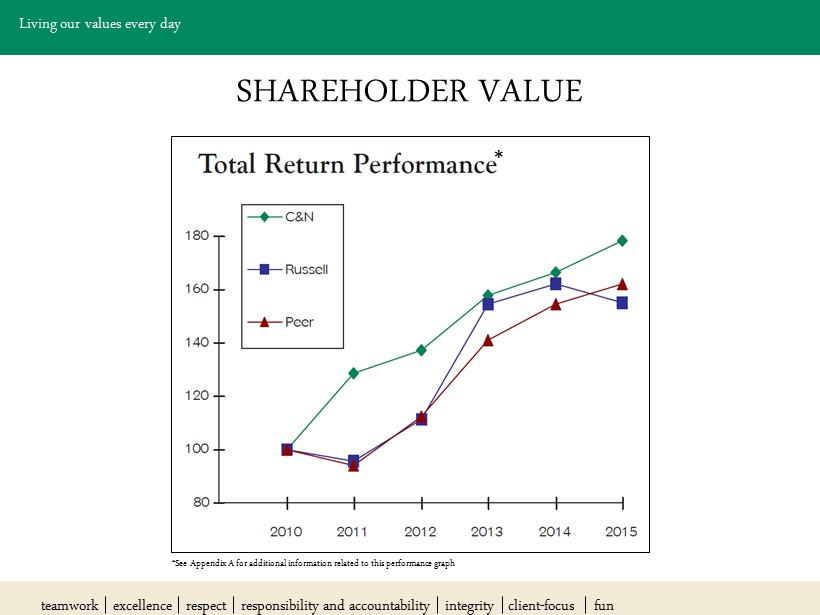
Living our values every day SHAREHOLDER VALUE * *See Appendix A for additional information related to this performance graph teamwork excellence respect responsibility and accountability integrity client - focus fun
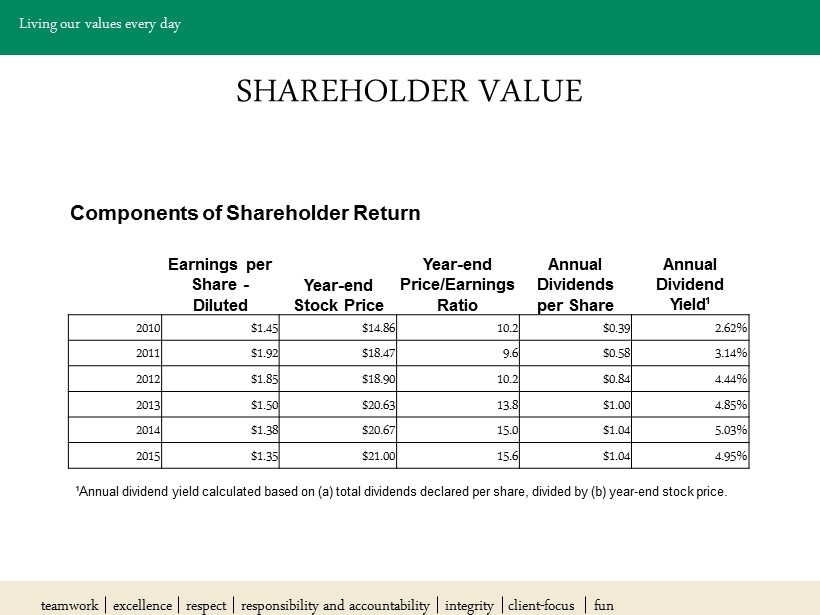
Living our values every day SHAREHOLDER VALUE Earnings per Share - Diluted Year - end Stock Price Year - end Price/Earnings Ratio Annual Dividends per Share Annual Dividend Yield ¹ 2010 $1.45 $14.86 10.2 $0.39 2.62% 2011 $1.92 $18.47 9.6 $0.58 3.14% 2012 $1.85 $18.90 10.2 $0.84 4.44% 2013 $1.50 $20.63 13.8 $1.00 4.85% 2014 $1.38 $20.67 15.0 $1.04 5.03% 2015 $1.35 $21.00 15.6 $1.04 4.95% Components of Shareholder Return ¹ Annual dividend yield calculated based on (a) total dividends declared per share, divided by (b) year - end stock price. teamwork excellence respect responsibility and accountability integrity client - focus fun
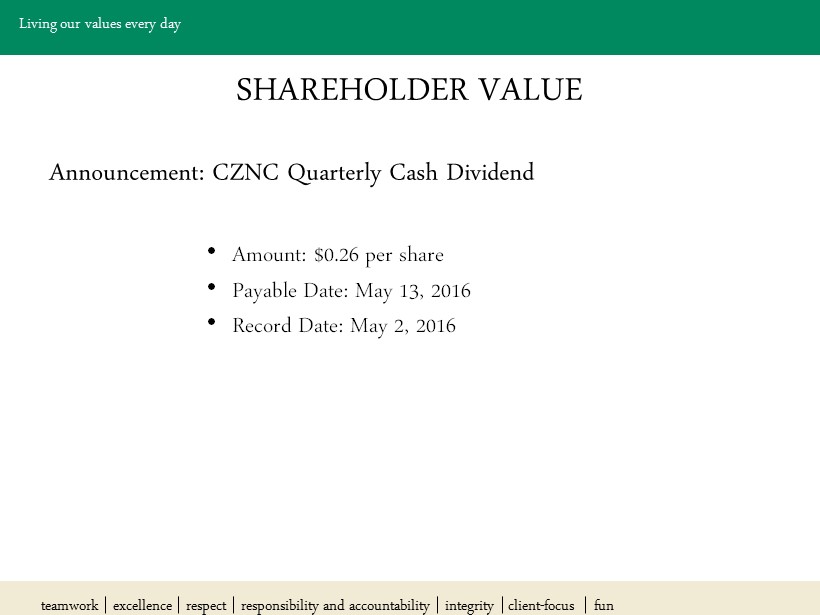
Living our values every day SHAREHOLDER VALUE Announcement: CZNC Quarterly Cash Dividend • Amount: $0.26 per share • Payable Date: May 13, 2016 • Record Date: May 2, 2016 teamwork excellence respect responsibility and accountability integrity client - focus fun
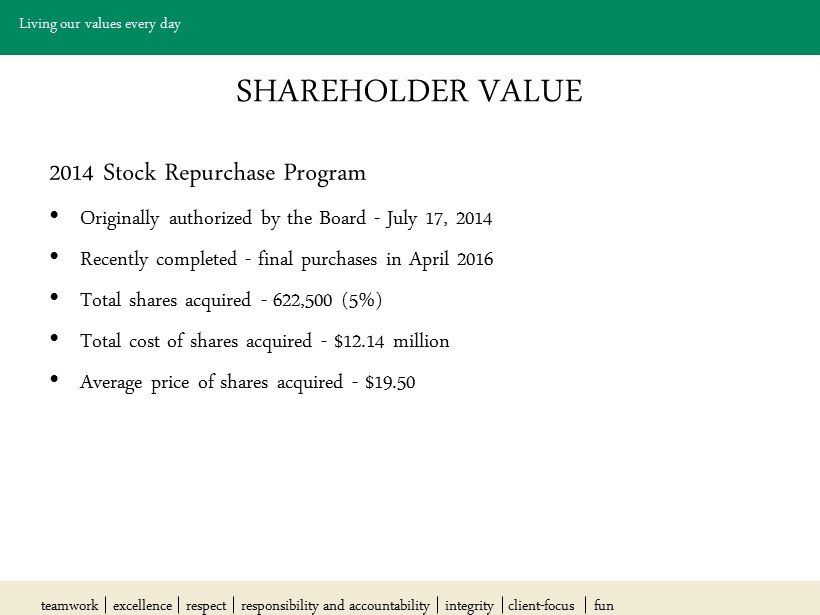
Living our values every day SHAREHOLDER VALUE 2014 Stock Repurchase Program • Originally authorized by the Board - July 17, 2014 • Recently completed - final purchases in April 2016 • Total shares acquired - 622,500 (5%) • Total cost of shares acquired - $12.14 million • Average price of shares acquired - $19.50 teamwork excellence respect responsibility and accountability integrity client - focus fun
Living our values every day SHAREHOLDER VALUE Announcement: 2016 Share Repurchase Program • New program authorized by the Board today (April 21, 2016) • Total shares authorized - 600,000 shares, or 4.98% of shares outstanding as of April 19, 2016 • Purchases may be made from time to time in the open market at prevailing prices, or through privately negotiated transactions • Program shall continue until suspended or terminated by the Board • Shares shall be available for use and reissuance for purposes as and when determined by the Board may include issuances for the Dividend Reinvestment Plan and for the equity compensation program teamwork excellence respect responsibility and accountability integrity client - focus fun
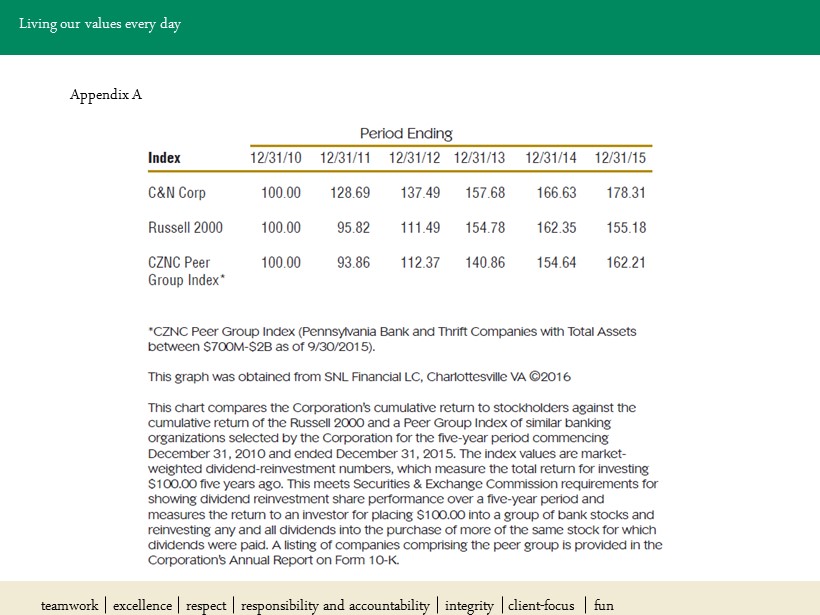
Living our values every day Appendix A teamwork excellence respect responsibility and accountability integrity client - focus fun