Exhibit 99.1
August 9, 2016 Hershey Community Bank Forum 2016
Safe Harbor This presentation contains statements which, to the extent that they are not recitations of historical fact may constitute fo rwa rd - looking statements for purposes of the Securities Act of 1933, as amended, and the Securities Exchange Act of 1934, as amended. Such forward - looking statements may include financial and other pr ojections as well as statements regarding Citizens & Northern Corporation (the “Corporation”) that may include future plans, objectives, performance, revenues, growth, profits, operating exp enses or the Corporation’s underlying assumptions. The words “may”, “would”, “should”, “could”, “will”, “likely”, “possibly”, “expect,” “anticipate,” “intend”, “estimate”, “target”, “pot ent ially”, “probably”, “outlook”, “predict”, “contemplate”, “continue”, “strategic”, “objective”, “plan”, “forecast”, “project” and “believe” or other similar words, phrases or concepts may identif y f orward - looking statements. Persons reading or present at this presentation are cautioned that such statements are only predictions, and that the Corporation’s actual future results or per for mance may be materially different. Such forward - looking statements involve known and unknown risks and uncertainties. A number of factors, many of which are beyond the Corporation’s control, could cause our actual results, events or developments, or industry results, to be materially different from any future results, events or developments expre sse d, implied or anticipated by such forward - looking statements, and so our business and financial condition and results of operations could be materially and adversely affected. Such factors include, among others, that the execution of any mergers with the Corporation may take longer than anticipated o r b e more costly to complete and that the anticipated benefits, including any anticipated cost savings or strategic gains, may be significantly harder to achieve or take longer than anticip ate d or may not be achieved, our need for capital, our ability to control operating costs and expenses, and to manage loan and lease delinquency rates; the credit risks of lending activities and over all quality of the composition of our loan and securities portfolio; the impact of economic conditions, consumer and business spending habits, and real estate market conditions on our business and in our market area; changes in the levels of general interest rates, deposit interest rates, or net interest margin and funding sources; changes in banking regulations and policies and the possi bil ity that any banking agency approvals we might require for certain activities will not be obtained in a timely manner or at all or will be conditioned in a manner that would impair our ability to implement our business plans; changes in accounting policies and practices; the inability of key third - party providers to perform their obligations to us; our ability to attract and retain key personnel; competition in our marketplace; war or terrorist activities; material differences in the actual financial results, cost savings and revenue enhancements associated with our acquisitions; an d other factors as described in our securities filings. All forward - looking statements and information made herein are based on management’s current beliefs and assumptions as of August 9, 2016 an d speak only as of that date. The Corporation does not undertake to update forward - looking statements. For a complete discussion of the assumptions, risks and uncertainties related to our business, you are encouraged to review our filings with the Securities and Exchange Commission, including our most recent annual report on Form 10 - K, as well as any changes in risk factors that we may identify in our quarterly or other reports subsequently filed with the SEC. [ 1 ]
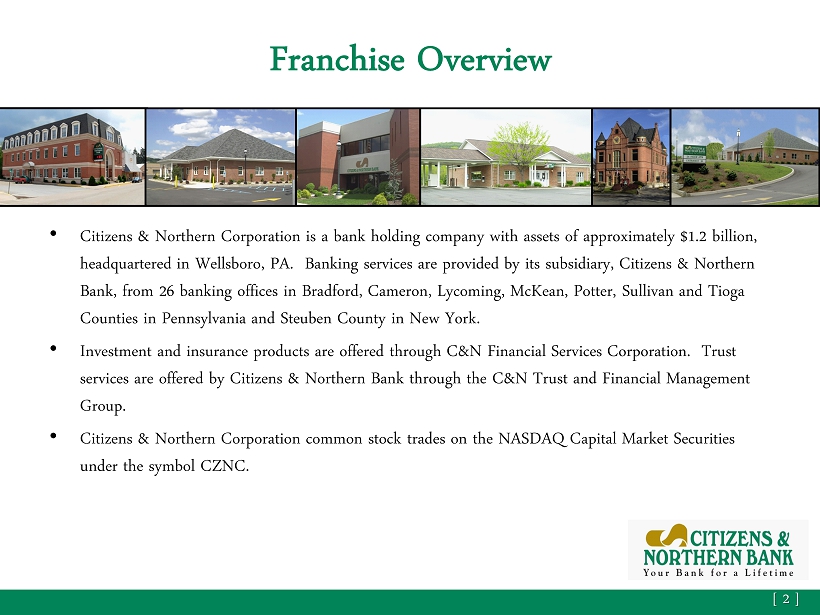
Franchise Overview • Citizens & Northern Corporation is a bank holding company with assets of approximately $1.2 billion, headquartered in Wellsboro, PA. Banking services are provided by its subsidiary, Citizens & Northern Bank, from 26 banking offices in Bradford, Cameron, Lycoming, McKean, Potter, Sullivan and Tioga Counties in Pennsylvania and Steuben County in New York. • Investment and insurance products are offered through C&N Financial Services Corporation. Trust services are offered by Citizens & Northern Bank through the C&N Trust and Financial Management Group. • Citizens & Northern Corporation common stock trades on the NASDAQ Capital Market Securities under the symbol CZNC. [ 2 ]
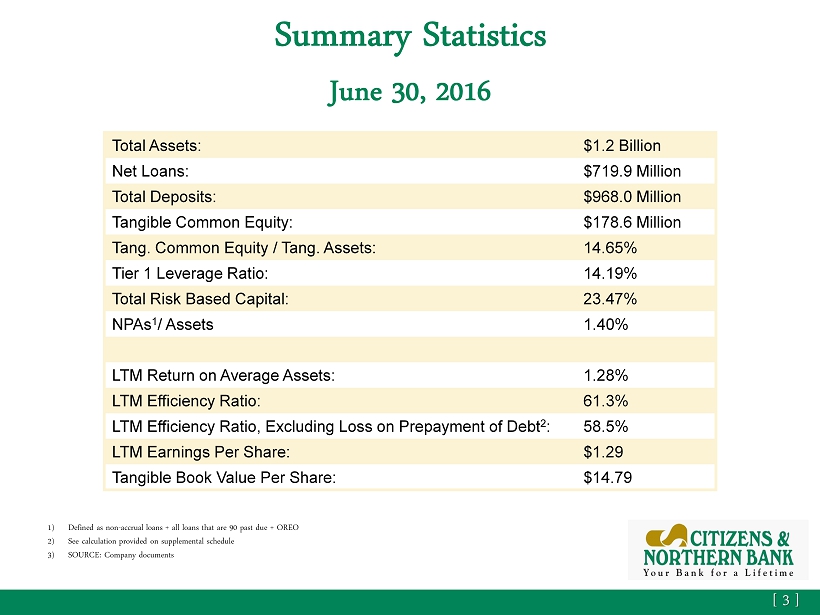
Summary Statistics June 30, 2016 Total Assets: $1.2 Billion Net Loans: $719.9 Million Total Deposits: $968.0 Million Tangible Common Equity: $178.6 Million Tang. Common Equity / Tang. Assets: 14.65% Tier 1 Leverage Ratio: 14.19% Total Risk Based Capital: 23.47% NPAs 1 / Assets 1.40% LTM Return on Average Assets: 1.28% LTM Efficiency Ratio: 61.3% LTM Efficiency Ratio, Excluding Loss on Prepayment of Debt 2 : 58.5% LTM Earnings Per Share: $1.29 Tangible Book Value Per Share: $14.79 1) Defined as non - accrual loans + all loans that are 90 past due + OREO 2) See calculation provided on supplemental schedule 3) SOURCE: Company documents [ 3 ]
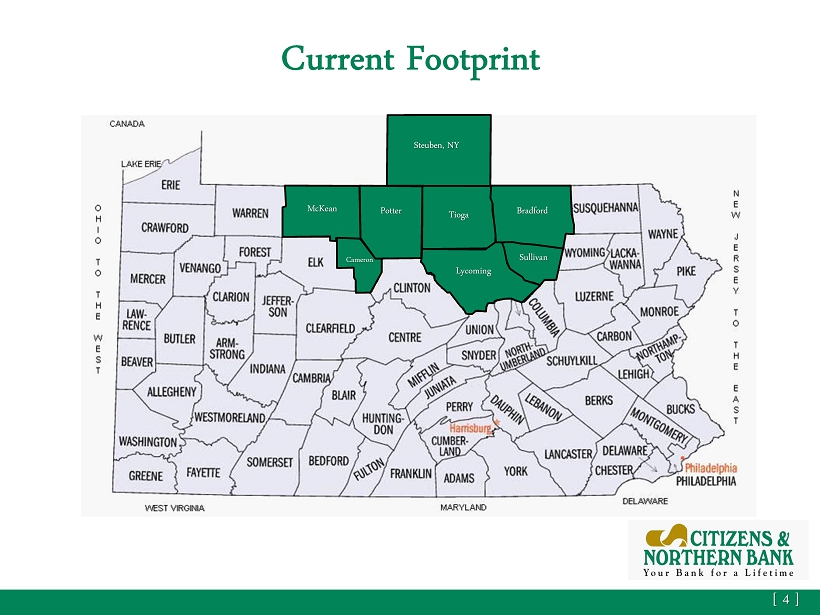
Current Footprint [ 4 ] McKean Potter Steuben, NY Tioga Bradford Cameron Lycoming Sullivan
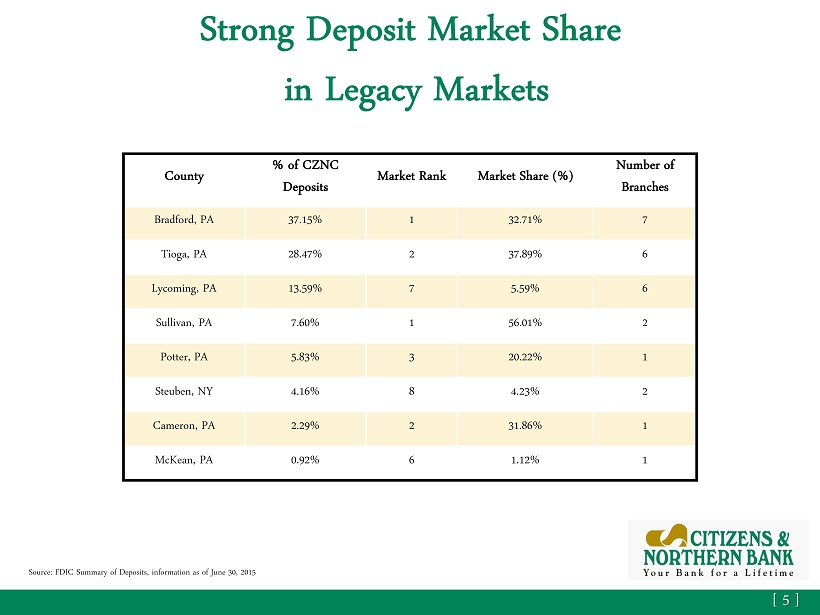
Strong Deposit Market Share in Legacy Markets [ 5 ] Source: FDIC Summary of Deposits, information as of June 30, 2015 County % of CZNC Deposits Market Rank Market Share (%) Number of Branches Bradford, PA 37.15% 1 32.71% 7 Tioga, PA 28.47% 2 37.89% 6 Lycoming, PA 13.59% 7 5.59% 6 Sullivan, PA 7.60% 1 56.01% 2 Potter, PA 5.83% 3 20.22% 1 Steuben, NY 4.16% 8 4.23% 2 Cameron, PA 2.29% 2 31.86% 1 McKean, PA 0.92% 6 1.12% 1
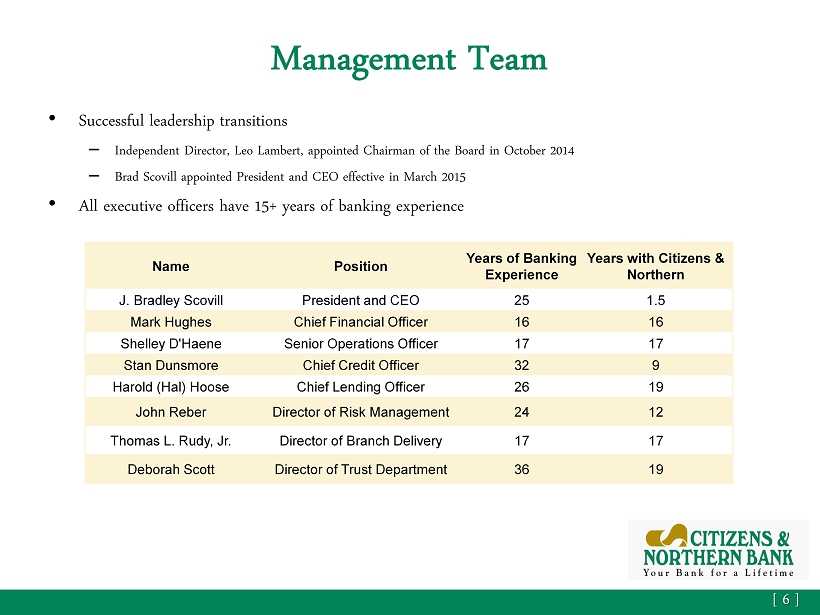
Management Team • Successful leadership transitions – Independent Director, Leo Lambert, appointed Chairman of the Board in October 2014 – Brad Scovill appointed President and CEO effective in March 2015 • All executive officers have 15+ years of banking experience [ 6 ] Name Position Years of Banking Experience Years with Citizens & Northern J. Bradley Scovill President and CEO 25 1.5 Mark Hughes Chief Financial Officer 16 16 Shelley D'Haene Senior Operations Officer 17 17 Stan Dunsmore Chief Credit Officer 32 9 Harold (Hal) Hoose Chief Lending Officer 26 19 John Reber Director of Risk Management 24 12 Thomas L. Rudy, Jr. Director of Branch Delivery 17 17 Deborah Scott Director of Trust Department 36 19
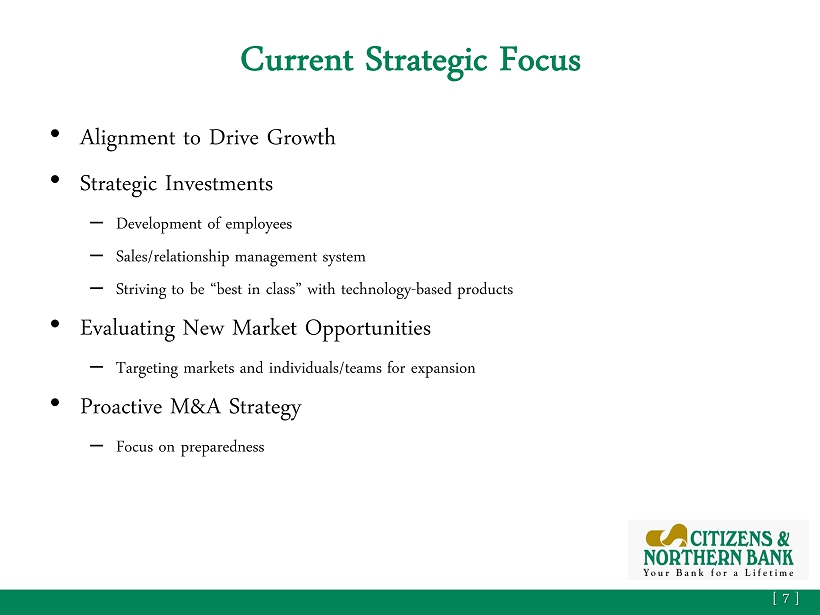
Current Strategic Focus • Alignment to Drive Growth • Strategic Investments – Development of employees – Sales/relationship management system – Striving to be “best in class” with technology - based products • Evaluating New Market Opportunities – Targeting markets and individuals/teams for expansion • Proactive M&A Strategy – Focus on preparedness [ 7 ]

Current Strategic Focus • Capital Deployment – Current dividend yield of 4.88% – 2014 stock buyback program completed – New stock buyback program announced in April 2016 • Risk Management – Continue to strengthen enterprise risk management programs consistent with size and complexity of the company [ 8 ]
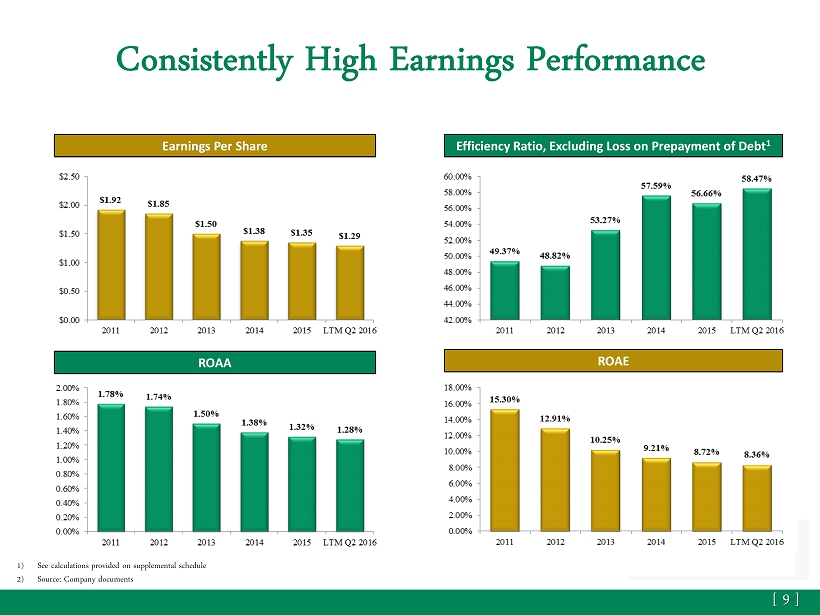
Consistently High Earnings Performance [ 9 ] Earnings Per Share Efficiency Ratio, Excluding Loss on Prepayment of Debt 1 ROAE ROAA 1) See calculations provided on supplemental schedule 2) Source: Company documents

Loan Portfolio Diversification [ 10 ] Loan Portfolio - as of June 30, 2016 (Amounts in thousands) Amount % of Total Residential mortgage: Residential mortgage loans - first liens $315,191 43.3% Residential mortgage loans - junior liens 22,159 3.0% Home equity lines of credit 39,054 5.4% 1 - 4 Family residential construction 22,241 3.1% Total residential mortgage 398,645 54.8% Commercial: Commercial loans secured by real estate 153,070 21.0% Commercial and industrial 82,390 11.3% Political subdivisions 41,026 5.6% Commercial construction and land 9,193 1.3% Loans secured by farmland 6,615 0.9% Multi - family (5 or more) residential 8,173 1.1% Agricultural loans 4,692 0.6% Other commercial loans 11,904 1.6% Total commercial 317,063 43.6% Consumer 12,134 1.7% Total $727,842 100.0% Total participation loans (1) $35,940 4.9% (1) Participation loans are included in the commercial segment in the table above. Source: Company documents
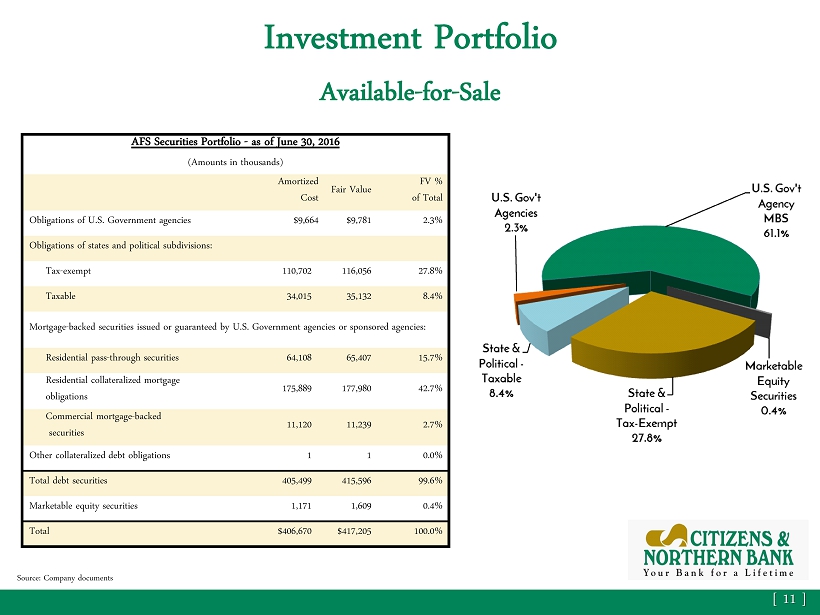
Investment Portfolio Available - for - Sale [ 11 ] AFS Securities Portfolio - as of June 30, 2016 (Amounts in thousands ) Amortized Cost Fair Value FV % of Total Obligations of U.S. Government agencies $9,664 $ 9,781 2.3% Obligations of states and political subdivisions: Tax - exempt 110,702 116,056 27.8% Taxable 34,015 35,132 8.4% Mortgage - backed securities issued or guaranteed by U.S. Government agencies or sponsored agencies: Residential pass - through securities 64,108 65,407 15.7% Residential collateralized mortgage obligations 175,889 177,980 42.7% Commercial mortgage - backed securities 11,120 11,239 2.7% Other collateralized debt obligations 1 1 0.0% Total debt securities 405,499 415,596 99.6% Marketable equity securities 1,171 1,609 0.4% Total $406,670 $417,205 100.0% Source: Company documents
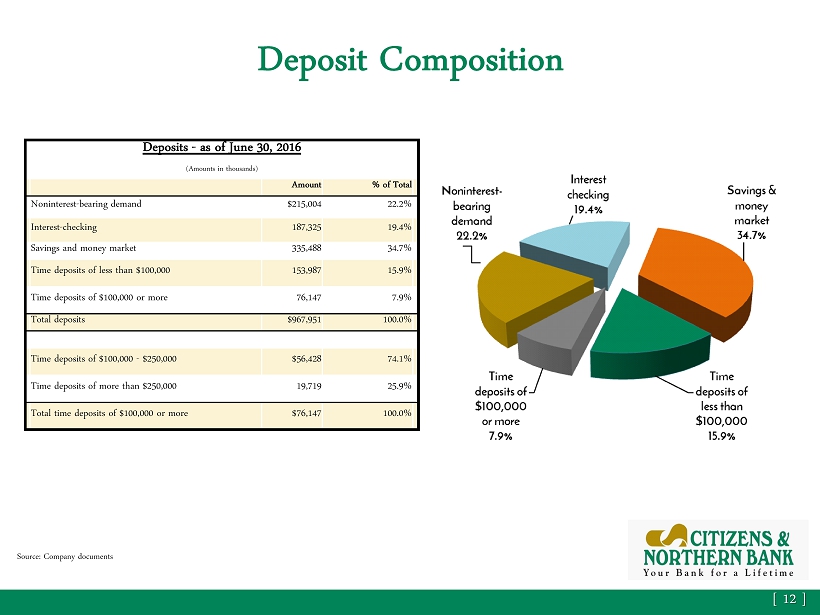
Deposit Composition [ 12 ] Source: Company documents Deposits - as of June 30, 2016 (Amounts in thousands) Amount % of Total Noninterest - bearing demand $215,004 22.2% Interest - checking 187,325 19.4% Savings and money market 335,488 34.7% Time deposits of less than $100,000 153,987 15.9% Time deposits of $100,000 or more 76,147 7.9% Total deposits $967,951 100.0% Time deposits of $100,000 - $250,000 $56,428 74.1% Time deposits of more than $250,000 19,719 25.9% Total time deposits of $100,000 or more $76,147 100.0%

Wealth Management Division • Largest Locally - based Wealth Management Department with Integrated Broker/Dealer and Insurance Sales • Team is comprised of over 30 professionals • $847 million in Trust assets under management at 6/30/16 • Trust and brokerage revenues totaled $2.7 million in six - month period ended 6/30/16, or 9.5% of total revenues excluding securities gains • Trust and brokerage revenues totaled $5.5 million in 2015, or 9.4% of total revenues excluding securities gains [ 13 ]
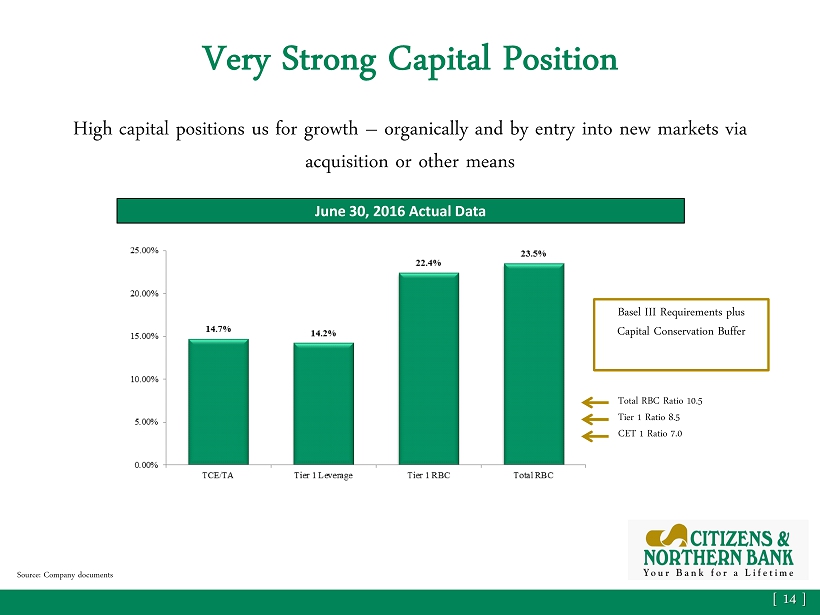
Very Strong Capital Position High capital positions us for growth – organically and by entry into new markets via acquisition or other means [ 14 ] June 30, 2016 Actual Data Source: Company documents Basel III Requirements plus Capital Conservation Buffer Total RBC Ratio 10.5 Tier 1 Ratio 8.5 CET 1 Ratio 7.0
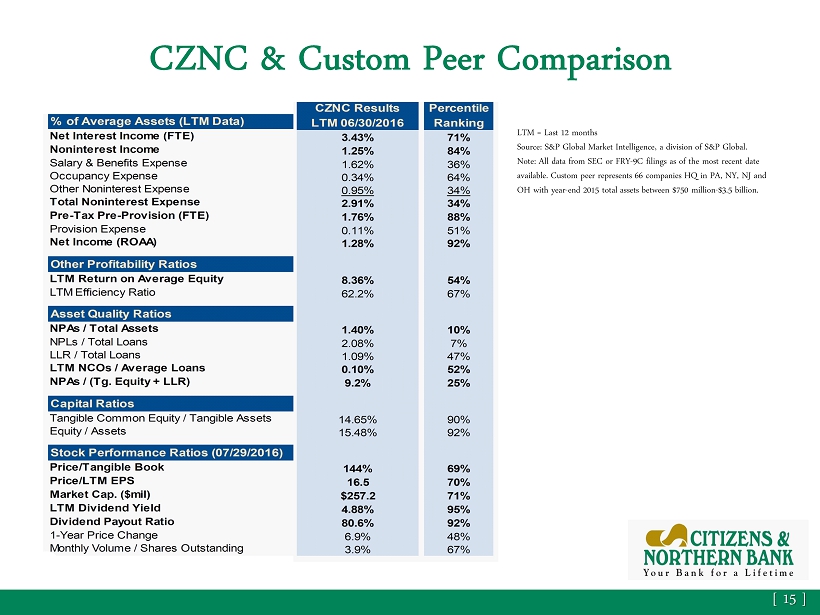
CZNC & Custom Peer Comparison [ 15 ] LTM = Last 12 months Source: S&P Global Market Intelligence, a division of S&P Global. Note: All data from SEC or FRY - 9C filings as of the most recent date available. Custom peer represents 66 companies HQ in PA, NY, NJ and OH with year - end 2015 total assets between $750 million - $3.5 billion. Source: SNL Financial – market data as of November 5, 2015
Investment Considerations • Leading market share among community banks in North Central Pennsylvania • Experienced Board and senior leadership team • Consistently high earnings performance, with diverse revenue sources • Very strong capital position • Significant loan growth in 2015 and the first six months of 2016 • Disciplined credit culture and risk management profile • Opportunity for growth in existing and new markets organically and through market dislocation [ 16 ]
Investment Considerations • Well - established trust and financial management team • Quarterly dividends declared of $0.26 per share in each of the last 11 quarters, resulting in an annualized yield of 4.88% 1 • Attractive currency with valuation of 144% of Tangible Book Value and 16.5x LTM EPS 1 • Market capitalization of $257.2 million 1 • 50 - day average daily trading volume of 20,737 shares, as of August 3, 2016 2 [ 17 ] 1) Source: S&P Global Market Intelligence, a division of S&P Global – market data as of July 29, 2016 2) Source: NASDAQ.com

Contact Information President and CEO: Brad Scovill BradleyS@cnbankpa.com; 570 - 723 - 2102 Treasurer and CFO: Mark Hughes MarkH@cnbankpa.com; 570 - 724 - 8533 Online: www.cnbankpa.com www.cntrustpa.com [ 18 ]
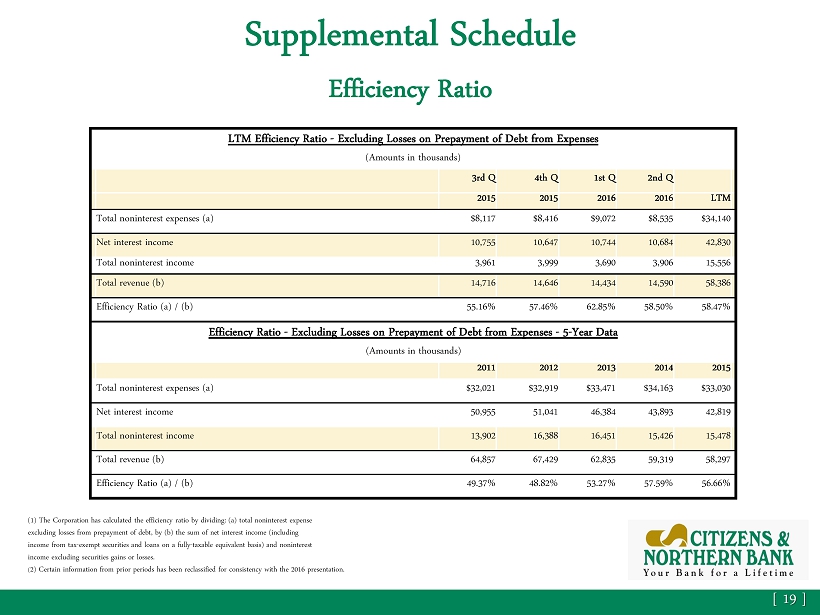
Supplemental Schedule Efficiency Ratio LTM Efficiency Ratio - Excluding Losses on Prepayment of Debt from Expenses (Amounts in thousands) 3rd Q 4th Q 1st Q 2nd Q 2015 2015 2016 2016 LTM Total noninterest expenses (a) $8,117 $8,416 $9,072 $8,535 $34,140 Net interest income 10,755 10,647 10,744 10,684 42,830 Total noninterest income 3,961 3,999 3,690 3,906 15,556 Total revenue (b) 14,716 14,646 14,434 14,590 58,386 Efficiency Ratio (a) / (b) 55.16% 57.46% 62.85% 58.50% 58.47% Efficiency Ratio - Excluding Losses on Prepayment of Debt from Expenses - 5 - Year Data ( Amounts in thousands) 2011 2012 2013 2014 2015 Total noninterest expenses (a) $32,021 $32,919 $33,471 $34,163 $33,030 Net interest income 50,955 51,041 46,384 43,893 42,819 Total noninterest income 13,902 16,388 16,451 15,426 15,478 Total revenue (b) 64,857 67,429 62,835 59,319 58,297 Efficiency Ratio (a) / (b) 49.37% 48.82% 53.27% 57.59% 56.66% (1) The Corporation has calculated the efficiency ratio by dividing: (a) total noninterest expense excluding losses from prepayment of debt, by (b) the sum of net interest income (including income from tax - exempt securities and loans on a fully - taxable equivalent basis) and noninterest income excluding securities gains or losses. ( 2) Certain information from prior periods has been reclassified for consistency with the 2016 presentation. [ 19 ]