Exhibit 99.1

Sandler O’Neill + Partners, L.P. 2019 Philly Bank Bonanza June 13, 2019
This presentation contains statements which, to the extent that they are not recitations of historical fact may constitute fo rwa rd - looking statements for purposes of the Securities Act of 1933, as amended, and the Securities Exchange Act of 1934, as amended. Such forward - looking statements may include financial and other projections as well as statements regarding Citizens & Northern Corporation (the “Corporation”) that may include future plans , o bjectives, performance, revenues, growth, profits, operating expenses or the Corporation’s underlying assumptions. The words “may”, “would”, “should”, “could”, “w ill”, “likely”, “possibly”, “expect,” “anticipate,” “intend”, “estimate”, “target”, “potentially”, “probably”, “outlook”, “predict”, “contemplate”, “continue”, “st rat egic”, “objective”, “plan”, “forecast”, “project” and “believe” or other similar words, phrases or concepts may identify forward - looking statements. Persons reading or present at this presentation are cautioned that such statements are only predictions, and that the Corporation’s actual future results or performance may be materially dif ferent. Such forward - looking statements involve known and unknown risks and uncertainties. A number of factors, many of which are beyond the Corporation’s control, could cause our actual results, events or developments, or industry results, to be materially different from any future resul ts, events or developments expressed, implied or anticipated by such forward - looking statements, and so our business and financial condition and results of operations could be materially and adversely affected. Such factors include, among others, that the execution of the recent merger with Monument Bancorp, Inc. or the execution of a ny other mergers with the Corporation may take longer than anticipated or be more costly to complete and that the anticipated benefits, including any a nti cipated cost savings or strategic gains, may be significantly harder to achieve or take longer than anticipated or may not be achieved; our need for capital; o ur ability to control operating costs and expenses, and to manage loan and lease delinquency rates; the credit risks of lending activities and overall quality of the c omp osition of our loan and securities portfolio; the impact of economic conditions, consumer and business spending habits, and real estate market conditions on our b usiness and in our market area; changes in the levels of general interest rates, deposit interest rates, or net interest margin and funding sources; changes in banking regulations and policies and the possibility that any banking agency approvals we might require for certain activities will not be obtained in a timely ma nne r or at all or will be conditioned in a manner that would impair our ability to implement our business plans; changes in accounting policies and practices; the inabi lit y of key third - party providers to perform their obligations to us; our ability to attract and retain key personnel; competition in our marketplace; war or terr ori st activities; material differences in the actual financial results, cost savings and revenue enhancements associated with our acquisitions; and other factors as descri bed in our securities filings. All forward - looking statements and information made herein are based on management’s current beliefs and assumptions as of June 13, 2019 and speak only as of that date. The Corporation does not undertake to update forward - looking statements. For a complete discussion of the assumptions, risks and uncertainties related to our business, you are encouraged to review o ur filings with the Securities and Exchange Commission, including our most recent annual report on Form 10 - K, as well as any changes in risk factors that we may id entify in our quarterly or other reports subsequently filed with the SEC. Safe Harbor 2
Table of Contents 3 • Who We Are ……………………………………… ..... 4 - 12 • Current Strategic Focus ………………………… ... 13 - 14 • Selected Financial Data ………………………… ... 15 - 29 • Investment Considerations ……………………… .. 30 - 31 • Contact Information ……………………………… ........ 32 • Supplemental Schedule ………………………… ... 33 - 39
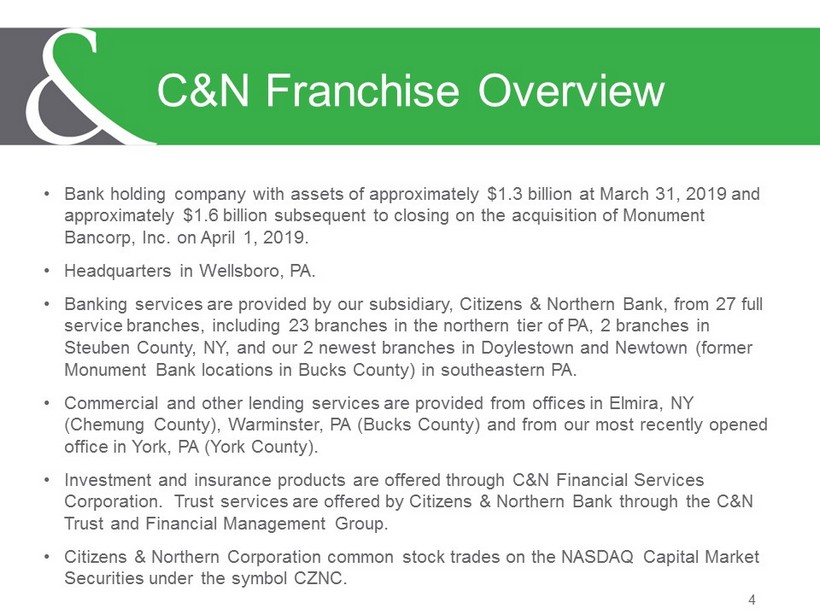
• Bank holding company with assets of approximately $1.3 billion at March 31, 2019 and approximately $1.6 billion subsequent to closing on the acquisition of Monument Bancorp, Inc. on April 1, 2019. • Headquarters in Wellsboro, PA. • Banking services are provided by our subsidiary, Citizens & Northern Bank, from 27 full service branches, including 23 branches in the northern tier of PA, 2 branches in Steuben County, NY, and our 2 newest branches in Doylestown and Newtown (former Monument Bank locations in Bucks County) in southeastern PA. • Commercial and other lending services are provided from offices in Elmira, NY (Chemung County), Warminster, PA (Bucks County) and from our most recently opened office in York, PA (York County). • Investment and insurance products are offered through C&N Financial Services Corporation. Trust services are offered by Citizens & Northern Bank through the C&N Trust and Financial Management Group. • Citizens & Northern Corporation common stock trades on the NASDAQ Capital Market Securities under the symbol CZNC. C&N Franchise Overview 4
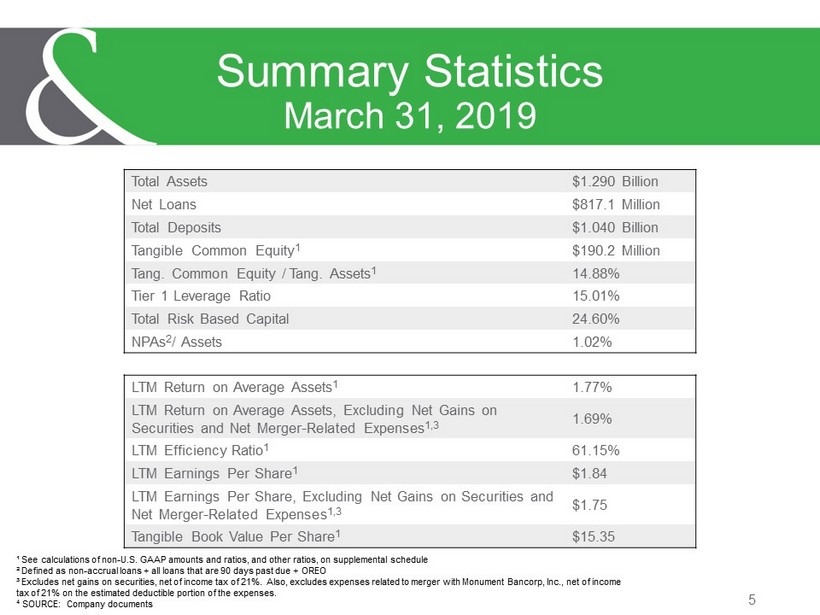
5 Summary Statistics March 31, 2019 Total Assets $1.290 Billion Net Loans $817.1 Million Total Deposits $1.040 Billion Tangible Common Equity 1 $190.2 Million Tang. Common Equity / Tang. Assets 1 14.88% Tier 1 Leverage Ratio 15.01% Total Risk Based Capital 24.60% NPAs 2 / Assets 1.02% LTM Return on Average Assets 1 1.77% LTM Return on Average Assets, Excluding Net Gains on Securities and Net Merger - Related Expenses 1,3 1.69% LTM Efficiency Ratio 1 61.15% LTM Earnings Per Share 1 $1.84 LTM Earnings Per Share, Excluding Net Gains on Securities and Net Merger - Related Expenses 1,3 $1.75 Tangible Book Value Per Share 1 $15.35 ¹ See calculations of non - U.S. GAAP amounts and ratios, and other ratios, on supplemental schedule ² Defined as non - accrual loans + all loans that are 90 days past due + OREO ³ Excludes net gains on securities, net of income tax of 21%. Also, excludes expenses related to merger with Monument Bancor p, Inc., net of income tax of 21% on the estimated deductible portion of the expenses. 4 SOURCE: Company documents

• Agreement and Plan of Merger signed and announced in September 2018 • Transaction closed April 1, 2019 • Total purchase transaction valued at approximately $42.7 million, including 80% of consideration in CZNC common stock/20% cash • Former Monument shareholders own 9.4% of CZNC common stock post - consummation • Clark S. Frame, Monument’s former Chairman, appointed to Citizens & Northern’s Board of Directors 6 Acquisition of Monument Bancorp, Inc.
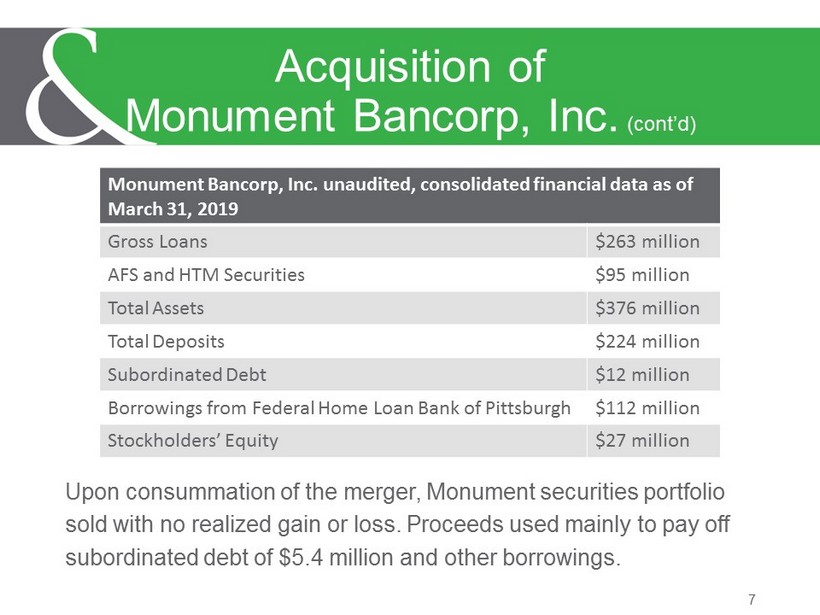
Upon consummation of the merger, Monument securities portfolio sold with no realized gain or loss. Proceeds used mainly to pay off subordinated debt of $5.4 million and other borrowings. 7 Acquisition of Monument Bancorp, Inc. (cont’d) Monument Bancorp, Inc. unaudited, consolidated financial data as of March 31, 2019 Gross Loans $263 million AFS and HTM Securities $95 million Total Assets $376 million Total Deposits $224 million Subordinated Debt $12 million Borrowings from Federal Home Loan Bank of Pittsburgh $112 million Stockholders’ Equity $27 million
• As of June 13, 2019, fair value calculations of Monument assets acquired and liabilities assumed are in progress. • Subject to purchase accounting adjustments, tangible book value dilution at closing is approximately 2%, consistent with prior modeling assumptions. • Merger - related expenses in 2019 estimated of $3.6 million pre - tax, or $2.9 million after - tax. • As announced in September 2018, estimated accretion of 2% in 2019 (excluding merger - related expenses), 5% accretion in 2020 and earn - back of up - front tangible book value dilution in approximately 3.75 years. 8 Acquisition of Monument Bancorp, Inc.
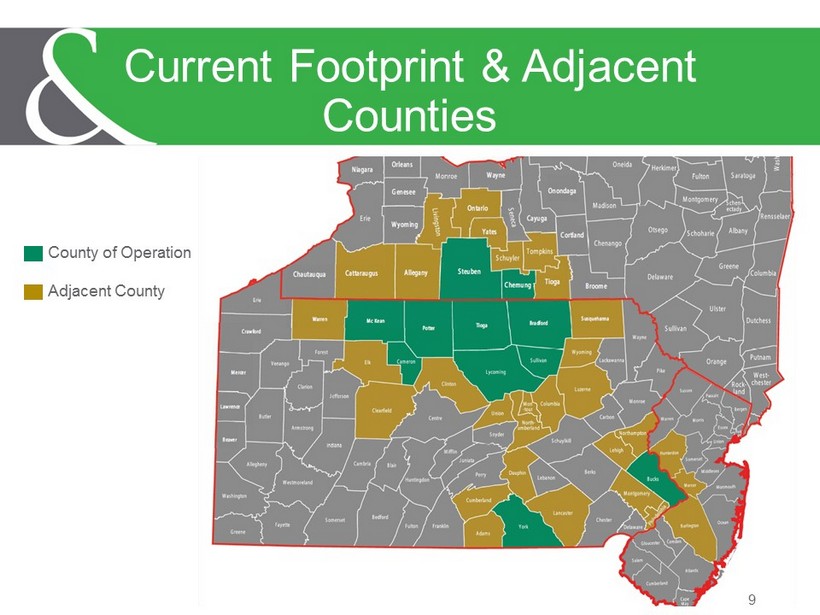
9 Current Footprint & Adjacent Counties County of Operation Adjacent County
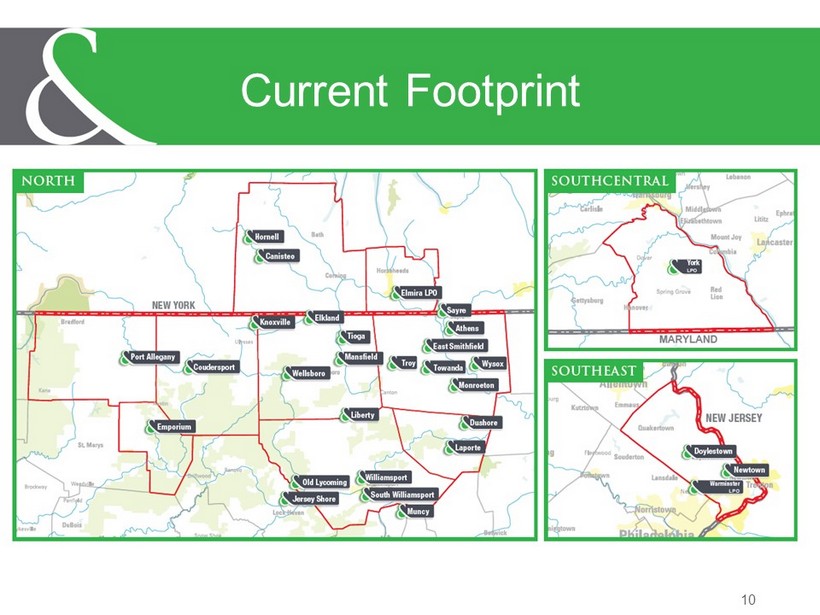
10 Current Footprint
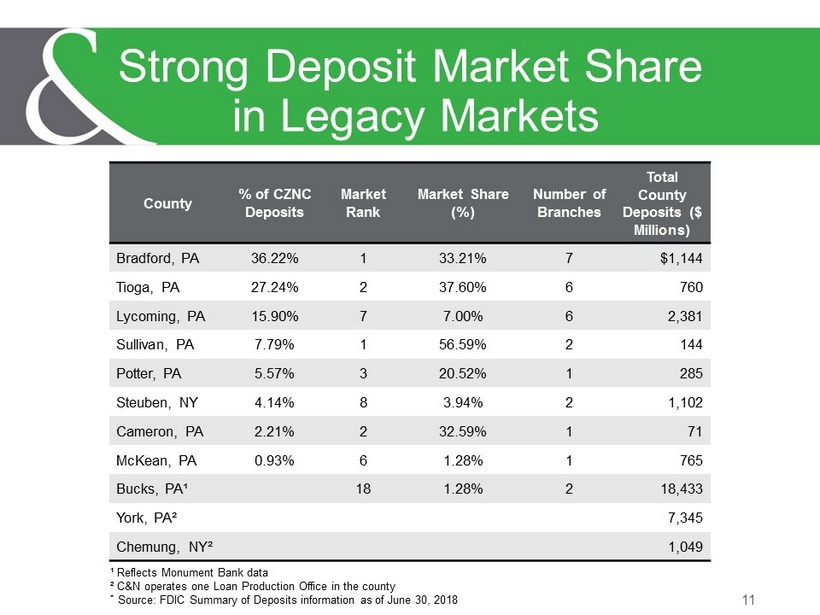
11 Strong Deposit Market Share in Legacy Markets County % of CZNC Deposits Market Rank Market Share (%) Number of Branches Total County Deposits ($ Millions) Bradford, PA 36.22% 1 33.21% 7 $1,144 Tioga, PA 27.24% 2 37.60% 6 760 Lycoming, PA 15.90% 7 7.00% 6 2,381 Sullivan, PA 7.79% 1 56.59% 2 144 Potter, PA 5.57% 3 20.52% 1 285 Steuben, NY 4.14% 8 3.94% 2 1,102 Cameron, PA 2.21% 2 32.59% 1 71 McKean, PA 0.93% 6 1.28% 1 765 Bucks, PA¹ 18 1.28% 2 18,433 York, PA² 7,345 Chemung, NY² 1,049 ¹ Reflects Monument Bank data ² C&N operates one Loan Production Office in the county * Source: FDIC Summary of Deposits information as of June 30, 2018
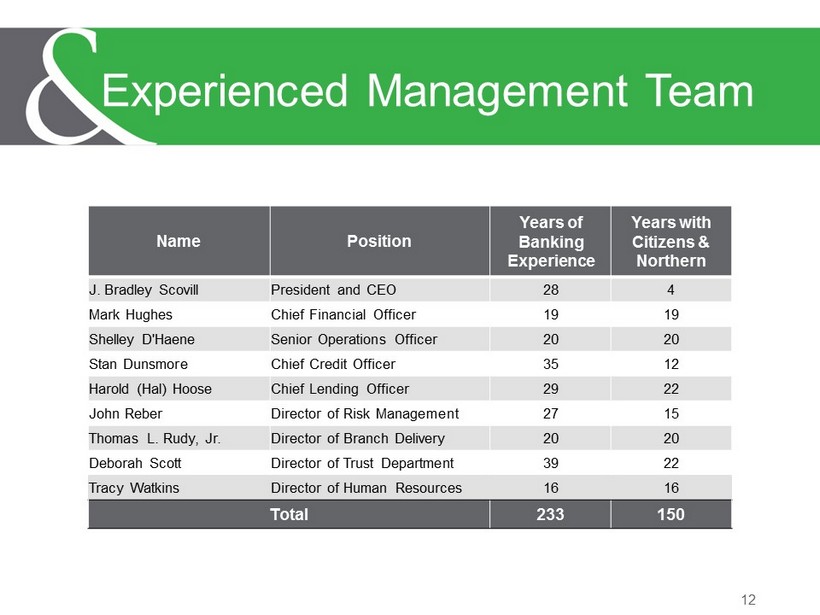
12 Experienced Management Team Name Position Years of Banking Experience Years with Citizens & Northern J. Bradley Scovill President and CEO 28 4 Mark Hughes Chief Financial Officer 19 19 Shelley D'Haene Senior Operations Officer 20 20 Stan Dunsmore Chief Credit Officer 35 12 Harold (Hal) Hoose Chief Lending Officer 29 22 John Reber Director of Risk Management 27 15 Thomas L. Rudy, Jr. Director of Branch Delivery 20 20 Deborah Scott Director of Trust Department 39 22 Tracy Watkins Director of Human Resources 16 16 Total 233 150
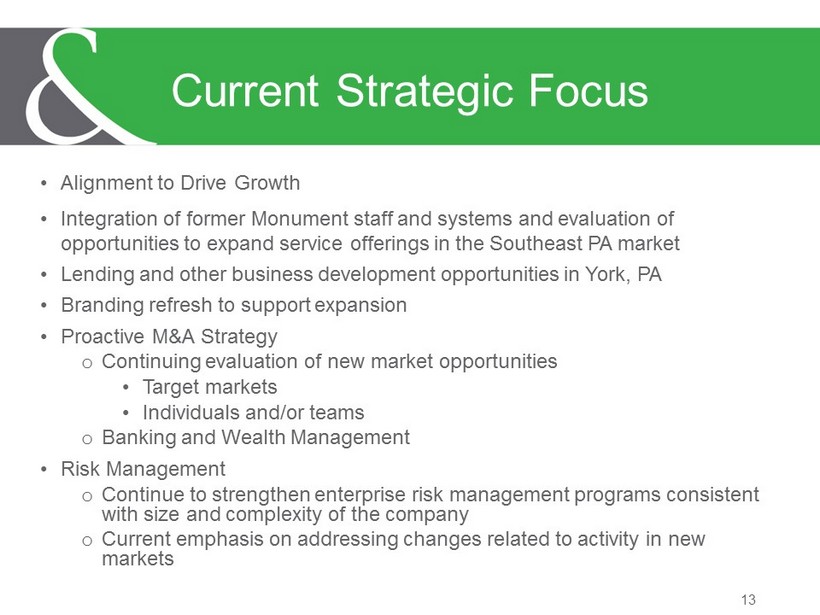
13 Current Strategic Focus • Alignment to Drive Growth • Integration of former Monument staff and systems and evaluation of opportunities to expand service offerings in the Southeast PA market • Lending and other business development opportunities in York, PA • Branding refresh to support expansion • Proactive M&A Strategy o Continuing evaluation of new market opportunities • Target markets • Individuals and/or teams o Banking and Wealth Management • Risk Management o Continue to strengthen enterprise risk management programs consistent with size and complexity of the company o Current emphasis on addressing changes related to activity in new markets
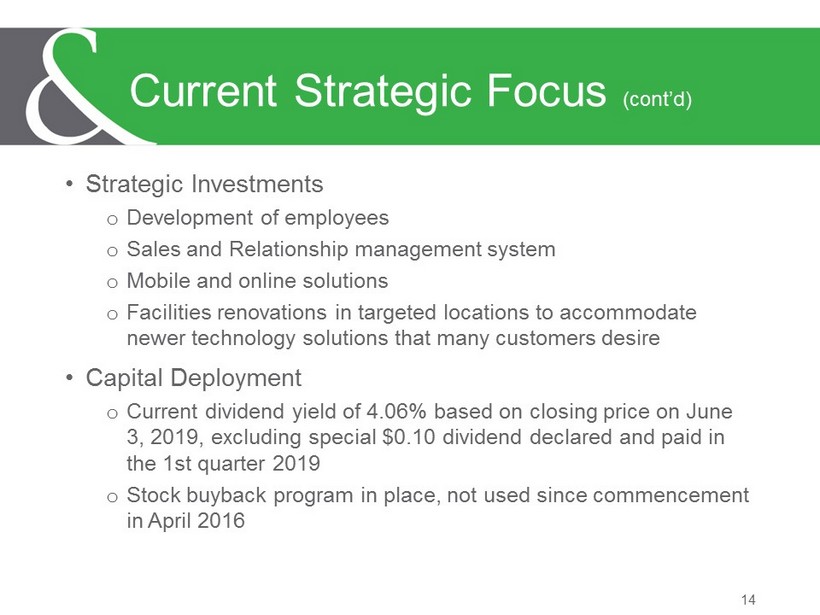
• Strategic Investments o Development of employees o Sales and Relationship management system o Mobile and online solutions o Facilities renovations in targeted locations to accommodate newer technology solutions that many customers desire • Capital Deployment o Current dividend yield of 4.06% based on closing price on June 3, 2019, excluding special $0.10 dividend declared and paid in the 1st quarter 2019 o Stock buyback program in place, not used since commencement in April 2016 14 Current Strategic Focus (cont’d)
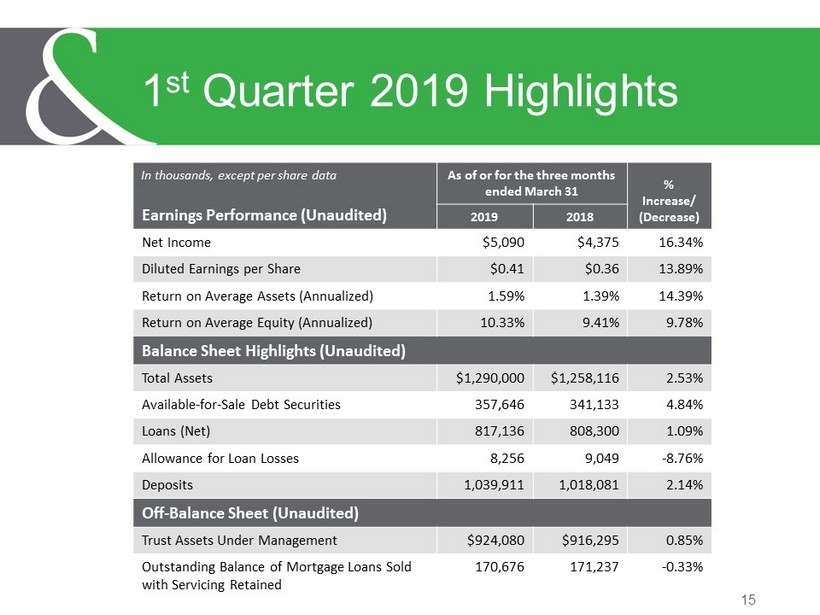
15 1 st Quarter 2019 Highlights Earnings Performance (Unaudited) As of or for the three months ended March 31 % Increase/ (Decrease) 2019 2018 Net Income $5,090 $4,375 16.34% Diluted Earnings per Share $0.41 $0.36 13.89% Return on Average Assets (Annualized) 1.59% 1.39% 14.39% Return on Average Equity (Annualized) 10.33% 9.41% 9.78% Balance Sheet Highlights (Unaudited) Total Assets $1,290,000 $1,258,116 2.53% Available - for - Sale Debt Securities 357,646 341,133 4.84% Loans (Net) 817,136 808,300 1.09% Allowance for Loan Losses 8,256 9,049 - 8.76% Deposits 1,039,911 1,018,081 2.14% Off - Balance Sheet (Unaudited) Trust Assets Under Management $924,080 $916,295 0.85% Outstanding Balance of Mortgage Loans Sold with Servicing Retained 170,676 171,237 - 0.33% In thousands, except per share data
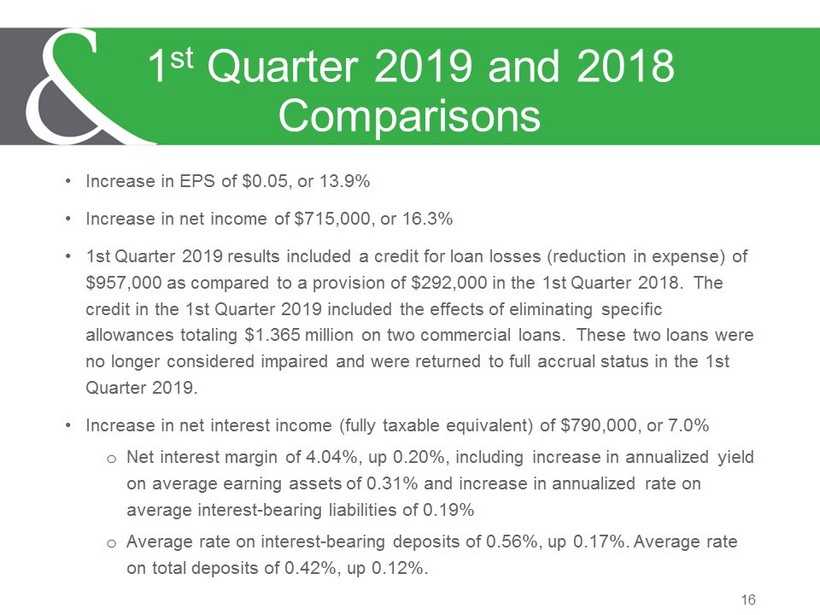
• Increase in EPS of $0.05, or 13.9% • Increase in net income of $715,000, or 16.3% • 1st Quarter 2019 results included a credit for loan losses (reduction in expense) of $957,000 as compared to a provision of $292,000 in the 1st Quarter 2018. The credit in the 1st Quarter 2019 included the effects of eliminating specific allowances totaling $1.365 million on two commercial loans. These two loans were no longer considered impaired and were returned to full accrual status in the 1st Quarter 2019. • Increase in net interest income (fully taxable equivalent) of $790,000, or 7.0% o Net interest margin of 4.04%, up 0.20%, including increase in annualized yield on average earning assets of 0.31% and increase in annualized rate on average interest - bearing liabilities of 0.19% o Average rate on interest - bearing deposits of 0.56%, up 0.17%. Average rate on total deposits of 0.42%, up 0.12%. 16 1 st Quarter 2019 and 2018 Comparisons
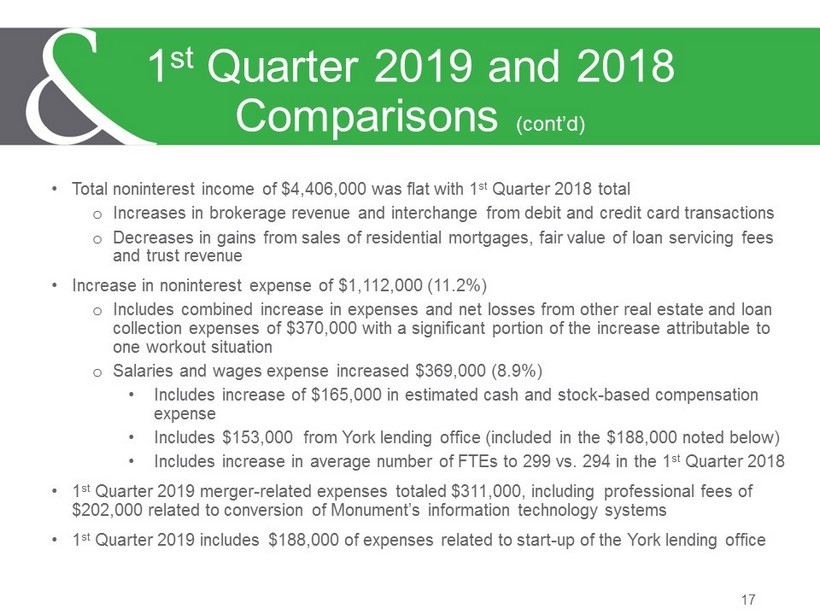
17 1 st Quarter 2019 and 2018 Comparisons (cont’d) • Total noninterest income of $4,406,000 was flat with 1 st Quarter 2018 total o Increases in brokerage revenue and interchange from debit and credit card transactions o Decreases in gains from sales of residential mortgages, fair value of loan servicing fees and trust revenue • Increase in noninterest expense of $1,112,000 (11.2%) o Includes combined increase in expenses and net losses from other real estate and loan collection expenses of $370,000 with a significant portion of the increase attributable to one workout situation o Salaries and wages expense increased $369,000 (8.9%) • Includes increase of $165,000 in estimated cash and stock - based compensation expense • Includes $153,000 from York lending office (included in the $188,000 noted below) • Includes increase in average number of FTEs to 299 vs. 294 in the 1 st Quarter 2018 • 1 st Quarter 2019 merger - related expenses totaled $311,000, including professional fees of $202,000 related to conversion of Monument’s information technology systems • 1 st Quarter 2019 includes $188,000 of expenses related to start - up of the York lending office

Commercial 42.5% Consumer 2.1% Residential 55.4% 18 Loan Portfolio Diversification and Yield LOAN PORTFOLIO – as of 3/31/19 Dollars in thousands Amount % of Total Residential mortgage loans - first liens $374,764 45.4% Residential mortgage loans - junior liens 25,538 3.1% Home equity lines of credit 32,847 4.0% 1 - 4 Family residential construction 24,437 3.0% Total Residential Mortgage 457,586 55.4% Commercial loans secured by real estate 160,177 19.4% Commercial and industrial 92,842 11.2% Political subdivisions 52,142 6.3% Commercial construction and land 12,701 1.5% Loans secured by farmland 7,397 0.9% Multi - family (5 or more) residential 7,031 0.9% Agricultural loans 5,471 0.7% Other commercial loans 13,467 1.6% Total Commercial 350,769 42.5% Total Consumer 17,037 2.1% TOTAL $825,392 100.0% Total participation loans¹ $68,418 8.3% ¹ Participation loans are included in the commercial segment in the table above. Average Loans and Yield Info (Dollars in thousands) YTD March 2019 YTD March 2018 % Increase Taxable $751,172 $740,655 1.4% Tax - Exempt 72,574 76,242 - 4.8% Average Total Loans $823,746 $816,897 0.8% Annualized Yields²: Taxable 5.37% 5.04% Tax - Exempt 3.97% 3.72% Avg. Yield on Ttl Loans 5.25% 4.92% ² Annualized yields on loans are presented on a fully taxable - equivalent basis, using the Corporation’s marginal tax income tax rate of 21%. Nonaccrual loans have been included with loans for the purpose of analyzing interest earnings. Source: Company documents
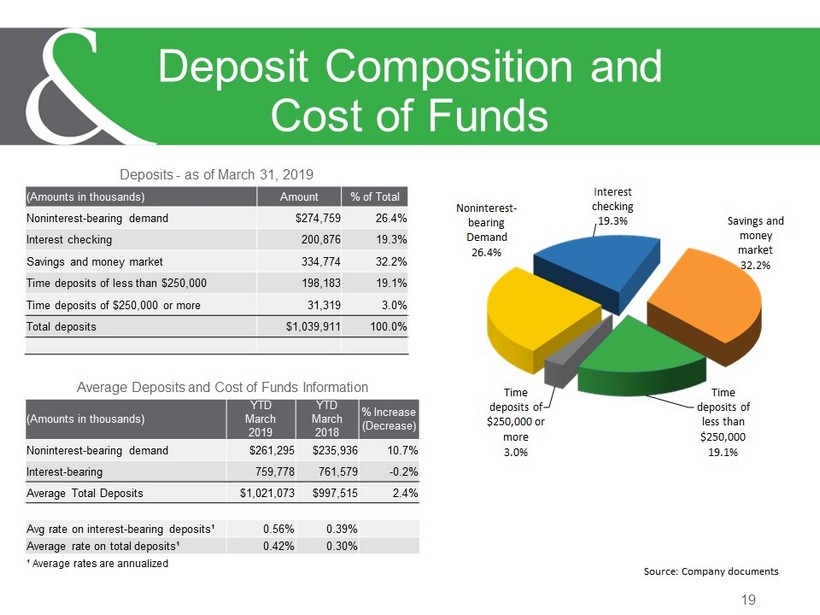
19 Deposit Composition and Cost of Funds Deposits - as of March 31, 2019 (Amounts in thousands) Amount % of Total Noninterest - bearing demand $274,759 26.4% Interest c hecking 200,876 19.3% Savings and money market 334,774 32.2% Time deposits of less than $250,000 198,183 19.1% Time deposits of $250,000 or more 31,319 3.0% Total deposits $1,039,911 100.0% Average Deposits and Cost of Funds Information (Amounts in thousands) YTD March 2019 YTD March 2018 % Increase (Decrease) Noninterest - bearing demand $261,295 $235,936 10.7% Interest - bearing 759,778 761,579 - 0.2% Average Total Deposits $1,021,073 $997,515 2.4% Avg rate on interest - bearing deposits¹ 0.56% 0.39% Average rate on total deposits¹ 0.42% 0.30% ¹ Average rates are annualized Time deposits of less than $250,000 19.1% Time deposits of $250,000 or more 3.0% Noninterest - bearing Demand 26.4% Interest checking 19.3% Savings and money market 32.2% Source: Company documents
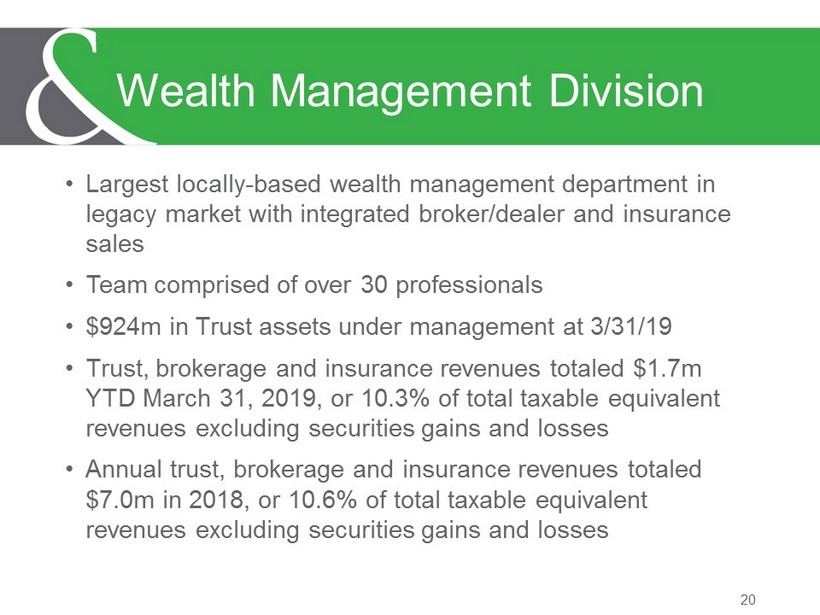
20 Wealth Management Division • Largest locally - based wealth management department in legacy market with integrated broker/dealer and insurance sales • Team comprised of over 30 professionals • $924m in Trust assets under management at 3/31/19 • Trust, brokerage and insurance revenues totaled $1.7m YTD March 31, 2019, or 10.3% of total taxable equivalent revenues excluding securities gains and losses • Annual trust, brokerage and insurance revenues totaled $7.0m in 2018, or 10.6% of total taxable equivalent revenues excluding securities gains and losses
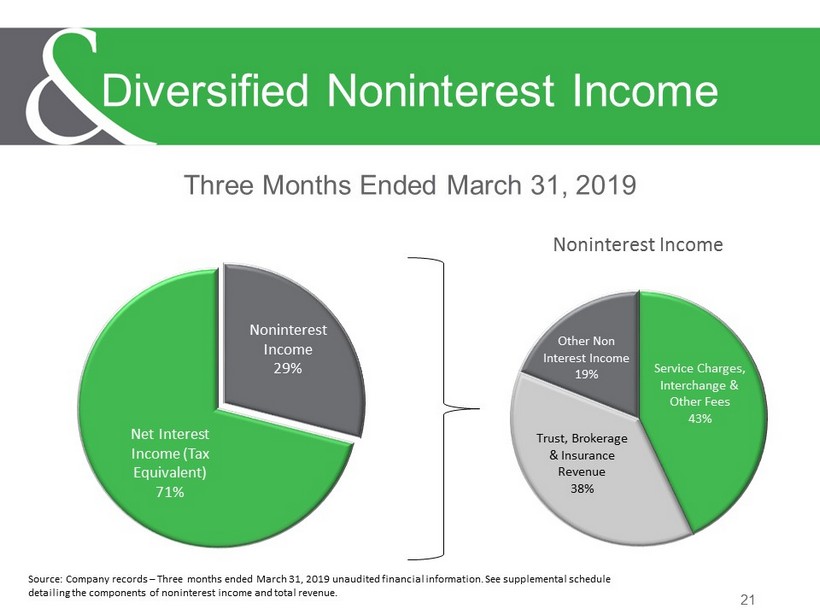
Three Months Ended March 31, 2019 21 Diversified Noninterest Income Noninterest Income 29% Net Interest Income (Tax Equivalent) 71% Service Charges, Interchange & Other Fees 43% Trust, Brokerage & Insurance Revenue 38% Other Non Interest Income 19% Noninterest Income Source: Company records – Three months ended March 31, 2019 unaudited financial information. See supplemental schedule detailing the components of noninterest income and total revenue.
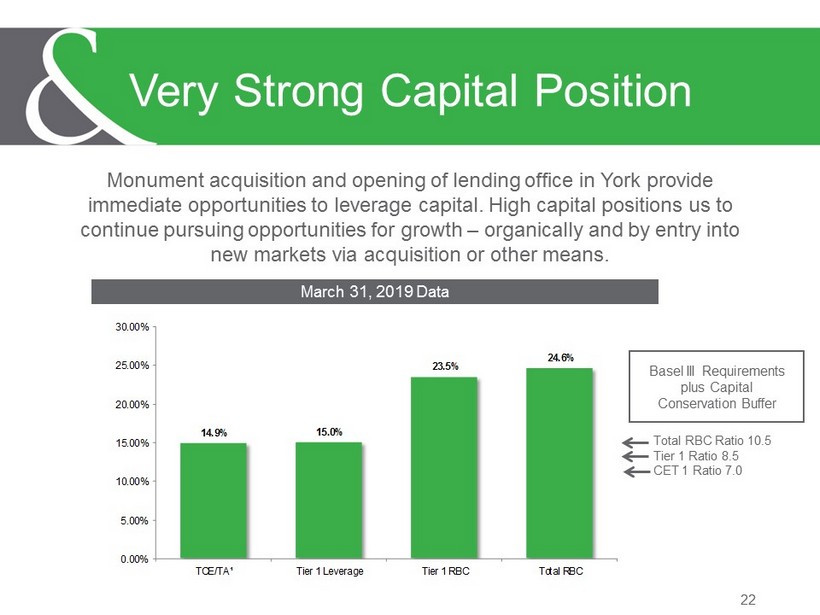
Monument acquisition and opening of lending office in York provide immediate opportunities to leverage capital. High capital positions us to continue pursuing opportunities for growth – organically and by entry into new markets via acquisition or other means. 22 Very Strong Capital Position 14.9% 15.0% 23.5% 24.6% 0.00% 5.00% 10.00% 15.00% 20.00% 25.00% 30.00% TCE/TA¹ Tier 1 Leverage Tier 1 RBC Total RBC March 31, 2019 Data Basel III Requirements plus Capital Conservation Buffer Total RBC Ratio 10.5 Tier 1 Ratio 8.5 CET 1 Ratio 7.0
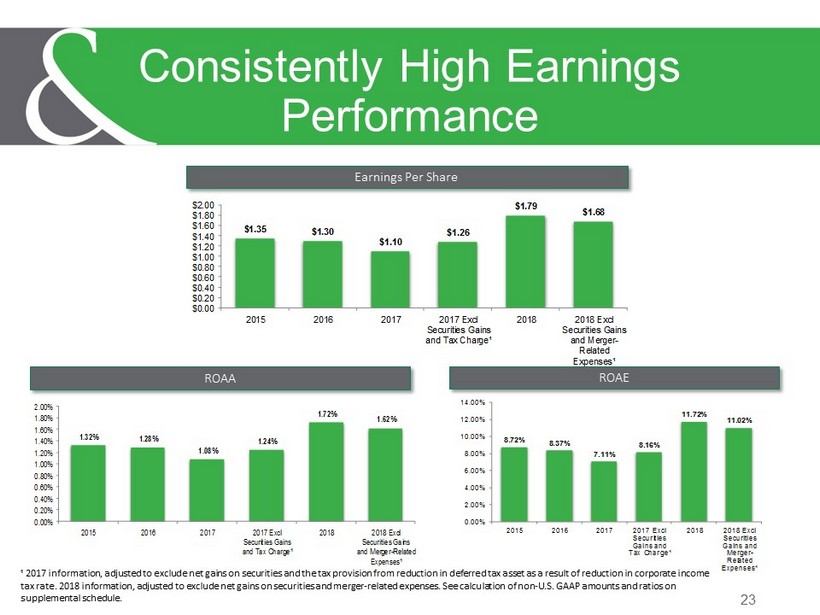
8.72% 8.37% 7.11% 8.16% 11.72% 11.02% 0.00% 2.00% 4.00% 6.00% 8.00% 10.00% 12.00% 14.00% 2015 2016 2017 2017 Excl Securities Gains and Tax Charge¹ 2018 2018 Excl Securities Gains and Merger- Related Expenses¹ 23 Consistently High Earnings Performance $1.35 $1.30 $1.10 $1.26 $1.79 $1.68 $0.00 $0.20 $0.40 $0.60 $0.80 $1.00 $1.20 $1.40 $1.60 $1.80 $2.00 2015 2016 2017 2017 Excl Securities Gains and Tax Charge¹ 2018 2018 Excl Securities Gains and Merger- Related Expenses¹ 1.32% 1.28% 1.08% 1.24% 1.72% 1.62% 0.00% 0.20% 0.40% 0.60% 0.80% 1.00% 1.20% 1.40% 1.60% 1.80% 2.00% 2015 2016 2017 2017 Excl Securities Gains and Tax Charge¹ 2018 2018 Excl Securities Gains and Merger-Related Expenses¹ Earnings Per Share ROAA ROAE ¹ 2017 information, adjusted to exclude net gains on securities and the tax provision from reduction in deferred tax asset as a result of reduction in corporate income tax rate. 2018 information, adjusted to exclude net gains on securities and merger - related expenses. See calculation of non - U.S. GAAP amounts and ratios on supplemental schedule.
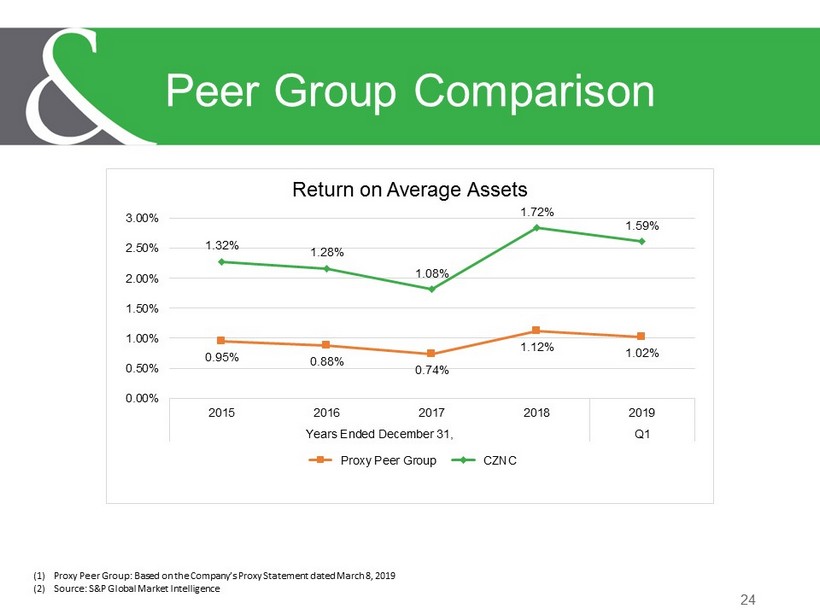
24 Peer Group Comparison 0.95% 0.88% 0.74% 1.12% 1.02% 1.32% 1.28% 1.08% 1.72% 1.59% 0.00% 0.50% 1.00% 1.50% 2.00% 2.50% 3.00% 2015 2016 2017 2018 2019 Years Ended December 31, Q1 Return on Average Assets Proxy Peer Group CZNC (1) Proxy Peer Group: Based on the Company’s Proxy Statement dated March 8, 2019 (2) Source: S&P Global Market Intelligence
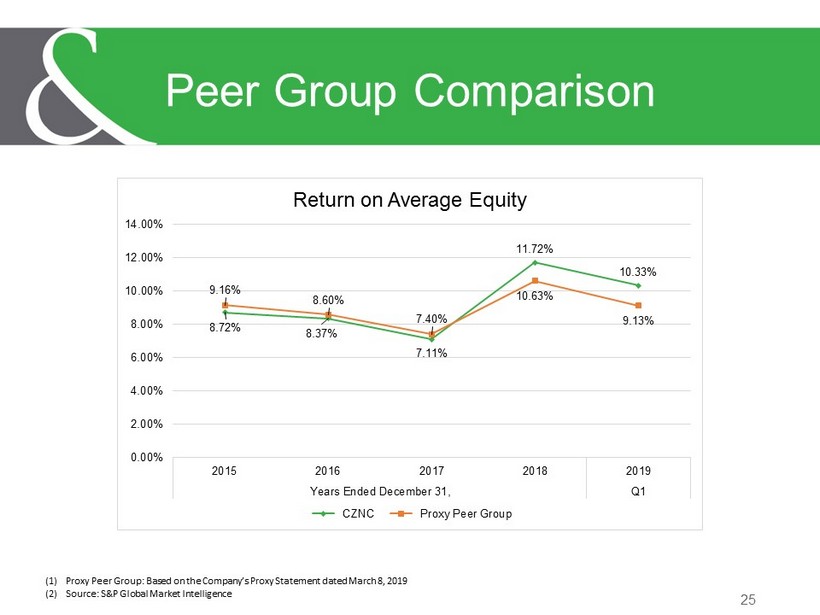
25 Peer Group Comparison (1) Proxy Peer Group: Based on the Company’s Proxy Statement dated March 8, 2019 (2) Source: S&P Global Market Intelligence 8.72% 8.37% 7.11% 11.72% 10.33% 9.16% 8.60% 7.40% 10.63% 9.13% 0.00% 2.00% 4.00% 6.00% 8.00% 10.00% 12.00% 14.00% 2015 2016 2017 2018 2019 Years Ended December 31, Q1 Return on Average Equity CZNC Proxy Peer Group
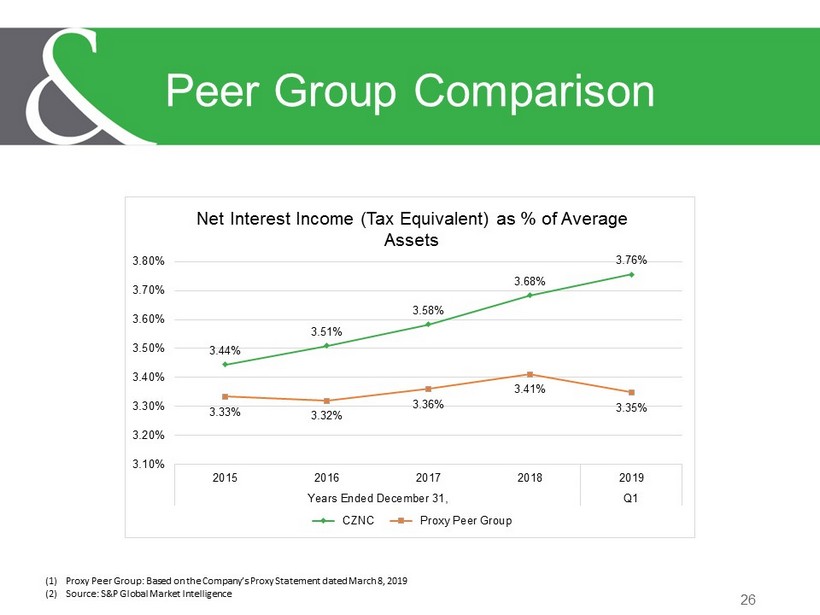
26 Peer Group Comparison 3.44% 3.51% 3.58% 3.68% 3.76% 3.33% 3.32% 3.36% 3.41% 3.35% 3.10% 3.20% 3.30% 3.40% 3.50% 3.60% 3.70% 3.80% 2015 2016 2017 2018 2019 Years Ended December 31, Q1 Net Interest Income (Tax Equivalent) as % of Average Assets CZNC Proxy Peer Group (1) Proxy Peer Group: Based on the Company’s Proxy Statement dated March 8, 2019 (2) Source: S&P Global Market Intelligence
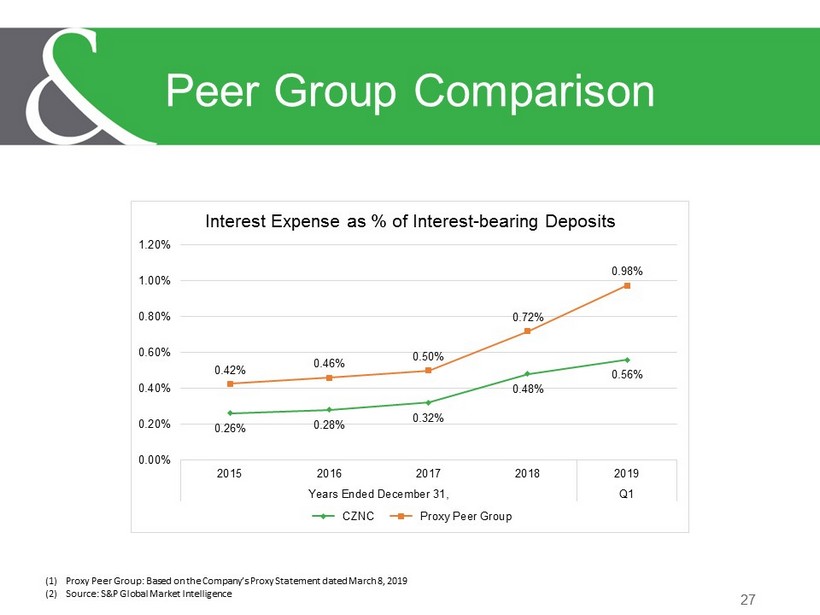
27 Peer Group Comparison 0.26% 0.28% 0.32% 0.48% 0.56% 0.42% 0.46% 0.50% 0.72% 0.98% 0.00% 0.20% 0.40% 0.60% 0.80% 1.00% 1.20% 2015 2016 2017 2018 2019 Years Ended December 31, Q1 Interest Expense as % of Interest - bearing Deposits CZNC Proxy Peer Group (1) Proxy Peer Group: Based on the Company’s Proxy Statement dated March 8, 2019 (2) Source: S&P Global Market Intelligence

Noninterest Revenue & Expense Data 28 Peer Group Comparison 1.23% 1.26% 1.29% 1.42% 1.37% 0.83% 0.80% 0.77% 0.76% 0.71% 0.40% 0.60% 0.80% 1.00% 1.20% 1.40% 1.60% 2015 2016 2017 2018 2019 Years Ended December 31, Q1 Noninterest Income as % of Average Assets CZNC Proxy Peer Group 2.86% 2.83% 2.96% 3.07% 3.34% 2.72% 2.81% 2.72% 2.72% 2.71% 2.40% 2.60% 2.80% 3.00% 3.20% 3.40% 2015 2016 2017 2018 2019 Years Ended December 31, Q1 Noninterest Expense as % of Average Assets CZNC Proxy Peer Group 61.40% 59.12% 60. … 60.18% 65.17% 66.61% 65.12% 63.64% 63.94% 64.80% 56.00% 58.00% 60.00% 62.00% 64.00% 66.00% 68.00% 2015 2016 2017 2018 2019 Years Ended December 31, Q1 Efficiency Ratio (Tax Equivalent) CZNC Proxy Peer Group (1) Proxy Peer Group: Based on the Company’s Proxy Statement Dated March 8, 2019 (2) Source: S&P Global Market Intelligence
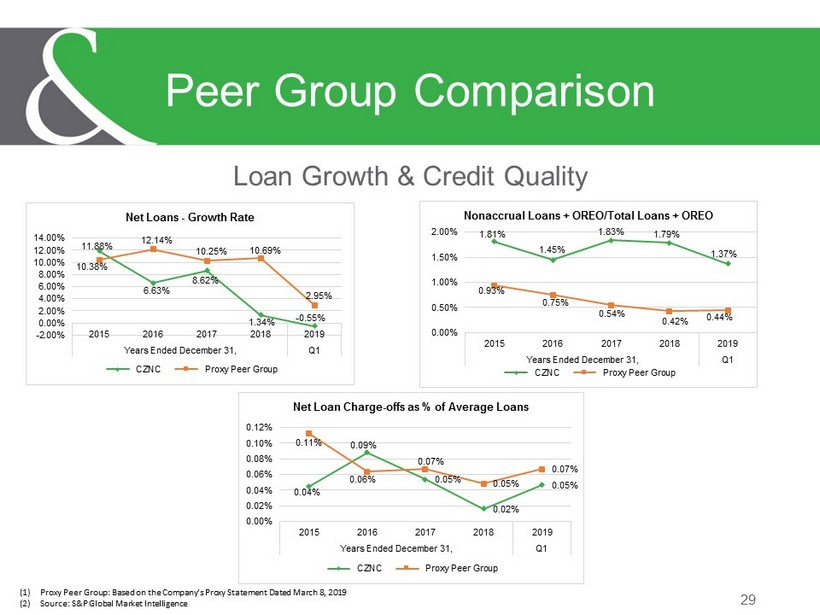
Loan Growth & Credit Quality 29 Peer Group Comparison (1) Proxy Peer Group: Based on the Company’s Proxy Statement Dated March 8, 2019 (2) Source: S&P Global Market Intelligence 11.88% 6.63% 8.62% 1.34% - 0.55% 10.38% 12.14% 10.25% 10.69% 2.95% -2.00% 0.00% 2.00% 4.00% 6.00% 8.00% 10.00% 12.00% 14.00% 2015 2016 2017 2018 2019 Years Ended December 31, Q1 Net Loans - Growth Rate CZNC Proxy Peer Group 1.81% 1.45% 1.83% 1.79% 1.37% 0.93% 0.75% 0.54% 0.42% 0.44% 0.00% 0.50% 1.00% 1.50% 2.00% 2015 2016 2017 2018 2019 Years Ended December 31, Q1 Nonaccrual Loans + OREO/Total Loans + OREO CZNC Proxy Peer Group 0.04% 0.09% 0.05% 0.02% 0.05% 0.11% 0.06% 0.07% 0.05% 0.07% 0.00% 0.02% 0.04% 0.06% 0.08% 0.10% 0.12% 2015 2016 2017 2018 2019 Years Ended December 31, Q1 Net Loan Charge - offs as % of Average Loans CZNC Proxy Peer Group
30 Investment Considerations • Leading deposit market share among community banks in North Central Pennsylvania • Well - established core deposit franchise • Consistently high earnings performance with diverse revenue sources • Disciplined credit culture and risk management profile • Very strong capital position • Poised for growth in attractive Southeast PA and York markets • Opportunity for additional growth in existing and new markets organically and through market dislocation • Experienced senior leadership team
31 Investment Considerations (cont’d) • Well - established wealth management team • Quarterly dividends declared of $0.27 per share in each of the first 2 quarters of 2019, resulting in an annualized yield of 4.06% based on market data as of 6/3/2019. 1 (Yield excludes effects of $0.10 special dividend declared and paid in the 1st quarter 2019.) • Attractive currency with valuation of 14.5x most recent Street estimate 2 ¹Source: NASDAQ.com ²Stock price based on closing price on June 3, 2019.

32 Contact Information President and CEO Brad Scovill BradleyS@cnbankpa.com 570 - 723 - 2102 Treasurer and CFO Mark Hughes MarkH@cnbankpa.com 570 - 724 - 8533 Online www.cnbankpa.com www.cntrustpa.com
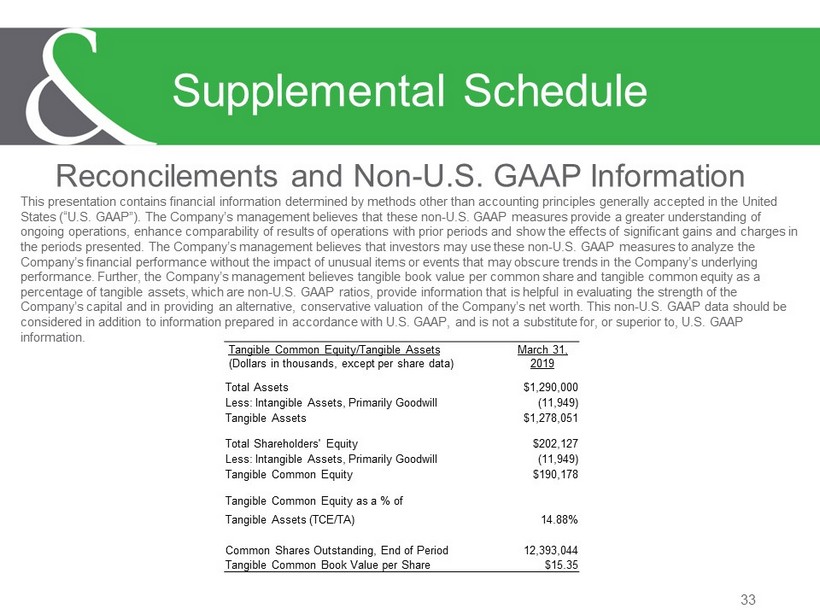
Reconcilements and Non - U.S. GAAP Information 33 Supplemental Schedule This presentation contains financial information determined by methods other than accounting principles generally accepted in th e United States (“U.S. GAAP”). The Company’s management believes that these non - U.S. GAAP measures provide a greater understanding of ongoing operations, enhance comparability of results of operations with prior periods and show the effects of significant gai ns and charges in the periods presented. The Company’s management believes that investors may use these non - U.S. GAAP measures to analyze the Company’s financial performance without the impact of unusual items or events that may obscure trends in the Company’s underl yin g performance. Further, the Company’s management believes tangible book value per common share and tangible common equity as a percentage of tangible assets, which are non - U.S. GAAP ratios, provide information that is helpful in evaluating the strength of the Company’s capital and in providing an alternative, conservative valuation of the Company’s net worth. This non - U.S. GAAP data sh ould be considered in addition to information prepared in accordance with U.S. GAAP, and is not a substitute for, or superior to, U.S . G AAP information. Tangible Common Equity/Tangible Assets (Dollars in thousands, except per share data) March 31, 2019 Total Assets $1,290,000 Less: Intangible Assets, Primarily Goodwill (11,949) Tangible Assets $1,278,051 Total Shareholders' Equity $202,127 Less: Intangible Assets, Primarily Goodwill (11,949) Tangible Common Equity $190,178 Tangible Common Equity as a % of Tangible Assets (TCE/TA) 14.88% Common Shares Outstanding, End of Period 12,393,044 Tangible Common Book Value per Share $15.35
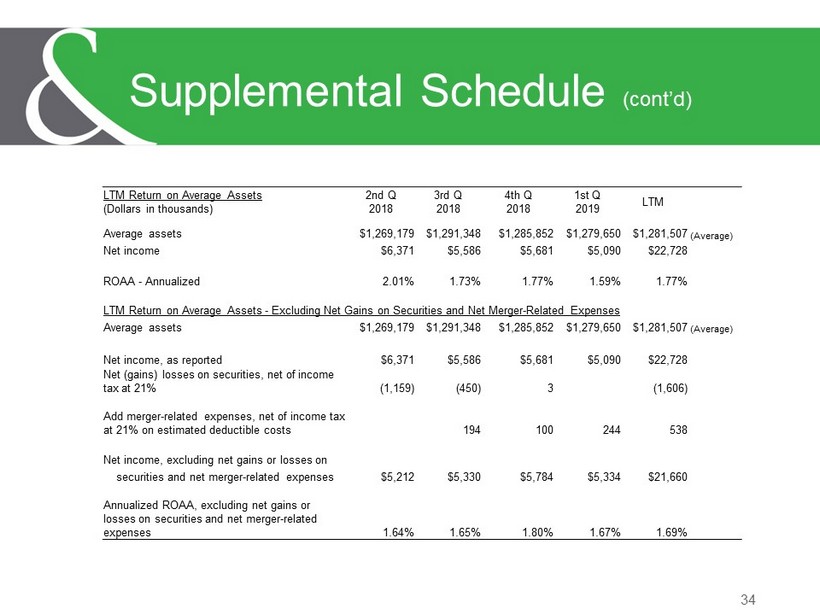
34 Supplemental Schedule (cont’d) LTM Return on Average Assets (Dollars in thousands) 2nd Q 2018 3rd Q 2018 4th Q 2018 1st Q 2019 LTM Average assets $1,269,179 $1,291,348 $1,285,852 $1,279,650 $1,281,507 (Average) Net income $6,371 $5,586 $5,681 $5,090 $22,728 ROAA - Annualized 2.01% 1.73% 1.77% 1.59% 1.77% LTM Return on Average Assets - Excluding Net Gains on Securities and Net Merger - Related Expenses Average assets $1,269,179 $1,291,348 $1,285,852 $1,279,650 $1,281,507 (Average) Net income, as reported $6,371 $5,586 $5,681 $5,090 $22,728 Net (gains) losses on securities, net of income tax at 21% (1,159) (450) 3 (1,606) Add merger - related expenses, net of income tax at 21% on estimated deductible costs 194 100 244 538 Net income, excluding net gains or losses on securities and net merger - related expenses $5,212 $5,330 $5,784 $5,334 $21,660 Annualized ROAA, excluding net gains or losses on securities and net merger - related expenses 1.64% 1.65% 1.80% 1.67% 1.69%
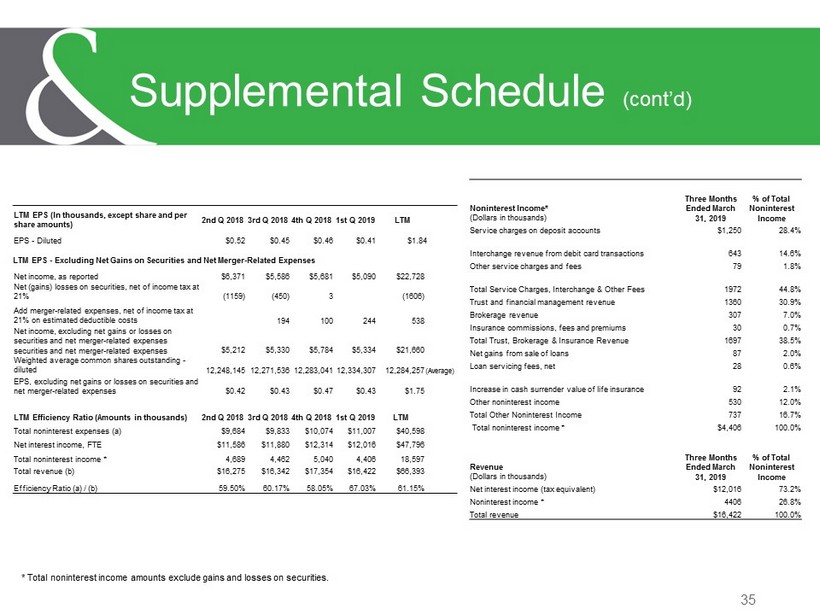
35 Supplemental Schedule (cont’d) * Total noninterest income amounts exclude gains and losses on securities. LTM EPS (In thousands, except share and per share amounts) 2nd Q 2018 3rd Q 2018 4th Q 2018 1st Q 2019 LTM EPS - Diluted $0.52 $0.45 $0.46 $0.41 $1.84 LTM EPS - Excluding Net Gains on Securities and Net Merger - Related Expenses Net income, as reported $6,371 $5,586 $5,681 $5,090 $22,728 Net (gains) losses on securities, net of income tax at 21% (1159) (450) 3 (1606) Add merger - related expenses, net of income tax at 21% on estimated deductible costs 194 100 244 538 Net income, excluding net gains or losses on securities and net merger - related expenses securities and net merger - related expenses $5,212 $5,330 $5,784 $5,334 $21,660 Weighted average common shares outstanding - diluted 12,248,145 12,271,536 12,283,041 12,334,307 12,284,257 (Average) EPS, excluding net gains or losses on securities and net merger - related expenses $0.42 $0.43 $0.47 $0.43 $1.75 LTM Efficiency Ratio (Amounts in thousands) 2nd Q 2018 3rd Q 2018 4th Q 2018 1st Q 2019 LTM Total noninterest expenses (a) $9,684 $9,833 $10,074 $11,007 $40,598 Net interest income, FTE $11,586 $11,880 $12,314 $12,016 $47,796 Total noninterest income * 4,689 4,462 5,040 4,406 18,597 Total revenue (b) $16,275 $16,342 $17,354 $16,422 $66,393 Efficiency Ratio (a) / (b) 59.50% 60.17% 58.05% 67.03% 61.15% Noninterest Income* (Dollars in thousands) Three Months Ended March 31, 2019 % of Total Noninterest Income Service charges on deposit accounts $1,250 28.4% Interchange revenue from debit card transactions 643 14.6% Other service charges and fees 79 1.8% Total Service Charges, Interchange & Other Fees 1972 44.8% Trust and financial management revenue 1360 30.9% Brokerage revenue 307 7.0% Insurance commissions, fees and premiums 30 0.7% Total Trust, Brokerage & Insurance Revenue 1697 38.5% Net gains from sale of loans 87 2.0% Loan servicing fees, net 28 0.6% Increase in cash surrender value of life insurance 92 2.1% Other noninterest income 530 12.0% Total Other Noninterest Income 737 16.7% Total noninterest income * $4,406 100.0% Revenue (Dollars in thousands) Three Months Ended March 31, 2019 % of Total Noninterest Income Net interest income (tax equivalent) $12,016 73.2% Noninterest income * 4406 26.8% Total revenue $16,422 100.0%
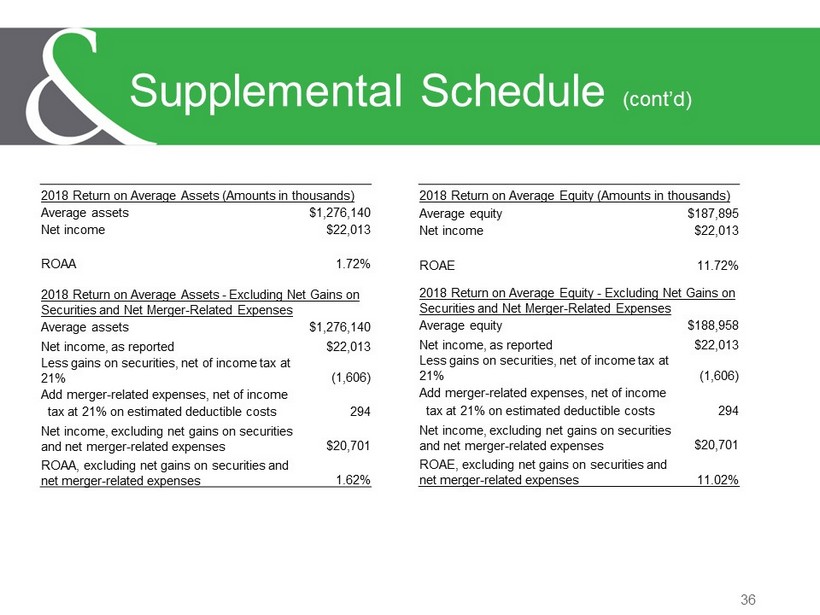
36 Supplemental Schedule (cont’d) 2018 Return on Average Assets (Amounts in thousands) Average assets $1,276,140 Net income $22,013 ROAA 1.72% 2018 Return on Average Assets - Excluding Net Gains on Securities and Net Merger - Related Expenses Average assets $1,276,140 Net income, as reported $22,013 Less gains on securities, net of income tax at 21% (1,606) Add merger - related expenses, net of income tax at 21% on estimated deductible costs 294 Net income, excluding net gains on securities and net merger - related expenses $20,701 ROAA, excluding net gains on securities and net merger - related expenses 1.62% 2018 Return on Average Equity (Amounts in thousands) Average equity $187,895 Net income $22,013 ROAE 11.72% 2018 Return on Average Equity - Excluding Net Gains on Securities and Net Merger - Related Expenses Average equity $188,958 Net income, as reported $22,013 Less gains on securities, net of income tax at 21% (1,606) Add merger - related expenses, net of income tax at 21% on estimated deductible costs 294 Net income, excluding net gains on securities and net merger - related expenses $20,701 ROAE, excluding net gains on securities and net merger - related expenses 11.02%
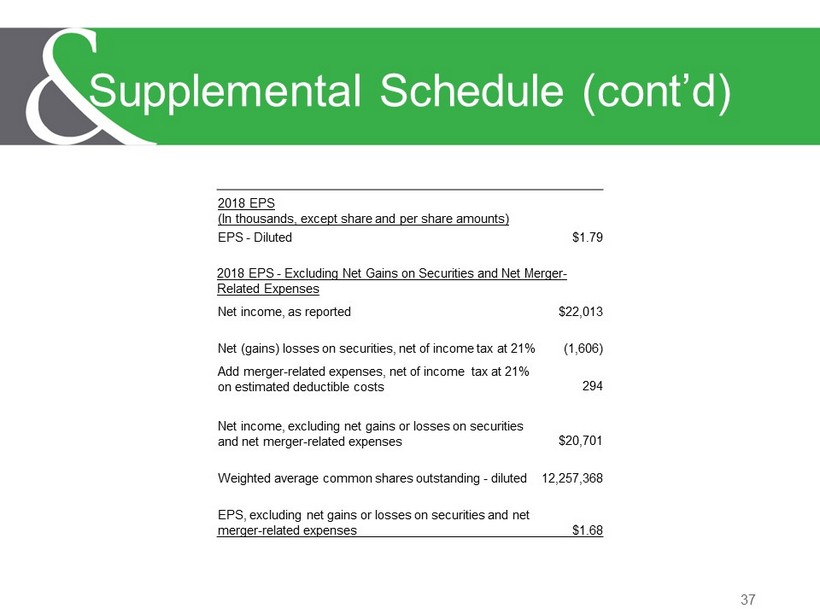
37 Supplemental Schedule (cont’d) 2018 EPS (In thousands, except share and per share amounts) EPS - Diluted $1.79 2018 EPS - Excluding Net Gains on Securities and Net Merger - Related Expenses Net income, as reported $22,013 Net (gains) losses on securities, net of income tax at 21% (1,606) Add merger - related expenses, net of income tax at 21% on estimated deductible costs 294 Net income, excluding net gains or losses on securities and net merger - related expenses $20,701 Weighted average common shares outstanding - diluted 12,257,368 EPS, excluding net gains or losses on securities and net merger - related expenses $1.68
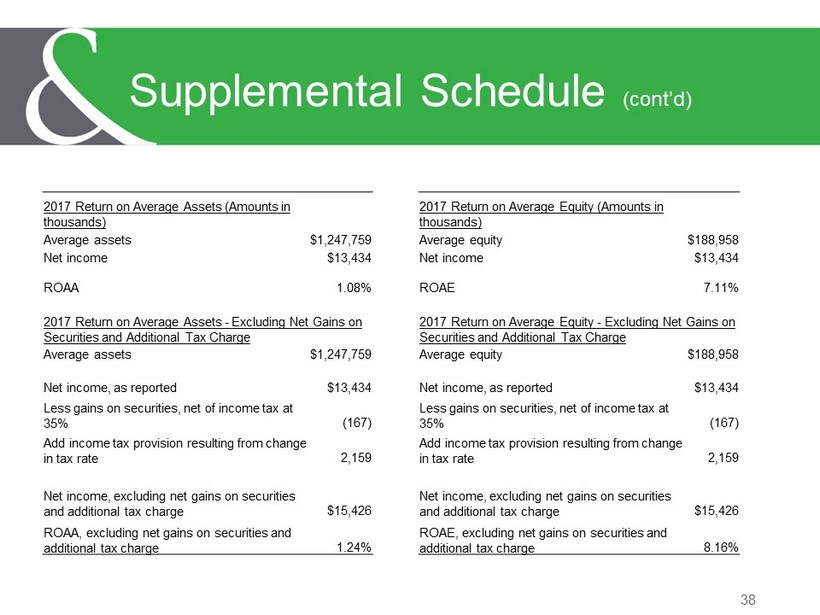
38 Supplemental Schedule (cont’d) 2017 Return on Average Assets (Amounts in thousands) Average assets $1,247,759 Net income $13,434 ROAA 1.08% 2017 Return on Average Assets - Excluding Net Gains on Securities and Additional Tax Charge Average assets $1,247,759 Net income, as reported $13,434 Less gains on securities, net of income tax at 35% (167) Add income tax provision resulting from change in tax rate 2,159 Net income, excluding net gains on securities and additional tax charge $15,426 ROAA, excluding net gains on securities and additional tax charge 1.24% 2017 Return on Average Equity (Amounts in thousands) Average equity $188,958 Net income $13,434 ROAE 7.11% 2017 Return on Average Equity - Excluding Net Gains on Securities and Additional Tax Charge Average equity $188,958 Net income, as reported $13,434 Less gains on securities, net of income tax at 35% (167) Add income tax provision resulting from change in tax rate 2,159 Net income, excluding net gains on securities and additional tax charge $15,426 ROAE, excluding net gains on securities and additional tax charge 8.16%
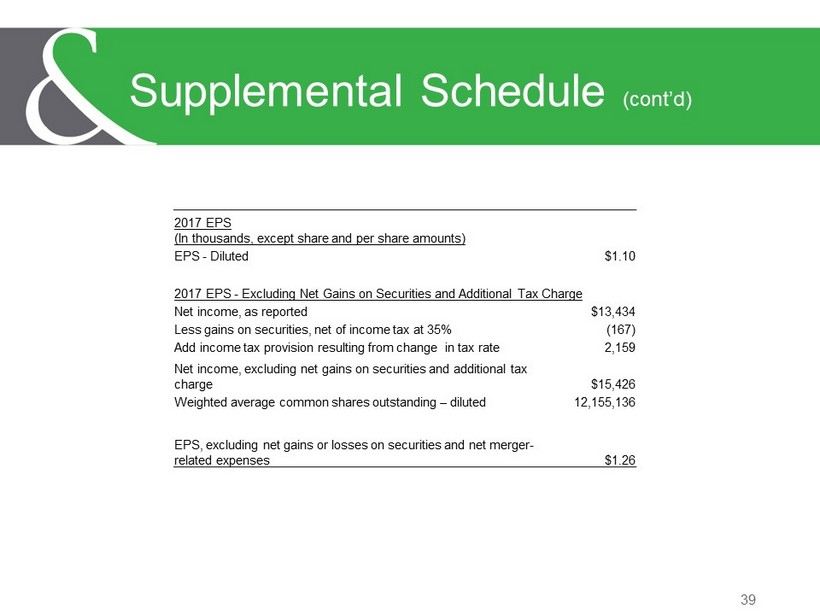
39 Supplemental Schedule (cont’d) 2017 EPS (In thousands, except share and per share amounts) EPS - Diluted $1.10 2017 EPS - Excluding Net Gains on Securities and Additional Tax Charge Net income, as reported $13,434 Less gains on securities, net of income tax at 35% (167) Add income tax provision resulting from change in tax rate 2,159 Net income, excluding net gains on securities and additional tax charge $15,426 Weighted average common shares outstanding – diluted 12,155,136 EPS, excluding net gains or losses on securities and net merger - related expenses $1.26