Exhibit 99.10

Communications
9th Floor, Edmonton Federal Building
9820 – 107 Street NW
Edmonton, Alberta, T5K 1E7
Telephone: (780) 427-5364
Toll-free within Alberta: 310-0000 then (780) 427-5364
E-mail: TBF.Communications@gov.ab.ca
For electronic copies of Budget 2018: Fiscal Plan
visit our website at:
www.alberta.ca/budget-documents.aspx
ISBN 978-1-4601-3833-5 (Print)
ISBN 978-1-4601-3834-2 (Electronic PDF)
ISSN 2369-0119 (Print)
ISSN 2369-0127 (Online)
Copyright © 2018 President of Treasury Board and Minister of Finance and its licensors. All rights reserved.
2018–21
Fiscal Plan
PRESENTED BY
JOE CECI PRESIDENT OF TREASURY BOARD AND MINISTER OF FINANCE
in the Legislative Assembly of Alberta March 22, 2018 |
Accountability Statement
The government’s Fiscal Plan for the three years commencing April 1, 2018 was prepared under my direction in accordance with the Fiscal Planning and Transparency Act and the government’s accounting policies. All of the government’s policy decisions as of March 7, 2018 with material economic or fiscal implications have been considered in preparing the three-year Fiscal Plan.
Original signed by
Joe Ceci
President of Treasury Board and Minister of Finance
March 15, 2018
2 FISCAL PLAN 2018 – 21
Fiscal Plan 2018 – 21
Overview | 4 | |||
Expense | 16 | |||
Revenue | 41 | |||
Capital Plan | 55 | |||
Path to Balance | 68 | |||
Economic Outlook | 85 | |||
Tax Plan | 116 | |||
Fiscal Plan Tables | 131 | |||
Response to the Auditor General | 151 | |||
NOTE: Amounts presented in tables and charts may not add to totals due to rounding.
| FISCAL PLAN 2018 – 21 | 3 |
Fiscal Plan
Overview
| 4 |
Table of Contents
OVERVIEW
A Recovery Built to Last | 6 | |||
Diversifying the Economy | 6 | |||
Protecting Vital Public Services | 8 | |||
Returning to Balance | 9 | |||
Revenue | 11 | |||
Expense | 11 | |||
Energy and Economic Assumptions | 13 | |||
Capital Plan | 14 | |||
Gender Budgeting | 15 | |||
| FISCAL PLAN 2018 – 20 • OVERVIEW | 5 |
Overview
A Recovery Built to Last
After the worst recession in a generation, things are looking up. Jobs are up, the deficit is down, and Alberta’s economy is growing faster than anywhere in Canada.
Budget 2018 is focused squarely on extending the recovery to all Albertans and continuing to build a more resilient, diversified and stable economy that is less vulnerable to oil price shocks - a recovery that is built to last for working people.
The plan is built on three pillars:
| ∎ | Diversifying the Economy – fighting for market access, adding value to our energy products and supporting new and developing industries. |
| ∎ | Protecting Vital Public Services – making sure loved ones get the care they need, young people get the best education possible, and no one is left behind. |
| ∎ | Returning to Balance – investing tax dollars where they are needed most, eliminating waste, and controlling spending to return to balance by 2023-24. |
Diversifying the Economy
A growing and diverse economy benefits all Albertans. It supports job creation and helps move Alberta off the resource revenue rollercoaster. While government continues to fight for market access, Budget 2018 includes a range of initiatives to add value to our energy products and support developing industries. These programs stimulate growth across sectors, support job creation and open doors for entrepreneurs to start and expand a business.
DIVERSIFICATION WITHIN THE ENERGY SECTOR
As we work to get needed pipelines built to access new markets and get better value for our resources, we will also do more to add value to our resources right here at home.
| ∎ | $1 billion for partial upgrading over eight years beginning in 2019-20, which includes a variety of tools such as loan guarantees and grants. Partial upgrading allows oil sands bitumen to flow through pipelines more easily, enhancing oil sands industry competitiveness by reducing costs, increasing pipeline capacity and enabling more refineries to process Alberta bitumen product. This will support construction of two to five partial upgrading facilities, representing up to $5 billion in private investment, 4,000 jobs during construction and 200 full-time jobs during operation. |

Budget 2018 supports developing
industries and job creation.
| FISCAL PLAN 2018 – 20 • OVERVIEW | 6 |

Budget 2018 launches the
Interactive Digital Media
Tax Credit.
| ∎ | $500 million in royalty credits to initiate a second phase of the successful Petrochemicals Diversification Program (PDP) that ensures companies have access to the natural gas liquids they need to grow private investment in Alberta-based natural gas processing. The intended outcome of the program is one to three world scale petrochemical facilities in Alberta, resulting in approximately $6 billion worth of new investment, creating roughly 4,000 new jobs during construction and over 200 full-time jobs once operations begin. |
| ∎ | $500 million for a Petrochemical Feedstock Infrastructure Program that encourages the construction of new extraction facilities on major pipelines to recover natural gas liquids feedstock. It is intended to encourage the development of one or two natural gas mid-stream projects to support liquids extraction with a focus on ethane extraction. The program will be a combination of loan guarantees and grants. |
DIVERSIFICATION ACROSS OUR ECONOMY
While we work to diversify our traditional strengths in the energy sector, we will also diversify by helping other sectors of the economy grow.
| ∎ | $60 million a year for two successful tax credit programs that are being extended to 2021-22 – the Alberta Investor and the Capital Investment Tax Credits. They will continue to foster new investment, encourage innovation, and accelerate growth in new industries. These two programs have already supported more than $1 billion in private sector capital projects. |
| ∎ | $20 million a year by 2020-21 for a new Interactive Digital Media Tax Credit that will attract more tech entrepreneurs to Alberta, and retain Alberta’s homegrown talent to inspire the next generation of tech innovators. |
| ∎ | 3,000 new post-secondary technology spaces over the next five years and new scholarships to support technology and other emerging sectors like life sciences, clean technology and health innovation. |
These investments will help create a recovery that is built to last for working people, ensuring that Albertans get the full value for our energy resources. At the same time, promoting economic diversification and the creation of good paying jobs.
| FISCAL PLAN 2018 – 20 • OVERVIEW | 7 |
Protecting Vital Public Services
During the downturn, government supported Albertans by investing in healthcare, education and social services and taking steps to make life more affordable for families. While the economy is now recovering, government continues to focus on these vital services and ensuring that no Albertan gets left behind.
MAKING SURE OUR LOVED ONES GET THE CARE THEY NEED
Making continued investments to support the delivery of publicly funded health programs and services. This includes capital investments in health care such as building high-quality health facilities such as the Calgary Cancer Centre and the new hospital in Edmonton and bringing on-line hundreds of continuing care beds in 2018-19 to support the shift to better community-based care.
YOUNG PEOPLE GET THE BEST EDUCATION POSSIBLE
Alberta’s young population continued to grow through the recession, so the province is fully funding enrolment growth in the K–12 education system and reducing school fees. For post-secondary students, government is extending the tuition freeze for the fourth year to keep education more affordable, and investing in 3,000 new technology spaces and providing new scholarships for technology and other emerging sectors so Alberta’s talent can thrive and prepare for the jobs of the future.
ENSURING NO ONE IS LEFT BEHIND
The Early Learning and Child Care Centre program will create an additional 4,500 affordable child care spaces that help working parents. The Alberta Child Benefit (ACB) makes life more affordable for Albertans by providing direct financial assistance to lower-income families and the Alberta Family Employment Tax Credit (AFETC) helps lower-and middle-income working families support their children. Approximately $328 million in ACB and AFETC benefits are provided in 2018-19.
A minimum wage of $15 per hour will help make sure that no Albertan has to stop at the food bank on their way home from work.
Government continues to make significant investments so Albertans with disabilities have timely and accessible services so that they are supported in leading meaningful lives in inclusive, welcoming communities. A review of the Persons with Developmental Disabilities program will ensure that Albertans living with disabilities get the right supports.
The Alberta Child Benefit
makes life more affordable.
| FISCAL PLAN 2018 – 20 • OVERVIEW | 8 |
Budget 2018 focuses tax dollars
where they are needed most to return
to balance by 2023-24.
Returning to Balance
When the price of oil collapsed, the recession hit Alberta hard. The recovery in Alberta’s economy and a growing population will increase government revenues over the path to balance. However, this is not enough. It is not until 2019-20 that government revenues of $50.6 billion are forecast to surpass the $49.4 billion in revenue reached in 2013-14. The government will focus the investment of tax dollars where they are needed most, eliminate waste, control spending and find efficiencies to balance the budget by 2023-24:
| ∎ | Managing public sector compensation which is over half of government’s annual operating expense by: |
| ● | Reaching practical agreements with labour unions; |
| ● | Continuing with a salary freeze on non-union employees in the public sector; |
| ● | Cutting the salaries and eliminating perks and bonuses for some of the highest paid executives of Alberta’s agencies, boards and commissions; and |
| ● | Keeping the size of the Alberta Public Service flat. |
| ∎ | Keeping health spending growth below growth in population and inflation. Health spending is more than 40% of government’s annual operating expense. |
| ∎ | Developing a new fiscal relationship with municipalities where grants under the Municipal Sustainability Initiative (MSI) are adjusted while the province returns to balance and a new infrastructure grant program to replace the MSI is developed, with a funding formula based on revenue sharing. |
| ∎ | Returning capital spending to normal levels as the economic recovery becomes broad-based. |
| ∎ | Dissolving or amalgamating government agencies, boards and commissions. |
| ∎ | Transforming corporate services across government including communications, finance, human resources and information technologies to deliver better services at a lower cost. |
| ∎ | Continuing to tightly manage discretionary spending across government. |
| FISCAL PLAN 2018 – 20 • OVERVIEW | 9 |
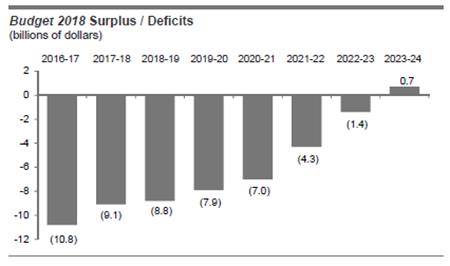
Through the implementation of the cost constraints identified above, the deficit along the path to balance improves annually to arrive at a projected surplus of $0.7 billion in 2023-24. More detail is included in the Path to Balance chapter.
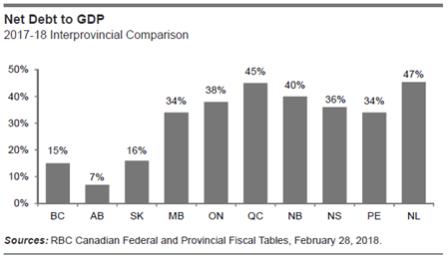
Net Debt to GDP ratio. The government is committed to maintaining one of the lowest net debt to nominal GDP ratios among the provinces.
Risk Adjustment. Alberta’s revenue is extremely volatile and difficult to predict given the volatility of the price of oil. Budget 2018 continues to include a risk adjustment factor, ensuring a level of prudence in Alberta’s budget and fiscal planning. The risk adjustment is $500 million in 2018-19 and increases to $700 million in 2019-20 and then to $1 billion in 2020-21.
Budget 2018 – Key Fiscal Metrics
(billions of dollars)
| 2016-17 | 2017-18 | 2017-18 | 2018-19 | 2019-20 | 2020-21 | |||||||||||||||||||
| Actual | Budget | Forecast | Estimate | Target | Target | |||||||||||||||||||
Total Revenue | 42.3 | 44.9 | 46.9 | 47.9 | 50.6 | 53.8 | ||||||||||||||||||
Total Expense | 53.1 | 54.9 | 55.9 | 56.2 | 57.8 | 59.8 | ||||||||||||||||||
Risk Adjustment | - | (0.5 | ) | - | (0.5 | ) | (0.7 | ) | (1.0 | ) | ||||||||||||||
Surplus / (Deficit) | (10.8 | ) | (10.5 | ) | (9.1 | ) | (8.8 | ) | (7.9 | ) | (7.0 | ) | ||||||||||||
Other Key Metrics: | ||||||||||||||||||||||||
Capital / Other Non-financial Assets | 49.4 | 52.7 | 52.0 | 53.8 | 55.3 | 56.8 | ||||||||||||||||||
Heritage Fund Year-end Balances | 15.4 | 15.7 | 15.6 | 16.0 | 16.3 | 16.6 | ||||||||||||||||||
Net Financial Assets / Net Debt | (8.9 | ) | (22.6 | ) | (20.3 | ) | (30.5 | ) | (39.8 | ) | (48.2 | ) | ||||||||||||
Net Debt to Nominal GDP Ratio | 2.8% | 7.0% | 6.0% | 8.7% | 10.8% | 12.4% | ||||||||||||||||||
| FISCAL PLAN 2018 – 20 • OVERVIEW | 10 |
Albertans pay the lowest
overall taxes in Canada.
Revenue
Alberta maintains the lowest overall tax regime in Canada, with no provincial sales tax, health premium or payroll tax. Albertans across all income ranges will continue to pay the lowest overall taxes when compared to other provinces. Alberta’s tax advantage is $11.2 billion in 2018-19. In addition, in 2018-19, the government will maintain the Education Property Tax requisition at 2017-18 levels and Alberta’s post-secondary students will benefit from a tuition freeze, for the fourth year.
Total revenue is forecast to be $47.9 billion in 2018-19, up 2.1% from 2017-18. Despite strong growth, revenue is not expected to exceed pre-recession levels until 2019-20.
Revenue growth will be led by income taxes, as stronger employment growth and higher household income will increase personal income taxes, while a robust manufacturing sector and an increase in bitumen production will boost corporate income taxes.
This increase in bitumen production will also increase non-renewable resource revenue (NRR). However, NRR in 2018-19 will still lag 2017-18 levels due to the US$7.90 per barrel estimated increase in the light-heavy oil price differential due to pipelines reaching capacity towards the end of 2017 and rail transport not being able to fill the gap.
Alberta’s share of the cannabis tax revenue is reported in other taxes. The province, through this budget, has signalled that it will have the federal government collect Alberta’s share of tax revenue from cannabis on our behalf. The Alberta Gaming and Liquor Commission (AGLC) is responsible for administering the distribution of cannabis, including online sales, which will be reported in net income from government business enterprises.
Budget 2018 – Revenue
(millions of dollars)
| 2016-17 | 2017-18 | 2017-18 | 2018-19 | 2019-20 | 2020-21 | |||||||||||||||||||
| Actual | Budget | Forecast | Estimate | Target | Target | |||||||||||||||||||
Income and Other Taxes | 20,181 | 21,762 | 21,211 | 22,899 | 24,548 | 25,995 | ||||||||||||||||||
Non-Renewable Resource Revenue | 3,097 | 3,754 | 4,534 | 3,829 | 4,183 | 5,001 | ||||||||||||||||||
Transfers from Government of Canada | 7,979 | 7,988 | 7,918 | 8,218 | 8,470 | 8,645 | ||||||||||||||||||
Investment Income | 3,698 | 2,193 | 3,061 | 2,884 | 3,161 | 3,357 | ||||||||||||||||||
Net Income from Government Business Enterprises | 543 | 2,506 | 3,294 | 2,777 | 2,707 | 2,844 | ||||||||||||||||||
Premiums, Fees and Licences | 3,701 | 3,683 | 3,742 | 3,854 | 3,929 | 3,996 | ||||||||||||||||||
Other | 3,094 | 3,032 | 3,121 | 3,419 | 3,617 | 4,010 | ||||||||||||||||||
Total Revenue | 42,293 | 44,918 | 46,881 | 47,879 | 50,615 | 53,848 | ||||||||||||||||||
Expense
As part of its plan to balance, government is committed to providing stable funding for core public services, including health care, education and social services. Government will target operating spending growth below population plus inflation, and avoid the province’s history of volatile year-to-year swings in spending. |
| FISCAL PLAN 2018 – 20 • OVERVIEW | 11 |
| ∎ | Health. Budget 2018 provides $22.1 billion for Health in 2018-19, keeping government’s commitment to provide stable funding for health care. Health’s 2018-19 budget reflects growth of 3%. This includes $87 million for addictions and mental health in 2018-19. Mental health issues affect 20 per cent of Albertans and it is estimated that over 10 per cent of the population will require addiction treatment at some point in their lives. |
| ∎ | Education. Budget 2018 provides $8.4 billion for Education in 2018-19, keeping government’s commitment to fund enrolment growth, projected at 2.2% in 2018-19. With $16 million in 2018-19, 30,000 students will receive a daily nutritious meal, up from 5,000 when the program was piloted in 2016-17. |
| ∎ | Advanced Education. Budget 2018 provides $6.1 billion for Advanced Education in 2018-19, keeping government’s commitment to provide stable, predictable funding for post-secondary education. Base operating grants for institutions will increase 2% per year, while accessibility and affordability for students improves with the fourth year of tuition freeze. |
| ∎ | Community and Social Services. Budget 2018 provides $3.7 billion for Community and Social Services in 2018-19, keeping government’s commitment to strong families and strong communities. Budget 2018 includes additional investment in the Association of Alberta Sexual Assault Services to ensure survivors of sexual assault have the supports they need. |
| ∎ | Children’s Services. Budget 2018 provides $1.5 billion for Children’s Services in 2018-19, which includes keeping government’s commitment to continue investing in improved outcomes for Alberta’s children, including 78 new Early Learning and Child Care Centres, so that 4,500 additional children and their families will have access to affordable $25-per-day child care. |
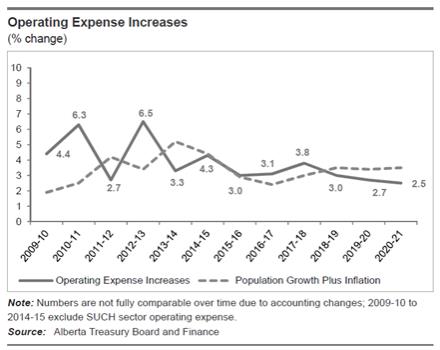
After funding to maintain core public services, operating expense increases are below forecast growth in population and inflation at 3.0% in 2018-19, 2.7% in 2019-20 and 2.5% in 2020-21. Population growth plus inflation is expected to be 3.5% in 2018-19, 3.4% in 2019-20 and 3.5% in 2020-21.
Budget 2018 – Expense1
(millions of dollars)
| 2016-17 | 2017-18 | 2017-18 | 2018-19 | 2019-20 | 2020-21 | |||||||||||||||||||
| Actual | Budget | Forecast | Estimate | Target | Target | |||||||||||||||||||
Operating expense (net of in-year savings) | 44,661 | 45,906 | 46,370 | 47,765 | 49,053 | 50,291 | ||||||||||||||||||
Climate Leadership Plan operating expense | 1,379 | 868 | 577 | 1,035 | 1,132 | 1,198 | ||||||||||||||||||
Disaster assistance (with operating 2013 flood support) | 1,191 | 235 | 495 | 206 | 200 | 200 | ||||||||||||||||||
Capital grants | 2,159 | 3,302 | 3,729 | 1,706 | 1,352 | 1,596 | ||||||||||||||||||
Climate Leadership Plan capital grants | 2 | 68 | 391 | 423 | 446 | 286 | ||||||||||||||||||
Amortization / inventory consumption / disposal loss | 3,210 | 3,375 | 3,362 | 3,434 | 3,577 | 3,677 | ||||||||||||||||||
Debt servicing costs | 1,018 | 1,398 | 1,355 | 1,921 | 2,434 | 2,937 | ||||||||||||||||||
Pension provisions | (543 | ) | (237 | ) | (332) | (310 | ) | (366 | ) | (365 | ) | |||||||||||||
Total Expense | 53,077 | 54,915 | 55,947 | 56,181 | 57,827 | 59,818 | ||||||||||||||||||
| 1 | Adjusted for government reorganization. |
| FISCAL PLAN 2018 – 20 • OVERVIEW | 12 |
Energy and Economic Assumptions
The Budget 2018 outlook is prudent and in line with other forecasts for energy prices and other economic and financial variables. A more balanced oil market is expected to support prices. WTI is expected to average US$59/bbl in 2018-19, $60 in 2019-20 and $63 in 2020-21.
The Alberta economy is well on its way to recovering from one of the worst recessions of the last 40 years. Following impressive real GDP growth estimated at 4.5% in 2017, the economy is forecast to expand by 2.7% in 2018. Rising economic activity led to a marked improvement in the labour market in 2017, with the Alberta economy recovering all of the jobs lost during the recession. This momentum is expected to carry into 2018, supporting employment growth of 2.0%. Continued improvement in the labour market, especially in the high-paying goods sector, should bolster earnings growth. As a result, household incomes this year are expected to exceed 2014 levels.
Population growth is forecast to pick up from 1.4% in 2018 to 1.6% by 2021. The improving net inflows of interprovincial migrants will add to strong immigration and natural increase. Population growth is expected to be above the national average.
Exports will drive growth in 2018, supported by rising oil sands production and an expanding manufacturing base. Beyond 2018, growth will be driven less by exports and more by households and businesses. After lagging the broader recovery in economic activity, non-residential investment starts to turn around beginning in 2019 when the economy shifts from recovery to expansion. This is expected to support real GDP growth of around 2.5% in the medium term. Investment will be aided by Government of Alberta policies aimed at diversifying the energy sector.
Energy and Economic Assumptions
| 2016-17 | 2017-18 | 2017-18 | 2018-19 | 2019-20 | 2020-21 | |||||||||||||||||||||||
| Actual | Budget | Forecast | Estimate | Target | Target | |||||||||||||||||||||||
WTI Oil (US$/bbl) | 47.93 | 55.00 | 54.00 | 59.00 | 60.00 | 63.00 | ||||||||||||||||||||||
Light-Heavy Differential (US$/bbl) | 13.93 | 16.00 | 14.50 | 22.40 | 21.00 | 22.30 | ||||||||||||||||||||||
WCS@Hardisty (Cdn$/bbl) | 44.67 | 51.30 | 50.40 | 46.00 | 48.80 | 50.90 | ||||||||||||||||||||||
Natural Gas (Cdn$/GJ) | 2.01 | 2.90 | 1.90 | 2.00 | 2.20 | 2.40 | ||||||||||||||||||||||
Conventional Crude Oil Production (000s barrels/day) | 431 | 416 | 449 | 461 | 468 | 466 | ||||||||||||||||||||||
Raw Bitumen Production (000s barrels/day) | 2,549 | 2,906 | 2,855 | 3,163 | 3,302 | 3,462 | ||||||||||||||||||||||
Exchange Rate (US¢/Cdn$) | 76.2 | 76.0 | 78.0 | 80.0 | 80.0 | 80.0 | ||||||||||||||||||||||
Interest Rate (10-year Canada bonds, %) | 1.39 | 2.00 | 1.90 | 2.50 | 2.90 | 3.10 | ||||||||||||||||||||||
| 2016 | 2017b | 2017f | 2018f | 2019f | 2020f | 2021f | ||||||||||||||||||||||
Real GDP (% change) | (3.7 | ) | 2.6 | 4.5 | 2.7 | 2.5 | 2.4 | 2.6 | ||||||||||||||||||||
Employment (% change) | (1.6 | ) | 0.9 | 1.0 | 2.0 | 1.7 | 1.8 | 1.6 | ||||||||||||||||||||
Unemployment Rate (%) | 8.1 | 8.0 | 7.8 | 6.8 | 6.2 | 5.7 | 5.3 | |||||||||||||||||||||
Primary Household Income (% change) | (7.4 | ) | 1.8 | 4.4 | 4.5 | 4.7 | 4.8 | 4.9 | ||||||||||||||||||||
Net Corporate Operating Surplus (% change) | (46.3 | ) | 66.4 | 90.6 | 19.1 | 9.8 | 19.5 | 20.2 | ||||||||||||||||||||
Alberta Consumer Price Index (% change) | 1.1 | 1.9 | 1.6 | 2.1 | 1.9 | 2.0 | 2.0 | |||||||||||||||||||||
Population (% change) | 1.4 | 1.3 | 1.2 | 1.4 | 1.5 | 1.5 | 1.6 | |||||||||||||||||||||
| FISCAL PLAN 2018 – 20 • OVERVIEW | 13 |
Capital Plan
The government chose to stimulate the economy during the downturn, through a nation-leading Capital Plan. This delivered on the recommendations from the former Bank of Canada governor David Dodge. The government took advantage of record low interest rates and cost pressures to make long-term investments and put Albertans back to work.
As the economy recovers, and consistent with Dodge’s recommendations, government is prudently returning to more normal levels of capital investment. With Alberta’s economic recovery advancing and becoming more broad-based, the Budget 2018 Capital Plan strikes the balance between continuing to deliver on critical public infrastructure projects, while not competing for resources and crowding out investment in private sector infrastructure projects.
The Budget 2018 Capital Plan is $30 billion over five years. This includes $26.6 billion for the core government and $3.3 billion for the SUCH sector. The Capital Plan provides:
| ∎ | $4.6 billion over five years for health infrastructure including the new Edmonton hospital and Calgary Cancer Centre. |
| ∎ | $2.2 billion over five years for schools that support student learning and well-being and address community needs. |
| ∎ | $2.1 billion for climate change and environmental sustainability. This includes $83 million to make sure First Nations communities in Alberta have the infrastructure necessary to bring safe, clean, reliable drinking water to people. |
| ∎ | $6.9 billion over five years for municipalities, including $0.9 billion for light rail transit. $3 billion is being committed over the next ten years for light rail transit in Edmonton and Calgary. |
| ∎ | $3.3 billion for roads and bridges to improve the flow of goods and services throughout the province and make roads safer for Albertans. |
| ∎ | $5.4 billion for capital maintenance and renewal to ensure public facilities continue to serve the needs of Albertans. |
Budget 2018 – Capital Plan
(billions of dollars)
| 2018-19 | 2019-20 | 2020-21 | 2021-22 | 2022-23 | 5-year | |||||||||||||||||||
| Estimate | Target | Target | Projected | Projected | Total | |||||||||||||||||||
Capital Plan: | ||||||||||||||||||||||||
Core Government | 5.5 | 5.2 | 5.3 | 5.9 | 4.7 | 26.6 | ||||||||||||||||||
SUCH Sector - Self-financed Investment | 0.9 | 0.7 | 0.7 | 0.5 | 0.5 | 3.3 | ||||||||||||||||||
Total Capital Plan | 6.4 | 5.9 | 6.0 | 6.4 | 5.2 | 29.9 | ||||||||||||||||||
Capital Plan Financing: | ||||||||||||||||||||||||
Direct Borrowing | 3.8 | 3.7 | 4.3 | 4.9 | 3.8 | 20.5 | ||||||||||||||||||
Alternative Financing (P3s) | 0.1 | 0.2 | 0.2 | 0.2 | 0.2 | 0.9 | ||||||||||||||||||
Other Cash Sources (e.g., retained income) | 1.1 | 0.6 | 0.5 | 0.4 | 0.3 | 2.9 | ||||||||||||||||||
Climate Leadership Plan | 0.6 | 0.7 | 0.4 | 0.3 | 0.4 | 2.4 | ||||||||||||||||||
SUCH Sector Self-financing | 0.9 | 0.7 | 0.7 | 0.5 | 0.5 | 3.3 | ||||||||||||||||||
Total Capital Plan Financing | 6.4 | 5.9 | 6.0 | 6.4 | 5.2 | 29.9 | ||||||||||||||||||
| FISCAL PLAN 2018 – 20 • OVERVIEW | 14 |
Gender Budgeting
The Government of Alberta is committed to advancing equality by allocating resources based on the needs of Alberta’s diverse population to ensure that all government initiatives, programs, policies, and services are delivered effectively to every Albertan. Gender budgeting includes providing gender analysis in business planning and annual reporting processes, as well as in policies and programs funded by government.
In 2015, government established its first stand-alone Ministry of the Status of Women, dedicated to spearheading the government’s work to advance gender equality in Alberta. Status of Women is leading the initiative to integrate Gender-based Analysis Plus (GBA+) across ministries to increase government’s capacity to apply a gender and intersectional lens to policies, programs and legislation, including budget processes. The GBA+ tool helps ensure that government’s work includes equity measures that address Albertans’ diverse needs depending on where they live, their identities, lived experiences, and abilities, to support equal outcomes.
| FISCAL PLAN 2018 – 20 • OVERVIEW | 15 |
Fiscal Plan
Expense
| FISCAL PLAN 2018 – 20 • OVERVIEW | 16 |
Table of Contents
EXPENSE
Expense | 18 | |||
Health | 19 | |||
Education: Kindergarten to Post-Secondary | 21 | |||
Social Services and Justice | 23 | |||
Indigenous Relations, Municipalities and Transportation | 28 | |||
Agriculture, Resource Management, Recreation and Culture | 29 | |||
Government Services | 32 | |||
Climate Leadership and Electricity | 33 | |||
Electricity Transition | 35 | |||
Gender Budgeting | 36 | |||
Cost Containment | 39 | |||
| FISCAL PLAN 2018 – 21 • EXPENSE | 17 |
Expense
Budget 2018 is focused squarely on extending the recovery to all Albertans and continuing to build a more resilient, diversified and stable economy that is less vulnerable to oil price shocks – a recovery that is built to last for working people.
It avoids the province’s history of volatile year-to-year swings in spending and focuses on investing tax dollars where they are needed most and targeting operating expense growth below growth in population and inflation. This is a responsible approach that continues to invest in vital public services including health care, education and social services.
Government will continue to avoid the volatile year-to-year swings of the past and target operating expense growth of 3.0% in 2018-19, 2.7% in 2019-20 and 2.5% in 2020-21. Growth in population and inflation is expected to be 3.5% in 2018-19, 3.4% in 2019-20 and 3.5% in 2020-21.
The low growth in total expense and operating expense also reflects actions government is taking to contain costs. Key actions include: managing public sector compensation through the negotiation of practical agreements with labour unions, a non-union wage freeze across the public sector and hiring restraint in the public service; implementation of strategies to manage health spending; normalizing the size of the capital plan; and a range of complementary actions to clean up waste, like reductions to discretionary spending and the review of Alberta’s agencies, boards and commissions.
Budget 2018 – Expense1
(millions of dollars)
| 2016-17 | 2017-18 | 2017-18 | 2018-19 | 2019-20 | 2020-21 | |||||||||||||||||||
| Actual | Budget | Forecast | Estimate | Target | Target | |||||||||||||||||||
Operating expense (net of in-year savings) | 44,661 | 45,906 | 46,370 | 47,765 | 49,053 | 50,291 | ||||||||||||||||||
Climate Leadership Plan operating expense | 1,379 | 868 | 577 | 1,035 | 1,132 | 1,198 | ||||||||||||||||||
Disaster assistance (with operating 2013 flood support) | 1,191 | 235 | 495 | 206 | 200 | 200 | ||||||||||||||||||
Capital grants | 2,159 | 3,302 | 3,729 | 1,706 | 1,352 | 1,596 | ||||||||||||||||||
Climate Leadership Plan capital grants | 2 | 68 | 391 | 423 | 446 | 286 | ||||||||||||||||||
Amortization / inventory consumption / disposal loss | 3,210 | 3,375 | 3,362 | 3,434 | 3,577 | 3,677 | ||||||||||||||||||
Debt servicing costs | 1,018 | 1,398 | 1,355 | 1,921 | 2,434 | 2,937 | ||||||||||||||||||
Pension provisions | (543 | ) | (237 | ) | (332) | (310 | ) | (366 | ) | (365 | ) | |||||||||||||
Total Expense | 53,077 | 54,915 | 55,947 | 56,181 | 57,827 | 59,818 | ||||||||||||||||||
| 1 | Adjusted for government reorganization. |
| FISCAL PLAN 2018 – 21 • EXPENSE | 18 |
Budget 2018 provides stable
funding for health care.
In 2016-17 and 2017-18, as Alberta recovered from a severe recession, population growth and inflation were lower than forecast at 2.4% and 3.0%, respectively. Operating expense grew 3.1% in 2016-17 and is forecast to grow at 3.8% in 2017-18, due to significant pressures on health, education and social services. The pressures resulted from high growth in specific populations such as school-aged children and Albertans with disabilities, and income support caseloads arising from the recession.
Health
The Ministry of Health provides a wide range of services that Alberta families rely on, including public health, community and home care, primary care, acute care and continuing and long-term care.
Health’s expense1 is budgeted at $22.1 billion. Budget 2018 continues the government’s ongoing commitment to provide stable funding for health care, with Health’s operating expense budget increasing by 3% in 2018-19, a reflection of government’s close management of health spending. In comparison, health spending grew by approximately 6% per year from 2008-09 to 2014-15. From 2015-16 to 2017-18, spending was contained with growth of only 3.3% a year.
KEY INVESTMENTS
Through government investments, hundreds of Continuing Care beds are expected to come on-line in 2018-19 to support the shift to community-based care.
There is $248 million budgeted in 2018-19 to support Primary Health Care, and a consolidated total of $668 million for Population and Public Health throughout the ministry.
There is $87 million budgeted for Addictions and Mental Health in 2018-19. Mental health issues affect 20% of Albertans and it is estimated that over 10% of the population will require addiction treatment at some point in their lives. Government is working closely with health and community partners to improve how programs and services are coordinated within the health sector and connected with social services such as housing and employment supports.
Opioid use continues to be an urgent public health crisis, requiring an ongoing and coordinated response across multiple levels of government, the health sector and social support organizations. In collaboration with health and community partners, the government continues to lead an aggressive response to the opioid crisis, focusing on prevention, harm reduction, targeted actions and expanded access to treatment.
1 Ministry expense, unless otherwise stated, includes as applicable, operating expense, capital grants, amortization, inventory consumption and loss on disposal of capital assets. Some ministries also have funds under Climate Leadership Plan, disaster assistance, debt servicing costs and pension provisions, which are not counted here.
| FISCAL PLAN 2018 – 21 • EXPENSE | 19 |
ALBERTA HEALTH SERVICES (AHS)
In 2018-19, a total of $15.2 billion is budgeted for AHS operations. AHS continues to drive improvements in both efficiency and outcomes for Albertans. In 2017-18, AHS implemented Operational and Clinical Best Practice initiatives, which identify opportunities for improvement through benchmarking against comparators. As a result, $37 million was recognized as costs savings in 2017-18 and these initiatives will continue in 2018-19. The shift from acute care to community-based services is also expected to help moderate long-term healthcare cost increases. As part of Budget 2018, the government is increasing investments in community care with an added emphasis on home care.
PHYSICIAN COMPENSATION AND DEVELOPMENT
Through the amended agreement with the Alberta Medical Association (AMA), the government is working cooperatively with physicians to slow
Budget 2018 increases investments
in community care with an added
emphasis on home care.
Ministry of Health – Expense
(excluding debt servicing costs, pension provisions and flood recovery initiatives)
(millions of dollars)
| 2016-17 | 2017-18 | 2017-18 | 2018-19 | 2019-20 | 2020-21 | |||||||||||||||||||
| Actual | Budget | Forecast | Estimate | Target | Target | |||||||||||||||||||
Alberta Health Services’ Operations: | ||||||||||||||||||||||||
Acute Care | 3,933 | 3,872 | 3,981 | 3,945 | 4,066 | 4,143 | ||||||||||||||||||
Support Services | 2,134 | 2,143 | 2,175 | 2,190 | 2,267 | 2,318 | ||||||||||||||||||
Diagnostic, Therapeutic and Other Patient Services | 2,102 | 2,065 | 2,106 | 2,154 | 2,216 | 2,265 | ||||||||||||||||||
Community Care | 1,239 | 1,389 | 1,336 | 1,482 | 1,543 | 1,593 | ||||||||||||||||||
Physician Compensation and Development | 1,003 | 1,013 | 1,158 | 1,146 | 1,147 | 1,149 | ||||||||||||||||||
Continuing Care | 1,031 | 1,072 | 1,047 | 1,107 | 1,133 | 1,155 | ||||||||||||||||||
Home Care | 582 | 646 | 631 | 691 | 740 | 830 | ||||||||||||||||||
Ambulance Services | 495 | 478 | 495 | 524 | 546 | 576 | ||||||||||||||||||
Administration | 476 | 503 | 494 | 509 | 514 | 518 | ||||||||||||||||||
Drugs and Supplemental Health Benefits | 450 | 462 | 450 | 496 | 533 | 566 | ||||||||||||||||||
Information Technology | 511 | 514 | 516 | 494 | 492 | 488 | ||||||||||||||||||
Population and Public Health | 332 | 336 | 333 | 332 | 336 | 339 | ||||||||||||||||||
Research and Education | 99 | 162 | 106 | 154 | 154 | 154 | ||||||||||||||||||
Alberta Health Services Sub-total | 14,387 | 14,654 | 14,828 | 15,224 | 15,687 | 16,094 | ||||||||||||||||||
Department of Health: | ||||||||||||||||||||||||
Physician Compensation and Development | 4,079 | 4,184 | 4,092 | 4,150 | 4,247 | 4,357 | ||||||||||||||||||
Drugs and Supplemental Health Benefits | 1,549 | 1,681 | 1,705 | 1,778 | 1,856 | 1,935 | ||||||||||||||||||
Population and Public Health | 228 | 346 | 317 | 336 | 347 | 375 | ||||||||||||||||||
Diagnostic, Therapeutic and Other Patient Services | 298 | 326 | 315 | 305 | 325 | 359 | ||||||||||||||||||
Acute Care | 162 | 167 | 165 | 172 | 188 | 219 | ||||||||||||||||||
Information Technology | 67 | 86 | 73 | 85 | 85 | 85 | ||||||||||||||||||
Ministry Support Services | 62 | 80 | 67 | 77 | 77 | 77 | ||||||||||||||||||
Infrastructure Support | 59 | 122 | 49 | 49 | 47 | 51 | ||||||||||||||||||
Administration | 29 | 41 | 34 | 43 | 43 | 43 | ||||||||||||||||||
Cancer Research and Prevention Investment | 8 | 12 | 1 | 13 | 13 | 16 | ||||||||||||||||||
Department of Health Sub-total | 6,541 | 7,045 | 6,818 | 7,009 | 7,229 | 7,517 | ||||||||||||||||||
Health Quality Council of Alberta | 8 | 7 | 7 | 7 | 7 | 7 | ||||||||||||||||||
Consolidation and Accounting Policy Adjustments | (255 | ) | (232 | ) | (229) | (183 | ) | (184 | ) | (182 | ) | |||||||||||||
Totals | 20,681 | 21,474 | 21,423 | 22,057 | 22,739 | 23,435 | ||||||||||||||||||
| FISCAL PLAN 2018 – 21 • EXPENSE | 20 |
Budget 2018 fully funds
enrolment growth.
spending increases while preserving access to high quality primary care for Albertans. The amending agreement with the AMA expires on March 31, 2018 and negotiations are underway on a new agreement to enable government and physicians to continue to reflect a shared responsibility to provide quality health care within a financially sustainable framework. There is a total of $5.3 billion budgeted in 2018-19 for various compensation and development programs for physicians and medical residents. This includes physicians employed by AHS and those on a fee for service contract.
DRUGS AND SUPPLEMENTAL HEALTH BENEFITS
Budget 2018 budgets a total of $2.3 billion for drugs and supplemental benefits in 2018-19, including $575 million for prescription drugs and $130 million in dental, optical and other supplemental health benefits for seniors. This budget also includes a total of $337 million for outpatient cancer and specialized high cost drugs. A new collaborative funding agreement between the province and the Alberta Pharmacists’ Association will save $150 million over the next two years, and reducing the cost of generic drug prices continues to be an important focus.
Education: Kindergarten to Post-Secondary
EDUCATION
Education’s expense is budgeted at $8.4 billion. Alberta’s young population continued to grow through the recession and government is continuing to fully fund enrolment growth, expand the school nutrition program, and invest in safe, caring, and inclusive classrooms so that our students get the best education possible.
In Budget 2018, $6.2 billion is committed for public Early Childhood Services to Grade 12 instruction. This funds enrolment growth of 2.2%, or nearly 15,000 students, in 2018-19. Enrolment growth of 2.5% is forecast in each year of
Ministry of Education – Expense
(excluding debt servicing costs and pension provisions)
(millions of dollars)
| 2016-17 | 2017-18 | 2017-18 | 2018-19 | 2019-20 | 2020-21 | |||||||||||||||||||
| Actual | Budget | Forecast | Estimate | Target | Target | |||||||||||||||||||
School Board Operations: | ||||||||||||||||||||||||
Instruction – Early Childhood Services to Grade 12 | 6,011 | 6,040 | 6,052 | 6,208 | 6,425 | 6,622 | ||||||||||||||||||
Operations and Maintenance | 756 | 746 | 719 | 723 | 730 | 745 | ||||||||||||||||||
School Facilities Amortization | 329 | 364 | 364 | 347 | 347 | 348 | ||||||||||||||||||
Student Transportation | 348 | 351 | 348 | 353 | 361 | 365 | ||||||||||||||||||
Governance and System Administration | 249 | 249 | 249 | 249 | 249 | 249 | ||||||||||||||||||
Program Support Services | 94 | 93 | 93 | 94 | 95 | 95 | ||||||||||||||||||
School Board Operations Sub-total | 7,787 | 7,843 | 7,825 | 7,974 | 8,207 | 8,424 | ||||||||||||||||||
Accredited Private Schools and ECS Operators | 261 | 263 | 268 | 274 | 284 | 292 | ||||||||||||||||||
Departmental Program Support and Amortization | 101 | 118 | 117 | 118 | 119 | 119 | ||||||||||||||||||
Ministry Support Services | 13 | 12 | 12 | 11 | 11 | 11 | ||||||||||||||||||
School Facilities (includes planning) | - | 3 | 3 | 2 | 2 | 2 | ||||||||||||||||||
Consolidation Adjustments | (41) | (22) | (22) | (22) | (22) | (22) | ||||||||||||||||||
Totals | 8,120 | 8,216 | 8,202 | 8,356 | 8,601 | 8,825 | ||||||||||||||||||
| FISCAL PLAN 2018 – 21 • EXPENSE | 21 |
2019-20 and 2020-21. Also included is $461 million for inclusive education to ensure that no student gets left behind. In addition, school authorities will support the establishment of Gay Straight Alliances to help ensure students feel safe and welcome at school.
We owe it to our students to provide them the best education possible, which requires a modern curriculum. The Ministry of Education will continue to develop and prepare for the implementation of a new provincial curriculum for Kindergarten to Grade 12, in English and French. The ministry will continue to take action to ensure that our students succeed in mathematics.
Working collaboratively with Indigenous communities continues to be a priority for the ministry. Budget 2018 will invest more than $80 million in each of the next three years to ensure all students, teachers and school leaders learn about First Nations, Métis and Inuit perspectives and experiences, treaties, agreements and the history and legacy of residential schools. Included is funding of $37 million per year to support key initiatives to strengthen educational outcomes and create opportunities for Indigenous students, including the Innovation in First Nations Education (IFNE) grant program.
To ensure our students have safe schools, in 2018-19, $723 million is allocated to operate and maintain schools and $353 million is allocated to support student transportation services.
In 2016-17, a school nutrition program was piloted with 14 public and separate school authorities. Each authority received $250,000 in grant funding and more than 5,000 students in 33 schools received a daily nutritious meal. In the 2017-18 school year, $10 million was allocated to the school nutrition program as the program expanded to all school boards in the province. More than 22,000 students in over 210 schools participated in the program. Students receive a daily nutritious meal that follows the Alberta Nutrition Guidelines for Children and Youth. $16 million is allocated for the 2018-19 school year and is expected to provide daily meals to approximately 30,000 students.
ADVANCED EDUCATION
Through investments in post-secondary institutions, First Nations colleges, and community adult learning providers, the Ministry of Advanced Education supports high quality adult education, innovation and research,
The school nutrition program
will feed about 30,000 students.
Ministry of Advanced Education – Expense
(excluding debt servicing costs and pension provisions)
(millions of dollars)
| 2016-17 | 2017-18 | 2017-18 | 2018-19 | 2019-20 | 2020-21 | |||||||||||||||||||
| Actual | Budget | Forecast | Estimate | Target | Target | |||||||||||||||||||
Post-Secondary Operations | 5,451 | 5,598 | 5,596 | 5,747 | 5,893 | 6,092 | ||||||||||||||||||
Student Aid | 221 | 243 | 223 | 228 | 235 | 241 | ||||||||||||||||||
Other Support for Adult Learning | 73 | 76 | 75 | 78 | 82 | 82 | ||||||||||||||||||
Foundational Learning Supports | 79 | 85 | 90 | 94 | 105 | 112 | ||||||||||||||||||
Apprenticeship Delivery | 28 | 32 | 31 | 31 | 38 | 38 | ||||||||||||||||||
Ministry Support Services | 14 | 15 | 15 | 15 | 15 | 15 | ||||||||||||||||||
Consolidation Adjustments | (8) | (57) | (57) | (51) | (51) | (51) | ||||||||||||||||||
Totals | 5,857 | 5,991 | 5,973 | 6,142 | 6,316 | 6,530 | ||||||||||||||||||
| FISCAL PLAN 2018 – 21 • EXPENSE | 22 |
$31 million is
budgeted for delivery of
apprenticeship programs.
skills development, apprenticeship, literacy and foundational training for all Albertans. Budget 2018 keeps government’s commitments to provide stable and predictable funding to institutions and ensure the post-secondary system is accessible and affordable for Alberta students and families by extending the tuition freeze into a fourth year.
Advanced Education’s expense is budgeted at $6.1 billion, which includes $2.4 billion in support for post-secondary institutions, including a 2% increase from last year and an additional $17 million in back-fill funding to provide for the continuation of the tuition freeze. Budget 2018 provides $6 million to begin investing in 3,000 new technology-related post-secondary program seats, which will grow to $43 million per year by 2022-23. New funding will attract investment to the province and bolster programs that will help create good jobs for everyday Albertans and enhanced training to grow a high-tech workforce. Coupled with this, the ministry will provide new scholarships that grow to $7 million per year by 2022-23 to support technology and other emerging sectors like life sciences, clean technology and health innovation. Alberta’s Student Aid and Foundational Learning programs ensure affordable post-secondary education by providing financial supports to adult learners to enable access and encourage progression in post-secondary, apprenticeship, and foundational learning programs.
Budget 2018 continues to provide funding to public post-secondary institutions to enhance their capacity to provide supports, services and accommodations for all backgrounds and abilities. Investments in supports for Indigenous adult learners, including $11 million for Indigenous training providers and targeted financial supports for learners, will ensure that Indigenous students have meaningful and relevant learning experiences.
Fostering healthy and safe campuses continues to be a priority. Funding of $8 million is provided to ensure that mental health supports are accessible and available when post-secondary students need them.
Apprenticeship delivery funding of $31 million allows Alberta’s apprenticeship system to ensure the next generation of skilled tradespeople receive the training and work experience they need to meet future jobsite demands and support the economic recovery.
Social Services and Justice
COMMUNITY AND SOCIAL SERVICES
The Ministry of Community and Social Services provides adaptive, innovative and person-centred programs and services to ensure that all Albertans are enabled and empowered to be successful.
Community and Social Services’ expense is budgeted at $3.7 billion. There is $1.3 billion allocated in 2018-19 for the delivery of disability services programs, including persons with developmental disabilities, family support for children with disabilities and fetal alcohol spectrum disorder initiatives. Also included is a newly established disability advocate who will be responsible for promoting the rights and interests of people with disabilities while examining broader issues affecting the community. This represents an increase of $64 million
| FISCAL PLAN 2018 – 21 • EXPENSE | 23 |
from the 2017-18 forecast to address expected caseload growth. A review of the Persons with Developmental Disabilities program, announced in January 2018, will explore ways the system can be improved to ensure individuals and families get the best supports available.
The Assured Income for the Severely Handicapped (AISH) program is budgeted at $1.1 billion in 2018-19 and will help nearly 62,000 adults live more independently. This represents an increase of $62 million from the 2017-18 forecast to address expected caseload growth.
Community and Social Services provides income support to low-income Albertans to cover their basic costs of living and help them to find a job or improve the one they have, so they can support themselves and their family. Income support programs are budgeted at $939 million, which represents an increase of $33 million from the 2017-18 forecast, to ensure those basic needs are met.
Funding in Budget 2018 provides secure, stable housing for Albertans affected by homelessness while delivering the services and supports to remain housed. There is $197 million budgeted in 2018-19 for Homeless and Outreach Support Services. This budget will support more than 100 new permanent supportive housing spaces – set to open in 2018-19. Budget 2018 ensures that Albertans in need will be safe, with funding for 28 homeless shelters, 30 women’s emergency shelters, 12 second-stage shelters, and trauma informed programming serving women and children leaving family violence. Budget 2018 continues to invest approximately $50 million per year in women’s shelters, as a result of a $15 million funding increase in 2015.
The ministry continues to support initiatives that make Alberta’s communities strong, resilient and violence-free. There is $123 million budgeted in 2018-19 for Community Supports and Family Safety, which includes funding of $101 million for Family and Community Support Services (FCSS), keeping government’s commitment to support these 80/20 partnerships between the province and 317 municipalities and Métis settlements organized within 206 local FCSS programs. At the community level, this funding encourages citizen participation, self-help and volunteerism, and enables communities to be innovative and creative in responding to local challenges.
Budget 2018 supports the basic needs
of low-income Albertans.
Ministry of Community and Social Services – Expense
(excluding flood recovery initiatives)
(millions of dollars)
| 2016-17 | 2017-18 | 2017-18 | 2018-19 | 2019-20 | 2020-21 | |||||||||||||||||||
| Actual | Budget | Forecast | Estimate | Target | Target | |||||||||||||||||||
Disability Services | 1,120 | 1,130 | 1,193 | 1,257 | 1,285 | 1,313 | ||||||||||||||||||
Assured Income for the Severely Handicapped | 1,004 | 1,048 | 1,071 | 1,133 | 1,190 | 1,249 | ||||||||||||||||||
Employment and Income Support | 827 | 825 | 906 | 939 | 1,012 | 1,042 | ||||||||||||||||||
Homeless and Outreach Support Services | 184 | 193 | 192 | 197 | 196 | 196 | ||||||||||||||||||
Community Supports and Family Safety | 122 | 123 | 129 | 123 | 128 | 128 | ||||||||||||||||||
Services Provided to Other Ministries | - | - | 62 | 51 | 51 | 51 | ||||||||||||||||||
Ministry Support Services | 21 | 24 | 24 | 24 | 24 | 24 | ||||||||||||||||||
Consolidation Adjustments | (20) | (13) | (75) | (63) | (63) | (63) | ||||||||||||||||||
Totals | 3,258 | 3,330 | 3,502 | 3,661 | 3,823 | 3,940 | ||||||||||||||||||
| FISCAL PLAN 2018 – 21 • EXPENSE | 24 |
The Alberta Child Benefit
supports 120,000 families.
CHILDREN’S SERVICES
The Ministry of Children’s Services is dedicated to the well-being of Alberta’s children and youth by helping ensure they get the services and supports they need to thrive in healthy families and healthy communities.
Children’s Services’ expense is budgeted at $1.5 billion. There is $826 million allocated towards strengthening the child intervention system in 2018-19. These funds will deliver both prevention and intervention programs to enhance the safety and well-being of children and youth at-risk across Alberta. Following a year of engagement with families, youth, communities including Indigenous peoples, stakeholders and experts in the system, the all-party Ministerial Panel on Child Intervention delivered its final recommendations to the Minister of Children’s Services. In response, the ministry will work alongside Indigenous communities, frontline workers and community partners to strengthen supports for children and families.
The ministry is helping families meet the cost of early childhood education by investing $393 million in 2018-19 for child care programs. This reflects an increase of $22 million from the 2017-18 forecast and underscores the commitment to make quality, accessible and affordable child care available to Alberta’s youngest citizens. Based on federal investment of approximately $46 million for each of the three years under the Canada-Alberta Early Learning and Child Care Bilateral Agreement, 78 additional Early Learning and Child Care Centres were announced in December 2017, bringing the total number to 100. This means 4,500 additional children and their families will have access to quality, affordable $25-per-day child care.
Budget 2018 also includes $175 million for the Alberta Child Benefit program. This benefit will provide up to $2,820 each year, supporting about 120,000 vulnerable families across the province, to help augment the cost of living.
With an investment of $108 million, Children’s Services is providing culturally appropriate community based early childhood services, parenting resources such as the Positive Parenting Program (Triple P) through Parent Link Centres, and youth services that will support the safety, well-being and resiliency of children, youth and families in their homes and in their communities, and reduce the need for more intensive crisis based services in the future.
Ministry of Children’s Services – Expense
(millions of dollars)
| 2016-17 | 2017-18 | 2017-18 | 2018-19 | 2019-20 | 2020-21 | |||||||||||||||||||
| Actual | Budget | Forecast | Estimate | Target | Target | |||||||||||||||||||
Child Intervention | 771 | 766 | 813 | 826 | 847 | 863 | ||||||||||||||||||
Child Care | 311 | 321 | 371 | 393 | 406 | 420 | ||||||||||||||||||
Alberta Child Benefit | 106 | 174 | 170 | 175 | 179 | 182 | ||||||||||||||||||
Early Intervention Services for Children and Youth | 96 | 103 | 103 | 108 | 108 | 108 | ||||||||||||||||||
Ministry Support Services | 16 | 18 | 18 | 18 | 18 | 18 | ||||||||||||||||||
Services Provided to Other Ministries | - | - | - | 10 | 10 | 10 | ||||||||||||||||||
Consolidation Adjustments | (9) | (11) | (11) | (21) | (21) | (21) | ||||||||||||||||||
Totals | 1,291 | 1,371 | 1,464 | 1,509 | 1,547 | 1,580 | ||||||||||||||||||
| FISCAL PLAN 2018 – 21 • EXPENSE | 25 |
SENIORS AND HOUSING
The Ministry of Seniors and Housing works with seniors, Albertans who require housing supports and others in the network of support: families and caregivers, communities, senior-serving organizations, housing management bodies, housing providers and other government partners.
Seniors and Housing’s expense is budgeted at $683 million. Budget 2018 continues the government’s commitment to a sustainable affordable housing system, providing safe homes for vulnerable Albertans and promoting well-being for Alberta’s aging population. The majority of the budget is made up of financial benefit programs that directly support Albertans with low income, and currently provides supports to over 155,000 seniors with low income and 75,000 Albertans (47,000 households) in need of affordable housing. The Seniors Services budget provides $366 million in financial assistance to seniors with low income through the Alberta Seniors Benefit program. This program has two components, including a monthly income supplement currently provided to 155,000 seniors and a supplementary benefit for seniors living in long-term care or designated supportive living.
The ministry has also committed $27 million in funding for Special Needs Assistance Grants, the Seniors Home Adaptation and Repair Program, and for Seniors Community Grants.
Budget 2018 has $256 million, delivered through the Alberta Social Housing Corporation, to support 47,000 households in securing affordable housing in Alberta. This includes $132 million for family and seniors housing, $68 million towards rental assistance and $16 million targeted towards special needs housing.
This budget also provides $12 million in maintenance and renewal funding for Housing Management Bodies across the province.
Seniors and Housing has developed the Affordable Housing Energy Savings Program (AHESP), which will enable retrofits in affordable housing units. This program will reduce greenhouse gas emissions, make buildings more environmentally and financially sustainable, and reduce utility costs for eligible affordable housing providers and tenants. There is $25 million allocated over three years to deliver this program.
JUSTICE AND SOLICITOR GENERAL
The Ministry of Justice and Solicitor General helps ensure that all Albertans can live in safe and secure communities while having access to a fair and impartial justice system. Working alongside its partners in law enforcement, the judiciary, family justice, health, the criminal justice system and other stakeholders, the ministry has a direct or shared responsibility in all elements of the justice system in Alberta. Its programs and services help ensure Albertans’ security and access to justice through efficient functioning of courts, corrections and law enforcement.
Justice and Solicitor General’s expense is budgeted at $1.47 billion. This budget includes $520 million for Public Security programs including policing, provincial sheriffs and enforcement branches. Funding for provincial contract
AHESP will reduce utility costs for eligible providers and tenants.
| FISCAL PLAN 2018 – 21 • EXPENSE | 26 |
Funding will address staffing
pressures in courts and
prosecution services.
The fair practices and medical panels
offices will ensure the workers’
compensation system is fair and
supports injured workers.
policing increases to $256 million in 2018-19, including new funding for the RCMP salary settlement, new RCMP officers, and policing services provided at no direct cost to all rural municipalities, including municipal districts, counties and Métis settlements, regardless of population, as well as towns, villages and summer villages with populations of 5,000 or less. A new seven-point action plan geared toward reducing rural crime will put resources where they are most needed. In addition, the current funding model assists urban municipalities with the cost of policing in several ways, including Municipal Policing Assistance Grants and Police Officer Grants.
Provincial contract policing also includes additional funding for rural crime reduction initiatives through new officers, civilian staff and equipment in key locations around the province; an additional $10 million will be spent in 2018-19. This budget includes $288 million for Correctional Services, $208 million for Resolution and Court Administration Services, $89 million in Support for Legal Aid and $104 million for the Crown prosecution service. The increased funding for the courts and prosecution service will allow critical staffing pressures to be addressed which will assist in prioritizing resources on serious and violent cases and holding offenders to account.
LABOUR
The Ministry of Labour protects workers’ rights by ensuring fair and modern legislation and regulating Alberta’s workplaces. The ministry also supports the continued development of Alberta’s skilled workforce and an efficient labour market that enables a thriving and diverse economy.
Labour’s expense is budgeted at nearly $223 million. This budget provides $78 million for safe, fair and healthy workplaces, which includes additional funding to support updated labour laws. More Employment Standards Officers will be hired to effectively implement changes resulting from the Fair and Family-friendly Workplaces Act. The additional staff are required to manage complaint resolution, proactive inspections, education and prevention, and administrative penalties.
As a result of the Occupational Health and Safety (OHS) system review and Workers’ Compensation Board (WCB) review, additional OHS officers will be hired to ensure Alberta workplaces are safe and healthy. In addition, a new fair practices office and medical panels office will be established to ensure the workers’ compensation system is fair and provides greater benefits to support injured workers.
The budget also includes $114 million for workforce strategies, including $41 million for skills and training support which will help workers be well- prepared to participate in the labour market.
| FISCAL PLAN 2018 – 21 • EXPENSE | 27 |
Indigenous Relations, Municipalities and Transportation
INDIGENOUS RELATIONS
The Ministry of Indigenous Relations is integral to leading the development of government-wide policies, strategies and partnerships with Indigenous organizations, governments and industry to support strong, vibrant Indigenous communities and people who fully participate in a prosperous, competitive and diverse Alberta.
Indigenous Relations’ expense is budgeted at $190 million. Alberta is committed to reconciliation with Indigenous peoples and implementing the principles of the United Nations Declaration on the Rights of Indigenous Peoples (United Nations Declaration). Budget 2018 allocates $3 million to help foster relationships with Indigenous peoples and support initiatives in response to the United Nations Declaration, including efforts to supporting implementation of Alberta’s Protocol Agreements.
This budget provides $123 million for the First Nations Development Fund which provides grants to support First Nations’ economic, social and community priorities. Approximately $24 million is allocated for First Nations and Métis Relations to provide grant funding, for example the Aboriginal Economic Partnerships Program and the Employment Partnerships Program, to provide advice and support to Indigenous communities and organizations, as well as for implementing relationship agreements to improve the lives of Métis peoples.
The First Nations Consultation Capacity Investment Program includes $7 million for assisting First Nations and Treaty organizations with continued development of consultation structures, including capacity building for consultation staff, to fulfill their responsibilities within Alberta’s consultation process. Consultation and engagement is taking place in a number of priority areas such as climate change adaptation, natural resource development, and caribou range planning, as well as steps to include Indigenous perspectives in land use planning, implementation and management.
MUNICIPAL AFFAIRS
The Ministry of Municipal Affairs builds and maintains relationships with municipalities that strengthen Alberta’s communities.
Municipal Affairs’ expense is budgeted at almost $1.2 billion. This includes the Municipal Sustainability Initiative (MSI) that provides grants to municipalities to help meet long-term infrastructure needs. A total of $800 million of MSI was provided in March 2018 from future years – $400 million from each of 2018-19 and 2019-20. Re-profiling these grants to 2017-18 provided local governments with flexibility in planning capital projects and adjusting to new fiscal arrangements. As government addresses its fiscal challenges, and as the end of the MSI approaches, funding arrangements with municipalities will be reviewed. Pending those discussions, funding under the MSI has been reduced by $152 million each year.
Budget 2018 provides $123 million for
the First Nations Development Fund.
| FISCAL PLAN 2018 – 21 • EXPENSE | 28 |
Over $423 million is budgeted
for highway maintenance.
The adjustment sees the $11.3 billion MSI program continuing until 2021-22. The government is committed to working with municipalities, over the coming months, to replace the MSI with a new infrastructure grant program, with a funding formula based on revenue sharing. The MSI is budgeted at $668 million in 2018-19. ($1,068 million, once the $400 million re-profiled to 2017-18 is included).
This budget will enhance public safety through ongoing updates to building codes and continued oversight in fire safety, while strategic investments in emergency management boost Alberta’s ability to safeguard against and respond to disasters. A total of $37 million in support to the provincial library network and operating grants will expand public library resources and services available to Albertans and their families, including Indigenous communities.
TRANSPORTATION
The Ministry of Transportation is making smart investments in the transportation system to create good jobs and contribute to Alberta’s economic recovery. Transportation’s expense is budgeted at nearly $1.5 billion. The ministry is developing key economic corridors, modern public transportation, roads, bridges and other critical infrastructure. Transportation will launch a rural transportation pilot program to connect residents in rural communities, and lay the foundation for a permanent program.
Over $667 million is allocated in capital grants (including Climate Leadership Plan and flood recovery initiatives) and supports the Government of Alberta’s Climate Leadership Plan while helping to create planning, engineering and construction jobs. The capital grants are for priority municipal public transit projects and critical drinking water and wastewater facilities. Provincial support for these projects will be partly achieved through the new Alberta Community Transit Fund and the First Nations Water Tie-In Program, which is part of Alberta’s commitment to the United Nations Declaration on the Rights of Indigenous Peoples.
Transportation manages more than 31,400 kilometers of highways, the largest number of kilometers per capita in Canada. More than $423 million is budgeted for on-going provincial highway maintenance to ensure the safe movement of people and goods throughout the province, and foster economic growth. Almost $35 million is committed to enhancing transportation safety through educational, regulatory, technological and infrastructure improvements to ensure Alberta highways remain amongst the safest in the country.
Agriculture, Resource Management,
Recreation and Culture
AGRICULTURE AND FORESTRY
The Ministry of Agriculture and Forestry provides the framework and services necessary for Alberta’s agriculture and forest industries to excel, inspire public confidence in the quality and safety of food and wildfire management, support environmentally sustainable practices, and lead the collaboration that enables resilient rural communities.
| FISCAL PLAN 2018 – 21 • EXPENSE | 29 |
Agriculture and Forestry’s expense is budgeted at $1.1 billion. This budget will support sustainable development in the agriculture and forestry sectors by focusing on sustainable growth through innovation, economic diversification, competitiveness and market access, as well as ensuring food safety and animal health. With a ministry focus to actively adopt innovative processes and technologies and promote value-added production and commercialization, Alberta is delivering a variety of high quality agriculture and forestry products and services that drive growth and economic diversification. The new Canadian Agricultural Partnership (CAP), a bilateral agreement with the Government of Canada will provide $47 million towards supporting sustainable growth, innovation and competitiveness in the agriculture industry.
Government promotes economic diversification through a suite of programs aimed at Alberta small liquor manufacturers. $25 million in the Alberta Small Brewers Development Program will support Alberta’s small brewers by providing flexibility to invest in their businesses, launch new products, and develop new markets. $200 million in forestry programs will provide funding for wildfire prevention, wildfire suppression initiatives as well as forest management initiatives, such as mitigating the mountain pine beetle, that help to maintain productive and sustainable forestry ecosystems. The department will continue investing in Alberta’s rural communities through $64 million in funding for the delivery of rural development programming, such as support to Agricultural Societies and Service Boards, local food initiatives, education, and rural electric and gas infrastructure. The Agriculture Financial Services Corporation will provide financial products to agricultural producers, including $528 million for crop, hail and livestock insurance and lending services as well as $120 million for agriculture income support.
ENVIRONMENT AND PARKS
The Ministry of Environment and Parks works to manage the province’s land and natural resources which is necessary to achieve Alberta’s long-term economic, environmental and social goals.
Environment and Parks’ expense is budgeted at $526 million. This budget provides $10 million for the development and implementation of regional plans including the North and South Saskatchewan, Lower and Upper Athabasca, Lower Peace and recreational use frameworks and management plans for priority areas including Porcupine/Livingstone, Moose Lake, Bighorn, Castle Wildland Provincial Park and Castle Provincial Park.
Parks and protected areas are essential tools for conserving nature and improving the status of biodiversity. They protect the habitat that species need to survive and thrive and this is an essential step toward conserving Canada’s ecosystems in the long term. $15 million is provided for species recovery plans and ecosystem plans and associated landscape recovery actions.
$107 million is provided for parks including funding to advance cooperative management of Alberta’s Parks with Indigenous peoples, and developing new Alberta Parks capital infrastructure through the Capital Maintenance and Renewal Program. This funding includes Alberta’s response to “Pathway to Canada Target 1 – Achieving Canada Target 1 in Alberta” to conserve 17% of Alberta’s terrestrial area and inland waters.
Budget 2018 continues investing
in rural communities.
Parks funding advances cooperative management with Indigenous peoples.
| FISCAL PLAN 2018 – 21 • EXPENSE | 30 |
The Alberta Screen-Based Production Grant program supports cultural and commercial productions.
This budget also provides $33 million for ongoing policy, plans and programs to better anticipate and minimize the impact of catastrophic events such as floods, droughts, human-wildlife conflicts and invasive species.
CULTURE AND TOURISM
The Ministry of Culture and Tourism supports the development and sustainability of Alberta’s cultural industries, tourism, the arts, recreation and sport, heritage, non-profit/voluntary sector and Alberta’s French’ speaking population.
Culture and Tourism’s expense is budgeted at $381 million. This budget provides $101 million for arts and cultural industries. Through the Alberta Media Fund, the ministry provides financial incentives to support screen-based production (such as Heartland and Fargo), book and magazine publishing, sound recordings, and interactive digital media. This investment creates, sustains and attracts skilled workers and helps diversify the economy.
Budget 2018 provides $56 million for tourism development and marketing. The ministry works in collaboration with internal and external stakeholders to support the growth of new and expanded tourism attractions, destinations and experiences, as well as developing tourism opportunities with China and other countries. The ministry collaborates with partners in the recreation, physical activity and sport sectors on quality programs and policies that support the Framework for Recreation in Canada and provincial sport initiatives, such as hosting the 2019 Canada Winter Games in Red Deer.
The ministry showcases Alberta’s heritage through its network of 20 museums, historic sites and archives, which collaborate with Education to enhance the K–12 curriculum. The ministry is continuing work with government partners to finalize the development of the Royal Alberta Museum, and expand the Royal Tyrrell Museum of Paleontology and the Reynolds-Alberta Museum. The ministry also regulates potential impacts to historic buildings, archaeological and paleontological sites, and Indigenous traditional use sites. Funding of $63 million allocated in Budget 2018 will help to ensure Albertans and visitors from around the world have continued access to our museums, archives and historic resources.
The ministry works to strengthen the capacity of Alberta’s non-profit/ voluntary sector by providing financial support, consultation, and skill development services. Budget 2018 provides $132 million in funding through Community Grants programs, including the Community Facility Enhancement Program, the Community Initiatives Program, and the Major Fairs Program.
In its role as a liaison between government and Alberta’s French-speaking population, the Francophone Secretariat represents the needs of the Francophonie in Alberta. The Secretariat collaborates with government departments, agencies, boards and commissions, and Francophone stakeholders to implement a French Policy for Alberta to guide the development and delivery of government services in French.
| FISCAL PLAN 2018 – 21 • EXPENSE | 31 |
Government Services
SERVICE ALBERTA
The Ministry of Service Alberta has a strategic role within government to drive modernization and foster the effective and efficient delivery of government programs, services and information. In addition, the ministry is supporting Alberta’s economic recovery by strengthening consumer protections and supporting a level playing field for businesses to compete. Consumers and businesses are protected through the work of the Consumer Investigations Unit, which investigates breaches of consumer protection legislation and ensures Alberta’s consumer protection laws are being followed.
Service Alberta’s expense is budgeted at $511 million. This budget provides more than $403 million for technology and business services to government ministries, centralizing core administrative functions to maximize their efficiency and effectiveness. This budget also provides over $96 million for services to Albertans, including Motor Vehicles, Registry Services, Land Titles, Consumer Awareness and Advocacy, and Utilities Consumer Advocate.
Service Alberta is leading the procurement of an Enterprise Resource Planning (ERP) solution, which will connect the core finance and human resource functions of government. It will involve the implementation of leading practice processes across finance and human resources and ultimately make government more effective and efficient. The procurement for a new ERP toolset will be complete in the spring of 2018.
To ensure Albertans receive consistent experiences when interacting with the government, in 2017, Service Alberta led the consolidation of information technology infrastructure. This work includes a 90 per cent reduction in data centres (from 37 to three), which will enable a significant reduction in complexity, contracts and servers.
EXECUTIVE COUNCIL
Executive Council supports the implementation and execution of government policy by coordinating the decision-making processes of Cabinet and Cabinet Committees, managing the submissions and proposals of government ministries and agencies and providing effective strategic planning and coordinated policy development across government.
Executive Council’s expense is budgeted at $19 million including $4 million for intergovernmental relations, $1 million for cabinet coordination, and $3 million for the policy coordination office. Executive Council also builds and maintains strong relationships with federal, provincial, and territorial governments; and supports ministries in their work towards creating jobs, making life more affordable for Albertans, and protecting the public services Albertans rely on.
There is $96 million budgeted
for services to Albertans.
| FISCAL PLAN 2018 – 21 • EXPENSE | 32 |
INFRASTRUCTURE
The Ministry of Infrastructure designs, builds, manages and maintains government-owned facilities, and collaborates with other ministries to ensure schools, hospitals and other government-owned and operated infrastructure meet the needs of Alberta’s population.
Infrastructure’s expense is budgeted at $670 million. This budget provides $595 million for the effective and sustainable management of owned and leased space using asset lifecycle management solutions. In addition, $49 million directly supports the delivery of innovative and responsible infrastructure solutions that meet current and future provincial needs.
TREASURY BOARD AND FINANCE
Treasury Board and Finance’s expense is budgeted at $1.6 billion. Treasury Board and Finance will continue to support effective use of government’s financial resources and ensuring they are being allocated to the most important initiatives supporting the government’s priorities of creating a recovery that lasts, diversifying the economy, creating good jobs and protecting vital public services.
Within the ministry, the Public Service Commission supports the Alberta Public Service with policies, services and programs that equip public servants to best serve Albertans and ensure they have a professional, non-partisan, diverse and inclusive public service. The 2018-19 budget for the Public Service Commission is $27 million. Transformation of government’s human resource systems is underway and focused on consolidating resources and streamlining services to achieve cost savings, increase process efficiencies, and support employee performance. Implementation of a new human resource service delivery model is expected to begin in 2018-19.
Communications and Public Engagement’s budget is $40 million in 2018-19. It facilitates two-way communications between Albertans and their government. A focus in 2018 is increasing multicultural and digital content and delivering better communications at a reduced cost.
Climate Leadership and Electricity
CLIMATE LEADERSHIP PLAN
With Budget 2018, government continues to implement the Climate Leadership Plan (CLP). The CLP is a made-in-Alberta strategy to reduce carbon emissions while diversifying our economy, creating jobs and protecting our health and environment. Under the CLP, Alberta is phasing out emissions from coal-fired electricity generation and developing more renewable energy; has implemented an economy-wide carbon price on greenhouse gas emissions; is working with key stakeholders to implement a legislated limit on oil sands emissions; and is taking action to reduce methane gas emissions from the oil and gas sector by 45% by 2025.
| FISCAL PLAN 2018 – 21 • EXPENSE | 33 |
Climate Leadership Funding
Over the next three years, $5.3 billion will be spent to advance climate leadership initiatives including public transit, innovative research, energy efficiency programs, infrastructure projects, and support to Indigenous communities. A further $632 million will provide tax relief to businesses through the small business tax rate reduction and the Capital Investment Tax Credit – Clean Tech Stream.
Household and Other Rebates. There is continued funding support for Albertans in the transition to a lower-carbon economy, including $1.6 billion over three years in rebates to over 60% of Albertans to offset costs associated with the carbon levy.
Electricity Transition. There is $680 million over three years for initiatives to support Alberta’s transition away from coal-generated electricity including, coal transition payments, financial support for coal workers through the Coal Workforce Transition Program, the Renewable Electricity Program and community generation. Finally, the province has capped electricity prices to protect families, farms, and small businesses for four years while the province implements the necessary reforms to the electricity system.
Energy Efficiency. There is $662 million over three years to support energy efficiency projects. Programs are in place for the residential, commercial, non-profit, agricultural and municipal sectors. Programs are also in place to help the commercial and industrial sectors lower emissions and energy use and reduce costs. Programming is being delivered by Energy Efficiency Alberta, Emissions Reduction Alberta and several Government of Alberta ministries.
Indigenous Communities. There is $145 million over three years for the Indigenous Climate Leadership Initiative to support retrofits of buildings, solar panel installations, energy audits, and capacity building and employment programs in Indigenous communities.
Budget 2018 provides
tax relief to businesses.
Climate Leadership Plan Budget Details
(millions of dollars)
| 2018-19 | 2019-20 | 2020-21 | 3-Year | |||||||||||||
| Estimate | Target | Target | Total | |||||||||||||
Tax Rebates and Reductions | ||||||||||||||||
Small Business Tax Rate Reduction | 195 | 205 | 215 | 615 | ||||||||||||
Capital Investment Tax Credit (Clean Tech Stream) | 9 | 8 | - | 17 | ||||||||||||
Sub-total | 204 | 213 | 215 | 632 | ||||||||||||
Targeted Programming | ||||||||||||||||
Household and Other Rebates | 536 | 518 | 506 | 1,560 | ||||||||||||
Electricity Transition | 214 | 228 | 237 | 680 | ||||||||||||
Energy Efficiency | 214 | 265 | 183 | 662 | ||||||||||||
Indigenous Communities | 49 | 49 | 46 | 145 | ||||||||||||
Infrastructure and Transit | 458 | 555 | 317 | 1,330 | ||||||||||||
Innovation and Technology | 183 | 192 | 146 | 521 | ||||||||||||
Program Delivery and Other Initiatives | 62 | 80 | 244 | 386 | ||||||||||||
Sub-total | 1,718 | 1,888 | 1,678 | 5,283 | ||||||||||||
Total | 1,922 | 2,101 | 1,893 | 5,915 | ||||||||||||
| FISCAL PLAN 2018 – 21 • EXPENSE | 34 |
Electricity Transition
Alberta Energy is leading the work to transition the electricity system which includes a number of initiatives, some of which are under the Climate Leadership Plan, and others which are outside the Climate Leadership Plan.
In November 2016, the government announced agreements with TransAlta, Capital Power and ATCO to end coal-fired emissions through the provision of transition payments for the six coal-fired units. These agreements will encourage the affected companies to participate in Alberta’s transition from coal to lower-emitting sources of electricity, such as natural gas and renewables, and are key to helping Alberta meet its target of 30 per cent renewable electricity by 2030.
On November 30, 2016, the government announced the Renewable Electricity Program (REP) to encourage growth of renewable energy such as wind, solar, geothermal, sustainable biomass and hydro. The REP is designed to attract new investment to Alberta in large-scale renewables, create jobs and diversify Alberta’s economy. It is estimated that the REP will attract new private investment approaching $10 billion and create at least 7,200 jobs.
The highly competitive first round of REP saw strong investor confidence and attracted private investment from Alberta and around the world, successful bidders providing 600 megawatts of renewable electricity to the grid by the end of 2019 at a record-low price for renewable energy in Canada. The province recently announced its intention to open the second and third rounds of competition.
Government is working to make it easier for Albertans, businesses and communities to offset their electricity consumption with renewable energy. The Micro-generation Regulation continues to enable distributed alternative and renewable generation intended for load displacement in individual households and small businesses. Community generation is the next step in the growth of locally generated power and will make it easier for Albertans, businesses and communities to produce and use renewable electricity.
The province’s electricity system will transition from an energy-only market to a capacity market framework in 2021. A capacity market will ensure that investment in new generation is sufficient to provide reliable electricity supply at stable, affordable prices. The introduction of a capacity market will provide more predictable prices for both consumers and investors, protecting Albertans from the volatility and price spikes we have endured under the energy-only market since deregulation.
The capacity market will be fully operational and protecting Albertans from price swings in 2021. Until that time, the government has implemented a cap for the Regulated Rate Option (RRO). The price cap ensures that Albertans, small businesses and farms eligible for the RRO will pay no more than 6.8 cents per kilowatt hour for electricity over four years, until May 2021.
The Balancing Pool continues to manage the cost to consumers resulting from the return of the Power Purchase Agreements by power companies. Costs are recovered over time reducing the impact on consumers’ monthly electricity bills.
| FISCAL PLAN 2018 – 21 • EXPENSE | 35 |
Infrastructure and Transit. There is $1.3 billion in funding for a variety of programs to enable greater public use of transit, including development of Low-carbon transit fleets and expanded light rail transit systems in Calgary and Edmonton. Funding will also support the construction and retrofits of government buildings to higher standards to improve energy efficiency, and to help Alberta adapt to climate change.
Innovation and Technology. There is $521 million over three years to support innovation and technology development. Broader climate programming is being delivered through the Climate Change Innovation and Technology Framework being delivered by Alberta Economic Development and Trade, with additional industrial supports being delivered by Emissions Reduction Alberta, Energy Efficiency Alberta and the Alberta Climate Change Office.
Program Delivery and Other Initiatives. There is $386 million over three years for future programming or an expansion of existing programs and initiatives, as well as funding for delivery of programming across government.
Emissions Impacts
Alberta’s CLP policies, legislation and programs all drive towards reduced greenhouse gas emissions and changing Alberta’s emissions path. The impacts of CLP policies and programs on emissions are expected as early as 2017 with reductions forecasted to continue with decreases in emissions from the electricity sector, and oil and gas sector’s methane emissions. These emissions reductions are expected to be complemented by large industrial facilities’ investment decisions in response to the incentive structure created by the full implementation of the carbon level and carbon competitiveness incentives. Further reductions from building improvements in the residential, commercial and institutional sector and in transportation are expected to occur as a result of the carbon levy and program incentives. GHG emissions can potentially be further reduced through the impact of clean technology investments.
Gender Budgeting
Advancing gender equality is a critical priority for the Government of Alberta, and is reflected in Budget 2018. Opportunities to impact change and improve lives for women and girls are supported through Alberta Status of Women, including a Community Grant Program. Budget 2018 provides a minimum of $500,000 annually to charitable and non-profit organizations in Alberta for projects and activities related to enhancing women’s economic security, increasing women in leadership and democratic participation, and preventing and responding to gender-based violence.
PROMOTING EQUALITY THROUGH ECONOMIC SECURITY
Having access to quality and affordable child care, reducing other barriers to employment, and ensuring minimum wage is a living wage are crucial to the growth of Alberta’s economy. Women’s full participation in the economy supports economic diversification and creates jobs and opportunities that benefit all Albertans. Several initiatives are underway to promote economic
Budget 2018 supports
women’s economic security
| FISCAL PLAN 2018 – 21 • EXPENSE | 36 |
security for women, Indigenous peoples, those with low incomes, and persons with disabilities. The Early Learning and Child Care Centre program will create an additional 4,500 affordable child care spaces and has positive benefits for working parents and for those working in child care settings, who are predominately women. The Alberta Child Benefit (ACB) makes life more affordable for Albertans by providing direct financial assistance to lower-income families. The Alberta Family Employment Tax Credit (AFETC) helps lower- and middle-income working families support their children, especially single parents who are predominantly women. Approximately $328 million in ACB and AFETC benefits are provided in Budget 2018. In October 2018, minimum wage will increase to $15/hour. Women account for more than 60% of minimum wage earners and are disproportionately represented in low-paying careers, even though Alberta women tend to be highly educated.
Recognizing that groups require different supports based on their identities and backgrounds, Budget 2018 provides $70,000 for the First Nations Women’s Councils on Economic Security and the Métis Women’s Council on Economic Security. These councils work to improve the lives of Indigenous women and their communities.
Government is working collaboratively with industry to advance diversity and inclusion through a range of its economic development and diversification initiatives. The Alberta Investor and Interactive Digital Media Tax Credits and the Petrochemical Diversification and Partial Upgrading Commercialization Programs all include evaluation criteria that create a preference for proponents who meet specific diversity and inclusion criteria.
PROMOTING EQUALITY THROUGH LEADERSHIP
AND DEMOCRATIC PARTICIPATION
Gender balance in decision-making bodies, whether elected or appointed, is necessary to ensure organizations fully reflect the diversity of Albertans and to increase and encourage innovative decision-making. Government launched the public agencies, boards, and commissions online recruitment site to help raise women’s representation from 32% in March 2015, to 53% as of January 2018. The total percentage of corporate board seats occupied by women increased from 12% in 2016 to 14% in 2017, according to the Alberta Securities Commission.
PREVENTING AND RESPONDING TO GENDER-BASED VIOLENCE
Sexual violence is a violation of the fundamental human right to safety and bodily autonomy and is a barrier to full participation for survivors in their communities. Building on annual funding of $4 million a year provided
to assist 12 sexual assault centres and their provincial organization – the Association of Alberta Sexual Assault Services – an additional $8 million was provided in March 2018 and Budget 2018 also includes $11 million in additional funding. Alberta’s women’s shelters provide accommodation for women and children in crisis from family violence, and help them rebuild their lives. Since 2015-16, $28 million in Family and Community Safety Program grant funding has been allocated to support 119 community projects focused
| FISCAL PLAN 2018 – 21 • EXPENSE | 37 |
on family violence, sexual violence, child sexual abuse and healthy relationships. The projects target diverse populations, including First Nations, Métis, immigrant and refugee communities, and LGBTQ and rural populations.
In August 2016, the Government of Alberta announced new protections under the Residential Tenancies Act and the Termination of Tenancy (Domestic Violence) Regulation, which allow tenants experiencing domestic violence to break their leases without penalty. Between August 8, 2016 and February 28, 2018, 406 Safer Spaces certificates have been issued. These protections for victims of domestic violence reduce financial barriers to leaving unsafe home environments.
An Act to Remove Barriers for Survivors of Sexual and Domestic Violence came into effect on May 4, 2017, which eliminated limitation periods for launching a civil claim related to sexual or domestic violence. By removing limitation periods, the Government of Alberta is making the legal system more accessible to victims of sexual and domestic violence, recognizing that it can take survivors longer than two years to come forward with a claim.
ASSISTING FAMILIES OF MISSING AND
MURDERED INDIGENOUS WOMEN
As part of the commitment to the implementation of the United Nations Declaration on the Rights of Indigenous People, the government supported the establishment of the National Inquiry into Missing and Murdered Indigenous Women and Girls, and passed an Order in Council granting the same Commissioners with the authority to examine areas of provincial jurisdiction, such as child welfare, justice, and health. Alberta also established a Family Information Liaison Unit. The unit is intended to be a single point of contact where experienced front-line staff can provide families with information about the justice system and legal processes, as well as specific updates about criminal investigations, court proceedings or fatality inquiries involving their loved ones. The team can also link families with Elders, spiritual support and counselling.
Alberta has established
a Family Information
Liaison Unit.
| FISCAL PLAN 2018 – 21 • EXPENSE | 38 |
Cost Containment
Government’s prudent management of the province’s finances involves investing dollars in the most critical services while containing costs.
Government’s plan achieves cost containment by focusing on the two largest areas of provincial government spending: public sector compensation and health care. Government is also taking steps to clean up waste.
PUBLIC SECTOR COMPENSATION
Total public sector compensation, including teachers, doctors and nurses, is budgeted at $26.6 billion in 2018-19. It includes the cost of existing collective agreements. Total public sector compensation makes up more than half of government’s annual operating expense.
Given the scale of public sector compensation, managing this aspect of operating expense is critical to achieving cost containment and returning to balance. Key actions include:
| ∎ | Negotiating fair and practical agreements with public sector unions. Successful agreements with responsible partners such as the Alberta Teachers’ Association and United Nurses of Alberta have restrained salary growth in a challenging fiscal environment. These partnerships have allowed government to invest in better work environments and ensure the stability of critical services to the benefit of all Albertans. |
| ∎ | Extending the salary freeze on non-union employees across the public sector to September 2019. The salary freeze has saved $29 million a year since it was introduced in the Alberta Public Service (APS). |
| ∎ | A hiring restraint in the APS was strengthened in December 2017, with the objective of keeping the size of the APS flat. This has resulted in cumulative savings of $204 million. |
Actions to contain compensation growth are evident in the declining share of total public sector compensation as a proportion of operating expense. It makes up 54.6% of operating expense in 2018-19, and is forecast to fall slightly to 54.1% of operating expense by 2020-21.
Budget 2018 – Public Sector Compensation
(millions of dollars)
| 2016-17 | 2017-18 | 2017-18 | 2018-19 | 2019-20 | 2020-21 | |||||||||||||||||||
| Actual | Budget | Forecast | Estimate | Target | Target | |||||||||||||||||||
Alberta Health Services | 7,981 | 8,092 | 8,152 | 8,240 | 8,446 | 8,616 | ||||||||||||||||||
School Boards | 5,931 | 5,999 | 5,998 | 6,131 | 6,339 | 6,523 | ||||||||||||||||||
Post-secondary Institutions | 3,425 | 3,547 | 3,542 | 3,612 | 3,701 | 3,793 | ||||||||||||||||||
Alberta Public Service (Departments) | 2,830 | 2,862 | 2,933 | 2,967 | 2,989 | 3,010 | ||||||||||||||||||
Other Government Agencies | 609 | 624 | 625 | 633 | 640 | 641 | ||||||||||||||||||
Environmental Protection and Enhancement Fund | 35 | 10 | 32 | 10 | 10 | 11 | ||||||||||||||||||
Sub-total | 20,812 | 21,135 | 21,282 | 21,593 | 22,125 | 22,593 | ||||||||||||||||||
Physician Compensation and Development | 4,831 | 4,988 | 4,972 | 5,046 | 5,144 | 5,256 | ||||||||||||||||||
Total Public Sector Compensation Costs | 25,643 | 26,122 | 26,254 | 26,640 | 27,270 | 27,849 | ||||||||||||||||||
| FISCAL PLAN 2018 – 21 • EXPENSE | 39 |
HEALTH
Government has made significant progress containing health costs. Health spending grew approximately 6.0% a year from 2008-09 to 2014-15. From 2015-16 to 2017-18, spending was contained with growth of only 3.3% a year. Over the next three years health spending growth is budgeted at 3.0% a year. As identified in the Health section, a number of strategies are being used to contain costs, including:
| ∎ | Savings of more than $100 million over the last three years through reduced generic drug prices. |
| ∎ | A new funding framework with the Alberta Pharmacists’ Association that will save $150 million over the next two years and slow spending growth in government-sponsored drug programs. |
| ∎ | Operational Best Practice (OBP), which is an Alberta Health Services (AHS) initiative that benchmarks AHS with comparable organizations to achieve efficiencies while still delivering safe, quality health care to Albertans. OBP initiatives have resulted in cost avoidance of $28 million in 2017-18 |
FINDING EFFICIENCIES
Continuous improvement is focused on ongoing efforts to achieve the greatest efficiencies and effectiveness across government through transformation and innovation. Key areas include:
| ∎ | Consolidating and modernizing corporate services such as communications, information technologies, finance and human resources, so they are more effective and deliver high levels of service that ultimately support Albertans. Opportunities to contract-in services will also be considered where efficiencies can be achieved. Once complete, annual savings from corporate service improvements are expected to be tens of millions of dollars. |
| ∎ | Looking for opportunities to reallocate Alberta Public Service staff to essential services and priority areas. |
CLEANING UP WASTE
| ∎ | Tightly controlling discretionary spending across government with restrictions on travel, conferences, advertising, publications and hospitality. Discretionary spending has declined 14% from 2014-15 to 2016-17. Discretionary spending for travel and hospitality in the Alberta Public Service declined by 25% and 23% respectively in that same time period. To limit discretionary spending, opportunities to leverage technology are being used such as video conferencing in lieu of travel. |
| ∎ | The review of agencies, boards and commissions has led to the amalgamation or dissolution of 66 agencies, boards and commissions. |
| ∎ | Government has cut the salaries of the highest paid executives in agencies, boards and commissions and eliminated perks and bonuses such as tax-payer funded golf club memberships. These actions will save $16 million a year. |
| FISCAL PLAN 2018 – 21 • EXPENSE | 40 |
Fiscal Plan
Revenue
| FISCAL PLAN 2018 – 21 • EXPENSE | 41 |
Table of Contents
REVENUE
Revenue Outlook | 43 | |||||||
Non-Renewable Resource Revenue | 45 | |||||||
Tax Revenue | 48 | |||||||
Federal Transfers | 49 | |||||||
Investment Income | 50 | |||||||
Other Revenue | 51 | |||||||
Risks | 52 | |||||||
| FISCAL PLAN 2018 – 21 • REVENUE | 42 |
Revenue
Revenue Outlook
Total revenue is forecast to be $47.9 billion in 2018-19, $1 billion, or 2.1% higher than the 2017-18 forecast. While this is still below the $49.5 billion prior to the oil price collapse in 2014, revenue is expected to continue strengthening, surpassing $50 billion in 2019-20 and reaching $53.8 billion by 2020-21, with growth averaging 6.1% over these two years.
After the 2014 oil price drop, prices remained low, causing Alberta’s economy to contract in both 2015 and 2016, by 3.6%, and an estimated 3.7%, respectively. Employment losses and wage restraint led to decreased household income, hampered consumer activity and reduced personal income tax revenue. Corporate profits tumbled resulting in lower corporate income tax revenue and significant efforts to reduce costs. Business investment deteriorated. The impact on government royalty revenue was most severe, with resource revenue dropping over $6 billion in fiscal year 2015-16, while total revenue declined by $7 billion.
While most revenue improved in 2016-17, and investment income was the highest ever recorded, resource revenue and income taxes, which typically make up about half of overall revenue, are taking longer to recover. Alberta’s economy rebounded in 2017, expanding by an estimated 4.5%, led by conventional investment, consumer spending, manufacturing and exports. The revenue forecast for 2017-18 has been increased from budget, primarily due to higher investment income, conventional oil and natural gas royalties, and land lease sales, and a sizeable reversal in the Balancing Pool liability. The higher royalties are mainly due to lower producer costs and higher condensate royalties.
The Budget 2018 revenue forecast is based on gradually increasing oil prices, a continued ramp-up in oil sands production, and economic expansion. Income tax revenue is expected to recover from the lingering remnants of the two-year recession, boosted by healthy employment, household income and consumer spending growth, reduced business costs, and increasing exports and housing
Total Revenue
(millions of dollars)
| 2016-17 | 2017-18 | 2018-19 | 2019-20 | 2020-21 | ||||||||||||||||||||
| Actual | Budget | Forecast | Estimate | Target | Target | |||||||||||||||||||
Personal income tax | 10,763 | 11,177 | 10,855 | 11,387 | 11,984 | 12,635 | ||||||||||||||||||
Corporate income tax | 3,769 | 3,918 | 3,852 | 4,551 | 5,293 | 5,719 | ||||||||||||||||||
Other tax revenue | 5,649 | 6,667 | 6,504 | 6,961 | 7,271 | 7,641 | ||||||||||||||||||
Resource revenue – Bitumen royalties | 1,483 | 2,546 | 2,358 | 1,785 | 2,184 | 2,926 | ||||||||||||||||||
Resource revenue – other | 1,614 | 1,208 | 2,176 | 2,044 | 1,999 | 2,075 | ||||||||||||||||||
Federal transfers | 7,979 | 7,988 | 7,918 | 8,218 | 8,470 | 8,645 | ||||||||||||||||||
Investment income | 3,698 | 2,193 | 3,061 | 2,884 | 3,161 | 3,357 | ||||||||||||||||||
Net income from business enterprises | 543 | 2,506 | 3,294 | 2,777 | 2,707 | 2,844 | ||||||||||||||||||
Premiums, fees and licences | 3,701 | 3,683 | 3,742 | 3,854 | 3,929 | 3,996 | ||||||||||||||||||
Other revenue | 3,094 | 3,032 | 3,121 | 3,419 | 3,617 | 4,010 | ||||||||||||||||||
Total Revenue | 42,293 | 44,918 | 46,881 | 47,879 | 50,615 | 53,848 | ||||||||||||||||||
Total revenue forecast to be
$48 billion in 2018-19,
and $53.8 billion by 2020-21.
Total revenue fell $7 billion
in 2015-16 relative to 2014-15.
Revenue forecast based on gradually
increasing oil prices and oil sands
production, and employment and
household income growth.
| FISCAL PLAN 2018 – 21 • REVENUE | 43 |
Revenue increases $7 billion between
2017-18 and 2020-21,
led by income taxes.
construction. Climate Leadership Plan (CLP) revenue also increases, mainly from the federally-imposed carbon price jump effective January 1, 2021, to $40 per tonne of carbon dioxide equivalent.
Resource revenue remains weak in 2018-19, $0.7 billion lower than the forecast for 2017-18, with only a modest rise in oil prices. The positive impact on revenue from the price lift is more than offset by the negative impact of the higher exchange rate and wider light-heavy oil price differential, the latter due to insufficient pipeline and other transportation capacity for Alberta oil to reach markets. Bitumen royalties begin increasing in 2019-20, with oil prices rising and production growth. Revenue received by industry and government still suffers from a deep price discount, as higher rail costs set prices without enough pipeline capacity. In 2020-21, when new and expanded pipelines are expected to come on-stream, bitumen royalties jump 34%.
Total revenue increases by almost $7 billion between the 2017-18 forecast and 2020-21, with the largest increase from income taxes ($3.6 billion). Most of the rest of the growth in revenue is from bitumen royalties, CLP revenue, federal transfers and investment income.
The government is committed to diversifying the economy and leaving no Albertan behind. Revenue initiatives supporting these goals include: freezing post-secondary tuition for the fourth year; extending and adding funding for the two tax credits introduced in Budget 2016 (one for investment in eligible small and medium-sized business, and the other for capital spending in eligible industries supporting diversification); introducing a second phase of the Petrochemicals Diversification Program; and keeping 2018-19 education property tax revenue at the 2017-18 level.
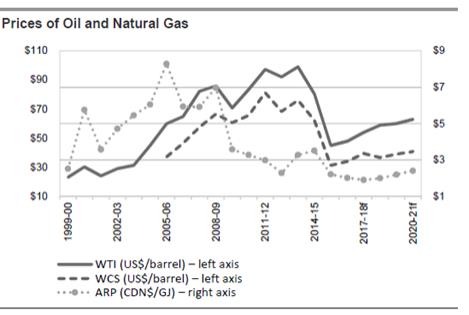
| FISCAL PLAN 2018 – 21 • REVENUE | 44 |
Non-Renewable Resource Revenue
Non-renewable resource revenue in 2018-19 accounts for 8% of total revenue, and its share is expected to grow to 9.3% by 2020-21. This is still well below the 18% share of total revenue in 2014-15, or 27% in 2011-12. It is forecast at $3.8 billion in 2018-19, $0.7 billion lower than in 2017-18. The decrease is primarily from lower bitumen royalties, due mainly to a widening of the light-heavy oil price differential and a higher exchange rate forecast. Revenue is estimated to increase to $5 billion in 2020-21, driven by accelerating bitumen royalties from improving oil prices, rising production and lower costs, in spite of the differential remaining wide.
The West Texas Intermediate (WTI) oil price averaged almost US$93 per barrel (/bbl) in the four fiscal years 2010-11 to 2013-14, but then fell 70%, from US$105/bbl in June 2014 to approximately US$30 in February 2016. The price collapse arose from global supply growth exceeding demand growth, with supply boosted by significant increases, including from North American production, and demand muted by a slowdown in developing economies.
Prices began to strengthen in 2016, climbing into the mid-US$40/bbl range, due mainly to supply disruptions, declining US crude output and stronger-than-anticipated global demand growth. In late 2016, OPEC members and several non-OPEC producers agreed to reduce output by 1.8 million barrels per day, starting in 2017. Average monthly prices approached US$50/bbl by December 2016, and climbed to almost $52 for the first three months of 2017, supported by the agreement and solid global demand growth. The elevated prices fueled increased US production and raised concerns about the pace of global demand-supply rebalancing, as inventories remained high. This decreased prices to about US$48/bbl in mid-2017. The OPEC / non-OPEC agreement was then extended until the end of 2018. This, together with continued demand growth, OPEC compliance, supply disruptions from pipeline outages and geopolitical events, as well as reduced global inventories, contributed to boost oil prices to US$55 in the fall of 2017. Prices rose to US$63.50 in January 2018, though they have fallen slightly since then.
Most analysts are forecasting that prices will be supported by the OPEC-led supply compliance, but that price growth will be limited by expanded US shale production that higher prices encourage. Continued global demand growth over the medium term is expected to exceed potential US supply growth, requiring incremental output from higher-cost producers, and thus gradually rising oil prices. The current view is that prices will reach US$70 by 2023.
The Budget 2018 forecast is based on WTI oil prices averaging US$59/bbl in 2018-19, US$60 in 2019-20 and US$63 in 2020-21. Other factors affecting oil royalties are the light-heavy price differential, the US-Canadian dollar exchange rate, production, oil sands project status and producer costs:
| ∎ | The Western Canadian Select price (WCS), a benchmark price for heavy oil (blended bitumen), is determined by the WTI US dollar price less a “light-heavy differential.” The differential is linked to costs of transporting Alberta production to Gulf Coast refineries or coastal ports for export, and to the lower quality of heavy oil relative to light sweet crude. Sufficient pipeline capacity lowers costs and the differential, increasing prices |
Resource revenue in 2018-19 is
estimated at $3.8 billion.
Oil prices declined dramatically from
excess supply relative to demand
growth.
Oil price now not expected to reach
US$70 per barrel until 2023.
Revenue forecast based on
US$59 oil price in 2018-19,
and US$63 by 2020-21.
| FISCAL PLAN 2018 – 21 • REVENUE | 45 |
Cost-effective transportation for
Alberta production incresases
value to Albertans.
Bitumen production to
grow 21% over next three years.
Bitumen royalties estimated at
$1.8 billion in 2018-19; increase to $2.9 billion by 2020-21.
| for Alberta producers; moving product by rail increases costs and the differential, lowering WCS prices. With Alberta production ramping up, pipeline access has become insufficient. In addition, any pipeline outages exacerbate the situation. This occurred in late 2017, raising the differential over US$25/bbl, where it still sits. The differential is estimated to have averaged US$14.50 in 2017-18, but is forecast to average US$22.35/bbl in 2018-19. The Enbridge Line 3 replacement pipeline is anticipated to start operations by 2019, while the TransCanada Keystone XL and Kinder Morgan TransMountain Expansion pipelines are expected by 2021. |
| ∎ | A lower US-Canadian dollar exchange rate supports royalty revenue. The bitumen royalty rate is based on the WTI price expressed in Canadian dollars, so the rate is higher with a lower Canadian dollar. A lower dollar also increases oil prices when they are converted from US into Canadian dollars, elevating producers’ revenue in Canadian dollars. The exchange rate forecast has increased to 80 US¢/Cdn$ for the forecast period. |
| ∎ | Bitumen production continues to grow. It is estimated to increase 21.3% between 2017-18 and 2020-21 as projects completed in 2017-18 ramp up and other expansions finish. Conventional crude production remains flat. |
| ∎ | Oil sands royalties change when projects reach post-payout status (total project revenue exceeds total capital and operating costs). Prior to payout, royalties are 1–9% of gross revenue, while after payout, they are the greater of 1–9% of gross revenue or 25– 40% of net revenue. With recent lower prices and higher costs from rail transportation, some post-payout projects would be paying the lower rate on gross revenue, while other projects would be delayed in reaching payout. |
| ∎ | Several years of low oil prices have incented industry to seek efficiencies, improve productivity and reduce costs. Prices for condensate used to dilute bitumen for transportation have also declined, as condensate prices follow oil prices. Natural gas is a significant input for oil sands operations and gas prices are forecast to remain weak. Since costs are part of royalty calculations, these support royalty revenue. |
Bitumen royalties are estimated at $1.8 billion in 2018-19, $573 million lower than in 2017-18, due primarily to the wider light-heavy oil price differential and higher exchange rate. The US$5 increase to WTI is more than offset by the differential discount. Royalties are forecast to increase to $2.9 billion by 2020-21. The main drivers are increasing oil prices, higher production and lower project costs.
The government will supply bitumen to the North West Redwater Sturgeon Refinery, tentatively scheduled to begin commercial operations June 1, 2018. The refinery will upgrade bitumen into higher-valued products such as ultra-low sulphur diesel. The Province will receive a portion of the revenue from the sale of the upgraded product, but is also responsible to pay monthly cost of service tolls for the 30-year term of the contract.
Conventional oil royalties are estimated at $1.1 billion in 2018-19,
$170 million higher than 2017-18, and at $1 billion by 2020-21. Revenue in 2017-18 increased significantly from budget, mainly due to lower costs and higher condensate royalties. Condensate is used to dilute bitumen for
| FISCAL PLAN 2018 – 21 • REVENUE | 46 |
Oil Assumptions
| 2016-17 | 2017-18 | 2018-19 | 2019-20 | 2020-21 | ||||||||||||||||||||
| Actual | Budget | Forecast | Estimate | Target | Target | |||||||||||||||||||
Revenue ($ millions) | ||||||||||||||||||||||||
Bitumen royalty | 1,483 | 2,546 | 2,358 | 1,785 | 2,184 | 2,926 | ||||||||||||||||||
Crude oil royalty | 716 | 476 | 883 | 1,053 | 981 | 1,035 | ||||||||||||||||||
Prices | ||||||||||||||||||||||||
West Texas Intermediate (US$/bbl) | 47.93 | 55.00 | 54.00 | 59.00 | 60.00 | 63.00 | ||||||||||||||||||
WCS @ Hardisty (Cdn$/bbl) | 44.67 | 51.30 | 50.40 | 46.00 | 48.80 | 50.95 | ||||||||||||||||||
Differential (US$/bbl) | (13.93 | ) | (16.00 | ) | (14.50 | ) | (22.35 | ) | (21.00 | ) | (22.25 | ) | ||||||||||||
Production (thousands of barrels / day) | ||||||||||||||||||||||||
Conventional | 431 | 416 | 449 | 461 | 468 | 467 | ||||||||||||||||||
Raw bitumen | 2,549 | 2,906 | 2,855 | 3,163 | 3,302 | 3,462 | ||||||||||||||||||
Exchange rate | ||||||||||||||||||||||||
(US¢/Cdn$)
|
| 76.2
|
|
| 76.0
|
|
| 78.0
|
|
| 80.0
|
|
| 80.0
|
|
| 80.0
|
| ||||||
transportation and its price follows the WTI price. With greater demand expected from oil sands output growth, production has been increasing. This is also a major reason for the higher-than-expected land lease sales in 2017-18, targeted at areas rich in liquids, including condensates.
Natural gas and by-product royalties are estimated at $541 million in 2018-19, on par with 2017-18 revenue, which was higher than budget due primarily to lower costs, higher production and revenue from by-products, even with lower natural gas prices. Since prices for natural gas by-products, such as propane, butane and pentanes plus, follow oil prices, the recent slight uplift in oil prices spurred increased production to maximize higher-valued natural gas liquids extraction. Royalties are forecast at $585 million by 2020-21, with prices increasing and costs constrained.
The immediate outlook for natural gas prices continues to be mixed, with abundant natural gas supplies keeping prices low. US natural gas production is expected to more than keep pace with demand growth arising from US natural gas exports, industrial demand and retirement of coal-fired electricity plants over the medium term. However, Alberta natural gas prices are buoyed by increasing demand from expanding oil sands operations, petrochemical and electricity-generation developments.
A second phase of the Petrochemicals Diversification Program will provide another $500 million in royalty credits for investment in facilities to upgrade methane and propane to higher-value products such as propylene and polypropylene. This follows the success of the first phase under which two facilities, estimated to cost between $5 and $6 billion, and create 4,000 construction and 200 operational jobs, were approved. The royalty credits are provided following expected project completion beginning in 2020-21, with royalties forecast to be reduced $81 million that year, with remaining credits of $919 million estimated to be claimed over the following four years.
Natural Gas Assumptions
| 2016-17 | 2017-18 | 2018-19 | 2019-20 | 2020-21 | ||||||||||||||||||||
| Actual | Budget | Forecast | Estimate | Target | Target | |||||||||||||||||||
Revenue ($ millions) | 520 | 455 | 557 | 541 | 590 | 585 | ||||||||||||||||||
Price (Cdn$/GJ) | 2.01 | 2.90 | 1.90 | 2.00 | 2.20 | 2.40 | ||||||||||||||||||
Production (billions of cubic feet) | 4,186 | 4,094 | 4,367 | 4,502 | 4,556 | 4,525 | ||||||||||||||||||
Condensate production has been rising
and boosts conventional royalties.
Second phase of Petrochemicals
Diversification Program introduced,
following phase one success and
demand.
| FISCAL PLAN 2018 – 21 • REVENUE | 47 |
Tax revenue of $22.9 billion in 2018-19 is about half of total revenue.
Personal income tax revenue is $11.4 billion in 2018-19, and $12.6 billion by 2020-21.
Bonuses and sales of Crown land leases revenue in 2018-19 is estimated at $327 million, and is forecast to be relatively flat for the next two years. Revenue increased in 2017-18 with higher bid prices and more hectares for conventional oil and gas exploration sold than expected. The forecast assumes some of this increased investment will continue.
Non-Renewable Resource Revenue
(millions of dollars)
| 2016-17 | 2017-18 | 2018-19 | 2019-20 | 2020-21 | ||||||||||||||||||||
| Actual | Budget | Forecast | Estimate | Target | Target | |||||||||||||||||||
Bitumen royalty | 1,483 | 2,546 | 2,358 | 1,785 | 2,184 | 2,926 | ||||||||||||||||||
Crude oil royalty | 716 | 476 | 883 | 1,053 | 981 | 1,035 | ||||||||||||||||||
Natural gas & by-products royalty | 520 | 455 | 557 | 541 | 590 | 585 | ||||||||||||||||||
Bonuses & sales of Crown leases | 203 | 148 | 577 | 327 | 312 | 343 | ||||||||||||||||||
Rentals and fees / coal royalty | 174 | 129 | 159 | 123 | 116 | 111 | ||||||||||||||||||
Total Resource Revenue | 3,097 | 3,754 | 4,534 | 3,829 | 4,183 | 5,001 | ||||||||||||||||||
Tax Revenue
Tax revenue is forecast at $22.9 billion in 2018-19, 48% of total revenue. This is $1.7 billion, or 8%, higher than 2017-18, as personal and corporate income taxes strengthen coming out of the recession, and the Climate Leadership Plan carbon levy increases primarily as the carbon price moves from $20 per tonne of carbon dioxide equivalent to $30, effective January 1, 2018. Tax revenue grows to $26 billion by 2020-21, with about 80% of the increase from income tax revenue.
Personal income tax revenue is estimated at $11.4 billion in 2018-19, an increase of $532 million, or 4.9% from 2017-18. The 2017-18 forecast was decreased by $322 million from Budget 2017 after 2016 assessment data, not received until late summer 2017, proved to be much lower than expected. This indicated the drag on personal incomes from the recession was deeper than expected when Budget 2017 was prepared. The reduction to 2016 assessment data lowers the base used to forecast personal income tax revenue for 2017 and future years. However, with better employment and household income growth for 2017 and forward, personal income tax revenue is forecast to increase by an average of 5.3% per year between 2018-19 and 2020-21, to $12.6 billion.
Corporate income tax is forecast at $4.6 billion in 2018-19, $699 million or 18.1% higher than 2017-18. Corporate profits (net corporate operating surplus) fell by 64% in 2015 and by 46% in 2016, before reviving in 2017 with an estimated 91% growth, driven by solid exports, manufacturing and consumer spending. Corporate income tax revenue in 2017-18 was reduced though mainly due to larger-than-estimated refunds claimed in 2017 by corporations as they carried losses back against income taxes paid in 2013 and 2014. With corporate loss carry-backs depleting, refunds are expected to return to historical levels in the next two years, which boosts revenue. With ongoing positive corporate profits forecast, based on rising economic activity, improving oil prices, and cost containment, corporate income tax increases $1.2 billion between 2018-19 and 2020-21, an average of 12.1% per year, to $5.7 billion. This is still slightly below the level it was in 2014-15.
| FISCAL PLAN 2018 – 21 • REVENUE | 48 |
The Alberta investor and capital investment tax credits were introduced in Budget 2016, the first for investment in eligible small and medium-sized non-traditional sector businesses, and the second for spending on capital in eligible industries, with $165 million budgeted over two years. The credits are being extended to 2021-22, with an additional $185 million in funding. Of the total $350 million, $133 million is reported as expense, while $217 million is reported as a reduction to corporate income tax.
Education property tax revenue is forecast at $2.4 billion in 2018-19, the same as 2017-18. Instead of increasing the requisition based on the policy of 32% of total education system operating expense, the government has chosen to freeze revenue, saving property taxpayers $114 million. With lower assessment values resulting from the two-year recession, mill rates are increasing slightly, but only to raise the same revenue. The residential/farm rate is $2.56 per $1,000 of equalized assessment, and the non-residential rate is $3.76 per $1,000 of equalized assessment.
Other tax revenue is forecast at $4.5 billion in 2018-19, an increase of $458 million from 2017-18. The carbon levy is $344 million higher, mainly as the carbon price moved to $30 per tonne effective January 1, 2018. Other tax revenue is anticipated to grow another $416 million to $4.9 billion, an average of 4.5% per year between 2018-19 and 2020-21. The carbon levy increases by $146 million in 2020-21, mainly due to the federally-imposed increase in the carbon price, to $40 per tonne on January 1, 2021. Other taxes also reflect Alberta’s estimated share of the cannabis tax room agreed to by the federal and provincial governments, beginning with $26 million in 2018-19, and rising to $99 million by 2020-21.
Tax Revenue
(millions of dollars)
| 2016 17 | 2017 18 | 2018 19 | 2019-20 | 2020-21 | ||||||||||||||||||||
| Actual | Budget | Forecast | Estimate | Target | Target | |||||||||||||||||||
Personal income tax | 10,763 | 11,177 | 10,855 | 11,387 | 11,984 | 12,635 | ||||||||||||||||||
Corporate income tax | 3,769 | 3,918 | 3,852 | 4,551 | 5,293 | 5,719 | ||||||||||||||||||
Education property tax | 2,412 | 2,446 | 2,446 | 2,446 | 2,596 | 2,709 | ||||||||||||||||||
Carbon levy | 250 | 1,038 | 1,012 | 1,356 | 1,381 | 1,526 | ||||||||||||||||||
Other taxes | 2,987 | 3,183 | 3,046 | 3,159 | 3,294 | 3,406 | ||||||||||||||||||
Total | 20,181 | 21,762 | 21,211 | 22,899 | 24,548 | 25,995 | ||||||||||||||||||
Federal Transfers
Federal transfers are forecast at $8.2 billion in 2018-19, approximately 17% of total revenue. This is an increase of $300 million or 3.8% from 2017-18, even though 2017-18 included an additional in-year bump of $82 million in AgriStability agriculture support related to prior-year program claims.
The Canada Social Transfer (CST) and Canada Health Transfer (CHT) grow in line with federal annual escalators and changes to Alberta’s share of the national population. For CST, the escalator is 3%, while for CHT, it is based on the higher of the three-year average of national nominal GDP growth, or 3%. For 2018-19, the CHT escalator is estimated at 4%.
Alberta investor and capital investment tax credits extended, with more funding budgeted.
Education property tax revenue for
2018-19 frozen at 2017-18 level.
Federal transfers of $8.2 billion
in 2018-19 are about 17% of
government revenue.
| FISCAL PLAN 2018 – 21 • REVENUE | 49 |
Forecast includes new targeted funding
for home care, mental health care, early learning and child care, labour market programs and climate initiatives.
Investment income has averaged $3.1 billion over the last five years.
The forecast includes funding for a number of new or expanded programs: the renewed, enhanced labour market agreements, which increased by $29 million during 2017-18, and grow about $20 million per year for the next three years; the new Early Learning and Child Care Agreement introduced during 2017-18 which provides $46 million per year; the ten-year home care and mental health care agreement from last year, with $35 million in 2017-18, $100 million in 2018-19, and $148 million by 2020-21; the Low Carbon Economy Leadership Fund, built into Alberta’s Climate Leadership Plan, provides $29 million in 2018-19, $75 million in 2019-20, and $35 million in 2020-21.
Federal support for infrastructure was increased with the introduction of two programs for public transit and clean water and wastewater projects several years ago. Of the funding budgeted in 2017-18, $213 million has been re- profiled into 2018-19 and 2019-20, when the programs end.
Federal transfers are forecast to grow by an average of 2.6% between 2018-19 and 2020-21, reaching $8.6 billion, with expected increases in CHT, CST and other transfers enhanced by the new programs noted above, partly offset by the ending of the two time-sensitive infrastructure programs.
Transfers from Government of Canada
(millions of dollars)
| 2016-17 | 2017-18 | 2018-19 | 2019-20 | 2020-21 | ||||||||||||||||||||
| Actual | Budget | Forecast | Estimate | Target | Target | |||||||||||||||||||
Canada Health Transfer | 4,201 | 4,360 | 4,325 | 4,521 | 4,746 | 4,957 | ||||||||||||||||||
Canada Social Transfer | 1,558 | 1,614 | 1,600 | 1,657 | 1,713 | 1,772 | ||||||||||||||||||
Transfers to SUCH sector | 528 | 479 | 478 | 520 | 530 | 537 | ||||||||||||||||||
Agriculture support programs | 386 | 293 | 376 | 308 | 309 | 312 | ||||||||||||||||||
Infrastructure support | 337 | 741 | 528 | 510 | 395 | 276 | ||||||||||||||||||
Labour market agreements | 223 | 203 | 232 | 250 | 267 | 290 | ||||||||||||||||||
Other transfers | 747 | 298 | 379 | 452 | 509 | 500 | ||||||||||||||||||
Total | 7,979 | 7,988 | 7,918 | 8,218 | 8,470 | 8,645 | ||||||||||||||||||
Investment Income
Investment income is forecast at $2.9 billion in 2018-19, a $177 million or 6% decrease from 2017-18, mainly due to lower Heritage and endowment fund income, as financial markets reset after several years of strong returns which enabled significant gains to be realized from asset sales. The forecast typically assumes market returns will trend back to “normal” rates, so income tends to decrease in years after above-average returns. Over the last five years (2013-14 to 2017-18), investment income has averaged $3.1 billion.
Investment income is estimated to increase by an average of 7.9% per year between 2018-19 and 2020-21, reaching $3.4 billion. This is primarily from higher Alberta Capital Finance Authority (ACFA) income, and to including income from the new $5 billion reserve established to manage cash flow risk. Both of these are offset by related increased debt servicing costs.
Investment income from ACFA is forecast to increase by $127 million or 58% in 2018-19, and by an average of 12.5% per year to 2020-21. ACFA accesses the government’s strong credit rating to borrow and then transfers that advantage to municipalities and other local authorities by on-lending the proceeds. The large increases result from greater use of complex financial
| FISCAL PLAN 2018 – 21 • REVENUE | 50 |
instruments, such as swaps, to mitigate risk associated with managing the debt portfolio incurred, and the portfolio of loans provided to local authorities, including cash flow timing differences for repayments. The increased use arises as a significant amount of “fixed rate” debt has matured recently, and is being replaced with “floating rate” debt to enable this risk management. There is a related offsetting increase in debt servicing costs.
The Agriculture Financial Services Corporation (AFSC) similarly borrows at the government’s rate and lends the proceeds to Alberta’s agriculture sector. Again, associated debt servicing costs are offset by income from loans. AFSC is also an insurer, and has additional funds and investment income from this activity.
Fund Assets / Investment Income
(millions of dollars)
| Assets as at | 2016-17 | 2017-18 | 2018-19 | 2019-20 | 2020-21 | |||||||||||||||||||
| Mar. 31, 2017 | Actual | Forecast | Estimate | Target | Target | |||||||||||||||||||
Heritage Savings Trust Fund | 15,352 | 2,467 | 1,972 | 1,653 | 1,759 | 1,838 | ||||||||||||||||||
Endowment Funds a | 3,847 | 526 | 416 | 336 | 405 | 436 | ||||||||||||||||||
Alberta Capital Finance Authority | 15,797 | 185 | 218 | 345 | 394 | 437 | ||||||||||||||||||
Agriculture Financial Services Corp. | 5,107 | 130 | 125 | 135 | 145 | 157 | ||||||||||||||||||
SUCH sector | n.a. | 312 | 258 | 254 | 256 | 258 | ||||||||||||||||||
Cash reserve ($5 b.: Mar. 31, 2018) | - | - | - | 80 | 110 | 125 | ||||||||||||||||||
Other b | 2,936 | 78 | 72 | 81 | 92 | 106 | ||||||||||||||||||
Total | 43,039 | 3,698 | 3,061 | 2,884 | 3,161 | 3,357 | ||||||||||||||||||
| a | Includes Alberta Heritage Foundation for Medical Research Endowment Fund, Alberta Heritage Scholarship Fund and Alberta Heritage Science and Engineering Research Fund. |
| b | Assets include Contingency Account, Cancer Prevention Legacy Fund and Alberta Enterprise Corporation; investment income includes income from these sources, student loans and other investment income from a variety of smaller funds and accounts. |
Other Revenue
Other revenue is forecast at $10 billion in 2018-19, about 21% of total revenue. This is a decrease of $107 million from 2017-18, which included a positive change in the Balancing Pool net liability. The Pool was consolidated in government reporting at year-end 2016-17, when an initial $2 billion liability was reported as negative revenue. The liability was lowered by $771 million, which is reported as positive revenue in 2017-18. As the Pool legally ends in 2030, it will need to generate net income totalling $1.2 billion over 13 years to eliminate its liability.
Regulation of cannabis, and responsibility for on-line retail sales, has been assigned to the Alberta Gaming and Liquor Commission. Net income from these activities includes retailer fees and sales revenue, less costs for administration and purchasing inventory. In 2018-19 and 2019-20, net income is estimated at negative $43 million and $47 million respectively, as set-up and product acquisition costs exceed revenue, but after that, income turns positive, with $37 million forecast for 2020-21.
Compliance payments from large emitters into the Climate Change and Emissions Management Fund in 2018-19 are estimated to increase $331 million, as 2018 is the first year of the Carbon Competitiveness Incentive Regulation. Whereas
ACFA and AFSC provide government borrowing rate benefits to municipalities and farmers.
| FISCAL PLAN 2018 – 21 • REVENUE | 51 |
New regulation for large emitter compliance payments designed to encourage innovation
and reward success.
Tuition freeze extended, helping
Alberta families and students.
Alberta fiscal planning complicated by volatility in revenue,
but stability in government programs is considered essential.
Budget 2018 contains risk
adjustments to bottom lines, to signal possible revenue shortfalls.
the previous regulation measured facility emission performance relative to its own historic baseline, the new regulation rewards low-emission performance and incents innovation by setting numerous product emissions benchmarks. The increase in 2020-21 is mainly from the full phase-in of the new product benchmarks in 2020, and the federal carbon price increase to $40 per tonne January 1, 2021.
Other revenue is estimated to grow by $800 million, or an average of 3.9% per year, between 2018-19 and 2020-21, reaching $10.9 billion. In addition to the increases above, this reflects the forecast for moderate Alberta economic growth, with wages, population, household income, and in turn consumer spending increasing, driving volume-related revenue sources, such as gaming and liquor sales, land titles, motor vehicle licenses or other premiums and fees. The forecast includes another year of freezing post-secondary tuition fees, saving students $17 million in 2018-19.
Revenue from Other Sources
(millions of dollars)
| 2016-17 | 2017-18 | 2018-19 | 2019-20 | 2020-21 | ||||||||||||||||||||
| Actual | Budget | Forecast | Estimate | Target | Target | |||||||||||||||||||
AGLC - gaming / lottery | 1,430 | 1,445 | 1,384 | 1,439 | 1,465 | 1,507 | ||||||||||||||||||
AGLC - liquor / cannabis | 855 | 876 | 867 | 794 | 784 | 859 | ||||||||||||||||||
Alberta Treasury Branches | 151 | 93 | 212 | 242 | 281 | 331 | ||||||||||||||||||
Balancing Pool | (1,952 | ) | - | 771 | 161 | 86 | 86 | |||||||||||||||||
Post-secondary tuition fees | 1,169 | 1,223 | 1,223 | 1,237 | 1,260 | 1,288 | ||||||||||||||||||
Health / school board fees | 704 | 655 | 655 | 664 | 668 | 672 | ||||||||||||||||||
Other premiums, fees and licences | 1,828 | 1,805 | 1,864 | 1,953 | 2,001 | 2,036 | ||||||||||||||||||
SUCH sales, rentals, services | 1,063 | 1,040 | 1,058 | 1,040 | 1,068 | 1,089 | ||||||||||||||||||
SUCH fundraising, donations, gifts | 708 | 627 | 631 | 639 | 667 | 684 | ||||||||||||||||||
Climate Ch. and Emiss. Mgt. Fund | 163 | 196 | 210 | 541 | 649 | 977 | ||||||||||||||||||
Other | 1,219 | 1,261 | 1,282 | 1,340 | 1,324 | 1,321 | ||||||||||||||||||
Total | 7,338 | 9,221 | 10,157 | 10,050 | 10,253 | 10,850 | ||||||||||||||||||
Risks
Alberta relies heavily on revenue that is volatile and unpredictable, including non-renewable resources, corporate income tax and investment income. Since 2004-05, these have accounted for up to 55% of total revenue, but in 2017-18 they are estimated at only 24%. This revenue is linked to factors such as energy prices, equity markets, exchange and interest rates, geopolitical events, global economic swings and weather, which are all unpredictable and can fluctuate rapidly. The decline in resource revenue and corporate income tax relative to 2014-15 was directly tied to the collapse in oil prices, while investment income has been elevated with strong market returns over the last few years.
The degree of revenue uncertainty means the Alberta government must assess the degree of risk associated with its revenue outlook and spending decisions. For the last two years, the government has included an annual risk adjustment. This is $500 million in the 2018-19 fiscal year, $700 million in 2019-20 and then $1 billion in 2020-21.
| FISCAL PLAN 2018 – 21 • REVENUE | 52 |
GLOBAL AND US ECONOMIES
| ∎ | Budget 2018 assumes global economic expansion of 4% in 2018, propelled by the healthy growth advanced economies achieved in 2017, including the Euro area and Japan, firmer growth in developing economies such as India and Brazil, and a strong US economy. Growth in China continues to decelerate from its recent rapid rates. Substantial risks remain. |
| ∎ | Weaker-than-forecast global growth would harm Alberta’s revenue forecast, as oil prices would remain lower for longer. |
ENERGY PRICES
| ∎ | Oil prices began recovering in mid-2016. WTI is forecast to average US$54/bbl in 2017-18, $59 in 2018-19, and then to slowly ascend to $63 by 2020-21. Energy analysts expect long-term prices to reach US$70 within about five years. |
| ∎ | Price forecasts depend on an array of assumptions about demand and supply. Factors influencing demand include economic growth in disparate regions around the world, from the US to China to Europe, pipeline or refinery outages, and storage and speculative market activities by traders. On the supply side, the level and duration of compliance with the agreement to cut production by OPEC and several non-OPEC members is critical, as has been the response to higher prices by the US industry. Other factors include investment and drilling decisions by other producers, geopolitical events, civil unrest or terrorist strikes, economic sanctions, or simple weather-related production disruptions. |
| ∎ | Without sufficient pipeline capacity, Alberta’s growing bitumen production is being transported by more costly and less safe rail, increasing the light-heavy differential, lowering prices for producers and government revenue. |
| ∎ | Natural gas prices remain weak due mainly to increasing production of US shale gas that has outstripped demand growth. |
INTEREST RATES
| ∎ | Interest rates have bumped up during the last year, and are forecast to rise gradually over the next several years, as global economic activity continues to pick up, labour markets tighten and inflationary pressures begin to mount. Lower rates generally help government investment income. While short-term investments perform poorly, the market value of bonds with higher rates held in endowment portfolios increase. |
| ∎ | Lower rates also typically encourage business investment, economic activity and consumer spending, all providing economic support to Alberta’s resource-based economy harmed by the oil price weakness. |
| ∎ | Rising rates pose risks for indebted households, consumer spending and the government, as substantial borrowing is planned, and higher rates make borrowing or refinancing of debt more expensive. |
Continued solid global economic
growth forecast.
Energy prices impacted by a variety of global variables, and pipeline access
for Canadian producers.
| FISCAL PLAN 2018 – 21 • REVENUE | 53 |
Exchange rate forecast increased
to 80US¢/Cdn$ for
next three years.
Corporate profits and corporate income tax difficult to forecast.
EXCHANGE RATES
| ∎ | The US-Canadian dollar exchange rate is forecast to average 80US¢/Cdn$ in 2018-19 and subsequent years, up from 78US¢/Cdn$ in 2017-18. |
| ∎ | A stronger Canadian dollar decreases the value of oil exports and the demand for exports priced in Canadian dollars. Changes in the exchange rate affect the profitability of energy producers, which can affect investment and government resource revenue as energy prices and contracts are mainly in US dollars. Investment income is also impacted due to significant foreign holdings in the Heritage Savings Trust Fund and endowment funds. |
EQUITY MARKETS
| ∎ | Equity markets have performed well the last several years, and government investment income has benefited. Markets can be affected by a wide range of factors, such as the strength of the US, European and developing economies, or fluctuations in commodity prices and interest rates. |
| ∎ | Alberta has significant assets invested globally in a variety of asset classes. The investment income forecast is based on recent government performance, and long-term expected rates of return. Financial market performance and investment income could vary considerably. |
NET CORPORATE OPERATING SURPLUS
| ∎ | Corporate profits in Alberta were hit hard in 2015 and 2016, but are rebounding, with reduced labour and other costs, and growing exports and consumer spending. Energy investment declined with the drop in oil prices, and as various energy projects transition from construction to the production phase, but is forecast to stabilize and pick up moderately. However, it can be difficult to predict how forecast net corporate operating surplus translates to corporate income tax revenue, as taxable income can differ significantly from corporate profits, due to tax changes or discretionary deductions such as depreciation or prior-year losses which can be carried forward or back and affect corporate income tax revenue for years. |
Sensitivities to Fiscal Year Assumptions, 2018–19a
(millions of dollars)
| Change | Net Impact | |||||
Oil price (WTI US$/bbl) | -$1 | -265 | ||||
Light-heavy oil price differential (US$/bb) | +$1 | -210 | ||||
Natural gas price (Cdn$/GJ) | -10¢ | 10 | ||||
Exchange rate (US¢/Cdn$) | + 1¢ | -198 | ||||
Interest rates | +1% | -226 | ||||
Primary household income | -1% | -150 | ||||
| a | Sensitivities are based on current assumptions of prices and rates and show the effect for a full 12 month period. Sensitivities can vary significantly at different price and rate levels. The energy price sensitivities do not include the potential impact of price changes on revenue from land lease sales. A reduction in the natural gas price now increases net revenue, as the negative impact on natural gas royalties is more than offset by the positive impact on bitumen royalties, since costs are lower as natural gas is used in bitumen production. |
| FISCAL PLAN 2018 – 21 • REVENUE | 54 |
Fiscal Plan
Capital Plan
| 55 |
| Table of Contents | ||
| CAPITAL PLAN | ||
2018 Capital Plan | 57 | |
Health Care | 58 | |
Education | 58 | |
Family, Social Supports and Housing | 58 | |
Roads and Bridges | 58 | |
Environmental Sustainability | 58 | |
Municipal Infrastructure. | 59 | |
Other Capital Projects | 59 | |
Capital Plan Details. | 60 | |
Unfunded Capital Projects (as of March 22, 2018). | 65 | |
| FISCAL PLAN 2018 – 21 • CAPITAL PLAN | 56 |
2018 Capital Plan
Economic recovery is underway and strengthening across Alberta. While the province still has a way to go, things are looking up. When the price of oil collapsed, the government listened to the advice of the former Governor of the Bank of Canada, David Dodge. Instead of making matters worse, the government put Albertans to work building badly needed infrastructure. The plan is working.
David Dodge also said that when the economy begins to recover, government should bring spending back to more normal levels. The 2018 Capital Plan does that, while continuing to invest in the vital schools, hospitals and roads that Albertans rely on.
As the economy recovers and capital spending returns to more normal levels, continued and strategic investment is critical to promoting growth and employment opportunities in communities across Alberta. The 2018 Capital Plan ensures that promises are kept – that construction continues on previously-announced projects like the Calgary Cancer Centre and Willow Square in Fort McMurray, and that new investments are made in the infrastructure Alberta families need.
From schools and hospitals, to roads and bridges, seniors’ accommodations and affordable housing, government is investing to ensure Albertans have access to the public infrastructure they require for years to come. Focused on careful and responsible spending, the Capital Plan invests $26.6 billion over five years, helping the province move forward with its economic recovery.
The criteria used to review projects is posted online at:
www.infrastructure.alberta.ca/6.htm
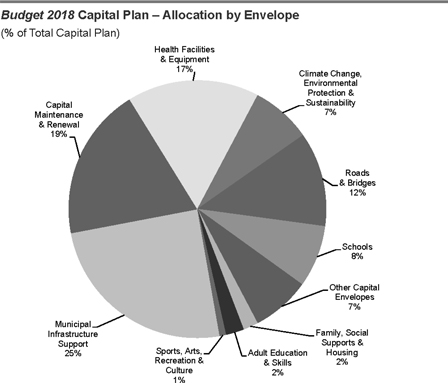
Budget 2018 returns the Capital Plan to normal spending levels while investing in schools, hospitals and roads.
| FISCAL PLAN 2018 – 21 • CAPITAL PLAN | 57 |
Health Care
Government is investing $4.6 billion over five years in capital projects that improve access to health care for Albertans. This investment supports dozens of projects underway including the new hospital in Edmonton; the Calgary Cancer Centre; the Norwood Long Term Care Facility; the Edmonton Clinical Laboratory Hub and capital planning for health in the Red Deer region. This budget also includes $59 million to upgrade the medical instrument cleaning and sterilization units in the Red Deer Regional Hospital and Calgary’s Peter Lougheed Centre.
Education
The 2018 Capital Plan will focus on planning and building modern school facilities to support student learning and wellbeing. This Capital Plan invests $2.2 billion over the next five years on school infrastructure. The funding includes $393 million for 20 new school projects, and an additional $25 million to fund the continuation of the schools modular program that provides school jurisdictions with additional classroom space to meet varying enrolment needs.
Government is investing $641 million in the province’s post-secondary infrastructure. Funding supports projects underway throughout Alberta including University of Calgary MacKimmie Complex and the University of Lethbridge Destination Project. This investment also provides $30 million to upgrade the District Energy System for the University of Alberta to increase the capacity of the campus’ electrical system.
Family, Social Supports and Housing
From Slave Lake and Whitecourt in the north, to Edmonton, Fort Saskatchewan and Red Deer in central Alberta, and south to Calgary, Lethbridge and Medicine Hat, government is committed to supporting seniors, at-risk youth, and homeless or low-income individuals and families. The 2018 Capital Plan includes an investment of $50 million to support nine new projects that will increase access to safe, affordable, and barrier-free homes for Alberta families.
Roads and Bridges
The Capital Plan will invest $5.6 billion over five years, including $2.3 billion in Capital Maintenance and Renewal, for major work on roads and bridges as part of the government’s commitment to foster economic competitiveness and create jobs. This investment includes completion of existing projects such as the Gaetz Ave-Highway 2 project at Red Deer, the Highway 2-Peace River Bridge, the Grande Prairie-Highway 43X bypass, the Highway 15 bridge at Fort Saskatchewan, Southwest Calgary Ring Road and other critical infrastructure. Alberta will continue to invest in developing key economic corridors to ensure goods are transported cost-effectively, and safely.
Environmental Sustainability
Government is focused on enhancing the province’s environmental sustainability. Over the next five years, programming includes $124 million for sustainable energy programs for Indigenous communities, funding to support a variety of energy
| FISCAL PLAN 2018 – 21 • CAPITAL PLAN | 58 |
efficiency and environmental infrastructure projects. The Capital Plan invests in projects that enhance the way public infrastructure is designed, built, and operated in order to reduce the province’s impact on the environment. This includes $22 million for the Foothills Medical Centre Power Plant, $68 million for reducing provincial office space footprints, and $17 million in capital investments for retrofitting affordable housing units to make buildings more environmentally and financially sustainable.
Municipal Infrastructure
The Capital Plan provides $6.9 billion for municipalities, including $0.9 billion for light rail transit. $3 billion is being committed over the next ten years for light rail transit in Edmonton and Calgary. This commitment will help our largest cities grow while cutting GHG emissions. As government addresses its fiscal challenges, and as the end of MSI approaches, funding arrangements with municipalities will be reviewed. Pending a new program, targeted funding under the MSI has been reduced by $152 million each year. The reduction will have the MSI program continuing to end in 2021-22. The government is committed to working with municipalities, over the coming months, to replace the MSI with a new infrastructure grant program, with a funding formula based on revenue sharing. Annual funding for a number application-based municipal grant programs is also reduced. This reduction extends programs like the Alberta Community Transit Fund, Strategic Transportation Infrastructure Program, Municipal and Regional Water and Wastewater programs over the five-year Capital Plan. To provide municipalities with increased flexibility in planning capital projects and adjusting to the new fiscal arrangements, government reprofiled $800 million in MSI funds to municipalities in 2017-18, $400 million from 2018-19 and $400 million from 2019-20.
Other Capital Projects
Budget 2018 Capital Plan also provides:
| ∎ | $5.4 billion for capital maintenance and renewal, including: |
| ◆ | Roads and bridges – $2.3 billion |
| ◆ | Schools – $696 million |
| ◆ | Post-secondary facilities – $736 million |
| ◆ | Health care facilities – $700 million |
| ◆ | Government-owned facilities – $441 million |
| ◆ | Seniors facilities and housing – $247 million |
| ◆ | Provincial parks – $139 million |
| ◆ | Information technology – $83 million |
| ◆ | Innovation infrastructure maintenance – $12 million |
| ◆ | Fish Culture Capital Maintenance and Renewal Program – $13 million |
| ◆ | Airtanker base maintenance – $4 million |
| ∎ | Support for culture and recreation projects, including: |
| ◆ | Jubilee Auditoria in Calgary and Edmonton – upgrades |
| ◆ | Telus World of Science, Edmonton – expansion and upgrades |
| ◆ | Vivo for Healthier Generations multi-recreation facility, Calgary – expansion |
| ◆ | Winspear Centre, Edmonton – expansion |
| FISCAL PLAN 2018 – 21 • CAPITAL PLAN | 59 |
Capital Plan Details
(millions of dollars)
| 2018-19 Estimate | 2019-20 Target | 2020-21 Target | 2021-22 Target | 2022-23 Target | 5-Year Total | |||||||||||||||||||
Adult Education and Skills | ||||||||||||||||||||||||
Keyano College – Campus Upgrades | 8 | - | - | - | - | 8 | ||||||||||||||||||
Medicine Hat College – East Campus Development | 4 | - | - | - | - | 4 | ||||||||||||||||||
Northern Lakes College – High Prairie Consolidation | - | 11 | 10 | - | - | 21 | ||||||||||||||||||
Strategic Investment Fund | 28 | - | - | - | - | 28 | ||||||||||||||||||
University of Alberta – Dentistry Pharmacy – Functional Renewal of Building | 52 | 43 | 44 | 44 | 56 | 239 | ||||||||||||||||||
University of Alberta – District Energy System | 14 | 9 | 5 | 2 | - | 30 | ||||||||||||||||||
University of Calgary – MacKimmie Complex | 75 | 95 | 60 | 32 | - | 262 | ||||||||||||||||||
University of Lethbridge Destination Project | 27 | 23 | - | - | - | 50 | ||||||||||||||||||
Total Adult Education and Skills | 208 | 180 | 119 | 78 | 56 | 641 | ||||||||||||||||||
Agriculture, Natural Resources and Industry | ||||||||||||||||||||||||
Alberta Tree Improvement and Seed Centre (ATISC) | 1 | - | - | - | - | 1 | ||||||||||||||||||
Flat Top Complex | 2 | 2 | 2 | 2 | 2 | 11 | ||||||||||||||||||
Footner Lake (High Level) Facility Renovations and Enhancements | 1 | 1 | - | - | - | 1 | ||||||||||||||||||
Irrigation Rehabilitation Program | 14 | 14 | 10 | 19 | 19 | 76 | ||||||||||||||||||
Land Stewardship Fund | 10 | 10 | 10 | 10 | 10 | 50 | ||||||||||||||||||
Partial Upgrading | - | 10 | 10 | 20 | 20 | 60 | ||||||||||||||||||
Petrochemical Feedstock Program | - | - | - | 100 | 100 | 200 | ||||||||||||||||||
Rural Utilities Program | 3 | 3 | 3 | 4 | 4 | 18 | ||||||||||||||||||
Wildfire Management and Facility Upgrade Program | 6 | 6 | 6 | 6 | 6 | 32 | ||||||||||||||||||
Total Agriculture, Natural Resources and Industry | 38 | 46 | 42 | 161 | 161 | 449 | ||||||||||||||||||
Capital Maintenance and Renewal | ||||||||||||||||||||||||
Air Tanker Base Maintenance | 1 | 1 | 1 | 1 | 1 | 4 | ||||||||||||||||||
Fish Culture Capital Maintenance and Renewal Program | 4 | 3 | 2 | 2 | 1 | 13 | ||||||||||||||||||
Government-Owned | 60 | 75 | 75 | 115 | 116 | 441 | ||||||||||||||||||
Health Care Facilities | 131 | 109 | 110 | 185 | 165 | 700 | ||||||||||||||||||
Information Technology | 13 | 18 | 18 | 17 | 17 | 83 | ||||||||||||||||||
Innovation Infrastructure Maintenance | 2 | 2 | 2 | 3 | 3 | 12 | ||||||||||||||||||
Post-Secondary | 119 | 119 | 119 | 190 | 190 | 736 | ||||||||||||||||||
Provincial Parks | 20 | 25 | 25 | 34 | 34 | 139 | ||||||||||||||||||
Roads and Bridges | 410 | 380 | 380 | 560 | 560 | 2,291 | ||||||||||||||||||
Schools | 111 | 116 | 116 | 190 | 163 | 696 | ||||||||||||||||||
Seniors Facilities and Housing | 52 | 38 | 37 | 60 | 60 | 247 | ||||||||||||||||||
Total Capital Maintenance and Renewal | 923 | 887 | 886 | 1,358 | 1,309 | 5,363 | ||||||||||||||||||
...continues next page
| FISCAL PLAN 2018 – 21 • CAPITAL PLAN | 60 |
Capital Plan Details, continued
(millions of dollars)
| 2018-19 Estimate | 2019-20 Target | 2020-21 Target | 2021-22 Target | 2022-23 Target | 5-Year Total | |||||||||||||||||||
Climate Change, Environmental Protection and Sustainability | ||||||||||||||||||||||||
Carbon Capture and Storage Initiative | 272 | 71 | 58 | 58 | 58 | 519 | ||||||||||||||||||
Caribou Rearing Facility | 4 | 2 | 1 | 2 | - | 9 | ||||||||||||||||||
Castle Provincial Park | 2 | 2 | 2 | - | - | 6 | ||||||||||||||||||
Clean Water and Wastewater Fund (CWWF) | 59 | 20 | - | - | - | 79 | ||||||||||||||||||
Climate Leadership Plan: Foothills Medical Centre Power Plant Redevelopment (co-generation initiative) (Calgary) | 11 | 12 | - | - | - | 24 | ||||||||||||||||||
Climate Leadership Plan: Other Projects (includes Energy Efficiency for Indigenous Communities and Seniors Affordable | 65 | 72 | 34 | 24 | - | 194 | ||||||||||||||||||
Housing) Critical Environmental Monitoring and Science | 1 | 1 | 1 | 1 | 1 | 5 | ||||||||||||||||||
Investment First Nations Water Tie-In Program | 24 | 24 | 13 | 12 | 10 | 83 | ||||||||||||||||||
Flood Recovery Projects | 163 | 169 | 124 | 105 | 50 | 611 | ||||||||||||||||||
Municipal Water and Wastewater Program | 45 | 25 | 14 | 22 | 22 | 128 | ||||||||||||||||||
Public Lands Trail Plan Development | 1 | - | - | - | - | 1 | ||||||||||||||||||
Regional Water / Wastewater Projects – Water for Life | 69 | 53 | 41 | 50 | 50 | 263 | ||||||||||||||||||
Swan Hills Treatment Centre | 5 | 5 | 5 | 5 | 5 | 25 | ||||||||||||||||||
Water Line to Castle Region | 6 | 3 | - | - | - | 9 | ||||||||||||||||||
Water Management Infrastructure | 29 | 29 | 30 | 30 | 30 | 148 | ||||||||||||||||||
Whirling Disease Management | 2 | - | - | - | - | 2 | ||||||||||||||||||
Total Climate Change, Environmental Protection and Sustainability | 759 | 487 | 323 | 309 | 226 | 2,105 | ||||||||||||||||||
Family, Social Supports and Housing | ||||||||||||||||||||||||
Aboriginal Business Investment Fund | 5 | 5 | 5 | 5 | - | 20 | ||||||||||||||||||
Family and Community Housing Development and Renewal | 45 | 33 | 8 | - | - | 86 | ||||||||||||||||||
Indigenous Housing Capital Program | 1 | 17 | 18 | 18 | 18 | 72 | ||||||||||||||||||
Long Term Governance and Funding Agreement (LTA) | 3 | 3 | 2 | 2 | 2 | 12 | ||||||||||||||||||
New Housing Supply – Affordable and Specialized Housing | 20 | 13 | 9 | 5 | - | 46 | ||||||||||||||||||
Planning for Affordable Housing | 3 | 3 | 3 | - | - | 8 | ||||||||||||||||||
Seniors Housing Development and Renewal | 144 | 98 | 33 | 4 | - | 280 | ||||||||||||||||||
Total Family, Social Supports and Housing | 220 | 172 | 78 | 34 | 20 | 524 | ||||||||||||||||||
Government Facilities, Equipment and Other
| ||||||||||||||||||||||||
Agrivalue Processing Business Incubator (Leduc) | 1 | 10 | 11 | 2 | - | 24 | ||||||||||||||||||
Alberta Innovates – Govier Air Handling Unit Project (Edmonton) | 2 | - | - | - | - | 2 | ||||||||||||||||||
Alberta Innovates – Millwoods Fuels and Lubricants Group Safety Upgrade | 4 | - | - | - | 4 | |||||||||||||||||||
Alberta Innovates / InnoTech Alberta Fume Hood Replacement Program | 4 | 4 | 4 | 3 | 3 | 18 | ||||||||||||||||||
Electronic Health Record | 6 | 6 | 6 | 6 | 6 | 29 | ||||||||||||||||||
Federal Building and Centennial Plaza (Edmonton) | 1 | - | - | - | - | 1 | ||||||||||||||||||
General Information Technology and other Capital | 84 | 63 | 66 | 61 | 61 | 336 | ||||||||||||||||||
Government Accommodation | 31 | 50 | 50 | 50 | 50 | 231 | ||||||||||||||||||
Government Vehicle Fleet | 13 | 13 | 13 | 13 | 13 | 64 | ||||||||||||||||||
Health IT Systems Development | 22 | 22 | 22 | 22 | 22 | 111 | ||||||||||||||||||
Infrastructure Capital Planning | 10 | 10 | 10 | 10 | 10 | 48 | ||||||||||||||||||
Land Purchases | 8 | 8 | 8 | 8 | 8 | 42 | ||||||||||||||||||
Modernization of Registry Systems | 12 | 5 | 4 | 10 | 10 | 41 | ||||||||||||||||||
One Information Management and Technology (IMT) Enterprise Planning Priorities | 5 | 5 | 5 | 5 | 5 | 25 | ||||||||||||||||||
One Management Technology(IMT) Enterprise Priorities | 51 | 44 | 44 | 44 | 44 | 227 | ||||||||||||||||||
Total Government Facilities, Equipment and Other | 254 | 240 | 244 | 234 | 231 | 1,202 | ||||||||||||||||||
...continues next page
| FISCAL PLAN 2018 – 21 • CAPITAL PLAN | 61 |
Capital Plan Details, continued
(millions of dollars)
| 2018-19 Estimate | 2019-20 Target | 2020-21 Target | 2021-22 Target | 2022-23 Target | 5-Year Total | |||||||||||||||||||
Health Facilities and Equipment | ||||||||||||||||||||||||
Addictions and Detox Centres | 5 | 2 | - | - | - | 7 | ||||||||||||||||||
Calgary Cancer Centre | 295 | 416 | 379 | 137 | 10 | 1,236 | ||||||||||||||||||
Clinical Information Systems | 80 | 100 | 100 | 67 | 20 | 367 | ||||||||||||||||||
Complex Continuing Care Facility (Calgary) | 10 | 43 | 40 | 33 | 5 | 130 | ||||||||||||||||||
Continuing Care Beds | 49 | 47 | 51 | 42 | 32 | 221 | ||||||||||||||||||
Edmonton Clinical Laboratory Hub | 10 | 60 | 200 | 200 | 120 | 590 | ||||||||||||||||||
Edmonton hospital | 5 | 15 | 70 | 228 | 305 | 623 | ||||||||||||||||||
Edson Healthcare Centre | 5 | - | - | - | - | 5 | ||||||||||||||||||
Equipment for Cancer Corridor Projects | 3 | - | - | - | - | 3 | ||||||||||||||||||
Foothills Medical Centre (Calgary) | 7 | - | - | - | - | 7 | ||||||||||||||||||
Foothills Medical Centre Urgent Power Plant Capacity (Calgary) | 15 | 7 | - | - | - | 22 | ||||||||||||||||||
Fort McMurray Residential Facility-Based Care Centre | 50 | 50 | 6 | - | - | 106 | ||||||||||||||||||
Grande Prairie Regional Hospital | 126 | 81 | 29 | 11 | 4 | 251 | ||||||||||||||||||
Health Facility Project Planning Funds | 2 | 2 | 1 | 1 | 1 | 6 | ||||||||||||||||||
High Prairie Health Complex | 6 | - | - | - | - | 6 | ||||||||||||||||||
Lloydminster Continuing Care Centre | 2 | 3 | - | - | - | 5 | ||||||||||||||||||
Medical Device Reprocessing Upgrades Program – Phase 1 | 6 | 26 | 25 | 2 | - | 59 | ||||||||||||||||||
Medical Equipment Replacement and Upgrade Program | 30 | 30 | 30 | 30 | 30 | 150 | ||||||||||||||||||
Medicine Hat Regional Hospital | 13 | 11 | 8 | - | - | 32 | ||||||||||||||||||
Misericordia Community Hospital – Planning | 1 | 5 | 4 | - | - | 10 | ||||||||||||||||||
Misericordia Community Hospital Modernization Program | 13 | 20 | 20 | 21 | 12 | 85 | ||||||||||||||||||
Northern Lights Regional Health Centre Repairs (Fort McMurray) | 14 | 15 | - | - | - | 29 | ||||||||||||||||||
Norwood Long Term Care Facility (Edmonton) | 18 | 14 | 52 | 96 | 114 | 293 | ||||||||||||||||||
Other Health Initiatives | 50 | - | - | - | - | 50 | ||||||||||||||||||
Peter Lougheed Centre (Women’s Services and Vascular Renovations) (Calgary) | 4 | - | - | - | - | 4 | ||||||||||||||||||
Peter Lougheed Centre Emergency Department, Mental Health Intensive Care Unit and Laboratory Redevelopment | 5 | - | - | - | - | 5 | ||||||||||||||||||
Provincial Heliports | 7 | - | - | - | - | 7 | ||||||||||||||||||
Provincial Pharmacy Central Drug Production and Distribution Centre | 4 | 9 | 26 | 12 | 14 | 66 | ||||||||||||||||||
Red Deer Health Capital Planning | 1 | - | - | - | - | 1 | ||||||||||||||||||
Royal Alexandra Hospital - Child and Adolescent Mental Health - New Building | 15 | 31 | 65 | 40 | 43 | 194 | ||||||||||||||||||
Royal Alexandra Hospital – Planning | 1 | 4 | 5 | - | - | 10 | ||||||||||||||||||
Stollery Children’s Hospital Critical Care Program (Edmonton) | 6 | 6 | 6 | 26 | - | 44 | ||||||||||||||||||
Total Health Facilities and Equipment | 858 | 997 | 1,116 | 943 | 709 | 4,623 | ||||||||||||||||||
...continues next page
| FISCAL PLAN 2018 – 21 • CAPITAL PLAN | 62 |
Capital Plan Details, continued
(millions of dollars)
| 2018-19 Estimate | 2019-20 Target | 2020-21 Target | 2021-22 Target | 2022-23 Target | 5-Year Total | |||||||||||||||||||
Municipal Infrastructure Support Alberta | ||||||||||||||||||||||||
Community Transit Fund Centralized | 22 | 48 | 45 | 50 | 50 | 215 | ||||||||||||||||||
Industrial Property Assessment Climate | 3 | 1 | 1 | - | - | 5 | ||||||||||||||||||
Leadership Plan: LRT Projects Community | - | 65 | 100 | 305 | 385 | 855 | ||||||||||||||||||
Facility Enhancement Program Federal Gas | 38 | 38 | 38 | 38 | 38 | 190 | ||||||||||||||||||
Tax Fund | 230 | 230 | 230 | 230 | 230 | 1,148 | ||||||||||||||||||
GreenTRIP | 250 | 180 | 10 | 5 | - | 445 | ||||||||||||||||||
Municipal Sustainability Initiative | ||||||||||||||||||||||||
Municipal Sustainability Initiative – Capital | 294 | 294 | 694 | 667 | - | 1,949 | ||||||||||||||||||
Basic Municipal Transportation Grant | 344 | 353 | 363 | 372 | 372 | 1,804 | ||||||||||||||||||
New Building Canada – Small Communities Fund | 17 | 10 | - | - | - | 27 | ||||||||||||||||||
Public Transit Infrastructure Fund (PTIF) | 136 | 75 | - | - | - | 212 | ||||||||||||||||||
Strategic Transportation Infrastructure Program | 27 | 18 | 15 | 15 | - | 75 | ||||||||||||||||||
Total Municipal Infrastructure Support | 1,361 | 1,312 | 1,495 | 1,681 | 1,075 | 6,924 | ||||||||||||||||||
Public Safety and Emergency Services | ||||||||||||||||||||||||
Alberta First Responders Radio Communications System | 7 | 5 | - | - | - | 12 | ||||||||||||||||||
Calgary Bail Hearing Office Project | 1 | - | - | - | - | 1 | ||||||||||||||||||
Calgary Bow Crow Fire Centre Renovation and Expansion | 1 | - | - | - | - | 1 | ||||||||||||||||||
Calgary Court of Appeal – Planning | 2 | - | - | - | - | 2 | ||||||||||||||||||
Calgary Remand Centre Divided Living Units | 3 | - | - | - | - | 3 | ||||||||||||||||||
Calgary Young Offender Centre - Security Upgrades | 2 | 1 | - | - | - | 2 | ||||||||||||||||||
Courthouse Renewal | 16 | 22 | 12 | 4 | - | 54 | ||||||||||||||||||
Courthouse Upgrades and Renovations (Calgary, Edmonton, and Lethbridge) | 2 | 1 | - | - | - | 2 | ||||||||||||||||||
Disaster Recovery Program – Redesign | 2 | 2 | - | - | - | 4 | ||||||||||||||||||
Kananaskis Emergency Services Centre | 9 | 7 | 1 | - | - | 17 | ||||||||||||||||||
Planning Funds | 1 | - | - | - | - | 1 | ||||||||||||||||||
Provincial Operations Centre | 12 | 40 | 53 | 20 | - | 125 | ||||||||||||||||||
Red Deer Justice Centre | 5 | 12 | 48 | 72 | 45 | 181 | ||||||||||||||||||
Total Public Safety and Emergency Services | 62 | 90 | 113 | 96 | 45 | 406 | ||||||||||||||||||
...continues next page
| FISCAL PLAN 2018 – 21 • CAPITAL PLAN | 63 |
Capital Plan Details, continued
(millions of dollars)
| 2018-19 Estimate | 2019-20 Target | 2020-21 Target | 2021-22 Target | 2022-23 Target | 5-Year Total | |||||||||||||||||||
Roads and Bridges | ||||||||||||||||||||||||
Assessment and Support Systems | 20 | 20 | 20 | 20 | 20 | 98 | ||||||||||||||||||
City of Edmonton – 50th Street | - | - | - | - | 14 | 14 | ||||||||||||||||||
Edmonton/Calgary Ring Roads | 396 | 450 | 513 | 388 | 396 | 2,144 | ||||||||||||||||||
Gaetz Avenue / Taylor Drive Interchange (Red Deer) | 22 | 5 | - | - | - | 27 | ||||||||||||||||||
Grande Prairie – Highway 43 Bypass | 20 | 5 | - | 7 | - | 32 | ||||||||||||||||||
Highway 19 (East and West ends) | 23 | 11 | 9 | - | 4 | 47 | ||||||||||||||||||
Highway 63 Twinning (Grassland to Fort McMurray) | 3 | - | 5 | 22 | 23 | 53 | ||||||||||||||||||
Highway Twinning, Widening and Expansion | 131 | 113 | 121 | 211 | 143 | 718 | ||||||||||||||||||
Other Road and Bridge Projects | 9 | 9 | 6 | 6 | 6 | 37 | ||||||||||||||||||
Peace River Bridge | 50 | 46 | 46 | 4 | - | 146 | ||||||||||||||||||
Total Roads and Bridges | 674 | 659 | 719 | 657 | 605 | 3,315 | ||||||||||||||||||
Schools | ||||||||||||||||||||||||
Education Planning Funds | 2 | 2 | 2 | 2 | 2 | 10 | ||||||||||||||||||
Future School Projects | - | 7 | 65 | 230 | 81 | 382 | ||||||||||||||||||
Modular Classroom Program | 50 | 25 | - | - | - | 75 | ||||||||||||||||||
Peerless Trout First Nation Schools | 16 | 3 | - | - | - | 19 | ||||||||||||||||||
Playgrounds | 5 | 5 | 5 | - | - | 15 | ||||||||||||||||||
Previously Announced School Projects | 470 | 320 | 305 | 163 | 22 | 1,281 | ||||||||||||||||||
Schools Capital Projects 2018-23 | 6 | 61 | 241 | 80 | 6 | 393 | ||||||||||||||||||
Total Schools | 549 | 423 | 618 | 475 | 111 | 2,175 | ||||||||||||||||||
Sports, Arts, Recreation and Culture | ||||||||||||||||||||||||
Calgary Zoo Expansion | 3 | - | - | - | - | 3 | ||||||||||||||||||
Fort Edmonton Park - Expansion | 14 | - | - | - | - | 14 | ||||||||||||||||||
Jubilee Auditoria Back-of-House Upgrades (Edmonton and Calgary) | 1 | 4 | 3 | 1 | - | 9 | ||||||||||||||||||
Parks Lower Athabasca Regional Implementation | 5 | 5 | 5 | 5 | 5 | 25 | ||||||||||||||||||
Parks South Saskatchewan Regional Plan Implementation | 10 | 10 | 10 | 10 | 10 | 50 | ||||||||||||||||||
Reynolds – Alberta Museum (Wetaskiwin) | 7 | 18 | 15 | - | - | 40 | ||||||||||||||||||
Royal Alberta Museum (Edmonton) | 6 | 9 | - | - | - | 16 | ||||||||||||||||||
Royal Tyrrell Museum of Palaeontology – Expansion (Drumheller) | 5 | 2 | - | - | - | 7 | ||||||||||||||||||
Telus World of Science (Edmonton) | 4 | 4 | 4 | - | - | 12 | ||||||||||||||||||
Vivo for Healthier Generations (Calgary) | 5 | 5 | 5 | - | - | 15 | ||||||||||||||||||
William Watson Lodge | 1 | 1 | 1 | 1 | - | 2 | ||||||||||||||||||
Winspear Centre (Edmonton) | 4 | 4 | 4 | - | - | 13 | ||||||||||||||||||
Winsport (CODA) – Sliding Track Refurbishment | 5 | - | - | - | - | 5 | ||||||||||||||||||
Total Sports, Arts, Recreation and Culture | 70 | 62 | 47 | 17 | 15 | 211 | ||||||||||||||||||
Contingency / Unallocated | ||||||||||||||||||||||||
Expected Cash Flow Adjustments | (391) | (388) | (431) | (360) | (245) | (1,815) | ||||||||||||||||||
Unallocated | - | - | - | 140 | 336 | 477 | ||||||||||||||||||
Total Contingency / Unallocated | (391) | (388) | (431) | (220) | 92 | (1,338) | ||||||||||||||||||
Total Capital Plan – Core Government | 5,585 | 5,168 | 5,369 | 5,824 | 4,654 | 26,599 | ||||||||||||||||||
Schools, Universities, Colleges, Hospitals (SUCH) Sector – Self-financed Investment | 860 | 717 | 662 | 541 | 505 | 3,285 | ||||||||||||||||||
Total Capital Plan – Fully Consolidated Basis | 6,444 | 5,884 | 6,032 | 6,365 | 5,159 | 29,884 | ||||||||||||||||||
| FISCAL PLAN 2018 – 21 • CAPITAL PLAN | 64 |
Unfunded Capital Projects (as of March 22, 2018)
As part of the commitment to transparency and openness, the government is presenting a list of unfunded capital projects as an addendum to the Budget 2018 Capital Plan. It is comprised of projects presented by departments that met priority criteria and fit within the three pillars of the Capital Plan: key social programs and services that Albertans rely on; encouraging economic development in communities, and protecting the environment.
Some of these projects will receive funding for planning as part the Budget 2018 Capital Plan. If the projects meet the criteria and there is funding available, they will be reflected in future capital plans. Adjustments to the Budget 2018 Capital Plan will be made to address emerging needs and issues around the province. Finally, this list is not all-encompassing, as there are many worthy projects in Alberta that are not reflected here.
| Infrastructure Project Name | Department | |
Ambrose II | Community and Social Services | |
Arts Commons Transformation (Calgary Centre for the Performing Arts) Project | Culture and Tourism | |
Arts Habitat (Artists Quarters) Project | Culture and Tourism | |
Aspen View Public School Division No. 78 (2125): H.A. Kostash Modernization (Smoky Lake) | Education | |
Athabasca University – Information Technology Capital | Advanced Education | |
Bighorn and Eastern Slopes Management | Environment and Parks | |
Black Gold Regional Division No. 18 (2245): Ecole Corinthia Park School Modernization (Leduc) | Education | |
Calgary Chief Medical Examiner Office Expansion Study | Justice and Solicitor General | |
Calgary Homeless Foundation – Permanent Support Housing for Youth | Community and Social Services | |
Calgary – redevelopment of affordable housing | Seniors and Housing | |
Calgary Housing Company Southview | Seniors and Housing | |
Calgary Roman Catholic Separate School District No. 1 (4010): Cochrane Elementary School | Education | |
Calgary Roman Catholic Separate School District No. 1 (4010): St. Andrew Modernization | Education | |
Calgary Roman Catholic Separate School District No. 1 (4010): St. Bonaventure Modernization (Calgary) | Education | |
Calgary Roman Catholic Separate School District No. 1 (4010): St. Boniface Modernization (Calgary) | Education | |
Calgary School District No. 19: Auburn Bay Middle School (Calgary) – Construction | Education | |
Calgary School District No. 19: New Calgary High School (Conventry Hills – Calgary) – Construction | Education | |
Calgary School District No. 19: New Middle School – Evanston | Education | |
Canmore Nordic Centre High Performance Sport Upgrades | Environment and Parks | |
Chinook’s Edge School Division No. 73 (0053): Carstairs Elementary School | Education | |
Christ the Redeemer Catholic Separate School Regional Division No. 3: Holy Cross Collegiate | Education | |
Critical Environmental Monitoring and Science – CMR Portion | Environment and Parks | |
Crop Diversification Centre South New Applied Research Facilities | Agriculture and Forestry | |
Edmonton Catholic Separate School District No. 7 (0110): Austin O’Brien Senior High School Modernization (Edmonton) | Education | |
Edmonton Catholic Separate School District No. 7 (0110): Lewis Farms Completion Centre | Education | |
Edmonton Catholic Separate School District No. 7 (0110): St. Alphonsus Modernization (Edmonton) | Education | |
Edmonton Catholic Separate School District No. 7: Elementary/Junior High School In Windermere/Keswick (Edmonton) | Education | |
Edmonton School District No.7: Edmonton Keswick K–9 School Windermere | Education | |
Edmonton School District No.7: Edmonton Windermere 7–12 | Education | |
| Elk Island Public Schools Regional Division No. 14 (2195): Rudolph Henning Junior High Modernization (Fort Saskatchewan) | Education | |
Elk Island Public Schools Regional Division No. 14 (2195): Sherwood Heights Modernization (Sherwood Park) | Education | |
Equipment Renewal Program | Environment and Parks | |
Foothills Medical Centre Kitchen Redevelopment | Health | |
Foothills School Division No. 38 (1180): Blackie School Modernization | Education | |
Fort McMurray School District (3260): Ecole Dickensfield School Modernization (Fort McMurray) | Education | |
Fort Vermilion School Division No. 52 (1250): Fort Vermilion Public School Expansion | Education |
...continues next page
| FISCAL PLAN 2018 – 21 • CAPITAL PLAN | 65 |
Unfunded Capital Projects (as of March 22, 2018), continued
| Infrastructure Project Name | Department | |
Grande Yellowhead Public School Division No. 77 (1085): Evansview Elementary School Modernization (Evansburg) | Education | |
Grande Yellowhead Public School Division No. 77 (1085): Grand Trunk High School (Evansburg) | Education | |
Greater Edmonton Foundation’s Elmwood Terrace | Seniors and Housing | |
Greater St. Albert Roman Catholic Separate School District No. 734 (4077): Morinville Community High School Modernization | Education | |
Head-Smashed-In Buffalo Jump Interpretive Centre - Redevelopment | Culture and Tourism | |
Heritage Park Society - Natural Resources Project | Culture and Tourism | |
High Prairie School Division No. 48 (1220): E.W. Pratt Modernization (High Prairie) | Education | |
Highway 1, interchange upgrade at Hwy. 1 and 22 | Transportation | |
Highway 1, Medicine Hat intersection improvement at Hwy. 1 and 3 | Transportation | |
Highway 2, 65th Avenue interchange at Leduc | Transportation | |
Highway 2, Balzac interchange replacement | Transportation | |
Highway 2, Interchange at Cardiff Road, south of Morinville | Transportation | |
Highway 3, between Hwy. 2 to east of Hwy. 2 (realignment within Fort Macleod) | Transportation | |
Highway 3, Coleman bypass | Transportation | |
Highway 3, Rock Creek culvert on Hwy. 3, wildlife underpass | Transportation | |
Highway 22, bridge widening and Priddis intersection improvement, east of Fish Creek to west of Fish Creek (passing/climbing lane) | Transportation | |
Highway 26, between Camrose to Hwy. 834 (widening) | Transportation | |
Highway 28, construct roundabout at junction of Hwy. 28 and Hwy. 831, west of Waskatenau | Transportation | |
Highway 40, between south of Wapiti River to the City of Grande Prairie corporate limits (twinning) | Transportation | |
Highway 43, interchange at Hwy. 43X, Grande Prairie | Transportation | |
Highway 566, construct roundabout, range road 11, near Balzac | Transportation | |
Highway 567, high load staging area, 4 km west of Hwy. 22 (safety rest area) | Transportation | |
Highway 60, capital improvements, over CNR (new railway overpass) north of Hwy. 16A to south of Hwy. 16 (Acheson) | Transportation | |
Highway 628, between east of Hwy. 779 to Edmonton west corporate limit (grade, base, pave) | Transportation | |
Highway 817, between Hwy. 24 to Hwy. 901 (reconstruct/realignment) | Transportation | |
Highway 881, safety and Roadway Improvements at various locations, passing and climbing lanes, truck staging areas, improved rest areas, and intersection improvements at various locations | Transportation | |
Hinton Justice Centre – New Courthouse Facility | Justice and Solicitor General | |
Hinton Training Centre Renovation and Expansion | Agriculture and Forestry | |
Holy Spirit Roman Catholic Separate Regional Division No. 4: West Lethbridge Elementary School | Education | |
Horizon School Division No. 67 (1045): Erle Rivers High School Modernization (Milk River) | Education | |
Innovation Infrastructure Systems New Equipment | Economic Development & Trade | |
Inpatient Unit Fit-Outs, Chinook Regional Hospital, Lethbridge | Health | |
JSG Correctional Facilities Renew Various Locations Study – Part 2 | Justice and Solicitor General | |
Lakeland Roman Catholic Separate School District No. 150 (4105): Holy Family Catholic School Replacement (Waskatenau) | Education | |
Land for Future Edmonton Law Courts Expansion – Strategic Purchase | Justice and Solicitor General | |
Living Waters Catholic Regional Division No. 42 (0047): Whitecourt Elementary | Education | |
Livingstone Range School Division No. 68 (1135): J.T. Foster Modernization (Nanton) | Education |
...continues next page
| FISCAL PLAN 2018 – 21 • CAPITAL PLAN | 66 |
Unfunded Capital Projects (as of March 22, 2018), continued
| Infrastructure Project Name | Department | |
Medicine Hat School District No. 76. (3050): Connaught School Modernization (Medicine Hat) | Education | |
New Calgary Sheriffs Escort Base | Justice and Solicitor General | |
Northern Gateway Regional Division No. 10 (2275): Valleyview Solution – Replacement | Education | |
Northern Lakes College – Community Learning Centres Project Phase 1 | Advanced Education | |
Northern Lights School Division No. 69 (1245): Ecole Plamondon Modernization (Lakeland County) | Education | |
Northern Lights School Division No. 69 (1245): Vera M Welsh Elementary School Replacement (Lac La Biche) | Education | |
Northwest Francophone Education Region No. 1 (8050): École des Quatre-Vents Replacement Facility (Peace River) | Education | |
Palliser Regional Division No. 26 (2255): Barons School Modernization | Education | |
Parks Demand Driven Expansion Program | Environment and Parks | |
Peace River School Division No. 10 (1070): Manning School | Education | |
Peace Wapiti School Division No. 76: Heritage Heights or Flying Shot Lake K–8 School | Education | |
Peter Lougheed Centre, Emergency Department and Laboratory | Health | |
Portage College Cold Lake Expansion | Advanced Education | |
Prairie Rose School Division No. 8 (0195): Burdett School Modernization & Addition | Education | |
Provincial Archives of Alberta – Vault & Public Spaces Expansion | Culture and Tourism | |
Raven Brood Trout Station | Environment and Parks | |
Ray Gibbon Drive | Transportation | |
Rocky View School District (1190): Langdon Junior/Senior High School | Education | |
Rocky View School District: Chestermere K–9 School | Education | |
Sheriffs’ Prisoner Holding Cells / Facilities Upgrades – Various Locations – Study | Justice and Solicitor General | |
Southern Francophone Education Region: Airdrie K–6 Francophone School | Education | |
St. Albert Public School District No. 5565 (7020): High School Modernization / Addition (Phase 2: High School Accommodation Plan) | Education | |
St. Paul Education Regional Division No. 1 (2185): Ecole Mallaig Community School Modernization | Education | |
Trans Canada Trail – Alberta | Culture and Tourism | |
University of Alberta Heating Plant – Turbine Generator #3 | Advanced Education | |
University of Calgary – Haskayne School of Business Advanced Learning Centre | Advanced Education | |
University of Calgary Life and Environmental Sciences Resource Centre | Advanced Education | |
Updating 2009 Edmonton Law Courts Business Case | Justice and Solicitor General | |
Wild Rose School Division No. 66 (1325): Ecole Rocky Elementary School Project (Rocky Mountain House) | Education | |
Wild Rose School Division No. 66 (1325)H.W. Pickup Junior School (Drayton Valley) | Education | |
William Watson Lodge Rehabilitation | Environment and Parks | |
Wolf Creek School Division No. 72 (0054): Iron Ridge Elementary Campus Modernization (Blackfalds) | Education | |
Wolf Creek School Division No. 72 (0054): Rimbey Jr / Sr High School Modernization | Education | |
Yellowhead Youth Centre Redevelopment | Children’s Services |
| FISCAL PLAN 2018 – 21 • CAPITAL PLAN | 67 |
Fiscal Plan
Path to Balance
FISCAL PLAN 2018 – 21 • PATH TO BALANCE 68
| Table of Contents | ||||||
| PATH TO BALANCE | ||||||
Introduction | 70 | |||||
The Fiscal Challenge | 71 | |||||
Government’s Response to the Downturn | 73 | |||||
Things are Looking Up | 74 | |||||
Looking Forward: The Path to Balance | 76 | |||||
Path to Balance Fiscal Metrics | 83 | |||||
Energy and Economic Metrics | 84 | |||||
| FISCAL PLAN 2018 – 21 • PATH TO BALANCE | 69 |
Introduction
Three years ago, global oil prices collapsed and Alberta plunged into a deep recession. In early 2016, the price of oil fell to US$26 per barrel and in one year non-renewable resource revenue plummeted by nearly 70%, from $8.9 billion to $2.8 billion. A drop of $6.1 billion in one year.
In the face of a severe recession, the government had a choice. It refused to make a bad situation worse by making drastic cuts that would have put thousands more people out of work, damaged the economy further and hurt Alberta families.
Instead, the government put Albertans to work by investing in badly needed schools, hospitals and roads, cushioning the impact of the downturn. It supported the energy industry by securing approval for new pipelines. It helped to make life more affordable by capping electricity rates, freezing tuition, reducing school fees and introducing the Alberta Child Benefit. Government protected the services that matter to Albertans, making sure that our children had teachers in their classrooms and when our loved ones got sick they received the care they needed. Albertans expect no less.
At the same time, government took steps to reduce Alberta’s dependency on resource revenue and make the taxation system more fair, while still maintaining a significant tax advantage over other provinces. These decisions will provide the province with more stable revenue to support the services Albertans rely on.
Government has also worked prudently and carefully to contain costs and eliminate waste. Practical agreements were reached with the Alberta Teacher’s Association and United Nurses of Alberta that recognize the province’s fiscal situation. Government slashed salaries and eliminated perks and bonuses for some of the highest paid executives at Alberta’s agencies, boards and commissions, saving $16 million a year.
The government’s plan is working. Today, Alberta’s economy is looking up. Jobs are up. Exports are up. Manufacturing is up. The province led the country in economic growth in 2017 and is expected to be near the top again in 2018. While the economy is recovering, not all Albertans are feeling it and there is more work ahead. Budget 2018 is focused on building a recovery to last for all Albertans.
The government is committed to return the budget to balance. While the need to absorb the economic shock has diminished, the government will continue to diversify the economy and create jobs while protecting the services Albertans rely on. This chapter outlines the government’s plan to balance the budget by 2023-24.
Government supported the economy and Alberta families during the downturn.
Government is finding ways to contain costs and eliminate waste.
| FISCAL PLAN 2018 – 21 • PATH TO BALANCE | 70 |
Resource revenues hit a record high of $14.3 billion in 2005-06. Ten years later, these revenues totalled only $2.8 billion.
The Fiscal Challenge
OVERDEPENDENCE ON RESOURCE REVENUE
Alberta has long depended on resource revenues. This reliance increased over time, making the province vulnerable to a drop in energy prices, as experienced in 2015 (Chart 1).
Earlier this decade, when oil prices were high and the economy was growing, the budget remained unbalanced and savings were not put aside for the future. Between 2010-11 and 2014-15, for example, oil prices averaged US$90/bbl, while the economy grew more than 5% per year – more than double the national average. Royalty revenues averaged $9.3 billion per year, more than 20% of total revenue. Yet, over this period, the government ran deficits in all but one fiscal year.
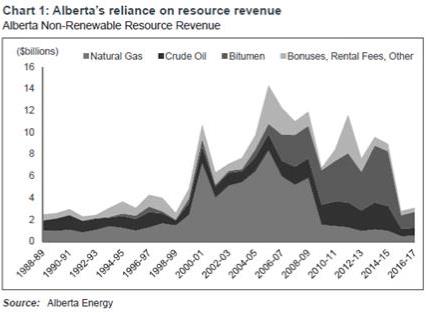
A reliance on resource revenue makes Alberta’s revenues far more volatile than in any other large province. At the same time, Alberta’s population and demand for services continue to increase. Rather than providing stability, the government used to have volatile year-to-year spending that accentuated the impact of the revenue roller coaster. In contrast, this government, in the last two years, has provided stability of funding for core public services, including health care, education and social services (Chart 2).
THE OIL PRICE SHOCK WILL HAVE LONG LASTING EFFECTS
While the economy is now on firmer footing, the fiscal impact of the 2015 oil price collapse will linger for some time. Oil prices are widely expected to be “lower for longer” due to ample and lower-cost global supplies of crude (Chart 3).
| FISCAL PLAN 2018 – 21 • PATH TO BALANCE | 71 |
The largest impact is on resource revenues. In 2018-19, they will be around 40% of 2014-15 levels. Even as oil prices improve and oil production continues to increase, the share of resource revenue in total revenue will remain well below historical norms.
More broadly, the oil shock has hit Alberta businesses and families hard. While earnings remained highest among the provinces, they declined during the recession, hurting tax and other government revenue. Nominal GDP, the broadest measure of income, fell $62 billion (or 16%) between 2014 and 2016, and is not expected to return to 2014 levels until 2020.
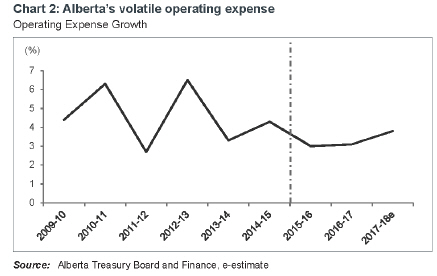
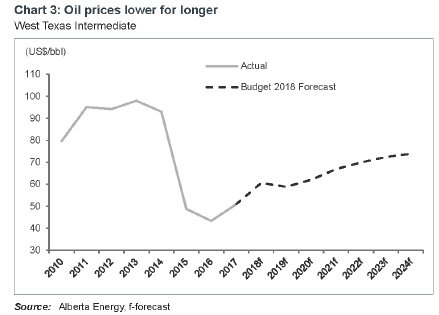
Operating expense growth has stabilized and moderated since 2015-16.
Oil prices are expected to stay well below 2010-2014 levels.
| FISCAL PLAN 2018 – 21 • PATH TO BALANCE | 72 |
Government’s Response to the Downturn
Faced with a deep recession and a massive shortfall in revenues, this government chose to help Albertans weather the storm by supporting public services and creating jobs.
A critical step was avoiding the province’s history of volatile swings in spending from one year to the next. In 2015-16 and 2016-17, operating expense (excluding CLP initiatives) posted stable and moderate growth of 3.0% and 3.1%, well below the 4.6% average increase in the previous six years.
In addition to providing stable funding for core public services, government carefully and prudently found savings. It focused on the two largest areas of spending: public sector compensation, which makes up over half of government’s operating expense; and health, government’s largest program area. Practical agreements were negotiated with public sector unions like the Alberta Teachers’ Association and United Nurses of Alberta that restrained salary growth. Spending growth in Health was contained at 3.3% per year between 2015-16 and 2017-18, down from an average of 6.0% annually over the previous six years.
The government also chose to stimulate the economy during the downturn through a nation-leading capital plan, delivering on recommendations from former Bank of Canada governor David Dodge. The government took advantage of record low interest rates, a strong balance sheet and lower cost pressures to make long-term investments and put Albertans back to work building badly needed schools, hospitals and roads.
The plan worked. Increased government spending on capital provided more economic stimulus than in any previous recession, boosting real GDP growth by over 0.3 percentage points in both 2015 and 2016 (Chart 4) and supporting about 10,000 new jobs by 2016. The investment was well timed, with construction near its peak in 2016 when the economy was at its lowest point (Chart 5).
Government continues to work to build a recovery that lasts for working people.
| FISCAL PLAN 2018 – 21 • PATH TO BALANCE | 73 |
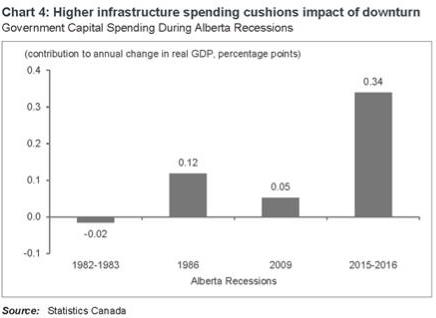
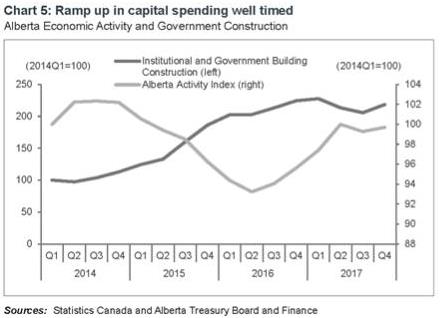
Things are Looking Up
After the worst recession in decades, the province has turned the corner.
Jobs are coming back – 38,000 in the last three months of 2017 alone. Most of the new jobs during the recovery have been in full-time, private sector positions. The oil and gas industry is recovering – rig activity jumped 66% in 2017.
And the recovery is spreading to other sectors: retail sales rose by 7.5% last year, manufacturing shipments by 14% and international exports by 27%. All told, Alberta led all provinces in economic growth at 4.5% in 2017, and is once again expected to be near the top in 2018
Increased government spending on capital added more to Alberta’s real GDP in 2015 and 2016 than during any other Alberta recession.
Government construction increased sharply in late 2015 and early 2016, coinciding with the low point of Alberta’s downturn.
| FISCAL PLAN 2018 – 21 • PATH TO BALANCE | 74 |
Alberta’s nominal GDP per capita, a broad measure of income, continues to exceed all other provinces even after the oil price crash.
The recovery speaks to Alberta’s resiliency. Even at US$51/bbl (WTI ) oil – nearly half of 2014 levels – Alberta outperformed all provinces on a number of key economic metrics in 2017, including:
| ∎ | Highest average weekly earnings – 17% above the national average. |
| ∎ | Highest estimated GDP per capita – 34% above the national average (Chart 6). |
| ∎ | Highest employment rate (i.e. the share of Albertans 15+ with a job) – 67% compared to 62% nationally. |
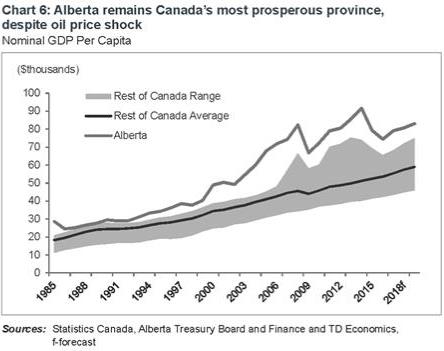
| FISCAL PLAN 2018 – 21 • PATH TO BALANCE | 75 |
Looking Forward: The Path to Balance
During the downturn, the government’s priority was helping Albertans weather the storm. With the worst behind us, the government is focused on returning Alberta’s budget to balance by 2023-24 (Chart 7).
Alberta’s economic recovery will increase revenue. A stronger labour market will lift wages and employment, driving up personal income tax revenue. Higher oil prices and production will support corporate tax revenue. Other revenues, like fuel taxes and the tourism levy, will also expand as activity picks up and the population grows.

Budget 2018 measures will bring the budget to balance by 2023-24.
| FISCAL PLAN 2018 – 21 • PATH TO BALANCE | 76 |
As a share of total revenues, resource revenues will remain well below historical norms.
The federally-imposed carbon price will increase carbon revenue based on federal approval of the Trans Mountain Expansion (TMX) and the federal government’s commitment to its construction.
Resource revenues, while improving over the forecast, are expected to contribute less to government revenue than in the past. By 2023-24, resource revenues are projected to rise to 16% of total revenues, well below the 23% average share over the last 20 years and the high of 37% in 2005-06 (Chart 8).
The Path to Balance is based on realistic revenue projections. The price of oil, an important driver of resource revenues, is based on the average of private sector analysts with a strong understanding of oil market fundamentals.
These forecasters indicate that oil prices will remain near US$60/bbl over the next three years, rising to US$73/bbl by 2023-24 as higher cost supplies will be required to meet global demand. The forecast for nominal GDP, the broadest measure of income and a key driver of government revenue, is also closely in line with the private sector average (Chart 9).
While revenues will improve, they are not projected to return to 2013-14 and 2014-15 levels until 2019-20 due to the lingering impacts of the recession and low oil prices (see Economic Outlook and Revenue chapters).
Despite a recovering economy, the budget will not balance itself. That is why the government has developed a balanced, long-term plan. This plan will continue to protect the services Albertans rely on, create jobs and diversify the economy. Through actions taken in Budget 2018, smaller deficits are projected year after year until the budget is balanced in 2023-24.
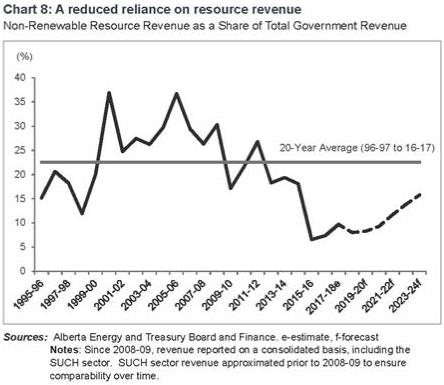
| FISCAL PLAN 2018 – 21 • PATH TO BALANCE | 77 |
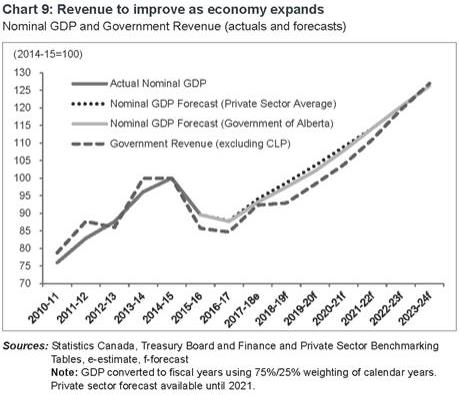
The Path to Balance Plan is based on three pillars: 1) A strong and more diversified economy; 2) Stable funding and cost containment; and 3) A lower reliance on volatile resource revenue.
1) A STRONG AND DIVERSIFIED ECONOMY
The Path to Balance will be underpinned by a growing and more diversified economy that is built to last. In addition to making significant investments in infrastructure during the downturn, the government has taken a number of steps to promote growth and diversification and create jobs, including:
| ∎ | Securing approval of two critical energy infrastructure projects – Line 3 replacement and TMX. These pipelines will provide critical market access as oil sands production continues to rise, supporting investment and jobs (see Economic Outlook chapter). The addition of Line 3/TMX could lift Alberta’s GDP by about 1.5–2% by 2023 relative to a scenario without new pipelines. |
| ∎ | Diversifying Alberta’s energy sector, and encouraging value-added production. Budget 2018 includes significant new investments in the Petroleum Diversification Program (PDP), petrochemical feedstock infrastructure, and partial upgrading. These initiatives will support up to $13 billion in industry investment, adding 0.6% to real GDP by 2021. |
| ∎ | Creating 3,000 new post-secondary technology spaces and new scholarship programs to support technology and other emerging sectors. |
A growing economy will lift government revenues. The government’s forecast for nominal GDP, a long-term driver of government revenue, is closely aligned with the private sector.
| FISCAL PLAN 2018 – 21 • PATH TO BALANCE | 78 |
Operating expense will increase slower than population growth and inflation, supporting the Path to Balance.
| ∎ | Introducing three tax incentives – the Alberta Investor Tax Credit, the Capital Investment Tax Credit and the Interactive Digital Media Tax Credit – to improve access to capital, promote innovation and encourage job creation. |
| ∎ | Modernizing Alberta’s energy royalty framework. The framework is fair and competitive, and provides long-term certainty to the oil and gas industry. |
| ∎ | Introducing supports for small brewers, doubling the number of brewpubs and brewers across the province. |
2) STABLE SPENDING AND COST CONTAINMENT
The government will avoid the previous government’s history of volatile swings in spending from one year to the next. Instead, this government will target keeping operating expense below population growth plus inflation (Chart 10). Operating expense is expected to rise 3.1% per year, on average, from 2018-19 to 2023-24, well below historical growth. To maintain lower operating expense growth, government is containing costs through a focus on its two largest areas of spending – public sector compensation and health – while finding efficiencies across government.
Compensation
Government is approaching collective bargaining recognizing the unprecedented fiscal challenges. The importance of practical agreements was evident in the agreements with the Alberta Teachers’ Association and United Nurses of Alberta. As negotiations in other sectors advance, government will take the same approach, providing job security in exchange for no increases. Government also continues to freeze the salaries of non-union staff across the public sector and a hiring restraint is in place across the public service to keep the size of the Alberta Public Service flat.
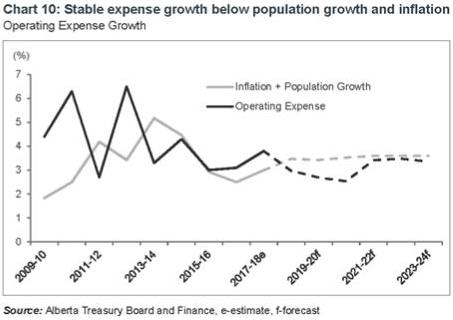
| FISCAL PLAN 2018 – 21 • PATH TO BALANCE | 79 |
Health
The government has made significant progress controlling health costs through targeted strategies. A new funding framework has been signed with the Alberta Pharmacists’ Association that will save $150 million over the next two years and slow spending growth in government-sponsored drug programs. Alberta has also saved more than $100 million over the last three years by reducing generic drug prices. Alberta Health Services’ Operational Best Practices initiative has delivered ongoing efficiencies in health delivery.
Finding Efficiencies
Continuous improvement is focused on ongoing efforts to achieve the greatest efficiencies and effectiveness across government. Corporate services such as communications, information technologies, finance and human resources are being consolidated and modernized so they are more effective and deliver high levels of service that ultimately support Albertans. Opportunities to contract-in services will also be considered where efficiencies can be achieved.
The review of agencies, boards and commissions (ABCs) has led to the elimination or consolidation of 66 ABCs, and salaries have been cut and bonuses eliminated for the highest paid executives of Alberta’s ABCs.
Discretionary spending is being tightly controlled across government with restrictions on travel, conferences, advertising, publications and hospitality.
Capital
The government chose to put Albertans to work and stimulate the economy during the downturn, delivering on the recommendations from former Bank of Canada Governor David Dodge.
Dodge indicated that as the economy recovers, the government should normalize spending and be prepared to curtail spending further if oil prices remained low. Consistent with his recommendations, government is reducing the capital plan to a more normal investment level starting in 2018-19, with reductions in both capital grants and investment.
Alberta currently provides more grants to municipalities than any other province on a per capita basis – about 60% more than the national average.1
Capital grants were enhanced in 2007 with the introduction of the Municipal Sustainability Initiative (MSI), a $11.3 billion commitment to municipalities. This commitment was made during a period of elevated oil and gas prices; resource revenue totalled $12.3 billion in 2006-07 and the province had just recorded 13 consecutive budget surpluses.
As government addresses its fiscal challenges, and as the end of MSI approaches, funding arrangements with municipalities will be reviewed. Pending a new program, targeted funding under the MSI has been reduced by $152 million each year. The reduction will have the MSI program continuing to end in 2021-22. The government is committed to working with municipalities,
| 1. | Based on 2016-17 Survey of Provincial Grants to Municipalities, Provincial -Territorial Officials Committee (PTOC) on Local Government. |
| FISCAL PLAN 2018 – 21 • PATH TO BALANCE | 80 |
over the coming months, to replace the MSI with a new infrastructure grant program, with a funding formula based on revenue sharing. Annual funding for a number of application-based municipal grant programs is also reduced. This reduction extends programs like the Alberta Community Transit Fund, Strategic Transportation Infrastructure Program, Municipal and Regional Water and Wastewater programs over the five-year Capital Plan.
To provide municipalities with increased flexibility in planning capital projects and adjusting to the new fiscal arrangements, government reprofiled $800 million in MSI funds to municipalities in 2017-18.
Government will continue to deliver on its commitments for capital investment to build schools, hospitals, highways and other public infrastructure.
3) REDUCING ALBERTA’S RELIANCE ON RESOURCE REVENUE
The government is committed to a tax system that is fair and encourages economic growth, while providing the revenue needed to fund public services.
Alberta continues to have a significant tax advantage. Albertans and Alberta businesses pay at least $11.2 billion less in taxes than they would if they faced the same tax system of any other province. For example, a one-income couple earning $75,000 and raising two children pays at least $1,680 less taxes in Alberta than in any other province.
At the same time, the government recognizes that the province must reduce its reliance on resource revenue. It has taken a balanced approach, introducing measures that raise revenue but still maintain Alberta’s overall tax advantage and keep life affordable for Albertans. Measures introduced include:
| ∎ | A more progressive, multiple-rate personal income tax structure was introduced in October 2015. The government protected 93% of taxfilers by only raising taxes on the top 7% of income earners. Even with the increase, Albertans will continue to pay the lowest overall taxes among provinces. This measure is anticipated to raise $750-800 million in 2018-19 alone, with the amount increasing over time as the economy improves. |
| ∎ | The general corporate income tax rate, which applies to larger corporations earning income, was raised two percentage points to 12% in July 2015, tied for third lowest among the provinces in 2018. Alberta’s corporate tax system remains among the most competitive in Canada, with no payroll or retail sales tax. This measure is anticipated to raise $350-400 million in 2018-19 alone. |
| ∎ | Other revenue measures, introduced in Budget 2015, raise more than $100 million annually. This includes a $5/carton increase in tobacco taxes, a 5% increase in standard liquor mark-ups and a 4 ¢/litre increase in locomotive fuel taxes to match the same increase introduced on gasoline and diesel in March 2015. |
As Alberta’s economy relies less on government stimulus, additional carbon revenue will help contribute to an improving bottom line. Beginning in 2021, additional revenue resulting from the federally-imposed carbon price tied to the construction of the Trans Mountain Pipeline will be used to support vital public services as the province stays on track to balance the budget by 2023-24.
| FISCAL PLAN 2018 – 21 • PATH TO BALANCE | 81 |
The federally-imposed carbon price will increase to $40/tonne in 2021 and $50/tonne in 2022, compared to Alberta’s price of $30/tonne.
STABILIZATION AND DECLINE IN DEBT BURDEN
The Path to Balance is expected to lead to a stabilization and decline in the province’s debt burden. Alberta will continue to have a strong balance sheet with the net debt-to-GDP ratio, a widely used measure of the debt burden, projected to peak at 13.1% in 2021-22, before declining to 12.3% in 2023-24 (Chart 11). This is below the current net debt-to-GDP ratio of any province in Canada today, and well below the 38% ratio in Ontario and 46% in Quebec for 2016-17.
Overall, the government’s Path to Balance plan – based on economic growth and diversification, stable spending and cost containment, and reduced reliance on resource revenue – is a balanced approach to Alberta’s fiscal challenge.
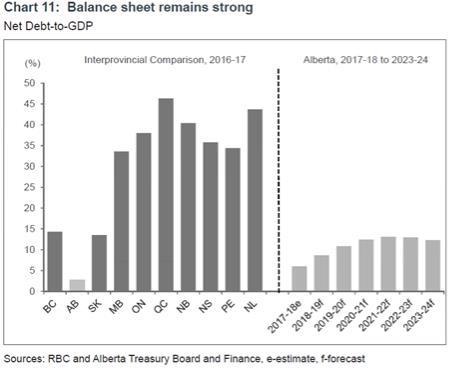
Alberta’s net debt-to-GDP ratio is expected to peak at 13.1%, which is below all provinces’ ratios in 2016-17.
| FISCAL PLAN 2018 – 21 • PATH TO BALANCE | 82 |
Path to Balance Fiscal Metrics
| $ Billions | 2014-15 Actuals | 2015-16 Actuals | 2016-17 Actuals | 2017-18 Forecast |
2018-19 Estimate | 2019-20 Targets | 2020-21 Targets | 2021-22 Projection | 2022-23 Projection | 2023-24 Projection | ||||||||||||||||||||||||||||||
Revenue | 49.5 | 42.6 | 42.3 | 46.9 | 47.9 | 50.6 | 53.8 | 57.8 | 62.3 | 66.3 | ||||||||||||||||||||||||||||||
Tax Revenue | 21.4 | 20.7 | 20.2 | 21.2 | 22.9 | 24.5 | 26.0 | 28.0 | 30.2 | 31.7 | ||||||||||||||||||||||||||||||
Non-Renewable | 8.9 | 2.8 | 3.1 | 4.5 | 3.8 | 4.2 | 5.0 | 6.8 | 8.6 | 10.4 | ||||||||||||||||||||||||||||||
Resource Revenue | ||||||||||||||||||||||||||||||||||||||||
Other Revenue | 19.1 | 19.1 | 19.0 | 21.1 | 21.2 | 21.9 | 22.8 | 23.0 | 23.5 | 24.2 | ||||||||||||||||||||||||||||||
Operating Expense | 42.0 | 43.3 | 44.7 | 46.4 | 47.8 | 49.1 | 50.3 | 52.0 | 53.8 | 55.6 | ||||||||||||||||||||||||||||||
% change | 4.3 | 3.0 | 3.1 | 3.8 | 3.0 | 2.7 | 2.5 | 3.4 | 3.5 | 3.4 | ||||||||||||||||||||||||||||||
CPI inflation + | 4.4 | 2.9 | 2.4 | 3.0 | 3.5 | 3.4 | 3.5 | 3.6 | 3.6 | 3.6 | ||||||||||||||||||||||||||||||
population growth (%) | ||||||||||||||||||||||||||||||||||||||||
Total Expense | 48.4 | 49.1 | 53.1 | 55.9 | 56.2 | 57.8 | 59.8 | 62.2 | 63.7 | 65.5 | ||||||||||||||||||||||||||||||
Surplus (Deficit) | 1.1 | (6.4) | (10.8) | (9.1) | (8.8) | (7.9) | (7.0) | (4.3) | (1.4) | 0.7 | ||||||||||||||||||||||||||||||
Capital Plan | 6.2 | 6.6 | 6.6 | 9.2 | 6.4 | 5.9 | 6.0 | 6.4 | 5.2 | 4.8 | ||||||||||||||||||||||||||||||
Net Financial Debt | (13.1) | (3.9) | 8.9 | 20.3 | 30.5 | 39.8 | 48.2 | 53.9 | 56.2 | 56.0 | ||||||||||||||||||||||||||||||
% GDP
|
| (3.5)
|
|
| (1.2)
|
|
| 2.8
|
|
| 6.0
|
|
| 8.7
|
|
| 10.8
|
|
| 12.4
|
|
| 13.1
|
|
| 12.9
|
|
| 12.3
|
| ||||||||||
Note: Surplus (deficit) includes risk adjustment of $0.5 billion in 2018-19, $0.7 billion in 2019-20 and $1.0 billion in 2020-21.
| FISCAL PLAN 2018 – 21 • PATH TO BALANCE | 83 |
Energy and Economic Metrics
| 2014-15 | 2015-16 | 2016-17 | 2017-18 | 2018-19 | 2019-20 | 2020-21 | 2021-22 | 2022-23 | 2023-24 | |||||||||||||||||||||||||||||
| Fiscal Year | Actuals | Actuals | Actuals | Estimates | Forecast | Forecast | Forecast | Projection | Projection | Projection | ||||||||||||||||||||||||||||
Crude Oil Pricesa |
| |||||||||||||||||||||||||||||||||||||
WTI (US$/bbl) | 80.48 | 45.00 | 47.93 | 54.00 | 59.00 | 60.00 | 63.00 | 68.00 | 70.00 | 73.00 | ||||||||||||||||||||||||||||
Light-Heavy Differential | 17.30 | 13.40 | 13.93 | 14.50 | 22.40 | 21.00 | 22.30 | 20.00 | 19.00 | 18.40 | ||||||||||||||||||||||||||||
(US$/bbl) | ||||||||||||||||||||||||||||||||||||||
a Forecasts have been rounded | ||||||||||||||||||||||||||||||||||||||
| 2014 | 2015 | 2016 | 2017 | 2018 | 2019 | 2020 | 2021 | 2022 | 2023 | 2024 | ||||||||||||||||||||||||||||||||
| Calendar Year | Actuals | Actuals | Actuals | Estimates | Forecast | Forecast | Forecast | Forecast | Projection | Projection | Projection | |||||||||||||||||||||||||||||||
Gross Domestic Product | ||||||||||||||||||||||||||||||||||||||||||
Nominal (billions of dollars) | 376.6 | 331.3 | 314.9 | 336.3 | 352.2 | 367.5 | 388.0 | 411.2 | 433.8 | 455.7 | 476.9 | |||||||||||||||||||||||||||||||
% change | 10.0 | -12.0 | -4.9 | 6.8 | 4.7 | 4.3 | 5.6 | 6.0 | 5.5 | 5.0 | 4.6 | |||||||||||||||||||||||||||||||
Real (billions of 2007 dollars) | 326.3 | 314.3 | 302.8 | 316.5 | 325.0 | 333.1 | 341.3 | 350.0 | 359.5 | 368.1 | 377.5 | |||||||||||||||||||||||||||||||
% change | 6.2 | -3.7 | -3.7 | 4.5 | 2.7 | 2.5 | 2.4 | 2.6 | 2.7 | 2.4 | 2.6 | |||||||||||||||||||||||||||||||
Other Indicators | ||||||||||||||||||||||||||||||||||||||||||
Employment (thousands) | 2,275 | 2,301 | 2,264 | 2,287 | b | 2,333 | 2,372 | 2,414 | 2,453 | 2,493 | 2,530 | 2,565 | ||||||||||||||||||||||||||||||
% change | 2.2 | 1.2 | -1.6 | 1.0 | b | 2.0 | 1.7 | 1.8 | 1.6 | 1.6 | 1.5 | 1.4 | ||||||||||||||||||||||||||||||
Unemployment Rate (%) | 4.7 | 6.0 | 8.1 | 7.8 | b | 6.8 | 6.2 | 5.7 | 5.3 | 5.1 | 5.0 | 4.9 | ||||||||||||||||||||||||||||||
Consumer Price Index | 2.6 | 1.1 | 1.1 | 1.6 | b | 2.1 | 1.9 | 2.0 | 2.0 | 2.0 | 2.0 | 2.0 | ||||||||||||||||||||||||||||||
(% change) | ||||||||||||||||||||||||||||||||||||||||||
Population | 2.8 | 1.7 | 1.4 | 1.2 | b | 1.4 | 1.5 | 1.5 | 1.6 | 1.6 | 1.6 | 1.6 | ||||||||||||||||||||||||||||||
(% change)
| ||||||||||||||||||||||||||||||||||||||||||
b Actual
| FISCAL PLAN 2018 – 21 • PATH TO BALANCE | 84 |
Fiscal Plan
Economic Outlook
∎ Annex
| FISCAL PLAN 2018 – 21 • ECONOMIC OUTLOOK | 85 |
Table of Contents
ECONOMIC OUTLOOK
Key Energy and Economic Assumptions | 88 | |||||
Economy Enters Second Year of Recovery | 89 | |||||
Chart 1: Economy moves from recovery to expansion | 89 | |||||
Global Economy | 90 | |||||
Chart 2: Broad rebound in industrial production | 90 | |||||
Chart 3: Labour markets tightening in advanced economies | 91 | |||||
Chart 4: Monetary policy tightening in advanced economies | 92 | |||||
Chart 5: US to account for majority of global oil supply growth | 93 | |||||
Chart 6: Muted outlook for oil prices | 94 | |||||
Canadian Economy | 94 | |||||
Chart 7: Energy sector lifts Canadian growth in 2017 | 95 | |||||
Alberta Economy | 96 | |||||
Chart 8: Exports continue to drive recovery | 96 | |||||
Chart 9: Strong growth in oil production | 97 | |||||
Chart 10: Agriculture shipments on the rise | 98 | |||||
Chart 11: Differential widens due to pipeline bottlenecks | 99 | |||||
Box 1: Importance of market access | 100 | |||||
Chart 12: Pipeline access needed for oil sands production | 100 | |||||
Chart 13: Conventional investment overtakes oil sands | 101 | |||||
Chart 14: Manufacturing investment to surge | 102 | |||||
Chart 15: Incomes are starting to improve | 104 | |||||
Chart 16: Unemployment rate easing | 105 | |||||
Chart 17: Natural increase and immigration drive population | 106 | |||||
Chart 18: Expanding population sustains demand for housing | 107 | |||||
Risks to the Economic Outlook | 107 | |||||
| FISCAL PLAN 2018 – 21 • ECONOMIC OUTLOOK | 86 |
Table of Contents, continued
ANNEX
Oil Price Benchmark | 109 | |||||
How Oil Price Forecasters Fared in Budget 2017 | 109 | |||||
Natural Gas Price Benchmark | 110 | |||||
How Natural Gas Price Forecasters Fared in Budget 2017 | 110 | |||||
Light-Heavy Oil Price Differential Benchmark | 111 | |||||
Canadian Long-Term Interest Rate Benchmark | 111 | |||||
United States / Canada Exchange Rate Benchmark | 112 | |||||
Alberta Real Gross Domestic Product Benchmark | 112 | |||||
Alberta Nominal Gross Domestic Product Benchmark | 113 | |||||
Alberta Primary Household Income Benchmark | 113 | |||||
Alberta Net Corporate Operating Surplus Benchmark | 113 | |||||
Alberta Employment Benchmark | 114 | |||||
Alberta Unemployment Rate Benchmark | 114 | |||||
Alberta Housing | 115 | |||||
| FISCAL PLAN 2018 – 21 • ECONOMIC OUTLOOK | 87 |
Key Energy and Economic Assumptions
| Fiscal Year Assumptions | 2016-17
Actuals | 2017-18
Estimates | 2018-19 | 2019-20 | 2020-21 | |||||||||||||||
Crude Oil Pricesa | ||||||||||||||||||||
WTI (US$/bbl) | 47.93 | 54.00 | 59.00 | 60.00 | 63.00 | |||||||||||||||
Light-Heavy Differential (US$/bbl) | 13.93 | 14.50 | 22.40 | 21.00 | 22.30 | |||||||||||||||
WCS @ Hardisty (Cdn$/bbl) | 44.67 | 50.40 | 46.00 | 48.80 | 50.90 | |||||||||||||||
Natural Gas Pricea | ||||||||||||||||||||
Alberta Reference Price (Cdn$/GJ) | 2.01 | 1.90 | 2.00 | 2.20 | 2.40 | |||||||||||||||
Production | ||||||||||||||||||||
Conventional Crude Oil (000s barrels/day) | 431 | 449 | 461 | 468 | 466 | |||||||||||||||
Raw Bitumen (000s barrels/day) | 2,549 | 2,855 | 3,163 | 3,302 | 3,462 | |||||||||||||||
Natural Gas (billions of cubic feet) | 4,186 | 4,367 | 4,502 | 4,556 | 4,525 | |||||||||||||||
Interest rates | ||||||||||||||||||||
3-month Canada Treasury Bills (%) | 0.51 | 0.90 | 1.60 | 2.20 | 2.50 | |||||||||||||||
10-year Canada Bonds (%) | 1.39 | 1.90 | 2.50 | 2.90 | 3.10 | |||||||||||||||
Exchange Rate (US¢/Cdn$)a | 76.2 | 78.0 | 80.0 | 80.0 | 80.0 | |||||||||||||||
| Calendar Year Assumptions | 2016 Actuals | 2017 Estimates | 2018 | 2019 | 2020 | 2021 | ||||||||||||||||||
Gross Domestic Product | ||||||||||||||||||||||||
Nominal (billions of dollars) | 314.9 | 336.3 | 352.2 | 367.5 | 388.0 | 411.2 | ||||||||||||||||||
% change | -4.9 | 6.8 | 4.7 | 4.3 | 5.6 | 6.0 | ||||||||||||||||||
Real (billions of 2007 dollars) | 302.8 | 316.5 | 325.0 | 333.1 | 341.3 | 350.0 | ||||||||||||||||||
% change | -3.7 | 4.5 | 2.7 | 2.5 | 2.4 | 2.6 | ||||||||||||||||||
Other Indicators | ||||||||||||||||||||||||
Employment (thousands) | 2,264 | 2,287 | b | 2,333 | 2,372 | 2,414 | 2,453 | |||||||||||||||||
% change | -1.6 | 1.0 | b | 2.0 | 1.7 | 1.8 | 1.6 | |||||||||||||||||
Unemployment Rate (%) | 8.1 | 7.8 | b | 6.8 | 6.2 | 5.7 | 5.3 | |||||||||||||||||
Average Weekly Earnings (% change) | -2.4 | 1.0 | b | 2.4 | 2.9 | 3.1 | 3.2 | |||||||||||||||||
Primary Household Income (% change) | -7.4 | 4.4 | 4.5 | 4.7 | 4.8 | 4.9 | ||||||||||||||||||
Net Corporate Operating Surplus (% change) | -46.3 | 90.6 | 19.1 | 9.8 | 19.5 | 20.2 | ||||||||||||||||||
Housing Starts (thousands of units) | 24.5 | 29.5 | b | 30.2 | 32.0 | 33.3 | 35.2 | |||||||||||||||||
Alberta Consumer Price Index (% change) | 1.1 | 1.6 | b | 2.1 | 1.9 | 2.0 | 2.0 | |||||||||||||||||
Retail Sales (% change) | -1.2 | 7.5 | b | 5.2 | 4.9 | 4.7 | 4.9 | |||||||||||||||||
Population (thousands) | 4,236 | 4,286 | b | 4,348 | 4,413 | 4,481 | 4,553 | |||||||||||||||||
% change | 1.4 | 1.2 | b | 1.4 | 1.5 | 1.5 | 1.6 | |||||||||||||||||
Net Migration (thousands) | 27.0 | 18.1 | b | 31.4 | 34.6 | 37.6 | 42.6 | |||||||||||||||||
| a | Forecasts have been rounded b Actual |
Fiscal Sensitivities to Key Assumptions, 2018–19c
(millions of dollars)
| Change | Net Impact (2018-19) | C | Sensitivities are based on current assumptions of prices and rates and show the effect for a full 12 month period. Sensitivities can vary significantly at different price and rate levels. The energy price sensitivities do not include the potential impact of price changes on the revenue from land lease sales. | |||||||
Oil Price (WTI US$/bbl) | -$1.00 | -265 | ||||||||
Light/Heavy Oil Price Differential | +$1.00 | -210 | ||||||||
Natural Gas Price (Cdn$/GJ) | -10 Cents | +10d | ||||||||
Exchange Rate (US¢/Cdn$) | + 1 Cent | -198 | ||||||||
Interest Rates | +1% | -226 | ||||||||
Primary Household Income | -1% | -150 | ||||||||
| d | Lower natural gas prices increase net royalty revenues due to the positive impact on bitumen royalties (due to lower costs) which more than offsets the decline in natural gas and by-product royalties. |
| FISCAL PLAN 2018 – 21 • ECONOMIC OUTLOOK | 88 |
Economic Outlook 2018–21
Economy Enters Second Year of Recovery
The rebound in Alberta’s economy surpassed expectations in 2017. Real GDP grew an estimated 4.5% following a deep two-year recession. The resurgence was broad-based, with nearly every sector expanding. Exports increased by almost 30% on rising oil production and an expanded manufacturing base. Housing starts grew by 20%, while retail trade expanded 7.5%. The labour market strengthened throughout the year and recovered all the jobs lost during the recession by December.
Building off the surge in activity in 2017, the economy is forecast to expand at a solid rate of 2.7% in 2018. Exports will continue to drive growth amid a solid expansion in the global economy, as oil sands output ramps up and production begins at the Sturgeon Refinery. The substantial improvement in the labour market at the end of 2017 is expected to carry through into the new year and boost housing and consumer spending. However, the recovery in business investment will lag the broader economic recovery due to the lingering impacts of the oil price shock.
As the economy moves from recovery into expansion (Chart 1), growth will be driven less by exports and more by investment. Non-residential investment will start to pick up in 2019. Until pipelines are built, market access challenges are likely to restrain upstream oil and gas investment. However, downstream investment in petrochemical facilities and partial upgraders will help to support real GDP growth of around 2.5% from 2019 to 2021. Households, too, will contribute to the expansion, with spending supported by rising incomes and solid population growth of about 1.5% per year. |
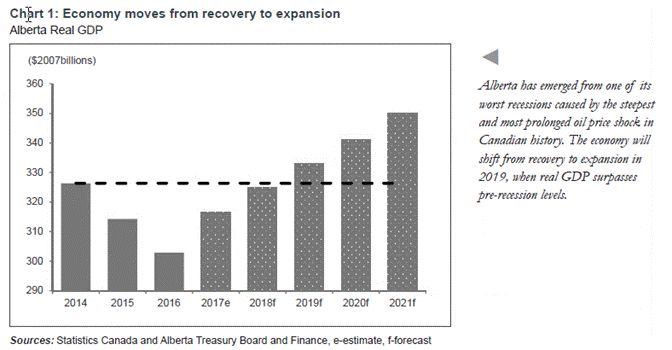
| FISCAL PLAN 2018 – 21 • ECONOMIC OUTLOOK | 89 |
Global Economy
Alberta’s trade- and energy-driven economy will continue to be shaped by global factors in 2018. The global economy exceeded expectations in 2017 as it rose at its fastest pace since 2011. A concerted rebound in global trade, business investment and industrial production paved the way for a synchronized expansion across countries for the first time following the 2009 global financial crisis. Global growth is forecast to accelerate to 3.7% in 2018 and 2019 from an estimated 3.6% in 2017. A sustained global expansion will support prices and improve prospects for the Alberta economy, given the province’s high reliance on trade and commodities.
SYNCHRONIZED GLOBAL GROWTH TO CONTINUE
Growth prospects for advanced and emerging economies have improved markedly over the past year. While activity accelerated significantly in most advanced economies, the upturn was pronounced in the Euro Area. Real GDP grew by an estimated 2.5% in 2017, the best growth performance in over a decade. Growth in the region is forecast to proceed at a healthy clip of around 2% in 2018 and 2019. In the US, a broad-based upswing in business investment, led by the energy sector, contributed to further strengthening in the labour market. Real GDP growth is forecast to accelerate to around 2.5% in 2018 and 2019 before slowing to around 2% thereafter.
Growth in emerging markets is also projected to strengthen in the near term. Firmer commodity prices are fuelling the recovery in resource-exporting countries such as Brazil and Russia, which in turn is boosting global growth. India’s economy is forecast to pick up as it recovers from the transitory impact of last year’s monetary reforms. Although growth in China’s economy is anticipated to slow from an estimated 6.8% in 2017 to 6.2% by 2021, it has been revised up from previous forecasts. |
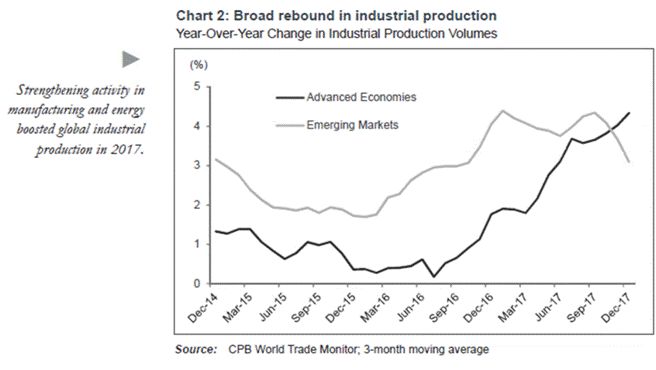
| FISCAL PLAN 2018 – 21 • ECONOMIC OUTLOOK | 90 |
INDUSTRIAL PRODUCTION AND GLOBAL TRADE REBOUND
Growth in global industrial production has accelerated sharply in advanced economies and emerging markets (Chart 2). Global industrial output has been bolstered by better-than-expected industrial production in China, which consumes half of the world’s metal production. An upturn in business investment, led by the energy and manufacturing industries, has also supported industrial output. Amid solid global growth, the increase in industrial production has lifted global trade, which increased 4.5% last year, the fastest pace since 2011. It has also led to a surge in prices for base metals such as copper and aluminum since mid-2017. Following last year’s exceptional gains, robust global demand should be supportive of the recovery in prices for oil and other non-energy commodities.
LABOUR MARKETS TIGHTEN AMID WEAK INFLATION
With growth accelerating, labour markets in many countries have posted significant improvements. Unemployment rates in the US and Canada are near multi-decade lows and have declined in the Euro Area, where unemployment was elevated (Chart 3). Despite these improvements, wage growth and inflation remain subdued. With both the US and Canadian economies operating near capacity, wage growth is likely to pick up in the near term. Rising wages and higher commodity prices will put some upward pressure on inflation as businesses raise prices. |
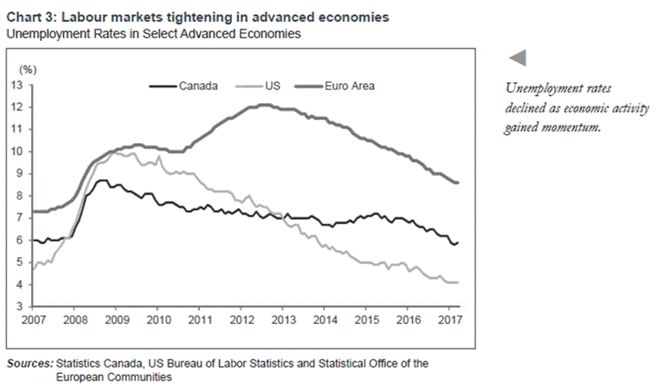
| FISCAL PLAN 2018 – 21 • ECONOMIC OUTLOOK | 91 |
INTEREST RATES RISING GRADUALLY
In the aftermath of the 2009 global financial crisis, central banks in advanced economies implemented extraordinary measures to support economic growth, such as exceptionally low policy interest rates and quantitative easing programs.
With growth on a solid footing and labour markets finally showing signs of tightening in several advanced economies, monetary policy is shifting (Chart 4). The US Federal Reserve, which is further ahead in its tightening cycle, implemented three rate hikes in 2017 and announced plans to gradually reduce the size of its balance sheet starting in October 2017. The Bank of Canada has increased rates three times since mid-2017 and the Bank of England reversed rate cuts implemented in 2016. Meanwhile, the European Central Bank has not raised interest rates due to stubbornly low inflation but has started to scale back its bond-buying stimulus program.
Looking ahead, with labour market tightening and inflationary pressures anticipated to build, central banks are expected to continue raising interest rates, albeit at a gradual pace. Even so, monetary policy is expected to be highly accommodative and supportive of growth, as interest rates in most of these countries will remain near historic lows. |
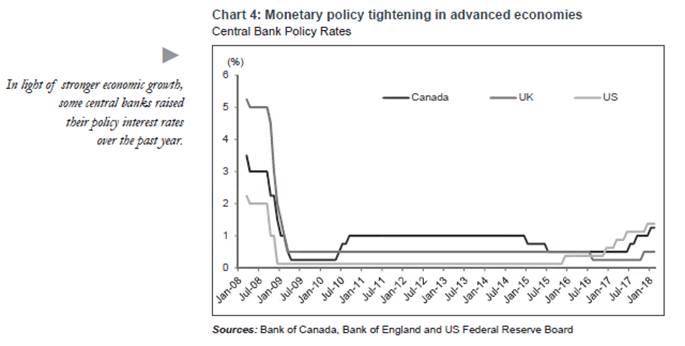
| FISCAL PLAN 2018 – 21 • ECONOMIC OUTLOOK | 92 |
MODEST IMPROVEMENT IN OIL PRICES
The global oil market is rebalancing against a backdrop of supply restraint and accelerating global economic growth. Global oil demand has benefitted from a broad-based expansion in industrial activity over the past year. An agreement by the Organization of the Petroleum Exporting Countries (OPEC) and several non-OPEC producers to extend output cuts until the end of this year, combined with strong compliance with the agreement, has helped reduce the supply glut. Global crude inventories have fallen from the record high reached in 2016. With synchronized global growth lending support to oil demand and lower inventories, oil prices have improved.
The US, however, remains a key driver of global supply growth (Chart 5). US production has been rising steadily since late 2016, when oil prices moved up to US$50/bbl. In late 2017, production reached a record high. With US shale oil producers very responsive to higher prices, expanding production is expected to keep a lid on price growth this year. West Texas Intermediate (WTI), the North American benchmark oil price, is forecast to average US$59 bbl in 2018-19. |
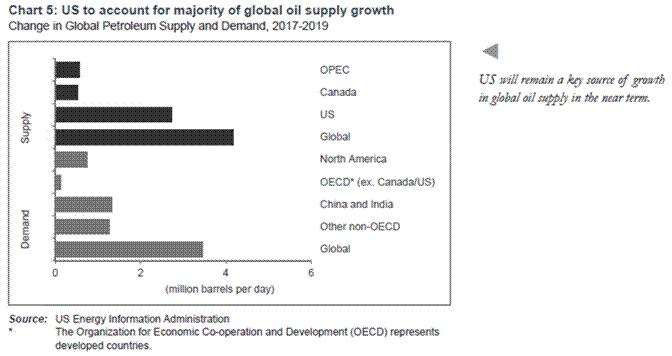
| FISCAL PLAN 2018 – 21 • ECONOMIC OUTLOOK | 93 |
| Over the medium term, the oil market is expected to remain well supplied, given ample low-cost OPEC output and strong gains in non-OPEC production, led by US shale. These factors are expected to keep oil prices contained over the next 3-4 years. WTI is forecast to rise to US$63/bbl by 2020-21, which is still well below the levels seen prior to the downturn (Chart 6). |
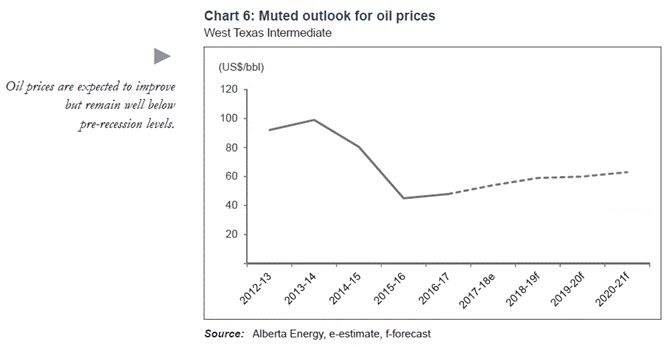 | ||
Canadian Economy
Following lacklustre growth in 2016, the Canadian economy grew at an exceptionally strong pace in the first half of 2017. This was largely driven by a rebound in Alberta’s economy. Momentum slowed in the second half of the year as growth in Alberta moderated, particularly in the oil and gas sector (Chart 7). Even so, industrial capacity utilization rates surged in 2017 and the Canadian economy led growth among G7 economies, at 3.0%.
Economic activity is shifting to a more sustainable pace. Real GDP growth is forecast to moderate to a still solid pace of 2.2% in 2018 and 2.0% in 2019 before averaging around 1.8% over the medium term. Consumer spending is expected to contribute to growth, underpinned by strong job gains and improvement in wage growth. Meanwhile, higher interest rates, elevated household debt and changes to housing policy are likely to cool down residential activity. Firmer oil prices, strong global growth and industrial capacity pressures in the US and Canada are anticipated to bolster business investment and exports, although uncertainty surrounding the NAFTA negotiations is weighing on the near-term outlook. | ||
| FISCAL PLAN 2018 – 21 • ECONOMIC OUTLOOK | 94 |
| While the Bank of Canada is expected to raise interest rates gradually, it is likely to take a cautious approach as it considers the economy’s response to higher interest rates, given elevated household debt levels and the recent moderation in economic growth. Even though the Canadian dollar has come under pressure recently, rising interest rates and a modest recovery in oil prices should provide support. The Loonie is forecast to appreciate gradually from US¢78/ Cdn$ in 2017-18 to US¢80/Cdn$ in 2019-20. |
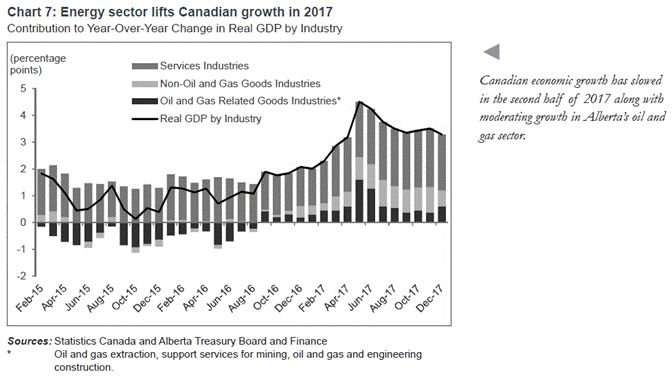
| FISCAL PLAN 2018 – 21 • ECONOMIC OUTLOOK | 95 |
Alberta Economy
The Alberta economy will move closer to a full recovery in 2018, building off the strong broad-based rebound in 2017. Real GDP growth is forecast to be 2.7%, driven by rising exports and strong consumer spending. Beyond 2018, the Alberta economy is set to shift into expansion mode at a solid pace of around 2.5%, consistent with robust population growth, an upturn in investment and a broadening of activity across all sectors of the economy.
TRANSITION FROM RECOVERY TO EXPANSION
The Alberta economy is well on its way to fully recovering from one of the worst recessions of the last 40 years. Following a surge in activity in 2017, some economic measures have already surpassed 2014 levels, notably retail sales and employment. However, given the depth of the downturn, the recovery has been drawn out. The economy is not expected to move into expansion until 2019, when the level of economic output (measured by real GDP) surpasses pre-recession levels. Although overall employment has recovered, employment in some industries is still below pre-recession levels. The unemployment rate remains elevated as people continue to enter the labour force and is not forecast to move near pre-recession rates until 2021.
Exports will continue to propel growth during the recovery as oil production rises and capacity expands in the manufacturing sector. Real exports are forecast to increase almost 5% in 2018 and around 3% between 2019 and 2021 (Chart 8).
As the pace of production moderates, growth will be driven less by exports and more by investment. Business investment, which has lagged the rest of the recovery, is expected to turn around starting in 2019. Although the outlook for oil and gas investment is muted, investment in non-residential construction, in particular manufacturing, is expected to help fuel the economic expansion. |
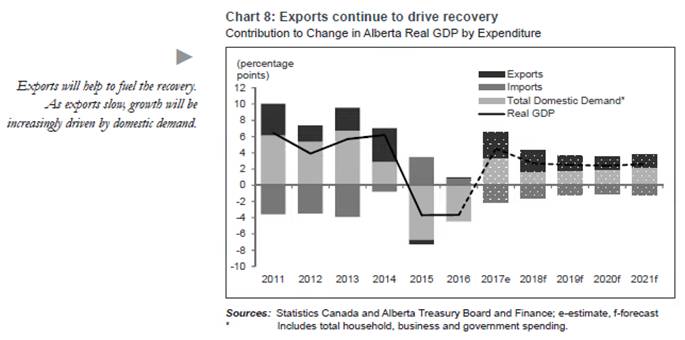
| FISCAL PLAN 2018 – 21 • ECONOMIC OUTLOOK | 96 |
The service sector is expected to contribute more to real GDP growth than the goods sector starting in 2019, as rising business activity and consumer spending boost demand for various services such as finance and real estate, wholesale and retail trade.
OIL PRODUCTION DRIVES EXPORTS
With several large oil sands projects finishing construction and ramping up, oil production is set to grow significantly (Chart 9). In 2018, production is forecast to increase more than 360,000 barrels per day (bpd), following an increase of almost 300,000 bpd in 2017. Of the various projects coming online in 2018, the largest is the Fort Hills oil sands mine, which drew first oil early this year and is expected to reach 90% of its 194,000 bpd nameplate capacity by the fall of 2018. Another 380,000 bpd of production is expected to be added from 2019 to 2021, when a number of in situ expansion projects are expected to become operational. This will bring Alberta oil production to just under four million bpd and maintain Canada’s position as one of the world’s largest oil producers. |
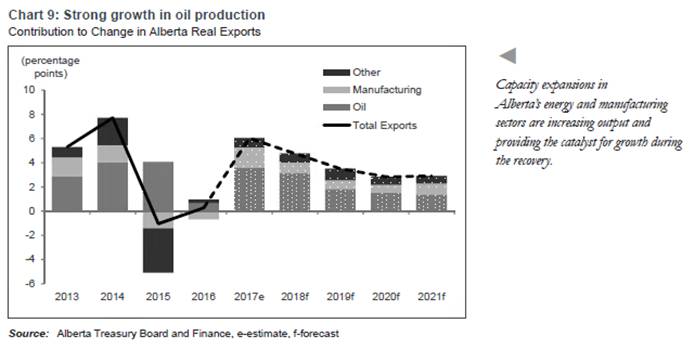 | ||
ALBERTA’S MANUFACTURING BASE CONTINUES TO EXPAND
Exports will be further supported by capacity expansions in Alberta’s manufacturing sector which will add value to Alberta’s resources and boost growth across several sectors of the economy. Following an estimated increase of over 7% in 2017, real manufacturing exports are expected to increase close to 4% in 2018. Petroleum manufacturing will be boosted by the Sturgeon Refinery, which produced its first barrel of diesel at the end of 2017. Production at Canada’s first new refinery in over 30 years will ramp up throughout the year, eventually reaching its 80,000 bpd capacity. Chemical manufacturing was given a boost in 2017, thanks in part to the completion of the Joffre polyethylene plant expansion. | ||
| FISCAL PLAN 2018 – 21 • ECONOMIC OUTLOOK | 97 |
Further petrochemical capacity expansions through the province’s Petrochemical Diversification Program (PDP) are expected to come online by 2021. Food manufacturing will increase in 2019 when the $360 million Cavendish Farms potato processing plant in Lethbridge moves into production. These projects will keep real manufacturing exports growing at 3.3% on average between 2019 and 2021.
AGRICULTURE AND FORESTRY REMAIN STEADY
Alberta’s agriculture and forestry industries are expected to see solid growth in 2018 following a strong expansion in 2017. Last year, Alberta’s agri-food exports grew by 12%, supported by the reopening of a beef packing plant in Balzac (Chart 10). Crop exports surged, while higher prices supported farm cash receipts. Despite some regionally adverse weather, overall improved growing conditions led to strong production of wheat and canola. This is expected to boost Alberta’s crop exports. Livestock and meat demand is likely to see moderate growth, supported by growing global demand for quality protein options. |
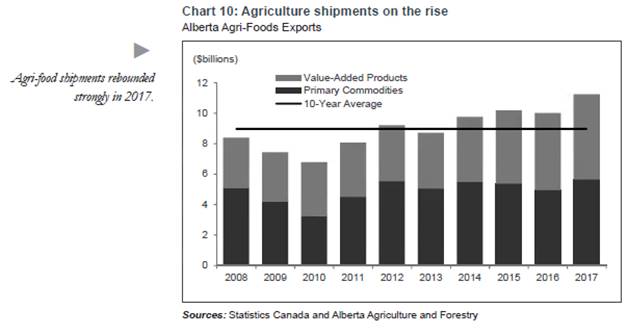 | ||
In the forestry sector, lumber producers will continue to benefit from elevated prices. Tight supply and strong demand in the US have so far enabled Canadian producers to pass softwood lumber duties onto US consumers.
While ongoing uncertainty in the NAFTA renegotiations poses significant risks to the outlook for the agriculture and forestry sectors, other trade agreements are set to create new business opportunities. The Comprehensive and Progressive Agreement for Trans-Pacific Partnership (CPTPP) was signed in March 2018. It is anticipated to take effect as early as the end of 2018 and will enhance Alberta’s access to key Asian markets and support growth in these industries. |
| FISCAL PLAN 2018 – 21 • ECONOMIC OUTLOOK | 98 |
WIDER DIFFERENTIAL WEIGHS ON OIL SANDS INVESTMENT
Although WTI prices are forecast to improve gradually over the forecast period, Alberta producers will not be able to fully realize the gains. This is mainly due to ongoing pipeline bottlenecks. The WTI/WCS differential is forecast to increase from around US$14.50/bbl in 2017-18 to over US$20/ bbl in 2018-19 (Chart 11). The approval and start-up of two pipelines, the Enbridge Line 3 replacement and Trans Mountain Expansion (TMX), will alleviate pipeline bottlenecks in 2020 and 2021 (see Box 1). However, the light-heavy differential is forecast to remain wide as new rules on the sulphur content of marine fuels from the International Maritime Organization go into effect. This is expected to reduce demand for bunker fuel, which mainly comes from heavy oil, and reduce heavy oil prices. |
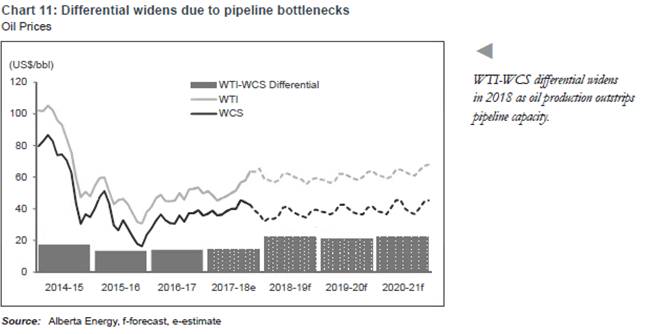 | ||
The wider differential will weigh on oil sands investment, which is forecast to fall by 10% in 2018 and recover moderately over the remainder of the forecast period. The decline in 2018 is largely driven by a reduction in spending following the completion of the Fort Hills oil sands mine and the Horizon Phase 3 expansion in 2017. Companies continue to focus on containing costs, which allowed operators to reduce sustaining capital outlays in 2017. However, sustaining capital requirements in 2018 and throughout the forecast period are expected to increase along with oil production. Investment will also be boosted primarily by thermal expansion projects, which will add around 250,000 barrels per day of additional capacity between 2019 and 2021.
NATURAL GAS SURPLUS TO UNWIND GRADUALLY
North America continues to be awash in natural gas. Drillers in Alberta are increasingly targeting natural gas liquids-rich deposits. This is mainly to feed the demand for condensate, which is used to dilute bitumen for transportation by pipeline and commands a much higher price than natural | ||
| FISCAL PLAN 2018 – 21 • ECONOMIC OUTLOOK | 99 |
Box 1: Importance of Market Access
The Alberta economy is on its strongest footing since 2014. However, just as the effects of the oil price collapse have started to fade, in part because of an improvement in oil prices, the challenges of market access have moved to the fore. Alberta heavy oil prices are once again trading at a large discount to global benchmarks. Long forecasted pipeline bottlenecks and an increasing reliance on rail are lifting transportation costs for Alberta heavy oil and widening the differential. Lack of market access is hurting heavy oil producers, government revenues and the Canadian economy.
Alberta bitumen is priced at a discount to WTI because of the lower quality of heavy oil and the cost of transporting it to market. The discount is measured through the light-heavy (L/H) differential. Without sufficient pipeline access, producers incur higher transportation costs shipping their crude by rail. Two pipeline projects approved by the federal government, TMX and the Enbridge Line 3 Expansion, would add almost 1 million bpd of transportation capacity by 2021 and alleviate bottlenecks (Chart 12).
Keystone XL would provide additional longer-term access.
Market access also allows for diversification to markets where heavy oil is fetching the highest price, reducing the discount on Alberta bitumen prices relative to global prices. Currently there is limited pipeline capacity to the two largest heavy oil markets in the world, the US Gulf Coast and Asia. TMX is critical, as it would allow producers to sell into the lucrative Pacific market. Keystone XL would provide additional access to the US Gulf Coast, a region with one of the world’s largest coking capacity and a key market for Alberta’s heavy crude.
The economic impacts of market access are significant. Additional pipeline capacity would allow Alberta producers to receive up to US$7/bbl more. This would lift capital investment by an estimated $10 billion and production capacity by 190,000 bpd over the period 2018 to 2023 compared with a scenario without additional pipeline access. The impact to real GDP is estimated at 1.5-2% by 2023. Higher production and prices would boost royalties by up to $10.5 billion between 2018 and 2023.
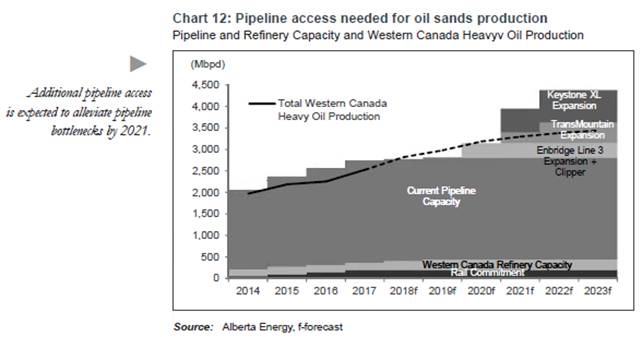
| FISCAL PLAN 2018 – 21 • ECONOMIC OUTLOOK | 100 |
gas, since it is priced more closely to WTI. Condensate production has more than doubled since 2016.
Demand for natural gas in Alberta is expected to rise over the next several years due to expanding oil sands operations, the continued transition to gas power generation and the expanding petrochemical industry in Alberta. In addition, two new propane terminals in BC – Pembina’s project in Prince Rupert and the Alta Gas project on Ridley Island – will boost demand for propane. However, imports are expected to rise as TransCanada Pipeline expands its Nova Gas Transmission System connecting BC gas to Alberta. Natural gas prices in Alberta will only improve modestly. The Alberta reference price for natural gas is forecast to rise gradually from $2.00 in 2018-19 to $2.40 in 2020-21.
CONVENTIONAL OIL AND GAS DRIVES ENERGY INVESTMENT
The conventional oil and gas sector is seeing a resurgence in activity. As a result, conventional investment is set to overtake oil sands (Chart 13). In 2017, investment is estimated to have increased by almost 60% as producers responded to higher oil prices by increasing drilling. Despite low natural gas prices, Alberta liquids-rich plays remain competitive compared with other areas in North America because of low drilling costs and proximity to the condensate market. Alberta’s emerging crude oil plays are becoming more understood and offer fast returns. Increased interest in conventional oil and gas activity, particularly in the expanding Montney and Duvernay plays, resulted in $505 million worth of Crown land sales in 2017, more than triple 2016 sales. Rising prices for condensate and light oil will support conventional oil and gas investment, which is forecast to expand nearly 6% this year. Some cost escalation is expected in 2018 as service companies increase rates that had been cut during the downturn. Between 2019 and 2021, investment is forecast to grow an average of 4.6% annually. |
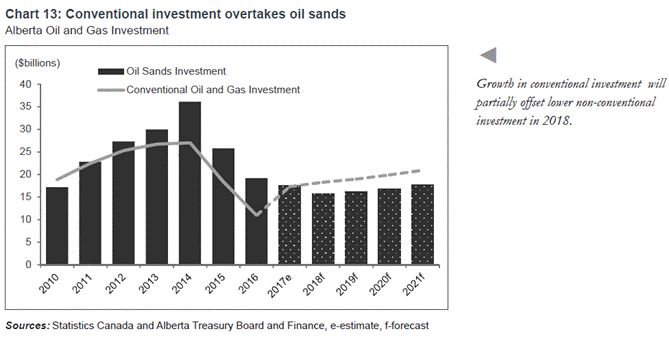
| FISCAL PLAN 2018 – 21 • ECONOMIC OUTLOOK | 101 |
NON-RESIDENTIAL CONSTRUCTION RECOVERS WITH A LAG
Non-residential construction is expected to edge lower in 2018 before gradually picking up. Building permits, a leading indicator of construction activity, fell considerably over the last two years. Commercial and industrial construction continues to be weighed down by elevated commercial real estate vacancies and the pullback in oil sands investment. A bright spot, however, is the manufacturing sector. According to Statistics Canada’s Survey of Investment Intentions, manufacturing investment is set to increase by almost $800 million this year (Chart 14). Construction has started on the $3.5 billion Heartland Petrochemical Complex that is slated to come online in 2021, while front-end engineering work has begun on a second polypropylene facility. Both of these projects were granted royalty credits through the Petrochemical Diversification Program. Overall, non-residential investment is expected to decline 1.9% in 2018 before rebounding by 2.5% in 2019. Growth accelerates to 5.0% by 2021, largely due to capacity expansions in the manufacturing sector.
Budget 2018 contains several new measures to further support downstream oil and gas investment. These initiatives are intended to diversify Alberta’s energy sector and get the best value from Alberta’s oil and gas resources. The three measures include a second round of funding for petrochemical facilities, support for straddle plants to extract natural gas liquids, and support for partial upgraders, which will improve the quality of bitumen so that it is easier to transport and can be processed by a wider variety of refinery configurations. These new measures could support up to $13 billion in capital investment, which would add 0.6 per cent to real GDP by 2021. |
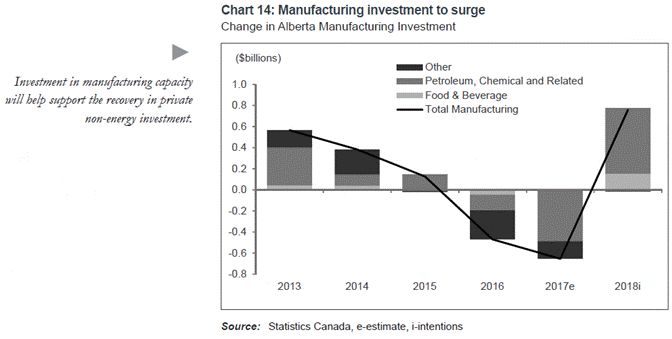
| FISCAL PLAN 2018 – 21 • ECONOMIC OUTLOOK | 102 |
SERVICE SECTOR IMPROVES
The service sector in Alberta makes up about 60% of the economy and fared better than the goods sector during the recession. It is expected to benefit from rising exports and growing business and consumer spending within Alberta. With oil and manufacturing output growing substantially and non-residential investment set to improve starting in 2019, rising spending within the business sector will provide a boost to professional, scientific and technical services and transportation and warehousing. Accommodation and food and other services in Alberta will also get a lift from increased business-related travel. Population and income growth will continue to drive demand for consumer services like finance and real estate and retail trade.
In addition to the demand for services within Alberta, service exports are forecast to continue recovering in 2018 and grow at a steady pace of around 3% over the medium term. Amid a solid outlook for the global economy, rising interprovincial and international trade will boost service exports. The tourism sector is likely to perform well following solid gains in 2017. Domestic and international visits are expected to get a boost from this year’s Canada-China Year of Tourism, as well as enhanced air capacity and connectivity to Canada and the US from Calgary’s airport. Strengthening energy investment in the US and other jurisdictions will increase the demand for services from Alberta’s oil and gas sector.
Overall, the service sector in Alberta is forecast to expand by 1.9% in 2018 and 2.3% over the medium term.
PROLONGED RECOVERY IN NOMINAL GDP
Despite the recovery in economic activity, the lingering effects of the recession and oil price decline are prolonging the recovery in nominal GDP, a broad measure of income. It is expected to grow annually by 5.2% between 2018 and 2021, but not to return to pre-recession levels until 2020. While oil prices have improved, they remain far below where they were in 2014. This means that the volume of oil exports in 2019 is expected to be 40% higher than in 2014, but the dollar value of those exports is expected to be 10% lower. Cost containment and a rebounding economy are bolstering corporate profits, which are forecast to grow by almost 20% per year between 2019 and 2021 (Chart 15); however, with oil prices not expected to exceed US$63/bbl, corporate profits will remain below 2014 levels over the next three years. This is in contrast to household earnings, which should exceed 2014 levels beginning this year. |
| FISCAL PLAN 2018 – 21 • ECONOMIC OUTLOOK | 103 |
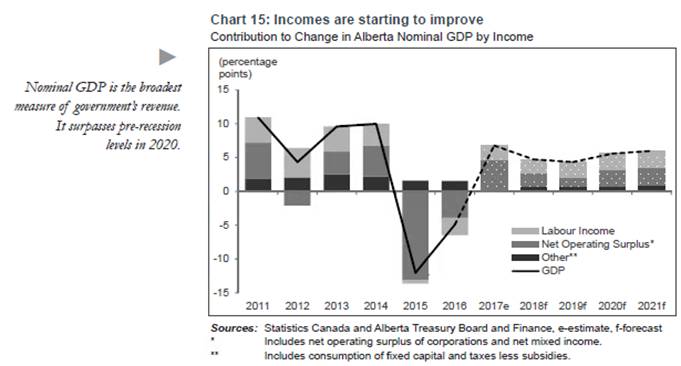
LABOUR MARKET RENEWAL
Building on the momentum in the labour market from the second half of 2017, employment growth is expected to accelerate in 2018. In the last three months of 2017, employment increased sharply, marking a full recovery of jobs lost during the recession. This improvement was due to increases in full-time and private sector positions which are expected to extend into this year.
Alongside steady growth in the service sector, solid conventional oil and gas activity and additional capacity in the manufacturing sector will boost job gains in the goods sector and support employment growth of 2.0% in 2018. Solid employment growth is expected throughout the forecast period as goods-producing industries, which suffered the largest job declines, continue to recover jobs and investment in non-residential construction picks up. Employment growth is expected to average 1.7% by 2021.
Continued improvement in the labour market, especially in the high-paying goods sector, will bolster earnings. With more full-time employment and hours worked, average weekly earnings (AWE) are forecast to expand by 2.4% in 2018 and around 3% annually between 2019 and 2021. This will support primary household income growth of 4.5% in 2018 and lift household income above the pre-recession level. Growth in primary household income is forecast to pickup to almost 5% by 2021. With inflation fairly steady, households will see real incomes rise over the medium term.
UNEMPLOYMENT FALLS GRADUALLY
With more Albertans working by the end of 2017, Alberta’s unemployment rate responded quickly. It fell from an elevated 8.1% in August to a two-year low of 7.0% by December. As employment advances again this year, the unemployment rate is forecast to fall further to average 6.8%. However, given |
| FISCAL PLAN 2018 – 21 • ECONOMIC OUTLOOK | 104 |
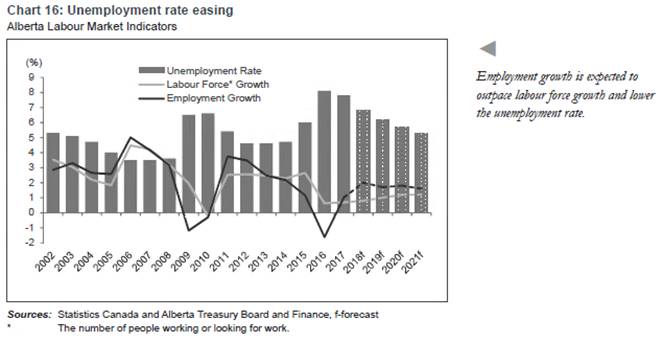
the depth of the recession and the prolonged recovery, the unemployment rate will not move near pre-recession rates until 2021, when it is forecast to average 5.3%. The improvement can be attributed to rising employment over the next four years as the expanding economy provides jobs for people entering the labour market (Chart 16).
Population aging is also playing a part as more people retire from the work force. The labour force participation rate has been trending downward at a rate of about 0.2 percentage points per year since 2009. This trend has coincided with an increase in the share of the population over 65. Both these trends are expected to continue over the forecast, with the labour force participation rate falling from 72.4% in 2017 to 71.7% in 2021. Even then, Alberta is expected to continue having the highest participation rate among the provinces.
POPULATION GROWTH PICKS UP
Alberta’s population is set to grow at a faster pace as the effects of the recession continue to fade. After two years of net outflows, interprovincial migration was again positive in the third quarter of 2017, and net inflows of 2,000 interprovincial migrants are expected in 2018. The reversal in interprovincial migrant flows was largely due to less out-migration, as improving economic conditions and affordable housing encouraged more Alberta residents to stay in the province.
In addition, Alberta’s relatively young population is producing robust natural increase of about 0.8% per year, faster than any other province. Continued strong natural increase and solid immigration into the province are expected to support population growth of 1.4% in 2018, well above the national increase of around 1%. |
| FISCAL PLAN 2018 – 21 • ECONOMIC OUTLOOK | 105 |
| Immigration into Alberta is expected to rise from around 37,500 in 2018 to almost 41,000 by 2021 as the Federal Government raises the national target for immigration. As Alberta’s economy continues to strengthen and labour prospects improve, net interprovincial migration is forecast to pick up gradually, rising to 8,000 by 2021. The modest turnaround in net interprovincial migration boosts population growth to 1.6% by 2021 (Chart 17). |
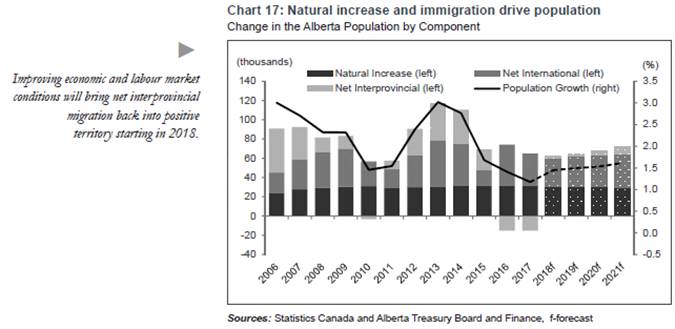 | ||
INCOME AND POPULATION GROWTH FUEL HOUSEHOLD SPENDING
Following a surge in 2017 when retail sales reached a new high, Albertans are expected to keep spending in 2018 and over the medium term. The increase is being driven by rising employment, wages and population. In 2018, real consumer spending (adjusted for inflation) is forecast to grow a solid 2.9%. Spending is expected to shift more to services and non-durable goods and away from durable goods, which saw an estimated real increase of almost 12% in 2017. With inflation expected to remain stable at around 2%, real household consumption is expected to grow by around 3.0% per year over the forecast, making a strong contribution to overall economic growth.
On the housing side, elevated inventories, higher interest rates and tighter mortgage rules are expected to keep housing starts contained this year at around 30,000, almost the same level as 2017. However, construction that began in 2017 will continue into 2018, which will support almost 9% growth in real residential investment. On the back of Alberta’s more affordable housing market and a net inflow of over 42,000 people by 2021, residential building activity is forecast to pick up over the next four years (Chart 18). Housing starts are expected to rise to 35,200 by 2021, while steady spending on renovations is expected to bolster residential expenditures. | ||
| FISCAL PLAN 2018 – 21 • ECONOMIC OUTLOOK | 106 |
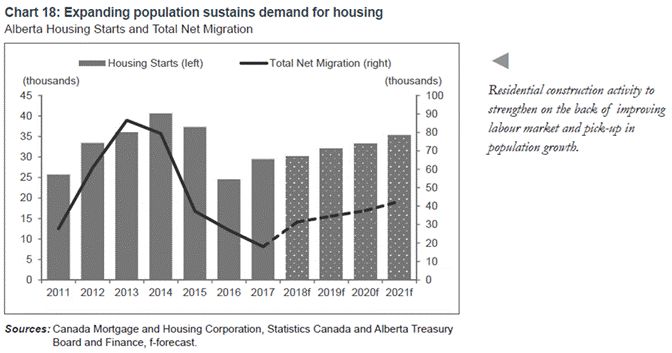
Risks to the Economic Outlook
Given the Alberta economy’s high reliance on global trade and commodities, the outlook is subject to a number of risks:
∎ A faster increase in US shale production and weaker compliance to OPEC-led supply cuts could limit the recovery in prices.
∎ With oil production outstripping pipeline capacity starting this year, prolonged market access issues could lead to a wider differential, weighing on incomes and investment.
∎ Monetary policy in advanced economies could tighten faster than anticipated. In Canada, highly indebted households remain vulnerable to a faster-than-expected increase in interest rates.
∎ In addition to its impact on commodity prices, stronger-than-expected global growth is likely to boost export demand. However, the threat of protectionist trade policies, such as those related to the NAFTA renegotiations, is a key risk to the trade outlook. |
| FISCAL PLAN 2018 – 21 • ECONOMIC OUTLOOK | 107 |
Annex
| FISCAL PLAN 2018 – 21 • ECONOMIC OUTLOOK | 108 |
Benchmarking Tables
Oil Price Benchmark
West Texas Intermediate (US$/bbl)
| Organization | 2018 | 2019 | 2020 | 2021 | ||||||||||||
National Forecasting Agencies | ||||||||||||||||
Conference Board of Canada (Feb/18) | 54.68 | 57.40 | 60.35 | n/a | ||||||||||||
IHS Global Insight (Feb/18) | 63.29 | 56.42 | 67.04 | 73.07 | ||||||||||||
Centre for Spatial Economics (Feb/18) | 55.33 | 57.43 | 63.28 | 67.47 | ||||||||||||
Banks and Investment Dealers | ||||||||||||||||
BMO Capital Markets (Feb/18) | 58.00 | 60.00 | n/a | n/a | ||||||||||||
CIBC World Markets (Jan/18) | 55.00 | 57.00 | n/a | n/a | ||||||||||||
Credit Suisse (Dec/17) | 56.00 | 58.00 | 57.00 | 57.00 | ||||||||||||
Goldman Sachs (Feb/18) | 72.50 | 64.50 | 54.50 | n/a | ||||||||||||
Laurentian Bank (Dec/17) | 64.75 | n/a | n/a | n/a | ||||||||||||
RBC Capital Markets (Dec/17) | 54.00 | 56.00 | 60.00 | 65.00 | ||||||||||||
Scotiabank (Feb/18) | 57.00 | 60.00 | n/a | n/a | ||||||||||||
Toronto Dominion Bank (Mar/18) | 60.00 | 58.50 | n/a | n/a | ||||||||||||
Industry Analysts | ||||||||||||||||
U.S. Energy Information Administration (Feb/18) | 58.28 | 57.51 | n/a | n/a | ||||||||||||
GLJ Petroleum Consultants (Jan/18) | 59.00 | 59.00 | 60.00 | 63.00 | ||||||||||||
Sproule Associates Limited (Jan/18) | 55.72 | 65.00 | 70.00 | 73.00 | ||||||||||||
Confidential Forecasts Provided to Alberta Energya | ||||||||||||||||
Average | 61.00 | 59.00 | 62.00 | 67.00 | ||||||||||||
High | 72.50 | 65.00 | 70.00 | 73.96 | ||||||||||||
Low | 52.25 | 53.18 | 54.50 | 57.00 | ||||||||||||
Average of All Private Forecasts | 59.00 | 59.00 | 62.00 | 67.00 | ||||||||||||
Government of Alberta (calendar year)b | 61.00 | 59.00 | 62.00 | 67.00 | ||||||||||||
| a | Alberta Energy also surveys, on a confidential basis, private sector forecasts from PIRA, the Bank of Montreal, IHS Markit, Stratas Advisors, and Wood Mackenzie; the futures price of oil is also included in the basket. The annual figures presented here are a weighted average of the forecast prices from these sources. High/Low forecasts may represent one of the confidential forecasts. The private sector average, consultant average and Government of Alberta forecasts have been rounded to the nearest dollar. |
| b | The Government of Alberta forecast is based on the confidential forecasts provided to Alberta Energy. |
Includes forecasts finalized on or before March 5, 2018.
| How Oil Price Forecasters Fared in Budget 2017 | ||||||||
| West Texas Intermediate (US$/bbl) | |||||||
| Organization (#) | How did they do in Budget 2017? | |||||||
| ||||||||
u | National Forecasting Agencies (3) | 52.57 | ||||||
Both the Government of Alberta and | Banks and Investment Dealers (7) | 56.77 | ||||||
the private sector overestimated | Industry Analysts (3) | 54.49 | ||||||
the WTI oil price for 2017, | Confidential Forecasts (6) | 56.00 | ||||||
by 6.0% and 7.9% respectively | Average | 55.00 | ||||||
| Government of Alberta (calendar year) | 54.00 | |||||||
| 2017 Actual | 50.95 | |||||||
| Sources: Alberta Treasury Board and Finance and Alberta Energy | ||||||||
| FISCAL PLAN 2018 – 21 • ECONOMIC OUTLOOK | 109 |
Natural Gas Price Benchmark
Henry Hub (US$/MMBTU)a
| Organization | 2018 | 2019 | 2020 | 2021 | ||||||||||||
National Forecasting Agencies | ||||||||||||||||
Conference Board of Canada (Feb/18) | 3.28 | 3.44 | 3.62 | n/a | ||||||||||||
IHS Global Insight (Feb/18) | 2.93 | 2.88 | 2.87 | 3.13 | ||||||||||||
Centre for Spatial Economics (Feb/18) | 3.19 | 3.78 | 4.39 | 4.37 | ||||||||||||
Banks and Investment Dealers | ||||||||||||||||
BMO Capital Markets (Feb/18) | 3.00 | 3.20 | n/a | n/a | ||||||||||||
CIBC World Markets (Jan/18) | 2.80 | 2.90 | n/a | n/a | ||||||||||||
Credit Suisse (Dec/17) | 3.10 | 3.00 | 3.00 | 3.00 | ||||||||||||
Goldman Sachs (Feb/18) | 3.00 | 2.75 | 2.75 | n/a | ||||||||||||
RBC Capital Markets (Dec/17) | 3.00 | 3.00 | 3.00 | 3.00 | ||||||||||||
Scotiabank (Feb/18) | 2.95 | 2.95 | n/a | n/a | ||||||||||||
Toronto Dominion Bank (Mar/18) | 3.01 | 3.13 | n/a | n/a | ||||||||||||
Industry Analysts | ||||||||||||||||
U.S. Energy Information Administration (Feb/18) | 3.20 | 3.08 | n/a | n/a | ||||||||||||
GLJ Petroleum Consultants (Jan/18) | 2.85 | 3.00 | 3.25 | 3.50 | ||||||||||||
Sproule Associates Limited (Jan/18) | 3.24 | 3.50 | 4.00 | 4.08 | ||||||||||||
Confidential Forecasts Provided to Alberta Energyb | ||||||||||||||||
Average | 3.00 | 3.00 | 3.30 | 3.30 | ||||||||||||
High | 3.28 | 3.78 | 4.51 | 4.39 | ||||||||||||
Low | 2.62 | 2.75 | 2.75 | 2.75 | ||||||||||||
Average of All Private Forecasts | 3.00 | 3.10 | 3.30 | 3.40 | ||||||||||||
Government of Alberta (calendar year) | 3.00 | 3.00 | 3.30 | 3.30 | ||||||||||||
| a | The natural gas price at Henry Hub Louisiana (in US$/mmBTU) is the US benchmark while the AECO natural gas price (in CAD$/GJ) is the Western Canada benchmark. While both benchmarks are widely used in North America, the difference between Henry Hub and AECO price reflects transportation costs and regional supply/demand impacts as well as exchange rate and unit conversion. The Alberta Reference Price (used in natural gas royalty calculations) represent the average field price of all Alberta gas sales which normally follows the Western Canada regional benchmark. |
| b | Alberta Energy also surveys, on a confidential basis, private sector forecasts from Petral, Sproule, IHS Markit, PIRA, Wood McKenzie, EIA, the Bank of Montreal, Scotiabank, Stratas Advisors, and NYMEX. The annual figures presented here are the average forecast prices from these sources. High/Low forecasts may represent one of the confidential forecasts. The private sector average, consultant average and Government of Alberta forecasts have been rounded to the nearest ten cents. |
Includes forecasts finalized on or before March 5, 2018.
| How Natural Gas Price Forecasters Fared in Budget 2017 | ||||||
| Henry Hub (US$/MMBTU) | ||||||
| Organization (#) | How did they do in Budget 2017? | |||||
| ||||||
| National Forecasting Agencies (3) | 3.19 | t
Both the Government of Alberta and the private sector overestimated natural gas prices in 2017, by 6.0% and 9.3% respectively. | ||||
| Banks and Investment Dealers (7) | 3.19 | |||||
| Industry Analysts (3) | 3.51 | |||||
| Confidential Forecasts (5) | 3.30 | |||||
| Average | 3.30 | |||||
| Government of Alberta (calendar year) | 3.20 | |||||
| 2017 Actual | 3.02 | |||||
| Sources: Alberta Energy and Alberta Treasury Board and Finance | ||||||
| FISCAL PLAN 2018 – 21 • ECONOMIC OUTLOOK | 110 |
Light-Heavy Oil Price Differential Benchmark
WTI-WCS Price Differential (US$/bbl)
| Organization | 2018 | 2019 | 2020 | 2021 | ||||||||||||
National Forecasting Agencies | ||||||||||||||||
Conference Board of Canada (Feb/18) | 15.47 | 15.74 | 16.72 | n/a | ||||||||||||
Centre for Spatial Economics (Feb/18) | 10.00 | 10.05 | 11.50 | 12.50 | ||||||||||||
Banks and Industry Analysts | ||||||||||||||||
RBC Capital Markets (Dec/17) | 15.50 | 17.50 | 15.00 | 14.52 | ||||||||||||
GLJ Petroleum Consultants (Jan/18) | 20.38 | 17.00 | 15.00 | 15.00 | ||||||||||||
Sproule Associates Limited (Jan/18) | 15.21 | 16.12 | 14.81 | 14.83 | ||||||||||||
Confidential Forecasts Provided to Alberta Energya | ||||||||||||||||
Average | 18.90 | 18.70 | 20.70 | 20.70 | ||||||||||||
High | 25.22 | 24.45 | 23.39 | 28.35 | ||||||||||||
Low | 10.00 | 10.05 | 11.50 | 12.50 | ||||||||||||
Average of All Private Forecasts | 17.10 | 17.00 | 17.70 | 17.80 | ||||||||||||
Government of Alberta (calendar year) | 23.50 | 20.30 | 22.20 | 21.00 | ||||||||||||
| a | Alberta Energy also surveys, on a confidential basis, private sector forecasts from IHS Markit, PIRA, Wood MacKenzie, Stratas Advisors, and the Bank of Montreal. The annual figures presented here are the average forecast prices from these sources. High/Low forecasts may represent one of the confidential forecasts. The private sector average, consultant average and Government of Alberta forecasts have been rounded to the nearest ten cents. |
Includes forecasts finalized on or before March 5, 2018.
Canadian Long-Term Interest Rate Benchmark
10-Year Government of Canada Bonds (%)
| Organization | 2018 | 2019 | 2020 | 2021 | ||||||||||||
National Forecasting Agencies | ||||||||||||||||
Conference Board of Canada (Feb/18) | 2.61 | 3.38 | 3.59 | n/a | ||||||||||||
IHS Global Insight (Feb/18) | 2.50 | 3.03 | 3.20 | 3.21 | ||||||||||||
Centre for Spatial Economics (Feb/18) | 2.69 | 3.15 | 4.05 | 4.40 | ||||||||||||
Banks | ||||||||||||||||
BMO Capital Markets (Mar/18) | 2.45 | 3.00 | n/a | n/a | ||||||||||||
CIBC World Markets (Feb/18) | 2.36 | n/a | n/a | n/a | ||||||||||||
Laurentian Bank (Dec/17) | 2.23 | n/a | n/a | n/a | ||||||||||||
National Bank (Feb/18) | 2.55 | 2.97 | n/a | n/a | ||||||||||||
RBC Royal Bank (Feb/18) | 2.60 | 3.08 | n/a | n/a | ||||||||||||
Scotiabank (Feb/18) | 2.49 | 2.74 | n/a | n/a | ||||||||||||
Toronto Dominion Bank (Mar/18) | 2.41 | 2.68 | n/a | n/a | ||||||||||||
High | 2.69 | 3.38 | 4.05 | 4.40 | ||||||||||||
Low | 2.23 | 2.68 | 3.20 | 3.21 | ||||||||||||
Average of All Private Forecasts | 2.49 | 3.00 | 3.61 | 3.80 | ||||||||||||
Government of Alberta (calendar year) | 2.40 | 2.80 | 3.10 | 3.10 | ||||||||||||
Includes forecasts finalized on or before March 5, 2018.
| FISCAL PLAN 2018 – 21 • ECONOMIC OUTLOOK | 111 |
United States / Canada Exchange Rate Benchmark
(US¢/Cdn$)
| Organization | 2018 | 2019 | 2020 | 2021 | ||||||||||||
National Forecasting Agencies | ||||||||||||||||
Conference Board of Canada (Feb/18) | 79.5 | 81.1 | 81.8 | n/a | ||||||||||||
IHS Global Insight (Feb/18) | 81.7 | 79.6 | 81.4 | 83.1 | ||||||||||||
Centre for Spatial Economics (Feb/18) | 80.0 | 80.0 | 80.0 | 80.1 | ||||||||||||
Banks | ||||||||||||||||
BMO Capital Markets (Mar/18) | 79.8 | 81.1 | n/a | n/a | ||||||||||||
CIBC World Markets (Feb/18) | 77.0 | n/a | n/a | n/a | ||||||||||||
Laurentian Bank (Dec/17) | 81.0 | n/a | n/a | n/a | ||||||||||||
National Bank (Mar/18) | 80.8 | n/a | n/a | n/a | ||||||||||||
RBC Royal Bank (Feb/18) | 80.0 | 79.2 | n/a | n/a | ||||||||||||
Scotiabank (Feb/18) | 79.0 | 81.0 | n/a | n/a | ||||||||||||
Toronto Dominion Bank (Mar/18) | 78.0 | 79.0 | n/a | n/a | ||||||||||||
Other | ||||||||||||||||
Bloomberg Forward Curve (Feb/18) | 78.1 | 78.6 | 78.9 | 79.2 | ||||||||||||
High | 81.7 | 81.1 | 81.8 | 83.1 | ||||||||||||
Low | 77.0 | 78.6 | 78.9 | 79.2 | ||||||||||||
Average of All Private Forecasts | 79.5 | 79.9 | 80.5 | 80.8 | ||||||||||||
Government of Alberta (calendar year) | 80.0 | 80.0 | 80.0 | 80.0 | ||||||||||||
Includes forecasts finalized on or before March 5, 2018.
Alberta Real Gross Domestic Product Benchmark
(% change)
| Organization | 2017 | 2018 | 2019 | 2020 | 2021 | |||||||||||||||
National Forecasting Agencies | ||||||||||||||||||||
Conference Board of Canada (Feb/18) | 5.8 | 2.7 | 1.8 | 2.2 | n/a | |||||||||||||||
IHS Global Insight (Jan/18) | 3.8 | 2.4 | 2.5 | 2.1 | 2.1 | |||||||||||||||
Centre for Spatial Economics (Feb/18) | 4.4 | 2.5 | 2.2 | 1.9 | 2.0 | |||||||||||||||
Banks | ||||||||||||||||||||
BMO Capital Markets (Mar/18) | 4.1 | 2.2 | 2.1 | n/a | n/a | |||||||||||||||
CIBC World Markets (Jan/18) | 3.8 | 2.3 | 1.9 | n/a | n/a | |||||||||||||||
Laurentian Bank (Feb/18) | 4.1 | 2.7 | 2.4 | n/a | n/a | |||||||||||||||
National Bank (Mar/18) | 4.2 | 2.7 | 1.9 | n/a | n/a | |||||||||||||||
RBC Royal Bank (Dec/17) | 4.1 | 2.3 | 2.0 | n/a | n/a | |||||||||||||||
Scotiabank (Feb/18) | 4.2 | 2.5 | 1.9 | n/a | n/a | |||||||||||||||
Toronto Dominion Bank (Dec/17) | 4.4 | 3.0 | 2.0 | n/a | n/a | |||||||||||||||
High | 5.8 | 3.0 | 2.5 | 2.2 | 2.1 | |||||||||||||||
Low | 3.8 | 2.2 | 1.8 | 1.9 | 2.0 | |||||||||||||||
Average of All Private Forecasts | 4.3 | 2.5 | 2.1 | 2.1 | 2.0 | |||||||||||||||
Government of Alberta (calendar year) | 4.5 | 2.7 | 2.5 | 2.4 | 2.6 | |||||||||||||||
Includes forecasts finalized on or before March 5, 2018.
| FISCAL PLAN 2018 – 21 • ECONOMIC OUTLOOK | 112 |
Alberta Nominal Gross Domestic Product Benchmark
(% change)
| Organization | 2017 | 2018 | 2019 | 2020 | 2021 | |||||||||||||||
National Forecasting Agencies | ||||||||||||||||||||
Conference Board of Canada (Feb/18) | 9.7 | 5.4 | 4.0 | 4.8 | n/a | |||||||||||||||
IHS Global Insight (Jan/18) | 6.3 | 4.4 | 4.7 | 4.3 | 4.2 | |||||||||||||||
Centre for Spatial Economics (Feb/18) | 7.7 | 4.6 | 5.3 | 6.8 | 5.0 | |||||||||||||||
Banks | ||||||||||||||||||||
CIBC World Markets (Jan/18) | 7.1 | 5.7 | 5.2 | n/a | n/a | |||||||||||||||
Laurentian Bank (Feb/18) | 7.9 | 5.3 | 5.5 | n/a | n/a | |||||||||||||||
National Bank (Mar/18) | 6.9 | 5.5 | 3.4 | n/a | n/a | |||||||||||||||
RBC Royal Bank (Dec/17) | 8.1 | 3.8 | 5.3 | n/a | n/a | |||||||||||||||
Scotiabank (Feb/18) | 7.6 | 4.9 | 5.0 | n/a | n/a | |||||||||||||||
Toronto Dominion Bank (Dec/17) | 7.7 | 5.1 | 4.8 | n/a | n/a | |||||||||||||||
High | 9.7 | 5.7 | 5.5 | 6.8 | 5.0 | |||||||||||||||
Low | 6.3 | 3.8 | 3.4 | 4.3 | 4.2 | |||||||||||||||
Average of All Private Forecasts | 7.7 | 5.0 | 4.8 | 5.3 | 4.6 | |||||||||||||||
Government of Alberta (calendar year) | 6.8 | 4.7 | 4.3 | 5.6 | 6.0 | |||||||||||||||
Includes forecasts finalized on or before March 5, 2018.
Alberta Primary Household Income Benchmark
(% change)
| National Forecasting Agencies | 2017 | 2018 | 2019 | 2020 | 2021 | |||||||||||||||
Conference Board of Canada (Feb/18) | 3.3 | 4.9 | 4.1 | 4.6 | n/a | |||||||||||||||
IHS Global Insight (Jan/18) | 4.9 | 4.8 | 4.1 | 3.7 | 3.7 | |||||||||||||||
Centre for Spatial Economics (Feb/18) | 4.7 | 5.4 | 4.2 | 4.7 | 4.7 | |||||||||||||||
High | 4.9 | 5.4 | 4.2 | 4.7 | 4.7 | |||||||||||||||
Low | 3.3 | 4.8 | 4.1 | 3.7 | 3.7 | |||||||||||||||
Average of All Private Forecasts | 4.3 | 5.0 | 4.1 | 4.3 | 4.2 | |||||||||||||||
Government of Alberta (calendar year) | 4.4 | 4.5 | 4.7 | 4.8 | 4.9 | |||||||||||||||
Includes forecasts finalized on or before March 5, 2018.
Alberta Net Corporate Operating Surplus Benchmark
(% change)
| National Forecasting Agencies | 2017 | 2018 | 2019 | 2020 | 2021 | |||||||||||||||
Conference Board of Canada (Feb/18) | 154.7 | 14.0 | 6.5 | 10.2 | n/a | |||||||||||||||
IHS Global Insight (Jan/18) | 67.4 | 10.2 | 6.4 | 6.3 | 3.7 | |||||||||||||||
Centre for Spatial Economics (Feb/18) | 57.1 | 8.9 | 28.8 | 35.4 | 13.3 | |||||||||||||||
High | 154.7 | 14.0 | 28.8 | 35.4 | 13.3 | |||||||||||||||
Low | 57.1 | 8.9 | 6.4 | 6.3 | 3.7 | |||||||||||||||
Average of All Private Forecasts | 93.1 | 11.0 | 13.9 | 17.3 | 8.5 | |||||||||||||||
Government of Alberta (calendar year) | 90.6 | 19.1 | 9.8 | 19.5 | 20.2 | |||||||||||||||
Includes forecasts finalized on or before March 5, 2018.
| FISCAL PLAN 2018 – 21 • ECONOMIC OUTLOOK | 113 |
Alberta Employment Benchmark
(% change)
| Organization | 2018 | 2019 | 2020 | 2021 | ||||||||||||
National Forecasting Agencies | ||||||||||||||||
Conference Board of Canada (Feb/18) | 1.7 | 1.1 | 1.4 | n/a | ||||||||||||
IHS Global Insight (Jan/18) | 1.9 | 1.6 | 1.2 | 0.9 | ||||||||||||
Centre for Spatial Economics (Feb/18) | 1.6 | 1.8 | 1.8 | 1.6 | ||||||||||||
Banks | ||||||||||||||||
BMO Capital Markets (Mar/18) | 1.7 | 1.3 | n/a | n/a | ||||||||||||
CIBC World Markets (Jan/18) | 2.1 | 1.1 | n/a | n/a | ||||||||||||
Laurentian Bank (Feb/18) | 2.0 | 1.2 | n/a | n/a | ||||||||||||
National Bank (Mar/18) | 1.6 | 1.2 | n/a | n/a | ||||||||||||
RBC Royal Bank (Dec/17) | 1.2 | 1.2 | n/a | n/a | ||||||||||||
Scotiabank (Feb/18) | 1.5 | 1.0 | n/a | n/a | ||||||||||||
Toronto Dominion Bank (Dec/17) | 1.6 | 1.0 | n/a | n/a | ||||||||||||
High | 2.1 | 1.8 | 1.8 | 1.6 | ||||||||||||
Low | 1.2 | 1.0 | 1.2 | 0.9 | ||||||||||||
Average of All Private Forecasts | 1.7 | 1.3 | 1.5 | 1.3 | ||||||||||||
Government of Alberta (calendar year) | 2.0 | 1.7 | 1.8 | 1.6 | ||||||||||||
Includes forecasts finalized on or before March 5, 2018.
Alberta Unemployment Rate Benchmark
(%)
| Organization | 2018 | 2019 | 2020 | 2021 | ||||||||||||
National Forecasting Agencies | ||||||||||||||||
Conference Board of Canada (Feb/18) | 6.6 | 6.2 | 5.8 | n/a | ||||||||||||
IHS Global Insight (Jan/18) | 6.8 | 6.5 | 6.3 | 6.3 | ||||||||||||
Centre for Spatial Economics (Feb/18) | 7.0 | 6.1 | 5.7 | 5.6 | ||||||||||||
Banks | ||||||||||||||||
BMO Capital Markets (Mar/18) | 6.8 | 6.5 | n/a | n/a | ||||||||||||
CIBC World Markets (Jan/18) | 6.7 | 6.3 | n/a | n/a | ||||||||||||
Laurentian Bank (Feb/18) | 6.6 | 6.1 | n/a | n/a | ||||||||||||
National Bank (Mar/18) | 6.2 | 5.9 | n/a | n/a | ||||||||||||
RBC Royal Bank (Dec/17) | 6.9 | 6.4 | n/a | n/a | ||||||||||||
Scotiabank (Feb/18) | 7.3 | 7.2 | n/a | n/a | ||||||||||||
Toronto Dominion Bank (Dec/17) | 7.1 | 6.9 | n/a | n/a | ||||||||||||
High | 7.3 | 7.2 | 6.3 | 6.3 | ||||||||||||
Low | 6.2 | 5.9 | 5.7 | 5.6 | ||||||||||||
Average of All Private Forecasts | 6.8 | 6.4 | 5.9 | 5.9 | ||||||||||||
Government of Alberta (calendar year) | 6.8 | 6.2 | 5.7 | 5.3 | ||||||||||||
Includes forecasts finalized on or before March 5, 2018.
| FISCAL PLAN 2018 – 21 • ECONOMIC OUTLOOK | 114 |
Alberta Housing Starts Benchmark
(thousands)
| Organization | 2018 | 2019 | 2020 | 2021 | ||||||||||||
National Forecasting Agencies | ||||||||||||||||
Conference Board of Canada (Feb/18) | 26.6 | 28.1 | 31.2 | n/a | ||||||||||||
IHS Global Insight (Jan/18) | 30.6 | 31.4 | 31.6 | 32.4 | ||||||||||||
Centre for Spatial Economics (Feb/18) | 29.0 | 28.1 | 27.9 | 27.4 | ||||||||||||
Banks | ||||||||||||||||
BMO Capital Markets (Mar/18) | 32.5 | 33.0 | n/a | n/a | ||||||||||||
CIBC World Markets (Jan/18) | 32.0 | 31.0 | n/a | n/a | ||||||||||||
Laurentian Bank (Feb/18) | 30.0 | 30.0 | n/a | n/a | ||||||||||||
National Bank (Mar/18) | 27.0 | 24.0 | n/a | n/a | ||||||||||||
RBC Royal Bank (Dec/17) | 27.5 | 29.0 | n/a | n/a | ||||||||||||
Scotiabank (Feb/18) | 29.0 | 30.0 | n/a | n/a | ||||||||||||
Toronto Dominion Bank (Dec/17) | 32.8 | 33.9 | n/a | n/a | ||||||||||||
Other | ||||||||||||||||
Canada Mortgage and Housing Corporation (Oct/17)a | 29.4 | 30.1 | n/a | n/a | ||||||||||||
High | 32.8 | 33.9 | 31.6 | 32.4 | ||||||||||||
Low | 26.6 | 24.0 | 27.9 | 27.4 | ||||||||||||
Average of All Private Forecasts | 29.7 | 29.9 | 30.3 | 29.9 | ||||||||||||
Government of Alberta (calendar year) | 30.2 | 32.0 | 33.3 | 35.2 | ||||||||||||
| a | The annual numbers are medians of CMHC’s high and low scenarios |
Includes forecasts finalized on or before March 5, 2018.
| FISCAL PLAN 2018 – 21 • ECONOMIC OUTLOOK | 115 |
Fiscal Plan
Tax Plan
∎ Annex
| FISCAL PLAN 2018 – 21 • TAX PLAN | 116 |
| Table of Contents | ||||
| TAX PLAN | ||||
Overview | 118 | |||
Supporting Jobs and Investment | 119 | |||
Supporting Alberta Families | 120 | |||
Cannabis | 123 | |||
Education Property Tax | 124 | |||
| ANNEX | ||||
Alberta Non-Refundable Tax Credit Block | 125 | |||
Indexation of Alberta’s Personal Income Tax | 125 | |||
2018-19 Tax and Levy Revenue | 126 | |||
2018-19 Tax and Levy Revenue Sources | 127 | |||
2018 Tax Expenditure Estimates | 128 | |||
Interprovincial Tax Comparison, 2018 | 129 | |||
Major Provincial Tax Rates, 2018 | 130 | |||
| FISCAL PLAN 2018 – 21 • TAX PLAN | 117 |
Tax Plan
Overview
This budget maintains a competitive tax system that encourages investment, promotes economic diversification and continues to help make life more affordable for Albertans. Highlights of Budget 2018 include:
| ∎ | A new Interactive Digital Media Tax Credit, worth 25% of eligible labour costs. |
| ∎ | An extension of the Alberta Investor Tax Credit and Capital Investment Tax Credit to 2021-22. |
| ∎ | Indexation of the personal income tax system, saving Albertans $65 million in 2018. |
| ∎ | Holding the total amount collected from education property taxes steady at the 2017-18 level. |
| ∎ | Confirmation of the tax revenue collection mechanism for cannabis. |
Alberta continues to have an overall tax advantage compared to other provinces, with no sales tax, no health premium and no payroll tax. Albertans and Alberta businesses would pay at least $11.2 billion more in taxes and carbon charges if Alberta had the same taxes and carbon charges as any other province.
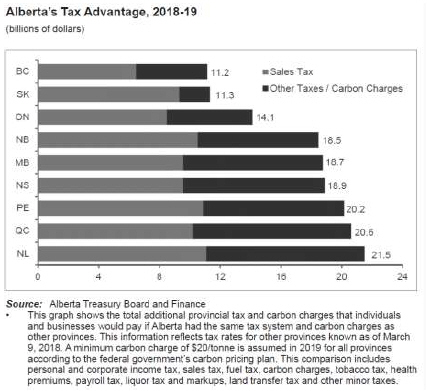
Alberta’s tax advantage is
$11.2 billion in 2018-19.
| FISCAL PLAN 2018 – 21 • TAX PLAN | 118 |
The new tax credit for
development of interactive digital
media will reimburse 25% of
eligible labour costs.
Supporting Jobs and Investment
INTERACTIVE DIGITAL MEDIA TAX CREDIT
As announced in Bill 2: Growth and Diversification Act, the government has introduced the Interactive Digital Media Tax Credit to support Alberta’s interactive digital media sector. This refundable tax credit is intended to improve Alberta’s ability to attract and retain employment and investment in this growing global industry.
The tax credit will provide eligible interactive digital media companies with a benefit worth 25% of eligible labour costs incurred after April 1, 2018. A diversity and inclusion credit enhancement, worth up to an additional 5%, will be available to companies that employ workers from under-represented groups. Further details on the enhancement will be provided when the regulations are brought forward.
The credit, which has a funding cap of $20 million per year, is estimated to provide $13 million of support in 2018-19, and $16 million in 2019-20. Program and application details will be available by summer 2018.
INVESTOR AND INVESTMENT TAX CREDITS
The Alberta Investor Tax Credit (AITC) provides a 30% tax credit to individual and corporate investors who make equity investments in eligible Alberta businesses that undertake research, development or commercialization of new technology, products or processes. It is also available to businesses engaged in interactive digital media development, video post-production, digital animation or tourism. The credit was planned to operate for three years. To continue supporting investment in non-traditional sectors, the credit will be extended until 2021-22, with annual support averaging about $30 million going forward.
Investors will also be eligible to receive an additional 5% credit if they invest in eligible business corporations that meet diversity and inclusion criteria. Details on the new diversity and inclusion credit requirements will be provided when the corresponding regulations are introduced. The overall maximums for the AITC remain the same, with individual investors still limited to claiming a maximum of $60,000 in one year, up to $300,000 over five years.
The Capital Investment Tax Credit (CITC) provides a 10% non-refundable tax credit of up to $5 million for a corporation’s eligible capital expenditures on manufacturing, processing and tourism infrastructure. The CITC was planned to operate for two years. To continue to encourage companies to invest in Alberta, the credit will be extended until 2021-22, with annual support averaging about $30 million going forward.
| FISCAL PLAN 2018 – 21 • TAX PLAN | 119 |
SMALL BUSINESS
Alberta’s small business corporate income tax rate is 2%, tied for second-lowest among provinces. Alberta continues to have the most competitive overall tax environment for small business owners, with no payroll or sales tax, and no health premium. When all taxes are taken into consideration, Alberta small business owners are better-off than they would be in other provinces.
Provincial Small Business Tax Rates, 2018
| Province | AB | BC | SK | MB | ON | QC | NB | NS | PE | NL | ||||||||||
Rate (%) | 2.0 | 2.0 | 0.0 | 3.5 | 8.0 | 3.0 | 3.0 | 4.5 | 3.0 |
| • | Rates for other provinces known as of March 9, 2018. |
Supporting Alberta Families
The government is committed to making life better for everyday Albertans. This includes a tax system that supports lower and middle-income families by keeping their taxes low, and providing significant children’s benefits and a carbon levy rebate.
Alberta’s tax system is also annually indexed to inflation to ensure that the value of Alberta’s basic non-refundable tax credits is not eroded over time, and that taxpayers are not pushed into higher tax brackets. Credit amounts and bracket thresholds will rise by 1.2% in 2018, saving Albertans roughly $65 million (see page 131 for more information).
NON-REFUNDABLE TAX CREDITS
Alberta’s high tax credit amounts allow individuals to earn more before they have to pay provincial income tax. Basic personal and spousal amounts are $18,915 each in 2018, the highest among provinces. After taking into account the most commonly claimed non-refundable tax credits and refundable children’s credits:
| ∎ | A working single individual can earn at least $20,068 before paying provincial income tax. |
| ∎ | A working single parent with two children can earn at least $51,969 before paying provincial income tax. |
| ∎ | A senior couple can make up to $51,283 before paying provincial income tax. |
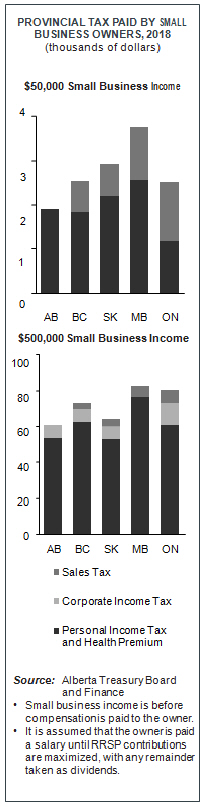
| FISCAL PLAN 2018 – 21 • TAX PLAN | 120 |
The ACB and AFETC will provide
$328 million to Alberta familie
$525 million in carbon
levy rebates will be
distributed to Alberta
households.
BENEFITS FOR LOWER AND MIDDLE-INCOME FAMILIES
In 2018-19, lower and middle-income families with children will receive $328 million in direct financial support through the Alberta Child Benefit (ACB) and the Alberta Family Employment Tax Credit (AFETC).
Alberta Family Employment Tax Credit (AFETC) and Alberta Child
Benefit (ACB) Program Parameters, 2018-19
Program Parameters
|
Support for Alberta’s Families
| |||||||
AFETC
|
ACB
| |||||||
Benefit amounts | ||||||||
1 child | $783 | $1,128 | ||||||
2 children | $1,495 | $1,692 | ||||||
3 children | $1,922 | $2,256 | ||||||
4 or more children | $2,064 | $2,820 | ||||||
Income phase-in threshold | $2,760 | n/a | ||||||
Phase-in rate | 11.0% | n/a | ||||||
Income phase-out threshold | $42,287 | $26,141 | ||||||
Phase-out rates | ||||||||
1 child | 4.0% | 7.0% | ||||||
2 children | 4.0% | 10.5% | ||||||
3 children | 4.0% | 14.0% | ||||||
4 or more children
|
| 4.0%
|
|
| 17.5%
|
| ||
• AFETC benefits are phased in on family working income. ACB and AFETC benefits are both phased out on family net income.
| ∎ | An estimated 120,000 families will receive about $175 million in benefits in 2018-19 through the ACB, a benefit provided to families with an annual family net income below $42,255. A family with one child could receive up to $1,128 in the 2018-19 benefit year, while a family with two children could receive as much as $1,692. |
| ∎ | An estimated 180,000 families will receive about $153 million in benefits in 2018-19 through the AFETC, a tax credit targeted towards working families with annual employment income over $2,760. A family with one child could receive up to $783 in the 2018-19 benefit year, while a family with two children could receive as much as $1,495. |
These two credits are refundable, meaning recipients do not have to pay taxes to receive them. As with personal tax credits, benefit amounts are also annually indexed to inflation and will rise 1.2% for the 2018-19 benefit year.
Lower and middle-income households also benefit from the Alberta Climate Leadership Adjustment Rebate, which helps protect them from the costs of the carbon levy. In 2018, the rebate is worth up to $300 for singles, $450 for couples and $540 for couples with two children ($45 per child to a maximum of four children). An estimated 1.2 million households will receive a rebate in 2018-19, with total benefits estimated at $525 million.
| FISCAL PLAN 2018 – 21 • TAX PLAN | 121 |
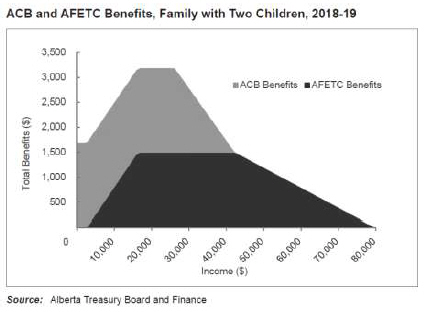
These programs provide significant support to many individuals and families, helping them make ends meet. For example, a single parent with two children earning $16,500 a year through a part-time job would receive $3,682 from these three programs, a boost to their income of over 20%.
Alberta Climate Leadership Adjustment Rebate Parameters, 2018-19
Benefit Amounts | ||||
First adult | $300 | |||
Spouse/equivalent to spouse | $150 | |||
Each child (max. 4) | $45 | |||
Phase-out Thresholds (Family Net Income) | ||||
Single | $47,500 | |||
Couples & families | $95,000 | |||
Income at which Rebate is Fully Phased Out (Family Net Income) | ||||
Single | $55,000 | |||
Couple | $103,750 | |||
Couple with 2 children | $106,000 | |||
Couple with 4 children | $108,250 | |||
Phase-out Rates | ||||
Single | 2.67% | |||
Couples & families
|
| 4.00%
|
| |
| • | Equivalent to spouse includes a common-law partner as reported on income tax forms, or the first child in single-parent households. |
| • | Households with income at or below the phase-out threshold receive the full rebate amount. |
| FISCAL PLAN 2018 – 21 • TAX PLAN | 122 |
Alberta will work to drive out the
illegal cannabis market by keeping
prices as low as possible.
A coordinated approach to
cannabis taxation helps keep
prices consistent and lowers costs
for the province and
Alberta businesses.
Cannabis
Alberta will collect revenue on the sale of cannabis when it is legalized in 2018. In December 2017, federal and provincial governments agreed to a common set of principles that would cover the first two years of legalization. These principles focus on coordinating cannabis taxation and revenue, and keeping cannabis prices low to curtail the illegal market.
Under these principles, tax room of $1 per gram or 10% of the producer price, whichever is greater, will be shared between federal and provincial governments. The provinces will receive 75% of this tax room, and can also collect an additional tax, or equivalent, of up to 10% of the retail price.
Alberta agrees to have the federal government use the federal excise tax to collect the following amounts on the province’s behalf:
| ∎ | The province’s share of the agreed-upon tax room, which is the greater of 75 cents per gram or 7.5% of the producer price; |
| ∎ | An additional amount equivalent to 10% of the retail price, similar to what will be applied in other provinces. This amount will be collected at the licensed producer level. |
Consistent taxation and pricing across the country will help push out the illegal market. Federal collection of these amounts also minimizes administration costs to the provincial government and compliance costs to business.
The amounts collected on Alberta’s behalf will be distributed to the province. Revenue for Alberta under the federal-provincial agreement is estimated to be $26 million in 2018-19 and $80 million in 2019-20. Revenue is expected to grow as the legal market gradually takes market share away from the illegal market.
The Alberta Gaming and Liquor Commission (AGLC) will also be able to collect a markup on wholesale distribution and on retail sales made through the public online system. As agreed to by Finance Ministers, these markups are limited to covering the costs of AGLC’s cannabis operations and a reasonable profit margin. See the Revenue Chapter (page 43) for more information.
| FISCAL PLAN 2018 – 21 • TAX PLAN | 123 |
Education Property Tax
Revenue from the education property tax is a stable source of funding for Alberta’s education system, helping to ensure students have the best education possible.
The total education property tax requisition will be frozen for 2018-19 to help make life more affordable for Albertans. While the amount of tax collected is frozen, the residential/farmland rate will go from $2.48 to $2.56 per $1,000 of equalized assessment and the non-residential rate will go from $3.64 to $3.76 due to lower assessed values in 2016. This revenue will fund about 31% of education operating costs, which is lower than the 32% of education operating costs funded annually from 2013-14 to 2016-17.
The provincial government’s share of total provincial-municipal property tax revenue collected continues to fall, from 51% in 1994 (when the provincial government assumed responsibility for the tax) to 25% in 2016.
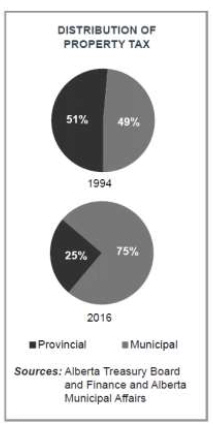
| FISCAL PLAN 2018 – 21 • TAX PLAN | 124 |
Annex
Alberta Non-Refundable Tax Credit Block
(dollars)
2017
|
2018
| |||||||||||||||
| Maximum Amount |
Reduction in
| Maximum Amount |
Reduction in
| |||||||||||||
Basic personal amount | 18,690 | 1,869 | 18,915 | 1,892 | ||||||||||||
Spousal amount | 18,690 | 1,869 | 18,915 | 1,892 | ||||||||||||
Eligible dependant amount | 18,690 | 1,869 | 18,915 | 1,892 | ||||||||||||
Age amount | 5,208 | 521 | 5,271 | 527 | ||||||||||||
Infirm dependant amount | 10,820 | 1,082 | 10,949 | 1,095 | ||||||||||||
CPP contributions | 2,564 | 256 | 2,594 | 259 | ||||||||||||
EI premiums | 836 | 84 | 858 | 86 | ||||||||||||
Pension income amount | 1,439 | 144 | 1,456 | 146 | ||||||||||||
Disability amount | 14,417 | 1,442 | 14,590 | 1,459 | ||||||||||||
Disability supplement | 10,819 | 1,082 | 10,949 | 1,095 | ||||||||||||
Tuition and education amounts | Variable | Variable | Variable | Variable | ||||||||||||
Adoption expenses | 12,783 | 1,278 | 12,936 | 1,294 | ||||||||||||
Medical expenses | Variable | Variable | Variable | Variable | ||||||||||||
Medical expenses (other dependants) | Variable | Variable | Variable | Variable | ||||||||||||
Caregiver amount | 10,819 | 1,082 | 10,949 | 1,095 | ||||||||||||
Interest on student loans | Variable | Variable | Variable | Variable | ||||||||||||
Donations and gifts | ||||||||||||||||
first $200 | 200 | 20 | 200 | 20 | ||||||||||||
over $200
|
| 75% of income
|
|
| Variable
|
|
| 75% of income
|
|
| Variable
|
| ||||
| • | In general, credit amounts are multiplied by 10% to arrive at the reduction in Alberta tax. In the case of total donations and gifts over $200, the credit rate is 21%. |
Indexation of Alberta’s Personal Income Tax Brackets
Bracket
|
Tax Rate (%)
|
Income Bracket
| ||||
2017
|
2018
| |||||
1 | 10 | Up to $126,625 | Up to $128,145 | |||
2 | 12 | $126,625.01 to $151,950 | $128,145.01 to $153,773 | |||
3 | 13 | $151,950.01 to $202,600 | $153,773.01 to $205,031 | |||
4 | 14 | $202,600.01 to $303,900 | $205,031.01 to $307,547 | |||
5 | 15 | $303,900.01 and up | $307,547.01 and up | |||
| FISCAL PLAN 2018 – 21 • TAX PLAN | 125 |
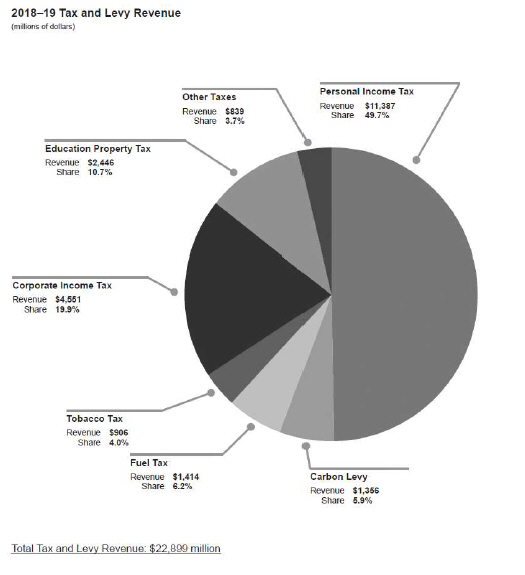
| FISCAL PLAN 2018 – 21 • TABLES | 126 |
2018–19 Tax and Levy Revenue Sources
(millions of dollars)
| Tax/Levy | Total Revenue | Rate | Revenue per Unit | |||||
1. | Personal Income Tax | 11,387 | ||||||
All taxable income | 10,623 | 10% of all taxable income | 1,062.3 per point | |||||
Taxable income > $128,145 | 764 | multiple rates | n/a | |||||
2. | Corporate Income Tax | 4,551 | ||||||
General | 4,171 | 12.0% | 347.6 per point | |||||
Small business | 380 | 2.0% | 190.0 per point | |||||
3. | Education Property Tax | 2,446 | ||||||
Residential/farmland property | 1,517 | $2.56 / $1,000 of assessment | 592.6 per mill | |||||
Non-residential property | 929 | $3.76 / $1,000 of assessment | 247.1 per mill | |||||
4. | Tobacco Tax | 906 | $50/carton | 18.1 per $/carton | ||||
5. | Fuel Tax | 1,414 | ||||||
Gasoline | 797 | 13.0 ¢/litre | 61.3 per ¢/litre | |||||
Diesel | 582 | 13.0 ¢/litre | 44.8 per ¢/litre | |||||
Locomotive | 18 | 5.5 ¢/litre | 3.3 per ¢/litre | |||||
Aviation | 13 | 1.5 ¢/litre | 8.7 per ¢/litre | |||||
Propane | 5 | 9.4 ¢/litre | 0.5 per ¢/litre | |||||
6. | Carbon Levy | 1,356 | multiple rates | n/a | ||||
7. | Freehold Mineral Rights Tax | 87 | n/a | n/a | ||||
8. | Insurance Tax | 641 | ||||||
Life, accident, sickness | 199 | 3.0% of premium | 66.3 per point | |||||
Other | 443 | 4.0% of premium | 110.8 per point | |||||
9. Tourism Levy | 85 | 4.0% | 21.3 per point | |||||
10. Cannabis Tax | 26 | multiple rates | n/a | |||||
| • | Numbers may not add due to rounding. |
| FISCAL PLAN 2018 – 21 • TABLES | 127 |
2018 Tax Expenditure Estimates
(millions of dollars)
Personal Income Tax
Federal Measures Paralleled by Alberta
Workers’ compensation payments exemption | 21.6 | |||||||
Social assistance payments exemption | 10.1 | |||||||
Union and professional dues deduction | 46.4 | |||||||
Child care expense deduction | 61.9 | |||||||
Moving expense deduction | 6.9 | |||||||
Flow-through share deduction | 15.6 | |||||||
Capital gains inclusion rate (50%) | 393.2 | |||||||
Lifetime capital gains exemption | 131.6 | |||||||
Security options deduction | 70.7 | |||||||
Northern residents deduction | 29.0 | |||||||
Provincial Measures | ||||||||
Basic personal amount | 4,762.0 | |||||||
Spousal amount | 309.6 | |||||||
Eligible dependant amount | 97.7 | |||||||
Age amount | 104.0 | |||||||
Pension income amount | 47.9 | |||||||
Caregiver amount | 20.7 | |||||||
Disability amount | 47.3 | |||||||
Disability amount transferred from a dependant | 44.7 | |||||||
Interest paid on student loans | 3.5 | |||||||
Tuition and education amounts | 150.8 | |||||||
Tuition and education amounts transferred from a child | 33.4 | |||||||
Amounts transferred from a spouse or common-law partner | 24.9 | |||||||
Medical expenses | 70.4 | |||||||
Donations and gifts | 315.9 | |||||||
Political contributions tax credit | 3.6 | |||||||
Corporate Income Tax | ||||||||
Small business rate | 1,900.0 | |||||||
Donations and gifts | 36.0 | |||||||
Capital Investment Tax Credit (CITC) | 35.5 | |||||||
Alberta Investor Tax Credit (AITC) | 12.7 | |||||||
Fuel Tax | ||||||||
Tax Exempt Fuel User program (marked fuel for off-road use) | 188.5 | |||||||
Alberta Farm Fuel Benefit (marked fuel) | 63.5 | |||||||
Reduced rate for locomotive fuel | 25.0 | |||||||
Exemption for aviation fuel used on international flights | 6.0 | |||||||
Transfers Through the Tax System a | ||||||||
Alberta Family Employment Tax Credit (AFETC) | 152.7 | |||||||
Alberta Child Benefit (ACB) | 175.0 | |||||||
Alberta Climate Leadership Adjustment Rebate (ACLAR) | 525.0 | |||||||
Alberta Investor Tax Credit (AITC) | 17.8 | |||||||
Scientific Research and Experimental Development (SR&ED) Tax Credit | 78.0 | |||||||
Interactive Digital Media Tax Credit (IDMTC) | 13.0 |
Generally, estimates cannot be added together to determine the fiscal impact of concurrently eliminating multiple tax expenditures.
| a | Transfers through the tax system are reported in ministries’ operating expense. Amounts for the AFETC, ACLAR, and SR&ED are reported by Treasury Board and Finance. The amount for the ACB is reported by Children’s Services and the amounts for the AITC and the IDMTC are reported by Economic Development and Trade. |
| FISCAL PLAN 2018 – 21 • TABLES | 128 |
Interprovincial Tax Comparison, 2018
(dollars)
| AB | BC | SK | MB | ON | QC | NB | NS | PE | NL | |||||||||||||||||||||||||||||||||||
Employment Income of $35,000 – One Income Couple with Two Children |
| |||||||||||||||||||||||||||||||||||||||||||
Provincial income tax | (2,221 | ) | 631 | (890 | ) | (98 | ) | (2,585 | ) | (5,563 | ) | 628 | 1,184 | 1,462 | 288 | |||||||||||||||||||||||||||||
Provincial sales tax | - | 842 | 898 | 1,437 | 737 | 989 | 1,421 | 2,170 | 1,977 | 1,328 | ||||||||||||||||||||||||||||||||||
Health premium | - | - | - | - | 300 | - | - | - | - | - | ||||||||||||||||||||||||||||||||||
Payroll tax | - | - | - | 421 | 439 | 896 | - | - | - | 357 | ||||||||||||||||||||||||||||||||||
Fuel tax | 390 | 435 | 450 | 420 | 441 | 576 | 465 | 465 | 393 | 615 | ||||||||||||||||||||||||||||||||||
Net carbon charges | (133 | ) | 55 | - | - | - | - | - | - | - | - | |||||||||||||||||||||||||||||||||
Total | (1,964 | ) | 1,963 | 458 | 2,180 | (668 | ) | (3,102 | ) | 2,514 | 3,819 | 3,832 | 2,588 | |||||||||||||||||||||||||||||||
Alberta Tax Advantage | 3,927 | 2,422 | 4,144 | 1,296 | (1,138 | ) | 4,478 | 5,783 | 5,796 | 4,552 | ||||||||||||||||||||||||||||||||||
Employment Income of $75,000 – One Income Couple with Two Children |
| |||||||||||||||||||||||||||||||||||||||||||
Provincial income tax | 2,365 | 3,113 | 2,705 | 4,527 | 3,185 | 1,228 | 5,952 | 6,804 | 6,571 | 6,101 | ||||||||||||||||||||||||||||||||||
Provincial sales tax | - | 1,083 | 1,151 | 1,837 | 2,068 | 2,963 | 2,694 | 2,780 | 2,788 | 2,804 | ||||||||||||||||||||||||||||||||||
Health premium | - | 900 | - | - | 600 | - | - | - | - | - | ||||||||||||||||||||||||||||||||||
Payroll tax | - | - | - | 903 | 940 | 1,920 | - | - | - | 764 | ||||||||||||||||||||||||||||||||||
Fuel tax | 390 | 435 | 450 | 420 | 441 | 576 | 465 | 465 | 393 | 615 | ||||||||||||||||||||||||||||||||||
Net carbon charges | (133 | ) | 393 | - | - | - | - | - | - | - | - | |||||||||||||||||||||||||||||||||
Total | 2,622 | 5,924 | 4,306 | 7,687 | 7,234 | 6,687 | 9,111 | 10,049 | 9,752 | 10,284 | ||||||||||||||||||||||||||||||||||
Alberta Tax Advantage | 3,302 | 1,684 | 5,065 | 4,612 | 4,065 | 6,489 | 7,427 | 7,130 | 7,662 | |||||||||||||||||||||||||||||||||||
Employment Income of $100,000 – Two Income Couple with Two Children |
| |||||||||||||||||||||||||||||||||||||||||||
Provincial income tax | 4,625 | 3,579 | 4,350 | 6,358 | 3,653 | 4,180 | 6,828 | 7,482 | 7,681 | 6,696 | ||||||||||||||||||||||||||||||||||
Provincial sales tax | - | 1,301 | 1,362 | 2,183 | 2,496 | 3,503 | 3,406 | 3,383 | 3,377 | 3,410 | ||||||||||||||||||||||||||||||||||
Health premium | - | 900 | - | - | 900 | - | - | - | - | - | ||||||||||||||||||||||||||||||||||
Payroll tax | - | - | - | 1,204 | 1,254 | 2,559 | - | - | - | 1,019 | ||||||||||||||||||||||||||||||||||
Fuel tax | 585 | 653 | 675 | 630 | 662 | 864 | 698 | 698 | 590 | 923 | ||||||||||||||||||||||||||||||||||
Net carbon charges | (32 | ) | 506 | - | - | - | - | - | - | - | - | |||||||||||||||||||||||||||||||||
Total | 5,178 | 6,939 | 6,387 | 10,375 | 8,965 | 11,106 | 10,932 | 11,563 | 11,648 | 12,048 | ||||||||||||||||||||||||||||||||||
Alberta Tax Advantage | 1,761 | 1,209 | 5,197 | 3,787 | 5,928 | 5,754 | 6,385 | 6,470 | 6,870 | |||||||||||||||||||||||||||||||||||
Employment Income of $200,000 – Two Income Couple with Two Children |
| |||||||||||||||||||||||||||||||||||||||||||
Provincial income tax | 13,027 | 10,944 | 14,688 | 19,120 | 12,632 | 19,394 | 19,406 | 21,467 | 20,756 | 19,287 | ||||||||||||||||||||||||||||||||||
Provincial sales tax | - | 2,148 | 2,207 | 3,478 | 4,127 | 5,693 | 5,493 | 5,424 | 5,448 | 5,497 | ||||||||||||||||||||||||||||||||||
Health premium | - | 900 | - | - | 1,350 | - | - | - | - | - | ||||||||||||||||||||||||||||||||||
Payroll tax | - | - | - | 2,408 | 2,507 | 5,119 | - | - | - | 2,038 | ||||||||||||||||||||||||||||||||||
Fuel tax | 585 | 653 | 675 | 630 | 662 | 864 | 698 | 698 | 590 | 923 | ||||||||||||||||||||||||||||||||||
Net carbon charges | 508 | 506 | - | - | - | - | - | - | - | - | ||||||||||||||||||||||||||||||||||
Total | 14,120 | 15,151 | 17,570 | 25,636 | 21,278 | 31,070 | 25,597 | 27,589 | 26,794 | 27,745 | ||||||||||||||||||||||||||||||||||
Alberta Tax Advantage | 1,031 | 3,450 | 11,516 | 7,158 | 16,950 | 11,477 | 13,469 | 12,674 | 13,625 | |||||||||||||||||||||||||||||||||||
Calculations are based on other provinces’ tax parameters known as of March 9, 2018.
| • | Health premiums are assumed to be borne by individuals. In provinces that impose payroll taxes, 75% is assumed to be borne by employees and 25% by employers. |
| • | Fuel tax is based on estimated consumption of 3,000 litres of gasoline per year for one-income families and 4,500 litres of gasoline for two--income families. |
| • | Carbon charges are based on the fuel tax gasoline consumption assumptions and natural gas consumption of 135 GJ/year for a family of four. |
| • | Only direct carbon charges are applied and are net of related credit programs (e.g. ACLAR). Cap-and-trade systems such as those in place in Ontario and Quebec are not included. |
| • | RRSP/RPP contributions of $0, $6,000, $10,000 and $25,000 are included in the calculation of personal income tax for the $35,000, $75,000, $100,000 and $200,000 families, respectively. |
| • | For two-income families, income and RRSP/RPP contributions are split 60/40 between the couple. |
| • | The children are assumed to be 6 and 12 years old. |
| FISCAL PLAN 2018 – 21 • TABLES | 129 |
Major Provincial Tax Rates, 2018
| AB | BC | SK | MB | ON | QC | NB | NS | PE | NL | |||||||||||||||||||||||||||||||||||
Personal Income Tax | ||||||||||||||||||||||||||||||||||||||||||||
Statutory rate range | (%) | 10.00 | 5.06 | 10.50 | 10.80 | 5.05 | 15.00a | 9.68 | 8.79 | 9.80 | 8.70 | |||||||||||||||||||||||||||||||||
highest rate | (%) | 15.00 | 16.80 | 14.50 | 17.40 | 13.16 | 25.75a | 20.30 | 21.00 | 16.70 | 18.30b | |||||||||||||||||||||||||||||||||
Surtax | (%) | - | - | - | - | 20/36c | - | - | - | 10.00 | - | |||||||||||||||||||||||||||||||||
Combined federal/provincial | (%) | 48.00 | 49.80 | 47.50 | 50.40 | 53.53 | 53.31 | 53.30 | 54.00 | 51.37 | 51.30 | |||||||||||||||||||||||||||||||||
Personal amount | ($) | 18,915 | 10,412 | 16,065 | 9,382 | 10,354 | 15,012 | 10,043 | 8,481e | 8,160 | 9,247 | |||||||||||||||||||||||||||||||||
Spousal amount | ($) | 18,915 | 8,915 | 16,065 | 9,134 | 8,792 | 15,012f | 8,528 | 8,481 | 6,931 | 7,556 | |||||||||||||||||||||||||||||||||
Corporate Income Tax | ||||||||||||||||||||||||||||||||||||||||||||
General rate | (%) | 12.0 | 12.0 | 12.0 | 12.0 | 11.5 | 11.7 | 14.0 | 16.0 | 16.0 | 15.0 | |||||||||||||||||||||||||||||||||
M&P rate | (%) | 12.0 | 12.0 | 10.0 | 12.0 | 10.0 | 11.7 | 14.0 | 16.0 | 16.0 | 15.0 | |||||||||||||||||||||||||||||||||
Small business | (%) | 2.0 | 2.0 | 2.0 | 0.0 | 3.5 | 8.0 | 3.0 | 3.0 | 4.5 | 3.0 | |||||||||||||||||||||||||||||||||
threshold | ($000) | 500 | 500 | 600 | 450 | 500 | 500 | 500 | 500 | 500 | 500 | |||||||||||||||||||||||||||||||||
Capital Tax | ||||||||||||||||||||||||||||||||||||||||||||
Financial institutions | (max.%) | - | - | 4.0 | 6.0 | - | - | 5.0 | 4.0 | 5.0 | 6.0 | |||||||||||||||||||||||||||||||||
Sales Tax | (%) | - | 7.0 | 6.0 | 8.0 | 8.0 | 9.975 | 10.0 | 10.0 | 10.0 | 10.0 | |||||||||||||||||||||||||||||||||
Gasoline Tax | (¢/litre) | 13.0 | 14.5g | 15.0 | 14.0 | 14.7h | 19.2h,i | 15.5h | 15.5h | 13.1h | 20.5h | |||||||||||||||||||||||||||||||||
Carbon Chargej | ||||||||||||||||||||||||||||||||||||||||||||
Gasoline | (¢/litre) | 6.73 | 6.67k | - | - | - | - | - | - | - | - | |||||||||||||||||||||||||||||||||
Natural gas | ($/GJ) | 1.517 | 1.4898k | - | - | - | - | - | - | - | - | |||||||||||||||||||||||||||||||||
Tobacco Tax | ($/carton) | 50.00 | 55.00l | 54.00h | 59.00h | 36.95h,l | 29.80 | 51.04h | 55.04h | 50.00h | 49.00h | |||||||||||||||||||||||||||||||||
Payroll Tax | (max.%) | - | - m | - | 2.15 | 1.95 | 4.26m | - | - | - | 2.00 | |||||||||||||||||||||||||||||||||
Rates for other provinces known as of March 9, 2018.
| a | Quebec residents receive an abatement of 16.5% of basic federal tax because of the province’s decision to opt out of federal cash transfers in support of provincial programs. |
| b | Residents of Newfoundland and Labrador with taxable income of more than $50,000 are also required to pay a Temporary Deficit Reduction Levy of up to $1,800 until 2019. |
| c | Ontario levies a two-tiered surtax, collecting 20% of basic tax in excess of $4,638 and an additional 36% of basic tax in excess of $5,936. |
| d | The top federal personal income tax rate is 33%, except in Quebec where the top federal rate is 27.56% because of the federal abatement. |
| e | Lower and middle income earners in Nova Scotia receive a supplement to the basic personal amount of up to $3,000 (with similar increases to the spousal and eligible dependant amounts). |
| f | After accounting for non-refundable tax credits in the calculation of the individual’s income tax, unused tax credits may be transferred from one spouse to another. |
| g | An additional 11¢/litre is imposed in the greater Vancouver area. Effective April 1, 2018, the additional rate in the Victoria area will increase from 3.5¢/litre to 5.5¢/litre. |
| h | These provinces apply their PST or the provincial portion of their HST on the retail price of the good inclusive of excise taxes. |
| i | An additional 3¢/litre is imposed in the Montreal area. |
| j | Only legislated carbon levy and tax rates are included in this table. Provincial cap-and-trade programs are excluded. It is estimated that cap-and trade adds approximately 4.3¢/litre to the price of fuel in Ontario and Quebec. |
| k | BC’s rates are slightly lower than Alberta’s because Alberta’s rates are based on updated Environment Canada emission factors. Beginning April 1, 2018 and for the following three years, BC’s carbon tax will be increased annually by $5 per tonne of CO2-equivalent emissions. New rates reflecting the 2018 increase have not been included because rates for specific fuels have not been announced. |
| l | BC’s tax on a carton of cigarettes will increase from $49.40 to $55.00 on April 1, 2018. Ontario announced that its tax on a carton of cigarettes will be increased from $32.95 to $36.95 in 2018, but has not announced the exact date of the increase. |
| m | BC will introduce a 1.95% payroll tax in 2019. Quebec levies an additional temporary payroll tax of 4.48% on wages and salaries paid by financial institutions. |
| FISCAL PLAN 2018 – 21 • TABLES | 130 |
Fiscal Plan
Tables
| FISCAL PLAN 2018 – 21 • TABLES | 131 |
Table of Contents
FISCAL PLAN TABLES
Statement of Operations | 133 | |||
Consolidated Fiscal Summary | 134 | |||
Revenue | 136 | |||
Operating Expense | 137 | |||
Debt Servicing Costs | 137 | |||
Climate Leadership Plan | 138 | |||
Disaster / Emergency Assistance | 138 | |||
Capital Amortization | 139 | |||
Inventory Consumption | 139 | |||
Inventory Acquisition | 139 | |||
Capital Plan | 140 | |||
Capital Grants | 140 | |||
Capital Investment | 141 | |||
Capital Plan Funding Sources | 141 | |||
Capital Plan Liability / Fiscal Plan Borrowing Principal Repayments | 141 | |||
Balance Sheet Details | 142 | |||
Financing Requirements | 143 | |||
Pension Liabilities | 143 | |||
Cash Adjustments | 144 | |||
Capital Assets | 144 | |||
Full-Time Equivalents | 145 | |||
Expense by Function | 146 | |||
Expense by Object | 147 | |||
Changes to Fees | 148 | |||
Allocation of 2018 –19 Lottery Fund Revenue | 149 | |||
Historical Fiscal Summary, 2008–09 to 2020–21 | 150 | |||
NOTE: Amounts presented in tables may not add to totals due to rounding.
| FISCAL PLAN 2018 – 21 • TABLES | 132 |
Statement of Operations
(millions of dollars)
| 2016-17 | 2017-18 | 2018-19 | 2019-20 | 2020-21 | ||||||||||||||||||||
| Actual | Budget | Forecast | Estimate | Target | Target | |||||||||||||||||||
Revenue | ||||||||||||||||||||||||
Personal income tax | 10,763 | 11,177 | 10,855 | 11,387 | 11,984 | 12,635 | ||||||||||||||||||
Corporate income tax | 3,769 | 3,918 | 3,852 | 4,551 | 5,293 | 5,719 | ||||||||||||||||||
Other taxes | 5,649 | 6,667 | 6,504 | 6,961 | 7,271 | 7,641 | ||||||||||||||||||
Non-renewable resource revenue | 3,097 | 3,754 | 4,534 | 3,829 | 4,183 | 5,001 | ||||||||||||||||||
Transfers from Government of Canada | 7,979 | 7,988 | 7,918 | 8,218 | 8,470 | 8,645 | ||||||||||||||||||
Investment income | 3,698 | 2,193 | 3,061 | 2,884 | 3,161 | 3,357 | ||||||||||||||||||
Net income from govt. business enterprises | 543 | 2,506 | 3,294 | 2,777 | 2,707 | 2,844 | ||||||||||||||||||
Premiums, fees and licences | 3,701 | 3,683 | 3,742 | 3,854 | 3,929 | 3,996 | ||||||||||||||||||
Other | 3,094 | 3,032 | 3,121 | 3,419 | 3,617 | 4,010 | ||||||||||||||||||
Total Revenue | 42,293 | 44,918 | 46,881 | 47,879 | 50,615 | 53,848 | ||||||||||||||||||
Expense a | ||||||||||||||||||||||||
Advanced Education | 5,857 | 5,991 | 5,973 | 6,142 | 6,316 | 6,530 | ||||||||||||||||||
Agriculture and Forestry | 1,585 | 1,095 | 1,529 | 1,103 | 1,121 | 1,113 | ||||||||||||||||||
Children’s Services | 1,291 | 1,371 | 1,464 | 1,509 | 1,547 | 1,580 | ||||||||||||||||||
Community and Social Services | 3,258 | 3,330 | 3,502 | 3,661 | 3,823 | 3,940 | ||||||||||||||||||
Culture and Tourism | 336 | 348 | 372 | 381 | 353 | 353 | ||||||||||||||||||
Economic Development and Trade | 270 | 345 | 314 | 289 | 274 | 298 | ||||||||||||||||||
Education | 8,120 | 8,216 | 8,202 | 8,356 | 8,600 | 8,825 | ||||||||||||||||||
Energy | 477 | 695 | 505 | 670 | 522 | 521 | ||||||||||||||||||
Environment and Parks | 458 | 559 | 629 | 526 | 540 | 527 | ||||||||||||||||||
Executive Council | 18 | 19 | 18 | 19 | 19 | 19 | ||||||||||||||||||
Health | 20,655 | 21,449 | 21,423 | 22,057 | 22,739 | 23,435 | ||||||||||||||||||
Indigenous Relations | 184 | 188 | 179 | 190 | 188 | 187 | ||||||||||||||||||
Infrastructure | 619 | 694 | 667 | 670 | 677 | 688 | ||||||||||||||||||
Justice and Solicitor General | 1,400 | 1,407 | 1,445 | 1,473 | 1,494 | 1,517 | ||||||||||||||||||
Labour | 185 | 196 | 198 | 223 | 233 | 239 | ||||||||||||||||||
Municipal Affairs | 2,426 | 1,713 | 2,517 | 1,150 | 1,151 | 1,550 | ||||||||||||||||||
Seniors and Housing | 722 | 682 | 714 | 683 | 699 | 706 | ||||||||||||||||||
Service Alberta | 435 | 459 | 471 | 511 | 500 | 474 | ||||||||||||||||||
Status of Women | 7 | 7 | 7 | 7 | 7 | 7 | ||||||||||||||||||
Transportation | 1,301 | 2,286 | 2,089 | 1,477 | 1,366 | 1,246 | ||||||||||||||||||
Treasury Board and Finance | 1,378 | 1,586 | 1,595 | 1,626 | 1,653 | 1,674 | ||||||||||||||||||
Legislative Assembly | 119 | 130 | 124 | 165 | 158 | 133 | ||||||||||||||||||
2013 Alberta flood assistance | 123 | 53 | 22 | 24 | - | - | ||||||||||||||||||
Climate Leadership Plan | 1,381 | 936 | 968 | 1,458 | 1,578 | 1,484 | ||||||||||||||||||
Operating expense in-year savings | - | (200 | ) | - | - | - | - | |||||||||||||||||
Unallocated disaster / emergency assistance | - | 200 | - | 200 | 200 | 200 | ||||||||||||||||||
Total Program Expense | 52,602 | 53,754 | 54,924 | 54,568 | 55,758 | 57,247 | ||||||||||||||||||
Debt servicing costs | 1,018 | 1,398 | 1,355 | 1,921 | 2,434 | 2,937 | ||||||||||||||||||
Pension provisions | (543 | ) | (237 | ) | (332 | ) | (310 | ) | (366 | ) | (365 | ) | ||||||||||||
Total Expense | 53,077 | 54,915 | 55,947 | 56,181 | 57,827 | 59,818 | ||||||||||||||||||
Risk Adjustment | - | (500 | ) | - | (500 | ) | (700 | ) | (1,000 | ) | ||||||||||||||
Surplus / (deficit) | (10,784 | ) | (10,497 | ) | (9,066 | ) | (8,802 | ) | (7,912 | ) | (6,970 | ) | ||||||||||||
Beginning net assets (+ adjustments) | 48,505 | 37,721 | 37,721 | 28,655 | 19,853 | 11,941 | ||||||||||||||||||
Net assets at end of year | 37,721 | 27,224 | 28,655 | 19,853 | 11,941 | 4,971 | ||||||||||||||||||
| a | The 2016-17 Actual, 2017-18 Budget, and 2017-18 Forecast numbers have been restated on the 2018-19 basis, reflecting re-organized ministry structures. First, pursuant to Order in Council 275/2017 (September 14, 2017) under the Government Organization Act, communications staff from departments were transferred to Treasury Board and Finance. Second, under the Appropriation Act 2018: Information Management and Technology and Enterprise Information and Technology Environment were transferred from departments to Service Alberta; some of School Facilities Infrastructure was transferred from Education to Infrastructure; Fetal Alcohol Spectrum Disorder, Parent Child Assistance for First Nations, and Supplemental Homelessness were transferred from Health to Community and Social Services; Alberta Sport Connection Parks and Wildlife Ventures was transferred from Culture and Tourism to Environment and Parks. |
| FISCAL PLAN 2018 – 21 • TABLES | 133 |
Consolidated Fiscal Summary
(millions of dollars)
| Income Statement | 2016-17 | 2017-18 | 2018-19 | 2019-20 | 2020-21 | |||||||||||||||||||||
| Actual | Budget | Forecast | Estimate | Target | Target | |||||||||||||||||||||
1 | Total Revenue | 42,293 | 44,918 | 46,881 | 47,879 | 50,615 | 53,848 | |||||||||||||||||||
| Expense | ||||||||||||||||||||||||||
2 | Operating expense (net of in-year savings) | 44,661 | 45,906 | 46,370 | 47,765 | 49,053 | 50,291 | |||||||||||||||||||
3 | % change from prior year | 3.1 | 2.8 | 3.8 | 3.0 | 2.7 | 2.5 | |||||||||||||||||||
4 | Climate Leadership Plan operating expense allocation | 1,379 | 868 | 577 | 1,035 | 1,132 | 1,198 | |||||||||||||||||||
5 | Disaster assistance (with operating 2013 flood support) | 1,191 | 235 | 495 | 206 | 200 | 200 | |||||||||||||||||||
6 | Capital grants (including 2013 flood support) | 2,159 | 3,302 | 3,729 | 1,706 | 1,352 | 1,596 | |||||||||||||||||||
7 | Climate Leadership Plan capital grants | 2 | 68 | 391 | 423 | 446 | 286 | |||||||||||||||||||
8 | Amortization / loss on disposals | 2,302 | 2,449 | 2,458 | 2,478 | 2,570 | 2,616 | |||||||||||||||||||
9 | Inventory consumption | 908 | 926 | 904 | 956 | 1,007 | 1,061 | |||||||||||||||||||
10 | Debt servicing costs – general | 438 | 619 | 594 | 1,027 | 1,360 | 1,692 | |||||||||||||||||||
11 | Debt servicing costs – Capital Plan | 580 | 779 | 761 | 895 | 1,074 | 1,244 | |||||||||||||||||||
12 | Pension provisions | (543 | ) | (237 | ) | (332 | ) | (310 | ) | (366 | ) | (365 | ) | |||||||||||||
13 | Total Expense | 53,077 | 54,915 | 55,947 | 56,181 | 57,827 | 59,818 | |||||||||||||||||||
14 | Risk Adjustment | - | (500 | ) | - | (500 | ) | (700 | ) | (1,000 | ) | |||||||||||||||
15 | Surplus / (Deficit) | (10,784 | ) | (10,497 | ) | (9,066 | ) | (8,802 | ) | (7,912 | ) | (6,970 | ) | |||||||||||||
| Capital Plan | ||||||||||||||||||||||||||
16 | Capital grants | 2,159 | 3,302 | 3,729 | 1,706 | 1,352 | 1,596 | |||||||||||||||||||
17 | Climate Leadership Plan capital grants | 2 | 68 | 391 | 423 | 446 | 286 | |||||||||||||||||||
18 | Capital investment | 4,412 | 5,659 | 5,016 | 4,123 | 3,846 | 4,026 | |||||||||||||||||||
19 | Climate Leadership Plan capital investment | 5 | 146 | 29 | 192 | 241 | 123 | |||||||||||||||||||
20 | Total Capital Plan | 6,578 | 9,175 | 9,165 | 6,444 | 5,884 | 6,032 | |||||||||||||||||||
| Balance Sheeta | At March 31 | |||||||||||||||||||||||||
| 2017 | 2018 | 2019 | 2020 | 2021 | ||||||||||||||||||||||
| Actual | Forecast | Estimate | Target | Target | ||||||||||||||||||||||
| Financial Assets | ||||||||||||||||||||||||||
21 | Heritage Savings Trust Fund, endowment and other funds | 19,836 | 20,321 | 20,778 | 21,298 | 21,872 | ||||||||||||||||||||
22 | Contingency Account | 2,299 | 1,661 | - | - | - | ||||||||||||||||||||
23 | Self-supporting lending organizations | 20,904 | 21,236 | 22,357 | 23,477 | 24,249 | ||||||||||||||||||||
24 | Cash reserve | - | 5,000 | 5,000 | 5,000 | 5,000 | ||||||||||||||||||||
25 | Other financial assets (including SUCH sector / Alberta Innovates Corp.) | 23,248 | 21,357 | 22,428 | 23,163 | 24,617 | ||||||||||||||||||||
26 | Total Financial Assets | 66,287 | 69,575 | 70,563 | 72,938 | 75,738 | ||||||||||||||||||||
| Liabilities | ||||||||||||||||||||||||||
27 | Liabilities for capital projects | 23,769 | 29,306 | 33,159 | 36,964 | 41,400 | ||||||||||||||||||||
28 | Debt for pre-1992 TPP liability / direct borrowing for the Fiscal Plan | 9,529 | 14,023 | 21,061 | 28,885 | 35,766 | ||||||||||||||||||||
29 | Self-supporting lending organizations | 18,385 | 18,446 | 19,236 | 19,967 | 20,300 | ||||||||||||||||||||
30 | Cash reserve | - | 5,000 | 5,000 | 5,000 | 5,000 | ||||||||||||||||||||
31 | Pension liabilities | 10,023 | 9,691 | 9,381 | 9,015 | 8,650 | ||||||||||||||||||||
32 | Other liabilities (including SUCH sector / Alberta Innovates Corp.) | 13,482 | 13,378 | 13,236 | 12,883 | 12,781 | ||||||||||||||||||||
33 | Total Liabilities | 75,188 | 89,844 | 101,073 | 112,714 | 123,897 | ||||||||||||||||||||
34 | Net Financial Assets | (8,901 | ) | (20,269 | ) | (30,510 | ) | (39,776 | ) | (48,159 | ) | |||||||||||||||
35 | Capital / other non-financial assets | 49,408 | 51,961 | 53,791 | 55,299 | 56,809 | ||||||||||||||||||||
36 | Deferred capital contributions | (2,786 | ) | (3,037 | ) | (3,428 | ) | (3,582 | ) | (3,679 | ) | |||||||||||||||
37 | Net Assets | 37,721 | 28,655 | 19,853 | 11,941 | 4,971 | ||||||||||||||||||||
38 | Change in Net Assets (before adjustments) | (10,784 | ) | (9,066 | ) | (8,802 | ) | (7,912 | ) | (6,970 | ) | |||||||||||||||
39 | Net financial assets as percentage of nominal Alberta GDP | 2.8% | 6.0% | 8.7% | 10.8% | 12.4% | ||||||||||||||||||||
| a | 2017-18 Forecast assets (Contingency Account) and liabilities (direct borrowing for the Fiscal Plan) have been updated to reflect debt issued on March 8, 2018 of $1.62 billion that was not included in the 2017-18 Third Quarter Fiscal Update and Economic Statement. |
| FISCAL PLAN 2018 – 21 • TABLES | 134 |
Consolidated Fiscal Summary continued
(millions of dollars)
Contingency Account | 2016-17 | 2017-18 | 2018-19 | 2019-20 | 2020-21 | |||||||||||||||||||||
| Actual | Budget | Forecast | Estimate | Target | Target | |||||||||||||||||||||
1 | Balance at Start of Year | 3,625 | 2,299 | 2,299 | 1,661 | - | - | |||||||||||||||||||
2 | Surplus / (deficit) | (10,784 | ) | (10,497 | ) | (9,066 | ) | (8,802 | ) | (7,912 | ) | (6,970 | ) | |||||||||||||
| Cash Adjustments – Sources / (Requirements) | ||||||||||||||||||||||||||
3 | SUCH / Alberta Innovates revenue / expense adjustments | 524 | 269 | 756 | 565 | 461 | 509 | |||||||||||||||||||
4 | Pension provisions | (543 | ) | (237 | ) | (332 | ) | (310 | ) | (366 | ) | (365 | ) | |||||||||||||
5 | Net deferred capital contribution cash adjustment | 104 | 37 | 211 | 351 | 114 | 57 | |||||||||||||||||||
6 | Heritage Fund inflation-proofing | (182 | ) | (292 | ) | (276 | ) | (328 | ) | (303 | ) | (325 | ) | |||||||||||||
7 | Retained income of funds and agencies | 2,128 | (616 | ) | (1,570 | ) | (1,151 | ) | (1,158 | ) | (1,910 | ) | ||||||||||||||
8 | Energy royalties | (397 | ) | 100 | 208 | 211 | 118 | 142 | ||||||||||||||||||
9 | Student loans | (432 | ) | (362 | ) | (392 | ) | (375 | ) | (351 | ) | (322 | ) | |||||||||||||
10 | Other cash adjustments | 290 | (80 | ) | (540 | ) | (121 | ) | (361 | ) | (11 | ) | ||||||||||||||
11 | 2013 Alberta flood assistance revenue / expense | (182 | ) | (114 | ) | (139 | ) | (74 | ) | 80 | 176 | |||||||||||||||
12 | 2016 Wood Buffalo wildfire revenue / expense | 240 | (90 | ) | (180 | ) | (97 | ) | (29 | ) | 43 | |||||||||||||||
13 | Inventory acquisition (excluding SUCH sector) | (122 | ) | (131 | ) | (134 | ) | (139 | ) | (134 | ) | (134 | ) | |||||||||||||
14 | Inventory consumption (non-cash expense; excluding SUCH) | 127 | 140 | 130 | 137 | 143 | 157 | |||||||||||||||||||
| Capital Plan Cash Adjustments – Sources / (Requirements) | ||||||||||||||||||||||||||
15 | Capital investment (excluding SUCH sector self-financed) | (3,714 | ) | (4,786 | ) | (4,138 | ) | (3,455 | ) | (3,370 | ) | (3,486 | ) | |||||||||||||
16 | Amortization / book value of disposals (non-cash expense) | 903 | 1,015 | 1,024 | 1,053 | 1,106 | 1,139 | |||||||||||||||||||
17 | Withdrawal from / (deposit to) Capital Plan financing account | 498 | 849 | 1,394 | - | - | - | |||||||||||||||||||
18 | Direct borrowing for Capital Plan | 4,686 | 5,954 | 5,434 | 3,772 | 3,687 | 4,265 | |||||||||||||||||||
19 | Alternative financing (P3s – public-private partnerships) | 83 | 108 | 145 | 128 | 166 | 228 | |||||||||||||||||||
20 | Current principal repayments (P3s) | (51 | ) | (61 | ) | (59 | ) | (64 | ) | (66 | ) | (74 | ) | |||||||||||||
21 | Surplus / (deficit) plus net cash adjustments | (6,824 | ) | (8,794 | ) | (7,524 | ) | (8,699 | ) | (8,175 | ) | (6,881 | ) | |||||||||||||
22 | Cash from prior-year final results | (695 | ) | - | 2,392 | - | - | - | ||||||||||||||||||
23 | Cash to be transferred next year | (2,392 | ) | - | - | - | - | - | ||||||||||||||||||
24 | Direct borrowing for the Fiscal Plan | 8,585 | 6,495 | 4,494 | 7,038 | 8,175 | 6,881 | |||||||||||||||||||
25 | Balance at End of Year | 2,299 | - | 1,661 | - | - | - | |||||||||||||||||||
| Liabilities / Borrowing | 2017 | 2018 | 2019 | 2020 | 2021 | |||||||||||||||||||||
| (at March 31) | Actual | Budget | Forecast | Estimate | Target | Target | ||||||||||||||||||||
| Liabilities for Capital Projects | ||||||||||||||||||||||||||
26 | Opening balance | 19,040 | 23,769 | 23,769 | 29,306 | 33,159 | 36,964 | |||||||||||||||||||
27 | Alternative financing (P3s – public-private partnerships) | 83 | 108 | 145 | 128 | 166 | 228 | |||||||||||||||||||
28 | Direct borrowing | 4,686 | 5,954 | 5,434 | 3,772 | 3,687 | 4,265 | |||||||||||||||||||
29 | Re-financing of existing debt | - | - | - | 500 | 3,713 | 2,988 | |||||||||||||||||||
30 | Principal repayments / amortization of debt issue costs | (40 | ) | (51 | ) | (42 | ) | (547 | ) | (3,762 | ) | (3,045 | ) | |||||||||||||
31 | Total Liabilities for Capital Projects | 23,769 | 29,780 | 29,306 | 33,159 | 36,964 | 41,400 | |||||||||||||||||||
| Borrowing for the Fiscal Plan | ||||||||||||||||||||||||||
32 | Opening balance | 944 | 9,529 | 9,529 | 14,023 | 21,061 | 28,885 | |||||||||||||||||||
33 | Direct borrowing | 8,585 | 6,495 | 4,494 | 7,038 | 8,175 | 6,881 | |||||||||||||||||||
34 | Principal repayments | - | - | - | - | (350 | ) | - | ||||||||||||||||||
35 | Total Borrowing for the Fiscal Plan | 9,529 | 16,024 | 14,023 | 21,061 | 28,885 | 35,766 | |||||||||||||||||||
36 | Total Liabilities / Borrowing - Capital Projects / Fiscal Plan | 33,298 | 45,804 | 43,329 | 54,220 | 65,849 | 77,166 | |||||||||||||||||||
37 | Percentage of nominal Alberta GDP | 10.6% | 14.1% | 12.9% | 15.4% | 17.9% | 19.9% | |||||||||||||||||||
| Savings | ||||||||||||||||||||||||||
38 | Heritage Fund inflation-proofing | 182 | 292 | 276 | 328 | 303 | 325 | |||||||||||||||||||
39 | Year-end Heritage Fund Balance | 15,352 | 15,644 | 15,629 | 15,957 | 16,260 | 16,585 | |||||||||||||||||||
| FISCAL PLAN 2018 – 21 • TABLES | 135 |
Revenue
(millions of dollars)
| 2016-17 | 2017-18 | 2018-19 | 2019-20 | 2020-21 | ||||||||||||||||||||
| Actual | Budget | Forecast | Estimate | Target | Target | |||||||||||||||||||
Income Taxes | ||||||||||||||||||||||||
Personal income tax | 10,763 | 11,177 | 10,855 | 11,387 | 11,984 | 12,635 | ||||||||||||||||||
Corporate income tax | 3,769 | 3,918 | 3,852 | 4,551 | 5,293 | 5,719 | ||||||||||||||||||
| 14,532 | 15,095 | 14,707 | 15,938 | 17,277 | 18,354 | |||||||||||||||||||
Other Taxes | ||||||||||||||||||||||||
Education property tax (includes opted-out boards) | 2,412 | 2,446 | 2,446 | 2,446 | 2,596 | 2,709 | ||||||||||||||||||
Fuel tax | 1,343 | 1,360 | 1,385 | 1,414 | 1,443 | 1,476 | ||||||||||||||||||
Tobacco / Cannabis tax | 953 | 1,026 | 910 | 932 | 980 | 993 | ||||||||||||||||||
Insurance taxes | 555 | 628 | 596 | 641 | 691 | 745 | ||||||||||||||||||
Freehold mineral rights tax | 57 | 90 | 73 | 87 | 92 | 100 | ||||||||||||||||||
Tourism levy | 78 | 79 | 82 | 85 | 88 | 92 | ||||||||||||||||||
Carbon levy | 250 | 1,038 | 1,012 | 1,356 | 1,381 | 1,526 | ||||||||||||||||||
| 5,649 | 6,667 | 6,504 | 6,961 | 7,271 | 7,641 | |||||||||||||||||||
Non-Renewable Resource Revenue | ||||||||||||||||||||||||
Bitumen royalty | 1,483 | 2,546 | 2,358 | 1,785 | 2,184 | 2,926 | ||||||||||||||||||
Crude oil royalty | 716 | 476 | 883 | 1,053 | 981 | 1,035 | ||||||||||||||||||
Natural gas and by-products royalty | 520 | 455 | 557 | 541 | 590 | 585 | ||||||||||||||||||
Bonuses and sales of Crown leases | 203 | 148 | 577 | 327 | 312 | 343 | ||||||||||||||||||
Rentals and fees / coal royalty | 174 | 129 | 159 | 123 | 116 | 111 | ||||||||||||||||||
| 3,097 | 3,754 | 4,534 | 3,829 | 4,183 | 5,001 | |||||||||||||||||||
Transfers from Government of Canada | ||||||||||||||||||||||||
Canada Health Transfer | 4,201 | 4,360 | 4,325 | 4,521 | 4,746 | 4,957 | ||||||||||||||||||
Canada Social Transfer | 1,558 | 1,614 | 1,600 | 1,657 | 1,713 | 1,772 | ||||||||||||||||||
Direct transfers to SUCH sector / Alberta Innovates Corporation | 528 | 479 | 478 | 520 | 530 | 537 | ||||||||||||||||||
Agriculture support programs | 386 | 293 | 376 | 308 | 309 | 312 | ||||||||||||||||||
Infrastructure support | 337 | 741 | 528 | 510 | 395 | 276 | ||||||||||||||||||
Labour market agreements | 223 | 203 | 232 | 250 | 267 | 290 | ||||||||||||||||||
Other (includes 2016 Wood Buffalo wildfire assistance) | 747 | 298 | 379 | 452 | 509 | 500 | ||||||||||||||||||
| 7,979 | 7,988 | 7,918 | 8,218 | 8,470 | 8,645 | |||||||||||||||||||
Investment Income | ||||||||||||||||||||||||
Alberta Heritage Savings Trust Fund | 2,467 | 1,290 | 1,972 | 1,653 | 1,759 | 1,838 | ||||||||||||||||||
Endowment funds | 526 | 251 | 416 | 336 | 405 | 436 | ||||||||||||||||||
Alberta Capital Finance Authority | 185 | 178 | 218 | 345 | 394 | 437 | ||||||||||||||||||
Agriculture Financial Services Corporation | 130 | 142 | 125 | 135 | 145 | 157 | ||||||||||||||||||
Other (includes Contingency Account and SUCH sector) | 387 | 332 | 330 | 415 | 458 | 489 | ||||||||||||||||||
| 3,698 | 2,193 | 3,061 | 2,884 | 3,161 | 3,357 | |||||||||||||||||||
Net Income from Government Business Enterprises | ||||||||||||||||||||||||
AGLC – Gaming / lottery | 1,430 | 1,445 | 1,384 | 1,439 | 1,465 | 1,507 | ||||||||||||||||||
AGLC – Liquor / Cannabis | 855 | 876 | 867 | 794 | 784 | 859 | ||||||||||||||||||
ATB Financial | 151 | 93 | 212 | 242 | 281 | 331 | ||||||||||||||||||
Balancing Pool | (1,952 | ) | - | 771 | 161 | 86 | 86 | |||||||||||||||||
Other (CUDGCo and APMC) | 59 | 92 | 60 | 141 | 91 | 61 | ||||||||||||||||||
| 543 | 2,506 | 3,294 | 2,777 | 2,707 | 2,844 | |||||||||||||||||||
Premiums, Fees and Licences | ||||||||||||||||||||||||
Post-secondary institution tuition fees | 1,169 | 1,223 | 1,223 | 1,237 | 1,260 | 1,288 | ||||||||||||||||||
Health / school board fees and charges | 704 | 655 | 655 | 664 | 668 | 672 | ||||||||||||||||||
Motor vehicle licences | 502 | 505 | 507 | 513 | 517 | 522 | ||||||||||||||||||
Crop, hail and livestock insurance premiums | 370 | 333 | 355 | 375 | 384 | 397 | ||||||||||||||||||
Energy industry levies | 300 | 310 | 295 | 333 | 342 | 336 | ||||||||||||||||||
Other (includes land titles, lands & grazing, health benefit premiums) | 656 | 657 | 707 | 733 | 758 | 780 | ||||||||||||||||||
| 3,701 | 3,683 | 3,742 | 3,854 | 3,929 | 3,996 | |||||||||||||||||||
Other | ||||||||||||||||||||||||
SUCH sector sales, rentals and services | 1,063 | 1,040 | 1,058 | 1,040 | 1,068 | 1,089 | ||||||||||||||||||
SUCH sector fundraising, donations, gifts and contributions | 708 | 627 | 631 | 639 | 667 | 684 | ||||||||||||||||||
AIMCo investment management charges | 291 | 318 | 338 | 342 | 352 | 363 | ||||||||||||||||||
Fines and penalties | 214 | 225 | 225 | 225 | 229 | 232 | ||||||||||||||||||
Refunds of expense | 282 | 197 | 213 | 195 | 195 | 196 | ||||||||||||||||||
Climate Change and Emissions Management Fund | 163 | 196 | 210 | 541 | 649 | 977 | ||||||||||||||||||
Miscellaneous (includes Alberta Innovates) | 373 | 429 | 446 | 437 | 457 | 470 | ||||||||||||||||||
| 3,094 | 3,032 | 3,121 | 3,419 | 3,617 | 4,010 | |||||||||||||||||||
Total Revenue | 42,293 | 44,918 | 46,881 | 47,879 | 50,615 | 53,848 | ||||||||||||||||||
| FISCAL PLAN 2018 – 21 • TABLES | 136 |
Operating Expense
(millions of dollars)
| 2016-17 | 2017-18 | 2018-19 | 2019-20 | 2020-21 | ||||||||||||||||||||
| Actual | Budget | Forecast | Estimate | Target | Target | |||||||||||||||||||
Advanced Education | 5,343 | 5,474 | 5,455 | 5,606 | 5,761 | 5,975 | ||||||||||||||||||
Agriculture and Forestry | 1,077 | 1,036 | 1,006 | 1,056 | 1,079 | 1,074 | ||||||||||||||||||
Children’s Services | 1,287 | 1,369 | 1,462 | 1,504 | 1,543 | 1,576 | ||||||||||||||||||
Community and Social Services | 3,253 | 3,318 | 3,490 | 3,650 | 3,815 | 3,933 | ||||||||||||||||||
Culture and Tourism | 288 | 282 | 306 | 303 | 299 | 299 | ||||||||||||||||||
Economic Development and Trade | 264 | 339 | 308 | 282 | 266 | 290 | ||||||||||||||||||
Education | 7,781 | 7,842 | 7,828 | 7,999 | 8,242 | 8,465 | ||||||||||||||||||
Energy | 432 | 466 | 440 | 478 | 499 | 497 | ||||||||||||||||||
Environment and Parks | 404 | 444 | 449 | 446 | 443 | 434 | ||||||||||||||||||
Executive Council | 18 | 19 | 18 | 19 | 19 | 19 | ||||||||||||||||||
Health | 19,177 | 19,910 | 19,967 | 20,566 | 21,187 | 21,823 | ||||||||||||||||||
Indigenous Relations | 175 | 179 | 170 | 182 | 179 | 180 | ||||||||||||||||||
Infrastructure | 486 | 494 | 493 | 497 | 499 | 499 | ||||||||||||||||||
Justice and Solicitor General | 1,389 | 1,392 | 1,430 | 1,466 | 1,487 | 1,511 | ||||||||||||||||||
Labour | 184 | 195 | 197 | 222 | 232 | 238 | ||||||||||||||||||
Municipal Affairs | 234 | 261 | 245 | 260 | 261 | 260 | ||||||||||||||||||
Seniors and Housing | 585 | 593 | 593 | 614 | 620 | 626 | ||||||||||||||||||
Service Alberta | 342 | 343 | 353 | 395 | 382 | 356 | ||||||||||||||||||
Status of Women | 7 | 7 | 7 | 7 | 7 | 7 | ||||||||||||||||||
Transportation | 463 | 454 | 461 | 450 | 450 | 449 | ||||||||||||||||||
Treasury Board and Finance | 1,355 | 1,562 | 1,570 | 1,603 | 1,628 | 1,649 | ||||||||||||||||||
Legislative Assembly | 118 | 126 | 121 | 161 | 155 | 130 | ||||||||||||||||||
Climate Leadership Plan | 1,379 | 868 | 577 | 1,035 | 1,132 | 1,198 | ||||||||||||||||||
In-year savings | - | (200 | ) | - | - | - | - | |||||||||||||||||
Total Operating Expense | 46,040 | 46,774 | 46,947 | 48,800 | 50,185 | 51,489 | ||||||||||||||||||
Debt Servicing Costs (millions of dollars) |
| |||||||||||||||||||||||
| 2016-17 | 2017-18 | 2018-19 | 2019-20 | 2020-21 | ||||||||||||||||||||
| General | Actual | Budget | Forecast | Estimate | Target | Target | ||||||||||||||||||
Advanced Education – post-secondary institutions | 39 | 41 | 41 | 42 | 46 | 47 | ||||||||||||||||||
Agriculture and Forestry – Agriculture Financial Services Corp. | 69 | 71 | 69 | 71 | 73 | 76 | ||||||||||||||||||
Education – school boards | 14 | 9 | 9 | 10 | 9 | 9 | ||||||||||||||||||
Health – Alberta Health Services | 16 | 15 | 15 | 16 | 15 | 14 | ||||||||||||||||||
Seniors and Housing – Alberta Social Housing Corporation | 6 | 5 | 5 | 5 | 5 | 5 | ||||||||||||||||||
Treasury Board and Finance – Alberta Capital Finance Authority | 125 | 131 | 176 | 313 | 361 | 397 | ||||||||||||||||||
Treasury Board and Finance – other | 168 | 347 | 279 | 570 | 851 | 1,144 | ||||||||||||||||||
Total General Debt Servicing Costs | 438 | 619 | 594 | 1,027 | 1,360 | 1,692 | ||||||||||||||||||
Capital Plan | ||||||||||||||||||||||||
Education – Alberta Schools Alternative Procurement P3s | 30 | 29 | 29 | 28 | 28 | 27 | ||||||||||||||||||
Transportation – ring road P3s | 83 | 94 | 94 | 92 | 90 | 95 | ||||||||||||||||||
Treasury Board and Finance – direct borrowing | 467 | 656 | 638 | 775 | 956 | 1,122 | ||||||||||||||||||
Total Capital Plan Debt Servicing Costs | 580 | 779 | 761 | 895 | 1,074 | 1,244 | ||||||||||||||||||
Total Debt Servicing Costs | 1,018 | 1,398 | 1,355 | 1,921 | 2,434 | 2,937 | ||||||||||||||||||
| FISCAL PLAN 2018 – 21 • TABLES | 137 |
Climate Leadership Plan
(millions of dollars)
| 2016 17 | 2017-18 | 2018-19 | 2019-20 | 2020-21 | ||||||||||||||||||||
| Actual | Budget | Forecast | Estimate | Target | Target | |||||||||||||||||||
Revenue | ||||||||||||||||||||||||
Carbon Levy | 250 | 1,038 | 1,012 | 1,356 | 1,381 | 1,526 | ||||||||||||||||||
Climate Change Emissions Management Fund | 163 | 196 | 210 | 541 | 649 | 977 | ||||||||||||||||||
Low Carbon Economy Leadership Fund (federal government) | - | - | - | 29 | 75 | 35 | ||||||||||||||||||
Total CLP Revenue | 413 | 1,234 | 1,222 | 1,926 | 2,105 | 2,538 | ||||||||||||||||||
Operating expense | ||||||||||||||||||||||||
Agriculture and Forestry | 6 | 8 | 19 | 42 | 35 | 7 | ||||||||||||||||||
Economic Development and Trade | - | 1 | 20 | 46 | 61 | 1 | ||||||||||||||||||
Energy | 1,119 | 35 | 35 | 106 | 135 | 160 | ||||||||||||||||||
Environment and Parks | 94 | 404 | 168 | 280 | 355 | 497 | ||||||||||||||||||
Indigenous Relations | 5 | 1 | 16 | 20 | 20 | 17 | ||||||||||||||||||
Labour | - | - | 1 | 6 | 5 | 7 | ||||||||||||||||||
Treasury Board and Finance | 154 | 418 | 316 | 533 | 521 | 508 | ||||||||||||||||||
Other (Infrastructure / Transportation / Seniors and Housing) | 1 | 2 | 2 | 1 | 1 | 1 | ||||||||||||||||||
Total CLP operating expense | 1,379 | 868 | 577 | 1,035 | 1,132 | 1,198 | ||||||||||||||||||
Capital Grants | ||||||||||||||||||||||||
Economic Development and Trade | - | 10 | - | - | - | - | ||||||||||||||||||
Energy | - | - | - | 95 | 71 | 58 | ||||||||||||||||||
Environment and Parks | - | 50 | 185 | 20 | 39 | 36 | ||||||||||||||||||
Indigenous Relations | 2 | - | 22 | 34 | 34 | 34 | ||||||||||||||||||
Transportation | - | 7 | 183 | 272 | 293 | 155 | ||||||||||||||||||
Other (Agri. / Infra. / Health / Mun. Aff. / Seniors and Housing) | - | 1 | 2 | 2 | 9 | 3 | ||||||||||||||||||
Total CLP Capital Grants | 2 | 68 | 391 | 423 | 446 | 286 | ||||||||||||||||||
Capital Investment | ||||||||||||||||||||||||
Advanced Education | 1 | - | - | 14 | 9 | 5 | ||||||||||||||||||
Economic Development and Trade | - | - | 10 | 1 | 4 | - | ||||||||||||||||||
Environment and Parks | - | 118 | - | - | - | - | ||||||||||||||||||
Health | 2 | 16 | 10 | 11 | 12 | - | ||||||||||||||||||
Infrastructure | - | - | - | 28 | 43 | - | ||||||||||||||||||
Seniors and Housing | - | - | - | 6 | 11 | - | ||||||||||||||||||
Transportation | 1 | 10 | 7 | 133 | 161 | 118 | ||||||||||||||||||
Other (Agriculture and Forestry / Energy) | 1 | 2 | 2 | 1 | - | - | ||||||||||||||||||
Total CLP Capital Investment | 5 | 146 | 29 | 192 | 241 | 123 | ||||||||||||||||||
Total CLP Capital Plan | 7 | 214 | 420 | 616 | 687 | 409 | ||||||||||||||||||
Other allocations | ||||||||||||||||||||||||
Small business tax reduction (Treasury Board and Finance) | 40 | 175 | 180 | 195 | 205 | 215 | ||||||||||||||||||
Investment tax credit (Economic Development and Trade) | - | - | 18 | 9 | 8 | - | ||||||||||||||||||
Coal transition payments (liability reduction – Energy) | - | 65 | 65 | 67 | 69 | 71 | ||||||||||||||||||
Total CLP other allocations | 40 | 240 | 263 | 271 | 282 | 286 | ||||||||||||||||||
Total Climate Leadership Plan allocations | 1,426 | 1,322 | 1,260 | 1,922 | 2,101 | 1,893 | ||||||||||||||||||
Disaster / Emergency Assistance (millions of dollars) | ||||||||||||||||||||||||
| 2016-17 | 2017-18 | 2018-19 | 2019-20 | 2020-21 | ||||||||||||||||||||
| Actual | Budget | Forecast | Estimate | Target | Target | |||||||||||||||||||
Agriculture and Forestry - agriculture support | 214 | - | 258 | - | - | - | ||||||||||||||||||
Agriculture and Forestry - wildfire fighting | 243 | - | 205 | - | - | - | ||||||||||||||||||
Municipal Affairs - Wood Buffalo wildfire / other | 711 | 2 | 25 | 1 | - | - | ||||||||||||||||||
2013 Alberta flood assistance (Envt. / Indig. Rel. / Infr. / other) a | 23 | 33 | 7 | 5 | - | - | ||||||||||||||||||
Unallocated | - | 200 | - | 200 | 200 | 200 | ||||||||||||||||||
Total Disaster / Emergency Assistance | 1,191 | 235 | 495 | 206 | 200 | 200 | ||||||||||||||||||
| a | Excludes capital grants included in expense for 2013 Alberta flood assistance reported in the Capital Plan. |
| FISCAL PLAN 2018 – 21 • TABLES | 138 |
Capital Amortization
(millions of dollars)
| 2016-17 | 2017-18 | 2018-19 | 2019-20 | 2020-21 | ||||||||||||||||||||
| Actual | Budget | Forecast | Estimate | Target | Target | |||||||||||||||||||
Advanced Education | 502 | 517 | 518 | 537 | 555 | 555 | ||||||||||||||||||
Agriculture and Forestry | 24 | 28 | 28 | 28 | 28 | 27 | ||||||||||||||||||
Children’s Services | 3 | 2 | 2 | 4 | 4 | 4 | ||||||||||||||||||
Community and Social Services | 5 | 12 | 12 | 9 | 8 | 8 | ||||||||||||||||||
Culture and Tourism | 3 | 3 | 3 | 3 | 3 | 3 | ||||||||||||||||||
Economic Development and Trade | 5 | 5 | 6 | 8 | 8 | 8 | ||||||||||||||||||
Education | 339 | 371 | 371 | 355 | 356 | 357 | ||||||||||||||||||
Energy | 16 | 15 | 15 | 15 | 14 | 14 | ||||||||||||||||||
Environment and Parks | 43 | 44 | 57 | 70 | 77 | 88 | ||||||||||||||||||
Health | 569 | 566 | 565 | 551 | 572 | 584 | ||||||||||||||||||
Infrastructure | 105 | 128 | 123 | 127 | 132 | 138 | ||||||||||||||||||
Justice and Solicitor General | 11 | 15 | 15 | 7 | 7 | 6 | ||||||||||||||||||
Labour | 1 | 1 | 1 | 1 | 1 | 1 | ||||||||||||||||||
Municipal Affairs | 2 | 3 | 3 | 4 | 4 | 4 | ||||||||||||||||||
Seniors and Housing | 37 | 41 | 41 | 39 | 42 | 44 | ||||||||||||||||||
Service Alberta | 77 | 101 | 100 | 101 | 102 | 102 | ||||||||||||||||||
Transportation | 516 | 568 | 559 | 590 | 629 | 644 | ||||||||||||||||||
Treasury Board and Finance | 23 | 24 | 25 | 24 | 25 | 25 | ||||||||||||||||||
Legislative Assembly | 1 | 4 | 3 | 3 | 3 | 3 | ||||||||||||||||||
Total Amortization Expense | 2,283 | 2,448 | 2,446 | 2,477 | 2,569 | 2,615 | ||||||||||||||||||
Inventory Consumption (millions of dollars) | ||||||||||||||||||||||||
| 2016-17 | 2017-18 | 2018-19 | 2019-20 | 2020-21 | ||||||||||||||||||||
| Actual | Budget | Forecast | Estimate | Target | Target | |||||||||||||||||||
Agriculture and Forestry | 1 | 1 | 1 | 1 | 1 | 1 | ||||||||||||||||||
Culture and Tourism | - | 1 | 1 | 1 | 1 | 1 | ||||||||||||||||||
Health | 849 | 851 | 836 | 891 | 932 | 976 | ||||||||||||||||||
Infrastructure | 3 | 13 | 3 | 3 | 13 | 22 | ||||||||||||||||||
Service Alberta | 12 | 10 | 13 | 10 | 10 | 10 | ||||||||||||||||||
Transportation | 44 | 50 | 50 | 50 | 50 | 50 | ||||||||||||||||||
Total Inventory Consumption | 908 | 926 | 904 | 956 | 1,007 | 1,061 | ||||||||||||||||||
Inventory Acquisition (millions of dollars) | ||||||||||||||||||||||||
| 2016-17 | 2017-18 | 2018-19 | 2019-20 | 2020-21 | ||||||||||||||||||||
| Actual | Budget | Forecast | Estimate | Target | Target | |||||||||||||||||||
Agriculture and Forestry | 2 | 1 | 1 | 1 | 1 | 1 | ||||||||||||||||||
Health | 840 | 851 | 841 | 891 | 932 | 972 | ||||||||||||||||||
Infrastructure | 2 | 3 | 3 | 3 | 3 | 3 | ||||||||||||||||||
Service Alberta | 12 | 10 | 13 | 10 | 10 | 10 | ||||||||||||||||||
Transportation | 41 | 50 | 50 | 50 | 50 | 50 | ||||||||||||||||||
Other (Culture and Tourism / Legislative Assembly) | 3 | 1 | 1 | 1 | 1 | 1 | ||||||||||||||||||
Total Inventory Acquisition | 900 | 916 | 909 | 956 | 998 | 1,038 | ||||||||||||||||||
| FISCAL PLAN 2018 – 21 • TABLES | 139 |
Capital Plan a
(millions of dollars)
| 2016-17 | 2017-18 | 2018-19 | 2019-20 | 2020-21 | ||||||||||||||||||
| Actual | Budget | Forecast | Estimate | Target | Target | |||||||||||||||||
Advanced Education | 731 | 1,051 | 995 | 714 | 634 | 481 | ||||||||||||||||
Agriculture and Forestry | 51 | 53 | 53 | 39 | 35 | 32 | ||||||||||||||||
Children’s Services | 1 | 2 | 2 | - | - | - | ||||||||||||||||
Community and Social Services | 4 | 4 | 4 | 2 | 1 | 1 | ||||||||||||||||
Culture and Tourism | 47 | 65 | 65 | 77 | 54 | 54 | ||||||||||||||||
Economic Development and Trade | 11 | 11 | 8 | 10 | 11 | 11 | ||||||||||||||||
Education | 1,385 | 1,389 | 1,162 | 744 | 636 | 835 | ||||||||||||||||
Energy | 42 | 225 | 71 | 194 | 21 | 22 | ||||||||||||||||
Environment and Parks | 44 | 135 | 185 | 65 | 75 | 59 | ||||||||||||||||
Health | 667 | 1,132 | 990 | 1,338 | 1,384 | 1,551 | ||||||||||||||||
Indigenous Relations | 8 | 8 | 8 | 8 | 8 | 7 | ||||||||||||||||
Infrastructure | 203 | 282 | 233 | 224 | 259 | 308 | ||||||||||||||||
Justice and Solicitor General | 3 | 4 | 5 | 10 | 4 | 4 | ||||||||||||||||
Labour | 2 | 1 | 4 | 2 | 1 | 1 | ||||||||||||||||
Municipal Affairs | 1,482 | 1,456 | 2,251 | 892 | 890 | 1,291 | ||||||||||||||||
Seniors and Housing | 328 | 306 | 251 | 259 | 199 | 107 | ||||||||||||||||
Service Alberta | 100 | 143 | 123 | 106 | 95 | 89 | ||||||||||||||||
Transportation | 1,267 | 2,586 | 2,262 | 1,485 | 1,262 | 1,187 | ||||||||||||||||
Treasury Board and Finance | 14 | 17 | 16 | 20 | 13 | 13 | ||||||||||||||||
Legislative Assembly | 1 | 2 | 3 | 3 | 2 | 2 | ||||||||||||||||
2013 Alberta flood assistance | 179 | 90 | 54 | 29 | 1 | - | ||||||||||||||||
Climate Leadership Plan | 7 | 214 | 420 | 616 | 687 | 409 | ||||||||||||||||
Contingency / unallocated | - | - | - | (391 | ) | (388 | ) | (431) | ||||||||||||||
Total Capital Plan | 6,578 | 9,175 | 9,165 | 6,444 | 5,884 | 6,032 | ||||||||||||||||
a The Capital Plan comprises capital grants included in expense plus capital investment in government-owned assets not included in expense. Capital investment adds to government capital assets, and those assets are depreciated over time through amortization expense included in total expense.
Capital Grants (millions of dollars)
| ||||||||||||||||||||||
| 2016-17 | 2017-18 | 2018-19 | 2019-20 | 2020-21 | ||||||||||||||||||
| Actual | Budget | Forecast | Estimate | Target | Target | |||||||||||||||||
Agriculture and Forestry | 25 | 30 | 29 | 17 | 13 | 10 | ||||||||||||||||
Community and Social Services | - | - | - | 1 | - | - | ||||||||||||||||
Culture and Tourism | 45 | 62 | 62 | 74 | 51 | 51 | ||||||||||||||||
Economic Development and Trade | - | - | - | - | - | - | ||||||||||||||||
Education | - | 3 | 3 | 2 | 2 | 2 | ||||||||||||||||
Energy | 29 | 214 | 50 | 177 | 10 | 10 | ||||||||||||||||
Environment and Parks | 11 | 71 | 121 | 10 | 20 | 5 | ||||||||||||||||
Health | 59 | 122 | 55 | 49 | 47 | 51 | ||||||||||||||||
Indigenous Relations | 8 | 8 | 8 | 8 | 8 | 7 | ||||||||||||||||
Infrastructure | 21 | 58 | 47 | 43 | 33 | 28 | ||||||||||||||||
Municipal Affairsa | 1,481 | 1,447 | 2,244 | 884 | 887 | 1,287 | ||||||||||||||||
Seniors and Housing | 99 | 48 | 78 | 30 | 37 | 37 | ||||||||||||||||
Service Alberta | 3 | 5 | 5 | 5 | 5 | 5 | ||||||||||||||||
Transportation | 278 | 1,213 | 1,010 | 386 | 238 | 102 | ||||||||||||||||
Climate Leadership Plan | 2 | 68 | 391 | 423 | 446 | 286 | ||||||||||||||||
2013 Alberta flood assistance (Envt. / Muni. Aff. / Trans.) | 100 | 20 | 15 | 19 | - | - | ||||||||||||||||
Total Capital Grants | 2,161 | 3,370 | 4,120 | 2,129 | 1,798 | 1,882 | ||||||||||||||||
| a | Municipal Affairs 2017-18 Forecast includes increased grants of $0.8 billion to municipalities re-profiled from future years. |
| FISCAL PLAN 2018 – 21 • TABLES | 140 |
Capital Investment a
(millions of dollars)
| 2016-17 | 2017-18 | 2018-19 | 2019-20 | 2020-21 | ||||||||||||||||||||
| Actual | Budget | Forecast | Estimate | Target | Target | |||||||||||||||||||
Advanced Education | 731 | 1,051 | 995 | 714 | 634 | 481 | ||||||||||||||||||
Agriculture and Forestry | 26 | 23 | 23 | 22 | 22 | 22 | ||||||||||||||||||
Children’s Services | 1 | 2 | 2 | - | - | - | ||||||||||||||||||
Community and Social Services | 4 | 4 | 4 | 1 | 1 | 1 | ||||||||||||||||||
Culture and Tourism | 2 | 3 | 3 | 3 | 3 | 3 | ||||||||||||||||||
Economic Development and Trade | 11 | 11 | 8 | 10 | 11 | 11 | ||||||||||||||||||
Education | 1,385 | 1,386 | 1,159 | 742 | 634 | 833 | ||||||||||||||||||
Energy | 13 | 11 | 21 | 17 | 11 | 12 | ||||||||||||||||||
Environment and Parks | 33 | 64 | 64 | 55 | 55 | 54 | ||||||||||||||||||
Health | 608 | 1,010 | 935 | 1,289 | 1,337 | 1,500 | ||||||||||||||||||
Infrastructure | 183 | 224 | 186 | 181 | 226 | 279 | ||||||||||||||||||
Justice and Solicitor General | 3 | 4 | 5 | 10 | 4 | 4 | ||||||||||||||||||
Labour | 2 | 1 | 4 | 2 | 1 | 1 | ||||||||||||||||||
Municipal Affairs | 1 | 10 | 6 | 7 | 3 | 5 | ||||||||||||||||||
Seniors and Housing | 229 | 258 | 172 | 229 | 162 | 70 | ||||||||||||||||||
Service Alberta | 97 | 138 | 118 | 101 | 90 | 84 | ||||||||||||||||||
Transportation | 988 | 1,372 | 1,252 | 1,099 | 1,024 | 1,085 | ||||||||||||||||||
Treasury Board and Finance | 14 | 17 | 16 | 20 | 13 | 13 | ||||||||||||||||||
Legislative Assembly | 1 | 2 | 3 | 3 | 2 | 2 | ||||||||||||||||||
Climate Leadership Plan | 5 | 146 | 29 | 192 | 241 | 123 | ||||||||||||||||||
2013 Alberta flood assistance (Ed. / Env. / Hlth. / Inf. / Trans.) | 79 | 70 | 39 | 10 | 1 | - | ||||||||||||||||||
Contingency / unallocated | - | - | - | (391 | ) | (388 | ) | (431 | ) | |||||||||||||||
Total Capital Investment | 4,417 | 5,805 | 5,045 | 4,315 | 4,087 | 4,149 | ||||||||||||||||||
| a | Capital investment is not included in expense. Rather, the assets are added to government capital assets and depreciated over time through amortization expense. |
Capital Plan Funding Sources
(millions of dollars)
| 2016-17 | 2017-18 | 2018-19 | 2019-20 | 2020-21 | ||||||||||||||||||||
| Actual | Budget | Forecast | Estimate | Target | Target | |||||||||||||||||||
Capital Plan | 6,578 | 9,175 | 9,165 | 6,444 | 5,884 | 6,032 | ||||||||||||||||||
Source of funding: | ||||||||||||||||||||||||
Cash received (primarily federal govt.) / donations / disposals | 545 | 842 | 832 | 969 | 552 | 402 | ||||||||||||||||||
Retained income of funds and agencies (primarily ASHC) | 56 | 189 | 34 | 101 | 75 | 65 | ||||||||||||||||||
SUCH sector self-financed | 703 | 1,019 | 906 | 860 | 717 | 663 | ||||||||||||||||||
Climate Leadership Plan | 7 | 214 | 420 | 615 | 687 | 409 | ||||||||||||||||||
Alternative financing (P3s – public-private partnerships) | 83 | 108 | 145 | 128 | 166 | 228 | ||||||||||||||||||
Direct borrowing | 4,686 | 5,954 | 5,434 | 3,772 | 3,687 | 4,265 | ||||||||||||||||||
Withdrawal from / (deposit to) Capital Plan financing account | 498 | 849 | 1,394 | - | - | - | ||||||||||||||||||
Total Capital Plan funding Sources | 6,578 | 9,175 | 9,165 | 6,444 | 5,884 | 6,032 | ||||||||||||||||||
Capital Plan Liability / Fiscal Plan Borrowing Principal Repayments
(millions of dollars)
| 2016-17 | 2017-18 | 2018-19 | 2019-20 | 2020-21 | ||||||||||||||||||||
| Actual | Budget | Forecast | Estimate | Target | Target | |||||||||||||||||||
Education – Alberta Schools Alternative Procurement P3s | 14 | 14 | 14 | 15 | 16 | 17 | ||||||||||||||||||
Infrastructure – Evan Thomas water treatment P3 | 1 | 1 | 1 | 1 | 1 | 1 | ||||||||||||||||||
Treasury Board and Finance – direct borrowing | - | - | - | 500 | 4,245 | 3,071 | ||||||||||||||||||
Transportation – ring road P3s | 37 | 46 | 45 | 48 | 50 | 56 | ||||||||||||||||||
Total Principal Repayments | 51 | 61 | 59 | 564 | 4,311 | 3,145 | ||||||||||||||||||
| FISCAL PLAN 2018 – 21 • TABLES | 141 |
Balance Sheet Details a
(millions of dollars)
At March 31
| ||||||||||||||||||||
| 2017 | 2018 | 2019 | 2020 | 2021 | ||||||||||||||||
| Actual | Forecast | Estimate | Target | Target | ||||||||||||||||
Financial Assets | ||||||||||||||||||||
Alberta Heritage Savings Trust Fund | 15,352 | 15,629 | 15,957 | 16,260 | 16,585 | |||||||||||||||
Endowment funds: | ||||||||||||||||||||
Alberta Heritage Foundation for Medical Research | 1,653 | 1,757 | 1,826 | 1,946 | 2,077 | |||||||||||||||
Alberta Heritage Science and Engineering Research | 989 | 1,055 | 1,094 | 1,151 | 1,218 | |||||||||||||||
Alberta Heritage Scholarship | 1,205 | 1,262 | 1,301 | 1,359 | 1,428 | |||||||||||||||
Alberta Cancer Prevention Legacy Fund | 470 | 453 | 436 | 419 | 402 | |||||||||||||||
Alberta Enterprise Corporation | 167 | 165 | 164 | 163 | 162 | |||||||||||||||
Contingency Account | 2,299 | 1,661 | - | - | - | |||||||||||||||
Self-supporting lending organizations: | ||||||||||||||||||||
Alberta Capital Finance Authority | 15,797 | 15,874 | 16,607 | 17,280 | 18,000 | |||||||||||||||
Agriculture Financial Services Corporation | 5,107 | 5,362 | 5,750 | 6,197 | 6,249 | |||||||||||||||
Equity in commercial enterprises | 1,974 | 3,037 | 3,601 | 4,079 | 4,577 | |||||||||||||||
Student loans | 2,156 | 2,547 | 2,922 | 3,273 | 3,596 | |||||||||||||||
Capital Plan financing account | 1,394 | - | - | - | - | |||||||||||||||
Carbon levy account | 45 | 12 | 2 | 17 | 78 | |||||||||||||||
Climate Change and Emissions Management Fund | 417 | 412 | 426 | 415 | 999 | |||||||||||||||
Cash Reserve | - | 5,000 | 5,000 | 5,000 | 5,000 | |||||||||||||||
Other financial assets (including SUCH sector / Alberta Innovates Corp.) | 17,262 | 15,349 | 15,477 | 15,379 | 15,367 | |||||||||||||||
Total Financial Assets | 66,287 | 69,575 | 70,563 | 72,938 | 75,738 | |||||||||||||||
Liabilities | ||||||||||||||||||||
Liabilities for capital projects: | ||||||||||||||||||||
Direct borrowing | 21,006 | 26,457 | 30,246 | 33,951 | 38,233 | |||||||||||||||
Alternative financing (P3s) | 2,763 | 2,849 | 2,913 | 3,013 | 3,167 | |||||||||||||||
Debt issued to reduce pre-1992 TPP unfunded liability | 944 | 944 | 944 | 594 | 594 | |||||||||||||||
Direct borrowing for the Fiscal Plan | 8,585 | 13,079 | 20,117 | 28,290 | 35,171 | |||||||||||||||
Self-supporting lending organizations: | ||||||||||||||||||||
Alberta Capital Finance Authority | 15,797 | 15,874 | 16,607 | 17,280 | 18,000 | |||||||||||||||
Agriculture Financial Services Corporation | 2,588 | 2,572 | 2,629 | 2,687 | 2,300 | |||||||||||||||
Coal phase-out liabilities | 1,115 | 1,050 | 983 | 914 | 843 | |||||||||||||||
Cash Reserve | - | 5,000 | 5,000 | 5,000 | 5,000 | |||||||||||||||
Other liabilities (including SUCH sector / Alberta Innovates Corp.) | 12,367 | 12,328 | 12,253 | 11,970 | 11,939 | |||||||||||||||
Pension liabilities | 10,023 | 9,691 | 9,381 | 9,015 | 8,650 | |||||||||||||||
Total Liabilities | 75,188 | 89,844 | 101,073 | 112,714 | 123,897 | |||||||||||||||
Net Financial Assets | (8,901 | ) | (20,269 | ) | (30,510 | ) | (39,776 | ) | (48,159 | ) | ||||||||||
Capital / Other Non-financial Assets | 49,408 | 51,961 | 53,791 | 55,299 | 56,809 | |||||||||||||||
Deferred capital contributions | (2,786 | ) | (3,037 | ) | (3,428 | ) | (3,582 | ) | (3,679 | ) | ||||||||||
Net Assets | 37,721 | 28,655 | 19,853 | 11,941 | 4,971 | |||||||||||||||
Change in Net Assets (before adjustments) | (10,784 | ) | (9,066 | ) | (8,802 | ) | (7,912 | ) | (6,970 | ) | ||||||||||
| a | 2017-18 Forecast assets (Contingency Account) and liabilities (direct borrowing for the Fiscal Plan) have been updated to reflect debt issued on March 8, 2018 of $1.62 billion that was not included in the 2017-18 Third Quarter Fiscal Update and Economic Statement. |
| FISCAL PLAN 2018 – 21 • TABLES | 142 |
Financing Requirementsa
(millions of dollars)
| 2017-18 | 2018-19 | |||||||||||||||||||||||
| Forecast | Maturities | Change | Forecast | Maturities | Change | |||||||||||||||||||
Direct borrowing for capital purposes | 5,434 | - | 5,434 | 4,272 | (500 | ) | 3,772 | |||||||||||||||||
Direct borrowing for the Fiscal Plan b | 4,494 | - | 4,494 | 7,038 | - | 7,038 | ||||||||||||||||||
Cash reserve | 5,000 | - | 5,000 | 5,000 | (5,000 | ) | - | |||||||||||||||||
Borrowing for the Orphan Well Association | 50 | - | 50 | 145 | (50 | ) | 95 | |||||||||||||||||
Short-term borrowing for working capital | 1,000 | (1,000 | ) | - | 1,000 | (1,000 | ) | - | ||||||||||||||||
Borrowing for provincial corporations: | ||||||||||||||||||||||||
Alberta Capital Finance Authority | 4,250 | (4,167 | ) | 83 | 3,760 | (3,700 | ) | 60 | ||||||||||||||||
ATB Financial | 2,600 | (1,000 | ) | 1,600 | 3,000 | (2,800 | ) | 200 | ||||||||||||||||
Alberta Petroleum Marketing Commission | 475 | (331 | ) | 144 | 675 | (475 | ) | 200 | ||||||||||||||||
Agriculture Financial Services Corporation | 200 | (169 | ) | 31 | 406 | (271 | ) | 135 | ||||||||||||||||
Balancing Pool | 650 | (232 | ) | 418 | 810 | (650 | ) | 160 | ||||||||||||||||
Total Financing Requirements | 24,153 | (6,899 | ) | 17,254 | 26,106 | (14,446 | ) | 11,660 | ||||||||||||||||
| 2019-20 | 2020-21 | |||||||||||||||||||||||
| Forecast | Maturities | Change | Forecast | Maturities | Change | |||||||||||||||||||
Direct borrowing for capital purposes | 7,582 | (3,895 | ) | 3,687 | 7,336 | (3,071 | ) | 4,265 | ||||||||||||||||
Direct borrowing for the Fiscal Plan | 8,174 | (350 | ) | 7,824 | 6,880 | - | 6,880 | |||||||||||||||||
Cash reserve | 5,000 | (5,000 | ) | - | 5,000 | (5,000 | ) | - | ||||||||||||||||
Borrowing for the Orphan Well Association | 188 | (145 | ) | 43 | 175 | (188 | ) | (13 | ) | |||||||||||||||
Short-term borrowing for working capital | 1,000 | (1,000 | ) | - | 1,000 | (1,000 | ) | - | ||||||||||||||||
Borrowing for provincial corporations: | ||||||||||||||||||||||||
Alberta Capital Finance Authority | 2,975 | (2,335 | ) | 640 | 4,572 | (3,902 | ) | 670 | ||||||||||||||||
ATB Financial | 1,700 | (1,500 | ) | 200 | 1,650 | (1,500 | ) | 150 | ||||||||||||||||
Alberta Petroleum Marketing Commission | 590 | (675 | ) | (85 | ) | 500 | (590 | ) | (90 | ) | ||||||||||||||
Agriculture Financial Services Corporation | 463 | (393 | ) | 70 | 413 | (325 | ) | 88 | ||||||||||||||||
Balancing Pool | 1,010 | (810 | ) | 200 | 1,210 | (1,010 | ) | 200 | ||||||||||||||||
Total Financing Requirements | 28,682 | (16,103 | ) | 12,579 | 28,736 | (16,586 | ) | 12,150 | ||||||||||||||||
| a | Forecast borrowing includes new requirements and maturing debt, both money market and long-term debt. Long-term debt issuance is forecast at $15.4 billion for 2018-19, $17.6 billion for 2019-20 and $17.5 billion for 2020-21. |
| b | 2017-18 Forecast for direct borrowing for the Fiscal Plan has been updated to reflect debt issued on March 8, 2018 of $1.62 billion that was not included in the 2017-18 Third Quarter Fiscal Update and Economic Statement. |
Pension Liabilities
(millions of dollars)
| At March 31 | ||||||||||||||||||||
| 2017 | 2018 | 2019 | 2020 | 2021 | ||||||||||||||||
| Actual | Forecast | Estimate | Target | Target | ||||||||||||||||
Teachers’ Pension Plan (pre-1992) | 7,884 | 7,696 | 7,577 | 7,442 | 7,290 | |||||||||||||||
Teachers’ Pension Plan (post-1992) | 517 | 455 | 327 | 153 | - | |||||||||||||||
Public Service Management Pension Plan (pre-1992; closed) a | 530 | 510 | 480 | 460 | 440 | |||||||||||||||
Local Authorities Pension Plan | 187 | 186 | 186 | 186 | 186 | |||||||||||||||
Universities Academic Pension Plan (pre-1992) | 294 | 290 | 290 | 290 | 290 | |||||||||||||||
Public Service Pension Plan | 117 | 117 | 117 | 117 | 117 | |||||||||||||||
Special Forces Pension Plan (pre-1992) | 90 | 90 | 90 | 90 | 90 | |||||||||||||||
Members of the Legislative Assembly Pension Plan (closed) a | 42 | 42 | 42 | 42 | 42 | |||||||||||||||
Public Service Supplementary Retirement Plan | 50 | 30 | 30 | 30 | 30 | |||||||||||||||
Provincial Judges and Masters in Chambers Pension Plan | 23 | 15 | 15 | 15 | 15 | |||||||||||||||
Management Employees Pension Plan | - | - | - | - | - | |||||||||||||||
SUCH sector – Universities Academic / Supp. Executive Retirement Plans | 289 | 260 | 227 | 190 | 150 | |||||||||||||||
Total Pension Liabilities | 10,023 | 9,691 | 9,381 | 9,015 | 8,650 | |||||||||||||||
Annual non-cash change in pension liabilities | (543 | ) | (332 | ) | (310 | ) | (366 | ) | (365 | ) | ||||||||||
| a | Membership closed and pensionable service no longer being accrued. |
| FISCAL PLAN 2018 – 21 • TABLES | 143 |
Cash Adjustments a
(millions of dollars)
| 2016-17 | 2017-18 | 2018-19 | 2019-20 | 2020-21 | ||||||||||||||||||||
| Actual | Budget | Forecast | Estimate | Target | Target | |||||||||||||||||||
Retained Income of Funds and Agencies | ||||||||||||||||||||||||
Alberta Heritage Savings Trust Fund inflation-proofing | (182 | ) | (292 | ) | (276 | ) | (328 | ) | (303 | ) | (325 | ) | ||||||||||||
ATB Financial | (151 | ) | (93 | ) | (212 | ) | (242 | ) | (281 | ) | (331 | ) | ||||||||||||
Agriculture Financial Services Corporation | (256 | ) | (355 | ) | (271 | ) | (387 | ) | (389 | ) | (440 | ) | ||||||||||||
Heritage Foundation for Medical Research Endowment Fund | (154 | ) | (28 | ) | (104 | ) | (68 | ) | (120 | ) | (131 | ) | ||||||||||||
Heritage Science and Engineering Research Endowment Fund | (96 | ) | (26 | ) | (65 | ) | (39 | ) | (57 | ) | (67 | ) | ||||||||||||
Heritage Scholarship Fund | (97 | ) | (13 | ) | (58 | ) | (39 | ) | (59 | ) | (69 | ) | ||||||||||||
Alberta Social Housing Corporation | 4 | 78 | 70 | 24 | 24 | 18 | ||||||||||||||||||
Alberta Capital Finance Authority | (56 | ) | (46 | ) | (41 | ) | (30 | ) | (32 | ) | (39 | ) | ||||||||||||
Alberta Cancer Prevention Legacy Fund | 6 | 17 | 17 | 17 | 18 | 18 | ||||||||||||||||||
Credit Union Deposit Guarantee Corporation | (30 | ) | (23 | ) | (21 | ) | (22 | ) | (25 | ) | (26 | ) | ||||||||||||
Alberta Petroleum Marketing Commission | (29 | ) | (69 | ) | (39 | ) | (119 | ) | (66 | ) | (35 | ) | ||||||||||||
Carbon Levy account | 1,070 | 5 | (32 | ) | (57 | ) | (84 | ) | (132 | ) | ||||||||||||||
Climate Change and Emissions Management Fund | (48 | ) | 19 | 5 | (14 | ) | 11 | (584 | ) | |||||||||||||||
Balancing Pool | 1,952 | - | (771 | ) | (161 | ) | (86 | ) | (86 | ) | ||||||||||||||
Other | 13 | (82 | ) | (49 | ) | (13 | ) | (11 | ) | (7 | ) | |||||||||||||
Total Retained Income of Funds and Agencies | 1,946 | (908 | ) | (1,846 | ) | (1,479 | ) | (1,461 | ) | (2,235 | ) | |||||||||||||
Other Cash Adjustments | ||||||||||||||||||||||||
SUCH sector own-source revenue | (4,773 | ) | (4,565 | ) | (4,601 | ) | (4,656 | ) | (4,770 | ) | (4,861 | ) | ||||||||||||
SUCH sector own-source expense | 5,297 | 4,834 | 5,357 | 5,221 | 5,231 | 5,370 | ||||||||||||||||||
Net deferred capital contribution cash adjustment | 104 | 37 | 211 | 351 | 114 | 57 | ||||||||||||||||||
Energy royalties (difference between accrued revenue & cash) | (397 | ) | 100 | 208 | 211 | 118 | 142 | |||||||||||||||||
Student loans | (432 | ) | (362 | ) | (392 | ) | (375 | ) | (351 | ) | (322 | ) | ||||||||||||
Inventory acquisition | (122 | ) | (131 | ) | (134 | ) | (139 | ) | (134 | ) | (134 | ) | ||||||||||||
Other cash adjustments | 290 | (80 | ) | (540 | ) | (121 | ) | (361 | ) | (11 | ) | |||||||||||||
Current principal repayments (P3 capital projects) | (51 | ) | (61 | ) | (59 | ) | (64 | ) | (66 | ) | (74 | ) | ||||||||||||
2013 Alberta flood assistance revenue / expense | (182 | ) | (114 | ) | (139 | ) | (74 | ) | 80 | 176 | ||||||||||||||
Wood Buffalo wildfire revenue / expense | 240 | (90 | ) | (180 | ) | (97 | ) | (29 | ) | 43 | ||||||||||||||
Pension provisions (non-cash expense) | (543 | ) | (237 | ) | (332 | ) | (310 | ) | (366 | ) | (365 | ) | ||||||||||||
Book value of asset disposals (net non-cash expense / revenue) | 10 | - | 12 | - | - | - | ||||||||||||||||||
Inventory consumption (non-cash expense) | 127 | 140 | 130 | 137 | 143 | 157 | ||||||||||||||||||
Amortization (non-cash expense) | 893 | 1,015 | 1,012 | 1,053 | 1,106 | 1,139 | ||||||||||||||||||
Total Other Cash Adjustments | 461 | 486 | 553 | 1,137 | 714 | 1,317 | ||||||||||||||||||
a Negative cash adjustments are a cash requirement; positive cash adjustments are a cash source.
Capital Assets (millions of dollars) |
| |||||||||||||||||||||||
| At March 31 | ||||||||||||||||||||||||
| 2017 | 2018 | 2018 | 2019 | 2020 | 2021 | |||||||||||||||||||
| Actual | Budget | Forecast | Estimate | Target | Target | |||||||||||||||||||
Net book value at start of the year | 46,697 | 49,446 | 48,799 | 51,386 | 53,224 | 54,742 | ||||||||||||||||||
Additions (capital investment) | 4,417 | 5,805 | 5,045 | 4,315 | 4,087 | 4,149 | ||||||||||||||||||
Amortization | (2,283 | ) | (2,448 | ) | (2,446 | ) | (2,477 | ) | (2,569 | ) | (2,615 | ) | ||||||||||||
Net book value of capital asset disposals / adjustments | (32 | ) | - | (12 | ) | - | - | - | ||||||||||||||||
Net Book Value at End of Year | 48,799 | 52,803 | 51,386 | 53,224 | 54,742 | 56,276 | ||||||||||||||||||
| FISCAL PLAN 2018 – 21 • TABLES | 144 |
Full-Time Equivalents a
| 2017-18 | 2018-19 | |||||||||||||
| Budget | Estimate | Change | Main reasons for change | |||||||||||
Department | ||||||||||||||
Advanced Education | 590 | 594 | 4 | Labour market foundational learning | ||||||||||
Agriculture and Forestry | 1,779 | 1,779 | - | |||||||||||
Children’s Services | 2,854 | 2,913 | 59 | Child Intervention / Early Learn. & Child Care (federal) | ||||||||||
Community and Social Services | 3,189 | 3,245 | 56 | Contact centres / Disability Advocate’s Office | ||||||||||
Culture and Tourism | 572 | 572 | - | |||||||||||
Economic Development and Trade | 371 | 371 | - | |||||||||||
Education | 589 | 589 | - | |||||||||||
Energy | 613 | 613 | - | |||||||||||
Environment and Parks | 2,329 | 2,329 | - | |||||||||||
Executive Council | 125 | 125 | - | |||||||||||
Health | 933 | 933 | - | |||||||||||
Indigenous Relations | 236 | 236 | - | |||||||||||
Infrastructure | 972 | 972 | - | |||||||||||
Justice and Solicitor General | 7,191 | 7,191 | - | |||||||||||
Labour | 758 | 841 | 83 | Employment standards / Workers’ Comp. Bd. reviews | ||||||||||
Municipal Affairs | 597 | 608 | 11 | Centralized industrial property assessment services | ||||||||||
Seniors and Housing | 281 | 281 | - | |||||||||||
Service Alberta | 1,723 | 1,723 | - | |||||||||||
Status of Women | 33 | 33 | - | |||||||||||
Transportation | 777 | 777 | - | |||||||||||
Treasury Board and Finance – department | 591 | 591 | - | |||||||||||
Treasury Board and Finance – Commun. and Public Engage. | 318 | 318 | - | |||||||||||
Treasury Board and Finance – Public Service Commiss. | 217 | 217 | - | |||||||||||
Workforce re-allocation | - | (42 | ) | (42 | ) | Re-allocation from corporate services | ||||||||
Department | 27,637 | 27,808 | 171 | |||||||||||
Agencies / SUCH sector / other arm’s length entities | ||||||||||||||
Advanced Education – Post-secondary institutions | 33,588 | 33,588 | - | |||||||||||
Agriculture and Forestry – Agric. Financial Services Corp. | 630 | 630 | - | |||||||||||
Culture and Tourism – Alberta Sport Connection | 32 | 32 | - | |||||||||||
Culture and Tourism – Travel Alberta Corporation | 80 | 80 | - | |||||||||||
Economic Development and Trade – Ab. Enterprise Corp. | 6 | 6 | - | |||||||||||
Economic Development and Trade – Alberta Innovates Corp. | 712 | 712 | - | |||||||||||
Education - School boards (pub., sep., francophone, charter) | - | |||||||||||||
Certificated Staff | 36,220 | 36,883 | 663 | Enrolment growth | ||||||||||
Non-certificated Staff | 26,097 | 26,463 | 366 | Enrolment growth | ||||||||||
Energy – Alberta Energy Regulator | 1,240 | 1,240 | - | |||||||||||
Energy – Alberta Utilities Commission | 143 | 143 | - | |||||||||||
Environment and Parks – Energy Efficiency Alberta | 26 | 34 | 8 | Progression of establishment of the Agency | ||||||||||
Environment and Parks – Natural Resources Conservation Bd. | 47 | 47 | - | |||||||||||
Justice and Solicitor General – Victims of Crime Fund | 54 | 54 | - | |||||||||||
Municipal Affairs – Safety Codes Council | 60 | 60 | - | |||||||||||
Transportation – Transportation Safety Board | 12 | 12 | - | |||||||||||
Treasury Board and Finance – Alberta Insurance Council | 24 | 24 | - | |||||||||||
Treasury Board and Finance – Ab. Investment Mgt. Corp. | 394 | 427 | 33 | Increased investment complexity and assets | ||||||||||
Treasury Board and Finance – Ab. Local Auth. Pens. Pl. Corp. | 8 | 8 | - | |||||||||||
Treasury Board and Finance – Ab. Pensions Services Corp. | 287 | 297 | 10 | Enhanced client services | ||||||||||
Treasury Board and Finance – Ab. Securities Commission | 197 | 205 | 8 | More complex, technology-driven fraud | ||||||||||
Health – Alberta Health Services | 79,450 | 80,570 | 1,120 | Home care / continuing care / community support | ||||||||||
Health – Health Quality Council of Alberta | 35 | 35 | - | |||||||||||
Legislative Assembly | 725 | 746 | 21 | Child and Youth Advocate / Auditor General | ||||||||||
Agencies / SUCH sector / other arm’s length entities | 180,067 | 182,296 | 2,229 | |||||||||||
| ||||||||||||||
Total Full-Time Equivalent Employment | 207,704 | 210,104 | 2,400 | |||||||||||
a 2017-18 budget numbers have been restated on the 2018-19 basis, incorporating ministry reorganizations.
| FISCAL PLAN 2018 – 21 • TABLES | 145 |
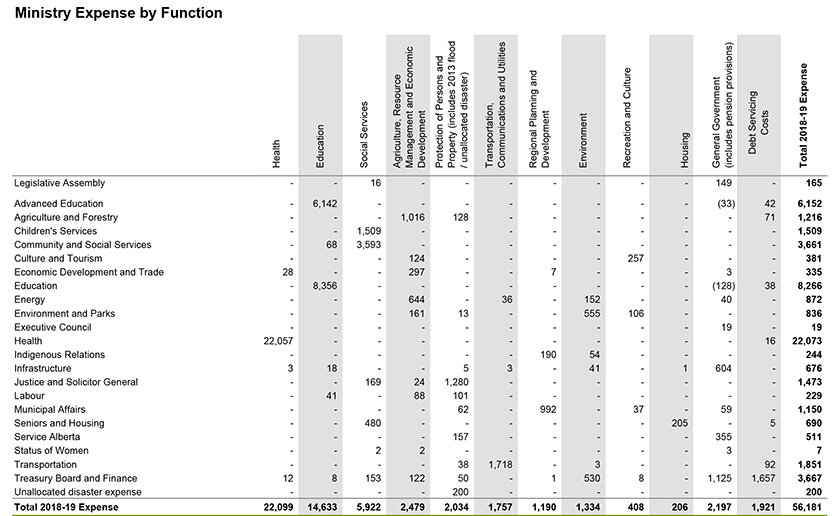
Ministry Expense by Function Health Education Social Services Agriculture, Resource Management and Economic Development Protection of Persons and Property (includes 2013 flood / unallocated disaster) Transportation, Communications and Utilities Regional Planning and Development Environment Recreation and Culture Housing General Government (includes pension provisions) Total 2018 19 Expense Debt Servicing Costs Legislative Assembly 16 149 165 Advanced Education 6,142 (33) 42 6,152 Agriculture and Forestry 1,016 128 71 1,216 Children’s Services 1,509 1,509 Community and Social Services 68 3,593 3,661 Culture and Tourism 124 257 381 Economic Development and Trade 28 297 7 3 335 Education 8,356 (128) 38 8,266 Energy 644 36 152 40 872 Environment and Parks 161 13 555 106 836 Executive Council 19 19 Health 22,057 16 22,073 Indigenous Relations 190 54 244 Infrastructure 3 18 5 3 41 1 604 676 Justice and Solicitor General 169 24 1,280 1,473 Labour 41 88 101 229 Municipal Affairs 62 992 37 59 1,150 Seniors and Housing 480 205 5 690 Service Alberta 157 355 511 Status of Women 2 2 3 7 Transportation 38 1,718 3 92 1,851 Treasury Board and Finance 12 8 153 122 50 1 530 8 1,125 1,657 3,667 Unallocated disaster expense 200 200 Total 2018 19 Expense 22,099 14,633 5,922 2,479 2,034 1,757 1,190 1,334 408 206 2,197 1,921 56,181
| FISCAL PLAN 2018 – 21 • TABLES | 146 |
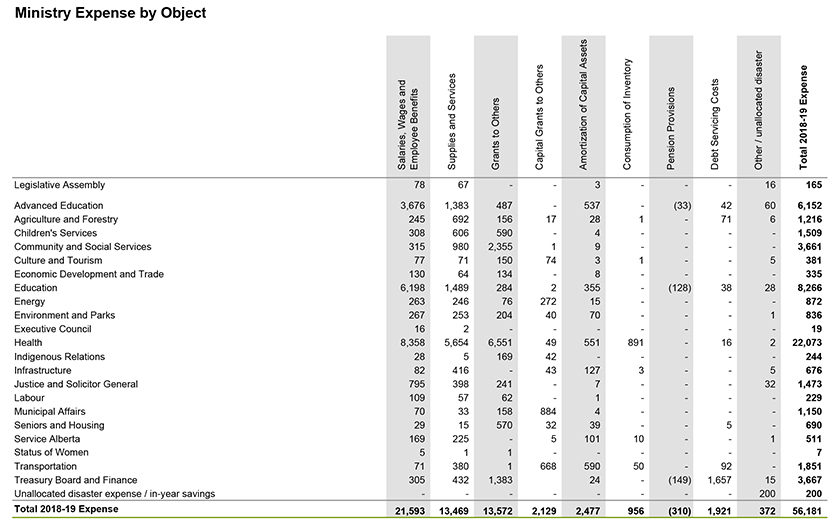
Ministry Expense by Object Salaries, Wages and Employee Benefits Supplies and Services Grants to Others Capital Grants to Others Amortization of Capital Assets Consumption of Inventory Pension Provisions Debt Servicing Costs Other / unallocated disaster Total 2018 19 Expense Legislative Assembly 78 67 3 16 165 Advanced Education 3,676 1,383 487 537 (33) 42 60 6,152 Agriculture and Forestry 245 692 156 17 28 1 71 6 1,216 Children’s Services 308 606 590 4 1,509 Community and Social Services 315 980 2,355 1 9 3,661 Culture and Tourism 77 71 150 74 3 1 5 381 Economic Development and Trade 130 64 134 8 335 Education 6,198 1,489 284 2 355 (128) 38 28 8,266 Energy 263 246 76 272 15 872 Environment and Parks 267 253 204 40 70 1 836 Executive Council 16 2 19 Health 8,358 5,654 6,551 49 551 891 16 2 22,073 Indigenous Relations 28 5 169 42 244 Infrastructure 82 416 43 127 3 5 676 Justice and Solicitor General 795 398 241 7 32 1,473 Labour 109 57 62 1 229 Municipal Affairs 70 33 158 884 4 1,150 Seniors and Housing 29 15 570 32 39 5 690 Service Alberta 169 225 5 101 10 1 511 Status of Women 5 1 1 7 Transportation 71 380 1 668 590 50 92 1,851 Treasury Board and Finance 305 432 1,383 24 (149) 1,657 15 3,667 Unallocated disaster expense / in year savings 200 200 Total 2018 19 Expense 21,593 13,469 13,572 2,129 2,477 956 (310) 1,921 372 56,181
| FISCAL PLAN 2018 – 21 • TABLES | 147 |
Changes to Fees
(dollars)
| Ministry / Description | 2017-18 | 2018-19 | ||||||
Culture and Tourism | ||||||||
Historical Resources Act – land developer historic sites clearance application fees | ||||||||
Applications (per application) | $0 | $500 | ||||||
Amendments to applications (per amendment) | $0 | $250 | ||||||
Film distribution license – annual / monthly | $450 / $37.50 | $540 / $45 | ||||||
Film classification | ||||||||
Feature films (charge per minute) – first copy / additional copies | $2 / $1 | $2.40 / $1.20 | ||||||
Trailers (charge per trailer) | $10 | $12 | ||||||
Royal Alberta Museum and Royal Tyrrell Museum | ||||||||
Adult one day | $18 | $19 | ||||||
Family one day | $46 | $48 | ||||||
Alberta Summer and Winter Games participant fee | $60 | $80 | ||||||
Jubilee Auditoria stage rental | ||||||||
Community / non-profit organizations | ||||||||
One performance (varies based on day of the week and statutory holidays) | $2,800 - $4,300 | $3,000 - $4,500 | ||||||
Two performance (varies based on day of the week and statutory holidays) | $4,200 - $6,450 | $4,500 - $7,500 | ||||||
Fit-up (varies based on day of the week and statutory holidays) | $1,825 - $2,800 | $3,000 - $4,500 | ||||||
Resident companies | ||||||||
One performance (varies based on day of the week and statutory holidays) | $2,100 | $3,000 - $4,500 | ||||||
Two performance (varies based on day of the week and statutory holidays) | $3,150 | $4,500 - $7,500 | ||||||
Fit-up / dark days (varies based on day of the week and statutory holidays) | $1,100 | $3,000 - $4,500 | ||||||
Commercial – daily rate | ||||||||
One performance | | Greater of $6,500 / 10% of gross box office ticket sales up to $14,000 | | | Greater of $7,500 / 10% of gross box office ticket sales up to $15,000 | | ||
Two performances | | Greater of $8,000 / 10% of gross box office ticket sales up to $22,000 | | | Greater of $10,000 / 10% of gross box office ticket | | ||
Fit-up | $3,250 | $5,000 | ||||||
Commercial – Sundays and statutory holidays | ||||||||
One performance | | Greater of $7,025 / 10% of gross box office ticket sales up to $15,125 | | | Greater of $8,000 / 10% of gross box office ticket sales up to $15,125 | | ||
Two performances | | Greater of $9,000 / 10% of gross box office ticket sales up to $22,500 | | | Greater of $10,000 / 10% of gross box office ticket sales up to $25,000 | | ||
Commercial – weekly rental (based on eight performances per week) | $80,000 | $95,000 | ||||||
Fit-up | $3,250 | $5,000 | ||||||
Treasury Board and Finance | ||||||||
Cannabis retail fees | ||||||||
Non-refundable application fee for retail licence | n/a | $400 | ||||||
Retail licence | n/a | $700 | ||||||
Supplier representation registration | n/a | $200 | ||||||
| FISCAL PLAN 2018 – 21 • TABLES | 148 |
Allocation of 2018-19 Lottery Fund Revenue
(thousands of dollars)
Lottery Fund Revenue | 1,439,443 | |||||||||
Agriculture and Forestry | Environment and Parks | |||||||||
Agricultural Service Boards | 11,598 | Parks Operations | 10,000 | |||||||
Agricultural Societies and Exhibitions | 11,462 | Resource Management | 500 | |||||||
Community and Social Services | Health | |||||||||
Family and Community Safety | 6,500 | Continuing Care | 637,954 | |||||||
Family and Community Support Services | 52,000 | |||||||||
Fetal Alcohol Spectrum Disorder Initiatives | 12,000 | Indigenous Relations | ||||||||
First Nations and Metis Relations | 200 | |||||||||
Culture and Tourism | First Nations Development Fund | 123,000 | ||||||||
Alberta Media Fund | 45,965 | |||||||||
Assistance to the Alberta Foundation for Arts | 31,510 | Justice and Solicitor General | ||||||||
Assistance to the Alberta Historical Resources | 8,150 | Assistance to the Human Rights Education and Multiculturalism Fund | 1,735 | |||||||
Assistance to the Alberta Sport Connection | 18,745 | |||||||||
Community Facility Enhancement Program | 38,000 | Labour | ||||||||
Community Initiatives Program | 25,000 | Settlement and Integration | 4,574 | |||||||
Major Fairs Program | 15,350 | Skills and Training Support | 400 | |||||||
Other Initiatives | 1,000 | |||||||||
Transportation | ||||||||||
Education | Provincial Highway Maintenance | 40,000 | ||||||||
Plant Operations and Maintenance | 150,000 | |||||||||
Transportation | 150,000 | Treasury Board and Finance | ||||||||
Bingo Associations | 6,200 | |||||||||
Gaming Research | 1,600 | |||||||||
Horse Racing and Breeding Renewal Program
|
| 36,000
|
| |||||||
Total Lottery Fund Allocation | 1,439,443 | |||||||||
| FISCAL PLAN 2018 – 21 • TABLES | 149 |
Historical Fiscal Summary, 2008-09 to 2020-21 a
Consolidated Financial Statements basis (millions of dollars)
| 1 | 2 | 3 | 4 | 5 | 6 | 7 | 8 | 9 | 10 | 11 | 12 | 13 | ||||||||||||||||||||||||||||||||||||||||||
| 2008-09 | 2009-10 | 2010-11 | 2011-12 | 2012-13 | 2013-14 | 2014-15 | 2015-16 | 2016-17 | 2017-18 | 2018-19 | 2019-20 | 2020-21 | ||||||||||||||||||||||||||||||||||||||||||
| Income Statement | Actual | Forecast | Estimate | Target | Target | |||||||||||||||||||||||||||||||||||||||||||||||||
| Revenue | ||||||||||||||||||||||||||||||||||||||||||||||||||||||
1 | Personal income tax | 8,708 | 7,877 | 7,631 | 8,563 | 9,621 | 10,537 | 11,042 | 11,357 | 10,763 | 10,855 | 11,387 | 11,984 | 12,635 | ||||||||||||||||||||||||||||||||||||||||
2 | Corporate income tax | 4,252 | 4,754 | 3,334 | 3,678 | 4,756 | 5,488 | 5,796 | 4,195 | 3,769 | 3,852 | 4,551 | 5,293 | 5,719 | ||||||||||||||||||||||||||||||||||||||||
3 | Other tax revenue | 3,817 | 3,746 | 3,820 | 4,099 | 4,333 | 4,500 | 4,598 | 5,168 | 5,649 | 6,504 | 6,961 | 7,271 | 7,641 | ||||||||||||||||||||||||||||||||||||||||
4 | Resource revenue | 11,915 | 6,768 | 8,428 | 11,636 | 7,779 | 9,578 | 8,948 | 2,789 | 3,097 | 4,534 | 3,829 | 4,183 | 5,001 | ||||||||||||||||||||||||||||||||||||||||
5 | Investment income | (1,888 | ) | 3,541 | 2,486 | 2,168 | 2,595 | 3,423 | 3,113 | 2,544 | 3,698 | 3,061 | 2,884 | 3,161 | 3,357 | |||||||||||||||||||||||||||||||||||||||
6 | Premiums, fees and licences | 3,356 | 2,857 | 2,922 | 2,931 | 3,184 | 3,437 | 3,564 | 3,574 | 3,701 | 3,742 | 3,854 | 3,929 | 3,996 | ||||||||||||||||||||||||||||||||||||||||
7 | Other own-source revenue | 4,587 | 4,627 | 4,903 | 5,128 | 5,234 | 5,412 | 6,438 | 5,850 | 3,637 | 6,415 | 6,196 | 6,324 | 6,854 | ||||||||||||||||||||||||||||||||||||||||
8 | Total own-source revenue | 34,747 | 34,170 | 33,524 | 38,203 | 37,502 | 42,375 | 43,499 | 35,477 | 34,314 | 38,963 | 39,662 | 42,145 | 45,203 | ||||||||||||||||||||||||||||||||||||||||
9 | Federal transfers | 4,578 | 5,342 | 5,452 | 5,192 | 5,042 | 7,059 | 5,982 | 7,142 | 7,979 | 7,918 | 8,218 | 8,470 | 8,645 | ||||||||||||||||||||||||||||||||||||||||
10 | Total Revenue | 39,325 | 39,512 | 38,976 | 43,395 | 42,544 | 49,434 | 49,481 | 42,619 | 42,293 | 46,881 | 47,879 | 50,615 | 53,848 | ||||||||||||||||||||||||||||||||||||||||
| Expense by Function | ||||||||||||||||||||||||||||||||||||||||||||||||||||||
11 | Health | 13,674 | 14,636 | 15,393 | 16,284 | 17,254 | 17,967 | 19,366 | 20,115 | 20,687 | 21,472 | 22,099 | 22,782 | 23,478 | ||||||||||||||||||||||||||||||||||||||||
12 | Basic / advanced education | 10,438 | 11,067 | 11,362 | 11,951 | 12,394 | 12,782 | 13,103 | 13,673 | 14,110 | 14,301 | 14,633 | 15,038 | 15,478 | ||||||||||||||||||||||||||||||||||||||||
13 | Social services | 3,417 | 3,807 | 4,129 | 4,278 | 4,641 | 4,668 | 4,548 | 4,752 | 5,198 | 5,773 | 5,922 | 6,135 | 6,293 | ||||||||||||||||||||||||||||||||||||||||
14 | Other program expense | 10,386 | 9,734 | 9,269 | 9,683 | 10,528 | 11,600 | 12,395 | 10,375 | 12,607 | 13,378 | 11,916 | 11,804 | 11,997 | ||||||||||||||||||||||||||||||||||||||||
15 | Total program expense | 37,915 | 39,344 | 40,327 | 42,366 | 44,817 | 48,387 | 48,048 | 48,915 | 52,602 | 54,924 | 54,570 | 55,759 | 57,246 | ||||||||||||||||||||||||||||||||||||||||
16 | Debt servicing costs | 208 | 214 | 472 | 509 | 530 | 601 | 722 | 776 | 1,018 | 1,355 | 1,921 | 2,434 | 2,937 | ||||||||||||||||||||||||||||||||||||||||
17 | Pension provisions | 2,133 | 430 | 439 | 634 | 296 | 748 | (404 | ) | (630 | ) | (543 | ) | (332 | ) | (310 | ) | (366 | ) | (365 | ) | |||||||||||||||||||||||||||||||||
18 | Total Expense | 40,256 | 39,988 | 41,238 | 43,509 | 45,643 | 49,736 | 48,366 | 49,061 | 53,077 | 55,947 | 56,181 | 57,827 | 59,818 | ||||||||||||||||||||||||||||||||||||||||
19 | Surplus / (Deficit) - less risk adjust. starting 2018-19 | (931 | ) | (476 | ) | (2,262 | ) | (114 | ) | (3,099 | ) | (302 | ) | 1,115 | (6,442 | ) | (10,784 | ) | (9,066 | ) | (8,802 | ) | (7,912 | ) | (6,970 | ) | ||||||||||||||||||||||||||||
Capital Plan b | 7,943 | 8,000 | 7,544 | 6,884 | 6,062 | 5,770 | 6,181 | 6,558 | 6,578 | 9,165 | 6,444 | 5,884 | 6,032 | |||||||||||||||||||||||||||||||||||||||||
Balance Sheet (at March 31) | ||||||||||||||||||||||||||||||||||||||||||||||||||||||
20 | Heritage / endowment funds | 16,900 | 17,077 | 17,500 | 17,936 | 18,176 | 18,562 | 18,860 | 19,262 | 19,836 | 20,323 | 20,778 | 21,298 | 21,872 | ||||||||||||||||||||||||||||||||||||||||
21 | Contingency Account | 16,822 | 14,983 | 11,192 | 7,497 | 3,326 | 4,658 | 6,529 | 3,625 | 2,299 | 1,661 | - | - | - | ||||||||||||||||||||||||||||||||||||||||
22 | Other financial assets | 28,868 | 30,338 | 30,799 | 32,972 | 34,734 | 40,039 | 40,688 | 41,138 | 44,152 | 47,591 | 49,785 | 51,640 | 53,866 | ||||||||||||||||||||||||||||||||||||||||
23 | Capital Plan liabilities | (880 | ) | (2,888 | ) | (3,199 | ) | (3,442 | ) | (4,594 | ) | (8,724 | ) | (11,922 | ) | (19,040 | ) | (23,769 | ) | (29,306 | ) | (33,159 | ) | (36,964 | ) | (41,400 | ) | |||||||||||||||||||||||||||
24 | Pre-1992 Teachers’ Pension Plan debt / operating liabilities | - | (1,187 | ) | (1,187 | ) | (1,187 | ) | (1,187 | ) | (1,187 | ) | (943 | ) | (944 | ) | (9,529 | ) | (14,023 | ) | (21,061 | ) | (28,885 | ) | (35,766 | ) | ||||||||||||||||||||||||||||
25 | Pension obligations | (10,239 | ) | (9,483 | ) | (9,922 | ) | (10,556 | ) | (10,852 | ) | (11,600 | ) | (11,196 | ) | (10,566 | ) | (10,023 | ) | (9,691 | ) | (9,381 | ) | (9,015 | ) | (8,650 | ) | |||||||||||||||||||||||||||
26 | Other liabilities | (19,770 | ) | (21,523 | ) | (23,530 | ) | (24,229 | ) | (25,148 | ) | (28,716 | ) | (28,962 | ) | (29,594 | ) | (31,867 | ) | (36,824 | ) | (37,472 | ) | (37,850 | ) | (38,081 | ) | |||||||||||||||||||||||||||
27 | Net Financial Assets / (Debt) | 31,701 | 27,317 | 21,653 | 18,991 | 14,455 | 13,032 | 13,054 | 3,881 | (8,901 | ) | (20,269 | ) | (30,510 | ) | (39,776 | ) | (48,159 | ) | |||||||||||||||||||||||||||||||||||
28 | Capital / non-fin. assets - less defer. contrib. starting 2012-13 | 30,275 | 34,217 | 37,607 | 40,122 | 39,517 | 40,839 | 42,197 | 44,661 | 46,622 | 48,924 | 50,363 | 51,717 | 53,130 | ||||||||||||||||||||||||||||||||||||||||
29 | Net Assets c | 61,976 | 61,534 | 59,260 | 59,113 | 53,972 | 53,871 | 55,251 | 48,542 | 37,721 | 28,655 | 19,853 | 11,941 | 4,971 | ||||||||||||||||||||||||||||||||||||||||
| a | Numbers are not strictly comparable due to numerous accounting policy changes over time. Examples include reporting certain items (transfers through the tax system, crude oil marketing and transportation costs, allowance for corporate income tax doubtful accounts) as expense, instead of netting the amounts from related revenue, increasing both revenue and expense, but not impacting the surplus / (deficit). 2015-16 revenue includes $84 million in donations to post-secondary and health authority endowments, which were not reported as revenue in prior years but rather as “adjustments to net assets.” 2015-16 revenue and expense have been increased by $119 million to correct a consolidation adjustment eliminating those amounts at year-end, with no deficit impact. 2016-17 revenue and expense have been reduced by $111 million resulting from an accounting treatment change such that drug cost rebates under Product Listing Agreements are netted from operating expense instead of being reported as revenue and gross expense. |
| b | Reflects capital grants and other support included in expense, and capital investment in government-owned assets not included in expense. Capital investment adds to capital assets, which are depreciated over time through amortization expense. Numbers for 2008-09 to 2013-14 are estimates as details required to consolidate SUCH capital spending with full accuracy are not readily available. |
| c | The change in net assets year over year does not match the surplus / (deficit) exactly in most years, due to various balance sheet adjustments, most of which are minor. A significant adjustment reducing net assets by $2 billion was made in 2012-13, to recognize the accumulated deferred capital contribution liability when the accounting standard was adopted |
| FISCAL PLAN 2018 – 21 • TABLES | 150 |
Fiscal Plan
Response to the
Auditor General
∎ May 2017
∎ October 2017
| FISCAL PLAN 2018 – 21 • RESPONSE TO THE AUDITOR GENERAL | 151 |
Table of Contents
RESPONSE TO THE AUDITOR GENERAL
May 2017 | 153 | |
October 2017 | 158 | |
| FISCAL PLAN 2018 – 21 • RESPONSE TO THE AUDITOR GENERAL | 152 |
Response to the Auditor General – May 2017
The Auditor General reports on the scope and findings of the work carried out by the Office of the Auditor General. The following are the recommendations in the Auditor General’s report titled Report of the Auditor General of Alberta – May 2017 and the government’s response to each of them.
AUDITOR GENERAL’S RECOMMENDATIONS
|
GOVERNMENT’S RESPONSE
| |
Justice and Solicitor General – Funding Sustainable and Cost-Effective Legal Aid Services
1. Determine the type and scope of services a public legal aid system can sustain
We recommend that the Department of Justice and Solicitor General determine, through analysis, the type and scope of services Alberta’s publicly funded legal aid system can provide and sustain.
2. Ensure performance measures in place for legal aid services
We recommend that the Department of Justice and Solicitor General ensure there are processes in place to measure, monitor and report on the quality, efficiency and cost-effectiveness of publicly funded legal aid services.
|
Accepted. The Department of Justice and Solicitor General will work with Legal Aid Alberta to develop a funding/cost model that will assist the department to better assess:
• demand and budget requirements for legal aid services; and • the costs and benefits of various legal aid services.
An improved governance agreement is being negotiated with Legal Aid Alberta and the Law Society of Alberta (tri-partite signatories), with a focus on renewed mandate, governance accountability, performance measuring, specific scope, and value. Negotiations are expected to conclude with the agreement ratified by the end of 2018.
Accepted. The Department of Justice and Solicitor General will work with Legal Aid Alberta to create a provincial performance measurement framework to measure the overall effectiveness of the delivery of legal aid services. The framework will:
• outline key performance indicators to measure quality, efficiency, and cost effectiveness of legal aid; and • evaluate business processes, improvements, financial, workforce outputs, outcomes and impacts.
The development of the measurement framework is expected to be completed by the end of 2018.
| |
| FISCAL PLAN 2018 – 21 • RESPONSE TO THE AUDITOR GENERAL | 153 |
AUDITOR GENERAL’S RECOMMENDATIONS
|
GOVERNMENT’S RESPONSE
| |
Service Alberta – Systems to Manage a Comprehensive Inventory of IT Applications
3. Establish a comprehensive inventory system for information technology applications used across government
We recommend that Service Alberta complete its plans to implement a comprehensive inventory system of all IT applications used across government, with supporting processes to maintain the inventory. If required, Service Alberta should seek the necessary authority to complete the project.
Treasury Board and Finance – Travel, Meal and Hospitality Expenses of the Premier, Ministers, Associate Ministers and Their Staff
The Department of Treasury Board and Finance has responsibility for government expense policies, so we report our overall audit results to that department. Where our audits identify that individual departments can improve their processes, we direct specific recommendations to those individual departments – in this case, the Department of Advanced Education.
4. Improve review of travel, meal and hospitality expenses
We recommend that the Department of Advanced Education improve its review processes for travel, meal and hospitality expenses. |
Accepted. The Department of Service Alberta will continue its application repository project, which involves working collaboratively with departments across government, to build an Information Technology Application Catalogue. A detailed project plan was formalized and the first iteration of the Application Catalogue was launched in June 2017.
Accepted. The Department of Advanced Education:
• met with the Minister’s Office; • improved documentation of business rationale for expenses; • updated tools such as expense manuals and checklists; and • provided more training for staff.
This recommendation is ready for follow-up audit.
| |
| FISCAL PLAN 2018 – 21 • RESPONSE TO THE AUDITOR GENERAL | 154 |
AUDITOR GENERAL’S RECOMMENDATIONS
|
GOVERNMENT’S RESPONSE
| |
Environment and Parks – Alberta Climate Change Office – Follow-up Audit on Managing the Specified Gas Emitters Regulation – Alberta Emissions Offset Registry
5. Obtain assurance on the registry provider’s data – repeated
We again recommend that the Department of Environment and Parks obtain assurance that data hosted and processed by its provider of registry services is accurate, complete and secure.
Indigenous Relations – Follow-up Audit on Systems to Assess First Nations Development Fund Grants
6. Improve review processes – repeated
We again recommend that the Department of Indigenous Relations improve its processes to review and approve grant applications by: • formalizing the additional review processes it developed for complex grant applications • consistently obtaining sufficient information to support its assessment of complex grant applications |
Accepted. The Department of Environment and Parks:
• receives quarterly confirmation from CSA Registries that their registry security, backup and storage controls remain in place;
• has contracted an independent audit organization to conduct a comprehensive service provider audit of CSA Registries; and
• will use the audit report results to inform CSA Registries of future internal control and audit requirements.
The service provider audit of CSA Registries is expected to be completed in the 2017-18 fiscal year.
Accepted. The Department of Indigenous Relations will:
• implement the newly-created First Nations Development Fund (FNDF) Complex Application Assessment Process Policy;
• incorporate the new procedure into the FNDF Grant Program Procedural Manual and FNDF Grant Program Guide;
• work with First Nations to ensure they provide sufficient information to support the assessment of their complex grant applications; and
• provide guidance and support to First Nations in the development of complex project applications.
|
| FISCAL PLAN 2018 – 21 • RESPONSE TO THE AUDITOR GENERAL | 155 |
AUDITOR GENERAL’S RECOMMENDATIONS
|
GOVERNMENT’S RESPONSE
| |
7. Improve monitoring processes – repeated
We again recommend that the Department of Indigenous Relations improve its monitoring processes by consistently ensuring First Nations comply with reporting requirements and acting to correct non-compliance with a grant agreement.
Advanced Education – Post-Secondary Institutions Report Card
8. Improve systems to ensure compliance with legislation – repeated
We again recommend that Northern Lakes College, Olds College and Portage College implement systems to:
• understand what legislation they must comply with
• develop appropriate policies, procedures and controls to ensure compliance with legislation
• monitor and report non-compliance to senior management and the board audit committee |
Accepted. The Department of Indigenous Relations will:
• ensure the reporting review guidelines and procedures are implemented on a consistent basis; • develop a procedure to analyze and document financial reporting variances between actual and budgeted project costs when the variance is material; • ensure liaison officers are providing more on-site support and guidance to First Nations who are not in compliance with their reporting requirements; and • develop specific training that better reflects the needs of the FNDF staff.
Accepted. Northern Lakes College addressed the items identified during the design effectiveness audit test of the process. This recommendation has been implemented.
Olds College developed a board policy and an administrative policy along with reporting mechanisms to the audit committee and the Board of Governors for legislative compliance. The college has a procedure for monitoring legislative compliance on an ongoing basis. A report on the Olds College legislative compliance was recently provided to the audit committee and to the Board of Governors. This recommendation has been implemented.
Portage College identified all applicable legislation and has assessed and monitored the risks. The college provided its first formal compliance/non-compliance report to the Board of Governors in its fourth quarter of the 2016-17 fiscal year. This recommendation has been implemented.
|
| FISCAL PLAN 2018 – 21 • RESPONSE TO THE AUDITOR GENERAL | 156 |
AUDITOR GENERAL’S RECOMMENDATIONS
|
GOVERNMENT’S RESPONSE
| |
9. Improve segregation of duties – repeated
We again recommend that Lakeland College improve segregation of duties within the finance department. |
Accepted. Lakeland College engaged in a risk assessment process, developed an action plan, and took action to address the significant risks identified. Lakeland College also engaged an external consultant to review its financial processes and controls. This recommendation has been implemented.
|
| FISCAL PLAN 2018 – 21 • RESPONSE TO THE AUDITOR GENERAL | 157 |
Response to the Auditor General – October 2017
The Auditor General reports on the scope and findings of the work carried out by the Office of the Auditor General. The following are the recommendations in the Auditor General’s report titled Report of the Auditor General of Alberta – October 2017 and the government’s response to each of them.
AUDITOR GENERAL’S RECOMMENDATIONS
|
GOVERNMENT’S RESPONSE
| |
Performance Auditing
Infrastructure – Government of Alberta Capital Planning
Improve capital planning standards and phased approach to capital planning and approval
We recommend that the Department of Infrastructure improve its capital planning system by:
• updating its capital planning standards • clarifying the capital planning phases and the planning deliverables required for each phase • verifying if departments have completed the required planning for capital submissions and, if not, reporting this information to government committees
Improve maintenance planning systems
We recommend that the Department of Infrastructure:
• obtain information from departments on their maintenance needs and risks, and on the results they aim to achieve with the maintenance funding they request • analyze the departments’ maintenance information and provide objective advice to government committees on maintenance funding |
Accepted. The Department of Infrastructure will update the Capital Plan Manual, including:
• incorporating information on project phases and required approvals to move between phases; • clarifying the minimum level of planning that is to be completed prior to program ministries’ requesting project funding; • developing a process for in-year approvals; • clarifying the submission review process; and • providing guidance that explains how information is reported to government committees for decision.
The Department of Infrastructure expects an updated Capital Plan Manual to be approved and distributed for use in the development of the capital plan for Budget 2019.
Accepted. The Department of Infrastructure will build in a process to provide analysis and advice for decision makers. The review of the Capital Plan Manual will include updates to the planning requirements for maintenance funding. Enhancements will include requiring submissions to identify information such as maintenance needs, identification of risks, expected results and impact on facility condition. |
| FISCAL PLAN 2018 – 21 • RESPONSE TO THE AUDITOR GENERAL | 158 |
AUDITOR GENERAL’S RECOMMENDATIONS
|
GOVERNMENT’S RESPONSE
| |
Evaluate capital maintenance programs for buildings
We recommend that the Department of Infrastructure work with affected departments to lead a review of the four capital maintenance programs for buildings and evaluate whether they are working well.
Advanced Education – Collaborative Initiatives Among Post-secondary Institutions
Develop strategic plan and accountability framework – recommendation repeated
We again recommend that the Department of Advanced Education, working with institutions:
• develop and communicate a strategic plan that clearly defines the minister’s expected outcomes for Campus Alberta, initiatives to achieve those outcomes, the resources required and sources of funding • develop relevant performance measures and targets to assess if the outcomes are being achieved • publicly report results and the costs associated with collaborative initiatives • review and clarify the accountability structure for governing collaborative initiatives
Develop processes and guidance to plan, implement and govern collaborative projects – recommendation repeated
We again recommend that the Department of Advanced Education, working with institutions, develop systems and guidance for institutions to follow effective project management processes for collaborative initiatives.
|
Accepted. The Department of Infrastructure will work with affected departments and lead a review of their capital maintenance programs in 2018. Based on the results of that review, the department will provide appropriate guidance to affected departments with regard to oversight of maintenance programs and funds, and monitoring and reporting on results achieved.
Accepted. The Department of Advanced Education is currently undertaking a funding review and is in the third phase of the Agencies, Boards, and Commissions review, focusing on Alberta public post-secondary institutions including collaboration mandates. This work will guide the department in developing a strategic plan and accountability framework for the post-secondary system by 2020-21.
Accepted. The Department of Advanced Education’s implementation of the strategic plan and accountability framework, described above, will support the development of processes and guidance to plan, implement, and govern collaborative projects.
|
| FISCAL PLAN 2018 – 21 • RESPONSE TO THE AUDITOR GENERAL | 159 |
AUDITOR GENERAL’S RECOMMENDATIONS
|
GOVERNMENT’S RESPONSE
| |
Health – Primary Care Networks
Evaluate PCN effectiveness
We recommend that the Department of Health, through its leadership role in the PCN Governance Structure, work with the PCNs and PCN physicians to:
• agree on appropriate targets for each PCN program performance measure, and require PCNs to measure and report results in relation to the targets • develop a formal action plan for public reporting of PCN program performance
Informing Albertans about PCN services
We recommend that the Department of Health, through its leadership role in the PCN Governance Structure, work with PCNs and PCN physicians to:
• require PCN physicians to complete the established patient attachment process, and set appropriate timelines for completing this process • agree on the best approaches for engaging Albertans as active participants in their own care and explaining the PCN services available to help them achieve their health goals |
Accepted. The Department of Health:
• has set out expectations for Primary Care Networks (PCNs) in grant agreements that stipulate performance measures for primary health care. These performance measures are supported by guidelines that were informed by consultation with PCNs and subject matter experts; • is working to update performance measures to reflect new directions for primary health care; and • will work with the PCNs, the Provincial PCN Committee and leadership to create an action plan and develop public reporting of the PCN system performance, program results compared to targets, and the impact of PCNs across the province. These reports are expected to be developed by September 2020.
Accepted. The Department of Health:
• is establishing a strategy to communicate and implement the concepts of “attachment” and “health home” for Albertans; and • will implement a process for PCN physicians to register confirmed attachment relationships with their patients. The department has contracted Alberta Blue Cross to develop and administer a Central Patient Attachment Registry, which will provide a provincial repository of attachment relationships between individual Albertans and their primary care providers. This is expected to be completed by April 2018. |
| FISCAL PLAN 2018 – 21 • RESPONSE TO THE AUDITOR GENERAL | 160 |
AUDITOR GENERAL’S RECOMMENDATIONS
|
GOVERNMENT’S RESPONSE
| |
Financial Statement Auditing
Advanced Education
We again recommend that the Department of Advanced Education implement an integrated enterprise risk management framework to identify and mitigate relevant risks.
Culture and Tourism
Improve controls over administration of the Alberta Production Grant Program
We recommend that the Department of Culture and Tourism improve its controls over administration of the Alberta Production Grant Program by:
• defining and documenting clear, easy-to-understand criteria for Alberta eligible expenses; and communicating them to stakeholders • using a risk-based approach when selecting grant files to audit • establishing a mechanism to facilitate more timely recovery of funds in instances where the department identified applicants claiming ineligible expenses
Economic Development and Trade
Improve financial reporting processes
We recommend that Alberta Innovates improve its financial reporting processes by implementing effective internal controls and quality review processes to ensure accurate and complete financial reporting.
|
Accepted. An Enterprise Risk Management (ERM) maturity assessment is currently being conducted and will form the development of a new ERM framework. The new ERM process is expected to be implemented and integrated into the planning process in preparation for the 2019-22 business plan.
Accepted. The Department of Culture and Tourism has replaced the Alberta Production Grant Program with a new screen based production grant program. The new program defines and documents clear, easy-to-understand criteria for Alberta eligible expenses. The new program and guidelines will be communicated to stakeholders.
The risk assessment framework followed will be documented when selecting grant files to audit. The framework will be reviewed and approved periodically as audits are completed.
The processes used to facilitate a more timely recovery of funds in instances where applicants claimed ineligible expenses will be improved. In addition, a scoping document on past files will be developed that will include an analysis of the potential recovery of any amounts identified.
Accepted. Alberta Innovates has developed a comprehensive implementation plan to establish effective internal controls and quality review processes to ensure accurate and complete financial reporting. This recommendation is expected to be implemented by March 2018.
|
| FISCAL PLAN 2018 – 21 • RESPONSE TO THE AUDITOR GENERAL | 161 |
AUDITOR GENERAL’S RECOMMENDATIONS
|
GOVERNMENT’S RESPONSE
| |
Education
Implement an enterprise risk management process
We recommend that the Department of Education implement an enterprise risk management process.
Improve controls over tracking and reporting cost obligations for school construction projects
We recommend that the Department of Education improve controls over tracking and reporting cost obligations for school construction projects.
Seniors and Housing
Improve change management control procedures
We recommend that the Alberta Social Housing Corporation improve and implement change management control procedures to ensure changes to the information systems within its computing environment are implemented in a controlled and consistent manner.
Treasury Board and Finance
Apply policies when recommending approval to Treasury Board Committee
We recommend the Department of Treasury Board and Finance consistently apply its policies when recommending to Treasury Board Committee to approve a payment based on agreement request. |
Accepted. The Department of Education is establishing an enterprise risk management process, including developing a risk register, evaluating risks and establishing treatment plans to mitigate identified risks. It is anticipated that the enterprise risk management process will be finalized by April 2018 and that treatment plans will be implemented and continually monitored by April 2019.
Accepted. The Department of Education is now using Alberta Infrastructure’s School Facilities Database System, which has enhanced controls, to ensure that contractual obligations for school construction projects are accurately recorded and tracked.
Accepted. A review of Alberta Social Housing Corporation’s IT change management process has been undertaken, resulting in various enhancements to the existing controls. This recommendation is currently undergoing a follow-up audit.
Accepted. The Department of Treasury Board and Finance will update its policies and will ensure it consistently applies its policies when recommending to Treasury Board Committee to approve a payment based on agreement request. |
| FISCAL PLAN 2018 – 21 • RESPONSE TO THE AUDITOR GENERAL | 162 |
AUDITOR GENERAL’S RECOMMENDATIONS
|
GOVERNMENT’S RESPONSE
| |
Update and follow enterprise risk management system – recommendation repeated
We again recommend that the Department of Treasury Board and Finance update and follow its enterprise risk management system by identifying, monitoring, communicating and appropriately mitigating relevant risks.
|
Accepted. The Department of Treasury Board and Finance has made progress on implementing an updated enterprise risk management (ERM) system. Implementation of the updated ERM framework, including the identification and mitigation of key strategic risks, was initiated and is an integral component of the 2017-18 business planning process. The department expects to update and follow its enterprise risk management system within the 2017-18 fiscal year. |
| FISCAL PLAN 2018 – 21 • RESPONSE TO THE AUDITOR GENERAL | 163 |