Exhibit 99.8

Table of Contents
Note: Amounts presented in tables may not add to totals due to rounding.
Notes on restatements of numbers:
| | ● | 2017-18 Actuals for Service Alberta operating expense and capital grants have been restated as $5 million in operating expense should have been reported as capital grants. There is no change to total expense or the deficit. |
| | ● | 2017-18 Actuals for operating expense have been restated to reflect corrected transfers between ministries and Service Alberta for Information Management and Technology services, implemented as part of Budget 2018. These were properly reflected in 2018-19 budget numbers. A second phase of these transfers was implemented pursuant to Order in Council 297/2018 (October 3, 2018) under the Government Organization Act. The total impacts, none of which change total expense, the deficit or borrowing amounts, are: operating expense: $244 million in 2017-18 and $163 million in 2018-19; amortization expense: $32 million in 2017-18 and $26 million in 2018-19; capital investment: $22 million in 2017-18 and $12 million in 2018-19. |
| | ● | 2017-18 Actual and 2018-19 Budget numbers have been restated, pursuant to Order in Council 297/2018 (October 3, 2018) under the Government Organization Act, to reflect the following transfers, none of which change total expense, the deficit or borrowing amounts: |
| | ∎ | Freedom of Information and Protection of Privacy services from ministries to Service Alberta (operating expense: $11 million in 2017-18 and $11 million in 2018-19); |
| | ∎ | Human Resource services from ministries to Treasury Board and Finance (operating expense: $49 million in 2017-18 and $51 million in 2018-19). |
Treasury Board and Finance, Government of Alberta
2018–19 Second Quarter Fiscal Update and Economic Statement, November 2018
Additional copies of this report may be obtained by visiting our website at: www.alberta.ca/budget-documents.aspx
| | |
| | | |
2 | | 2018–19 Second Quarter Fiscal Update and Economic Statement |
2018 –19 Second Quarter Highlights
Deficit decreases but pipeline bottlenecks weigh on outlook
| | | | |
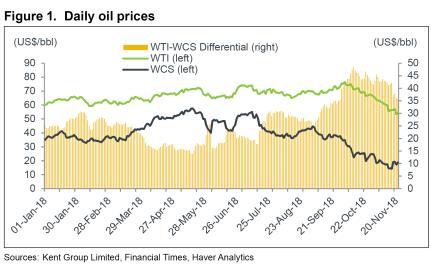
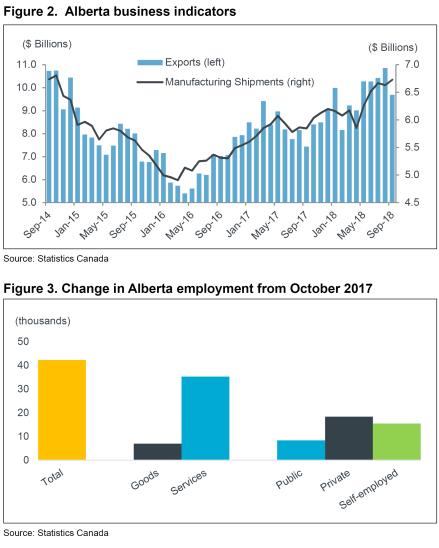
Deficit and borrowing lower The 2018-19 deficit is now forecast at $7.5 billion, $1.3 billion lower than Budget 2018: ● Total revenue of $49.6 billion is forecast, up $1.7 billion from budget, due primarily to higher resource and personal income tax revenue, partially offset by lower investment income and corporate income tax revenue. ● Total expense of $56.6 billion is forecast, up $436 million from Budget 2018. Expense increases are mainly related to wildfire and agriculture disaster assistance, federally-funded capital grants re-profiled from 2017-18 and increases in operating expense mainly for the Lubicon Lake land claim, pipeline advocacy, Legal Aid changes and indexation of social programs like Assured Income for the Severely Handicapped. ● 2018-19 Capital Plan spending is forecast to be largely unchanged from budget, with projects from 2017-18 re-profiled or carried-over into this year essentially offset by projects re-profiled from 2018-19 to future years, based on progress. ● Mainly as a result of the lower deficit, borrowing for the Fiscal Plan and Capital Plan is now projected to be $1.4 billion lower than initially estimated in Budget 2018. | | Economic recovery on track; market access elevates risk Alberta’s economic recovery has continued, propelled by higher- than-expected oil prices in the first six months of the fiscal year. However, recent escalation of market access issues, from transportation bottlenecks and pipeline delays, have caused severe discounts for Alberta crudes. More recently, concerns about a global oil supply glut have caused oil prices, including Alberta’s, to weaken. Alberta business activity has been strong so far this year, aided by a lower US-Canadian dollar exchange rate. Manufacturing shipments are at a four-year high, while crude oil production is expected to be up 8.4% relative to 2017-18. Moving forward, falling global oil prices and record highs for the Alberta light-heavy oil price differential have dampened growth expectations. | | Some Alberta oil producers have begun to shut in production and weaker corporate profits will impact the investment outlook next year. As a result, Alberta real GDP growth forecasts for 2018 and 2019 have been revised down to 2.5% and 2.0%, from the 2.7% and 2.5% estimates in Budget 2018. Employment is improving, with over 42,000 jobs added since October 2017, reflecting broad-based gains. Employment in 2018 is forecast to grow as expected in Budget 2018, but will slow next year, due to lower energy investment and related activity. Substantial uncertainty remains. Market access, as well as ongoing global market and geopolitical risks, will continue to contribute to significant volatility in oil prices and the light-heavy oil price differential, impacting Alberta producers, the government and Canadian taxpayers |
| |  |
| | |
| 2018–19 Second Quarter Fiscal Update and Economic Statement | | 3 |
2018–19 Second Quarter Fiscal Update
Fiscal Plan Highlights
A deficit of $7.5 billion is forecast for 2018-19, $1.3 billion lower than estimated in Budget 2018, due primarily to higher revenue.
Total revenue of $49.6 billion is forecast, up $1,726 million from budget. Higher resource and personal income tax revenue is partly offset by lower investment income and corporate income tax revenue.
Total expense of $56.6 billion has increased $436 million from budget:
| ● | | Operating expense (excluding Climate Leadership Plan - CLP) is $121 million higher, mainly reflecting increases for implementing child intervention panel recommendations, the Lubicon Lake Band settlement, Legal Aid, support to municipalities |
| | for cannabis legalization, advocacy regarding the Trans Mountain pipeline, election enumeration costs and indexation of social programs. CLP operating expense has decreased $6 million due to reallocations to CLP capital spending. |
| ● | | Disaster expense is $253 million higher, with increases for wildfire fighting, agriculture support and municipal floods partly offset by removing the $200 million in unallocated budgeted expense. |
| ● | | Capital grant expense has been increased by a net $122 million, mainly from re-profiling federally-funded municipal infrastructure programs, and a transfer for housing projects from capital investment. |
| ● | | Other expense is down $55 million, due mainly to lower debt servicing costs from reduced borrowing. |
The Capital Plan is in line with budget, at $6.4 billion. Decreases from re-profiling of health, school, ring road and housing projects to match anticipated project timelines, are offset by re-profiling of federally-funded municipal grants and capital investment carry-overs from 2017-18.
Direct borrowing for the Fiscal Plan is estimated at $5.7 billion, $1,307 million lower than budget, due primarily to the lower forecast deficit. Direct borrowing for the Capital Plan is forecast at $3.7 billion, a decrease of $95 million from budget, due mainly to additional federal cash transfers.
Fiscal Plan Summary (millions of dollars)
| | | | | | | | | | | | | | | | |
| | | Fiscal Year | | | Change | |
| | | 2017-18 | | | 2018-19 | | | from | |
| Income Statement | | Actual | | | Budget | | | Forecast | | | Budget | |
| | | | |
| Revenue | | | | | | | | | | | | | | | | |
Income tax revenue | | | 14,223 | | | | 15,938 | | | | 16,318 | | | | 380 | |
Other tax revenue | | | 6,538 | | | | 6,961 | | | | 6,884 | | | | (77 | ) |
Non-renewable resource revenue | | | 4,980 | | | | 3,829 | | | | 5,322 | | | | 1,493 | |
Other revenue | | | 21,553 | | | | 21,152 | | | | 21,081 | | | | (71 | ) |
Total Revenue | | | 47,295 | | | | 47,879 | | | | 49,605 | | | | 1,726 | |
| | | | |
Expense | | | | | | | | | | | | | | | | |
Operating expense | | | 46,229 | | | | 47,765 | | | | 47,886 | | | | 121 | |
Climate Leadership Plan operating expense | | | 521 | | | | 1,035 | | | | 1,029 | | | | (6 | ) |
Disaster assistance (with operating 2013 flood support) | | | 438 | | | | 205 | | | | 458 | | | | 253 | |
Wood Buffalo Disaster Recovery Program | | | 1 | | | | 1 | | | | 1 | | | | - | |
Capital grants (including 2013 flood support) | | | 3,628 | | | | 1,706 | | | | 1,823 | | | | 117 | |
Climate Leadership Plan capital grants | | | 394 | | | | 423 | | | | 429 | | | | 5 | |
Amortization / inventory consumption / disposal losses | | | 3,282 | | | | 3,434 | | | | 3,426 | | | | (8 | ) |
General debt servicing costs | | | 659 | | | | 1,027 | | | | 982 | | | | (45 | ) |
Capital Plan debt servicing costs | | | 761 | | | | 895 | | | | 893 | | | | (2 | ) |
Pension provisions | | | (593 | ) | | | (310 | ) | | | (310 | ) | | | - | |
Total Expense | | | 55,318 | | | | 56,181 | | | | 56,617 | | | | 436 | |
Risk Adjustment | | | - | | | | (500 | ) | | | (500 | ) | | | - | |
Surplus / (Deficit) | | | (8,023 | ) | | | (8,802 | ) | | | (7,512 | ) | | | 1,290 | |
Capital Plan | | | | | | | | | | | | | | | | |
Capital grants | | | 3,628 | | | | 1,706 | | | | 1,823 | | | | 117 | |
Capital investment | | | 4,974 | | | | 4,123 | | | | 3,992 | | | | (131 | ) |
Climate Leadership Plan (capital grants) | | | 394 | | | | 423 | | | | 429 | | | | 5 | |
Climate Leadership Plan (capital investment) | | | 25 | | | | 192 | | | | 193 | | | | 1 | |
Total Capital Plan | | | 9,021 | | | | 6,444 | | | | 6,436 | | | | (8 | ) |
| | |
| | | |
4 | | 2018–19 Second Quarter Fiscal Update and Economic Statement |
Revenue and Expense Highlights
Total Revenue is forecast to be $49.6 billion, $1.7 billion higher than estimated in Budget 2018.
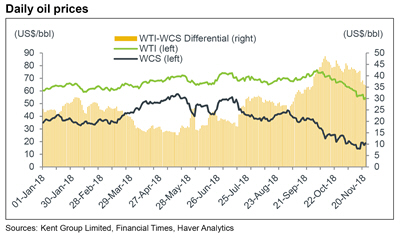
| ● | | Resource revenue is forecast to be $5.3 billion, $1,493 million higher than budget, mainly due to an increased forecast for the fiscal- year average oil price, and a lower US-Canadian dollar exchange rate, partly offset by a wider light-heavy oil price differential. |
| ● | | The West Texas Intermediate (WTI) oil price is now forecast at US$64 per barrel for 2018-19, up $5 from budget. WTI has averaged US$68 so far this fiscal year (up to November 26). The exchange rate forecast has been reduced by two and a half cents from budget, to 77.5 US¢/Cdn$, while the light-heavy oil price differential, which has been very volatile, is forecast to average US$29.25 per barrel for the fiscal year, US$6.90 wider than budget. |
| ● | | Bitumen royalties are forecast to be $1 billion higher than budget, while crude oil royalties have increased $265 million. Natural gas and by- products royalties have increased by $177 million, due mainly to lower producer costs and the impact of higher oil prices on by-product royalties. The natural gas Alberta Reference Price forecast has been decreased by 50 cents, to Cdn$1.50 per gigajoule. |
| ● | | Personal income tax revenue is forecast at $12.1 billion, an increase of $742 million from budget, due primarily to higher- than-expected 2017 assessments, which elevates the base used to forecast 2018 revenue and requires a positive $450 million prior-years’ adjustment (the 2017 portions of 2016-17 and 2017 -18 revenue were under-reported). |
| ● | | Corporate income tax revenue is forecast at $4.2 billion, a decrease of $362 million from the estimate in Budget 2018, due mainly to the impact of the wider light-heavy oil price differential. |
| ● | | Other tax revenue is forecast at $6.9 billion, a $77 million decrease from budget, due primarily to a revised forecast for the carbon levy and the impact of lower- than-expected 2017-18 insurance premiums taxes. |
| ● | | Federal transfers of $8.2 billion are forecast, $27 million higher than estimated in Budget 2018. Increases of $94 million in infrastructure support, mainly from re-profiling municipal programs from 2017-18, and $15 million primarily for municipal flood support, are partially offset by reductions in health and social transfers due to updated projections of Alberta’s population. |
| ● | | Investment income is forecast at $2.6 billion, $265 million lower than the Budget 2018 estimate, due to weaker market returns, and to reduced Alberta Capital Finance Authority (ACFA) net income from lower payments on loan swaps (a similar impact on debt swaps decreases debt servicing costs) |
| ● | | Total revenue from other sources is forecast at $10.2 billion, $167 million higher than budget. Government business enterprise income has increased $120 million, mainly from lower costs and higher sales in AGLC, and improvements to Balancing Pool and Alberta Petroleum Marketing Commission (APMC) income. Reduced income to APMC from the delayed start- up of the North West Redwater Partnership upgrader is now more than offset by the impact of the wider oil price differential. Other revenue is up a net $47 million, with higher timber royalties and health authority out-of-province patient fees, service revenue and donations, partly offset by lower agriculture insurance participation. |
Total Expense is forecast to be $56.6 billion, $436 million higher than estimated in Budget 2018.
| ● | | Total operating expense is forecast at $48.9 billion, $115 million higher |
| | than Budget 2018. Main increases from budget are for implementing child intervention panel recommendations, a settlement with the Lubicon Lake First Nation, enhanced indigenous consultation capacity, Legal Aid and Victims of Crime program improvements, support to municipalities for cannabis legalization, indexation of various social programs, higher costs of selling oil, caseload growth in programs for seniors, public advocacy on the benefits of the Trans Mountain pipeline project, and election enumeration costs. These are partly offset by decreases primarily from lower agriculture hail and livestock insurance indemnities and a transfer of $6 million to Climate Leadership Plan capital spending. |
| ● | | Total capital grants of $2.3 billion are forecast, a net increase of $122 million. This mainly includes $103 million in federal funding for re-profiled municipal grants and Investing in Canada Infrastructure projects, $21 million from capital investment for housing projects, a net $5 million from Climate Leadership Plan operating expense, and $5 million for flood mitigation, partly offset by re- profiling $12 million to future years. |
| ● | | Disaster assistance of $459 million is forecast, $253 million higher than budget. Increases comprise agriculture support of $200 million for spring drought and fall snow conditions, $186 million for early summer wildfire activity and municipal support of $67 million for spring flooding. These are partially offset by removal of the budgeted unallocated $200 million. |
| ● | | Debt servicing costs have decreased $47 million, consisting of $24 million from lower borrowing, and a $25 million reduction in ACFA costs, partly offset by an increase of $2 million in post-secondary institution debt servicing costs funded by lower operating expense. |
| | |
| | | |
2018–19 Second Quarter Fiscal Update and Economic Statement | | 5 |
Assets and Liabilities
Financial Assets of $70.4 billion are forecast for March 31, 2019, a decrease of $0.5 billion from 2018.
| ● | | Heritage Fund, endowment and other fund assets are increasing by $0.5 billion, from inflation-proofing and net income retention. |
| ● | | The balance in the Contingency Account on March 31, 2018 was $1.7 billion. The forecast is for all of this cash to be withdrawn to fund the 2018-19 deficit, after making various cash adjustments, including differences between accrued revenue and expense and actual cash receipts and outlays, income retained by various funds and entities, and cash borrowing. More details are provided on page 10. |
| ● | | Assets of self-supporting lending organizations (Agriculture Financial Services Corporation {AFSC} and Alberta Capital Finance Authority) are decreasing $7 million, primarily from the use of insurance cash to fund agriculture indemnity payments. |
| ● | | Cash of $55 million in the Capital Plan financing account is being withdrawn to fund capital spending. |
| ● | | Other financial assets are increasing a net $0.7 billion. |
Liabilities of $98.6 billion are forecast for March 31, 2019, an increase of $8.2 billion from 2018, but lower than expected in Budget 2018. Fiscal Plan and Capital Plan liabilities on March 31, 2019 are forecast at $52.8 billion. This is $1.4 billion lower than estimated in Budget 2018.
| ● | | Liabilities for capital projects are $3.7 billion higher than they were at March 31, 2018, due to direct borrowing of $3.7 billion, alternative financing of $92 million, less principal repayments on completed private-public partnership projects (P3s) of $64 million. |
| ● | | Direct borrowing for the Fiscal Plan in 2018-19 is now forecast to be $5.7 billion, $1.3 billion lower than estimated in budget. |
| ● | | Self-supporting lending organization liabilities are |
| | decreasing $174 million. AFSC assets exceed liabilities by about $3 billion. |
| ● | | Other liabilities are decreasing by $0.7 billion, while government obligations for pension plan liabilities are down $0.3 billion. |
Net financial debt (the difference between financial assets and liabilites) on March 31, 2019 is estimated to be $28.1 billion.
Capital and other non-financial assets of $50.3 billion are forecast for March 31, 2019, a $1.3 billion net increase from March 31, 2018. This reflects: addition of $4.2 billion in capital assets less $2.5 billion in amortization; addition of $1 billion in inventory assets (e.g. vaccines, highway maintenance gravel) less consumption of $1 billion; and a net increase of $0.4 billion in deferred capital contributions.
Net Assets of $22.2 billion are forecast for March 31, 2019, a $7.5 billion decrease from 2018, reflecting the deficit for 2018-19.
Balance Sheet Summary (millions of dollars)
| | | | | | | | | | | | | | | | |
| | | At March 31 | | | Change | |
| | | 2018 | | | 2019 | | | from | |
| | | Actual | | | Budgeta | | | Forecast | | | 2018 | |
Financial Assets | | | | | | | | | | | | | | | | |
Heritage Fund, endowment and other funds | | | 20,306 | | | | 20,763 | | | | 20,768 | | | | 462 | |
Contingency Account | | | 1,661 | | | | - | | | | - | | | | (1,661 | ) |
Self-supporting lending organizations | | | 21,471 | | | | 22,592 | | | | 21,464 | | | | (7 | ) |
Capital Plan financing account | | | 55 | | | | 55 | | | | - | | | | (55 | ) |
Other financial assets (includes SUCH sector) | | | 27,484 | | | | 28,555 | | | | 28,209 | | | | 725 | |
Total Financial Assets | | | 70,977 | | | | 71,965 | | | | 70,441 | | | | (536 | ) |
Liabilities | | | | | | | | | | | | | | | | |
Liabilities for capital projects | | | 29,339 | | | | 33,192 | | | | 33,061 | | | | 3,722 | |
Debt for pre-1992 Teachers’ Pension Plan | | | 944 | | | | 944 | | | | 944 | | | | - | |
Direct borrowing for the Fiscal Plan | | | 13,079 | | | | 20,117 | | | | 18,810 | | | | 5,731 | |
Self-supporting lending organizations | | | 18,661 | | | | 19,451 | | | | 18,487 | | | | (174 | ) |
Other liabilities (includes SUCH sector) | | | 18,868 | | | | 18,726 | | | | 18,135 | | | | (733 | ) |
Pension liabilities | | | 9,430 | | | | 9,120 | | | | 9,120 | | | | (310 | ) |
Total Liabilities | | | 90,321 | | | | 101,550 | | | | 98,557 | | | | 8,236 | |
Net Financial Assets / (Debt) | | | (19,344 | ) | | | (29,585 | ) | | | (28,116 | ) | | | (8,772 | ) |
Capital / other non-financial assets | | | 52,024 | | | | 53,854 | | | | 53,732 | | | | 1,708 | |
Spent deferred capital contributions | | | (3,009 | ) | | | (3,400 | ) | | | (3,457 | ) | | | (448 | ) |
Net Assets | | | 29,671 | | | | 20,869 | | | | 22,159 | | | | (7,512 | ) |
Change in Net Assets (before adjustments) | | | (8,023 | ) | | | (8,801 | ) | | | (7,512 | ) | | | 511 | |
| a | Budget numbers have been restated to reflect 2017-18 actual results. |
| | |
| | | |
6 | | 2018–19 Second Quarter Fiscal Update and Economic Statement |
Revenue (millions of dollars)
| | | | | | | | | | | | | | | | |
| | | Fiscal Year | | | Change | |
| | | 2017-18 | | | 2018-19 | | | from | |
| | | Actual | | | Budget | | | Forecast | | | Budget | |
Income Taxes | | | | | | | | | | | | | | | | |
Personal income tax | | | 10,775 | | | | 11,387 | | | | 12,129 | | | | 742 | |
Corporate income tax | | | 3,448 | | | | 4,551 | | | | 4,189 | | | | (362 | ) |
| | | 14,223 | | | | 15,938 | | | | 16,318 | | | | 380 | |
Other Taxes | | | | | | | | | | | | | | | | |
Education property tax | | | 2,450 | | | | 2,446 | | | | 2,446 | | | | - | |
Fuel tax | | | 1,399 | | | | 1,414 | | | | 1,415 | | | | 1 | |
Tobacco / cannabis taxes | | | 908 | | | | 932 | | | | 924 | | | | (8 | ) |
Insurance taxes | | | 582 | | | | 641 | | | | 626 | | | | (15 | ) |
Freehold mineral rights tax | | | 67 | | | | 87 | | | | 76 | | | | (11 | ) |
Tourism levy | | | 85 | | | | 85 | | | | 88 | | | | 3 | |
Carbon levy | | | 1,046 | | | | 1,356 | | | | 1,309 | | | | (47 | ) |
| | | 6,538 | | | | 6,961 | | | | 6,884 | | | | (77 | ) |
Non-Renewable Resource Revenue | | | | | | | | | | | | | | | | |
Bitumen royalty | | | 2,643 | | | | 1,785 | | | | 2,787 | | | | 1,002 | |
Crude oil royalty | | | 965 | | | | 1,053 | | | | 1,318 | | | | 265 | |
Natural gas and by-products royalty | | | 645 | | | | 541 | | | | 718 | | | | 177 | |
Bonuses and sales of Crown leases | | | 564 | | | | 327 | | | | 360 | | | | 33 | |
Rentals and fees / coal royalty | | | 164 | | | | 123 | | | | 138 | | | | 15 | |
| | | 4,980 | | | | 3,829 | | | | 5,322 | | | | 1,493 | |
Transfers from Government of Canada | | | | | | | | | | | | | | | | |
Canada Health Transfer | | | 4,325 | | | | 4,521 | | | | 4,461 | | | | (60 | ) |
Canada Social Transfer | | | 1,600 | | | | 1,657 | | | | 1,637 | | | | (20 | ) |
Direct transfers to SUCH sector / Alberta Innovates Corp. | | | 482 | | | | 520 | | | | 520 | | | | - | |
Agriculture support programs | | | 349 | | | | 308 | | | | 306 | | | | (2 | ) |
Infrastructure support | | | 391 | | | | 510 | | | | 604 | | | | 94 | |
Labour market agreements | | | 233 | | | | 250 | | | | 250 | | | | - | |
Other | | | 226 | | | | 452 | | | | 467 | | | | 15 | |
| | | 7,606 | | | | 8,218 | | | | 8,245 | | | | 27 | |
Investment Income | | | | | | | | | | | | | | | | |
Alberta Heritage Savings Trust Fund | | | 1,926 | | | | 1,653 | | | | 1,452 | | | | (201 | ) |
Endowment funds | | | 427 | | | | 336 | | | | 295 | | | | (41 | ) |
Alberta Capital Finance Authority | | | 245 | | | | 345 | | | | 322 | | | | (23 | ) |
Agriculture Financial Services Corporation | | | 122 | | | | 135 | | | | 135 | | | | - | |
Other (includes SUCH sector / Contingency Account) | | | 405 | | | | 415 | | | | 415 | | | | - | |
| | | 3,126 | | | | 2,884 | | | | 2,619 | | | | (265 | ) |
Net Income from Government Business Enterprises | | | | | | | | | | | | | | | | |
AGLC – Gaming / lottery | | | 1,417 | | | | 1,439 | | | | 1,449 | | | | 10 | |
AGLC – Liquor / cannabis | | | 866 | | | | 794 | | | | 833 | | | | 39 | |
ATB Financial | | | 278 | | | | 242 | | | | 247 | | | | 5 | |
Balancing Pool | | | 763 | | | | 161 | | | | 206 | | | | 45 | |
Other – CUDGCo / APMC | | | 63 | | | | 141 | | | | 162 | | | | 21 | |
| | | 3,387 | | | | 2,777 | | | | 2,897 | | | | 120 | |
Premiums, Fees and Licences | | | | | | | | | | | | | | | | |
Post-secondary institution tuition fees | | | 1,202 | | | | 1,237 | | | | 1,237 | | | | - | |
Health / school board fees and charges | | | 711 | | | | 664 | | | | 684 | | | | 20 | |
Motor vehicle licences | | | 508 | | | | 513 | | | | 513 | | | | - | |
Crop, hail and livestock insurance premiums | | | 348 | | | | 375 | | | | 317 | | | | (58 | ) |
Energy industry levies | | | 292 | | | | 333 | | | | 333 | | | | - | |
Other (includes land titles, land and grazing, health benefits premiums) | | | 779 | | | | 733 | | | | 787 | | | | 54 | |
| | | 3,839 | | | | 3,854 | | | | 3,871 | | | | 17 | |
Other | | | | | | | | | | | | | | | | |
SUCH sector sales, rentals and services | | | 1,010 | | | | 1,040 | | | | 1,063 | | | | 23 | |
SUCH sector fundraising, donations and gifts | | | 823 | | | | 639 | | | | 646 | | | | 7 | |
AIMCo investment management charges | | | 383 | | | | 342 | | | | 342 | | | | - | |
Fines and penalties | | | 215 | | | | 225 | | | | 225 | | | | - | |
Refunds of expense | | | 463 | | | | 195 | | | | 189 | | | | (6 | ) |
Climate change and emissions management | | | 250 | | | | 541 | | | | 541 | | | | - | |
Miscellaneous | | | 451 | | | | 437 | | | | 443 | | | | 6 | |
| | | | 3,595 | | | | 3,419 | | | | 3,449 | | | | 30 | |
Total Revenue | | | 47,295 | | | | 47,879 | | | | 49,605 | | | | 1,726 | |
| | |
| | | |
2018–19 Second Quarter Fiscal Update and Economic Statement | | 7 |
Operating Expense by Ministry (millions of dollars)
| | | | | | | | | | | | | | | | |
| | | Fiscal Year | | | Change | |
| | | 2017-18 | | | 2018-19 | | | from | |
| | | Actual | | | Budget | | | Forecast | | | Budget | |
Advanced Education | | | 5,512 | | | | 5,604 | | | | 5,602 | | | | (2 | ) |
Agriculture and Forestry | | | 962 | | | | 1,045 | | | | 1,000 | | | | (45 | ) |
Children’s Services | | | 1,401 | | | | 1,470 | | | | 1,480 | | | | 10 | |
Community and Social Services | | | 3,428 | | | | 3,621 | | | | 3,638 | | | | 17 | |
Culture and Tourism | | | 293 | | | | 298 | | | | 301 | | | | 3 | |
Economic Development and Trade | | | 284 | | | | 277 | | | | 277 | | | | - | |
Education | | | 7,905 | | | | 7,993 | | | | 7,993 | | | | - | |
Energy | | | 435 | | | | 473 | | | | 487 | | | | 14 | |
Environment and Parks | | | 417 | | | | 411 | | | | 412 | | | | 1 | |
Executive Council | | | 16 | | | | 17 | | | | 17 | | | | - | |
Health | | | 19,759 | | | | 20,563 | | | | 20,563 | | | | - | |
Indigenous Relations | | | 167 | | | | 180 | | | | 205 | | | | 25 | |
Infrastructure | | | 490 | | | | 489 | | | | 489 | | | | - | |
Justice and Solicitor General | | | 1,405 | | | | 1,430 | | | | 1,450 | | | | 20 | |
Labour | | | 185 | | | | 219 | | | | 219 | | | | - | |
Municipal Affairs | | | 233 | | | | 258 | | | | 269 | | | | 11 | |
Seniors and Housing | | | 593 | | | | 608 | | | | 619 | | | | 11 | |
Service Alberta | | | 509 | | | | 564 | | | | 571 | | | | 7 | |
Status of Women | | | 7 | | | | 7 | | | | 7 | | | | - | |
Transportation | | | 454 | | | | 432 | | | | 445 | | | | 13 | |
Treasury Board and Finance | | | 1,654 | | | | 1,644 | | | | 1,671 | | | | 27 | |
Legislative Assembly | | | 117 | | | | 161 | | | | 170 | | | | 9 | |
Total Operating Expense – excluding Climate Leadership Plan | | | 46,229 | | | | 47,765 | | | | 47,886 | | | | 121 | |
Climate Leadership Plan: | | | | | | | | | | | | | | | | |
Agriculture and Forestry | | | 11 | | | | 42 | | | | 42 | | | | - | |
Economic Development and Trade | | | 2 | | | | 46 | | | | 46 | | | | - | |
Energy | | | 34 | | | | 106 | | | | 106 | | | | - | |
Environment and Parks | | | 151 | | | | 280 | | | | 278 | | | | (2 | ) |
Indigenous Relations | | | 16 | | | | 20 | | | | 17 | | | | (3 | ) |
Treasury Board and Finance | | | 306 | | | | 532 | | | | 532 | | | | - | |
Other (Infrastructure / Labour / Service Alberta / Transportation) | | | 2 | | | | 8 | | | | 8 | | | | - | |
Total Climate Leadership Plan Operating Expense | | | 521 | | | | 1,035 | | | | 1,029 | | | | (6 | ) |
Total Operating Expense | | | 46,750 | | | | 48,800 | | | | 48,915 | | | | 115 | |
Debt Servicing Costs (millions of dollars)
| | | | | | | | | | | | | | | | |
| | | Fiscal Year | | | Change | |
| | | 2017-18 | | | 2018-19 | | | from | |
| | | Actual | | | Budget | | | Forecast | | | Budget | |
General | | | | | | | | | | | | | | | | |
Advanced Education – post-secondary institutions | | | 39 | | | | 42 | | | | 44 | | | | 2 | |
Agriculture and Forestry – Agriculture Financial Services Corporation | | | 68 | | | | 71 | | | | 71 | | | | - | |
Education – school boards | | | 13 | | | | 10 | | | | 10 | | | | - | |
Health – Alberta Health Services | | | 16 | | | | 16 | | | | 16 | | | | - | |
Seniors and Housing – Alberta Social Housing Corporation | | | 6 | | | | 5 | | | | 5 | | | | - | |
Treasury Board and Finance – Alberta Capital Finance Authority / other | | | 517 | | | | 883 | | | | 836 | | | | (47 | ) |
Total general debt servicing costs | | | 659 | | | | 1,027 | | | | 982 | | | | (45 | ) |
Capital Plan | | | | | | | | | | | | | | | | |
Education – Alberta Schools Alternative Procurement P3s | | | 29 | | | | 28 | | | | 28 | | | | - | |
Transportation – ring road P3s | | | 94 | | | | 92 | | | | 92 | | | | - | |
Treasury Board and Finance – direct borrowing | | | 638 | | | | 775 | | | | 773 | | | | (2 | ) |
Total Capital Plan debt servicing costs | | | 761 | | | | 895 | | | | 893 | | | | (2 | ) |
Total Debt Servicing Costs | | | 1,420 | | | | 1,921 | | | | 1,874 | | | | (47 | ) |
| | |
| | | |
8 | | 2018–19 Second Quarter Fiscal Update and Economic Statement |
Disaster / Emergency Assistance Expense (millions of dollars)
| | | | | | | | | | | | | | | | |
| | | Fiscal Year | | | Change | |
| | | 2017-18 | | | 2018-19 | | from | |
| | | Actual | | | Budget | | Forecast | | Budget | |
Agriculture and Forestry – wildfires | | | 201 | | | | - | | | | 186 | | | | 186 | |
Agriculture and Forestry – agriculture indemnities / AgriStability | | | 207 | | | | - | | | | 200 | | | | 200 | |
Municipal Affairs – Wood Buffalo wildfire / other | | | 23 | | | | 1 | | | | 68 | | | | 67 | |
2013 Alberta flood assistance (Comm. and Soc. Serv. / Ind. Rel. / Infra. / Envt.) | | | 7 | | | | 5 | | | | 5 | | | | - | |
Unallocated | | | - | | | | 200 | | | | - | | | | (200 | ) |
Total Disaster / Emergency Assistance | | | 439 | | | | 206 | | | | 459 | | | | 253 | |
Capital Amortization Expense (millions of dollars)
| | | | | | | | | | | | | | | | |
| | | Fiscal Year | | | Change | |
| | | 2017-18 | | | 2018-19 | | from | |
| | | Actual | | | Budget | | Forecast | | Budget | |
Advanced Education | | | 496 | | | | 537 | | | | 537 | | | | - | |
Agriculture and Forestry | | | 24 | | | | 28 | | | | 28 | | | | - | |
Economic Development and Trade | | | 5 | | | | 8 | | | | 8 | | | | - | |
Education | | | 372 | | | | 354 | | | | 354 | | | | - | |
Energy | | | 16 | | | | 14 | | | | 14 | | | | - | |
Environment and Parks | | | 49 | | | | 70 | | | | 70 | | | | - | |
Health | | | 554 | | | | 551 | | | | 551 | | | | - | |
Infrastructure | | | 108 | | | | 121 | | | | 122 | | | | 1 | |
Justice and Solicitor General | | | 3 | | | | 6 | | | | 6 | | | | - | |
Seniors and Housing | | | 36 | | | | 39 | | | | 35 | | | | (4 | ) |
Service Alberta | | | 92 | | | | 127 | | | | 126 | | | | (1 | ) |
Transportation | | | 555 | | | | 586 | | | | 586 | | | | - | |
Treasury Board and Finance | | | 20 | | | | 22 | | | | 22 | | | | - | |
Other a | | | 7 | | | | 13 | | | | 13 | | | | - | |
Total Amortization Expense | | | 2,337 | | | | 2,477 | | | | 2,472 | | | | (5 | ) |
| a | Other includes Children’s Services, Culture and Tourism, Community and Social Services, Indigenous Relations, Labour, Legislative Assembly and Municipal |
Financing Requirementsa (millions of dollars)
| | | | | | | | | | | | | | | | | | | | | | | | | | | | | | | | |
| | | 2017-18 | | | 2018-19 | |
| | | Actual Financing | | | Maturities | | | Increase in
Financing | | | Budget Estimate | | | Change to
Estimate | | | Forecast | | Maturities | | | Increase in
Financing | |
Financing Requirements | | | | | | | | | | | | | | | | | | | | | | | | | | | | | | | | |
Direct borrowing for the Capital Plan | | | 5,434 | | | | - | | | | 5,434 | | | | 4,272 | | | | (95 | ) | | | 4,177 | | | | (500 | ) | | | 3,677 | |
Direct borrowing for the Fiscal Plan | | | 4,494 | | | | - | | | | 4,494 | | | | 7,038 | | | | (1,307 | ) | | | 5,731 | | | | - | | | | 5,731 | |
Cash Reserve | | | 5,000 | | | | - | | | | 5,000 | | | | 5,000 | | | | - | | | | 5,000 | | | | (5,000 | ) | | | - | |
Borrowing for the Orphan Well Association | | | 50 | | | | - | | | | 50 | | | | 145 | | | | - | | | | 145 | | | | (50 | ) | | | 95 | |
Borrowing for working capital | | | 82 | | | | (1,150 | ) | | | (1,068 | ) | | | 1,000 | | | | - | | | | 1,000 | | | | (82 | ) | | | 918 | |
Borrowing for government organizations and business enterprises: | | | | | | | | | | | | | | | | | | | | | | | | | | | | | | | | |
Agriculture Financial Services Corp. | | | 183 | | | | (169 | ) | | | 14 | | | | 406 | | | | (83 | ) | | | 323 | | | | (271 | ) | | | 52 | |
Alberta Capital Finance Authority | | | 4,162 | | | | (4,167 | ) | | | (5 | ) | | | 3,760 | | | | 164 | | | | 3,924 | | | | (3,720 | ) | | | 204 | |
Alberta Petroleum Marketing Comm. | | | 445 | | | | (331 | ) | | | 114 | | | | 675 | | | | 36 | | | | 711 | | | | (445 | ) | | | 266 | |
ATB Financial | | | 2,769 | | | | (1,000 | ) | | | 1,769 | | | | 3,000 | | | | 264 | | | | 3,264 | | | | (2,974 | ) | | | 290 | |
Balancing Pool | | | 804 | | | | (232 | ) | | | 572 | | | | 810 | | | | 90 | | | | 900 | | | | (804 | ) | | | 96 | |
Total Financing Requirements | | | 23,423 | | | | (7,049 | ) | | | 16,374 | | | | 26,106 | | | | (931 | ) | | | 25,175 | | | | (13,846 | ) | | | 11,329 | |
| a | Includes both new financing requirements and money market and long-term debt maturities. Long-term debt issuance is forecast to be $14.4 billion for 2018-19. Approximately $11 billion has been borrowed to date. |
| | |
| | | |
2018–19 Second Quarter Fiscal Update and Economic Statement | | 9 |
Contingency Account (millions of dollars)
| | | | | | | | | | | | | | | | |
| | | Fiscal Year | | | Change from | |
| | | 2017-18 | | | 2018-19 | |
| | Actual | | | Budget | | | Forecast | | | Budget | |
Balance at Start of Year | | | 2,299 | | | | 1,661 | | | | 1,661 | | | | - | |
Surplus / (Deficit) | | | (8,023 | ) | | | (8,802 | ) | | | (7,512 | ) | | | 1,290 | |
Cash Adjustments (negative = cash requirement; positive = cash source) | | | | | | | | | | | | | | | | |
SUCH / Alberta Innovates own-source revenue / expense | | | 397 | | | | 565 | | | | 809 | | | | 244 | |
Pension provisions (non-cash expense) | | | (593 | ) | | | (310 | ) | | | (310 | ) | | | - | |
Net deferred capital contribution adjustment (excluding SUCH) | | | 215 | | | | 351 | | | | 408 | | | | 57 | |
Retained income of funds, agencies and accounts: | | | | | | | | | | | | | | | | |
Alberta Heritage Savings Trust Fund inflation-proofing | | | (230 | ) | | | (328 | ) | | | (374 | ) | | | (46 | ) |
Alberta Treasury Branches | | | (278 | ) | | | (242 | ) | | | (247 | ) | | | (5 | ) |
Agriculture Financial Services Corporation | | | (288 | ) | | | (387 | ) | | | (166 | ) | | | 221 | |
Endowment funds | | | (240 | ) | | | (146 | ) | | | (106 | ) | | | 40 | |
Alberta Social Housing Corporation | | | 12 | | | | 24 | | | | 1 | | | | (23 | ) |
Alberta Capital Finance Authority | | | (41 | ) | | | (30 | ) | | | (30 | ) | | | - | |
Climate Change and Emiss. Mgmt. Fund / Carbon Levy acct. / Energy Effic. Ab. | | | (114 | ) | | | (71 | ) | | | (24 | ) | | | 47 | |
Balancing Pool | | | (763 | ) | | | (161 | ) | | | (206 | ) | | | (45 | ) |
Other | | | (223 | ) | | | (138 | ) | | | 14 | | | | 152 | |
Energy royalties (difference between accrued revenue and cash) | | | (151 | ) | | | 211 | | | | (8 | ) | | | (219 | ) |
Student loans | | | (392 | ) | | | (375 | ) | | | (375 | ) | | | - | |
Other cash adjustments | | | (383 | ) | | | (121 | ) | | | (572 | ) | | | (451 | ) |
2016 Wood Bufffalo fire / 2013 Alberta flood assistance revenue / expense | | | (218 | ) | | | (171 | ) | | | (187 | ) | | | (16 | ) |
Inventory acquisition | | | (129 | ) | | | (139 | ) | | | (136 | ) | | | 3 | |
Inventory consumption (non-cash expense) | | | 123 | | | | 137 | | | | 134 | | | | (3 | ) |
Capital Plan (excluding SUCH sector) cash sources / (requirements): | | | | | | | | | | | | | | | | |
Capital investment | | | (4,064 | ) | | | (3,455 | ) | | | (3,315 | ) | | | 140 | |
Amortization / book value of disposals | | | 966 | | | | 1,053 | | | | 1,050 | | | | (3 | ) |
Withdrawal from / (deposit to) Capital Plan financing account | | | 1,339 | | | | - | | | | 55 | | | | 55 | |
Direct borrowing for the Capital Plan | | | 5,434 | | | | 3,772 | | | | 3,677 | | | | (95 | ) |
Alternative financing (P3s – public-private partnerships) | | | 181 | | | | 128 | | | | 92 | | | | (36 | ) |
Current principal repayments (P3s) | | | (62 | ) | | | (64 | ) | | | (64 | ) | | | - | |
Surplus / (Deficit) plus net cash adjustments | | | (7,524 | ) | | | (8,699 | ) | | | (7,392 | ) | | | 1,307 | |
Cash from prior-year final results | | | 2,392 | | | | - | | | | - | | | | - | |
Cash to be transferred next year | | | - | | | | - | | | | - | | | | - | |
Direct borrowing for the Fiscal Plan | | | 4,494 | | | | 7,038 | | | | 5,731 | | | | (1,307 | ) |
Balance at End of Year | | | 1,661 | | | | - | | | | - | | | | - | |
Inventory Consumption Expense (millions of dollars)
| | | | | | | | | | | | | | | | |
| | | Fiscal Year | | | Change from | |
| | | 2017-18 | | | 2018-19 | |
| | Actual | | | Budget | | | Forecast | | | Budget | |
Health | | | 863 | | | | 891 | | | | 888 | | | | (3 | ) |
Service Alberta | | | 12 | | | | 10 | | | | 10 | | | | - | |
Transportation | | | 46 | | | | 50 | | | | 50 | | | | - | |
Other (Agric. / Cult. / Infra. / Leg. Assembly) | | | 5 | | | | 5 | | | | 5 | | | | - | |
Total Inventory Consumption Expense | | | 926 | | | | 956 | | | | 953 | | | | (3 | ) |
Inventory Acquisition (millions of dollars)
| | | | | | | | | | | | | | | | |
| | | Fiscal Year | | | Change from | |
| | | 2017-18 | | | 2018-19 | |
| | Actual | | | Budget | | | Forecast | | | Budget | |
Health | | | 869 | | | | 891 | | | | 888 | | | | (3 | ) |
Service Alberta | | | 12 | | | | 10 | | | | 10 | | | | - | |
Transportation | | | 50 | | | | 50 | | | | 50 | | | | - | |
Other (Agric. / Cult. / Infra. / Leg. Assembly) | | | 5 | | | | 5 | | | | 5 | | | | - | |
Total Inventory Acquisition | | | 936 | | | | 956 | | | | 953 | | | | (3 | ) |
| | |
| | | |
10 | | 2018–19 Second Quarter Fiscal Update and Economic Statement |
Capital Plan Highlights
2018-19 Capital Plan spending is forecast to be $6.4 billion, almost identical to the Budget 2018 estimate.
Decreases in school, health and housing projects are due to re- profiling projects to future years based on progress. These decreases are essentially offset by re-profiling and carrying-over of projects from 2017-18 into 2018-19, including federally-funded municipal programs.
Factors impacting project progress include the pace of construction, project scope, land conditions, timing related to tendering, planning and permitting, and rate of project identification, approval and construction under federal programs.
Direct borrowing of $3.7 billion is forecast, a decrease of $95 million from budget. The decrease is due mainly to a large portion of the
re-profiling from 2017-18 relating to federally-funded municipal programs, and an additional $55 million in the Capital Plan financing account, partly offset by a lower contribution from Alberta Social Housing Corporation and a $36 million reduction in alternative financing this year as 2017-18 progress on the Calgary ring road was accelerated.
Capital Plan Summary (millions of dollars)
| | | | | | | | | | | | | | | | |
| | | Fiscal Year | | | Change | |
| | | 2017-18 | | | 2018-19 | | | from | |
| By Ministry | | Actual | | | Budget | | | Forecast | | | Budget | |
Advanced Education | | | 921 | | | | 714 | | | | 731 | | | | 17 | |
Agriculture and Forestry | | | 50 | | | | 39 | | | | 39 | | | | - | |
Community and Social Services | | | 1 | | | | 2 | | | | 2 | | | | - | |
Culture and Tourism | | | 67 | | | | 76 | | | | 87 | | | | 11 | |
Economic Development and Trade | | | 8 | | | | 10 | | | | 10 | | | | - | |
Education | | | 1,229 | | | | 744 | | | | 731 | | | | (13 | ) |
Energy | | | 73 | | | | 194 | | | | 194 | | | | - | |
Environment and Parks | | | 187 | | | | 65 | | | | 78 | | | | 13 | |
Health | | | 1,000 | | | | 1,338 | | | | 1,273 | | | | (65 | ) |
Indigenous Relations | | | 8 | | | | 8 | | | | 8 | | | | - | |
Infrastructure | | | 212 | | | | 220 | | | | 220 | | | | - | |
Justice and Solicitor General | | | 4 | | | | 10 | | | | 10 | | | | - | |
Labour | | | 3 | | | | 2 | | | | 2 | | | | - | |
Municipal Affairs | | | 2,248 | | | | 892 | | | | 892 | | | | - | |
Seniors and Housing | | | 191 | | | | 259 | | | | 236 | | | | (23 | ) |
Service Alberta | | | 126 | | | | 117 | | | | 121 | | | | 4 | |
Transportation | | | 2,233 | | | | 1,481 | | | | 1,514 | | | | 33 | |
Treasury Board and Finance | | | 13 | | | | 18 | | | | 18 | | | | - | |
Legislative Assembly | | | 2 | | | | 3 | | | | 3 | | | | - | |
Contingency / unallocated | | | - | | | | (391 | ) | | | (391 | ) | | | - | |
2013 Alberta flood assistance (Envt. and Parks / Health / Infr. / Trans.) | | | 24 | | | | 29 | | | | 37 | | | | 8 | |
Climate Leadership Plan: | | | | | | | | | | | | | | | | |
Energy | | | - | | | | 95 | | | | 95 | | | | - | |
Environment and Parks | | | 189 | | | | 20 | | | | 21 | | | | 1 | |
Indigenous Relations | | | 22 | | | | 34 | | | | 37 | | | | 3 | |
Infrastructure | | | - | | | | 28 | | | | 29 | | | | 1 | |
Transportation | | | 189 | | | | 405 | | | | 405 | | | | - | |
Other (Ad. Ed. / Agric. / Ec. Dev. / Hlth. / Mun. Aff. / Snrs. / Serv. Ab.) | | | 19 | | | | 34 | | | | 35 | | | | 1 | |
Total Capital Plan | | | 9,021 | | | | 6,444 | | | | 6,436 | | | | (8 | ) |
Capital Plan Financing Cash received / assets donated for capital purposes Retained income of funds and agencies SUCH sector self-financed Climate Leadership Plan Book value capital asset disposals / grants-in-kind Alternative financing (P3s) Capital Plan financing account withdrawal / (deposit) Direct borrowing | |
| 732
(53 935 418 35 181 1,339 5,434 |
) | |
| 969
101 860 615 - 128 - 3,772 |
| |
| 1,115
5 870 622 - 92 55 3,677 |
| |
| 146
(96 10 7 - (36 55 (95 |
) ) ) |
Total Capital Plan Financing | | | 9,021 | | | | 6,444 | | | | 6,436 | | | | (8 | ) |
| | |
| | | |
2018–19 Second Quarter Fiscal Update and Economic Statement | | 11 |
Economic Outlook
Solid growth in second year of recovery
| | | | |
The Alberta economy is on track to post solid growth in its second year of recovery. The province added more than 42,000 jobs since October 2017. However, transportation bottlenecks, if left unchecked, will continue to cripple Alberta oil prices and create economic headwinds. Alberta’s recovery following the 2015-16 recession has been a driver of the Canadian economy. A lack of progress from Ottawa on pipelines has resulted in a slowdown in economic activity heading into 2019 and lost income to the country. Through three quarters of 2018, Alberta’s economy expanded largely in line with Budget 2018 expectations. The Alberta Activity Index (AAX) is tracking 3.0% above the 2017 level through August, hovering near pre- recession peak. Heading into the fourth quarter of 2018, with Alberta crudes currently trading at record discounts to global benchmarks, sentiments and conditions have deteriorated markedly. Producers are slowing production and restraining capital spending. In addition, household spending and residential construction activity have softened more than expected. As a result, after nation-leading growth of 4.5% in 2017, real GDP is expected to | | be 2.5% in 2018, down from 2.7% at Budget. With market access issues persisting in 2019, weaker corporate profits and slower oil production growth will dampen the investment and export outlook next year. Based on recent developments, growth is forecast to slow to 2.0%, down from 2.5% at Budget. Alberta oil prices tumble Alberta oil producers are grappling with weaker global oil prices and severe discounts for their crude. West Texas Intermediate (WTI), the benchmark North American crude, has fallen below US$55/bbl in recent weeks, a decline of more than 30% from a four-year high reached in early October. Global prices have come under pressure as concerns over a supply glut have intensified. At the same time, persistent transportation bottlenecks and rising inventories have caused severe discounts for Alberta crudes. The differential between WTI and Alberta’s Western Canadian Select (WCS) widened to a record high in October (Figure 1). Other Alberta crudes are also trading at large discounts. The WTI-WCS differential is forecast to remain volatile and elevated in 2019 until rail capacity increases and Enbridge’s | | Line 3 pipeline expansion comes online. As a result, the WTI-WCS differential is expected to average US$29.25/bbl in 2018-19, up from US$22.40/bbl at Budget, while WTI is forecast to average US$64/bbl. Corporate profits aided by weaker Loonie A lower Canadian dollar is cushioning the blow of weaker oil prices on corporate profits for Alberta oil producers and other exporters. After a brief uplift in early October from the conclusion of the US-Mexico-Canada trade negotiations, the Loonie has since slipped to around 76 US¢/Cdn$. The 2018-19 exchange rate is now forecast at 77.5 US¢/Cdn$, two and a half cents lower than Budget. Pipeline constraints lower investment The run-up in oil prices earlier in the year brought the prospect of continued improvement in oil and gas investment in 2018. However, the collapse in WCS prices is hitting corporate profits and weighing on investor sentiment. Efforts to curb costs and reduce production have weakened the energy investment outlook. Oil sands investment in 2019 is forecast to remain weak after four years of decline, while growth in conventional investment is forecast to slow. Labour market resilient Employment gains have been moderating compared to last year’s strong pace, but still remain solid. The province has added over 42,000 jobs since October 2017, reflecting broad- based gains (Figure 3). Employment is forecast to grow 1.9% this year, in-line with Budget expectations. In 2019, weaker energy investment and related activity will slow employment growth to 1.4%. A stronger economy has drawn people back into workforce, |
|
| | |
| | |
| | |
| | |
| | |
| | |
| | |
| 12 | | 2018–19 Second Quarter Fiscal Update and Economic Statement |
Economic Outlook
| | | | |
lifting the participation rate to a 10-month high. This, along with a pick-up in population growth, pushed the unemployment rate to 7.3% in October. The unemployment rate has averaged 6.7% year-to-date, in line with Budget expectations. It is expected to decline to 6.3% in 2019. Exports aid growth Despite recent difficulties, solid business activity has been the linchpin of Alberta’s economic growth so far this year. Manufacturing sales are at a four-year high and are up 8.5% through the first three quarters of 2018 (Figure 2). Energy exports have also risen by more than 19% over the same period, bolstered by the improvement in prices and strong | | growth in oil production prior to the recent slide in WCS prices. Given the year-to-date strength, exports are expected to grow by 7.4% this year. However, oil producers have already started to slow production in response to the wider differential. This is expected to carry into 2019, dragging down exports and overall real GDP growth in 2019. Non-energy investment shift There are some positive signs for investment outside the energy sector. The decline in private sector construction spending over the past three years looks to have abated, led by a recovery in industrial construction, which climbed to a two-year high in the third quarter of | | 2018. The decline in real non-energy business investment is expected to moderate to 2.9% this year before turning to modest growth in 2019. Housing market slows Tighter mortgage regulations, rising interest rates and elevated housing inventories are weighing on residential housing activity. Resale activity across most regions of the province has slowed markedly in recent months, with the number of units sold falling below last year’s levels and prices softening. On the construction side, housing starts are expected to slow from around 29,500 units in 2017 to 26,500 in 2018 due to weakness in the fourth quarter. In 2019, starts are forecast to average 27,300 units reflecting a pick-up in the last half of the year. Households cautious Rising costs and weaker sentiment are slowing the pace of consumer spending in Alberta. While retail sales remain at record levels, they are being propped up by higher consumer prices. Inflation remains elevated on higher gasoline and electricity prices, along with a weakening Canadian dollar. Inflation has been revised to 2.5% in 2018, up 0.4 ppt from Budget. On an inflation-adjusted basis, growth in consumer spending in 2018 is now forecast to rise 2.2% compared with 2.9% at Budget. In 2019, growth is forecast to increase slightly, buoyed by a growing population and employment gains. Risks to the Outlook ● An easing of trade tensions and protectionist policies would improve global growth prospects. ● Growing global oil supply or slowing demand could put downward pressure on oil prices. ● As oil production is now outstripping pipeline capacity in the province, more prolonged and wider-than- expected discounts for Alberta crudes would further hit corporate profits and investment. |
|
| | |
| 2018–19 Second Quarter Fiscal Update and Economic Statement | | 13 |
| | | | | | | | | | | | | | | | |
Key Energy and Economic Assumptions | |
Fiscal Year Assumptions | | 2017-18 Actual | | | 2018-19 6 Month Actual | | | 2018-19 Fiscal Year | |
| | Budget | | | 2nd Quarter | |
Prices | |
Crude Oil Price | | | | | | | | | | | | | | | | |
WTI (US$/bbl) | | | 53.69 | | | | 68.69 | | | | 59.00 | | | | 64.00 | |
Light-Heavy Differential (US$/bbl) | | | 14.40 | | | | 20.76 | | | | 22.40 | | | | 29.25 | |
WCS @ Hardisty (Cdn$/bbl) | | | 50.38 | | | | 62.30 | | | | 46.00 | | | | 45.00 | |
Natural Gas Price | | | | | | | | | | | | | | | | |
Alberta Reference Price (Cdn$/Gj) | | | 1.82 | | | | 0.98 | | | | 2.00 | | | | 1.50 | |
Production | |
Conventional crude oil (000s barrlels/day) | | | 457 | | | | N/A | | | | 461 | | | | 483 | |
Raw bitumen (000s barrels/day) | | | 2,804 | | | | N/A | | | | 3,163 | | | | 3,051 | |
Natural Gas (billions of cubic feet) | | | 4,253 | | | | N/A | | | | 4,502 | | | | 4,291 | |
Interest rates | |
3-month Canada treasury bills (per cent) | | | 0.85 | | | | 1.34 | | | | 1.60 | | | | 1.60 | |
10-year Canada bonds (per cent) | | | 1.91 | | | | 2.28 | | | | 2.50 | | | | 2.50 | |
Exchange Rate (US¢/Cdn$) | | | 78.0 | | | | 77.0 | | | | 80.0 | | | | 77.5 | |
| | | | | | | | | | | | | | | | | | | | | | | | |
| Calendar Year Assumptions | | 2017 Calendar Year | | | 2018 Calendar Year | | | 2019 Calendar Year | |
| | Budget | | | Actual | | | Budget | | | 2nd
Quarter | | | Budget | | | 2nd
Quarter | |
Gross Domestic Product | |
Nominal (millions of dollars) | | | 336,284 | | | | 337,282a | | | | 352,189 | | | | 352,196 | | | | 367,474 | | | | 365,416 | |
per cent change | | | 6.8 | | | | 7.1a | | | | 4.7 | | | | 4.4 | | | | 4.3 | | | | 3.8 | |
Real (millions of 2007 dollars) | | | 316,451 | | | | 316,542a | | | | 325,029 | | | | 324,311 | | | | 333,139 | | | | 330,949 | |
per cent change | | | 4.5 | | | | 4.5a | | | | 2.7 | | | | 2.5 | | | | 2.5 | | | | 2.0 | |
Other Indicators | |
Employment (thousands) | | | 2,287 | | | | 2,287 | | | | 2,333 | | | | 2,330 | | | | 2,372 | | | | 2,362 | |
per cent change | | | 1.0 | | | | 1.0 | | | | 2.0 | | | | 1.9 | | | | 1.7 | | | | 1.4 | |
Unemployment Rate (per cent) | | | 7.8 | | | | 7.8 | | | | 6.8 | | | | 6.7 | | | | 6.2 | | | | 6.3 | |
Average Weekly Earnings (per cent change) | | | 1.0 | | | | 1.0 | | | | 2.4 | | | | 2.5 | | | | 2.9 | | | | 2.7 | |
Primary Household Income (per cent change) | | | 4.4 | | | | 4.5a | | | | 4.5 | | | | 4.5 | | | | 4.7 | | | | 4.3 | |
Net Corporate Operating Surplus (per cent change) | | | 90.6 | | | | 97.9a | | | | 19.1 | | | | 16.1 | | | | 9.8 | | | | 6.3 | |
Housing Starts (number of units) | | | 29,500 | | | | 29,500 | | | | 30,200 | | | | 26,500 | | | | 32,000 | | | | 27,300 | |
Alberta Consumer Price Index (per cent change) | | | 1.6 | | | | 1.6 | | | | 2.1 | | | | 2.5 | | | | 1.9 | | | | 1.9 | |
Population (July 1st, thousands) | | | 4,286 | | | | 4,244 | | | | 4,348 | | | | 4,307 | | | | 4,413 | | | | 4,372 | |
per cent change | | | 1.2 | | | | 1.1 | | | | 1.4 | | | | 1.5 | | | | 1.5 | | | | 1.5 | |
| a | Alberta Treasury Board and Finance estimate. Does not reflect revisions to the Provincial Economic Accounts, released by Statistics Canada on November 8. |
| | |
| 2018–19 Second Quarter Fiscal Update and Economic Statement | | 14 |
Reporting Methodology
and Legislative Compliance
Method of Consolidation
The 2018-19 Second Quarter Fiscal Update and Economic Statement reports on the same scope, using the same method of consolidation, as presented in Budget 2018.
This is also the same scope and consolidation approach used in the Consolidated Financial Statements in the Government of Alberta Annual Report.
The results of all government departments, funds and agencies, except those designated as government business enterprises, are consolidated on a line-by-line basis. Revenue and expense transactions between consolidated entities have been eliminated.
The accounts of provincial agencies designated as government business enterprises are included on the modified equity basis, computed in accordance with International Financial Reporting Standards applicable to those entities.
Basis of Financial Reporting
The consolidated fiscal summary reports revenue (including gains from disposal of tangible capital assets), expense (including amortization, inventory consumption, loss on disposal and write-down of tangible capital assets), and surplus / (deficit).
Revenue and expense are recorded using the accrual basis of accounting. Cash received for goods or services which have not been provided by period end is recorded as unearned revenue.
Transfers received for capital purposes, and donated capital assets, are recorded as “deferred capital contributions” when the cash or asset is received, and recognized in revenue over the related asset’s useful life (in effect matching the asset’s amortization expense).
Expense includes the province’s cash payments towards the unfunded pension liabilities, and the non-cash change in unfunded pension liabilities.
Debt servicing costs include interest payable, and amortization of issue costs and discounts / premiums on debt issues.
Compliance with Legislation
The Fiscal Planning and Transparency Act (FPTA) requires a public report on the accuracy of the Fiscal Plan for a fiscal year on or before November 30. The FPTA gives the President of Treasury Board and Minister of Finance discretion over the form of the report.
The 2018‑19 Second Quarter Fiscal Update and Economic Statement includes comparisons between the Budget 2018 estimates and first quarter forecasts for revenue and expense (including details and categories of each); the surplus / (deficit); the Contingency Account balance and cash adjustments; a summary balance sheet; the Capital Plan; and financing (borrowing) requirements. An updated Alberta economic outlook, with associated assumptions, is also provided.
Under the FPTA, operating expense increases, excluding those for dedicated revenue-operating expense, collective bargaining or other remuneration settlements, First Nations settlements, or increases funded by reserves of school boards, post-secondary institutions or Alberta Health Services, are limited to 1% of budgeted operating expense.
The forecast provided in this report is in compliance with the requirements of the FPTA.
| | |
| 2018–19 Second Quarter Fiscal Update and Economic Statement | | 15 |