Exhibit 99.1

This is the report to Albertans on Budget 2018: A Recovery Built to Last.
It is a permanent public record of the revenue, expense and results achieved by the Government of Alberta for the 2018 – 19 fiscal year.
The Government of Alberta 2018 ��� 19 Annual Report consists of three parts:
| | · | | Budget 2018 Key Results, which provide a description and variance analysis of government’s revenue, spending, assets and liabilities. |
| | · | | Consolidated Financial Statements, which provide an overall accounting of the government’s revenue and spending, and assets and liabilities. |
| | · | | Measuring Up, which reports on the progress that has been made towards achieving the government’s goals. |
Annual reports for each ministry have also been published, providing additional detailed information on performance and financial results.
Copyright © 2019
| | |
| Government of Alberta 2018–19 Annual Report |
| |
ISBN 978-1-4601-4522-7 (print) ISSN 2291-6423 (print) | | ISBN 978-1-4601-4523-4 (PDF) ISSN 2291-6431 (online) |

Preface
The Public Accounts of Alberta are prepared in accordance with the Financial Administration Act and the Fiscal Planning and Transparency Act. The Public Accounts consist of the Annual Report of the Government of Alberta and the annual reports of each of the 21 ministries.
This Annual Report of the Government of Alberta contains Budget 2018 Key Results, the audited Consolidated Financial Statements and the Measuring Up report, which compares actual performance results to desired results set out in the government’s strategic plan.
The annual reports of ministries are released concurrently with the Annual Report of the Government of Alberta. The ministry annual reports contain the financial information of the ministries and a comparison of actual performance results to desired results set out in the ministries’ business plans. Each ministry annual report also includes:
| ∎ | | Financial statements of entities making up the ministry which includes regulated funds, provincial agencies and Crown-controlled corporations for which the minister is responsible; |
| ∎ | | Other financial information as required by the Financial Administration Act and the Fiscal Planning and Transparency Act, as separate reports, to the extent that the ministry has anything to report; |
| ∎ | | Financial information relating to accountable organizations and trust funds. |
In December 2018, government announced changes to the 2018-19 Consolidated Financial Statements and ministry annual reports. Ministry and department audited financial statements previously included in the annual report of ministries have been replaced with the financial information of the ministries. Key information previously contained in the annual reports of each of the 21 ministries is now included in the Schedules to the audited Consolidated Financial Statements.
| | |
| GOVERNMENT OF ALBERTA 2018—19 ANNUAL REPORT | | 1 |
Table of Contents
| | |
| 2 | | GOVERNMENT OF ALBERTA 2018—19 ANNUAL REPORT |
Table of Contents, continued
| | |
| GOVERNMENT OF ALBERTA 2018—19 ANNUAL REPORT | | 3 |
BLANK PAGE
Budget 2018 Key Results
Table of Contents
Note: Amounts presented in tables and text may not add to totals due to rounding.
| | |
| 6 | | GOVERNMENT OF ALBERTA 2018—19 ANNUAL REPORT |
Financial Highlights
The deficit in 2018-19 was $6.7 billion, a decrease of $1.3 billion from 2017-18, and $2.1 billion lower than estimated in Budget 2018.
Total Revenue was $49.6 billion in 2018-19, $2.3 billion higher than in 2017-18, and an increase of $1.7 billion from budget.
| ∎ | | Change from 2017-18. Increases of $2.8 billion in income and other taxes, $0.4 billion in non-renewable resource revenue, $0.4 billion in transfers from the federal government, and $0.2 billion in premiums, fees and licences and other revenue, were partly offset by decreases of $0.8 billion in investment income and of $0.8 billion in net income from government business enterprises (GBEs). |
| ∎ | | Change from Budget. Increases of $0.8 billion in income taxes, $1.6 billion in resource revenue, $0.4 billion in other revenue were partly offset by decreases of $0.1 billion in other taxes, $0.5 billion in investment income, $0.2 billion in federal |
transfers, and $0.2 billion in net income from GBEs.
Total Expense was $56.3 billion, a $1 billion increase from 2017-18 and $0.2 billion more than estimated in budget. The following discussion is based on “Expense by Function” categories, not by ministry.
| ∎ | | Change from 2017-18. Comprises increases of $0.7 billion in health, $0.4 billion in education, $0.3 billion in social services, $0.6 billion in debt servicing costs and $0.4 billion lower pension recovery, less a decrease of $1.3 billion in other expense. |
| ∎ | | Change from Budget. Increases of $0.2 billion in education and $0.1 billion in the pension recovery were partly offset by a $0.2 billion decrease in health expense. |
Net Financial Debt. At March 31, 2019, net financial debt was $27.5 billion, an increase of $8.1 billion from March 31, 2018, mainly due to higher borrowing for the fiscal and capital plans.
Fiscal Summary
(millions of dollars)
| | | | | | | | | | | | | | | | | | | | |
| | | | | | | | | | | | Change from | |
| | | 2018-19 | | | 2017-18 | | | | | | 2017-18 | |
| | | | | | | | | | | | |
| | | Budget | | | Actual | | | Actual | | | Budget | | | Actual | |
| |
Revenue | | | | | | | | | | | | | | | | | | | | |
Income taxes | | | 15,938 | | | | 16,745 | | | | 14,223 | | | | 807 | | | | 2,522 | |
Other taxes | | | 6,961 | | | | 6,833 | | | | 6,538 | | | | (128 | ) | | | 295 | |
Non-renewable resource revenue | | | 3,829 | | | | 5,429 | | | | 4,980 | | | | 1,600 | | | | 449 | |
Transfers from Government of Canada | | | 8,218 | | | | 8,013 | | | | 7,605 | | | | (205 | ) | | | 408 | |
Investment income | | | 2,884 | | | | 2,349 | | | | 3,126 | | | | (535 | ) | | | (777) | |
Net income from government business enterprises | | | 2,777 | | | | 2,585 | | | | 3,387 | | | | (102 | ) | | | (802) | |
Premiums, fees and licences | | | 3,857 | | | | 3,909 | | | | 3,843 | | | | 52 | | | | 66 | |
Other revenue | | | 3,415 | | | | 3,761 | | | | 3,593 | | | | 346 | | | | 168 | |
| | | | |
Total Revenue | | | 47,879 | | | | 49,624 | | | | 47,295 | | | | 1,740 | | | | 2,322 | |
| | | | |
Expense by Function | | | | | | | | | | | | | | | | | | | | |
Health | | | 22,099 | | | | 21,921 | | | | 21,239 | | | | (178 | ) | | | 682 | |
Education | | | 14,633 | | | | 14,848 | | | | 14,471 | | | | 215 | | | | 377 | |
Social Services | | | 5,922 | | | | 5,867 | | | | 5,592 | | | | (55 | ) | | | 275 | |
Other expense1 | | | 11,916 | | | | 11,918 | | | | 13,189 | | | | 2 | | | | (1,271) | |
| | | | |
Total Program Expense | | | 54,570 | | | | 54,554 | | | | 54,491 | | | | (16 | ) | | | 63 | |
Debt servicing costs | | | 1,921 | | | | 1,971 | | | | 1,420 | | | | 50 | | | | 551 | |
Pension provisions / (recovery) | | | (310 | ) | | | (190 | ) | | | (593 | ) | | | 120 | | | | 403 | |
| | | | |
Total Expense | | | 56,181 | | | | 56,335 | | | | 55,318 | | | | 154 | | | | 1,017 | |
| |
Risk Adjustment | | | (500 | ) | | | - | | | | - | | | | 500 | | | | - | |
| |
Surplus / (Deficit) | | | (8,802 | ) | | | (6,711 | ) | | | (8,023 | ) | | | 2,086 | | | | 1,305 | |
| |
| | | | | | | | | | | | | | | | | | | | |
| |
Net Financial Debt | | | (29,585 | ) | | | (27,477 | ) | | | (19,344 | ) | | | (2,108 | ) | | | (8,133) | |
| |
| 1 | Other expense by function categories are detailed in the Statement of Operations on page 19 in the Consolidated Financial Statements. |
| | |
| BUDGET 2018 KEY RESULTS | | 7 |
Revenue Highlights
Total revenue was $49.6 billion in 2018-19, 2.3 billion higher than in 2017-18, and an increase of $1.7 billion from the Budget 2018 estimate.
| ∎ | | Revenue from income taxes was $16.7 billion in 2018-19, comprising $11.9 billion in personal income tax (PIT) and $4.9 billion in corporate income tax (CIT). PIT was up $0.5 billion from budget and $1.1 billion from 2017-18 mainly due to growth in employment and incomes and $0.4 billion in prior-years’ adjustments. CIT was $1.4 billion higher than it was in 2017-18 and $0.3 billion higher than in budget mainly due to year-end accounting adjustments, such as refund liabilities or accounts payable. |
| ∎ | | Other tax revenue was $6.8 billion in 2018-19, comprising: $2.4 billion in education property tax, which was frozen at the 2017-18 requisition level, $1.4 billion in fuel tax, $1.3 billion in carbon tax and $1.7 billion in other taxes. Other tax revenue was up $0.3 billion from 2017-18, but down $0.1 billion from budget. The 2017-18 change was due almost entirely to the $10 per tonne carbon price increase, effective January 1, 2018, while the change from budget was due to lower demand. |
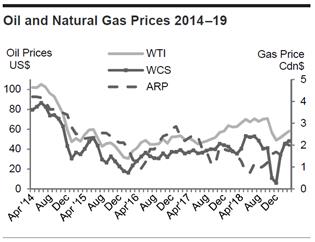
| ∎ | | Non-renewable resource revenue was $5.4 billion, a $0.4 billion increase from 2017-18, and an increase of $1.6 billion from budget, primarily due to higher oil prices and production, and a lower exchange rate. The West Texas Intermediate price averaged US$62.77 in 2018-19, up $9.08 from 2017-18 and $3.77 from the budget estimate. The Western Canadian Select heavy oil price averaged Cdn$51.65, up $1.27 from 2017-18. The average light-heavy differential in 2018-19 was US$23.31, $8.91 wider than 2017-18, but higher oil prices muted the impact. |
| ∎ | | Transfers from the Government of Canada were $8 billion in 2018-19, an increase of $0.4 billion from 2017-18, mainly due to expected growth in the Canada Health Transfer (CHT) and Canada Social Transfer (CST). The $0.2 billion decrease from budget was due to revisions to population numbers, which impact the CHT and CST, as well as re-profiling federal infrastructure funding to future years. |
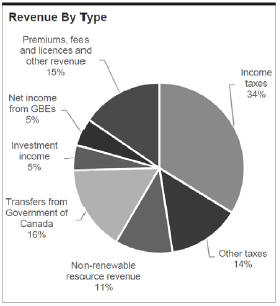
| ∎ | | Investment income was $2.3 billion in 2018-19, down $0.8 billion from 2017-18 and $0.5 billion from budget, due mainly to weaker market returns. |
| ∎ | | Net income from government business enterprises was $2.6 billion in 2018-19, with $2.3 billion of this from the Alberta Gaming, Liquor and Cannabis Commission. The $0.8 billion decrease from 2017-18 was mainly due to a $0.4 billion decrease in the Balancing Pool net income, which reported a reduction to its liability of $0.8 billion in 2017-18 that was reported as revenue. The $0.2 billion decrease from budget was mainly due to decreases in Alberta Petroleum Marketing Commission and ATB Financial net income, due to delays in opening the Sturgeon Refinery, and to higher credit loss provisions. |
| ∎ | | Premiums, fees and licences and other revenue totalled $7.7 billion in 2018-19, up $0.2 billion from 2017-18 and $0.4 billion from budget. The increase from 2017-18 was primarily due to an increase in compliance payments from large emitters under the new regulation which adjusted the calculation, and the increase from budget was due to an increase in refunds of prior-year expense, recorded as revenue. |
| | |
| 8 | | GOVERNMENT OF ALBERTA 2018—19 ANNUAL REPORT |
Expense Highlights
Total expense in 2018-19 was $56.3 billion. On a functional basis this comprises $21.9 billion for health, $14.8 billion for education, $5.9 billion for social services, $11.9 billion in other program expense, debt servicing costs of $2 billion and negative $0.2 billion in reduced pension liabilities.
| ∎ | | Health expense was $21.9 billion in 2018-19, up $0.7 billion from 2017-18 primarily due to a $0.2 billion increase for home, continuing and community care reflecting increases in volume and enhanced care under the Continuing Care Capacity Plan, and a $0.2 billion increase for physician compensation reflecting higher volumes. The $0.2 billion decrease from budget is primarily due to savings on generic drugs as a result of a new pricing agreement with Canada’s generic drug industry and higher product listing agreement cost recoveries, staff vacancies, and delays in opening continuing care beds. |
| ∎ | | Education expense was $14.8 billion in 2018-19, up $0.4 billion from 2017-18 and $0.2 billion from budget. The increase from 2017-18 was due to enrolment growth and the increase from budget was mainly due to local decisions by school boards using their reserves, partly offset by hiring delays and vacancies in post-secondary institutions. |

| ∎ | | Social services expense was $5.9 billion in 2018-19, up $0.3 billion from 2017-18, and down $0.1 billion from budget. The increase from 2017-18 was primarily due to caseload growth in income support programs, child care, child intervention services, seniors and programs to support disabled individuals, and to benefit rate increases, including indexation to inflation, of various social programs. The $0.1 billion decrease from budget was primarily due to reclassifying information technology. |
| ∎ | | Other expense was $11.9 billion, virtually unchanged from budget, but down $1.3 billion from 2017-18 due to re-profiling of $0.8 billion for the Municipal Sustainability Initiative from future years into 2017-18. |
| ∎ | | Debt servicing costs were $2.0 billion, an increase of $0.6 billion from 2017-18 and $0.1 billion from budget. The increase from 2017-18 is primarily due increased borrowing for the fiscal and capital plans, although $0.1 billion of the increase is due to less favourable results from the Alberta Capital Finance Authority (ACFA) debt rate swaps. ACFA on-lends to municipalities and other local authorities. ACFA’s debt servicing costs are more than offset by investment income. The $0.1 billion increase from budget was due mainly to additional borrowing undertaken in advance for 2019-20 cash management purposes. |
| ∎ | | Public sector pension plan liabilities decreased by $0.2 billion to $9.2 billion at March 31, 2019. This was a $0.4 billion lower change than the change in 2017-18, mainly due to 2017-18 reflecting the impact of healthy financial market returns. The liability reduction of $0.2 billion was reported as a negative expense. |
| | |
BUDGET 2018 KEY RESULTS | | 9 |
Balance Sheet
At March 31, 2019, Government of Alberta financial and non-financial assets exceeded liabilities by $23.3 billion. This was $6.4 billion lower than March 31, 2018, mainly due to an increase in debt that was partly offset by an increase in assets.
Financial assets were $75.7 billion, $4.8 billion higher than on March 31, 2018, mainly due to an increase in cash and cash equivalents from borrowing undertaken for 2019-20 operations.
Liabilities were $103.2 billion in 2018-19, $12.9 billion higher than in 2017-18 mainly due to an increase in debt for the government’s fiscal and capital plans. Total debt for the capital and fiscal plans was $60.0 billion. The majority of the remaining $20.8 billion in debt is primarily related to the Alberta Capital Finance Authority and Agriculture Financial Services Corporation, which on-lend to local authorities and the agriculture sector. Most of this debt is thus offset by the loans receivable (financial asset).
Capital / other non-financial assets net of deferred capital contibutions was $50.7 billion in 2018-19, $1.7 billion above 2017-18, reflecting $4.1 billion in capital asset acquisition and $0.3 billion in pre-paid expense, less $2.5 billion in amortization and disposals. Major capital investment included:
| ∎ | | $1.2 billion for the highway network mainly comprising: $0.3 billion for Calgary’s ring road, with the final, southwest portion about 50% |
| | | complete; $0.3 billion for highway twinning, widening and expansion, which includes the Peace River Bridge twinning and Grande Prairie Highway 43 Bypass, and $0.4 billion for highway rehabilitation. |
| ∎ | | $0.9 billion for health facilities and equipment. The Edson Healthcare Centre was completed in 2018- 19 and construction continued on major projects: Medicine Hat Regional Hospital Redevelopment and Expansion; Grande Prairie Regional Hospital; Fort McMurray Willow Square; Calgary Cancer Centre; Stollery Children’s Hospital Critical Care Program at the University of Alberta (U of A) Hospital. |
| ∎ | | $0.7 billion for schools and other capital asset acquisition in the K-12 education system, including $0.5 billion for schools, $0.2 billion for school capital maintenance and renewal (CMR) and school board funding. Of the 278 projects announced since 2011, 207 have been completed, including 30 schools in 2018-19. |
| ∎ | | $0.7 billion for post-secondary projects, including funding of $0.2 billion for expansion and upgrading, $0.4 billion in post-secondary institution funding and donations and $0.1 billion for CMR. Major projects included University of Calgary MacKimmie Complex, U of A Dentistry / Pharmacy renewal, University of Lethbridge Destination project, Medicine Hat College East Development and Northern Lakes College High Prairie Consolidation. |
| | | | | | | | | | | | |
Balance Sheet Summary | | | | | | | | | | | | |
| (millions of dollars) | | at March 31 | |
| | 2019 Actual | | | 2018 Actual | | | Change from
2018 | |
Financial Assets | | | | | | | | | | | | |
Portfolio investments | | | 31,261 | | | | 30,845 | | | | 416 | |
Equity in government business enterprises | | | 3,062 | | | | 2,527 | | | | 535 | |
Other | | | 41,420 | | | | 37,605 | | | | 3,815 | |
| | | 75,743 | | | | 70,977 | | | | 4,766 | |
| | | |
Liabilities | | | | | | | | | | | | |
Debt and liabilities under public private partnerships | | | 80,791 | | | | 66,414 | | | | 14,377 | |
Pension liabilities | | | 9,240 | | | | 9,430 | | | | (190 | ) |
Other | | | 13,189 | | | | 14,477 | | | | (1,288 | ) |
| | | | 103,220 | | | | 90,321 | | | | 12,899 | |
Net Financial Debt | | | (27,477 | ) | | | (19,344 | ) | | | (8,133 | ) |
Capital / Other Non-financial Assets | | | 53,908 | | | | 52,024 | | | | 1,884 | |
Spent deferred capital contributions | | | (3,164 | ) | | | (3,009 | ) | | | (155 | ) |
Net Assets | | | 23,267 | | | | 29,671 | | | | (6,404 | ) |
Change in Net Assets | | | (6,404 | ) | | | (8,050 | ) | | | | |
| | |
| 10 | | GOVERNMENT OF ALBERTA 2018—19 ANNUAL REPORT |
Financial Indicators and Risks
| ∎ | | Net financial debt on March 31, 2019 was $27.5 billion, or $6,380 per person. This is a deterioration of $40.5 billion over five years, when the government reported net financial assets of $13.1 billion. |
| ∎ | | Over the same period revenue has remained unchanged. The government reported revenue of $49.5 billion in 2014-15. Revenue then dipped to a low of $42.3 billion in 2016-17 before returning to $49.6 billion in 2018-19. |
| ∎ | | Expense has grown by a total of 16.5% or an average of 3.9% per year since 2014-15. Expense varies by program, but many are demand-driven (e.g. enrolment growth, physician costs) and others are driven by emergencies such as wildfires and floods. |
| ∎ | | Alberta relies heavily on revenue that is volatile and unpredictable, including non-renewable resources, corporate income tax and investment income. Since 2004-05, these have accounted for up to 55% of total revenue, while over the last five years they have averaged 26%. The revenue volatility is linked to numerous factors, some of which are described below. |
| ∎ | | Oil prices depend on various assumptions for supply and demand. Factors influencing demand include economic growth, pipeline or refinery outages, and speculative market activities by traders. Supply is mainly impacted by production cuts and the US response to higher prices. Other factors include drilling and investment decisions, geopolitical events, economic sanctions, or weather related disruptions. WTI prices increased in the first half of 2018-19, and then decreased sharply due to continued supply growth coupled with concerns about weakening global demand growth. Likewise, market access bottlenecks led to rising inventories and lower WCS prices in late 2018. Short-term reductions in Alberta’s oil production and US sanctions on Venezuelan heavy oil supply, narrowed the light-heavy differential to within US$1 of the budget estimate. |
| ∎ | | Weaker-than-forecast global and US growth harms Alberta’s revenue forecast, as oil prices would remain lower for longer. |
| ∎ | | A decrease in Alberta’s population reduces many revenue sources and demand-driven expense. In |
| | 2018-19, a Statistics Canada revision to population resulted in lower federal transfers. |
| ∎ | | Higher interest rates typically discourage business investment and economic activity, which contribute to lower income tax revenue. |
| ∎ | | A lower exchange rate increases the value of exports and positively impacts government revenue. |
| ∎ | | Equity markets have performed well over the last several years, and government investment income has benefited. Markets can be affected by a wide range of factors, such as strength in global economies, fluctuations in commodity prices, and interest rates. Investment income decreased from 2017-18 and from the budget estimate as market performance was not as strong. |
| ∎ | | Improvements to net corporate operating surplus positively impact revenue, but can be difficult to predict as taxable income can vary significantly from corporate profits due to discretionary deductions or prior-year losses that can be carried forward or back. |
| ∎ | | The degree of revenue uncertainty means the Alberta government must assess the degree of risk associated with its revenue and spending decisions. For the last two years, the government included an annual risk adjustment, which was $0.5 billion in 2018-19. |
| ∎ | | These highlights should be read in conjunction with the budget and quarterly updates https://www.alberta.ca/budget-documents.aspx. |
| | |
| BUDGET 2018 KEY RESULTS | | 11 |
Historical Fiscal Summary, 2008-09 to 2018-19 a
(millions of dollars)
| | | | | | | | | | | | | | | | | | | | | | | | | | | | | | | | | | | | | | | | | | | | | | |
| | | | | 2008-09 | | | 2009-10 | | | 2010-11 | | | 2011-12 | | | 2012-13 | | | 2013-14 | | | 2014-15 | | | 2015-16 | | | 2016-17 | | | 2017-18 | | | 2018-19 | |
Income Statement | | | | | | | | | | | | | | | | | | | | | | | | | | | | | | | | | |
| | Revenue | | | | | | | | | | | | | | | | | | | | | | | | | | | | | | | | | | | | | | | | | | | | |
| 1 | | Personal income tax | | | 8,708 | | | | 7,877 | | | | 7,631 | | | | 8,563 | | | | 9,621 | | | | 10,537 | | | | 11,042 | | | | 11,357 | | | | 10,763 | | | | 10,775 | | | | 11,874 | |
| 2 | | Corporate income tax | | | 4,252 | | | | 4,754 | | | | 3,334 | | | | 3,678 | | | | 4,756 | | | | 5,488 | | | | 5,796 | | | | 4,195 | | | | 3,769 | | | | 3,448 | | | | 4,871 | |
| 3 | | Other tax revenue | | | 3,817 | | | | 3,746 | | | | 3,820 | | | | 4,099 | | | | 4,333 | | | | 4,500 | | | | 4,598 | | | | 5,168 | | | | 5,649 | | | | 6,538 | | | | 6,833 | |
| 4 | | Resource revenue | | | 11,915 | | | | 6,768 | | | | 8,428 | | | | 11,636 | | | | 7,779 | | | | 9,578 | | | | 8,948 | | | | 2,789 | | | | 3,097 | | | | 4,980 | | | | 5,429 | |
| 5 | | Investment income | | | (1,888 | ) | | | 3,541 | | | | 2,486 | | | | 2,168 | | | | 2,595 | | | | 3,423 | | | | 3,113 | | | | 2,544 | | | | 3,698 | | | | 3,126 | | | | 2,349 | |
| 6 | | Premiums, fees and licences | | | 3,356 | | | | 2,857 | | | | 2,922 | | | | 2,931 | | | | 3,184 | | | | 3,437 | | | | 2,665 | | | | 3,574 | | | | 3,701 | | | | 3,839 | | | | 3,911 | |
| 7 | | Other own-source revenue | | | 4,587 | | | | 4,627 | | | | 4,903 | | | | 5,128 | | | | 5,234 | | | | 5,412 | | | | 7,337 | | | | 5,850 | | | | 3,637 | | | | 6,982 | | | | 6,344 | |
| 8 | | Total own-source revenue | | | 34,747 | | | | 34,170 | | | | 33,524 | | | | 38,203 | | | | 37,502 | | | | 42,375 | | | | 43,499 | | | | 35,477 | | | | 34,314 | | | | 39,688 | | | | 41,611 | |
| 9 | | Federal transfers | | | 4,578 | | | | 5,342 | | | | 5,452 | | | | 5,192 | | | | 5,042 | | | | 7,059 | | | | 5,982 | | | | 7,142 | | | | 7,979 | | | | 7,606 | | | | 8,013 | |
| 10 | | Total Revenue | | | 39,325 | | | | 39,512 | | | | 38,976 | | | | 43,395 | | | | 42,544 | | | | 49,434 | | | | 49,481 | | | | 42,619 | | | | 42,293 | | | | 47,295 | | | | 49,624 | |
| | Expense by Function | | | | | | | | | | | | | | | | | | | | | | | | | | | | | | | | | | | | | | | | | | | | |
| 11 | | Health | | | 13,674 | | | | 14,636 | | | | 15,393 | | | | 16,284 | | | | 17,254 | | | | 17,967 | | | | 19,366 | | | | 20,115 | | | | 20,687 | | | | 21,239 | | | | 21,921 | |
| 12 | | Basic / advanced education | | | 10,438 | | | | 11,067 | | | | 11,362 | | | | 11,951 | | | | 12,394 | | | | 12,782 | | | | 13,103 | | | | 13,673 | | | | 14,110 | | | | 14,471 | | | | 14,848 | |
| 13 | | Social services | | | 3,417 | | | | 3,807 | | | | 4,129 | | | | 4,278 | | | | 4,641 | | | | 4,668 | | | | 4,548 | | | | 4,752 | | | | 5,198 | | | | 5,592 | | | | 5,867 | |
| 14 | | Other program expense | | | 10,386 | | | | 9,834 | | | | 9,443 | | | | 9,853 | | | | 10,528 | | | | 12,970 | | | | 11,031 | | | | 10,375 | | | | 12,607 | | | | 13,189 | | | | 11,918 | |
| 15 | | Total program expense | | | 37,915 | | | | 39,344 | | | | 40,327 | | | | 42,366 | | | | 44,817 | | | | 48,387 | | | | 48,048 | | | | 48,915 | | | | 52,602 | | | | 54,491 | | | | 54,554 | |
| 16 | | Debt servicing costs | | | 208 | | | | 214 | | | | 472 | | | | 509 | | | | 530 | | | | 601 | | | | 722 | | | | 776 | | | | 1,018 | | | | 1,420 | | | | 1,971 | |
| 17 | | Pension provisions | | | 2,133 | | | | 430 | | | | 439 | | | | 634 | | | | 296 | | | | 748 | | | | (404 | ) | | | (630 | ) | | | (543 | ) | | | (593 | ) | | | (190 | ) |
| 18 | | Total Expense | | | 40,256 | | | | 39,988 | | | | 41,238 | | | | 43,509 | | | | 45,643 | | | | 49,736 | | | | 48,366 | | | | 49,061 | | | | 53,077 | | | | 55,318 | | | | 56,335 | |
| 19 | | Surplus / (Deficit) | | | (931 | ) | | | (476 | ) | | | (2,262 | ) | | | (114 | ) | | | (3,099 | ) | | | (302 | ) | | | 1,115 | | | | (6,442 | ) | | | (10,784 | ) | | | (8,023 | ) | | | (6,711 | ) |
| Capital Plan b | | | 7,943 | | | | 8,000 | | | | 7,544 | | | | 6,884 | | | | 6,062 | | | | 5,770 | | | | 6,181 | | | | 6,558 | | | | 6,578 | | | | 9,016 | | | | 6,127 | |
| | | | | | | | | | | |
| Balance Sheet (at March 31) | | | | | | | | | | | | | | | | | | | | | | | | | | | | | | | | | | | | | | | | | | | | |
| 20 | | Heritage / endowment funds | | | 16,900 | | | | 17,077 | | | | 17,500 | | | | 17,936 | | | | 18,176 | | | | 18,562 | | | | 18,860 | | | | 19,262 | | | | 19,836 | | | | 20,306 | | | | 20,716 | |
| 21 | | Contingency Account | | | 16,822 | | | | 14,983 | | | | 11,192 | | | | 7,497 | | | | 3,326 | | | | 4,658 | | | | 6,529 | | | | 3,625 | | | | 2,399 | | | | 1,661 | | | | 6,342 | |
| 22 | | Other financial assets | | | 28,868 | | | | 30,338 | | | | 30,799 | | | | 32,972 | | | | 34,734 | | | | 40,039 | | | | 40,688 | | | | 40,990 | | | | 44,052 | | | | 49,010 | | | | 48,685 | |
| 23 | | Capital Plan liabilities | | | (880 | ) | | | (2,888 | ) | | | (3,199 | ) | | | (3,442 | ) | | | (4,594 | ) | | | (8,724 | ) | | | (11,922 | ) | | | (19,040 | ) | | | (23,769 | ) | | | (29,339 | ) | | | (33,597 | ) |
| 24 | | Fiscal Plan liabilities (borrowing / pre-1992 TPP) | | | 0 | | | | (1,187 | ) | | | (1,187 | ) | | | (1,187 | ) | | | (1,187 | ) | | | (1,187 | ) | | | (943 | ) | | | (944 | ) | | | (95,29 | ) | | | (14,023 | ) | | | (26,374 | ) |
| 25 | | Pension obligations | | | (10,239 | ) | | | (9,483 | ) | | | (9,922 | ) | | | (10,556 | ) | | | (10,852 | ) | | | (11,600 | ) | | | (11,196 | ) | | | (10,566 | ) | | | (10,023 | ) | | | (9,430 | ) | | | (9,240 | ) |
| 26 | | Other liabilities | | | (19,770 | ) | | | (21,523 | ) | | | (23,530 | ) | | | (24,229 | ) | | | (25,148 | ) | | | (28,716 | ) | | | (28,962 | ) | | | (29,408 | ) | | | (31,867 | ) | | | (37,529 | ) | | | (34,009 | ) |
| 27 | | Net Financial Assets / (Debt) | | | 31,701 | | | | 27,317 | | | | 21,653 | | | | 18,991 | | | | 14,455 | | | | 13,032 | | | | 13,054 | | | | 3,919 | | | | (8,901 | ) | | | (19,344 | ) | | | (27,477 | ) |
| 28 | | Capital (net of defer, Contrib.) / non-fin. assets | | | 30,275 | | | | 34,217 | | | | 37,607 | | | | 40,122 | | | | 39,517 | | | | 40,839 | | | | 42,197 | | | | 44,623 | | | | 46,622 | | | | 49,015 | | | | 50,744 | |
| 29 | | Net Assets c | | | 61,976 | | | | 61,534 | | | | 59,260 | | | | 59,113 | | | | 53,972 | | | | 53,871 | | | | 55,251 | | | | 48,542 | | | | 37,721 | | | | 29,671 | | | | 23,267 | |
| a | Numbers are not strictly comparable due to numerous accounting policy changes over time. Examples include reporting certain items (transfers through the tax system, crude oil marketing and transportation costs, allowance for corporate income tax doubtful accounts) as expense, instead of netting the amounts from related revenue, increasing both revenue and expense, but not impacting the surplus / (deficit), 2015-16 revenue and expense have been increased by $119 million to correct a consolidation adjustment eliminating those amounts at year-end, with no deficit impact, 2016-17 revenue and expense have been reduced by $111 million resulting from an accounting treatment change such that drug cost rebates under Product Listing Agreements are netted from operating expense instead of being reported as revenue and gross expense. |
| b | Reflects capital grants and other support included in expense, and capital investment in government-owned assets not included in expense. Capital investment adds to capital assets, which are depreciated over time through amortization expense. Numbers for 2008-09 to 2013-14 are estimates as details required to consolidate SUCH sector capital spending with full accuracy are not readily available. |
| c | The change in net assets / (debt) year over year does not match the surplus / (deficit) exactly in most years, due to various balance sheet adjustments, most of which are minor. A significant adjustment reducing net assets by $2 billion was made in 2012-13, to recognize the accumulated deferred capital contribution liability when the accounting standard was adopted. |
| | |
| 12 | | GOVERNMENT OF ALBERTA 2018—19 ANNUAL REPORT |
Consolidated Financial Statements
BLANK PAGE
| | |
| CONSOLIDATED FINANCIAL STATEMENTS | | 15 |
Table of Contents, continued
| | |
| 16 | | GOVERNMENT OF ALBERTA 2018—19 ANNUAL REPORT |
Management’s Responsibility
for the Consolidated Financial Statements
The consolidated financial statements are prepared by the Controller under the general direction of the Deputy Minister of Treasury Board and Finance as authorized by the President of Treasury Board and Minister of Finance pursuant to the Financial Administration Act. The consolidated financial statements are prepared in accordance with Canadian Public Sector Accounting Standards, and of necessity include some amounts that are based on estimates and judgments. As required by the Fiscal Planning and Transparency Act, the consolidated financial statements are included in the consolidated annual report of the Province of Alberta that forms part of the Public Accounts.
To fulfill its accounting and reporting responsibilities, management maintains systems of financial management and internal control which give consideration to costs, benefits and risks, and which are designed to:
| ∎ | | Provide reasonable assurance that transactions are properly authorized, executed in accordance with prescribed legislation and regulations, and properly recorded so as to maintain accountability for public money, and |
| ∎ | | Safeguard the assets and properties of the Province of Alberta under government administration. |
Under the Financial Administration Act, deputy heads are responsible for the collection of revenue payable to the Crown, and for making and controlling disbursements with respect to their departments. They are also responsible for prescribing the accounting systems to be used in their departments. In order to meet government accounting and reporting requirements, the Controller obtains information relating to departments, regulated funds, provincial agencies, Crown-controlled corporations, schools, universities, colleges, technical institutes, Alberta Health Services and other health entities from ministries as necessary.
The consolidated financial statements are reviewed by the Audit Committee established under the Auditor General Act. The Audit Committee advises the Lieutenant Governor in Council on the scope and results of the Auditor General’s audit of the consolidated financial statements of the Province.
The Auditor General of Alberta provides an independent opinion on the consolidated financial statements. The duties of the Auditor General in that respect are contained in the Auditor General Act.
Annually, the consolidated annual report is tabled in the Legislature as a part of the Public Accounts and is referred to the Standing Committee on Public Accounts of the Legislative Assembly.
Approved by:
Athana Mentzelopoulos
Deputy Minister of Treasury Board and Finance
Dan Stadlwieser, CPA, CA
Controller
Edmonton, Alberta
June 18, 2019
| | |
| CONSOLIDATED FINANCIAL STATEMENTS | | 17 |
| | |
| Independent Auditor’s Report | | 
|
To the Members of the Legislative Assembly
Report on the Consolidated Financial Statements
Opinion
I have audited the consolidated financial statements of the Province of Alberta, which comprise the consolidated statement of financial position as at March 31, 2019, and the consolidated statements of operations, change in net debt, and cash flows for the year then ended, and notes and schedules to the consolidated financial statements, including a summary of significant accounting policies.
In my opinion, the accompanying consolidated financial statements present fairly, in all material respects, the consolidated financial position of the Province of Alberta as at March 31, 2019, and the results of its operations, its changes in net debt, and its cash flows for the year then ended in accordance with Canadian public sector accounting standards.
Basis for opinion
I conducted my audit in accordance with Canadian generally accepted auditing standards. My responsibilities under those standards are further described in the Auditor’s Responsibilities for the Audit of the Consolidated Financial Statements section of my report. I am independent of the Province of Alberta in accordance with the ethical requirements that are relevant to my audit of the consolidated financial statements in Canada, and I have fulfilled my other ethical responsibilities in accordance with these requirements. I believe that the audit evidence I have obtained is sufficient and appropriate to provide a basis for my opinion.
Other information
Management is responsible for the other information. The other information comprises the information included in the Government of Alberta 2018-19 Annual Report, but does not include the consolidated financial statements and my auditor’s report thereon.
My opinion on the consolidated financial statements does not cover the other information and I do not express any form of assurance conclusion thereon.
In connection with my audit of the consolidated financial statements, my responsibility is to read the other information and, in doing so, consider whether the other information is materially inconsistent with the consolidated financial statements or my knowledge obtained in the audit or otherwise appears to be materially misstated. If, based on the work I have performed, I conclude that there is a material misstatement of this other information, I am required to report that fact. I have nothing to report in this regard.
| | |
| 18 | | GOVERNMENT OF ALBERTA 2018—19 ANNUAL REPORT |
Independent Auditor’s Report, continued
Responsibilities of management and those charged with governance for the consolidated financial statements
Management is responsible for the preparation and fair presentation of the consolidated financial statements in accordance with Canadian public sector accounting standards, and for such internal control as management determines is necessary to enable the preparation of the consolidated financial statements that are free from material misstatement, whether due to fraud or error.
In preparing the consolidated financial statements, management is responsible for assessing the Province of Alberta’s ability to continue as a going concern, disclosing, as applicable, matters related to going concern, and using the going concern basis of accounting unless an intention exist to liquidate or to cease operations, or there is no realistic alternative but to do so.
Those charged with governance are responsible for overseeing the Province’s financial reporting process.
Auditor’s responsibilities for the audit of the consolidated financial statements
My objectives are to obtain reasonable assurance about whether the consolidated financial statements as a whole are free from material misstatement, whether due to fraud or error, and to issue an auditor’s report that includes my opinion. Reasonable assurance is a high level of assurance, but is not a guarantee that an audit conducted in accordance with Canadian generally accepted auditing standards will always detect a material misstatement when it exists. Misstatements can arise from fraud or error and are considered matetial if, individually or in the aggregate, they could reasonably be expected to influence the economic decisions of users taken on the basis of these consolidated financial statements.
As part of an audit in accordance with Canadian generally accepted auditing standards, I exercise professional judgment and maintain professional skepticism throughout the audit. I also:
| · | | Identify and assess the risks of material misstatement of the consolidated financial statements, whether due to fraud or error, design and perform audit procedures responsive to those risks, and obtain audit evidence that is sufficient and appropriate to provide a basis for my opinion. The risk of not detecting a material misstatement resulting from fraud is higher than for one resulting from error, as fraud may involve collusion, forgery, intentional omissions, misrepresentations, or the override of internal control. |
| · | | Obtain an understanding of internal control relevant to the audit in order to design audit procedures that are appropriate in the circumstances, but not for the purpose of expressing an opinion on the effectiveness of the Province of Alberta’s internal control. |
| · | | Evaluate the appropriateness of accounting policies used and the reasonableness of accounting estimates and related disclosures made by management. |
| | |
| CONSOLIDATED FINANCIAL STATEMENTS | | 19 |
Independent Auditor’s Report, continued
| · | | Conclude on the appropriateness of management’s use of the going concern basis of accounting and, based on the audit evidence obtained, whether a material uncertainty exists related to events or conditions that may cast significant doubt on the Province’s ability to continue as a going concern. If I conclude that a material uncertainty exists, I am required to draw attention in my auditor’s report to the related disclosures in the consolidated financial statements or, if such disclosures are inadequate, to modify my opinion. My conclusions are based on the audit evidence obtained up to the date of my auditor’s report. However, future events or conditions may cause the Province to cease to continue as a going concern. |
| · | | Evaluate the overall presentation, structure and content of the consolidated financial statements, including the disclosures, and whether the consolidated financial statements represent the underlying transactions and events in a manner that achieves fair presentation. |
| · | | Obtain sufficient appropriate audit evidence regarding the financial information of the entities and business activities within the consolidated financial statements, to express an opinion on the consolidated financial statements. I am responsible for the direction, supervision and performance of the group audit. I remain solely responsible for my audit opinion. |
I communicate with those charged with governance regarding, among other matters, the planned scope and timing of the audit and significant audit findings, including any significant deficiencies in internal control that I identify during my audit.
I also provide those charged with governance with a statement that I have complied with relevant ethical requirements regarding independence, and to communicate with them all relationships and other matters that may reasonably be thought to bear on my independence, and where applicable, related safeguards.
In accordance with the Auditor General Act, I am responsible to report the independent opinion on the consolidated financial statements of the Province of Alberta completed by my office.
[Original signed by W. Doug Wylie FCPA, FCMA, ICD.D]
Auditor General
June 18, 2019
Edmonton, Alberta
| | |
| 20 | | GOVERNMENT OF ALBERTA 2018—19 ANNUAL REPORT |
Consolidated Statement of Operations
| | | | | | | | | | | | |
| Year Ended March 31 | | | | | | |
| | | 2019 | | | 2018 | |
| | | Budget | | | Actual | | | Actual | |
| | | In millions | | | | |
| | | |
Revenues (Schedules 1 and 2) | | | | | | | | | | | | |
| | | |
Income taxes | | $ | 15,938 | | | $ | 16,745 | | | $ | 14,223 | |
| | | |
Other taxes | | | 6,961 | | | | 6,833 | | | | 6,538 | |
| | | |
Non-renewable resource revenue | | | 3,829 | | | | 5,429 | | | | 4,980 | |
| | | |
Transfers from Government of Canada | | | 8,218 | | | | 8,013 | | | | 7,605 | |
| | | |
Net income from government business enterprises (Schedule 8) | | | 2,777 | | | | 2,585 | | | | 3,387 | |
| | | |
Investment income | | | 2,884 | | | | 2,349 | | | | 3,126 | |
| | | |
Premiums, fees and licences | | | 3,857 | | | | 3,909 | | | | 3,843 | |
| | | |
Other | | | 3,415 | | | | 3,761 | | | | 3,593 | |
| | | |
| | | 47,879 | | | | 49,624 | | | | 47,295 | |
| | | |
Expenses by function (Schedule 3) | | | | | | | | | | | | |
| | | |
Health | | | 22,099 | | | | 21,921 | | | | 21,239 | |
| | | |
Education | | | 14,633 | | | | 14,848 | | | | 14,471 | |
| | | |
Social services | | | 5,922 | | | | 5,867 | | | | 5,592 | |
| | | |
General government | | | 2,508 | | | | 2,617 | | | | 2,238 | |
| | | |
Agriculture, resource management and economic development | | | 2,479 | | | | 2,319 | | | | 2,291 | |
| | | |
Protection of persons and property | | | 2,034 | | | | 2,021 | | | | 1,951 | |
| | | |
Transportation, communications and utilities | | | 1,757 | | | | 1,696 | | | | 2,204 | |
| | | |
Environment | | | 1,334 | | | | 1,299 | | | | 1,221 | |
| | | |
Regional planning and development | | | 1,190 | | | | 1,207 | | | | 2,518 | |
| | | |
Recreation and culture | | | 408 | | | | 458 | | | | 459 | |
| | | |
Housing | | | 206 | | | | 301 | | | | 307 | |
| | | |
Debt servicing costs | | | 1,921 | | | | 1,971 | | | | 1,420 | |
| | | |
Pension recovery (Schedule 12) | | | (310 | ) | | | (190 | ) | | | (593 | ) |
| | | |
| | | 56,181 | | | | 56,335 | | | | 55,318 | |
| | | |
Risk adjustment (Note 1c) | | | (500 | ) | | | - | | | | - | |
| | | |
Annual deficit | | | (8,802 | ) | | | (6,711 | ) | | | (8,023 | ) |
| | | |
Net assets at beginning of year – as previously reported | | | 29,671 | | | | 29,671 | | | | 37,721 | |
| | | |
Adjustments to net assets (Schedule 16) | | | - | | | | 307 | | | | (27 | ) |
| | | |
Net assets at end of year | | $ | 20,869 | | | $ | 23,267 | | | $ | 29,671 | |
The accompanying notes and schedules are part of these consolidated financial statements.
| | |
| CONSOLIDATED FINANCIAL STATEMENTS | | 21 |
Consolidated Statement of Financial Position
| | | | | | | | |
| As at March 31 | | | | | | |
| | | 2019 | | | 2018 | |
| | | In | | | millions | |
| | |
Financial assets | | | | | | | | |
| | |
Cash and cash equivalents (Schedule 4) | | $ | 14,695 | | | $ | 12,391 | |
| | |
Accounts receivable (Schedule 5) | | | 6,460 | | | | 5,771 | |
| | |
Portfolio investments (Schedule 6) | | | | | | | | |
| | |
Operating | | | 26,689 | | | | 28,428 | |
| | |
Endowments (Schedule 7) | | | 2,572 | | | | 2,417 | |
| | |
Equity in government business enterprises (Schedule 8) | | | 3,062 | | | | 2,527 | |
| | |
Loans and advances (Schedule 9) | | | 20,231 | | | | 19,405 | |
| | |
Inventories for resale and other | | | 34 | | | | 38 | |
| | |
| | | 75,743 | | | | 70,977 | |
| | |
Liabilities | | | | | | | | |
| | |
Accounts payable and other accrued liabilities (Schedule 10) | | | 11,814 | | | | 13,233 | |
| | |
Debt and liabilities under public private partnerships (Schedules 11 and 14) | | | 80,791 | | | | 66,414 | |
| | |
Pension liabilities (Schedule 12) | | | 9,240 | | | | 9,430 | |
| | |
Unspent deferred contributions (Schedule 13) | | | 1,375 | | | | 1,244 | |
| | |
| | | 103,220 | | | | 90,321 | |
| | |
Net debt | | | (27,477 | ) | | | (19,344 | ) |
| | |
Non-financial assets | | | | | | | | |
| | |
Tangible capital assets (Schedule 15) | | | 52,925 | | | | 51,399 | |
| | |
Prepaid expenses | | | 618 | | | | 284 | |
| | |
Inventories of supplies and other | | | 365 | | | | 341 | |
| | |
| | | 53,908 | | | | 52,024 | |
| | |
Net assets before spent deferred capital contributions | | | 26,431 | | | | 32,680 | |
| | |
Spent deferred capital contributions (Schedule 13) | | | 3,164 | | | | 3,009 | |
| | |
Net assets | | $ | 23,267 | | | $ | 29,671 | |
Contractual rights and obligations (Notes 4 and 6)
Contingent assets and liabilities (Notes 5 and 7)
The accompanying notes and schedules are part of these consolidated financial statements.
| | |
| 22 | | GOVERNMENT OF ALBERTA 2018–19 ANNUAL REPORT |
Consolidated Statement of Change in Net Debt
| | | | | | | | | | | | |
| Year Ended March 31 | | | | | | | | | |
| | | 2019 | | | 2018 | |
| | | Budget | | | Actual | | | Actual | |
| | | | | | In millions | | | | |
| | | |
Annual deficit | | $ | (8,802 | ) | | $ | (6,711 | ) | | $ | (8,023 | ) |
| | | |
Acquisition of tangible capital assets | | | (4,187 | ) | | | (3,837 | ) | | | (4,780 | ) |
| | | |
Additions to public private partnerships, capital leases, donated capital assets and other | | | (128 | ) | | | (268 | ) | | | (225 | ) |
| | | |
Amortization of tangible capital assets | | | 2,477 | | | | 2,472 | | | | 2,337 | |
| | | |
Net (gain)/loss on disposal and write-down of tangible capital assets | | | - | | | | (13 | ) | | | 28 | |
| | | |
Proceeds on sale of tangible capital assets | | | - | | | | 120 | | | | 38 | |
| | | |
(Increase)/decrease in inventory of supplies | | | - | | | | (24 | ) | | | 20 | |
| | | |
Increase in prepaid expenses | | | - | | | | (334 | ) | | | (36 | ) |
| | | |
Net increase in spent deferred capital contributions | | | 574 | | | | 155 | | | | 225 | |
| | | |
Change in accumulated unrealized gains/(losses) (Schedule 8) | | | - | | | | 166 | | | | (137 | ) |
| | | |
Other (Schedule 16) | | | - | | | | 141 | | | | 110 | |
| | | |
Increase in net debt | | | (10,066 | ) | | | (8,133 | ) | | | (10,443 | ) |
| | | |
Net debt at beginning of year | | | (19,344 | ) | | | (19,344 | ) | | | (8,901 | ) |
| | | |
Net debt at end of year | | $ | (29,410 | ) | | $ | (27,477 | ) | | $ | (19,344 | ) |
The accompanying notes and schedules are part of these consolidated financial statements.
| | |
| CONSOLIDATED FINANCIAL STATEMENTS | | 23 |
Consolidated Statement of Cash Flows
| | | | | | | | |
| Year Ended March 31 | | | | | | |
| | | 2019 | | | 2018 | |
| | | In | | | millions | |
| | |
Operating transactions | | | | | | | | |
| | |
Annual deficit | | $ | (6,711 | ) | | $ | (8,023 | ) |
| | |
Non-cash items | | | | | | | | |
| | |
Amortization of tangible capital assets | | | 2,472 | | | | 2,337 | |
| | |
Deferred contributions recognized as revenue | | | (1,652 | ) | | | (1,423 | ) |
| | |
Pension recovery | | | (190 | ) | | | (593 | ) |
| | |
Net income from government business enterprises | | | (2,585 | ) | | | (3,387 | ) |
| | |
Other non-cash items included in annual deficit | | | (122 | ) | | | 90 | |
| | |
| | | (8,788 | ) | | | (10,999 | ) |
| | |
Increase in accounts receivable, inventories and prepaids | | | (915 | ) | | | (638 | ) |
| | |
(Decrease)/increase in accounts payable and other accrued liabilities | | | (1,562 | ) | | | 1,522 | |
| | |
Distribution from government business enterprises | | | 2,165 | | | | 2,246 | |
| | |
Cash used by operating transactions | | | (9,100 | ) | | | (7,869 | ) |
| | |
Capital transactions | | | | | | | | |
| | |
Acquisition of tangible capital assets | | | (3,837 | ) | | | (4,780 | ) |
| | |
Proceeds on sale of tangible capital assets | | | 120 | | | | 38 | |
| | |
Cash used by capital transactions | | | (3,717 | ) | | | (4,742 | ) |
| | |
Investing transactions | | | | | | | | |
| | |
Purchases of portfolio investments | | | (8,589 | ) | | | (10,218 | ) |
| | |
Disposals of portfolio investments | | | 8,638 | | | | 10,103 | |
| | |
Loans and advances made | | | (2,482 | ) | | | (2,115 | ) |
| | |
Repayment of loans and advances | | | 1,576 | | | | 1,498 | |
| | |
Cash invested by investing transactions | | | (857 | ) | | | (732 | ) |
| | |
Financing transactions | | | | | | | | |
| | |
Debt retirements | | | (36,932 | ) | | | (29,920 | ) |
| | |
Debt issues | | | 51,036 | | | | 43,805 | |
| | |
Contributions restricted for capital and operations | | | 1,942 | | | | 1,604 | |
| | |
Repayment of liabilities under capital leases and
public private partnerships | | | (64 | ) | | | (62 | ) |
| | |
Other | | | (4 | ) | | | (6 | ) |
| | |
Cash provided by financing transactions | | | 15,978 | | | | 15,421 | |
| | |
Increase in cash and cash equivalents | | | 2,304 | | | | 2,078 | |
| | |
Cash and cash equivalents at beginning of year | | | 12,391 | | | | 10,313 | |
| | |
Cash and cash equivalents at end of year | | $ | 14,695 | | | $ | 12,391 | |
The accompanying notes and schedules are part of these consolidated financial statements.
| | |
| 24 | | GOVERNMENT OF ALBERTA 2018–19 ANNUAL REPORT |
Notes to the Consolidated Financial Statements
| NOTE 1 | SUMMARY OF SIGNIFICANT ACCOUNTING POLICIES AND REPORTING PRACTICES |
These consolidated financial statements are prepared in accordance with Canadian Public Sector Accounting Standards (PSAS).
The consolidated financial statements of the Province of Alberta (Province) include the accounts of organizations that meet the criteria of control as established under PSAS. The consolidated financial statements also include the accounts of the Offices of the Legislative Assembly.
A list of organizations included in these consolidated financial statements can be found in Schedule 18.
| | (b) | METHOD OF CONSOLIDATION |
The accounts of government sector entities, except those designated as government business enterprises, are consolidated using the line-by-line method. Under this method, accounting policies of the consolidated entities are adjusted to conform to government accounting policies and the results of each line item in their financial statements (revenue, expense, assets and liabilities) are included in the Province’s results. Revenue, expense, capital, investing and financing transactions, as well as related asset and liability balances between consolidated entities have been eliminated.
Schools, colleges, technical institutes, some government business enterprises and some government organizations have year ends that are other than March 31. The significant transactions of these organizations that have occurred during the period between their year ends and the Province’s year end of March 31, 2019, have been recorded in these financial statements. Organizations that the Province controls for reporting purposes through its consolidated organizations, but that do not meet the materiality threshold of $6 million in assets, liabilities, revenues or expenses after eliminating inter-entity transactions and balances, are not consolidated in these financial statements. These organizations are reviewed annually to determine if they meet the materiality threshold and after two years of exceeding the threshold will be considered for consolidation.
The accounts of provincial agencies designated as government business enterprises, such as ATB Financial (Schedule 8), are accounted for on the modified equity basis, with the equity being computed in accordance with International Financial Reporting Standards (IFRS). Under the modified equity method, the accounting policies of government business enterprises are not adjusted to conform to those of the government sector entities. Inter-entity revenue and expense transactions and related asset and liability balances are not eliminated except for inter-entity gains and losses, which are eliminated on assets and liabilities remaining within the government reporting entity at the financial statement date.
| | (c) | BUDGET AND LEGISLATIVE AUTHORITY |
PSAS require that financial statements contain a comparison of the actual and budgeted results for the year. The Province’s fiscal plan is prepared in accordance with the Fiscal Planning and Transparency Act consistent with the scope and accounting policies used in the Province’s consolidated financial statements. The Fiscal Plan documents, which describe the Province’s budget for the 2019 fiscal year, were tabled in the Legislature on March 22, 2018.
| | |
| CONSOLIDATED FINANCIAL STATEMENTS | | 25 |
The budget contains an annual risk adjustment of $500 million. The Province relies on revenue sources that are volatile and unpredictable, including non-renewable resources, income taxes and investment income. This revenue is linked to factors such as energy prices, equity markets, exchange rates, geopolitical events and global economic swings. The annual risk adjustment is a way to signal the possible extent of a revenue shortfall.
| | (d) | ADOPTION OF NEW ACCOUNTING STANDARD |
The Province has prospectively adopted PS 3430 Restructuring Transactions with an effective date of April 1, 2018. This standard did not significantly impact the consolidated financial statements.
| | (e) | FUTURE CHANGES IN ACCOUNTING STANDARDS |
PS 3450 Financial Instruments
The effective date of this standard has been extended to April 1, 2021. Adoption of this standard requires corresponding adoption of PS 2601 Foreign Currency Translation, PS 1201 Financial Statement Presentation and PS 3041 Portfolio Investments in the same fiscal period. These standards provide guidance on: recognition, measurement and disclosure of financial instruments; standards on how to account for and report transactions that are denominated in a foreign currency; general reporting principles and standards for the disclosure of information in financial statements; and how to account for and report portfolio investments. However, the Public Sector Accounting Board issued an exposure draft in January 2019 and proposed narrow scope amendments to this standard. The proposed revision to the treatment of debt buybacks will affect how the annual surplus/deficit is calculated and the presentation of assets and liabilities on the Consolidated Statement of Financial Position without impacting net debt.
The Province, including all government components, except for government organizations and some regulated funds that manage their investments on a fair value basis, have not yet adopted this standard.
Items within the scope of the financial instruments section are assigned to one of the following measurement categories: fair value, cost or amortized cost. Fair value measurement will apply to derivatives and portfolio investments in equity instruments that are quoted in an active market. Also, when groups of financial assets and financial liabilities are managed on a fair value basis, they may be reported on that basis. Other financial assets and financial liabilities will generally be measured at cost or amortized cost. Until an item is derecognized, gains and losses arising due to fair value remeasurement will be reported in the Consolidated Statement of Remeasurement Gains and Losses.
PS 3280 Asset Retirement Obligations
Effective April 1, 2021, this standard provides guidance on how to account for and report liabilities for retirement of tangible capital assets.
PS 3400 Revenue
Effective April 1, 2022, this standard provides guidance on how to account for and report revenue, and specifically, it differentiates between revenue arising from exchange and non-exchange transactions.
The Province has not yet adopted these standards. The Province is currently assessing the impact of these standards on the consolidated financial statements.
| | |
| 26 | | GOVERNMENT OF ALBERTA 2018–19 ANNUAL REPORT |
| | (f) | BASIS OF FINANCIAL REPORTING |
Revenues
All revenues are reported on the accrual basis of accounting. Cash received for which goods or services have not been provided by year end is recognized as unearned revenue and recorded in accounts payable and other accrued liabilities.
The provincial tax system is predicated on self-assessment where taxpayers are expected to understand the tax laws and comply with them. This has an impact on the completeness of tax revenues when taxpayers fail to comply with tax laws, for example, if they do not report all of their income. The Province has implemented systems and controls in order to detect and correct situations where taxpayers are not complying with the various Acts it administers. These systems and controls include performing audits of taxpayer records when determined necessary. However, such procedures cannot identify all sources of unreported income or other cases of non- compliance with tax laws. The Province does not estimate the amount of unreported tax.
Tax revenues are reported net of applicable tax concessions. Tax concessions are defined as tax credits that provide relief to taxpayers from taxes previously paid or currently owing.
Tax credits that provide a financial benefit through the tax system but do not change a taxpayer’s tax liability amount are defined as transfers through the tax system and reported as expenses.
Personal income tax is recognized on an accrual basis based on an economic estimate of the various components of personal income tax for the fiscal year. Gross personal income tax growth for the taxation year is a key component of the estimate for the fiscal year.
Corporate income tax revenue is recognized when installments are received from taxpayer corporations. A receivable is established for tax assessments that are outstanding. Revenue and tax receivables will be adjusted in the year in which any additional information becomes available from resulting audits, appeals and court decisions. Corporate income tax refunds payable are accrued based primarily on the prior year’s corporate income tax refunds paid on assessments. Corporate income tax receipts from corporations in anticipation of an upward reassessment of Alberta income tax payable are described as corporate income tax receipts in abeyance and recognized as accounts payable and other accrued liabilities.
The Province calculates an allowance for corporate income taxes based on the difference between the actual corporate income tax receivable and the estimate of the collectability. The adjustment to the allowance is recorded as an expense. The adjustment may increase or decrease the allowance as tax receivables are revalued in subsequent years based on resulting audits, appeals and court decisions.
Other taxes are recognized during the period in which the taxable event occurs and when authorized by legislation.
The provincial royalty system is predicated on self-reporting where the petroleum and natural gas industry is expected to understand the relevant energy legislation (statutes and regulations) and comply with them. This has an impact on the completeness of revenue when the petroleum and natural gas industry does not fully meet the legislative requirements, for example, by reporting inaccurate or incomplete production data. The Province has implemented systems and controls in order to detect and correct situations where the petroleum and natural gas industry has not complied with the various Acts and Regulations the Province administers. These systems and controls, based on areas of highest risk, include performing audits of the petroleum and natural gas industry records when determined necessary. The Province does not estimate the effect of
| | |
| CONSOLIDATED FINANCIAL STATEMENTS | | 27 |
misreported revenue. Any impacts on revenue of refiling by industry are recognized in the year of refiling.
Royalty revenues are reported net of expenses incurred by provincial oil and gas royalty reduction programs. These programs aim to encourage industry to produce from wells which otherwise would not be economically productive.
Bitumen royalty is determined based on revenues from production sold by projects less the costs of that production and costs of selling the Crown’s royalty share. Crude oil and natural gas royalties are determined based on monthly production. Revenue is recognized when the resource is produced by the mineral right holders. Revenue from bonuses and sales of Crown leases is recognized when the Crown leases are sold.
Transfers from the Government of Canada for capital purposes and donated assets with restrictions for their use are recognized as deferred capital contributions. Transfers for operating purposes with stipulations for their use are recognized as deferred operating contributions. These deferred contributions are recognized as revenue in the Consolidated Statement of Operations based on relevant stipulations of the transfer taken together with the actions and communications of the Province. All other transfers, without stipulations for their use, are recognized as revenue in the Consolidated Statement of Operations when authorized and eligibility criteria, if any, are met.
Endowment contributions, matching contributions and associated investment income allocated for preservation of endowment capital purchasing power are recognized as other revenue in the Consolidated Statement of Operations in the period in which they are received.
Expenses
Expenses represent the cost of resources consumed during the year on government operations. Expenses include amortization of tangible capital assets and expenses incurred in accordance with the terms of approved grant programs. Grants are recognized as expenses when authorized, eligibility criteria, if any, are met and a reasonable estimate of the amounts can be made.
Pension expenses comprise the cost of pension benefits earned by employees during the year, interest on the Province’s share of the unfunded pension liabilities, and the amortization of deferred adjustments arising from experience gains and losses and changes in actuarial assumptions over the expected average remaining service life of employees. Pension recovery represents the change in pension liabilities. Schedule 12 provides additional information on the components of pension expenses and liabilities.
In the Consolidated Statement of Operations, pension costs of government sector entities which are funded are included in expenses by function and costs which have not been funded are recognized as pension provisions.
Costs arising from obligations under guarantees and indemnities are recognized as expenses when management determines that the Province will likely be called upon to make payment. The expense represents management’s best estimate of future payments less recoveries.
The estimated increase or decrease for the year in accrued employee vacation entitlements is recognized in the related expense function.
Financial Assets
Financial assets are the Province’s financial claims on external organizations and individuals, and inventories for resale at year end.
| | |
| 28 | | GOVERNMENT OF ALBERTA 2018–19 ANNUAL REPORT |
Cash includes deposits in banks and cash-in-transit. Cash equivalents include directly held interest-bearing securities with terms to maturity of primarily less than three months.
Accounts receivable is recognized at the lower of cost or net recoverable value. A valuation allowance is recognized when recovery is uncertain.
Portfolio investments are recognized at cost. Cost includes the amortization of a discount or premium using the straight-line method over the life of the investments. Realized gains and losses on disposal of these investments are included in calculating the net operating results for the year. If an investment loses value that is other than a temporary decline, its recognized value is reduced to reflect the loss. The reduced value is deemed to be the new cost.
Portfolio investments restricted for endowments (Schedule 7) are from donors who have placed restrictions on their contributions to the endowment funds, for example, capital preservation. The principal restriction is that the original contribution should be maintained intact in perpetuity. Other restrictions may include spending investment income earned by endowments for specific operational or capital purposes, or capitalizing a certain amount of investment income to maintain and grow the real value of endowments.
Loans are recognized at cost less any discounts and allowance for credit loss. Where there is no longer reasonable assurance of timely collection of the full amount of principal and interest of a loan, a provision for credit loss is made and the carrying amount of the loan is reduced to its estimated realizable amount.
Inventories for resale representing the Province’s share of royalty oil in feeder and trunk pipelines are recognized at the lower of cost or net realizable value. Other inventories for resale are valued at the lower of cost, determined on a first-in, first-out basis, and estimated net realizable value.
Liabilities
Liabilities represent present obligations of the Province to external organizations and individuals arising from past transactions or events occurring before year end, the settlement of which is expected to result in the future sacrifice of economic benefits. They are recognized when there is an appropriate basis of measurement and management can reasonably estimate the amount.
The value of pension liabilities and associated changes during the year are based on an actuarial extrapolation of the most recent actuarial valuation. This valuation technique uses the projected benefit method pro-rated on service and management’s best estimate as at the extrapolation date of various economic and non-economic assumptions. Where the Province is a participating employer in the plan, experience gains and losses to the extent of the Province’s employer share are amortized over the estimated average remaining service life of employees. Where the Province has a liability for pre-1992 pension obligations, experience gains or losses are recognized in the year incurred.
Debentures included in debt are recognized at the face amount of the issue less unamortized discount, which includes issuance and hedging costs.
Income or expense on derivatives used to manage interest rate or foreign currency exposure is recognized as an adjustment to debt servicing costs.
Coal phase-out agreements liabilities are valued at the net present value of the future payments, discounted using the Province’s borrowing rate for long term debt at the time of signing the agreements.
| | |
| CONSOLIDATED FINANCIAL STATEMENTS | | 29 |
Public private partnerships (P3) are legally-binding contracts between the Province and one or more public/private/not-for-profit partners for the provision of assets and the delivery of services that allocates responsibilities and business risks among various partners.
The Province accounts for P3 projects in accordance with the substance of the underlying agreements. These agreements are accounted for in the same way as capital leases as follows:
| | ∎ | | The capital asset is valued at the total of progress payments made during construction and net present value of the future payments, discounted using the Province’s estimated borrowing rate for long term debt at the time of signing the P3 agreement. |
| | ∎ | | The liability is valued at the net present value of the future payments, discounted using the Province’s borrowing rate for long term debt at the time of signing the P3 agreement. |
| | ∎ | | During construction, the capital asset (classified as work-in-progress) and the corresponding liability are recorded based on the estimated percentage complete or the term of the agreement. |
| | ∎ | | Amortization on a straight-line basis over the estimated useful life commences when the asset is put into service. |
Liabilities also include:
| | ∎ | | All financial claims payable by the Province at year end; |
| | ∎ | | Contingent liabilities where future liabilities are likely and the amount can be reasonably estimated; |
| | ∎ | | Estimates of the Province’s liabilities for contaminated sites; |
| | ∎ | | Accrued employee vacation entitlements; |
| | ∎ | | Asset retirement obligations recognized by some organizations based on their accounting policies or terms of contract; |
| | ∎ | | Unspent deferred contributions for capital and operating purposes; and |
| | ∎ | | Spent deferred capital contributions which are excluded from net debt. |
Non-financial Assets
Non-financial assets include tangible capital assets, prepaid expenses, inventories of supplies and other non-financial assets.
Tangible capital assets are valued at cost less accumulated amortization. Cost is the gross amount of consideration given up to acquire an asset and includes all costs directly attributable to acquisition, construction, development or betterment of the tangible capital asset. Amortization is provided on a straight-line basis over estimated useful lives of the assets (Schedule 15). The annual amortization costs are allocated to the functions of the Province that employ those assets and are reported on the Consolidated Statement of Operations.
Prepaid expenses are recorded at cost and amortized based on the terms of the agreement.
Inventories of supplies are valued at the lower of cost, determined on a weighted average or first-in, first-out basis, and replacement cost.
Other Assets
Intangible assets, collections of historical artifacts, provincial, national and international works of art and tangible capital assets acquired by right, such as Crown lands, forests, water and mineral resources, are not included in the Consolidated Statement of Financial Position as a reasonable estimate of the amounts involved cannot be made.
| | |
| 30 | | GOVERNMENT OF ALBERTA 2018–19 ANNUAL REPORT |
Derivative Contracts
Derivative contracts are held directly for hedging purposes to manage specific loan receivable and debt related risks, or indirectly through pooled funds included in portfolio investments. Types of derivative contracts and their classification in these financial statements are described further in Note 3.
Derivative contracts used for hedging purposes, where there is an underlying matching asset or liability, are recognized at cost plus accrued interest. The estimated amounts receivable or payable related to derivative contracts are included in accrued interest receivable or payable respectively. Derivative contracts without an underlying matching asset or liability are recognized at fair value and are included in portfolio investments. Gains and losses from derivative contracts are included in investment income or debt servicing costs, based on their intended purpose.
Foreign Currency
Unhedged monetary items denominated in a foreign currency are translated at the year end rate of exchange. Hedged assets and liabilities denominated in foreign currencies are translated at the rate of exchange established by the terms of the hedging agreement.
Foreign currency transactions are translated into Canadian dollars using the average exchange rate for the day, except for hedged foreign currency transactions, which are translated at exchange rates established by the terms of the hedging agreement.
Exchange gains and losses that arise on translation of fixed-term foreign currency denominated monetary items are deferred and amortized over the life of the contract.
Amortization of deferred exchange gains and losses and other exchange differences on unhedged transactions are included in the determination of the net operating results for the year.
Measurement Uncertainty
Estimates are used in accruing revenues, expenses, assets and liabilities in circumstances where the actual results are unknown at the time the financial statements are prepared. Uncertainty in the determination of the amount at which an item is recognized in financial statements is known as measurement uncertainty. Such uncertainty exists when there is a variance between the recognized amount and another reasonably possible amount, whenever estimates are used.
Measurement uncertainty that is material to these financial statements exists in the accrual of personal and corporate income taxes; royalties derived from non-renewable resources; health transfers; private investments, inflation sensitive and alternative investments; loans receivable; and pension liabilities.
Personal income tax revenue (Schedule 1) of $11,874 million (2018: $10,775 million) is subject to measurement uncertainty due primarily to the use of economic estimates of personal income growth. Personal income growth is inherently difficult to estimate due to subsequent revisions to personal income data. The current fiscal year estimate of primary household income growth used in determining personal income tax is 3.3% for 2018 calendar year and 3.2% for 2019 calendar year (the 2018 estimate was 4.5% for 2018 calendar year and 3.9% for 2017 calendar year. Based on historical data, there is an uncertainty of plus or minus $586 million (2018: $518 million) in the personal income tax revenue estimate.
Corporate income tax revenue (Schedule 1) of $4,702 million (2018: $3,360 million), the related amount receivable (Schedule 5) of $1,048 million (2018: $840 million) and refunds payable (Schedule 10) of $500 million (2018: $698 million) are subject to measurement uncertainty due
| | |
| CONSOLIDATED FINANCIAL STATEMENTS | | 31 |
to estimates of amounts not yet assessed based on cash received as well as taxpayer objections to assessed taxes (Note 7). Estimates are based on cash received from tax installments, payments with a filed return, current year refunds paid, and amounts assessed where payment has not yet been received. The methodology of calculating the refund liability estimate is back tested and the estimate is revised as necessary. Final assessed taxes may differ from original estimates due to reassessments in subsequent years. The impact of future reassessments cannot reasonably be determined. The amounts included in the corporate income tax accounts receivable are evaluated for collectability annually. A valuation allowance of $119 million (2018: $200 million) is the reduction to receivables to determine the estimated net recoverable amount. The methodology to calculate the allowance is back tested and revised as required.
Bitumen royalty of $3,214 million (2018: $2,642 million) and natural gas and by-products revenue of $536 million (2018: $644 million), Schedule 1, are subject to measurement uncertainty. For projects from which bitumen royalty is paid and the project has reached payout, the royalty rate used to determine the royalties is based on the average price of West Texas Intermediate (WTI) crude oil in Canadian dollars for the calendar year. Royalty rates will start at 25% of net profits when oil is priced at fifty-five dollars per barrel or less, and increase to a maximum of 40% of net profits when oil is priced at one hundred and twenty dollars or more. Payout is defined at the first date at which the cumulative revenue of a project first equals the cumulative cost of the project. Natural gas and by-products royalty is calculated based on allowable costs incurred by the royalty payers and production volumes that are reported to the Province by royalty payers. Industry may modify their royalty and gas cost allowance for non-statute barred years. The Province estimates what the costs, volumes and royalty rates for the fiscal year should be based on statistical analysis of industry data. Based on historical data, changes to natural gas and by-products revenues were approximately $69 million (2018: $81 million).
The Canada Health Transfers of $4,461 million (2018: $4,325 million), Schedule 1, are determined on an equal per capita cash basis. Measurement uncertainty for the Canada Health Transfer relates to the population estimate upon which entitlements are based. As the population estimate is finalized, it is used to adjust the entitlements of open prior years. Accordingly, these amounts are estimated and could change by a material amount.
The fair value of private equities, inflation sensitive and alternative investments of $10,160 million (2018: $9,565 million), Schedule 6, are subject to measurement uncertainty as the fair value may differ significantly from the values that would have been used had a ready market for these investments existed.
Loans receivable (Schedule 9) relating to net student loans receivable of $2,884 million (2018: $2,547 million) made under the authority of the Student Loan Act are subject to measurement uncertainty. Allowances totaling $341 million (2018: $285 million) have been recognized for impaired loans, loan subsidies, and repayment assistance. The Province has made certain estimates in the following areas:
| | ∎ | | Recovery and default rates in the determination of the allowance for impaired loans; |
| | ∎ | | Blended student lending rate; the annual average provincial borrowing rate; the average repayment period, default rate, and repayment assistance rate in the determination of the allowance for loan subsidy; and |
| | ∎ | | Future loan amounts approved for repayment assistance and loan forgiveness rates in the determination of the allowance for repayment assistance. |
| | |
| 32 | | GOVERNMENT OF ALBERTA 2018–19 ANNUAL REPORT |
Pension liabilities (Schedule 12) of $9,240 million (2018: $9,430 million) are subject to measurement uncertainty because the actual experience of a plan may differ significantly from assumptions used in the calculation of the pension liabilities.
Estimates of contingent liabilities for contaminated sites are subject to measurement uncertainty because the existence and extent of contamination, the responsibility for clean-up, and the timing and cost of remediation cannot be reasonably estimated in all circumstances. The degree of measurement uncertainty cannot be reasonably determined.
Some of the government organizations have year ends that are other than March 31. The accounts of these organizations are consolidated based on the results of their latest financial year end. Estimation of transactions for the period between their year ends and March 31 is therefore subject to measurement uncertainty.
While best estimates have been used for reporting items subject to measurement uncertainty, management considers that it is possible, based on existing knowledge, that changes in future conditions in the near term could require a material change in the recognized amounts. Near term is defined as a period of time not to exceed one year from the date of the financial statements.
Segment Disclosure
A segment is defined as a distinguishable activity or group of activities for which it is appropriate to separately report financial information. Segment information reflects the existing accountability framework for government and the way in which operations are managed. Inter-segment transfers are measured at carrying value. Segment information is reported in Schedules 1, 2, 3, 8 and 15 and is based on accountability, budgetary practices and governance relationships within the Province. Additional information is provided in ministry and other entity annual reports.
| NOTE 2 | VALUATION OF FINANCIAL ASSETS AND LIABILITIES |
Fair value is the amount of consideration agreed upon in an arm’s length transaction between knowledgeable, willing parties who are under no compulsion to act.
Due to their short-term nature, the fair values of cash and cash equivalents, accounts receivable and accounts payable are estimated to approximate their carrying value.
The methods used to determine the fair values of portfolio investments are explained in the following paragraphs:
| | ∎ | | Public fixed-income securities and equities are valued at the year end closing sale price or the average of the latest bid and ask prices quoted by an independent securities valuation company. |
| | ∎ | | Mortgages and certain non-public provincial debentures are valued at the net present value of future cash flows. These cash flows are discounted using appropriate interest rate premiums over similar Government of Canada benchmark bonds trading in the market. |
| | ∎ | | The fair value of alternative investments including absolute return strategy investments, investments in limited partnerships, private investment funds, private equities and securities with limited marketability is estimated using methods such as cost, discounted cash flows, earnings multiples, prevailing market values for instruments with similar characteristics and other pricing models as appropriate. |
| | ∎ | | Real estate investments are reported at their most recent appraised value, net of any liabilities against the real property. Real estate properties are appraised annually by qualified external |
| | |
| CONSOLIDATED FINANCIAL STATEMENTS | | 33 |
| | real estate appraisers using methods such as replacement cost, discounted cash flows, earnings multiples, prevailing market values for properties with similar characteristics and other pricing models as appropriate. |
| | ∎ | | As quoted market prices are not readily available for private and alternative investments and private real estate, estimated fair values may not reflect amounts that could be realized upon immediate sale, or amounts that may ultimately be realized. Accordingly, estimated fair values may differ significantly from the values that would have been used had a ready market existed for these investments. |
The fair value of derivative contracts relating to portfolio investments is disclosed in Note 3. The estimated amount receivable or payable from derivative contracts at the reporting date is determined by the following methods:
| | ∎ | | Equity and bond index swaps are valued based on changes in the appropriate market based index net of accrued floating rate interest. Forward foreign exchange contracts and equity index and interest rate future contracts are valued based on quoted market prices. Interest rate swaps and cross currency interest rate swaps are valued based on discounted cash flows using current market yields and exchange rates. Credit default swaps are valued based on discounted cash flows using current market yields and calculated default probabilities. Options to enter into interest rate swap contracts are valued based on discounted cash flows using current market yields and volatility parameters which measure change in the underlying swap. Warrants and rights are valued at the year end closing sale price or the average of the latest bid and ask prices quoted by an independent securities valuation company. |
| NOTE 3 | FINANCIAL RISK MANAGEMENT AND DERIVATIVES |
The investments that the Province holds are exposed to credit risk and market risk. Market risk is comprised of foreign currency risk, interest rate risk and price risk. In order to earn the best possible return at an acceptable level of risk, the Province has established policies for the asset mix of its investment portfolios.
The Province reduces its investment risk by holding many different types of assets, investing in securities from various governments and companies in different industries and countries, having quality constraints on fixed income instruments, and restricting amounts exposed to countries designated as emerging markets.
A large percentage of the Province’s investments are in the Alberta Heritage Savings Trust Fund (Heritage Fund), which also includes money allocated to the Heritage Fund under the Access to the Future Act. The objective is to invest in a diversified portfolio to maximize long-term returns at an acceptable level of risk.
Investments in the Alberta Heritage Foundation for Medical Research Endowment Fund, the Alberta Heritage Scholarship Fund, the Alberta Heritage Science and Engineering Research Endowment Fund and the Alberta Cancer Prevention Legacy Fund are managed to provide income, which can be used by the funds to fulfill their respective mandates for the purpose of making grants to students and to researchers in the fields of medicine, science and engineering.
| | |
| 34 | | GOVERNMENT OF ALBERTA 2018–19 ANNUAL REPORT |
Cash and cash equivalents are used to repay debt as it matures, to provide funding for the capital and fiscal plans, and to help protect operating and capital spending from short-term declines in revenue and the costs of emergencies, disasters and other unforeseen cash requirements.
The objective of the Province’s debt management activity is to raise funding for the Province and its agencies in a cost-effective manner, while ensuring that borrowed funds can be serviced and repaid as scheduled.
The Province’s debt management goals include: ensuring sufficient liquidity to meet the Province’s financial commitments and withstand market disruptions, providing stable and low-cost funding for the Province, maintaining access to both domestic and global debt markets to provide financing and liquidity for the Province and strategically structuring the debt portfolio to allow for prudent management of maturities and refinancing.
In order to achieve this objective, the Province manages the following risks: interest rate risk, foreign currency risk, credit risk, liquidity risk, operational risk, settlement risk and refinancing risk. The Province manages these risks within approved policy guidelines. The management of these risks and the policy guidelines apply to the Province’s debt, excluding debt raised to fund requirements of provincial corporations. The debt of provincial corporations is managed separately in relation to their stated requirements and respective authorities.
The Province has decided that the most effective liability risk management strategy is to allow existing debt instruments to mature in accordance with their terms (Schedule 11).
The Province uses various types of derivative contracts held indirectly through pooled investment funds to gain access to equity markets and enhance returns or to manage exposure to interest rate risk, currency exchange risk and credit risk.
In order to mitigate credit risk, credit support annex (CSA) agreements have been signed with most counterparties to derivative contracts. The CSA agreements allow the Province to receive collateral in the form of cash or securities when the net position with a counterparty is favourable, based on established thresholds. Conversely, if the net position with a counterparty is unfavourable, the Province is required to pay or post cash or securities with the counterparty. Collateral received is reported as both an asset and a liability, and may be used by the Province. Collateral paid by the Province is considered to be a restricted asset, and disclosed as such (Schedule 4).
The following is a summary of the fair values of the Province’s derivative contracts by type:
| | | | | | | | |
| | | 2019 | | | 2018 | |
| | | Fair | | | Fair | |
| | | value (a) (b) (c) | | | value (a) (b) (c) | |
| | | | | | In millions | |
| | |
Interest rate derivatives (d) | | $ | (552 | ) | | $ | (406 | ) |
| | |
Equity replication derivatives (e) | | | 74 | | | | (66 | ) |
| | |
Foreign currency derivatives (f) | | | (270 | ) | | | (352 | ) |
| | |
Credit risk derivatives (g) | | | 3 | | | | 4 | |
| | |
Net fair value of derivative contracts (h) | | $ | (745 | ) | | $ | (820 | ) |
| | |
| CONSOLIDATED FINANCIAL STATEMENTS | | 35 |
Current credit exposure is represented by the current replacement cost of all outstanding contracts in a favourable position (positive fair value). The Province monitors counterparty risk exposure and actively seeks to mitigate counterparty risk by requiring that counterparties collateralize mark-to-market gains.
The method of determining the fair value of derivative contracts is described in Note 2.
Includes interest rate derivatives of Alberta Capital Finance Authority with a net fair value of $(544) million (2018: $(433) million), of which 0.17% will mature in under one year, 2.66% in one to three years and 97.18% in over three years.
As at March 31, 2019, $304 million (2018: $9 million) in cash collateral on net unfavourable positions has been pledged by the Province.
Portfolio investments reported include exposure to margin and collateral amounts held in pooled funds. At March 31, 2019, deposits in futures contracts margin accounts totalled $38 million (2018: $38 million). Cash and non-cash collateral for derivative contracts pledged and received, respectively totalled to $68 million (2018: $69 million) and $nil (2018: $nil).
Interest rate derivatives allow the Province to exchange interest rate cash flows (fixed, floating and bond index) based on a notional amount. Interest rate derivatives primarily include interest rate swaps, cross currency interest rate swaps, bond index swaps, futures contracts and options.
Equity replication derivatives allow the Province to receive or pay cash based on the performance of a specified market-based equity index, security or basket of equity securities applied to a notional amount. Equity derivatives primarily include equity index swaps, futures contracts and rights, warrants and options.
Foreign currency derivatives include contractual agreements to exchange specified currencies at an agreed upon exchange rate and on an agreed settlement date in the future.
Credit risk derivatives include credit default swaps allowing the Province to buy and sell protection on credit risk inherent in a bond. A premium is paid or received, based on a notional amount, in exchange for a contingent payment should a defined credit event occur with respect to the underlying security.
The fair value of derivative contracts represents the amount that the Province would receive (positive fair value) or pay (negative fair value) in the event contracts were terminated at year-end.
The derivatives of government business enterprises are disclosed in Schedule 8.
| NOTE 4 | CONTRACTUAL RIGHTS |
Contractual rights are rights of the Province to economic resources arising from contracts or agreements that will result in both assets and revenues in the future when the terms of those contracts or agreements are met.
| | | | | | | | |
| | | 2019 | | | 2018 Restated | |
| | | In | | | millions | |
Contractual rights from operating leases, contracts and programs (a) | | $ | 1,325 | | | $ | 1,230 | |
Contractual rights from capital lease principal and interest payments | | | 24 | | | | 25 | |
| | | $ | 1,349 | | | $ | 1,255 | |
2017-18 amount was decreased by $33 million due to reassessment of agreements.
| | |
| 36 | | GOVERNMENT OF ALBERTA 2018–19 ANNUAL REPORT |
Estimated amounts that will be received or receivable for each of the next five years and thereafter are as follows:
| | | | | | | | | | | | |
| | | Operating leases, contracts
and programs | | | Capital lease principal and
interest payments | | | Total | |
| | | In millions | |
2019-20 | | $ | 247 | | | $ | 1 | | | $ | 248 | |
2020-21 | | | 151 | | | | 1 | | | | 152 | |
2021-22 | | | 149 | | | | 1 | | | | 150 | |
2022-23 | | | 134 | | | | 1 | | | | 135 | |
2023-24 | | | 141 | | | | 15 | | | | 156 | |
Thereafter | | | 503 | | | | 5 | | | | 508 | |
| | | $ | 1,325 | | | $ | 24 | | | $ | 1,349 | |
The Province has contingent assets for fine revenues. Fine revenues are recognized at the point of conviction, which excludes certain outstanding federal statute and provincial statute fines that are satisfied by means other than cash payment. At March 31, 2019, the estimate of contingent assets for fines issued is $27 million (2018: $28 million).
| NOTE 6 | CONTRACTUAL OBLIGATIONS AND COMMITMENTS |
Contractual obligations represent a legal obligation of the Province to others and will become liabilities in the future when the terms of the contract are met.
| | | | | | | | |
| | | 2019 | | | 2018
Restated (b) | |
| | | | | | In millions | |
Obligations under operating leases, contracts and programs (a) | | $ | 19,430 | | | $ | 13,210 | |
Obligations under capital leases and public private partnerships | | | | | | | | |
Operations and maintenance payments | | | 4,073 | | | | 4,014 | |
Capital payments | | | 312 | | | | 439 | |
Interest payments | | | 193 | | | | 273 | |
| | | $ | 24,008 | | | $ | 17,936 | |
In February and March of 2019, the Province entered into various commercial agreements to execute a crude-by-rail project. The commitments related to these contracts amount to $1,771 million.
2017-18 amount was increased by $137 million to include grant agreements that are not subject to annual appropriation.
| | |
| CONSOLIDATED FINANCIAL STATEMENTS | | 37 |
Estimated payment requirements for each of the next five years and thereafter are as follows:
| | | | | | | | | | | | | | | | | | | | |
| | | Operating leases,
contracts and
programs | | | Operations and maintenance payments | | | Capital payments | | | Interest payments | | | Total | |
| | | In millions | |
2019-20 | | $ | 7,205 | | | $ | 93 | | | $ | - | | | $ | - | | | $ | 7,298 | |
2020-21 | | | 3,923 | | | | 98 | | | | 2 | | | | 3 | | | | 4,026 | |
2021-22 | | | 2,816 | | | | 120 | | | | 5 | | | | 9 | | | | 2,950 | |
2022-23 | | | 1,783 | | | | 129 | | | | 6 | | | | 10 | | | | 1,928 | |
2023-24 | | | 877 | | | | 136 | | | | 6 | | | | 10 | | | | 1,029 | |
Thereafter | | | 2,826 | | | | 3,497 | | | | 293 | | | | 161 | | | | 6,777 | |
| | | $ | 19,430 | | | $ | 4,073 | | | $ | 312 | | | $ | 193 | | | $ | 24,008 | |
Major obligations included in the above figures are for capital construction contracts for health and education facilities and highways.
The Province has outstanding approved undisbursed loan commitments of $479 million (2018: $241 million).
The Province has various commitments relating to the devolution of services or disposition of assets to the private sector. Those commitments include the performance of duties and obligations if the private sector organization fails to meet them.
The Province initiated the petrochemicals diversification program to provide up to $1.1 billion in royalty credits to encourage companies to invest in the development of Alberta petrochemical facilities.
The Province targets the development of renewable electricity generation capacity as part of its target of 30% renewable electricity by 2030. The Province has contracted with the Alberta Electric System Operator to implement and administer the program. On December 17, 2018, the Province announced the results of rounds 2 and 3. Round 2 will successfully deliver nearly 360 megawatts of wind generation at a weighted average bid price of approximately $38 per megawatt hour. Round 3 will successfully deliver nearly 400 megawatts of wind generation at a weighted average bid price of approximately $40 per megawatt hour.
| | |
| 38 | | GOVERNMENT OF ALBERTA 2018–19 ANNUAL REPORT |
| NOTE 7 | CONTINGENT LIABILITIES |
Set out below are details of contingent liabilities resulting from guarantees, indemnities and litigation, other than those reported as liabilities. Any losses arising from the settlement of contingent liabilities are treated as current year expenses.
| | (a) | GUARANTEES AND INDEMNITIES |
Guarantees are detailed below:
| | | | | | | | | | | | |
| | | 2019 | | | 2018 | | | Expiry date | |
| | | In | | | millions | | | | |
| | | |
Feeder Associations Guarantee Act | | $ | 81 | | | $ | 71 | | | | Ongoing | |
Agriculture Financial Services Act | | | 6 | | | | 10 | | | | Variable | |
| | | $ | 87 | | | $ | 81 | | | | | |
Authorized loan guarantee limits are shown below where applicable. Where authorized loan guarantee limits are not noted, the authorized limits decline as guaranteed or indemnified loans are repaid.
Guarantee programs under the following Acts are ongoing:
| | ∎ | | Feeder Associations Guarantee Act (authorized guarantee limit set by Order in Council is $100 million) and |
| | ∎ | | Agriculture Financial Services Act. |
The lender takes appropriate security prior to issuing a loan to the borrower, which is guaranteed by the Province. The security taken depends on the nature of the loan. Interest rates are negotiated with the lender by the borrower.
Included in the guarantees issued under the Agriculture Financial Services Act is $3 million (2018: $7 million) guaranteed under the Alberta Flood Recovery Loan Guarantee Program (AFRLGP), which was established to assist Alberta businesses directly impacted by the June 2013 flood in Southern Alberta. Under the AFRLGP, the Province has entered into agreements with financial institutions guaranteeing repayment of up to 75% of loans issued under this program.
Through the Public Trustee Act, the Province also unconditionally guarantees the amount outstanding on a client’s guaranteed account as administered by the Office of the Public Guardian and Trustee. As at March 31, 2019, the potential liability of the Province based on the outstanding balance of the Client Guaranteed Accounts is $443 million (2018: $433 million).
The Province has an indemnity associated with the Canadian Blood Services (CBS). CBS has established two wholly-owned captive insurance corporations, CBS Insurance Company Limited (CBSI) and Canadian Blood Services Captive Insurance Company Limited (CBSE). CBSI provides insurance coverage up to $250 million with respect to risks associated with the operation of the blood system. CBSE was capitalized in whole through funding from the provinces and territories (except Quebec), through a Captive Support Agreement (CSA) dated September 28, 2006, between the provinces, territories, and CBSE. Under the CSA, each of the provinces and territories provided their Pro Rata Share (as defined in the CSA) through an indemnity. Alberta’s Pro Rata Share is 13.1% of CBSE’s total capital amount, which amounts to $98 million. Authority for Alberta to provide the indemnity under the CSA is pursuant to section 5.05 of the Indemnity Authorization Regulation 22/1997, under the Financial Administration Act. The expense recognition criterion for the indemnity is notification from CBS that the indemnity is required. At March 31, 2019, no amount has been recognized for this indemnity.
| | |
| CONSOLIDATED FINANCIAL STATEMENTS | | 39 |
The Province, through the Canadian Securities Administrators National Systems operations management and governance agreement, has committed to pay 25% of any shortfall from approved system operating costs that exceed revenues should there not be an accumulated operating surplus available to offset. As at March 31, 2019, the accumulated operating surplus is $173 million (2018: $163 million). Payments under guarantees are a statutory charge on the Province.
The Province has contingent liabilities with respect to various indemnities as permitted under the Financial Administration Act. The indemnified amount and corresponding liability cannot be reasonably estimated.
At March 31, 2019, the Province was involved in legal matters where damages are being sought. These matters give rise to contingent liabilities.
Accruals have been made in specific instances where it is likely that losses will be incurred based on a reasonable estimate. As at March 31, 2019, the total claimed amount for all likely claims is $393 million (2018: $255 million - restated), of which $244 million (2018: $171 million) has been accrued as a liability. The resulting additional liability, if any, from likely claims in excess of the amounts accrued is not determinable.
The Province has been named in 763 (2018: 706) claims of which the outcome is not determinable. Of these claims 586 (2018: 585) have specified claimed amounts totalling $4.2 billion (2018: $4.4 billion). The remaining 177 (2018: 121) claims have no amounts specified. The resolution of indeterminable claims may result in a liability, if any, that may be significantly lower than the claimed amount.
In addition, the Province has been named in 22 (2018: 25) claims in matters such as Aboriginal rights, Aboriginal title and treaty rights. In most cases, these claims have been filed jointly and severally against the Province and the Government of Canada and in some cases involve third parties. Of these claims, 10 (2018: 12) have specified amounts totalling $94 billion (2018: $95 billion) plus a provision for interest and other costs that are not determinable. The remaining 12 (2018: 13) claims have no amounts specified. In addition, there are four (2018: six - restated) claims for treaty land entitlement for which the Province may have an obligation under the Natural Resources Transfer Agreement.
At March 31, 2019, 958 (2018: 878) corporate income tax files totalling $768 million (2018: $611 million) were under objection or dispute. The resulting loss, if any, cannot be reasonably estimated.
| | (d) | ENVIRONMENTAL LIABILITIES |
The Province has identified various sites where contaminations exist and the level of contamination is either known or unknown at this time. As at March 31, 2019, $35 million (2018: $27 million) has been recognized as liabilities for contaminated sites. No liability for remediation of other sites has been recognized as: the Province becoming responsible for these sites are not determinable; the Province does not expect to give up any future economic benefits; no reasonable estimate of the amount can be made; or a combination of the factors.
| | |
| 40 | | GOVERNMENT OF ALBERTA 2018–19 ANNUAL REPORT |
| NOTE 8 | TRUST AND OTHER FUNDS UNDER ADMINISTRATION |
Trust and other funds under administration are regulated and other funds consisting of public money over which the Legislature has no power of appropriation. They are not included in the consolidated financial statements because the Province has no equity in the funds and administers them for the purposes of various trusts. As at March 31, 2019, trust and other funds under administration are as follows:
| | | | | | | | |
| | | 2019 | | | 2018 | |
| | | In | | | millions | |
| | |
Public Sector Pension Plan Funds (a) | | $ | 9,334 | | | $ | 68,618 | |
| | |
The Workers’ Compensation Board Accident Fund | | | 447 | | | | 405 | |
| | |
Public Trustee | | | 606 | | | | 605 | |
| | |
Special Areas Trust Account | | | 306 | | | | 296 | |
| | |
Various Court Offices and Fines Distribution Trust | | | 185 | | | | 154 | |
| | |
Miscellaneous trust funds | | | 1,949 | | | | 1,493 | |
| | | $ | 12,827 | | | $ | 71,571 | |
| | (a) | Pursuant to the Joint Governance of Public Sector Pension Plans Act, plan funds for Local Authorities Pension Plan, Public Service Pension Plan and Special Forces Pension Plan were transitioned to each respective corporation (Schedule 12) as of March 1, 2019. As a result, the 2019 amount excluded these plan funds. The assets of these plan funds are managed by Alberta Investment Management Corporation. |
In addition to the above trust and other funds under administration, the Province holds cash and bank guarantees in the form of letters of credit and promissory notes in the amount of $2.2 billion (2018: $2.1 billion). The majority of these guarantees are held to assure satisfactory reclamation of coal and oil sands operations, sand and gravel pits, landfills, hazardous waste management and hazardous recyclable facilities.
On June 4, 2019, Bill 1 - An Act To Repeal The Carbon Tax (2019: $1,324 million Carbon Levy) came into force and as a result, the Climate Leadership Act was repealed effective May 30, 2019. Consequential amendments were also made to other various Acts including the Alberta Personal Income Tax Act, which brings the Alberta climate leadership adjustment rebate (2019: $523 million consumer rebates) to an end.
| NOTE 10 | COMPARATIVE FIGURES |
Certain 2018 figures have been reclassified, where necessary, to conform to 2019 presentation.
| | |
| CONSOLIDATED FINANCIAL STATEMENTS | | 41 |
Schedules to the Consolidated Financial Statements
| | | | | | | | | | | | |
| | | 2019 | | | 2018 | |
| | | Budget | | | Actual | | | Actual | |
| | | In millions | | | | |
| | | |
Income taxes | | | | | | | | | | | | |
Personal income tax | | $ | 11,387 | | | $ | 11,874 | | | $ | 10,775 | |
Corporate income tax | | | 4,551 | | | | 4,702 | | | | 3,360 | |
Interest and penalties on corporate income tax | | | - | | | | 169 | | | | 88 | |
| | | 15,938 | | | | 16,745 | | | | 14,223 | |
| | | |
Other taxes | | | | | | | | | | | | |
Education property tax | | | 2,446 | | | | 2,441 | | | | 2,450 | |
Fuel tax | | | 1,414 | | | | 1,394 | | | | 1,399 | |
Tobacco tax and cannabis levy | | | 932 | | | | 903 | | | | 908 | |
Insurance taxes | | | 641 | | | | 612 | | | | 582 | |
Carbon levy | | | 1,356 | | | | 1,324 | | | | 1,046 | |
Tourism levy | | | 85 | | | | 90 | | | | 85 | |
Freehold mineral rights tax | | | 87 | | | | 67 | | | | 67 | |
Interest and penalties on other tax | | | - | | | | 2 | | | | 1 | |
| | | 6,961 | | | | 6,833 | | | | 6,538 | |
| | | |
Non-renewable resource revenue | | | | | | | | | | | | |
Bitumen royalty | | | 1,785 | | | | 3,214 | | | | 2,642 | |
Crude oil royalty | | | 1,053 | | | | 1,149 | | | | 965 | |
Natural gas and by-products royalty | | | 541 | | | | 536 | | | | 644 | |
Bonuses and sales of Crown leases | | | 327 | | | | 360 | | | | 564 | |
Coal royalty, rentals and fees | | | 123 | | | | 170 | | | | 165 | |
| | | 3,829 | | | | 5,429 | | | | 4,980 | |
| | | |
Transfers from Government of Canada | | | | | | | | | | | | |
Canada health transfers | | | 4,521 | | | | 4,461 | | | | 4,325 | |
Canada social transfers | | | 1,657 | | | | 1,637 | | | | 1,600 | |
Disaster financial assistance | | | - | | | | 31 | | | | (212 | ) |
Agriculture support programs | | | 308 | | | | 272 | | | | 349 | |
Labour market agreements | | | 250 | | | | 255 | | | | 232 | |
Other | | | 1,482 | | | | 1,357 | | | | 1,311 | |
| | | 8,218 | | | | 8,013 | | | | 7,605 | |
| | | |
Net income/(loss) from government business enterprises | | | | | | | | | | | | |
Alberta Gaming, Liquor and Cannabis Commission | | | 2,233 | | | | 2,273 | | | | 2,283 | |
ATB Financial | | | 242 | | | | 139 | | | | 278 | |
Balancing Pool | | | 161 | | | | 361 | | | | 763 | |
Other | | | 141 | | | | (188 | ) | | | 63 | |
| | | 2,777 | | | | 2,585 | | | | 3,387 | |
| | | | | | | | | | | | |
Investment income | | | 2,884 | | | | 2,349 | | | | 3,126 | |
| | | |
Premiums, fees and licences | | | | | | | | | | | | |
Tuition | | | 1,237 | | | | 1,256 | | | | 1,202 | |
Motor vehicle licences | | | 513 | | | | 520 | | | | 509 | |
Health fees and charges | | | 534 | | | | 537 | | | | 501 | |
Crop and hail insurance premiums | | | 375 | | | | 323 | | | | 348 | |
Energy Industry Levies | | | 333 | | | | 330 | | | | 292 | |
Land titles | | | 73 | | | | 70 | | | | 73 | |
Other | | | 792 | | | | 873 | | | | 918 | |
| | | 3,857 | | | | 3,909 | | | | 3,843 | |
| | | |
Other | | | | | | | | | | | | |
Sales, rentals and services | | | 1,381 | | | | 1,367 | | | | 1,329 | |
Fundraising, donations, gifts and contributions | | | 569 | | | | 684 | | | | 659 | |
Fines and penalties | | | 225 | | | | 200 | | | | 207 | |
Climate change and emissions management | | | 541 | | | | 528 | | | | 250 | |
Endowment contributions and reinvested income | | | 73 | | | | 155 | | | | 160 | |
Other | | | 626 | | | | 827 | | | | 988 | |
| | | 3,415 | | | | 3,761 | | | | 3,593 | |
| | | $ | 47,879 | | | $ | 49,624 | | | $ | 47,295 | |
| | |
| 42 | | GOVERNMENT OF ALBERTA 2018–19 ANNUAL REPORT |
| | |
| REVENUES BY SOURCE BY MINISTRY | | SCHEDULE 2 |
| | | | | | | | | | | | | | | | | | | | | | | | | | | | | | | | | | | | | | | | | | | | | | | | |
| | | Income taxes | | | Other taxes | | | Non- renewable resource revenue (a) | | | Transfers
from
Government
of Canada | | | Net income
from
government
business
enterprises | | | Investment income | | | Premiums,
fees and
licences | | | Other | | | Sub
total | | | Consolidation
adjustments | | | 2019 Total | | | 2018 Total | |
| | | | | | | | | | | | | | | | | | | | | | | In millions | | | | | | | | | | | | | | | | | | | | | |
Offices of the Legislative Assembly | | $ | - | | | $ | - | | | $ | - | | | $ | - | | | $ | - | | | $ | - | | | $ | - | | | $ | - | | | $ | - | | | $ | - | | | $ | - | | | $ | - | |
Ministries | | | | | | | | | | | | | | | | | | | | | | | | | | | | | | | | | | | | | | | | | | | | | | | | |
Advanced Education | | | - | | | | - | | | | - | | | | 535 | | | | 6 | | | | 245 | | | | 1,261 | | | | 1,582 | | | | 3,629 | | | | (446 | ) | | | 3,183 | | | | 3,059 | |
Agriculture and Forestry | | | - | | | | - | | | | - | | | | 279 | | | | - | | | | 138 | | | | 464 | | | | 14 | | | | 895 | | | | (3 | ) | | | 892 | | | | 998 | |
Children’s Services | | | - | | | | - | | | | - | | | | 111 | | | | - | | | | - | | | | - | | | | 8 | | | | 119 | | | | - | | | | 119 | | | | 114 | |
Community and Social Services | | | - | | | | - | | | | - | | | | 118 | | | | - | | | | - | | | | - | | | | 34 | | | | 152 | | | | (15 | ) | | | 137 | | | | 143 | |
Culture and Tourism | | | - | | | | - | | | | - | | | | 7 | | | | - | | | | 1 | | | | 11 | | | | 71 | | | | 90 | | | | (52 | ) | | | 38 | | | | 28 | |
Economic Development and Trade | | | - | | | | - | | | | - | | | | 5 | | | | - | | | | - | | | | - | | | | 175 | | | | 180 | | | | (121 | ) | | | 59 | | | | 47 | |
Education | | | - | | | | 2,441 | | | | - | | | | 115 | | | | - | | | | 25 | | | | 167 | | | | 568 | | | | 3,316 | | | | (321 | ) | | | 2,995 | | | | 3,044 | |
Energy | | | - | | | | 67 | | | | 5,429 | | | | - | | | | 146 | | | | 3 | | | | 343 | | | | 29 | | | | 6,017 | | | | - | | | | 6,017 | | | | 6,154 | |
Environment and Parks | | | - | | | | - | | | | - | | | | 5 | | | | - | | | | 2 | | | | 147 | | | | 755 | | | | 909 | | | | (148 | ) | | | 761 | | | | 441 | |
Executive Council | | | - | | | | - | | | | - | | | | - | | | | - | | | | - | | | | - | | | | - | | | | - | | | | - | | | | - | | | | - | |
Health | | | - | | | | - | | | | - | | | | 4,570 | | | | - | | | | 69 | | | | 580 | | | | 1,099 | | | | 6,318 | | | | (473 | ) | | | 5,845 | | | | 5,646 | |
Indigenous Relations | | | - | | | | - | | | | - | | | | 5 | | | | - | | | | - | | | | - | | | | - | | | | 5 | | | | - | | | | 5 | | | | 2 | |
Infrastructure | | | - | | | | - | | | | - | | | | 18 | | | | - | | | | - | | | | 2 | | | | 53 | | | | 73 | | | | (3 | ) | | | 70 | | | | 43 | |
Justice and Solicitor General | | | - | | | | - | | | | - | | | | 39 | | | | - | | | | 3 | | | | 56 | | | | 244 | | | | 342 | | | | - | | | | 342 | | | | 341 | |
Labour | | | - | | | | - | | | | - | | | | 66 | | | | - | | | | - | | | | 5 | | | | 73 | | | | 144 | | | | - | | | | 144 | | | | 119 | |
Municipal Affairs | | | - | | | | - | | | | - | | | | 269 | | | | - | | | | - | | | | 38 | | | | 75 | | | | 382 | | | | - | | | | 382 | | | | 282 | |
Seniors and Housing | | | - | | | | - | | | | - | | | | 91 | | | | - | | | | 9 | | | | - | | | | 31 | | | | 131 | | | | (8 | ) | | | 123 | | | | 162 | |
Service Alberta | | | - | | | | - | | | | - | | | | 3 | | | | - | | | | - | | | | 639 | | | | 76 | | | | 718 | | | | (53 | ) | | | 665 | | | | 651 | |
Status of Women | | | - | | | | - | | | | - | | | | - | | | | - | | | | - | | | | - | | | | - | | | | - | | | | - | | | | - | | | | - | |
Transportation | | | - | | | | - | | | | - | | | | 138 | | | | - | | | | - | | | | 30 | | | | 28 | | | | 196 | | | | - | | | | 196 | | | | 221 | |
Treasury Board and Finance | | | 16,745 | | | | 4,325 | | | | - | | | | 1,639 | | | | 2,433 | | | | 2,014 | | | | 171 | | | | 505 | | | | 27,832 | | | | (181 | ) | | | 27,651 | | | | 25,800 | |
Consolidation adjustments | | | - | | | | - | | | | - | | | | - | | | | - | | | | (160 | ) | | | (5 | ) | | | (1,659 | ) | | | | | | | (1,824 | ) | | | | | | | | |
Total at March 31, 2019 | | $ | 16,745 | | | $ | 6,833 | | | $ | 5,429 | | | $ | 8,013 | | | $ | 2,585 | | | $ | 2,349 | | | $ | 3,909 | | | $ | 3,761 | | | | | | | | | | | $ | 49,624 | | | | | |
Total at March 31, 2018 | | $ | 14,223 | | | $ | 6,538 | | | $ | 4,980 | | | $ | 7,605 | | | $ | 3,387 | | | $ | 3,126 | | | $ | 3,843 | | | $ | 3,593 | | | | | | | | | | | | | | | $ | 47,295 | |
| (a) | Includes royalty revenues that were reduced by $953 million (2018: $1,456 million) under provincial oil and gas royalty reduction programs. |
| | |
| CONSOLIDATED FINANCIAL STATEMENTS | | 43 |
| | | | |
| EXPENSES OBJECT BY MINISTRY | | | | SCHEDULE 3 |
| | | | | | | | | | | | | | | | | | | | | | | | | | | | | | | | | | | | | | | | | | | | | | | | | | | | |
| | | Budget | | | Salaries, wages,
employment
contracts and
benefits | | | Grants | | | Supplies
and
services | | | Amortization
of tangible
capital
assets | | | Consumption
of Inventories
of supplies | | | Debt servicing costs (a) | | | Pension (recovery) provisions | | | Other | | | Sub
total | | | Consolidation adjustments | | | 2019 Total | | | 2018 Total Restated (b) | |
| | | In millions | | | | |
Offices of the Legislative Assembly | | $ | 165 | | | $ | 74 | | | $ | - | | | $ | 47 | | | $ | 1 | | | $ | - | | | $ | - | | | $ | - | | | $ | 15 | | | $ | 137 | | | $ | - | | | $ | 137 | | | $ | 118 | |
Ministries | | | | | | | | | | | | | | | | | | | | | | | | | | | | | | | | | | | | | | | | | | | | | | | | | | | | |
Advanced Education | | | 6,150 | | | | 3,621 | | | | 579 | | | | 1,352 | | | | 524 | | | | - | | | | 40 | | | | (40 | ) | | | 80 | | | | 6,156 | | | | (102 | ) | | | 6,054 | | | | 5,992 | |
Agriculture and Forestry | | | 1,204 | | | | 247 | | | | 184 | | | | 997 | | | | 22 | | | | 1 | | | | 69 | | | | - | | | | 5 | | | | 1,525 | | | | (92 | ) | | | 1,433 | | | | 1,436 | |
Children’s Services | | | 1,472 | | | | 295 | | | | 609 | | | | 602 | | | | - | | | | - | | | | - | | | | - | | | | - | | | | 1,506 | | | | (14 | ) | | | 1,492 | | | | 1,400 | |
Community and Social Services | | | 3,623 | | | | 297 | | | | 2,421 | | | | 957 | | | �� | 1 | | | | - | | | | - | | | | - | | | | - | | | | 3,676 | | | | (38 | ) | | | 3,638 | | | | 3,430 | |
Culture and Tourism | | | 375 | | | | 70 | | | | 253 | | | | 63 | | | | 4 | | | | - | | | | - | | | | - | | | | 1 | | | | 391 | | | | (15 | ) | | | 376 | | | | 362 | |
Economic Development and Trade | | | 331 | | | | 118 | | | | 250 | | | | 50 | | | | 7 | | | | - | | | | - | | | | - | | | | - | | | | 425 | | | | (125 | ) | | | 300 | | | | 292 | |
Education | | | 8,259 | | | | 6,326 | | | | 369 | | | | 1,585 | | | | 413 | | | | - | | | | 45 | | | | (110 | ) | | | (4 | ) | | | 8,624 | | | | (54 | ) | | | 8,570 | | | | 8,251 | |
Energy | | | 864 | | | | 258 | | | | 219 | | | | 216 | | | | 18 | | | | - | | | | - | | | | - | | | | 34 | | | | 745 | | | | (1 | ) | | | 744 | | | | 534 | |
Environment and Parks | | | 801 | | | | 255 | | | | 186 | | | | 259 | | | | 58 | | | | - | | | | - | | | | - | | | | 14 | | | | 772 | | | | (24 | ) | | | 748 | | | | 941 | |
Executive Council | | | 17 | | | | 15 | | | | - | | | | 2 | | | | - | | | | - | | | | - | | | | - | | | | - | | | | 17 | | | | - | | | | 17 | | | | 17 | |
Health | | | 22,070 | | | | 8,420 | | | | 6,579 | | | | 5,668 | | | | 545 | | | | 921 | | | | 15 | | | | 1 | | | | 49 | | | | 22,198 | | | | (278 | ) | | | 21,920 | | | | 21,225 | |
Indigenous Relations | | | 242 | | | | 26 | | | | 213 | | | | 22 | | | | - | | | | - | | | | - | | | | - | | | | - | | | | 261 | | | | - | | | | 261 | | | | 215 | |
Infrastructure | | | 661 | | | | 72 | | | | 919 | | | | 438 | | | | 119 | | | | 3 | | | | - | | | | - | | | | 64 | | | | 1,615 | | | | (975 | ) | | | 640 | | | | 652 | |
Justice and Solicitor General | | | 1,437 | | | | 754 | | | | 272 | | | | 419 | | | | 2 | | | | - | | | | - | | | | - | | | | 9 | | | | 1,456 | | | | (2 | ) | | | 1,454 | | | | 1,408 | |
Labour | | | 226 | | | | 100 | | | | 70 | | | | 42 | | | | 1 | | | | - | | | | - | | | | - | | | | - | | | | 213 | | | | (4 | ) | | | 209 | | | | 186 | |
Municipal Affairs | | | 1,147 | | | | 66 | | | | 1,122 | | | | 40 | | | | 2 | | | | - | | | | - | | | | - | | | | - | | | | 1,230 | | | | - | | | | 1,230 | | | | 2,504 | |
Seniors and Housing | | | 685 | | | | 28 | | | | 653 | | | | 11 | | | | 35 | | | | - | | | | 5 | | | | - | | | | - | | | | 732 | | | | - | | | | 732 | | | | 712 | |
Service Alberta | | | 708 | | | | 221 | | | | - | | | | 370 | | | | 115 | | | | - | | | | - | | | | - | | | | 30 | | | | 736 | | | | (57 | ) | | | 679 | | | | 617 | |
Status of Women | | | 7 | | | | 4 | | | | 3 | | | | - | | | | - | | | | - | | | | - | | | | - | | | | - | | | | 7 | | | | - | | | | 7 | | | | 7 | |
Transportation | | | 1,829 | | | | 67 | | | | 512 | | | | 369 | | | | 583 | | | | 48 | | | | 92 | | | | - | | | | 122 | | | | 1,793 | | | | (117 | ) | | | 1,676 | | | | 2,260 | |
Treasury Board and Finance | | | 3,708 | | | | 360 | | | | 986 | | | | 537 | | | | 22 | | | | - | | | | 1,866 | | | | (41 | ) | | | 513 | | | | 4,243 | | | | (225 | ) | | | 4,018 | | | | 2,759 | |
Unallocated disaster expense | | | 200 | | | | - | | | | - | | | | - | | | | - | | | | - | | | | - | | | | - | | | | - | | | | - | | | | - | | | | - | | | | - | |
Consolidation adjustments | | | | | | | (59 | ) | | | (1,329 | ) | | | (344 | ) | | | - | | | | - | | | | (161 | ) | | | - | | | | (230 | ) | | | | | | | (2,123 | ) | | | | | | | | |
Total at March 31, 2019 | | $ | 56,181 | | | $ | 21,635 | | | $ | 15,070 | | | $ | 13,702 | | | $ | 2,472 | | | $ | 973 | | | $ | 1,971 | | | $ | (190 | ) | | $ | 702 | | | | | | | | | | | $ | 56,335 | | | | | |
Total at March 31, 2018 | | $ | 54,859 | | | $ | 21,074 | | | $ | 16,230 | | | $ | 13,194 | | | $ | 2,337 | | | $ | 913 | | | $ | 1,420 | | | $ | (593 | ) | | $ | 743 | | | | | | | | | | | | | | | $ | 55,318 | |
| (a) | Debt servicing costs consist of interest paid on various forms of government debt. Interest on pension liabilities is included in pension expense, which is included in salaries, wages, employment contracts and benefits, pension recovery and pension liability funding reported under other expenses. |
| (b) | On October 3, 2018, the Province transferred the responsibility of Information Technology and Freedom of Information and Protection of Privacy services to the Ministry of Service Alberta from applicable ministries; Human Resource services were also transferred to the Ministry of Treasury Board and Finance from applicable ministries. Comparative figures have been restated to conform to 2019 presentation. |
| | |
| 44 | | GOVERNMENT OF ALBERTA 2018–19 ANNUAL REPORT |
| | | | |
| CASH AND CASH EQUIVALENTS | | | | SCHEDULE 4 |
| | | | | | | | |
| | | 2019 | | | 2018 | |
| | | In | | | millions | |
Cash (a) (b) | | $ | 4,242 | | | $ | 3,651 | |
Cash equivalents (a) | | | 10,453 | | | | 8,740 | |
| | | $ | 14,695 | | | $ | 12,391 | |
| (a) | Cash and cash equivalents includes deposits in the Consolidated Cash Investments Trust Fund (CCITF). At March 31, 2019, deposits in CCITF had a time-weighted return of 1.8% (2018:1.1%) per annum, and securities had an average effective yield of 1.7% (2018:1.3%) per annum. |
| (b) | Includes restricted cash of $304 million (2018: $9 million) related to cash collateral posted to counterparties under the terms of the CSA agreements as disclosed in Note 3. |
| | | | |
| ACCOUNTS RECEIVABLE | | | | SCHEDULE 5 |
| | | | | | | | |
| | | 2019 | | | 2018 | |
| | | In | | | millions | |
Income taxes | | $ | 1,733 | | | $ | 1,519 | |
Due from Government of Canada | | | 1,256 | | | | 1,120 | |
Due from government business enterprises | | | 703 | | | | 632 | |
Other taxes | | | 637 | | | | 619 | |
Royalties | | | 558 | | | | 361 | |
Interest receivable | | | 207 | | | | 216 | |
Other receivables | | | 1,604 | | | | 1,617 | |
| | | 6,698 | | | | 6,084 | |
Less: allowance for doubtful accounts | | | (238 | ) | | | (313 | ) |
| | | $ | 6,460 | | | $ | 5,771 | |
| | |
| CONSOLIDATED FINANCIAL STATEMENTS | | 45 |
| | | | |
| PORTFOLIO INVESTMENTS | | | | SCHEDULE 6 |
| | | | | | | | | | | | | | | | |
| | | 2019 | | | 2018 | |
| | | Book | | | Fair | | | Book | | | Fair | |
| | | value | | | value | | | value | | | value | |
| | | | | | In | | | millions | | | | |
Interest-bearing securities | | | | | | | | | | | | | | | | |
| | | | |
Deposits and short-term securities | | $ | 1,219 | | | $ | 1,224 | | | $ | 1,183 | | | $ | 1,185 | |
| | | | |
Bonds and mortgages | | | 10,808 | | | | 10,851 | | | | 10,665 | | | | 10,464 | |
| | | | |
| | | 12,027 | | | 12,075 | | | 11,848 | | | 11,649 | |
| | | | |
Equities | | | | | | | | | | | | | | | | |
| | | | |
Canadian equities | | | 2,271 | | | | 2,539 | | | | 2,228 | | | | 2,487 | |
| | | | |
Global developed equities | | | 6,963 | | | | 7,358 | | | | 6,929 | | | | 7,385 | |
| | | | |
Emerging markets equities | | | 711 | | | | 775 | | | | 761 | | | | 843 | |
| | | | |
Private equities | | | 1,516 | | | | 1,703 | | | | 1,443 | | | | 1,516 | |
| | | | |
Pooled hedged funds | | | 130 | | | | 132 | | | | 30 | | | | 31 | |
| | | | |
Pooled investment funds | | | 1,184 | | | | 1,394 | | | | 1,158 | | | | 1,388 | |
| | | | |
| | | 12,775 | | | 13,901 | | | 12,549 | | | 13,650 | |
| | | | |
Inflation sensitive and alternative investments | | | | | | | | | | | | | | | | |
| | | | |
Private real estate | | | 3,820 | | | | 5,402 | | | | 3,911 | | | | 5,390 | |
| | | | |
Private infrastructure | | | 2,030 | | | | 2,410 | | | | 1,948 | | | | 2,059 | |
| | | | |
Timberland | | | 413 | | | | 633 | | | | 389 | | | | 593 | |
| | | | |
Other investments | | | 10 | | | | 12 | | | | 7 | | | | 7 | |
| | | | |
| | | 6,273 | | | 8,457 | | | 6,255 | | | 8,049 | |
| | | | |
Strategic, tactical and currency investments | | | 186 | | | | 219 | | | | 193 | | | | 232 | |
| | | | |
| | | $ | 31,261 | | | $ | 34,652 | | | $ | 30,845 | | | $ | 33,580 | |
The following is the breakdown of portfolio investments: | |
| | | 2019 | | | 2018 | |
| | | Book | | | Fair | | | Book | | | Fair | |
| | | value | | | value | | | value | | | value | |
| | | | | | In | | | millions | | | | |
Operating | | | | | | | | | | | | | | | | |
| | | | |
Internally designated assets (a) | | $ | 20,835 | | | $ | 23,564 | | | $ | 20,680 | | | $ | 22,818 | |
| | | | |
Other funds and agencies | | | 7,854 | | | | 8,122 | | | | 7,748 | | | | 7,904 | |
| | | | |
| | | 28,689 | | | 31,686 | | | 28,428 | | | 30,722 | |
| | | | |
Endowments (Schedule 7) | | | 2,572 | | | | 2,966 | | | | 2,417 | | | | 2,858 | |
| | | | |
Total portfolio investments | | $ | 31,261 | | | $ | 34,652 | | | $ | 30,845 | | | $ | 33,580 | |
| (a) | Internally designated assets are designated in legislation for specific purposes. Some of these assets are to provide stewardship of savings from the Province’s non-renewable resources revenues as is the case with the Heritage Fund assets of $15.8 billion (2018: $15.7 billion). They also support specific purposes such as cancer prevention initiatives, health and science research and post-secondary scholarships. |
| | |
| 46 | | GOVERNMENT OF ALBERTA 2018–19 ANNUAL REPORT |
| | | | |
| ENDOWMENT FUNDS | | | | SCHEDULE 7 |
The endowment balance represents the principal that will be maintained intact in perpetuity. As at March 31, 2019, endowment funds are as follows:
| | | | | | | | |
| | | 2019 | | | 2018 | |
| | | In | | | millions | |
Balance beginning of year | | $ | 2,403 | | | $ | 2,241 | |
| | |
Endowment contributions | | | 55 | | | | 53 | |
| | |
Reinvested income | | | 100 | | | | 107 | |
| | |
Transfers from the accumulated surplus
of related government organizations | | | 1 | | | | 2 | |
| | |
Balance end of year (a) | | $ | 2,559 | | | $ | 2,403 | |
| (a) | Investment income earned by endowments for specific operational or capital purposes of $13 million (2018: $14 million) is excluded from the endowment balance but included in the portfolio investment restricted for endowments (Schedule 6). |
| | |
| CONSOLIDATED FINANCIAL STATEMENTS | | 47 |
| | | | |
| EQUITY IN GOVERNMENT BUSINESS ENTERPRISES | | | | SCHEDULE 8 |
| | | | | | | | | | | | | | | | | | | | | | | | | | | | | | | | |
| | | Alberta Gaming,
Liquor and
Cannabis
Commission
(AGLC) | | | ATB
Financial | | | Balancing Pool
(BP) | | | Alberta Petroleum
Marketing
Commission
(APMC) | | | Credit Union
Deposit
Guarantee
Corporation
(CUDGC) | | | Other | | | 2019
Total | | | 2018
Total | |
| | | In millions | | | | |
Accumulated (deficit)/surplus at beginning of year | | $ | (10 | ) | | $ | 3,279 | | | $ | (1,189 | ) | | $ | 105 | | | $ | 348 | | | $ | (6 | ) | | $ | 2,527 | | | $ | 1,592 | |
Adjustment (a) | | | - | | | | 57 | | | | - | | | | - | | | | (1 | ) | | | - | | | | 56 | | | | (27 | ) |
Restated opening (deficit)/surplus | | | (10 | ) | | | 3,336 | | | | (1,189 | ) | | | 105 | | | | 347 | | | | (6 | ) | | | 2,583 | | | | 1,565 | |
Total revenue | | | 2,631 | | | | 1,683 | | | | 1,373 | | | | 61 | | | | 29 | | | | 14 | | | | 5,791 | | | | 6,882 | |
Total expense (b) | | | 359 | | | | 1,544 | | | | 1,012 | | | | 276 | | | | 7 | | | | 8 | | | | 3,206 | | | | 3,495 | |
Net income | | | 2,272 | | | | 139 | | | | 361 | | | | (215 | ) | | | 22 | | | | 6 | | | | 2,585 | | | | 3,387 | |
| | | | | | | | |
Change in accumulated unrealized (losses)/gains (c) | | | (11 | ) | | | 169 | | | | - | | | | - | | | | 8 | | | | - | | | | 166 | | | | (137 | ) |
Transfers from government business enterprise | | | (2,272 | ) | | | - | | | | - | | | | - | | | | - | | | | - | | | | (2,272 | ) | | | (2,288 | ) |
Total accumulated (deficit)/surplus and equity | | $ | (21 | ) | | $ | 3,644 | | | $ | (828 | ) | | $ | (110 | ) | | $ | 377 | | | $ | - | | | $ | 3,062 | | | $ | 2,527 | |
| | | | | | | | |
Assets | | | | | | | | | | | | | | | | | | | | | | | | | | | | | | | | |
Loans | | $ | 34 | | | $ | 47,006 | | | $ | 2 | | | $ | 605 | | | $ | 4 | | | $ | 37 | | | $ | 47,688 | | | $ | 44,700 | |
Investments | | | 181 | | | | 4,380 | | | | 224 | | | | 7 | | | | 369 | | | | - | | | | 5,161 | | | | 5,203 | |
Other | | | 560 | | | | 2,958 | | | | 762 | | | | 87 | | | | 9 | | | | 39 | | | | 4,415 | | | | 4,043 | |
Total assets | | | 775 | | | | 54,344 | | | | 988 | | | | 699 | | | | 382 | | | | 76 | | | | 57,264 | | | | 53,946 | |
| | | | | | | | |
Liabilities | | | | | | | | | | | | | | | | | | | | | | | | | | | | | | | | |
Accounts payable (d) | | | 796 | | | | 2,193 | | | | 229 | | | | 105 | | | | 5 | | | | 24 | | | | 3,352 | | | | 3,680 | |
Deposits (e) | | | - | | | | 39,541 | | | | - | | | | - | | | | - | | | | - | | | | 39,541 | | | | 38,131 | |
Debt (f) | | | - | | | | 8,966 | | | | 827 | | | | 704 | | | | - | | | | 52 | | | | 10,549 | | | | 9,266 | |
Reclamation and abandonment provision | | | - | | | | - | | | | 23 | | | | - | | | | - | | | | - | | | | 23 | | | | 16 | |
Power purchase arrangements | | | - | | | | - | | | | 737 | | | | - | | | | - | | | | - | | | | 737 | | | | 326 | |
Total liabilities | | | 796 | | | | 50,700 | | | | 1,816 | | | | 809 | | | | 5 | | | | 76 | | | | 54,202 | | | | 51,419 | |
Total equity | | $ | (21 | ) | | $ | 3,644 | | | $ | (828 | ) | | $ | (110 | ) | | $ | 377 | | | $ | - | | | $ | 3,062 | | | $ | 2,527 | |
| (a) | The adjustment was recorded to reflect the adoption of updated accounting standards. |
| (b) | Included in the total expense is $41 million (2018: $82 million) of payment in lieu of taxes of ATB Financial that was paid to the Province. |
| (c) | The change in accumulated unrealized gains of $166 million (2018: losses of $137 million) is comprised of changes in other comprehensive income in government business enterprises. At March 31, 2019, the Province has $29 million in accumulated unrealized losses (2018: $195 million in accumulated unrealized losses). |
| (d) | Included in accounts payable of the ATB Financial is $41 million (2018: $82 million) of payment in lieu of taxes payable to the Province. |
| | |
| 48 | | GOVERNMENT OF ALBERTA 2018–19 ANNUAL REPORT |
| | |
| EQUITY IN GOVERNMENT BUSINESS ENTERPRISES | | SCHEDULE 8 (continued) |
| (e) | The Province ensures the repayment of all deposits without limit, including accrued interest, for ATB Financial. The Province assesses an annual deposit guarantee fee of $54 million (2018: $42 million) payable by ATB Financial. Included in the deposits are ATB Financial wholesale borrowings that include amounts borrowed by the Province on behalf of ATB Financial totalling $3,619 million (2018: $4,653 million), to be repaid as follows: $1,771 million in 2019-20, $297 million in 2020-21, $nil million in 2021-22 and $1,551 million thereafter. |
| (f) | Included in debt are amounts borrowed by the Province on behalf of ATB Financial, BP and APMC (Schedule 11). |
Contractual Obligations, Contingent Liabilities and Commitments
Contractual obligations belonging to government business enterprises are $626 million (2018: $537 million - restated). These amounts include obligations under operating leases which expire on various dates.
ATB Financial
At March 31, 2019, ATB Financial had a contingent liability under guarantees and letters of credit of $571 million (2018: $564 million) and outstanding loan commitments of $18.7 billion (2018: $19.6 billion).
BP
Terminated Power Purchase Arrangements
The Sundance B and C Power Purchase Arrangements (PPAs) were terminated effective April 1, 2018 and the Battle River 5 PPA was terminated effective October 1, 2018. Termination notices have not been provided to the owners of the remaining PPAs (Genesee, Sheerness and Keephills) as at March 31, 2019.
Retroactive Line Loss Adjustment
In December 2017, Alberta Utilities Commission (AUC) reached its decision on Proceeding 790. As a result, the BP will incur additional charges as a result of the retroactive adjustments to line loss factors in relation to the various PPAs. An estimated provision in the amount of $46 million (2018: $43 million) has been recorded in trade payable and other accrued liabilities for the retroactive line loss adjustment as a result of the AUC’s December 2017 decision. The estimate has been prepared using the Module B method based on Incremental Loss Factors with generation scaling.
Various matters approved by the AUC regarding the retroactive line loss adjustments are under appeal with the Court of Appeal, including the retroactive nature of the adjustments and prospective line loss factors used to calculate the adjustment. The quantum of any retroactive adjustment will be dependent upon the methodology finally adopted and approved. Given the uncertainty of the final methodology, the BP estimates may be higher or lower than the current estimate reflected in these financial statements.
Payments (Refunds) in Lieu of Tax
As a result of settlement being reached, approximately $39 million was reversed from the previously accrued payments (refunds) in lieu of taxes, leaving a balance of $28 million (2018: $67 million) payable to the municipal entity at March 31, 2019.
CUDGC
The Province, through the CUDGC which operates under the authority of the Credit Union Act, has a potential liability under guarantees relating to deposits of credit unions. At March 31, 2019, credit unions in Alberta held deposits totalling $22.1 billion (2018: $21.5 billion). Substantial assets are available from credit unions to safeguard the Province from the risk of loss from its potential obligation under the Credit Union Act.
| | |
| CONSOLIDATED FINANCIAL STATEMENTS | | 49 |
| | |
| EQUITY IN GOVERNMENT BUSINESS ENTERPRISES | | SCHEDULE 8 (continued) |
APMC
North West Redwater Partnership Monthly Toll Commitment
The APMC has used judgement to estimate the toll commitments. The components of the toll are: senior debt; operating costs; class A subordinated debt; equity; and incentive fees. To calculate the toll, management has used estimates for factors including: future interest rates, operating costs, oil prices (WTI and light/heavy differentials), refined product prices, gas prices and foreign exchange.
The North West Redwater Partnership (Partnership) targets the refinery to come on stream to process bitumen feedstock with commercial operations anticipated to commence late 2019. The future toll commitments are estimated to be:
| | | | |
| | | In millions | |
2019-20 | | $ | 447 | |
2020-21 | | | 877 | |
2021-22 | | | 1,014 | |
2022-23 | | | 1,026 | |
2023-24 | | | 1,006 | |
Thereafter | | | 22,345 | |
| | | $ | 26,715 | |
North West Redwater Partnership
On November 8, 2012, the Partnership announced the sanctioning of the construction of Phase 1 of the Sturgeon Refinery which it will build, own and operate. The Province via the APMC, has entered into agreements whereby the Partnership will process and market Crown royalty bitumen, or equivalent volumes, collected pursuant to the Bitumen Royalty in Kind initiative in order to capture additional value within Alberta. The Partnership will market the refined products (primarily ultra low sulphur diesel and low sulphur vacuum gas oil) on behalf of the APMC. There is financial risk to the APMC under these agreements related to the difference in price between bitumen supplied as feedstock and marketed refined products, relative to the costs of the processing toll.
Under the processing agreement, the APMC is obligated to pay a monthly toll comprised of: senior debt; operating costs; class A subordinated debt; equity; and incentive fees on 37,500 barrels per day of bitumen (75% of the project’s feedstock) for 30 years. The toll includes both flow through costs as well as costs of facility construction, estimated to be $9.9 billion (2018: $9.7 billion). The APMC has very restricted rights to terminate the agreement, and if it is terminated, the APMC remains obligated to pay its share of the senior secured debt component of the toll incurred to date. The term of the commitment began on June 1, 2018, at that date, APMC began paying its share of the debt tolls. As at March 31, 2019, $261 million debt tolls have been paid and recorded as expenses.
The nominal tolls under the processing agreement, assuming $9.9 billion (2018: $9.7 billion) Facility Capital Cost (FCC), market interest rates and 2% operating cost inflation rate, are estimated above. The total estimated tolls have been increased by $690 million (2018: $70 million) relative to March 2018, due primarily to higher debt tolls related to higher FCC. As at March 31, 2019, the Partnership has issued $6.4 billion (2018: $6.4 billion) in bonds.
No value has been ascribed to the anticipated refining profits available to the APMC over the term of the agreement.
Term Loan Provided to North West Redwater Partnership
As part of the Subordinated Debt Agreement with the Partnership, the APMC provided a $439 million loan (2018: $432 million). These amounts plus the accrued interest will be repaid on a straight-line basis over ten years
| | |
| 50 | | GOVERNMENT OF ALBERTA 2018–19 ANNUAL REPORT |
| | |
| EQUITY IN GOVERNMENT BUSINESS ENTERPRISES | | SCHEDULE 8 (continued) |
by the Partnership beginning one year after commercial start-up of the Sturgeon Refinery. Upon initiation of commercial operations, the total amount of the term loan will be adjusted to reflect an agreed equity to debt ratio. While loans to the Partnership are outstanding, the APMC is entitled to a 25% voting interest on the Executive Leadership Committee, which is charged with overseeing and making decisions on the construction and start-up of the Sturgeon Refinery. The APMC has significant influence over the Partnership because of the 25% voting interest. However, the APMC has no equity ownership interest in the Partnership and does not account for the Sturgeon Refinery or its operations in its financial statements.
Under the agreements related to the FCC for the Sturgeon Refinery, the financing structure is required to be 80% senior debt and 20% equity/subordinated debt .. The APMC is committed to provide 50% of the subordinated debt required to meet this test. This commitment relates to incremental FCC from April 7, 2014, until completion. A final reconciliation of the amount of subordinated debt required will be done six months after Commercial Operation Date. The calculation of the 80/20 ratio allows for the deduction of the cumulative debt servicing costs (accrued interest) at this time, while prior to this time, the calculation does not allow for the deduction of accumulated debt servicing costs, which could result in a temporary need for additional subordinated debt lending by the APMC.
The APMC is forecasting to provide the Partnership no additional subordinated debt in 2019 (2018: $13 million). In 2020, the APMC anticipates the Partnership will repay $90 million (2018: $94 million) to the APMC as part of the final subordinated debt true-up six months after Commercial Operations Date.
North West Redwater Partnership Processing Agreement Assessment
The APMC uses a cash flow model to determine if the unavoidable costs of meeting the obligations under the Processing Agreement exceed the economic benefits expected to be received. The model uses a number of variables to calculate a discounted net cash flow for the APMC. Those variables include technical variables that arise from the design of the project such as catalyst volumes or energy consumption; pricing related variables such as crude oil prices (WTI), heavy-light differentials, ultra-low sulphur diesel-WTI premiums, exchange rates, capital costs, operating costs, interest rates, discount rates; and operating performance compared to capacity.
Technical inputs may be estimated with reasonable accuracy for a particular operating plan; however, revenues and costs that depend upon market prices are challenging to estimate, particularly over long future time periods. The Processing Agreement has a term of 30 years and may be renewed for successive five year periods at the APMC’s option. In order to perform the onerous contract analysis, the APMC’s management developed estimates for the key variables based on information from various sources including forecasts of global consultancies, reserve evaluation consultants, forward markets and the Province.
Based on the analysis, the APMC determined the agreement has a positive net present value of future cash flows and no provision is required.
Crude-by-rail Project
On February 14, 2019, the Province instructed the APMC, as agent to execute the crude-by-rail project as a medium term solution to alleviate the constrained market access for Alberta’s heavy crude oil production. The Province has evaluated this program and the contracts thereunder in accordance with IFRS 15 Revenue from Contracts with Customers, and determined that APMC is an agent on all commercial elements. As a result, all financial obligations, risks, and rewards of the project are borne by the Province.
Keystone XL Pipeline Project
Effective October 30, 2018, APMC has assigned these capacity agreements to another party. Therefore, APMC no longer has this commitment.
| | |
| CONSOLIDATED FINANCIAL STATEMENTS | | 51 |
| | |
| EQUITY IN GOVERNMENT BUSINESS ENTERPRISES | | SCHEDULE 8 (continued) |
Legal Actions
At March 31, 2019, the government business enterprises were involved in various legal actions. Accruals have been made in specific instances where it is probable that losses will be incurred which can be reasonably estimated. The resulting loss, if any, from claims in excess of the amounts accrued cannot be determined.
Of the various legal actions, the government business enterprises are jointly or separately named as a defendant in 21 (2018: 20) legal claims of which the outcome is not determinable. Of the 21 claims, 16 (2018: 15) have specified amounts totalling approximately $252 million (2018: $152 million) and five claims (2018: five) have no specified amount. The government business enterprises are also named in one (2018: nil) claim, the outcome of which is likely and has a specific amount of $1 million (2018: nil). One (2018: two) claim totalling approximately $1 million (2018: $2 million) is covered by the Alberta Risk Management Fund.
Measurement Uncertainty
BP
The estimates and assumptions made in BP’s audited financial statements and unaudited financial results from January 1 to March 31, 2019 are subject to measurement uncertainty. There is a significant risk of a material adjustment to the carrying amounts of assets and liabilities within the next financial year. In addition, the BP’s provisions for onerous contracts have been recorded at the lower of the present value of continuing the PPAs and the expected costs of terminating them.
APMC
The Province, through its agent APMC, is party to the Partnership. The APMC has used judgement to estimate the net present value of the processing agreement with the Partnership, as well as to estimate the monthly toll commitments in this disclosure.
Derivative Contracts
ATB Financial has the following derivatives:
| | | | | | | | |
| | | 2019 | | | 2018 | |
| | | Fair value | | | Fair value | |
| | | In | | | millions | |
Interest rate derivatives (a) | | $ | 82 | | | $ | (113 | ) |
Cross currency interest rate swaps | | | 8 | | | | (5 | ) |
Forward commodity contracts (b) | | | 42 | | | | 16 | |
Foreign currency derivatives | | | 5 | | | | 7 | |
Future contracts | | | (1 | ) | | | - | |
Embedded derivatives | | | (1 | ) | | | (1 | ) |
Net derivative-related investments | | $ | 135 | | | $ | (96 | ) |
| (a) | The exposure to credit risk on the fair value of derivatives of $642 million (2018: $577 million) is reduced by $335 million resulting from entering into master netting agreements (2018: $388 million) and is reduced by $158 million in collateral agreements (2018: $14 million) with counterparties resulting in a residual credit exposure of $149 million (2018: $175 million) of the derivative assets and $71 million (2018: $110 million - restated) of the derivative liability. |
| (b) | Commodity price risk arises when ATB Financial offers deposit or derivative products where the value of the derivative instrument or rate of return on the deposit is linked to changes in the price of the underlying commodity. ATB Financial uses commodity-linked derivatives to fully hedge associated commodity risk exposure on these products and does not accept any net direct commodity price risk. |
| | |
| 52 | | GOVERNMENT OF ALBERTA 2018–19 ANNUAL REPORT |
| | |
| EQUITY IN GOVERNMENT BUSINESS ENTERPRISES | | SCHEDULE 8 (continued) |
Pension Liabilities
The government business enterprises have pension liabilities of $140 million (2018: $107 million) comprised of $132 million (2018: $112 million) for employees in the Public Service Pension Plan, the Management Employees Pension Plan, the Supplementary Retirement Plan for Public Service Managers and $8 million in pension liabilities (2018: $5 million pension asset) in other pension plans.
| | |
| LOANS AND ADVANCES | | SCHEDULE 9 |
| | | | | | | | |
| | | 2019 | | | 2018 | |
| | | In | | | millions | |
Loans and advances made under the authority of: | | | | | | | | |
Alberta Capital Finance Authority Act (a) | | $ | 14,528 | | | $ | 14,192 | |
Student Loan Act (b) | | | 3,225 | | | | 2,832 | |
Agriculture Financial Services Act (c) | | | 2,305 | | | | 2,248 | |
Alberta Treasury Branches Act (d) | | | 339 | | | | 331 | |
Oil and Gas Conservation Act (e) | | | 129 | | | | 46 | |
Seniors’ Property Tax Deferral Act | | | 27 | | | | 22 | |
Financial Administration Act | | | 26 | | | | 31 | |
Seniors’ Home Adaptation and Repair Act | | | 18 | | | | 13 | |
| | | 20,597 | | | | 19,715 | |
Less allowance for doubtful accounts (b) | | | 366 | | | | 310 | |
| | | $ | 20,231 | | | $ | 19,405 | |
The loan repayment terms are as follows:
| | | | | | | | | | | | |
| | | Principal (f) | | | Interest | | | Total payments | |
| | | | | | In millions | | | | |
2019-20 | | $ | 1,258 | | | $ | 649 | | | $ | 1,907 | |
2020-21 | | | 1,263 | | | | 584 | | | | 1,847 | |
2021-22 | | | 1,180 | | | | 548 | | | | 1,728 | |
2022-23 | | | 1,166 | | | | 515 | | | | 1,681 | |
2023-24 | | | 1,112 | | | | 477 | | | | 1,589 | |
Thereafter | | | 12,703 | | | | 3,387 | | | | 16,090 | |
| | | $ | 18,682 | | | $ | 6,160 | | | $ | 24,842 | |
| (a) | Alberta Capital Finance Authority maintains a loan portfolio consisting of several different borrower categories, each with their own source of security to ensure repayment. Municipal loans on average yield 3.8% (2018: 3.8%) per annum. |
| (b) | Student loans become payable and interest is earned starting six months after students discontinue their studies or graduate. Loans are unsecured and are repayable to a maximum term of 114 months. The interest rates on student loans are a floating rate of prime or a fixed rate of prime plus 2%. |
Allowance for doubtful accounts includes allowance for repayment assistance, impaired loans, and loan subsidy.
The allowance for repayment assistance is a provision that estimates the amount of loans receivable that will be forgiven through the repayment assistance program. The key assumptions used to determine the provision are future loan amounts approved for repayment assistance and loan forgiveness rates of 9.5% (2018: 9.2%).
The allowance for impaired loans is a provision that estimates the amount of loans receivable that will be impaired. The key assumptions used to determine this provision are default rates of 5.3% (2018: 5.4%) and recovery rates of 25.3% (2018: 26.7%).
| | |
| CONSOLIDATED FINANCIAL STATEMENTS | | 53 |
| | |
| LOANS AND ADVANCES | | SCHEDULE 9 (continued) |
The allowance for loan subsidy is a provision that reflects the future benefit provided to students. The key assumptions used to determine this provision are a blended student lending rate of 3.3% (2018: 3.3%), the annual average provincial borrowing rate of 2.9% (2018: 2.6%) for similar maturities, the average repayment period of 10 years (2018: 9 years), default rate assumptions, and Repayment Assistance Plan rate assumptions.
| (c) | The weighted average annual interest rate of the Agricultural Financial Services loan portfolios is 4.0% (2018: 3.9%). |
Loans have fixed interest rates for the term of the loan or renewal period. Loans have blended repayments during the term and can be repaid in full or part during the term without penalty. The loans are secured by tangible assets consisting predominantly of land followed by buildings, equipment and other assets. The estimated values of such assets are $5.2 billion (2018: $5.0 billion).
| (d) | Pursuant to the Alberta Treasury Branches Act, the Province assesses a charge to ATB Financial as prescribed by the Alberta Treasury Branches Regulation. The payment in lieu of tax is settled by issuing subordinated debentures calculated as 23% of net income. The effective interest rate is 2.7% (2018: 2.8%) with maturities ranging from 2020 to 2024. |
| (e) | Pursuant to section 76.2 of the Oil and Gas Conservation Act, the Province entered into an agreement with Alberta Oil and Gas Orphan Abandonment and Reclamation Association (also known as Orphan Well Association or OWA) to provide OWA with a series of interest-free loan advances to clean up orphaned oil and gas wells. A discount of $15 million for the present value of foregone interest has been expensed in the current year and will be amortized to revenue in subsequent periods over the remaining life of the loan. |
| (f) | Some loans, such as loans under Student Loan Act, are excluded from the repayment schedule as no terms of repayment have been established. |
| | |
| ACCOUNTS PAYABLE AND OTHER ACCRUED LIABILITIES | | SCHEDULE 10 |
| | | | | | | | |
| | | 2019 | | | 2018 | |
| | | In | | | millions | |
Salaries, wages, employment contracts and benefits | | $ | 2,919 | | | $ | 2,887 | |
Grants | | | 1,345 | | | | 2,620 | |
Corporate income tax receipts in abeyance and tax refunds payable | | | 1,111 | | | | 1,499 | |
Coal phase-out agreements | | | 983 | | | | 1,054 | |
Unearned revenue | | | 711 | | | | 677 | |
Accrued interest | | | 611 | | | | 465 | |
Capital leases | | | 228 | | | | 250 | |
Other accounts payable and accrued liabilities | | | 3,906 | | | | 3,781 | |
| | | $ | 11,814 | | | $ | 13,233 | |
| | |
| 54 | | GOVERNMENT OF ALBERTA 2018–19 ANNUAL REPORT |
| | | | | | | | | | | | | | | | | | | | | | | | |
| Fiscal Year of Maturity Ending March 31 | | Debt (a) | |
| | | Effective | | | | | | (in Canadian dollars) | | | 2019 | | | 2018 | |
| | | interest
rate (b) | | | Canadian
dollar | | | US
dollar | | | Other
currencies | | | Total | | | Total | |
| | | | | | | | | In millions | | | | | | | |
Floating rate debt
2019 | | | - | | | $ | - | | | $ | - | | | $ | - | | | $ | - | | | $ | 1,500 | |
2020 | | | - | | | | - | | | | - | | | | - | | | | - | | | | - | |
2021 | | | 2.09% | | | | 480 | | | | - | | | | - | | | | 480 | | | | 480 | |
Fixed rate debt
2019 | | | - | | | | - | | | | - | | | | - | | | | - | | | | 8,152 | |
2020 | | | 2.45% | | | | 4,656 | | | | 5,351 | | | | - | | | | 10,007 | | | | 4,822 | |
2021 | | | 1.75% | | | | 2,978 | | | | 1,646 | | | | - | | | | 4,624 | | | | 4,624 | |
2022 | | | 1.50% | | | | 2,917 | | | | 702 | | | | 1,309 | | | | 4,928 | | | | 4,928 | |
2023 | | | 2.46% | | | | 2,812 | | | | 1,891 | | | | 431 | | | | 5,134 | | | | 4,703 | |
2024 | | | 2.99% | | | | 1,771 | | | | 5,006 | | | | 70 | | | | 6,847 | | | | - | |
2020-2024 (< 5 years) | | | 2.32% | | | | 15,614 | | | | 14,596 | | | | 1,810 | | | | 32,020 | | | | 29,209 | |
2025-2029 (6-10 years) | | | 2.76% | | | | 13,411 | | | | 2,932 | | | | 5,991 | | | | 22,334 | | | | 14,257 | |
2030-2039 (11-20 years) | | | 3.67% | | | | 5,508 | | | | - | | | | - | | | | 5,508 | | | | 5,838 | |
2040-2051 (> 21 years) | | | 3.29% | | | | 17,400 | | | | - | | | | 913 | | | | 18,313 | | | | 14,513 | |
Total debt issued at face value | | | 2.77% | | | $ | 51,933 | | | $ | 17,528 | | | $ | 8,714 | | | $ | 78,175 | | | $ | 63,817 | |
Unamortized discount | | | | | | | | | | | | | | | | | | | (330 | ) | | | (285 | ) |
Total debt (c) | | | | | | | | | | | | | | | | | | $ | 77,845 | | | $ | 63,532 | |
| (a) | Debt includes the following foreign currency denominated debt that is fully hedged to Canadian dollars to eliminate exposure to future fluctuations in exchange rates. Fully hedged foreign currency debt is translated into Canadian dollars at the rate of exchange established by the hedging instrument. |
| | | | | | | | | | | | | | | | |
| | | Debt at par | | | Debt at cost (CAD$) | |
| Fully Hedged Foreign Currency | | 2019 | | | 2018 | | | 2019 | | | 2018 | |
US dollars | | $ | 13,330 | | | $ | 10,855 | | | $ | 17,521 | | | $ | 14,137 | |
Euros | | € | 3,387 | | | € | 637 | | | € | 5,164 | | | € | 911 | |
Swedish Kronor | | SEK | 2,500 | | | | - | | | SEK | 357 | | | | - | |
British pounds sterling | | £ | 1,050 | | | £ | 800 | | | £ | 1,740 | | | £ | 1,309 | |
Australian dollars | | $ | 965 | | | $ | 865 | | | $ | 947 | | | $ | 851 | |
South African Rand | | ZAR | 750 | | | | - | | | ZAR | 70 | | | | - | |
Swiss francs | | CHF | 325 | | | | - | | | CHF | 436 | | | | - | |
| (b) | The effective interest rate is based on the weighted average of debt issues. The effective rate is the rate that exactly discounts estimated future cash payments through the expected term of the debt to the net carrying amount and includes the effects of interest rate and currency swaps. |
| (c) | Debt and liabilities under public private partnerships (P3) totalling $80,791 million is comprised of $77,845 million debt and $2,946 million liabilities under P3 (Schedule 14). |
The consolidated gross debt of the Province totalling $82,994 million (2018: $69,429 million) is comprised of debt of the Province totalling $77,845 million (2018: $63,532 million) and debt of government business enterprises totalling $5,149 million (2018: $5,897 million).
The consolidated gross debt servicing cost of the Province totalling $2,097 million (2018: $1,497 million) is comprised of $1,971 million (2018: $1,420 million) on debt of the Province and Alberta Capital Finance Authority and $126 million (2018: $77 million) on debt of government business enterprises.
| | |
| CONSOLIDATED FINANCIAL STATEMENTS | | 55 |
| | |
| PENSION PLANS AND OTHER DEFINED BENEFIT PLANS | | SCHEDULE 12 |
Pension Plans
The President of Treasury Board and Minister of Finance is the trustee for the following pension plans under the Public Sector Pension Plans Act: Management Employees Pension Plan (MEPP) and the Public Service Management (Closed Membership) Pension Plan (PSMC). The President of Treasury Board and Minister of Finance is also the trustee for the Provincial Judges and Masters in Chambers (Registered) Pension Plan (PJMCPP) under the Provincial Court Act and the Supplementary Retirement Plan for Public Service Managers (MSRP) under the Supplementary Retirement Plan – Retirement Compensation Arrangement Directive (Treasury Board Directive 01/06). All of these pension plans are open with the exception of PSMC.
On March 1, 2019, Local Authorities Pension Plan (LAPP), Public Service Pension Plan (PSPP) and Special Forces Pension Plan (SFPP) transitioned to a joint governance structure in accordance with the Joint Governance of Public Sector Pension Plans Act passed on December 5, 2018. On the transition date, ownership of the Plan fund transferred from the President of Treasury Board and Minister of Finance as the trustee to the newly established LAPP Corporation, PSPP Corporation and SFPP Corporation respectively. The corporations of each plan become the administrator and trustee of these plans. Under joint governance, a Sponsor Board comprising nominees from employee and employer sponsor organizations will govern and be responsible for each plan.
Financial statements for MEPP, PSMC, PJMCPP and MSRP as of their December 31, 2018 year end or March 31, 2019 year end are included as supplementary information in the Ministry of Treasury Board and Finance Annual Report. Financial statements for LAPP, PSPP and SFPP are available on respective corporation’s website. All of the plans, except PJMCPP, are multi-employer plans.
The Teachers’ Pension Plan (Teachers’) and the Universities Academic Pension Plan (UAPP) are administered by their respective boards.
In addition to the aforementioned plans, there are several agencies which maintain their own plans to compensate senior staff members that do not participate in the regular government pension plans. These entities include the Alberta Innovates, Alberta Energy Regulator, Alberta Utilities Commission, Alberta Securities Commission and some SUCH sector entities. Summaries of these plans are included in these financial statements as Supplementary Executive Retirement Plans (SERP). Additional information can be found in the entities’ financial statements.
The following is a summary of the plans for the year ended March 31, 2019:
| | | | | | | | | | | | | | | | | | | | | | | | | | | | |
Defined benefit
pension plans | | Approximate
number of
active
employees | | | Average age
of active
employees | | | Approximate
number of former
employees entitled
to future benefits (b) | | | Approximate
number of
retirees
receiving
benefits | | | Employee
contributions | | | Employer
contributions | | | Benefit
payments | |
| | | | | | | | | | | | | | | In millions | |
| | | | | | | |
LAPP | | | 164,854 | | | | 46 | | | | 33,923 | | | | 69,401 | | | | 1,186 | | | | 1,278 | | | | 1,633 | |
PSPP | | | 42,754 | | | | 44 | | | | 14,878 | | | | 27,380 | | | | 317 | | | | 319 | | | | 590 | |
MEPP | | | 5,631 | | | | 49 | | | | 1,021 | | | | 5,621 | | | | 82 | | | | 109 | | | | 236 | |
MLAPP (a) | | | - | | | | - | | | | - | | | | 102 | | | | - | | | | - | | | | 4 | |
MSRP | | | 1,030 | | | | 53 | | | | 222 | | | | 1,143 | | | | 3 | | | | 3 | | | | 6 | |
PJMCPP | | | 128 | | | | 61 | | | | 2 | | | | 174 | | | | 1 | | | | 3 | | | | 8 | |
PSMC (a) | | | - | | | | - | | | | 50 | | | | 1,611 | | | | - | | | | - | | | | 47 | |
SFPP (a) | | | 4,486 | | | | 41 | | | | 216 | | | | 2,691 | | | | 60 | | | | 65 | | | | 132 | |
Teachers’ Pre-1992 | | | 4,884 | | | | 56 | | | | 877 | | | | 26,006 | | | | - | | | | - | | | | 478 | |
Teachers’ Post-1992 | | | 40,321 | | | | 42 | | | | 6,642 | | | | 24,602 | | | | 429 | | | | 405 | | | | 499 | |
UAPP Pre-1992 (a) | | | 572 | | | | 62 | | | | - | | | | 3,753 | | | | 16 | | | | 16 | | | | 134 | |
UAPP | | | 8,205 | | | | 49 | | | | 2,269 | | | | 5,625 | | | | 135 | | | | 145 | | | | 275 | |
| | |
| 56 | | GOVERNMENT OF ALBERTA 2018–19 ANNUAL REPORT |
| | |
| PENSION PLANS AND OTHER DEFINED BENEFIT PLANS | | SCHEDULE 12 (continued) |
| (a) | During the year these plans also received contributions, primarily related to pre-1992 commitments, from the Province as follows: PSMC $48 million, SFPP $6 million, UAPP Pre-1992 $12 million and MLAPP $4 million. |
| (b) | Includes vested former employees in the pension plan and non-vested former employees entitled to a refund of their contributions. |
The plans provide a defined benefit retirement income based on a formula for each plan that considers final average years of salary, length of service and a percentage ranging from 1 .4% to 2% per year of service.
The Province accounts for the liabilities for pension obligations on a defined benefit basis as a participating employer for former and current employees in LAPP, MEPP, MSRP, PJMCPP, PSPP, Teachers’ and UAPP for the government’s consolidated reporting entities except for government business enterprises that are required to account directly for participation in the public service pension plans under IFRS.
In addition, the Province accounts for the specific commitments made for pre-1992 pension obligations to the Teachers’, PSMC, UAPP and SFPP. In 1992, there was pension plan reform resulting in pre-1992 and post-1992 arrangements for several pension plans.
The Province also accounts for the obligation to the Members of the Legislative Assembly Pension Plan (MLAPP).
The following table contains summary information on these specific pension plans. Complete financial reporting is available through each pension plan. Pension liabilities are as follows:
| | | | | | | | | | | | |
| | | 2019 | | | 2018 | |
| | | Pension
liabilities | | | Pension provision
(recovery)
(Schedule 3) | | | Pension
liabilities | |
| | | | | | In millions | | | | |
Liabilities for the Province’s employer share
for former and current employees | | | | | | | | | | | | |
LAPP (a) | | $ | - | | | $ | - | | | $ | - | |
MEPP (b) | | | - | | | | - | | | | - | |
MSRP (c) | | | 70 | | | | 15 | | | | 55 | |
PJMCPP (d) | | | - | | | | (8 | ) | | | 8 | |
PSPP (e) | | | - | | | | (16 | ) | | | 16 | |
Teachers’ (f) | | | 340 | | | | (110 | ) | | | 450 | |
UAPP (g) | | | 160 | | | | (45 | ) | | | 205 | |
SERP (h) | | | 66 | | | | 6 | | | | 60 | |
| | | 636 | | | | (158 | ) | | | 794 | |
Liabilities for the Province’s commitment towards
pre-1992 obligations | | | | | | | | | | | | |
Teachers’ (f) | | | 7,739 | | | | (35 | ) | | | 7,774 | |
PSMC (i) | | | 473 | | | | (33 | ) | | | 506 | |
UAPP (g) | | | 259 | | | | 15 | | | | 244 | |
SFPP (g) | | | 93 | | | | 23 | | | | 70 | |
| | | 8,564 | | | | (30 | ) | | | 8,594 | |
MLAPP (j) | | | 40 | | | | (2 | ) | | | 42 | |
| | | $ | 9,240 | | | $ | (190 | ) | | $ | 9,430 | |
| | |
| CONSOLIDATED FINANCIAL STATEMENTS | | 57 |
| | |
| PENSION PLANS AND OTHER DEFINED BENEFIT PLANS | | SCHEDULE 12 (continued) |
The following is a description of each pension plan:
| (a) | The LAPP is a contributory defined benefit pension plan for eligible employees of local authorities and approved public bodies. These include cities, towns, villages, municipal districts, hospitals, Alberta Health Services, school divisions, school districts, colleges, technical institutes and certain commissions, foundations, agencies, libraries, corporations, associations and societies. In accordance with the Public Sector Pension Plans Act, the actuarial deficiencies as determined by actuarial funding valuations are expected to be funded by special payments currently totaling 4.6% of pensionable earnings shared equally between employers and employees until December 31, 2028. Current services costs are funded by employers and employees. |
| (b) | The MEPP is a contributory defined benefit pension plan for eligible management employees of the Province and certain approved provincial agencies and public bodies. Members of the former Public Service Management Pension Plan who were active contributors at August 1, 1992, and have not withdrawn from the Plan since that date, continue as members of this Plan. In accordance with the Public Sector Pension Plans Act, the actuarial deficiencies as determined by the December 31, 2015 actuarial funding valuation is being funded by special payments currently totaling 10.2% of pensionable earnings shared between employees and employers until December 31, 2016. Thereafter, the special payments will decrease successively to 5% until December 31, 2024, and to 2.9% until December 31, 2027. Current services costs are funded by employers and employees. |
| (c) | The MSRP is a contributory defined benefit pension plan for certain public service managers of designated employers who participate in the MEPP and whose annual salary exceeds the maximum pensionable salary limit under the Income Tax Act. The Plan is supplementary to the MEPP. The contribution rates in effect at December 31, 2018 were at 12.8% (2017: 12.8%) of pensionable salary in excess of the maximum pensionable salary limit for eligible employees and designated employers. |
| (d) | The Provincial Judges and Masters in Chambers Registered and Unregistered Pension Plans collectively are contributory defined benefit pension plans for Judges and Masters in Chambers of the Province. Current service costs in the Registered Plan are funded by the Province and plan members at rates which are expected to provide for all benefits payable under the Plan. The rates in effect at March 31, 2019 are 7% of capped salary for plan members and 19.6% of capped salary for the Province. The Unregistered Plan contribution rates in effect at March 31, 2019 are unchanged at 7% of pensionable salary in excess of capped salary for members and 7% of the excess for the Province. Benefits are payable by the Province if assets are insufficient to pay for all benefits under the plans. |
| (e) | The PSPP is a contributory defined benefit pension plan for eligible employees of the Province, approved provincial agencies and public bodies. In accordance with the Public Sector Pension Plans Act, the actuarial deficiencies as determined by an actuarial funding valuation are expected to be funded by special payments currently totaling 3.4% of pensionable earnings shared equally between employees and employers until December 31, 2026. Current services costs are funded by employers and employees. |
| (f) | The Teachers’ Pension Plans Act requires all teachers under contract with jurisdictions in Alberta to contribute to the Teachers’ Pension Plan. The Province assumed responsibility for the entire unfunded pre-1992 pension obligation of the Teachers’ Pension Plan. In 2009-10 there was a repayment of $1,187 million towards the liability. As of September 1, 2009, the costs of all benefits under the Plan are paid by the Province. |
| (g) | Under the Public Sector Pension Plans Act, the Province has a liability for payment of additional contributions under defined benefit pension plans for certain employees of municipalities and post-secondary educational institutions. The plans are the Universities Academic and the Special Forces plans. |
For the UAPP, the unfunded liability for service credited prior to January 1, 1992 is being financed by additional contributions of 1.3% of pensionable salaries by the Province, and contributions by employers and employees to fund the remaining amount, as determined by the plan valuation, over the period ending on or before December 31, 2043. Employers and employees fund current service costs.
For the SFPP, the unfunded liability for service credited prior to January 1, 1992 is being financed by additional contributions in the ratio of 45.5% by the Province and 27.3% each by employers and employees, over the period ending on or before December 31, 2036. Current service costs are funded by employers and employees. The Act provides that payment of all benefits arising from pensionable service prior to 1994, excluding post-1991 cost of living adjustment benefits, is guaranteed by the Province.
| (h) | Certain consolidated entities provide defined supplementary executive retirement plans for certain management staff, and other benefit plans for all or specific groups of staff, depending on the plans. The cost of these benefits are actuarially determined on an annual basis using the projected benefit method pro-rated on services, a market interest rate, and management’s best estimate of expected costs and the period of benefit coverage. |
| | |
| 58 | | GOVERNMENT OF ALBERTA 2018–19 ANNUAL REPORT |
| | |
| PENSION PLANS AND OTHER DEFINED BENEFIT PLANS | | SCHEDULE 12 (continued) |
| (i) | The PSMC provides benefits to former members of the Public Service Management Pension Plan who were retired, were entitled to receive a deferred pension or had attained 35 years of service before August 1, 1992. The costs of all benefits under the Plan are paid by the Province. |
| (j) | The Province has a liability for payment of pension benefits under a defined benefit pension plan for Members of the Legislative Assembly. Active participation in this plan was terminated as of June 1993, and no benefits can be earned for service after this date. The costs of all benefits under the plan are paid by the Province. |
The liability for pension obligations as a participating employer is as follows:
As at March 31, 2019
| | | | | | | | | | | | | | | | | | | | | | | | | | | | | | | | |
| | | | | | | | | | | | Teachers’ | | | | | | | | | 2019 | | | 2018 | |
| | | | | | | | | | | | Pension | | | | | | | | | | | | | |
| | | | | | | | | | | | Plan | | | | | | | | | | | | | |
| | | LAPP | | | MEPP | | | PSPP | | | Post-1992 | | | UAPP | | | Others (d) | | | Total | | | Total | |
| | | | | | | | | | | | In millions | | | | | | | | | | | | | |
| | | | | | | | |
Net assets available for benefits (a) | | $ | 44,469 | | | $ | 5,061 | | | $ | 13,713 | | | $ | 17,204 | | | $ | 4,897 | | | $ | 664 | | | | | | | | | |
Pension obligation | | | 40,999 | | | | 4,391 | | | | 13,193 | | | | 16,023 | | | | 5,893 | | | | 792 | | | | | | | | | |
Pension plan (surplus)/deficit (a) | | | (3,470 | ) | | | (670 | ) | | | (520 | ) | | | (1,181 | ) | | | 996 | | | | 128 | | | | | | | | | |
Unamortized gains/(losses) (b) | | | 2,612 | | | | 248 | | | | 478 | | | | 1,829 | | | | (347 | ) | | | 3 | | | | | | | | | |
Timing differences (c) | | | (195 | ) | | | (18 | ) | | | (32 | ) | | | - | | | | - | | | | - | | | | | | | | | |
(Accrued benefit asset)/Future benefit liability | | $ | (1,053 | ) | | $ | (440 | ) | | $ | (74 | ) | | $ | 648 | | | $ | 649 | | | $ | 131 | | | | | | | | | |
| | | | | | | | |
(Asset)/Liability for the Province’s share for former and current employees | | | (326 | ) | | | (244 | ) | | | (33 | ) | | | 339 | | | | 160 | | | | 131 | | | | 27 | | | | 588 | |
Valuation adjustment | | | 326 | | | | 244 | | | | 33 | | | | - | | | | - | | | | 6 | | | | 609 | | | | 206 | |
Liability for the Province’s commitment towards pre-1992 obligation | | | | | | | | | | | | | | | | | | | | | | | | | | | 8,564 | | | | 8,594 | |
MLAPP | | | | | | | | | | | | | | | | | | | | | | | | | | | 40 | | | | 42 | |
Total pension liability of the Province | | | | | | | | | | | | | | | | | | | | | | | | | | $ | 9,240 | | | $ | 9,430 | |
| (a) | These numbers are as reported in the pension plan 2018 financial statements, except for the Teachers’ Post-1992 Pension Plan and the UAPP which use numbers as reported in actuarial reports. |
| (b) | Under PSAS, gains and losses are amortized over the employee expected average remaining service life of the employees of each plan, which ranges from eight to 11 years. |
| (c) | Accounting timing differences between the pension plan fiscal year ends and March 31 for payments and interest expense. |
| (d) | Others include the MSRP, PJMCPP and SERP. |
| | |
| CONSOLIDATED FINANCIAL STATEMENTS | | 59 |
| | |
| PENSION PLANS AND OTHER DEFINED BENEFIT PLANS | | SCHEDULE 12 (continued) |
The pension expense for the Province is as follows:
| | | | | | | | | | | | | | | | | | | | | | | | | | | | | | | | | | | | |
| | | | | | | | | | | | Teachers’ Pension Plan | | | | | | | | | 2019 | | | 2018 | |
| | | LAPP | | | MEPP | | | PSPP | | | Pre-92 | | | Post-92 | | | UAPP | | | Others(c) | | | Total | | | Total | |
| | | | | | | | | | | | In millions | | | | | | | | | | | | | | | | |
Pension expense | | | | | | | | | | | | | | | | | | | | | | | | | | | | | | | | | | | | |
Current period benefit cost (a) | | $ | 1,736 | | | $ | 127 | | | $ | 503 | | | $ | - | | | $ | 529 | | | $ | 90 | | | $ | 32 | | | $ | 3,017 | | | $ | 3,047 | |
Amortization of actuarial losses/(gains) (b) | | | 169 | | | | (113 | ) | | | 23 | | | | 164 | | | | 230 | | | | (10 | ) | | | (15 | ) | | | 448 | | | | 304 | |
Total | | $ | 1,905 | | | $ | 14 | | | $ | 526 | | | $ | 64 | | | $ | 759 | | | $ | 80 | | | $ | 17 | | | $ | 3,465 | | | $ | 3,351 | |
Province’s share of pension expense | | $ | 591 | | | $ | 8 | | | $ | 236 | | | $ | 164 | | | $ | 380 | | | $ | 80 | | | $ | 17 | | | $ | 1,476 | | | $ | 1,403 | |
Interest expense | | | | | | | | | | | | | | | | | | | | | | | | | | | | | | | | | | | | |
Interest on pension (asset)/liability (a) | | | (93 | ) | | | (30 | ) | | | (35 | ) | | | 279 | | | | (93 | ) | | | 8 | | | | 32 | | | | 68 | | | | 217 | |
Total pension expense/(recovery) of the Province | | $ | 498 | | | $ | (22 | ) | | $ | 201 | | | $ | 443 | | | $ | 287 | | | $ | 88 | | | $ | 49 | | | $ | 1,544 | | | $ | 1,620 | |
| (a) | As reported in pension plan financial statements or actuarial reports. Numbers in UAPP are net of employees’ share. |
| (b) | Except for SFPP, numbers are adjusted to March 31, 2019. |
| (c) | Others includes the MSRP, PJMCPP, SFPP, SERP, MLAPP and PSMC. |
Pension liabilities are based upon actuarial valuations performed at least triennially using the projected benefit method pro-rated on services and actuarial extrapolations performed at December 31, 2018 or March 31, 2019. The assumptions used in the valuations and extrapolations were adopted after consultation between the pension plan boards, the government and the actuaries, depending on the plan, and represent best estimates of future events. The non-economic assumptions include considerations such as mortality as well as withdrawal and retirement rates. The primary economic assumptions include salary escalation rate, discount rate and inflation rate. Each plan’s future experience will inevitably vary, perhaps significantly, from the assumptions. Any differences between the actuarial assumptions and future experience will emerge as gains or losses in future valuations. Gains and losses are amortized over the expected average remaining service lives of the related employee groups.
| | |
| 60 | | GOVERNMENT OF ALBERTA 2018–19 ANNUAL REPORT |
| | |
| PENSION PLANS AND OTHER DEFINED BENEFIT PLANS | | SCHEDULE 12 (continued) |
The date of actuarial extrapolation and primary economic assumptions used for accounting purposes were:
| | | | | | | | | | |
| Plan | | Latest
valuation
date | | Latest
extrapolation
date | | Salary
Escalation
rate % | | Inflation
rate % | | Discount
rate (a) % |
| | | | | |
Teachers’ Pre-1992 Pension Plan | | 31-Aug-18 | | 31-Mar-19 | | - | | 2.00 | | 3.60 |
Teachers’ Post-1992 Pension Plan | | 31-Aug-18 | | 31-Mar-19 | | 3.00 | | 2.00 | | 5.80 |
PSMC | | 31-Dec-17 | | 31-Dec-18 | | - | | 2.00 | | 3.60 |
UAPP | | 31-Dec-16 | | 31-Mar-19 | | 3.00 | | 2.00 | | 5.60 |
LAPP | | 31-Dec-17 | | 31-Dec-18 | | 3.00 | | 2.00 | | 5.70 |
PSPP | | 31-Dec-17 | | 31-Dec-18 | | 3.00 | | 2.00 | | 5.70 |
MLAPP | | 31-Mar-19 | | 31-Mar-19 | | - | | 2.00 | | 3.60 |
MEPP | | 31-Dec-17 | | 31-Dec-18 | | 3.00 | | 2.00 | | 6.10 |
PJMCPP, Unregistered | | 31-Mar-17 | | 31-Mar-19 | | 3.00 | | 2.00 | | 4.60 |
PJMCPP, Registered | | 31-Mar-17 | | 31-Mar-19 | | 3.00 | | 2.00 | | 5.20 |
MSRP | | 31-Dec-16 | | 31-Dec-18 | | 3.00 | | 2.00 | | 5.70 |
SFPP | | 31-Dec-16 | | 31-Dec-18 | | 3.00 | | 2.00 | | 5.60 |
| (a) | The discount rate is the expected rate of return for plans with assets and is also the discount rate used to measure the actuarial liability. |
The actual return on major funded plans’ assets during the period ranges from (0 .5)% to 9 .6%
(2018: 7.7% to 11.3%). This range includes returns for LAPP, Teachers’ Post-1992 Plan, PSPP, MEPP, SFPP and UAPP.
A separate pension plan fund is maintained for each pension plan except for the Teachers’ Pre-1992 Pension Plan and the MLAPP. Each pension plan fund reports annually through financial statements.
Other Defined Benefit Plans
Long Term Disability Income Continuance Plans
The Province administers two long-term disability income continuance plans. As at March 31, 2019, the Bargaining Unit Plan reported an actuarial surplus of $110 million (2018: surplus of $112 million) and the Management, Opted Out, and Excluded Plan reported an actuarial surplus of $25 million (2018: surplus of $30 million). At March 31, 2019, the Province did not recognize these accrued benefit assets.
Accumulating Non-Vesting Sick Leave Liability
Sick leave benefits are paid by the Province without employees’ contributions and no assets are set aside to fund the obligation. The sick leave liability is based on an actuarial valuation as at March 31, 2015 and extrapolated to March 31, 2018. As at March 31, 2019, the sick leave liability is $122 million (2018: $119 million). These liabilities are reported in accounts payable and other accrued liabilities (Schedule 10).
| | |
| CONSOLIDATED FINANCIAL STATEMENTS | | 61 |
| | |
| DEFERRED CONTRIBUTIONS | | SCHEDULE 13 |
Deferred contributions represent funding or capital assets received from the Government of Canada or other sources with stipulations or external restrictions related to the use of the funding or capital assets. Operating contributions are recognized as revenue when the funding is spent for the restricted purposes. Capital contributions are recognized as revenue over the estimated useful life of the underlying capital assets once constructed or acquired.
| | | | | | | | |
| Unspent Deferred Contributions | | | | | | |
| | | 2019 | | | 2018 | |
| | | In | | | millions | |
Deferred operating contributions | | | | | | | | |
Deferred operating contributions beginning of year | | $ | 1,020 | | | $ | 839 | |
Contributions received | | | 1,583 | | | | 1,309 | |
Transfers and adjustments | | | (60 | ) | | | 68 | |
Deferred operating contributions recognized as revenue | | | (1,458 | ) | | | (1,196 | ) |
Deferred operating contributions end of year | | | 1,085 | | | | 1,020 | |
Unspent deferred capital contributions | | | | | | | | |
Unspent deferred capital contributions beginning of year | | | 224 | | | | 292 | |
Adjustments from prior period | | | 3 | | | | - | |
Contributions restricted for capital | | | 359 | | | | 295 | |
Transfers to spent deferred capital contributions | | | (292 | ) | | | (371 | ) |
Transfers from other accounts | | | - | | | | 18 | |
Deferred capital contributions recognized as revenue | | | (4 | ) | | | (10 | ) |
Unspent deferred capital contributions end of year | | | 290 | | | | 224 | |
Unspent deferred contributions end of year | | $ | 1,375 | | | $ | 1,244 | |
| | |
Spent Deferred Capital Contributions | | | | | | | | |
| | | 2019 | | | 2018 | |
| | | In | | | millions | |
Spent deferred capital contributions beginning of year | | $ | 3,009 | | | $ | 2,786 | |
Adjustments from prior period | | | (3 | ) | | | 22 | |
Transfers from unspent deferred capital contributions | | | 292 | | | | 371 | |
Transfers from other accounts | | | 56 | | | | 47 | |
Deferred capital contributions recognized as revenue | | | (190 | ) | | | (217 | ) |
Spent deferred capital contributions end of year | | $ | 3,164 | | | $ | 3,009 | |
| | |
| 62 | | GOVERNMENT OF ALBERTA 2018–19 ANNUAL REPORT |
| | |
| LIABILITIES UNDER PUBLIC PRIVATE PARTNERSHIPS | | SCHEDULE 14 |
The Province has entered into 33 to 35 year contracts for the design, finance, build, operations and maintenance of ring road segments under the following P3: Anthony Henday - South East, North West and North East Edmonton Ring Road, and Stoney Trail - North East, South East and South West Calgary Ring Road. The Province has entered into 32-year contracts for the design, finance, build, and maintenance of schools under the Alberta Schools Alternative Procurement Phase 1, Phase 2 and Phase 3 projects. These contracts include a construction period followed by a 30-year operations period for the ring roads and a 30-year maintenance period for the schools. The Province has also entered into a 12-year contract for the design, finance, build and operation of the Evan Thomas Water & Wastewater Treatment Facilities which includes a construction period followed by a 10-year operations period.
The details of the contract under construction are as follows:
| | | | | | | | |
| | | Contractor | | Date contract entered into | | Scheduled
completion
date | | Date capital
payments begin |
South West Calgary Ring Road | | Mountain View General Partners General Partnership | | September 2016 | | October 2021 | | October 2020 |
The details of the contracts for those projects that are already operational are as follows:
| | | | | | | | |
| | | Contractor | | Date contract entered into | | Completion date | | Date capital payments began |
| Anthony Henday – South | | Access Roads | | January 2005 | | October 2007 | | November 2007 |
East Edmonton Ring Road | | Edmonton Ltd. | | | | | | |
| Stoney Trail – North | | Stoney Trail Group | | February 2007 | | October 2009 | | November 2009 |
East Calgary Ring Road | | | | | | | | |
| Alberta Schools Alternative | | BBPP Alberta | | September 2008 | | June 2010 | | July 2010 |
Procurement Phase 1 | | Schools Ltd. | | | | | | |
| Anthony Henday – North | | NorthwestConnect | | July 2008 | | October 2011 | | November 2011 |
West Edmonton Ring Road | | General Partnership | | | | | | |
| Alberta Schools Alternative | | B2L Partnership | | April 2010 | | June 2012 | | August 2012 |
Procurement Phase 2 | | | | | | | | |
| Stoney Trail – South | | Chinook Roads | | March 2010 | | November 2013 | | November 2013 |
East Calgary Ring Road | | Partnership | | | | | | |
| Alberta Schools Alternative | | ABC Schools | | September 2012 | | June 2014 | | July 2014 |
Procurement Phase 3 | | Partnership | | | | | | |
| Evan Thomas Water & | | EPCOR Water | | October 2012 | | August 2014 | | August 2014 |
Wastewater Treatment Facilities | | Services Inc. | | | | | | |
| Anthony Henday – North East | | Capital City Link | | May 2012 | | September 2016 | | October 2016 |
Edmonton Ring Road | | General Partnership | | | | | | |
| | |
| CONSOLIDATED FINANCIAL STATEMENTS | | 63 |
| | |
| LIABILITIES UNDER PUBLIC PRIVATE PARTNERSHIPS | | SCHEDULE 14 (continued) |
The calculation of the P3 liabilities is as follows:
| | | | | | | | |
| | | 2019 | | | 2018 | |
| | | In | | | millions | |
| | |
Liabilities beginning of year | | $ | 2,882 | | | $ | 2,763 | |
Additions to liabilities
during the year | | | 128 | | | | 181 | |
Principal payments | | | (64 | ) | | | (62 | ) |
Liabilities end of year | | $ | 2,946 | | | $ | 2,882 | |
Estimated payment requirements for each of the next five years and thereafter are as follows:
| | | | |
| Capital Payments | | | |
| | | In millions | |
| |
2019-20 | | $ | 185 | |
2020-21 | | | 190 | |
2021-22 | | | 198 | |
2022-23 | | | 201 | |
2023-24 | | | 201 | |
Thereafter | | | 3,787 | |
| | | 4,762 | |
Less net present value of interest | | | (1,816 | ) |
Total liabilities | | $ | 2,946 | |
The capital payments for P3 are fixed, equal monthly payments for the privately financed portion of the costs of building the infrastructure. The present value of these capital payments is recorded as a liability on the Consolidated Statement of Financial Position.
| | |
| 64 | | GOVERNMENT OF ALBERTA 2018–19 ANNUAL REPORT |
| | |
| TANGIBLE CAPITAL ASSETS | | SCHEDULE 15 |
| | | | | | | | | | | | | | | | | | | | | | | | | | | | | | | | | | | | | | | | | | | | | | | | | | | | |
| | | | | | General Capital Assets | | | | | | | | | | | | Infrastructure Assets | | | | | | 2019 | | | 2018 | |
| | | | | | | | | | | | | | | | | | | | | | | | | | | | | | | | | | | | Total | | | Total | |
| | | | | | | | | | | | Computer | | | | | | | | | | | | Provincial | | | | | | Dams and | | | | | | | | | | |
| | | | | | | | | | | | hardware | | | | | | | | | | | | highways, | | | | | | water | | | | | | | | | | |
| | | | | | | | | | | | and | | | | | | Sub | | | Land | | | roads and | | | | | | management | | | Sub | | | | | | | |
| | | Land (a) | | | Buildings (b) | | | Equipment (c) | | | Software | | | Other (d) | | | total | | | improvements (e) | | | airstrips (f) | | | Bridges | | | structures (g) | | | total | | | | | | | |
| Estimated Useful Life | | Indefinite | | | 10-50 yrs | | | 3-25 yrs | | | 3-10 yrs | | | 3-50 yrs | | | | | | 10-40 yrs | | | 20-50 yrs | | | 50 yrs | | | 25-80 yrs | | | | | | | | | | |
| | | | | | | | | | | | | | | | | | | | | In millions | | | | | | | | | | | | | | | | | | | |
Historical cost (h) | | | | | | | | | | | | | | | | | | | | | | | | | | | | | | | | | | | | | | | | | | | | | | | | | | | | |
Beginning of year | | $ | 2,693 | | | $ | 40,373 | | | $ | 6,594 | | | $ | 4,914 | | | $ | 1,259 | | | $ | 55,833 | | | $ | 619 | | | $ | 23,390 | | | $ | 2,324 | | | $ | 1,559 | | | $ | 27,892 | | | $ | 83,725 | | | $ | 79,575 | |
Additions | | | 119 | | | | 1,770 | | | | 501 | | | | 410 | | | | 58 | | | | 2,858 | | | | 53 | | | | 1,094 | | | | 70 | | | | 30 | | | | 1,247 | | | | 4,105 | | | | 5,005 | |
Transfers and adjustments (i) | | | (1 | ) | | | 20 | | | | (25 | ) | | | 7 | | | | 14 | | | | 15 | | | | (2 | ) | | | 4 | | | | - | | | | - | | | | 2 | | | | 17 | | | | (20 | ) |
Disposals including write-downs | | | (4 | ) | | | (124 | ) | | | (114 | ) | | | (222 | ) | | | (8 | ) | | | (472 | ) | | | - | | | | - | | | | - | | | | - | | | | - | | | | (472 | ) | | | (835 | ) |
| | | 2,807 | | | | 42,039 | | | | 6,956 | | | | 5,109 | | | | 1,323 | | | | 58,234 | | | | 670 | | | | 24,488 | | | | 2,394 | | | | 1,589 | | | | 29,141 | | | | 87,375 | | | | 83,725 | |
Accumulated amortization | | | | | | | | | | | | | | | | | | | | | | | | | | | | | | | | | | | | | | | | | | | | | | | | | | | | |
Beginning of year | | $ | - | | | $ | 15,130 | | | $ | 4,443 | | | $ | 3,818 | | | $ | 916 | | | $ | 24,307 | | | $ | 342 | | | $ | 6,501 | | | $ | 702 | | | $ | 474 | | | $ | 8,019 | | | $ | 32,326 | | | $ | 30,776 | |
Amortization expense | | | - | | | | 1,049 | | | | 448 | | | | 285 | | | | 63 | | | | 1,845 | | | | 16 | | | | 524 | | | | 57 | | | | 30 | | | | 627 | | | | 2,472 | | | | 2,337 | |
Transfers and adjustments (i) | | | - | | | | 28 | | | | (25 | ) | | | 3 | | | | 12 | | | | 18 | | | | - | | | | (1 | ) | | | - | | | | - | | | | (1 | ) | | | 17 | | | | (10 | ) |
Effect of disposals including write-downs | | | - | | | | (36 | ) | | | (105 | ) | | | (217 | ) | | | (7 | ) | | | (365 | ) | | | - | | | | - | | | | - | | | | - | | | | - | | | | (365 | ) | | | (777 | ) |
| | | - | | | | 16,171 | | | | 4,761 | | | | 3,889 | | | | 984 | | | | 25,805 | | | | 358 | | | | 7,024 | | | | 759 | | | | 504 | | | | 8,645 | | | | 34,450 | | | | 32,326 | |
Net book value at March 31, 2019 | | $ | 2,807 | | | $ | 25,868 | | | $ | 2,195 | | | $ | 1,220 | | | $ | 339 | | | $ | 32,429 | | | $ | 312 | | | $ | 17,464 | | | $ | 1,635 | | | $ | 1,085 | | | $ | 20,496 | | | $ | 52,925 | | | | | |
Net book value at March 31, 2018 | | $ | 2,693 | | | $ | 25,243 | | | $ | 2,151 | | | $ | 1,096 | | | $ | 343 | | | $ | 31,526 | | | $ | 277 | | | $ | 16,889 | | | $ | 1,622 | | | $ | 1,085 | | | $ | 19,873 | | | | | | | $ | 51,399 | |
| (a) | Land includes land acquired for parks and recreation, building sites, infrastructure and other program use. It does not include land held for resale or Crown lands acquired by right. |
| (b) | The cost of buildings under capital leases is $194 million (2018: $192 million - restated). |
| (c) | Equipment includes SuperNet, vehicles, heavy equipment, fire protection equipment, office equipment and furniture, and other equipment. |
| (d) | Other tangible capital assets include leasehold improvements (amortized over the life of the lease). |
| (e) | Land improvements include parks development and grazing reserves. |
| (f) | Provincial highways and roads consist of original pavement, roadbed, drainage works and traffic control devices, and include secondary highways and bridges and some key arterial roadways within cities. Included in these numbers are $2,607 million in historical cost (2018: $2,479 million) and $291 million in accumulated amortization (2018: $245 million) for alternatively financed capital assets. |
| (g) | Dams and water management structures include dams, reservoirs, weirs, canals, dikes, ditches, channels, diversions, cut-offs, pump houses and erosion protection structures. Measurement uncertainty exists in the estimated useful life of dams and water management structures. |
| (h) | Historical costs include $5,425 million (2018: $5,262 million - restated) in construction in progress which will not be amortized until the tangible capital assets are completed and in use. |
| (i) | Transfers and adjustments relate to accounting policy alignments and reclassifications between capital asset categories. |
| | |
| CONSOLIDATED FINANCIAL STATEMENTS | | 65 |
| | |
| TANGIBLE CAPITAL ASSETS | | SCHEDULE 15 (continued) |
The Province’s net book value of tangible capital assets by ministry is as follows:
| | | | | | | | |
| | | 2019 | | | 2018 | |
| | | In | | | millions | |
Ministries | | | | | | | | |
Transportation | | $ | 20,168 | | | $ | 19,624 | |
Advanced Education (a) | | | 8,784 | | | | 8,621 | |
Health | | | 8,432 | | | | 8,092 | |
Education | | | 8,251 | | | | 8,068 | |
Infrastructure | | | 3,295 | | | | 3,237 | |
Environment and Parks | | | 1,657 | | | | 1,533 | |
Seniors and Housing | | | 1,038 | | | | 962 | |
Service Alberta | | | 709 | | | | 725 | |
Other | | | 591 | | | | 537 | |
| | | $ | 52,925 | | | $ | 51,399 | |
| (a) | Amount includes policy adjustment of $13 million (2018: $13 million). |
| | |
| ADJUSTMENTS TO NET ASSETS | | SCHEDULE 16 |
| | | | | | | | |
| | | 2019 | | | 2018 | |
| | | In | | | millions | |
Change in accumulated unrealized gains/(losses) (Schedule 8) | | $ | 166 | | | $ | (137 | ) |
Adjustment to tobacco tax | | | - | | | | 82 | |
Adjustment to deferred contributions | | | - | | | | 82 | |
Change in accounting policy (Schedule 8) | | | 56 | | | | - | |
Other | | | 85 | | | | (54 | ) |
| | | $ | 307 | | | $ | (27 | ) |
| | |
| 66 | | GOVERNMENT OF ALBERTA 2018—19 ANNUAL REPORT |
| | |
| OVER-EXPENDITURE OF SPENDING AUTHORITIES | | SCHEDULE 17 |
The authority of the Legislative Assembly is required before public monies from the General Revenue Fund can be to used to fund the operations of the Government. The 2018-19 Government Estimates identifies the total requirements for public monies from the General Revenue Fund for the year. Approvals are provided in the form of annually approved limits through appropriations . Appropriations may be created by an appropriation act or other statute. Appropriations under an appropriation act must be created pursuant to a supply vote or set of supply votes. Supply votes are divided along departmental lines. During the year, expenditures were made under the three general types of supply votes: Expense, Capital Investment and Financial Transactions.
Details about the source and disposition of authorities and the details of departmental expenditures are provided in each Ministry’s Annual Report.
An encumbrance is incurred when, on a vote by vote basis, the total of actual disbursements in the 2018-19 fiscal year exceed the total estimate . As required by the Financial Administration Act, these amounts must be charged against the voted appropriation for the year ending March 31, 2020.
During the year, three departments (2018: two) exceeded their supply votes as follows:
| | | | | | | | |
| | | Adjusted
voted
estimate | | Voted
actuals | | Over
expended | | Explanation |
| Departments | | | | | | In millions | | |
| | | | |
Children’s Services | | | | | | | | |
| | | | |
Operating expense | | $ 1,328.6 | | $1,334.3 | | $ (5.7) | | Additional disbursements related to the Foster Care Support and Child Intervention Services programs. |
| | | | |
Education | | | | | | | | |
| | | | |
Capital investment | | 123.0 | | 123.2 | | (0.2) | | Additional disbursements related to the School Facilities program. |
| | | | |
Transportation | | | | | | | | |
| | | | |
Capital investment | | 1,097.2 | | 1,117.5 | | (20.3) | | Additional disbursements related to Provincial Highway Construction projects. |
| | |
| CONSOLIDATED FINANCIAL STATEMENTS | | 67 |
| | |
| LISTING OF ORGANIZATIONS | | SCHEDULE 18 |
The financial results of the following entities are included in these financial statements:
GOVERNMENT COMPONENTS
Offices of the Legislative Assembly
Support to the Legislative Assembly
Office of the Auditor General
Office of the Ombudsman
Office of the Chief Electoral Officer
Office of the Election Commissioner (a)
Office of the Ethics Commissioner
Office of the Information and Privacy Commissioner
Office of the Child and Youth Advocate
Office of the Public Interest Commissioner
Departments
Advanced Education
Agriculture and Forestry
Children’s Services
Community and Social Services
Culture and Tourism
Economic Development and Trade
Education
Energy
Environment and Parks
Executive Council
Health
Indigenous Relations
Infrastructure
Justice and Solicitor General
Labour
Municipal Affairs
Seniors and Housing
Service Alberta
Status of Women
Transportation
Treasury Board and Finance
REGULATED FUNDS
Access to the Future Fund
Alberta Cancer Prevention Legacy Fund
Alberta Heritage Foundation for Medical Research Endowment Fund
Alberta Heritage Savings Trust Fund
Alberta Heritage Scholarship Fund
| | |
| 68 | | GOVERNMENT OF ALBERTA 2018–19 ANNUAL REPORT |
| | |
| LISTING OF ORGANIZATIONS | | SCHEDULE 18 (continued) |
Regulated Funds (continued)
Alberta Heritage Science and Engineering Research Endowment Fund
Alberta Lottery Fund
Alberta Risk Management Fund
Alberta School Foundation Fund
Climate Change and Emissions Management Fund
Environmental Protection and Enhancement Fund
Historic Resources Fund
Human Rights Education and Multiculturalism Fund
Land Stewardship Fund
Post-closure Stewardship Fund
Provincial Judges and Masters in Chambers Reserve Fund
Supplementary Retirement Plan Reserve Fund
Victims of Crime Fund
GOVERNMENT ORGANIZATIONS(c)
Agriculture Financial Services Corporation
Alberta Capital Finance Authority
Alberta Energy Regulator
Alberta Enterprise Corporation
Alberta Foundation for the Arts
Alberta Historical Resources Foundation
Alberta Innovates Corporation
Alberta Insurance Council
Alberta Investment Management Corporation
Alberta Pensions Services Corporation
Alberta Securities Commission
Alberta Social Housing Corporation
Alberta Sport Connection
Alberta Transportation Safety Board
Alberta Utilities Commission
Energy Efficiency Alberta
Gainers Inc.
Natural Resources Conservation Board
N. A. Properties (1994) Ltd.
Safety Codes Council
Travel Alberta Corporation
School Jurisdictions and Charter Schools
Almadina School Society
Aspen View Public School Division No. 78
Aurora School Ltd.
| | |
| CONSOLIDATED FINANCIAL STATEMENTS | | 69 |
| | |
| LISTING OF ORGANIZATIONS | | SCHEDULE 18 (continued) |
School Jurisdictions and Charter Schools (continued)
Battle River Regional Division No. 31
Black Gold Regional Division No. 18
Boyle Street Education Centre
Buffalo Trail Public Schools Regional Division No. 28
Calgary Arts Academy Society
Calgary Girls’ School Society
Calgary Roman Catholic Separate School District No. 1
Calgary School District No. 19
Canadian Rockies Regional Division No. 12
CAPE-Centre for Academic and Personal Excellence Institute
Chinook’s Edge School Division No. 73
Christ the Redeemer Catholic Separate Regional Division No. 3
Clearview School Division No. 71
Connect Charter School Society
East Central Alberta Catholic Separate Schools Regional Division No. 16
East Central Francophone Education Region No.3
Edmonton Catholic Separate School District No. 7
Edmonton School District No. 7
Elk Island Catholic Separate Regional Division No. 41
Elk Island Public Schools Regional Division No. 14
Evergreen Catholic Separate Regional Division No. 2
Foothills School Division No. 38
Fort McMurray Public School District No. 2833
Fort McMurray Roman Catholic Separate School District No. 32
Fort Vermilion School Division No. 52
Foundations for the Future Charter Academy Charter School Society
Golden Hills School Division No. 75
Grande Prairie Roman Catholic Separate School District No. 28
Grande Prairie School District No. 2357
Grande Yellowhead Public School Division No. 77
Grasslands Regional Division No. 6
Greater North Central Francophone Education Region No. 2
Greater St . Albert Roman Catholic Separate School District No. 734
High Prairie School Division No. 48
Holy Family Catholic Regional Division No. 37
Holy Spirit Roman Catholic Separate Regional Division No. 4
Horizon School Division No. 67
Lakeland Roman Catholic Separate School District No. 150
Lethbridge School District No. 51
Living Waters Catholic Regional Division No. 42
Livingstone Range School Division No. 68
Medicine Hat Roman Catholic Separate School District No. 21
| | |
| 70 | | GOVERNMENT OF ALBERTA 2018–19 ANNUAL REPORT |
| | |
| LISTING OF ORGANIZATIONS | | SCHEDULE 18 (continued) |
School Jurisdictions and Charter Schools (continued)
Medicine Hat School District No. 76
Mother Earth’s Children’s Charter School Society
New Horizons Charter School Society
Northern Gateway Regional Division No. 10
Northern Lights School Division No. 69
Northland School Division No. 61
Northwest Francophone Education Region No. 1
Palliser Regional Division No. 26
Parkland School Division No. 70
Peace River School Division No. 10
Peace Wapiti School Division No. 76
Pembina Hills Regional Division No. 7 (including Alberta Distance Learning Centre)
Prairie Land Regional Division No. 25
Prairie Rose School Division No. 8
Red Deer Catholic Regional Division No. 39
Red Deer Public School District No. 104
Rocky View School Division No. 41
St. Albert Public School District No. 5565
St. Paul Education Regional Division No. 1
St. Thomas Aquinas Roman Catholic Separate Regional Division No. 38
Sturgeon School Division No. 24
Southern Francophone Education No. 4
Suzuki Charter School Society
Valhalla School Foundation
Westmount Charter School Society
Westwind School Division No. 74
Wetaskiwin Regional Division No. 11
Wild Rose School Division No. 66
Wolf Creek School Division No. 72
Post-secondary Institutions
Alberta University of Arts (b)
Athabasca University
Banff Centre
Bow Valley College
Grande Prairie Regional College
Keyano College
Lakeland College
Lethbridge College
| | |
| CONSOLIDATED FINANCIAL STATEMENTS | | 71 |
| | |
| LISTING OF ORGANIZATIONS | | SCHEDULE 18 (continued) |
Post-secondary Institutions (continued)
MacEwan University
Medicine Hat College
Mount Royal University
NorQuest College
Northern Alberta Institute of Technology
Northern Lakes College
Olds College
Portage College
Red Deer College
Southern Alberta Institute of Technology
University of Alberta
University of Calgary
University of Lethbridge
Alberta Health Services and Other Health Entities
Alberta Health Services
Health Quality Council of Alberta
The following organizations are accounted for on the modified equity basis in these financial statements:
GOVERNMENT BUSINESS ENTERPRISES (c)
Alberta Gaming, Liquor and Cannabis Commission
Alberta Petroleum Marketing Commission
ATB Financial
Balancing Pool
Credit Union Deposit Guarantee Corporation
| | |
| | (a) The Office of the Election Commissioner was created on July 1, 2018 and operates under the authority of the Election Act and the Election Finances and Contributions Disclosure Act. |
| |
| | (b) Alberta College of Art and Design became Alberta University of Arts on February 1, 2019. |
| |
| | (c) Subsidiaries of government organizations and government business enterprises are not included in the list. |
| | |
| 72 | | GOVERNMENT OF ALBERTA 2018–19 ANNUAL REPORT |
Glossary (Unaudited)
| | | | |
Absolute return strategies: Absolute return strategies (hedge funds) encompass a wide variety of investments with the objective of realizing positive returns regardless of the overall market direction. A common feature of many of these strategies is buying undervalued securities and selling short overvalued securities. Some of the major types of strategies include long/short equity, merger arbitrage, fixed income arbitrage, macroeconomic strategies, convertible arbitrage, distressed securities and short selling. Accrued interest: Interest income that has been earned but not paid in cash at the financial statement date. Alternative investments: Investments considered outside of the traditional asset class of stocks, bonds and cash. Examples include hedge funds, private equities, private income, timberland and asset-backed commercial paper. Amortized cost: Amortized cost is the amount at which a financial asset or a financial liability is measured at initial recognition minus principal repayments, plus or minus the cumulative amortization using the effective interest method of any difference between that initial amount and the maturity amount, and minus any reduction (directly or through the use of an allowance account) for impairment or uncollectability. Ask price: The price that a seller is willing to accept for a security, also known as the offer price. Asset mix: The percentage of an investment fund’s assets allocated to major asset classes (for example 50% equities, 30% interest-bearing securities and 20% inflation sensitive and alternative investments). Bid price: The price that a buyer is willing to pay for a security. Cash equivalents: Cash equivalents are short-term, highly liquid investments that are readily convertible to known amounts of cash and that are subject to insignificant risk of changes in value. Cash equivalents are held for the purpose of meeting short-term cash commitments rather than for investing or other purposes. Credit risk: The risk that one party to a financial instrument will cause a financial loss for the other party by failing to discharge an obligation. | | | | Currency risk: The risk that the fair value or future cash flows of a financial instrument will fluctuate because of changes in foreign exchange rates. Debenture: A financial instrument showing a debt where the issuer promises to pay interest and repay the principal by the maturity date. It is usually unsecured, meaning there are no liens or pledges on specific assets. Debt servicing cost: Debt servicing cost consists of interest paid on various forms of government debt. Defined benefit pension plan: A pension plan that specifies either the benefits to be received by an employee, or the method of determining those benefits, such as a pension benefit equal to two percent of the average of the five highest consecutive years’ salary times the total years of service. Derecognition: The removal of previously recognized financial assets or financial liabilities from a government’s statement of financial position. Derivative contract: Financial contracts, the value of which is derived from the value of underlying assets, indices, interest rates, or currency rates. They usually give rise to a financial asset of one party and a financial liability or equity instrument of another party, require no initial net investment and are settled at a future date. A derivative contract has the following three characteristics: ∎ Its value changes in response to the change in a specified interest rate, equity index price, foreign exchange rate or credit rating, ∎ It requires no initial net investment or the initial investment is smaller than required for exposure to a similar investment market, except for cross currency swaps. Cross currency swaps can have an exchange of notional amounts at the start of the contract, the end of the contract, or both, and ∎ It is settled in the future. Discount: The difference between the price paid for a security and the security’s par or face value. Because price fluctuates with interest rates, price will differ from the face value. For example, if interest rates are higher than the coupon rate, then the security is sold at a discount. |
| | |
| CONSOLIDATED FINANCIAL STATEMENTS | | 73 |
Glossary (continued)
| | | | |
Emerging market: An economy in the early stages of development, with markets of sufficient size and liquidity and receptive to foreign investment. Endowment funds: Endowment funds generally are established by donor gifts and bequests to provide a permanent endowment, which is to provide a permanent source of income, or a term endowment, which is to provide income for a specified period. The principal restriction is that the original contribution should be maintained intact in perpetuity. The income generated from the endowments may or may not be restricted in how they are used. Fair value: The amount of consideration agreed upon in an arm’s length transaction between knowledgeable, willing parties who are under no compulsion to act. Fair value is similar to market value. Financial asset: Assets that could be used to discharge existing liabilities or finance future operations and are not for consumption in the normal course of operations. A financial asset could be cash, a right to receive cash or another financial asset from another party, a right to exchange financial instruments with another party under conditions that are potentially favourable or equity of another entity. First-in, first-out: A method of valuing inventory where the cost of the first goods purchased or acquired is the cost assigned to the first goods sold. Therefore, the cost allocated to the inventory items on hand at the end of the period is the cost of those items most recently acquired. Fixed income instrument: Interest-bearing instrument that provides a return in the form of fixed periodic payments and eventual return of principal at maturity, or money market instrument such as treasury bills and discount notes. Floating rate: An interest rate that is reset periodically, usually every couple of months or sometimes daily. Government business enterprise: A government organization that is a separate legal entity with the power to contract in its own name and that can sue and be sued; has been delegated the financial and operational authority to carry on a business; sells goods and services to individuals and organizations outside of the government reporting entity as its principal activity; and can, in the normal course of | | | | its operations, maintain its operations and meet its liabilities from revenues received from sources outside of the government reporting entity . Hedging: An activity designed to manage exposure to one or more risks. When management designates a hedging relationship, it must identify the specific items included in the hedging relationship, the risk that is being hedged, and the period over which the hedging relationship is intended to be effective. The designation of the hedging relationship is documented formally in the entity’s records when designation occurs . Interest rate risk: The risk that the fair value or future cash flows of a financial instrument will fluctuate because of future changes in market interest rates. Liquidity: The ease with which an asset can be turned into cash and the certainty of the value it will obtain. Liquidity risk: The risk of insufficient cash to meet financial commitments. This refers to a disruption in which funds cannot be raised in capital markets due to external forces. Modified equity: Under the modified equity method, the equity method of accounting is modified only to the extent that the government business enterprise’s accounting policies are not adjusted to conform with those of the government. Thus, the government aggregates a government business enterprise’s net assets and net income by adjusting the investment shown in the government’s statement of financial position and by presenting the net income as a separate item on the government’s statement of operations. Net realizable value: The selling price less the estimated costs of completion and costs necessary to make the sale. Non-financial assets: Assets that are acquired, constructed or developed and do not normally provide resources to discharge existing liabilities, but instead are normally employed to deliver government services; may be consumed in the normal course of operations; and are not for sale in the normal course of operations. Onerous contract: A contract in which the unavoidable costs of meeting the obligations under |
| | |
| 74 | | GOVERNMENT OF ALBERTA 2018–19 ANNUAL REPORT |
Glossary (continued)
| | | | |
the contract exceed the economic benefits expected to be received under it. Operational risk: The risk that results from internal human and system errors or inadequate processes and controls. Other-than-temporary loss: A significant or prolonged decline in the fair value of an investment below its carrying value is evidence of an other-than- temporary loss in value of an investment. Par value: A value set as the face or principal amount of a security, typically expressed as multiples of $100 or $1,000. Bondholders receive par value for their bonds at maturity. Power Purchasing Arrangements (PPAs): One of the mechanisms used by the Province to introduce competition into the supply of thermal electric power from regulated generating units. The PPAs were intended to allow the facility Owners of the power generating facilities a reasonable opportunity to recover their fixed and variable costs of generation while transferring the right to offer the output of the plants into the power pool to intermediaries (PPA Buyers) . The PPAs govern the relationship between the facility Owner and the PPA Buyer in a manner similar to a contract but are not negotiated contracts, they are statutory instruments imposed upon the parties by legislation. Prepaid expenses: An expenditure that is paid for in one accounting period, but which will not be entirely consumed until a future period. Consequently, it is carried on the government’s statement of financial position as an asset until it is consumed. Present value: Today’s value of one or more future cash payments, determined by discounting the future cash payments using interest rates. Price risk: The risk that the fair value or future cash flows of a financial instrument will fluctuate because of changes in market prices (other than those arising from interest rate risk or currency risk), whether those changes are caused by factors specific to the individual financial instrument or its issuer, or factors affecting all similar financial instruments traded in the market. Prior year expenditure refunds: When recoveries of overpayments occur in the current year that are related | | | | to an expenditure of prior years, the recovery is accounted for as revenue of the current year. Private equity: An ownership interest in a privately held company. Public private partnership (P3): A legally-binding contract between the Province and one or more public or private partners for the provision of assets and the delivery of services that allocates responsibilities and business risks among the various partners. Realized gains and losses: Gains or losses are realized when investments are sold at a price over or below its book value and selling costs. Refinancing risk: The risk that the fair value or future cash flows of a financial instrument will fluctuate due to refinancing. Segment: A distinguishable activity or group of activities of a government for which it is appropriate to separately report financial information to help users of the financial statements identify the resources allocated to support the major activities of the government. Settlement risk: The risk that arises from non-simultaneous payment exchanges (late or missed payments). Spent deferred capital contributions: Spent deferred capital contributions represent the total net book value of contributed tangible capital assets and the portion of capital funding that has been expended on acquisition of tangible capital assets. SUCH: It is an acronym for schools, universities, colleges and hospitals. Unspent deferred contributions: Unspent deferred contributions consist of two components: unspent deferred operating contributions and unspent deferred capital contributions. These unspent deferred contributions represent the funding received by the government and not yet used in accordance with relevant stipulations or restrictions. Yield curve: A graphic line chart that shows interest rates at a specific point for all securities having equal risk but different maturity dates. |
| | |
| CONSOLIDATED FINANCIAL STATEMENTS | | 75 |
Measuring Up
Table of Contents
Management’s Responsibility for Reporting
Responsibility for the integrity and objectivity of the performance results reported in the province’s annual performance report Measuring Up, a component of the Government of Alberta’s (GoA) Annual Report, rests with the government. Measuring Up is prepared by the Assistant Deputy Minister of Strategic and Business Services under the general direction of the Deputy Minister of Treasury Board and Finance as authorized by the President of Treasury Board and Minister of Finance pursuant to Section 8 of the Fiscal Planning and Transparency Act.
Under Section 8, the government is to prepare and make public on or before June 30 of each year an annual report for the Province of Alberta for the fiscal year ended on the preceding March 31. The annual report must include a comparison of the actual performance results to the targets included in the government strategic plan and an explanation of any significant variances. Measuring Up is published with the consolidated annual report of the Government of Alberta that forms part of the Public Accounts.
In order to meet government reporting requirements, the Assistant Deputy Minister of Strategic and Business Services obtains performance results relating to each ministry as necessary. Deputy heads in each ministry are responsible for maintaining management and internal control systems to ensure that the information provided by their ministry, including performance measure reporting and results reporting for key initiatives and activities, for presentation in Measuring Up is prepared in accordance with the following criteria:
Reliability – information used in applying performance measure methodologies agrees with underlying source data for the current and prior years’ results.
Understandability – the performance measure methodologies and results are presented clearly.
Comparability – the methodologies for performance measure preparation are applied consistently for the current and prior years’ results.
Completeness – outcomes, performance measures and related targets match those included in Budget 2018.
Annually, Measuring Up is tabled in the Legislature as a part of the Public Accounts and is referred to the Standing Committee on Public Accounts of the Legislative Assembly.
[Original signed by]
Athana Mentzelopoulos
Deputy Minister of Treasury Board and Finance
June 18, 2019
| | |
| 80 | | GOVERNMENT OF ALBERTA 2018–19 ANNUAL REPORT |
Readers’ Guide
Measuring Up 2019 provides performance results on government priorities, performance measures and indicators as identified in Budget 2018. Budget 2018 focused on economic recovery, diversifying the economy, protecting public services and returning to a balanced budget.
The 2018-21 Government of Alberta Strategic Plan, as part of Budget 2018, identified the following three strategic priorities and associated performance measures and indicators by which to assess the government’s performance over the 2018-19 fiscal year. Performance measures illustrate what progress is being achieved relative to the strategic priorities while indicators provide context and additional information about long-term desired outcomes.
Strategic Priority One: Diversifying the Economy
- Measure One: Sponsored Research Revenue
- Measure Two: Value of Alberta Enterprise Corporation Funds Invested
- Measure Three: Tourism Expenditures
- Measure Four: Value Added Agricultural Products
- Measure Five: Alberta’s Oil Sands Supply Share of Global Oil Consumption
Other measures:
- Alberta Investor Tax Credit Program
- Capital Investment Tax Credit Program
- Skills Training Program
- Environmentally Sustainable Agriculture Practices
- Electricity Generation from Renewables
- Energy Consumption
- Indicator One: Gross Domestic Product (GDP) Growth
- Indicator Two: Total Value of Exported Products Outside the US Market
Other indicators:
- Labour Force Participation Rate
- Licensing University Technology
- Alberta Immigrant Nominee Program
- Women’s Labour Force Participation Rate
- Market Access
- Regulatory Compliance (Alberta Energy Regulator)
- Total Greenhouse Gas Emissions
Strategic Priority Two: Protecting Vital Public Services
- Measure One: Access to Continuing Care Spaces
- Measure Two: Child Intervention Services
- Measure Three: Positive Outcomes for Women
Other measures:
- Employment Standards
- Post-Secondary Transition
- Unplanned Readmissions of Mental Health Patients
- Indicator One: Percentage of Children Receiving Child Intervention Services
- Indicator Two: Core Housing Need
Other indicators:
- Post-secondary Education
- Health Expenditures
Strategic Priority Three: Returning to Balance
- Measure One: Sustainable Operating Expense Growth
- Measure Two: Interprovincial Tax comparison
- Measure Three: Provincial Financial Wealth Ranking
Measuring Up 2019 provides a high-level overview of results achieved under the three priorities. Key performance measures and indicators have been selected for detailed presentation under the strategic priorities while tables at the end of the report contain the results of all 33 performance measures and indicators outlined in the 2018-21 Government of Alberta Strategic Plan.
Each of the three priorities in the strategic plan identified key initiatives and activities to be undertaken by government ministries. Results of these and additional performance measures and indicators, are reported in detail in ministry 2018-19 annual reports.
Readers should note that performance measures and indicators reported in Measuring Up 2019 do not represent the current state of government policy. As for new government policy and initiatives, it is anticipated that a new Government of Alberta Strategic Plan will be published in the fall of 2019 along with Budget 2019.
The following report contains high level results based on the 2018-21 Government of Alberta Strategic Plan, closing out the previous government’s mandate.
| | |
| 82 | | GOVERNMENT OF ALBERTA 2018–19 ANNUAL REPORT |
| | |
| Strategic Priority One | | Overview |
Diversifying the Economy
The following initiatives were undertaken by the former government in 2018-19:
| ∎ | | Petrochemical Diversification Program Round Two was meant to incent the construction of new and expanding petrochemical facilities that turn methane, ethane and propane feedstock into products that have more value than the raw materials in the province by providing $500 million in royalty credits. In November 2018, an additional $600 million was announced for the program, and the total available funding for PDP2 reached $1.1 billion in royalty credits. To date, two companies have been approved in January / February 2019 under the second round committing $150 million in royalty credits. |
| ∎ | | The Alberta Investors Tax Credit (AITC) program, introduced in January 2017, received investments totaling $166 million from over 1,850 investors and seven Venture Capital Corporations investing in 150 Alberta-based small and medium sized enterprises. The AITC tax credit was available to investors who provided equity capital to Alberta small businesses doing research, development or commercialization of new technology, new products or new processes. |
| ∎ | | The Capital Investment Tax Credit promotes investment in capital-intensive industries. The program provides a 10 per cent tax credit, with a $5 million tax credit cap. |
| ∎ | | The Interactive Digital Media Tax Credit (IDMTC), announced in March 2018, provides a refundable 25 per cent tax credit on eligible salary and wage expenditures to companies that develop Interactive Digital Media (IDM) products in Alberta. It also provides an additional five per cent tax credit to companies that hire people from underrepresented groups. |
| ∎ | | The Enhanced Hydrocarbon Recovery Program came into effect on January 1, 2017. |
| ∎ | | In February 2019, the government decided to contract $3.7 billion to increase rail capacity to transport Alberta’s oil to markets. |
| | |
| Strategic Priority One | | Performance Measures and Indicators |
For other measures and indicators that provide results and variance analysis related to Diversifying the Economy, please see Ministry Annual Reports for 2018-19.
Performance Measure One: Sponsored Research Revenue
Sponsored research revenue attracted by Alberta’s academic and research institutions ($millions)
| | |
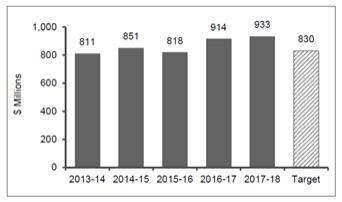
| | ∎ The research conducted at Alberta’s academic and research institutions is fundamental to Alberta’s innovation system and its success in the global knowledge-driven economy. ∎ Total sponsored research revenue over the past 10 years shows an upward trend, with an average yearly increase of 2.7 per cent over that time. Total sponsored research revenue for the 2017-18 fiscal year was $933 million, an approximate two per cent increase from 2016-17. |
|
Source: Comprehensive Academic Research Institutions, collected by Ministry of Economic Development, Trade and Tourism
For additional sources and notes see page 98
Performance Measure Two: Value of Alberta Enterprise Corporation Funds Invested
Cumulative value of Alberta Enterprise Corporation (AEC) funds (venture capital funds and their syndicate partners) invested in Alberta businesses ($millions)
| | |
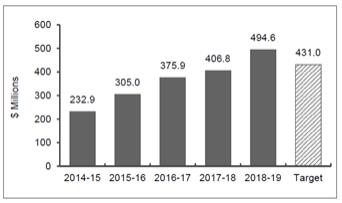
| | ∎ AEC funds and their syndicate partners have invested over $494.6 million in 42 Alberta technology companies as of March 31, 2019. ∎ The number of new funds can be influenced by various financial, external, and competitive factors. |
|
Source: Alberta Enterprise Corporation and Ministry of Economic Development, Trade and Tourism
For additional sources and notes see page 99
| | |
| 84 | | GOVERNMENT OF ALBERTA 2018–19 ANNUAL REPORT |
Strategic Priority One | Performance Measures and Indicators |
Performance Measure Three: Tourism Expenditures
Total tourism expenditures in Alberta ($billions)
| | |
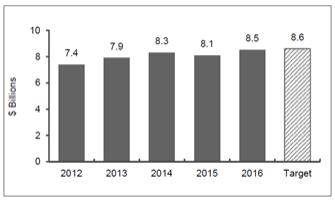 | | ∎ More than 34.7 million person-visits were made to Alberta in 2016, and these visitors spent $8.5 billion. ∎ Many factors contributed to Alberta’s increase in tourism expenditures performance in 2016, including Travel Alberta brand/marketing efforts, improved air access from selected markets, a favourable exchange rate (for international visitors), cheaper gasoline prices (for domestic visitors), and the perception of Canada as a safe tourism destination. Competition from other tourism destinations and the impact of their marketing campaigns also impacts results. |
|
Source: Statistics Canada Travel Survey of Residents of Canada, the International Travel Survey and the Ministry of Economic Development, Trade and Tourism
Note(s): The 2014-15 result was revised based on final data from Statistics Canada for the International Travel Survey. The 2016-17 result is not directly comparable to previous results due to a change in how expenditures by international visitors were identified. Due to revisions by Statistics Canada, results for 2017 will not be available before July 2019.
For additional sources and notes see page 99
Performance Measure Four: Value-added Agricultural Products
Number of value-added agriculture products developed and successfully introduced into market with assistance from the Government of Alberta
| | |
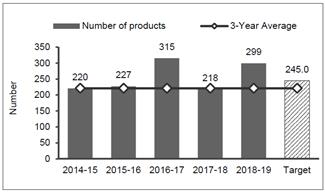 | | ∎ In 2018-19, a total of 299 new value-added agriculture products were developed and successfully introduced to market with assistance from Ministry of Agriculture and Forestry. The actual result is 22 per cent above the forecasted target and is 37 per cent above the prior year’s results. |
Source: Ministry of Agriculture and Forestry
For additional sources and notes see page 100
| | |
| Strategic Priority One | | Performance Measures and Indicators |
Performance Measure Five: Alberta’s Oil Sands Supply Share of Global Oil Consumption
Alberta’s oil sands supply of global oil consumption
| | |
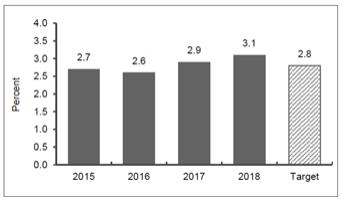
| | ∎ From 2017 to 2018, the share of mined production within the province’s total crude bitumen production profile increased from 45 per cent to 48 per cent, while the share of in-situ bitumen decreased from 55 per cent to 52 per cent. ∎ The oil sands industry in Alberta has been significantly affected by the decline in oil prices that occurred in late 2014. Oil prices significantly declined in late 2014 and remained relatively low throughout 2015 and 2016. |
|
Source: Ministry of Energy
For additional sources and notes see page 101
Performance Indicator One: Gross Domestic Product
Percentage of manufacturing, business and commercial services growth in Alberta
| | |
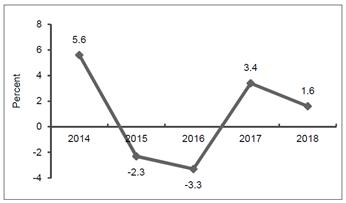
| | ∎ Various external factors affect GDP growth in Alberta, including the health of the United States’ and global economies, the level of energy prices, the level of other natural resource and commodity prices, and the balance between the supply and demand of labour. |
|
Source: Statistics Canada’s CANSIM table 379-0030 – Gross domestic product (GDP) at basic prices, by North American Industry Classification System (NAICS), provinces and territories
Note(s): Statistics Canada periodically revises its previously posted data, which accounts for some data changes from data reported in previous years. In November 2017, Statistics Canada revised the data for years 2014, 2015, 2016.
For additional sources and notes see page 103
| | |
| 86 | | GOVERNMENT OF ALBERTA 2018–19 ANNUAL REPORT |
Strategic Priority One | Performance Measures and Indicators |
Performance Indicator Two: Total Value of Alberta’s Exported Products
Outside of the United States
Includes all products that are exported globally but not exported to the United States
| | |
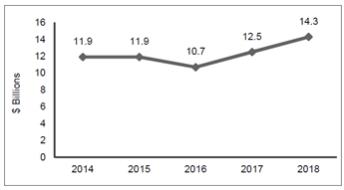 | | ∎ Alberta international goods exports, not to the US, increased 14.7 per cent in 2018 to $14.3 billion, as did exports to most of Alberta’s major trading partners. ∎ Over the past five years, the percentage of the value of goods exported to partners other than the US has varied from a low of 12.65 per cent to a high of 16.78 per cent in 2018. |
|
Source: Statistics Canada CANSIM table 383-0038 – Gross domestic product, expenditure-based, provincial and territorial, Industry Canada and the Ministry of Economic Development, Trade and Tourism
For additional sources and notes see page 105
| | |
| Strategic Priority Two | | Overview |
Protecting Vital Public Services
The following initiatives were undertaken by the former government in 2018-19:
| ∎ | | There was work on many major infrastructure projects in 2018-19, as construction continued on projects such as the Calgary Cancer Centre, Medicine Hat Regional Hospital renovations, Fort McMurray Residential Facility Based Care, and the Chinook Regional Hospital redevelopment in Lethbridge, while planning work continued for projects such as the new Edmonton hospital, a child and adolescent mental health facility at the Royal Alexandra Hospital, and the Misericordia Hospital emergency department renovations. A redeveloped maternity care unit at the Peter Lougheed Centre in Calgary and new wing at the Medicine Hat Regional Hospital opened in 2018-19. |
| ∎ | | Direct funding was provided to post-secondary institutions for mental health services on campus. |
| ∎ | | As of March 31, 2019, 24 of the 26 publicly funded post-secondary have policies in place to address sexual violence. |
| ∎ | | The province continued to implement the Child Intervention Practice Framework (CIPF). The CIPF sets the foundation for child intervention practice initiatives including Signs of Safety, Family Finding, and Practice Strategies for Lifelong Connection. |
| ∎ | | The Early Learning and Child Care Centre initiative was expanded. |
| | |
| 88 | | GOVERNMENT OF ALBERTA 2018–19 ANNUAL REPORT |
| | |
| Strategic Priority Two | | Performance Measures and Indicators |
|
For other measures and indicators that provide results and variance analysis related to Protecting Vital Public Services, please see Ministry Annual Reports for 2018-19. |
Performance Measure One: Access to Continuing Care Spaces
Percentage of clients placed in continuing care within 30 days of being assessed
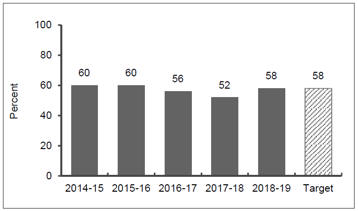
Source: Alberta Health Services. Data are extracted from Meditech and Stratahealth Pathways
For additional sources and notes see page 107
Performance Measure Two: Child Intervention Services
Percentage of non-Indigenous children and youth who did not return for additional services within 12 months
| | |
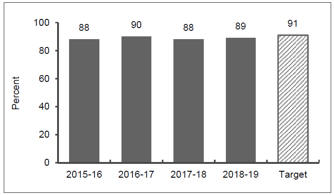 | | ∎ In 2018-19, 89 per cent of non-indigenous children and youth with a new child intervention file did not have a file closure in the previous 12 months. ∎ The results have been stable at around 88 per cent over the last four fiscal years. The province supports healthy families by offering targeted services and community-based supports so children can safely remain at home, whenever possible. ∎ The province continues to build on preventive approaches and implementation of reforms in the child intervention system, addressing the conditions that bring children into care and promoting collaborative solutions to support child safety and well-being. |
Source: Ministry of Children’s Services, Child Intervention Case Information Online System (CICIO)
Note(s): Includes children and youth that are in-care and not-in-care.
For additional sources and notes see page 107
| | |
| Strategic Priority Two | | Performance Measures and Indicators |
Performance Measure Three: Positive Outcomes for Women
Percentage of grant recipients reporting positive outcomes for women and girls, as a result of their project
| | |
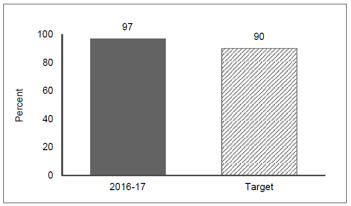 | | ∎ Government administered a Community Grant Program that provided one-time funding to civil society organizations for projects and activities that improve the lives of women and girls in Alberta. |
Source: Status of Women Final Grant Reports
For additional sources and notes see page 108
Performance Indicator One:
Child Intervention Services as a Percentage of the Child Population
| | |
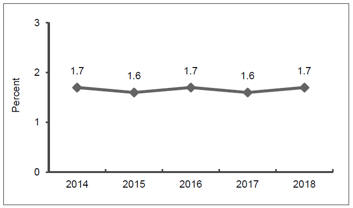 | | ∎ Child intervention services address issues that affect the safety and well-being of children and youth such as abuse, neglect, family violence, and exposure to addictions. ∎ In 2018, 16,123 children and youth received child intervention services. This is 1.7 per cent of the total child population in Alberta. |
Source: Ministry of Children’s Services. Child Intervention Case Information Online (CICIO) system, Statistics Canada, table 17-10-0005-01 Population estimates on July 1st, by age and sex
Note(s): The reported number of children receiving child intervention services is subject to change as source information is entered into the system. Only children and youth whose file closure occurred prior to their 18th birthday are included.
For additional sources and notes see page 110
| | |
| 90 | | GOVERNMENT OF ALBERTA 2018–19 ANNUAL REPORT |
| | |
| Strategic Priority Two | | Performance Measures and Indicators |
Performance Indicator Two: Core Housing Need
Percentage of Alberta households in core housing need
| | |
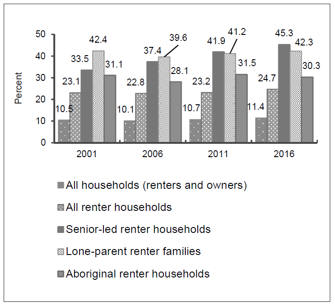 | | ∎ A household is in core housing need if its housing is unsuitable, inadequate or unaffordable, and if it cannot pay the median rent of alternative local housing that meets all three criteria. ∎ Among all households, approximately 11 per cent are considered to be in core housing need, but this number rises to nearly 25 per cent when only considering renter households. Within lone parent renter families, it is observed that 42 per cent are in core housing need, a number that has remained stable. Senior-led renter households in core housing need have increased from 33 per cent in 2001 to 45 per cent in 2016. Among Aboriginal renter households living off-reserve, 30 per cent are considered in core housing need. ∎ Amendments have been made to the Social Housing Accommodation Regulation to better prioritize Albertans with the greatest need and help ensure they are able to access the housing they require. |
|
Source: Canada Mortgage and Housing Corporation (CMHC), table: Characteristics of Households in Core Housing Need: Canada, Provinces, Territories, Census Metropolitan Areas, 2001, 2006, 2011 and 2016
For additional sources and notes see page 110
| | |
| Strategic Priority Three | | Overview |
Returning to Balance
There has not yet been a return to balance.
| | |
| Strategic Priority Three | | Performance Measures and Indicators |
| | |
For other measures and indicators that provide results and variance analysis related to Returning to Balance, please see Ministry Annual Reports for 2018-19. |
Performance Measure One: Sustainable Operating Spending Growth
| | |
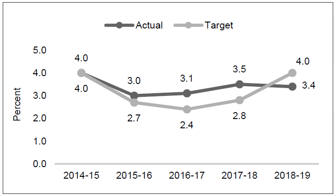 | | ∎ Operating expense was slightly lower than the population plus CPI growth, primarily due to lower-than-expected spending in the Ministry of Health because of higher-than-anticipated savings from the a new agreement with Alberta’s pharmacists, a new pricing agreement with Canada’s generic drug industry and product listing agreement cost recoveries, and delays in opening continuing care beds. Lower agriculture indemnities in the Ministry of Agriculture and Forestry and staff vacancies across government also contributed to the variance. ∎ Going forward, there will not be these types of favorable variances for drugs. |
|
Source: Growth in operating expense, population and inflation is calculated by Alberta Treasury Board and Finance
Note(s): Growth in operating expense is calculated based on data taken from the Government of Alberta’s 2018-19 Final Results Year-End Report. Population growth is calculated by taking the annual change in population at the midpoint of the fiscal year (October 1). Inflation is the year over year growth in the average of the Alberta Consumer Price Index over the fiscal year (April to March). Operating expense excludes Climate Leadership Plan.
For additional sources and notes see page 111
| | |
| 92 | | GOVERNMENT OF ALBERTA 2018–19 ANNUAL REPORT |
| | |
| Strategic Priority Three | | Performance Measures and Indicators |
Performance Measure Two: Interprovincial Tax Comparison
Alberta’s Tax Advantage: interprovincial tax comparison ranking among provinces
| | |
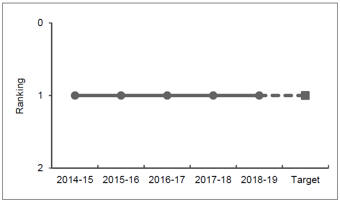 | | ∎ In 2018-19, Alberta had the lowest overall taxes among the provinces in Canada, with no sales tax, no health premium and no payroll tax. |
|
Source: Alberta Treasury Board and Finance
Note(s): Alberta’s tax advantage is an estimate of the total additional provincial taxes and carbon charges that individuals and businesses would pay if Alberta had the same tax system and carbon charges as other provinces.
For additional sources and notes see page 111
Performance Measure Three: Provincial Financial Wealth Ranking
The total value of government’s financial assets minus the total value of outstanding liabilities, compared with all provinces on per capita basis
| | |
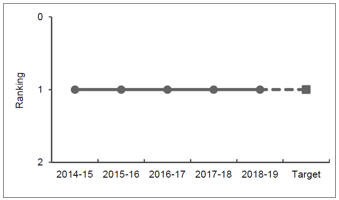 | | ∎ Net debt (financial debt less financial assets) is widely considered to be the best measure for cross-jurisdictional comparisons of government financial health. ∎ Alberta continues to maintain its ranking among provinces in terms of net debt per capita. ∎ According to preliminary data for 2018-19, Alberta’s net debt was $6,450 per capita, the lowest among provinces and about one-third of the ten-province average of $18,060 per capita. |
|
Source: Alberta Treasury Board and Finance
Note(s): Balance sheet measure that shows the Government of Alberta’s ability, comparing to other provinces, to meet its debt obligations. It measures the government’s financial resilience.
For additional sources and notes see page 111
Performance Measures/Indicators by Strategic
The following tables include all performance measures and indicators identified in the 2018-21 Government of Alberta Strategic Plan, both the measures and indicators analyzed in this report on pages 84–87, 89–93 and others identified in the GoA Strategic Plan.
Strategic Priority One – Diversifying the Economy
| | | | | | |
| | | | |
| Strategic Priority One Performance Measures | | Previous Results | | Targets 2018-19 | | Current Results |
| | | | |
Alberta Investor Tax Credit Program (AITC) | | | | | | |
| | | | |
Total annual investment raised ($ millions) | | 93.8 | | 102.0 | | 72.5 |
| | | (2017-18) | | | | (2018-19) |
| | | | |
Capital Investment Tax Credit Program (CITC) | | | | | | |
| | | | |
Total annual investment raised ($ millions) | | 1,217 | | 370 | | 984 |
| | | (2017-18) | | | | (2018-19) |
| | | | |
Sponsored Research Revenue | | | | | | |
| | | | |
Sponsored research revenue attracted by Alberta’s comprehensive academic and research institutions ($ millions) | | 914 | | 830 | | 933 |
| | (2016-17) | | | | (2017-18) |
| | | | |
Value of Alberta Enterprise Corporation Funds Invested (AEC) | | | | | | |
| | | | |
Cumulative value of AEC (and their syndicate partners) funds investment in Alberta businesses ($ millions) | | 406.8 | | 431.0 | | 494.6 |
| | (2017-18) | | | | (2018-19) |
| | | | |
Tourism Expenditures | | | | | | |
| | | | |
Total tourism expenditures in Alberta ($ billions) | | 8.1 | | 8.6 | | 8.5 |
| | | (2015) | | | | (2016) |
| | | | |
Skills Training Program | | | | | | |
| | | | |
Percentage of training-for-work clients reporting they are either employed or in further education or training after leaving a skills training program | | 66.7% | | 70% | | 71.9% |
| | (2017-18) | | | | (2018-19) |
| | | | |
Value-Added Agricultural Products | | | | | | |
| | | | |
Number of value-added agriculture products developed and successfully introduced into market with assistance from Agriculture and Forestry | | 218 | | 245 | | 299 |
| | (2017-18) | | | | (2018-19) |
| | | | |
Environmentally Sustainable Agriculture Practices | | | | | | |
| | | | |
Average percentage of improved environmentally sustainable agriculture practices adopted by producers (biennial survey) | | 55 | | n/a | | 53 |
| | (2015-16) | | | | (2017-18) |
| | | | |
Alberta’s Oil Sands Supply Share | | | | | | |
| | | | |
Alberta’s oil sands supply share of global oil consumption | | 2.9% | | 2.8% | | 3.1% |
| | | (2017) | | | | (2018) |
| | | | |
Electricity Generation from Renewables | | | | | | |
| | | | |
Percentage of electricity produced in Alberta from renewable sources (megawatts) | | 9.91% | | 30% of | | 9.64% |
| | (2017) | | electricity generation from renewables by 2030 | | (2018) |
| | | | |
Energy Consumption | | | | | | |
| | | | |
Energy consumption intensity megajoules per gross square metre in government-owned and operated facilities | | 1,649 | | 1,642 | | 1,608 |
| | (2017-18) | | | | (2018-19) |
See page 98–106 for sources and notes.
| | |
| 94 | | GOVERNMENT OF ALBERTA 2018–19 ANNUAL REPORT |
Strategic Priority One – Diversifying the Economy, continued
| | | | | | | | | | |
Strategic Priority One Performance Indicators | | | | | | | | | | |
| | | | | | |
Labour Force Participation Rate | | 2014 | | 2015 | | 2016 | | 2017 | | 2018 |
| | | | | | |
Rate of: | | | | | | | | | | |
| | | | | | |
• All Albertans (aged 25-64) | | 84.2% | | 84.3% | | 84.2% | | 84.5% | | 84.8% |
• Indigenous Albertans living off-reserve (aged 25-64) | | 78.5% | | 76.6% | | 78.9% | | 76.6% | | 76.3% |
• Alberta’s immigrant population (aged 25-64) | | 83.6% | | 83.6% | | 83.6% | | 84.1% | | 85.0% |
• Alberta youth (aged 15-24) | | 67.4% | | 68.6% | | 67.6% | | 66.4% | | 64.3% |
| | | | | | |
Gross Domestic Product (GDP) Growth | | 2014 | | 2015 | | 2016 | | 2017 | | 2018 |
| | | | | | |
Percentage of manufacturing, business and commercial services GDP growth in Alberta | | 5.6% | | -2.3% | | -3.3% | | 3.4% | | 1.8% |
| | | | | | |
Licensing University Technology | | 2012 | | 2913 | | 2014 | | 2015 | | 2016 |
| | | | | | |
Start-ups licensing university technology per million population | | 4.6 | | 5.2 | | 6.9 | | 8.4 | | 9.1 |
| | | | | | |
Alberta Immigrant Nominee Program | | 2013 | | 2014 | | 2015 | | 2016 | | 2017 |
| | | | | | |
Percentage of Alberta Immigrant Nominee Program nominees surveyed who report that they are still residing and working in Alberta one year after obtaining permanent residency | | 88.5% | | 83.9% | | 85.8% | | 86.3% | | 85.7% |
| | | | | | |
Women’s Labour Force Participation in Alberta | | 2014 | | 2015 | | 2016 | | 2017 | | 2018 |
| | | | | | |
• All women | | 66.2% | | 66.6% | | 66.3% | | 66.2% | | 66.1% |
• Aboriginal women (off-reserve) | | 66.7% | | 65.6% | | 63.4% | | 63.6% | | 61.0% |
| | | | | | |
Total Value of Alberta’s Exported Products Outside of United States | | 2014 | | 2015 | | 2016 | | 2017 | | 2018 |
| | | | | | |
Includes products that are not exported to the United States | | $11.9 | | $11.9 | | $10.7 | | $12.5 | | $14.3 |
| | | | | | |
Market Access | | 2014 | | 2015 | | 2016 | | 2017 | | 2018 |
| | | | | | |
Total percentage of natural gas leaving Alberta | | 65% | | 63% | | 62% | | 60% | | 57% |
| | | | | | |
Regulatory Compliance | | 2014-15 | | 2015-16 | | 2016-17 | | 2017-18 | | 2018-19 |
| | | | | | |
Alberta Energy Regulator (AER) | | | | | | | | | | |
Percentage of inspections that are in compliance with regulatory requirements | | 99% | | 99% | | 99% | | 99% | | 99% |
| | | | | | | | | | |
| | | | | | |
Total Greenhouse Gas Emissions | | 2013 | | 2014 | | 2015 | | 2016 | | 2017 |
| | | | | | |
Total million tonnes of CO2 equivalent (greenhouse gas) emitted | | 271 | | 276 | | 275 | | 264 | | 273 |
See page 98–106 for sources and notes.
Strategic Priority Two – Protecting Vital Public Services
| | | | | | |
| | | | |
| Strategic Priority Two Performance Measures | | Previous Results | | Targets 2018-19 | | Current Results |
| | | | |
Post-secondary Transition | | | | | | |
| | | | |
Percentage of students entering post-secondary programs (including apprenticeship) within six years of entering grade 10 | | 57.9% | | 60.2% | | 58.7% |
| | (2015-16) | | | | (2016-17) |
| | | | |
Unplanned Readmissions of Mental Health Patients | | | | | | |
| | | | |
| Percentage of clients readmitted within 30 days of leaving hospital | | 8.8% | | 8.6% | | 9.8% |
| | | (2017-18) | | | | (2018-19) |
| | | | |
Access to Continuing Care Spaces | | | | | | |
| | | | |
| Percentage of clients placed in continuing care within 30 days of being assessed | | 52% | | 58% | | 58% |
| | (2017-18) | | | | (2018-19) |
| | | | |
Child Intervention Services | | | | | | |
| | | | |
Percentage of non-Indigenous children and youth who did not return for additional services within 12 months | | 88% | | 91% | | 89% |
| | (2017-18) | | | | (2018-19) |
| | | | |
Positive Outcomes for Women | | | | | | |
| | | | |
Percentage of grant recipients reporting positive outcomes for women and girls, as a result of their project | | n/a | | 90% | | 97% |
| | | | | | (2016-17) |
| | | | |
Employment Standards | | | | | | |
| | | | |
Percentage of employment standards complaints resolved using mediation, settlement, compromise or other voluntary means | | 82% | | 84% | | 81% |
| | (2017-18) | | | | (2018-19) |
See page 106–111 for sources and notes.
| | | | | | | | | | |
Strategic Priority Two Performance Indicators | | | | | | | | | | |
| | | | | | |
Post-secondary Education | | 2014 | | 2015 | | 2016 | | 2017 | | 2018 |
| | | | | | |
Percentage of Albertans age 18-34 participating in post-secondary education | | 17% | | 17% | | 17% | | 18% | | 17% |
| | | | | | |
Children Receiving Child Intervention Services as a Percentage of the Child Population in Alberta | | 2014 | | 2015 | | 2016 | | 2017 | | 2018 |
| | | | | | |
• Percentage | | 1.7% | | 1.6% | | 1.7% | | 1.6% | | 1.7% |
• Number of children receiving Child Intervention Services | | 15,636 | | 14,834 | | 15,564 | | 15,624 | | 16,123 |
• Children in Alberta | | 900,381 | | 919,922 | | 938,410 | | 949,448 | | 962,327 |
| | | | | | |
Core Housing Need | | | | 2001 | | 2006 | | 2011 | | 2016 |
| | | | | | |
| Percentage of Alberta rental households in core housing need: | | | | | | | | | | |
| | | | | | |
• All households (renters and owners) | | | | 10.5% | | 10.1% | | 10.7% | | 11.4% |
| | | | | | |
• All rental households | | | | 23.1% | | 22.8% | | 23.2% | | 24.7% |
| | | | | | |
• Senior-led households | | | | 33.5% | | 37.4% | | 41.9% | | 45.3% |
| | | | | | |
• Lone-parent families | | | | 42.4% | | 39.6% | | 41.2% | | 42.3% |
| | | | | | |
• Aboriginal households | | | | 31.1% | | 28.1% | | 31.5% | | 30.3% |
| | | | | | |
Health Expenditures | | 2014 | | 2015 | | 2016 | | 2017 | | 2018 |
| | | | | | |
Per capita provincial government expenditures ($ nominal dollars) | | $4,677 | | $4,813 | | $4,912 | | $5,004 | | $5,097 |
See page 106–111 for sources and notes.
| | |
| 96 | | GOVERNMENT OF ALBERTA 2018–19 ANNUAL REPORT |
Strategic Priority Three – Returning to Balance
| | | | | | |
| | | | |
| Strategic Priority Three Performance Measures | | Previous Results | | Targets 2018-19 | | Current Results |
| | | | |
Sustainable Operating Spending Growth | | | | | | |
| | | | |
Sustainable operating spending growth (operating spending relative to population plus CPI)) | | 3.5% (Operating spending growth) 2.8% (CPI plus population) | | 4.0% (CPI plus population) | | 3.4% (Operating spending growth) (2018-19) |
| | | | |
Interprovincial Tax Comparison | | | | | | |
| | | | |
• Alberta’s ranking | | #1 | | #1 | | #1 |
| | | (2017-18) | | | | (2018-19) |
| | | | |
Interprovincial government financial wealth comparison | | | | | | |
| | | | |
• Alberta ranking | | #1 | | #1 | | #1 |
| | | (2017-18) | | | | (2018-19) |
See page 111 for sources and notes.
Performance Measures and Indicators – Sources and Notes
Strategic Priority One: Diversifying the Economy
Alberta Investor Tax Credit Program
Source: Economic Development Trade and Tourism Client (EDTT) Relationship Management System
Note(s): The total investment raised for Alberta Investor Tax Credit Program (AITC) is tracked in the Client Relationship Management (CRM) system at EDTT. Data is provided and stored through a web based portal and in a variety of methods, including the CRM system, excel spreadsheets and drafted reports. Investments in AITC are made by individuals and corporations into eligible businesses. The investment values are pulled from CRM for all investors who have received tax credits and are summed to find a total value. The annual investment raised is calculated in two ways. The first being a sum of the actual investments raised for each project over the course of a fiscal year, and the second being a projected raise calculated by dividing the tax credit amounts for the fiscal year by 30%. The table is also divided into two sources of funding, the Alberta Jobs Plan and the Climate Change Innovation and Technology Framework (CCITF). The total annual investment raised is the sum of investment raised from these two sources.
Capital Investment Tax Credit Program
Source: Economic Development Trade and Tourism Client Relationship Management System
Note(s): The total investment raised for CITC is tracked in the Client Relationship Management (CRM) system. Corporations invest in qualified properties. The investment values are pulled from CRM for all of the corporations who have received conditionally approved tax credits, and are summed to find a total value. In order to determine the leveraged ratio, first the total tax credits issued, or conditionally approved, for each program are calculated. This is done by adding all of the tax credits issued to each investor or corporation. The investment total is then divided by the tax credit total to find a ratio between them. This value represents the investment spur due to the tax credits provided.
Sponsored Research Revenue
Source: Comprehensive Academic Research Institutions collected by Ministry of Economic Development Trade and Tourism (EDTT)
Note(s): Sponsored research revenue data are collected from the Comprehensive Academic and Research Institutions (CARIs). The CARIs submit the data using a template and guidelines which outline the information required and specific instructions regarding how the revenue should be reported. The guidelines provided to the CARIs by EDTT were developed to augment the guidelines in place for corresponding annual reporting submissions by the CARIs to the Canadian Association of University Business Officers (CAUBO) to report on total sponsored research revenue at Alberta universities. CARIs are required to follow the CAUBO reporting guidelines for the appropriate year. The CARIs derive the data from audited financial statements and supplementary schedules. The reported data is compiled and analyzed by EDTT in the Research Funding at Alberta’s Comprehensive Academic and Research Institutions report.
| | |
| 98 | | GOVERNMENT OF ALBERTA 2018–19 ANNUAL REPORT |
Sources and Notes, continued
Value of Alberta Enterprise Corporation (AEC) Funds Invested
Source: Alberta Enterprise Corporation
Note(s): The result is reported to the Government of Alberta by AEC as required by the legislation (Alberta Enterprise Corporation Act, S. 14 Disclosure of Information), and the Transfer Agreement (S. 16 Reporting Requirements). The number reported here is collected from the last available AEC Annual Report, which was AEC Annual Report 2017-18, published in July 2018.
Tourism Expenditures
Source: Statistics Canada Travel Survey of Residents of Canada, the International Travel Survey, and the Ministry of Culture and Tourism
Note(s): The Travel Survey of Residents of Canada measures the size of domestic travel in Canada and provides information about the volume of trips and expenditures for Canadian residents. It is a sample survey run as a voluntary supplement to the Labour Force Survey. Respondents are randomly selected and asked to respond to the travel survey questionnaire. The International Travel Survey provides statistics on travellers to and from Canada using mail-back questionnaires, e-questionnaires, the Air Exit Survey as well as Frontier Counts. Both surveys are undertaken by Statistics Canada and sponsored by the Canadian Tourism Commission, Statistics Canada, provincial/territorial tourism agencies and other federal government departments. The 2015 result (2016-17) is not directly comparable to previous results due to change in how expenditures by international visitors were identified. This year, all provinces and territories jointly made a decision to use only direct information from the International Travel Survey for the 2015 (2016-17) reference year, due to the travel and trip detail available from the survey. In previous years, data management and harmonization procedures were applied to the International Travel Survey data to better identify expenditures by international visitors. In 2016-17, Alberta led a Canada-wide cross-provincial pilot project to improve the information available about international tourism. Discussions are also underway with Statistics Canada on how to better collect data on international tourism for future years. The 2013 (2014-15) result was revised based on final data from Statistics Canada for the International Travel Survey. There were no changes in methodology for the 2016 (2017-18) reference year. Due to revisions by Statistics Canada, results for 2017 (2018-19) will not be available before July 2019.
Skills Training Program
Source: Work Outcomes Reporting Project Survey and Ministry of Labour and Immigration
Note(s): Results for this measure are obtained through the Work Outcomes Reporting Project Survey. An independent consultant is contracted to contact former program participants three months after they have left a skills training programs delivered by the Ministry of Labour. WORP uses a census approach for Ministry of Labour clients who have attended skills training programs, meaning all clients having taken these programs will be contacted for inclusion in the survey.
The results for this measure are calculated based on the clients who have participated in Labour and Immigration’s Skills Training programs and were surveyed between January and December 2018. As surveys are conducted three months after an individual leaves their program, this survey period corresponds to those who left between September 1, 2017 and August 31, 2018. The percentage of Skills Training participants employed post-intervention is determined using the following questions, “What is your current
Sources and Notes, continued
main activity? Are you Employed, Self- Employed, In School/Training, Unemployed, Retired?” The responses that indicate that the participant is employed (including self-employed) or in school (i.e. further education) or training are weighted and used to calculate the measure result. The sample size for the 2018 result is 1,400. The margin of error is 2.62, at the 95 per cent level of confidence. With a result of 71.89 per cent (rounded to 71.9 per cent), we are confident that the population percentage lies between 69.27 per cent and 74.51 per cent, 19 times out of 20. Historical results have been restated to accurately reflect skills training programs delivered by Labour.
Value-added Agriculture Products
Source: Ministry of Agriculture and Forestry
Note(s): The result for this measure is the total number of written confirmations provided by industry clients for products that were developed with assistance from the Ministry of Agriculture and Forestry and successfully introduced to market.
At year-end, each industry client is asked to provide a written confirmation (or declaration) to verify all new value-added products that were developed with assistance from the ministry and successfully introduced to market. Each industry client self-declares the following information: name of processing company; name of product(s), date the product entered the marketplace, signature of an authorized representative of the processing company, and ministry project lead. This information is aggregated and reported under this measure.
Value-added products include value-added food, beverage, and bio-industrial products and new crop varieties. Introduced to market refers to a product that has obtained a listing at retail or food service, domestically or internationally, as well as products that have been sold as ingredients for further manufacturing. Ministry staff assist industry clients in one or more of the following areas: product formulation, shelf-life, packaging, sensory evaluation, marketing, and commercialization.
The number of new products confirmed by industry clients are aggregated and reported for this measure. The data is collated from program areas within the ministry that are engaged in product development and commercialization.
Environmentally Sustainable Agriculture Practices
Source: Ministry of Agriculture and Forestry Environmentally Sustainable Agriculture Tracking Survey Reports
Note(s): The result for this measure is derived from 40 environmentally sustainable agriculture (ESA) practices that could be used to address soil conservation, water management, wildlife habitat conservation, energy management, climate change adaptation, agricultural waste management, and grazing and manure management.
An eligible ESA practice (or group) for the base calculation is based on farm type, farm site characteristics, and operation practices. The percentage of eligible environmentally sustainable agricultural practices adopted by each respondent is multiplied by a weighting factor to generate a weighted adoption score for each respondent. The result of this measure is the average weighted adoption score of all respondents expressed as a percentage.
| | |
| 100 | | GOVERNMENT OF ALBERTA 2018–19 ANNUAL REPORT |
Sources and Notes, continued
The target population for Agriculture and Forestry’s Environmentally Sustainable Agriculture Tracking Survey is based on a list of commercial farmers in Alberta maintained by Kynetec Canada. The random and representative sample size was 500, providing a margin of error in provincial results of ± 4.4 per cent at a 95 per cent confidence level. The response rate was 8.3 per cent.
Data limitations include: producers that are not included in Kynetec Canada’s database (the source of the survey list); non-contactable subscribers (due to privacy legislation compliance); unreachable respondents (due to wrong telephone numbers, answering machine, busy, no answer, etc.); non-response; and disqualification due to failure to answer a required screening question.
Alberta’s Oil Sands Supply Share
Source: Ministry of Energy
Note(s): This measure is calculated as the annual ratio of the total number of barrels of Alberta oil sands production over the total number of barrels of world oil consumption.
The total for annual barrels of Alberta oil sands production is the sum of total mined and in-situ bitumen production in any given calendar year. Bitumen production data is calculated from Alberta Energy Regulator’s reports. Global oil consumption data is based on the Oil Market Report, published by the International Energy Agency.
Electricity Generation From Renewables
Source: Alberta Utilities Commission
Note(s): In Alberta, under the Renewable Electricity Act (2016), renewable generation refers to naturally occurring energy resources that can be replenished or renewed within a human lifespan, including, but not limited to, moving water, wind, heat from the earth, sunlight, and sustainable biomass.
Electricity generation data from both renewable and non-renewable sources is collected and reported annually by the Alberta Utilities Commission. The source of information is regulatory filings under the Hydro and Electric Energy Act by operators of power generating facilities.
The result of the measure, for any given year, is calculated dividing the electricity generated from renewables by the total electricity generated from all sources.
Energy Consumption
Source: Ministry of Infrastructure
Note(s): Energy consumption data is collected by various retailers throughout the year in the form of individual utility bills. This data is recorded in Infrastructure’s Energy Consumption Reporting System and transferred into EnergyCAP, the ministry’s Energy Management Information System.
Energy consumption intensity is the amount of energy consumed by a facility relative to its size. The EnergyCAP software automatically populates the energy consumption data into Natural Resources Canada’s ENERGY STAR Portfolio Manager (ESPM) tool. ESPM provides a common industry standard for calculating energy consumption intensity.
Sources and Notes, continued
Through ESPM, energy consumption data is:
| | • | | Calendarized to ensure energy data is allotted on a calendar year basis (January 1 to December 31) even when utility bills do not coincide with calendar months. |
| | • | | Converted to a single common unit, megajoules, from: |
| | – | gigajoules (natural gas) |
| | – | kilowatt-hours (electricity) |
| | – | tonne hours (chilled water |
| | • | | Weather-normalized by using temperature information taken from nearby weather stations. This ensures that the influence of varying weather is accounted for so that year to year comparisons are based on the energy that facilities would have used under average climatic conditions. |
Energy consumption intensity is then calculated by:
| | • | | Determining the total floor space in square metres (m2) of the facility by accessing the Building and Land Information Management System (BLIMS). |
| | • | | The energy consumption in megajoules (MJ) processed through ESPM is divided by the applicable floor space to determine the energy consumption intensity (MJ/m2). |
The gross energy consumption intensity (MJ/m2) of all government-owned and operated facilities is then totalled to account for the current inventory.
Facilities that have incomplete data or show zero energy consumption (i.e., unoccupied facilities or seasonal structures) are excluded from this measure. Government facilities such as schools, hospitals and facilities that are not managed by Ministry of Infrastructure are not included in this measure.
Labour Force Participation Rate
Source: Labour Force Survey, Statistics Canada and Ministry of Labour and Immigration
Note(s): Statistics Canada’s Labour Force Survey is the primary source of statistics on employment and unemployment in Canada and the provinces. The Labour Force Survey is conducted by Statistics Canada across the country. The survey sample size for Canada for the reporting period was 55,989. Alberta’s sample size corresponds to its share of the national population. An average of 5,690 Alberta households were surveyed each month. The coefficient of variation (the standard error as a percentage of the reported result) for the estimated 2,494,800 Albertans in the labour force is 1.0 per cent.
The Labour Force Survey provides information on the work activities of survey respondents during the week containing the 15th day of the month, known as the reference week. The target population covered by the survey corresponds to all persons aged 15 years and over residing in Canada, with the exception of the following: persons living on reserves and other Aboriginal settlements, full-time members of the Canadian Armed Forces and the institutionalized population. The labour force is the sum of the number of persons employed and the number of persons actively seeking employment (unemployed). This is calculated as a 12-month average for the calendar year.
For more information on the methodology of the Labour Force Survey, please see Guide to the Labour Force Survey (2018), Statistics Canada: https://www150.statcan.gc.ca/n1/en/pub/71-543-g/71-543- g2018001-eng.pdf?st=2OX23DIG
| | |
| 102 | | GOVERNMENT OF ALBERTA 2018–19 ANNUAL REPORT |
Sources and Notes, continued
All Albertans (aged 25–64)
The participation rate for all Albertans represents the percentage of the working age population (aged 25–64) who are either employed or actively seeking employment (unemployed).
Aboriginal Albertans living off-reserve (aged 25–64)
The Labour Force Survey includes a question that asks respondents if they identify themselves with at least one Aboriginal group, for example, North American Indian, Métis or Inuit. The First Nations, Métis and Inuit labour force (off-reserve) represents the number of people in the working age population (aged 25–64) who are either employed or actively seeking employment (unemployed).
Alberta’s immigrant population (aged 25–64)
A landed immigrant is a person who has been granted the right to live in Canada permanently by immigration authorities. Canadian citizens by birth and non-permanent residents (persons from another country who live in Canada and have a work or study permit, or are claiming refugee status, as well as family members living here with them) are not landed immigrants. The landed immigrant labour force represents the number of people in the working age population (aged 25–64) who are either employed or actively seeking employment (unemployed).
Alberta youth (aged 15–24)
Alberta youth (aged 15–24) represents the number of people in that age cohort who are either employed or actively seeking employment (unemployed).
Gross Domestic Product (GDP) Growth
Source: Statistics Canada Table 36-10-0402-01 (formerly CANSIM 379-0030) Gross domestic product (GDP) at basic prices, by industry, by provinces and territories (x 1,000,000)
Note(s): Gross Domestic Product (GDP) is the total market value of all goods and services produced during a given year. GDP is also referred to as economic output. To avoid counting the same output more than once, GDP includes only final goods and services – not those that are used to make another product. For this indicator, GDP is measured in real dollars. Real GDP is a measure of the volume of production. To measure this concept, GDP expenditure-based components are adjusted to eliminate the effect of price change. This process is known as deflation. For more information on Statistic’s Canada’s methodology, see the following Statistics Canada webpage: Gross Domestic Product by Industry – Provincial and Territorial (Annual): http://www23.statcan.gc.ca/imdb/p2SV.pl?Function=getSurvey&SDDS=1303. In November 2018, all real GDP estimates were revised by Statistics Canada with the base year changing from 2007 to 2012 This results in significantly higher values for the constant/real $ GDP estimates as prices are generally higher in more recent years (e.g. they were higher in 2012 than in 2007). GDP estimates in current $ are not affected. The year over year changes may see some revisions but these revisions are generally not significant.
Licensing University Technology
Source: Association of University Technology Managers, Licensing Surveys Database and the Ministry of Economic Development Trade and Tourism
Note(s): The data on university technology licensing comes from the Association of University Technology Managers (AUTM), a US-based non-profit formed to support and advance academic technology transfer globally. AUTM has a membership of more than 3,200 intellectual property managers
Sources and Notes, continued
from universities, research institutions, hospitals, businesses and governments. Specifically, the data comes from the AUTM’s annual Canadian edition of their Licensing Activity Survey. The 2015 Canadian Licensing Activity Survey solicited responses from 71 research institutions in Canada. Thirty-six institutions responded to the survey.
Alberta Immigrant Nominee Program
Source: Alberta Immigrant Nominee Program One-Year Post-Landing Followup Survey, Ministry of Labour and Immigration
Note(s): The ministry surveys Alberta Immigrant Nominee Program (AINP) nominees to determine if they are still living and working in Alberta, one year after obtaining permanent residency. To allow for one year to have passed from the date the nominee obtained permanent residency and to allow time for the survey to be conducted, AINP nominees who landed in 2016 were surveyed in 2018. In addition, the ministry is reporting on AINP nominees who landed in 2017 and surveyed in 2019. The survey is conducted by the ministry through an online survey. AINP nominees are contacted by email to complete the online survey.
A nominee is considered to be working and residing in Alberta if they responded that they currently reside in Alberta and that they are currently employed (including working and performing their job duties, on paid maternity leave, on a paid leave of absence or on vacation.)
The retention rate is calculated as:

For 2018, 3,122 of the 3,253 nominees who landed in Alberta in 2016 were sent the survey and 2,164 nominees responded to the survey. The survey response rate based on all landed immigrants was 66.5 per cent and the results are considered accurate to +/- 1.15 percentage points, 19 times out of 20.
For 2019, 3,208 of the 3,447 nominees who landed in Alberta in 2017 were sent the survey and 1,878 nominees responded to the survey. The survey response rate based on all landed immigrants was 54.5 per cent and the results are considered accurate to +/- 1.52 percentage points, 19 times out of 20.
Women’s Labour Force Participation Rate
Source: Statistics Canada’s Labour Force Survey (LFS)
Note(s): Statistics Canada’s Labour Force Survey (LFS) is the primary source of statistics on employment and unemployment in Canada and the provinces. The LFS is conducted by Statistics Canada across the country. The survey sample size for Canada at the end of 2015, was 55,989 (the sample for Alberta at the end of 2015 was 5,690). The coefficient of variation (the standard error as a percentage of the reported result) is approximately 1.0 per cent for the 2,481,700 people in the Alberta labour force. The above sample size and estimate for the coefficient of variation is contained in the 2016 Guide to the Labour Force Survey
| | |
| 104 | | GOVERNMENT OF ALBERTA 2018–19 ANNUAL REPORT |
Sources and Notes, continued
and is the most current information available. There were minor changes in methodology and a rebase in 2015, which affects the results back to 2001.
The LFS provides information on the work activities of the respondents during the week containing the 15th day of the month known as the reference week. The target population covered by the survey corresponds to all persons aged 15 years and over residing in Canada, with the exception of the following: persons living on reserves and other Aboriginal settlements, full-time members of the Canadian Forces, and the institutionalized population. The labour force is the sum of the number of persons employed and the number of persons actively seeking employment (unemployed). This is calculated as a 12-month average for the calendar year.
The participation rate represents the percentage of the working age population that is either employed or actively seeking employment (unemployed).
For more information on the methodology of the Labour Force Survey, please see Guide to the Labour Force Survey (2018), Statistics Canada: https://www150.statcan.gc.ca/n1/en/pub/71-543-g/71-543- g2018001-eng.pdf?st=MbcT_uZt
The Ministry of Labour and Immigration obtains this data through Statistics Canada. For “all women”, Table 14-10-0017-01, formerly CANSIM table 282-0001 was used. For “Aboriginal women in Alberta (off-reserve), 14-10-0364-01, formerly CANSIM table 282-0226 was used.
Historical results have been restated to reflect updated census data information provided by Statistics Canada.
Total Value of Alberta’s Exported Products Outside the United States
Source: Industry Canada’s Trade Data Online Data Set and Ministry of Economic Development Trade and Tourism
Note(s): Data comes from Industry Canada’s Trade Data Online tool, which aggregates trade data from Statistics Canada and simplifies the data extraction process. Trade data is aggregated from the Canadian International Merchandise Trade (Customs Basis) survey (http://www23.statcan.gc.ca/imdb/p2SV.pl?Func tion=getSurvey&SDDS=2201).
Data is estimated from a census of administrative records of customs received from multiple sources which Statistics Canada then compiles. Exports are attributed to the country that is the last known destination of the goods at the time of export. This can be error prone if the destination is incorrectly reported, which typically happens when goods are routed through intermediary countries. A monthly estimated adjustment is applied based on balance of payments data to correct for this.
Market Access
Source: Ministry of Energy
Note(s): This indicator reports the share of total volumes of natural gas leaving Alberta as a percentage of total disposition. All data is calculated from the Alberta Energy Regulator’s (AER) reports. On the basis of an updated source, the results included in the Ministry of Energy’s 2017-18 Annual Report have been retroactively revised. For the indicator, the results are compiled and reported on a calendar year basis.
Sources and Notes, continued
Regulatory Compliance
Source: Alberta Energy Regulator (AER)
Note(s): AER staff inspects operations of the upstream oil and gas and coal mining industries with respect to the drilling, production, and disposal of hydrocarbons and associated wastes. All inspection results are recorded into the Field Surveillance Inspection System and result in an outcome of either compliant or noncompliant. If the inspection is noncompliant the triage tool is used to assess the significance of the noncompliance and determine the need for an investigation. If an investigation is warranted, information and evidence is collected relevant to the noncompliance. The investigation will determine if an enforcement action is required. The data is based on inspections performed in the following activities: drilling operations, gas facilities, oil facilities, pipelines, well servicing operations, drilling waste, well sites, coal mines, mineable oil sands and waste management facilities, and is counted based on the year the inspection was initiated.
Total Greenhouse Gas Emissions
Source: Environment and Climate Change Canada
Note(s): As Canada is a signatory to the United Nations Framework Convention on Climate Change, Environment and Climate Change Canada prepares and submits an annual national greenhouse gas inventory covering anthropogenic emissions by sources and removals by sinks. Guidelines produced by the Intergovernmental Panel on Climate Change for countries reporting to the United Nations Framework Convention on Climate Change provide methods for calculating greenhouse gas emissions from a given human activity. Greenhouse gas emissions are reported in carbon dioxide equivalents, determined by multiplying the amount of emissions of a particular gas by the global warming potential of that gas. Results are reported annually with an 18-month reporting lag period. The total greenhouse gas (GHG) emissions indicator utilizes GHG emissions data from Environment and Climate Change Canada’s National Inventory Report 1990-2017: Greenhouse Gas Sources and Sinks in Canada.
Strategic Priority Two: Protecting Vital Public Services
Post-secondary Transition
Source: Ministry of Education
Note(s): The high school to post-secondary transition rate reports the percentages of Alberta students in public, separate, francophone, charter, and accredited private schools who made the transition to post-secondary education including apprenticeships within six years of entering Grade 10. The High School to Post-secondary Transition Rate is calculated by dividing the number of students who enter post-secondary programs by the number of students in the Grade 10 cohort, adjusted for attrition. Students from the Grade 10 cohort are counted as in-province post-secondary attenders if they are registered in a post-secondary-level program at an Alberta post-secondary institution or if they are registered in an apprenticeship program in Alberta. The most recent results are for 2016-17 as the data for this measure lag a year and the 2017-18 data was not available at the time of reporting.
Students are considered to have entered the post-secondary system if they attend a credit program, part-time or full-time, in a publicly-funded Alberta postsecondary institution. Information on post-secondary
| | |
| 106 | | GOVERNMENT OF ALBERTA 2018–19 ANNUAL REPORT |
Sources and Notes, continued
enrolments incorporates post-secondary Classification of Instructional Programs coding to better identify students enrolled in programs not deemed to be post-secondary level (e.g. academic upgrading). Students in these kinds of programs are not considered transitioners for the purpose of this measure. A student is considered to have entered the post-secondary system if the student has registered in an apprenticeship program. A student registered in the Registered Apprenticeship Program (RAP) is not considered to have entered the post-secondary system as students in RAP are high school students. The Alberta Student Number is used to match students from the Grade 10 cohort with the apprentices in the Apprenticeship, Trade and Occupation Management System, Alberta Advanced Education’s apprenticeship information system. Students identified as attending both a post-secondary institution and having registered in an apprenticeship program are reported as attending a post-secondary institution. Alberta Education does not specifically track Alberta students who participate in post-secondary programs outside of Alberta. An estimate of the number of students who have left the province to pursue post-secondary education is therefore factored into the high school to post-secondary transition rate.
Unplanned Readmissions of Mental Health Patients
Source: Canadian Institute for Health Information (CIHI); Alberta Health Services, Provincial Inpatient Database
Note(s): Current results are Q3 year-to-date. Enforced reporting lag is applied (90 days) to allow for completion of stay and load of the abstract record for the readmission stay. This measure is defined as the number of discharged patients readmitted to any acute hospital in Alberta as selected mental illness within 30 days of index discharge divided by the number of index discharges with Most Responsible Diagnosis (MRDx) as selected mental illness multiplied by 100. Risk Adjusted rate (observed cases divided by expected cases) multiplied by the Canadian average rate: a) The Canadian average rate is based on 2010-11 as provided by CIHI; b) The observed number of cases is the actual count of readmissions to a hospital; and c) The expected number of cases is based on the sum of the probabilities of readmissions to a hospital.
Coefficients from CIHI used for calculating the probability of readmissions were from logistic regression models on the following independent variables – age, sex, multiple previous admissions for a selected mental illness (two or more) during the past 12 months, discharges against medical advice, substance abuse related disorder, schizophrenia, anxiety disorder, and personality disorder.
Access to Continuing Care Spaces
Source: Alberta Health Services. Data are extracted from Meditech and Stratahealth Pathways
Note(s): Percentage of clients admitted to a continuing care living option (Designated Supportive Living or Long-Term Care) within 30 days of the assessed and approved date.
Assessed and Approved date refers to the date the client is placed on the waitlist for a Continuing Care Living Option following the completion of the assessment and approval process.
The result is calculated based on the number of individuals admitted to a Continuing Care Living Option within 30 days of their assessed and approved date divided by the total number of individuals admitted to a Continuing Care Living Option during the reporting period, expressed as a percentage.
Sources and Notes, continued
Child Intervention Services
Source: Ministry of Children’s Services. Child Intervention Case Information Online system
Note(s): Child Intervention services are guided by legislated principles under the Child, Youth and Family Enhancement Act. The Act places emphasis on assessment in determining the need for intervention and the type of intervention to be provided to children, youth and families. This is based on the belief that a thorough assessment of child and family strengths and needs will result in better case planning, more effective interventions and shorter timeframes to achieve the intervention objectives. With more than 10,000 children and youth currently receiving child intervention services across Alberta in or out of care, child intervention services promote well-being, stability and continuity of relationships with biological families or legal guardians, while protecting children from further maltreatment.
The results were determined by extracting data from the Child Intervention Case Information Online (CICIO) to assess whether those children and youth had a previous Child Intervention file closure (i.e. the conclusion of services under a Family Enhancement Agreement of Child Protection file) in the last 12 months. Only youth whose file closure occurred prior to his/her 18th birthday were used to calculate the results. The new file does not have to be related to the previous reason for service.
This performance measure is calculated using the following formula:

Preliminary data is available from a live dataset at least one month after the end of the fiscal year. Since the dataset is a live source, the data and results generated are subject to change as more information is entered into the system. Data is considered preliminary for 26 months, after which the data is frozen for yearly reporting (i.e. Official data for 2017-18 is frozen on May 15, 2019).
Positive Outcomes for Women
Source: Status of Women Final Grant Reports. The ministry’s grant recipients are required to submit within four months of the end of their project or by July 31st of the following year, whichever comes first
Note(s): The purpose of this reporting is to assess aggregate, quantitative, and qualitative short-term results of the funded projects, resources and events. These include outputs such as resources developed, knowledge gained, partnerships/networks formed, strategies/tools put into use, etc.
This measure is self-reported by civil society organizations who received funding for their project. The ministry is exploring other options for measures in future years that will employ a more robust methodology to assess the success of civil society organizations achieving positive outcomes for women and girls.
Analysis of aggregated data indicates the percentage of grant recipients reporting positive outcomes. This is done by calculating the number of grant recipients reporting positive outcomes divided by the total number of grant recipients and multiplying by 100. Recipients were also asked to provide information on how the outputs of their initiatives contribute to the desired outcomes, to provide narratives/feedback from participants, and to detail how the grants funds were spent. Analysis of aggregated data will indicate the percentage of grant recipients reporting positive outcomes for women and girls in Alberta as a result of their project, resource, or event.
| | |
| 108 | | GOVERNMENT OF ALBERTA 2018–19 ANNUAL REPORT |
Sources and Notes, continued
Initially, this measure was designed to use the data from interim reports; however, once the interim reports were received from the first year of the grant program (September 30, 2017), it became clear that very few of the recipients had significant activities to report, much less impacts and outcomes. The six month point was too early for many of the recipients to share the type of data required for the performance measure, and what was available was inconsistent due to the variance in project types and timelines.
For that reason, the performance measure was revised to use the final reports data which would allow for more consistency and be based on a complete understanding of the funded project, conference, event or training.
The data from the final reports will be collected, categorized into qualitative and quantitative measures, and analyzed for overall trends and patterns, which will be collected in a report, along with learnings for the ministry and grant program to inform future decisions.
Please note only the wording for this measure changed in 2017-18; the methodology remains the same.
Employment Standards
Source: Data and Statistics Hub (DASH), an internally administered database by the Ministry of Labour
Note(s): DASH tracks all data related to employment standards complaints. For this performance measure, a report is created from the Data and Statistics Hub System that identifies those complaints that were concluded within the reporting period and the resolution type. A complaint is marked concluded when the investigation is concluded or there is no further work to do on the file.
The voluntary resolution of an employment standards complaint can include full payment of earnings, an amount the employee believes is satisfactory or advising the employee there are no earnings due, which results in concluding the complaint. This measure considers only those complaints that are eligible for voluntary resolution. Instances where a voluntary resolution is not possible (e.g. the employer is bankrupt, the business has failed, the employer is in receivership or the claim is abandoned) are excluded from the measure.
Post-Secondary Education
Source: Labour Force Survey, Statistics Canada
Note(s): The data for this indicator is obtained from a custom tabulation performed by Statistics Canada based on the information collected by its Labour Force Survey (LFS). LFS is a monthly household survey of a sample of individuals. The target population is the non-institutionalized population 15 years of age and over. Recently, the monthly LFS sample size has been approximately 5,690 households for Alberta.
The post-secondary education (PSE) participants are identified by using the following questions from the LFS: “Last week, was … attending a school, college or university?”; “Was he/she enrolled as a full-time or part-time student?”; “What kind of school was this?” Responses that indicate attending a university, college or other post-secondary institution at the time of interview are used to calculate the performance indicator results.
The percentage of Albertans aged 18–34 participating in PSE is calculated by dividing the estimated number of Albertans aged 18–34 who report attending a university, college or other post-secondary institution (numerator) by the estimated number of Albertans aged 18–34 (denominator), based on the
Sources and Notes, continued
Alberta sample. The sample data are weighted to enable tabulation of estimates at the provincial level of aggregation.
In order to account for the fact that many post-secondary students attend school during the fall and winter semesters while working during the summer, the calculation for this indicator uses an 8-month average (January – April and September – December).
The 18–34 age group represents the majority of the learners participating in PSE; however, it does not capture all learners in the post-secondary system. For example, the data includes students (including international students and students studying outside of Alberta) whose primary residence is in Alberta during their studies but does not include individuals who live on reserves and other Indigenous settlements or those who study only between May and August.
Children Receiving Child Intervention Services as a Percentage of the Child Population in Alberta
Source: Ministry of Children’s Services. Child Intervention Case Information Online (CICIO) system and Statistics Canada Table: 17-10-0005-01 (formerly CANSIM 051-0001) – Population estimates on July 1st, by age and sex
Note(s): This indicator describes the percentage of children and youth, ages 0–17 years, receiving child intervention services as a proportion of the total child population in Alberta. Only children and youth whose file closure occurred prior to their 18th birthday are included. The CICIO system identifies how many unique children and youth had an open child intervention legal authority (not-in-care or in-care) at any point during the calendar year. Tracking the number of children receiving services can help the ministry plan and prepare resources to address caseload demands.
Monitoring the percentage of children and youth receiving child intervention services as a direct proportion of the total child population in Alberta helps the ministry track whether any progress was made to the overall safety, security and well-being of children in the province. Specifically, if the percentage stabilizes when Alberta’s child population is growing every year, it may indicate the ministry’s success in strengthening families and communities to keep children in safe and living in stable environments.
The percentage is calculated as follows:
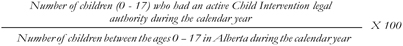
The reported number of children receiving child intervention services is subject to change as source information is entered into the system. Data for 2018 is current as of May 10, 2019.
Core Housing Need
Source: Canada Mortgage and Housing Corporation (CMHC). Table: Characteristics of Households in Core Housing Need: Canada, Provinces, Territories, Census Metropolitan Areas (2001, 2006, 2011). Core housing need data for 2016 was obtained directly from CMHC
Note(s): A household is in core housing need if its housing is unsuitable, inadequate or unaffordable, and if it cannot pay the median rent of alternative local housing that meets all three criteria. Housing is defined as adequate when it does not require major repairs according to its residents; suitable when it has enough bedrooms for the size and make-up of resident households, according to the National Occupancy Standard; and affordable when its shelter costs represent less than 30 per cent of before-tax household income.
| | |
| 110 | | GOVERNMENT OF ALBERTA 2018–19 ANNUAL REPORT |
Sources and Notes, continued
This indicator is based on self-reporting through the Canadian Income Survey-based housing indicators and data developed by the CMHC. It is updated every five years with data from the National Census and the National Household Survey.
Health Expenditures
Source: Canadian Institute for Health Information (CIHI), National Health Expenditure Trends (NHEX), 1975 to 2018
Note(s): Results for 2017 and 2018 are forecast as there is a two year lag in available actual results. Data is extracted annually from provincial/territorial government public accounts. Programs and/or program items are classified into health expenditure categories according to accepted and standardized methods and definitions used in estimating national health expenditure. Data from the public accounts is supplemented with information from provincial/territorial government department annual reports and annual statistical reports when available as well as information provided by provincial/territorial government department officials.
Adjustments for regional health authority and/or hospital deficits or surpluses are not made in NHEX unless the provincial government assumes them. If deficits or surpluses are assumed by the provincial government, they are allocated to the years when the regional health authority and/or hospitals accumulated them. As part of the preparation of this report, CIHI’s estimates of provincial/territorial government health expenditures are submitted to provincial/territorial departments of health for review.
To obtain per capita provincial government health expenditure, the provincial government health expenditure is divided by population estimates from the Demography Division of Statistics Canada.
Strategic Priority Three: Returning to Balance
Sustainable Operating Spending Growth
Source: Growth in operating expense, population and inflation is calculated by Alberta Treasury Board and Finance
Note(s): Growth in operating expense is calculated based on data taken from the Government of Alberta’s 2018-19 Final Results Year-End Report. Population growth is calculated by taking the annual change in population at the midpoint of the fiscal year (October 1). Inflation is the year-over-year growth in the average of the Alberta Consumer Price Index over the fiscal year (April to March). Operating spending excludes Climate Leadership Plan.
Interprovincial Tax Comparison
Source: Ministry of Treasury Board and Finance
Note(s): Total additional provincial tax and carbon changes that individuals and businesses would pay if Alberta had the same tax system and carbon changes as other provinces.
Financial Wealth
Source: Alberta Treasury Board and Finance
Note(s): The total value of government’s financial assets minus the total value of outstanding liabilities, compared with all provinces on per capita basis.