Exhibit 99.6
GOVERNMENT OF ALBERTA

2020-21 Mid-year
Fiscal Update and
Economic Statement
| | |
| NOVEMBER 2020 | |  |
Table of Contents
| | | | |
| |
2020-21 Mid-year Fiscal Plan Highlights | | | 3 | |
| |
Revenue Highlights | | | 4 | |
| |
Expense Highlights | | | 6 | |
| |
Assets and Liabilities | | | 8 | |
| |
Capital Plan | | | 9 | |
| |
Alberta Fiscal Policy and Debt | | | 10 | |
| |
Economic Update | | | 13 | |
| |
2020-21 Mid-year Tables | | | 23 | |
| |
Reporting Methodology and Legislative Compliance | | | 35 | |
Note: Amounts presented in tables may not add to totals due to rounding.
Treasury Board and Finance, Government of Alberta
2020–21 Mid-year Fiscal Update and Economic Statement, November 2020
Additional copies of this report may be obtained by visiting our website at: www.alberta.ca/budget-documents.aspx
| | |
| 2 | | 2020-21 Mid-year Fiscal Update and Economic Statement |
2020-21 Mid-year Fiscal Plan Highlights
The Budget 2020 fiscal plan aimed to balance the budget by 2022-23. It was presented in February, just prior to COVID-19 being declared a global pandemic. While Alberta’s government amended the Appropriation Act, 2020 to add $500 million to the Health budget during the budget process, the impacts on the government’s fiscal situation have been much deeper.
Alberta’s government has responded to the pandemic with a variety of significant initiatives for Albertans and Alberta businesses aimed at protecting lives and livelihoods. In June, Alberta’s Recovery Plan was announced to stimulate economic activity, implement measures to create jobs, and spur broader economic activity through sector strategies and strategic infrastructure projects.
The revenue forecast has significantly declined in all three fiscal years. Severe revenue deterioration has forced the government to re-evaluate the time frame for balancing the budget. A great
deal of uncertainty remains with respect to how soon the global pandemic will be beaten, and how it could impact the world economy and indeed our daily lives. Alberta’s resource-based economy and employment have been harder hit than other jurisdictions by the pandemic and the resulting shut-down of economic activity and travel, which has severely hampered energy markets and prices.
The deficit in 2020-21 has increased from the $7.3 billion estimate in the amended Budget 2020, to $21.3 billion. Total revenue is $8.6 billion lower, forecast at $41.4 billion. Total expense is forecast at $62.7 billion, a $5.4 billion increase, due largely to COVID-19 and economic stimulus measures of $4.3 billion. Expense, not including COVID-19 / Recovery Plan measures and the crude-by-rail provision, has decreased $156 million from Budget 2020.
The deficit is $2.8 billion lower than the $24.2 billion deficit estimated at
first quarter. The revenue forecast has increased nearly $3 billion from first quarter, primarily from $1.4 billion in additional federal transfers, $0.4 billion greater resource revenue (attributed to higher-than-expected oil and natural gas prices), $0.4 billion increase in gaming revenue, and an improvement of $0.7 billion in tax revenue, investment income and timber royalties.
Capital Plan spending in 2020-21 has increased by $1.4 billion, to $8.4 billion, with additional support provided to municipalities, and maintenance and renewal funding accelerated, as part of the stimulus measures in Alberta’s Recovery Plan. Several strategic projects to assist in economic recovery and create future opportunities have also been added, reflected mainly in Capital Plan spending over the next several years.
With the revenue decline and deficits deepening for several years, additional borrowing will be required. Taxpayer-supported debt is estimated to reach $97.4 billion by March 31, 2021. For 2020-21, net debt to GDP is estimated at 20.6 per cent.
Consolidated Fiscal Summary
(millions of dollars)
| | | | | | | | | | | | | | | | | | | | | | | | | | | | |
| | | | | | 2019-20 | | | 2020-21 | | | Change fr. | | | 2021-22 | | | 2022-23 | |
| | | | Statement of Operations | | Actual | | | Budget | | | Forecast | | | Budget | | | Target | | | Target | |
| | | | | | | |
| | 1 | | | Total Revenue | | | 46,224 | | | | 49,996 | | | | 41,414 | | | | (8,582 | ) | | | 42,664 | | | | 47,641 | |
| | | | | | | |
| | | | Expense | | | | | | | | | | | | | | | | | | | | | | | | |
| | | | | | | |
| | 2 | | | Operating expense (net of in-year savings) | | | 48,616 | | | | 47,809 | | | | 47,745 | | | | (64) | | | | 47,451 | | | | 47,412 | |
| | | | | | | |
| | 3 | | | % change from prior year | | | 0.5 | | | | (1.6) | | | | (1.8) | | | | - | | | | (0.6) | | | | (0.1) | |
| | | | | | | |
| | 4 | | | Capital grants | | | 1,696 | | | | 2,302 | | | | 2,266 | | | | (36) | | | | 2,201 | | | | 2,168 | |
| | | | | | | |
| | 5 | | | Amortization / inventory consumption / loss on disposals | | | 3,720 | | | | 3,857 | | | | 3,891 | | | | 34 | | | | 4,015 | | | | 4,122 | |
| | | | | | | |
| | 6 | | | Debt servicing costs | | | 2,235 | | | | 2,505 | | | | 2,413 | | | | (92) | | | | 2,737 | | | | 2,965 | |
| | | | | | | |
| | 7 | | | Pension provisions | | | (334) | | | | (415) | | | | (415) | | | | - | | | | (379) | | | | (275) | |
| | | | | | | |
| | 8 | | | Expense (before COVID-19 / Recovery Plan, Contingency, Crude-by-rail) | | | 55,936 | | | | 56,056 | | | | 55,900 | | | | (156) | | | | 56,024 | | | | 56,394 | |
| | | | | | | |
| | 9 | | | COVID-19 / Recovery Plan: | | | | | | | | | | | | | | | | | | | | | | | | |
| | | | | | | |
| | 10 | | | Operating expense | | | 218 | | | | 500 | | | | 3,534 | | | | 3,034 | | | | 504 | | | | 271 | |
| | | | | | | |
| | 11 | | | Capital grants | | | - | | | | - | | | | 607 | | | | 607 | | | | 160 | | | | 91 | |
| | | | | | | |
| | 12 | | | Inventory consumption (PPE) | | | - | | | | - | | | | 702 | | | | 702 | | | | - | | | | - | |
| | | | | | | |
| | 13 | | | Contingency for COVID-19 | | | - | | | | - | | | | - | | | | - | | | | 750 | | | | - | |
| | | | | | | |
| | 14 | | | Crude-by-rail provision | | | 866 | | | | - | | | | 1,250 | | | | 1,250 | | | | - | | | | - | |
| | | | | | | |
| | 15 | | | Contingency / disaster and emergency assistance | | | 1,356 | | | | 750 | | | | 750 | | | | - | | | | 750 | | | | 750 | |
| | | | | | | |
| | 16 | | | Total Expense | | | 58,376 | | | | 57,306 | | | | 62,743 | | | | 5,437 | | | | 58,188 | | | | 57,506 | |
| | | | | | | |
| | 17 | | | Surplus / Deficit | | | (12,152) | | | | (7,310) | | | | (21,329) | | | | (14,019) | | | | (15,524) | | | | (9,865) | |
| | | | | Capital Plan | | | | | | | | | | | | | | | | | | | | | | | | |
| | | | | | | |
| | 18 | | | Capital grants | | | 1,696 | | | | 2,302 | | | | 2,873 | | | | 571 | | | | 2,361 | | | | 2,259 | |
| | | | | | | |
| | 19 | | | Capital investment | | | 3,868 | | | | 4,687 | | | | 5,556 | | | | 869 | | | | 4,698 | | | | 3,857 | |
| | | | | | | |
| | 20 | | | Total Capital Plan | | | 5,564 | | | | 6,989 | | | | 8,429 | | | | 1,440 | | | | 7,059 | | | | 6,116 | |
| | |
| 2020-21 Mid-year Fiscal Update and Economic Statement | | 3 |
Revenue Highlights
Total Revenue
Total revenue is forecast at $41.4 billion in 2020-21, $8.6 billion lower than expected in Budget 2020, and 10 per cent lower than 2019-20. Revenue is now expected to grow 3 per cent in 2021-22, to $42.7 billion, and then to rise by 11.7 per cent to $47.6 billion in 2022-23. In total over the three Budget 2020 fiscal years, revenue is forecast to be $30.4 billion less than anticipated prior to COVID-19.
The pandemic, and resulting travel restrictions and closure of global economic activity, hit energy prices and Alberta’s resource-based economy particularly hard: over $11 billion of the $30 billion drop in revenue over the three fiscal years is from non-renewable resource revenue.
The forecast is based on real GDP growth of 4.4 per cent in 2021, following a massive 8.1 per cent contraction in 2020 and a recovery in oil production and consumer spending. A great deal of uncertainty remains with respect to COVID-19 and a second wave, resulting in delayed recovery in certain sectors, including the service sector, as well as an overall decline in
business investment. GDP is expected to level out to 3.7 per cent growth thereafter, with business investment picking up, spurred by the corporate income tax rate reduction, introduction of the Innovation Employment Grant, strengthening population and job growth.
Non-Renewable Resource Revenue
Non-renewable resource revenue is forecast at $1.7 billion in 2020-21. This is $4.3 billion lower than in 2019-20 and down $3.4 billion from budget. It is estimated to grow to $2.5 billion in 2021-22 and $5.1 billion by 2022-23, led primarily by bitumen royalties.
Oil prices are expected to remain weak in 2020-21, as expanding global COVID-19 cases threaten economic recovery and the speed of demand growth, even though global producers continue to exercise supply curtailment. The West Texas Intermediate (WTI) price is forecast at US$36.40 per barrel (/bbl) for 2020-21, far below the estimated US$58/bbl in Budget 2020. WTI is estimated to reach US$54.90 by 2022-23, again much lower than US$63 Budget 2020 was based on, as global
demand slowly recovers and supply grows at a more moderate rate.
The light-heavy oil price differential narrowed early in 2020, as Alberta production receded sharply in the face of COVID-19 and its economic impacts. Alberta production has started to ramp up in the second half of 2020, and is expected to expand 7 per cent in 2021 before moderating over the next two years, when it will be about 200,000 barrels per day below estimates in Budget 2020. This production profile, combined with debottlenecking and additional pipeline access in 2022, is expected to alleviate market access pressures that have spiked the differential in recent years. The light-heavy oil price differential is forecast at US$11.10/bbl in 2020-21, $8 below budget, and about $14/bbl for the next two years.
Tax Revenue
Total tax revenue in 2020-21 is forecast at $18.2 billion, $4.7 billion lower than budget, and down $2.9 billion from 2019-20. Half of the reduction from budget is due to a severe decline in corporate income tax (CIT) revenue, with personal income tax (PIT) revenue accounting for about 40 per cent of the
Revenue
(millions of dollars)
| | | | | | | | | | | | | | | | | | | | | | | | |
| | | 2019-20 | | | 2020-21 | | | Change fr. | | | 2021-22 | | | 2022-23 | |
| | | Actual | | | Budget | | | Forecast | | | Budget | | | Target | | | Target | |
| | | | | | |
Personal income tax | | | 11,244 | | | | 12,566 | | | | 10,753 | | | | (1,813) | | | | 11,686 | | | | 12,535 | |
| | | | | | |
Corporate income tax | | | 4,107 | | | | 4,539 | | | | 2,188 | | | | (2,351) | | | | 1,666 | | | | 2,391 | |
| | | | | | |
Education property tax | | | 2,475 | | | | 2,559 | | | | 2,472 | | | | (87) | | | | 2,652 | | | | 2,766 | |
| | | | | | |
Other taxes | | | 3,272 | | | | 3,223 | | | | 2,814 | | | | (409) | | | | 3,090 | | | | 3,231 | |
| | | | | | |
Bitumen royalty | | | 4,089 | | | | 3,211 | | | | 896 | | | | (2,315) | | | | 1,335 | | | | 3,180 | |
| | | | | | |
Other non-renewable resource revenue | | | 1,848 | | | | 1,879 | | | | 773 | | | | (1,106) | | | | 1,156 | | | | 1,875 | |
| | | | | | |
Transfers from Government of Canada | | | 9,072 | | | | 9,110 | | | | 11,337 | | | | 2,227 | | | | 9,903 | | | | 9,731 | |
| | | | | | |
Heritage / endowment funds | | | 1,779 | | | | 1,463 | | | | 1,138 | | | | (325) | | | | 1,239 | | | | 1,470 | |
| | | | | | |
Other investment income | | | 1,049 | | | | 1,167 | | | | 781 | | | | (386) | | | | 723 | | | | 780 | |
| | | | | | |
Net income from Government Business Enterprises | | | (225) | | | | 2,358 | | | | 1,194 | | | | (1,164) | | | | 1,666 | | | | 1,915 | |
| | | | | | |
Premiums, fees and licences | | | 3,929 | | | | 4,194 | | | | 4,030 | | | | (164) | | | | 4,162 | | | | 4,291 | |
| | | | | | |
Other | | | 3,585 | | | | 3,726 | | | | 3,038 | | | | (688) | | | | 3,386 | | | | 3,476 | |
Total Revenue | | | 46,224 | | | | 49,996 | | | | 41,414 | | | | (8,582) | | | | 42,664 | | | | 47,641 | |
| | | |
Change from Budget 2020 in 2021-22 and 2022-23: | | | Personal income tax | | | | (1,740) | | | | (1,780) | |
| | | |
| | | Corporate income tax | | | | (3,319) | | | | (2,969) | |
| | | |
| | | Other taxes (includes education property tax) | | | | (227) | | | | (192) | |
| | | |
| | | Non-renewable resource revenue | | | | (4,214) | | | | (3,481) | |
| | | |
| | | Transfers from Government of Canada | | | | 370 | | | | (53) | |
| | | |
| | | Investment income | | | | (927) | | | | (820) | |
| | | |
| | | Net income from GBEs | | | | (753) | | | | (650) | |
| | | |
| | | Other revenue | | | | (562) | | | | (475) | |
| | | |
| | | Total change from Budget 2020 | | | | (11,372) | | | | (10,420) | |
| | |
| 4 | | 2020-21 Mid-year Fiscal Update and Economic Statement |
decrease. The weakness in income tax revenue continues in the next two years, particularly for CIT, which declines again in 2021-22 before beginning to recover in 2022-23.
The impact of COVID-19 on activity, and the global oil price drop, are estimated to have reduced corporate profits by 56.5 per cent in 2020. Continued low, though rebounding, oil prices, an uncertain and modest pace of recovery and the ability to carry losses forward against future income, all combine to decrease CIT revenue further in 2021-22, before it grows 44 per cent to $2.4 billion in 2022-23. The acceleration of the full CIT rate reductions from January 2022 to July 2020 is estimated to decrease revenue by $200 to $300 million in 2020-21.
The loss of jobs from the pandemic - 360,900 between February and April - has impacted personal incomes and PIT revenue. While over 70 per cent of the jobs have returned, overall employment is forecast to fall 7 per cent in 2020. PIT revenue is estimated to have fallen almost $0.5 billion or 4.4 per cent from 2019-20, and by $1.8 billion from the budget forecast, to $10.8 billion. PIT revenue is expected to grow an average of 8 per cent over the next two years, reaching $12.5 billion in 2022-23, as employment, population growth and weekly earnings recover, albeit slowly.
Other tax revenue is estimated about $0.5 billion lower in 2020-21 relative to budget and to 2019-20. Fuel taxes and the tourism levy have decreased from budget by $256 and $65 million respectively, while tobacco tax is down $70 million, and education property tax is down $87 million due to the freeze. The change from 2019-20 reflects decreases of $209 million from fuel tax revenue, $62 million from the tourism levy abatement, and $189 million from eliminating the carbon tax. Other tax revenue grows by an average of 6.5 per cent over the next two years, mainly as the economy recovers from COVID-19.
Transfers from Government of Canada
Federal transfers back to Alberta are forecast to be $2.2 billion higher than estimated in Budget 2020, due primarily to: $1.3 billion Safe Restart Agreement; $263 million Safe Return to Class; $215 million in labour market, financial assistance and wage top-up programs; $420 million of the $1 billion for Site Rehabilitation. The Site Rehabilitation funding extends into 2021-22 ($390 million) and 2022-23 ($190 million), though the cash has yet to be received. Canada health and social transfers have decreased from budget due mainly to revised population forecasts.
Investment Income
Investment income is forecast at $1.9 billion for 2020-21, $711 million lower than budget as financial markets were significantly impacted by COVID-19. Markets have generally recovered but remain turbulent. Heritage and endowment fund income is forecast at $1.1 billion, a decrease of $325 million from budget, but about $350 million higher than expected at first quarter as markets rallied after hitting lows at the end of March. Income from lending to local authorities (formerly via Alberta Capital Finance Authority) is estimated $268 million lower, while income from various other accounts is estimated to have declined $118 million, largely due to lower interest rates.
Investment income is then forecast to grow by an annual average of 8.3 per cent, reaching $2.3 billion by 2022-23. This is down $927 million and $820 million relative to Budget 2020 in 2021-22 and 2022-23 respectively. About 85 per cent of the decline is from revised forecasts for the Heritage and endowment funds, and local authority lending, and 15 per cent from other investment income.
Other Revenue
Net income from government business enterprises is forecast at $1.2 billion, about half of the Budget 2020 forecast, but $475 million higher than estimated for first quarter. The decline from budget mainly reflects lower net income from gaming activities ($456 million lower), ATB Financial ($372 million lower) and Alberta Petroleum Marketing Commission (APMC - $294 million lower). The change from first quarter is mainly due to higher revenue from gaming and ATB, partly offset by decreased APMC net income. Net income grows by an average of 27 per cent over the next two years, reaching $1.9 billion in 2022-23.
Premiums, fees and licences revenue of $4 billion forecast for 2020-21 has decreased $164 million from budget, but is $161 million higher than the first quarter forecast. Post-secondary institution tuition fees are $130 million lower, energy industry levies are down $114 million from the six month waiver, and various other fees and premiums are also lower. These are partly offset by $203 million in higher timber royalties, as industry curtailment reduced lumber supply while the pandemic encouraged renovation activity. This is the main reason for the increase from first quarter. Other revenue of $3 billion is down $688 million from budget, due to declines of $411 million in post-secondary institution and health authority sales and donations revenue, and $149 million in compliance payments to the Technology Innovation and Emissions Reduction Fund.
| | |
| 2020-21 Mid-year Fiscal Update and Economic Statement | | 5 |
Total Expense
Total expense is forecast at $62.7 billion in 2020-21, an increase of $4.4 billion from 2019-20 and $5.4 billion more than estimated in Budget 2020.
The increase from 2019-20 comprises $4.6 billion in COVID-19 / Recovery Plan initiatives, $0.4 billion increase for crude-by-rail (CBR) divestment, partly offset by a decrease of $0.6 billion in disaster and emergency expense. Similarly, the increase from budget consists of COVID-19 / Recovery Plan increases of $4.3 billion and $1.3 billion for CBR, partially offset by $0.2 billion in lower operating expense, capital grants and debt servicing costs.
Expense in 2021-22 and 2022-23, excluding COVID-19 / Recovery Plan, is forecast close to Budget 2020 expense, increasing $33 million and $239 million respectively. These reflect re-profiled capital grants, higher-cost cancer drugs and increased amortization due to more capital investment.
Operating Expense (excluding COVID-19 / Recovery Plan)
Operating expense (excluding
COVID-19 / Recovery Plan) is forecast to be $47.7 billion, a decrease of a net $64 million from budget. Alberta’s government has achieved $53 million of the $59 million in budgeted in-year savings. Main decreases consist of:
| • | | $129 million due to lower caseloads in income support programs (Community and Social Services); |
| • | | $129 million due to in-person class cancellations (Education); |
| • | | $38 million lower First Nation Development Fund grants from casino closures (Indigenous Relations): |
| • | | $30 million municipal sustainability grants cost-matched by funding under the federal Safe Restart Agreement, and included as COVID-19 operating expense (Municipal Affairs); |
| • | | $94 million lower AIMCo investment management costs from delays in adding assets (Treasury Bd. & Fin.). |
Main increases comprise:
| • | | $106 million for post-secondary operations (Adv. Ed.); |
| • | | $27 million mainly in federal funding for fighting mountain pine beetle infestations (Ag. & Forestry); |
| • | | $52 million for AISH caseload growth (Community and Soc. Services); |
| • | | $45 million for surface rights compensation (Envt. & Parks); |
| • | | $100 million net increase in Health: $130 million for higher drug and supplemental benefit costs, $150 million primarily due to AHS pressures in areas like continuing care, partly offset by $180 million in decreases mainly for physician compensation. Delays in achieving budgeted savings in AHS are largely offset by reduced non-COVID-19 activity in the health care system; |
| • | | $35 million for corporate income tax doubtful accounts (Treas. Bd. & Fin.). |
Capital Grants (excluding COVID-19 / Recovery Plan)
Capital grants of $2.3 billion are forecast for 2020-21, a decrease of $36 million from budget. Increases of $75 million primarily in Transportation municipal grants re-profiled from 2019-20, are more than offset by $111 million in decreases mainly due to re-profiling continuing care, federal Public Transit Infrastructure Fund, and Clean Water Wastewater Fund grants to future years.
Other Expense (excluding COVID-19 / Recovery Plan)
Other expense is forecast $1.2 billion higher than Budget 2020 due primarily to the $1,250 million provision for divestment of crude-by-rail contracts reported in the 2020-21 First Quarter Fiscal Update and Economic Statement. A $1.5 billion provision was estimated for 2019-20 in Budget 2019, but as not all contracts were assigned due to pandemic impacts, only $866 million in expense was included in 2019-20. As costs continue in 2020-21 and the value of the contracts has been significantly impacted by the global pandemic, oil markets and
reduced discounts Alberta producers face, the projected cost of divestment has increased to $2.1 billion. This remains below the estimated net cost of the CBR program, revised to $2.3-$2.7 billion in the first quarter report.
Amortization, inventory consumption and asset disposal loss expense has increased by $34 million, mainly due to higher consumption of cancer therapy and specialized high cost drugs. Debt servicing costs have declined by a net $92 million due to borrowing at much lower rates - approximately two percentage points lower - than anticipated at budget. Self-supported organization debt servicing costs have declined by $173 million, while taxpayer-supported debt servicing is up a net $81 million from budget. The $1.4 billion increase to the Capital Plan has required $1.5 billion more borrowing, but the lower rates have still reduced estimated Capital Plan debt servicing costs by $220 million. Fiscal Plan borrowing has increased $12.4 billion to deal with the revenue decline and expense increases induced by the COVID-19 pandemic and energy market turmoil. Fiscal Plan debt servicing costs are forecast $301 million greater than estimated in Budget 2020.
COVID-19 / Recovery Plan Expense
Total COVID-19 / Recovery Plan expense of $4.8 billion is forecast for 2020-21, with $1.8 billion estimated for the next two years, including a $750 million unallocated COVID-19 contingency in 2021-22.
Operating expense of $3.5 billion is forecast for 2020-21, comprising:
| • | | $76 million in Children’s Services for wage top-ups and child care programs funded through federal supports and the Safe Restart Agreement; |
| • | | $62 million in Community and Social Services for homeless shelters and federally-supported financial assistance for disability service providers; |
| • | | $276 million in Education, with $13 million for school nutrition and personal protective equipment, and |
| | |
| 6 | | 2020-21 Mid-year Fiscal Update and Economic Statement |
| | $263 million under the federal Safe Return to Class program; |
| • | | $421 million for site rehabilitation, with $392 million in 2021-22 and $192 million in 2022-23, in Energy; |
| • | | $277 million in Environment and Parks: $252 million from the Technology Innovation and Emissions Reduction (TIER) Fund, and $25 million from the federal Low Carbon Economy Leadership Fund (LCELF); another $77 million is budgeted from LCELF in 2021-22; |
| • | | $1 billion in Health, including the $500 million added in budget process; |
| • | | $316 million in Jobs, Economy and Innovation comprising $200 million in SME re-launch grants, $67 million in rental supports, $22 million for the tourism levy abatement, $1 million for entrepreneur supports, and TIER funding of $25 million provided to Alberta Innovates, which will also |
| | | receive a further $25 million over the next two years; |
| • | | $273 million in Labour and Immigration, with $209 million for the three-quarters of the 2020 calendar-year waiver of WCB premiums and $64 million for emergency isolation support; |
| • | | $658 million in Municipal Affairs reflecting $52 million for emergency centre operations, and $606 million for municipal operations and transit, half of which is funded from the Safe Restart Agreement; |
| • | | $60 million in Transportation Capital Maintenance and Renewal acceleration for pothole repairs; |
| • | | $29 million in Treasury Board and Finance, with $8 million for communications and $21 million representing the cost of providing the Orphan Well Association an interest-free loan; the new Innovation Employment Grant is estimated at |
| | | $15 million and $74 million in 2021-22 and 2022-23 respectively; |
| • | | $31 million in Agriculture is primarily for fire-fighting programs, $19 million in Culture is for overnight camps and community initiatives, and $30 million in Seniors is for lodges. |
Capital grants of $607 million are forecast for 2020-21, with $520 million for municipalities, $49 million from the TIER Fund for community and watershed resiliency, $29 million for strategic projects (Lethbridge Exhibition Centre, Northern Lights Gas Co-op, Terwillegar Drive), and $10 million in accelerated capital maintenance. Grants of $160 million in 2021-22 and a further $91 million in 2022-23 continue municipal support and strategic projects.
The purchase and use of personal protective equipment is estimated at $702 million in 2020-21, with $77 million in Municipal Affairs for emergency centres and $625 million for the health care system.
Total Expense
| | | | | | | | | | | | | | | | | | | | | | | | |
| (millions of dollars) | | 2019-20 | | | 2020-21 | | | Change fr. | | | 2021-22 | | | 2022-23 | |
| | | Actual | | | Budget | | | Forecast | | | Budget | | | Target | | | Target | |
Operating expense (net of in-year savings) | | | 48,616 | | | | 47,809 | | | | 47,745 | | | | (64 | ) | | | 47,451 | | | | 47,412 | |
Capital grants | | | 1,696 | | | | 2,302 | | | | 2,266 | | | | (36 | ) | | | 2,201 | | | | 2,168 | |
Amortization / loss on disposals | | | 2,642 | | | | 2,717 | | | | 2,720 | | | | 3 | | | | 2,822 | | | | 2,907 | |
Inventory consumption | | | 1,078 | | | | 1,140 | | | | 1,171 | | | | 31 | | | | 1,193 | | | | 1,215 | |
Debt servicing costs | | | 2,235 | | | | 2,505 | | | | 2,413 | | | | (92 | ) | | | 2,737 | | | | 2,965 | |
Pension provisions | | | (334 | ) | | | (415 | ) | | | (415 | ) | | | — | | | | (379 | ) | | | (275 | ) |
| | | | | | |
Expense (before COVID-19 / Recovery Plan, Contingency, Crude-by-rail) | | | 55,936 | | | | 56,056 | | | | 55,900 | | | | (156 | ) | | | 56,024 | | | | 56,394 | |
COVID-19 / Recovery Plan: | | | | | | | | | | | | | | | | | | | | | | | | |
Operating expense: | | | | | | | | | | | | | | | | | | | | | | | | |
Children’s Services | | | — | | | | — | | | | 76 | | | | 76 | | | | — | | | | — | |
Community and Social Services | | | 60 | | | | — | | | | 62 | | | | 62 | | | | — | | | | — | |
Education | | | — | | | | — | | | | 276 | | | | 276 | | | | — | | | | — | |
Energy | | | — | | | | — | | | | 421 | | | | 421 | | | | 392 | | | | 192 | |
Environment and Parks | | | — | | | | — | | | | 277 | | | | 277 | | | | 77 | | | | — | |
Health | | | 25 | | | | 500 | | | | 1,006 | | | | 506 | | | | — | | | | — | |
Jobs, Economy and Innovation | | | — | | | | — | | | | 316 | | | | 316 | | | | 20 | | | | 5 | |
Labour and Immigration | | | 114 | | | | — | | | | 273 | | | | 273 | | | | — | | | | — | |
Municipal Affairs | | | — | | | | — | | | | 658 | | | | 658 | | | | — | | | | — | |
Transportation | | | — | | | | — | | | | 60 | | | | 60 | | | | — | | | | — | |
Treasury Board and Finance | | | 2 | | | | — | | | | 29 | | | | 29 | | | | 15 | | | | 74 | |
Other (Ag. & Forestry; Cult., Multicult. & Stat. of Women; Snrs. & Housing) | | | 17 | | | | — | | | | 80 | | | | 80 | | | | — | | | | — | |
COVID-19 / Recovery Plan operating expense | | | 218 | | | | 500 | | | | 3,534 | | | | 3,034 | | | | 504 | | | | 271 | |
Capital grants (municipal) | | | — | | | | — | | | | 607 | | | | 607 | | | | 160 | | | | 91 | |
Inventory consumption (personal protective equipment) | | | — | | | | — | | | | 702 | | | | 702 | | | | — | | | | — | |
COVID-19 Contingency | | | — | | | | — | | | | — | | | | — | | | | 750 | | | | — | |
Total COVID-19 / Recovery Plan | | | 218 | | | | 500 | | | | 4,843 | | | | 4,343 | | | | 1,414 | | | | 362 | |
Crude-by-rail provision | | | 866 | | | | — | | | | 1,250 | | | | 1,250 | | | | — | | | | — | |
Contingency / disaster and emergency assistance—allocated | | | 1,356 | | | | — | | | | 567 | | | | 567 | | | | — | | | | — | |
Contingency / disaster and emergency assistance—unallocated | | | — | | | | 750 | | | | 183 | | | | (567 | ) | | | 750 | | | | 750 | |
Total Expense | | | 58,376 | | | | 57,306 | | | | 62,743 | | | | 5,437 | | | | 58,188 | | | | 57,506 | |
| | |
| 2020-21 Mid-year Fiscal Update and Economic Statement | | 7 |
Assets and Liabilities
Financial assets of $75.6 billion are forecast for March 31, 2021, a decrease of $758 million from March 31, 2020.
| • | | Assets of the Heritage, endowment and other funds are $250 million higher, from $195 million inflation-proofing of the Heritage Fund, based on Alberta CPI of 1.2 per cent, and from retention of endowment fund income less withdrawals. |
| • | | Assets from self-supporting lending activities (Agriculture Financial Services Corporation - AFSC; Alberta Capital Finance Authority - ACFA / local authority loans) are decreasing a net $29 million from 2019-20. AFSC is $160 million higher primarily as revenue from insurance and lending programs exceeds associated agriculture support and debt servicing costs. Assets of the former ACFA have decreased $189 million as the entity is dissolved, due to a $270 million cash withdrawal on wind-up. |
| • | | Government business enterprise (GBE) net equity has declined by $591 million, primarily from Alberta Petroleum Marketing Commission (APMC) and ATB Financial net losses. GBE equity continues to decrease |
| | | in 2021-22 and 2022-23, as APMC losses exceed other GBE net income. |
| • | | Other financial assets have decreased $78 million from 2019-20, with a $517 million withdrawal from the TIER Fund for stimulus partly offset by increases in other assets. |
Liabilities are forecast at $139.1 billion, $22.6 billion more than they were on March 31, 2020.
| • | | Taxpayer-supported debt is estimated at $97.4 billion on March 31, 2021, $23.3 billion greater than at year-end 2020. Capital Plan borrowing and P3 liabilities, less principal repayments, have increased $5.7 billion, while Fiscal Plan debt is $17.7 billion more. Taxpayer-supported debt is estimated to grow $27.6 billion, to $125 billion, by 2022-23, essentially reflecting deficits and net capital investment needs. This is $37.3 billion more than Budget 2020 forecast, due mainly to the $30.4 billion three-year revenue decrease, plus $5 billion in extra pre-borrowing in 2022-23. |
| • | | Debt of AFSC and issued to finance loans to local authorities has increased $538 million, with $499 million for local authority loans offset by an increase in net loans receivable. |
| • | | Government obligations for pension plan liabilities are $415 million lower, mainly from improved valuations for the two Teachers’ Pension Plans. Other liabilities have decreased $567 million. |
Net financial debt (financial assets less liabilities) is estimated at $63.5 billion for March 31, 2021, $23.3 billion more than on March 31, 2020, and essentially reflecting the increase in taxpayer-supported debt. The net debt to GDP (2020 forecast) ratio is 20.6 per cent.
Capital, non-financial assets less spent deferred capital contributions, have increased $2 billion to $53.5 billion, mainly displaying the difference between capital asset acquisition (capital investment less a 10 per cent contingency), and depreciation (amortization expense). The annual change in capital and non-financial assets is expected to slow with reduced capital investment and increasing amortization.
Net assets of negative $9.9 billion are forecast for March 31, 2021, a deterioration of $21.3 billion from 2020 reflecting the 2020-21 deficit. Net assets are estimated to decrease to negative $35.3 billion by 2022-23, based on $25.4 billion in deficits over two years.
Balance Sheet Summary a
| | | | | | | | | | | | | | | | | | | | |
(millions of dollars) | | At March 31 | |
| | 2020 | | | 2021 | | | 2021 | | | 2022 | | | 2023 | |
| | | Actual | | | Budget | | | Forecast | | | Target | | | Target | |
Financial Assets | | | | | | | | | | | | | | | | | | | | |
Heritage Fund, endowments and other funds | | | 20,670 | | | | 21,118 | | | | 20,920 | | | | 21,248 | | | | 21,666 | |
Self-supporting lending organizations / activities | | | 22,075 | | | | 23,046 | | | | 22,046 | | | | 23,331 | | | | 24,623 | |
Equity in commercial enterprises | | | 1,105 | | | | 1,258 | | | | 514 | | | | 211 | | | | 103 | |
Other financial assets | | | 32,531 | | | | 32,258 | | | | 32,143 | | | | 29,132 | | | | 30,489 | |
Total Financial Assets | | | 76,381 | | | | 77,680 | | | | 75,623 | | | | 73,922 | | | | 76,881 | |
| | | | | |
Liabilities | | | | | | | | | | | | | | | | | | | | |
Taxpayer-supported Capital Plan borrowing / liabilities (P3s) | | | 37,207 | | | | 41,461 | | | | 42,858 | | | | 47,420 | | | | 51,472 | |
Taxpayer-supported Fiscal Plan borrowing | | | 36,935 | | | | 42,211 | | | | 54,588 | | | | 64,912 | | | | 73,564 | |
Total taxpayer-supported debt / liabilities | | | 74,142 | | | | 83,672 | | | | 97,446 | | | | 112,332 | | | | 125,036 | |
Self-supporting lending organization / activity debt | | | 18,066 | | | | 18,605 | | | | 18,604 | | | | 18,851 | | | | 19,483 | |
Total debt | | | 92,208 | | | | 102,277 | | | | 116,050 | | | | 131,183 | | | | 144,519 | |
Pension liabilities | | | 8,918 | | | | 8,503 | | | | 8,503 | | | | 8,124 | | | | 7,849 | |
Other liabilities (including SUCH sector, coal phase-out payments) | | | 15,399 | | | | 15,492 | | | | 14,522 | | | | 14,621 | | | | 14,659 | |
Total Liabilities | | | 116,525 | | | | 126,272 | | | | 139,075 | | | | 153,928 | | | | 167,027 | |
Net Financial Assets / (Debt) | | | (40,144 | ) | | | (48,592 | ) | | | (63,452 | ) | | | (80,006 | ) | | | (90,146 | ) |
Capital / Other Non-financial Assets | | | 54,801 | | | | 56,068 | | | | 56,935 | | | | 58,105 | | | | 58,453 | |
Spent deferred capital contributions | | | (3,231 | ) | | | (3,360 | ) | | | (3,386 | ) | | | (3,526 | ) | | | (3,599 | ) |
Net Assets | | | 11,426 | | | | 4,116 | | | | (9,903 | ) | | | (25,427 | ) | | | (35,292 | ) |
| a | 2021 Budget, and 2022 and 2023 Target numbers have been restated to reflect 2019-20 Actual results. |
| | |
| 8 | | 2020-21 Mid-year Fiscal Update and Economic Statement |
Capital Plan
The three-year Budget 2020 Capital Plan has increased by $2.3 billion, to $21.6 billion. Spending in 2020-21 is forecast at $8.4 billion, an increase of $1.4 billion from budget, mainly due to strategic economic stimulus projects, higher municipal grants and accelerated Capital Maintenance and Renewal (CMR). Work is underway to support Alberta’s economic potential and job growth across the province. With the $1.5 billion investment in the Keystone XL pipeline, the total commitment to infrastructure in 2020-21 is $10 billion.
Capital Plan spending in 2021-22 is forecast to be $617 million more than Budget 2020, while 2022-23 spending has increased by $293 million.
The mid-year update includes a net increase of $9 million from first quarter, primarily due to a $215 million increase in transportation projects, offset by decreases of $188 million mainly from project re-profiling, including SUCH sector (schools, universities, colleges and health entities) self-financed projects, and a net $18 million in transfers to operating expense.
Most re-profiling results from changes to project progress. Adjustments for slower progress include: $18 million for the Lethbridge Exhibition Centre Expansion; $51 million for continuing
care beds; $46 million in school projects and playgrounds; $16 million in Investing in Canada Infrastructure Program projects; $32 million under the federal Public Transit Infrastructure Fund and Clean Water Wastewater Fund; $43 million in SUCH sector projects, such as Connect Care; and $32 million in general government and health facility projects.
Factors impacting project progress include the pace of construction, project scope, land conditions, timing related to tendering, permitting and planning, and rate of project identification, approval and construction under federal programs.
COVID-19 / Recovery Plan Projects
In response to COVID-19, and as part of Alberta’s Recovery Plan, shovel-ready CMR projects were identified, resulting in $937 million in planned Budget 2020 funding being accelerated: $734 million in 2020-21, $194 million in 2021-22 and $9 million in 2022-23. Over the three years, $465 million out of the total $937 million is for transportation CMR projects. In 2020-21, about one-third of the projects, or $250 million, are in schools across Alberta, $98 million is for post-secondary institution projects, while $293 million is for transportation projects.
Municipal support has also been increased by $700 million over three years, with additions of $520 million in 2020-21, $120 million in 2021-22 and $60 million in 2022-23. This includes an increase of $500 million in municipal grants in 2020-21, and $150 million for water infrastructure and $50 million under the Strategic Transportation Infrastructure Program.
Another $706 million has been added for strategic infrastructure projects, with $250 million of this budgeted in 2023-24 to 2025-26. These projects are expected to facilitate greater mobility and efficiency in Alberta’s transportation network, improving long-term productivity, attracting investment and spurring economic diversification. They are expected to immediately support 2,500 jobs, develop growth in the agriculture sector, and provide gas line extensions for northern residents and treatment facilities for Albertans recovering from addictions.
Capital Plan Summary
(millions of dollars)
| | | | | | | | | | | | | | | | | | | | |
| | | 2020-21 | | | 2021-22 | | | 2022-23 | | | 3-year | |
| | | Budget | | | Forecast | | | Target | | | Target | | | Total | |
| | | | | |
Municipal support | | | 1,854 | | | | 2,455 | | | | 1,992 | | | | 1,926 | | | | 6,373 | |
| | | | | |
Capital maintenance and renewal | | | 937 | | | | 1,640 | | | | 1,090 | | | | 872 | | | | 3,601 | |
| | | | | |
Protect quality health care | | | 863 | | | | 893 | | | | 778 | | | | 757 | | | | 2,429 | |
| | | | | |
Roads and bridges | | | 862 | | | | 1,075 | | | | 870 | | | | 876 | | | | 2,821 | |
| | | | | |
Renewing education infrastructure | | | 623 | | | | 510 | | | | 684 | | | | 430 | | | | 1,625 | |
| | | | | |
Streamlining service delivery | | | 337 | | | | 339 | | | | 313 | | | | 301 | | | | 954 | |
| | | | | |
Public safety and emergency services | | | 136 | | | | 170 | | | | 186 | | | | 187 | | | | 543 | |
| | | | | |
Agriculture and natural resources | | | 190 | | | | 209 | | | | 166 | | | | 147 | | | | 523 | |
| | | | | |
Family, social supports and housing | | | 176 | | | | 165 | | | | 93 | | | | 53 | | | | 311 | |
| | | | | |
Skills for jobs | | | 150 | | | | 150 | | | | 80 | | | | 59 | | | | 288 | |
| | | | | |
Sports and recreation | | | 88 | | | | 92 | | | | 111 | | | | 76 | | | | 279 | |
Total - core government | | | 6,216 | | | | 7,698 | | | | 6,365 | | | | 5,684 | | | | 19,747 | |
| | | | | |
SUCH sector (schools, universities, colleges, health entities) self-financed | | | 774 | | | | 731 | | | | 695 | | | | 432 | | | | 1,858 | |
| | | | | |
Total Capital Plan | | | 6,989 | | | | 8,429 | | | | 7,059 | | | | 6,116 | | | | 21,604 | |
| | |
| 2020-21 Mid-year Fiscal Update and Economic Statement | | 9 |
Alberta Fiscal Policy and Debt
The COVID-19 pandemic has brought uncertainty to the global economy, while rendering spending and revenue projections of governments around the world virtually unrecognizable from their initial targets for 2020.
The government of Alberta presented a fiscal plan in October 2019 that included modest budget reductions of 2.8 per cent to operating expense to achieve balance by 2022-23.
Budget 2020 continued implementation of the plan to balance the budget by 2022-23. It was presented to the Legislative Assembly in late February 2020, several weeks before the World Health Organization declared COVID-19 a global pandemic. With the outbreak of COVID-19, the government’s priorities changed.
The twin priorities of saving lives and livelihoods have required the government to adjust plans for balancing the budget, but have not altered the focus on good financial management and fiscal prudence.
While the public sector plays a key role in delivering public services, it does not create jobs or generate wealth. Rather, public sector activities and spending are paid by withdrawing money from the economy, through taxes, or by taking money from future taxpayers by borrowing for deficit financing.
Government’s role must be to strive to set the best possible conditions for private sector growth, including effective regulatory regimes and efficient government, right-touch financial supports reinforcing rather than subverting free enterprise, and a competitive tax regime.
Competitive Taxes
As of July 1, 2020, the Job Creation Tax Cut was fully implemented at 8 per cent, accelerated as part of the recovery plan. Alberta’s corporate income tax rate is now 30 per cent lower than the next lowest provincial rate and lower than the combined federal /state corporate income tax rate of 44 U.S. states.
Budget 2020 estimated that the Job Creation Tax Cut would benefit over 100,000 businesses in all sectors of the economy, and since 75 per cent of these businesses file taxes as small businesses, it benefits both small and large businesses.
Recent research shows that workers bear much of the cost of high corporate income taxes. A study by the University of Calgary’s School of Public Policy showed that, for every $1 increase in corporate income tax revenue due to a rate increase, aggregate wages in Alberta declined by at least 95 cents.
The Job Creation Tax Cut applies to all sectors of the economy and supports sustainable diversification. By reducing the tax on success, the measure rewards private sector growth and innovation.
The acceleration of the tax rate reduction as part of the Alberta’s Recovery Plan is intended to attract investment, support job-creation and enhance diversification by rewarding innovation and success, and by encouraging firms to relocate to Alberta. Speeding up the tax reduction will not only provide businesses with greater confidence and certainty as they recover from the pandemic, freeing up resources to hire Albertans and invest, but will also accelerate the economic returns to the province. At the same time, the Innovation Employment Grant will target small and medium-sized companies in the early stages of operation, then as they scale up they will phase out of the grant and begin to benefit from the Job Creation Tax Cut. The two initiatives will work together to support a wide range of businesses in Alberta.
While lowering the tax rate reduces tax revenue, there are two mitigating factors that offset this change. First, more corporate income will be earned in Alberta, as activity is shifted to where it can earn the highest return. Second, adding new firms and growing investment by existing companies supports greater employment, while expanding the personal income tax base as well.
Efficient Regulatory Regimes
and Efficient Government
On November 16 2020, the government of Alberta released its first annual report on Red Tape Reduction which highlights progress made towards the goal of cutting red tape by one-third. Between May 1, 2019 and June 30, 2020, Alberta’s government cut more than six per cent of red tape, saving job creators both time and money.
Reducing the regulatory burden and corresponding red tape is key to driving economic growth, improving government service delivery, and reducing compliance costs for Albertans and Alberta businesses. Achieving this efficiency is even more important within the context of the pandemic.
Red tape hits small businesses particularly hard. In 2017, businesses with fewer than five employees spent 178 hours per employee complying with government regulations, while those with 100 or more employees only spent 20 hours per employee. The Canadian Federation of Independent Business (CFIB) has estimated that regulation from all levels of government cost Canadian businesses $36 billion in 2017, with red tape accounting for $10 billion of that total.
In the last fiscal year, the Alberta government focused on cutting red tape in areas where job creators and innovators indicated there would be the greatest impact. The most significant impacts were realized by removing regulatory burden in Alberta’s largest industry sectors, freeing the businesses and Albertans who work and benefit from those sectors. By consulting with nine key industry panels, and reflecting on thousands of submissions from Albertans, government has cut red tape that job creators say will save industry over $476 million, which includes the elimination of 52,470 regulatory requirements.
Alberta’s government is responsible to taxpayers, and now is more important than ever to ensure programs and services are delivered in the most efficient manner possible.
| | |
| 10 | | 2020-21 Mid-year Fiscal Update and Economic Statement |
The Mackinnon Panel compared spending and outcomes in 2018-19 in key areas, including health care, K-12 education, post-secondary education, capital spending and public sector compensation. The report shows that Alberta’s spending per capita is by far the highest in Canada and over the last 25 years has consistently been higher than the average of all 10 provinces. Alberta’s annual expenditures would be $10.4 billion less if our per capita spending matched the average of spending in Canada’s three largest provinces: British Columbia, Ontario and Quebec.
Comparisons to other provinces are currently being adjusted, given the spending all provinces are undertaking to battle the pandemic and support economic recovery. But Alberta is spending more as well, and it is reasonable to assume the per capita differences will remain significant.
Alberta’s greater on average per capita spending is largely due to the boom and bust nature of resource-based economies. Government programs and services can expand with strong non-tax, non-fee revenue growth, and those spending objects and levels become embedded in an ongoing way. Put simply, revenue drives spending, and when revenue declines, as it does in Alberta with our volatile revenue mix, it is difficult to reverse or downsize those expanded programs and services.
For example, the boom years encouraged higher wages, in both the private and public sectors, but the private sector response to recent downturns has been rapid. Alberta’s government used strong revenue growth to balance the budget and repay debt two decades ago, shrinking debt servicing cost requirements.
The budget reductions that were identified in the 2019 budget would have helped to narrow the gap between Alberta’s spending levels and those of comparable provinces, but did not eliminate the differences.
Albertans deserve efficient government that aligns costs with what the same services cost in other provinces. But
there are no easy solutions to achieving that goal. Government is bringing in reasonable controls to the public service – built on fairness to all Albertans – but these adjustments will only be achieved as a result of very difficult negotiations with public sector unions.
Efforts to implement parity in other areas of government operations will similarly be challenging. All of these efforts are complicated by the difficult economic circumstances wrought by the pandemic.
Now that oil has been at relatively depressed prices for a long period of time, in part because Alberta has lacked pipeline capacity and because of global economic conditions, questions about the Alberta government’s revenue mix have become more prominent. These questions will not distract the government from efforts to ensure limited tax dollars are being used efficiently, are directed at core programs and services, and are effective in accomplishing program objectives.
Foundational Fiscal Policy
Government’s commitment to fiscal prudence in the context of the worst economic dislocation in Alberta since the 1930s requires flexibility and determination.
Flexibility dictates that government cannot adhere to the plan to balance the budget in 2022-23. Determination requires that government develop a transparent and sensible framework to guide towards a balanced budget, in a way that protects lives and livelihoods, while simultaneously protecting current and future Alberta taxpayers.
Alberta’s government has identified several indicators to help evaluate the province’s fiscal sustainability – that is, the ability to continue providing core services including health care, education, social services for vulnerable Albertans, an efficient and effective justice system and dependable infrastructure. These metrics will help guide work to address the deficit, improve the efficiency of government and solidify opportunities for a prosperous future. These are:
| | • | | Aligning per capita spending on par with that in comparator provinces; |
| | • | | Keeping the net debt to Gross Domestic Product (GDP) ratio well below 30 per cent; |
| | • | | Determining, once the COVID-19 pandemic is beaten, and its global impacts become clearer, a time frame for balancing the budget, and then developing a plan to repay debt being left to future Albertans. |
In the decade prior to 2015, costs and incomes in Alberta, including those of government, were generally higher than those in peer provinces – in many cases, substantially so. Due largely to very high levels of activity in Alberta’s energy sector, construction and labour costs exceeded the national average from heightened demand and competition for scarce labour and materials. And government revenue also boomed.
These factors provided some rationale for Alberta’s above-average spending on public services, including public sector compensation, but also elevated demands for more and enriched programs and services.
Since the recession of 2015-16, Alberta incomes and cost pressures have receded dramatically as energy sector activity and prices have declined, and as unemployment has grown. Alberta’s unemployment rate has exceeded the national average since April of 2016. As a result, any rationale for above-average public sector spending has been eroded.
Establishing a fiscal anchor helps guide decision-makers, in both good times and bad times. Evaluating spending levels and outcomes relative to other comparable jurisdictions, and striving to be as efficient, is one such metric.
Another anchor is the government’s net debt to GDP ratio. GDP is a measure of a jurisdiction’s income, so the ratio indicates the overall risk of the government, by indicating its ability to repay current debt.
Finally, the most straightforward and rigid fiscal anchor is some type of
| | |
| 2020-21 Mid-year Fiscal Update and Economic Statement | | 11 |
balanced budget rule, or in this case, a target date for balance.
Requiring budget balance reduces the short-term temptation for additional spending that is paid for by debt - by future taxpayers without their consent. Borrowing to pay for today’s programs and services decreases accountability for the efficiency with which programs are delivered, since citizens are only paying part of the costs of the services they receive. Increasing debt puts government finances at risk as interest costs compound and with interest rates paid on re-financing of debt certain to climb.
The benefits of establishing and being disciplined in achieving fiscal anchors is especially important for Alberta, because of our unique and extreme economic and revenue volatility. This is true both while times are rough, as now, but also when better times return.
Debt
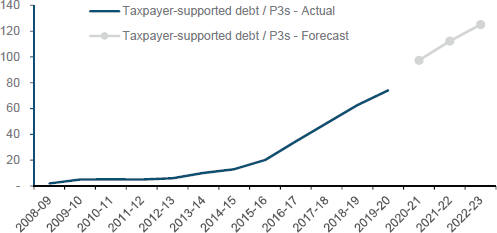
Alberta’s taxpayer-supported debt has risen dramatically over the past decade. It was $5.1 billion at the end of fiscal year 2010-11, with $3.2 billion from acquiring infrastructure assets through the Capital Plan, and $1.2 billion from re-structuring the Teachers’ Pension Plan liabilities. It is forecast at $97.4 billion by the end of 2020-21, and to climb to $125 billion by 2022-23.
The 2020-21 amount equates to over $22,000 per Albertan. While interest rates have been at historic lows, billions of dollars of debt will be maturing annually for the foreseeable future. A maturity of $5 billion with rates just 1 per cent higher adds $50 million to debt servicing cost expense - $50 million we have no choice to pay and $50 million less Alberta tax dollars available for seniors, children, low income or disabled Albertans, education or health care. A future fiscal anchor will have to include a structured debt repayment schedule.
Federal Government Impact
Alberta’s government will work diligently to right the fiscal ship, guided by these fiscal anchors and by Albertans’ hard work and aversion to the inequity of leaving our kids and grandkids to pay the bills for our programs and services. But we are not fully in control of our finances, as our fiscal condition is significantly affected by that of the federal government, and their policies. Federal government debt is projected at over $27,000 per person by year-end 2020-21.
Some Albertans feel that when times were good, we were treated as the cash cow, and now that we are in severe difficulty, we are perceived as an embarrassing neighbour. However one feels about whether Alberta is
getting a fair deal, there is no disputing the fact that the federal government’s decisions, international relations, and financial reputation or credit rating affect Alberta’s ability to attract investment and jobs, our borrowing rates and our opportunities for future prosperity.
Taxpayer-supported Debt
(billions of dollars)
| | |
| 12 | | 2020-21 Mid-year Fiscal Update and Economic Statement |
Economic Update
Overview
The Alberta economy is slowly coming out from the depths of the downturn caused by the dual shock of the COVID-19 pandemic and collapse in oil prices. The Alberta Activity Index, an indicator of provincial economic activity, has bounced back nearly 6 per cent since hitting a trough in May. The recovery has been led by households, and indicators like retail spending and housing have rebounded more strongly than anticipated. Business activity continues to lag behind, but there have been some bright spots. The agriculture sector is benefitting from strong crop conditions
3.7 per cent. As the economy moves closer to full recovery, growth will be increasingly driven by investment. Measures to support business investment, such as the acceleration of the Job Creation Tax Cut, are helping to set the foundation for growth as pandemic-related uncertainty abates. At the same time, a pick-up in population growth and a strengthening labour market will further lift consumer spending and housing activity.
The COVID-19 crisis is the latest in a series of challenges that Alberta’s
economy has faced in recent years, dating back to the 2014 oil price crash and 2015-16 recession. The result has been a prolonged period of weakness in the economy. Real GDP is not expected to return to pre-COVID levels, or even 2014 levels, until 2023. The recovery in the labour market will lag behind real GDP. While employment is expected to fully recover by 2022, the unemployment rate will remain elevated throughout the forecast period. Even as the economic recovery begins to take shape, real GDP per capita, a measure of standard of living, will remain below pre-COVID levels.
| | |
overall, and the forestry sector is seeing higher lumber prices. There has been support for natural gas producers with higher prices and investment in pipeline capacity. Even so, overall economic activity in the province remains well below February’s level. Recent indicators also suggest that momentum in the economy is slowing. Investment remains weak in the province, and the resurgence in COVID-19 cases in Alberta, Canada and around the world poses a headwind to the recovery. Nonetheless, continued government income support programs and increased public infrastructure spending will remain supportive of growth in the near term. Given the sharp contraction in the second quarter and the slowing pace of recovery, real gross domestic product (GDP) is expected to decline 8.1 per cent this year. While this is slightly better than the First Quarter forecast of an 8.8 per cent decline released in August, it is still the largest annual contraction in modern history. The province is expected to see a partial rebound in real GDP next year (Chart 1), led by a strong bounce back in oil production and consumer spending. However, elevated concerns about the virus are expected to limit gains in some parts of the economy, particularly those impacted by social distancing and other public health measures. In addition, muted global oil prices will temper prospects in the energy sector, while elevated uncertainty will keep non-energy investment subdued. Real GDP is forecast to grow 4.4 per cent in 2021. Over the medium term, real GDP growth is forecast to moderate to around | | Chart 1: Exports to lead economic recovery Contribution to Change in Alberta Real GDP by Expenditure 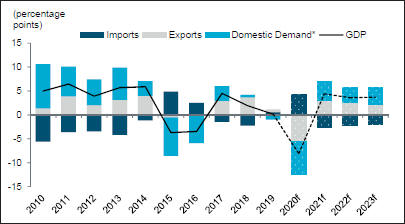
Sources: Statistics Canada, Haver Analytics, Alberta Treasury Board and Finance; f-forecast * Includes household, business and government spending Chart 2: Lower trajectory for oil prices West Texas Intermediate 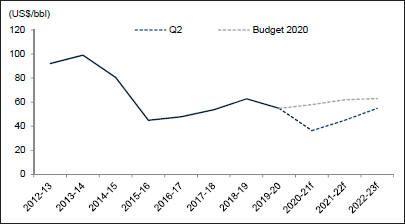
Source: Alberta Treasury Board and Finance; f-forecast |
| | |
| 2020-21 Mid-year Fiscal Update and Economic Statement | | 13 |
Moderate gains in oil prices
The recovery in global oil prices stalled heading into the fall amid a resurgence in COVID-19 infections around the world, which has intensified concerns about demand and the global economic recovery. After rebounding strongly through the summer, West Texas Intermediate (WTI) has swung widely from a low of US$37/barrel (bbl) in early September before moving back to around US$40/bbl. Abundant supply, amid weak demand and high inventories, is expected to keep a lid on prices in the short term. WTI is forecast to average US$36.40/bbl in 2020-21. Over the next year, a gradual rebalancing in the global oil market will be underpinned by a slow recovery in global petroleum demand and subdued growth in supply. This will lead to an appreciation in prices, with WTI improving slowly to US$45.00/bbl in 2021-22 and US$54.90/bbl by 2022-23. This is well below Budget 2020 expectations, when WTI was expected to climb above US$60/bbl by 2021-22 (Chart 2).
Oil production drives exports
A gradual ramp-up in oil production is expected to spearhead growth in real GDP. Oil production has bounced back on improving demand and prices after dropping over 800,000 barrels per day (bpd) between December 2019 and May 2020. It is forecast to average nearly 3.3 million bpd this year, about 250,000 bpd lower than in 2019.
Building on improving demand in the second half of this year, oil production is anticipated to rebound in 2021. It is forecast to expand by an average of nearly 222,000 bpd (or 7 per cent) to reach 3.5 million bpd in 2021, before growing at a more modest pace in 2022 and 2023. The increase will be led by oil sands production, which is expected to fully recover by next year, aided by the lifting of oil production limits in December 2020. In contrast, conventional production is not expected to return to 2019 levels throughout the forecast period. Overall, total oil production in the province is forecast to climb to nearly 3.8 million bpd by 2023. It will remain a key driver of exports, accounting for roughly half of the annual growth in real overall exports over the forecast period.
Narrow differentials support prices
The differential between WTI and Western Canadian Select (WCS) has remained in a tight range since the spring, as voluntary production shut-ins have significantly eased transportation bottlenecks in the province. Export pipeline capacity is set to improve from targeted debottlenecking and the start-up of the Sturgeon Refinery and Gibson/USD’s diluent recovery unit, which are expected to free up some space on the pipeline system. In addition, the completion of the U.S. portion of Enbridge’s Line 3 replacement and
Trans Mountain Expansion (TMX) are expected to add more than 800,000 bpd of pipeline capacity by the end of 2022.
With export capacity anticipated to meet growing oil production, the light-heavy differential will continue to reflect pipeline transportation costs. It is expected to widen slightly from an average of US$11/barrel in 2020-21 to around US$14/bbl in the following two years. This, along with the modest improvement in WTI, will help lift WCS prices to above US$40/bbl by 2022-23.
Construction of all three major pipeline projects has made some headway to date, but regulatory and legal headwinds continue. Delays in obtaining environmental permits have deferred the expected in-service date for the Line 3 replacement to the second half of 2021. Although the cross-border section of Keystone XL (KXL) project has been completed and work on the Alberta segment commenced in the summer, ongoing regulatory hurdles have slowed construction of the project south of the border and delayed completion. Alberta’s government is committed to the project and will strongly advocate for its success with the new U.S. administration. A positive decision by the Supreme Court of Canada has provided a much needed boost to the TMX project, which is still on track to be completed by the end of 2022. All three pipelines are critical to support future growth in the energy sector.
| | | | |
| | Impact of Provincial COVID-19 Economic Support and Measures In response to the unprecedented dual crises of the COVID-19 pandemic and collapse in oil prices, the Alberta government has introduced numerous programs and measures to protect the health of Albertans, provide financial support to families and businesses, and increase infrastructure spending to stimulate the economy. This spending amounts to over $6 billion from 2019-20 to 2021-22, the majority of which will be spent in 2020-21. The province has accelerated the reduction in the CIT rate and committed more than $3.0 billion in waivers and payment deferrals to provide immediate relief to struggling individuals and businesses, in addition to a $1.5 billion investment to the Keystone XL pipeline project. The latter is expected to boost the province’s egress capacity and provide access to the U.S. Gulf Coast region, a key market for Alberta’s heavy crude. The economic impact is significant. These measures are estimated to lift Alberta’s real GDP by $8.2 billion (or 2.6 per cent) in 2020 and $3.4 billion (or 1 per cent) in 2021, compared to a scenario without provincial economic measures. Business investment is estimated to be about $2.1 billion higher on average in 2020 and 2021. With the higher operational spending, business investment, and provincial infrastructure spending, employment in the province is estimated to be about 32,200 higher in 2020 and 23,600 higher in 2021. The investments made in protecting the health of Albertans, protecting their jobs, and protecting their businesses have significantly reduced the economic impact of the pandemic in 2020, and will set the foundation for the Alberta economy to continue recovering in 2021 and beyond. | | |
| | |
| 14 | | 2020-21 Mid-year Fiscal Update and Economic Statement |
Exports to rise
Exports have improved alongside an upturn in global activity, although slowing economic momentum in the U.S. and globally is keeping a lid on the recovery. Exports of refined petroleum products have bounced back strongly from pandemic lows on improving demand, while forestry exports are nearing record highs due to strong prices and a rebound in residential construction activity. The food manufacturing sector has also held up well during the pandemic, with sales up 5.5 per cent through September. However, other exports, such as chemicals and machinery
reducing GHG emissions and improving future returns. For example, Suncor is planning to spend $1.4 billion over the next four years to replace petroleum coke-fired boilers with highly efficient natural gas cogeneration units at its base plant in Fort McMurray, Alberta. Once completed, the project will reduce greenhouse gas emissions at the plant by 25 per cent. The company is also spending $300 million over the next two years on a wind power project in southern Alberta. In contrast, drilling activity has stabilized at very low levels, but subdued prices are expected to
keep a lid on conventional activity heading into the winter drilling season. Conventional investment is forecast to see marginal improvement next year before gaining traction in 2022 and 2023. This will be supported by growing natural gas activity in the province, as global demand for gas and related products is expected to rebound and be sustained by population growth, the transition from coal to gas electricity, and rising standards of living.
| | |
and equipment, continue to struggle. Meanwhile, service exports are expected to be slower to pick up amid ongoing travel restrictions and sluggish recovery in business-related services. As global economic activity improves and COVID-19 impacts dissipate, non-energy exports are expected to pick up and increasingly contribute to growth in overall exports. These will help lift growth in real overall exports to around 4 per cent in 2022 and 2023. Oil sands leads energy investment The unprecedented decline in oil demand, accompanied by the collapse in oil prices in the spring, have significantly impaired balance sheets of Canadian oil producers and prompted further consolidation in the industry. While investment in oil and gas extraction is expected to turn positive next year on improving demand and prices, producers are expected to maintain capital discipline and gradually increase production to meet demand. After plunging more than an estimated 30 per cent this year, oil and gas investment is forecast to increase by nearly $1.7 billion, or 9.3 per cent, in 2021. Growth is expected to accelerate in 2022 and 2023, averaging about $2.6 billion (or 12 per cent) per year. While oil and gas investment is expected to pick up, it is not expected to return to 2019 level throughout the forecast period (Chart 3). The growth in investment will be led by the non-conventional sector. Sustaining capital is expected to increase alongside a quicker recovery in bitumen production. Investment will also be propped up by strategic spending initiatives aimed at | | Chart 3: Oil and gas investment will remain below 2019 levels Alberta Nominal Oil and Gas Investment and Crude Oil Production 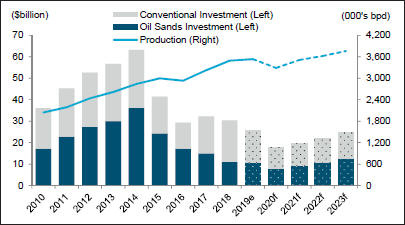
Sources: Statistics Canada, Alberta Treasury Board and Finance; e-estimate, f-forecast Chart 4: Non-energy investment to accelerate over the medium term Change in Private Non-residential Investment in Alberta 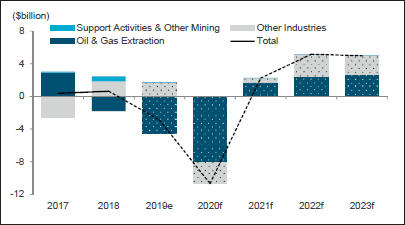
Sources: Statistics Canada, Haver Analytics, Alberta Treasury Board and Finance; e-estimate, f-forecast |
| | |
| 2020-21 Mid-year Fiscal Update and Economic Statement | | 15 |
Non-energy investment to pick up
Investment intentions outside the energy sector have pulled back significantly, as many companies have either delayed or cancelled expansion plans amid weaker profits and heightened economic uncertainty. At the same time, the commercial real estate sector is facing additional headwinds from rising vacancies. Business investment outside oil and gas extraction is forecast to fall about 9 per cent this year after growing over the last two years. The weakness
is being partially offset by a ramp-up in provincial infrastructure spending. Economic support measures, including the provincial government’s investment in the KXL project, are also helping to support private sector investment in the near term (see page 15).
As pandemic-related uncertainty dissipates, non-energy investment is expected to stabilize next year before accelerating over the medium term (Chart 4). Projects that will support the province’s transition towards natural gas and renewable energy are expected to
provide a lift. With the federal approval announced this fall, construction of TC Energy’s $2.3 billion expansion of its Nova Gas Transmission System is expected to ramp starting next year. Overall, non-energy investment is forecast to increase by an average of nearly $2.5 billion (or 8.6 per cent) per year in 2022 and 2023.
Protracted jobs recovery
Alberta’s labour market continues to make headway, but it still has a long way to go. With the strong gains since May, employment has now recovered more than 258,000 (or 72 per cent) of the 360,900 jobs lost between February
| | |
Chart 5: Unemployment rate to ease gradually Labour Market Indicators 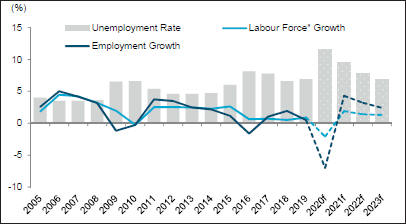
Sources: Statistics Canada, Haver Analytics, Alberta Treasury Board and Finance; f-forecast * The number of people working or looking for work Chart 6: Population growth to pick up after near-term slowdown Annual Change in Alberta Population by Component 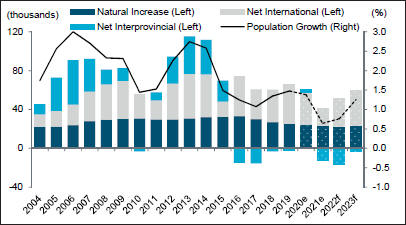
Sources: Canada Mortgage and Housing Corporation, Haver Analytics, Alberta Treasury Board and Finance; e-estimate, f-forecast | | and April. The unemployment rate has also come down from the record highs in the spring. Despite the improvement, employment remains more than 100,000 below February’s level, with the recovery in full-time and private sector jobs a long way off. Employment is forecast to contract 7 per cent in 2020. While the labour market is expected to gradually strengthen over the medium term, the road to recovery will be slow and uneven. Social distancing measures and limits on travel and large gatherings will restrain growth in some sectors, such as accommodation and food services, transportation and other close-contact services. At the same time, a prolonged recovery in business investment will temper gains in oil and gas extraction and construction employment. As a result, headline employment is forecast to see a partial rebound of 4.3 per cent in 2021 before growing at an average of 2.8 per cent in the following two years (Chart 5). Employment is not forecast to surpass the 2019 level until 2022. Unemployment to slowly decline Despite the labour market improvement, unemployment in the province remains high. The unemployment rate is forecast to remain elevated and average 11.6 per cent this year. Job gains have struggled to keep pace with the increase in the number of people looking for work since the economy reopened. Unemployment has been largely concentrated among youth (15-24 age group) as well as those who are long-term unemployed or have not |
| | |
| 16 | | 2020-21 Mid-year Fiscal Update and Economic Statement |
worked before. The latter currently represents more than 35 per cent of total unemployed in the province.
Given the uneven recovery across industries and segments of the population, the unemployment rate is expected to decline slowly. A slower pace of labour force expansion arising from weaker migration and an aging population will help the labour market gradually rebalance over the medium term. However, given the depth of the contraction and prolonged recovery in employment, the unemployment rate is not expected to move closer to the 2019 level until 2023, when it averages 6.8 per cent.
Population growth to slow
Alberta’s population growth is set to slow in the near term. International travel restrictions will continue to weigh heavily on immigration, while relatively weaker economic conditions in the province will lead to net outflows of interprovincial migrants. These factors will keep annual population growth below 1 per cent in the next two census years. Natural increase will become a major driver of growth.
propel a strong rebound in residential construction investment. Government income supports, along with mortgage and other loan payment deferrals, have also buffered the housing market from the worst impact of the pandemic. After slowing to 21,600 units this year, housing starts are expected to pick up modestly over the medium term. With the Bank of Canada expected to keep interest rates unchanged through 2023, low mortgage rates will continue to support housing demand in the coming years. However, slower population growth, along with the protracted recovery in the labour market, are likely to keep a lid on growth. As a result, housing starts are expected to pick up slightly to 23,500 units next year before gradually increasing to nearly 28,000 by 2023 (Chart 7). This is well below Budget 2020 expectations, when housing starts were forecast to move higher than 35,000 units by 2023.
Services a drag on spending
The recovery in consumer spending has outpaced other parts of economy, as government income support programs have blunted the impact of the pandemic on household incomes. Retail sales
have now surpassed February levels. However, with the shift in spending patterns and increase in precautionary savings among consumers, the rebound in goods spending has been largely contained in essentials and renovation-related categories. Spending in other discretionary categories, such motor vehicle sales and clothing, has improved somewhat, but remains lacklustre. Meanwhile, spending on services – which account for nearly 60 per cent of overall consumer spending – remains weak, reflecting pandemic-related impact on travel, restaurants, and entertainment.
Lingering concerns over the virus and prolonged recovery in the labour market will likely restrain growth in real consumer spending next year. After declining by more than 6 per cent this year, it is forecast to partially rebound by 5.6 per cent in 2021. It is expected to improve further in 2022 and 2023 as population growth picks up and the labour market improves.
| | |
Population growth is forecast to rise to 1.3 per cent in 2023 (Chart 6) as travel restrictions are lifted and international migration is expected to return to pre-COVID levels. Given the prolonged economic recovery in Alberta relative to other provinces due to the dual COVID and energy shock, net interprovincial outflows are expected to continue but moderate over the medium term. Housing market resilient The housing market has held up relatively well compared with other sectors of the economy. It has benefitted from historically low mortgage rates, pent-up demand and improving consumer confidence. Shifting preference among homebuyers towards bigger spaces to accommodate remote work or learning have also supported the recovery. The rebound has been most pronounced in the resale market, where home sales in October have surpassed pre-COVID levels. While new housing construction has only partially recovered, a surge in renovation activity has helped | | Chart 7: Housing starts to rise but remain below Budget expectations Alberta Housing Starts 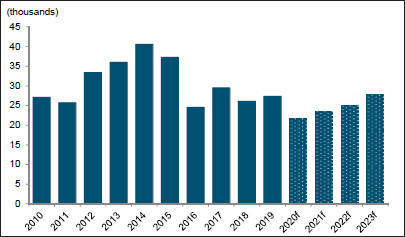
Sources: Canada Mortgage and Housing Corporation, Haver Analytics, Alberta Treasury Board and Finance; f-forecast |
| | |
| 2020-21 Mid-year Fiscal Update and Economic Statement | | 17 |
Risks to Outlook
The uncertainty surrounding the pandemic creates a number of risks to the Alberta economy and provincial government revenues.
The low scenario assumes a weaker recovery in oil prices compared with the base case, which could be driven by a number of factors. For example, a severe and prolonged second wave of infections leading to a broad-based shut down of economices around the world would derail the recovery in global demand and prolong the rebalancing in global oil markets. This would weigh heavily on energy exports and investment in the
province. At the same time, lingering uncertainty and a weaker recovery in the U.S. and global economy would dampen activity in other sectors, such as consumer spending and non-energy investment. These negative impacts would be partially cushioned by a weaker Canadian dollar and continued low interest rates. In this case, the recovery in real GDP and employment is expected to be weaker compared with the base case. Lower oil prices and a weaker economic recovery would negatively impact Alberta’s resource and tax revenues.
On the upside, a stronger-than-expected recovery in the global economy would
pave the way for a faster rebalancing in the global oil market. Higher oil prices would drive energy sector investment and production higher relative to the base case. In this case, real GDP and employment are expected to surpass 2019 levels in 2022. Higher oil prices and a faster economic recovery would translate to significant increases in provincial government revenues.
These scenarios do not include any additional government responses, which would either buffer the downside risks to the economy in the low case or temper the upside risks in the high case.
| | | | | | | | | | | | | | | | | | | | | | | | | | | | |
| Table 1: Scenario Impacts | | | | | | | | | | | | | | | | | | | | | |
| Fiscal Year Assumptions | | | | | 2020-21 | | | | | | 2021-22 | | | | | | | | | 2022-23 | |
WTI (US$/bbl) | | | | | | | | | | | | | | | | | | | | | | | | | | | | |
Base | | | | | | | 36.40 | | | | | | | | 45.00 | | | | | | | | | | | | 54.90 | |
High | | | | | | | 39.50 | | | | | | | | 55.80 | | | | | | | | | | | | 62.90 | |
Low | | | | | | | 34.90 | | | | | | | | 37.10 | | | | | | | | | | | | 45.00 | |
Light-Heavy Differential (US$/bbl) | | | | | | | | | | | | | | | | | | | | | | | | | | | | |
Base | | | | | | | 11.10 | | | | | | | | 14.00 | | | | | | | | | | | | 13.80 | |
High | | | | | | | 11.10 | | | | | | | | 14.30 | | | | | | | | | | | | 15.70 | |
Low | | | | | | | 11.10 | | | | | | | | 13.60 | | | | | | | | | | | | 12.70 | |
Exchange Rate (US¢/Cdn$) | | | | | | | | | | | | | | | | | | | | | | | | | | | | |
Base | | | | | | | 74.6 | | | | | | | | 76.2 | | | | | | | | | | | | 77.2 | |
High | | | | | | | 75.1 | | | | | | | | 78.3 | | | | | | | | | | | | 79.2 | |
Low | | | | | | | 74.3 | | | | | | | | 74.7 | | | | | | | | | | | | 75.5 | |
Tax and Resource Revenue ($billions)* | | | | | | | | | | | | | | | | | | | | | | | | | | | | |
Base | | | | | | | 17.4 | | | | | | | | 18.9 | | | | | | | | | | | | 23.1 | |
Variance from base | | | | | | | | | | | | | | | | | | | | | | | | | | | | |
High | | | | | | | 0.9 | | | | | | | | 4.4 | | | | | | | | | | | | 4.0 | |
Low | | | | | | | -0.3 | | | | | | | | -2.4 | | | | | | | | | | | | -4.4 | |
| Calendar Year Assumptions | | 2020 | | | | | | 2021 | | | | | | 2022 | | | | | | 2023 | |
Real GDP (% Change) | | | | | | | | | | | | | | | | | | | | | | | | | | | | |
Base | | | -8.1 | | | | | | | | 4.4 | | | | | | | | 3.6 | | | | | | | | 3.7 | |
High | | | -8.1 | | | | | | | | 6.3 | | | | | | | | 5.0 | | | | | | | | 4.2 | |
Low | | | -8.1 | | | | | | | | 2.1 | | | | | | | | 3.3 | | | | | | | | 3.6 | |
Nominal GDP (% Change) | | | | | | | | | | | | | | | | | | | | | | | | | | | | |
Base | | | -12.9 | | | | | | | | 7.7 | | | | | | | | 8.7 | | | | | | | | 7.3 | |
High | | | -12.5 | | | | | | | | 13.8 | | | | | | | | 8.7 | | | | | | | | 8.2 | |
Low | | | -13.0 | | | | | | | | 2.2 | | | | | | | | 6.9 | | | | | | | | 9.0 | |
Employment (thousands) | | | | | | | | | | | | | | | | | | | | | | | | | | | | |
Base | | | 2,178 | | | | | | | | 2,273 | | | | | | | | 2,346 | | | | | | | | 2,404 | |
High | | | 2,178 | | | | | | | | 2,295 | | | | | | | | 2,396 | | | | | | | | 2,464 | |
Low | | | 2,178 | | | | | | | | 2,245 | | | | | | | | 2,302 | | | | | | | | 2,361 | |
* Tax revenue includes personal and corporate income taxes, fuel tax, tobacco/vaping taxes, cannabis tax, insurance premiums tax, and the tourism levy. | |
| | |
| 18 | | 2020-21 Mid-year Fiscal Update and Economic Statement |
Key Energy and Economic Assumptions
| | | | | | | | | | | | | | | | | | | | | | | | |
| | | 2018-19 | | | 2019-20 | | | 2020-21 Forecast | | | 2021-22 | | | 2022-23 | |
| Fiscal Year Assumptionsa | | Actuals | | | Actuals | | | Budget | | | Q2 | | | Forecast | | | Forecast | |
Crude Oil Pricesb | | | | | | | | | | | | | | | | | | | | | | | | |
WTI (US$/bbl) | | | 62.77 | | | | 54.85 | | | | 58.00 | | | | 36.40 | | | | 45.00 | | | | 54.90 | |
Light-Heavy Differential (US$/bbl) | | | 23.31 | | | | 14.82 | | | | 19.10 | | | | 11.10 | | | | 14.00 | | | | 13.80 | |
WCS @ Hardisty (Cdn$/bbl) | | | 51.65 | | | | 53.14 | | | | 51.20 | | | | 33.80 | | | | 40.80 | | | | 53.30 | |
Natural Gas Priceb | | | | | | | | | | | | | | | | | | | | | | | | |
Alberta Reference Price (Cdn$/GJ) | | | 1.34 | | | | 1.39 | | | | 1.70 | | | | 2.10 | | | | 2.50 | | | | 2.50 | |
Production | | | | | | | | | | | | | | | | | | | | | | | | |
Conventional Crude Oil (thousands of barrels/day) | | | 489 | | | | 487 | | | | 488 | | | | 401 | | | | 412 | | | | 419 | |
Raw Bitumen (thousands of barrels/day) | | | 3,007 | | | | 3,085 | | | | 3,249 | | | | 2,869 | | | | 3,126 | | | | 3,237 | |
Natural Gas (billions of cubic feet) | | | 4,158 | | | | 4,045 | | | | 4,144 | | | | 3,901 | | | | 3,917 | | | | 3,962 | |
Interest Ratesb | | | | | | | | | | | | | | | | | | | | | | | | |
3-month Canada Treasury Bills (%) | | | 1.49 | | | | 1.56 | | | | 1.70 | | | | 0.20 | | | | 0.20 | | | | 0.20 | |
10-year Canada Bonds (%) | | | 2.19 | | | | 1.42 | | | | 2.00 | | | | 0.60 | | | | 0.60 | | | | 0.70 | |
Exchange Rate (US¢/Cdn$)b | | | 76.2 | | | | 75.2 | | | | 76.5 | | | | 74.6 | | | | 76.2 | | | | 77.2 | |
| | | | | | | | | | | | | | | | | | | | | | | | | | | | |
| | | 2018 | | | 2019 | | | 2020 Forecast | | | 2021 | | | 2022 | | | 2023 | |
| Calendar Year Assumptionsa | | Actuals | | | Actuals | | | Budget | | | Q2 | | | Forecast | | | Forecast | | | Forecast | |
Gross Domestic Product | | | | | | | | | | | | | | | | | | | | | | | | | | | | |
Nominal (billions of dollars) | | | 343.7 | | | | 352.9 | | | | 360.3 | d | | | 307.4 | | | | 331.0 | | | | 359.8 | | | | 386.1 | |
% change | | | 3.4 | | | | 2.7 | | | | 2.8 | d | | | -12.9 | | | | 7.7 | | | | 8.7 | | | | 7.3 | |
Real (billions of 2012 dollars) | | | 346.6 | | | | 347.1 | | | | 356.5 | d | | | 319.0 | | | | 333.0 | | | | 345.0 | | | | 357.8 | |
% change | | | 1.9 | | | | 0.1 | | | | 2.5 | d | | | -8.1 | | | | 4.4 | | | | 3.6 | | | | 3.7 | |
Other Indicators | | | | | | | | | | | | | | | | | | | | | | | | | | | | |
Employment (thousands) | | | 2,331 | | | | 2,343 | | | | 2,375 | | | | 2,178 | | | | 2,273 | | | | 2,346 | | | | 2,404 | |
% change | | | 1.9 | | | | 0.5 | | | | 1.4 | | | | -7.0 | | | | 4.3 | | | | 3.2 | | | | 2.4 | |
Unemployment Rate (%) | | | 6.6 | | | | 6.9 | | | | 6.7 | | | | 11.6 | | | | 9.5 | | | | 7.8 | | | | 6.8 | |
Average Weekly Earnings (% change) | | | 1.7 | | | | 1.4 | | | | 2.8 | | | | 4.0 | | | | 0.2 | | | | 2.1 | | | | 2.5 | |
Primary Household Income (% change) | | | 1.9 | | | | 1.5 | | | | 4.4 | | | | -4.3 | | | | 4.8 | | | | 5.0 | | | | 4.8 | |
Net Corporate Operating Surplus (% change) | | | 11.0 | | | | 8.7 | | | | -2.7 | | | | -56.5 | | | | 30.5 | | | | 68.7 | | | | 30.5 | |
Housing Starts (thousands of units) | | | 26.1 | | | | 27.3 | | | | 28.0 | | | | 21.6 | | | | 23.5 | | | | 25.0 | | | | 27.9 | |
Alberta Consumer Price Index (% change) | | | 2.4 | | | | 1.8 | | | | 2.0 | | | | 1.2 | | | | 1.5 | | | | 1.8 | | | | 2.1 | |
Retail Sales (% change) | | | 1.8 | | | | -0.8 | | | | 4.0 | | | | -5.4 | | | | 7.1 | | | | 6.8 | | | | 6.9 | |
Population (thousands) | | | 4,298 | | | | 4,362 | | | | 4,439 | | | | 4,422 | c | | | 4,450 | | | | 4,484 | | | | 4,540 | |
% change | | | 1.3 | | | | 1.5 | | | | 1.6 | | | | 1.4 | c | | | 0.6 | | | | 0.8 | | | | 1.3 | |
Net Migration (thousands) | | | 30.3 | | | | 37.6 | | | | 40.6 | | | | 35.4 | c | | | 4.7 | | | | 11.1 | | | | 33.0 | |
| a | Forecast was finalized on October 16, 2020 |
| b | Forecasts have been rounded |
| d | Budget forecast was finalized prior to the release of the Provincial Economic Accounts 2019 actuals on November 9, 2020. |
| | |
| 2020-21 Mid-year Fiscal Update and Economic Statement | | 19 |
Benchmarking Tables
| | | | | | | | | | | | | | | | |
Oil Price Benchmark | | | | | | | | | | | | | | | | |
West Texas Intermediate (US$/bbl) | | | | | | | | | | | | |
| Organization | | 2020 | | | 2021 | | | 2022 | | | 2023 | |
National Forecasting Agencies | | | | | | | | | | | | | | | | |
Conference Board of Canada (September 21, 2020) | | | 38.77 | | | | 48.56 | | | | 53.76 | | | | 57.79 | |
Stokes Economics (October 16, 2020) | | | 34.01 | | | | 43.08 | | | | 50.39 | | | | 54.50 | |
Banks and Investment Dealers | | | | | | | | | | | | | | | | |
Credit Suisse (July 7, 2020) | | | 38.00 | | | | 45.00 | | | | 55.00 | | | | 55.00 | |
Goldman Sachs (October 2020) | | | 40.53 | | | | 55.88 | | | | 55.00 | | | | n/a | |
Laurentian Bank (October 7, 2020) | | | 38.57 | | | | 46.25 | | | | 50.00 | | | | 55.00 | |
National Bank (September 2020) | | | 37.00 | | | | 49.00 | | | | n/a | | | | n/a | |
RBC Capital Markets (October 16, 2020) | | | 38.77 | | | | 46.15 | | | | n/a | | | | n/a | |
Scotiabank (October 15, 2020) | | | 39.00 | | | | 48.00 | | | | 52.00 | | | | n/a | |
TD Bank (October 14, 2020) | | | 39.00 | | | | 46.00 | | | | 52.00 | | | | n/a | |
Industry Analysts | | | | | | | | | | | | | | | | |
U.S. Energy Information Administration (October 6, 2020) | | | 38.76 | | | | 44.72 | | | | n/a | | | | n/a | |
GLJ Petroleum Consultants (October 1, 2020) | | | 39.24 | | | | 44.00 | | | | 47.50 | | | | 52.50 | |
Sproule Associates Limited (September 30, 2020) | | | 39.24 | | | | 47.00 | | | | 53.00 | | | | 57.00 | |
Confidential Forecasts Provided to the Government of Albertaa | | | | | | | | | | | | | | | | |
Average | | | 39.00 | | | | 48.00 | | | | 55.00 | | | | 59.00 | |
High | | | 42.67 | | | | 60.17 | | | | 68.54 | | | | 71.70 | |
Low | | | 34.01 | | | | 40.65 | | | | 46.00 | | | | 51.00 | |
Average of All Private Forecasts | | | 39.00 | | | | 47.00 | | | | 53.00 | | | | 57.00 | |
Government of Alberta (calendar year) | | | 38.30 | | | | 42.50 | | | | 53.00 | | | | 56.00 | |
Includes forecasts finalized on or before October 16, 2020.
| a | The Government of Alberta surveys, on a confidential basis, private sector forecasts from PIRA, the Bank of Montreal, IHS Markit, Stratas Advisors, and Wood Mackenzie. The annual figures presented here are an average of the forecast prices from these sources. High/Low forecasts may represent one of the confidential forecasts. The private sector average, consultant average and Government of Alberta forecasts have been rounded to the nearest dollar. |
| | | | | | | | | | | | | | | | |
Light-Heavy Oil Price Differential Benchmark | | | | | | | | | | | | | | | | |
| WTI-WCS Price Differential ($US/bbl) | | 2020 | | | 2021 | | | 2022 | | | 2023 | |
High | | | 13.64 | | | | 15.00 | | | | 15.00 | | | | 15.02 | |
Low | | | 8.69 | | | | 8.43 | | | | 11.90 | | | | 10.65 | |
Average of All Private Forecasts | | | 12.20 | | | | 13.00 | | | | 13.30 | | | | 13.00 | |
Government of Alberta (calendar year) | | | 12.90 | | | | 13.90 | | | | 13.80 | | | | 14.10 | |
Number of Private Sector Forecasters | | | 10 | | | | 10 | | | | 9 | | | | 8 | |
Includes forecasts finalized on or before October 16, 2020.
| | |
| 20 | | 2020-21 Mid-year Fiscal Update and Economic Statement |
| | | | | | | | |
United States / Canada Exchange Rate Benchmark |
| (US¢/Cdn$) | | 2020 | | 2021 | | 2022 | | 2023 |
High | | 74.7 | | 78.1 | | 79.5 | | 77.9 |
Low | | 73.8 | | 74.5 | | 71.5 | | 77.0 |
Average of All Private Forecasts | | 74.3 | | 76.5 | | 76.3 | | 77.3 |
Government of Alberta (calendar year) | | 74.3 | | 76.0 | | 76.9 | | 77.9 |
Number of Private Sector Forecasters | | 10 | | 10 | | 6 | | 3 |
Alberta Real Gross Domestic Product Benchmark |
| (% change) | | 2020 | | 2021 | | 2022 | | 2023 |
High | | -6.4 | | 7.9 | | 6.6 | | 4.1 |
Low | | -11.3 | | 3.8 | | 3.3 | | 3.9 |
Average of All Private Forecasts | | -7.7 | | 5.0 | | 4.6 | | 4.0 |
Government of Alberta (calendar year) | | -8.1 | | 4.4 | | 3.6 | | 3.7 |
Number of Private Sector Forecasters | | 9 | | 9 | | 5 | | 2 |
Alberta Nominal Gross Domestic Product Benchmark |
| (% change) | | 2020 | | 2021 | | 2022 | | 2023 |
High | | -9.2 | | 14.1 | | 9.9 | | 5.9 |
Low | | -16.6 | | 7.1 | | 6.0 | | 5.9 |
Average of All Private Forecasts | | -13.0 | | 9.0 | | 8.0 | | 5.9 |
Government of Alberta (calendar year) | | -12.9 | | 7.7 | | 8.7 | | 7.3 |
Number of Private Sector Forecasters | | 8 | | 8 | | 5 | | 2 |
Alberta Employment Benchmark |
| (% change) | | 2020 | | 2021 | | 2022 | | 2023 |
High | | -6.4 | | 5.6 | | 3.4 | | 3.0 |
Low | | -8.3 | | 3.8 | | 2.7 | | 2.1 |
Average of All Private Forecasts | | -7.2 | | 4.6 | | 3.0 | | 2.6 |
Government of Alberta (calendar year) | | -7.0 | | 4.3 | | 3.2 | | 2.4 |
Number of Private Sector Forecasters | | 8 | | 8 | | 4 | | 2 |
Alberta Housing Starts Benchmark |
| (thousands) | | 2020 | | 2021 | | 2022 | | 2023 |
High | | 25.9 | | 32.2 | | 31.8 | | 33.5 |
Low | | 19.0 | | 19.8 | | 22.9 | | 24.8 |
Average of All Private Forecasts | | 21.9 | | 23.9 | | 27.4 | | 29.1 |
Government of Alberta (calendar year) | | 21.6 | | 23.5 | | 25.0 | | 27.9 |
Number of Private Sector Forecasters | | 8 | | 8 | | 4 | | 2 |
Benchmarking tables include forecasts finalized on or before October 16, 2020.
| | |
| 2020-21 Mid-year Fiscal Update and Economic Statement | | 21 |
| | |
| 22 | | 2020-21 Mid-year Fiscal Update and Economic Statement |
GOVERNMENT OF ALBERTA
2020-21 Mid-year
Tables
| | |
| 2020-21 Mid-year Fiscal Update and Economic Statement | | 23 |
Table of Contents
Tables
| | | | |
Consolidated Fiscal Summary | | | 25 | |
| |
Statement of Financial Position | | | 26 | |
| |
Capital Assets | | | 26 | |
| |
Revenue | | | 27 | |
| |
Operating Expense | | | 28 | |
| |
Debt Servicing Costs | | | 28 | |
| |
Capital Amortization | | | 29 | |
| |
Inventory Consumption | | | 29 | |
| |
Inventory Acquisition | | | 29 | |
| |
Contingency / Disaster and Emergency Assistance | | | 30 | |
| |
Borrowing Requirements | | | 30 | |
| |
Borrowing Sources | | | 30 | |
| |
Pension Liabilities | | | 30 | |
| |
Cash Adjustments | | | 31 | |
| |
Capital Plan | | | 32 | |
| |
Capital Grants | | | 32 | |
| |
Capital Investment | | | 33 | |
| |
Fiscal Plan and Capital Plan Liability Principal Repayments | | | 33 | |
| |
Capital Plan Funding Sources | | | 33 | |
| |
Historical Fiscal Summary, 2008-09 to 2022-23 | | | 34 | |
| | |
| 24 | | 2020-21 Mid-year Fiscal Update and Economic Statement |
Consolidated Fiscal Summary
| | | | | | | | | | | | | | | | | | | | | | | | | | | | |
| (millions of dollars) | | 2019-20 | | | 2020-21 | | | Change fr. | | | 2021-22 | | | 2022-23 | |
| | | | Statement of Operations | | Actual | | | Budget | | | Forecast | | | Budget | | | Target | | | Target | |
| | | | | | | |
| | 1 | | | Total Revenue | | | 46,224 | | | | 49,996 | | | | 41,414 | | | | (8,582 | ) | | | 42,664 | | | | 47,641 | |
| | | | Expense | | | | | | | | | | | | | | | | | | | | | | | | |
| | 2 | | | Operating expense (net of in-year savings) | | | 48,616 | | | | 47,809 | | | | 47,745 | | | | (64 | ) | | | 47,451 | | | | 47,412 | |
| | 3 | | | % change from prior year | | | 0.5 | | | | (1.7 | ) | | | (1.8 | ) | | | (0.1 | ) | | | (0.6 | ) | | | (0.1 | ) |
| | 4 | | | Capital grants | | | 1,696 | | | | 2,302 | | | | 2,266 | | | | (36 | ) | | | 2,201 | | | | 2,168 | |
| | 5 | | | Amortization / inventory consumption / loss on disposals | | | 3,720 | | | | 3,857 | | | | 3,891 | | | | 34 | | | | 4,015 | | | | 4,122 | |
| | 6 | | | Taxpayer-supported debt servicing costs | | | 1,783 | | | | 2,066 | | | | 2,147 | | | | 81 | | | | 2,461 | | | | 2,660 | |
| | 7 | | | Self-supported debt servicing costs | | | 452 | | | | 439 | | | | 266 | | | | (173 | ) | | | 276 | | | | 305 | |
| | 8 | | | Pension provisions | | | (334 | ) | | | (415 | ) | | | (415 | ) | | | - | | | | (379 | ) | | | (275 | ) |
| | | | | | | |
| | 9 | | | Expense (before COVID-19 / Recovery Plan, Contingency, Crude-by-rail) | | | 55,936 | | | | 56,056 | | | | 55,900 | | | | (156 | ) | | | 56,024 | | | | 56,394 | |
| | | | | | | |
| | 10 | | | COVID-19 / Recovery Plan: | | | | | | | | | | | | | | | - | | | | | | | | | |
| | 11 | | | Operating expense | | | 218 | | | | 500 | | | | 3,534 | | | | 3,034 | | | | 504 | | | | 271 | |
| | 12 | | | Capital grants | | | - | | | | - | | | | 607 | | | | 607 | | | | 160 | | | | 91 | |
| | 13 | | | Inventory consumption (PPE) | | | - | | | | - | | | | 702 | | | | 702 | | | | - | | | | - | |
| | 14 | | | Contingency for COVID-19 | | | - | | | | - | | | | - | | | | - | | | | 750 | | | | - | |
| | 15 | | | Crude-by-rail provision | | | 866 | | | | - | | | | 1,250 | | | | 1,250 | | | | - | | | | - | |
| | 16 | | | Contingency / disaster and emergency assistance | | | 1,356 | | | | 750 | | | | 750 | | | | - | | | | 750 | | | | 750 | |
| | | | | | | |
| | 17 | | | Total Expense | | | 58,376 | | | | 57,306 | | | | 62,743 | | | | 5,437 | | | | 58,188 | | | | 57,506 | |
| | | | | | | |
| | 18 | | | Surplus / Deficit | | | (12,152 | ) | | | (7,310 | ) | | | (21,329 | ) | | | (14,019 | ) | | | (15,524 | ) | | | (9,865 | ) |
| | |
| | | | Capital Plan | | | |
| | 19 | | | Capital grants | | | 1,696 | | | | 2,302 | | | | 2,873 | | | | 571 | | | | 2,361 | | | | 2,259 | |
| | 20 | | | Capital investment | | | 3,868 | | | | 4,687 | | | | 5,556 | | | | 869 | | | | 4,698 | | | | 3,857 | |
| | | | | | | |
| | 21 | | | Total Capital Plan | | | 5,564 | | | | 6,989 | | | | 8,429 | | | | 1,440 | | | | 7,059 | | | | 6,116 | |
| | |
| | | | Cash adjustments / borrowing requirements | | (at March 31) | |
| | 22 | | | Cash at start of year | | | 6,342 | | | | 2,500 | | | | 9,405 | | | | 6,905 | | | | 10,000 | | | | 8,500 | |
| | 23 | | | Surplus / (deficit) | | | (12,152 | ) | | | (7,310 | ) | | | (21,329 | ) | | | (14,019 | ) | | | (15,524 | ) | | | (9,865 | ) |
| | 24 | | | Cash adjustments (for details, see table on page 31) | | | | | | | | | | | | | | | - | | | | | | | | | |
| | 25 | | | Retained income of funds and agencies | | | 3,014 | | | | (304 | ) | | | 1,199 | | | | 1,503 | | | | (481 | ) | | | (782 | ) |
| | 26 | | | Other cash adjustments | | | 1,515 | | | | 235 | | | | 402 | | | | 167 | | | | 1,728 | | | | 991 | |
| | 27 | | | Capital cash adjustments | | | 1,651 | | | | 2,103 | | | | 2,652 | | | | 549 | | | | 2,453 | | | | 2,504 | |
| | | | Total cash requirements | | | (5,971 | ) | | | (5,276 | ) | | | (17,076 | ) | | | (11,800 | ) | | | (11,824 | ) | | | (7,152 | ) |
| | 28 | | | Cash transferred from prior-year final results | | | 854 | | | | - | | | | - | | | | - | | | | - | | | | - | |
| | 29 | | | Pre-borrowing for cash management purposes | | | 9,405 | | | | 2,500 | | | | 10,000 | | | | 7,500 | | | | 8,500 | | | | 10,000 | |
| | 30 | | | Direct borrowing required (without pre-borrowing) | | | (1,225 | ) | | | 2,776 | | | | 7,671 | | | | 4,895 | | | | 1,824 | | | | (1,348 | ) |
| | | | | | | |
| | 31 | | | Cash at end of year | | | 9,405 | | | | 2,500 | | | | 10,000 | | | | 7,500 | | | | 8,500 | | | | 10,000 | |
| | |
| | | | Taxpayer-supported Liabilities / Borrowing | | (at March 31) | |
| | | | Liabilities for Capital Projects | | | | | | | | | | | | | | | | | | | | | | | | |
| | 32 | | | Opening balance | | | 33,597 | | | | 37,228 | | | | 37,208 | | | | (20 | ) | | | 42,858 | | | | 47,420 | |
| | 33 | | | Alternative financing (P3s – public-private partnerships) | | | 159 | | | | 151 | | | | 107 | | | | (44 | ) | | | 46 | | | | - | |
| | 34 | | | Direct borrowing | | | 3,499 | | | | 4,100 | | | | 5,595 | | | | 1,495 | | | | 4,575 | | | | 4,116 | |
| | 35 | | | Re-financing of existing debt | | | 3,899 | | | | 3,071 | | | | 3,071 | | | | - | | | | 1,753 | | | | 1,669 | |
| | 36 | | | Principal repayments / amortization of debt issue costs | | | (3,946 | ) | | | (3,068 | ) | | | (3,123 | ) | | | (55 | ) | | | (1,812 | ) | | | (1,733 | ) |
| | 37 | | | Total Liabilities for Capital Projects | | | 37,208 | | | | 41,482 | | | | 42,858 | | | | 1,376 | | | | 47,420 | | | | 51,472 | |
| | | | Borrowing for the Fiscal Plan / Other General Purposes | | | | | | | | | | | | | | | | | | | | | | | | |
| | 38 | | | Opening balance | | | 29,092 | | | | 30,648 | | | | 36,917 | | | | 6,269 | | | | 54,588 | | | | 64,912 | |
| | 39 | | | Direct borrowing for Fiscal Plan | | | 8,180 | | | | 5,276 | | | | 17,671 | | | | 12,395 | | | | 10,324 | | | | 8,652 | |
| | 40 | | | Other general purpose borrowing | | | 45 | | | | - | | | | - | | | | - | | | | - | | | | - | |
| | 41 | | | Re-financing of existing debt | | | - | | | | - | | | | - | | | | - | | | | 1,926 | | | | 1,603 | |
| | 42 | | | Re-financing of existing debt | | | (400 | ) | | | - | | | | - | | | | - | | | | (1,926 | ) | | | (1,603 | ) |
| | 43 | | | Total Borrowing for the Fiscal Plan / Other | | | 36,917 | | | | 35,924 | | | | 54,588 | | | | 18,664 | | | | 64,912 | | | | 73,564 | |
| | 44 | | | Total Taxpayer-supported Debt - Capital Projects / Fiscal Plan / Other | | | 74,125 | | | | 77,406 | | | | 97,446 | | | | 20,040 | | | | 112,332 | | | | 125,036 | |
| | |
| 2020-21 Mid-year Fiscal Update and Economic Statement | | 25 |
| | | | | | | | | | | | | | | | | | | | |
Statement of Financial Positiona | | | | | | | | | | | | | | | | | | | | |
| (millions of dollars) | | | | | | | | | | | | | | | |
| | | At March 31 | |
| | | 2020 | | | 2021 | | | 2022 | | | 2023 | |
| | | Actual | | | Budget | | | Forecast | | | Target | | | Target | |
Financial Assets | | | | | | | | | | | | | | | | | | | | |
Alberta Heritage Savings Trust Fund | | | 16,243 | | | | 16,568 | | | | 16,438 | | | | 16,685 | | | | 16,985 | |
Endowment funds: | | | | | | | | | | | | | | | | | | | | |
Alberta Heritage Foundation for Medical Research | | | 1,849 | | | | 1,928 | | | | 1,892 | | | | 1,964 | | | | 2,036 | |
Alberta Heritage Science and Engineering Research | | | 1,111 | | | | 1,142 | | | | 1,126 | | | | 1,138 | | | | 1,167 | |
Alberta Heritage Scholarship | | | 1,308 | | | | 1,322 | | | | 1,306 | | | | 1,304 | | | | 1,322 | |
Alberta Enterprise Corporation | | | 159 | | | | 158 | | | | 158 | | | | 157 | | | | 156 | |
General Revenue Fund cash pre-borrowing / reserve | | | 9,405 | | | | 9,405 | | | | 10,000 | | | | 8,500 | | | | 10,000 | |
Self-supporting lending organizations / activities: | | | | | | | | | | | | | | | | | | | | |
Alberta Capital Finance Authority / loans to local authorities | | | 16,328 | | | | 16,521 | | | | 16,139 | | | | 16,289 | | | | 16,853 | |
Agriculture Financial Services Corporation | | | 5,747 | | | | 6,525 | | | | 5,907 | | | | 7,042 | | | | 7,770 | |
Equity in commercial enterprises | | | 1,105 | | | | 1,258 | | | | 514 | | | | 211 | | | | 103 | |
Student loans | | | 3,192 | | | | 3,544 | | | | 3,690 | | | | 4,054 | | | | 4,394 | |
Climate funds (TIER Fund / Energy Efficiency Ab. / carbon tax) | | | 569 | | | | 454 | | | | 46 | | | | 46 | | | | 46 | |
Other financial assets (including SUCH sector / Alberta Innovates Corp.) | | | 19,365 | | | | 18,855 | | | | 18,407 | | | | 16,532 | | | | 16,049 | |
Total Financial Assets | | | 76,381 | | | | 77,680 | | | | 75,623 | | | | 73,922 | | | | 76,881 | |
| | | | | |
Liabilities | | | | | | | | | | | | | | | | | | | | |
Taxpayer-supported debt: | | | | | | | | | | | | | | | | | | | | |
Direct borrowing for the Capital Plan | | | 34,169 | | | | 38,346 | | | | 39,713 | | | | 44,229 | | | | 48,281 | |
Alternative financing for Capital Plan (public-private partnerships - P3s) | | | 3,038 | | | | 3,115 | | | | 3,145 | | | | 3,191 | | | | 3,191 | |
Debt issued to reduce pre-1992 TPP unfunded liability | | | 594 | | | | 594 | | | | 594 | | | | 594 | | | | 594 | |
Direct borrowing for the Fiscal Plan | | | 33,608 | | | | 38,884 | | | | 49,994 | | | | 60,318 | | | | 68,970 | |
Other debt | | | 2,733 | | | | 2,733 | | | | 4,000 | | | | 4,000 | | | | 4,000 | |
Total taxpayer-supported debt | | | 74,142 | | | | 83,672 | | | | 97,446 | | | | 112,332 | | | | 125,036 | |
Self-supporting lending organization / activities debt: | | | | | | | | | | | | | | | | | | | | |
Alberta Capital Finance Authority / for local authority loans | | | 15,640 | | | | 15,829 | | | | 16,139 | | | | 16,289 | | | | 16,853 | |
Agriculture Financial Services Corporation | | | 2,426 | | | | 2,776 | | | | 2,465 | | | | 2,562 | | | | 2,630 | |
Total debt | | | 92,208 | | | | 102,277 | | | | 116,050 | | | | 131,183 | | | | 144,519 | |
Coal phase-out liabilities | | | 914 | | | | 842 | | | | 842 | | | | 769 | | | | 693 | |
Pension liabilities | | | 8,918 | | | | 8,503 | | | | 8,503 | | | | 8,124 | | | | 7,849 | |
Other liabilities (including SUCH sector / Alberta Innovates Corp.) | | | 14,485 | | | | 14,650 | | | | 13,680 | | | | 13,852 | | | | 13,966 | |
Total Liabilities | | | 116,525 | | | | 126,272 | | | | 139,075 | | | | 153,928 | | | | 167,027 | |
Net Financial Assets / (Debt) | | | (40,144 | ) | | | (48,592 | ) | | | (63,452 | ) | | | (80,006 | ) | | | (90,146 | ) |
Capital / Other Non-financial Assets | | | 54,801 | | | | 56,068 | | | | 56,935 | | | | 58,105 | | | | 58,453 | |
Spent deferred capital contributions | | | (3,231 | ) | | | (3,360 | ) | | | (3,386 | ) | | | (3,526 | ) | | | (3,599 | ) |
Net Assets | | | 11,426 | | | | 4,116 | | | | (9,903 | ) | | | (25,427 | ) | | | (35,292 | ) |
| a | 2021 Budget, and 2022 and 2023 Target numbers have been restated to reflect 2019-20 Actual results. |
| | | | | | | | | | | | | | | | | | | | |
| Capital Assets | | | | | | | | | | | | | | | |
| (millions of dollars) | | At March 31 | |
| | | 2020 | | | 2021 | | | 2022 | | | 2023 | |
| | | Actual | | | Budget | | | Forecast | | | Target | | | Target | |
Net book value at start of the year | | | 52,925 | | | | 54,066 | | | | 54,066 | | | | 56,203 | | | | 57,380 | |
Additions (capital investment) | | | 3,868 | | | | 4,687 | | | | 5,556 | | | | 4,698 | | | | 3,857 | |
Contingency | | | - | | | | (700 | ) | | | (700 | ) | | | (700 | ) | | | (600 | ) |
Amortization | | | (2,578 | ) | | | (2,716 | ) | | | (2,717 | ) | | | (2,821 | ) | | | (2,906 | ) |
Net book value of capital asset disposals / adjustments | | | (149 | ) | | | - | | | | (2 | ) | | | - | | | | - | |
Net Book Value at End of Year | | | 54,066 | | | | 55,337 | | | | 56,203 | | | | 57,380 | | | | 57,731 | |
| | |
| 26 | | 2020-21 Mid-year Fiscal Update and Economic Statement |
| | | | | | | | | | | | | | | | | | | | | | | | |
Revenue | | | | | | | | | | | | | | | | | | | | | | | | |
| | | | | |
| (millions of dollars) | | 2019-20 | | | 2020-21 | | | Change fr.
Budget | | | 2021-22 | | | 2022-23 | |
| | | Actual | | | Budget | | | Forecast | | | Target | | | Target | |
Income Taxes | | | | | | | | | | | | | | | | | | | | | | | | |
| | | | | | |
Personal income tax | | | 11,244 | | | | 12,566 | | | | 10,753 | | | | (1,813 | ) | | | 11,686 | | | | 12,535 | |
| | | | | | |
Corporate income tax | | | 4,107 | | | | 4,539 | | | | 2,188 | | | | (2,351 | ) | | | 1,666 | | | | 2,391 | |
| | | | 15,351 | | | | 17,105 | | | | 12,941 | | | | (4,164 | ) | | | 13,352 | | | | 14,926 | |
Other Taxes | | | | | | | | | | | | | | | | | | | | | | | | |
| | | | | | |
Education property tax (includes opted-out boards) | | | 2,475 | | | | 2,559 | | | | 2,472 | | | | (87 | ) | | | 2,652 | | | | 2,766 | |
| | | | | | |
Fuel tax | | | 1,376 | | | | 1,423 | | | | 1,167 | | | | (256 | ) | | | 1,333 | | | | 1,374 | |
| | | | | | |
Tobacco / vaping taxes | | | 805 | | | | 864 | | | | 794 | | | | (70 | ) | | | 790 | | | | 810 | |
| | | | | | |
Cannabis tax | | | 76 | | | | 74 | | | | 90 | | | | 16 | | | | 94 | | | | 98 | |
| | | | | | |
Insurance taxes | | | 662 | | | | 703 | | | | 683 | | | | (20 | ) | | | 735 | | | | 792 | |
| | | | | | |
Tourism levy | | | 89 | | | | 92 | | | | 27 | | | | (65 | ) | | | 74 | | | | 87 | |
| | | | | | |
Carbon tax | | | 189 | | | | - | | | | - | | | | - | | | | - | | | | - | |
| | | | | | |
Freehold mineral rights tax | | | 75 | | | | 67 | | | | 53 | | | | (14 | ) | | | 64 | | | | 70 | |
| | | | 5,747 | | | | 5,782 | | | | 5,286 | | | | (496 | ) | | | 5,742 | | | | 5,997 | |
Non-Renewable Resource Revenue | | | | | | | | | | | | | | | | | | | | | | | | |
| | | | | | |
Bitumen royalty | | | 4,089 | | | | 3,211 | | | | 896 | | | | (2,315 | ) | | | 1,335 | | | | 3,180 | |
| | | | | | |
Crude oil royalty | | | 1,175 | | | | 1,135 | | | | 397 | | | | (738 | ) | | | 530 | | | | 845 | |
| | | | | | |
Natural gas and by-products royalty | | | 371 | | | | 429 | | | | 192 | | | | (237 | ) | | | 389 | | | | 733 | |
| | | | | | |
Bonuses and sales of Crown leases | | | 120 | | | | 177 | | | | 36 | | | | (141 | ) | | | 109 | | | | 171 | |
| | | | | | |
Rentals and fees / coal royalty | | | 182 | | | | 137 | | | | 148 | | | | 11 | | | | 128 | | | | 126 | |
| | | | 5,937 | | | | 5,090 | | | | 1,669 | | | | (3,421 | ) | | | 2,491 | | | | 5,055 | |
Transfers from Government of Canada | | | | | | | | | | | | | | | | | | | | | | | | |
| | | | | | |
Canada Health Transfer | | | 4,678 | | | | 4,857 | | | | 4,838 | | | | (19 | ) | | | 4,960 | | | | 5,092 | |
| | | | | | |
Canada Social Transfer | | | 1,694 | | | | 1,755 | | | | 1,744 | | | | (11 | ) | | | 1,792 | | | | 1,840 | |
| | | | | | |
Direct transfers to SUCH sector / Alberta Innovates Corporation | | | 510 | | | | 590 | | | | 574 | | | | (16 | ) | | | 571 | | | | 576 | |
| | | | | | |
Agriculture support programs | | | 362 | | | | 286 | | | | 315 | | | | 29 | | | | 286 | | | | 287 | |
| | | | | | |
Infrastructure support | | | 679 | | | | 828 | | | | 810 | | | | (18 | ) | | | 939 | | | | 917 | |
| | | | | | |
Labour market agreements | | | 277 | | | | 299 | | | | 484 | | | | 185 | | | | 314 | | | | 314 | |
| | | | | | |
Other (incl. 2019-20 fiscal stabil. payment and 2020-21 safe re-start) | | | 872 | | | | 495 | | | | 2,572 | | | | 2,077 | | | | 1,041 | | | | 705 | |
| | | | 9,072 | | | | 9,110 | | | | 11,337 | | | | 2,227 | | | | 9,903 | | | | 9,731 | |
Investment Income | | | | | | | | | | | | | | | | | | | | | | | | |
| | | | | | |
Alberta Heritage Savings Trust Fund | | | 1,471 | | | | 1,177 | | | | 915 | | | | (262 | ) | | | 1,020 | | | | 1,180 | |
| | | | | | |
Endowment funds | | | 308 | | | | 286 | | | | 223 | | | | (63 | ) | | | 219 | | | | 290 | |
| | | | | | |
Alberta Capital Finance Authority / lending to local authorities | | | 366 | | | | 485 | | | | 217 | | | | (268 | ) | | | 147 | | | | 170 | |
| | | | | | |
Agriculture Financial Services Corporation | | | 158 | | | | 157 | | | | 157 | | | | - | | | | 164 | | | | 173 | |
| | | | | | |
Other (includes SUCH sector) | | | 526 | | | | 525 | | | | 407 | | | | (118 | ) | | | 412 | | | | 437 | |
| | | | 2,828 | | | | 2,630 | | | | 1,919 | | | | (711 | ) | | | 1,962 | | | | 2,250 | |
Net Income from Government Business Enterprises | | | | | | | | | | | | | | | | | | | | | | | | |
| | | | | | |
AGLC – Gaming / lottery | | | 1,331 | | | | 1,396 | | | | 940 | | | | (456 | ) | | | 1,185 | | | | 1,242 | |
| | | | | | |
AGLC – Liquor | | | 845 | | | | 844 | | | | 886 | | | | 42 | | | | 844 | | | | 850 | |
| | | | | | |
AGLC – Cannabis | | | (14 | ) | | | (36 | ) | | | (18 | ) | | | 18 | | | | (25 | ) | | | (24 | ) |
| | | | | | |
ATB Financial | | | 104 | | | | 260 | | | | (112 | ) | | | (372 | ) | | | 80 | | | | 147 | |
| | | | | | |
Balancing Pool | | | 161 | | | | 135 | | | | 41 | | | | (94 | ) | | | 50 | | | | 50 | |
| | | | | | |
Other (CUDGCo / APMC / PSIs) | | | (2,652 | ) | | | (241 | ) | | | (543 | ) | | | (302 | ) | | | (468 | ) | | | (350 | ) |
| | | | (225 | ) | | | 2,358 | | | | 1,194 | | | | (1,164 | ) | | | 1,666 | | | | 1,915 | |
Premiums, Fees and Licences | | | | | | | | | | | | | | | | | | | | | | | | |
| | | | | | |
Post-secondary institution tuition fees | | | 1,311 | | | | 1,460 | | | | 1,330 | | | | (130 | ) | | | 1,475 | | | | 1,575 | |
| | | | | | |
Health / school board fees and charges | | | 703 | | | | 717 | | | | 702 | | | | (15 | ) | | | 743 | | | | 772 | |
| | | | | | |
Motor vehicle licences | | | 518 | | | | 546 | | | | 510 | | | | (36 | ) | | | 530 | | | | 543 | |
| | | | | | |
Crop, hail and livestock insurance premiums | | | 321 | | | | 339 | | | | 324 | | | | (15 | ) | | | 354 | | | | 366 | |
| | | | | | |
Energy industry levies | | | 325 | | | | 328 | | | | 214 | | | | (114 | ) | | | 318 | | | | 302 | |
| | | | | | |
Other (includes land titles, lands and grazing, health benefit premiums) | | | 751 | | | | 804 | | | | 950 | | | | 146 | | | | 742 | | | | 733 | |
| | | | 3,929 | | | | 4,194 | | | | 4,030 | | | | (164 | ) | | | 4,162 | | | | 4,291 | |
Other | | | | | | | | | | | | | | | | | | | | | | | | |
| | | | | | |
SUCH sector sales, rentals and services | | | 1,036 | | | | 1,088 | | | | 809 | | | | (279 | ) | | | 928 | | | | 983 | |
| | | | | | |
SUCH sector fundraising, donations, gifts and contributions | | | 724 | | | | 748 | | | | 616 | | | | (132 | ) | | | 628 | | | | 643 | |
| | | | | | |
AIMCo investment management charges | | | 385 | | | | 536 | | | | 449 | | | | (87 | ) | | | 626 | | | | 632 | |
| | | | | | |
Fines and penalties | | | 200 | | | | 267 | | | | 240 | | | | (27 | ) | | | 262 | | | | 279 | |
| | | | | | |
Refunds of expense | | | 359 | | | | 195 | | | | 196 | | | | 1 | | | | 196 | | | | 197 | |
| | | | | | |
Technology Innovation and Emissions Reduction Fund | | | 403 | | | | 421 | | | | 272 | | | | (149 | ) | | | 275 | | | | 272 | |
| | | | | | |
Miscellaneous (includes Alberta Innovates Corporation) | | | 477 | | | | 471 | | | | 456 | | | | (15 | ) | | | 471 | | | | 470 | |
| | | | 3,585 | | | | 3,726 | | | | 3,038 | | | | (688 | ) | | | 3,386 | | | | 3,476 | |
Total Revenue | | | 46,224 | | | | 49,996 | | | | 41,414 | | | | (8,582 | ) | | | 42,664 | | | | 47,641 | |
| | |
| 2020-21 Mid-year Fiscal Update and Economic Statement | | 27 |
Operating Expense
| | | | | | | | | | | | | | | | | | | | | | | | |
| (millions of dollars) | | 2019-20 Actual | | | 2020-21 | | | Change fr. | | | 2021-22
Target | | | 2022-23
Target | |
| | | Budget | | | Forecast | | | Budget | |
| | | | | | |
Advanced Education | | | 5,478 | | | | 5,126 | | | | 5,201 | | | | 75 | | | | 4,999 | | | | 4,890 | |
| | | | | | |
Agriculture and Forestry | | | 868 | | | | 833 | | | | 860 | | | | 27 | | | | 852 | | | | 850 | |
| | | | | | |
Children’s Services | | | 1,548 | | | | 1,636 | | | | 1,628 | | | | (8 | ) | | | 1,684 | | | | 1,703 | |
| | | | | | |
Community and Social Services | | | 3,965 | | | | 3,910 | | | | 3,845 | | | | (65 | ) | | | 3,910 | | | | 3,910 | |
| | | | | | |
Culture, Multiculturalism and Status of Women | | | 205 | | | | 185 | | | | 159 | | | | (26 | ) | | | 170 | | | | 156 | |
| | | | | | |
Education | | | 8,134 | | | | 8,322 | | | | 8,190 | | | | (132 | ) | | | 8,247 | | | | 8,247 | |
| | | | | | |
Energy | | | 597 | | | | 506 | | | | 483 | | | | (23 | ) | | | 494 | | | | 497 | |
| | | | | | |
Environment and Parks | | | 558 | | | | 532 | | | | 590 | | | | 58 | | | | 405 | | | | 417 | |
| | | | | | |
Executive Council | | | 18 | | | | 17 | | | | 17 | | | | - | | | | 16 | | | | 16 | |
| | | | | | |
Health | | | 20,870 | | | | 20,616 | | | | 20,716 | | | | 100 | | | | 20,632 | | | | 20,672 | |
| | | | | | |
Indigenous Relations | | | 162 | | | | 203 | | | | 148 | | | | (55 | ) | | | 169 | | | | 158 | |
| | | | | | |
Infrastructure | | | 457 | | | | 472 | | | | 470 | | | | (2 | ) | | | 448 | | | | 424 | |
| | | | | | |
Jobs, Economy and Innovation | | | 282 | | | | 298 | | | | 296 | | | | (2 | ) | | | 310 | | | | 318 | |
| | | | | | |
Justice and Solicitor General | | | 1,442 | | | | 1,443 | | | | 1,443 | | | | - | | | | 1,395 | | | | 1,411 | |
| | | | | | |
Labour and Immigration | | | 196 | | | | 209 | | | | 204 | | | | (5 | ) | | | 206 | | | | 201 | |
| | | | | | |
Municipal Affairs | | | 244 | | | | 241 | | | | 207 | | | | (34 | ) | | | 237 | | | | 236 | |
| | | | | | |
Seniors and Housing | | | 634 | | | | 637 | | | | 637 | | | | - | | | | 636 | | | | 636 | |
| | | | | | |
Service Alberta | | | 494 | | | | 482 | | | | 495 | | | | 13 | | | | 466 | | | | 457 | |
| | | | | | |
Transportation | | | 425 | | | | 384 | | | | 389 | | | | 5 | | | | 383 | | | | 386 | |
| | | | | | |
Treasury Board and Finance | | | 1,900 | | | | 1,693 | | | | 1,648 | | | | (45 | ) | | | 1,668 | | | | 1,679 | |
| | | | | | |
Legislative Assembly | | | 140 | | | | 126 | | | | 126 | | | | - | | | | 128 | | | | 155 | |
| | | | | | |
In-year savings | | | - | | | | (59 | ) | | | (6 | ) | | | 53 | | | | (7 | ) | | | (8 | ) |
| | | | | | | |
Operating Expense before COVID-19 / Recovery Plan | | | 48,616 | | | | 47,809 | | | | 47,745 | | | | (64 | ) | | | 47,451 | | | | 47,412 | |
| | | | | | |
COVID-19 / Recovery Plan operating expense | | | | | | | | | | | | | | | | | | | | | | | | |
| | | | | | |
Children’s Services | | | - | | | | - | | | | 76 | | | | 76 | | | | - | | | | - | |
| | | | | | |
Community and Social Services | | | 60 | | | | - | | | | 62 | | | | 62 | | | | - | | | | - | |
| | | | | | |
Education | | | - | | | | - | | | | 276 | | | | 276 | | | | - | | | | - | |
| | | | | | |
Energy | | | - | | | | - | | | | 421 | | | | 421 | | | | 392 | | | | 192 | |
| | | | | | |
Environment and Parks | | | - | | | | - | | | | 277 | | | | 277 | | | | 77 | | | | - | |
| | | | | | |
Health | | | 25 | | | | 500 | | | | 1,006 | | | | 506 | | | | - | | | | - | |
| | | | | | |
Jobs, Economy and Innovation | | | - | | | | - | | | | 316 | | | | 316 | | | | 20 | | | | 5 | |
| | | | | | |
Labour and Immigration | | | 114 | | | | - | | | | 273 | | | | 273 | | | | - | | | | - | |
| | | | | | |
Municipal Affairs | | | - | | | | - | | | | 658 | | | | 658 | | | | - | | | | - | |
| | | | | | |
Othera | | | 19 | | | | - | | | | 169 | | | | 169 | | | | 15 | | | | 74 | |
| | | | | | | |
COVID-19 / Recovery Plan operating expense | | | 218 | | | | 500 | | | | 3,534 | | | | 3,034 | | | | 504 | | | | 271 | |
| | | | | | |
Total Operating Expense | | | 48,834 | | | | 48,309 | | | | 51,279 | | | | 2,970 | | | | 47,955 | | | | 47,683 | |
| a | Other includes Agric. & Forestry; Culture, Multiculturalism & Status of Women; Seniors & Housing; Transport.; Treasury Bd. & Finance. |
Debt Servicing Costs
(millions of dollars)
| | | | | | | | | | | | | | | | | | | | | | | | |
| | | 2019-20
Actual | | | 2020-21 | | | Change fr. Budget | | | 2021-22 Target | | | 2022-23 Target | |
| | | Budget | | | Forecast | |
Taxpayer-supported general debt servicing costs | | | | | | | | | | | | | | | | | | | | | | | | |
| | | | | | |
Education – school boards | | | 11 | | | | 9 | | | | 9 | | | | - | | | | 9 | | | | 9 | |
| | | | | | |
Seniors and Housing – Alberta Social Housing Corporation | | | 2 | | | | - | | | | - | | | | - | | | | - | | | | - | |
| | | | | | |
Treasury Board and Finance | | | 799 | | | | 710 | | | | 1,011 | | | | 301 | | | | 1,171 | | | | 1,330 | |
| | | | | | |
Total | | | 812 | | | | 719 | | | | 1,020 | | | | 301 | | | | 1,180 | | | | 1,339 | |
| | | | | | |
Taxpayer-supported Capital Plan debt servicing costs | | | | | | | | | | | | | | | | | | | | | | | | |
| | | | | | |
Education – Alberta Schools Alternative Procurement P3s | | | | | | | 27 | | | | 27 | | | | - | | | | 26 | | | | 25 | |
| | | | | | |
Transportation – ring road P3s | | | 90 | | | | 95 | | | | 95 | | | | - | | | | 103 | | | | 103 | |
| | | | | | |
Treasury Board and Finance – direct borrowing | | | 853 | | | | 1,225 | | | | 1,005 | | | | (220 | ) | | | 1,152 | | | | 1,193 | |
| | | | | | |
Total | | | 971 | | | | 1,347 | | | | 1,127 | | | | (220 | ) | | | 1,281 | | | | 1,321 | |
| | | | | | |
Total taxpayer-supported debt servicing costs | | | 1,783 | | | | 2,066 | | | | 2,147 | | | | 81 | | | | 2,461 | | | | 2,660 | |
| | | | | | |
Self-supported debt servicing costss | | | | | | | | | | | | | | | | | | | | | | | | |
| | | | | | |
Treasury Board and Finance – Ab. Capital Finance Authority | | | 384 | | | | 367 | | | | 198 | | | | (169 | ) | | | 208 | | | | 239 | |
| | | | | | |
Treasury Board and Finance – Ag. Financial Services Corp. | | | 68 | | | | 72 | | | | 68 | | | | (4 | ) | | | 68 | | | | 66 | |
| | | | | | |
Total self-supported debt servicing costs | | | 452 | | | | 439 | | | | 266 | | | | (173 | ) | | | 276 | | | | 305 | |
| | | | | | |
Total Debt Servicing Costs | | | 2,235 | | | | 2,505 | | | | 2,413 | | | | (92 | ) | | | 2,737 | | | | 2,965 | |
| | |
| 28 | | 2020-21 Mid-year Fiscal Update and Economic Statement |
| | | | | | | | | | | | | | | | | | | | | | | | |
Capital Amortization | | | | | | | | | | | | | | | | | | | | | | | | |
(millions of dollars) | | | | | | | | | | | | | | | | | | | | | | | | |
| | | 2019-20 | | | 2020-21 | | | Change fr. Budget | | | 2021-22 | | | 2022-23 | |
| | | Actual | | | Budget | | | Forecast | | | Target | | | Target | |
| | | | | | |
Advanced Education | | | 558 | | | | 555 | | | | 549 | | | | (6 | ) | | | 570 | | | | 567 | |
Agriculture and Forestry | | | 23 | | | | 25 | | | | 25 | | | | - | | | | 25 | | | | 25 | |
Culture, Multiculturalism and Status of Women | | | 8 | | | | 7 | | | | 7 | | | | - | | | | 7 | | | | 7 | |
Education | | | 433 | | | | 431 | | | | 431 | | | | - | | | | 436 | | | | 439 | |
Energy | | | 18 | | | | 18 | | | | 18 | | | | - | | | | 19 | | | | 20 | |
Environment and Parks | | | 64 | | | | 85 | | | | 85 | | | | - | | | | 93 | | | | 99 | |
Health | | | 557 | | | | 605 | | | | 605 | | | | - | | | | 611 | | | | 611 | |
Infrastructure | | | 123 | | | | 135 | | | | 135 | | | | - | | | | 143 | | | | 151 | |
Jobs, Economy and Innovation | | | 7 | | | | 8 | | | | 8 | | | | - | | | | 8 | | | | 8 | |
Justice and Solicitor General | | | 2 | | | | 6 | | | | 6 | | | | - | | | | 6 | | | | 6 | |
Municipal Affairs | | | 27 | | | | 30 | | | | 30 | | | | - | | | | 32 | | | | 32 | |
Seniors and Housing | | | 39 | | | | 44 | | | | 44 | | | | - | | | | 39 | | | | 39 | |
Service Alberta | | | 80 | | | | 95 | | | | 95 | | | | - | | | | 87 | | | | 86 | |
Transportation | | | 611 | | | | 638 | | | | 649 | | | | 11 | | | | 710 | | | | 780 | |
Treasury Board and Finance | | | 24 | | | | 29 | | | | 26 | | | | (3 | ) | | | 30 | | | | 30 | |
Other a | | | 2 | | | | 5 | | | | 5 | | | | - | | | | 5 | | | | 5 | |
Total Amortization Expense | | | 2,578 | | | | 2,716 | | | | 2,717 | | | | 1 | | | | 2,821 | | | | 2,906 | |
a Other includes Community and Social Services, Labour and Immigration and Legislative Assembly
| | | | | | | | | | | | | | | | | | | | | | | | |
Inventory Consumption | | | | | | | | | | | | | | | | | | | | | | | | |
(millions of dollars) | | | 2019-20 | | | | 2020-21 | | |
| Change fr.
Budget |
| | | 2021-22 | | | | 2022-23 | |
| | | Actual | | | Budget | | | Forecast | | | Target | | | Target | |
Advanced Education | | | 160 | | | | 178 | | | | 178 | | | | - | | | | 181 | | | | 185 | |
Health | | | 846 | | | | 894 | | | | 1,559 | | | | 665 | | | | 952 | | | | 970 | |
Municipal Affairs | | | - | | | | - | | | | 77 | | | | 77 | | | | - | | | | - | |
Service Alberta | | | 13 | | | | 14 | | | | 5 | | | | (9 | ) | | | 5 | | | | 5 | |
Transportation | | | 54 | | | | 50 | | | | 49 | | | | (1 | ) | | | 50 | | | | 50 | |
Agriculture & Forestry / Culture, Multiculturalism & Status of Women /Infrastructure | | | 5 | | | | 5 | | | | 5 | | | | - | | | | 5 | | | | 5 | |
Total Inventory Consumption | | | 1,078 | | | | 1,140 | | | | 1,873 | | | | 733 | | | | 1,193 | | | | 1,215 | |
| | | | | | | | | | | | | | | | | | | | | | | | |
| Inventory Acquisition | | | | | | | | | | | | | | | | | | |
(millions of dollars) | | | 2019-20 | | | | 2020-21 | | |
| Change fr.
Budget |
| | | 2021-22 | | | | 2022-23 | |
| | | Actual | | | Budget | | | Forecast | | | Target | | | Target | |
Advanced Education | | | 160 | | | | 178 | | | | 178 | | | | - | | | | 181 | | | | 181 | |
Health | | | 869 | | | | 888 | | | | 1,554 | | | | 666 | | | | 946 | | | | 964 | |
Municipal Affairs | | | - | | | | - | | | | 77 | | | | 77 | | | | - | | | | - | |
Service Alberta | | | 14 | | | | 14 | | | | 5 | | | | (9 | ) | | | 5 | | | | 5 | |
Transportation | | | 51 | | | | 50 | | | | 49 | | | | (1 | ) | | | 50 | | | | 50 | |
Agriculture & Forestry / Culture, Multiculturalism & Status of Women /Infrastructure | | | 6 | | | | 5 | | | | 5 | | | | - | | | | 5 | | | | 5 | |
Total Inventory Acquisition | | | 1,100 | | | | 1,135 | | | | 1,869 | | | | 734 | | | | 1,187 | | | | 1,205 | |
| | |
| 2020-21 Mid-year Fiscal Update and Economic Statement | | 29 |
Contingency / Disaster and Emergency Assistance
| | | | | | | | | | | | | | | | | | | | | | | | |
(millions of dollars) | | | | | | | | | | | | | | | | | | | | | | | | |
| | | 2019-20 | | | 2020-21 | | | Change fr.
Budget | | | 2021-22 | | | 2022-23 | |
| | | Actual | | | Budget | | | Forecast | | | Target | | | Target | |
| | | | | | |
Agriculture and Forestry – wildfires | | | 461 | | | | - | | | | 85 | | | | 85 | | | | - | | | | - | |
| | | | | | |
Agriculture and Forestry – agriculture indemnities / income support | | | 748 | | | | - | | | | 324 | | | | 324 | | | | - | | | | - | |
| | | | | | |
Municipal Affairs – floods | | | 147 | | | | - | | | | 158 | | | | 158 | | | | - | | | | - | |
| | | | | | |
Unallocated | | | - | | | | 750 | | | | 183 | | | | (567 | ) | | | 750 | | | | 750 | |
| | | | | | |
Total Disaster / Emergency Assistance | | | 1,356 | | | | 750 | | | | 750 | | | | - | | | | 750 | | | | 750 | |
| | | | | | | | | | | | | | | | | | | | | | | | |
Borrowing Requirements | | | | | | | | | | | | | | | | | | | | | | | | |
| (millions of dollars) | | 2019-20 | | | 2020-21 | | | Change fr.
Budget | | | 2021-22 | | | 2022-23 | |
| | | Actual | | | Budget | | | Forecast | | | Target | | | Target | |
| | | | | | |
Government | | | 13,555 | | | | 12,098 | | | | 25,492 | | | | 13,394 | | | | 19,857 | | | | 18,620 | |
| | | | | | |
Provincial corporations | | | 495 | | | | 2,616 | | | | 2,571 | | | | (45 | ) | | | 250 | | | | 250 | |
| | | | | | |
Government business enterprises | | | 990 | | | | 1,077 | | | | 402 | | | | (675 | ) | | | 830 | | | | 340 | |
| | | | | | |
Total borrowing requirements | | | 15,040 | | | | 15,791 | | | | 28,465 | | | | 12,674 | | | | 20,937 | | | | 19,210 | |
| | | | | | | | | | | | | | | | | | | | | | | | |
Borrowing Sources | | | | | | | | | | | | | | | | | | | | | | | | |
| (millions of dollars) | | 2019-20 | | | 2020-21 | | | Change fr.
Budget | | | 2021-22 | | | 2022-23 | |
| | | Actual | | | Budget | | | Forecast | | | Target | | | Target | |
| | | | | | |
Money market (net change) | | | 5,711 | | | | (1,500) | | | | (1,500) | | | | - | | | | 680 | | | | 304 | |
| | | | | | |
Public-private partnerships (P3s) | | | 159 | | | | 151 | | | | 107 | | | | (44) | | | | 46 | | | | - | |
| | | | | | |
Term debt | | | 9,170 | | | | 17,140 | | | | 29,858 | | | | 12,718 | | | | 20,211 | | | | 18,906 | |
| | | | | | |
Total borrowing sources | | | 15,040 | | | | 15,791 | | | | 28,465 | | | | 12,674 | | | | 20,937 | | | | 19,210 | |
| | | | | | | | | | | | | | | | |
Pension Liabilities a | | | | | | | | | | | | | | | | |
| (millions of dollars) | | At March 31 | |
| | | 2020 | | | 2021 | | | 2022 | | | 2023 | |
| | | Actual | | | Estimate | | | Target | | | Target | |
| | | | |
Teachers’ Pension Plan (pre-1992) | | | 7,554 | | | | 7,322 | | | | 7,083 | | | | 6,837 | |
| | | | |
Teachers’ Pension Plan (post-1992) | | | 215 | | | | 97 | | | | - | | | | - | |
| | | | |
Public Service Management Pension Plan (pre-1992; closed)b | | | 449 | | | | 417 | | | | 383 | | | | 348 | |
| | | | |
Universities Academic Pension Plan (pre-1992) | | | 266 | | | | 266 | | | | 265 | | | | 265 | |
| | | | |
Special Forces Pension Plan (pre-1992) | | | 81 | | | | 70 | | | | 62 | | | | 57 | |
| | | | |
Members of the Legislative Assembly Pension Plan (closed)b | | | 38 | | | | 36 | | | | 34 | | | | 32 | |
| | | | |
Public Service Supplementary Retirement Plan | | | 67 | | | | 76 | | | | 87 | | | | 98 | |
| | | | |
Provincial Judges and Masters in Chambers Pension Plan | | | - | | | | - | | | | 8 | | | | 18 | |
| | | | |
SUCH sector – Universities Academic / Supp. Exec. Retirement Plans | | | 248 | | | | 219 | | | | 202 | | | | 194 | |
| | | | |
Total Pension Liabilities | | | 8,918 | | | | 8,503 | | | | 8,124 | | | | 7,849 | |
| | | | |
Annual non-cash change in pension liabilities | | | (334) | | | | (415) | | | | (379) | | | | (275) | |
| a | Numbers for 2021, 2022 and 2023 have been restated to reflect 2019-20 Actual results. |
| b | Membership closed and pensionable service no longer being accrued. |
| | |
| 30 | | 2020-21 Mid-year Fiscal Update and Economic Statement |
| | | | | | | | | | | | | | | | | | | | | | | | |
Cash Adjustments a | | | | | | | | | | | | | | | | | | | | | | | | |
| (millions of dollars) | | 2019-20 | | | 2020-21 | | | Change fr.
Budget | | | 2021-22 | | | 2022-23 | |
| | | Actual | | | Budget | | | Forecast | | | Target | | | Target | |
| | | | | | |
Retained Income of Funds and Agencies | | | | | | | | | | | | | | | | | | | | | | | | |
| | | | | | |
Alberta Heritage Savings Trust Fund inflation-proofing | | | (287) | | | | (325) | | | | (195) | | | | 130 | | | | (247) | | | | (300) | |
| | | | | | |
ATB Financial | | | (104) | | | | (260) | | | | 112 | | | | 372 | | | | (80) | | | | (147) | |
| | | | | | |
Agriculture Financial Services Corporation | | | 152 | | | | (430) | | | | (128) | | | | 302 | | | | (434) | | | | (452) | |
| | | | | | |
Heritage Foundation for Medical Research Endowment Fund | | | (71) | | | | (79) | | | | (43) | | | | 36 | | | | (41) | | | | (72) | |
| | | | | | |
Heritage Science and Engineering Research Endowment Fund | | | (37) | | | | (31) | | | | (15) | | | | 16 | | | | (12) | | | | (29) | |
| | | | | | |
Heritage Scholarship Fund | | | (27) | | | | (14) | | | | 2 | | | | 16 | | | | 2 | | | | (18) | |
| | | | | | |
Alberta Social Housing Corporation | | | 197 | | | | 184 | | | | 215 | | | | 31 | | | | (20) | | | | (6) | |
| | | | | | |
Alberta Capital Finance Authority | | | (15) | | | | 513 | | | | 270 | | | | (243) | | | | - | | | | - | |
| | | | | | |
Alberta Cancer Prevention Legacy Fund | | | 435 | | | | - | | | | - | | | | - | | | | - | | | | - | |
| | | | | | |
Credit Union Deposit Guarantee Corporation | | | (20) | | | | (22) | | | | (15) | | | | 7 | | | | (15) | | | | (16) | |
| | | | | | |
Alberta Petroleum Marketing Commission | | | 2,678 | | | | 264 | | | | 558 | | | | 294 | | | | 483 | | | | 366 | |
| | | | | | |
Carbon tax account | | | 282 | | | | - | | | | - | | | | - | | | | - | | | | - | |
| | | | | | |
Technology Innovation and Emissions Reduction Fund | | | 28 | | | | 116 | | | | 517 | | | | 401 | | | | - | | | | - | |
| | | | | | |
Balancing Pool | | | (161) | | | | (135) | | | | (41) | | | | 94 | | | | (50) | | | | (50) | |
| | | | | | |
Other | | | (36) | | | | (85) | | | | (38) | | | | 47 | | | | (67) | | | | (58) | |
| | | | | | |
Total Retained Income of Funds and Agencies | | | 3,014 | | | | (304) | | | | 1,199 | | | | 1,503 | | | | (481) | | | | (782) | |
| | | | | | |
Other Cash Adjustments | | | | | | | | | | | | | | | | | | | | | | | | |
| | | | | | |
SUCH sector own-source revenue | | | (4,892) | | | | (5,197) | | | | (4,630) | | | | 567 | | | | (4,934) | | | | (5,147) | |
| | | | | | |
SUCH sector own-source expense | | | 6,227 | | | | 6,010 | | | | 7,255 | | | | 1,245 | | | | 8,173 | | | | 7,342 | |
| | | | | | |
Net deferred capital contribution cash adjustment | | | 129 | | | | 70 | | | | 95 | | | | 25 | | | | 80 | | | | 13 | |
| | | | | | |
Energy royalties (difference between accrued revenue & cash) | | | 254 | | | | (48) | | | | (870) | | | | (822) | | | | (688) | | | | (450) | |
| | | | | | |
Student loans | | | (308) | | | | (352) | | | | (498) | | | | (146) | | | | (364) | | | | (340) | |
| | | | | | |
Inventory acquisition | | | (131) | | | | (139) | | | | (278) | | | | (139) | | | | (188) | | | | (202) | |
| | | | | | |
Other cash adjustments | | | 524 | | | | (41) | | | | (602) | | | | (561) | | | | (109) | | | | (112) | |
| | | | | | |
2013 Alberta flood assistance revenue / expense | | | (71) | | | | 187 | | | | 84 | | | | (103) | | | | (34) | | | | (5) | |
| | | | | | |
Wood Buffalo wildfire revenue / expense | | | (13) | | | | 22 | | | | (13) | | | | (35) | | | | (14) | | | | (36) | |
| | | | | | |
Pension provisions (non-cash expense) | | | (334) | | | | (415) | | | | (415) | | | | - | | | | (379) | | | | (275) | |
| | | | | | |
Inventory consumption (non-cash expense) | | | 130 | | | | 137 | | | | 274 | | | | 137 | | | | 185 | | | | 203 | |
| | | | | | |
Total Other Cash Adjustments | | | 1,515 | | | | 235 | | | | 402 | | | | 167 | | | | 1,728 | | | | 991 | |
| | | | | | |
Capital cash adjustments | | | | | | | | | | | | | | | | | | | | | | | | |
| | | | | | |
Capital investment (excluding SUCH sector self-financed) | | | (3,085) | | | | (3,913) | | | | (4,825) | | | | (912) | | | | (4,003) | | | | (3,425) | |
| | | | | | |
Capital Plan contingency | | | - | | | | 700 | | | | 700 | | | | - | | | | 700 | | | | 600 | |
| | | | | | |
Current principal repayments (P3s – public-private partnerships) | | | (66) | | | | (74) | | | | (74) | | | | - | | | | (83) | | | | (89) | |
| | | | | | |
Withdrawal from / (deposit to) Capital Plan financing account | | | 123 | | | | - | | | | | | | | - | | | | | | | | | |
| | | | | | |
Direct borrowing for Capital Plan | | | 3,499 | | | | 4,100 | | | | 5,595 | | | | 1,495 | | | | 4,575 | | | | 4,116 | |
| | | | | | |
Alternative financing (P3s – public-private partnerships) | | | 159 | | | | 151 | | | | 107 | | | | (44) | | | | 46 | | | | - | |
| | | | | | |
Amortization (excluding SUCH sector - non-cash expense) | | | 1,003 | | | | 1,139 | | | | 1,147 | | | | 8 | | | | 1,218 | | | | 1,302 | |
| | | | | | |
Book value of asset disposals (net non-cash expense / revenue) | | | 18 | | | | - | | | | 2 | | | | 2 | | | | - | | | | - | |
| | | | | | |
Total Capital Cash Adjustments | | | 1,651 | | | | 2,103 | | | | 2,652 | | | | 549 | | | | 2,453 | | | | 2,504 | |
| a | Negative cash adjustments are a cash requirement; positive cash adjustments are a cash source. |
| | |
| 2020-21 Mid-year Fiscal Update and Economic Statement | | 31 |
| | | | | | | | | | | | | | | | | | | | | | | | |
| Capital Plan a | | | | | | | | | | | | | | | | | | | | | | | | |
(millions of dollars) | | | | | | | | | | | | | | | | | | | | | | | | |
| | | 2019-20 | | | 2020-21 | | | Change fr. | | | 2021-22 | | | 2022-23 | |
| | | Actual | | | Budget | | | Forecast | | | Budget | | | Target | | | Target | |
Advanced Education | | | 554 | | | | 654 | | | | 752 | | | | 98 | | | | 480 | | | | 257 | |
Agriculture and Forestry | | | 28 | | | | 39 | | | | 65 | | | | 26 | �� | | | 87 | | | | 77 | |
Community and Social Services | | | - | | | | 1 | | | | 1 | | | | - | | | | 1 | | | | 1 | |
Culture, Multiculturalism and Status of Women | | | 40 | | | | 61 | | | | 59 | | | | (2) | | | | 50 | | | | 32 | |
Education | | | 600 | | | | 842 | | | | 979 | | | | 137 | | | | 907 | | | | 652 | |
Energy | | | 73 | | | | 163 | | | | 163 | | | | - | | | | 75 | | | | 69 | |
Environment and Parks | | | 68 | | | | 123 | | | | 167 | | | | 44 | | | | 125 | | | | 73 | |
Health | | | 1,083 | | | | 1,288 | | | | 1,276 | | | | (12) | | | | 1,226 | | | | 1,137 | |
Indigenous Relations | | | 3 | | | | 19 | | | | 21 | | | | 2 | | | | 37 | | | | 28 | |
Infrastructure | | | 125 | | | | 270 | | | | 321 | | | | 51 | | | | 325 | | | | 291 | |
Jobs, Economy and Innovation | | | 10 | | | | 12 | | | | 12 | | | | - | | | | 12 | | | | 12 | |
Justice and Solicitor General | | | 5 | | | | 10 | | | | 25 | | | | 15 | | | | 15 | | | | 18 | |
Labour and Immigration | | | 1 | | | | 1 | | | | 1 | | | | - | | | | 1 | | | | 1 | |
Municipal Affairs | | | 1,128 | | | | 1,236 | | | | 1,744 | | | | 508 | | | | 1,187 | | | | 1,143 | |
Seniors and Housing | | | 182 | | | | 216 | | | | 235 | | | | 19 | | | | 100 | | | | 54 | |
Service Alberta | | | 88 | | | | 94 | | | | 86 | | | | (8) | | | | 99 | | | | 99 | |
Transportation | | | 1,551 | | | | 1,941 | | | | 2,500 | | | | 559 | | | | 2,311 | | | | 2,150 | |
Treasury Board and Finance | | | 23 | | | | 19 | | | | 19 | | | | - | | | | 19 | | | | 19 | |
Legislative Assembly | | | 1 | | | | 3 | | | | 3 | | | | - | | | | 3 | | | | 2 | |
Total Capital Plan | | | 5,564 | | | | 6,989 | | | | 8,429 | | | | 1,440 | | | | 7,059 | | | | 6,116 | |
|
a The Capital Plan comprises capital grants included in expense plus capital investment in government-owned assets not included in expense. Capital investment adds to government capital assets, and those assets are depreciated over time through amortization expense included in total expense. | |
| | | | | | |
| Capital Grants | | | | | | | | | | | | | | | | | | | | | | | | |
| (millions of dollars) | | | | | | | | | | | | | | | | | | | | | | | | |
| | | 2019-20 | | | 2020-21 | | | Change fr. | | | 2021-22 | | | 2022-23 | |
| | | Actual | | | Budget | | | Forecast | | | Budget | | | Target | | | Target | |
Agriculture and Forestry | | | 17 | | | | 13 | | | | 39 | | | | 26 | | | | 67 | | | | 57 | |
Culture, Multiculturalism and Status of Women | | | 40 | | | | 58 | | | | 57 | | | | (1) | | | | 47 | | | | 30 | |
Education | | | 1 | | | | 1 | | | | 7 | | | | 6 | | | | 2 | | | | 2 | |
Energy | | | 60 | | | | 146 | | | | 146 | | | | - | | | | 58 | | | | 58 | |
Environment and Parks | | | 36 | | | | 55 | | | | 81 | | | | 26 | | | | 41 | | | | 23 | |
Health | | | 5 | | | | 92 | | | | 16 | | | | (76) | | | | 50 | | | | 51 | |
Indigenous Relations | | | 3 | | | | 19 | | | | 21 | | | | 2 | | | | 37 | | | | 28 | |
Infrastructure | | | 13 | | | | 13 | | | | 20 | | | | 7 | | | | 16 | | | | 8 | |
Jobs, Economy and Innovation | | | 4 | | | | - | | | | - | | | | - | | | | - | | | | - | |
Municipal Affairs | | | 1,124 | | | | 1,224 | | | | 1,732 | | | | 508 | | | | 1,181 | | | | 1,140 | |
Seniors and Housing | | | 16 | | | | 47 | | | | 49 | | | | 2 | | | | 33 | | | | 26 | |
Service Alberta | | | 2 | | | | 5 | | | | 5 | | | | - | | | | 5 | | | | 5 | |
Transportation | | | 374 | | | | 628 | | | | 700 | | | | 72 | | | | 824 | | | | 832 | |
Total Capital Grants | | | 1,696 | | | | 2,302 | | | | 2,873 | | | | 571 | | | | 2,361 | | | | 2,259 | |
| | |
| 32 | | 2020-21 Mid-year Fiscal Update and Economic Statement |
| | | | | | | | | | | | | | | | | | | | | | | | |
Capital Investment | | | | | | | | | | | | | | | | | | | | | | | | |
| (millions of dollars) | | | | | | | | | | | | | | | | | | |
| | | 2019-20 | | | 2020-21 | | | Change fr. Budget | | | 2021-22 | | | 2022-23 | |
| | | Actual | | | Budget | | | Forecast | | | Target | | | Target | |
| | | | | | |
Advanced Education | | | 554 | | | | 654 | | | | 752 | | | | 98 | | | | 480 | | | | 257 | |
Agriculture and Forestry | | | 11 | | | | 25 | | | | 26 | | | | 1 | | | | 21 | | | | 21 | |
Community and Social Services | | | - | | | | 1 | | | | 1 | | | | - | | | | 1 | | | | 1 | |
Culture, Multiculturalism and Status of Women | | | 1 | | | | 2 | | | | 2 | | | | - | | | | 2 | | | | 2 | |
Education | | | 599 | | | | 841 | | | | 972 | | | | 131 | | | | 905 | | | | 650 | |
Energy | | | 13 | | | | 17 | | | | 17 | | | | - | | | | 17 | | | | 11 | |
Environment and Parks | | | 32 | | | | 67 | | | | 86 | | | | 19 | | | | 84 | | | | 51 | |
Health | | | 1,077 | | | | 1,196 | | | | 1,260 | | | | 64 | | | | 1,175 | | | | 1,086 | |
Infrastructure | | | 112 | | | | 257 | | | | 300 | | | | 43 | | | | 309 | | | | 283 | |
Jobs, Economy and Innovation | | | 6 | | | | 12 | | | | 12 | | | | - | | | | 12 | | | | 12 | |
Justice and Solicitor General | | | 5 | | | | 9 | | | | 25 | | | | 16 | | | | 15 | | | | 18 | |
Labour and Immigration | | | 1 | | | | 1 | | | | 1 | | | | - | | | | 1 | | | | 1 | |
Municipal Affairs | | | 4 | | | | 13 | | | | 12 | | | | (1 | ) | | | 6 | | | | 3 | |
Seniors and Housing | | | 166 | | | | 168 | | | | 186 | | | | 18 | | | | 67 | | | | 28 | |
Service Alberta | | | 86 | | | | 89 | | | | 81 | | | | (8 | ) | | | 94 | | | | 94 | |
Transportation | | | 1,176 | | | | 1,313 | | | | 1,800 | | | | 487 | | | | 1,487 | | | | 1,318 | |
Treasury Board and Finance | | | 23 | | | | 19 | | | | 19 | | | | - | | | | 19 | | | | 19 | |
Legislative Assembly | | | 1 | | | | 3 | | | | 3 | | | | - | | | | 3 | | | | 2 | |
Total Capital Investment | | | 3,868 | | | | 4,687 | | | | 5,556 | | | | 869 | | | | 4,698 | | | | 3,857 | |
| | | | | | | | | | | | | | | | | | | | | | | | |
Fiscal Plan and Capital Plan Liability Principal Repayments | | | | | | | | | | | | | | | | | | | | | |
| (millions of dollars) | | | | | | | | | | | | | | | | | | |
| | | 2019-20 | | | 2020-21 | | | Change fr. Budget | | | 2021-22 | | | 2022-23 | |
| | | Actual | | | Budget | | | Forecast | | | Target | | | Target | |
| | | | | | |
Education – Alberta Schools Alternative Procurement P3s | | | 16 | | | | 17 | | | | 17 | | | | - | | | | 17 | | | | 18 | |
Infrastructure – Evan Thomas water treatment P3 | | | 1 | | | | 1 | | | | 1 | | | | - | | | | 1 | | | | 1 | |
Transportation – ring road P3s | | | 50 | | | | 56 | | | | 56 | | | | - | | | | 65 | | | | 70 | |
Seniors and Housing - Alberta Social Housing Corporation | | | 50 | | | | - | | | | - | | | | - | | | | - | | | | - | |
Treasury Board and Finance – debt to reduce pre-1992 TPP liability | | | 350 | | | | - | | | | - | | | | - | | | | - | | | | - | |
Treasury Board and Finance – direct borrowing | | | 4,249 | | | | 3,071 | | | | 3,071 | | | | - | | | | 3,680 | | | | 3,272 | |
Total Principal Repayments | | | 4,716 | | | | 3,145 | | | | 3,145 | | | | - | | | | 3,763 | | | | 3,361 | |
| | | | | | | | | | | | | | | | | | | | | | | | |
Capital Plan Funding Sources | | | | | | | | | | | | | | | | | | | | | | | | |
| (millions of dollars) | | | | | | | | | | | | | | | | | | |
| | | 2019-20 | | | 2020-21 | | | Change fr. Budget | | | 2021-22 | | | 2022-23 | |
| | | Actual | | | Budget | | | Forecast | | | Estimate | | | Target | |
| | | | | | |
Capital Plan, less | | | 5,564 | | | | 6,989 | | | | 8,429 | | | | 1,440 | | | | 7,059 | | | | 6,116 | |
10% cash flow adjustment (rounded) | | | - | | | | (700 | ) | | | (700 | ) | | | - | | | | (700 | ) | | | (600 | ) |
Capital Plan funding requirements | | | 5,564 | | | | 6,289 | | | | 7,729 | | | | 1,440 | | | | 6,359 | | | | 5,516 | |
| | | | | | |
Source of funding: | | | | | | | | | | | | | | | | | | | | | | | | |
Cash received (primarily federal govt.) / donations / disposals | | | 841 | | | | 918 | | | | 938 | | | | 20 | | | | 1,046 | | | | 956 | |
Retained income of funds and agencies (primarily ASHC) | | | 100 | | | | 200 | | | | 164 | | | | (36 | ) | | | (66 | ) | | | (49 | ) |
SUCH sector self-financed | | | 783 | | | | 774 | | | | 731 | | | | (43 | ) | | | 695 | | | | 432 | |
TIER Fund | | | 60 | | | | 146 | | | | 194 | | | | 48 | | | | 62 | | | | 61 | |
Alternative financing (P3s – public-private partnerships) | | | 159 | | | | 151 | | | | 107 | | | | (44 | ) | | | 46 | | | | - | |
Capital Plan financing account withdrawal / (deposit) | | | 123 | | | | - | | | | - | | | | - | | | | - | | | | - | |
Direct borrowing | | | 3,499 | | | | 4,100 | | | | 5,595 | | | | 1,495 | | | | 4,575 | | | | 4,116 | |
Total Capital Plan funding Sources | | | 5,564 | | | | 6,289 | | | | 7,729 | | | | 1,440 | | | | 6,358 | | | | 5,516 | |
| | |
| 2020-21 Mid-year Fiscal Update and Economic Statement | | 33 |
Historical Fiscal Summary, 2008-09 to 2022-23a
| | | | | | | | | | | | | | | | | | | | | | | | | | | | | | | | | | | | | | | | | | | | | | | | | | | | | | | | | | | | | | | | |
| | | | | | | | | | | | | | | | |
| | | | | | 1 | | | 2 | | | 3 | | | 4 | | | 5 | | | 6 | | | 7 | | | 8 | | | 9 | | | 10 | | | 11 | | | 12 | | | 13 | | | 14 | | | 15 | |
| | | | | | 2008-09 | | | 2009-10 | | | 2010-11 | | | 2011-12 | | | 2012-13 | | | 2013-14 | | | 2014-15 | | | 2015-16 | | | 2016-17 | | | 2017-18 | | | 2018-19 | | | 2019-20 | | | 2020-21 | | | 2021-22 | | | 2022-23 | |
| Income Statement | | | | | | | | | | | | | | | | | | | | | | | | | | | | | | | | | | | Actual | | | Forecast | | | Target | | | Target | |
| | | | Revenue | | | | | | | | | | | | | | | | | | | | | | | | | | | | | | | | | | | | | | | | | | | | | | | | | | | | | | | | | | | | |
| | 1 | | | Personal income tax | | | 8,708 | | | | 7,877 | | | | 7,631 | | | | 8,563 | | | | 9,621 | | | | 10,537 | | | | 11,042 | | | | 11,357 | | | | 10,763 | | | | 10,775 | | | | 11,874 | | | | 11,244 | | | | 10,753 | | | | 11,686 | | | | 12,535 | |
| | 2 | | | Corporate income tax | | | 4,252 | | | | 4,754 | | | | 3,334 | | | | 3,678 | | | | 4,756 | | | | 5,488 | | | | 5,796 | | | | 4,195 | | | | 3,769 | | | | 3,448 | | | | 4,871 | | | | 4,107 | | | | 2,188 | | | | 1,666 | | | | 2,391 | |
| | 3 | | | Other tax revenue | | | 3,817 | | | | 3,746 | | | | 3,820 | | | | 4,099 | | | | 4,333 | | | | 4,500 | | | | 4,598 | | | | 5,168 | | | | 5,649 | | | | 6,538 | | | | 6,833 | | | | 5,747 | | | | 5,286 | | | | 5,742 | | | | 5,997 | |
| | 4 | | | Resource revenue | | | 11,915 | | | | 6,768 | | | | 8,428 | | | | 11,636 | | | | 7,779 | | | | 9,578 | | | | 8,948 | | | | 2,789 | | | | 3,097 | | | | 4,980 | | | | 5,429 | | | | 5,937 | | | | 1,669 | | | | 2,491 | | | | 5,055 | |
| | 5 | | | Investment income | | | (1,888 | ) | | | 3,541 | | | | 2,486 | | | | 2,168 | | | | 2,595 | | | | 3,423 | | | | 3,113 | | | | 2,544 | | | | 3,698 | | | | 3,126 | | | | 2,349 | | | | 2,828 | | | | 1,919 | | | | 1,962 | | | | 2,250 | |
| | 6 | | | Premiums, fees and licences | | | 3,356 | | | | 2,857 | | | | 2,922 | | | | 2,931 | | | | 3,184 | | | | 3,437 | | | | 3,564 | | | | 3,574 | | | | 3,701 | | | | 3,839 | | | | 3,911 | | | | 3,929 | | | | 4,030 | | | | 4,162 | | | | 4,291 | |
| | 7 | | | Other own-source revenue | | | 4,587 | | | | 4,627 | | | | 4,903 | | | | 5,128 | | | | 5,234 | | | | 5,412 | | | | 6,438 | | | | 5,850 | | | | 3,637 | | | | 6,983 | | | | 6,292 | | | | 3,360 | | | | 4,232 | | | | 5,052 | | | | 5,391 | |
| | 8 | | | Total own-source revenue | | | 34,747 | | | | 34,170 | | | | 33,524 | | | | 38,203 | | | | 37,502 | | | | 42,375 | | | | 43,499 | | | | 35,477 | | | | 34,314 | | | | 39,689 | | | | 41,559 | | | | 37,152 | | | | 30,077 | | | | 32,761 | | | | 37,910 | |
| | 9 | | | Federal transfers | | | 4,578 | | | | 5,342 | | | | 5,452 | | | | 5,192 | | | | 5,042 | | | | 7,059 | | | | 5,982 | | | | 7,142 | | | | 7,979 | | | | 7,606 | | | | 8,013 | | | | 9,072 | | | | 11,337 | | | | 9,903 | | | | 9,731 | |
| | 10 | | | Total Revenue | | | 39,325 | | | | 39,512 | | | | 38,976 | | | | 43,395 | | | | 42,544 | | | | 49,434 | | | | 49,481 | | | | 42,619 | | | | 42,293 | | | | 47,295 | | | | 49,572 | | | | 46,224 | | | | 41,414 | | | | 42,664 | | | | 47,641 | |
| | | | Expense by Function | | | | | | | | | | | | | | | | | | | | | | | | | | | | | | | | | | | | | | | | | | | | | | | | | | | | | | | | | | | | |
| | 11 | | | Health | | | 13,674 | | | | 14,636 | | | | 15,393 | | | | 16,284 | | | | 17,254 | | | | 17,967 | | | | 19,366 | | | | 20,115 | | | | 20,687 | | | | 21,239 | | | | 21,921 | | | | 22,408 | | | | 22,765 | | | | 22,267 | | | | 22,326 | |
| | 12 | | | Basic / advanced education | | | 10,438 | | | | 11,067 | | | | 11,362 | | | | 11,951 | | | | 12,394 | | | | 12,782 | | | | 13,103 | | | | 13,673 | | | | 14,110 | | | | 14,471 | | | | 14,848 | | | | 14,971 | | | | 14,673 | | | | 14,556 | | | | 14,446 | |
| | 13 | | | Social services | | | 3,417 | | | | 3,807 | | | | 4,129 | | | | 4,278 | | | | 4,641 | | | | 4,668 | | | | 4,548 | | | | 4,752 | | | | 5,198 | | | | 5,592 | | | | 5,867 | | | | 6,203 | | | | 6,285 | | | | 6,015 | | | | 6,036 | |
| | 14 | | | Other program expense | | | 10,386 | | | | 9,734 | | | | 9,443 | | | | 9,853 | | | | 10,528 | | | | 12,970 | | | | 11,031 | | | | 10,375 | | | | 12,607 | | | | 13,189 | | | | 11,866 | | | | 12,893 | | | | 17,022 | | | | 12,992 | | | | 12,008 | |
| | 15 | | | Total program expense | | | 37,915 | | | | 39,344 | | | | 40,327 | | | | 42,366 | | | | 44,817 | | | | 48,387 | | | | 48,048 | | | | 48,915 | | | | 52,602 | | | | 54,491 | | | | 54,502 | | | | 56,475 | | | | 60,745 | | | | 55,830 | | | | 54,816 | |
| | 16 | | | Debt servicing costs | | | 208 | | | | 214 | | | | 472 | | | | 509 | | | | 530 | | | | 601 | | | | 722 | | | | 776 | | | | 1,018 | | | | 1,420 | | | | 1,971 | | | | 2,235 | | | | 2,413 | | | | 2,737 | | | | 2,965 | |
| | 17 | | | Pension provisions | | | 2,133 | | | | 430 | | | | 439 | | | | 634 | | | | 296 | | | | 748 | | | | (404 | ) | | | (630 | ) | | | (543 | ) | | | (593 | ) | | | (190 | ) | | | (334 | ) | | | (415 | ) | | | (379 | ) | | | (275 | ) |
| | 18 | | | Total Expense | | | 40,256 | | | | 39,988 | | | | 41,238 | | | | 43,509 | | | | 45,643 | | | | 49,736 | | | | 48,366 | | | | 49,061 | | | | 53,077 | | | | 55,318 | | | | 56,283 | | | | 58,376 | | | | 62,743 | | | | 58,188 | | | | 57,506 | |
| | 19 | | | Surplus / (Deficit) | | | (931 | ) | | | (476 | ) | | | (2,262 | ) | | | (114 | ) | | | (3,099 | ) | | | (302 | ) | | | 1,115 | | | | (6,442 | ) | | | (10,784 | ) | | | (8,023 | ) | | | (6,711 | ) | | | (12,152 | ) | | | (21,329 | ) | | | (15,524 | ) | | | (9,865 | ) |
| Capital Plan
b | | | 7,943 | | | | 8,000 | | | | 7,544 | | | | 6,884 | | | | 6,062 | | | | 5,770 | | | | 6,181 | | | | 6,558 | | | | 6,578 | | | | 9,021 | | | | 6,057 | | | | 5,564 | | | | 8,429 | | | | 7,059 | | | | 6,116 | |
| | | | | | | | | | | | | | | |
| Balance
Sheet (at
March 31) | | | | | | | | | | | | | | | | | | | | | | | | | | | | | | | | | | | | | | | | | | | | | | | | | | | | | | | | | | | | |
| | 20 | | | Heritage / endowment funds | | | 16,900 | | | | 17,077 | | | | 17,500 | | | | 17,936 | | | | 18,176 | | | | 18,562 | | | | 18,860 | | | | 19,262 | | | | 19,836 | | | | 20,306 | | | | 20,700 | | | | 20,670 | | | | 20,920 | | | | 21,248 | | | | 21,666 | |
| | 21 | | | Contingency Account | | | 16,822 | | | | 14,983 | | | | 11,192 | | | | 7,497 | | | | 3,326 | | | | 4,658 | | | | 6,529 | | | | 3,625 | | | | 2,299 | | | | 1,661 | | | | 6,342 | | | | - | | | | - | | | | - | | | | - | |
| | 22 | | | Other financial assets | | | 28,868 | | | | 30,338 | | | | 30,799 | | | | 32,972 | | | | 34,734 | | | | 40,039 | | | | 40,688 | | | | 41,138 | | | | 44,152 | | | | 49,010 | | | | 48,701 | | | | 55,711 | | | | 54,703 | | | | 52,606 | | | | 55,157 | |
| | 23 | | | Taxpayer-supported Capital Plan liabilities | | | (880 | ) | | | (2,888 | ) | | | (3,199 | ) | | | (3,442 | ) | | | (4,594 | ) | | | (8,724 | ) | | | (11,922 | ) | | | (19,040 | ) | | | (23,769 | ) | | | (29,339 | ) | | | (33,597 | ) | | | (37,207 | ) | | | (42,858 | ) | | | (47,420 | ) | | | (51,472 | ) |
| | 24 | | | Taxpayer-supported Fiscal Plan debt | | | (1,160 | ) | | | (2,279 | ) | | | (2,015 | ) | | | (1,676 | ) | | | (1,426 | ) | | | (1,333 | ) | | | (1,053 | ) | | | (1,024 | ) | | | (10,751 | ) | | | (19,227 | ) | | | (29,060 | ) | | | (36,935 | ) | | | (54,588 | ) | | | (64,920 | ) | | | (73,590 | ) |
| | 25 | | | Self-supported debt | | | (7,921 | ) | | | (9,300 | ) | | | (11,010 | ) | | | (12,707 | ) | | | (14,116 | ) | | | (15,775 | ) | | | (16,592 | ) | | | (17,373 | ) | | | (17,822 | ) | | | (17,848 | ) | | | (18,134 | ) | | | (18,066 | ) | | | (18,294 | ) | | | (18,783 | ) | | | (19,425 | ) |
| | 26 | | | Total Debt | | | (9,961 | ) | | | (14,467 | ) | | | (16,224 | ) | | | (17,825 | ) | | | (20,136 | ) | | | (25,832 | ) | | | (29,567 | ) | | | (37,437 | ) | | | (52,342 | ) | | | (66,414 | ) | | | (80,791 | ) | | | (92,208 | ) | | | (115,740 | ) | | | (131,123 | ) | | | (144,487 | ) |
| | 27 | | | Pension obligations | | | (10,239 | ) | | | (9,483 | ) | | | (9,922 | ) | | | (10,556 | ) | | | (10,852 | ) | | | (11,600 | ) | | | (11,196 | ) | | | (10,566 | ) | | | (10,023 | ) | | | (9,430 | ) | | | (9,252 | ) | | | (8,918 | ) | | | (8,503 | ) | | | (8,124 | ) | | | (7,849 | ) |
| | 28 | | | Other liabilities | | | (10,689 | ) | | | (11,131 | ) | | | (11,692 | ) | | | (11,033 | ) | | | (10,793 | ) | | | (12,795 | ) | | | (12,260 | ) | | | (12,141 | ) | | | (12,823 | ) | | | (14,477 | ) | | | (13,177 | ) | | | (15,399 | ) | | | (14,832 | ) | | | (14,613 | ) | | | (14,633 | ) |
| | 29 | | | Net Financial Assets / (Debt) | | | 31,701 | | | | 27,317 | | | | 21,653 | | | | 18,991 | | | | 14,455 | | | | 13,032 | | | | 13,054 | | | | 3,881 | | | | (8,901 | ) | | | (19,344 | ) | | | (27,477 | ) | | | (40,144 | ) | | | (63,452 | ) | | | (80,006 | ) | | | (90,146 | ) |
| | 30 | | | Capital / non-fin. assets - less defer. contrib. starting 2012-13 | | | 30,275 | | | | 34,217 | | | | 37,607 | | | | 40,122 | | | | 39,517 | | | | 40,839 | | | | 42,197 | | | | 44,661 | | | | 46,622 | | | | 49,015 | | | | 50,744 | | | | 51,570 | | | | 53,549 | | | | 54,579 | | | | 54,854 | |
| | 31 | | | Net Assets c | | | 61,976 | | | | 61,534 | | | | 59,260 | | | | 59,113 | | | | 53,972 | | | | 53,871 | | | | 55,251 | | | | 48,542 | | | | 37,721 | | | | 29,671 | | | | 23,267 | | | | 11,426 | | | | (9,903 | ) | | | (25,427 | ) | | | (35,292 | ) |
| a | Numbers are not strictly comparable due to numerous accounting policy changes over time. Examples include reporting certain items (transfers through the tax system, crude oil marketing and transportation costs, allowance for corporate income tax doubful accounts) as expense, instead of netting the amounts from related revenue, increasing both revenue and expense, but not impacting the surplus / (deficit) . Beginning in 2015-16, revenue includes donations to post-secondary and health authority endowments; in prior years donations were not inlcuded in revenue but rather were reported as “adjustments to net assets.” |
| b | Reflects capital grants and other support included in expense, and capital investment in government-owned assets not included in expense. Capital investment adds to capital assets, which are depreciated over time through amortization expense. Numbers for 2008-09 to 2013-14 are estimates as details required to consolidate SUCH sector capital spending with full accuracy are not readily available. |
| c | The change in net assets / (debt) year over year does not match the surplus / (deficit) exactly in most years, due to various balance sheet adjustments, most of which are minor. A significant adjustment reducing net assets by $2 billion was made in 2012-13, to recognize the accumulated deferred capital contribution liability when the accounting standard was adopted. |
| | |
| 34 | | 2020-21 Mid-year Fiscal Update and Economic Statement |
Reporting Methodology and Legislative Compliance
| | | | |
Method of Consolidation The 2020-21 Mid-year Fiscal Update and Economic Statement reports on the same scope, using the same method of consolidation, as presented in Budget 2020. This is also the same scope and consolidation approach used in the Consolidated Financial Statements in the Government of Alberta Annual Report. The results of all government departments, funds and agencies, except those designated as government business enterprises, are consolidated on a line-by-line basis. Revenue and expense transactions between consolidated entities have been eliminated. The accounts of provincial agencies designated as government business enterprises are included on the modified equity basis, computed in accordance with International Financial Reporting Standards applicable to those entities. | | Basis of Financial Reporting The consolidated fiscal summary reports revenue (including gains from disposal of tangible capital assets), expense (including amortization, inventory consumption, loss on disposal and write-down of tangible capital assets), and surplus / (deficit). Revenue and expense are recorded using the accrual basis of accounting. Cash received for goods or services which have not been provided by period end is recorded as unearned revenue. Transfers received for capital purposes, and donated capital assets, are recorded as “deferred capital contributions” when the cash or asset is received, and recognized in revenue over the related asset’s useful life (in effect matching the asset’s amortization expense). Expense includes the province’s cash payments towards the unfunded pension liabilities, and the non-cash change in unfunded pension liabilities. Debt servicing costs include interest payable, and amortization of issue costs and discounts / premiums on debt issues. | | Compliance with Legislation The Fiscal Planning and Transparency Act (FPTA) requires a public report on the accuracy of the Fiscal Plan for a fiscal year on or before November 30. The FPTA gives the President of Treasury Board and Minister of Finance discretion over the form of the report. The 2020-21 Mid-year Fiscal Update and Economic Statement includes comparisons between the Budget 2020 estimates and second quarter forecasts for revenue and expense (including details and categories of each); the surplus / (deficit); cash adjustments and balance; a summary balance sheet; the Capital Plan; and borrowing requirements and sources. An updated Alberta economic outlook, with associated assumptions, is also provided. The forecast provided in this report is in compliance with the requirements of the FPTA. |
| | |
| 2020-21 Mid-year Fiscal Update and Economic Statement | | 35 |