Exhibit 99.6
GOVERNMENT OF ALBERTA
2021-22 Mid-year
Fiscal Update and
Economic Statement
NOVEMBER 2021 |
Table of Contents
2021-22 Mid-year Fiscal Plan Highlights | 3 | |||
Revenue Highlights | 4 | |||
Expense Highlights | 6 | |||
Assets and Liabilities | 9 | |||
Capital Plan | 10 | |||
Economic Update | 11 | |||
Fiscal Update Tables | 23 | |||
Reporting Methodology and Legislative Compliance | 35 |
Note: Amounts presented in tables may not add to totals due to rounding.
Treasury Board and Finance, Government of Alberta
2021–22 Mid-year Fiscal Update and Economic Statement, November 2021
Additional copies of this report may be obtained by visiting our website at: www.alberta.ca/budget-documents.aspx
2 | 2021-22 Mid-year Fiscal Update and Economic Statement |
2021-22 Mid-year Fiscal Plan Highlights
The Alberta government fiscal situation has changed materially from the forecast presented in Budget 2021. At that time, the world was still reeling from the COVID-19 pandemic and its impacts on global economic activity, travel, energy and financial markets, and health care and other social systems. A great deal of uncertainty existed and still does, regarding the success and extent of vaccination coverage, and global economic growth.
Since the budget was presented in February 2021, COVID-19 waves have continued to challenge Alberta’s health care system and additional supports for Albertans and Alberta businesses have been required, with the higher expense mostly offset by the budgeted contingency. Severe drought conditions this summer have also resulted in significant expense increases for agriculture support, the cash for much of it to be withdrawn from the crop insurance fund.
There have also been positive developments, with Alberta’s Recovery Plan gaining traction, improved
employment, solid consumer spending, residential construction and activity, and stronger-than-expected global energy demand growth - boosting oil and natural gas prices.
The revenue forecast has improved dramatically in all three years. Revenue in 2021-22 is forecast at $57.9 billion, $14.2 billion higher than budget, with over half of the increase from resource revenue. Revenue is $8.2 billion and $5.5 billion more than the budget estimates for 2022-23 and 2023-24 respectively. Risks remain elevated: pandemic impacts constrained short-term energy supply growth, and now demand is returning with unexpected strength, causing what should be a temporary spike in oil and natural gas prices. This, combined with pent-up consumer demand, supply chain issues, including major flooding in British Columbia, are pressuring inflation and interest rates.
Total expense has increased $1.8 billion from Budget 2021, with three-quarters of this due to adding a $1.4 billion provision for potential crop insurance indemnities. About $0.4 billion in additional COVID-19 / Recovery Plan
expense is offset by lower spending or increased federal transfers instead of the budgeted contingency expense, and the remaining increased operating expense is largely associated with offsetting revenue, and reduced or re-profiled capital grants, amortization and debt servicing costs. Expense in 2022-23 is $0.5 billion higher than estimated in budget, and in 2023-24 is $0.1 billion lower, mainly reflecting re-profiled capital grants, COVID-19 / Recovery Plan initiatives, offset by lower debt servicing costs.
The deficit in 2021-22 is forecast to be $5.8 billion, $12.4 billion lower than Budget 2021. In the next two years, deficits of $3.3 billion and $2.3 billion are forecast, $7.7 billion and $5.7 billion lower than the budget estimates.
Capital Plan spending in 2021-22 has increased slightly mainly reflecting additional federally-funded municipal grants. In 2022-23, spending has increased almost $0.9 billion, due primarily to re-profiling of projects.
Taxpayer-supported debt is estimated to reach $101.6 billion by March 31, 2022, $9 billion less than restated Budget 2021 forecast. For 2021-22, net debt to GDP is estimated at 19.2%.
Consolidated Fiscal Summary
(millions of dollars) | 2020-21 | 2021-22 | Change fr. | 2022-23 | 2023-24 | |||||||||||||||||||||||
Statement of Operations | Actual | Budget | Forecast | Budget | Target | Target | ||||||||||||||||||||||
1 | Total Revenue | 43,137 | 43,697 | 57,917 | 14,220 | 55,643 | 56,402 | |||||||||||||||||||||
Expense | ||||||||||||||||||||||||||||
2 | Operating expense | 46,205 | 48,280 | 48,875 | 595 | 48,545 | 48,586 | |||||||||||||||||||||
3 | % change from prior year | (5.0) | 2.1 | 5.8 | - | (0.7 | ) | 0.1 | ||||||||||||||||||||
4 | Capital grants | 1,752 | 2,608 | 2,502 | (106 | ) | 1,943 | 2,267 | ||||||||||||||||||||
5 | Amortization / inventory consumption / loss on disposals | 3,659 | 4,009 | 3,833 | (176 | ) | 3,993 | 4,069 | ||||||||||||||||||||
6 | Debt servicing costs | 2,486 | 2,764 | 2,484 | (280 | ) | 2,934 | 3,127 | ||||||||||||||||||||
7 | Pension provisions | (282) | (369) | (340) | 29 | (255 | ) | (266 | ) | |||||||||||||||||||
8 | Expense (before COVID-19 /Recovery Plan, Contingency, Crude-by-rail) | 53,820 | 57,294 | 57,354 | 60 | 57,160 | 57,783 | |||||||||||||||||||||
COVID-19 / Recovery Plan: | ||||||||||||||||||||||||||||
9 | Operating expense | 4,059 | 919 | 2,238 | 1,319 | 753 | 130 | |||||||||||||||||||||
10 | Capital grants | 649 | 196 | 452 | 256 | 257 | 68 | |||||||||||||||||||||
11 | Inventory consumption (PPE) | 402 | 33 | 133 | 100 | - | - | |||||||||||||||||||||
12 | Contingency for COVID-19 / Recovery Plan - unallocated | - | 1,750 | 487 | (1,263 | ) | - | - | ||||||||||||||||||||
13 | Crude-by-rail provision | 443 | 976 | 925 | (51 | ) | - | - | ||||||||||||||||||||
14 | Contingency / disaster and emergency assistance | 721 | 750 | 2,150 | 1,400 | 750 | 750 | |||||||||||||||||||||
15 | Total Expense | 60,099 | 61,918 | 63,739 | 1,821 | 58,920 | 58,731 | |||||||||||||||||||||
16 | Surplus / Deficit | (16,962) | (18,221) | (5,822) | 12,399 | (3,277 | ) | (2,329 | ) | |||||||||||||||||||
Capital Plan | ||||||||||||||||||||||||||||
17 | Capital grants | 2,401 | 2,804 | 2,954 | 150 | 2,200 | 2,335 | |||||||||||||||||||||
18 | Capital investment | 4,495 | 5,310 | 5,299 | (11 | ) | 5,073 | 3,729 | ||||||||||||||||||||
19 | Total Capital Plan | 6,896 | 8,114 | 8,253 | 139 | 7,274 | 6,064 |
2021-22 Mid-year Fiscal Update and Economic Statement | 3 |
Revenue Highlights
Total Revenue
Total revenue is forecast at $57.9 billion in 2021-22, $14.2 billion higher than Budget 2021, and $2.9 billion more than the first quarter forecast. Revenue is forecast to drop $2.3 billion in 2022-23, to $55.6 billion, and to $56.4 billion in 2023-24, due mainly to lower federal transfers as pandemic transfers decrease, and resource revenue and investment income, as energy prices and financial markets stabilize. Total revenue is still $8.2 billion more than anticipated in 2022-23 and $5.5 billion in 2023-24, relative to Budget 2021.
Short-term energy investment has been impacted by the pandemic and resulting travel restrictions and closure of global economic activity. This has dampened oil and natural gas supply growth. With global economic activity picking up, energy demand growth is temporarily exceeding supply growth, causing a surge in prices. OPEC and other producing nations have begun to increase production, which should ease the current situation. The forecast assumes the supply-demand growth imbalance will influence prices some months into 2022, when they will decrease slightly and stabilize.
Alberta’s economy is recovering, with investment, drilling and oil production increasing, and energy, petrochemical and food manufacturing sales and exports on the upswing. Decreasing lumber prices and the severe drought this summer have hampered the forestry and primary agriculture sectors though, and rising costs and global supply chain issues are constraining employment growth. The forecast is based on real GDP growth of 6.1% in 2021, and then 5.1% in 2022.
Non-Renewable Resource Revenue
Non-renewable resource revenue is forecast at $10.9 billion in 2021-22, $7.8 billion higher than in 2020-21 and $8.1 billion more than estimated in Budget 2021. Revenue is forecast to decrease to $9.9 billion in 2022-23 and to $9.2 billion in 2023-24, as energy prices stabilize. Bitumen royalties now make up about 70% of resource revenue, and the proportion is anticipated to continue increasing.
The West Texas Intermediate (WTI) price is forecast at US$70.50 per barrel (/bbl) for 2021-22, $24.50 more than estimated Budget 2021. WTI is
estimated to drop to about $64/bbl in 2022-23 and 2023-24, but this is still $9/bbl and $7/bbl more than expected in Budget 2021. The decrease is based on global demand growth moderating and supply increasing.
The light-heavy oil price differential has recently widened, due to reduced refinery demand caused by the jump in natural gas prices from energy supply issues in Europe and Asia. As Alberta’s high-sulphur heavy oil requires hydrogen treatment prior to refining, and as natural gas is used to produce the hydrogen, the cost of refining Alberta oil has risen, reducing demand and widening the differential. The oil price differential is now forecast at US$14.40/ bbl for 2021-22, close to Budget 2021, but $1.10 wider than the first quarter update estimate. Increasing Alberta production is also contributing to the wider differential, but also adds to royalties although at slightly lower prices.
Natural gas and by-product royalties have also increased, by $1.1 billion in 2021-22, as natural gas and oil prices are higher (by-product prices follow oil prices). Royalties decrease in the following two years as prices moderate.
Revenue
(millions of dollars) | 2020-21 | 2021-22 | Change fr. | 2022-23 | 2023-24 | |||||||||||||||||||
Actual | Budget | Forecast | Budget | Target | Target | |||||||||||||||||||
Personal income tax | 11,257 | 11,647 | 13,075 | 1,428 | 13,083 | 13,792 | ||||||||||||||||||
Corporate income tax | 3,037 | 1,891 | 2,916 | 1,025 | 3,308 | 4,110 | ||||||||||||||||||
Education property tax | 2,483 | 2,472 | 2,452 | (20) | 2,534 | 2,618 | ||||||||||||||||||
Other taxes | 2,802 | 3,055 | 2,969 | (86) | 3,114 | 3,208 | ||||||||||||||||||
Bitumen royalty | 2,006 | 1,482 | 7,607 | 6,125 | 6,961 | 6,675 | ||||||||||||||||||
Other non-renewable resource revenue | 1,085 | 1,374 | 3,301 | 1,927 | 2,898 | 2,556 | ||||||||||||||||||
Transfers from Government of Canada | 10,532 | 10,181 | 11,367 | 1,186 | 10,393 | 10,043 | ||||||||||||||||||
Heritage / endowment funds | 1,888 | 1,484 | 3,305 | 1,821 | 2,329 | 1,980 | ||||||||||||||||||
Other investment income | 754 | 721 | 690 | (31) | 781 | 842 | ||||||||||||||||||
Net income from Government Business Enterprises | (83 | ) | 1,877 | 2,284 | 407 | 2,369 | 2,514 | |||||||||||||||||
Premiums, fees and licences | 4,021 | 4,133 | 4,283 | 150 | 4,303 | 4,437 | ||||||||||||||||||
Other | 3,355 | 3,380 | 3,669 | 289 | 3,570 | 3,627 | ||||||||||||||||||
Total Revenue | 43,137 | 43,697 | 57,917 | 14,220 | 55,643 | 56,402 | ||||||||||||||||||
Change from Budget 2021 in 2022-23 and 2023-24: | Personal income tax | 644 | 534 | |||||||||||||||||||||
Corporate income tax | 826 | 971 | ||||||||||||||||||||||
Other taxes (includes education property tax) | (100 | ) | (113 | ) | ||||||||||||||||||||
Non-renewable resource revenue | 5,141 | 3,362 | ||||||||||||||||||||||
Transfers from Government of Canada | 521 | 258 | ||||||||||||||||||||||
Investment income | 785 | 344 | ||||||||||||||||||||||
Net income from GBEs | 304 | 42 | ||||||||||||||||||||||
Other revenue | 100 | 139 | ||||||||||||||||||||||
Total change from Budget 2021 | 8,221 | 5,537 |
4 | 2021-22 Mid-year Fiscal Update and Economic Statement |
Tax Revenue
Total tax revenue in 2021-22 is forecast at $21.4 billion, $2.3 billion higher than budget, and $1.8 billion more than in 2020-21. The increase from budget is due to stronger personal (PIT) and corporate (CIT) income taxes, while the increase from last year is primarily from growth in reported PIT.
PIT revenue is forecast at $13.1 billion, $1.4 billion higher than estimated in Budget 2021, and $1.8 billion more than in 2020-21. Revenue grows to $13.8 billion by 2023-24. Improving employment and household income, including federal COVID-19 transfers this fiscal year, are contributing to PIT growth. In 2021-22, reported PIT revenue also includes a $717 million prior-years’ adjustment. As 2020 assessments are only now being finalized, 2019-20 and 2020-21 PIT reported in those years’ financial statements contained estimates for 2020 and 2021 which were too low. This requires an adjustment reported in 2021-22 PIT.
CIT revenue of $2.9 billion is forecast for 2021-22, $1 billion more than the budget estimate but $121 million lower than 2020-21. CIT then increases rapidly, by an average of 19% per year and reaches $4.1 billion by 2023-24, driven by economic recovery and an attractive business climate. The decrease in 2021-22 from last year results from positive 2020-21 year-end accounting adjustments not expected at the same level this year
(e.g. accounts receivable accruals, refund liabilities).
Other tax revenue in 2021-22 is estimated at $5.4 billion, $106 million less than expected in Budget 2021, but an increase of $136 from 2020-21. Other tax revenue is forecast to grow $405 million, to $5.8 billion, over the next two years. The decline from budget is mainly due to the impact of lower consumption on fuel and tobacco taxes, and the tourism levy. Fuel tax revenue growth is expected to slow over the medium term, as people transition to more fuel-efficient or electric vehicles and working from home. Education
property tax revenue is lower than budget in all three years, as municipal credits have been increased under the Provincial Education Requisition Credit for uncollectible education property tax on delinquent oil and gas properties. These are partly offset by increased revenue from insurance, cannabis and freehold mineral rights taxes, due to higher-than-expected revenue in 2020, increased consumption and higher oil and natural gas price forecasts, respectively.
Transfers from Government of Canada
Federal transfers of $11.4 billion are forecast for 2021-22, $1.2 billion higher than estimated in Budget 2021. Main changes comprise: a $465 million special one-time bump to the Canada Health Transfer (CHT) for COVID-19, and $44 million added following usual revisions to the provincial-allocation calculation (Alberta’s share of the national population, and Canadian GDP growth); $116 million onetime transfer for immunization costs; a net $145 million increase in infrastructure support, reflecting a one-time supplement of $244 million to the Canada Community-Building Fund, partly offset by re-profiling of various projects under the array of federal infrastructure programs, mostly for municipalities; $208 million in agriculture support, primarily for livestock producers; labour market agreement funding re-profiled from 2020-21; a net $261 million in other increases including Safe Return to Class funding, early learning workforce support and flood assistance, partly offset by re-profiling a net $50 million in site rehabilitation funding.
Transfers are $0.5 billion higher than budget in 2022-23, due mainly to the revised CHT and re-profiling of infrastructure and site rehabilitation funds, with revenue in 2022-23 relatively close to budget, with the main variance the usual CHT revision.
Investment Income
Investment income in 2021-22 is forecast at $4 billion, $1.8 billion more than budget as financial market returns have been strong. Almost all the increase is from the Heritage and endowment funds. Income is forecast to decrease to $3.1 billion and $2.8 billion in the following two years, based on market returns moderating to more “normal” rates, although investment income is still $785 million and $344 million greater than the budget forecasts.
Other Revenue
Net income from government business enterprises in 2021-22 is forecast at $2.3 billion, $407 million more than budget, primarily due to higher income from ATB Financial (mainly reduced credit loss provision), Alberta Petroleum Marketing Commission (APMC, optimization transaction of Sturgeon Refinery) and gaming. Revenue is higher than budget in 2022-23, and slightly higher in 2023-24, due to the ATB and APMC improvements.
Premiums, fees and licences revenue of $4.3 billion is forecast for 2021-22, an increase of $150 million from budget. Timber royalties and fees have increased $117 million from elevated lumber prices, though prices have now dropped (revenue is $202 million lower than first quarter forecast). Other increases are from the ATB payment-in-lieu-of-taxes, based on higher net income, and parks fees and the 911 call levy. These are partly offset by lower Alberta Health Services fees, mainly from out-of-province patients.
Other revenue of $3.7 billion is up by $289 million from budget, comprising: $207 million in external investment management charges arising from increased income, charged to external clients (e.g. pension plans), which also impacts Treasury Board and Finance operating expense; $138 million in compliance payments to the Technology Innovation and Emissions Reduction Fund, from higher activity; partially offset by decreases of $56 million, mainly in fines and penalties revenue.
2021-22 Mid-year Fiscal Update and Economic Statement | 5 |
Expense Highlights
Total Expense
Total expense is forecast at $63.7 billion in 2021-22, an increase of $3.6 billion from 2020-21 and $1.8 billion more than estimated in Budget 2021.
The increase from 2020-21 comprises: $2.7 billion in “regular” operating expense, $0.9 billion primarily in capital grants, $1.4 billion for disaster and emergency assistance and $0.5 billion for crude-by-rail divestment, partly offset by a net decrease of $1.8 billion in COVID-19 / recovery plan expense.
The increase from budget consists of $0.6 billion in “regular”operating expense and a net $0.4 billion in COVID-19 / Recovery plan expense. A provision of $1.4 billion has been added for potential crop insurance indemnities due to the 2021 drought. These increases are partially offset by a net decrease of $0.5 billion in other expense including $51 million in the provision for crude-by-rail divestment.
In the future years, changes from budget reflect an increase of $0.5 billion in 2022-23 and a decrease in 2023-24 of $0.1 billion. Operating expense, excluding COVID-19 / Recovery Plan, is increasing by $154 million in 2022-23 and $166 million in 2023-24, primarily due to increases in external investment management fees, the cost of selling oil, and dedicated revenue initiatives. Capital grants, excluding COVID-19 / recovery plan, are increasing by $190 million in 2022-23 mainly from re-profiling of federally funded municipal projects. Amortization is forecast $297 million lower over the two subsequent years from revised estimates in Health, while debt servicing costs are forecast $359 million lower over 2022-24 due to reduced borrowing requirements.
COVID-19 / recovery plan operating expense increase of $281 million in 2022-23 includes $172 million in re-profiled cash flows for the federal Site Rehabilitation program and $91 million for the Alberta Jobs Now Program.
COVID-19 / recovery plan capital grant increases of $166 million in 2022-23 and $68 million in 2023-24 include
$47 million for irrigation and other water projects, $150 million for Alberta’s broadband strategy and $37 million for the Terwillegar Drive expansion.
Operating Expense (excluding COVID-19 / Recovery Plan)
Operating expense (excluding COVID-19 / Recovery Plan) is forecast at $48.9 billion, a $595 million increase from budget, mainly from:
• | $25 million in Advanced Education including $20 million for the student loan provision and $5 million for the French language program and Canada student loan administration fees; |
• | $19 million in Agriculture, Forestry and Rural Economic Development, with $11 million in additional federal funding for mountain pine beetle infestations and Canadian Agriculture Partnership, and $8 million for cloud-based information technology; |
• | $49 million in Children’s Services mainly comprising $56 million for extending the current federal Early Learning Child Care agreement, less $6 million reallocated to Critical Worker Benefits in COVID-19 operating expense; |
• | $63 million in Energy for the cost of selling oil; |
• | $85 million in Environment and Parks comprising $69 million from the Technology Innovation and Emissions Management Reduction (TIER) fund and a net $16 million from higher parks fees and other dedicated revenue changes; |
• | $170 million in Health, mainly due to $160 million in physician compensation from increased fee for service billings, and $93 million in acute care, partially offset by decreases of $83 million in other programs; |
• | $8 million in Indigenous Relations for the residential school grant, offset by lower First Nations Development Fund grants; |
• | $11 million in Municipal Affairs for 911 call centre support; |
• | $43 million in Transportation primarily comprising $35 million to recognize environmental liabilities for highway maintenance yards and gravel pits, and $7 million for highway maintenance; |
• | $274 million in Treasury Board and Finance, reflecting increases of $264 million in external investment management fees from higher investment income, and $25 million mainly for the Scientific Research and Experimental Development tax credit, partly offset by net decreases of $15 million in corporate income tax interest payments and other programs; |
• | These increases are partially offset by a $141 million decrease in Community and Social Services resulting from federal COVID-19 programs impact on income support caseloads. |
Capital Grants (excluding COVID-19 / Recovery Plan)
Capital grants excluding recovery plan are forecast at $2.5 billion, a net decrease of $106 million from budget, mainly for re-profiling federal funds to future years under the Investing in Canada Infrastructure Plan and Public Transit Infrastructure Fund.
Other Expense (excluding COVID-19 / Recovery Plan)
Amortization, inventory consumption and asset disposal loss expense has decreased by $176 million, mainly due to revised Health amortization.
Debt servicing costs have declined by a net $280 million due mainly to lower borrowing.
COVID-19 / Recovery Plan Expense
In Budget 2021, a $1.75 billion contingency for COVID-19 and Recovery Plan initiatives was created. Total COVID-19 / Recovery Plan expense of $2.8 billion is forecast for 2021-22, comprising $2.2 billion in operating expense, $452 million in capital grants and $133 million in inventory consumption. The budget
6 | 2021-22 Mid-year Fiscal Update and Economic Statement |
forecast included $919 million in operating expense, $196 million in capital grants and $33 million in inventory consumption. The net increase of $1.7 billion is offset by budgeted, unallocated expense of $859 million from the COVID-19 portion of the contingency and $404 million from the Recovery Plan portion, additional federal transfers of $336 million, and $77 million from reductions in other expense. Unallocated contingency expense room of $391 million (COVID-19) and $96 million (Recovery Plan) remain. Over the next two years, $1.2 billion is estimated for COVID-19
/ Recovery Plan expense, $517 million more than estimated in budget.
Changes in COVID-19 / Recovery Plan 2021-22 operating expense comprise:
• | $55 million in Advanced Education for the pharmaceuticals and life sciences sector strategy; |
• | $6 million in Children’s Services for Critical Worker Benefits; |
• | $33 million in Community and Social Services for Critical Worker Benefits, Homeless and Women’s Shelters; |
• | $37 million in Education comprising $45 million for COVID-19 learning disruption offset by $8 million in re-profiled Safe Return to Class funds; |
• | $714 million in Health for contact tracing and lab testing, vaccine deployment, acute and clinical care, staffing and operations, drugs and supplemental health benefits and incremental physician compensation under alternative relationship plans; |
• | $253 million in Jobs, Economy and Innovation: $199 million in Small and Medium Enterprise Relaunch grants, $28 million for vaccine investment and $20 million for the restrictions exception program implementation; |
• | $232 million in Labour and Immigration, comprising $151 million for Alberta Jobs Now and $81 million for Critical Worker Benefits; |
Total Expense
(millions of dollars) | 2020-21 | 2021-22 | Change fr. | 2022-23 | 2023-24 | |||||||||||||||||||
Actual | Budget | Forecast | Budget | Target | Target | |||||||||||||||||||
Operating expense | 46,205 | 48,280 | 48,875 | 595 | 48,545 | 48,586 | ||||||||||||||||||
Capital grants | 1,752 | 2,608 | 2,502 | (106 | ) | 1,943 | 2,267 | |||||||||||||||||
Amortization / loss on disposals | 2,638 | 2,877 | 2,717 | (160 | ) | 2,843 | 2,907 | |||||||||||||||||
Inventory consumption | 1,021 | 1,132 | 1,116 | (16 | ) | 1,150 | 1,162 | |||||||||||||||||
Debt servicing costs | 2,486 | 2,764 | 2,484 | (280 | ) | 2,934 | 3,127 | |||||||||||||||||
Pension provisions | (282 | ) | (369 | ) | (340 | ) | 29 | (255 | ) | (266 | ) | |||||||||||||
Expense (before COVID-19 / Recovery Plan, Contingency, Crude-by-rail) | 53,820 | 57,294 | 57,354 | 60 | 57,160 | 57,783 | ||||||||||||||||||
COVID-19 / Recovery Plan: | ||||||||||||||||||||||||
Operating expense: | ||||||||||||||||||||||||
Advanced Education | 8 | 12 | 67 | 55 | 12 | 5 | ||||||||||||||||||
Agriculture, Forestry and Rural Economic Development | 26 | 3 | 3 | - | - | - | ||||||||||||||||||
Children’s Services | 147 | - | 6 | 6 | - | - | ||||||||||||||||||
Community and Social Services | 82 | - | 33 | 33 | - | - | ||||||||||||||||||
Culture and Status of Women | 39 | 15 | 18 | 3 | - | - | ||||||||||||||||||
Education | 248 | 99 | 136 | 37 | - | - | ||||||||||||||||||
Energy | 130 | 480 | 430 | (50 | ) | 475 | 1 | |||||||||||||||||
Environment and Parks | 336 | 50 | 50 | - | 27 | - | ||||||||||||||||||
Health | 1,093 | - | 714 | 714 | 10 | - | ||||||||||||||||||
Infrastructure | 7 | - | - | - | - | - | ||||||||||||||||||
Jobs, Economy and Innovation | 765 | 122 | 375 | 253 | 123 | 119 | ||||||||||||||||||
Justice and Solicitor General | 5 | - | - | - | - | - | ||||||||||||||||||
Labour and Immigration | 433 | 129 | 361 | 232 | 98 | 2 | ||||||||||||||||||
Municipal Affairs | 621 | - | 21 | 21 | - | - | ||||||||||||||||||
Seniors and Housing | 36 | - | 2 | 2 | - | - | ||||||||||||||||||
Service Alberta | 1 | 9 | 9 | - | 2 | 1 | ||||||||||||||||||
Transportation | 55 | - | - | - | - | - | ||||||||||||||||||
Treasury Board and Finance | 28 | - | 14 | 14 | 6 | 2 | ||||||||||||||||||
Contingency – COVID-19 – unallocated | - | 1,250 | 391 | (859 | ) | - | - | |||||||||||||||||
Contingency – Recovery Plan – unallocated | - | 500 | 96 | (404 | ) | - | - | |||||||||||||||||
COVID-19 / Recovery Plan operating expense | 4,059 | 2,669 | 2,725 | 56 | 753 | 130 | ||||||||||||||||||
Capital grants | 649 | 196 | 452 | 256 | 257 | 68 | ||||||||||||||||||
Inventory consumption (personal protective equipment) | 402 | 33 | 133 | 100 | - | - | ||||||||||||||||||
Total COVID-19 / Recovery Plan | 5,110 | 2,898 | 3,310 | 412 | 1,010 | 198 | ||||||||||||||||||
Crude-by-rail provision | 443 | 976 | 925 | (51 | ) | - | - | |||||||||||||||||
Contingency / disaster and emergency assistance - allocated | 721 | - | 515 | 515 | - | - | ||||||||||||||||||
Contingency / disaster and emergency assistance - unallocated | - | 750 | 1,635 | 885 | 750 | 750 | ||||||||||||||||||
Total Expense | 60,099 | 61,918 | 63,739 | 1,821 | 58,920 | 58,731 |
2021-22 Mid-year Fiscal Update and Economic Statement | 7 |
• | $21 million in Municipal Affairs for COVID-19 care teams and self-isolation benefits; |
• | $14 million in Treasury Board and Finance for public awareness advertising; |
• | These are offset by $50 million in re-profiling of the federal Site Rehabilitation Program in Energy. |
COVID-19 / Recovery Plan capital grants and inventory consumption increases in 2021-22 include $12 million in Agriculture, Forestry and Rural Economic Development for irrigation projects, $244 million in Municipal Affairs and $100 million in Health for personal protective equipment.
Disaster and Emergency Assistance Contingency
The Budget 2021 contingency included $750 million for disasters and emergencies. Mid-year allocations consist of: $128 million for wildfires; $340 million for AgriRecovery support to livestock producers, partially offset by $204 million in federal transfers; $32 million for municipal flood assistance; and $15 million related to 1GX software system implementation. A $1.4 billion provision has been added for crop insurance indemnities due to the severe drought conditions in 2021.
Health COVID-19 Spending
In the early stages of the COVID-19 pandemic, Alberta supported other provinces experiencing high COVID-19 cases by donating ventilators to Ontario, personal protective equipment including procedural masks, N95 masks and gloves, to British Columbia, Ontario and Quebec, while continuing to support Albertans needing critical care.
As Canada entered the second, third and fourth waves of the pandemic, some COVID-19 ICU patients from Manitoba, BC and Saskatchewan were transferred to Alberta, while Alberta received nursing support from Newfoundland and Labrador, and the military. Alberta will be reimbursed for treating the out-of-province patients, and will reimburse Newfoundland and
Labrador for physician fees, meals, accommodation and travel costs for their staff. Since Alberta taxpayers contribute to the armed forces, Alberta will not have to pay for the military nursing staff. To date, Alberta has not sent any COVID-19 patients to other provinces as sufficient bed capacity has been available. To minimize the impact of the fourth wave, 200 surge capacity ICU beds were created, the restrictions exemption program was introduced, and vaccine mandates for Alberta public service were implemented. Third doses of vaccination have also been made available to the elderly and immunocompromised, and rollout is underway for children aged 5-11.
The financial cost of the COVID-19 pandemic to Alberta Health has been $0.7 billion in operating expense and $0.1 billion in inventory consumption so far this fiscal year. This represents 65% of the $1.25 billion COVID-19 portion of the 2021-22 budgeted contingency. In comparison, Alberta Health COVID-19 expense in 2020-21 was $1.1 billion in operating and $0.4 billion in inventory consumption.
In the first half of 2021-22, COVID-19 activities comprised:
• | lab testing and contact tracing, including assessment centres and outbreak response; |
• | vaccine deployment and distribution, including immunizations provided by pharmacies and primary care physicians. It also includes the cost of |
the vaccine incentive programs ($100 debit card and summer lottery); |
• | acute care, including ICU and additional staff for entry screening at Alberta Health Services facilities; |
• | continuing care, including additional temporary facility staff, home care workers and health care aids; |
• | staffing costs, including wage top-ups, overtime and temporary staff; |
• | incremental operating costs, including emergency operations, communications, mental health, public health guidance, health link and central booking system; |
• | environmental and protective services; |
• | drugs and supplemental health benefits, including co-payment modifications to prevent drug shortages, pharmacist assess / screen and test billing code, pharmacy assessments, Alberta Aids to Daily Living respiratory benefits and the critical drug reserve; |
• | incremental physician compensation under an alternative relationship plans; |
• | personal protective equipment such as gloves, masks, shields and gowns. |
Alberta Health Services implemented additional accounting requirements to track its COVID-19 response costs early in the pandemic, including incremental staffing. Given the complexity, estimates are needed when costs cannot be easily disentangled from non-COVID-19 costs.
Health COVID-19 Expense
(millions of dollars)
2021-22 Actuals to (9/30/21) | ||
Operating expense | ||
Lab testing and contact tracing | 207 | |
Vaccine deployment | 146 | |
Continuing care | 140 | |
Staffing and operations | 99 | |
Acute care | 98 | |
Drugs and supplemental health benefits | 13 | |
Incremental physician compensation under alternative relationship plans | 11 | |
Sub-total | 714 | |
Inventory consumption expense | ||
Personal protective equipment | 100 | |
Total | 814 |
8 | 2021-22 Mid-year Fiscal Update and Economic Statement |
Assets and Liabilities
Financial assets of $75 billion are forecast for March 31, 2022, a decrease of $3.1 billion from March 31, 2021.
• | Assets of the Heritage, endowment and other funds are $1 billion higher, from $508 million inflation-proofing of the Heritage Fund (based on Alberta CPI of 3.1%) and retention of fund income less withdrawals. |
• | Assets from self-supporting lending activities (Agriculture Financial Services Corporation - AFSC; local authority lending) are decreasing by $2.5 billion from 2020-21, primarily as cash is withdrawn from AFSC’s crop insurance fund to pay for forecast indemnities, and as a significant local authority loan was repaid. |
• | Government business enterprise (GBE) net equity has increased by $145 million, primarily from improved ATB Financial net income, offset partially by net losses of the Alberta Petroleum Marketing Commission (APMC). GBE equity continues to increase in 2022-23 and 2023-22, as APMC net losses decline. |
• | Other financial assets have decreased a net $1.8 billion from 2020-21. |
Liabilities are forecast at $141.8 billion, $4.1 billion more than they were on March 31, 2021.
• | Taxpayer-supported debt is estimated at $101.6 billion on March 31, 2022, $8.5 billion greater than at year-end 2021. Capital Plan borrowing and P3 liabilities, less principal repayments, have increased $4.8 billion, while Fiscal Plan debt is $3.8 billion more. Taxpayer-supported debt is estimated to grow $5.6 billion in 2022-23, to $107.1 billion, and then decline by $0.5 billion as surplus cash is forecast by 2023-24, permitting repayment, instead of re-financing, of maturing debt. This essentially reflects lower forecast deficits and pre-borrowing. |
• | Debt of AFSC and issued to finance loans to local authorities has decreased $1.3 billion, mainly from a $2 billion local authority loan repayment, partially offset by an increase in debt needed to finance other agricultural and local authority loans. |
• | Government obligations for pension plan liabilities are $340 million lower, mainly from improved valuations for |
the two Teachers’ Pension Plans. Other liabilities have decreased $2.8 billion. |
Net financial debt (financial assets less liabilities) is estimated at $66.8 billion for March 31, 2022, $7.3 billion more than on March 31, 2021, essentially reflecting the increase in taxpayer-supported debt. Net debt to GDP (2021 forecast) ratio is estimated at 19.2%.
Capital, non-financial assets less spent deferred capital contributions, are forecast to increase $1.4 billion to $55.2 billion, mainly displaying the difference between capital asset acquisition (capital investment less a 10% contingency), and depreciation (amortization expense). The annual change in capital and non-financial assets is expected to slow with reduced capital investment and increasing amortization.
Net assets of negative $11.6 billion are forecast for March 31, 2022, a deterioration of $5.8 billion from 2021 reflecting the 2021-22 deficit. Net assets are estimated to decrease to negative $17.2 billion by 2023-24, based on deficits of $3.3 billion and $2.3 billion over the two years.
Balance Sheet Summary a
(millions of dollars) | At March 31 | |||||||||||||||||||
2021 | 2022 | 2023 | 2024 | |||||||||||||||||
Actual | Budget | Forecast | Target | Target | ||||||||||||||||
Financial Assets | ||||||||||||||||||||
Heritage Fund, endowments and other funds | 21,090 | 21,555 | 22,137 | 22,821 | 23,334 | |||||||||||||||
Self-supporting lending organizations / activities | 21,544 | 22,543 | 19,046 | 19,530 | 20,448 | |||||||||||||||
Equity in commercial enterprises | (822 | ) | (1,051 | ) | (677 | ) | (583 | ) | (414 | ) | ||||||||||
Other financial assets | 36,274 | 34,327 | 34,465 | 32,876 | 28,769 | |||||||||||||||
Total Financial Assets | 78,086 | 77,374 | 74,971 | 74,644 | 72,137 | |||||||||||||||
Liabilities | ||||||||||||||||||||
Taxpayer-supported Capital Plan borrowing / liabilities (P3s) | 42,733 | 47,765 | 47,502 | 51,846 | 51,818 | |||||||||||||||
Taxpayer-supported Fiscal Plan borrowing | 50,303 | 62,793 | 54,082 | 55,288 | 54,828 | |||||||||||||||
Total taxpayer-supported debt / liabilities | 93,036 | 110,558 | 101,584 | 107,134 | 106,646 | |||||||||||||||
Self-supporting lending organization / activity debt | 18,389 | 19,069 | 17,104 | 17,254 | 17,886 | |||||||||||||||
Total debt | 111,425 | 129,627 | 118,688 | 124,388 | 124,532 | |||||||||||||||
Pension liabilities | 8,636 | 8,267 | 8,296 | 8,041 | 7,775 | |||||||||||||||
Other liabilities (including SUCH sector, coal phase-out payments) | 17,553 | 18,689 | 14,778 | 13,555 | 13,756 | |||||||||||||||
Total Liabilities | 137,614 | 156,583 | 141,762 | 145,984 | 146,063 | |||||||||||||||
Net Financial Assets / (Debt) | (59,528 | ) | (79,209 | ) | (66,791 | ) | (71,340 | ) | (73,926 | ) | ||||||||||
Capital / Other Non-financial Assets | 57,110 | 58,714 | 58,971 | 60,393 | 60,725 | |||||||||||||||
Spent deferred capital contributions | (3,343 | ) | (3,487 | ) | (3,763 | ) | (3,913 | ) | (3,988 | ) | ||||||||||
Net Assets | (5,761 | ) | (23,982 | ) | (11,583 | ) | (14,860 | ) | (17,189 | ) |
a | 2022 Budget, and 2023 and 2024 Target numbers have been restated to reflect 2020-21 Actual results. |
2021-22 Mid-year Fiscal Update and Economic Statement | 9 |
Capital Plan
Capital Plan spending in 2021-22 is forecast at $8.3 billion, an increase of $139 million from budget, mainly due to strategic recovery plan stimulus projects, higher municipal grants through the Canada Community-Building Fund and accelerated Capital Maintenance and Renewal (CMR). Spending in 2022-23 is forecast to be $856 million more than Budget 2021, while 2023-24 forecast has decreased by $57 million. Alberta continues to support economic stimulus and job growth through the Capital Plan.
The three-year Budget 2021 Capital Plan has increased by $937 million, to $21.6 billion, primarily due to a $244 million increase in Municipal Support for Canada Community-Building Fund, $150 million increase for the Broadband Strategy for rural, remote and indigenous communities, $136 million increase for the Alberta Petrochemical Incentive Program (APIP), $190 million increase for flood prevention related projects, $228 million increase from unspent funds from prior years, offset by decreases of $11 million mainly from project re-profiling.
Most re-profiling and carry forward of unspent funds from prior year result from changes to project progress. Factors impacting project progress include the pace of construction, project scope, land conditions, timing related to tendering, permitting and planning, and rate of project identification, approval and construction under federal programs.
As a key component of the Natural Gas Vision and Strategy, the APIP will turn the province into a top global producer of petrochemicals. APIP will further strengthen Alberta’s position as the leader in petrochemical in the future and offers a direct financial incentive on new or expanded petrochemical manufacturing facilities in Alberta. Thus far, capital grant funding of $408 million over three years, with $136 million starting in 2023-24, has been approved for this program.
Following a comprehensive, competitive procurement process, the Alberta government has awarded the P3 contract to design, build and finance five new high schools in Blackfalds, Langdon, Leduc and two in Edmonton.
The Springbank Reservoir moves into the construction phase. This critical project will protect countless homes in Calgary and southern Alberta from the type of devastation that resulted from the 2013 floods. The construction of the reservoir will begin in early 2022 and is scheduled to be operational by 2024.
Alberta’s Recovery Plan Projects
Irrigation infrastructure is a critical component of Alberta’s Recovery Plan. Building on last fall’s historic $815 million investment, the government of Alberta, the Canada Infrastructure Bank and 10 irrigation districts, are investing another $118 million, for a total of
$933 million to modernize irrigation infrastructure and increase water storage in southern Alberta.
In 2020-21 $475 million was spent on accelerated CMR projects for schools, post-secondary institutions, government facilities, road and bridges, and seniors and housing facilities. $417 million in accelerated CMR is forecast to be spent in 2021-22, with another $45 million to be spent over the following two years.
Another $150 million has been committed by Alberta’s government to expand and improve broadband internet in rural, remote and Indigenous communities. This funding will be used to begin construction on broadband expansion projects as soon as possible.
The Province continues to support municipalities through the recovery plan by providing $152 million for water management infrastructure support and strategic transportation infrastructure support, of which $108 million is forecast in 2021-22.
Additionally, new funding of $10 million was added for the COVID-19 Pandemic Response to support Alberta Health Services through the fourth wave of COVID-19 for equipment including ICU beds, ventilators and mobile wireless monitoring systems in ICU wards.
Capital Plan Summary
(millions of dollars)
2020-21 | 2021-22 | 2022-23 | 2023-24 | 3-year | ||||||||||||||||||||
Actual | Budget | Forecast | Target | Target | Total | |||||||||||||||||||
Municipal support | 2,075 | 2,396 | 2,505 | 1,724 | 1,884 | 6,113 | ||||||||||||||||||
Capital maintenance and renewal | 1,249 | 1,301 | 1,493 | 962 | 899 | 3,354 | ||||||||||||||||||
Protect quality health care | 740 | 796 | 806 | 786 | 450 | 2,042 | ||||||||||||||||||
Roads and bridges | 1,125 | 926 | 803 | 782 | 628 | 2,213 | ||||||||||||||||||
Renewing education infrastructure | 325 | 780 | 624 | 720 | 326 | 1,670 | ||||||||||||||||||
Streamlining service delivery | 215 | 367 | 426 | 455 | 266 | 1,147 | ||||||||||||||||||
Public safety and emergency services | 91 | 201 | 247 | 323 | 252 | 822 | ||||||||||||||||||
Agriculture and natural resources | 165 | 189 | 189 | 147 | 269 | 605 | ||||||||||||||||||
Family, social supports and housing | 142 | 110 | 120 | 70 | 41 | 231 | ||||||||||||||||||
Skills for jobs | 268 | 85 | 86 | 82 | 24 | 192 | ||||||||||||||||||
Sports and recreation | 58 | 125 | 140 | 93 | 37 | 270 | ||||||||||||||||||
SUCH sector self-financed (schools, universities, colleges, health entities) | 444 | 839 | 813 | 755 | 613 | 2,181 | ||||||||||||||||||
Unallocated Recovery Plan | - | - | - | 375 | 375 | 750 | ||||||||||||||||||
Total Capital Plan | 6,896 | 8,114 | 8,253 | 7,274 | 6,064 | 21,591 |
10 | 2021-22 Mid-year Fiscal Update and Economic Statement |
2021-22
Economic Update
2021-22 to 2023-24
2021-22 Mid-year Fiscal Update and Economic Statement | 11 |
Economic Update
Overview
The recovery in the Alberta economy is firmly underway. The Alberta Activity Index, a measure of provincial economic activity, is up 9.4% through September, reflecting the sharp rebound in the first half of the year. High energy prices are boosting drilling activity and oil production, while business output remains solid. Housing activity continues to be robust, while private sector construction spending is picking up. There have been a number of large investment projects announced recently, including Amazon Web Services’ $4.3 billion cloud computing hub in Calgary and Northern Petrochemical Corp.’s $2.5 billion petrochemical facility in Grand Prairie.
The economy continues to feel the effects of COVID-19, but the impacts are fading. With the economy reopening in the summer and consumer confidence at pre-pandemic levels, there were signs of a broader recovery in services, such as restaurant sales and hotel occupancy rates. The Delta-driven fourth wave and tighter public health measures dampened activity in the Fall, particularly in tourism-related services, but the impacts are expected to be far less than in previous waves.
After contracting 7.9% last year, Alberta’s real gross domestic product (GDP) is now forecast to grow 6.1% in 2021. While this is lower than the First Quarter forecast of 6.7%, it continues to far exceed Budget expectations. Rising input costs, supply side bottlenecks and labour shortages in some industries are expected to restrain job gains in the near term. As a result, employment is now forecast to grow 5.1%, slightly lower than in the First Quarter, while the unemployment rate is forecast to average 8.8%.
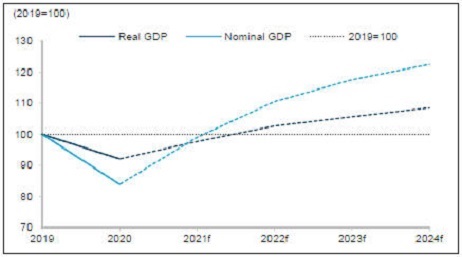
Income gains in the province are expected to outpace real activity. Growth in nominal GDP, a broad measure of income, has been revised up to 18.1% this year compared to 15.7% in the First Quarter. The swift recovery in incomes relative to output (Chart 1) will boost provincial government revenues this year.
Next year, real GDP is forecast to expand 5.1% and return to 2014 levels as the pandemic subsides further and the recovery in the services gathers momentum. Growth in business
investment is expected to accelerate, underpinned by solid oil prices, improving confidence and Alberta’s competitive tax regime. Alberta’s strong fundamentals, including a young working age population, will support real GDP growth of about 2.8% on average in 2023 and 2024.
Energy leads output recovery
The recovery in business output this year is largely being driven by the energy sector. Strong oil prices and demand are boosting oil production, which | reached 3.5 million barrels per day (bpd) in September, up more than 9% year-to-date. Manufacturing shipments of petroleum and petrochemicals have also rebounded strongly. On the non-energy side, food manufacturing shipments were at record highs in September on the back of robust growth in global demand and prices. However, exports of forestry products have come down amid a sharp pullback in lumber prices and moderating residential construction activity. Tight crop inventories, along with drought conditions in the summer, have also weighed on primary agricultural production and exports. |
Chart 1: Incomes recovering faster than real output
Alberta’s nominal and real GDP, indexed to pre-pandemic level
Sources: Statistics Canada, Haver Analytics, Alberta Treasury Board and Finance; f-forecast
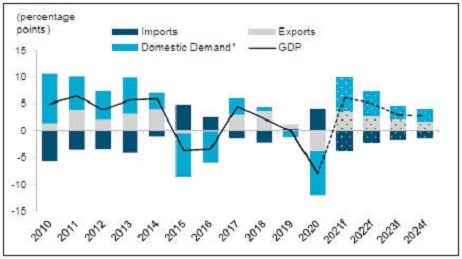
Chart 2: Exports a key driver of growth this year
Contribution to change in Alberta real GDP by expenditure
Sources: Statistics Canada, Haver Analytics, Alberta Treasury Board and Finance; f-forecast
* Includes household, business and government spending
12 | 2021-22 Mid-year Fiscal Update and Economic Statement |
Nonetheless, real exports are forecast to rise 6.7% this year (Chart 2). Oil exports will lead the gains, accounting for more than half of the growth in overall exports this year. With the pick-up in tourism-related services, real exports are forecast to grow 5.2% in 2022 before expanding at an average of 3.6% in 2023 and 2024.
Stronger energy prices
Natural gas prices have strengthened this year. A solid rebound in the global economy and an accelerated transition away from emissions-intensive energy sources like coal have boosted demand for natural gas globally. Moreover, concerns about short-term supply constraints and low storage levels heading into the 2022 heating season have caused price spikes in Europe and Asia. This has led to moderate price gains in North America, with the price surge in Alberta less drastic than in the U.S. While prices are expected to moderate following the winter heating season, strong demand fundamentals will continue to support prices. The Alberta Reference Price (ARP) is expected to average $3.30/GJ in 2021-22, a robust increase from $1.40/GJ in 2019-20, before moderating to an average of $2.90/GJ over the next two fiscal years.
The recovery in oil prices has far exceeded Budget expectations. Global petroleum demand has outstripped supply, underpinned by a solid pickup in the global economy and ongoing output restraint by OPEC+. Oil prices are also getting support from the natural gas crunch in Asia and Europe. The surge in natural gas prices is expected to boost oil demand from jurisdictions that are switching to oil to meet winter fuel needs. This switch will be temporary, and natural gas prices are anticipated to normalize next year. As these transitory factors fade, oil prices are expected to retreat from currently elevated levels. West Texas Intermediate (WTI) is forecast to average US$70.50/bbl in 2021-22, US$5/bbl higher than in the First Quarter.
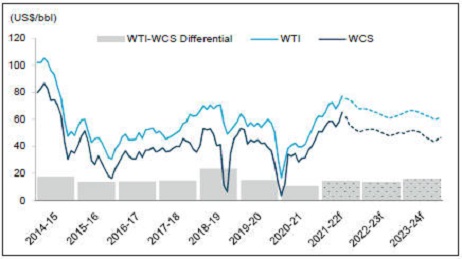
Over the medium term, a gradual rebalancing in the global oil market will lead to moderation in oil prices, with WTI averaging US$64.00/bbl in 2022-23 and US$63.50/bbl in 2023-24 (Chart 3). This is still above Budget expectations, when WTI was expected to
average US$56.50/bbl in 2023-24. The Mid-year oil price forecast is prudent, below the average of private sector forecasters (see page 20).
Light-heavy differential supports netback prices
The differential between WTI and Western Canadian Select (WCS) is expected to remain in line with pipeline transportation costs as export pipeline capacity is anticipated to meet growing oil production. Enbridge’s Line 3 replacement pipeline is now in operation and expected to reach its nameplate capacity in the next few months. Trans Mountain Pipeline Expansion (TMX) will add more export pipeline capacity in early 2023. However, transient periods of volatility are likely. For example, the recent increase in natural gas prices has caused the differential to widen as U.S. refineries cut back on using high sulphur Alberta crudes that require more natural gas for processing. As a result, the differential is expected to remain under pressure for the rest of this fiscal year and average at US$14.40/bbl, an increase from US$13.30/bbl in the First Quarter. Once the impact of temporary factors dissipate, the differential is forecast to narrow to US$13.60/bbl in 2022-23. Over the medium term, rising oil production and higher pipeline throughput will put upward pressure on the differential to US$15.40/bbl by 2023-24.
Despite a wider differential, stronger global oil prices will lift the WCS price to around US$56/bbl in 2021-22 and average at US$49.00/bbl over the next two years, the highest annual averages since oil prices collapsed in 2014. This will be tempered by a higher Canadian dollar, which is now forecast to average 80.1 US¢/Cdn$ in 2021-22 before easing to 79.7 US¢/Cdn$ in 2023-24.
Strong rebound in incomes
Robust energy prices and a pick up in economic activity are boosting incomes in the province. After declining 63% in 2020, corporate incomes are forecast to surge more than 70% this year. At the same time, the recovery in employment, along with hours worked, are expected to bolster primary household income by 6.2% this year. Household disposable incomes are also getting a lift from federal government income support programs, which started to wind down in the Fall. While growth in incomes is expected to moderate next year, it will remain solid, supported by the ongoing economic expansion.
Oil and gas investment recovering
With higher corporate profits, there are growing investment opportunities in Alberta’s oil and gas sector. Stronger cash flows and financial positions among energy producers have allowed
Chart 3: Oil prices to moderate after short-term surge
Oil prices
Sources: Alberta Energy and Alberta Treasury Board and Finance; e-estimate, f-forecast
2021-22 Mid-year Fiscal Update and Economic Statement | 13 |
some operators to exceed their debt reduction targets. Drilling activity is picking up after a slow start to the year, with rig counts exceeding pre-pandemic 2019 levels every month since June. Non-conventional production has also risen 11% year-to-date through September amid a quick rebound in bitumen output. After plunging an estimated 37% in 2020, total oil and gas investment is forecast to grow nearly $4.3 billion (or 26%) this year.
Investment will gain further momentum in 2022, adding another $5.4 billion (or 26%) to reach almost $26 billion and return to 2019 levels. With the ramp up in activity, conventional investment is forecast to lead growth in total oil and gas investment. Meanwhile, rising bitumen production will lift sustaining capital in the oil sands. Although energy producers are likely to maintain capital discipline in expanding production, they are expected to ramp-up financing of ESG-related initiatives in the medium term.
Non-energy investment looking up
With pandemic-related uncertainty gradually dissipating, investment outside oil and gas is anticipated to see a full recovery this year. Investment is getting a boost from Alberta’s competitive tax environment, lower office and industrial rents, and a young and skilled workforce. Commercial building investment has risen steadily since bottoming out earlier in the year on the back of strong growth in trade and services, as well as continued demand for distribution and warehouse spaces due to growing e-commerce and better availability in the industrial space. This is partly offsetting the weakness in the commercial real estate, where office space continue to grapple with high vacancy rates.
Investment in petrochemical manufacturing, transportation, renewable energy and agricultural infrastructure is boosting investment in the industrial sector. Adoption of cleaner and emission-reduction technologies is also helping to grow emerging sectors and diversify the economy.
The expansion in Alberta’s technology sector is also gaining momentum.
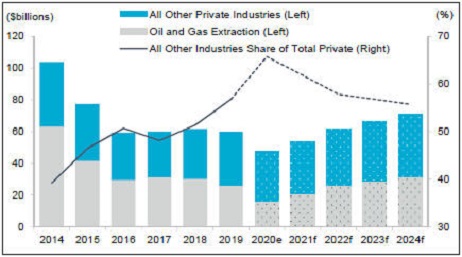
The province has already exceeded last year’s record for venture capital investment this year. Several tech companies have also announced that they are relocating or setting up operations in the province. More recently, Amazon Web Services announced plans to invest $4.3 billion in the next two years to create a cloud computing hub in Calgary. Overall, non-energy investment is forecast to grow 6.6% this year. Growth is expected to accelerate to 7% in 2022 before moderating to an average of 5.6% thereafter. Non-energy investment is expected to exceed investment in oil and gas extraction over the forecast horizon (Chart 4). | Pandemic weighs on services
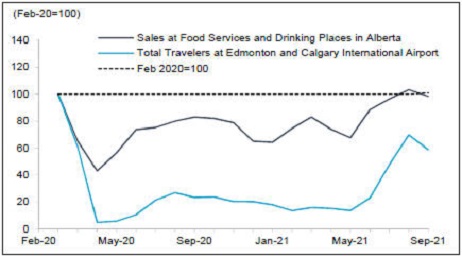
The services sector was gaining momentum in the summer (Chart 5). However, the fourth wave of the pandemic and subsequent tightening of public health measures introduced in the Fall are expected to slow the recovery in services, albeit by a lesser extent that in previous waves. With the province lifting most public health measures in July, restaurant sales bounced back strongly and exceeded pre-pandemic February 2020 level as of August. Hotel occupancy rates and air travel in and out |
Chart 4: Business investment to accelerate over the medium term
Alberta nominal non-residential investment by category
Sources: Statistics Canada and Alberta Treasury Board and Finance; e-estimate, f-forecast
Chart 5: Tourism-related activity ramps up in the summer
Alberta restaurant sales and air travel indexed to Feb 2020 Level
Sources: Statistics Canada, Haver Analytics, and Alberta Jobs, Economy and Innovation
* Total travelers is all air passengers, arrivals and departures.
14 | 2021-22 Mid-year Fiscal Update and Economic Statement |
of the province have also picked up in the summer, although they are still well below 2019 levels, largely reflecting the impact of ongoing federal travel restrictions and pandemic concerns. The recovery is expected to be slower than anticipated, particularly in tourism-related industries such as food and accommodation, entertainment and recreation. However, the impact of COVID-19 on these industries is far less than in previous waves and will continue to fade as businesses and consumers further adapt to the pandemic and public health measures become more targeted. In particular, Alberta’s Restrictions Exemption Program is lending support and enabling participating businesses to operate without most public health restrictions. Next year, activity in these industries is anticipated to pick up strongly as the pandemic abates further and travel restrictions continue easing. The rebound is lifting overall GDP growth in 2022.
Immigration to drive population growth
The impact of the pandemic continues to dampen Alberta’s population growth, although there are signs that this is easing. Immigration into the province is recovering from last year’s pandemic lows as travel restrictions are lifting and application processing is ramping up. In contrast, net interprovincial outflows have picked up, likely reflecting the impact of elevated unemployment in Alberta relative to other provinces.
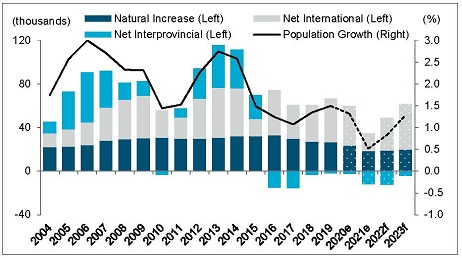
After slowing to a multi-decade low of 0.5% in the 2021 census year, Alberta’s population growth is expected to improve to 0.8% next year (Chart 6). Over the medium term, population growth is anticipated to trend up to pre-pandemic levels, reaching 1.4% by 2024. Immigration will remain a key driver. It is projected to surpass 2019 levels in the 2023 census year, buoyed by increased federal immigration targets as Canada tries to compensate for limited landings throughout the pandemic. Meanwhile, net outflows of interprovincial migrants will moderate as economic activity picks up and the labour market strengthens. Natural increase will continue to underpin growth.
Economic reopening lifts employment
Alberta’s labour market has made significant progress, but the recovery continues to be uneven. With the strong employment gains throughout the summer and into the fall, the province has regained nearly all of the jobs lost during the pandemic, mostly in full-time positions. Services sector employment is now above its pre-COVID level, led by finance, insurance and real estate, as well as wholesale and retail trade. In contrast, contact-intensive and tourism-related industries continue to lag behind. Goods sector employment has also been much slower to recover, despite the strong rebound in business output and residential construction investment this year. In particular, employment in agriculture and some manufacturing industries – such as fabricated metals and machinery equipment – remains subdued.
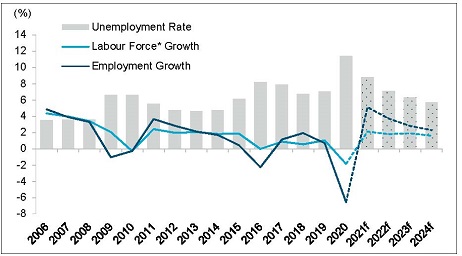
Rising input costs, supply side bottlenecks and labour shortages in some industries have intensified in recent months and are posing challenges for many businesses. These factors are expected to restrain job gains in the near term. Employment is now forecast to grow 5.1% this year (Chart 7), down slightly from the First Quarter. As public health measures ease and pandemic-related challenges dissipate, services sector employment is forecast to gather momentum next year. Goods sector employment is also expected to | benefit from a robust pick-up in business investment. Overall employment is forecast to advance 3.7% in 2022 before growing at a solid clip of 2.6% over the medium term.
Unemployment rate declining
With the employment recovery well underway, the unemployment rate has receded, but remains elevated. It is now forecast to improve to an average of 8.8% this year, down from 11.4% in 2020 and more than a percentage point below Budget expectations. While labour underutilization has improved, considerable slack in the labour market remains. Despite the economic reopening in the summer, labour market participation has been slow to recover in some groups, particularly among youth, older workers and women aged 35-44 years old. Lingering concerns over the virus, government income support programs, and other pandemic-related factors may be holding back some people from returning to the workforce. Moreover, growth in the working-age population remains muted, as ongoing travel restrictions and higher unemployment in the province continue to weigh on migration.
These supply-side constraints, along with mismatches between the skills that job seekers have and what employers are looking for, are contributing to |
Chart 6: Population growth to pick up after near-term slowdown
Annual change in Alberta population by component
Sources: Statistics Canada, Haver Analytics, Alberta Treasury Board and Finance; e-estimate, f-forecast
2021-22 Mid-year Fiscal Update and Economic Statement | 15 |
high job vacancies and shortages in some industries, despite elevated unemployment in the province. It is expected to take some time for the labour market to adjust. With the more broad-based recovery in employment and economic activity, the unemployment rate is forecast to fall to an average of 7.1% next year before declining gradually to reach 5.7% by 2024.
Cost pressures elevated
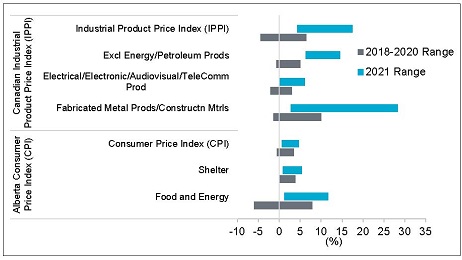
Businesses and consumers are grappling with rising costs and prices. While growth in costs for both residential and non-residential construction have eased, they remain elevated. A sharp pullback in lumber prices has been offset by rising prices for other inputs, such as concrete and fabricated metal products (Chart 8). Persistent supply chain bottlenecks continue to be a major driver, although a sharp increase in energy prices is also putting pressure on costs.
These factors are translating to higher consumer prices. Consumer inflation moved above 4% in the third quarter. Energy prices surged to multi-year peaks in the summer, while pandemic-related disruptions have pushed food prices even higher. Core inflation – excluding food and energy – has also picked up. Robust demand for goods, coupled with ongoing supply chain bottlenecks, are boosting prices for consumer durables such as motor vehicles, household appliances and furniture. Elevated construction costs are also propping up shelter costs. Services inflation continues to lag after stagnating in 2020 and early 2021, but prices are starting to rise, also contributing to consumer inflation.
Headline consumer inflation is now forecast to accelerate to 3.1% this year, the fastest annual pace since 2007. This is 1.7 and 0.2 percentage points higher compared to Budget and First Quarter, respectively. With the rising inflation, the Bank of Canada is expected to begin raising interest rates in mid-2022, sooner than expected in Budget. As supply bottlenecks dissipate in the second half of next year, consumer inflation is forecast to recede gradually to 2.6% in 2022 before returning to 2% by 2024.
Strong recovery in goods spending
Consumer spending has rebounded strongly this year, underpinned by improving consumer confidence and household incomes. While retail sales have moderated from the exceptionally strong gains in the first half of the year, they remain up 15% through October. The summer reopening likely prompted some consumers to shift their spending from goods to services, while supply chain disruptions and higher prices are also weighing on demand for some
consumer goods, such as motor vehicles and other housing-related items. This, coupled with rising consumer prices, is likely to restrain goods spending in the near term. However, the overall rebound in goods spending has lifted imports into the province, which are forecast to rise 8% this year.
With the weaker recovery in services, real consumer spending is now expected to rise 7.7% this year, down from the First Quarter forecast of 8.6%. Next year, real consumer spending is forecast to grow 6.1% and exceed pre-pandemic 2019 levels by 2022, supported by high
Chart 7: Labour market to strengthen as services sector recovers
Labour market indicators
Sources: Statistics Canada, Haver Analytics, Alberta Treasury Board and Finance; f-forecast
* The number of people working or looking for work
Chart 8: Rising input costs put upward pressure on consumer prices
Various price indices, year-over-year growth
Sources: Statistics Canada and Haver Analytics
16 | 2021-22 Mid-year Fiscal Update and Economic Statement |
levels of household savings and pent-up demand for certain goods and services during the pandemic. Growth is forecast to moderate to around 3.3% over the medium term as consumption patterns normalize and interest rates rise.
Housing activity solid but moderating
Housing activity is receding from the torrid pace earlier in the year, but remains strong in the province. Activity is being propped up by record low mortgages rates, robust consumer confidence, and elevated household savings. Home sales in the resale market have pulled back after hitting record highs earlier in the year, while renovation spending has slowed sharply from last year’s elevated levels, Single-detached housing starts have also moderated in recent months, although this has been partly offset by recent strength in the multi-family segment. These are helping to create more balanced conditions in the housing market and cool down growth in home prices. While house prices in Edmonton and Calgary have risen over the past year, they remain among the most affordable in the country, especially when compared to other urban centres, such as Vancouver and Toronto.
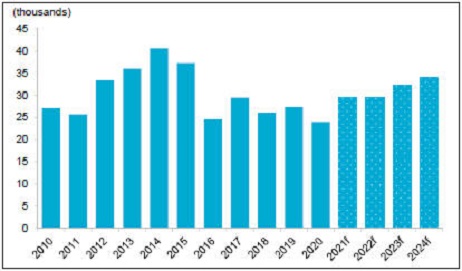
With activity easing in the short-term, housing starts are forecast to average around 29,000 units this year and next year. This comes after years of subdued activity in the province prior to the pandemic (Chart 9). Despite expectations for rising interest rates next year, they will remain very accommodative for homebuyers. Tight inventories, relatively low mortgage rates and strengthening labour market are expected to support activity. Over the medium term, a pick-up in net migration and wage growth should help lift housing starts to around 34,000 units by 2024.
Risks to Outlook
The uncertainty surrounding global oil prices and the long-term effects of the Covid-19 pandemic on households and business investment create a number of risks to the Alberta economy. Oil prices are consistently volatile, and a significantly higher or lower oil price could have a notable impact on the provincial economy and revenues. In the short-term, the B.C. floods have
caused severe disruption to the flows of goods. While transportation companies are looking for alternative routes, the disruptions pose a risk to imports and exports and could put upward pressure on prices over the next few months.
The low scenario assumes a persistent decline in oil prices from the base case forecast beginning in 2022. Given the uneven access to vaccines around the world, a resurgence in COVID-19 cases would result in weaker than anticipated demand. Sufficient OPEC+ production capacity is also assumed to balance the market at lower price levels. The weakness in oil prices leads to significantly less oil and gas investment and oil production, which spills over into the broader economy in both Canada and Alberta. The low scenario also assumes a permanent shift in household preferences resulting from the pandemic, with persistently more spending on goods relative to services, more household savings, and reduced labour supply. The combined effect of these shocks is a weaker Canadian dollar, lower consumption, lower employment, lower investment, and a lower rate of population growth. Alberta collects less corporate and personal tax revenues as a result of a weaker economy. Additionally, lower oil prices reduce Alberta’s natural resource revenues.
The high scenario assumes a sustained higher path for WTI starting at the end of 2021, driven by continued growth in global demand, combined with lower petroleum production, a consequence of global underinvestment in recent years. At the same time, the light-heavy differential is assumed to stay at levels observed earlier in the Fall, prior to the recent widening. These factors would lead to higher energy sector investment and oil production in Alberta. This, in turn, drives increases in Canadian interest rates and the Canadian dollar, but exert a minor drag on Alberta’s corporate profits, business investment, and exports. The strong recovery also bolsters household consumption growth, driven by higher wages and employment, as well as a decline in the unemployment rate relative to the base case. This broad-based economic strength translates into significant increases in corporate and personal tax revenue, and higher energy prices lead to even faster growth in Alberta’s natural resource revenue.
Neither scenario includes additional fiscal policy responses from the federal or provincial governments beyond what is included in the base case that would buffer the downside risks to the economy in the low scenario or temper the upside in the economy in the high scenario.
Chart 9: Housing starts to rise gradually
Alberta housing starts
Sources: Canada Mortgage and Housing Corporation, Haver Analytics, Alberta Treasury Board and Finance; f-forecast
2021-22 Mid-year Fiscal Update and Economic Statement | 17 |
Table 1: Scenario Impacts
Fiscal Year Assumptions | 2021-22 | 2022-23 | 2023-24 | |||||||||||||||||||||
WTI (US$/bbl) | ||||||||||||||||||||||||
Base | 70.50 | 64.00 | 63.50 | |||||||||||||||||||||
High | 74.50 | 78.00 | 79.00 | |||||||||||||||||||||
Low | 66.50 | 55.00 | 56.00 | |||||||||||||||||||||
Light-Heavy Differential (US$/bbl) | ||||||||||||||||||||||||
Base | 14.40 | 13.60 | 15.40 | |||||||||||||||||||||
High | 13.30 | 15.70 | 17.40 | |||||||||||||||||||||
Low | 12.20 | 11.10 | 12.10 | |||||||||||||||||||||
Exchange Rate (US¢/Cdn$) | ||||||||||||||||||||||||
Base | 80.1 | 79.4 | 79.7 | |||||||||||||||||||||
High | 81.2 | 83.7 | 85.2 | |||||||||||||||||||||
Low | 79.3 | 76.2 | 76.1 | |||||||||||||||||||||
Tax and Resource Revenue ($billions)* | ||||||||||||||||||||||||
Base | 29.9 | 29.4 | 30.3 | |||||||||||||||||||||
Variance from base | ||||||||||||||||||||||||
High | 2.4 | 6.6 | 6.9 | |||||||||||||||||||||
Low | -1.3 | -3.1 | -2.9 | |||||||||||||||||||||
Calendar Year Assumptions | 2021 | 2022 | 2023 | 2024 | ||||||||||||||||||||
Real GDP (% Change) | ||||||||||||||||||||||||
Base | 6.1 | 5.1 | 2.9 | 2.7 | ||||||||||||||||||||
High | 6.2 | 6.3 | 3.5 | 3.2 | ||||||||||||||||||||
Low | 5.9 | 3.5 | 2.5 | 2.4 | ||||||||||||||||||||
Nominal GDP (% Change) | ||||||||||||||||||||||||
Base | 18.1 | 11.5 | 6.4 | 4.2 | ||||||||||||||||||||
High | 19.2 | 17.5 | 7.1 | 6.2 | ||||||||||||||||||||
Low | 17.6 | 7.5 | 5.2 | 4.2 | ||||||||||||||||||||
Employment (thousands) | ||||||||||||||||||||||||
Base | 2,238 | 2,321 | 2,386 | 2,441 | ||||||||||||||||||||
High | 2,240 | 2,336 | 2,412 | 2,472 | ||||||||||||||||||||
Low | 2,237 | 2,304 | 2,360 | 2,416 |
* Tax revenue includes personal and corporate income taxes, fuel tax, tobacco/vaping taxes, cannabis tax, insurance premiums tax, the tourism levy and the freehold mineral tax..
18 | 2021-22 Mid-year Fiscal Update and Economic Statement |
Key Energy and Economic Assumptions
2019-20 | 2020-21 | 2021-22 Forecast | 2022-23 | 2023-24 | ||||||||||||||||||||||||
Fiscal Year Assumptionsa | Actuals | Actuals | Budget | Q2 | Forecast | Forecast | ||||||||||||||||||||||
Crude Oil Pricesb | ||||||||||||||||||||||||||||
WTI (US$/bbl) | 54.85 | 42.32 | 46.00 | 70.50 | 64.00 | 63.50 | ||||||||||||||||||||||
Light-Heavy Differential (US$/bbl) | 14.82 | 10.58 | 14.60 | 14.40 | 13.60 | 15.40 | ||||||||||||||||||||||
WCS @ Hardisty (Cdn$/bbl) | 53.14 | 41.42 | 40.70 | 70.10 | 63.50 | 60.40 | ||||||||||||||||||||||
Natural Gas Priceb | ||||||||||||||||||||||||||||
Alberta Reference Price (Cdn$/GJ) | 1.39 | 2.10 | 2.60 | 3.30 | 3.10 | 2.70 | ||||||||||||||||||||||
Production | ||||||||||||||||||||||||||||
Conventional Crude Oil (thousands of barrels/day) | 484 | 398 | 410 | 436 | 440 | 444 | ||||||||||||||||||||||
Raw Bitumen (thousands of barrels/day) | 3,085 | 2,969 | 3,202 | 3,222 | 3,316 | 3,398 | ||||||||||||||||||||||
Natural Gas (billions of cubic feet) | 4,045 | 3,857 | 3,921 | 3,952 | 4,034 | 4,074 | ||||||||||||||||||||||
Interest Ratesb | ||||||||||||||||||||||||||||
3-month Canada Treasury Bills (%) | 1.57 | 0.14 | 0.20 | 0.20 | 0.60 | 1.20 | ||||||||||||||||||||||
10-year Canada Bonds (%) | 1.42 | 0.74 | 1.00 | 1.40 | 1.70 | 2.10 | ||||||||||||||||||||||
Exchange Rate (US¢/Cdn$)b | 75.2 | 75.8 | 77.4 | 80.1 | 79.4 | 79.7 |
2019 | 2020 | 2021 Forecast | 2022 | 2023 | 2024 | |||||||||||||||||||||||
Calendar Year Assumptionsa | Actuals | Actuals | Budget | Q2 | Forecast | Forecast | Forecast | |||||||||||||||||||||
Gross Domestic Product | ||||||||||||||||||||||||||||
Nominal (billions of dollars) | 351.4 | 294.8 | 320.8d | 348.2 | 388.2 | 413.1 | 430.4 | |||||||||||||||||||||
% change | 1.5 | -16.1 | 8.8d | 18.1 | 11.5 | 6.4 | 4.2 | |||||||||||||||||||||
Real (billions of 2012 dollars) | 347.2 | 319.7 | 335.1d | 339.2 | 356.5 | 366.8 | 376.8 | |||||||||||||||||||||
% change | -0.1 | -7.9 | 4.8d | 6.1 | 5.1 | 2.9 | 2.7 | |||||||||||||||||||||
Other Indicators | ||||||||||||||||||||||||||||
Employment (thousands) | 2,279 | 2,130 | 2,219 | 2,238 | 2,321 | 2,386 | 2,441 | |||||||||||||||||||||
% change | 0.7 | -6.6 | 4.2 | 5.1 | 3.7 | 2.8 | 2.3 | |||||||||||||||||||||
Unemployment Rate (%) | 7.0 | 11.4 | 9.9 | 8.8 | 7.1 | 6.3 | 5.7 | |||||||||||||||||||||
Average Weekly Earnings (% change) | 1.4 | 3.2 | 1.1 | 1.1 | 2.2 | 3.3 | 3.6 | |||||||||||||||||||||
Primary Household Income (% change) | 2.4 | -5.6 | 4.6 | 6.2 | 6.1 | 5.7 | 5.4 | |||||||||||||||||||||
Net Corporate Operating Surplus (% change) | 2.6 | -63.4 | 37.3 | 73.6 | 23.2 | 6.1 | 4.0 | |||||||||||||||||||||
Housing Starts (thousands of units) | 27.3 | 24.0 | 26.2 | 29.4 | 29.6 | 32.2 | 34.1 | |||||||||||||||||||||
Alberta Consumer Price Index (% change) | 1.8 | 1.1 | 1.4 | 3.1 | 2.6 | 2.2 | 2.0 | |||||||||||||||||||||
Retail Sales (% change) | -0.8 | -2.7 | 8.2 | 10.2 | 9.6 | 6.4 | 5.4 | |||||||||||||||||||||
Population (thousands) | 4,363 | 4,420 | 4,447 | 4,443c | 4,478 | 4,537 | 4,600 | |||||||||||||||||||||
% change | 1.5 | 1.3 | 0.6 | 0.5c | 0.8 | 1.3 | 1.4 | |||||||||||||||||||||
Net Migration (thousands) | 37.7 | 33.9 | 3.7 | 4.4c | 17.8 | 38.0 | 42.3 |
a | Forecast was finalized on October 26, 2021 |
b | Forecasts have been rounded |
c | Estimate |
d | Budget 2021 forecast was finalized prior to the release of the Provincial Economic Accounts 2019 actuals on November 9, 2020. |
2021-22 Mid-year Fiscal Update and Economic Statement | 19 |
Benchmarking Tables
Oil Price Benchmark
West Texas Intermediate (US$/bbl)
Organization | 2021 | 2022 | 2023 | 2024 | ||||||||||||
National Forecasting Agencies | ||||||||||||||||
Conference Board of Canada (September 16, 2021) | 66.13 | 70.39 | 68.30 | 67.49 | ||||||||||||
Stokes Economics (August 5, 2021) | 67.00 | 70.00 | 66.00 | 62.00 | ||||||||||||
Banks and Investment Dealers | ||||||||||||||||
CIBC World Markets (October 2021) | 67.00 | 65.00 | n/a | n/a | ||||||||||||
Credit Suisse (October 2021) | 66.50 | 66.00 | 59.00 | 59.00 | ||||||||||||
Goldman Sachs (October 2021) | 69.07 | 78.25 | 81.00 | 66.00 | ||||||||||||
National Bank (October 2021) | 69.21 | 78.75 | 70.00 | n/a | ||||||||||||
RBC Capital Markets (October 2021) | 67.94 | 81.00 | 71.00 | n/a | ||||||||||||
Scotiabank (September 9, 2021) | 66.00 | 69.00 | 71.00 | n/a | ||||||||||||
TD Bank (October 14, 2021) | 68.46 | 73.25 | 69.50 | n/a | ||||||||||||
Industry Analysts | ||||||||||||||||
U.S. Energy Information Administration (October 13, 2021) | 68.48 | 68.24 | n/a | n/a | ||||||||||||
GLJ Petroleum Consultants (October 1, 2021) | 67.33 | 72.00 | 69.01 | 67.24 | ||||||||||||
Sproule Associates Limited (September 30, 2021) | 67.62 | 71.00 | 68.00 | 66.00 | ||||||||||||
Confidential Forecasts Provided to the Government of Albertaa | ||||||||||||||||
Average | 67.00 | 68.00 | 64.00 | 61.00 | ||||||||||||
High | 69.21 | 81.00 | 81.00 | 72.41 | ||||||||||||
Low | 65.70 | 60.92 | 49.50 | 44.00 | ||||||||||||
Average of All Private Forecasts | 67.00 | 71.00 | 68.00 | 63.00 | ||||||||||||
Government of Alberta (calendar year) | 67.50 | 66.00 | 64.00 | 62.00 |
Includes forecasts finalized on or before October 19, 2021.
a | The Confidential Forecast provided to the Government of Alberta include forecasts from S&P Global Platts, the Bank of Montreal, IHS Markit, Rystad Energy, and Wood Mackenzie. High/Low forecasts may represent one of the confidential forecasts. Averages and the Government of Alberta forecast have been rounded to the nearest 50 cents. |
20 | 2021-22 Mid-year Fiscal Update and Economic Statement |
Light-Heavy Oil Price Differential Benchmark
WTI-WCS Price Differential ($US/bbl) | 2021 | 2022 | 2023 | 2024 | ||||
High | 13.00 | 15.00 | 15.00 | 13.79 | ||||
Low | 10.77 | 10.30 | 11.65 | 11.05 | ||||
Average of All Private Forecasts | 12.40 | 12.90 | 12.90 | 12.60 | ||||
Government of Alberta (calendar year) | 13.00 | 14.80 | 14.70 | 15.50 | ||||
Number of Private Sector Forecasters | 9 | 9 | 9 | 7 |
Includes forecasts finalized on or before October 19, 2021.
Natural Gas Price Benchmark
Henry Hub (US$/MMBtu)ab | 2021 | 2022 | 2023 | 2024 | ||||
High | 4.17 | 4.70 | 3.69 | 3.25 | ||||
Low | 3.10 | 3.08 | 2.65 | 2.44 | ||||
Average of All Private Forecasts | 3.70 | 3.80 | 3.20 | 2.90 | ||||
Government of Alberta (calendar year) | 3.60 | 3.80 | 3.20 | 2.90 | ||||
Number of Private Sector Forecasters | 16 | 16 | 15 | 12 |
Includes forecasts finalized on or before October 19, 2021.
a | The natural gas price at Henry Hub Louisiana (in US$/MMBtu) is the US benchmark while the AECO natural gas price (in CAD$/GJ) is the Western Canada benchmark. The Alberta Reference Price (used in natural gas royalty calculations) represents the average field price of all Alberta gas sales which normally follows the Western Canada regional benchmark. The average and Government of Alberta forecast are rounded to the nearest 10 cents. |
United States / Canada Exchange Rate Benchmark
(US¢/Cdn$) | 2021 | 2022 | 2023 | 2024 | ||||
High | 81.0 | 82.6 | 82.0 | 82.6 | ||||
Low | 79.8 | 77.5 | 76.0 | 78.0 | ||||
Average of All Private Forecasts | 80.2 | 80.3 | 79.3 | 80.3 | ||||
Government of Alberta (calendar year) | 80.0 | 79.5 | 79.7 | 80.0 | ||||
Number of Private Sector Forecasters | 10 | 10 | 6 | 2 |
Includes forecasts finalized on or before October 19, 2021.
Canadian Long-Term Interest Rate Benchmark
10-Year Government of Canada Bonds (%) | 2021 | 2022 | 2023 | 2024 | ||||
High | 1.82 | 2.09 | 2.40 | 2.62 | ||||
Low | 0.98 | 1.21 | 2.14 | 2.50 | ||||
Average of All Private Forecasts | 1.37 | 1.82 | 2.23 | 2.56 | ||||
Government of Alberta (calendar year) | 1.30 | 1.60 | 2.00 | 2.40 | ||||
Number of Private Sector Forecasters | 10 | 10 | 7 | 2 |
Includes forecasts finalized on or before October 19, 2021.
2021-22 Mid-year Fiscal Update and Economic Statement | 21 |
Alberta Real Gross Domestic Product Benchmark
(% change) | 2021 | 2022 | 2023 | 2024 | ||||
High | 7.9 | 6.1 | 3.8 | 2.8 | ||||
Low | 4.9 | 3.8 | 2.4 | 2.8 | ||||
Average of All Private Forecasts | 6.5 | 4.6 | 3.1 | 2.8 | ||||
Government of Alberta (calendar year) | 6.1 | 5.1 | 2.9 | 2.7 | ||||
Number of Private Sector Forecasters | 9 | 9 | 5 | 1 |
Includes forecasts finalized on or before October 25, 2021.
Alberta Nominal Gross Domestic Product Benchmark
(% change) | 2021 | 2022 | 2023 | 2024 | ||||
High | 22.9 | 9.2 | 6.6 | 3.2 | ||||
Low | 15.3 | 6.0 | 2.8 | 3.2 | ||||
Average of All Private Forecasts | 19.5 | 7.0 | 4.7 | 3.2 | ||||
Government of Alberta (calendar year) | 18.1 | 11.5 | 6.4 | 4.2 | ||||
Number of Private Sector Forecasters | 8 | 8 | 5 | 1 |
Includes forecasts finalized on or before October 25, 2021.
Alberta Employment Benchmark
(% change) | 2021 | 2022 | 2023 | 2024 | ||||
High | 5.6 | 4.2 | 2.5 | 2.2 | ||||
Low | 4.6 | 2.4 | 1.2 | 2.2 | ||||
Average of All Private Forecasts | 5.1 | 3.3 | 1.9 | 2.2 | ||||
Government of Alberta (calendar year) | 5.1 | 3.7 | 2.8 | �� | 2.3 | |||
Number of Private Sector Forecasters | 8 | 8 | 5 | 1 |
Includes forecasts finalized on or before October 25, 2021.
Alberta Unemployment Rate Benchmark
(%) | 2021 | 2022 | 2023 | 2024 | ||||
High | 9.0 | 7.9 | 7.2 | 5.9 | ||||
Low | 8.5 | 6.4 | 6.1 | 5.9 | ||||
Average of All Private Forecasts | 8.8 | 7.2 | 6.8 | 5.9 | ||||
Government of Alberta (calendar year) | 8.8 | 7.1 | 6.3 | 5.7 | ||||
Number of Private Sector Forecasters | 9 | 9 | 5 | 1 |
Includes forecasts finalized on or before October 25, 2021.
Alberta Housing Starts Benchmark
(thousands of units) | 2021 | 2022 | 2023 | 2024 | ||||
High | 32.8 | 31.6 | 30.0 | 29.0 | ||||
Low | 30.0 | 26.0 | 26.5 | 29.0 | ||||
Average of All Private Forecasts | 31.2 | 29.6 | 28.3 | 29.0 | ||||
Government of Alberta (calendar year) | 29.4 | 29.6 | 32.2 | 34.1 | ||||
Number of Private Sector Forecasters | 7 | 7 | 5 | 1 |
Includes forecasts finalized on or before October 25, 2021.
22 | 2021-22 Mid-year Fiscal Update and Economic Statement |
2021-22
Mid-year Tables
2021-22 to 2023-24
2021-22 Mid-year Fiscal Update and Economic Statement | 23 |
Table of Contents
Tables
Consolidated Fiscal Summary | 25 | |||
Statement of Financial Position | 26 | |||
Capital Assets | 26 | |||
Revenue | 27 | |||
Operating Expense | 28 | |||
Inventory Consumption | 28 | |||
Debt Servicing Costs | 29 | |||
Capital Amortization | 29 | |||
Inventory Acquisition | 29 | |||
Contingency / Disaster and Emergency Assistance | 30 | |||
Pension Liabilities | 30 | |||
Borrowing Requirements | 30 | |||
Cash Adjustments | 31 | |||
Borrowing Sources | 31 | |||
Capital Plan | 32 | |||
Capital Grants | 32 | |||
Capital Investment | 33 | |||
Fiscal Plan and Capital Plan Liability Principal Repayments | 33 | |||
Capital Plan Funding Sources | 33 | |||
Historical Fiscal Summary, 2008-09 to 2023-24 | 34 |
24 | 2021-22 Mid-year Fiscal Update and Economic Statement |
Consolidated Fiscal Summary
(millions of dollars)
2020-21 | 2021-22 | Change fr. | 2022-23 | 2023-24 | ||||||||||||||||||||||||
Statement of Operations | Actual | Budget | Forecast | Budget | Target | Target | ||||||||||||||||||||||
1 | Total Revenue | 43,137 | 43,697 | 57,917 | 14,220 | 55,643 | 56,402 | |||||||||||||||||||||
Expense | ||||||||||||||||||||||||||||
2 | Operating expense | 46,205 | 48,280 | 48,875 | 595 | 48,545 | 48,586 | |||||||||||||||||||||
3 | % change from prior year | (5.0 | ) | 2.1 | 5.8 | - | (0.7 | ) | 0.1 | |||||||||||||||||||
4 | Capital grants | 1,752 | 2,608 | 2,502 | (106 | ) | 1,943 | 2,267 | ||||||||||||||||||||
5 | Amortization / inventory consumption / loss on disposals | 3,659 | 4,009 | 3,833 | (176 | ) | 3,993 | 4,069 | ||||||||||||||||||||
6 | Taxpayer-supported debt servicing costs | 2,333 | 2,323 | 2,319 | (4 | ) | 2,682 | 2,850 | ||||||||||||||||||||
7 | Self-supported debt servicing costs | 153 | 441 | 165 | (276 | ) | 252 | 277 | ||||||||||||||||||||
8 | Pension provisions | (282 | ) | (369 | ) | (340 | ) | 29 | (255 | ) | (266 | ) | ||||||||||||||||
9 | Expense (before COVID-19 / Recovery Plan, Contingency, Crude-by-rail) | 53,820 | 57,294 | 57,354 | 60 | 57,160 | 57,783 | |||||||||||||||||||||
10 | COVID-19 / Recovery Plan: | |||||||||||||||||||||||||||
11 | Operating expense | 4,059 | 919 | 2,238 | 1,319 | 753 | 130 | |||||||||||||||||||||
12 | Capital grants | 649 | 196 | 452 | 256 | 257 | 68 | |||||||||||||||||||||
13 | Inventory consumption (PPE) | 402 | 33 | 133 | 100 | - | - | |||||||||||||||||||||
14 | Contingency for COVID-19 – unallocated | - | 1,250 | 391 | (859 | ) | - | - | ||||||||||||||||||||
15 | Contingency for Recovery Plan – unallocated | - | 500 | 96 | (404 | ) | - | - | ||||||||||||||||||||
16 | Contingency / disaster and emergency assistance | 721 | 750 | 2,150 | 1,400 | 750 | 750 | |||||||||||||||||||||
17 | Crude-by-rail provision | 443 | 976 | 925 | (51 | ) | - | - | ||||||||||||||||||||
18 | Total Expense | 60,099 | 61,918 | 63,739 | 1,821 | 58,920 | 58,731 | |||||||||||||||||||||
19 | Surplus / Deficit | (16,962 | ) | (18,221 | ) | (5,822 | ) | 12,399 | (3,277 | ) | (2,329 | ) | ||||||||||||||||
Capital Plan | ||||||||||||||||||||||||||||
20 | Capital grants | 2,401 | 2,804 | 2,954 | 150 | 2,200 | 2,335 | |||||||||||||||||||||
21 | Capital investment | 4,495 | 5,310 | 5,299 | (11 | ) | 5,073 | 3,729 | ||||||||||||||||||||
22 | Total Capital Plan | 6,896 | 8,114 | 8,253 | 139 | 7,274 | 6,064 | |||||||||||||||||||||
Cash Adjustments / Borrowing Requirements | (at March 31) | |||||||||||||||||||||||||||
23 | Cash at start of year | 9,405 | 10,000 | 7,429 | (2,571 | ) | 8,500 | 8,000 | ||||||||||||||||||||
24 | Surplus / (deficit) | (16,962 | ) | (18,221 | ) | (5,822 | ) | 12,399 | (3,277 | ) | (2,329 | ) | ||||||||||||||||
25 | Cash adjustments (for details, see table on page 31) | - | ||||||||||||||||||||||||||
26 | Retained income of funds and agencies | 2,096 | (586 | ) | (118 | ) | 468 | (1,021 | ) | (988 | ) | |||||||||||||||||
27 | Other cash adjustments | (3,008 | ) | 2,263 | 955 | (1,308 | ) | 584 | 984 | |||||||||||||||||||
28 | Capital cash adjustments | 2,548 | 2,554 | 2,277 | (277 | ) | 2,007 | 2,594 | ||||||||||||||||||||
Total cash requirements | (15,325 | ) | (13,990 | ) | (2,708 | ) | 11,282 | (1,707 | ) | 261 | ||||||||||||||||||
29 | Pre-borrowing for cash management purposes | 7,429 | 8,500 | 8,500 | - | 8,000 | 4,000 | |||||||||||||||||||||
30 | Direct borrowing required (without pre-borrowing) | 5,920 | 3,990 | (4,721 | ) | (8,711 | ) | (6,794 | ) | (8,261 | ) | |||||||||||||||||
31 | Cash at end of year | 7,429 | 8,500 | 8,500 | - | 8,000 | 4,000 | |||||||||||||||||||||
Taxpayer-supported Liabilities / Borrowing | (at March 31) | |||||||||||||||||||||||||||
Liabilities for Capital Projects | ||||||||||||||||||||||||||||
32 | Opening balance | 37,188 | 42,733 | 42,733 | - | 47,502 | 51,846 | |||||||||||||||||||||
33 | Alternative financing (P3s – public-private partnerships) | 123 | 46 | 43 | (3 | ) | 81 | 39 | ||||||||||||||||||||
34 | Direct borrowing | 5,475 | 5,045 | 4,785 | (260 | ) | 4,327 | - | ||||||||||||||||||||
35 | Re-financing of existing debt | 3,071 | 1,753 | 1,753 | - | 1,669 | 1,954 | |||||||||||||||||||||
36 | Principal repayments / amortization of debt issue costs | (3,123 | ) | (1,812 | ) | (1,812 | ) | - | (1,733 | ) | (2,021 | ) | ||||||||||||||||
37 | Total Liabilities for Capital Projects | 42,733 | 47,765 | 47,502 | (263 | ) | 51,846 | 51,818 | ||||||||||||||||||||
Borrowing for the Fiscal Plan | ||||||||||||||||||||||||||||
38 | Opening balance | 36,954 | 50,303 | 50,303 | - | 54,082 | 55,288 | |||||||||||||||||||||
39 | Direct borrowing for Fiscal Plan | 13,349 | 12,490 | 3,779 | (8,711 | ) | 1,206 | - | ||||||||||||||||||||
40 | Re-financing of existing debt | - | 1,926 | 1,926 | - | 1,603 | 3,912 | |||||||||||||||||||||
41 | Principal repayments | - | (1,926 | ) | (1,926 | ) | - | (1,603 | ) | (4,372 | ) | |||||||||||||||||
42 | Total Borrowing for the Fiscal Plan / Other | 50,303 | 62,793 | 54,082 | (8,711 | ) | 55,288 | 54,828 | ||||||||||||||||||||
43 | Total Taxpayer-supported Debt - Capital Projects / Fiscal Plan / Other | 93,036 | 110,558 | 101,584 | (8,974 | ) | 107,134 | 106,646 |
2021-22 Mid-year Fiscal Update and Economic Statement | 25 |
Statement of Financial Positiona |
| |||||||||||||||||||||
(millions of dollars) | ||||||||||||||||||||||
At March 31 | ||||||||||||||||||||||
2021 | 2022 | 2023 | 2024 | |||||||||||||||||||
Actual | Budget | Forecast | Target | Target | ||||||||||||||||||
Financial Assets | ||||||||||||||||||||||
Alberta Heritage Savings Trust Fund | 16,389 | 16,668 | 16,897 | 17,269 | 17,614 | |||||||||||||||||
Endowment funds: | ||||||||||||||||||||||
Alberta Heritage Foundation for Medical Research | 1,941 | 2,029 | 2,171 | 2,322 | 2,427 | |||||||||||||||||
Alberta Heritage Science and Engineering Research |
| 1,161 | 1,192 | 1,289 | 1,365 | 1,427 | ||||||||||||||||
Alberta Heritage Scholarship | 1,360 | 1,379 | 1,493 | 1,530 | 1,533 | |||||||||||||||||
Alberta Enterprise Corporation | 239 | 287 | 287 | 335 | 333 | |||||||||||||||||
General Revenue Fund cash pre-borrowing / reserve | 7,429 | 8,500 | 8,500 | 8,000 | 4,000 | |||||||||||||||||
Self-supporting lending organizations / activities: | ||||||||||||||||||||||
Alberta Capital Finance Authority / loans to local authorities | 15,929 | 16,542 | 14,542 | 14,692 | 15,256 | |||||||||||||||||
Agriculture Financial Services Corporation | 5,615 | 6,001 | 4,504 | 4,838 | 5,192 | |||||||||||||||||
Equity in commercial enterprises | (822 | ) | (1,051 | ) | (677 | ) | (583 | ) | (414 | ) | ||||||||||||
Student loans | 3,376 | 3,740 | 3,704 | 4,046 | 4,359 | |||||||||||||||||
Technology Innovation Emissions Reduction Fund | 145 | 219 | 232 | 308 | 386 | |||||||||||||||||
Other financial assets (including SUCH sector / Alberta Innovates Corp.) | 25,324 | 21,868 | 22,029 | 20,522 | 20,024 | |||||||||||||||||
Total Financial Assets | 78,086 | 77,374 | 74,971 | 74,644 | 72,137 | |||||||||||||||||
Liabilities | ||||||||||||||||||||||
Taxpayer-supported debt: | ||||||||||||||||||||||
Direct borrowing for the Capital Plan | 39,646 | 44,715 | 44,455 | 48,807 | 48,832 | |||||||||||||||||
Alternative financing for Capital Plan (public-private partnerships - P3s) | 3,087 | 3,050 | 3,047 | 3,039 | 2,986 | |||||||||||||||||
Debt issued to reduce pre-1992 TPP unfunded liability | 594 | 594 | 594 | 594 | 594 | |||||||||||||||||
Direct borrowing for the Fiscal Plan | 45,709 | 58,199 | 49,488 | 50,694 | 50,234 | |||||||||||||||||
Other debt | 4,000 | 4,000 | 4,000 | 4,000 | 4,000 | |||||||||||||||||
Total taxpayer-supported debt | 93,036 | 110,558 | 101,584 | 107,134 | 106,646 | |||||||||||||||||
Self-supporting lending organization / activities debt: | ||||||||||||||||||||||
Alberta Capital Finance Authority / for local authority loans | 15,929 | 16,542 | 14,542 | 14,692 | 15,256 | |||||||||||||||||
Agriculture Financial Services Corporation | 2,460 | 2,527 | 2,562 | 2,562 | 2,630 | |||||||||||||||||
Total debt | 111,425 | 129,627 | 118,688 | 124,388 | 124,532 | |||||||||||||||||
Coal phase-out liabilities | 843 | 771 | 771 | 698 | 622 | |||||||||||||||||
Pension liabilities | 8,636 | 8,267 | 8,296 | 8,041 | 7,775 | |||||||||||||||||
Other liabilities (including SUCH sector / Alberta Innovates Corp.) | 16,710 | 17,918 | 14,007 | 12,857 | 13,134 | |||||||||||||||||
Total Liabilities | 137,614 | 156,583 | 141,762 | 145,984 | 146,063 | |||||||||||||||||
Net Financial Assets / (Debt) | (59,528 | ) | (79,209 | ) | (66,791 | ) | (71,340 | ) | (73,926 | ) | ||||||||||||
Capital / Other Non-financial Assets | 57,110 | 58,714 | 58,971 | 60,393 | 60,725 | |||||||||||||||||
Spent deferred capital contributions | (3,343 | ) | (3,487 | ) | (3,763 | ) | (3,913 | ) | (3,988 | ) | ||||||||||||
Net Assets | (5,761 | ) | (23,982 | ) | (11,583 | ) | (14,860 | ) | (17,189 | ) | ||||||||||||
Net financial debt / GDP (calendar year, nominal) | -20.2% | -24.7% | -19.2% | -18.4% | -17.9% |
a | 2022 Budget, and 2023 and 2024 Target numbers have been restated to reflect 2020-21 Actual results. |
Capital Assets | ||||||||||||||||||||
(millions of dollars) | At March 31 | |||||||||||||||||||
2021 | 2022 | 2023 | 2024 | |||||||||||||||||
Actual | Budget | Forecast | Target | Target | ||||||||||||||||
Net book value at start of the year | 54,066 | 55,875 | 55,875 | 57,657 | 59,188 | |||||||||||||||
Additions (capital investment) | 4,495 | 5,310 | 5,299 | 5,073 | 3,729 | |||||||||||||||
Contingency | - | (800 | ) | (800 | ) | (700 | ) | (600 | ) | |||||||||||
Amortization | (2,627 | ) | (2,876 | ) | (2,715 | ) | (2,842 | ) | (2,906 | ) | ||||||||||
Net book value of capital asset disposals / adjustments | (59 | ) | - | (2 | ) | - | - | |||||||||||||
Net Book Value at End of Year | 55,875 | 57,509 | 57,657 | 59,188 | 59,411 |
26 | 2021-22 Mid-year Fiscal Update and Economic Statement |
Revenue
(millions of dollars)
2020-21 | 2021-22 | Change fr. | 2022-23 | 2023-24 | ||||||||||||||||||||
Actual | Budget | Forecast | Budget | Target | Target | |||||||||||||||||||
Income Taxes | ||||||||||||||||||||||||
Personal income tax | 11,257 | 11,647 | 13,075 | 1,428 | 13,083 | 13,792 | ||||||||||||||||||
Corporate income tax | 3,037 | 1,891 | 2,916 | 1,025 | 3,308 | 4,110 | ||||||||||||||||||
14,293 | 13,538 | 15,991 | 2,453 | 16,391 | 17,902 | |||||||||||||||||||
Other Taxes | ||||||||||||||||||||||||
Education property tax (includes opted-out boards) | 2,483 | 2,472 | 2,452 | (20 | ) | 2,534 | 2,618 | |||||||||||||||||
Fuel tax | 1,138 | 1,351 | 1,244 | (107 | ) | 1,307 | 1,340 | |||||||||||||||||
Tobacco / vaping taxes | 755 | 752 | 708 | (44 | ) | 710 | 705 | |||||||||||||||||
Insurance taxes | 709 | 718 | 757 | 39 | 814 | 876 | ||||||||||||||||||
Cannabis tax | 113 | 105 | 120 | 15 | 121 | 123 | ||||||||||||||||||
Tourism levy | 33 | 62 | 48 | (14 | ) | 70 | 81 | |||||||||||||||||
Freehold mineral rights tax | 60 | 67 | 92 | 25 | 92 | 83 | ||||||||||||||||||
Carbon tax | (6 | ) | - | - | - | - | - | |||||||||||||||||
5,285 | 5,527 | 5,421 | (106 | ) | 5,648 | 5,826 | ||||||||||||||||||
Non-Renewable Resource Revenue | ||||||||||||||||||||||||
Bitumen royalty | 2,006 | 1,482 | 7,607 | 6,125 | 6,961 | 6,675 | ||||||||||||||||||
Crude oil royalty | 466 | 627 | 1,485 | 858 | 1,390 | 1,334 | ||||||||||||||||||
Natural gas and by-products royalty | 465 | 467 | 1,551 | 1,084 | 1,165 | 875 | ||||||||||||||||||
Bonuses and sales of Crown leases | 24 | 151 | 124 | (27 | ) | 218 | 229 | |||||||||||||||||
Rentals and fees / coal royalty | 130 | 128 | 141 | 13 | 124 | 117 | ||||||||||||||||||
3,091 | 2,856 | 10,908 | 8,052 | 9,859 | 9,231 | |||||||||||||||||||
Transfers from Government of Canada | ||||||||||||||||||||||||
Canada Health Transfer | 4,838 | 4,959 | 5,468 | 509 | 5,212 | 5,621 | ||||||||||||||||||
Canada Social Transfer | 1,744 | 1,792 | 1,797 | 5 | 1,846 | 1,905 | ||||||||||||||||||
Direct transfers to SUCH sector / Alberta Innovates Corporation | 573 | 582 | 584 | 2 | 601 | 593 | ||||||||||||||||||
Infrastructure support | 434 | 1,095 | 1,240 | 145 | 1,148 | 892 | ||||||||||||||||||
Agriculture support programs | 298 | 256 | 464 | 208 | 259 | 260 | ||||||||||||||||||
Labour market agreements | 299 | 437 | 499 | 62 | 314 | 314 | ||||||||||||||||||
Other (incl. 2019-20 fiscal stabil. payment and 2020-21 safe re-start) | 2,346 | 1,060 | 1,314 | 254 | 1,013 | 458 | ||||||||||||||||||
10,532 | 10,181 | 11,367 | 1,186 | 10,393 | 10,043 | |||||||||||||||||||
Investment Income | ||||||||||||||||||||||||
Alberta Heritage Savings Trust Fund | 1,521 | 1,180 | 2,636 | 1,456 | 1,894 | 1,638 | ||||||||||||||||||
Endowment funds | 367 | 304 | 669 | 365 | 435 | 342 | ||||||||||||||||||
Loans to local authorities | - | 149 | 103 | (46 | ) | 176 | 212 | |||||||||||||||||
Agriculture Financial Services Corporation | 166 | 156 | 156 | - | 161 | 166 | ||||||||||||||||||
Other (includes SUCH sector) | 589 | 416 | 431 | 15 | 444 | 464 | ||||||||||||||||||
2,643 | 2,205 | 3,995 | 1,790 | 3,110 | 2,822 | |||||||||||||||||||
Net Income from Government Business Enterprises | ||||||||||||||||||||||||
AGLC – Gaming / lottery | 774 | 1,249 | 1,308 | 59 | 1,416 | 1,472 | ||||||||||||||||||
AGLC – Liquor | 897 | 898 | 874 | (24 | ) | 904 | 913 | |||||||||||||||||
AGLC – Cannabis | (12 | ) | (15 | ) | (16 | ) | (1 | ) | (10 | ) | (5 | ) | ||||||||||||
ATB Financial | 211 | 193 | 420 | 227 | 267 | 286 | ||||||||||||||||||
Balancing Pool | (113 | ) | 107 | 107 | - | 107 | 107 | |||||||||||||||||
Other (CUDGCo / APMC / PSIs) | (1,840 | ) | (555 | ) | (409 | ) | 146 | (315 | ) | (259 | ) | |||||||||||||
(83 | ) | 1,877 | 2,284 | 407 | 2,369 | 2,514 | ||||||||||||||||||
Premiums, Fees and Licences | ||||||||||||||||||||||||
Post-secondary institution tuition fees | 1,323 | 1,475 | 1,475 | - | 1,575 | 1,644 | ||||||||||||||||||
Health / school board fees and charges | 543 | 699 | 625 | (74 | ) | 676 | 715 | |||||||||||||||||
Motor vehicle licences | 533 | 530 | 539 | 9 | 544 | 551 | ||||||||||||||||||
Crop, hail and livestock insurance premiums | 319 | 321 | 321 | - | 334 | 349 | ||||||||||||||||||
Energy industry levies | 210 | 312 | 312 | - | 291 | 291 | ||||||||||||||||||
Other (includes land titles, lands and grazing, health benefit premiums) | 1,093 | 796 | 1,011 | 215 | 883 | 887 | ||||||||||||||||||
4,021 | 4,133 | 4,283 | 150 | 4,303 | 4,437 | |||||||||||||||||||
Other | ||||||||||||||||||||||||
SUCH sector sales, rentals and services | 683 | 894 | 888 | (6 | ) | 985 | 999 | |||||||||||||||||
SUCH sector fundraising, donations, gifts and contributions | 673 | 645 | 644 | (1 | ) | 684 | 705 | |||||||||||||||||
AIMCo investment management charges | 540 | 577 | 784 | 207 | 630 | 645 | ||||||||||||||||||
Fines and penalties | 176 | 262 | 232 | (30 | ) | 280 | 284 | |||||||||||||||||
Refunds of expense | 389 | 196 | 182 | (14 | ) | 182 | 182 | |||||||||||||||||
Technology Innovation and Emissions Reduction Fund | 463 | 353 | 491 | 138 | 385 | 362 | ||||||||||||||||||
Miscellaneous (includes Alberta Innovates Corporation) | 431 | 453 | 448 | (5 | ) | 424 | 450 | |||||||||||||||||
3,355 | 3,380 | 3,669 | 289 | 3,570 | 3,627 | |||||||||||||||||||
Total Revenue | 43,137 | 43,697 | 57,917 | 14,220 | 55,643 | 56,402 |
2021-22 Mid-year Fiscal Update and Economic Statement | 27 |
Operating Expense | 2020-21 | 2021-22 | Change fr. | 2022-23 | 2023-24 | |||||||||||||||||||
(millions of dollars) | Actual | Budget | Forecast | Budget | Target | Target | ||||||||||||||||||
Advanced Education | 5,132 | 5,044 | 5,069 | 25 | 5,085 | 5,118 | ||||||||||||||||||
Agriculture, Forestry and Rural Economic Development | 812 | 839 | 857 | 18 | 851 | 819 | ||||||||||||||||||
Children’s Services | 1,443 | 1,717 | 1,766 | 49 | 1,722 | 1,710 | ||||||||||||||||||
Community and Social Services | 3,691 | 3,886 | 3,745 | (141 | ) | 3,952 | 3,979 | |||||||||||||||||
Culture and Status of Women | 151 | 161 | 157 | (4 | ) | 146 | 147 | |||||||||||||||||
Education | 7,707 | 8,248 | 8,247 | (1 | ) | 8,248 | 8,248 | |||||||||||||||||
Energy | 413 | 483 | 546 | 63 | 547 | 548 | ||||||||||||||||||
Environment and Parks | 479 | 449 | 534 | 85 | 451 | 447 | ||||||||||||||||||
Executive Council | 15 | 18 | 18 | - | 18 | 18 | ||||||||||||||||||
Health | 20,285 | 21,418 | 21,588 | 170 | 21,418 | 21,418 | ||||||||||||||||||
Indigenous Relations | 102 | 180 | 181 | 1 | 186 | 190 | ||||||||||||||||||
Infrastructure | 446 | 425 | 418 | (7 | ) | 404 | 403 | |||||||||||||||||
Jobs, Economy and Innovation | 257 | 308 | 307 | (1 | ) | 324 | 315 | |||||||||||||||||
Justice and Solicitor General | 1,394 | 1,346 | 1,347 | 1 | 1,357 | 1,368 | ||||||||||||||||||
Labour and Immigration | 182 | 200 | 207 | 7 | 183 | 183 | ||||||||||||||||||
Municipal Affairs | 191 | 247 | 258 | 11 | 259 | 259 | ||||||||||||||||||
Seniors and Housing | 611 | 673 | 674 | 1 | 699 | 702 | ||||||||||||||||||
Service Alberta | 484 | 454 | 453 | (1 | ) | 434 | 434 | |||||||||||||||||
Transportation | 424 | 408 | 451 | 43 | 400 | 402 | ||||||||||||||||||
Treasury Board and Finance | 1,879 | 1,649 | 1,923 | 274 | 1,707 | 1,725 | ||||||||||||||||||
Legislative Assembly | 104 | 128 | 128 | - | 155 | 155 | ||||||||||||||||||
Operating Expense before COVID-19 / Recovery Plan | 46,205 | 48,280 | 48,875 | 595 | 48,545 | 48,586 | ||||||||||||||||||
COVID-19 / Recovery Plan operating expense | ||||||||||||||||||||||||
Advanced Education | 8 | 12 | 67 | 55 | 12 | 5 | ||||||||||||||||||
Agriculture, Forestry and Rural Economic Development | 26 | 3 | 3 | - | - | - | ||||||||||||||||||
Children’s Services | 147 | - | 6 | 6 | - | - | ||||||||||||||||||
Community and Social Services | 82 | - | 33 | 33 | - | - | ||||||||||||||||||
Culture and Status of Women | 39 | 15 | 18 | 3 | - | - | ||||||||||||||||||
Education | 248 | 99 | 136 | 37 | - | - | ||||||||||||||||||
Energy | 130 | 480 | 430 | (50 | ) | 475 | 1 | |||||||||||||||||
Environment and Parks | 336 | 50 | 50 | - | 27 | - | ||||||||||||||||||
Health | 1,093 | - | 714 | 714 | 10 | - | ||||||||||||||||||
Infrastructure | 7 | - | - | - | - | - | ||||||||||||||||||
Jobs, Economy and Innovation | 765 | 122 | 375 | 253 | 123 | 119 | ||||||||||||||||||
Justice and Solicitor General | 5 | - | - | - | - | - | ||||||||||||||||||
Labour and Immigration | 433 | 129 | 361 | 232 | 98 | 2 | ||||||||||||||||||
Municipal Affairs | 621 | - | 21 | 21 | - | - | ||||||||||||||||||
Seniors and Housing | 36 | - | 2 | 2 | - | - | ||||||||||||||||||
Service Alberta | 1 | 9 | 9 | - | 2 | 1 | ||||||||||||||||||
Transportation | 55 | - | - | - | - | - | ||||||||||||||||||
Treasury Board and Finance | 28 | - | 14 | 14 | 6 | 2 | ||||||||||||||||||
Contingency – COVID-19 operating expense – unallocated | - | 1,250 | 391 | (859 | ) | - | - | |||||||||||||||||
Contingency – Recovery Plan operating expense – unallocated | - | 500 | 96 | (404 | ) | - | - | |||||||||||||||||
COVID-19 / Recovery Plan operating expense | 4,059 | 2,669 | 2,725 | 56 | 753 | 130 | ||||||||||||||||||
Total Operating Expense | 50,264 | 50,949 | 51,600 | 650 | 49,298 | 48,716 | ||||||||||||||||||
Inventory Consumption | ||||||||||||||||||||||||
(millions of dollars) | 2020-21 | 2021-22 | Change fr. | 2022-23 | 2023-24 | |||||||||||||||||||
Actual | Budget | Forecast | Budget | Target | Target | |||||||||||||||||||
Advanced Education | 129 | 181 | 181 | - | 185 | 185 | ||||||||||||||||||
Agriculture, Forestry and Rural Economic Development | 1 | 1 | 1 | - | 1 | 1 | ||||||||||||||||||
Culture and Status of Women | - | 1 | 1 | - | 1 | 1 | ||||||||||||||||||
Health | 1,193 | 890 | 974 | 84 | 905 | 917 | ||||||||||||||||||
Infrastructure | 3 | 3 | 3 | - | 3 | 3 | ||||||||||||||||||
Municipal Affairs | 42 | 33 | 33 | - | - | - | ||||||||||||||||||
Service Alberta | 4 | 6 | 6 | - | 6 | 6 | ||||||||||||||||||
Transportation | 51 | 50 | 50 | - | 50 | 50 | ||||||||||||||||||
Total Inventory Consumption | 1,423 | 1,165 | 1,249 | 84 | 1,150 | 1,162 |
28 | 2021-22 Mid-year Fiscal Update and Economic Statement |
Debt Servicing Costs
(millions of dollars)
2020-21 | 2021-22 | Change fr. | 2022-23 | 2023-24 | ||||||||||||||||||||
Actual | Budget | Forecast | Budget | Target | Target | |||||||||||||||||||
Taxpayer-supported general debt servicing costs | ||||||||||||||||||||||||
Education – school boards | 9 | 9 | 9 | - | 9 | 9 | ||||||||||||||||||
Treasury Board and Finance – direct borrowing | 1,241 | 1,117 | 1,154 | 37 | 1,375 | 1,438 | ||||||||||||||||||
Total | 1,250 | 1,126 | 1,163 | 37 | 1,384 | 1,447 | ||||||||||||||||||
Taxpayer-supported Capital Plan debt servicing costs | ||||||||||||||||||||||||
Education – Alberta Schools Alternative Procurement P3s | 27 | 26 | 26 | - | 26 | 25 | ||||||||||||||||||
Transportation – ring road P3s | 95 | 103 | 103 | - | 103 | 101 | ||||||||||||||||||
Treasury Board and Finance – direct borrowing | 961 | 1,068 | 1,027 | (41 | ) | 1,169 | 1,277 | |||||||||||||||||
Total | 1,083 | 1,197 | 1,156 | (41 | ) | 1,298 | 1,403 | |||||||||||||||||
Total taxpayer-supported debt servicing costs | 2,333 | 2,323 | 2,319 | (4 | ) | 2,682 | 2,850 | |||||||||||||||||
Self-supported debt servicing costs | ||||||||||||||||||||||||
Treasury Board and Finance – loans to local authorities | 85 | 374 | 95 | (279 | ) | 182 | 208 | |||||||||||||||||
Treasury Board and Finance – Ag. Financial Services Corp. | 68 | 67 | 70 | 3 | 70 | 69 | ||||||||||||||||||
Total self-supported debt servicing costs | 153 | 441 | 165 | (276 | ) | 252 | 277 | |||||||||||||||||
Total Debt Servicing Costs | 2,486 | 2,764 | 2,484 | (280 | ) | 2,934 | 3,127 | |||||||||||||||||
Capital Amortization | ||||||||||||||||||||||||
(millions of dollars) | 2020-21 | 2021-22 | Change fr. | 2022-23 | 2023-24 | |||||||||||||||||||
Actual | Budget | Forecast | Budget | Target | Target | |||||||||||||||||||
Advanced Education | 560 | 570 | 570 | - | 567 | 567 | ||||||||||||||||||
Agriculture, Forestry and Rural Economic Development | 26 | 23 | 23 | - | 23 | 23 | ||||||||||||||||||
Community and Social Services | - | - | - | - | - | |||||||||||||||||||
Culture and Status of Women | 8 | 8 | 8 | - | 8 | 8 | ||||||||||||||||||
Education | 435 | 458 | 458 | - | 470 | 470 | ||||||||||||||||||
Energy | 17 | 19 | 19 | - | 20 | 20 | ||||||||||||||||||
Environment and Parks | 51 | 93 | 93 | - | 99 | 102 | ||||||||||||||||||
Health | 572 | 645 | 485 | (160 | ) | 512 | 520 | |||||||||||||||||
Infrastructure | 120 | 143 | 143 | - | 151 | 159 | ||||||||||||||||||
Jobs, Economy and Innovation | 7 | 8 | 8 | - | 8 | 8 | ||||||||||||||||||
Justice and Solicitor General | 3 | 6 | 6 | - | 6 | 6 | ||||||||||||||||||
Labour and Immigration | 9 | 1 | 2 | 1 | 1 | 1 | ||||||||||||||||||
Municipal Affairs | 27 | 30 | 30 | - | 31 | 31 | ||||||||||||||||||
Seniors and Housing | 44 | 44 | 44 | - | 46 | 46 | ||||||||||||||||||
Service Alberta | 77 | 89 | 89 | - | 88 | 88 | ||||||||||||||||||
Transportation | 644 | 710 | 710 | - | 780 | 823 | ||||||||||||||||||
Treasury Board and Finance | 25 | 26 | 26 | - | 28 | 30 | ||||||||||||||||||
Legislative Assembly | 2 | 2 | 2 | - | 4 | 4 | ||||||||||||||||||
Total Amortization Expense | 2,627 | 2,876 | 2,715 | (161 | ) | 2,842 | 2,906 | |||||||||||||||||
Inventory Acquisition | ||||||||||||||||||||||||
(millions of dollars) | 2020-21 | 2021-22 | Change fr. | 2022-23 | 2023-24 | |||||||||||||||||||
Actual | Budget | Forecast | Budget | Target | Target | |||||||||||||||||||
Advanced Education | 78 | 181 | 181 | - | 181 | 181 | ||||||||||||||||||
Agriculture, Forestry and Rural Economic Development | 2 | 1 | 1 | - | 1 | 1 | ||||||||||||||||||
Culture and Status of Women | - | 1 | 1 | - | 1 | 1 | ||||||||||||||||||
Health | 1,560 | 893 | 1,066 | 173 | 908 | 920 | ||||||||||||||||||
Infrastructure | 3 | 3 | 3 | - | 3 | 3 | ||||||||||||||||||
Municipal Affairs | 48 | - | 20 | 20 | - | - | ||||||||||||||||||
Service Alberta | 4 | 6 | 6 | - | 6 | 6 | ||||||||||||||||||
Transportation | 53 | 50 | 50 | - | 50 | 50 | ||||||||||||||||||
Total Inventory Acquisition | 1,748 | 1,135 | 1,328 | 193 | 1,150 | 1,162 |
2021-22 Mid-year Fiscal Update and Economic Statement | 29 |
Contingency / Disaster and Emergency Assistance | ||||||||||||||||||||||
(millions of dollars) | ||||||||||||||||||||||
2020-21 | 2021-22 | Change fr. | 2022-23 | 2023-24 | ||||||||||||||||||
Actual | Budget | Forecast | Budget | Target | Target | |||||||||||||||||
Disaster and emergency assistance contingency | ||||||||||||||||||||||
Agriculture, Forestry and Rural Economic Development – wildfires | 76 | - | 128 | 128 | - | - | ||||||||||||||||
Agriculture, Forestry and Rural Economic Development – agriculture support | 479 | - | 340 | 340 | - | - | ||||||||||||||||
Municipal Affairs – floods | 166 | - | 32 | 32 | - | - | ||||||||||||||||
Service Alberta - 1GX cloud costs | - | - | 15 | 15 | - | - | ||||||||||||||||
Provision for agriculture drought support | - | - | 1,400 | 1,400 | - | - | ||||||||||||||||
Treasury Board and Finance – unallocated | - | 750 | 235 | (515 | ) | 750 | 750 | |||||||||||||||
Total disaster and emergency assistance contingency expense | 721 | 750 | 2,150 | 1,400 | 750 | 750 | ||||||||||||||||
COVID-19 contingency | ||||||||||||||||||||||
Operating expense – allocated | - | - | 775 | 775 | - | - | ||||||||||||||||
Inventory consumption | - | - | 84 | 84 | - | - | ||||||||||||||||
Treasury Board and Finance – unallocated | - | 1,250 | 391 | (859 | ) | - | - | |||||||||||||||
Total COVID-19 contingency expense | - | 1,250 | 1,250 | - | - | - | ||||||||||||||||
Recovery Plan contingency | ||||||||||||||||||||||
Operating expense / capital grants – allocated | - | - | 404 | 404 | - | - | ||||||||||||||||
Treasury Board and Finance – unallocated | - | 500 | 96 | (404 | ) | - | - | |||||||||||||||
Total Recovery Plan contingency expense | - | 500 | 500 | - | - | - | ||||||||||||||||
Total Contingency / Disaster and Emergency Assistance Expense | 721 | 2,500 | 3,900 | 1,400 | 750 | 750 |
Pension Liabilities a
(millions of dollars)
At March 31 | ||||||||||||||
| 2021 Actual |
| | 2022 Estimate |
| | 2023 Target |
| 2024 Target | |||||
Teachers’ Pension Plan (pre-1992) | 7,398 | 7,205 | 6,976 | 6,733 | ||||||||||
Teachers’ Pension Plan (post-1992) | 95 | - | - | - | ||||||||||
Public Service Management Pension Plan (pre-1992; closed) b | 423 | 387 | 352 | 315 | ||||||||||
Universities Academic Pension Plan (pre-1992) | 249 | 273 | 273 | 273 | ||||||||||
Special Forces Pension Plan (pre-1992) | 66 | 28 | 23 | 21 | ||||||||||
Members of the Legislative Assembly Pension Plan (closed) b | 36 | 34 | 32 | 29 | ||||||||||
Public Service Supplementary Retirement Plan | 60 | 96 | 107 | 121 | ||||||||||
Provincial Judges and Masters in Chambers Pension Plan | 41 | 8 | 18 | 30 | ||||||||||
SUCH sector – Universities Academic / Supp. Exec. Retirement Plans | 268 | 265 | 260 | 253 | ||||||||||
Total Pension Liabilities | 8,636 | 8,296 | 8,041 | 7,775 | ||||||||||
Annual non-cash change in pension liabilities | (282 | ) | (340 | ) | (255 | ) | (266) |
a | Numbers for 2022, 2023 and 2024 have been restated to reflect 2020-21 Actual results. |
b | Membership closed and pensionable service no longer being accrued. |
Borrowing Requirements
(millions of dollars)
2020-21 | 2021-22 | Change fr. | 2022-23 | 2023-24 | ||||||||||||||||||
Actual | Budget | Forecast | Budget | Target | Target | |||||||||||||||||
Government | 25,204 | 22,935 | 12,298 | (10,637 | ) | 11,298 | 6,309 | |||||||||||||||
Provincial corporations | 34 | 248 | 248 | - | 204 | 394 | ||||||||||||||||
Government business enterprises | 139 | 863 | 404 | (459 | ) | 923 | 934 | |||||||||||||||
Total borrowing requirements | 25,377 | 24,046 | 12,950 | (11,096 | ) | 12,425 | 7,637 |
30 | 2021-22 Mid-year Fiscal Update and Economic Statement |
Cash Adjustments a
(millions of dollars) | 2020-21 | 2021-22 | Change fr. | 2022-23 | 2023-24 | |||||||||||||||||||
Actual | Budget | Forecast | Budget | Target | Target | |||||||||||||||||||
Retained Income of Funds and Agencies | ||||||||||||||||||||||||
Alberta Heritage Savings Trust Fund inflation-proofing | (146 | ) | (279 | ) | (508 | ) | (229 | ) | (372 | ) | (345 | ) | ||||||||||||
ATB Financial | (211 | ) | (193 | ) | (420 | ) | (227 | ) | (267 | ) | (286 | ) | ||||||||||||
Agriculture Financial Services Corporation | (34 | ) | (326 | ) | 1,075 | 1,401 | (221 | ) | (240 | ) | ||||||||||||||
Heritage Foundation for Medical Research Endowment Fund | (92 | ) | (88 | ) | (230 | ) | (142 | ) | (151 | ) | (105 | ) | ||||||||||||
Heritage Science and Engineering Research Endowment Fund | (50 | ) | (31 | ) | (128 | ) | (97 | ) | (76 | ) | (62 | ) | ||||||||||||
Heritage Scholarship Fund | (51 | ) | (19 | ) | (133 | ) | (114 | ) | (37 | ) | (3 | ) | ||||||||||||
Alberta Social Housing Corporation | 111 | 35 | 45 | 10 | 21 | 28 | ||||||||||||||||||
Alberta Capital Finance Authority | 270 | - | - | - | - | - | ||||||||||||||||||
Credit Union Deposit Guarantee Corporation | (20 | ) | (16 | ) | (12 | ) | 4 | (15 | ) | (16 | ) | |||||||||||||
Alberta Petroleum Marketing Commission | 1,854 | 570 | 421 | (149 | ) | 330 | 275 | |||||||||||||||||
Technology Innovation and Emissions Reduction Fund | 418 | (74 | ) | (87 | ) | (13 | ) | (76 | ) | (78 | ) | |||||||||||||
Balancing Pool | 113 | (107 | ) | (107 | ) | - | (107 | ) | (107 | ) | ||||||||||||||
Other | (65 | ) | (58 | ) | (34 | ) | 24 | (50 | ) | (49 | ) | |||||||||||||
Total Retained Income of Funds and Agencies | 2,096 | (586 | ) | (118 | ) | 468 | (1,021 | ) | (988 | ) | ||||||||||||||
Other Cash Adjustments | ||||||||||||||||||||||||
SUCH sector own-source revenue | (4,404 | ) | (4,872 | ) | (4,789 | ) | 83 | (5,098 | ) | (5,245 | ) | |||||||||||||
SUCH sector own-source expense | 4,526 | 8,074 | 6,102 | (1,972 | ) | 6,146 | 6,253 | |||||||||||||||||
Net deferred capital contribution cash adjustment | 96 | 84 | 363 | 279 | 125 | 29 | ||||||||||||||||||
Energy royalties (difference between accrued revenue & cash) | (1,286 | ) | (319 | ) | 5 | 324 | 322 | 229 | ||||||||||||||||
Student loans | (184 | ) | (364 | ) | (328 | ) | 36 | (342 | ) | (313 | ) | |||||||||||||
Other cash adjustments | (1,441 | ) | 26 | (40 | ) | (66 | ) | (249 | ) | (130 | ) | |||||||||||||
2013 Alberta flood assistance revenue / expense | (23 | ) | (11 | ) | (10 | ) | 1 | (12 | ) | 365 | ||||||||||||||
Wood Buffalo wildfire revenue / expense | (3 | ) | (14 | ) | (16 | ) | (2 | ) | (51 | ) | 63 | |||||||||||||
Pension provisions (non-cash expense) | (282 | ) | (369 | ) | (340 | ) | 29 | (255 | ) | (266 | ) | |||||||||||||
Inventory acquisition | (133 | ) | (132 | ) | (152 | ) | (20 | ) | (128 | ) | (128 | ) | ||||||||||||
Inventory consumption (non-cash expense) | 126 | 160 | 160 | - | 126 | 126 | ||||||||||||||||||
Total Other Cash Adjustments | (3,008 | ) | 2,263 | 955 | (1,308 | ) | 584 | 984 | ||||||||||||||||
Capital cash adjustments | ||||||||||||||||||||||||
Capital investment (excluding SUCH sector self-financed) | (4,051 | ) | (4,470 | ) | (4,486 | ) | (16 | ) | (4,318 | ) | (3,116 | ) | ||||||||||||
Capital Plan contingency | - | 800 | 800 | - | 700 | 600 | ||||||||||||||||||
Current principal repayments (P3s – public-private partnerships) | (74 | ) | (83 | ) | (83 | ) | - | (89 | ) | (92 | ) | |||||||||||||
Direct borrowing for Capital Plan | 5,475 | 5,045 | 4,785 | (260 | ) | 4,327 | 3,801 | |||||||||||||||||
Alternative financing (P3s – public-private partnerships) | 123 | 46 | 43 | (3 | ) | 81 | 39 | |||||||||||||||||
Amortization (excluding SUCH sector - non-cash expense) | 1,072 | 1,216 | 1,216 | - | 1,306 | 1,362 | ||||||||||||||||||
Book value of asset disposals (net non-cash expense / revenue) | 3 | - | 2 | 2 | - | - | ||||||||||||||||||
Total Capital Cash Adjustments | 2,548 | 2,554 | 2,277 | (277 | ) | 2,007 | 2,594 |
a | Negative cash adjustments are a cash requirement; positive cash adjustments are a cash source. |
Borrowing Sources
(millions of dollars)
2020-21 | 2021-22 | Change fr. | 2022-23 | 2023-24 | ||||||||||||||||||||
Actual | Budget | Forecast | Budget | Target | Target | |||||||||||||||||||
Money market (net change) | (1,155 | ) | 1,511 | 1,079 | (432 | ) | 1,377 | 1,528 | ||||||||||||||||
Public-private partnerships (P3s) | 123 | 46 | 43 | (3 | ) | 81 | 39 | |||||||||||||||||
Term debt | 26,409 | 22,489 | 11,828 | (10,661 | ) | 10,967 | 6,070 | |||||||||||||||||
Total borrowing sources | 25,377 | 24,046 | 12,950 | (11,096 | ) | 12,425 | 7,637 |
2021-22 Mid-year Fiscal Update and Economic Statement | 31 |
Capital Plan a | ||||||||||||||||||||||||
(millions of dollars) | 2020-21 | 2021-22 | Change fr. | 2022-23 | 2023-24 | |||||||||||||||||||
Actual | Budget | Forecast | Budget | Target | Target | |||||||||||||||||||
Advanced Education | 484 | 653 | 654 | 1 | 576 | 387 | ||||||||||||||||||
Agriculture, Forestry and Rural Economic Development | 40 | 104 | 114 | 10 | 68 | 69 | ||||||||||||||||||
Children’s Services | - | - | 1 | 1 | - | - | ||||||||||||||||||
Community and Social Services | - | 1 | 1 | - | 1 | 1 | ||||||||||||||||||
Culture and Status of Women | 40 | 47 | 64 | 17 | 37 | 28 | ||||||||||||||||||
Education | 782 | 1,008 | 877 | (131 | ) | 875 | 476 | |||||||||||||||||
Energy | 140 | 75 | 64 | (11 | ) | 69 | 205 | |||||||||||||||||
Environment and Parks | 130 | 176 | 183 | 7 | 91 | 66 | ||||||||||||||||||
Health | 1,111 | 1,266 | 1,326 | 60 | 1,160 | 817 | ||||||||||||||||||
Indigenous Relations | 9 | 37 | 32 | (5 | ) | 12 | 7 | |||||||||||||||||
Infrastructure | 164 | 468 | 530 | 62 | 328 | 257 | ||||||||||||||||||
Jobs, Economy and Innovation | 6 | 13 | 13 | - | 12 | 10 | ||||||||||||||||||
Justice and Solicitor General | 18 | 18 | 22 | 4 | 18 | 14 | ||||||||||||||||||
Labour and Immigration | - | 1 | 1 | - | 1 | 1 | ||||||||||||||||||
Municipal Affairs | 1,730 | 1,501 | 1,739 | 238 | 781 | 772 | ||||||||||||||||||
Seniors and Housing | 187 | 141 | 161 | 20 | 75 | 33 | ||||||||||||||||||
Service Alberta | 61 | 97 | 118 | 21 | 242 | 93 | ||||||||||||||||||
Transportation | 1,979 | 2,486 | 2,331 | (155 | ) | 2,532 | 2,432 | |||||||||||||||||
Treasury Board and Finance | 15 | 19 | 18 | (1 | ) | 19 | 19 | |||||||||||||||||
Legislative Assembly | - | 3 | 3 | - | 3 | 2 | ||||||||||||||||||
Unallocated | - | - | - | - | 375 | 375 | ||||||||||||||||||
Total Capital Plan | 6,896 | 8,114 | 8,253 | 139 | 7,274 | 6,064 |
a | The Capital Plan comprises capital grants included in expense plus capital investment in government-owned assets not included in expense. Capital investment adds to government capital assets, and those assets are depreciated over time through amortization expense included in total expense. |
Capital Grants | ||||||||||||||||||||||||
(millions of dollars) | 2020-21 | 2021-22 | Change fr. | 2022-23 | 2023-24 | |||||||||||||||||||
Actual | Budget | Forecast | Budget | Target | Target | |||||||||||||||||||
Agriculture, Forestry and Rural Economic Development | 23 | 83 | 95 | 12 | 49 | 49 | ||||||||||||||||||
Culture and Status of Women | 39 | 45 | 62 | 17 | 35 | 26 | ||||||||||||||||||
Education | 6 | 11 | 11 | - | 8 | 2 | ||||||||||||||||||
Energy | 126 | 58 | 45 | (13 | ) | 58 | 194 | |||||||||||||||||
Environment and Parks | 78 | 56 | 58 | 2 | 30 | 21 | ||||||||||||||||||
Health | 15 | 50 | 51 | 1 | 51 | 53 | ||||||||||||||||||
Indigenous Relations | 9 | 37 | 32 | (5 | ) | 12 | 7 | |||||||||||||||||
Infrastructure | 18 | 20 | 25 | 5 | 4 | 8 | ||||||||||||||||||
Jobs, Economy and Innovation | - | - | - | - | - | - | ||||||||||||||||||
Municipal Affairs | 1,726 | 1,491 | 1,723 | 232 | 778 | 769 | ||||||||||||||||||
Seniors and Housing | 43 | 51 | 68 | 17 | 38 | 10 | ||||||||||||||||||
Service Alberta | - | - | - | - | 150 | - | ||||||||||||||||||
Transportation | 318 | 901 | 781 | (120 | ) | 986 | 1,195 | |||||||||||||||||
Total Capital Grants | 2,401 | 2,804 | 2,954 | 150 | 2,200 | 2,335 |
32 | 2021-22 Mid-year Fiscal Update and Economic Statement |
Capital Investment
(millions of dollars) | 2020-21 | 2021-22 | Change fr. | 2022-23 | 2023-24 | |||||||||||||||||||
Actual | Budget | Forecast | Budget | Target | Target | |||||||||||||||||||
Advanced Education | 484 | 653 | 654 | 1 | 576 | 387 | ||||||||||||||||||
Agriculture, Forestry and Rural Economic Development | 17 | 21 | 19 | (2 | ) | 19 | 20 | |||||||||||||||||
Children’s Services | - | - | 1 | 1 | - | - | ||||||||||||||||||
Community and Social Services | - | 1 | 1 | - | 1 | 1 | ||||||||||||||||||
Culture and Status of Women | - | 2 | 2 | - | 2 | 2 | ||||||||||||||||||
Education | 776 | 997 | 866 | (131 | ) | 867 | 474 | |||||||||||||||||
Energy | 14 | 17 | 19 | 2 | 11 | 11 | ||||||||||||||||||
Environment and Parks | 52 | 120 | 125 | 5 | 60 | 44 | ||||||||||||||||||
Health | 1,095 | 1,216 | 1,275 | 59 | 1,109 | 764 | ||||||||||||||||||
Infrastructure | 146 | 448 | 505 | 57 | 324 | 249 | ||||||||||||||||||
Jobs, Economy and Innovation | 6 | 13 | 13 | - | 12 | 10 | ||||||||||||||||||
Justice and Solicitor General | 18 | 18 | 22 | 4 | 18 | 14 | ||||||||||||||||||
Labour and Immigration | - | 1 | 1 | - | 1 | 1 | ||||||||||||||||||
Municipal Affairs | 4 | 10 | 16 | 6 | 3 | 3 | ||||||||||||||||||
Seniors and Housing | 143 | 90 | 93 | 3 | 37 | 23 | ||||||||||||||||||
Service Alberta | 61 | 97 | 118 | 21 | 92 | 93 | ||||||||||||||||||
Transportation | 1,661 | 1,585 | 1,550 | (35 | ) | 1,546 | 1,237 | |||||||||||||||||
Treasury Board and Finance | 15 | 19 | 18 | (1 | ) | 19 | 19 | |||||||||||||||||
Legislative Assembly | - | 3 | 3 | - | 3 | 2 | ||||||||||||||||||
Unallocated | - | - | - | - | 375 | 375 | ||||||||||||||||||
Total Capital Investment | 4,495 | 5,310 | 5,299 | (11 | ) | 5,073 | 3,729 |
Fiscal Plan and Capital Plan Liability Principal Repayments
(millions of dollars) | 2020-21 | 2021-22 | Change fr. | 2022-23 | 2023-24 | |||||||||||||||||||
Actual | Budget | Forecast | Budget | Target | Target | |||||||||||||||||||
Education – Alberta Schools Alternative Procurement P3s | 17 | 17 | 17 | - | 18 | 19 | ||||||||||||||||||
Infrastructure – Evan Thomas water treatment P3 | 1 | 1 | 1 | - | 1 | 1 | ||||||||||||||||||
Transportation – ring road P3s | 56 | 65 | 65 | - | 70 | 73 | ||||||||||||||||||
Treasury Board and Finance – debt to reduce pre-1992 TPP liability | - | - | - | - | - | - | ||||||||||||||||||
Treasury Board and Finance – direct borrowing | 3,071 | 3,680 | 3,680 | - | 3,272 | 6,326 | ||||||||||||||||||
Total Principal Repayments | 3,145 | 3,763 | 3,763 | - | 3,361 | 6,419 | ||||||||||||||||||
Capital Plan Funding Sources |
| |||||||||||||||||||||||
(millions of dollars) | 2020-21 | 2021-22 | Change fr. | 2022-23 | 2023-24 | |||||||||||||||||||
Actual | Budget | Forecast | Budget | Target | Target | |||||||||||||||||||
Capital Plan, less | 6,896 | 8,114 | 8,253 | 139 | 7,274 | 6,064 | ||||||||||||||||||
10% cash flow adjustment (rounded) | - | (800 | ) | (800 | ) | - | (700 | ) | (600 | ) | ||||||||||||||
Capital Plan funding requirements | 6,896 | 7,314 | 7,453 | 139 | 6,574 | 5,464 | ||||||||||||||||||
Source of funding: | ||||||||||||||||||||||||
Cash received (primarily federal govt.) / donations / disposals | 548 | 1,193 | 1,624 | 431 | 1,289 | 935 | ||||||||||||||||||
Retained income of funds and agencies (primarily ASHC) | 132 | 129 | 139 | 10 | 61 | 18 | ||||||||||||||||||
SUCH sector self-financed | 444 | 839 | 813 | (26 | ) | 755 | 613 | |||||||||||||||||
TIER Fund | 174 | 62 | 49 | (13 | ) | 61 | 58 | |||||||||||||||||
Alternative financing (P3s – public-private partnerships) | 123 | 46 | 43 | (3 | ) | 81 | 39 | |||||||||||||||||
Direct borrowing / surplus cash (in 2023-24) | 5,475 | 5,045 | 4,785 | (260 | ) | 4,327 | 3,801 | |||||||||||||||||
Total Capital Plan Funding Sources | 6,896 | 7,314 | 7,453 | 139 | 6,574 | 5,464 |
2021-22 Mid-year Fiscal Update and Economic Statement | 33 |
Historical Fiscal Summary, 2008-09 to 2023-24a
|
| |||||||||||||||||||||||||||||||||||||||||||||||||||||||||||||||||
(millions of dollars) |
| |||||||||||||||||||||||||||||||||||||||||||||||||||||||||||||||||
1 | 2 | 3 | 4 | 5 | 6 | 7 | 8 | 9 | 10 | 11 | 12 | 13 | 14 | 15 | 16 | |||||||||||||||||||||||||||||||||||||||||||||||||||
2008-09 | 2009-10 | 2010-11 | 2011-12 | 2012-13 | 2013-14 | 2014-15 | 2015-16 | 2016-17 | 2017-18 | 2018-19 | 2019-20 | 2020-21 | 2021-22 | 2022-23 | 2023-24 | |||||||||||||||||||||||||||||||||||||||||||||||||||
Statement of Operations
| Actual | Forecast | Target | Target | ||||||||||||||||||||||||||||||||||||||||||||||||||||||||||||||
Revenue | ||||||||||||||||||||||||||||||||||||||||||||||||||||||||||||||||||
1 | Personal income tax | 8,708 | 7,877 | 7,631 | 8,563 | 9,621 | 10,537 | 11,042 | 11,357 | 10,763 | 10,775 | 11,874 | 11,244 | 11,257 | 13,075 | 13,083 | 13,792 | |||||||||||||||||||||||||||||||||||||||||||||||||
2 | Corporate income tax | 4,252 | 4,754 | 3,334 | 3,678 | 4,756 | 5,488 | 5,796 | 4,195 | 3,769 | 3,448 | 4,871 | 4,107 | 3,037 | 2,916 | 3,308 | 4,110 | |||||||||||||||||||||||||||||||||||||||||||||||||
3 | Other tax revenue | 3,817 | 3,746 | 3,820 | 4,099 | 4,333 | 4,500 | 4,598 | 5,168 | 5,649 | 6,538 | 6,833 | 5,747 | 5,285 | 5,421 | 5,648 | 5,826 | |||||||||||||||||||||||||||||||||||||||||||||||||
4 | Resource revenue | 11,915 | 6,768 | 8,428 | 11,636 | 7,779 | 9,578 | 8,948 | 2,789 | 3,097 | 4,980 | 5,429 | 5,937 | 3,091 | 10,908 | 9,859 | 9,231 | |||||||||||||||||||||||||||||||||||||||||||||||||
5 | Investment income | (1,888 | ) | 3,541 | 2,486 | 2,168 | 2,595 | 3,423 | 3,113 | 2,544 | 3,698 | 3,126 | 2,349 | 2,828 | 2,643 | 3,995 | 3,110 | 2,822 | ||||||||||||||||||||||||||||||||||||||||||||||||
6 | Premiums, fees and licences | 3,356 | 2,857 | 2,922 | 2,931 | 3,184 | 3,437 | 3,564 | 3,574 | 3,701 | 3,839 | 3,911 | 3,929 | 4,021 | 4,283 | 4,303 | 4,437 | |||||||||||||||||||||||||||||||||||||||||||||||||
7 | Other own-source revenue | 4,587 | 4,627 | 4,903 | 5,128 | 5,234 | 5,412 | 6,438 | 5,850 | 3,637 | 6,983 | 6,292 | 3,360 | 3,272 | 5,953 | 5,939 | 6,141 | |||||||||||||||||||||||||||||||||||||||||||||||||
8 | Total own-source revenue | 34,747 | 34,170 | 33,524 | 38,203 | 37,502 | 42,375 | 43,499 | 35,477 | 34,314 | 39,689 | 41,559 | 37,152 | 32,605 | 46,551 | 45,250 | 46,359 | |||||||||||||||||||||||||||||||||||||||||||||||||
9 | Federal transfers | 4,578 | 5,342 | 5,452 | 5,192 | 5,042 | 7,059 | 5,982 | 7,142 | 7,979 | 7,606 | 8,013 | 9,072 | 10,532 | 11,367 | 10,393 | 10,043 | |||||||||||||||||||||||||||||||||||||||||||||||||
10 | Total Revenue | 39,325 | 39,512 | 38,976 | 43,395 | 42,544 | 49,434 | 49,481 | 42,619 | 42,293 | 47,295 | 49,572 | 46,224 | 43,137 | 57,917 | 55,643 | 56,402 | |||||||||||||||||||||||||||||||||||||||||||||||||
Expense by Function | ||||||||||||||||||||||||||||||||||||||||||||||||||||||||||||||||||
11 | Health | 13,674 | 14,636 | 15,393 | 16,284 | 17,254 | 17,967 | 19,366 | 20,115 | 20,687 | 21,239 | 21,921 | 22,408 | 23,984 | 23,812 | 22,897 | 22,909 | |||||||||||||||||||||||||||||||||||||||||||||||||
12 | Basic / advanced education | 10,438 | 11,067 | 11,362 | 11,951 | 12,394 | 12,782 | 13,103 | 13,673 | 14,110 | 14,471 | 14,848 | 14,971 | 14,134 | 14,675 | 14,603 | 14,620 | |||||||||||||||||||||||||||||||||||||||||||||||||
13 | Social services | 3,417 | 3,807 | 4,129 | 4,278 | 4,641 | 4,668 | 4,548 | 4,752 | 5,198 | 5,592 | 5,867 | 6,203 | 5,919 | 6,339 | 6,458 | 6,448 | |||||||||||||||||||||||||||||||||||||||||||||||||
14 | Other program expense | 10,386 | 9,834 | 9,443 | 9,853 | 10,528 | 12,970 | 11,031 | 10,375 | 12,607 | 13,189 | 11,866 | 12,893 | 13,858 | 16,769 | 12,283 | 11,893 | |||||||||||||||||||||||||||||||||||||||||||||||||
15 | Total program expense | 37,915 | 39,344 | 40,327 | 42,366 | 44,817 | 48,387 | 48,048 | 48,915 | 52,602 | 54,491 | 54,502 | 56,475 | 57,895 | 61,595 | 56,241 | 55,870 | |||||||||||||||||||||||||||||||||||||||||||||||||
16 | Debt servicing costs | 208 | 214 | 472 | 509 | 530 | 601 | 722 | 776 | 1,018 | 1,420 | 1,971 | 2,235 | 2,486 | 2,484 | 2,934 | 3,127 | |||||||||||||||||||||||||||||||||||||||||||||||||
17 | Pension provisions | 2,133 | 430 | 439 | 634 | 296 | 748 | (404 | ) | (630 | ) | (543 | ) | (593 | ) | (190 | ) | (334 | ) | (282 | ) | (340 | ) | (255 | ) | (266 | ) | |||||||||||||||||||||||||||||||||||||||
18 | Total Expense | 40,256 | 39,988 | 41,238 | 43,509 | 45,643 | 49,736 | 48,366 | 49,061 | 53,077 | 55,318 | 56,283 | 58,376 | 60,099 | 63,739 | 58,920 | 58,731 | |||||||||||||||||||||||||||||||||||||||||||||||||
19 | Surplus / (Deficit) | (931 | ) | (476 | ) | (2,262 | ) | (114 | ) | (3,099 | ) | (302 | ) | 1,115 | (6,442 | ) | (10,784 | ) | (8,023 | ) | (6,711 | ) | (12,152 | ) | (16,962 | ) | (5,822 | ) | (3,277 | ) | (2,329 | ) | ||||||||||||||||||||||||||||||||||
Capital Planb | 7,943 | 8,000 | 7,544 | 6,884 | 6,062 | 5,770 | 6,181 | 6,558 | 6,578 | 9,021 | 6,057 | 5,545 | 6,896 | 8,253 | 7,274 | 6,064 | ||||||||||||||||||||||||||||||||||||||||||||||||||
Statement of Financial Position (at March 31) | ||||||||||||||||||||||||||||||||||||||||||||||||||||||||||||||||||
20 | Heritage / endowment funds | 16,900 | 17,077 | 17,500 | 17,936 | 18,176 | 18,562 | 18,860 | 19,262 | 19,836 | 20,306 | 20,700 | 20,670 | 21,090 | 22,137 | 22,821 | 23,334 | |||||||||||||||||||||||||||||||||||||||||||||||||
21 | Contingency Account | 16,822 | 14,983 | 11,192 | 7,497 | 3,326 | 4,658 | 6,529 | 3,625 | 2,299 | 1,661 | 6,342 | - | - | - | - | - | |||||||||||||||||||||||||||||||||||||||||||||||||
22 | Other financial assets | 28,868 | 30,338 | 30,799 | 32,972 | 34,734 | 40,039 | 40,688 | 40,990 | 44,152 | 49,010 | 48,701 | 55,711 | 56,996 | 52,834 | 51,823 | 48,803 | |||||||||||||||||||||||||||||||||||||||||||||||||
23 | Taxpayer-supported Capital Plan liabilities | (880 | ) | (2,888 | ) | (3,199 | ) | (3,442 | ) | (4,594 | ) | (8,724 | ) | (11,922 | ) | (19,040 | ) | (23,769 | ) | (29,339 | ) | (33,597 | ) | (37,188 | ) | (42,733 | ) | (47,502 | ) | (51,846 | ) | (51,818 | ) | |||||||||||||||||||||||||||||||||
24 | Taxpayer-supported operating debt / pre-1992 TPP debt | (1,160 | ) | (2,279 | ) | (2,015 | ) | (1,676 | ) | (1,426 | ) | (1,333 | ) | (1,053 | ) | (1,024 | ) | (10,751 | ) | (19,227 | ) | (29,060 | ) | (36,954 | ) | (50,303 | ) | (54,082 | ) | (55,288 | ) | (54,828 | ) | |||||||||||||||||||||||||||||||||
25 | Self-supported debt | (7,921 | ) | (9,300 | ) | (11,010 | ) | (12,707 | ) | (14,116 | ) | (15,775 | ) | (16,592 | ) | (17,373 | ) | (17,822 | ) | (17,848 | ) | (18,134 | ) | (18,066 | ) | (18,389 | ) | (17,104 | ) | (17,254 | ) | (17,886 | ) | |||||||||||||||||||||||||||||||||
26 | Total Debt c | (9,961 | ) | (14,467 | ) | (16,224 | ) | (17,825 | ) | (20,136 | ) | (25,832 | ) | (29,567 | ) | (37,437 | ) | (52,342 | ) | (66,414 | ) | (80,791 | ) | (92,208 | ) | (111,425 | ) | (118,688 | ) | (124,388 | ) | (124,532 | ) | |||||||||||||||||||||||||||||||||
27 | Pension obligations | (10,239 | ) | (9,483 | ) | (9,922 | ) | (10,556 | ) | (10,852 | ) | (11,600 | ) | (11,196 | ) | (10,566 | ) | (10,023 | ) | (9,430 | ) | (9,240 | ) | (8,918 | ) | (8,636 | ) | (8,296 | ) | (8,041 | ) | (7,775 | ) | |||||||||||||||||||||||||||||||||
28 | Other liabilities | (10,689 | ) | (11,131 | ) | (11,692 | ) | (11,033 | ) | (10,793 | ) | (12,795 | ) | (12,260 | ) | (11,955 | ) | (12,823 | ) | (14,477 | ) | (13,189 | ) | (15,399 | ) | (17,553 | ) | (14,778 | ) | (13,555 | ) | (13,756 | ) | |||||||||||||||||||||||||||||||||
29 | Net Financial Assets / (Debt) | 31,701 | 27,317 | 21,653 | 18,991 | 14,455 | 13,032 | 13,054 | 3,919 | (8,901 | ) | (19,344 | ) | (27,477 | ) | (40,144 | ) | (59,528 | ) | (66,791 | ) | (71,340 | ) | (73,926 | ) | |||||||||||||||||||||||||||||||||||||||||
30 | Capital / non-fin. assets (less def. cap. contributions starting 2012-13) | 30,275 | 34,217 | 37,607 | 40,122 | 39,517 | 40,839 | 42,197 | 44,623 | 46,622 | 49,015 | 50,744 | 51,570 | 53,767 | 55,208 | 56,480 | 56,737 | |||||||||||||||||||||||||||||||||||||||||||||||||
31 | Net Assets d | 61,976 | 61,534 | 59,260 | 59,113 | 53,972 | 53,871 | 55,251 | 48,542 | 37,721 | 29,671 | 23,267 | 11,426 | (5,761 | ) | (11,583 | ) | (14,860 | ) | (17,189 | ) | |||||||||||||||||||||||||||||||||||||||||||||
Energy prices and exchange rate | ||||||||||||||||||||||||||||||||||||||||||||||||||||||||||||||||||
32 | Oil price (WTI US$/bbl) | 85.94 | 70.71 | 83.38 | 97.33 | 92.07 | 99.05 | 80.48 | 45.00 | 47.93 | 53.69 | 62.77 | 54.85 | 42.32 | 70.50 | 64.00 | 63.50 | |||||||||||||||||||||||||||||||||||||||||||||||||
33 | Heavy oil price (WCS @ Hardisty; Cdn$/bbl) | 74.36 | 66.08 | 66.70 | 80.72 | 68.48 | 80.11 | 70.78 | 40.86 | 44.67 | 50.38 | 51.65 | 53.14 | 41.42 | 70.10 | 63.50 | 60.40 | |||||||||||||||||||||||||||||||||||||||||||||||||
34 | Natural gas price (ARP; Cdn$/GJ) | 6.97 | 3.58 | 3.28 | 2.98 | 2.28 | 3.28 | 3.51 | 2.21 | 2.01 | 1.82 | 1.34 | 1.39 | 2.10 | 3.35 | 3.15 | 2.65 | |||||||||||||||||||||||||||||||||||||||||||||||||
35 | Exchange rate (US¢/Cdn$) | 89.6 | 91.9 | 98.4 | 100.7 | 99.9 | 95.0 | 88.0 | 76.5 | 76.2 | 78.0 | 76.3 | 75.2 | 75.7 | 80.0 | 79.0 | 80.0 |
a | Numbers are not strictly comparable due to numerous accounting policy changes over time. 2019-20 expense by function have been re-classified following re-organizations and other adjustments. |
b | Reflects capital grants and other support included in expense, and capital investment in government-owned assets not included in expense. Capital investment adds to capital assets, which are depreciated over time through amortization expense. Numbers for 2008-09 to 2013-14 are estimates as details required to consolidate SUCH sector capital spending with full accuracy are not readily available. |
c | Does not include capital lease liabilities, or debt issued on behalf of government business enterprises which is reported on a net equity basis in Other Financial Assets. |
d | The change in net assets / (debt) year over year does not match the surplus / (deficit) exactly in most years, due to various balance sheet adjustments, most of which are minor. A significant adjustment reducing net assets by $2 billion was made in 2012-13, to recognize the accumulated deferred capital contribution liability when the accounting standard was adopted. |
34 | 2021-22 Mid-year Fiscal Update and Economic Statement |
Reporting Methodology and Legislative Compliance
Method of Consolidation
The 2021-22 Mid-year Fiscal Update and Economic Statement reports on the same scope, using the same method of consolidation, as presented in Budget 2021. This is also the same scope and consolidation approach used in the Consolidated Financial Statements in the Government of Alberta Annual Report.
The results of all government departments, funds and agencies, except those designated as government business enterprises, are consolidated on a line-by-line basis. Revenue and expense transactions between consolidated entities have been eliminated.
The accounts of provincial agencies designated as government business enterprises are included on the modified equity basis, computed in accordance with International Financial Reporting Standards applicable to those entities.
Basis of Financial Reporting
The consolidated fiscal summary reports revenue (including gains from disposal of tangible capital assets), expense (including amortization, inventory consumption, loss on disposal and write-down of tangible capital assets), and surplus / (deficit).
Revenue and expense are recorded using the accrual basis of accounting. Cash received for goods or services which have not been provided by period end is recorded as unearned revenue.
Transfers received for capital purposes, and donated capital assets, are recorded as “deferred capital contributions” when the cash or asset is received, and recognized in revenue over the related asset’s useful life (in effect matching the asset’s amortization expense).
Expense includes the province’s cash payments towards the unfunded pension liabilities, and the non-cash change in unfunded pension liabilities.
Debt servicing costs include interest payable, and amortization of issue costs and discounts / premiums on debt issues.
Compliance with Legislation
The Fiscal Planning and Transparency Act (FPTA) requires a public report on the accuracy of the Fiscal Plan for a fiscal year on or before November 30. The FPTA gives the President of Treasury Board and Minister of Finance discretion over the form of the report.
The 2021-22 Mid-year Fiscal Update and Economic Statement includes comparisons between the Budget 2021 estimates and second quarter forecasts for revenue and expense (including details and categories of each); the surplus / (deficit); cash adjustments and balance; a summary balance sheet; the Capital Plan; and borrowing requirements and sources. An updated Alberta economic outlook, with associated assumptions, is also provided.
The forecast provided in this report is in compliance with the requirements of the FPTA.
2021-22 Mid-year Fiscal Update and Economic Statement | 35 |