Exhibit 99.2
GOVERNMENT OF ALBERTA
2021-22 Final Results
Year-end Report
| | |
| June 2022 | |  |
Table of Contents
| | | | |
2021–22 Final Results | |
| |
Fiscal Plan Highlights | | | 3 | |
| |
Fiscal Plan Summary | | | 3 | |
| |
Revenue Highlights | | | 4 | |
| |
Revenue | | | 4 | |
| |
Expense Highlights | | | 6 | |
| |
Total Expense | | | 7 | |
| |
Cash Adjustments / Borrowing Requirements | | | 9 | |
| |
Net Financial and Capital Assets | | | 10 | |
| |
Balance Sheet | | | 11 | |
| |
Economic and Tax Highlights | | | 12 | |
| |
Historical Fiscal Summary | | | 13 | |
| |
Annual Infrastructure Report | | | 15 | |
Note: Amounts presented in tables may not add to totals due to rounding.
Treasury Board and Finance, Government of Alberta
2021–22 Final Results Year-end Report, June 2022
Additional copies of this report may be obtained by visiting our website at: www.alberta.ca/budget-documents.aspx
| | |
| |
| 2 | | 2021-22 Final Results | Year-End Report |
2021–22 Final Results
Fiscal Plan Highlights
The Alberta government 2021-22 final results was a $3.9 billion surplus, a large improvement of $22.2 billion from budget, and $20.9 billion from 2020-21.
Budget 2021 was developed in the midst of the COVID-19 global pandemic, which affected economic activity and energy prices, and complicated forecasting. As 2021-22 unfolded, additional COVID-19 variants and waves continued, but successful vaccination roll-outs, diminishing severity, and recovering health care systems enabled many countries to begin easing travel and health restrictions. As COVID-19 restrictions began to wind down, demand for energy returned rapidly while production could not keep pace, causing energy prices to jump when various supply chain issues were already sparking inflation. When Russia invaded Ukraine, global responses included limiting imports from one of the world’s largest energy producers, further eroding supply and raising prices.
These factors impacted 2021-22 Alberta government finances dramatically. Revenue increased substantially. Expense increases mainly included support for agriculture crop and livestock producers due to a severe drought, health care system needs, flowing-through federal funding, and providing electricity rebates, partially offset by reductions mainly from COVID-19-related impacts on program demand.
Total Revenue was $68.3 billion, $24.6 billion more than Budget 2021, and $25.2 billion more than 2020-21.
| • | | Change from Budget includes increases of $13.3 billion in resource revenue, $4.4 billion in income and other taxes, $2.9 billion in government business enterprises (GBE) income, $1.4 billion in federal transfers and $2.5 billion in other revenue. |
| • | | Change from 2020-21 includes similar increases in revenue sources, with the GBE change greater, at $4.9 billion. This reflects the 2020-21 write-down |
| | | for the Keystone XL pipeline, and now the 2021-22 partial reversal of the prior 2019-20 provision for an onerous contract related to the Sturgeon Refinery, based on the changes made to the ownership structure this year. |
Total Expense was $64.4 billion, $2.5 billion more than budget and a $4.3 billion increase from 2020-21.
| • | | Change from Budget was primarily due to $2.3 billion increase in disaster assistance, mainly for agriculture. |
| • | | Change from 2020-21 was mainly due to increases of $2.4 billion in disaster assistance, $2.9 billion in operating expense, mainly for child care, electricity rebates, pandemic health care costs, physician compensation, and crude-by-rail divestment, partly offset by $1.3 billion in lower pandemic and Recovery Plan needs. |
Capital Plan. Support for infrastructure in 2021-22 was $6.6 billion, $1.5 billion below budget and $0.3 billion lower than in 2020-21.
Consolidated Fiscal Summary
| | | | | | | | | | | | | | | | | | | | | | |
| (millions of dollars) | | | | | | | | | | | Change from | |
| | | | | 2021-22 | | | 2020-21 | | | | | | 2020-21 | |
| INCOME STATEMENT | | Budget | | | Actual | | | Actual | | | Budget | | | Actual | |
| | | Revenue | | | | | | | | | | | | | | | |
| | | | | | |
| 1 | | Personal income tax | | | 11,647 | | | | 13,335 | | | | 11,257 | | | | 1,688 | | | | 2,078 | |
| | | | | | |
| 2 | | Corporate income tax | | | 1,891 | | | | 4,718 | | | | 3,037 | | | | 2,827 | | | | 1,681 | |
| | | | | | |
| 3 | | Other taxes | | | 5,527 | | | | 5,453 | | | | 5,285 | | | | (74) | | | | 168 | |
| | | | | | |
| 4 | | Non-renewable resource revenue | | | 2,856 | | | | 16,170 | | | | 3,091 | | | | 13,314 | | | | 13,079 | |
| | | | | | |
| 5 | | Transfers from Government of Canada | | | 10,181 | | | | 11,595 | | | | 10,532 | | | | 1,414 | | | | 1,063 | |
| | | | | | |
| 6 | | Investment income | | | 2,205 | | | | 3,579 | | | | 2,643 | | | | 1,374 | | | | 936 | |
| | | | | | |
| 7 | | Net income / (loss) from government business enterprises | | | 1,877 | | | | 4,810 | | | | (83) | | | | 2,933 | | | | 4,893 | |
| | | | | | |
| 8 | | Premiums, fees and licences | | | 4,133 | | | | 4,520 | | | | 4,021 | | | | 387 | | | | 499 | |
| | | | | | |
| 9 | | Other revenue | | | 3,380 | | | | 4,142 | | | | 3,355 | | | | 762 | | | | 787 | |
| | | | | |
| 10 Total Revenue | | | 43,697 | | | | 68,322 | | | | 43,137 | | | | 24,625 | | | | 25,185 | |
| | | | | | |
| | Expense | | | | | | | | | | | | | | | | | | | | |
| | | | | | |
| 11 | | Operating expense (includes crude-by-rail expense) | | | 49,256 | | | | 49,531 | | | | 46,648 | | | | 275 | | | | 2,883 | |
| | | | | | |
| 12 | | COVID-19 / Recovery Plan op. exp. (includes $1,750 million contingency) | | | 2,669 | | | | 2,812 | | | | 4,059 | | | | 143 | | | | (1,247) | |
| | | | | | |
| 13 | | Capital grants | | | 2,804 | | | | 2,503 | | | | 2,401 | | | | (301) | | | | 102 | |
| | | | | | |
| 14 | | Disaster assistance (includes $750 million contingency) | | | 750 | | | | 3,076 | | | | 721 | | | | 2,326 | | | | 2,355 | |
| | | | | | |
| 15 | | Capital amortization / inventory consumption / asset disposal losses | | | 4,042 | | | | 4,184 | | | | 4,061 | | | | 142 | | | | 123 | |
| | | | | | |
| 16 | | Debt servicing costs - general | | | 1,567 | | | | 1,525 | | | | 1,403 | | | | (42) | | | | 122 | |
| | | | | | |
| 17 | | Debt servicing costs - Capital Plan | | | 1,197 | | | | 1,116 | | | | 1,083 | | | | (81) | | | | 33 | |
| | | | | | |
| 18 | | Pension provisions / (recovery) | | | (369) | | | | (365) | | | | (282) | | | | 4 | | | | (83) | |
| | | | | | |
| 19 | | Total Expense | | | 61,918 | | | | 64,378 | | | | 60,099 | | | | 2,460 | | | | 4,279 | |
| | | | | |
| 20 Surplus / (Deficit) | | | (18,221) | | | | 3,944 | | | | (16,962) | | | | 22,165 | | | | 20,906 | |
| | | | | |
| CAPITAL PLAN | | | | | | | | | | | | | | | | | | | | |
| | | | | |
| 21 Capital grants | | | 2,804 | | | | 2,503 | | | | 2,401 | | | | (301) | | | | 102 | |
| | | | | |
| 22 Capital investment | | | 5,310 | | | | 4,119 | | | | 4,495 | | | | (1,191) | | | | (376) | |
| | | | | |
| 23 Total Capital Plan | | | 8,114 | | | | 6,622 | | | | 6,896 | | | | (1,492) | | | | (274) | |
| | |
| |
| 2021-22 Final Results | Year-End Report | | 3 |
Revenue Highlights
Total Revenue
| • | | Total revenue was $68.3 billion in 2021-22, an increase of $24.6 billion from Budget 2021 and of $25.2 billion from 2020-21, due primarily to higher energy prices and economic recovery. |
| • | | Revenue was $6.6 billion more than the third quarter forecast (revised after Budget 2022 to add $80 million in federal funding for municipal transit shortfalls). Changes included: |
| | - | | Resource revenue was $2.9 billion higher due mainly to strong oil and natural gas prices in the last quarter of the fiscal year. |
| | - | | Corporate income tax revenue was $1.4 billion higher. Installment payments were more than expected and refunds were lower. Personal income tax revenue also improved, up $0.1 billion. |
| | - | | Federal transfers increased by a net $0.2 billion, with added transit and COVID-19 health transfers partially offset by lower transfers for infrastructure due primarily to re-profiling of municipal transportation and water projects. |
| | - | | Investment income decreased by $1.1 billion, as financial markets stumbled on inflation concerns and assumed imminent interest rate hikes. Income from loans to local authorities increased with prepayment penalties for early loan |
| | retirement, but this caused a similar increase to debt servicing costs for early wind-up of related swaps. |
| | - | | Government Business Enterprise (GBE) net income increased by $2.3 billion, primarily due to the Alberta Petroleum Marketing Commission (APMC) $2.2 billion partial reversal of the 2019-20 provision for an onerous contract related to the Sturgeon Refinery, based on the changes implemented in 2021-22 to the ownership structure, and improved ATB Financial income. |
| | - | | Premiums, fees and licenses and other revenue increased by a net $0.7 billion from third quarter, due mainly to increases in: timber royalties and fees from strong North American lumber prices; payment-in-lieu-of-taxes (PILOT) from ATB; investment management fees from external clients; refunds of prior-year expense accruals, such as for disasters; compliance payments into the Technology Innovation and Emissions Reduction Fund (TIER) due to higher activity; SUCH sector sales and donations revenue, mainly from post-secondary institutions. |
Non-Renewable Resource Revenue
| • | | Non-renewable resource revenue was $16.2 billion, an increase of |
| | $13.3 billion from Budget 2021, and $13.1 billion from 2020-21. |
| • | | The increases were mainly due to the rapid surge in oil and natural gas prices, especially in the last quarter of the fiscal year. The price spikes have been spurred by global economies reopening and the associated expansion in activity and energy demand, and the war in Ukraine and response to Russia affecting European and global energy supplies. |
| • | | The West Texas Intermediate (WTI) price averaged US$77.03 per barrel (/bbl) in 2021-22, $30.92 more than the Budget 2021 estimate, and $34.71 more than in 2020-21. Private sector forecasters were expecting prices to be about US$52/bbl at the time the budget forecast was prepared. Since oil sands royalty rates are tied to WTI prices, they also were higher. |
| • | | The light-heavy oil price differential averaged US$13.56/bbl, $1.05 narrower than budget, but $2.98 wider than 2020-21. |
| • | | The US-Canadian dollar exchange rate averaged US¢80/Cdn$, two and a half cents more than estimated in budget and almost four cents more than the 2020-21 average. A higher exchange rate negatively impacts revenue, but the energy price increases dwarfed the impact. Natural gas prices also jumped: the Alberta Reference Price (ARP) averaged Cdn$3.48 per |
Revenue
| | | | | | | | | | | | | | | | | | | | | | | | |
| (millions of dollars) | | | | | | | | | | | Change from | |
| | | | | | 2021-22 | | | 2020-21 | | | | | | 2020-21 | |
| | | | | | Budget | | | Actual | | | Actual | | | Budget | | | Actual | |
| | 1 | | | Personal income tax | | | 11,647 | | | | 13,335 | | | | 11,257 | | | | 1,688 | | | | 2,078 | |
| | | | | | |
| | 2 | | | Corporate income tax | | | 1,891 | | | | 4,718 | | | | 3,037 | | | | 2,827 | | | | 1,681 | |
| | | | | | |
| | 3 | | | Education property tax | | | 2,472 | | | | 2,478 | | | | 2,483 | | | | 6 | | | | (5) | |
| | | | | | |
| | 4 | | | Other taxes | | | 3,055 | | | | 2,975 | | | | 2,802 | | | | (80) | | | | 173 | |
| | | | | | |
| | 5 | | | Bitumen royalties | | | 1,482 | | | | 11,605 | | | | 2,006 | | | | 10,123 | | | | 9,599 | |
| | | | | | |
| | 6 | | | Other non-renewable resource revenue | | | 1,374 | | | | 4,565 | | | | 1,085 | | | | 3,191 | | | | 3,480 | |
| | | | | | |
| | 7 | | | Canada Social Transfer / Canada Health Transfer | | | 6,751 | | | | 7,299 | | | | 6,582 | | | | 548 | | | | 717 | |
| | | | | | |
| | 8 | | | Other transfers from Government of Canada | | | 3,430 | | | | 4,296 | | | | 3,950 | | | | 866 | | | | 346 | |
| | | | | | |
| | 9 | | | Heritage / endowment fund investment income | | | 1,484 | | | | 2,642 | | | | 1,888 | | | | 1,158 | | | | 754 | |
| | | | | | |
| | 10 | | | Other investment income | | | 721 | | | | 937 | | | | 755 | | | | 216 | | | | 182 | |
| | | | | | |
| | 11 | | | Net income / (loss) from government business enterprises | | | 1,877 | | | | 4,810 | | | | (83) | | | | 2,933 | | | | 4,893 | |
| | | | | | |
| | 12 | | | Post-secondary institution tuition fees | | | 1,475 | | | | 1,465 | | | | 1,323 | | | | (10) | | | | 142 | |
| | | | | | |
| | 13 | | | Other premiums, fees and licences | | | 2,658 | | | | 3,055 | | | | 2,698 | | | | 397 | | | | 357 | |
| | | | | | |
| | 14 | | | SUCH sector sales, rentals / fundraising, donations | | | 1,539 | | | | 1,547 | | | | 1,356 | | | | 8 | | | | 191 | |
| | | | | | |
| | 15 | | | Other revenue | | | 1,841 | | | | 2,595 | | | | 1,999 | | | | 754 | | | | 596 | |
| | | | | |
| | 16 Total Revenue | | | 43,697 | | | | 68,322 | | | | 43,137 | | | | 24,625 | | | | 25,185 | |
| | |
| |
| 4 | | 2021-22 Final Results | Year-End Report |
Oil and Natural Gas Prices 2017-22
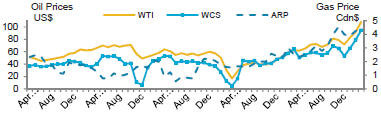
| | gigajoule, 86 cents above budget and $1.38 above 2020-21, boosted by higher demand, with global efforts to use gas instead of coal for electricity production, European needs to replace supply from Russia, and increased US LNG exports, coupled with relatively flat North American production. |
| • | | Bitumen royalties were $11.6 billion, $10.1 billion more than budget and $9.6 billion more than 2020-21. Five oil sands projects reached payout in 2021, elevating their royalty rates. Conventional crude oil royalties were $1.9 billion in 2021-22, an increase of $1.3 billion from budget and $1.5 billion from 2020-21. Bitumen production was close to budget, while conventional was about 8% greater. |
| • | | Natural gas and by-product royalties were $2.2 billion, up $1.8 billion from both budget and 2020-21. By-product prices follow oil prices, which rose relatively more than ARP, increasing royalties. Natural gas and natural gas liquids production rose as well. |
| • | | Crown land lease sales increased by $77 million from budget and by $204 million from 2020-21, due to higher prices per hectare, and more than double the number of oil sands hectares sold relative to budget and 2020-21. Land lease sales were deferred for much of 2020-21. |
Tax Revenue
| • | | Total tax revenue was $23.5 billion, $4.4 billion greater than estimated in Budget 2021 and $3.9 billion more than in 2020-21. |
| • | | Personal income tax (PIT) revenue was $13.3 billion, $1.7 billion higher than budget, and $2.1 billion greater than 2020-21, mainly due to strengthening household income with economic recovery. Revenue includes a prior-years’ adjustment of $745 million as PIT reported in 2019-20 and 2020-21 was too low. Household incomes in 2020 were elevated by federal support programs, and PIT was underestimated, requiring an adjustment following updated 2020 assessments. |
| • | | Corporate income tax (CIT) revenue was $4.7 billion, $2.8 billion greater than Budget 2021 and $1.7 billion more than 2020-21, primarily reflecting higher corporate cash receipts due to Alberta’s economic recovery and stronger energy prices. |
| • | | Education property and other tax revenue was $5.5 billion, a decrease of $74 million from budget, but an increase of $168 million from 2020-21. Higher insurance, cannabis and freehold mineral rights tax revenue was more than offset by lower fuel tax and tobacco tax revenue, relative to budget. Relative to 2020-21, fuel tax increased by $137 million and tourism levy revenue was up $26 million, while tobacco tax revenue continued to decline. |
Transfers from Government of Canada
| • | | Total of $11.6 billion, $1.4 billion higher than Budget 2021, and an increase of $1.1 billion from 2020-21, mainly due to various COVID-19 transfers, support for livestock |
| | | producers, child care and labour market programs, municipal transit operating shortfalls and flood disaster assistance. These were partly offset by re-profiling municipal transportation and water projects to future years. |
Investment Income
| • | | Investment income was $3.6 billion, $1.4 billion more than estimated in budget and $936 million more than realized in 2020-21. Income of the Heritage, endowments and other funds was higher with strong market returns in 2021, though markets weakened to start 2022 due mainly to concerns with inflation and likely interest rate hikes. Local authority lending income increased largely due to a pre-payment penalty for an early repayment. There is a corresponding increase to debt servicing costs to wind up swaps related to the debt prepaid. |
Other Revenue
| • | | Other revenue was $13.5 billion, an increase of $4.1 billion from budget and $6.2 billion from 2020-21. Most of this ($2.9 billion from budget; $4.9 billion from 2020-21) reflects improved GBE net income, primarily of APMC and ATB Financial. APMC net income of $2.1 billion comprises a $2.2 billion partial reversal of the 2019-20 provision for an onerous contract related to the Sturgeon Refinery after the ownership restructuring, less a $0.2 billion operating loss. Premium, fees and licences revenue increased $0.4 billion from budget and $0.5 billion from 2020-21. Changes from budget were mainly due to $0.3 billion in higher timber royalties and $0.2 billion in ATB PILOT, partly offset by lower AHS fees. Other revenue was $0.8 billion higher than budget and 2020-21. Changes from budget were mainly due to higher investment management fees charged to external clients, TIER compliance payments and refunds of prior-year over-accrued expense. |
Energy Prices and Exchange Rates
Fiscal year averages, 2007-08 to 2021-22
| | | | | | | | | | | | | | | | | | | | | | | | | | | | | | | | | | | | | | | | | | | | | | | | | | | | | | | | | | | | |
| | | 07-08 | | | 08-09 | | | 09-10 | | | 10-11 | | | 11-12 | | | 12-13 | | | 13-14 | | | 14-15 | | | 15-16 | | | 16-17 | | | 17-18 | | | 18-19 | | | 19-20 | | | 20-21 | | | 21-22 | |
Oil Price (WTI US$/bbl) | | | 82.25 | | | | 85.94 | | | | 70.71 | | | | 83.38 | | | | 97.33 | | | | 92.07 | | | | 99.05 | | | | 80.48 | | | | 45.00 | | | | 47.93 | | | | 53.69 | | | | 62.77 | | | | 54.85 | | | | 42.32 | | | | 77.03 | |
WCS @ Hardisty (Cdn$/bbl) | | | 59.30 | | | | 74.36 | | | | 66.08 | | | | 66.70 | | | | 80.72 | | | | 68.48 | | | | 80.11 | | | | 70.78 | | | | 40.86 | | | | 44.67 | | | | 50.38 | | | | 51.65 | | | | 53.14 | | | | 41.42 | | | | 79.63 | |
Natural Gas Price (Cdn$/GJ) | | | 5.92 | | | | 6.97 | | | | 3.58 | | | | 3.28 | | | | 2.98 | | | | 2.28 | | | | 3.28 | | | | 3.51 | | | | 2.21 | | | | 2.01 | | | | 1.82 | | | | 1.34 | | | | 1.39 | | | | 2.10 | | | | 3.48 | |
Exchange rate (US¢/Cdn$) | | | 97.1 | | | | 89.6 | | | | 91.9 | | | | 98.4 | | | | 100.7 | | | | 99.9 | | | | 95.0 | | | | 88.0 | | | | 76.5 | | | | 76.2 | | | | 78.0 | | | | 76.3 | | | | 75.2 | | | | 75.7 | | | | 80.0 | |
| | |
| |
| 2021-22 Final Results | Year-End Report | | 5 |
Expense Highlights
Total expense was $64.4 billion in 2021-22, comprising $52.3 billion in operating expense, $2.5 billion in capital grants, $3.1 billion in disaster assistance, $4.2 billion in amortization, inventory consumption and asset disposal losses, $2.6 billion in debt servicing costs, less $0.4 billion in reductions to pension liabilities.
Budget-to-actual changes. Expense was $2.5 billion higher than budget:
| • | | Operating expense. $417 million increase, with $274 million in regular operating expense and $143 million in COVID-19 / Recovery Plan support. Increases were required mainly for electricity rebates introduced late in the year, the cost of selling oil, investment management fees, labour agreements and child-care expense. Decreases were mostly related to slower recovery from the pandemic in K-12 education enrolment and some social services programs, site rehabilitation program delays, lower-than-expected uptake for the Alberta Jobs Now program and crude-by-rail divestment costs. |
| • | | Capital grants. $301 million decrease, mainly for re-profiling federally-funded projects to future years, partially offset by a one-time increase to the Community Building Fund. |
| • | | Disaster assistance. $2.3 billion increase from the $750 million budgeted contingency, primarily for crop insurance indemnities and livestock feed assistance due to the severe drought in 2021. |
| • | | Other expense. $23 million increase. Increases of $426 million in inventory consumption and $12 million in disposal losses and lower reduction to pension liabilities were mostly offset by decreases of $292 million in amortization and $123 million in debt servicing costs. |
Year-over-year comparison. Expense was $4.3 billion higher than 2020-21:
| • | | Operating expense. A $1.6 billion net increase, reflecting a $2.9 billion increase in “regular” operating expense, partially offset by a decrease |
| | | of $1.3 billion in COVID-19 / Recovery Plan operating expense. Regular operating expense was higher in most ministries, as public health measures began to ease and demand for services started to return to pre-pandemic levels. The strong economic recovery and higher oil and gas prices also had an impact on the cost of government programs and services. |
| • | | Capital grants. $102 million higher mainly from increased municipal support, including for LRT projects, partially offset by $264 million lower COVID-19 / Recovery Plan grants. |
| • | | Disaster assistance. $2.4 billion increase primarily due to support to crop and livestock producers following the severe 2021 drought. |
| • | | Other expense. $195 million increase. Increases of $155 million in debt servicing costs and $168 million in inventory consumption (mainly for personal protective equipment - PPE) were partly offset by $45 million in lower amortization and disposal losses and an $83 million higher reduction to pension liabilities. |
Third Quarter forecast-to-actual changes. Expense was $0.8 billion lower than the $65.2 billion third quarter forecast (revised after Budget 2022), mainly due operating expense. Increases of $240 million in debt servicing costs and $39 million in inventory consumption were partly offset by decreases of $127 million in capital grants and $88 million in amortization.
COVID-19 / Recovery Plan
Total 2021-22 expense of $3.8 billion. This includes the $1.75 billion budgeted COVID-19 / Recovery Plan contingency. In addition, $459 million in capital investment was spent on Alberta’s Recovery Plan.
| • | | Operating expense. $2.8 billion, with $1.5 billion in Health. Health expense comprised: $499 million for acute and continuing care; $294 million for lab testing and contact tracing; $222 million for vaccine distribution; $513 million for other costs including Healthlink, mental health, drugs |
| | | and supplemental benefits, staffing and operations. Other ministry COVID-19 / Recovery Plan expense of $1.3 billion included: $300 million for site rehabilitation; $159 million for transit recovery; $158 million for the Alberta Jobs Now Program; $122 million for Small and Medium Enterprise Relaunch Grants; $91 million for Safe Return to Class; and $445 million in other expense. |
| • | | Capital grants. $385 million was provided primarily to Alberta municipalities, with $243 million funded by the one-time increase to the federal Community Building Fund, and $142 million for irrigation, water and other projects. |
| • | | Inventory consumption. A total of $564 million, primarily for personal protective equipment and rapid test kits, with $451 million in Health, $78 million in Education and $35 million in Municipal Affairs. |
Ministry Expense
Total expense includes operating (shown by ministry in facing table), as well as other types of expense (e.g. COVID-19 operating, capital grants, amortization), for which only major ministries are individually displayed in the table. The remainder are grouped into “Other.”
Health
Total expense of $24.7 billion, including $22.8 billion in operating expense and $1.8 billion in amortization and inventory consumption. This exceeded the budget by $1.7 billion or 7%, and was $1.5 billion more than 2020-21.
| • | | Major changes from Budget 2021 included $2 billion for COVID-19 costs, with $1.15 billion transferred from the contingency. Regular operating expense was $0.1 billion lower, primarily from decreases in drugs and supplemental health benefits, reduced participation in the Adult Health Benefit program and staff vacancies in community care. The remaining $0.2 billion decrease was primarily in amortization expense. |
| | |
| |
| 6 | | 2021-22 Final Results | Year-End Report |
Total Expense
(millions of dollars)
| | | | | | | | | | | | | | | | | | | | | | |
| | | | | 2021-22 | | | 2020-21 | | | Change from | |
| | | Operating Expense by Ministry | | Budget | | | Actual | | | Actual | | | Budget | | | 2020-21 | |
| 1 | | Advanced Education | | | 5,044 | | | | 5,280 | | | | 5,132 | | | | 236 | | | | 148 | |
| 2 | | Agriculture, Forestry and Rural Economic Development | | | 839 | | | | 789 | | | | 812 | | | | (50 | ) | | | (23 | ) |
| 3 | | Children’s Services | | | 1,717 | | | | 1,706 | | | | 1,443 | | | | (11 | ) | | | 263 | |
| 4 | | Community and Social Services | | | 3,886 | | | | 3,714 | | | | 3,691 | | | | (172 | ) | | | 23 | |
| 5 | | Culture and Status of Women | | | 161 | | | | 161 | | | | 151 | | | | - | | | | 10 | |
| 6 | | Education | | | 8,248 | | | | 7,846 | | | | 7,707 | | | | (402 | ) | | | 139 | |
| 7 | | Energy | | | 483 | | | | 901 | | | | 413 | | | | 418 | | | | 488 | |
| 8 | | Environment and Parks | | | 449 | | | | 519 | | | | 479 | | | | 70 | | | | 40 | |
| 9 | | Executive Council | | | 18 | | | | 14 | | | | 15 | | | | (4 | ) | | | (1 | ) |
| 10 | | Health | | | 21,418 | | | | 21,302 | | | | 20,285 | | | | (116 | ) | | | 1,017 | |
| 11 | | Indigenous Relations | | | 180 | | | | 153 | | | | 102 | | | | (27 | ) | | | 51 | |
| 12 | | Infrastructure | | | 425 | | | | 430 | | | | 446 | | | | 5 | | | | (16 | ) |
| 13 | | Jobs, Economy and Innovation | | | 308 | | | | 265 | | | | 257 | | | | (43 | ) | | | 8 | |
| 14 | | Justice and Solicitor General | | | 1,346 | | | | 1,478 | | | | 1,394 | | | | 132 | | | | 84 | |
| 15 | | Labour and Immigration | | | 200 | | | | 190 | | | | 182 | | | | (10 | ) | | | 8 | |
| 16 | | Municipal Affairs | | | 247 | | | | 251 | | | | 191 | | | | 4 | | | | 60 | |
| 17 | | Seniors and Housing | | | 673 | | | | 616 | | | | 611 | | | | (57 | ) | | | 5 | |
| 18 | | Service Alberta | | | 454 | | | | 459 | | | | 484 | | | | 5 | | | | (25 | ) |
| 19 | | Transportation | | | 408 | | | | 437 | | | | 424 | | | | 29 | | | | 13 | |
| 20 | | Treasury Board and Finance | | | 1,647 | | | | 2,036 | | | | 1,879 | | | | 389 | | | | 157 | |
| 21 | | Legislative Assembly | | | 128 | | | | 117 | | | | 104 | | | | (11 | ) | | | 13 | |
| 22 | | Crude-by-rail (Energy) | | | 976 | | | | 866 | | | | 443 | | | | (110 | ) | | | 423 | |
| 23 | | Total Operating Expense | | | 49,254 | | | | 49,531 | | | | 46,648 | | | | 277 | | | | 2,883 | |
| | COVID-19 / Recovery Plan Operating Expense | | | | | | | | | | | | | | | | | | | | |
| 24 | | Energy | | | 480 | | | | 318 | | | | 130 | | | | (162 | ) | | | 188 | |
| 25 | | Health | | | - | | | | 1,528 | | | | 1,093 | | | | 1,528 | | | | 435 | |
| 26 | | Jobs, Economy and Innovation | | | 122 | | | | 240 | | | | 765 | | | | 118 | | | | (525 | ) |
| 27 | | Labour and Immigration | | | 129 | | | | 224 | | | | 433 | | | | 95 | | | | (209 | ) |
| 28 | | Other | | | 188 | | | | 502 | | | | 1,638 | | | | 314 | | | | (1,136 | ) |
| 29 | | Contingency (Treasury Board and Finance) | | | 1,750 | | | | - | | | | - | | | | (1,750 | ) | | | - | |
| 30 | | Total COVID-19 / Recovery Plan Operating Expense | | | 2,669 | | | | 2,812 | | | | 4,059 | | | | 143 | | | | (1,247 | ) |
| | Capital Grants | | | | | | | | | | | | | | | | | | | | |
| 31 | | Agriculture, Forestry and Rural Economic Development | | | 83 | | | | 95 | | | | 23 | | | | 12 | | | | 72 | |
| 32 | | Energy | | | 58 | | | | 43 | | | | 126 | | | | (15 | ) | | | (83 | ) |
| 33 | | Municipal Affairs | | | 1,491 | | | | 1,702 | | | | 1,726 | | | | 211 | | | | (24 | ) |
| 34 | | Transportation | | | 901 | | | | 472 | | | | 318 | | | | (429 | ) | | | 154 | |
| 35 | | Other | | | 271 | | | | 191 | | | | 208 | | | | (80 | ) | | | (17 | ) |
| 36 | | Total Capital Grants | | | 2,804 | | | | 2,503 | | | | 2,401 | | | | (301 | ) | | | 102 | |
| | Disaster / Emergency Assistance | | | | | | | | | | | | | | | | | | | | |
| 37 | | Agriculture, Forestry and Rural Ec. Dev. (agriculture support/wildfire fighting) | | | - | | | | 3,030 | | | | 555 | | | | 3,030 | | | | 2,475 | |
| 38 | | Municipal Affairs (flood support) | | | - | | | | 32 | | | | 166 | | | | 32 | | | | (134 | ) |
| 39 | | Service Alberta (1GX costs) | | | - | | | | 14 | | | | - | | | | 14 | | | | 14 | |
| 40 | | Contingency (Treasury Board and Finance) | | | 750 | | | | - | | | | - | | | | (750 | ) | | | - | |
| 41 | | Total Disaster / Emergency Assistance | | | 750 | | | | 3,076 | | | | 721 | | | | 2,326 | | | | 2,355 | |
| | Amortization / Inventory Consumption / Loss on Asset Disposals | | | | | | | | | | | | | | | | | | | | |
| 42 | | Advanced Education amortization / inventory consumption | | | 751 | | | | 578 | | | | 689 | | | | (173 | ) | | | (111 | ) |
| 43 | | Education amortization / inventory consumption | | | 458 | | | | 554 | | | | 435 | | | | 96 | | | | 119 | |
| 44 | | Health amortization / inventory consumption | | | 1,535 | | | | 1,831 | | | | 1,765 | | | | 296 | | | | 66 | |
| 45 | | Infrastructure amortization / inventory consumption | | | 146 | | | | 129 | | | | 124 | | | | (17 | ) | | | 5 | |
| 46 | | Transportation amortization / inventory consumption | | | 760 | | | | 760 | | | | 695 | | | | - | | | | 65 | |
| 47 | | Other amortization / inventory consumption / loss on disposals | | | 392 | | | | 332 | | | | 353 | | | | (60 | ) | | | (21 | ) |
| 48 | | Total Amortization / Invent. Consump. / Loss on Disposals | | | 4,042 | | | | 4,184 | | | | 4,061 | | | | 142 | | | | 123 | |
| | Taxpayer-supported Debt Servicing Costs - General | | | | | | | | | | | | | | | | | | | | |
| 49 | | Education (School Boards) | | | 9 | | | | 8 | | | | 9 | | | | (1 | ) | | | (1 | ) |
| 50 | | Treasury Board and Finance | | | 1,117 | | | | 1,154 | | | | 1,241 | | | | 37 | | | | (87 | ) |
| 51 | | Total Taxpayer-supported General Debt Servicing Costs | | | 1,126 | | | | 1,162 | | | | 1,250 | | | | 36 | | | | (88 | ) |
| | Taxpayer-supported Debt Servicing Costs - Capital Plan | | | | | | | | | | | | | | | | | | | | |
| 52 | | Education (school P3s) / Transportation (ring road P3s) | | | 129 | | | | 129 | | | | 122 | | | | - | | | | 7 | |
| 53 | | Treasury Board and Finance – direct borrowing | | | 1,068 | | | | 987 | | | | 961 | | | | (81 | ) | | | 26 | |
| 54 | | Total Taxpayer-supported Capital Plan Debt Servicing Costs | | | 1,197 | | | | 1,116 | | | | 1,083 | | | | (81 | ) | | | 33 | |
| | | | | | |
| 55 | | Total Taxpayer-supported Debt Servicing Costs | | | 2,323 | | | | 2,278 | | | | 2,333 | | | | (45 | ) | | | (55 | ) |
| | | | | | |
| | Self-supported Debt Servicing Costs | | | | | | | | | | | | | | | | | | | | |
| 56 | | Treasury Board and Finance – loans to local authorities | | | 374 | | | | 298 | | | | 85 | | | | (76 | ) | | | 213 | |
| 57 | | Treasury Board and Finance – Ag Financial Services Corp. | | | 67 | | | | 65 | | | | 68 | | | | (2 | ) | | | (3 | ) |
| 58 | | Total Self-supported Debt Servicing Costs | | | 441 | | | | 363 | | | | 153 | | | | (78 | ) | | | 210 | |
| 59 | | Total Debt Servicing Costs | | | 2,764 | | | | 2,641 | | | | 2,486 | | | | (123 | ) | | | 155 | |
| 60 | | Pension Provisions / (Recovery) | | | (369 | ) | | | (365 | ) | | | (282 | ) | | | 4 | | | | (83 | ) |
| 61 | | Total Expense | | | 61,918 | | | | 64,378 | | | | 60,099 | | | | 2,460 | | | | 4,279 | |
| | |
| |
| 2021-22 Final Results | Year-End Report | | 7 |
| • | | Increases from 2020-21 comprised $0.5 billion for COVID-19 costs, $0.5 billion in physician compensation, and $0.5 billion for acute and long-term care and other programs. |
Education
Total expense was $8.5 billion, a decrease of $275 million from budget, but an increase of $166 million from 2020-21.
| • | | The decrease from budget comprises $371 million in lower operating expense, primarily from lower-than-expected enrolment, offset by increases of $83 million for consumption of personal protective equipment (masks) and rapid test kits, and $13 million for amortization. |
| • | | The change from 2020-21 comprises increases of $20 million in operating expense, $83 million in inventory consumption, $36 million in amortization, $6 million in capital grants, and a $23 million lower reduction in pension liabilities, less a decrease of $2 million in debt servicing costs. |
Advanced Education
Total expense was $5.9 billion, an increase of $102 million from budget and $11 million from 2020-21. The increases primarily reflect the cost of new labour agreements, students returning to in-person learning and higher student loan default costs.
Community and Social Services
Expense was $3.7 billion in 2021-22, $141 million lower than budget and $29 million lower than 2020-21. The decreases were mainly due to reduced caseloads in income support programs, as federal COVID-19 supports were extended.
Children’s Services
Expense was $1.7 billion, $24 million higher than budget and $152 million higher than 2020-21. The increase from 2020-21 reflects $109 million for child-care programs funded by the federal government and $43 million mainly for the Alberta Child and Family Benefit and child intervention.
Justice and Solicitor General
Expense of $1.5 billion, $131 million more than budget and $80 million more than 2020-21, mainly for the RCMP agreement, indigenous policing and the Coutts border protest.
Energy
Total expense was $2.1 billion, with increases of $128 million from budget and $1 billion from 2020-21. Changes from 2020-21 include: $423 million for terminating crude-by-rail contracts; $296 million for electricity rebates for January-March 2022; $187 million for the cost of selling oil; $171 million for site rehabilitation; partly offset by decreases of $63 million mainly for carbon capture and storage grants.
Other Ministries
Total expense for other ministries was $16.2 billion in 2021-22, $0.8 billion higher than estimated in Budget 2021 and $1.4 billion higher than 2020-21.
Changes from budget include:
| • | | Agriculture, Forestry and Rural Economic Development expense was $3 billion higher primarily due to drought-related disaster assistance. |
| • | | Jobs, Economy and Innovation was $74 million higher, primarily in Recovery Plan initiatives. |
| • | | Labour and Immigration increased $85 million mainly for the Alberta Jobs Now Program and Critical Worker Benefit programs. |
| • | | Municipal Affairs was $267 million higher: $243 million for Community Building Fund grants, and $24 million for 911 call centre support, self-isolation benefits and other programs. |
| • | | Transportation expense decreased $242 million largely from Edmonton and Calgary LRT project delays, partially offset by $159 million for municipal transit shortfalls. |
| • | | Treasury Board and Finance was down $2.3 billion as the $2.5 billion contingency was transferred to other ministries, debt servicing costs were $122 million lower, while external investment management fees were $360 million higher. |
| • | | Expense in other ministries was a net $79 million lower than budget. |
Changes from 2020-21 include:
| • | | Agriculture, Forestry and Rural Economic Development increased $2.5 billion due to disaster support. |
| • | | Environment and Parks declined by $300 million, mainly due to lower TIER fund allocations. |
| • | | Jobs, Economy and Innovation expense was $518 million lower, mainly from lower relaunch grants. |
| • | | Labour and Immigration decreased $209 million primarily from one-time initiatives such as WCB premium and emergency isolation support. |
| • | | Municipal Affairs was $704 million lower due mainly to the 2020-21 federally-funded Safe Restart program and lower disaster assistance. |
| • | | Transportation increased $344 million due mainly to higher municipal capital grants and support for transit shortfall. |
| • | | Treasury Board and Finance increased $194 million, mainly from external investment management fees and debt servicing costs, partly offset by a larger reduction in pension liabilities. |
| • | | Expense in other ministries was a net $70 million lower than 2020-21. |
Pension Provisions/Recovery
| • | | Public sector pension plan liabilities decreased by $365 million, to $8.3 billion at March 31, 2022. |
| • | | Liabilities for pre-1992 and other closed plan obligations account for 96% (2021: 95%) of the liability, with the pre-1992 Teachers’ PP accounting for 88% (2021: 86%). |
Pension Liabilities
Government obligations for pension plan liabilities (millions of dollars)
| | | | | | | | |
| (at March 31) | | 2022 | | 2021 |
Teachers’ (pre-1992) | | | 7,244 | | | | 7,398 | |
| | |
PS Mgmt. (pre-1992) | | | 386 | | | | 423 | |
| | |
Univ. Acad. (pre-1992) | | | 226 | | | | 249 | |
| | |
Spec. Forces (pre-1992) | | | 85 | | | | 66 | |
| | |
MLA (Closed) | | | 35 | | | | 36 | |
Universities Academic | | | 197 | | | | 196 | |
| | |
Teachers’ (post-1992) | | | - | | | | 95 | |
| | |
Supp. Exec. Retir. Plans | | | 72 | | | | 72 | |
| | |
PS Mgmt. (Supp.) | | | 25 | | | | 60 | |
| | |
Prov. Judges / Masters | | | 1 | | | | 41 | |
Total Pension Liab. | | | 8,271 | | | | 8,636 | |
| | |
| |
| 8 | | 2021-22 Final Results | Year-End Report |
Cash Adjustments / Borrowing Requirements
General Revenue Fund cash balance. The year-end GRF cash balance was $9.6 billion on March 31, 2022, an increase of $2.1 billion from the prior year, comprising: the $3.9 billion surplus, less a net $6.6 billion in net cash requirements and adjustments from accrual accounting numbers, offset by the addition of $4.8 billion in borrowing for capital spending.
Cash adjustments such as differences between accrued revenue and cash receipts, non-cash revenue or expense, SUCH sector entity results, and transfers not reported on the income statement, are necessary to determine the cash balance.
| • | | Net income of, or retained by, other entities. |
| | - | | Positive adjustments include: the SUCH sector / Alberta Innovates own-source expense exceeded their revenue by $0.6 billion; the Agriculture Financial Services Corporation funded $2.1 billion in indemnity payments from the Crop Insurance Fund. |
| | - | | Negative adjustments include: the $2.1 billion net income of Alberta Petroleum Marketing Commission and $0.9 billion in surpluses of entities like ATB Financial, the Technology Innovation and Emissions Reduction Fund, or the Balancing Pool, are retained by the entities; $0.7 billion was retained by the Heritage Fund for inflation-proofing, and another $0.3 billion in net income is kept by the endowment funds. |
| • | | Non-cash expense. $1.5 billion of amortization, inventory consumption and loss on disposal expense requires no cash; a $365 million decrease in pension liabilities is reported as non-cash negative expense. |
| • | | Cash requirements not in expense. $271 million for student loans, net of repayments; $148 million for short-term inventory assets; a net $42 million was required for 2013 flood assistance and 2016 Wood Buffalo wildfire spending, after adjusting for revised expense and revenue. |
| • | | Revenue and other cash adjustments. Revenue reported for non-renewable resource royalties exceeded cash received by $2.4 billion, while reported revenue for income taxes exceeded cash received by $0.3 billion; various other differences between revenue / expense and cash were offsetting. Cash transfers for capital, reported in revenue over the related asset’s life, exceeded non-cash reported revenue by $249 million. |
Capital Plan cash. Cash for capital investment and P3 principal repayments of $3.5 billion was more than offset by $4.8 billion in cash from borrowing and P3 partners.
Cash Adjustments / Borrowing Requirements
(millions of dollars)
| | | | | | | | | | | | | | | | | | | | | | | | |
| | | | | | | | | | | | | | | Change from | |
| | | | | | 2021-22 | | | 2020-21 | | | | | | 2020-21 | |
| | | | | | Budget | | | Actual | | | Actual | | | Budget | | | Actual | |
| | 1 | | | Balance at Start of Year (April 1) | | | 10,000 | | | | 7,429 | | | | 9,405 | | | | (2,571 | ) | | | (1,976 | ) |
| | | | | | |
| | 2 | | | Surplus / (Deficit) | | | (18,221 | ) | | | 3,944 | | | | (16,962 | ) | | | 22,165 | | | | 20,906 | |
| | | | | | |
| | | | Cash Adjustments – Sources / (Requirements) | | | | | | | | | | | | | | | | | | | | |
| | | | | | |
| | 3 | | | SUCH / Alberta Innovates own-source revenue / expense | | | 3,202 | | | | 590 | | | | 122 | | | | (2,612 | ) | | | 468 | |
| | 4 | | | Income retained by funds and agencies / Heritage Fund | | | (586 | ) | | | (1,941 | ) | | | 2,096 | | | | (1,355 | ) | | | (4,037 | ) |
| | 5 | | | Pension provisions (non-cash expense) | | | (369 | ) | | | (365 | ) | | | (282 | ) | | | 4 | | | | (83 | ) |
| | 6 | | | Amort. / invent. cons. / book value disp. (ex. SUCH; non-cash exp.) | | | 1,376 | | | | 1,523 | | | | 1,201 | | | | 147 | | | | 322 | |
| | 7 | | | Student loans / inventory acquisition (excluding SUCH) | | | (496 | ) | | | (419 | ) | | | (317 | ) | | | 77 | | | | (102 | ) |
| | 8 | | | 2016 Wood Buffalo fire / 2013 flood assistance revenue / expense | | | (25 | ) | | | (42 | ) | | | (26 | ) | | | (17 | ) | | | (16 | ) |
| | 9 | | | Energy royalties / personal income tax / other cash adjustments | | | (293 | ) | | | (2,682 | ) | | | (2,727 | ) | | | (2,389 | ) | | | 45 | |
| | 10 | | | Net deferred capital contribution adjustment (excluding SUCH) | | | 84 | | | | 249 | | | | 96 | | | | 165 | | | | 153 | |
| | 11 | | | Capital investment (excluding SUCH; cash requirement not in expense) | | | (3,670 | ) | | | (3,492 | ) | | | (4,051 | ) | | | 178 | | | | 559 | |
| | 12 | | | Withdrawal / (deposit) from / (to) Capital Plan account | | | - | | | | - | | | | - | | | | - | | | | - | |
| | 13 | | | Direct borrowing for Capital Plan | | | 5,045 | | | | 4,812 | | | | 5,475 | | | | (233 | ) | | | (663 | ) |
| | 14 | | | Alternative financing for Capital Plan (P3s – public-private partnerships) | | | 46 | | | | 43 | | | | 123 | | | | (3 | ) | | | (80 | ) |
| | 15 | | | Current principal repayments (P3s) | | | (83 | ) | | | (83 | ) | | | (74 | ) | | | - | | | | (9 | ) |
| | | | | | |
| | 16 | | | Surplus / (deficit) plus net cash adjustments | | | (13,990 | ) | | | 2,137 | | | | (15,325 | ) | | | 16,127 | | | | 17,463 | |
| | 17 | | | Cash transferred from / (due to) prior-year final results | | | - | | | | - | | | | - | | | | - | | | | - | |
| | 18 | | | Cash from final results to be withdrawn / (deposited) next year | | | - | | | | - | | | | - | | | | - | | | | - | |
| | 19 | | | Direct borrowing for Fiscal Plan | | | 12,490 | | | | - | | | | 13,349 | | | | (12,490 | ) | | | (13,349 | ) |
| | 20 | | | Balance at End of Year (March 31) | | | 8,500 | | | | 9,566 | | | | 7,429 | | | | 1,066 | | | | 2,138 | |
| | |
| |
| 2021-22 Final Results | Year-End Report | | 9 |
Net Financial and Capital Assets
At March 31, 2022, government of Alberta liabilities exceeded financial and capital / other non-financial assets by $1.9 billion.
This was a $3.8 billion improvement relative to March 31, 2021, due to a reduction of $2.8 billion in liabilities and a net increase in capital / non-financial assets of $1 billion. Main changes in financial assets and liabilities included:
| • | | Addition of $1.3 billion in the Heritage Fund, endowment funds, Alberta Enterprise Corporation, and Technology Innovation and Emissions Reduction Fund (TIER), primarily from income retention; $0.3 billion in student loans; a net $2.6 billion increase in government business enterprise equity (mainly from the $2.2 billion partial reversal of the 2019-20 provision for an onerous contract related to the Sturgeon Refinery, and ATB Financial net income); offset by a decrease of $3.1 billion in net assets related to self-supporting lending activities, as a sizeable local authority loan was repaid and cash was withdraw to fund agriculture insurance indemnities; and a net reduction of $1 billion in General Revenue Fund cash and other financial assets (primarily cash and equivalents). |
| • | | The $2.8 billion decrease in liabilities comprised a net $1.3 billion reduction in debt, mainly reflecting the repayment of debt incurred for local authority lending, a $0.4 billion decrease in pension and coal phase-out liabilities, and $1.1 billion in various other liabilities. |
Financial assets
$78.1 billion at March 31, 2022.
Heritage Fund. $17.1 billion book value. This was a $705 million increase from March 31, 2021, from inflation-proofing of 4.3 per cent (2021 Alberta CPI).
Endowment and other funds. $5.1 billion, a $381 million increase from March 31, 2021. This comprises $331 million in net investment income
of the three endowment funds and Alberta Enterprise Corporation (AEC), and $50 million investment into AEC.
General Revenue Fund cash. Balance of $9.6 billion, an increase of $2.1 billion from March 31, 2021.
Self-supporting lending activities. $18.4 billion in assets of Agriculture Financial Services Corporation (AFSC) and local authority loans. These assets offset the related liabilities.
Equity / (deficit) in commercial enterprises. $1.8 billion, comprising equity of $4.5 billion in ATB Financial and $0.6 billion in Credit Union Deposit Guarantee Corporation and Alberta Gaming, Liquor and Cannabis Commission, less deficits of $2.6 billion in Alberta Petroleum Marketing Commission and $0.7 billion in the Balancing Pool.
Student loans. $3.6 billion, an increase of $271 million from March 31, 2021, comprising $739 million in loans provided less $380 million in repayments and a net $88 million in other adjustments, mainly provision for loan losses.
Technology Innovation and Emissions Reduction Fund. $0.3 billion, a $192 million increase from March 31, 2021 as TIER revenue exceeded allocations.
Other financial assets. $22.2 billion. These assets include financial assets of school boards, universities and colleges and the health authority, accounts and interest receivable, natural gas royalty deposits and cash associated with future liabilities such as corporate income tax refunds.
Liabilities
$135.1 billion at March 31, 2022, including debt of $107.1 billion, alternative financing (public-private partnerships) of $3 billion, coal phase-out liabilities of $0.8 billion, pension liabilities of $8.3 billion and other liabilities of $15.9 billion.
Liabilities for capital projects. $47.5 billion, a $4.8 billion increase
from March 31, 2021: $4,812 million in borrowing, $24 million in amortization of issue discounts, and the addition of $43 million in P3 project liabilities, less $83 million in repayments.
Fiscal plan borrowing. $45.6 billion, a decrease of $4.7 billion, as surplus cash enabled repayment of maturing debt. This includes $45 billion borrowed for operations and cash management purposes, and $0.6 billion in debt incurred for the financial restructuring of the pre-1992 Teachers’ Pension Plan.
Self-supporting lending activities. $17 billion, consisting of $14.4 billion in debt incurred to provide loans to local authorities and $2.6 billion in AFSC to on-lend to the agriculture sector.
Coal phase-out liabilities. $0.8 billion, $73 million lower than 2020-21, reflecting the net present value of $97 million in annual payments to be made to generators for phasing-out coal use by 2030.
Pension liabilities. $8.3 billion, a decrease of $0.4 billion.
Other liabilities. $15.9 billion. Includes liabilities of school boards, universities and colleges and the health authority, natural gas royalty and security deposits, unearned revenue, estimated corporate income tax refunds, trade payables and other liabilities of AFSC.
Capital / Non-financial Assets
$58.6 billion at March 31, 2022.
$57.3 billion in capital assets include land, land improvements, buildings, computer hardware and software, equipment, provincial highways, bridges, dams and other water management infrastructure.
Capital assets increased $1.5 billion: $4.1 billion in capital investment less $2.6 billion amortization and disposals.
Total Capital Plan spending in 2021-22 of $6.6 billion ($4.1 billion investment plus $2.5 billion in grants) was financed from a variety of sources: $1.1 billion in federal funding, donations and other
| | |
| |
| 10 | | 2021-22 Final Results | Year-End Report |
sources; $0.6 billion provided by school boards, post-secondary institutions and Alberta Health Services; $0.1 billion from cash of agencies and funds (e.g. ASHC and TIER); borrowing and contributions from public-private partnerships provided $4.8 billion.
Other non-financial assets include $904 million in inventory assets,
including personal protective equipment, and $350 million in
prepaid expenses. Inventory acquisition exceeded consumption / write-downs by $18 million, while prepaid expenses decreased by $19 million.
Spent Deferred Capital Contributions
$3.5 billion at March 31, 2022.
Spent deferred capital contributions (DCC) increased by $489 million.
This reflects the use of $0.6 billion in cash received for capital purposes that has not yet been reported in revenue (increasing DCC), less $0.2 billion previously received and spent, and now being recognized in 2021-22 revenue (decreasing DCC).
Balance Sheet
(millions of dollars)
| | | | | | | | | | | | |
| | | | | | at March 31 | | | | |
| | | 2022 | | | 2021 | | | Change from | |
| | | Actual | | | Actual | | | 2021 | |
Financial Assets | | | | | | | | | | | | |
| | | |
Alberta Heritage Savings Trust Fund accumulated operating surplus | | | 17,094 | | | | 16,389 | | | | 705 | |
| | | |
Endowment fund accumulated operating surpluses: | | | | | | | | | | | | |
| | | |
Alberta Heritage Foundation for Medical Research | | | 2,094 | | | | 1,941 | | | | 153 | |
| | | |
Alberta Heritage Science and Engineering Research | | | 1,249 | | | | 1,161 | | | | 88 | |
| | | |
Alberta Heritage Scholarship | | | 1,447 | | | | 1,360 | | | | 87 | |
| | | |
Alberta Enterprise Corporation | | | 292 | | | | 239 | | | | 53 | |
| | | |
General Revenue Fund cash pre-borrowing / reserve | | | 9,566 | | | | 7,429 | | | | 2,137 | |
| | | |
Self-supporting lending activity: | | | | | | | | | | | | |
| | | |
Loans to local authorities (including SUCH sector) | | | 14,424 | | | | 15,929 | | | | (1,505 | ) |
| | | |
Agriculture Financial Services Corporation | | | 3,967 | | | | 5,607 | | | | (1,640 | ) |
| | | |
Equity in commercial enterprises: ATB / AGLC / APMC / CUDGCo / Bal. Pool / PSIs | | | 1,766 | | | | (822 | ) | | | 2,588 | |
| | | |
Student loans | | | 3,647 | | | | 3,376 | | | | 271 | |
| | | |
Technology Innovation and Emissions Reduction Fund | | | 337 | | | | 145 | | | | 192 | |
| | | |
Other financial assets (including SUCH sector) | | | 22,243 | | | | 25,332 | | | | (3,089 | ) |
Total Financial Assets | | | 78,126 | | | | 78,086 | | | | 40 | |
Liabilities | | | | | | | | | | | | |
Taxpayer-supported debt: | | | | | | | | | | | | |
| | | |
Direct borrowing for the Capital Plan | | | 44,482 | | | | 39,646 | | | | 4,836 | |
| | | |
Alternative financing (Public-private partnerships {P3s} - Capital Plan) | | | 3,047 | | | | 3,087 | | | | (40 | ) |
| | | |
Debt issued to reduce pre-1992 TPP unfunded liability | | | 594 | | | | 594 | | | | - | |
| | | |
Direct borrowing for the Fiscal Plan | | | 45,001 | | | | 45,709 | | | | (708 | ) |
| | | |
Other debt (short-term; reserve) | | | - | | | | 4,000 | | | | (4,000 | ) |
Total taxpayer-supported debt | | | 93,124 | | | | 93,036 | | | | 88 | |
Self-supporting lending organizations / activities debt: | | | | | | | | | | | | |
To fund loans to local authorities (including SUCH sector) | | | 14,424 | | | | 15,929 | | | | (1,505 | ) |
Agriculture Financial Services Corporation | | | 2,604 | | | | 2,469 | | | | 135 | |
Total debt a | | | 110,152 | | | | 111,434 | | | | (1,282 | ) |
Coal phase-out liabilities | | | 770 | | | | 843 | | | | (73 | ) |
Pension liabilities | | | 8,271 | | | | 8,636 | | | | (365 | ) |
Other liabilities (including SUCH sector) | | | 15,899 | | | | 17,010 | | | | (1,111 | ) |
Total Liabilities | | | 135,092 | | | | 137,923 | | | | (2,831 | ) |
Net Financial Assets / (Debt) (total financial assets less total liabilities) | | | (56,966 | ) | | | (59,837 | ) | | | 2,871 | |
Capital / Other Non-financial Assets | | | 58,576 | | | | 57,110 | | | | 1,466 | |
Spent deferred capital contributions | | | (3,523 | ) | | | (3,034 | ) | | | (489 | ) |
Net Assets / (Liabilities) (net financial assets + capital assets - def. capital contributions | | | (1,913 | ) | | | (5,761 | ) | | | 3,848 | |
Change in Net Assets / (Liabilities) b | | | 3,848 | | | | (17,187 | ) | | | | |
Net debt / GDP | | | -16.2% | | | | -20.3% | | | | | |
| a | Does not include term debt of $7,590 million (2021: $6,103 million) issued on behalf of government business enterprises which is included on a net basis in financial assets (“Equity in commercial enterprises” = assets minus debt and other liabilities), nor does it include liabilities for capital leases. |
| b | Change in Net Assets differ from the surplus / (deficit) numbers due to net assets adjustments (2022: ($96) million; 2021: ($225) million; see Schedule 15, p.68 of the 2021-22 Consolidated Financial Statements). |
| | |
| |
| 2021-22 Final Results | Year-End Report | | 11 |
Economic and Tax Highlights
Economic highlights
(Calendar Year Basis)
Alberta’s economy bounced back strongly in 2021 from the downturn caused by the COVID-19 pandemic and collapse in oil prices in 2020. Real gross domestic product rose by an estimated 5.1% in 2021 with all sectors rebounding. Exports led the recovery, driven by oil production. With vaccine rollouts, the economy re-opened in the summer. By fall, the Delta-driven fourth wave required re-introduction of public health measures which hampered economic activity, though the impact was less than in previous waves as the economy adapted to the pandemic.
A strong recovery in demand and prices boosted business output and exports, particularly in the energy sector. Oil production hit a historical high, propelled by bitumen. Conventional output also improved, but more slowly as drilling activity took time to respond to higher prices. Drilling did return to 2018 levels by year-end. Robust prices and demand also lifted natural gas production. Outside energy, export gains were led by chemicals, forestry products and consumer goods, while tight crop inventories and drought conditions weighed on agricultural production and exports. Higher corporate profits and improving sentiment led to 6.8% growth
in business investment, particularly outside oil and gas extraction.
Alberta’s labour market made progress in 2021. Employment returned to pre-pandemic levels by the second half, and grew 5.1% annually. However, employment lagged in certain sectors such as tourism or where close contact was needed, as well as in the agriculture and manufacturing sectors. The unemployment rate fell steadily during 2021, averaging 8.7%, but slower recovery in labour force participation led to labour shortages.
Improved consumer confidence and household incomes boosted consumer spending. Goods spending was robust, and services were supported by easing of public health measures in the summer. Alberta’s housing market also gained momentum. While soaring commodity prices boosted activity, they added pressure to input costs already elevated due to persistent supply chain bottlenecks. These contributed to an average 3.2% inflation rate in 2021, the highest in more than a decade.
Population growth decelerated to 0.5% from 1.3% in 2020. Despite this, it picked up between July and December 2021, with positive net interprovincial migration after six years of outflows. Immigration also increased with travel restrictions lifted and the temporary to permanent resident pathway.
Tax highlights
Alberta continued to have an overall tax advantage compared to all other provinces, with no sales tax, payroll tax or health premium.
In recognition of rising costs, the collection of the provincial fuel tax on gasoline and diesel was paused starting April 1, 2022. This tax relief is to be evaluated quarterly based on the average WTI oil price.
Assistance to lessen the impact of the pandemic was continued in 2021-22, with the property tax requisition frozen at the 2019 level, and the abatement of the tourism levy extended until June 30, 2021. Hotels and other accommodation providers with a 40% decline in net revenue relative to 2019 kept tourism levy amounts collected between October 1, 2021 and March 31, 2022.
The Alberta Child and Family Benefit (ACFB) provided $288 million to Alberta families in 2021-22.
Other tax initiatives included: lowering the rate on smokeless tobacco products to 27.5 cents per gram, to align with the cigarette rate, effective March 1, 2022, in order to reduce purchases outside the province; introducing legislative amendments to require online marketplaces to collect and remit the tourism levy on behalf of their Alberta short term rental hosts, to help lower the compliance burden of the rental hosts.
| | | | | | | | | | | | | | | | | | | | | | | | | | | | | | | | | | | | | | | | | | | | |
| Key Economic Indicators, 2011 to 2021 | | | | | | | | | | | | | | | | | | | | | | | | | |
| | | | | | |
| Calendar year, % change unless otherwise noted | | | | | | | | | | | | | | | | | | | | | | | | | |
| | | | | | | | | | | |
| | | 2011 | | 2012 | | 2013 | | 2014 | | 2015 | | 2016 | | 2017 | | 2018 | | 2019 | | 2020 | | 2021 |
Nominal GDP growth a | | | 10.9 | | | | 4.3 | | | | 9.6 | | | | 10.0 | | | | (14.0 | ) | | | (6.1 | ) | | | 9.2 | | | | 4.2 | | | | 1.5 | | | | (16.1 | ) | | | 19.0 | |
| | | | | | | | | | | |
Real GDP growth | | | 6.5 | | | | 3.9 | | | | 5.7 | | | | 5.9 | | | | (3.7 | ) | | | (3.5 | ) | | | 4.5 | | | | 2.2 | | | | (0.1 | ) | | | (7.9 | ) | | | 5.1 | |
| | | | | | | | | | | |
Employment (thousands) | | | 2,095 | | | | 2,154 | | | | 2,199 | | | | 2,237 | | | | 2,246 | | | | 2,196 | | | | 2,221 | | | | 2,264 | | | | 2,279 | | | | 2,130 | | | | 2,239 | |
| | | | | | | | | | | |
Employment growth | | | 3.6 | | | | 2.8 | | | | 2.1 | | | | 1.7 | | | | 0.4 | | | | (2.3 | ) | | | 1.1 | | | | 1.9 | | | | 0.7 | | | | (6.6 | ) | | | 5.1 | |
| | | | | | | | | | | |
Unemployment rate | | | 5.5 | | | | 4.7 | | | | 4.6 | | | | 4.7 | | | | 6.1 | | | | 8.2 | | | | 7.9 | | | | 6.7 | | | | 7.0 | | | | 11.4 | | | | 8.7 | |
| | | | | | | | | | | |
Average weekly earnings ($ / week) | | | 1,034 | | | | 1,070 | | | | 1,107 | | | | 1,149 | | | | 1,145 | | | | 1,117 | | | | 1,129 | | | | 1,148 | | | | 1,164 | | | | 1,201 | | | | 1,226 | |
| | | | | | | | | | | |
Primary household income a | | | 8.5 | | | | 8.7 | | | | 6.8 | | | | 6.4 | | | | 3.3 | | | | (10.9 | ) | | | 4.1 | | | | 1.8 | | | | 2.4 | | | | (5.6 | ) | | | 6.8 | |
| | | | | | | | | | | |
Net corporate operating surplus a | | | 27.1 | | | | (11.6 | ) | | | 19.2 | | | | 23.2 | | | | (74.0 | ) | | | (22.9 | ) | | | 159.0 | | | | 17.6 | | | | 2.6 | | | | (63.4 | ) | | | 147.3 | |
| | | | | | | | | | | |
Housing starts (number of units) | | | 25,704 | | | | 33,396 | | | | 36,011 | | | | 40,590 | | | | 37,282 | | | | 24,533 | | | | 29,457 | | | | 26,085 | | | | 27,325 | | | | 23,990 | | | | 31,935 | |
| | | | | | | | | | | |
Alberta consumer price index | | | 2.4 | | | | 1.1 | | | | 1.4 | | | | 2.6 | | | | 1.1 | | | | 1.1 | | | | 1.6 | | | | 2.4 | | | | 1.8 | | | | 1.1 | | | | 3.2 | |
| | | | | | | | | | | |
Population (July 1, thousands) | | | 3,789 | | | | 3,875 | | | | 3,981 | | | | 4,084 | | | | 4,145 | | | | 4,196 | | | | 4,241 | | | | 4,298 | | | | 4,363 | | | | 4,420 | | | | 4,443 | |
| | | | | | | | | | | |
Population growth | | | 1.5 | | | | 2.3 | | | | 2.7 | | | | 2.6 | | | | 1.5 | | | | 1.2 | | | | 1.1 | | | | 1.3 | | | | 1.5 | | | | 1.3 | | | | 0.5 | |
a 2021 is an estimate as of May 30, 2022.
| | |
| |
| 12 | | 2021-22 Final Results | Year-End Report |
Historical Fiscal Summary, 2008-09 to 2021-22 a
(millions of dollars)
| | | | | | | | | | | | | | | | | | | | | | | | | | | | | | | | | | | | | | | | | | | | | | | | | | | | | | | | | | |
| | | 1 | | | 2 | | | 3 | | | 4 | | | 5 | | | 6 | | | 7 | | | 8 | | | 9 | | | 10 | | | 11 | | | 12 | | | 13 | | | 14 | |
| | | | | | | | | | | | | | | | | | | | | | | | | | | | | | | | | | | | | | | | | | | | | | | | | | | | | | | | | | |
| | | | | 2008-09 | | | 2009-10 | | | 2010-11 | | | 2011-12 | | | 2012-13 | | | 2013-14 | | | 2014-15 | | | 2015-16 | | | 2016-17 | | | 2017-18 | | | 2018-19 | | | 2019-20 | | | 2020-21 | | | 2021-22 | |
| Statement of Operations | | | | | | | | | | | | | | | | | | | | | | | | | | | | | | | | | | | | | | | | | | | | | | | | | | | | | | | Actual | |
| | Revenue | | | | | | | | | | | | | | | | | | | | | | | | | | | | | | | | | | | | | | | | | | | | | | | | | | | | | | | | |
1 | | Personal income tax | | | 8,708 | | | | 7,877 | | | | 7,631 | | | | 8,563 | | | | 9,621 | | | | 10,537 | | | | 11,042 | | | | 11,357 | | | | 10,763 | | | | 10,775 | | | | 11,874 | | | | 11,244 | | | | 11,257 | | | | 13,335 | |
2 | | Corporate income tax | | | 4,252 | | | | 4,754 | | | | 3,334 | | | | 3,678 | | | | 4,756 | | | | 5,488 | | | | 5,796 | | | | 4,195 | | | | 3,769 | | | | 3,448 | | | | 4,871 | | | | 4,107 | | | | 3,037 | | | | 4,718 | |
3 | | Other tax revenue | | | 3,817 | | | | 3,746 | | | | 3,820 | | | | 4,099 | | | | 4,333 | | | | 4,500 | | | | 4,598 | | | | 5,168 | | | | 5,649 | | | | 6,538 | | | | 6,833 | | | | 5,747 | | | | 5,285 | | | | 5,453 | |
4 | | Resource revenue | | | 11,915 | | | | 6,768 | | | | 8,428 | | | | 11,636 | | | | 7,779 | | | | 9,578 | | | | 8,948 | | | | 2,789 | | | | 3,097 | | | | 4,980 | | | | 5,429 | | | | 5,937 | | | | 3,091 | | | | 16,170 | |
5 | | Investment income | | | (1,888 | ) | | | 3,541 | | | | 2,486 | | | | 2,168 | | | | 2,595 | | | | 3,423 | | | | 3,113 | | | | 2,544 | | | | 3,698 | | | | 3,126 | | | | 2,349 | | | | 2,828 | | | | 2,643 | | | | 3,579 | |
6 | | Premiums, fees and licences | | | 3,356 | | | | 2,857 | | | | 2,922 | | | | 2,931 | | | | 3,184 | | | | 3,437 | | | | 3,564 | | | | 3,574 | | | | 3,701 | | | | 3,839 | | | | 3,911 | | | | 3,929 | | | | 4,021 | | | | 4,520 | |
7 | | Other own-source revenue | | | 4,587 | | | | 4,627 | | | | 4,903 | | | | 5,128 | | | | 5,234 | | | | 5,412 | | | | 6,438 | | | | 5,850 | | | | 3,637 | | | | 6,983 | | | | 6,292 | | | | 3,360 | | | | 3,272 | | | | 8,952 | |
8 | | Total own-source revenue | | | 34,747 | | | | 34,170 | | | | 33,524 | | | | 38,203 | | | | 37,502 | | | | 42,375 | | | | 43,499 | | | | 35,477 | | | | 34,314 | | | | 39,689 | | | | 41,559 | | | | 37,152 | | | | 32,605 | | | | 56,727 | |
9 | | Federal transfers | | | 4,578 | | | | 5,342 | | | | 5,452 | | | | 5,192 | | | | 5,042 | | | | 7,059 | | | | 5,982 | | | | 7,142 | | | | 7,979 | | | | 7,606 | | | | 8,013 | | | | 9,072 | | | | 10,532 | | | | 11,595 | |
10 | | Total Revenue | | | 39,325 | | | | 39,512 | | | | 38,976 | | | | 43,395 | | | | 42,544 | | | | 49,434 | | | | 49,481 | | | | 42,619 | | | | 42,293 | | | | 47,295 | | | | 49,572 | | | | 46,224 | | | | 43,137 | | | | 68,322 | |
| | Expense by Function | | | | | | | | | | | | | | | | | | | | | | | | | | | | | | | | | | | | | | | | | | | | | | | | | | | | | | | | |
11 | | Health | | | 13,674 | | | | 14,636 | | | | 15,393 | | | | 16,284 | | | | 17,254 | | | | 17,967 | | | | 19,366 | | | | 20,115 | | | | 20,687 | | | | 21,239 | | | | 21,921 | | | | 22,408 | | | | 23,984 | | | | 25,131 | |
12 | | Basic / advanced education | | | 10,438 | | | | 11,067 | | | | 11,362 | | | | 11,951 | | | | 12,394 | | | | 12,782 | | | | 13,103 | | | | 13,673 | | | | 14,110 | | | | 14,471 | | | | 14,848 | | | | 14,971 | | | | 14,134 | | | | 14,296 | |
13 | | Social services | | | 3,417 | | | | 3,807 | | | | 4,129 | | | | 4,278 | | | | 4,641 | | | | 4,668 | | | | 4,548 | | | | 4,752 | | | | 5,198 | | | | 5,592 | | | | 5,867 | | | | 6,203 | | | | 5,919 | | | | 5,989 | |
14 | | Other program expense | | | 10,386 | | | | 9,834 | | | | 9,443 | | | | 9,853 | | | | 10,528 | | | | 12,970 | | | | 11,031 | | | | 10,375 | | | | 12,607 | | | | 13,189 | | | | 11,866 | | | | 12,893 | | | | 13,858 | | | | 16,686 | |
15 | | Total program expense | | | 37,915 | | | | 39,344 | | | | 40,327 | | | | 42,366 | | | | 44,817 | | | | 48,387 | | | | 48,048 | | | | 48,915 | | | | 52,602 | | | | 54,491 | | | | 54,502 | | | | 56,475 | | | | 57,895 | | | | 62,102 | |
16 | | Debt servicing costs | | | 208 | | | | 214 | | | | 472 | | | | 509 | | | | 530 | | | | 601 | | | | 722 | | | | 776 | | | | 1,018 | | | | 1,420 | | | | 1,971 | | | | 2,235 | | | | 2,486 | | | | 2,641 | |
17 | | Pension provisions | | | 2,133 | | | | 430 | | | | 439 | | | | 634 | | | | 296 | | | | 748 | | | | (404 | ) | | | (630 | ) | | | (543 | ) | | | (593 | ) | | | (190 | ) | | | (334 | ) | | | (282 | ) | | | (365 | ) |
18 | | Total Expense | | | 40,256 | | | | 39,988 | | | | 41,238 | | | | 43,509 | | | | 45,643 | | | | 49,736 | | | | 48,366 | | | | 49,061 | | | | 53,077 | | | | 55,318 | | | | 56,283 | | | | 58,376 | | | | 60,099 | | | | 64,378 | |
19 | | Surplus / (Deficit) | | | (931 | ) | | | (476 | ) | | | (2,262 | ) | | | (114 | ) | | | (3,099 | ) | | | (302 | ) | | | 1,115 | | | | (6,442 | ) | | | (10,784 | ) | | | (8,023 | ) | | | (6,711 | ) | | | (12,152 | ) | | | (16,962 | ) | | | 3,944 | |
| | | | | | | | | | | | | | |
Capital Plan b | | | 7,943 | | | | 8,000 | | | | 7,544 | | | | 6,884 | | | | 6,062 | | | | 5,770 | | | | 6,181 | | | | 6,558 | | | | 6,578 | | | | 9,021 | | | | 6,057 | | | | 5,545 | | | | 6,896 | | | | 6,622 | |
| | | | | | | | | | | | | |
Statement of Financial Position (at March 31) | | | | | | | | | | | | | | | | | | | | | | | | | | | | | | | | | | | | | | | | | | | | | | | | | | | | | |
20 | | Heritage / endowment funds | | | 16,900 | | | | 17,077 | | | | 17,500 | | | | 17,936 | | | | 18,176 | | | | 18,562 | | | | 18,860 | | | | 19,262 | | | | 19,836 | | | | 20,306 | | | | 20,700 | | | | 20,670 | | | | 21,090 | | | | 22,176 | |
21 | | Contingency Account | | | 16,822 | | | | 14,983 | | | | 11,192 | | | | 7,497 | | | | 3,326 | | | | 4,658 | | | | 6,529 | | | | 3,625 | | | | 2,299 | | | | 1,661 | | | | 6,342 | | | | - | | | | - | | | | - | |
22 | | Other financial assets | | | 28,868 | | | | 30,338 | | | | 30,799 | | | | 32,972 | | | | 34,734 | | | | 40,039 | | | | 40,688 | | | | 40,990 | | | | 44,152 | | | | 49,010 | | | | 48,701 | | | | 55,711 | | | | 56,996 | | | | 55,950 | |
23 | | Taxpayer-supported Capital Plan liabilities | | | (880 | ) | | | (2,888 | ) | | | (3,199 | ) | | | (3,442 | ) | | | (4,594 | ) | | | (8,724 | ) | | | (11,922 | ) | | | (19,040 | ) | | | (23,769 | ) | | | (29,339 | ) | | | (33,597 | ) | | | (37,188 | ) | | | (42,733 | ) | | | (47,529 | ) |
24 | | Taxpayer-supported operating debt / pre-1992 TPP debt | | | (1,160 | ) | | | (2,279 | ) | | | (2,015 | ) | | | (1,676 | ) | | | (1,426 | ) | | | (1,333 | ) | | | (1,053 | ) | | | (1,024 | ) | | | (10,751 | ) | | | (19,227 | ) | | | (29,060 | ) | | | (36,954 | ) | | | (50,303 | ) | | | (45,595 | ) |
25 | | Self-supported debt | | | (7,921 | ) | | | (9,300 | ) | | | (11,010 | ) | | | (12,707 | ) | | | (14,116 | ) | | | (15,775 | ) | | | (16,592 | ) | | | (17,373 | ) | | | (17,822 | ) | | | (17,848 | ) | | | (18,134 | ) | | | (18,066 | ) | | | (18,398 | ) | | | (17,028 | ) |
26 | | Total Debt c | | | (9,961 | ) | | | (14,467 | ) | | | (16,224 | ) | | | (17,825 | ) | | | (20,136 | ) | | | (25,832 | ) | | | (29,567 | ) | | | (37,437 | ) | | | (52,342 | ) | | | (66,414 | ) | | | (80,791 | ) | | | (92,208 | ) | | | (111,434 | ) | | | (110,152 | ) |
27 | | Pension obligations | | | (10,239 | ) | | | (9,483 | ) | | | (9,922 | ) | | | (10,556 | ) | | | (10,852 | ) | | | (11,600 | ) | | | (11,196 | ) | | | (10,566 | ) | | | (10,023 | ) | | | (9,430 | ) | | | (9,240 | ) | | | (8,918 | ) | | | (8,636 | ) | | | (8,271 | ) |
28 | | Other liabilities | | | (10,689 | ) | | | (11,131 | ) | | | (11,692 | ) | | | (11,033 | ) | | | (10,793 | ) | | | (12,795 | ) | | | (12,260 | ) | | | (11,955 | ) | | | (12,823 | ) | | | (14,477 | ) | | | (13,189 | ) | | | (15,399 | ) | | | (17,853 | ) | | | (16,669 | ) |
29 | | Net Financial Assets / (Debt) | | | 31,701 | | | | 27,317 | | | | 21,653 | | | | 18,991 | | | | 14,455 | | | | 13,032 | | | | 13,054 | | | | 3,919 | | | | (8,901 | ) | | | (19,344 | ) | | | (27,477 | ) | | | (40,144 | ) | | | (59,837 | ) | | | (56,966 | ) |
30 | | Capital / non-fin. assets (less def. cap. contributions starting 2012-13) | | | 30,275 | | | | 34,217 | | | | 37,607 | | | | 40,122 | | | | 39,517 | | | | 40,839 | | | | 42,197 | | | | 44,623 | | | | 46,622 | | | | 49,015 | | | | 50,744 | | | | 51,570 | | | | 54,076 | | | | 55,053 | |
31 | | Net Assets / (Liabilities) d | | | 61,976 | | | | 61,534 | | | | 59,260 | | | | 59,113 | | | | 53,972 | | | | 53,871 | | | | 55,251 | | | | 48,542 | | | | 37,721 | | | | 29,671 | | | | 23,267 | | | | 11,426 | | | | (5,761 | ) | | | (1,913 | ) |
| | | | | | | | | | | | | |
Energy prices and exchange rate | | | | | | | | | | | | | | | | | | | | | | | | | | | | | | | | | | | | | | | | | | | | | | | | | | | | | |
32 | | Oil price (WTI US$/bbl) | | | 85.94 | | | | 70.71 | | | | 83.38 | | | | 97.33 | | | | 92.07 | | | | 99.05 | | | | 80.48 | | | | 45.00 | | | | 47.93 | | | | 53.69 | | | | 62.77 | | | | 54.85 | | | | 42.32 | | | | 77.03 | |
33 | | Heavy oil price (WCS @ Hardisty; Cdn$/bbl) | | | 74.36 | | | | 66.08 | | | | 66.70 | | | | 80.72 | | | | 68.48 | | | | 80.11 | | | | 70.78 | | | | 40.86 | | | | 44.67 | | | | 50.38 | | | | 51.65 | | | | 53.14 | | | | 41.42 | | | | 79.63 | |
34 | | Natural gas price (ARP; Cdn$/GJ) | | | 6.97 | | | | 3.58 | | | | 3.28 | | | | 2.98 | | | | 2.28 | | | | 3.28 | | | | 3.51 | | | | 2.21 | | | | 2.01 | | | | 1.82 | | | | 1.34 | | | | 1.39 | | | | 2.10 | | | | 3.48 | |
35 | | Exchange rate (US¢/Cdn$) | | | 89.6 | | | | 91.9 | | | | 98.4 | | | | 100.7 | | | | 99.9 | | | | 95.0 | | | | 88.0 | | | | 76.5 | | | | 76.2 | | | | 78.0 | | | | 76.3 | | | | 75.2 | | | | 75.7 | | | | 79.8 | |
a Numbers are not strictly comparable over time due to numerous accounting policy changes. 2019-20 expense by function have been re-classified following re-organizations and other adjustments.
b Reflects capital grants and other support included in expense, and capital investment in government-owned assets not included in expense. Capital investment adds to capital assets, which are depreciated over time through amortization expense.
Numbers for 2008-09 to 2013-14 are estimates as details required to consolidate SUCH sector capital spending with full accuracy are not readily available.
c Does not include capital lease liabilities, or debt issued on behalf of government business enterprises which is reported on a net equity basis in Other Financial Assets.
d The change in net assets / (debt) does not match the surplus / (deficit) exactly in most years, due to various balance sheet adjustments, most of which are minor. A significant adjustment reducing net assets by $2 billion was made in 2012-13, to recognize the accumulated deferred capital contribution liability when the accounting standard was adopted.
| | |
| |
| 2021-22 Final Results | Year-End Report | | 13 |
GOVERNMENT OF ALBERTA
2021-22 Final Results
Annual Infrastructure Report
| | |
| |
| 14 | | 2021-22 Final Results | Year-End Report |
Annual Infrastructure Report
With the third edition of the Annual Infrastructure Report, the province continues to inform Albertans of the important progress made on infrastructure projects around Alberta, as set out in the 2021-22 Capital Plan.
The projects underway and completed over the past fiscal year are all significant in contributing to improving the everyday lives of Albertans.
Budget 2021 supported careful and informed capital investments to aid the province’s recovery and long-term economic growth in the wake of the pandemic-induced recession that began in 2020.
The 2021-22 Capital Plan balanced both fiscal and economic recovery imperatives in an effort that allowed for the continuous support of jobs while building and diversifying the province’s economy.
In 2021-22, Capital Plan spending was $6.6 billion, with $0.8 billion in support of Alberta’s Recovery Plan. This included investment in capital maintenance and renewal projects, the continuation of strategic infrastructure projects, and economic stimulus funding for municipalities through the Strategic Transportation Infrastructure Program, the Municipal Water and Wastewater Program and the First Nations Regional Drinking Water Tie-In Program.
Over the course of 2021-22, many new and existing projects were underway to build, maintain and renew infrastructure across the province, while other projects reached completion. These projects support a range of jobs related to the planning, design, building and service delivery of this infrastructure.
This included the completion of 15 new school projects, 50 bridge construction and over 80 road rehabilitation projects, 912 housing units, as well as continued progress on 52 school projects, four post-secondary facility projects, and five new health facility projects.
The Budget 2021 Capital Plan provided funding for new projects such as the La Crete Maternity and Community
Health Centre, the Court of Appeal and cyclotron facility in Calgary, safety upgrades to the David Thompson Highway Corridor, and the Bragg Creek Flood Mitigation.
Other major projects that continue to be underway include the Calgary Cancer Centre, a new Edmonton hospital, the Peter Lougheed Centre Emergency Department upgrades, the Springbank Off-Stream Reservoir, province-wide school projects, the University of Calgary MacKimmie Complex and Professional Faculties Building Redevelopment, the Edmonton and Calgary light rail transit (LRT), Deerfoot Trail Upgrades, Highway 15 bridge and twinning, and Highway 40 bridge and twinning.
Alberta’s
Recovery Plan
Alberta’s Recovery Plan initiatives totaled $0.8 billion in 2021-22.
In 2021-22, vital work that was accelerated because of the Recovery Plan, was underway around the province to maintain and revitalize infrastructure assets. A total of $354 million was spent on capital maintenance and renewal projects that included schools, government facilities, bridge and highway rehabilitation.
Municipal Infrastructure Recovery Plan funding provided $282 million that included $9 million in grants for municipal transportation infrastructure projects, $30 million dedicated to helping Alberta communities with their water and wastewater needs and $243 million in federal funding for the Canada Community - Building Fund, formerly known as the Federal Gas Tax Fund (FGTF).
A total of $129 million was spent on strategic infrastructure projects such as the Highway 3 twinning, the Highway 201 Bow River Bridge on Stoney Trail Southeast, and the Terwillegar Expansion. These projects will all facilitate greater mobility and efficiency in Alberta’s transportation network,
improving long-term productivity and attracting investment. While most of the strategic infrastructure projects are multi-year projects, this year saw the completion of the Northern Lights Gas Co-op Gas Supply Line for Mackenzie County, with approximately 100 km of a natural gas pipeline constructed.
To further support Alberta’s economic recovery, diversification and future investment opportunities, $43 million was spent to begin critical work on modernizing irrigation district infrastructure through the province’s Agriculture Sector Strategy. As well, $26 million was spent to support COVID-19 pandemic response initiatives.
The Budget 2021 Select Ongoing and Completed Projects map on page 19 provides a listing of these strategic projects initiated as part of Alberta’s Recovery Plan, and their specific locations across Alberta.
Capital Plan
Initiatives Update
During 2021-22, progress was made on several important Capital Plan initiatives:
| • | | Infrastructure Accountability Act |
| | - | | The Infrastructure Accountability Act, which legislates increased transparency and requires rigorous prioritization criteria to be used for decision-making based on long-term strategic planning, received royal assent and came into force on December 8, 2021. |
| • | | Building Forward: Alberta’s 20-Year Strategic Capital Plan |
| | - | | In December 2021, Alberta’s government published Building Forward: Alberta’s 20–Year Strategic Capital Plan. The Plan provides transparent and strategic direction for how Alberta’s government can best meet future infrastructure needs that will provide Albertans access to the services they need and encourage competitiveness, |
| | |
| |
| 2021-22 Final Results | Year-End Report | | 15 |
| | | productivity, and long-term economic growth. |
| • | | Procurement and Project Delivery Review |
| | - | | A government-wide procurement and project delivery review was completed resulting in opportunities to increase efficiency and reduce red tape for vendors bidding on public procurements. The recommended opportunities are currently being analyzed for broader government implementation. Outcomes from this internal review will demonstrate the best use of funds for project delivery and procurement. |
| • | | Acquisition, Surplus and Disposal Policy from Asset Management Inventory Review |
| | - | | The Ministry of Infrastructure implemented a new Acquisition, Surplus and Disposal policy on April 1, 2022 to manage the disposal and acquisition of government property on behalf of all ministries, with an exception being that Transportation may acquire properties for highway, road and water projects. This will help achieve corresponding cost efficiencies, revenue generation and red tape reduction commitments, while increasing the ability for government to dispose of surplus assets to assist offsetting costs of new investments or generating revenue to reduce borrowing needs. |
| • | | Investing in Canada Infrastructure Program (ICIP) |
| | - | | Since the signing of the Integrated Bilateral Agreement between Alberta and the federal government in 2018, there has been $3.2 billion approved through ICIP for 200 projects. In 2021-22, a total of 15 projects that received funding through ICIP were completed. |
Budget 2021 Capital Plan Analysis
Budget 2021 Grant and
Investment Spending
The Capital Plan includes:
| • | | Capital Investment – cash spent on acquisition of Government of Alberta capital assets, including hospitals, schools, and provincial highways. These transactions are recorded as Capital Assets on the province’s Balance Sheet. |
| • | | Capital Grants – cash provided to entities outside of the government for the development of their capital assets, including municipalities and partners in carbon capture and storage projects. Examples include the Municipal Sustainability Initiative, Strategic Transportation Infrastructure Program, and the Water and Wastewater Programs. These transactions are recorded as a Capital Grant expense in the government’s Income Statement. |
In 2021-22, Capital Plan spending totalled $6.6 billion, with $4.1 billion in capital investment and $2.5 billion in capital grants.
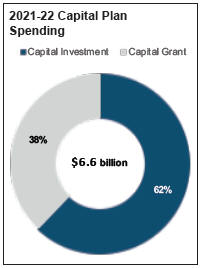
Status of Capital Investment Projects over $5 million as of March 31, 2022
The pie graph below illustrates the status of capital investment projects (excluding capital maintenance and renewal projects) that have a Total Capital Plan Funding of $5 million and above.
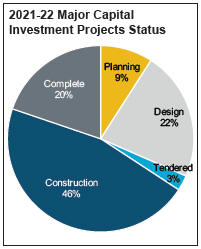
| | |
| |
| 16 | | 2021-22 Final Results | Year-End Report |
Capital Plan
(millions of dollars)
| | | | | | | | | | | | | | | | |
| | | | | | | | | | Change from |
| | | | |
| | | 2021-22 | | | 2020-21 | | | | 2020-21 |
| BY MINISTRY | | Budget | | | Actual | | Actual | | Budget | | Actual |
Advanced Education | | | 653 | | | | 583 | | | | 484 | | | (70) | | 99 |
Agriculture, Forestry and Rural Economic Development | | | 104 | | | | 109 | | | | 40 | | | 5 | | 69 |
Community and Social Services | | | 1 | | | | - | | | | - | | | (1) | | - |
Culture and Status of Women | | | 47 | | | | 35 | | | | 40 | | | (12) | | (5) |
Education | | | 1,008 | | | | 759 | | | | 782 | | | (249) | | (23) |
Energy | | | 75 | | | | 56 | | | | 140 | | | (19) | | (84) |
Environment and Parks | | | 176 | | | | 95 | | | | 130 | | | (81) | | (35) |
Health | | | 1,266 | | | | 927 | | | | 1,111 | | | (339) | | (184) |
Indigenous Relations | | | 37 | | | | 26 | | | | 9 | | | (11) | | 17 |
Infrastructure | | | 468 | | | | 221 | | | | 164 | | | (247) | | 57 |
Jobs, Economy and Innovation | | | 13 | | | | 4 | | | | 6 | | | (9) | | (2) |
Justice and Solicitor General | | | 18 | | | | 16 | | | | 18 | | | (2) | | (2) |
Labour and Immigration | | | 1 | | | | - | | | | - | | | (1) | | - |
Municipal Affairs | | | 1,501 | | | | 1,708 | | | | 1,730 | | | 207 | | (22) |
Seniors and Housing | | | 141 | | | | 138 | | | | 187 | | | (3) | | (49) |
Service Alberta | | | 97 | | | | 73 | | | | 61 | | | (24) | | 12 |
Transportation | | | 2,486 | | | | 1,855 | | | | 1,979 | | | (631) | | (124) |
Treasury Board and Finance | | | 19 | | | | 14 | | | | 15 | | | (5) | | (1) |
Legislative Assembly | | | 3 | | | | 3 | | | | - | | | - | | 3 |
| | | | | |
Total Capital Plan - Fully Consolidated Basis | | | 8,114 | | | | 6,622 | | | | 6,896 | | | (1,492) | | (274) |
2021-22 Budget to Actual Comparison
Actual Capital Plan spending was $6.6 billion in 2021-22, $0.3 billion lower than 2020-21.
| • | | Capital spending for 2021-22 was $1.5 billion lower than the Budget. |
| | - | | $259 million related to school facilities projects due to changes in cash flow requirements for various school capital projects. |
| | - | | $252 million of underspending in Edmonton and Calgary LRT federal Investing in Canada Infrastructure Program (ICIP) and provincial funding due to slower than anticipated progress. |
| | - | | $249 million for various other projects and program to re-align cash flows with project progress and timelines primarily on government accommodations, government facilities and IT infrastructure. |
| | - | | $239 million related to roads and bridge projects such as Highway Twinning, Widening and Expansion, Edmonton and Calgary Ring Roads, and Deerfoot Trail Upgrade project due to slower than anticipated progress. |
| | - | | $211 million due to lower than anticipated progress for Schools, University, Colleges, and Hospitals (SUCH) Sector self-financed investment, $86 million for Alberta Health Services, $71 million in post-secondary institutions, and $47 million in School Board funded projects. |
| | - | | $208 million related to health facilities due to supply chain issues, re-prioritization for new COVID-19 projects and increased clinical COVID-19 activity. |
| | - | | $188 million for various other ICIP projects to re-align cash flows with project progress and timelines. |
| | - | | $152 million related to CMR projects for schools, post-secondary institutions, government facilities, roads and bridges, and seniors and housing facilities due to supply chain challenges and facility accessibility. |
| | - | | $77 million related to water management infrastructure due to slower than anticipated progress. |
| • | | The decrease was partially offset by increases from budget in several areas. |
| | - | | $243 million added for one-time top-up grant funding from the Community-Building Fund (CCBF). |
| | - | | $100 million increase for Springbank Off-Stream Reservoir (SR1) for land acquisition and faster than anticipated progress. |
Overall, the 2021-22 Capital Plan envelope spending comprised of:
| • | | $2.2 billion in Municipal Infrastructure Support: |
| | - | | $1.2 billion in municipal Capital Grants were provided in support of municipal development through the Municipal Sustainability Initiative (MSI). |
| | - | | $497 million from the federally funded Canada Community- Building Fund (CCBF) including $243 million in one-time stimulus. |
| | - | | $232 million for Federal and Provincial LRT funding. |
| | - | | $121 million in other grants including Investing in Canada Infrastructure Program projects, Public Transit Infrastructure Fund, |
| | |
| |
| 2021-22 Final Results | Year-End Report | | 17 |
| | | Clean Water Wastewater Fund, and Aboriginal Business Investment Fund. |
| | - | | $61 million for water supply, treatment, wastewater treatment and disposal systems. |
| | - | | $26 million in GreenTRIP grants for transit and $34 million for the Strategic Transportation Infrastructure Program. |
| • | | $1.2 billion for Capital Maintenance and Renewal: |
| | - | | $522 million for bridge and highway rehabilitation; |
| | - | | $175 million for school facilities; |
| | - | | $155 million for parks, government facilities preservation, and information technology; |
| | - | | $151 million for post-secondary institutions; |
| | - | | $86 million for health facilities; and |
| | - | | $60 million for family, social support, and housing. |
| • | | $0.6 billion for Protecting Quality Health Care: |
| | - | | Continued work on projects in Fort McMurray, La Crete, Lloydminster, Red Deer, Edmonton and Calgary. |
| | - | | Continued planning for the Edmonton hospital and construction on the Calgary Cancer Centre. |
| • | | $0.7 billion for Roads and Bridges: |
| | - | | $415 million for Calgary’s Ring Road and Edmonton’s Ring Road, with the Calgary Ring Road southwest portion about 95 per cent complete. |
| | - | | $251 million for highway twinning, widening and expansion projects including Deerfoot Trail upgrades, Terwillegar Expansion, and Twinning project including Highway 3, 19, 40 and Peace River Bridge. |
| | - | | $20 million for P3 Ring Road Rehabilitation. |
| • | | $0.5 billion for Renewing Educational Infrastructure: |
| | - | | $0.5 billion in school construction projects for various ongoing projects with 52 school projects currently underway, and 15 completed in 2021-22. |
| • | | $0.6 billion in SUCH sector self-financed projects: |
| | - | | $346 million in projects self-funded by post-secondary institutions. |
| | - | | $219 million in Health facilities. |
| | - | | $61 million in school board funded projects. |
| | - | | $9 million in donated capital assets. |
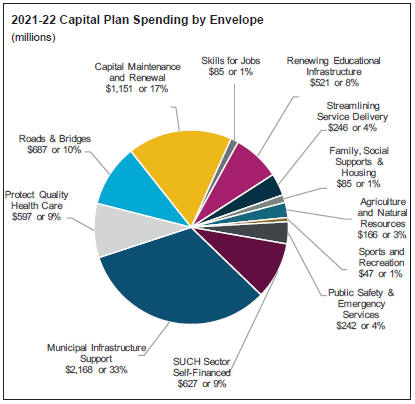
| • | | $0.9 billion for Agriculture and Natural Resources, Family, Social Supports and Housing, Public Safety and Emergency Services, Skills for Jobs, Sports and Recreation and Streamlining Service Delivery. |
| | |
| |
| 18 | | 2021-22 Final Results | Year-End Report |
2021-22 Select Ongoing and Completed Projects
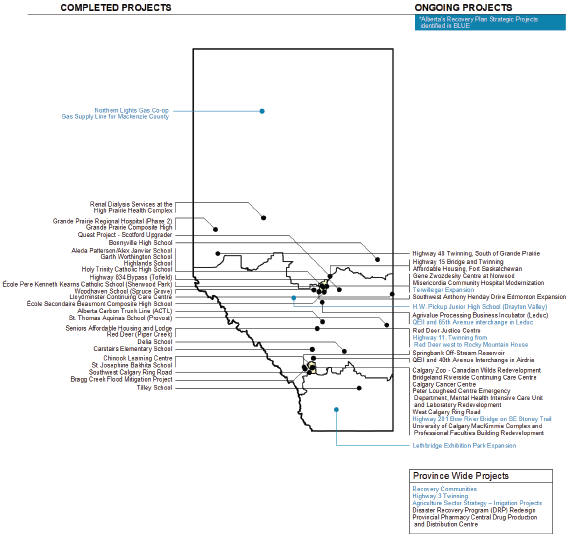
| | |
| |
| 2021-22 Final Results | Year-End Report | | 19 |
Year-end Highlights
This section highlights the total projects completed and underway by category which also includes the total assets existing and in operation in the province as of March 31, 2022.
| | | | | | |
 | | 16 health facility projects in progress | |  | | 912 housing units completed |
| | 5 new health facility projects, and 11 previously approved health facility projects which include continued renovations, modernizations, expansions and/or redevelopment. | | 523 housing units under construction ~57,000 existing affordable housing units |
| | 8 health facilities capital programs in progress | | | | |
| | for previously approved health facility capital programs with ongoing implementation. | |  | | 52 school projects underway 15 school projects completed |
| | 6 health facilities projects and capital programs completed 2 health facility projects and 4 health facilities capital programs. 900+ existing owned or leased buildings including health facilities, continuing care, community care facilities where health services are provided. | | 5,000+ new and 5,900+ modernized student spaces 2,000+ existing school buildings 5,900+ existing modular classrooms |
| | | |

| | ~50 bridge construction and over 80 road rehabilitation projects completed | |  | | 1 courthouse renovation completed |
| | | | | | 5 courthouse projects |
| | 4 roads and bridges | | | | currently underway |
| | expansion projects completed | | | | |
| | | | | | 72 existing |
| | 64,000 km existing | | | | courthouses |
| | highway lanes | | | | |
| | | | | | 10 existing |
| | ~4,600 existing | | | | correctional facilities |
| | bridge structures | | | | |
| | | | | | |
| | |
| |
| 20 | | 2021-22 Final Results | Year-End Report |
Select Ongoing and Completed Projects - Status as of March 31, 2022
Planning and Design
Total Capital Plan Funding and Expected Completion in planning and design are estimates and subject to change upon finalizing project scope.
Court of Appeal, Calgary
Total Capital Plan Funding:
$104 million
Expected Completion: TBD
| • | | This project will bring all court levels in this province together as part of the Calgary Courts Centre in downtown Calgary. |
Edmonton Hospital
Committed as of Budget 2021:
$393 million
Expected Completion: TBD
| • | | Construction of a new hospital in southwest Edmonton. |
La Crete Maternity and Community Health Centre
Total Capital Plan Funding:
$79 million
Expected Completion: TBD
| • | | This project will develop a purpose-built facility that fully integrates ambulatory care, primary care, maternal care and diagnostic services. |
Red Deer Regional Hospital
Total Capital Plan Funding: $1.8 billion Expected Completion: TBD
| • | | The project will expand inpatient capacity, adding surgical suites, a cardiac catheterization laboratory, new medical device reprocessing space, additional ambulatory care capacity, and increases to many other clinical programs throughout the hospital. |
Highway 3 Twinning, Phased Approach, Initial Section Taber to Burdett
Total Capital Plan Funding:
$150 million
Expected Completion: Fall 2025
| • | | Twinning this major economic corridor will support increased traffic as a result of new economic activity from the agriculture/agri-business sector and developments in southeastern Alberta. |
Highway 2 Deerfoot Trail Upgrade
Total Capital Plan Funding: $210 million Expected Completion: Fall 2026
| • | | A combination of upgrades to Highway 2 Deerfoot Trail. |
Big Island Provincial Park Planning
Total Capital Plan Funding: $10 million Expected Completion: Spring 2023
| • | | This project will determine the condition and appropriate future use of the Big Island Provincial Park. |
Bow Reservoir Options Project
Total Capital Plan Funding: $15 million Expected Completion: Spring 2023
| • | | A four phase project to assess the feasibility of a multi-use dam on the Bow River upstream from Calgary. |
Alberta Surgical Initiative Capital Program
Total Capital Plan Funding: $167 million Expected Completion: Fall 2026
| • | | This program will increase provincial surgical capacity to reduce wait times by renovating, improving and expanding operating rooms and support spaces. |
Recovery Communities
Total Capital Plan Funding: $56 million Expected Completion: TBD
| • | | This program will establish multiple recovery communities for addictions treatment across Alberta. |
Construction in Progress
Agriculture Sector Strategy
– Irrigation Projects
Total Capital Plan Funding: $280 million Expected Completion: Spring 2028
| • | | This project will modernize irrigation district infrastructure and increase water storage capacity to improve water use efficiency and support irrigation expansion. The Alberta government, Canada Infrastructure Bank, and a consortium of ten irrigation districts are together investing almost $933 million in this project. |
Lethbridge Exhibition
Park Expansion
Total Capital Plan Funding: $28 million Expected Completion: Winter 2023
| • | | This grant supports construction of a 268,000 square foot Agri-food Hub and Trade Centre. |
| | |
The province has committed a combined $3 billion for LRT projects in Edmonton and Calgary: |
| |
 | | Edmonton - $1.47 billion for the Metro Line LRT Extension, West Valley Line LRT, and Capital Line South LRT Extension. |
| | Calgary - $1.53 billion for the Green Line LRT. |
| | |
| |
| 2021-22 Final Results | Year-End Report | | 21 |
Disaster Recovery Program (DRP) Redesign
Total Capital Plan Funding: $10 million
Expected Completion: Spring 2023
| • | | A DRP information system is required to conduct core disaster recovery programs for business handling, processing and controlling compensation for victims of declared disasters in Alberta. |
Calgary Zoo - Canadian Wilds Redevelopment
Total Capital Plan Funding: $16 million Expected Completion: Winter 2023
| • | | This project incorporates major upgrades and expansion of the river otter habitat and new habitats for the polar bear and related arctic species. |
Affordable Housing,
Fort Saskatchewan
Total Capital Plan Funding: $6 million Expected Completion: Summer 2022
| • | | Construction of a 78-unit apartment building to meet the needs of specialized clients with low incomes. |
Gene Zwozdesky Centre at Norwood
Total Capital Plan Funding: $385 million Expected Completion: Winter 2023
| • | | The project will accommodate 350 enhanced long-term care beds. |
Calgary Cancer Centre
Total Capital Plan Funding: $1.4 billion Expected Completion: 2023
| • | | Construction of a new facility to accommodate comprehensive cancer care services for southern Alberta. |
Red Deer Justice Centre
Total Capital Plan Funding: $207 million Expected Completion: 2023
| • | | The project will address space shortages in the community and ensure vital justice services are delivered effectively to residents of central Alberta. |
Agrivalue Processing Business Incubator (Leduc)
Total Capital Plan Funding: $28 million Expected Completion: Spring 2023
| • | | The facility is being expanded with additional incubator suites to support the establishment and growth of new food companies, products and business ventures in Alberta. |
QEII and 40th Avenue Interchange in Airdrie
Total Capital Plan Funding: $83 million Expected Completion: Fall 2023
| • | | This project will improve traffic flow onto the QEII at 40 Avenue and support ongoing and future residential and commercial development. |
Highway 15 Bridge and Twinning
Total Capital Plan Funding: $108 million Expected Completion: Fall 2022
| • | | Twinning of the North Saskatchewan River Bridge on Highway 15 and into Fort Saskatchewan. |
Southwest Anthony Henday Drive Edmonton Expansion
Total Capital Plan Funding: $100 million Expected Completion: Fall 2022
| • | | Construction on widening 18 kilometres of Southwest Anthony Henday Drive from four to six lanes began in November 2019. |
West Calgary Ring Road
Total Capital Plan Funding: $1.2 billion Expected Completion: Fall 2024
| • | | The Calgary Ring Road will provide 101 kilometres of free flow traffic around the Calgary region. |
Springbank Off-Stream Reservoir
Total Capital Plan Funding: $744 million Expected Completion: Fall 2025
| • | | This project will provide flood protection along the Elbow River in Calgary and other downstream communities as part of an overall flood mitigation system. |
Misericordia Community Hospital Modernization Program
Total Capital Plan Funding: $85 million Expected Completion: Winter 2022
| • | | Design and construction of a new emergency department that will accommodate current and future patient volume needs. |
Provincial Pharmacy Central Drug Production and Distribution Centre
Total Capital Plan Funding: $63 million Expected Completion: TBD
| • | | This project will consolidate and centralize drug production and distribution activities in Edmonton. |
Peter Lougheed Centre
Emergency Department, Mental Health Intensive Care Unit and Laboratory Redevelopment
Total Capital Plan Funding: $137 million Expected Completion: Fall 2025
| • | | This project includes renovations for the existing Emergency Department and fit out of east tower shelled space for additional emergency space, mental health ICU and lab redevelopment. |
| | |
| |
| 22 | | 2021-22 Final Results | Year-End Report |
Bridgeland Riverside Continuing Care Centre
Total Capital Plan Funding: $131 million Expected Completion: Winter 2023
| • | | The project will provide an additional 198 private room long-term care beds for Calgary to accommodate patients with complex health needs. |
University of Calgary MacKimmie Complex and Professional Faculties Building Redevelopment
Total Capital Plan Funding: $262 million Expected Completion: Fall 2022
| • | | The MacKimmie Complex project will renew the building’s vacated space and increase student capacity. |
Completed Projects
*Projects are defined as completed when they are operational, however, they may continue to be supported by the Capital Plan budget due to close out costs.
Northern Lights Gas Co-op - Gas Supply Line for Mackenzie County
Total Capital Plan Funding: $16 million
| • | | Construction of approximately 100 kilometres of a natural gas supply line from a pipeline northeast of Peace River north to Mackenzie County. |
Grande Prairie Regional Hospital (Phase 2)
Total Capital Plan Funding: $850 million (Phases 1 and 2)
| • | | A new full service acute care hospital with a cancer clinic. |
| • | | There is also an additional $20 million from the Alberta Surgical Initiative Capital Program (Page 21). |
Alberta Carbon Trunk Line (ACTL)
Total Capital Plan Funding: $495 million
| • | | The ACTL is a 240 km pipeline that transports CO2 from a fertilizer plant and an oil sands bitumen refinery in Alberta’s Industrial Heartland to producing oil fields in Central Alberta. |
Quest Project - Scotford Upgrader
Total Capital Plan Funding: $745 million
| • | | This upgrader project captures and stores carbon dioxide in a deep geological formation from Shell’s Scotford oil sands upgrader and expansion near Fort Saskatchewan. |
Seniors Affordable Housing and Lodge, Red Deer (Piper Creek)
Total Capital Plan Funding: $28 million
| • | | Construction of a 90-unit seniors building. |
Renal Dialysis Services at the High Prairie Health Complex
Total Capital Plan Funding: $5.2 million
| • | | Introduction of renal dialysis services to the community with six stations. |
Lloydminster Continuing Care Centre
Total Capital Plan Funding: $34 million
| • | | Phase two of this facility project included minor renovations to replace some support service areas and the demolition of the existing Dr. Cooke facility. |
Highway 834 Bypass (Tofield)
Total Capital Plan Funding: $20 million
| • | | The Tofield Bypass on Highway 834, a high load corridor that sees over 900 over-sized loads a year, will reduce congestion and delays, and safely separate industrial and other large vehicle traffic from local residents. |
Southwest Calgary Ring Road
Total Capital Plan Funding: $2.2 billion
| • | | This 31-kilometre Ring Road connects Highway 8 to Macleod Trail SE and makes up about 20 per cent of the entire Calgary Ring Road. |
Bragg Creek Flood
Mitigation Project
Total Capital Plan Funding: $9.1 million
| • | | The project will help protect the Hamlet of Bragg Creek from a flood event through the construction of berms and replacement of an undersized bridge adjacent to the Elbow River. |
Schools
The following 15 school projects were completed in 2021-22 with total capital plan funding of $347 million:
| • | | Aleda Patterson School, Alex Janvier School (Edmonton) |
| • | | Carstairs Elementary School |
| • | | Chinook Learning Centre (Planning Only) (Calgary) |
| • | | École Père Kenneth Kearns Catholic School (Sherwood Park) |
| • | | École Secondaire Beaumont Composite High School (Beaumont) |
| • | | Garth Worthington School (Edmonton) |
| • | | Grande Prairie Composite High |
| • | | Highlands School (Edmonton) |
| • | | Holy Trinity Catholic High School (Edmonton) |
| • | | St. Josephine Bakhita School (Evanston Elementary School) (Calgary) |
| • | | St. Thomas Aquinas School (Provost) |
| • | | Woodhaven School (Spruce Grove) |
| | |
| |
| 2021-22 Final Results | Year-End Report | | 23 |