Exhibit 99.6
GOVERNMENT OF ALBERTA
2023-24 Mid-year
Fiscal Update and
Economic Statement
NOVEMBER 2023 |
Table of Contents
2023-24 Mid-year Fiscal Plan Highlights | 3 | |||
Revenue Highlights | 4 | |||
Expense Highlights | 6 | |||
Assets and Liabilities | 7 | |||
Fiscal Framework | 9 | |||
Capital Plan | 10 | |||
Economic Update | 11 | |||
Fiscal Update Tables | 21 | |||
Reporting Methodology and Legislative Compliance | 35 |
Note on restatements and accounting policy changes:
• | 2022-23 Actual and 2023-24 Budget numbers have been restated to reflect the revised government structure under the Government Organization Act (Order in Council 157/2023, June 9, 2023 and Order in Council 167/2023, July 10, 2023). |
• | 2022-23 Actual numbers for Infrastructure have been restated on the Budget 2023 basis with an increase of $11 million in operating expense and a decrease of $11 million in capital grants. |
• | Effective April 1, 2022, the government adopted the Asset Retirement Obligations (ARO) standard. The ARO standard provides guidance on accounting for and reporting on liabilities related to the retirement of capital assets. Some types of assets need decommissioning and remediation work and therefore resources to be available for this work. The standard requires recognition of the future outlay when the asset is added, and then recalibration annually as the asset is used and moves closer to disposal. To adopt this standard, the government used the modified retroactive approach, with restatement of prior-year comparatives. As a result, the 2023-24 budget numbers are restated to reflect the 2022-23 impact of $2 billion increase in net debt, $692 million increase to tangible capital assets and $29 million increase in amortization expense for a total adjustment of $1.3 billion to net liabilities. |
• | Effective April 1, 2022, the government adopted the Financial Instruments standard and corresponding standards relating to Foreign Currency Translation, Financial Statement Presentation and Portfolio Investments. These standards provide guidance on recognition, measurement and reporting of financial assets and liabilities, including derivatives, foreign currency translation, remeasurement gains and losses and risk disclosures. As a result of these standards, derivatives, publicly traded equities as well as portfolio investments that are managed on a fair value basis are recognized at fair market value instead of amortized book value, and foreign currency debt is recognized at current exchange rates rather than locked-in hedge rates. The government used prospective application to adopt these standards. As a result, the presentation on the balance sheet has been revised to show net-assets / liabilities - statement of operations and accumulated remeasurement gains. |
Note: Amounts presented in tables may not add to totals due to rounding.
Treasury Board and Finance, Government of Alberta
2023–24 Mid-year Fiscal Update and Economic Statement, November 2023
Additional copies of this report may be obtained by visiting our website at: www.alberta.ca/budget-documents.aspx
2 | 2023-24 Mid-year Fiscal Update and Economic Statement |
2023-24 Mid-year Fiscal Plan Highlights
The Alberta government’s fiscal situation has improved in the near term since Budget 2023. In 2022-23, energy prices surged resulting in record high revenue for Alberta. At the same time, the global economy continued to be hit with severe inflation and interest rate hikes. The budget forecast was based on many of these issues easing in 2023 and 2024, with energy prices trending down and financial markets recovering. While the economic outlook for Alberta remains strong, bolstered by population growth, uncertainty about global economic conditions remain a risk to the forecast.
The 2023-24 surplus is now forecast to be $5.5 billion, up $3.2 billion from Budget 2023. Surpluses of $2.1 billion in 2024-25 and $2.8 billion in 2025-26 are forecast, $0.1 billion and $1.4 billion more than the estimated in Budget 2023.
The revenue forecast has improved in all three years. Revenue in 2023-24 is forecast at $74.3 billion, $3.7 billion higher than budget, mainly from non-renewable resource revenue and income tax revenue. Revenue is $1.4 billion and $2.3 billion more than
the budget estimates for 2024-25 and 2025-26 respectively. The West Texas Intermediate oil price is expected to average $79.00/bbl in 2023-24. Oil prices are expected to soften over the three-year forecast but remain supportive of activity in the province.
Total expense has increased by $0.5 billion from Budget 2023, with another $1.4 billion of increases offset by the contingency. Significant expense increases include $1.2 billion in disaster /emergency assistance costs mainly due to the unprecedented wildfire season and AgriRecovery support to livestock producers facing extraordinary costs due to dry conditions, enrolment growth in Education, additional health spending mainly as a result of the bi-lateral agreement with the federal government and debt servicing costs. Total expense increases $1.3 billion in 2024-25 and $0.9 billion in 2025-26 relative to Budget 2023.
Capital Plan spending in 2023-24 has decreased from budget mainly reflecting re-profiling of cash flows to future years
to align with project progress. As a result, the Capital Plan has increased by $0.3 billion in 2024-25 and by $0.2 billion in 2025-26 relative to Budget 2023 primarily for recovery communities and the Calgary Rivers District and Event Centre.
Taxpayer-supported debt is estimated at $76.1 billion on March 31, 2024. This is $1.7 billion less than the restated Budget 2023 forecast. For 2023-24, net debt to GDP is estimated at 9%.
In Budget 2023, the government introduced a new fiscal framework to guide decision-making to help manage Alberta’s unique revenue and economic volatility. The framework requires balanced budgets, limits expense increases and sets out the policies for the allocation of surplus cash to debt repayment and the Alberta Fund. Planned debt repayment of $3.2 billion and $0.5 billion is forecast in 2023-24 and 2024-25 respectively, while the Alberta Fund is forecast to grow to $2 billion by the end of 2024-25.
Consolidated Fiscal Summary
| (millions of dollars)
| 2022-23 | 2023-24 | Change fr. | 2024-25 | 2025-26 | ||||||||||||||||||||||
Statement of Operations | Actual | Budget | Forecast | Budget | Target | Target | ||||||||||||||||||||||
1 | Total Revenue | 76,120 | 70,653 | 74,305 | 3,652 | 73,157 | 74,956 | |||||||||||||||||||||
Expense | ||||||||||||||||||||||||||||
2 | Operating expense | 54,737 | 57,038 | 57,357 | 319 | 58,581 | 59,573 | |||||||||||||||||||||
3 | % change from prior year | 17.3 | 4.2 | 4.8 | - | 2.1 | 1.7 | |||||||||||||||||||||
4 | Capital grants | 1,525 | 2,821 | 2,841 | 20 | 3,563 | 3,508 | |||||||||||||||||||||
5 | Amortization / inventory consumption / loss on disposals | 4,090 | 4,418 | 4,418 | - | 4,481 | 4,531 | |||||||||||||||||||||
6 | Debt servicing costs | 2,829 | 2,848 | 3,157 | 309 | 3,253 | 3,398 | |||||||||||||||||||||
7 | Pension provisions | (21 | ) | (322 | ) | (341 | ) | (19 | ) | (358 | ) | (370 | ) | |||||||||||||||
8 | Disaster and emergency assistance | 1,319 | - | 1,229 | 1,229 | - | - | |||||||||||||||||||||
9 | Expense before contingency | 64,479 | 66,803 | 68,661 | 1,858 | 69,520 | 70,640 | |||||||||||||||||||||
10 | Contingency (forecast un-allocated) | - | 1,500 | 123 | (1,377 | ) | 1,500 | 1,500 | ||||||||||||||||||||
11 | Total Expense | 64,479 | 68,303 | 68,784 | 481 | 71,020 | 72,140 | |||||||||||||||||||||
12 | Surplus / Deficit | 11,641 | 2,350 | 5,521 | 3,171 | 2,137 | 2,816 | |||||||||||||||||||||
Capital Plan | ||||||||||||||||||||||||||||
13 | Capital grants | 1,525 | 2,821 | 2,841 | 20 | 3,563 | 3,508 | |||||||||||||||||||||
14 | Capital investment | 4,108 | 5,184 | 4,903 | (281 | ) | 4,690 | 3,695 | ||||||||||||||||||||
15 | Total Capital Plan | 5,633 | 8,005 | 7,744 | (261 | ) | 8,253 | 7,203 |
2023-24 Mid-year Fiscal Update and Economic Statement | 3 |
Revenue Highlights
Total Revenue
Total revenue is forecast at $74.3 billion in 2023-24, $3.7 billion higher than Budget 2023, and $3.2 billion more than the first quarter forecast. Revenue is forecast to increase to $75.0 billion by 2025-26. Relative to Budget 2023, total revenue is $1.4 billion more in 2024-25 and $2.3 billion more in 2025-26.
In 2022, the economy posted strong growth and energy prices soared due to the Russia-Ukraine war. At the same time, inflation climbed and central banks raised interest rates in response which weakened global economic prospects. Budget 2023 was based on many of these issues gradually easing during 2023 and 2024, with energy prices trending down, financial markets recovering and inflation beginning to cool.
Alberta’s economy continues to be resilient. Alberta’s real GDP growth is forecast at 2.8% this year, before slowing to 2.6% in 2024 as higher interest rates continue to weigh on consumer spending. Despite the drop in the near term, prospects remain positive over the medium term, with an average real GDP growth of 2.8% over the next three years to 2026.
Non-Renewable Resource Revenue
Non-renewable resource revenue (NRR) is projected to be $19.7 billion in 2023-24, a $1.3 billion increase from Budget 2023, due to higher bitumen royalties, but $5.6 billion lower than in 2022-23, due to lower oil prices. NRR is anticipated to decrease for the remainder of the forecast period, reaching $17.4 billion in 2025-26 as oil prices continue to soften. Bitumen royalties make up about 70% of resource revenue.
The West Texas Intermediate (WTI) oil price is now estimated to average US$79.00 per barrel(/bbl) for 2023-24, in with Budget 2023. WTI has rebounded from low levels observed in the first quarter of 2023-24, primarily due to a tighter supply/demand balance and the emergence of geopolitical events posing supply risks. WTI is forecast to drop to $76.00/bbl in 2024-25 and then to $73.50/bbl in 2025-26, in line with the Budget 2023 estimates.
Bitumen royalties in 2023-24 are forecast to be $14.4 billion, surpassing Budget 2023 by $1.8 billion. This is primarily due to the rebound in WTI prices, driven by a tight supply-demand balance, along with a narrower light-heavy differential, a weaker Canadian dollar, and three additional oil sands projects achieving payout in 2023, which is one more than predicted in
Budget 2023. In contrast, year-over-year bitumen royalties in 2023-24 are expected to decline by approximately $2.5 billion compared to 2022-23, due to the US$10.39 per barrel decrease in WTI from last year. With prices moderating, bitumen royalties are expected to continue their downward adjustment, reaching about $12.5 billion in 2025-26.
Despite a recent seasonal widening, the light-heavy oil price differential is expected to be around US$17/bbl per barrel for 2023-24, $2.5/bbl narrower than budget. Greater-than-normal seasonal maintenance by oil sands facilities in the spring resulting in reduced supply, together with stronger U.S. refinery and global demand for heavier crudes over the summer months, helped narrow the differential through the summer. Despite a recent seasonal widening, the light-heavy differential is expected to narrow further to around $15/bbl in 2024-25 when TMX is expected to come online, providing additional pipeline egress for Alberta crude oil.
Conventional oil royalties are forecast at $3.1 billion for 2023-24, $0.2 billion higher than in Budget 2023. This increase is attributed to higher WTI prices, a narrower light-heavy differential, and a lower exchange rate. Conventional oil royalties have declined $0.9 billion from 2022-23, primarily
Revenue
(millions of dollars) | 2022-23 | 2023-24 | Change fr. | 2024-25 | 2025-26 | |||||||||||||||||||
Actual | Budget | Forecast | Budget | Target | Target | |||||||||||||||||||
Personal income tax | 13,925 | 14,069 | 15,014 | 945 | 15,405 | 16,483 | ||||||||||||||||||
Corporate income tax | 8,167 | 5,911 | 6,800 | 889 | 6,894 | 7,103 | ||||||||||||||||||
Education property tax | 2,537 | 2,504 | 2,504 | - | 2,604 | 2,703 | ||||||||||||||||||
Other taxes | 1,895 | 2,508 | 1,980 | (528 | ) | 3,194 | 3,297 | |||||||||||||||||
Bitumen royalty | 16,879 | 12,555 | 14,364 | 1,809 | 12,620 | 12,469 | ||||||||||||||||||
Other non-renewable resource revenue | 8,363 | 5,806 | 5,303 | (503 | ) | 4,933 | 4,914 | |||||||||||||||||
Transfers from Government of Canada | 11,363 | 12,552 | 12,738 | 186 | 12,731 | 13,220 | ||||||||||||||||||
Heritage / endowment funds | 7 | 1,578 | 2,033 | 455 | 1,356 | 1,922 | ||||||||||||||||||
Other investment income | 1,319 | 1,576 | 1,822 | 246 | 2,049 | 1,583 | ||||||||||||||||||
Net income from Government Business Enterprises | 2,481 | 2,727 | 2,472 | (255 | ) | 2,161 | 2,274 | |||||||||||||||||
Premiums, fees and licences | 4,657 | 5,040 | 5,049 | 9 | 5,277 | 5,352 | ||||||||||||||||||
Other | 4,527 | 3,827 | 4,226 | 399 | 3,933 | 3,636 | ||||||||||||||||||
Total Revenue | 76,120 | 70,653 | 74,305 | 3,652 | 73,157 | 74,956 |
4 | 2023-24 Mid-year Fiscal Update and Economic Statement |
due to the decrease in WTI prices, and are expected to continue to decline with moderating prices, reaching $2.5 billion in 2025-26.
Natural gas and by-product royalties are forecast to be $1.6 billion for 2023-24, $0.9 billion lower than budget, as natural gas prices have been impacted by high storage levels and robust production. Compared to the previous year, royalties and by-products have decreased $2 billion, primarily due to a decrease in both the Alberta Reference Price (ARP) for natural gas and WTI, as by-product prices track oil prices.
Tax Revenue
Total tax revenue in 2023-24 is forecast at $26.3 billion, $1.3 billion higher than budget, but $0.2 billion lower than in 2022-23. The increase from budget is due to stronger personal income tax (PIT) and corporate income tax (CIT) revenue, offset by lower fuel tax revenue from the extension of the fuel tax pause to December 2023.
PIT revenue is forecast at $15 billion, $945 million higher than estimated in Budget 2023, mainly due to stronger 2022 tax assessments and an improved personal income outlook following solid gains in Alberta’s labour market in 2023. PIT revenue increases to $16.5 billion by 2025-26, led by growth in personal income.
CIT revenue of $6.8 billion is forecast for 2023-24, $889 million higher than budget. The increase from budget is reflective of the higher base used to forecast future years, resulting from the record high CIT revenue in 2022. CIT revenue recovers with corporate profits over the outlook, increasing to $7.1 billion by 2025-26, but does not return to the 2022-23 level of $8.2 billion within the forecast horizon
Other tax revenue in 2023-24 is estimated at $4.5 billion, $528 million less than the $5 billion expected in Budget 2023, almost entirely due to the extension of the fuel tax pause until December 2023. Other tax revenue is
forecast to recover to $6 billion by 2025-26 as fuel tax revenue returns to normal levels. Revenue from freehold mineral taxes is down $23 million from budget, as the decline in natural gas prices has impacted freehold unit values. Tobacco and vaping tax forecasts are also down slightly from budget, while revenue from cannabis taxes and tourism levies has increased moderately with increased demand and inflation.
Transfers from Government of Canada
Federal transfers of $12.7 billion are forecast for 2023-24, $186 million higher than estimated in Budget 2023. Main changes comprise: $285 million in additional health care funding under the proposed new Working Together for Improved Health Care for Canadians bi-lateral agreement; $105 million anticipated for 2023 disaster program financial support; $99 million federal share for AgriRecovery to provide relief to livestock producers impacted by dry conditions; partially offset by a $154 million reduction to the Canada Health and Canada Social Transfer forecast, based on a downward revision to Alberta’s share of the national population; a $130 million forecast reduction for the fiscal stabilization payment related to the 2020-21 drop in revenue; revised cash flow estimates for the Alberta Social Housing Corporation, and re-profiling of federal infrastructure funds to align with project schedules.
Investment Income
Investment income in 2023-24 is forecast at $3.9 billion, $0.7 billion higher than budget. Forecasts for heritage and endowment fund income are $311 million and $144 million higher respectively, as financial markets have recovered from poor performance in 2022-23. Income from local authority loans is $41 million higher, from new loan issuances and higher interest rates. Other investment income is up $205 million, mainly from the higher balance carried in the general revenue fund required for upcoming debt maturities, and higher interest rates.
Investment income is $132 million higher in 2024-25 and $98 million higher in 2025-26, relative to Budget 2023.
Other Revenue
Net income from government business enterprises (GBEs) in 2023-24 is forecast at $2.5 billion, $255 million lower than budget, primarily due to a $283 million net loss forecast for the Alberta Petroleum Marketing Commission’s (APMC) Sturgeon Refinery due to a decline in forecast refined product prices, such as diesel, and higher feedstock costs due to the narrowing oil price differential, as well as higher service costs on outstanding debt. This is partly offset by a $36 million increase in ATB Financial net income due to a lower than anticipated provision for credit losses, as well as a $27 million increase in Alberta Gaming, Liquor and Cannabis Commission income from casino and online gaming revenue. GBE revenue in 2024-25 and 2025-26 is $261 million and $373 million lower than budget respectively, primarily due to forecasted APMC net losses.
Premiums, fees and licences revenue of $5 billion is forecast for 2023-24, $9 million higher than the budget, mainly due to increases in fee revenue as a result of ATB’s higher profitability. The 2024-25 and 2025-26 revenue forecast is slightly down from budget, due to decreases in preferred accommodation fees as hospital occupancy is forecast to remain high.
Other revenue of $4.2 billion is up $399 million from budget, comprising a $338 million increase in the Technology Innovation and Emissions Reduction Fund (TIER) as a result of revised revenue modelling, as well as a $75 million increase in revenue from the Renewable Electricity Program following higher than anticipated electricity prices. Other revenue decreases in the out-years to $3.6 billion in 2025-26 mainly due to the revised TIER revenue modelling.
2023-24 Mid-year Fiscal Update and Economic Statement | 5 |
Expense Highlights
Total Expense
Total expense is forecast at $68.8 billion in 2023-24, $4.3 billion more than 2022-23 and $0.5 billion more than estimated in Budget 2023. After $1.4 billion in expense increases are forecast as preliminary allocations from the $1.5 billion budgeted contingency, $123 million remains unallocated.
The increase from 2022-23 comprises: increases of $2.6 billion in operating expense, $1.3 billion in capital grants, and $0.7 billion in other expense, partly offset by decreases of $0.3 billion for pension provisions and disaster and emergency assistance costs.
The increase from budget consists of: increases of $0.3 billion in operating expense, $0.3 billion in debt servicing costs and $1.2 billion in disaster and emergency assistance.
Expense increases of $1.3 billion in 2024-25 and $0.9 billion in 2025-26 reflect higher operating expense of $0.5 billion and $0.4 billion in each of the next two years, mainly due to the new health federal bi-lateral agreement, increased TIER spending and the cost of selling oil. The increases also include $0.4 billion in 2024-25 and $0.2 billion in 2025-26 for capital grants and $0.4 billion in 2024-25 and $0.3 billion in 2025-26 for debt servicing costs.
Operating Expense
Operating expense is forecast at $57.4 billion in 2023-24, a $0.3 billion increase from budget, mainly from:
• | $48 million in Advanced Education including $43 million for post-secondary institutions to access reserves, $14 million for apprenticeship seat expansion partially offset by $9 million transfer to capital investment. |
• | $30 million in Education for unanticipated enrolment growth since Budget 2023. |
• | $48 million in Energy and Minerals mainly due to $39 million for increased costs of selling oil and $8 million for the Alberta Energy Regulator, primarily for the Public Geoscience Data Project. |
• | $14 million in Indigenous Relations including $4 million for the First Nations Development Fund as result of increased Alberta Gaming, Liquor and Cannabis forecast, $5 million for Alberta Indigenous Opportunities Corporation for additional capacity grants and due diligence costs, and $5 million for other initiatives. |
• | $301 million for Health mainly for the new federal bi-lateral agreement, physician compensation and development, and health system refocusing. |
• | $33 million in Mental Health and Addiction mainly for children and youth mental health facilities offset by funding from the federal government under the new bi-lateral agreement. |
• | A net $39 million in other ministries for various other initiatives. |
• | These increases are partially offset by decreases of: |
- | $127 million across government due to lower than-expected program take-up in affordability payments for children, seniors, disabled Albertans, income support and Assured Income for the Severely Handicapped (AISH) clients. |
- | $60 million net decrease in Environment and Protected Areas mainly related to re-profiling planned TIER spending to 2024-25. |
- | $7 million net decrease in other ministries for various initiatives. |
Capital Grants
Capital grants are forecast at $2.8 billion, up $20 million from budget, down from $170 million in first quarter mainly due to funding schedules for the Calgary and Edmonton LRT projects.
Other Expense
Amortization, inventory consumption, pension provision and disposal loss expense are expected to be in line with Budget 2023 estimates.
Debt servicing costs have increased by $309 million in 2023-24, as savings from debt repayment are more than offset by increased debt swap costs due to rising interest rates. In the two subsequent years, debt servicing costs are up $448 million and $295 million in 2024-25 and 2025-26 respectively compared to Budget 2023.
Disaster and Emergency Assistance
Disaster and emergency assistance of $1.2 billion is forecast, primarily due to an unprecedented wildfire season. The $1.2 billion includes $750 million for wildfire presuppression and response costs, $165 million for AgriRecovery to provide relief to livestock producers impacted by dry conditions, $55 million mainly for emergency evacuation payments and Disaster Recovery Programs of $175 million for the spring wildfires and $68 million for summer flooding to provide financial assistance to communities for uninsurable damage. The increases are offset by $99 million federal share for Agri-Recovery, and $102 million in federal disaster financial assistance, although eligibility under the federal program for various costs is still being evaluated.
Contingency
A contingency of $1.5 billion was included in Budget 2023, to align with the in-year expense limitation under the new legislated fiscal framework. Increases in expense not offset by dedicated revenue are included in the preliminary contingency allocation.
6 | 2023-24 Mid-year Fiscal Update and Economic Statement |
Assets and Liabilities
Financial assets of $82.2 billion are forecast for March 31, 2024, an increase of $2.7 billion from March 31, 2023.
• | Assets of the Heritage, endowment and other funds are $1.7 billion higher. The Heritage Fund is forecast to set aside a net $1.5 billion from retaining all 2023-24 net income. The net assets of the three endowment funds and Alberta Enterprise Corporation (AEC) have increased a net $321 million, mainly due to income gains. This is unchanged from the first quarter. |
• | Assets from self-supporting lending activities (Agriculture Financial Services Corporation - AFSC; local authority lending) are increasing by $1 billion from 2022-23, mainly due to current year revenue exceeding crop insurance fund withdrawals. |
• | Government business enterprise (GBE) net equity has increased by $136 million, primarily from improved ATB Financial net income, offset partially by net losses of the Alberta Petroleum Marketing Commission (APMC). GBE equity decreases in 2024-25 and 2025-26, primarily from APMC net losses from the Sturgeon Refinery. |
• | After the first 50 per cent of available surplus cash is used to pay off maturing debt, $1.6 billion and $0.4 billion in available surplus cash is allocated to the Alberta Fund in 2023-24 and 2024-25 respectively. |
• | Other financial assets have decreased a net $0.4 billion from 2022-23. These include financial assets of school boards, universities and colleges and the health authority, student loans, accounts and interest receivable, natural gas royalty deposits, cash associated with future liabilities such as corporate income tax refunds, the cash reserve and derivative financial instruments. |
Liabilities are forecast at $123 billion, $2.1 billion lower than they were on March 31, 2023.
• | Taxpayer-supported debt is estimated at $76.1 billion on March 31, 2024, a $3.2 billion reduction from year-end 2023, due to planned debt repayment. Capital Plan borrowing and P3 liabilities, less principal repayments, have decreased marginally, while Fiscal Plan debt is $3.2 billion lower. Taxpayer-supported debt is estimated to decline a further $0.7 billion by 2025-26, to $75.4 billion based on the interim allocation assumptions in the mid-year report. |
• | Debt issued to finance loans to local authorities and for AFSC has increased $323 million. |
• | Government obligations for pension plan liabilities is $341 million lower, mainly from improved valuations for the pre-1992 Teacher’s Pension. |
• | Asset retirement obligations are $2.2 billion. Government’s adoption of the Asset Retirement Obligation standard requires recognition of future disposal costs of certain capital assets that need remediation or decommissioning work. |
Net financial debt (financial assets less liabilities) is estimated at $40.8 billion for March 31, 2024, $4.8 billion less than on March 31, 2023, essentially reflecting the taxpayer-supported debt repayment. Net debt to GDP (2023 forecast) ratio is estimated at 9%.
Capital, non-financial assets less spent deferred capital contributions, are forecast to increase $0.7 billion to $57.6 billion, mainly displaying the difference between capital asset acquisition (capital investment less a 10% contingency), and depreciation (amortization expense).
Net assets of $16.8 billion are forecast for March 31, 2024, an improvement of $5.5 billion from 2023 mainly as a result of the forecast surplus. Net assets are estimated to continuing increasing, to $21.8 billion by 2025-26, based on surpluses of $2.1 billion and $2.8 billion over the two years.
2023-24 Mid-year Fiscal Update and Economic Statement | 7 |
Balance Sheet Summarya | ||||||||||||||||||||
(millions of dollars) | ||||||||||||||||||||
At March 31 | ||||||||||||||||||||
2023 | 2024 | 2025 | 2026 | |||||||||||||||||
Actual | Budget | Forecast | Target | Target | ||||||||||||||||
Financial Assets | ||||||||||||||||||||
Heritage Fund, endowments and other funds | 23,920 | 25,193 | 25,646 | 26,690 | 28,294 | |||||||||||||||
Self-supporting lending organizations / activities | 18,498 | 19,360 | 19,545 | 20,881 | 21,880 | |||||||||||||||
General Revenue Fund cash | 5,136 | 2,935 | 1,610 | 181 | - | |||||||||||||||
Alberta Fund | - | - | 1,610 | 1,963 | 1,963 | |||||||||||||||
Equity in commercial enterprises | 2,481 | 2,883 | 2,617 | 2,443 | 2,305 | |||||||||||||||
Other financial assets | 29,455 | 29,437 | 31,196 | 29,338 | 29,745 | |||||||||||||||
Total Financial Assets | 79,490 | 79,808 | 82,224 | 81,496 | 84,187 | |||||||||||||||
Liabilities | ||||||||||||||||||||
Taxpayer-supported Capital Plan borrowing / liabilities (P3s) | 45,525 | 45,512 | 45,512 | 45,430 | 45,342 | |||||||||||||||
Taxpayer-supported Fiscal Plan borrowing | 33,763 | 32,331 | 30,556 | 30,032 | 30,042 | |||||||||||||||
Total taxpayer-supported debt / liabilities | 79,288 | 77,843 | 76,068 | 75,462 | 75,384 | |||||||||||||||
Self-supporting lending organization / activity debt | 17,596 | 17,794 | 17,919 | 18,324 | 18,254 | |||||||||||||||
Total debt | 96,884 | 95,637 | 93,987 | 93,786 | 93,638 | |||||||||||||||
Pension liabilities | 8,272 | 7,950 | 7,931 | 7,592 | 7,244 | |||||||||||||||
Asset retirement obligations | 2,287 | 2,241 | 2,241 | 2,241 | 2,241 | |||||||||||||||
Other liabilities (including SUCH sector, coal phase-out payments) | 17,661 | 18,730 | 18,852 | 17,869 | 18,186 | |||||||||||||||
Total Liabilities | 125,104 | 124,558 | 123,011 | 121,488 | 121,309 | |||||||||||||||
Net Financial Assets / (Debt) | (45,614 | ) | (44,750 | ) | (40,788 | ) | (39,993 | ) | (37,122 | ) | ||||||||||
Capital / Other Non-financial Assets | 60,624 | 62,251 | 61,472 | 62,835 | 62,775 | |||||||||||||||
Spent deferred capital contributions | (3,696 | ) | (3,837 | ) | (3,848 | ) | (3,869 | ) | (3,864 | ) | ||||||||||
Net Assets | 11,314 | 13,664 | 16,836 | 18,973 | 21,789 | |||||||||||||||
Net assets / (liabilities) - statement of operations | 8,500 | 10,850 | 14,021 | 16,158 | 18,974 | |||||||||||||||
Accumulated remeasurement gains | 2,814 | 2,814 | 2,814 | 2,814 | 2,814 | |||||||||||||||
Change in Net Assets - statement of operations (before adjustments) | 11,748 | 2,350 | 5,521 | 2,137 | 2,816 |
a | 2023 Budget, and 2024 and 2025 Target numbers have been restated to reflect 2022-23 Actual results. |
8 | 2023-24 Mid-year Fiscal Update and Economic Statement |
Fiscal Framework
The Sustainable Fiscal Planning and Reporting Act requires the government to balance the budget. The government continues to forecast surpluses of $5.5 billion in 2023-24, $2.1 billion in 2024-25 and $2.8 billion in 2025-26.
The framework also limits in-year expense increases, adjusted to exclude expense that is directly offset by a related increase to revenue and non-cash, non-recurring adjustments, to the voted, budgeted contingency. In 2023-24, the contingency is set at $1.5 billion.
Thus far in 2023-24, expense has increased by a total of $1.9 billion. Of this increase, $481 million is directly offset by revenue and is excluded from the in-year expense limit calculation. The remaining $1.4 billion is forecast to be allocated from the contingency, leaving $123 million unallocated.
• | Expense increases offset by dedicated revenue include $282 million related to the proposed new Working Together for Improved Healthcare for Canadians federal bi-lateral agreement, $102 million in Disaster Recovery Program expense and $99 million for AgriRecovery anticipated to be reimbursed by the federal government, $27 million for infrastructure investments partially funded by the federal government and other various minor changes. |
Budget 2023-24 Contingency | ||||||||
(millions of dollars) | ||||||||
Expense increases: | 1,500 | |||||||
Emergency / disaster assistance | 1,229 | |||||||
Other | 349 | |||||||
Total Expense increases | 1,858 | |||||||
Less dedicated revenue / expense | (481 | ) | ||||||
Preliminary contingency allocation | 1,377 | (1,377 | ) | |||||
Contingency - unallocated | 123 |
Debt Repayment and Alberta Fund Allocation
Surplus cash available for allocation to debt repayment and the Alberta Fund is different from the forecast surplus.
Cash adjustments to the surplus / deficit, such as differences between accrued revenue and expense, SUCH sector and entity results, and transfers not reported on the income statement are necessary to determine the cash balance available for allocation.
In 2023-24, the opening cash balance was $5.1 billion from the 2022-23 final results. Details of the various cash adjustments are included below.
• | Retained income of funds and agencies Funds and agencies retain $3.0 billion of the reported surplus, as this cash belongs to the funds and agencies and not the General Revenue Fund (GRF). |
- | This includes: $3.3 billion in income from Alberta Heritage Savings Trust Fund and endowment funds, ATB Financial, Agriculture Financial Services Corporation, Technology Innovation and Emission Reduction Fund, other government business enterprises and entities. |
- | The net loss of $327 million reported by Alberta Petroleum Marketing Commission (APMC) in contrast, is the responsibility of APMC and GRF cash is not required. |
• | Other cash adjustments $1.0 billion are forecast mainly in differences between accrued and cash revenue and expense and cash needed for student and other loans, and other changes in financial assets and liabilities. |
- | The differences between energy royalties, PIT and CIT revenue and cash received are among the most significant and volatile cash adjustments. |
• | Capital cash adjustments A negative $2.2 billion cash adjustment mainly reflects non-SUCH capital investment cash requirement of $3.5 billion not reported in the surplus, less non-SUCH non-cash amortization expense of $1.3 billion that is included in expense and the surplus. |
The framework also sets policies for the allocation of surplus cash available from fiscal results with the first 50 per cent used to repay debt maturing in that fiscal year and the remaining 50 per cent allocated to the Alberta Fund. This plan for using cash from the Alberta Fund will continue to be evaluated as the fiscal year unfolds.
Cash Available for Allocation | ||||
(millions of dollars) | ||||
From 2022-23 results | 5.1 | |||
2023-24 surplus | 5.5 | |||
less entity retained income | (3.0 | ) | ||
less capital plan requirements | (2.2 | ) | ||
plus net other cash adjust. | 0.9 | |||
Total cash available | 6.4 | |||
Allocation: | ||||
2023-24 taxpayer-supported debt | 3.2 | |||
Alberta Fund | 1.6 | |||
Total allocation | 4.8 | |||
Cash at end of year | 1.6 | |||
Debt maturities | ||||
2023-24 maturities | 7.5 | |||
2024-25 maturities | 6.0 | |||
2025-26 maturities | 13.2 |
2023-24 Mid-year Fiscal Update and Economic Statement | 9 |
Capital Plan
The three-year Capital Plan has increased by $211 million from Budget 2023, to $23.2 billion. This adjustment entails a $607 million increase in capital grants, offset by a $396 million decrease in capital investment. The $23.2 billion includes $7.7 billion in 2023-24, $8.3 billion in 2024-25, and $7.2 billion in 2025-26, which reflect a decrease from budget of $263 million, followed by increases of $277 million and $195 million respectively.
The Capital Plan continues to support a diverse portfolio of investment in infrastructure across the province, with 28 per cent of funding allocated to municipal infrastructure support, contributing to the most significant portion of the Capital Plan. Capital maintenance and renewal represents the second-largest component, reflecting the government’s continued investment in protecting and extending the life of existing assets. Health facilities constitute the third-largest segment of the Capital Plan, dedicated to supporting health facilities across the province. Additionally, the province continues to support ongoing work on school facilities, roads and bridges, housing, and public safety.
Overall, the increase from Budget 2023 comprises $530 million in new funding to support new and existing projects and initiatives, $15 million net transfers from operating expense, and $121 million in SUCH sector self financed spending offset by a net decrease of $452 million for re-profiling and carrying-forward of unspent funds from 2022-23 due to revised project cash-flows.
Significant re-profiling pertains to various health-related facilities, school facilities, and roads and bridges. Most re-profiling occurs due to changes in cash flows to align with project timelines. Factors affecting project timelines include the pace of construction, revisions to project scope, and timing related to tendering and permitting.
Since Budget 2023, there has been a $528 million increase over three years in new and existing projects, including:
• | $247 million for the Calgary Rivers District and Event Centre and Community Rink as part of the $330 million commitment to Calgary’s downtown revitalization; |
• | $152 million for Recovery Communities to support more Albertans in their recovery from the deadly disease of addiction; |
• | $37 million for various health facilities; |
• | $27 million for flood mitigation projects; |
• | $21 million for Alberta Petrochemicals Incentive Program; |
• | $7 million increase in Local Government Fiscal Framework (LGFF) in 2025-26 from adjustment set out in the funding model as part of the LGFF Act; and |
• | $37 million in other projects, mainly in Agriculture and Irrigation. |
SUCH sector self-financed spending has also increased by $121 million over the next three years.
Capital Plan Summary
(millions of dollars) | ||||||||||||||||||||||||
2022-23 | 2023-24 | 2024-25 | 2025-26 | 3-year | ||||||||||||||||||||
Actual | Budget | Forecast | Target | Target | Total | |||||||||||||||||||
Municipal infrastructure support | 1,145 | 1,819 | 1,676 | 2,463 | 2,441 | 6,580 | ||||||||||||||||||
Capital maintenance and renewal | 1,166 | 1,413 | 1,380 | 1,221 | 938 | 3,539 | ||||||||||||||||||
Protect quality health care | 500 | 824 | 721 | 1,127 | 819 | 2,667 | ||||||||||||||||||
Roads and bridges | 653 | 986 | 664 | 856 | 663 | 2,183 | ||||||||||||||||||
Renewing education infrastructure | 508 | 633 | 711 | 592 | 432 | 1,734 | ||||||||||||||||||
Streamlining service delivery | 238 | 649 | 706 | 508 | 448 | 1,662 | ||||||||||||||||||
Public safety and emergency services | 278 | 333 | 421 | 241 | 162 | 824 | ||||||||||||||||||
Agriculture and natural resources | 139 | 323 | 316 | 358 | 427 | 1,101 | ||||||||||||||||||
Family, social supports and housing | 55 | 139 | 168 | 111 | 220 | 500 | ||||||||||||||||||
Skills for jobs | 98 | 75 | 88 | 84 | 20 | 192 | ||||||||||||||||||
Sports and recreation | 112 | 176 | 182 | 132 | 82 | 396 | ||||||||||||||||||
SUCH sector self-financed (schools, universities, colleges, health entities) | 739 | 632 | 711 | 559 | 551 | 1,820 | ||||||||||||||||||
Total Capital Plan | 5,633 | 8,005 | 7,744 | 8,252 | 7,203 | 23,199 |
10 | 2023-24 Mid-year Fiscal Update and Economic Statement |
2023-24 Mid-year
Economic Update
2023-24 to 2025-26
2023-24 Mid-year Fiscal Update and Economic Statement | 11 |
Economic Update
Overview
The Alberta economy continues to be resilient; however, interest rate increases, high prices and slower global economic growth are creating headwinds. Growth is being led by the oil and gas sector, where solid energy prices and the anticipated increase in Alberta’s takeaway capacity next year are driving spending and production. Business investment intentions are on track and employment prospects remain positive in the province. Homebuilding activity took off in the third quarter, suggesting some relief is coming for Alberta’s tight housing market. However, the impact of higher interest rates and elevated prices is working its way through the economy. Consumer confidence has pulled back sharply, leading households to curtail spending. Consumers and businesses also continue to grapple with rising costs. Slower global demand is dampening non-energy exports and contributing to the volatility in oil prices. Alberta’s real gross domestic product (GDP) is forecast to grow 2.8% this year, a moderation from last year’s exceptionally strong pace of 5.0%. This is in line with budget expectations but slightly lower than the first quarter.
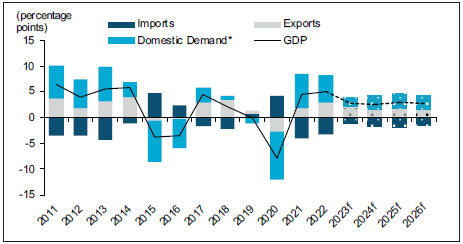
Real GDP growth is set to slow further next year to 2.6% (Chart 1). The slowdown is mainly due to higher for longer interest rates and more persistent inflation, which will be a drag on consumer spending. The completion of Trans Mountain pipeline expansion (TMX) in the second half of 2024 is expected to support energy sector activity, although slower global growth will continue to dampen non-energy output and exports. Strong momentum in residential construction in the second half of this year will support a modest rebound in residential investment in 2024.
Over the medium term, the Alberta economy is expected to rebound to around 2.9% as consumer spending recovers. Solid fundamentals – including a strong population growth, relatively young population, lower cost of living and high wages – will support Alberta’s expansion. While real GDP is forecast to expand, it will lag behind Alberta’s strong population growth in 2023 and 2024. As a result, real GDP per capita is expected to decline during these years before rebounding in 2025.
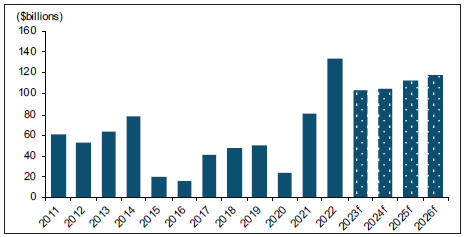
Nominal GDP, a broad measure of income, is forecast to retreat in 2023 before rebounding in 2024. This reflects the pullback in corporate profits this year due to lower commodity prices with last year’s elevated levels and rising costs. Even with the decline, corporate profits are forecast to exceed the 2014 high throughout the forecast period (Chart 2). In contrast, strong job gains and accelerating wage growth are expected to lift labour and primary household incomes this year and over the forecast period. Growth in labour and primary household incomes are projected to be higher compared with budget and the first quarter. | Oil price volatility continues
Global oil prices have gained ground after falling below $70/bbl in the summer. The extension of voluntary output cuts by Saudi Arabia and Russia until the end of the year, along with lower crude oil stocks in the U.S., lifted West Texas Intermediate (WTI) oil price above US$89/bbl in September. Supply concerns intensified following the onset of the Israel-Hamas conflict in October, but these have since eased as fears over slowing demand have grown recently. These factors have all contributed to more volatility in prices. The outlook for WTI has improved modestly in recent months, in-line with budget projections. It is forecast to average |
Chart 1: Real GDP growth to moderate next year
Contribution to annual change in Alberta real GDP by expenditure
Sources: Statistics Canada, Haver Analytics and Alberta Treasury Board and Finance; e-estimate, f-forecast
* Includes total household, business, and government spending
Chart 2: Corporate profits to ease but remain robust
Net operating surplus, actuals and forecast
Sources: Statistics Canada, Haver Analytics and Alberta Treasury Board and Finance; f-forecast
12 | 2023-24 Mid-year Fiscal Update and Economic Statement |
US$79.00/bbl in 2023-24 before easing to US$76.00/bbl in 2024-25. The global oil market is expected to shift into modest surplus next year amid slower growth in petroleum demand and additional supply coming online. While demand is expected to rise in the coming years, restrained investment in the oil and gas sector worldwide will limit supply growth and keep prices at or above US$70/bbl over the medium term.
TMX to boost Alberta oil prices
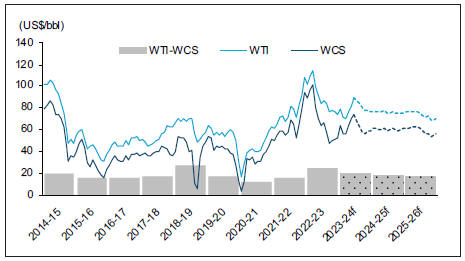
Additional pipeline capacity to move oil out of the province next year is expected to support Alberta oil prices and narrow the discount between WTI and the Western Canadian Select (WCS). The completion of TMX in the second half
of 2024 will help bring the differential to around US$14-15/bbl in the next two fiscal years (Chart 3). TMX is scheduled to begin line fill in the second quarter of 2024, which will require about 4.5 million barrels, before coming into full service in the third quarter. This comes on the heels of steeper discounts for WCS in recent months. The WTI-WCS differential has stayed above US$25/bbl since September due to a heavy refinery turnaround season in the U.S., which temporarily reduces demand for Alberta’s crude oil. This has coincided with a ramp up in oil sands production following larger-than-normal maintenance activities. The differential is expected to recede from current levels in the near term as U.S. refineries come back online and average US$17.00/bbl for 2023-24, $2.00 wider
Chart 3: WTI-WCS differential to improve with TMX completion
Oil Prices
Sources: Alberta Energy and Alberta Treasury Board and Finance; f-forecast
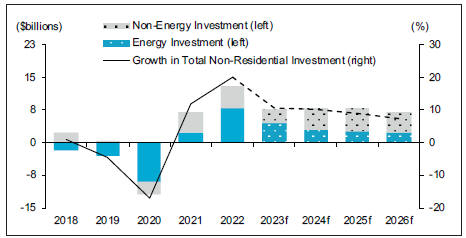
Chart 4: Oil and gas leads growth in investment this year
Change in Alberta non-residential investment by component
Sources: Statistics Canada and Alberta Treasury Board and Finance; f-forecast
than the first quarter, but down $2.50/bbl from budget.
Despite the wider differential, a lower Canadian dollar is expected to bolster Alberta heavy oil prices. With the U.S. economy exceeding expectations this year alongside a slowing Canadian economy, the Loonie has lost ground to the U.S. dollar. It is now forecast to average US¢74.10/Cdn$ in 2023-24, lower than expected in the first quarter and budget, before slowly rising to US¢78.60/ Cdn$ by 2025-26. This will lift WCS price to C$84.00/bbl in 2023-24 before moderating to C$75.10/bbl by 2025-26.
Energy sector driving investment
Prospects for the energy sector remain positive, underpinned by solid energy prices and the anticipated increase in Alberta’s takeaway capacity. A strong increase in drilling activity, along with a rising number of wells coming online, have boosted conventional oil production. The latter reached a five-year high in September and was up 6% year-to-date. Meanwhile, non-conventional oil production fully recovered in the summer following an abnormally large maintenance period. Both natural gas output and exports have also risen at a strong pace so far this year despite the impact of wildfires in the spring. Investment in the oil and gas extraction sector is forecast to grow 18% (or more than $4.5 billion) in 2023, unchanged from budget. It is the major driver of business investment this year (Chart 4).
Oil and gas investment is forecast to rise over the medium term, growing at a more moderate pace of $3.0 billion (or 10%) in 2024 and $2.7 billion (or 8.2%) in 2025. Energy prices are anticipated to remain supportive of activity. Producers are also expected to continue drilling at a solid pace ahead of TMX coming online in the second half of 2024. Increased takeaway capacity will help propel Alberta’s crude oil production from nearly 3.8 million barrels per day (bpd) in 2023 to over four million barrels bpd by 2026. Producers, however, are still expected to maintain capital discipline in expanding production and continue to invest in emissions reduction initiatives.
2023-24 Mid-year Fiscal Update and Economic Statement | 13 |
Business investment still on track
With many new projects announced in the province over the past year, industries outside oil and gas extraction will become an increasingly important driver of business investment over the medium term. Investment in non-residential building construction is finally gaining momentum despite higher borrowing and input costs. Investment increased for the third month in a row in August, led by gains in commercial and industrial buildings. Non-residential building permits in the private sector remain up nearly 14% year-to-date, despite pulling back from recent highs. Indicators of business spending on machinery and equipment, such as imports and wholesale
trade, have grown at a robust pace so far this year, partly reflecting solid activity in the energy sector. Business investment outside oil and gas extraction is forecast to grow around 9% this year. In real terms, however, non-energy investment is forecast to rise by a modest 3%. Over the medium term, investment is forecast to accelerate as the impact from higher interest rates fades and demand improves. Capacity additions in the petrochemical and agri-food sectors, as well as ongoing efforts to reduce emissions and increase capacity in renewable energy in the province, will contribute to growth. Real non-energy investment is forecast to expand 8-9% annually between 2024 and 2026.
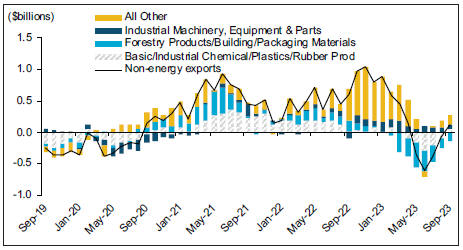
Chart 5: Slower demand weighing on non-energy exports
Year-over-year change in Alberta’s non-energy merchandise exports
Sources: Statistics Canada and Haver Analytics
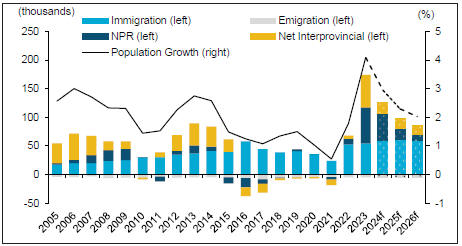
Chart 6: Strong inflows of NPRs* will support population growth
Annual change in the Alberta population by migration component
Sources: Statistics Canada, Haver Analytics and Alberta Treasury Board and Finance; e-estimate, f-forecast
* | Non-permanent residents |
Slower demand weighing on exports
Outside oil and gas, business output has trended lower since peaking in 2022. There have been declines in exports of many categories, most notably metal ores & non-metallic minerals, forestry products & building & package materials, and basic & industrial chemical products (Chart 5). While lower commodity prices have played a significant role, slowing demand has also been a factor. These declines are being partly offset by strength in exports of agriculture products and machinery and equipment, which have both seen exceptional growth so far this year. Given the broad-based weakness, growth in real manufacturing and services and other exports have been revised down this year before picking up slightly next year. This will dampen overall real exports, which are forecast to grow 3.5% this year. Meanwhile, crop exports are expected to pull back in 2024 due to this year’s drought conditions. This will weigh on real exports, which are forecast to rise just 2.6% next year.
Population growth to moderate
Alberta’s population growth is expected to moderate from last year’s exceptionally strong pace but nevertheless remain robust. Strong momentum in the second quarter of the year propelled Alberta’s population to expand by 184,000 or 4.1% in the 2023 census year, the fastest annual growth rate since 1981.
Alberta’s population is projected to rise 2.9% in the 2024 census year, an upward revision from 2.2% at budget. Net international migration is expected to remain at elevated levels, buoyed by higher national immigration targets set by the federal government and strong inflows of non-permanent residents. The latter will be largely driven by the arrival of Ukrainian migrants under the Canada-Ukraine Authorization for Emergency Travel (CUAET) program. Over 36,000 CUAET visa holders have settled in Alberta since the program began in 2022, and about 30,000 more are expected in the 2024 census year. Meanwhile, net interprovincial migration will slow following exceptional gains in 2023 (Chart 6). Nonetheless, it is still expected to remain strong, supported by Alberta’s relatively strong economic and labour market conditions, favourable housing affordability and a lower cost of living. Population growth is forecast to moderate over the medium term to 2.0% by 2026.
14 | 2023-24 Mid-year Fiscal Update and Economic Statement |
Job gains to moderate
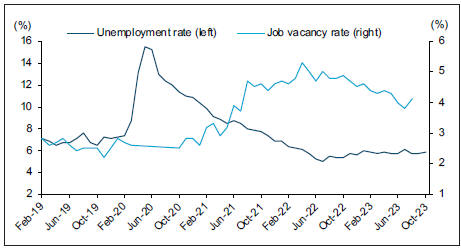
Job prospects remain strong in the province even as momentum in the labour market is slowing. Looking past the recent volatility, employment in the province has expanded 78,000 through ten months of the year. Employment is now forecast to grow 3.3% this year, up one percentage point from budget but down slightly from the first quarter update. The province will continue to add jobs, albeit at a more moderate pace of 2.5% in 2024. Job vacancies remain elevated in the province, despite the downward trend this year (Chart 7). Rising investment and higher migration will help employers fill vacant positions and should help bring down vacancies further. Employment is forecast to rise around 2.4% in 2025 and 2026.
Labour market still tight
Strong job gains and a declining labour force participation rate have contributed to tight labour market conditions in the province. Although Alberta’s labour force expanded by over 108,000 (or 4.3%) over the past year, its proportion to the working-age population – as measured by the labour force participation rate (or part rate) – has fallen since January 2023. The recent weakness has been most pronounced among youth and older workers, with the youth part rate pulling back sharply to historically low levels. An ageing population also continues to exert downward pressure on the overall part rate. Given the weakness year-to-date, the labour force participation rate has been revised down from budget and is expected to average 69.6% this year.
Chart 7: Job vacancies remain high amid tight labour market
Unemployment rate and job vacancy rate in Alberta
Sources: Statistics Canada and Haver Analytics
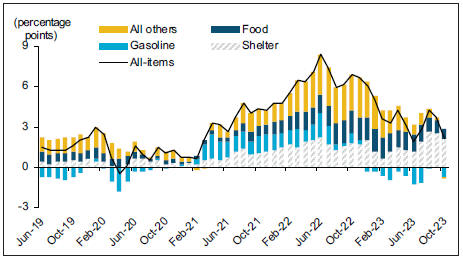
Chart 8: Shelter component a key driver of inflation
Contribution to inflation by category
Source: Statistics Canada
This is below the annual rates seen in the previous two years. A weaker participation rate is expected to lower Alberta’s unemployment rate, which is now forecast to average 5.9% in 2023. This is down 0.5 and 0.1 percentage points from budget and the first quarter, respectively.
The labour market is anticipated to gradually become more balanced in the coming years as labour demand moderates. Higher levels of migration into the province are also expected to boost supply. The unemployment rate is expected to rise to 6.2% in 2024 before declining gradually to 5.9% by 2026.
Consistent with a tight labour market, wage growth in the province has accelerated and is now catching up to the national pace. This, along with strong job gains, will help boost labour and primary household incomes. The latter is expected to rise 7.0% this year, up 1.1 percentage points from budget, before moderating to 6.0% in 2024. Wages will continue to grow at a robust pace of between 3.6% to 3.8% over the next few years.
Food and shelter propping up inflation
While headline inflation has moderated significantly this year, prices for shelter and food remain elevated. Prices for durable and semi-durable goods have fallen and are lower than year-ago levels. In contrast, shelter inflation has accelerated since February and is now close to a 15-year high, driven by rising mortgage rates, surging rent and electricity prices (Chart 8). Notably, electricity prices reached a record high in September due to the removal of provincial affordability measures and robust demand. Alberta’s tight rental market has also contributed to an 9.9% year-over-year increase in rents, marking the fastest growth since December 1982. Although food inflation is moderating, prices remain considerably higher than a year ago.
According to the Bank of Canada, underlying inflation is proving to be more persistent. Data from the Canadian Survey on Business Conditions for the third quarter of 2023 show that rising inflation and higher input costs are the two most commonly expected obstacles faced by businesses over the next three months. Consequently, more than a fifth of businesses expect to raise their selling prices over the next three months, a marginal decrease from the second quarter.
2023-24 Mid-year Fiscal Update and Economic Statement | 15 |
Inflation is now forecast to average 3.5% this year, up 0.2 percentage points from budget. Inflation projections have also been revised up by 0.3 percentage points from budget to 2.5% in 2024, before returning to around 2% over the medium term.
Consumer spending softening
Consumers are curtailing their spending in response to interest rate increases over the past year, elevated prices, and waning sentiment. Consumer confidence remains subdued despite the improvement in September. Declining sentiment toward major purchases has translated to weaker spending on big-ticket items such as motor vehicles and housing-related categories, where sales have slowed considerably compared to a year ago. On an inflation-adjusted basis, spending on food and beverage stores has also stagnated so far this year. Despite these headwinds, staggering population growth is supporting overall consumption, and real consumer spending is now forecast to rise 3.4% in 2023, up 1.3 percentage points from budget. On a per capita basis, however, real consumer spending is set to decline this year, reflecting the impact of rising borrowing costs and high inflation on goods spending (Chart 9). Services spending, on the other hand, is expected to rise in line with strong population growth.
With inflation slower to return to target, the Bank of Canada is not expected to begin cutting rates until the third quarter of 2024. This means that households are expected to increasingly feel the impact of higher for longer interest rates next year, which will lead to slower consumer spending. Real consumer spending is forecast to slow to 2.5% next year before bouncing back in 2025 and boosting overall real GDP growth.
Homebuilding activity gains momentum
Residential construction is finally responding to low inventories after being weighed down by higher interest rates, labour shortages and elevated costs in the construction sector. Housing starts posted a significant turnaround, averaging at a annualized pace of over 42,000 units in the last four months to October. While the robust growth has primarily been driven by a surge in apartment starts, single-family dwellings have also picked up. Residential building investment have
also trended higher in recent months (Chart 10). With the recent pickup in activity and construction intentions, housing starts in the province are now expected to average 34,000 units this year. This is higher than the first quarter forecast of 31,000 but still lower than 38,000 at budget.
Housing construction in the province has not kept up with the pace of recent population growth during the 2023 census year. Between July 1, 2022 and 2023, there were 33,300 units that started construction in the province even as population grew more than 184,000 people. This translated to 5.5 people per housing start, exceeding the approximate 2.5 people per dwelling each census has record since 2001. The catch-up in supply will buoy housing starts in the next few years. Housing starts are expected to
gradually rise to 35,200 in 2024, 36,000 in 2025 and 36,800 in 2025, buoyed by faster population growth and declining interest rates. Despite the upswing, real residential investment is expected to decline about 10% this year. This reflects subdued renovation activity and weakness in new housing construction in the first half of 2023, in addition to the shifting composition of housing starts towards lower-priced, multi-family dwellings. However, strong momentum in residential construction during the second half of this year is expected to carry over into the next, resulting in a projected 4% rebound in real residential investment in 2024.
Chart 9: Higher interest rates a drag on per capita consumer spending
Real per capita consumption in Alberta
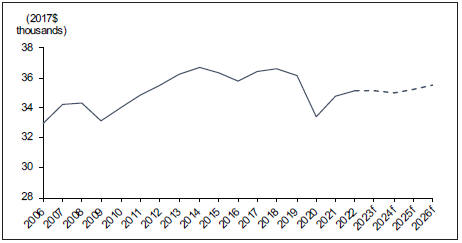
Sources: Statistics Canada, Haver Analytics and Alberta Treasury Board and Finance; f-forecast
Chart 10: Residential construction turning a corner
Residential construction investment and 3-month MA* housing starts
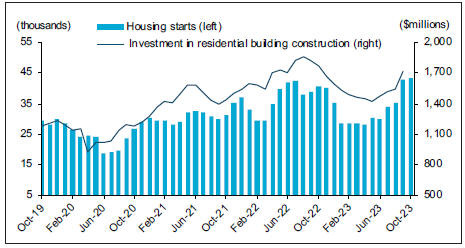
Sources: Statistics Canada and Haver Analytics; * Moving average
16 | 2023-24 Mid-year Fiscal Update and Economic Statement |
Key Energy and Economic Assumptions
2021-22 | 2022-23 | 2023-24 Forecast | 2024-25 | 2025-26 | ||||||||||||||||||||
Fiscal Year Assumptionsa | Actuals | Actuals | Budget | Q2 | Forecast | Forecast | ||||||||||||||||||
Crude Oil Pricesb | ||||||||||||||||||||||||
WTI (US$/bbl) | 77.03 | 89.69 | 79.00 | 79.00 | 76.00 | 73.50 | ||||||||||||||||||
Light-Heavy Differential (US$/bbl) | 13.56 | 20.77 | 19.50 | 17.00 | 15.30 | 14.70 | ||||||||||||||||||
WCS @ Hardisty (Cdn$/bbl) | 79.63 | 90.62 | 78.00 | 84.00 | 79.30 | 75.10 | ||||||||||||||||||
Natural Gas Priceb | ||||||||||||||||||||||||
Alberta Reference Price (Cdn$/GJ) | 3.48 | 4.63 | 4.10 | 2.50 | 3.00 | 3.60 | ||||||||||||||||||
Production | ||||||||||||||||||||||||
Conventional Crude Oil (thousands of barrels/day) | 445 | 497 | 497 | 510 | 515 | 512 | ||||||||||||||||||
Raw Bitumen (thousands of barrels/day) | 3,197 | 3,250 | 3,345 | 3,312 | 3,436 | 3,529 | ||||||||||||||||||
Natural Gas (billions of cubic feet) | 4,028 | 4,265 | 4,275 | 4,278 | 4,306 | 4,327 | ||||||||||||||||||
Interest Ratesb | ||||||||||||||||||||||||
3-month Canada Treasury Bills (%) | 0.19 | 3.17 | 4.20 | 4.80 | 4.30 | 3.00 | ||||||||||||||||||
10-year Canada Bonds (%) | 1.56 | 3.05 | 3.60 | 3.70 | 4.10 | 3.70 | ||||||||||||||||||
Exchange Rate (US¢/Cdn$)b | 79.8 | 75.6 | 76.2 | 74.1 | 76.4 | 78.6 |
2021 | 2022 | 2023 Forecast | 2024 | 2025 | 2026 | |||||||||||||||||||||||
Calendar Year Assumptionsa | Actuals | Actuals | Budget | Q2 | Forecast | Forecast | Forecast | |||||||||||||||||||||
Gross Domestic Product | ||||||||||||||||||||||||||||
Nominal (billions of dollars) | 376.4 | 459.3 | 449.2 | 448.7 | 466.2 | 485.8 | 506.2 | |||||||||||||||||||||
% change | 24.9 | 22.0 | -2.2 | -2.3 | 3.9 | 4.2 | 4.2 | |||||||||||||||||||||
Real (billions of 2012 dollars) | 327.1 | 343.5 | 353.1 | 353.1 | 362.3 | 373.2 | 383.6 | |||||||||||||||||||||
% change | 4.6 | 5.0 | 2.8 | 2.8 | 2.6 | 3.0 | 2.8 | |||||||||||||||||||||
Other Indicators | ||||||||||||||||||||||||||||
Employment (thousands) | 2,260 | 2,376 | 2,431 | 2,455 | 2,517 | 2,581 | 2,639 | |||||||||||||||||||||
% change | 5.4 | 5.2 | 2.3 | 3.3 | 2.5 | 2.5 | 2.2 | |||||||||||||||||||||
Unemployment Rate (%) | 8.6 | 5.8 | 6.4 | 5.9 | 6.2 | 6.1 | 5.9 | |||||||||||||||||||||
Average Weekly Earnings (% change) | 2.1 | 2.5 | 3.3 | 2.6 | 3.8 | 3.8 | 3.6 | |||||||||||||||||||||
Primary Household Income (% change) | 6.7 | 9.7 | 5.9 | 7.0 | 6.0 | 6.6 | 6.0 | |||||||||||||||||||||
Net Corporate Operating Surplus (% change) | 233.2 | 66.1 | -13.9 | -14.8 | 1.2 | 6.8 | 5.2 | |||||||||||||||||||||
Housing Starts (thousands of units) | 31.9 | 36.5 | 38.1 | 34.0 | 35.2 | 36.0 | 36.8 | |||||||||||||||||||||
Alberta Consumer Price Index (% change) | 3.2 | 6.4 | 3.3 | 3.5 | 2.5 | 2.2 | 2.2 | |||||||||||||||||||||
Retail Sales (% change) | 11.7 | 6.9 | 4.2 | 5.1 | 4.2 | 4.4 | 4.6 | |||||||||||||||||||||
Population (thousands) | 4,432 | 4,511 | 4,644 | 4,695 | c | 4,834 | 4,945 | 5,045 | ||||||||||||||||||||
% change | 0.5 | 1.8 | 2.9 | 4.1 | c | 2.9 | 2.3 | 2.0 | ||||||||||||||||||||
Net Migration (thousands) | 5.5 | 63.0 | 112.3 | 168.8 | c | 120.8 | 91.8 | 79.9 |
a | Forecast was finalized on November 1, 2023. |
b | Forecasts have been rounded. |
c | Estimate |
d | Budget 2023 and the mid-year forecast were finalized prior to the release of the Provincial Economic Accounts 2022 actuals on November 8, 2023. |
2023-24 Mid-year Fiscal Update and Economic Statement | 17 |
Benchmarking Tables
Oil Price Benchmark
West Texas Intermediate (US$/bbl)
Organization | 2023 | 2024 | 2025 | 2026 | ||||||||||||
National Forecasting Agencies | ||||||||||||||||
Conference Board of Canada (September 18, 2023) | 78.98 | 80.30 | 77.48 | 76.86 | ||||||||||||
Stokes Economics (July, 2023) | 72.80 | 73.50 | 74.00 | 74.30 | ||||||||||||
Banks and Investment Dealers | ||||||||||||||||
Credit Suisse (April, 2023) | 79.25 | 77.00 | 72.00 | 67.00 | ||||||||||||
Deloitte (June 30, 2023) | 73.55 | 70.05 | 73.55 | 75.00 | ||||||||||||
Goldman Sachs (October 30, 2023) | 76.69 | 75.00 | 75.00 | 75.00 | ||||||||||||
Laurentian Bank | n/a | n/a | n/a | n/a | ||||||||||||
National Bank (October, 2023) | 77.94 | 79.00 | n/a | n/a | ||||||||||||
RBC Capital Markets (October, 2023) | 79.57 | 86.44 | 77.00 | n/a | ||||||||||||
Scotiabank (October 23, 2023) | 80.00 | 81.00 | 81.00 | n/a | ||||||||||||
TD Bank (October, 2023) | 78.94 | 80.00 | 76.75 | n/a | ||||||||||||
Industry Analysts | ||||||||||||||||
U.S. Energy Information Administration (October 5, 2023) | 79.61 | 90.91 | n/a | n/a | ||||||||||||
GLJ Petroleum Consultants (October 1, 2023) | 80.07 | 83.00 | 78.50 | 76.94 | ||||||||||||
Sproule Associates Limited (October 31, 2023) | 79.50 | 81.00 | 76.00 | 77.60 | ||||||||||||
Confidential Forecasts Provided to the Government of Albertaa | ||||||||||||||||
Average | 79.50 | 85.00 | 77.50 | 77.50 | ||||||||||||
High | 80.20 | 92.25 | 96.00 | 86.00 | ||||||||||||
Low | 72.80 | 70.05 | 70.09 | 61.35 | ||||||||||||
Average of All Private Forecasts | 78.50 | 81.00 | 76.50 | 76.00 | ||||||||||||
Government of Alberta (calendar year) | 79.00 | 76.50 | 75.00 | 70.00 |
Includes forecasts finalized on or before November 2, 2023.
a | The Confidential Forecast provided to the Government of Alberta include forecasts from S&P Global, the Bank of Montreal, Rystad Energy, and Wood Mackenzie. High/Low forecasts may represent one of the confidential forecasts. Averages and the Government of Alberta forecast have been rounded to the nearest 50 cents. |
18 | 2023-24 Mid-year Fiscal Update and Economic Statement |
Light-Heavy Oil Price Differential Benchmark
WTI-WCS Price Differential ($US/bbl) | 2023 | 2024 | 2025 | 2026 | ||||||||||||
High | 18.42 | 17.25 | 17.00 | 15.63 | ||||||||||||
Low | 16.11 | 13.03 | 9.74 | 11.10 | ||||||||||||
Average of All Private Forecasts | 17.70 | 15.50 | 13.20 | 13.20 | ||||||||||||
Government of Alberta (calendar year) | 18.30 | 16.60 | 14.70 | 14.50 | ||||||||||||
Number of Private Sector Forecasters | 10 | 10 | 10 | 9 |
Includes forecasts finalized on or before November 2, 2023.
Natural Gas Price Benchmark
Henry Hub (US$/MMBtu)a | 2023 | 2024 | 2025 | 2026 | ||||||||||||
High | 2.78 | 3.75 | 4.50 | 5.41 | ||||||||||||
Low | 2.46 | 2.78 | 3.19 | 3.40 | ||||||||||||
Average of All Private Forecasts | 2.60 | 3.30 | 3.90 | 4.00 | ||||||||||||
Government of Alberta (calendar year) | 2.70 | 3.30 | 3.80 | 4.00 | ||||||||||||
Number of Private Sector Forecasters | 15 | 15 | 14 | 12 |
Includes forecasts finalized on or before November 2, 2023.
a | The natural gas price at Henry Hub Louisiana (in US$/MMBtu) is the US benchmark while the AECO natural gas price (in CAD$/GJ) is the Western Canada benchmark. The Alberta Reference Price (used in natural gas royalty calculations) represents the average field price of all Alberta gas sales which normally follows the Western Canada regional benchmark. The Averages and Government of Alberta forecast are rounded to the nearest 10 cents. |
United States / Canada Exchange Rate Benchmark
(US¢/Cdn$) | 2023 | 2024 | 2025 | 2026 | ||||||||||||
High | 75.5 | 77.3 | 80.0 | 77.8 | ||||||||||||
Low | 73.7 | 72.9 | 73.5 | 73.3 | ||||||||||||
Average of All Private Forecasts | 74.3 | 74.9 | 77.2 | 75.6 | ||||||||||||
Government of Alberta (calendar year) | 74.1 | 75.6 | 78.2 | 79.7 | ||||||||||||
Number of Private Sector Forecasters | 9 | 9 | 4 | 2 |
Includes forecasts finalized on or before November 2, 2023.
Canadian Long-Term Interest Rate Benchmark
10-Year Government of Canada Bonds (%) | 2023 | 2024 | 2025 | 2026 | ||||||||||||
High | 3.48 | 3.84 | 3.65 | 3.50 | ||||||||||||
Low | 3.10 | 3.10 | 2.91 | 3.17 | ||||||||||||
Average of All Private Forecasts | 3.40 | 3.50 | 3.30 | 3.30 | ||||||||||||
Government of Alberta (calendar year) | 3.50 | 4.10 | 3.90 | 3.50 | ||||||||||||
Number of Private Sector Forecasters | 9 | 9 | 5 | 2 |
Includes forecasts finalized on or before November 2, 2023.
2023-24 Mid-year Fiscal Update and Economic Statement | 19 |
Alberta Real Gross Domestic Product Benchmark
(% change) | 2023 | 2024 | 2025 | 2026 | ||||||||||||
High | 2.6 | 2.0 | 2.8 | 2.6 | ||||||||||||
Low | 1.7 | -0.2 | 1.9 | 2.0 | ||||||||||||
Average of All Private Forecasts | 2.2 | 1.2 | 2.4 | 2.3 | ||||||||||||
Government of Alberta (calendar year) | 2.8 | 2.6 | 3.0 | 2.8 | ||||||||||||
Number of Private Sector Forecasters | 9 | 9 | 5 | 2 |
Includes forecasts finalized on or before November 2, 2023.
Alberta Nominal Gross Domestic Product Benchmark
(% change) | 2023 | 2024 | 2025 | 2026 | ||||||||||||
High | 1.3 | 4.5 | 4.8 | 3.8 | ||||||||||||
Low | -3.3 | -1.1 | 3.4 | 3.8 | ||||||||||||
Average of All Private Forecasts | -1.3 | 3.1 | 3.9 | 3.8 | ||||||||||||
Government of Alberta (calendar year) | -2.3 | 3.9 | 4.2 | 4.2 | ||||||||||||
Number of Private Sector Forecasters | 7 | 7 | 4 | 1 |
Includes forecasts finalized on or before November 2, 2023.
Alberta Employment Benchmark
(% change) | 2023 | 2024 | 2025 | 2026 | ||||||||||||
High | 3.5 | 2.2 | 2.6 | 2.2 | ||||||||||||
Low | 1.0 | 0.6 | 1.0 | 1.7 | ||||||||||||
Average of All Private Forecasts | 3.0 | 1.4 | 2.0 | 2.0 | ||||||||||||
Government of Alberta (calendar year) | 3.3 | 2.5 | 2.5 | 2.2 | ||||||||||||
Number of Private Sector Forecasters | 8 | 8 | 4 | 2 |
Includes forecasts finalized on or before November 2, 2023.
Alberta Unemployment Rate Benchmark
(%) | 2023 | 2024 | 2025 | 2026 | ||||||||||||
High | 6.1 | 7.3 | 6.6 | 6.3 | ||||||||||||
Low | 5.7 | 5.6 | 5.8 | 6.0 | ||||||||||||
Average of All Private Forecasts | 5.9 | 6.3 | 6.2 | 6.2 | ||||||||||||
Government of Alberta (calendar year) | 5.9 | 6.2 | 6.1 | 5.9 | ||||||||||||
Number of Private Sector Forecasters | 9 | 9 | 5 | 2 |
Includes forecasts finalized on or before November 2, 2023.
Alberta Housing Starts Benchmark
(thousands of units) | 2023 | 2024 | 2025 | 2026 | ||||||||||||
High | 35.5 | 43.8 | 41.0 | 39.6 | ||||||||||||
Low | 31.0 | 28.5 | 30.3 | 33.4 | ||||||||||||
Average of All Private Forecasts | 33.1 | 35.3 | 35.8 | 36.5 | ||||||||||||
Government of Alberta (calendar year) | 34.0 | 35.2 | 36.0 | 36.8 | ||||||||||||
Number of Private Sector Forecasters | 9 | 9 | 5 | 2 |
Includes forecasts finalized on or before November 2, 2023.
20 | 2023-24 Mid-year Fiscal Update and Economic Statement |
2023-24 Mid-year
Tables
2023-24 to 2025-26
2023-24 Mid-year Fiscal Update and Economic Statement | 21 |
Table of Contents
Tables
Consolidated Fiscal Summary | 23 | |||
Statement of Financial Position | 24 | |||
Revenue | 25 | |||
Operating Expense | 26 | |||
Inventory Consumption | 26 | |||
Inventory Acquisition | 27 | |||
Debt Servicing Costs | 27 | |||
Capital Amortization | 28 | |||
Disaster and Emergency Assistance | 28 | |||
Pension Liabilities | 29 | |||
Cash Adjustments | 30 | |||
Capital Assets | 31 | |||
Capital Plan | 31 | |||
Capital Investment | 32 | |||
Capital Grants | 32 | |||
Capital Plan Funding Sources | 33 | |||
Historical Fiscal Summary, 2008-09 to 2025-26 | 34 |
22 | 2023-24 Mid-year Fiscal Update and Economic Statement |
Consolidated Fiscal Summary
(millions of dollars)
2022-23 | 2023-24 | Change fr. | 2024-25 | 2025-26 | ||||||||||||||||||||||||
Statement of Operations | Actual | Budget | Forecast | Budget | Target | Target | ||||||||||||||||||||||
1 | Total Revenue | 76,120 | 70,653 | 74,305 | 3,652 | 73,157 | 74,956 | |||||||||||||||||||||
Expense | ||||||||||||||||||||||||||||
2 | Operating expense | 54,737 | 57,038 | 57,357 | 319 | 58,581 | 59,573 | |||||||||||||||||||||
3 | % change from prior year | 17.3 | 4.2 | 4.8 | - | 2.1 | 1.7 | |||||||||||||||||||||
4 | Capital grants | 1,525 | 2,821 | 2,841 | 20 | 3,563 | 3,508 | |||||||||||||||||||||
5 | Amortization / inventory consumption / loss on disposals | 4,090 | 4,418 | 4,418 | - | 4,481 | 4,531 | |||||||||||||||||||||
6 | Taxpayer-supported debt servicing costs | 2,325 | 2,097 | 2,351 | 254 | 2,422 | 2,639 | |||||||||||||||||||||
7 | Self-supported debt servicing costs | 504 | 751 | 806 | 55 | 831 | 759 | |||||||||||||||||||||
8 | Pension provisions | (21 | ) | (322 | ) | (341 | ) | (19 | ) | (358 | ) | (370 | ) | |||||||||||||||
9 | Disaster and emergency assistance | 1,319 | - | 1,229 | 1,229 | - | - | |||||||||||||||||||||
10 | Expense before contingency | 64,479 | 66,803 | 68,661 | 1,858 | 69,520 | 70,640 | |||||||||||||||||||||
11 | Contingency (forecast un-allocated) | - | 1,500 | 123 | (1,377 | ) | 1,500 | 1,500 | ||||||||||||||||||||
12 | Total Expense | 64,479 | 68,303 | 68,784 | 481 | 71,020 | 72,140 | |||||||||||||||||||||
13 | Surplus / Deficit | 11,641 | 2,350 | 5,521 | 3,171 | 2,137 | 2,816 | |||||||||||||||||||||
Capital Plan | ||||||||||||||||||||||||||||
14 | Capital grants | 1,525 | 2,821 | 2,841 | 20 | 3,563 | 3,508 | |||||||||||||||||||||
15 | Capital investment | 4,108 | 5,184 | 4,903 | (281 | ) | 4,690 | 3,695 | ||||||||||||||||||||
16 | Total Capital Plan | 5,633 | 8,005 | 7,744 | (261 | ) | 8,253 | 7,203 | ||||||||||||||||||||
Cash Adjustments / Borrowing Requirements | (at March 31) | |||||||||||||||||||||||||||
17 | Cash at start of year | 8,858 | 3,644 | 5,136 | 1,492 | 1,610 | 181 | |||||||||||||||||||||
18 | Surplus / (deficit) | 11,641 | 2,350 | 5,521 | 3,171 | 2,137 | 2,816 | |||||||||||||||||||||
19 | Cash adjustments (for details, see table on page 31) | |||||||||||||||||||||||||||
20 | Retained income of funds and agencies | (1,838 | ) | (2,725 | ) | (3,020 | ) | (295 | ) | (1,798 | ) | (2,565 | ) | |||||||||||||||
21 | Other cash adjustments | 1,975 | 2,080 | 968 | (1,112 | ) | 1,207 | 728 | ||||||||||||||||||||
22 | Capital cash adjustments | (2,269 | ) | (2,464 | ) | (2,169 | ) | 295 | (2,087 | ) | (1,160 | ) | ||||||||||||||||
23 | Surplus cash (cash at start of year + surplus +/- net cash adjustments) | 18,367 | 2,885 | 6,437 | 3,551 | 1,068 | - | |||||||||||||||||||||
24 | Less: Taxpayer-supported debt repayment | (13,231 | ) | (1,442 | ) | (3,217 | ) | (1,775 | ) | (534 | ) | - | ||||||||||||||||
25 | Less: Allocation to Alberta Fund | - | (1,443 | ) | (1,610 | ) | (167 | ) | (353 | ) | - | |||||||||||||||||
26 | Cash at end of year | 5,136 | - | 1,610 | 1,609 | 181 | - | |||||||||||||||||||||
Taxpayer-supported Liabilities / Borrowing | (at March 31) | |||||||||||||||||||||||||||
Liabilities for Capital Projects | ||||||||||||||||||||||||||||
27 | Opening balance | 47,529 | 45,525 | 45,525 | - | 45,512 | 45,430 | |||||||||||||||||||||
28 | Alternative financing (P3s – public-private partnerships) | 52 | 64 | 64 | - | 1 | - | |||||||||||||||||||||
29 | Principal repayments / amortization of debt issue costs | (2,056 | ) | (77 | ) | (77 | ) | - | (83 | ) | (88 | ) | ||||||||||||||||
30 | Total Liabilities for Capital Projects | 45,525 | 45,512 | 45,512 | - | 45,430 | 45,342 | |||||||||||||||||||||
Borrowing for the Fiscal Plan | ||||||||||||||||||||||||||||
31 | Opening balance | 45,595 | 33,763 | 33,763 | - | 30,556 | 30,032 | |||||||||||||||||||||
32 | Principal repayments | (11,832 | ) | (1,432 | ) | (3,207 | ) | (1,775 | ) | (524 | ) | 10 | ||||||||||||||||
33 | Total Borrowing for the Fiscal Plan / Other | 33,763 | 32,331 | 30,556 | (1,775 | ) | 30,032 | 30,042 | ||||||||||||||||||||
34 | Total Taxpayer-supported Debt - Capital Projects / | |||||||||||||||||||||||||||
Fiscal Plan / Other | 79,288 | 77,843 | 76,068 | (1,775 | ) | 75,462 | 75,384 |
2023-24 Mid-year Fiscal Update and Economic Statement | 23 |
Statement of Financial Positiona
(millions of dollars)
At March 31 | ||||||||||||||||||||||
2023 | 2024 | 2025 | 2026 | |||||||||||||||||||
Actual | Budget | Forecast | Target | Target | ||||||||||||||||||
Financial Assets | ||||||||||||||||||||||
Alberta Heritage Savings Trust Fund | 18,980 | 20,076 | 20,385 | 21,296 | 22,673 | |||||||||||||||||
Endowment funds: | ||||||||||||||||||||||
Alberta Heritage Foundation for Medical Research | 2,027 | 2,129 | 2,185 | 2,263 | 2,385 | |||||||||||||||||
Alberta Heritage Science and Engineering Research | 1,201 | 1,238 | 1,285 | 1,317 | 1,374 | |||||||||||||||||
Alberta Heritage Scholarship | 1,376 | 1,418 | 1,459 | 1,486 | 1,538 | |||||||||||||||||
Alberta Enterprise Corporation | 336 | 332 | 332 | 328 | 324 | |||||||||||||||||
General Revenue Fund cash | 5,136 | 2,935 | 1,610 | 181 | - | |||||||||||||||||
Alberta Fund | - | - | 1,610 | 1,963 | 1,963 | |||||||||||||||||
Self-supporting lending organizations / activities: | ||||||||||||||||||||||
Loans to local authorities | 14,836 | 14,729 | 14,972 | 15,247 | 15,047 | |||||||||||||||||
Agriculture Financial Services Corporation | 3,662 | 4,631 | 4,573 | 5,634 | 6,833 | |||||||||||||||||
Equity in commercial enterprises | 2,481 | 2,883 | 2,617 | 2,443 | 2,305 | |||||||||||||||||
Student loans | 4,100 | 4,645 | 4,581 | 5,065 | 5,521 | |||||||||||||||||
Technology Innovation Emissions Reduction Fund | 592 | 626 | 869 | 713 | 618 | |||||||||||||||||
Other financial assets (including SUCH sector / Alberta Innovates Corp.) | 24,763 | 24,166 | 25,746 | 23,560 | 23,606 | |||||||||||||||||
Total Financial Assets | 79,490 | 79,808 | 82,224 | 81,496 | 84,187 | |||||||||||||||||
Liabilities | ||||||||||||||||||||||
Taxpayer-supported debt: | ||||||||||||||||||||||
Direct borrowing for the Capital Plan | 42,515 | 42,530 | 42,530 | 42,545 | 42,560 | |||||||||||||||||
Alternative financing for Capital Plan (public-private partnerships - P3s) | 3,010 | 2,982 | 2,982 | 2,885 | 2,782 | |||||||||||||||||
Debt issued to reduce pre-1992 TPP unfunded liability | 594 | 594 | 594 | 594 | 594 | |||||||||||||||||
Direct borrowing for the Fiscal Plan | 33,169 | 31,737 | 29,962 | 29,438 | 29,448 | |||||||||||||||||
Total taxpayer-supported debt | 79,288 | 77,843 | 76,068 | 75,462 | 75,384 | |||||||||||||||||
Self-supporting lending organization / activities debt: | ||||||||||||||||||||||
For local authority loans | 14,836 | 14,729 | 14,972 | 15,247 | 15,047 | |||||||||||||||||
Agriculture Financial Services Corporation | 2,760 | 3,065 | 2,947 | 3,077 | 3,207 | |||||||||||||||||
Total debt | 96,884 | 95,637 | 93,987 | 93,786 | 93,638 | |||||||||||||||||
Coal phase-out liabilities | 686 | 609 | 532 | 453 | 372 | |||||||||||||||||
Pension liabilities | 8,272 | 7,950 | 7,931 | 7,592 | 7,244 | |||||||||||||||||
Asset retirement obligations | 2,287 | 2,241 | 2,241 | 2,241 | 2,241 | |||||||||||||||||
Other liabilities (including SUCH sector / Alberta Innovates Corp.) | 16,975 | 18,121 | 18,320 | 17,416 | 17,814 | |||||||||||||||||
Total Liabilities | 125,104 | 124,558 | 123,011 | 121,488 | 121,309 | |||||||||||||||||
Net Financial Assets / (Debt) | (45,614 | ) | (44,750 | ) | (40,788 | ) | (39,993 | ) | (37,122 | ) | ||||||||||||
Capital / Other Non-financial Assets | 60,624 | 62,251 | 61,472 | 62,835 | 62,775 | |||||||||||||||||
Spent deferred capital contributions | (3,696 | ) | (3,837 | ) | (3,848 | ) | (3,869 | ) | (3,864 | ) | ||||||||||||
Net Assets | 11,314 | 13,664 | 16,836 | 18,973 | 21,789 | |||||||||||||||||
Net assets / (liabilities) - statement of operations | 8,500 | 10,850 | 14,021 | 16,158 | 18,974 | |||||||||||||||||
Accumulated remeasurement gains | 2,814 | 2,814 | 2,814 | 2,814 | 2,814 | |||||||||||||||||
Change in Net Assets - statement of operations (before adjustments) | 11,748 | 2,350 | 5,521 | 2,137 | 2,816 | |||||||||||||||||
Net financial debt / GDP (calendar year, nominal) | -9.8% | -9.9% | -9.0% | -8.5% | -7.5% |
a | 2023 Budget, and 2024 and 2025 Target numbers have been restated to reflect 2022-23 Actual results. |
24 | 2023-24 Mid-year Fiscal Update and Economic Statement |
Revenue
(millions of dollars)
2022-23 | 2023-24 | Change fr. | 2024-25 | 2025-26 | ||||||||||||||||||||
Actual | Budget | Forecast | Budget | Target | Target | |||||||||||||||||||
Income Taxes | ||||||||||||||||||||||||
Personal income tax | 13,925 | 14,069 | 15,014 | 945 | 15,405 | 16,483 | ||||||||||||||||||
Corporate income tax | 8,167 | 5,911 | 6,800 | 889 | 6,894 | 7,103 | ||||||||||||||||||
22,092 | 19,980 | 21,814 | 1,834 | 22,299 | 23,586 | |||||||||||||||||||
Other Taxes | ||||||||||||||||||||||||
Education property tax | 2,537 | 2,504 | 2,504 | - | 2,604 | 2,703 | ||||||||||||||||||
Fuel tax | 139 | 769 | 245 | (524 | ) | 1,409 | 1,439 | |||||||||||||||||
Tobacco / vaping taxes | 513 | 489 | 477 | (12 | ) | 452 | 452 | |||||||||||||||||
Insurance taxes | 806 | 851 | 856 | 5 | 914 | 976 | ||||||||||||||||||
Cannabis tax | 172 | 173 | 185 | 12 | 191 | 195 | ||||||||||||||||||
Tourism levy | 104 | 97 | 111 | 14 | 115 | 119 | ||||||||||||||||||
Freehold mineral rights tax | 161 | 129 | 106 | (23 | ) | 113 | 116 | |||||||||||||||||
4,432 | 5,012 | 4,484 | (528 | ) | 5,798 | 6,000 | ||||||||||||||||||
Non-Renewable Resource Revenue | ||||||||||||||||||||||||
Bitumen royalty | 16,879 | 12,555 | 14,364 | 1,809 | 12,620 | 12,469 | ||||||||||||||||||
Crude oil royalty | 3,968 | 2,905 | 3,116 | 211 | 2,699 | 2,532 | ||||||||||||||||||
Natural gas and by-products royalty | 3,595 | 2,465 | 1,599 | (866 | ) | 1,761 | 1,913 | |||||||||||||||||
Bonuses and sales of Crown leases | 465 | 307 | 386 | 79 | 290 | 289 | ||||||||||||||||||
Rentals and fees / coal royalty | 335 | 129 | 202 | 73 | 183 | 180 | ||||||||||||||||||
25,242 | 18,361 | 19,667 | 1,306 | 17,553 | 17,383 | |||||||||||||||||||
Transfers from Government of Canada | ||||||||||||||||||||||||
Canada Health Transfer | 5,507 | 6,079 | 5,964 | (115 | ) | 6,169 | 6,507 | |||||||||||||||||
Canada Social Transfer | 1,864 | 1,942 | 1,902 | (40 | ) | 2,001 | 2,071 | |||||||||||||||||
Direct transfers to SUCH sector / Alberta Innovates Corporation | 576 | 617 | 655 | 38 | 626 | 637 | ||||||||||||||||||
Infrastructure support | 580 | 935 | 826 | (109 | ) | 1,202 | 1,020 | |||||||||||||||||
Agriculture support programs | 455 | 480 | 579 | 99 | 517 | 564 | ||||||||||||||||||
Labour market agreements | 341 | 325 | 317 | (8 | ) | 320 | 320 | |||||||||||||||||
Early learning child care agreements | 655 | 937 | 937 | - | 1,062 | 1,226 | ||||||||||||||||||
Other (includes Fiscal Stabilization payment in 2023-24) | 1,385 | 1,237 | 1,558 | 321 | 835 | 876 | ||||||||||||||||||
11,363 | 12,552 | 12,738 | 186 | 12,731 | 13,220 | |||||||||||||||||||
Investment Income | ||||||||||||||||||||||||
Alberta Heritage Savings Trust Fund | 20 | 1,226 | 1,537 | 311 | 1,046 | 1,517 | ||||||||||||||||||
Endowment funds | (13 | ) | 352 | 496 | 144 | 310 | 405 | |||||||||||||||||
Income from local authority loans | 509 | 734 | 775 | 41 | 793 | 700 | ||||||||||||||||||
Agriculture Financial Services Corporation | 86 | 126 | 126 | - | 130 | 139 | ||||||||||||||||||
Other (includes SUCH sector) | 724 | 716 | 921 | 205 | 1,126 | 744 | ||||||||||||||||||
1,326 | 3,154 | 3,855 | 701 | 3,405 | 3,505 | |||||||||||||||||||
Net Income from Government Business Enterprises | ||||||||||||||||||||||||
AGLC – Gaming / lottery | 1,554 | 1,515 | 1,542 | 27 | 1,509 | 1,573 | ||||||||||||||||||
AGLC – Liquor | 825 | 830 | 812 | (18 | ) | 836 | 845 | |||||||||||||||||
AGLC – Cannabis | 18 | 5 | 8 | 3 | 9 | 14 | �� | |||||||||||||||||
ATB Financial | 428 | 279 | 315 | 36 | 302 | 351 | ||||||||||||||||||
Balancing Pool | 144 | 103 | 113 | 10 | 113 | 113 | ||||||||||||||||||
Other (CUDGCo / APMC / PSIs) | (488 | ) | (5 | ) | (318 | ) | (313 | ) | (609 | ) | (622 | ) | ||||||||||||
2,481 | 2,727 | 2,472 | (255 | ) | 2,161 | 2,274 | ||||||||||||||||||
Premiums, Fees and Licences | ||||||||||||||||||||||||
Post-secondary institution tuition fees | 1,603 | 1,771 | 1,771 | - | 1,865 | 1,902 | ||||||||||||||||||
Health Services / school board fees and charges | 723 | 754 | 750 | (4 | ) | 781 | 820 | |||||||||||||||||
Motor vehicle licences | 572 | 580 | 580 | - | 593 | 605 | ||||||||||||||||||
Crop, hail and livestock insurance premiums | 511 | 613 | 613 | - | 683 | 741 | ||||||||||||||||||
Energy industry levies | 310 | 384 | 385 | 1 | 392 | 399 | ||||||||||||||||||
Other (includes land titles revenue) | 938 | 938 | 950 | 12 | 963 | 885 | ||||||||||||||||||
4,657 | 5,040 | 5,049 | 9 | 5,277 | 5,352 | |||||||||||||||||||
Other | ||||||||||||||||||||||||
SUCH sector sales, rentals and services | 899 | 915 | 893 | (22 | ) | 939 | 960 | |||||||||||||||||
SUCH sector fundraising, donations, gifts and contributions | 699 | 662 | 648 | (14 | ) | 660 | 672 | |||||||||||||||||
AIMCo investment management charges | 816 | 877 | 877 | - | 903 | 931 | ||||||||||||||||||
Fines and penalties | 223 | 226 | 226 | - | 226 | 226 | ||||||||||||||||||
Refunds of expense | 436 | 108 | 117 | 9 | 121 | 136 | ||||||||||||||||||
Technology Innovation and Emissions Reduction Fund | 764 | 523 | 861 | 338 | 571 | 219 | ||||||||||||||||||
Miscellaneous | 690 | 516 | 604 | 88 | 512 | 493 | ||||||||||||||||||
4,527 | 3,827 | 4,226 | 399 | 3,933 | 3,636 | |||||||||||||||||||
Total Revenue | 76,120 | 70,653 | 74,305 | 3,652 | 73,157 | 74,956 |
2023-24 Mid-year Fiscal Update and Economic Statement | 25 |
Operating Expense
(millions of dollars)
2022-23 | 2023-24 | Change fr. | 2024-25 | 2025-26 | ||||||||||||||||||||
Actual | Budget | Forecast | Budget | Target | Target | |||||||||||||||||||
Advanced Education | 5,716 | 5,779 | 5,827 | 48 | 5,919 | 6,052 | ||||||||||||||||||
Affordability and Utilities | 712 | 131 | 133 | 2 | 84 | 85 | ||||||||||||||||||
Agriculture and Irrigation | 685 | 804 | 806 | 2 | 806 | 809 | ||||||||||||||||||
Arts, Culture and Status of Women | 138 | 132 | 134 | 2 | 150 | 149 | ||||||||||||||||||
Children and Family Services | 2,517 | 2,987 | 2,928 | (59 | ) | 2,874 | 3,074 | |||||||||||||||||
Education | 8,329 | 8,836 | 8,866 | 30 | 9,036 | 9,162 | ||||||||||||||||||
Energy and Minerals | 1,234 | 766 | 814 | 48 | 779 | 769 | ||||||||||||||||||
Environment and Protected Areas | 428 | 494 | 434 | (60 | ) | 684 | 342 | |||||||||||||||||
Executive Council | 45 | 53 | 53 | - | 54 | 56 | ||||||||||||||||||
Forestry and Parks | 273 | 315 | 315 | - | 297 | 297 | ||||||||||||||||||
Health | 23,438 | 24,533 | 24,834 | 301 | 25,683 | 26,300 | ||||||||||||||||||
Immigration and Multiculturalism | 38 | 40 | 40 | - | 39 | 37 | ||||||||||||||||||
Indigenous Relations | 185 | 214 | 228 | 14 | 212 | 212 | ||||||||||||||||||
Infrastructure | 447 | 462 | 462 | - | 468 | 466 | ||||||||||||||||||
Jobs, Economy and Trade | 355 | 401 | 401 | - | 383 | 369 | ||||||||||||||||||
Justice | 588 | 655 | 672 | 17 | 667 | 673 | ||||||||||||||||||
Mental Health and Addiction | 88 | 148 | 181 | 33 | 165 | 228 | ||||||||||||||||||
Municipal Affairs | 180 | 228 | 226 | (2 | ) | 230 | 232 | |||||||||||||||||
Public Safety and Emergency Services | 1,032 | 1,187 | 1,182 | (5 | ) | 1,210 | 1,203 | |||||||||||||||||
Seniors, Community and Social Services | 4,816 | 5,252 | 5,183 | (69 | ) | 5,159 | 5,335 | |||||||||||||||||
Service Alberta and Red Tape Reduction | 131 | 159 | 159 | - | 158 | 153 | ||||||||||||||||||
Technology and Innovation | 660 | 704 | 705 | 1 | 690 | 691 | ||||||||||||||||||
Tourism and Sport | 92 | 103 | 111 | 8 | 111 | 106 | ||||||||||||||||||
Transportation and Economic Corridors | 572 | 507 | 514 | 7 | 532 | 546 | ||||||||||||||||||
Treasury Board and Finance | 1,910 | 1,971 | 1,971 | - | 2,010 | 2,043 | ||||||||||||||||||
Legislative Assembly | 128 | 178 | 178 | - | 181 | 184 | ||||||||||||||||||
Total Operating Expense | 54,737 | 57,038 | 57,357 | 318 | 58,581 | 59,573 |
Inventory Consumption
(millions of dollars)
2022-23 | 2023-24 | Change fr. | 2024-25 | 2025-26 | ||||||||||||||||||||
Actual | Budget | Forecast | Budget | Target | Target | |||||||||||||||||||
Advanced Education | 50 | 180 | 180 | - | 183 | 186 | ||||||||||||||||||
Arts, Culture and Status of Women | 1 | 1 | 1 | - | 1 | 1 | ||||||||||||||||||
Education | 24 | - | - | - | - | - | ||||||||||||||||||
Forestry and Parks | 1 | 1 | 1 | - | 1 | 1 | ||||||||||||||||||
Health | 1,217 | 1,278 | 1,278 | - | 1,269 | 1,297 | ||||||||||||||||||
Infrastructure | 1 | 2 | 2 | - | 2 | 2 | ||||||||||||||||||
Public Safety and Emergency Services | 1 | 1 | 1 | - | 1 | 1 | ||||||||||||||||||
Service Alberta and Red Tape Reduction | 4 | 6 | 6 | - | 6 | 6 | ||||||||||||||||||
Transportation and Economic Corridors | 54 | 62 | 62 | - | 65 | 66 | ||||||||||||||||||
Total Inventory Consumption | 1,353 | 1,530 | 1,530 | - | 1,527 | 1,560 |
26 | 2023-24 Mid-year Fiscal Update and Economic Statement |
Inventory Acquisition
(millions of dollars)
2022-23 | 2023-24 | Change fr. | 2024-25 | 2025-26 | ||||||||||||||||||||
Actual | Budget | Forecast | Budget | Target | Target | |||||||||||||||||||
Advanced Education | 58 | 181 | 181 | - | 181 | 181 | ||||||||||||||||||
Arts, Culture and Status of Women | - | 1 | 1 | - | 1 | 1 | ||||||||||||||||||
Education | 26 | - | - | - | - | - | ||||||||||||||||||
Forestry and Parks | 1 | 1 | 1 | - | 1 | 1 | ||||||||||||||||||
Health | 1,201 | 1,404 | 1,402 | (2 | ) | 1,493 | 1,211 | |||||||||||||||||
Infrastructure | 1 | 2 | 2 | - | 2 | 2 | ||||||||||||||||||
Service Alberta and Red Tape Reduction | 4 | 6 | 6 | - | 6 | 6 | ||||||||||||||||||
Transportation and Economic Corridors | 53 | 62 | 62 | - | 65 | 66 | ||||||||||||||||||
Total Inventory Acquisition | 1,344 | 1,656 | 1,654 | (2 | ) | 1,749 | 1,468 |
Debt Servicing Costs
(millions of dollars)
2022-23 | 2023-24 | Change fr. | 2024-25 | 2025-26 | ||||||||||||||||||||
Actual | Budget | Forecast | Budget | Target | Target | |||||||||||||||||||
Taxpayer-supported general debt servicing costs | ||||||||||||||||||||||||
Education – school boards | 8 | 9 | 9 | - | 9 | 9 | ||||||||||||||||||
Treasury Board and Finance – direct borrowing | 972 | 850 | 960 | 110 | 991 | 1,087 | ||||||||||||||||||
Total | 980 | 859 | 969 | 110 | 1,000 | 1,096 | ||||||||||||||||||
Taxpayer-supported Capital Plan debt servicing costs | ||||||||||||||||||||||||
Education – Alberta Schools Alternative Procurement P3s | 25 | 24 | 25 | 1 | 27 | 27 | ||||||||||||||||||
Transportation – ring road P3s | 103 | 101 | 100 | (1 | ) | 97 | 93 | |||||||||||||||||
Treasury Board and Finance – direct borrowing | 1,217 | 1,113 | 1,257 | 144 | 1,298 | 1,423 | ||||||||||||||||||
Total | 1,345 | 1,238 | 1,382 | 144 | 1,422 | 1,543 | ||||||||||||||||||
Total taxpayer-supported debt servicing costs | 2,325 | 2,097 | 2,351 | 254 | 2,422 | 2,639 | ||||||||||||||||||
Self-supported debt servicing costs | ||||||||||||||||||||||||
Treasury Board and Finance – loans to local authorities | 428 | 659 | 710 | 51 | 727 | 650 | ||||||||||||||||||
Treasury Board and Finance – Ag. Financial Services Corp. | 76 | 92 | 96 | 4 | 104 | 109 | ||||||||||||||||||
Total self-supported debt servicing costs | 504 | 751 | 806 | 55 | 831 | 759 | ||||||||||||||||||
Total Debt Servicing Costs | 2,829 | 2,848 | 3,157 | 309 | 3,253 | 3,398 |
2023-24 Mid-year Fiscal Update and Economic Statement | 27 |
Capital Amortization
(millions of dollars)
2022-23 | 2023-24 | Change fr. | 2024-25 | 2025-26 | ||||||||||||||||||||
Actual | Budget | Forecast | Budget | Target | Target | |||||||||||||||||||
Advanced Education | 520 | 563 | 563 | - | 566 | 577 | ||||||||||||||||||
Affordability and Utilities | 2 | 2 | 2 | - | 2 | 2 | ||||||||||||||||||
Agriculture and Irrigation | 29 | 36 | 36 | - | 39 | 41 | ||||||||||||||||||
Arts, Culture and Status of Women | 7 | 8 | 8 | - | 7 | 7 | ||||||||||||||||||
Children and Family Services | - | 1 | 1 | - | 1 | 1 | ||||||||||||||||||
Education | 480 | 479 | 479 | - | 488 | 488 | ||||||||||||||||||
Energy and Minerals | 13 | 13 | 13 | - | 13 | 13 | ||||||||||||||||||
Environment and Protected Areas | 4 | 4 | 4 | - | 5 | 5 | ||||||||||||||||||
Forestry and Parks | 32 | 38 | 38 | - | 39 | 41 | ||||||||||||||||||
Health | 515 | 556 | 556 | - | 552 | 513 | ||||||||||||||||||
Infrastructure | 132 | 146 | 146 | - | 160 | 169 | ||||||||||||||||||
Jobs, Economy and Trade | 1 | 1 | 1 | - | 1 | 1 | ||||||||||||||||||
Justice | 1 | 4 | 4 | - | 4 | 4 | ||||||||||||||||||
Municipal Affairs | 1 | 4 | 4 | - | 4 | 4 | ||||||||||||||||||
Public Safety and Emergency Services | 29 | 29 | 29 | - | 29 | 29 | ||||||||||||||||||
Seniors, Community and Social Services | 51 | 52 | 52 | - | 52 | 52 | ||||||||||||||||||
Service Alberta and Red Tape Reduction | 17 | 18 | 18 | - | 18 | 18 | ||||||||||||||||||
Technology and Innovation | 51 | 79 | 79 | - | 80 | 80 | ||||||||||||||||||
Transportation and Economic Corridors | 751 | 823 | 823 | - | 861 | 889 | ||||||||||||||||||
Treasury Board and Finance | 28 | 25 | 25 | - | 26 | 27 | ||||||||||||||||||
Legislative Assembly | 2 | 2 | 2 | - | 2 | 2 | ||||||||||||||||||
Total Amortization Expense | 2,666 | 2,883 | 2,883 | - | 2,949 | 2,963 |
Disaster and Emergency Assistance
(millions of dollars)
2022-23 | 2023-24 | Change fr. | 2024-25 | 2025-26 | ||||||||||||||||||||
Actual | Budget | Forecast | Budget | Target | Target | |||||||||||||||||||
Disaster and emergency assistance | ||||||||||||||||||||||||
Agriculture and Irrigation - agriculture support | 1,141 | - | 165 | 165 | - | - | ||||||||||||||||||
Forestry and Parks - wildfire fighting | 161 | - | 750 | 750 | - | - | ||||||||||||||||||
Health - wildfire support | - | - | 6 | 6 | - | - | ||||||||||||||||||
Public Safety and Emergency Services – wildfire / flood support | 17 | - | 253 | 253 | - | - | ||||||||||||||||||
Seniors, Community and Social Services - wildfire support | - | - | 55 | 55 | - | - | ||||||||||||||||||
Total Disaster and Emergency Assistance Expense | 1,319 | - | 1,229 | 1,229 | - | - |
28 | 2023-24 Mid-year Fiscal Update and Economic Statement |
Pension Liabilities a
(millions of dollars)
At March 31 | ||||||||||||||||||||
2023 | 2024 | 2024 | 2025 | 2026 | ||||||||||||||||
Actual | Budget | Forecast | Target | Target | ||||||||||||||||
Teachers’ Pension Plan (pre-1992) | 7,309 | 7,044 | 7,044 | 6,769 | 6,486 | |||||||||||||||
Teachers’ Pension Plan (post-1992) | - | - | - | - | - | |||||||||||||||
Public Service Management Pension Plan (pre-1992; closed) b | 375 | 343 | 343 | 309 | 275 | |||||||||||||||
Universities Academic Pension Plan (pre-1992) | 198 | 198 | 179 | 176 | 175 | |||||||||||||||
Special Forces Pension Plan (pre-1992) | 77 | 79 | 79 | 80 | 78 | |||||||||||||||
Members of the Legislative Assembly Pension Plan (closed) b | 34 | 32 | 32 | 29 | 27 | |||||||||||||||
Public Service Supplementary Retirement Plan | 25 | 25 | 25 | 25 | 25 | |||||||||||||||
Provincial Judges and Masters in Chambers Pension Plan | 3 | 3 | 3 | 3 | 3 | |||||||||||||||
SUCH sector – Universities Academic / Supp. Exec. Retirement Plans | 251 | 226 | 226 | 201 | 175 | |||||||||||||||
Total Pension Liabilities | 8,272 | 7,950 | 7,931 | 7,592 | 7,244 | |||||||||||||||
Annual non-cash change in pension liabilities | (21 | ) | (322 | ) | (341 | ) | (358 | ) | (370 | ) |
a | The following pubic service pension plans are fully funded, and thus not included above: the Local Authorities Pension Plan, the Public Service Pension Plan and the Management Employees Penson Plan. |
b | Membership closed and pensionable service no longer being accrued. |
2023-24 Mid-year Fiscal Update and Economic Statement | 29 |
Cash Adjustments
(millions of dollars)
2022-23 | 2023-24 | Change fr. | 2024-25 | 2025-26 | ||||||||||||||||||||
Actual | Budget | Forecast | Budget | Target | Target | |||||||||||||||||||
Balance at Start of Year | 8,858 | 3,644 | 5,136 | 1,492 | 1,610 | 181 | ||||||||||||||||||
Surplus / (Deficit) | 11,641 | 2,350 | 5,521 | 3,171 | 2,137 | 2,816 | ||||||||||||||||||
Cash Adjustments (negative = cash requirement; positive = cash source) | ||||||||||||||||||||||||
Retained Income of Funds and Agencies | ||||||||||||||||||||||||
Alberta Heritage Savings Trust Fund | (1,886 | ) | (1,096 | ) | (1,405 | ) | (309 | ) | (911 | ) | (1,377 | ) | ||||||||||||
ATB Financial | (428 | ) | (279 | ) | (315 | ) | (36 | ) | (302 | ) | (351 | ) | ||||||||||||
Agriculture Financial Services Corporation | 296 | (910 | ) | (911 | ) | (1 | ) | (1,061 | ) | (1,199 | ) | |||||||||||||
Heritage Foundation for Medical Research Endowment Fund | 67 | (102 | ) | (158 | ) | (56 | ) | (78 | ) | (122 | ) | |||||||||||||
Heritage Science and Engineering Research Endowment Fund | 49 | (37 | ) | (84 | ) | (47 | ) | (32 | ) | (57 | ) | |||||||||||||
Heritage Scholarship Fund | 71 | (42 | ) | (83 | ) | (41 | ) | (27 | ) | (52 | ) | |||||||||||||
Alberta Social Housing Corporation | (4 | ) | (95 | ) | 23 | 118 | (23 | ) | 8 | |||||||||||||||
Credit Union Deposit Guarantee Corporation | (7 | ) | (13 | ) | (10 | ) | 3 | (16 | ) | (17 | ) | |||||||||||||
Alberta Petroleum Marketing Commission | 487 | 18 | 327 | 309 | 625 | 639 | ||||||||||||||||||
Technology Innovation and Emissions Reduction Fund | (255 | ) | (34 | ) | (277 | ) | (243 | ) | 156 | 95 | ||||||||||||||
Balancing Pool | (144 | ) | (103 | ) | (113 | ) | (10 | ) | (113 | ) | (113 | ) | ||||||||||||
Other | (84 | ) | (32 | ) | (14 | ) | 18 | (16 | ) | (19 | ) | |||||||||||||
Total Retained Income of Funds and Agencies | (1,838 | ) | (2,725 | ) | (3,020 | ) | (295 | ) | (1,798 | ) | (2,565 | ) | ||||||||||||
Other Cash Adjustments | ||||||||||||||||||||||||
SUCH sector own-source revenue | (5,307 | ) | (5,292 | ) | (5,317 | ) | (25 | ) | (5,460 | ) | (5,596 | ) | ||||||||||||
SUCH sector own-source expense | 6,297 | 7,087 | 6,634 | (453 | ) | 6,531 | 6,682 | |||||||||||||||||
Net deferred capital contribution cash adjustment | 126 | 81 | 92 | 11 | (24 | ) | (64 | ) | ||||||||||||||||
Energy royalties (difference between accrued revenue & cash) | 1,705 | 545 | 90 | (455 | ) | 862 | 900 | |||||||||||||||||
Student loans | (453 | ) | (545 | ) | (481 | ) | 65 | (484 | ) | (457 | ) | |||||||||||||
Other cash adjustments | (373 | ) | 95 | 299 | 204 | (429 | ) | (399 | ) | |||||||||||||||
2013 Alberta flood assistance revenue / expense | (69 | ) | 375 | (3 | ) | (378 | ) | 449 | (12 | ) | ||||||||||||||
Wood Buffalo wildfire revenue / expense | (74 | ) | 57 | (3 | ) | (60 | ) | 93 | - | |||||||||||||||
Pension provisions (non-cash expense) | (21 | ) | (322 | ) | (341 | ) | (19 | ) | (358 | ) | (370 | ) | ||||||||||||
Inventory acquisition (excluding SUCH sector; non-cash expense) | (282 | ) | (160 | ) | (162 | ) | (2 | ) | (231 | ) | (236 | ) | ||||||||||||
Inventory consumption (excluding SUCH sector; non-cash expense) | 426 | 158 | 159 | 1 | 258 | 280 | ||||||||||||||||||
Total Other Cash Adjustments | 1,975 | 2,080 | 968 | (1,111 | ) | 1,207 | 728 | |||||||||||||||||
Capital cash adjustments | ||||||||||||||||||||||||
Capital investment (excluding SUCH sector self-financed) | (3,397 | ) | (4,559 | ) | (4,246 | ) | 313 | (4,186 | ) | (3,239 | ) | |||||||||||||
Capital Plan contingency | - | 800 | 800 | - | 800 | 700 | ||||||||||||||||||
Current principal repayments (P3s – public-private partnerships) | (89 | ) | (92 | ) | (92 | ) | - | (98 | ) | (103 | ) | |||||||||||||
Alternative financing (P3s – public-private partnerships) | 52 | 64 | 64 | - | 1 | - | ||||||||||||||||||
Amortization (excluding SUCH sector - non-cash expense) | 1,162 | 1,323 | 1,305 | (18 | ) | 1,396 | 1,482 | |||||||||||||||||
Book value of asset disposals (net non-cash expense / revenue) | 3 | - | - | - | - | - | ||||||||||||||||||
Total Capital Cash Adjustments | (2,269 | ) | (2,464 | ) | (2,169 | ) | 295 | (2,087 | ) | (1,160 | ) | |||||||||||||
Total Cash Adjustments | (2,132 | ) | (3,109 | ) | (4,221 | ) | (1,111 | ) | (2,678 | ) | (2,997 | ) | ||||||||||||
Surplus / (Deficit) plus net cash adjustments | 9,509 | (759 | ) | 1,301 | 2,060 | (541 | ) | (180 | ) | |||||||||||||||
Allocation of Surplus Cash | ||||||||||||||||||||||||
Surplus cash (balance at start of year + surplus +/- net cash adjustments) | 18,367 | 2,885 | 6,437 | 3,552 | 1,068 | - | ||||||||||||||||||
Less: | ||||||||||||||||||||||||
Taxpayer-supported debt repayment | 13,231 | 1,442 | 3,217 | 1,775 | 534 | - | ||||||||||||||||||
Allocation to Alberta Fund | - | 1,443 | 1,610 | 167 | 353 | - | ||||||||||||||||||
Balance at End of Year | 5,136 | - | 1,610 | 1,610 | 181 | - |
30 | 2023-24 Mid-year Fiscal Update and Economic Statement |
Capital Assets
(millions of dollars)
At March 31 | ||||||||||||||||||||
2023 | 2024 | 2025 | 2026 | |||||||||||||||||
Actual
| Budget
| Forecast
| Target
| Target
| ||||||||||||||||
Net book value at start of the year | 58,014 | 59,337 | 59,337 | 60,557 | 61,698 | |||||||||||||||
Additions (capital investment) | 4,108 | 5,184 | 4,903 | 4,690 | 3,695 | |||||||||||||||
Contingency | - | (800 | ) | (800 | ) | (600 | ) | (700 | ) | |||||||||||
Amortization | (2,666 | ) | (2,883 | ) | (2,883 | ) | (2,949 | ) | (2,963 | ) | ||||||||||
Net book value of capital asset disposals / adjustments | (119 | ) | - | - | - | - | ||||||||||||||
Net Book Value at End of Year | 59,337 | 60,838 | 60,557 | 61,698 | 61,730 | |||||||||||||||
Prepaid | 496 | 496 | - | - | - | |||||||||||||||
Inventory | 791 | 917 | 915 | 1,137 | 1,045 | |||||||||||||||
Total Capital and Inventory Assets | 60,624 | 62,251 | 61,472 | 62,835 | 62,775 |
Capital Plan a
(millions of dollars)
2022-23 | 2023-24 | Change fr. | 2024-25 | 2025-26 | ||||||||||||||||||||
Actual
| Budget
| Forecast
| Budget
| Target
| Target
| |||||||||||||||||||
Advanced Education | 478 | 492 | 505 | 13 | 394 | 326 | ||||||||||||||||||
Affordability and Utilities | 6 | 8 | 8 | - | 7 | 5 | ||||||||||||||||||
Agriculture and Irrigation | 48 | 64 | 70 | 6 | 85 | 89 | ||||||||||||||||||
Arts, Culture and Status of Women | 97 | 139 | 139 | - | 88 | 54 | ||||||||||||||||||
Children and Family Services | 11 | 19 | 26 | 7 | 18 | 13 | ||||||||||||||||||
Education | 851 | 765 | 785 | 20 | 794 | 642 | ||||||||||||||||||
Energy and Minerals | 66 | 221 | 228 | 7 | 227 | 340 | ||||||||||||||||||
Environment and Protected Areas | 55 | 112 | 131 | 19 | 67 | 20 | ||||||||||||||||||
Forestry and Parks | 61 | 96 | 100 | 4 | 112 | 55 | ||||||||||||||||||
Health | 841 | 1,273 | 1,178 | (95 | ) | 1,428 | 1,172 | |||||||||||||||||
Indigenous Relations | 28 | 16 | 18 | 2 | 8 | 8 | ||||||||||||||||||
Infrastructure | 301 | 423 | 436 | 13 | 376 | 272 | ||||||||||||||||||
Jobs, Economy and Trade | 2 | 2 | 2 | - | 1 | 1 | ||||||||||||||||||
Justice | 14 | 18 | 24 | 6 | 6 | 5 | ||||||||||||||||||
Mental Health and Addiction | 10 | 18 | 76 | 58 | 84 | 34 | ||||||||||||||||||
Municipal Affairs | 751 | 783 | 798 | 15 | 1,027 | 1,109 | ||||||||||||||||||
Public Safety and Emergency Services | 4 | 6 | 10 | 4 | 5 | 5 | ||||||||||||||||||
Seniors, Community and Social Services | 98 | 142 | 197 | 55 | 111 | 212 | ||||||||||||||||||
Service Alberta and Red Tape Reduction | 23 | 46 | 46 | - | 64 | 52 | ||||||||||||||||||
Technology and Innovation | 68 | 361 | 385 | 24 | 217 | 194 | ||||||||||||||||||
Transportation and Economic Corridors | 1,804 | 2,973 | 2,552 | (421 | ) | 3,105 | 2,566 | |||||||||||||||||
Treasury Board and Finance | 13 | 28 | 28 | - | 27 | 27 | ||||||||||||||||||
Legislative Assembly | 2 | 2 | 2 | - | 2 | 2 | ||||||||||||||||||
Total Capital Plan | 5,633 | 8,005 | 7,744 | (263 | ) | 8,253 | 7,203 |
a | The Capital Plan comprises capital grants included in expense plus capital investment in government-owned assets not included in expense. Capital investment adds to government capital assets, and those assets are depreciated over time through amortization expense included in total expense. |
2023-24 Mid-year Fiscal Update and Economic Statement | 31 |
Capital Investment
(millions of dollars)
2022-23 | 2023-24 | Change fr. | 2024-25 | 2025-26 | ||||||||||||||||||||
Actual
| Budget
| Forecast
| Budget
| Target
| Target
| |||||||||||||||||||
Advanced Education | 478 | 492 | 505 | 13 | 394 | 326 | ||||||||||||||||||
Affordability and Utilities | 1 | 1 | 1 | - | 1 | 1 | ||||||||||||||||||
Agriculture and Irrigation | 4 | 11 | 18 | 7 | 7 | 7 | ||||||||||||||||||
Arts, Culture and Status of Women | 1 | 2 | 2 | - | 2 | 2 | ||||||||||||||||||
Children and Family Services | 10 | 10 | 15 | 5 | 10 | 5 | ||||||||||||||||||
Education | 841 | 762 | 761 | (1 | ) | 781 | 641 | |||||||||||||||||
Energy and Minerals | 13 | 16 | 16 | - | 15 | 15 | ||||||||||||||||||
Environment and Protected Areas | 18 | 59 | 32 | (27 | ) | 58 | 11 | |||||||||||||||||
Forestry and Parks | 57 | 85 | 89 | 4 | 106 | 54 | ||||||||||||||||||
Health | 829 | 1,184 | 1,088 | (96 | ) | 1,186 | 1,072 | |||||||||||||||||
Infrastructure | 300 | 420 | 434 | 14 | 376 | 272 | ||||||||||||||||||
Jobs, Economy and Trade | 2 | 2 | 2 | - | 1 | 1 | ||||||||||||||||||
Justice | 14 | 18 | 24 | 6 | 6 | 5 | ||||||||||||||||||
Mental Health and Addiction | - | - | 3 | 3 | - | 1 | ||||||||||||||||||
Municipal Affairs | 1 | 1 | 6 | 5 | 1 | 1 | ||||||||||||||||||
Public Safety and Emergency Services | 4 | 6 | 10 | 4 | 5 | 5 | ||||||||||||||||||
Seniors, Community and Social Services | 77 | 61 | 84 | 23 | 35 | 31 | ||||||||||||||||||
Service Alberta and Red Tape Reduction | 23 | 46 | 46 | - | 64 | 52 | ||||||||||||||||||
Technology and Innovation | 68 | 132 | 156 | 24 | 126 | 124 | ||||||||||||||||||
Transportation and Economic Corridors | 1,352 | 1,846 | 1,581 | (265 | ) | 1,487 | 1,040 | |||||||||||||||||
Treasury Board and Finance | 13 | 28 | 28 | - | 27 | 27 | ||||||||||||||||||
Legislative Assembly | 2 | 2 | 2 | - | 2 | 2 | ||||||||||||||||||
Total Capital Investment | 4,108 | 5,184 | 4,903 | (281 | ) | 4,690 | 3,695 |
Capital Grants
(millions of dollars)
2022-23 | 2023-24 | Change fr. | 2024-25 | 2025-26 | ||||||||||||||||||||
Actual
| Budget
| Forecast
| Budget
| Target
| Target
| |||||||||||||||||||
Affordability and Utilities | 6 | 7 | 7 | - | 6 | 4 | ||||||||||||||||||
Agriculture and Irrigation | 44 | 52 | 52 | - | 78 | 82 | ||||||||||||||||||
Arts, Culture and Status of Women | 97 | 136 | 137 | 1 | 86 | 52 | ||||||||||||||||||
Children and Family Services | 1 | 9 | 11 | 2 | 8 | 8 | ||||||||||||||||||
Education | 10 | 3 | 24 | 21 | 13 | 1 | ||||||||||||||||||
Energy and Minerals | 53 | 205 | 212 | 7 | 212 | 325 | ||||||||||||||||||
Environment and Protected Areas | 37 | 52 | 99 | 47 | 9 | 9 | ||||||||||||||||||
Forestry and Parks | 4 | 11 | 11 | - | 6 | 1 | ||||||||||||||||||
Health | 11 | 89 | 90 | 1 | 242 | 100 | ||||||||||||||||||
Indigenous Relations | 28 | 16 | 18 | 2 | 8 | 8 | ||||||||||||||||||
Infrastructure | 1 | 3 | 2 | (1 | ) | - | - | |||||||||||||||||
Mental Health and Addiction | 10 | 18 | 73 | 55 | 84 | 33 | ||||||||||||||||||
Municipal Affairs | 750 | 782 | 792 | 10 | 1,026 | 1,108 | ||||||||||||||||||
Seniors, Community and Social Services | 21 | 81 | 113 | 32 | 76 | 181 | ||||||||||||||||||
Technology and Innovation | - | 229 | 229 | - | 91 | 70 | ||||||||||||||||||
Transportation and Economic Corridors | 452 | 1,127 | 971 | (156 | ) | 1,618 | 1,526 | |||||||||||||||||
Total Capital Grants | 1,525 | 2,821 | 2,841 | 21 | 3,563 | 3,508 |
32 | 2023-24 Mid-year Fiscal Update and Economic Statement |
Capital Plan Funding Sources
(millions of dollars)
2022-23 | 2023-24 | Change fr. | 2024-25 | 2025-26 | ||||||||||||||||||||
Actual
| Budget
| Forecast
| Budget
| Target
| Target
| |||||||||||||||||||
Capital Plan, less | 5,633 | 8,005 | 7,744 | (261 | ) | 8,253 | 7,203 | |||||||||||||||||
Non-cash adjustments | 95 | - | 95 | 21 | 13 | |||||||||||||||||||
Capital Plan 10% contingency | - | (800 | ) | (800 | ) | - | (600 | ) | (700 | ) | ||||||||||||||
Funding required | 5,728 | 7,205 | 7,039 | (261 | ) | 7,674 | 6,516 | |||||||||||||||||
Sources of funding: | ||||||||||||||||||||||||
Cash received / assets donated / book value of disposals | 848 | 1,031 | 937 | (94 | ) | 1,209 | 990 | |||||||||||||||||
Retained income of funds and agencies | 16 | 35 | 30 | (5 | ) | 29 | 29 | |||||||||||||||||
SUCH sector self-financed | 716 | 625 | 667 | 42 | 524 | 541 | ||||||||||||||||||
Technology Innovation and Emissions Reduction Fund | 50 | 63 | 63 | - | 58 | 129 | ||||||||||||||||||
Alternative financing (P3s – public-private partnerships) | 52 | 64 | 64 | - | 1 | - | ||||||||||||||||||
General reveune fund cash / direct borrowing | 4,046 | 5,387 | 5,278 | (109 | ) | 5,853 | 4,828 | |||||||||||||||||
Total Capital Plan Funding Sources | 5,728 | 7,205 | 7,039 | (166 | ) | 7,674 | 6,516 |
2023-24 Mid-year Fiscal Update and Economic Statement | 33 |
Historical Fiscal Summary, 2008-09 to 2025-26a
|
| |||||||||||||||||||||||||||||||||||||||||||||||||||||||||||||||||||||||||
(millions of dollars) | 1 | 2 | 3 | 4 | 5 | 6 | 7 | 8 | 9 | 10 | 11 | 12 | 13 | 14 | 15 | 16 | 17 | 18 | ||||||||||||||||||||||||||||||||||||||||||||||||||||||||
2008-09 | 2009-10 | 2010-11 | 2011-12 | 2012-13 | 2013-14 | 2014-15 | 2015-16 | 2016-17 | 2017-18 | 2018-19 | 2019-20 | 2020-21 | 2021-22 | 2022-23 | 2023-24 | 2024-25 | 2025-26 | |||||||||||||||||||||||||||||||||||||||||||||||||||||||||
Statement of Operations | Actual | Forecast | Target | Target | ||||||||||||||||||||||||||||||||||||||||||||||||||||||||||||||||||||||
Revenue | ||||||||||||||||||||||||||||||||||||||||||||||||||||||||||||||||||||||||||
1 | Personal income tax | 8,708 | 7,877 | 7,631 | 8,563 | 9,621 | 10,537 | 11,042 | 11,357 | 10,763 | 10,775 | 11,874 | 11,244 | 11,257 | 13,335 | 13,925 | 15,014 | 15,405 | 16,483 | |||||||||||||||||||||||||||||||||||||||||||||||||||||||
2 | Corporate income tax | 4,252 | 4,754 | 3,334 | 3,678 | 4,756 | 5,488 | 5,796 | 4,195 | 3,769 | 3,448 | 4,871 | 4,107 | 3,037 | 4,718 | 8,167 | 6,800 | 6,894 | 7,103 | |||||||||||||||||||||||||||||||||||||||||||||||||||||||
3 | Other tax revenue | 3,817 | 3,746 | 3,820 | 4,099 | 4,333 | 4,500 | 4,598 | 5,168 | 5,649 | 6,538 | 6,833 | 5,747 | 5,285 | 5,453 | 4,432 | 4,484 | 5,798 | 6,000 | |||||||||||||||||||||||||||||||||||||||||||||||||||||||
4 | Resource revenue | 11,915 | 6,768 | 8,428 | 11,636 | 7,779 | 9,578 | 8,948 | 2,789 | 3,097 | 4,980 | 5,429 | 5,937 | 3,091 | 16,170 | 25,242 | 19,667 | 17,553 | 17,383 | |||||||||||||||||||||||||||||||||||||||||||||||||||||||
5 | Investment income | (1,888 | ) | 3,541 | 2,486 | 2,168 | 2,595 | 3,423 | 3,113 | 2,544 | 3,698 | 3,126 | 2,349 | 2,828 | 2,643 | 3,579 | 1,326 | 3,855 | 3,405 | 3,505 | ||||||||||||||||||||||||||||||||||||||||||||||||||||||
6 | Premiums, fees and licences | 3,356 | 2,857 | 2,922 | 2,931 | 3,184 | 3,437 | 3,564 | 3,574 | 3,701 | 3,839 | 3,911 | 3,929 | 4,021 | 4,520 | 4,657 | 5,049 | 5,277 | 5,352 | |||||||||||||||||||||||||||||||||||||||||||||||||||||||
7 | Other own-source revenue | 4,587 | 4,627 | 4,903 | 5,128 | 5,234 | 5,412 | 6,438 | 5,850 | 3,637 | 6,983 | 6,292 | 3,360 | 3,272 | 8,952 | 7,008 | 6,698 | 6,094 | 5,910 | |||||||||||||||||||||||||||||||||||||||||||||||||||||||
8 | Total own-source revenue | 34,747 | 34,170 | 33,524 | 38,203 | 37,502 | 42,375 | 43,499 | 35,477 | 34,314 | 39,689 | 41,559 | 37,152 | 32,605 | 56,727 | 64,757 | 61,567 | 60,426 | 61,736 | |||||||||||||||||||||||||||||||||||||||||||||||||||||||
9 | Federal transfers | 4,578 | 5,342 | 5,452 | 5,192 | 5,042 | 7,059 | 5,982 | 7,142 | 7,979 | 7,606 | 8,013 | 9,072 | 10,532 | 11,595 | 11,363 | 12,738 | 12,731 | 13,220 | |||||||||||||||||||||||||||||||||||||||||||||||||||||||
10 | Total Revenue | 39,325 | 39,512 | 38,976 | 43,395 | 42,544 | 49,434 | 49,481 | 42,619 | 42,293 | 47,295 | 49,572 | 46,224 | 43,137 | 68,322 | 76,120 | 74,305 | 73,157 | 74,956 | |||||||||||||||||||||||||||||||||||||||||||||||||||||||
Expense by Function | ||||||||||||||||||||||||||||||||||||||||||||||||||||||||||||||||||||||||||
11 | Health | 13,674 | 14,636 | 15,393 | 16,284 | 17,254 | 17,967 | 19,366 | 20,115 | 20,687 | 21,239 | 21,921 | 22,408 | 23,984 | 25,143 | 25,486 | 27,070 | 28,046 | 28,199 | |||||||||||||||||||||||||||||||||||||||||||||||||||||||
12 | Basic / advanced education | 10,438 | 11,067 | 11,362 | 11,951 | 12,394 | 12,782 | 13,103 | 13,673 | 14,110 | 14,471 | 14,848 | 14,971 | 14,134 | 14,308 | 15,220 | 16,110 | 16,336 | 16,601 | |||||||||||||||||||||||||||||||||||||||||||||||||||||||
13 | Social services | 3,417 | 3,807 | 4,129 | 4,278 | 4,641 | 4,668 | 4,548 | 4,752 | 5,198 | 5,592 | 5,867 | 6,203 | 5,919 | 5,992 | 7,222 | 8,133 | 7,998 | 8,443 | |||||||||||||||||||||||||||||||||||||||||||||||||||||||
14 | Other program expense | 10,386 | 9,834 | 9,443 | 9,853 | 10,528 | 12,970 | 11,031 | 10,375 | 12,607 | 13,189 | 11,866 | 12,893 | 13,858 | 1,668 | 13,743 | 14,655 | 15,745 | 15,869 | |||||||||||||||||||||||||||||||||||||||||||||||||||||||
15 | Total program expense | 37,915 | 39,344 | 40,327 | 42,366 | 44,817 | 48,387 | 48,048 | 48,915 | 52,602 | 54,491 | 54,502 | 56,475 | 57,895 | 62,131 | 61,671 | 65,968 | 68,125 | 69,112 | |||||||||||||||||||||||||||||||||||||||||||||||||||||||
16 | Debt servicing costs | 208 | 214 | 472 | 509 | 530 | 601 | 722 | 776 | 1,018 | 1,420 | 1,971 | 2,235 | 2,486 | 2,641 | 2,829 | 3,157 | 3,253 | 3,398 | |||||||||||||||||||||||||||||||||||||||||||||||||||||||
17 | Pension provisions | 2,133 | 430 | 439 | 634 | 296 | 748 | (404 | ) | (630 | ) | (543 | ) | (593 | ) | (190 | ) | (334 | ) | (282 | ) | (365 | ) | (21 | ) | (341 | ) | (358 | ) | (370 | ) | |||||||||||||||||||||||||||||||||||||||||||
18 | Total Expense | 40,256 | 39,988 | 41,238 | 43,509 | 45,643 | 49,736 | 48,366 | 49,061 | 53,077 | 55,318 | 56,283 | 58,376 | 60,099 | 64,407 | 64,479 | 68,784 | 71,020 | 72,140 | |||||||||||||||||||||||||||||||||||||||||||||||||||||||
19 | Surplus / (Deficit) | (931 | ) | (476 | ) | (2,262 | ) | (114 | ) | (3,099 | ) | (302 | ) | 1,115 | (6,442 | ) | (10,784 | ) | (8,023 | ) | (6,711 | ) | (12,152 | ) | (16,962 | ) | 3,915 | 11,641 | 5,521 | 2,137 | 2,816 | |||||||||||||||||||||||||||||||||||||||||||
Capital Plan b | 7,943 | 8,000 | 7,544 | 6,884 | 6,062 | 5,770 | 6,181 | 6,558 | 6,578 | 9,021 | 6,057 | 5,545 | 6,896 | 6,622 | 5,633 | 7,744 | 8,253 | 7,203 | ||||||||||||||||||||||||||||||||||||||||||||||||||||||||
Statement of Financial Position (at March 31) |
| |||||||||||||||||||||||||||||||||||||||||||||||||||||||||||||||||||||||||
20 | Heritage / endowment funds | 16,900 | 17,077 | 17,500 | 17,936 | 18,176 | 18,562 | 18,860 | 19,262 | 19,836 | 20,306 | 20,700 | 20,670 | 21,090 | 22,176 | 23,920 | 25,646 | 26,690 | 28,294 | |||||||||||||||||||||||||||||||||||||||||||||||||||||||
21 | Contingency Account | 16,822 | 14,983 | 11,192 | 7,497 | 3,326 | 4,658 | 6,529 | 3,625 | 2,299 | 1,661 | 6,342 | - | - | - | - | - | - | - | |||||||||||||||||||||||||||||||||||||||||||||||||||||||
22 | Other financial assets | 28,868 | 30,338 | 30,799 | 32,972 | 34,734 | 40,039 | 40,688 | 40,990 | 44,152 | 49,010 | 48,701 | 55,711 | 56,996 | 55,950 | 55,570 | 56,578 | 54,806 | 55,893 | |||||||||||||||||||||||||||||||||||||||||||||||||||||||
23 | Taxpayer-supported Capital Plan liabilities | (880 | ) | (2,888 | ) | (3,199 | ) | (3,442 | ) | (4,594 | ) | (8,724 | ) | (11,922 | ) | (19,040 | ) | (23,769 | ) | (29,339 | ) | (33,597 | ) | (37,188 | ) | (42,733 | ) | (47,529 | ) | (45,525 | ) | (45,512 | ) | (45,430 | ) | (45,342 | ) | |||||||||||||||||||||||||||||||||||||
24 | Taxpayer-supported operating debt / pre-1992 TPP debt | (1,160 | ) | (2,279 | ) | (2,015 | ) | (1,676 | ) | (1,426 | ) | (1,333 | ) | (1,053 | ) | (1,024 | ) | (10,751 | ) | (19,227 | ) | (29,060 | ) | (36,954 | ) | (50,303 | ) | (45,595 | ) | (33,763 | ) | (30,556 | ) | (30,032 | ) | (30,042 | ) | |||||||||||||||||||||||||||||||||||||
25 | Self-supported debt | (7,921 | ) | (9,300 | ) | (11,010 | ) | (12,707 | ) | (14,116 | ) | (15,775 | ) | (16,592 | ) | (17,373 | ) | (17,822 | ) | (17,848 | ) | (18,134 | ) | (18,066 | ) | (18,389 | ) | (17,028 | ) | (17,596 | ) | (17,919 | ) | (18,324 | ) | (18,254 | ) | |||||||||||||||||||||||||||||||||||||
26 | Total Debt c | (9,961 | ) | (14,467 | ) | (16,224 | ) | (17,825 | ) | (20,136 | ) | (25,832 | ) | (29,567 | ) | (37,437 | ) | (52,342 | ) | (66,414 | ) | (80,791 | ) | (92,208 | ) | (111,425 | ) | (110,152 | ) | (96,884 | ) | (93,987 | ) | (93,786 | ) | (93,638 | ) | |||||||||||||||||||||||||||||||||||||
27 | Pension obligations | (10,239 | ) | (9,483 | ) | (9,922 | ) | (10,556 | ) | (10,852 | ) | (11,600 | ) | (11,196 | ) | (10,566 | ) | (10,023 | ) | (9,430 | ) | (9,240 | ) | (8,918 | ) | (8,636 | ) | (8,287 | ) | (8,272 | ) | (7,931 | ) | (7,592 | ) | (7,244 | ) | |||||||||||||||||||||||||||||||||||||
28 | Other liabilities | (10,689 | ) | (11,131 | ) | (11,692 | ) | (11,033 | ) | (10,793 | ) | (12,795 | ) | (12,260 | ) | (11,955 | ) | (12,823 | ) | (14,477 | ) | (13,189 | ) | (15,399 | ) | (17,553 | ) | (18,680 | ) | (19,948 | ) | (21,093 | ) | (20,110 | ) | (20,427 | ) | |||||||||||||||||||||||||||||||||||||
29 | Net Financial Assets / (Debt) | 31,701 | 27,317 | 21,653 | 18,991 | 14,455 | 13,032 | 13,054 | 3,919 | (8,901 | ) | (19,344 | ) | (27,477 | ) | (40,144 | ) | (59,528 | ) | (58,993 | ) | (45,614 | ) | (40,788 | ) | (39,993 | ) | (37,122 | ) | |||||||||||||||||||||||||||||||||||||||||||||
30 | Capital / non-fin. assets (less def. cap. contributions starting 2012-13) | 30,275 | 34,217 | 37,607 | 40,122 | 39,517 | 40,839 | 42,197 | 44,623 | 46,622 | 49,015 | 50,744 | 51,570 | 53,767 | 55,745 | 56,928 | 57,624 | 58,966 | 58,911 | |||||||||||||||||||||||||||||||||||||||||||||||||||||||
31 | Net Assets d | 61,976 | 61,534 | 59,260 | 59,113 | 53,972 | 53,871 | 55,251 | 48,542 | 37,721 | 29,671 | 23,267 | 11,426 | (5,761 | ) | (3,248 | ) | 11,314 | 16,836 | 18,973 | 21,789 | |||||||||||||||||||||||||||||||||||||||||||||||||||||
Energy prices and exchange rate |
| |||||||||||||||||||||||||||||||||||||||||||||||||||||||||||||||||||||||||
32 | Oil price (WTI US$/bbl) | 85.94 | 70.71 | 83.38 | 97.33 | 92.07 | 99.05 | 80.48 | 45.00 | 47.93 | 53.69 | 62.77 | 54.85 | 42.32 | 77.03 | 89.69 | 79.00 | 76.00 | 73.50 | |||||||||||||||||||||||||||||||||||||||||||||||||||||||
33 | Heavy oil price (WCS @ Hardisty; Cdn$/bbl) | 74.36 | 66.08 | 66.70 | 80.72 | 68.48 | 80.11 | 70.78 | 40.86 | 44.67 | 50.38 | 51.65 | 53.14 | 41.42 | 79.63 | 90.62 | 84.00 | 79.30 | 75.10 | |||||||||||||||||||||||||||||||||||||||||||||||||||||||
34 | Natural gas price (ARP; Cdn$/GJ) | 6.97 | 3.58 | 3.28 | 2.98 | 2.28 | 3.28 | 3.51 | 2.21 | 2.01 | 1.82 | 1.34 | 1.39 | 2.10 | 3.48 | 4.63 | 2.50 | 3.00 | 3.60 | |||||||||||||||||||||||||||||||||||||||||||||||||||||||
35 | Exchange rate (US¢/Cdn$) | 89.60 | 91.90 | 98.40 | 100.70 | 99.90 | 95.00 | 88.00 | 76.50 | 76.20 | 78.00 | 76.30 | 75.20 | 75.70 | 79.80 | 75.60 | 74.10 | 76.40 | 78.60 |
a | Numbers are not strictly comparable due to numerous accounting policy changes over time. 2019-20 expense by function have been re-classified following re-organizations and other adjustments. |
b | Reflects capital grants and other support included in expense, and capital investment in government-owned assets not included in expense. Capital investment adds to capital assets, which are depreciated over time through amortization expense. |
Numbers for 2008-09 to 2013-14 are estimates as details required to consolidate SUCH sector capital spending with full accuracy are not readily available. |
c | Does not include capital lease liabilities, or debt issued on behalf of government business enterprises which is reported on a net equity basis in Other Financial Assets. |
d | The change in net assets / (debt) year over year does not match the surplus / (deficit) exactly in most years, due to various balance sheet adjustments, most of which are minor. A significant adjustment reducing net assets by $2 billion was made in 2012-13, to recognize the accumulated deferred capital contribution liability when the accounting standard was adopted. |
34 | 2023-24 Mid-year Fiscal Update and Economic Statement |
Reporting Methodology and Legislative Compliance
Method of Consolidation
The 2023-24 Mid-year Fiscal Update and Economic Statement reports on the same scope, using the same method of consolidation, as presented in Budget 2023. This is also the same scope and consolidation approach used in the Consolidated Financial Statements in the Government of Alberta Annual Report.
The results of all government departments, funds and agencies, except those designated as government business enterprises, are consolidated on a line-by-line basis. Revenue and expense transactions between consolidated entities have been eliminated.
The accounts of provincial agencies designated as government business enterprises are included on the modified equity basis, computed in accordance with International Financial Reporting Standards applicable to those entities.
Basis of Financial Reporting
The consolidated fiscal summary reports revenue (including gains from disposal of tangible capital assets), expense (including amortization, inventory consumption, loss on disposal and write-down of tangible capital assets), and surplus / (deficit).
Revenue and expense are recorded using the accrual basis of accounting. Cash received for goods or services which have not been provided by period end is recorded as unearned revenue.
Transfers received for capital purposes, and donated capital assets, are recorded as “deferred capital contributions” when the cash or asset is received, and recognized in revenue over the related asset’s useful life (in effect matching the asset’s amortization expense).
Expense includes the province’s cash payments towards the unfunded pension liabilities, and the non-cash change in unfunded pension liabilities.
Debt servicing costs include interest payable, and amortization of issue costs and discounts / premiums on debt issues.
Assets and liabilities include recognition of asset retirement obligations and accumulated remeasurement gains and losses.
Compliance with Legislation
The Sustainable Fiscal Planning and Reporting Act (SFPRA) requires a report to be published on the accuracy of the Fiscal Plan for a fiscal year on or before November 30. The FPTA gives the President of Treasury Board and Minister of Finance discretion over the form of the report.
The 2023-24 Mid-year Fiscal Update and Economic Statement includes comparisons between the Budget 2023 estimates and second quarter forecasts for revenue and expense (including details and categories of each); the surplus / (deficit); cash adjustments and balance; a summary balance sheet; the Capital Plan; and borrowing requirements and sources. An updated Alberta economic outlook, with associated assumptions, is also provided.
The forecast provided in this report is in compliance with the requirements of the SFPRA.
2023-24 Mid-year Fiscal Update and Economic Statement | 35 |