Exhibit 99.2
GOVERNMENT OF ALBERTA
|
2023-24 Final Results
Year-end Report
June 2024 |
Table of Contents
2023–24 Final Results | ||||
Fiscal Plan Highlights | 3 | |||
Consolidated Fiscal Summary | 3 | |||
Revenue Highlights | 4 | |||
Revenue | 4 | |||
Expense Highlights | 6 | |||
Total Expense | 7 | |||
Fiscal Framework | 9 | |||
Net Financial and Capital Assets | 11 | |||
Balance Sheet | 12 | |||
Economic and Tax Highlights | 13 | |||
Historical Fiscal Summary | 14 | |||
Annual Infrastructure Report | 15 |
Note: Amounts presented in tables may not add to totals due to rounding.
Note on restatements and accounting policy changes:
• | 2022-23 Actual and 2023-24 Budget numbers have been restated to reflect the revised government structure under the Government Organization Act (Order in Council 156/2023, June 9, 2023 and Order in Council 029/2024, February 16, 2024). |
• | Effective April 1, 2023, the Province adopted the Public Private Partnerships (P3) standard. This standard provides guidance on how to account for public private partnerships between public and private sector entities, where the public sector entity procures infrastructure using a private sector partner. The Province used prospective application to adopt this standard, except for P3 contracts entered prior to April 1, 2023, of which retroactive application is used without restating prior year comparatives. As a result, the reported opening net book value of tangible capital assets decreased by $415 million and opening P3 liabilities decreased by $353 million. |
• | Effective April 1, 2023, the Province adopted the Revenue standard. This standard provides guidance on how to account for and report revenue, and specifically differentiates between revenue arising from exchange and non-exchange transactions. The Province used prospective application to adopt this standard. As a result, 2023 comparatives are not restated. |
• | Effective April 1, 2023, the Province adopted the Purchased Intangibles guideline. The Province used prospective application to adopt this guideline. As a result, 2023 comparatives are not restated. |
Treasury Board and Finance, Government of Alberta
2023–24 Final Results Year-end Report, June 2024
Additional copies of this report may be obtained by visiting our website at: www.alberta.ca/budget-documents.aspx
2 | 2023-24 Final Results | Year-End Report |
2023–24 Final Results
Fiscal Plan Highlights
The 2023-24 final results were a $4.3 billion surplus, an increase of $1.9 billion from budget, and a decrease of $7.4 billion from 2022-23.
Budget 2023 was developed as Alberta’s economy gained momentum after some challenging years. It focused on securing Alberta’s future by strengthening health care, addressing affordability, growing the economy, supporting job creation, and keeping Albertans and communities safe.
Budget 2023 introduced a new fiscal framework requiring balanced budgets, limiting operating expense growth, and setting out rules for the allocation of surplus cash to pay down maturing debt, save for the future, and invest in areas and services important to Albertans. Amendments were also made to the Alberta Heritage Savings Trust Fund to allow it to retain 100 per cent of its net income. The fair value of its net financial assets grew from $21.2 billion at March 31, 2023 to $22.9 billion at March 31, 2024.
Revenue in 2023-24 was higher than budget, driven by solid gains in Alberta’s labour market underpinned by robust growth in Alberta’s population, and carry-forward effects of record-high income tax revenue in 2022-23. Expense increases in 2023-24 were mainly for health care, affordability measures, enrolment growth in K-12 and post-secondary education, and disaster and emergency spending.
Total Revenue was $74.7 billion, $4.1 billion more than budget, but $1.4 billion less than 2022-23.
• | Change from Budget. Consists of increases of $1.8 billion in tax revenue, $0.9 billion in non-renewable resource revenue (NRR), $1.4 billion in investment income, $1.6 billion in other revenue, and decreases of $1.5 billion in government business enterprise (GBE) net income, and $0.2 billion in federal transfers. |
• | Change from 2022-23. Comprises decreases of $6 billion in NRR, $1.2 billion in GBE net income, and increases of $0.2 billion in tax |
revenue, $3.2 billion in investment income, $1 billion in federal government transfers, and $1.4 billion in other revenue. |
Total Expense was $70.4 billion, $6 billion more than 2022-23 and up $2.1 billion from budget. Budget 2023 included a contingency of $1.5 billion for disaster and emergency assistance.
• | Change from Budget. Increases of $1.1 billion in operating expense, $3 billion in disaster assistance and $0.2 billion in debt servicing, pension and other expense, partially offset by decreases of $0.7 billion in capital grants netted against the $1.5 billion contingency. |
• | Change from 2022-23. Increases of $3.4 billion in operating expense, $0.6 billion of capital grants, $1.7 billion in disaster assistance, and $0.2 billion in debt servicing, pension and other expense. |
• | Capital Plan. Support for infrastructure in 2023-24 was $6.3 billion, $1.7 billion below budget. |
Consolidated Fiscal Summary
Change from | ||||||||||||||||||||||
(millions of dollars) | 2023-24 | 2022-23 | 2022-23 | |||||||||||||||||||
INCOME STATEMENT | Budget | Actual | Actual | Budget | Actual | |||||||||||||||||
Revenue | ||||||||||||||||||||||
1 | Personal income tax | 14,069 | 15,160 | 13,925 | 1,091 | 1,235 | ||||||||||||||||
2 | Corporate income tax | 5,911 | 7,044 | 8,167 | 1,133 | (1,123) | ||||||||||||||||
3 | Other taxes | 5,012 | 4,543 | 4,432 | (469) | 111 | ||||||||||||||||
4 | Non-renewable resource revenue | 18,361 | 19,287 | 25,242 | 926 | (5,955) | ||||||||||||||||
5 | Transfers from Government of Canada | 12,552 | 12,336 | 11,363 | (216) | 973 | ||||||||||||||||
6 | Investment income | 3,154 | 4,581 | 1,334 | 1,427 | 3,247 | ||||||||||||||||
7 | Net income / (loss) from government business enterprises | 2,727 | 1,237 | 2,481 | (1,490) | (1,244) | ||||||||||||||||
8 | Premiums, fees and licences | 5,040 | 5,565 | 4,672 | 525 | 893 | ||||||||||||||||
9 | Other revenue | 3,827 | 4,979 | 4,527 | 1,152 | 452 | ||||||||||||||||
10 | Total Revenue | 70,653 | 74,732 | 76,143 | 4,079 | (1,411) | ||||||||||||||||
Expense | ||||||||||||||||||||||
11 | Operating expense | 57,038 | 58,143 | 54,760 | 1,105 | 3,383 | ||||||||||||||||
12 | Capital grants | 2,821 | 2,103 | 1,525 | (718) | 578 | ||||||||||||||||
13 | Disaster and emergency assistance | - | 3,025 | 1,319 | 3,025 | 1,706 | ||||||||||||||||
14 | Capital amort. / inventory consump. / asset disposal losses | 4,418 | 4,399 | 4,090 | (19) | 309 | ||||||||||||||||
15 | Debt servicing costs - general | 1,610 | 1,826 | 1,484 | 216 | 342 | ||||||||||||||||
16 | Debt servicing costs - Capital Plan | 1,238 | 1,323 | 1,345 | 85 | (22) | ||||||||||||||||
17 | Pension provisions / (recovery) | (322) | (372) | (21) | (50) | (351) | ||||||||||||||||
18 | Contingency | 1,500 | - | - | (1,500) | - | ||||||||||||||||
19 | Total Expense | 68,303 | 70,447 | 64,502 | 2,144 | 5,945 | ||||||||||||||||
20 | Surplus / (Deficit) | 2,350 | 4,285 | 11,641 | 1,935 | (7,356) | ||||||||||||||||
CAPITAL PLAN | ||||||||||||||||||||||
21 | Capital grants | 2,821 | 2,103 | 1,525 | (718) | 578 | ||||||||||||||||
22 | Capital investment | 5,184 | 4,197 | 4,108 | (987) | 89 | ||||||||||||||||
23 | Total Capital Plan | 8,005 | 6,300 | 5,633 | (1,705) | 667 |
2023-24 Final Results | Year-End Report | 3 |
Revenue Highlights
Total Revenue
• | Total revenue was $74.7 billion in 2023-24, an increase of $4.1 billion from Budget 2023 but a decrease of $1.4 billion from 2022-23. The increase from budget was primarily due to higher income tax revenue and investment income, whereas the decrease from the prior year was due to lower resource revenue, partially offset by increased investment income. |
• | Revenue was $0.9 billion lower than the third quarter forecast. Changes included: |
- | Corporate income tax revenue was $0.2 billion lower due to lower- than-expected year-end settlement payments. Personal income tax revenue also decreased $79 million following a downward revision to personal income growth in 2023. |
- | Federal transfers decreased by a net $0.3 billion, with lower transfers for municipal infrastructure projects due to the timing of completions, delays in approval of federal financial assistance for 2023 disaster events, and lower than forecast spending on child care programs. |
- | Net income from GBEs decreased by $1.3 billion following an adjustment to the Sturgeon Refinery Processing Agreement Provision. |
- | Other revenue increased by a net $0.8 billion, primarily due to Northwest Territories wildfire assistance reimbursements, refunds of prior-year over-accrued expenditures, and an accounting standards adjustment. |
Non-Renewable Resource Revenue
• | Non-renewable resource revenue was $19.3 billion, an increase of $0.9 billion from Budget 2023 but a decrease of $6 billion from the record high in 2022-23, reflecting the drop in oil prices from the prior year. The increase from budget was primarily due to a narrower light-heavy differential than expected and a lower exchange rate. |
• | The West Texas Intermediate (WTI) oil price averaged US$77.83 per barrel (/ bbl) in 2023-24, $1.33 less than estimated in Budget 2023, but $11.86 lower than in 2022-23. Total crude oil production was up 2% from budget. |
• | The light-heavy oil price differential averaged US$17.29/bbl. This was $2.21 narrower than budget and $3.48 narrower than 2022-23, influenced by an increased demand for heavier crude and the additional egress capacity from the anticipated completion of TMX. |
• | The US-Canadian dollar exchange rate averaged US¢74/ Cdn$ in 2023-24, two cents lower than estimated in budget and the 2022-23 average. As oil is priced in US dollars, a lower exchange rate increases Canadian dollar revenue. |
• | Natural gas prices were also lower: The Alberta Reference Price (ARP) averaged Cdn$2.07 per gigajoule in 2023-24, $2.03 below budget and $2.56 below 2022-23. The price decrease in natural gas was mainly driven by robust production, higher storage levels and a mild winter hampering demand. |
• | Bitumen royalties were $14.5 billion, $2 billion more than budget but $2.4 billion lower than in 2022-23. Conventional crude oil royalties were $3 billion in 2023-24, slightly higher than budget, but $1 billion lower than in 2022-23. Bitumen and conventional oil production volumes were both close to budget. |
• | Natural gas and by-product royalties were $1.1 billion, down $1.4 billion from budget and $2.5 billion from 2022-23, following the downward trend in oil and gas prices. |
• | Crown land lease sales increased by $0.2 billion from budget as higher prices per hectare sold outweighed a decrease in the number of oil sands hectares sold. |
Change from | ||||||||||||||||||||||||
Revenue | 2023-24 | 2022-23 | 2022-23 | |||||||||||||||||||||
(millions of dollars) | Budget | Actual | Actual | Budget | Actual | |||||||||||||||||||
1 | Personal income tax | 14,069 | 15,160 | 13,925 | 1,091 | 1,235 | ||||||||||||||||||
2 | Corporate income tax | 5,911 | 7,044 | 8,167 | 1,133 | (1,123) | ||||||||||||||||||
3 | Education property tax | 2,504 | 2,526 | 2,537 | 22 | (11) | ||||||||||||||||||
4 | Other taxes | 2,508 | 2,017 | 1,895 | (491) | 122 | ||||||||||||||||||
5 | Bitumen royalties | 12,555 | 14,518 | 16,879 | 1,963 | (2,361) | ||||||||||||||||||
6 | Other non-renewable resource revenue | 5,806 | 4,769 | 8,363 | (1,037) | (3,594) | ||||||||||||||||||
7 | Canada Social Transfer / Canada Health Transfer | 8,021 | 7,872 | 7,371 | (149) | 501 | ||||||||||||||||||
8 | Other transfers from Government of Canada | 4,531 | 4,464 | 3,992 | (67) | 472 | ||||||||||||||||||
9 | Heritage / endowment fund investment income | 1,578 | 2,592 | 7 | 1,014 | 2,585 | ||||||||||||||||||
10 | Other investment income | 1,576 | 1,989 | 1,327 | 413 | 662 | ||||||||||||||||||
11 | Net income / (loss) from government business enterprises | 2,727 | 1,237 | 2,481 | (1,490) | (1,244) | ||||||||||||||||||
12 | Post-secondary institution tuition fees | 1,771 | 1,836 | 1,603 | 65 | 233 | ||||||||||||||||||
13 | Other premiums, fees and licences | 3,269 | 3,729 | 3,069 | 460 | 660 | ||||||||||||||||||
14 | SUCH sector sales, rentals / fundraising, donations | 1,577 | 1,911 | 1,598 | 334 | 313 | ||||||||||||||||||
15 | Other revenue | 2,250 | 3,068 | 2,929 | 818 | 139 | ||||||||||||||||||
16 Total Revenue | 70,653 | 74,732 | 76,143 | 4,079 | (1,411) |
4 | 2023-24 Final Results | Year-End Report |
Oil and Natural Gas Prices 2019-24
| strong performance of global equity markets. Other investment income also increased with favorable market conditions, higher interest rates, and realized gains on investment sales.
Other Revenue
• Net income from GBEs was $1.2 billion, $1.5 billion lower than budget and $1.2 billion lower than in 2022-23. The majority of the change from prior year was in the Alberta Petroleum Marketing Corporation (APMC) where a $1.3 billion non-cash adjustment to the Sturgeon Refinery Processing Agreement Provision was recognized. The additional decrease from budget was due to a larger loss than was budgeted at the Sturgeon Refinery due to weaker commodity prices.
• Premiums, fees and licences revenue was $5.6 billion, an increase of $0.5 billion from budget and $0.9 billion from 2022-23. These increases came from higher post-secondary institution tuition fees revenue due to rate and enrolment increases, higher revenue for Alberta Health Services (AHS) fees, and an increase in motor vehicle licences revenue recorded following an accounting standards change on the recognition of unearned revenue.
• Other revenue was $5 billion, an increase of $1.2 billion from budget and $0.5 billion from 2022-23. Changes from budget comprised increases in the Technology Innovation and Emissions Reduction Fund compliance payments, SUCH sector sales, services, fundraising and donations revenue, gains on sales of government properties, and refunds of prior-year over-accrued expense, offset partially by lower revenue from traffic fines and other sources. | |||
Tax Revenue
• Total tax revenue was $26.7 billion, $1.8 billion greater than estimated in Budget 2023 and $0.2 billion more than in 2022-23.
• Personal income tax (PIT) revenue was $15.2 billion, $1.1 billion higher than budget, and $1.2 billion greater than 2022-23, driven by robust growth in Alberta’s labour market in 2023, underpinned by record-high population growth. Indexation of the PIT tax system to inflation continued, saving Albertans around $680 million in 2023-24.
• Corporate income tax (CIT) revenue was $7 billion, $1.1 billion greater than Budget 2023 but $1.1 billion less than the record high CIT recorded in 2022-23, following a softening of corporate profits on the back of weaker commodity prices. The increase from budget is due to the base-year effects of the high revenue recorded in 2022-23 and industry fundamentals that held up through 2023.
• Education property and other tax revenue was $4.5 billion, $0.5 billion lower than budget but slightly higher than in 2022-23. Fuel tax relief is provided when the average price of WTI is US$80/bbl or higher. Fuel tax was fully paused for the first nine months of the fiscal year and applied at a reduced rate for the remaining |
three months, and was the primary reason for the decrease in other tax revenue from budget.
Transfers from Government of Canada
• Federal government transfers totaled $12.3 billion, $0.2 billion lower than Budget 2023, but $1.0 billion higher than 2022-23. The decrease from budget is mainly from lower infrastructure support revenue due to municipal project delays, a lower than expected Canada Health Transfer (CHT), and lower child care transfers, with some offsetting increases in agriculture support and other transfers. The increase from the prior year was primarily due to a $0.5 billion increase in the CHT following growth in Alberta’s population, as well as increases in agriculture support and the Canada-Alberta Early Learning and Child Care agreement.
Investment Income
• Investment income was $4.6 billion, $1.4 billion greater than estimated in budget and $3.2 billion greater than in 2022-23. Income of the Heritage and endowment funds increased $1 billion relative to budget and $2.6 billion relative to the prior year, as financial markets experienced a significant recovery from 2022-23, driven by the |
Energy Prices and Exchange Rates
Fiscal year averages, 2008-09 to 2023-24
08-09 | 09-10 | 10-11 | 11-12 | 12-13 | 13-14 | 14-15 | 15-16 | 16-17 | 17-18 | 18-19 | 19-20 | 20-21 | 21-22 | 22-23 | 23-24 | |||||||||||||||||||||||||||||||||||||||||||||||||
Oil Price (WTI US$/bbl) | 85.94 | 70.71 | 83.38 | 97.33 | 92.07 | 99.05 | 80.48 | 45.00 | 47.93 | 53.69 | 62.77 | 54.85 | 42.32 | 77.03 | 89.69 | 77.83 | ||||||||||||||||||||||||||||||||||||||||||||||||
WCS @ Hardisty (Cdn$/bbl) | 74.36 | 66.08 | 66.70 | 80.72 | 68.48 | 80.11 | 70.78 | 40.86 | 44.67 | 50.38 | 51.65 | 53.14 | 41.42 | 79.63 | 90.62 | 81.67 | ||||||||||||||||||||||||||||||||||||||||||||||||
Natural Gas Price (Cdn$/GJ) | 6.97 | 3.58 | 3.28 | 2.98 | 2.28 | 3.28 | 3.51 | 2.21 | 2.01 | 1.82 | 1.34 | 1.39 | 2.10 | 3.48 | 4.63 | 2.07 | ||||||||||||||||||||||||||||||||||||||||||||||||
Exchange rate (US¢/Cdn$) | 89.6 | 91.9 | 98.4 | 100.7 | 99.9 | 95.0 | 88.0 | 76.5 | 76.2 | 78.0 | 76.3 | 75.2 | 75.7 | 80.0 | 75.6 | 74.2 |
2023-24 Final Results | Year-End Report | 5 |
Expense Highlights
Total expense was $70.4 billion in 2023-24, comprising $58.1 billion in operating expense, $2.1 billion in capital grants, $3 billion in disaster assistance, $4.1 billion in other expense (including amortization, inventory consumption, loss on disposal and pension), and $3.1 billion in debt servicing costs.
Budget-to-actual changes. Expense was $2.1 billion higher than budget, net of the $1.5 billion contingency:
• | Operating expense. $1.1 billion increase, primarily due to enrolment growth in K-12 education and post-secondary institutions, and pressures in Alberta’s health care system, offset by decreases in affordability supports and reprofiling of TIER funding. |
• | Capital grants. $0.7 billion decrease, primarily due to slower progress on municipal transportation and water infrastructure projects, re-profiling projects to future years, and delays in the Alberta Broadband Strategy. |
• | Disaster assistance. $3 billion increase budget, primarily for crop insurance indemnities as a result of province-wide drought conditions and 2023 Alberta wildfires. |
• | Other expense. $0.2 billion increase. Increases of $0.3 billion in debt servicing costs partially offset by a decrease of $50 million in lower reduction to pension liabilities. |
Year-over-year comparison. Expense was $5.9 billion higher than 2022-23:
• | Operating expense. A $3.4 billion net increase. Operating expense was higher in most ministries. The strong economic recovery, population increase, compensation settlements and other price inflation had an impact on the cost of programs and services. |
• | Capital grants. $0.6 billion higher due to LRT projects progressing and additional progress on the Alberta Petrochemical Incentive Program projects. |
• | Disaster assistance. $1.7 billion increase from the extreme wildfire season and higher support to crop and |
livestock producers in 2023-24 than in 2022-23, partially offset by decrease to hail insurance. |
• | Other expense. $0.3 billion net increase, comprised of $252 million inventory consumption, $320 million in debt servicing costs, offset by a $351 million higher reduction to pension liabilities. |
Third Quarter forecast-to-actual changes. Expense was $53 million higher than the third quarter forecast: $267 million higher operating expense mainly for higher expense for post-secondary institutions and third party external investment management fees, partially offset by child care and other programs, and $272 million lower capital grants mostly for the Calgary and Edmonton LRT projects and municipal water projects.
Ministry Expense
Total expense includes operating (shown by ministry in facing table), as well as other types of expense (e.g. capital grants, amortization, loss on disposal), for which only major ministries are individually displayed in the table. The remainder are grouped into “Other.”
Health
Total expense of $27.2 billion, includes $25.2 billion in operating expense and $2 billion in other expense. This was $0.8 billion higher than budget and $2 billion higher than 2022-23.
• | The increase from Budget 2023 is due to physician compensation, higher use of agency nursing, overtime, additional finance and human resource costs related to the transition of lab services from DynaLIFE to AHS; higher utility costs; partially offset by program savings in Community Care, Home Care and EMS. |
• | Increases from 2022-23 include physician compensation, higher overtime, recruitment challenges, increased healthcare activity in acute care, diagnostics, community care, continuing care and home care, DynaLIFE transition, priority |
initiatives including Continuing Care Transformation, physician costs, and expanded pharmaceutical services. |
Education
Total expense was $9.4 billion, up $556 million from 2022-23 and $82 million from budget.
• | The change from 2022-23 includes an increase of $549 million in operating expense, primarily due to increased enrolment that has led to higher costs for teachers and instructional support staff including educational assistants. There have also been increases in services contracts and supplies that support student learning. |
• | The increase from budget comprises higher operating expense, primarily for supplemental enrolment growth to address the unprecedented population growth in Alberta in 2023-24, an increase in consumption of inventory, increased capital grants which includes funding for Charter Hubs. |
Advanced Education
Total expense was $6.8 billion, an increase of $286 million from budget and $528 million from 2022-23. The increases are primarily due to support enrolment growth, student loan provisions due to higher than expected default rate, increase in Student Aid grants due to higher than expected demand to private career colleges, and to reflect the cost of compensation for post secondary institutions.
Seniors, Community and Social Services
Expense was $5.5 billion, $61 million higher than budget and $561 million higher than 2022-23. The increases were primarily due to Affordability Action Plan expense including indexing the Alberta Seniors Benefit, Assured Income for the Severely Handicapped, and Income Support benefit payments to inflation, supporting the social sector with increased wages and operating funding, and addressing Homelessness
6 | 2023-24 Final Results | Year-End Report |
Total Expense
(millions of dollars)
2023-24 | 2022-23 | Change from | ||||||||||||||||||||
Operating Expense by Ministry | Budget | Actual | Actual | Budget | 2022-23 | |||||||||||||||||
1 | Advanced Education | 5,779 | 6,233 | 5,716 | 454 | 517 | ||||||||||||||||
2 | Affordability and Utilities | 131 | 119 | 712 | (12 | ) | (593 | ) | ||||||||||||||
3 | Agriculture and Irrigation | 804 | 743 | 708 | (61 | ) | 35 | |||||||||||||||
4 | Arts, Culture and Status of Women | 132 | 132 | 138 | - | (6 | ) | |||||||||||||||
5 | Children and Family Services | 1,725 | 1,603 | 1,552 | (122 | ) | 51 | |||||||||||||||
6 | Education | 8,836 | 8,878 | 8,329 | 42 | 549 | ||||||||||||||||
7 | Energy and Minerals | 766 | 822 | 1,234 | 56 | (412 | ) | |||||||||||||||
8 | Environment and Protected Areas | 493 | 377 | 429 | (116 | ) | (52 | ) | ||||||||||||||
9 | Executive Council | 54 | 47 | 46 | (7 | ) | 1 | |||||||||||||||
10 | Forestry and Parks | 316 | 285 | 271 | (31 | ) | 14 | |||||||||||||||
11 | Health | 24,533 | 25,165 | 23,438 | 632 | 1,727 | ||||||||||||||||
12 | Immigration and Multiculturalism | 40 | 39 | 38 | (1 | ) | 1 | |||||||||||||||
13 | Indigenous Relations | 214 | 214 | 185 | - | 29 | ||||||||||||||||
14 | Infrastructure | 462 | 462 | 447 | - | 15 | ||||||||||||||||
15 | Jobs, Economy and Trade | 1,664 | 1,557 | 1,320 | (107 | ) | 237 | |||||||||||||||
16 | Justice | 655 | 652 | 588 | (3 | ) | 64 | |||||||||||||||
17 | Mental Health and Addiction | 148 | 151 | 88 | 3 | 63 | ||||||||||||||||
18 | Municipal Affairs | 228 | 220 | 180 | (8 | ) | 40 | |||||||||||||||
19 | Public Safety and Emergency Services | 1,187 | 1,205 | 1,032 | 18 | 173 | ||||||||||||||||
20 | Seniors, Community and Social Services | 5,252 | 5,284 | 4,816 | 32 | 468 | ||||||||||||||||
21 | Service Alberta and Red Tape Reduction | 159 | 159 | 131 | - | 28 | ||||||||||||||||
22 | Technology and Innovation | 704 | 723 | 660 | 19 | 63 | ||||||||||||||||
23 | Tourism and Sport | 103 | 112 | 92 | 9 | 20 | ||||||||||||||||
24 | Transportation and Economic Corridors | 507 | 564 | 572 | 57 | (8 | ) | |||||||||||||||
25 | Treasury Board and Finance | 1,971 | 2,237 | 1,910 | 266 | 327 | ||||||||||||||||
26 | Legislative Assembly | 178 | 160 | 128 | (18 | ) | 32 | |||||||||||||||
27 | Total Operating Expense | 57,038 | 58,143 | 54,760 | 1,105 | 3,383 | ||||||||||||||||
Capital Grants | ||||||||||||||||||||||
28 | Arts, Culture and Status of Women | 136 | 123 | 97 | (13 | ) | 26 | |||||||||||||||
29 | Energy and Minerals | 205 | 130 | 53 | (75 | ) | 77 | |||||||||||||||
30 | Municipal Affairs | 782 | 765 | 750 | (17 | ) | 15 | |||||||||||||||
31 | Transportation and Economic Corridors | 1,127 | 819 | 452 | (308 | ) | 367 | |||||||||||||||
32 | Other | 571 | 266 | 173 | (305 | ) | 93 | |||||||||||||||
33 | Total Capital Grants | 2,821 | 2,103 | 1,525 | (718 | ) | 578 | |||||||||||||||
Disaster / Emergency Assistance | ||||||||||||||||||||||
34 | Agriculture and Irrigation – agriculture support | - | 1,856 | 1,141 | 1,856 | 715 | ||||||||||||||||
35 | Forestry and Parks – wildfire fighting | - | 851 | 161 | 851 | 690 | ||||||||||||||||
36 | Health - wildfire supports | - | 4 | - | 4 | 4 | ||||||||||||||||
37 | Public Safety and Emergency Services – wildfire / flood support | - | 260 | 17 | 260 | 243 | ||||||||||||||||
38 | Seniors, Community and Social Services - wildfire supports | - | 54 | - | 54 | 54 | ||||||||||||||||
39 | Total Disaster / Emergency Assistance | - | 3,025 | 1,319 | 3,025 | 1,706 | ||||||||||||||||
40 | Amortization / Inventory Consumption / Loss on Asset Disposals | 4,418 | 4,399 | 4,090 | (19 | ) | 309 | |||||||||||||||
Taxpayer-supported Debt Servicing Costs - General | ||||||||||||||||||||||
41 | Education (School Boards) | 9 | 10 | 8 | 1 | 2 | ||||||||||||||||
42 | Treasury Board and Finance | 850 | 917 | 972 | 67 | (55 | ) | |||||||||||||||
43 | Total Taxpayer-supported General Debt Servicing Costs | 859 | 927 | 980 | 68 | (53 | ) | |||||||||||||||
Taxpayer-supported Debt Servicing Costs - Capital Plan | ||||||||||||||||||||||
44 | Education (school P3s) / Transportation (ring road P3s) | 125 | 122 | 128 | (3 | ) | (6 | ) | ||||||||||||||
45 | Treasury Board and Finance – direct borrowing | 1,113 | 1,201 | 1,217 | 88 | (16 | ) | |||||||||||||||
46 | Total Taxpayer-supported Capital Plan Debt Servicing Costs | 1,238 | 1,323 | 1,345 | 85 | (22 | ) | |||||||||||||||
47 | Total Taxpayer-supported Debt Servicing Costs | 2,097 | 2,250 | 2,325 | 153 | (74 | ) | |||||||||||||||
Self-supported Debt Servicing Costs | ||||||||||||||||||||||
48 | Treasury Board and Finance – loans to local authorities | 659 | 802 | 428 | 143 | 374 | ||||||||||||||||
49 | Treasury Board and Finance – Ag Financial Services Corp. | 92 | 97 | 76 | 5 | 21 | ||||||||||||||||
50 | Total Self-supported Debt Servicing Costs | 751 | 899 | 504 | 148 | 395 | ||||||||||||||||
51 | Total Debt Servicing Costs | 2,848 | 3,149 | 2,829 | 301 | 320 | ||||||||||||||||
52 | Pension Provisions / (Recovery) | (322 | ) | (372 | ) | (21 | ) | (50 | ) | (351 | ) | |||||||||||
53 | Contingency | 1,500 | - | - | (1,500 | ) | - | |||||||||||||||
54 | Total Expense | 68,303 | 70,447 | 64,502 | 2,144 | 5,945 |
2023-24 Final Results | Year-End Report | 7 |
Task Force recommendations, evacuation payments, and other initiatives.
Children and Family Services
Expense was $1.6 billion, up $53 million from 2022-23, but $120 million lower than the budget. The increase in spending from 2022-23 can be attributed to indexation of the Alberta Child and Family Benefit (ACFB) due to population growth and increased case complexity. The decrease from budget was primarily due to lower demand for the Affordability Support Payments program, which ended in June 2023, child intervention hiring and retention challenges, and lower benefits provided to ACFB resulting from higher than expected household incomes.
Public Safety and Emergency Services
Expense was $1.5 billion, a $277 million increase from budget and $415 million from 2022-23. The increase from budget is mainly due to disaster-related expenses for 2023 Alberta wildfires, Alberta 2023 flood, 2023 NWT wildfires, and Canadian Red Cross matching donation for 2023 Alberta wildfire. The 2022-23 increase is mainly for disaster related expenses, additional funding to RCMP, increased recruitment to address overtime and operational challenges in correctional facilities, and an increase in grants for transit safety, and the federally-funded Gun and Gang Violence Action Fund.
Energy and Minerals
Total expense was $962 million, a decrease of $23 million from budget and $339 million lower than 2022-23. The decrease from budget is primarily related to surpluses for the Carbon Capture and Storage program, Alberta Petrochemical Incentive Program capital grant programs, and offset by increases to the cost of selling oil. The change from 2022-23 is primarily due to cost of selling oil and the completion of the Site Rehabilitation Program.
Other Ministries
Total expense for other ministries was $17.5 billion in 2023-24, $0.8 billion
higher than estimated in Budget 2023 and $2.2 billion higher than 2022-23.
Changes from budget include:
• | Agriculture and Irrigation expense was $1.8 billion higher mainly for disaster-related expense due to higher insurance indemnity payments for crop and hail, with higher crop prices and insurable acres. |
• | Environment and Protected Areas was $84 million lower primarily for reprofiling funding to support TIER investments in future fiscal years. |
• | Forestry and Parks increased $799 million, comprised of $851 million increase for wildfire disaster and emergency support, offset by $32 million in Mountain Pine Beetle control costs, $10 million in capital grants due to delays in Big Island Provincial Park and Water Crossing, and $10 million in amortization. |
• | Jobs, Economy and Trade was down $116 million due to lower-than-expected spending on child care affordability and accessibility programs, and on the Film and Television Tax Credit program. |
• | Technology and Innovation expense decreased by $201 million mainly due to reallocation of funds in the Broadband initiative to future years. |
• | Transportation and Economic Corridors expense was $292 million lower primarily due to slower progress on the Calgary and Edmonton LRTs and municipal water projects. |
• | Treasury Board and Finance was down $986 million as the $1.5 billion contingency was transferred to other ministries, partially offset by increases of $452 million for debt servicing costs. |
• | Expense in other ministries was a net $55 million lower than budget. |
Changes from 2022-23 include:
• | Affordability and Utilities expense decreased $593 million primarily due to the ending of the electricity rebate program on utility bills. |
• | Agriculture and Irrigation expense was $725 million higher primarily |
due to insurance indemnity payments provided in 2023-24. |
• | Forestry and Parks increased $696 million mainly for wildfire fighting costs. |
• | Jobs, Economy and Trade was up $237 million from increased spending and enrolment for child care affordability and accessibility programs, and on the Film and Television Tax Credit program. |
• | Technology and Innovation expense increased by $101 million largely due to increase in IT service, innovation grants and capital grants. |
• | Transportation and Economic Corridors expense was $395 million higher primarily due to progress on the Calgary and Edmonton LRTs and Calgary Rivers District and Events Centre. |
• | Treasury Board and Finance increased $280 million, mainly from a higher decrease to pension liabilities, higher debt servicing costs, and greater external investment management fees. |
• | Expense in other ministries was a net $339 million higher than 2022-23. |
Pension Provisions/Recovery
• | Public sector pension plan liabilities decreased by $0.4 billion to $7.9 billion at March 31, 2024. |
• | Liabilities for pre-1992 and other closed plan obligations account for 97% of the liability, with the pre-1992 Teachers’ pension plan accounting for 88%. |
Pension Liabilities
Government obligations for pension plan liabilities (millions of dollars)
(at March 31) | 2024 | 2023 | ||||||
Teachers’ (pre-1992) | 7,030 | 7,309 | ||||||
PS Mgmt. (pre-1992) | 347 | 375 | ||||||
Univ. Acad. (pre-1992) | 196 | 198 | ||||||
Spec. Forces (pre-1992) | 64 | 77 | ||||||
MLA (Closed) | 32 | 34 | ||||||
Universities Academic | 128 | 169 | ||||||
Teachers’ (post-1992) | - | - | ||||||
Supp. Exec. Retir. Plans | 82 | 82 | ||||||
PS Mgmt. (Supp.) | 24 | 25 | ||||||
Prov. Judges / Masters | 1 | 3 | ||||||
Total Pension Liab. | 7,904 | 8,272 |
8 | 2023-24 Final Results | Year-End Report |
Fiscal Framework
The Sustainable Fiscal Planning and Reporting Act requires the government to balance the budget. In 2023-24 the government is reporting a surplus of $4.3 billion.
The framework also limits in-year expense increases, adjusted to exclude expense that is directly offset by a related increase to revenue and non-cash, non-recurring adjustments, to the voted, budgeted contingency. In 2023-24, the contingency was set at $1.5 billion.
In 2023-24, expense exceeded budget by $2.2 billion. Of this increase, $1.5 billion was offset by the contingency. The remaining increase was mainly as a result of crop indemnity and insurance payments as a result of drought conditions throughout the province and expense related to dedicated revenue. The fiscal framework provides allowable exceptions for the in-year expense limitation, including exceptions for disasters and emergencies and dedicated-revenue expense.
Surplus cash and Alberta Fund.
The fiscal framework requires the allocation of surplus cash, with the first 50 per cent going to repay maturing debt and the remaining 50 per cent allocated to the Alberta Fund. There are three allowable uses of cash from the Alberta Fund: further debt repayment, saving in the Alberta Heritage Savings Trust Fund or for one-time initiatives that do not permanently increase government spending. Surplus cash at March 31, 2024 of $7.3 billion is comprised of $5.1 billion 2022-23 cash results, plus the $4.3 billion surplus, less $2.1 billion in cash requirements and adjustments. $3.7 billion of surplus cash has been allocated to debt repayment, with $1.7 billion of taxpayer-supported debt repaid in 2023-24 and $2 billion set aside to repay debt maturing in 2024-25.
The remaining $3.7 billion has been allocated to the Alberta Fund. In Budget 2024, the government signalled $2 billion from the Alberta Fund will be deposited into the Heritage Fund to support the long-term plan to grow the size of the fund.
Cash adjustments such as differences between accrued revenue and cash receipts, non-cash revenue or expense, SUCH sector (schools, universities, colleges and health entities) and entity results, and transfers not reported on the income statement, are necessary to determine the cash balance.
• | Net income of, or retained by, other entities. |
- | Positive adjustments include: SUCH sector own- source expense exceeded own-source revenue by $0.3 billion; the Agriculture Financial Services Corporation funded $0.6 billion in indemnity payments from the Crop Insurance Fund; the Alberta Petroleum Marketing Commission had a net loss of $1.6 billion from Surgeon Refinery Processing Agreement provision. |
- | Negative adjustments include: $1.9 billion of net income was retained in the Alberta Heritage Savings Trust Fund; $0.3 billion of net income was retained in the endowment funds; $0.3 billion of net income was retained by ATB Financial; and $0.4 billion of net income was retained by the Technology Innovation and Emissions Reduction Fund. |
• | Other cash adjustments. |
- | Non-cash expense: $0.8 billion excluding the SUCH sector of amortization, inventory consumption, loss on disposal, inventory write-down, bad debt provision expense requires no cash. $372 million adjustment for pension provision is added back to cash balance as it is also non-cash. |
- | Cash requirements not in expense: $540 million for student loans, net of repayments and default provision; $157 million for short-term inventory acquisition. |
- | Revenue and other cash adjustments: NRR revenue reported was $0.3 billion less than cash received, income tax revenue reported was $0.4 billion less than cash received. $145 million cash was received for 2013 flood assistance, 2016 Wood Buffalo wildfire and other disasters where spending incurred in prior years. Cash transfers for capital, reported in revenue over the related asset’s life, exceeded non-cash reported revenue by $183 million. |
• | Capital Plan cash. Cash for capital investment and P3 principal repayments of $3.7 billion was slightly offset by the $64 million from P3 partners and $1.2 billion in non-cash amortization. |
2023-24 Final Results | Year-End Report | 9 |
Cash Adjustments / Borrowing Requirements
(millions of dollars)
Change from | ||||||||||||||||||||
2023-24 | 2022-23 | 2022-23 | ||||||||||||||||||
Budget |
Actual | Actual | Budget | Actual | ||||||||||||||||
Balance at Start of Year | 3,644 | 5,136 | 8,858 | - | - | |||||||||||||||
Surplus / (Deficit) | 2,350 | 4,285 | 11,641 | 1,935 | (7,356 | ) | ||||||||||||||
Cash Adjustments (negative = cash requirement; positive = cash source) | ||||||||||||||||||||
Retained Income of Funds and Agencies | ||||||||||||||||||||
Alberta Heritage Savings Trust Fund | (1,096 | ) | (1,892 | ) | (1,886 | ) | (796 | ) | (6 | ) | ||||||||||
ATB Financial | (279 | ) | (337 | ) | (428 | ) | (58 | ) | 91 | |||||||||||
Agriculture Financial Services Corporation | (910 | ) | 609 | 296 | 1,519 | 313 | ||||||||||||||
Heritage Foundation for Medical Research Endowment Fund | (102 | ) | (174 | ) | 67 | (72 | ) | (241 | ) | |||||||||||
Heritage Science and Engineering Research Endowment Fund | (37 | ) | (87 | ) | 49 | (50 | ) | (136 | ) | |||||||||||
Heritage Scholarship Fund | (42 | ) | (83 | ) | 71 | (41 | ) | (154 | ) | |||||||||||
Alberta Social Housing Corporation | (95 | ) | 6 | (4 | ) | 101 | 10 | |||||||||||||
Credit Union Deposit Guarantee Corporation | (13 | ) | (9 | ) | (7 | ) | 4 | (2 | ) | |||||||||||
Alberta Petroleum Marketing Commission | 18 | 1,637 | 487 | 1,619 | 1,150 | |||||||||||||||
Technology Innovation and Emissions Reduction Fund | (34 | ) | (425 | ) | (255 | ) | (391 | ) | (170 | ) | ||||||||||
Balancing Pool | (103 | ) | (160 | ) | (144 | ) | (57 | ) | (16 | ) | ||||||||||
Other | (32 | ) | (57 | ) | (84 | ) | (25 | ) | 27 | |||||||||||
Total Retained Income of Funds and Agencies | (2,725 | ) | (972 | ) | (1,838 | ) | 1,753 | 866 | ||||||||||||
Other Cash Adjustments | ||||||||||||||||||||
SUCH sector own-source revenue | (5,292 | ) | (6,020 | ) | (5,307 | ) | (728 | ) | (713 | ) | ||||||||||
SUCH sector own-source expense | 7,087 | 6,643 | 6,297 | (444 | ) | 346 | ||||||||||||||
Net deferred capital contribution cash adjustment | 81 | 183 | 126 | 102 | 57 | |||||||||||||||
Energy royalties (difference between accrued revenue & cash) | 545 | 274 | 1,705 | (271 | ) | (1,431 | ) | |||||||||||||
Student loans | (545 | ) | (540 | ) | (453 | ) | 5 | (87 | ) | |||||||||||
Other cash adjustments | 95 | 922 | (373 | ) | 827 | 1,295 | ||||||||||||||
2013 Alberta flood assistance revenue / expense | 375 | (7 | ) | (69 | ) | (382 | ) | 62 | ||||||||||||
Wood Buffalo wildfire revenue / expense | 57 | (6 | ) | (74 | ) | (63 | ) | 68 | ||||||||||||
Pension provisions (non-cash expense) | (322 | ) | (372 | ) | (21 | ) | (50 | ) | (351 | ) | ||||||||||
Inventory acquisition (excluding SUCH sector; non-cash expense) | (160 | ) | (157 | ) | (282 | ) | 3 | 125 | ||||||||||||
Inventory consumption (excluding SUCH sector; non-cash expense) | 158 | 361 | 426 | 203 | (65 | ) | ||||||||||||||
Total Other Cash Adjustments | 2,080 | 1,281 | 1,975 | (798 | ) | (694 | ) | |||||||||||||
Capital cash adjustments | ||||||||||||||||||||
Capital investment (excluding SUCH sector self-financed) | (4,559 | ) | (3,581 | ) | (3,397 | ) | 978 | (184 | ) | |||||||||||
Capital Plan contingency | 800 | - | - | (800 | ) | - | ||||||||||||||
Current principal repayments (P3s – public-private partnerships) | (92 | ) | (92 | ) | (89 | ) | - | (3 | ) | |||||||||||
Alternative financing (P3s – public-private partnerships) | 64 | 64 | 52 | - | 12 | |||||||||||||||
Amortization (excluding SUCH sector - non-cash expense) | 1,323 | 1,212 | 1,162 | (111 | ) | 50 | ||||||||||||||
Book value of asset disposals (net non-cash expense / revenue) | - | - | 3 | - | (3 | ) | ||||||||||||||
Total Capital Cash Adjustments | (2,464 | ) | (2,397 | ) | (2,269 | ) | 67 | (128 | ) | |||||||||||
Total Cash Adjustments | (3,109 | ) | (2,088 | ) | (2,132 | ) | 1,022 | 44 | ||||||||||||
Surplus / (Deficit) plus net cash adjustments | (759 | ) | 2,197 | 9,509 | 2,957 | (7,312 | ) | |||||||||||||
Allocation of Surplus Cash | ||||||||||||||||||||
Surplus cash (balance at start of year + surplus +/- net cash adjustments) | 2,885 | 7,333 | 18,367 | 4,448 | (11,034 | ) | ||||||||||||||
Less: | ||||||||||||||||||||
Taxpayer-supported debt repayment a | 1,442 | 3,666 | 13,231 | 2,224 | (9,566 | ) | ||||||||||||||
Allocation to Alberta Fund | 1,443 | 3,667 | - | 2,224 | 3,667 | |||||||||||||||
Balance at End of Year | - | - | 5,136 | - | (5,136 | ) |
a | $1.682 billion of taxpayer-supported debt was repaid in 2023-24. The remaining $1.984 billion will be used to repay debt maturing in 2024-25. |
10 | 2023-24 Final Results | Year-End Report |
Net Financial and Capital Assets
At March 31, 2024, government of Alberta assets exceeded liabilities by $16.2 billion.
This was a $4.9 billion improvement relative to March 31, 2023, due to an increase of $7.4 billion in financial assets, an increase of $0.6 billion in capital / non-financial assets, netted against a reduction of $3.1 billion in liabilities. Main changes in financial assets and liabilities include:
• | The $7.4 billion increase in financial assets consists of $6.2 billion in the Heritage Fund, endowment funds, debt retirement account, Alberta Fund, and Technology Innovation and Emissions Reduction Fund (TIER), primarily from income retention; $1.7 billion in student loans and loans to local authorities; $1.1 billion in other financial assets; offset by decreases of $1 billion in net assets for government business enterprises and $0.7 billion in loans to Agriculture Financial Services Corporation (AFSC). |
• | The $3.1 billion increase in liabilities comprised a $2.7 billion increase in debt, mainly reflecting advanced borrowing due to the pre-funding plan offset by the repayment of $1.7 billion in taxpayer-supported debt; $0.9 billion increase in asset retirement obligation and other liabilities; offset by $0.4 billion reduction in pension and coal phase-out liabilities. |
Financial assets
$86.9 billion at March 31, 2024.
Heritage Fund. $20.9 billion book value. This was a $1.9 billion increase from March 31, 2023, from retaining 100 per cent of its net income.
Endowment and other funds. $5.3 billion, a $0.3 billion increase from March 31, 2023. This is also due to retaining their net income for the year.
Debt retirement account/Alberta Fund. Balance of $5.0 billion in the debt retirement account, a small decrease of $0.1 billion from March 31, 2023. This cash was set aside to retire upcoming
maturing debt. In addition, $3.7 billion has been allocated to the Alberta Fund in 2023-24.
Self-supporting lending activities. $17.7 billion in assets of Agriculture Financial Services Corporation (AFSC) and local authority loans. These assets fully offset the related liabilities.
Equity / (deficit) in commercial enterprises. $0.9 billion, comprising equity of $5.3 billion in ATB Financial, $0.4 billion in Credit Union Deposit Guarantee Corporation, $0.3 billion in Alberta Gaming, Liquor and Cannabis Commission, less deficits of $4.7 billion in Alberta Petroleum Marketing Commission and $0.4 billion in the Balancing Pool.
Student loans. $4.6 billion, an increase of $540 million from March 31, 2023, comprising $1.1 billion in loans disbursed less $344 million in repayments and a $206 million in loan default loss provision and other adjustments.
Technology Innovation and Emissions Reduction Fund. $1 billion, a $425 million increase from March 31, 2023 as TIER revenue exceeded allocations.
Other financial assets. $27.9 billion, a $1.1 billion increase from the prior year. These assets include financial assets of school boards, universities and colleges and the health authority, accounts and interest receivable, natural gas royalty deposits, cash associated with future liabilities such as corporate income tax refunds and derivative financial instruments.
Liabilities
$128.3 billion at March 31, 2024, including debt of $96.9 billion, alternative financing (public-private partnerships) of $2.6 billion, coal phase-out liabilities of $0.6 billion, pension liabilities of $7.9 billion, $2.4 billion for asset retirement obligations and other liabilities of $17.8 billion.
Liabilities for capital projects. $47.6 billion, a $2.1 billion increase from March 31, 2023. P3 projects added
$52 million in liabilities, less $89 million in repayments.
Fiscal plan borrowing. $34.2 billion, a increase of $478 million, due to the financial restructuring of the pre-1992 Teachers’ Pension Plan.
Self-supporting lending activities. $17.7 billion, consisting of $14.6 billion in debt incurred to provide loans to local authorities and $3.1 billion in AFSC to on-lend to the agriculture sector.
Coal phase-out liabilities. $0.6 billion, $77 million lower than 2022-23, reflecting the net present value of $96 million in annual payments to be made to generators for phasing-out coal use by 2030.
Pension liabilities. $7.9 billion, a decrease of $368 million.
Asset retirement obligations. $2.4 billion, a $104 million increase from 2022-23. The Government’s adoption of the Asset Retirement Obligation standard requires recognition of future disposal costs of certain capital assets that need remediation or decommissioning work.
Other liabilities. $17.8 billion. Includes liabilities of school boards, universities and colleges and the health authority, natural gas royalty and security deposits, unearned revenue, estimated corporate income tax refunds, trade payables, other liabilities of AFSC, and derivative financial instruments.
Capital / Non-financial Assets
$61.5 billion at March 31, 2024. $60.4 billion in capital assets include land, land improvements, buildings, computer hardware and software, equipment, provincial highways, bridges, dams and other water management infrastructure.
Capital assets increased $1billion: $4.4 billion in capital investment less $3.4 billion in amortization, disposals, and accounting adjustments.
Total Capital Plan spending in 2023-24 of $6.3 billion ($4.2 billion investment plus $2.1 billion in grants) was financed
2023-24 Final Results | Year-End Report | 11 |
from a variety of sources: $4.7 billion from the general revenue fund; $0.9 billion in federal funding, donations and other sources; $0.7 billion provided by school boards, post-secondary institutions and AHS; and $116 million from cash of agencies and funds (e.g. Alberta Social Housing Corporation and TIER), and public private partnerships.
Other non-financial assets include $441 million in inventory assets, $547 million in prepaid expenses, and $156 million in purchased intangibles. Inventory acquisition was less than consumption / write-downs by $334 million, while prepaid expenses increased by $51 million and purchased intangibles increased by $140 million.
Spent Deferred Capital Contributions
$3.9 billion at March 31, 2024.
Spent deferred capital contributions increased $268 million, reflecting the use of $0.5 billion in cash received for capital that has not yet been reported in revenue, less $0.2 billion in cash previously received and spent, and now being recognized in 2023-24 revenue.
Balance Sheet | at March 31 | |||||||||||
(millions of dollars) | 2024 Actual | 2023 Actual | Change from 2023 | |||||||||
Financial Assets | ||||||||||||
Alberta Heritage Savings Trust Fund accumulated operating surplus | 20,872 | 18,980 | 1,892 | |||||||||
Endowment fund accumulated operating surpluses: | ||||||||||||
Alberta Heritage Foundation for Medical Research | 2,202 | 2,027 | 175 | |||||||||
Alberta Heritage Science and Engineering Research | 1,288 | 1,201 | 87 | |||||||||
Alberta Heritage Scholarship | 1,459 | 1,376 | 83 | |||||||||
Alberta Enterprise Corporation | 337 | 336 | 1 | |||||||||
General Revenue Fund - surplus cash a | 1,984 | 5,136 | (3,152 | ) | ||||||||
Debt retirement | 5,035 | - | 5,035 | |||||||||
Alberta Fund | 3,667 | - | 3,667 | |||||||||
Self-supporting lending activity: | ||||||||||||
Loans to local authorities (including SUCH sector) | 12,606 | 14,836 | (2,230 | ) | ||||||||
Agriculture Financial Services Corporation | 2,966 | 3,662 | (696 | ) | ||||||||
Equity in commercial enterprises: ATB / AGLC / APMC / CUDGCo / Bal. Pool / PSIs | 862 | 1,846 | (984 | ) | ||||||||
Student loans | 4,640 | 4,100 | 540 | |||||||||
Technology Innovation and Emissions Reduction Fund | 1,017 | 592 | 425 | |||||||||
Other financial assets (including SUCH sector) | 27,954 | 25,398 | 2,556 | |||||||||
Total Financial Assets | 86,889 | 79,490 | 7,399 | |||||||||
Liabilities | ||||||||||||
Taxpayer-supported debt: | ||||||||||||
Direct borrowing for the Capital Plan | 44,957 | 42,515 | 2,442 | |||||||||
Alternative financing (Public-private partnerships {P3s} - Capital Plan) | 2,637 | 3,010 | (373 | ) | ||||||||
Debt issued to reduce pre-1992 TPP unfunded liability | 478 | 594 | (116 | ) | ||||||||
Direct borrowing for the Fiscal Plan | 33,763 | 33,169 | 594 | |||||||||
Total taxpayer-supported debt | 81,835 | 79,288 | 2,547 | |||||||||
Self-supporting lending organizations / activities debt: | ||||||||||||
Debt issued to finance local authority loans | 14,590 | 14,836 | (246 | ) | ||||||||
Agriculture Financial Services Corporation | 3,125 | 2,760 | 365 | |||||||||
Total debt b | 99,550 | 96,884 | 2,666 | |||||||||
Coal phase-out liabilities | 609 | 686 | (77 | ) | ||||||||
Pension liabilities | 7,904 | 8,272 | (368 | ) | ||||||||
Asset retirement obligations | 2,391 | 2,287 | 104 | |||||||||
Other liabilities (including SUCH sector) | 17,799 | 16,975 | 824 | |||||||||
Total Liabilities | 128,253 | 125,104 | 3,149 | |||||||||
Net Financial Assets / (Debt) (total financial assets less total liabilities) | (41,364 | ) | (45,614 | ) | 4,250 | |||||||
Capital / Other Non-financial Assets | 61,515 | 60,624 | 891 | |||||||||
Spent deferred capital contributions | (3,964 | ) | (3,696 | ) | (268 | ) | ||||||
Net Assets / (Liabilities) (net financial assets + capital assets - def. capital contributions) | 16,187 | 11,314 | 4,873 | |||||||||
Net assets / (Liabilities) - statement of operations | 12,649 | 8,500 | ||||||||||
Accumulated remeasurement gains | 3,538 | 2,814 | ||||||||||
Change in Net Assets / (Liabilities) - stmt. of operations c | 4,149 | 11,748 | ||||||||||
Net debt / GDP | -9.4% | -9.9% |
a | In 2023-24, surplus cash of the General Revenue Fund is allocated to debt repayment and the Alberta Fund in accordance with the Sustainable Fiscal Planning and Transparency Act. Due to timing of maturities, $1,682 million was repaid in 2023-24 and the remaining $1,984 million will be used to repay upcoming debt maturities in 2024-25. |
b | Does not include term debt of $5,708 million (2022: $7,590 million) issued on behalf of government business enterprises which is included on a net basis in financial assets (“Equity in commercial enterprises” = assets minus debt and other liabilities), nor does it include liabilities for capital leases. |
c | Change in Net Assets stmt. of operations differ from the surplus / (deficit) numbers due to net assets adjustments (2024: $(136) million; 2023 $107 million, and adoption of PS3160 Public Private Partnerships (P3), PS 3400 Revenue and PSG-8 Purchased Intangibles accounting standards (see Schedule 17, p.83 and Note 1, page 30 of the 2023-24 Consolidated Financial Statements respectively). |
12 | 2023-24 Final Results | Year-End Report |
Economic and Tax Highlights
Economic highlights
(Calendar Year Basis)
Alberta’s economy expanded in 2023, although headwinds from rising interest rates and high inflation moderated growth. Real gross domestic product (GDP) rose an estimated 1.8%, down from the 5% growth recorded in 2022 when Alberta’s economy fully recovered from the pandemic.
Oil prices pulled back from 2022 highs but remained solid. While drilling activity moderated, it held close to its historical peak. Oil production also climbed to a new record in late 2023, as producers ramped up output in anticipation of increased export capacity and growing domestic demand. Wildfire-related shut-ins and weak prices dampened natural gas production, which grew 1.3%. Meanwhile, strong gains in agri-food products and machinery and equipment also contributed to business output in 2023 and offset declines in primary agriculture due to drought conditions.
Alberta’s population surged in the 2023 census year. Population growth was 4.1% year-over-year, the fastest rate since 1981. It was led by record annual levels of non-permanent residents and net interprovincial migration. Strong momentum propelled population growth to accelerate even further to 4.4% in the fourth quarter of 2023.
Alberta’s labour market had another strong year. Robust migration into the province helped fill job vacancies, boosting employment by 3.6% or 85,000 on an annual basis in 2023. The gains were broad-based, led by strength in the private sector and in full-time positions. Strong job gains and weakness in the participation rate contributed to tight labour market conditions. The unemployment rate averaged 5.9%, little changed from 2022. Wage growth picked up after years of muted gains.
Despite the strong labour market conditions, households continued to face headwinds last year. Prices for necessities such as food and shelter remained elevated. This was despite the moderation in headline inflation to 3.3% as lower commodity prices worked its way into the supply chain. High prices along with rising interest rates weighed on sentiment and per capita consumer spending. Meanwhile, residential construction gained momentum in the second half of the year, buoyed by strong population growth and low inventories in the housing market.
Tax highlights
Alberta maintained an overall tax advantage compared to all other provinces, with low personal and corporate income taxes, low fuel taxes and no sales tax.
Alberta’s Fuel Tax Relief Program continued to apply in 2023-2024. The program saved drivers an estimated $1.1 billion in provincial fuel tax in 2023-24. The fuel tax was paused for the full 2023 calendar year and applied at a reduced rate of nine cents per litre in the first three months of 2024.
Indexation of the personal income tax system for inflation continued in 2023 and 2024. The value of Alberta’s personal income tax credits and tax bracket thresholds increased by six per cent in 2023 and 4.2 per cent in 2024, saving Albertans around $680 million in 2023-24. Alberta will continue to index the personal income tax system, providing an estimated $980 million in savings in 2024-25.
To further deter tobacco use among Albertans, government increased tax rates on cigarettes and smokeless tobacco effective March 1, 2024, as announced in Budget 2024.
Fall 2023 amendments to the Tourism Levy Act will implement the Budget 2022 commitment to require online brokers, such as Airbnb, Vrbo and Expedia, to collect and remit tourism levy on temporary accommodations purchased through their marketplaces. These changes will take effect for bookings made on or after October 1, 2024.
Key Economic Indicators, 2012 to 2023
Calendar year, % change unless otherwise noted
2012 | 2013 | 2014 | 2015 | 2016 | 2017 | 2018 | 2019 | 2020 | 2021 | 2022 | 2023 | |||||||||||||||||||||||||||||||||||||
Nominal GDP growth a | 4.3 | 9.6 | 10.0 | (14.0 | ) | (6.1 | ) | 9.2 | 4.2 | 1.7 | (15.7 | ) | 26.2 | 24.4 | (4.4 | ) | ||||||||||||||||||||||||||||||||
Real GDP growth | 3.9 | 5.7 | 5.9 | (3.7 | ) | (3.5 | ) | 4.5 | 2.2 | (0.1 | ) | (8.0 | ) | 4.8 | 5.1 | 1.8 | ||||||||||||||||||||||||||||||||
Employment (thousands) | 2,167 | 2,211 | 2,247 | 2,266 | 2,205 | 2,221 | 2,280 | 2,308 | 2,144 | 2,260 | 2,376 | 2,461 | ||||||||||||||||||||||||||||||||||||
Employment growth | 3.0 | 2.1 | 1.6 | 0.8 | (2.7 | ) | 0.7 | 2.7 | 1.2 | (7.1 | ) | 5.4 | 5.2 | 3.6 | ||||||||||||||||||||||||||||||||||
Unemployment rate | 4.7 | 4.6 | 4.8 | 6.1 | 8.2 | 8.0 | 6.5 | 6.8 | 11.3 | 8.6 | 5.8 | 5.9 | ||||||||||||||||||||||||||||||||||||
Average weekly earnings ($ / week) | 1,069 | 1,107 | 1,148 | 1,144 | 1,117 | 1,128 | 1,147 | 1,164 | 1,201 | 1,226 | 1,257 | 1,284 | ||||||||||||||||||||||||||||||||||||
Primary household income a | 8.7 | 6.8 | 6.4 | 3.3 | (10.9 | ) | 4.1 | 1.8 | 2.8 | (4.8 | ) | 5.8 | 7.7 | 7.0 | ||||||||||||||||||||||||||||||||||
Net corporate operating surplus a | (11.6 | ) | 19.2 | 23.2 | (74.0 | ) | (22.9 | ) | 159.0 | 17.6 | 3.9 | (60.3 | ) | 284.9 | 59.6 | (14.6 | ) | |||||||||||||||||||||||||||||||
Housing starts (number of units) | 33,396 | 36,011 | 40,590 | 37,282 | 24,533 | 29,457 | 26,085 | 27,325 | 24,023 | 31,935 | 36,544 | 36,022 | ||||||||||||||||||||||||||||||||||||
Alberta consumer price index | 1.1 | 1.4 | 2.6 | 1.1 | 1.1 | 1.6 | 2.4 | 1.8 | 1.1 | 3.2 | 6.4 | 3.3 | ||||||||||||||||||||||||||||||||||||
Population (July 1, thousands) | 3,875 | 3,981 | 4,084 | 4,144 | 4,196 | 4,241 | 4,298 | 4,363 | 4,417 | 4,444 | 4,543 | 4,695 | ||||||||||||||||||||||||||||||||||||
Population growth | 2.3 | 2.7 | 2.6 | 1.5 | 1.2 | 1.1 | 1.3 | 1.5 | 1.2 | 0.6 | 2.2 | 4.1 | ||||||||||||||||||||||||||||||||||||
a 2023 is an estimate. |
|
2023-24 Final Results | Year-End Report | 13 |
Historical Fiscal Summary, 2009-10 to 2023-24a
(millions of dollars)
1 | 2 | 3 | 4 | 5 | 6 | 7 | 8 | 9 | 10 | 11 | 12 | 13 | 14 | 15 | ||||||||||||||||||||||||||||||||||||||||||||||||
Statement of Operations | 2009-10 | 2010-11 | 2011-12 | 2012-13 | 2013-14 | 2014-15 | 2015-16 | 2016-17 | 2017-18 | 2018-19 | 2019-20 | 2020-21 | 2021-22 | 2022-23 | 2023-24 Actual | |||||||||||||||||||||||||||||||||||||||||||||||
Revenue | ||||||||||||||||||||||||||||||||||||||||||||||||||||||||||||||
1 | Personal income tax | 7,877 | 7,631 | 8,563 | 9,621 | 10,537 | 11,042 | 11,357 | 10,763 | 10,775 | 11,874 | 11,244 | 11,257 | 13,335 | 13,925 | 15,160 | ||||||||||||||||||||||||||||||||||||||||||||||
2 | Corporate income tax | 4,754 | 3,334 | 3,678 | 4,756 | 5,488 | 5,796 | 4,195 | 3,769 | 3,448 | 4,871 | 4,107 | 3,037 | 4,718 | 8,167 | 7,044 | ||||||||||||||||||||||||||||||||||||||||||||||
3 | Other tax revenue | 3,746 | 3,820 | 4,099 | 4,333 | 4,500 | 4,598 | 5,168 | 5,649 | 6,538 | 6,833 | 5,747 | 5,285 | 5,453 | 4,432 | 4,543 | ||||||||||||||||||||||||||||||||||||||||||||||
4 | Resource revenue | 6,768 | 8,428 | 11,636 | 7,779 | 9,578 | 8,948 | 2,789 | 3,097 | 4,980 | 5,429 | 5,937 | 3,091 | 16,170 | 25,242 | 19,287 | ||||||||||||||||||||||||||||||||||||||||||||||
5 | Investment income | 3,541 | 2,486 | 2,168 | 2,595 | 3,423 | 3,113 | 2,544 | 3,698 | 3,126 | 2,349 | 2,828 | 2,643 | 3,579 | 1,334 | 4,581 | ||||||||||||||||||||||||||||||||||||||||||||||
6 | Premiums, fees and licences | 2,857 | 2,922 | 2,931 | 3,184 | 3,437 | 3,564 | 3,574 | 3,701 | 3,839 | 3,911 | 3,929 | 4,021 | 4,520 | 4,672 | 5,565 | ||||||||||||||||||||||||||||||||||||||||||||||
7 | Other own-source revenue | 4,627 | 4,903 | 5,128 | 5,234 | 5,412 | 6,438 | 5,850 | 3,637 | 6,983 | 6,292 | 3,360 | 3,272 | 8,952 | 7,008 | 6,216 | ||||||||||||||||||||||||||||||||||||||||||||||
8 | Total own-source revenue | 34,170 | 33,524 | 38,203 | 37,502 | 42,375 | 43,499 | 35,477 | 34,314 | 39,689 | 41,559 | 37,152 | 32,605 | 56,727 | 64,780 | 62,396 | ||||||||||||||||||||||||||||||||||||||||||||||
9 | Federal transfers | 5,342 | 5,452 | 5,192 | 5,042 | 7,059 | 5,982 | 7,142 | 7,979 | 7,606 | 8,013 | 9,072 | 10,532 | 11,595 | 11,363 | 12,336 | ||||||||||||||||||||||||||||||||||||||||||||||
10 | Total Revenue | 39,512 | 38,976 | 43,395 | 42,544 | 49,434 | 49,481 | 42,619 | 42,293 | 47,295 | 49,572 | 46,224 | 43,137 | 68,322 | 76,143 | 74,732 | ||||||||||||||||||||||||||||||||||||||||||||||
Expense by Function | ||||||||||||||||||||||||||||||||||||||||||||||||||||||||||||||
11 | Health | 14,636 | 15,393 | 16,284 | 17,254 | 17,967 | 19,366 | 20,115 | 20,687 | 21,239 | 21,921 | 22,408 | 23,984 | 25,143 | 25,486 | 27,447 | ||||||||||||||||||||||||||||||||||||||||||||||
12 | Basic / advanced education | 11,067 | 11,362 | 11,951 | 12,394 | 12,782 | 13,103 | 13,673 | 14,110 | 14,471 | 14,848 | 14,971 | 14,134 | 14,308 | 15,220 | 16,359 | ||||||||||||||||||||||||||||||||||||||||||||||
13 | Social services | 3,807 | 4,129 | 4,278 | 4,641 | 4,668 | 4,548 | 4,752 | 5,198 | 5,592 | 5,867 | 6,203 | 5,919 | 5,992 | 7,222 | 8,035 | ||||||||||||||||||||||||||||||||||||||||||||||
14 | Other program expense | 9,834 | 9,443 | 9,853 | 10,528 | 12,970 | 11,031 | 10,375 | 12,607 | 13,189 | 11,866 | 12,893 | 13,858 | 16,688 | 13,766 | 15,829 | ||||||||||||||||||||||||||||||||||||||||||||||
15 | Total program expense | 39,344 | 40,327 | 42,366 | 44,817 | 48,387 | 48,048 | 48,915 | 52,602 | 54,491 | 54,502 | 56,475 | 57,895 | 62,131 | 61,694 | 67,670 | ||||||||||||||||||||||||||||||||||||||||||||||
16 | Debt servicing costs | 214 | 472 | 509 | 530 | 601 | 722 | 776 | 1,018 | 1,420 | 1,971 | 2,235 | 2,486 | 2,641 | 2,829 | 3,149 | ||||||||||||||||||||||||||||||||||||||||||||||
17 | Pension provisions | 430 | 439 | 634 | 296 | 748 | (404 | ) | (630 | ) | (543 | ) | (593 | ) | (190 | ) | (334 | ) | (282 | ) | (365 | ) | (21 | ) | (372 | ) | ||||||||||||||||||||||||||||||||||||
18 | Total Expense | 39,988 | 41,238 | 43,509 | 45,643 | 49,736 | 48,366 | 49,061 | 53,077 | 55,318 | 56,283 | 58,376 | 60,099 | 64,407 | 64,502 | 70,447 | ||||||||||||||||||||||||||||||||||||||||||||||
19 | Surplus / (Deficit) | (476 | ) | (2,262 | ) | (114 | ) | (3,099 | ) | (302 | ) | 1,115 | (6,442 | ) | (10,784 | ) | (8,023 | ) | (6,711 | ) | (12,152 | ) | (16,962 | ) | 3,915 | 11,641 | 4,285 | |||||||||||||||||||||||||||||||||||
Capital Plan b | 8,000 | 7,544 | 6,884 | 6,062 | 5,770 | 6,181 | 6,558 | 6,578 | 9,021 | 6,057 | 5,545 | 6,896 | 6,622 | 5,633 | 6,300 | |||||||||||||||||||||||||||||||||||||||||||||||
Statement of Financial Position (at March 31) | ||||||||||||||||||||||||||||||||||||||||||||||||||||||||||||||
20 | Heritage / endowment funds | 17,077 | 17,500 | 17,936 | 18,176 | 18,562 | 18,860 | 19,262 | 19,836 | 20,306 | 20,700 | 20,670 | 21,090 | 22,176 | 23,920 | 25,821 | ||||||||||||||||||||||||||||||||||||||||||||||
21 | Contingency Account | 14,983 | 11,192 | 7,497 | 3,326 | 4,658 | 6,529 | 3,625 | 2,299 | 1,661 | 6,342 | |||||||||||||||||||||||||||||||||||||||||||||||||||
22 | Other financial assets | 30,338 | 30,799 | 32,972 | 34,734 | 40,039 | 40,688 | 40,990 | 44,152 | 49,010 | 48,701 | 55,711 | 56,996 | 55,950 | 55,570 | 61,068 | ||||||||||||||||||||||||||||||||||||||||||||||
23 | Taxpayer-supported Capital Plan liabilities | (2,888 | ) | (3,199 | ) | (3,442 | ) | (4,594 | ) | (8,724 | ) | (11,922 | ) | (19,040 | ) | (23,769 | ) | (29,339 | ) | (33,597 | ) | (37,188 | ) | (42,733 | ) | (47,529 | ) | (45,525 | ) | (47,594 | ) | |||||||||||||||||||||||||||||||
24 | Taxpayer-supported operating debt / pre-1992 TPP debt | (2,279 | ) | (2,015 | ) | (1,676 | ) | (1,426 | ) | (1,333 | ) | (1,053 | ) | (1,024 | ) | (10,751 | ) | (19,227 | ) | (29,060 | ) | (36,954 | ) | (50,303 | ) | (45,595 | ) | (33,763 | ) | (34,241 | ) | |||||||||||||||||||||||||||||||
25 | Self-supported debt | (9,300 | ) | (11,010 | ) | (12,707 | ) | (14,116 | ) | (15,775 | ) | (16,592 | ) | (17,373 | ) | (17,822 | ) | (17,848 | ) | (18,134 | ) | (18,066 | ) | (18,398 | ) | (17,028 | ) | (17,596 | ) | (17,715 | ) | |||||||||||||||||||||||||||||||
26 | Total Debt c | (14,467 | ) | (16,224 | ) | (17,825 | ) | (20,136 | ) | (25,832 | ) | (29,567 | ) | (37,437 | ) | (52,342 | ) | (66,414 | ) | (80,791 | ) | (92,208 | ) | (111,434 | ) | (110,152 | ) | (96,884 | ) | (99,550 | ) | |||||||||||||||||||||||||||||||
27 | Pension obligations | (9,483 | ) | (9,922 | ) | (10,556 | ) | (10,852 | ) | (11,600 | ) | (11,196 | ) | (10,566 | ) | (10,023 | ) | (9,430 | ) | (9,240 | ) | (8,918 | ) | (8,636 | ) | (8,287 | ) | (8,272 | ) | (7,904 | ) | |||||||||||||||||||||||||||||||
28 | Other liabilities | (11,131 | ) | (11,692 | ) | (11,033 | ) | (10,793 | ) | (12,795 | ) | (12,260 | ) | (11,955 | ) | (12,823 | ) | (14,477 | ) | (13,189 | ) | (15,399 | ) | (17,853 | ) | (18,680 | ) | (19,948 | ) | (20,799 | ) | |||||||||||||||||||||||||||||||
29 | Net Financial Assets / (Debt) | 27,317 | 21,653 | 18,991 | 14,455 | 13,032 | 13,054 | 3,919 | (8,901 | ) | (19,344 | ) | (27,477 | ) | (40,144 | ) | (59,837 | ) | (58,993 | ) | (45,614 | ) | (41,364 | ) | ||||||||||||||||||||||||||||||||||||||
30 | Capital / non-fin. assets (less def. cap. contributions starting 2012-13) | 34,217 | 37,607 | 40,122 | 39,517 | 40,839 | 42,197 | 44,623 | 46,622 | 49,015 | 50,744 | 51,570 | 54,076 | 55,745 | 56,928 | 57,551 | ||||||||||||||||||||||||||||||||||||||||||||||
31 | Net Assets / (Liabilities) d | 61,534 | 59,260 | 59,113 | 53,972 | 53,871 | 55,251 | 48,542 | 37,721 | 29,671 | 23,267 | 11,426 | (5,761 | ) | (3,248 | ) | 11,314 | 16,187 | ||||||||||||||||||||||||||||||||||||||||||||
Energy prices and exchange rate | ||||||||||||||||||||||||||||||||||||||||||||||||||||||||||||||
32 | Oil price (WTI US$/bbl) | 70.71 | 83.38 | 97.33 | 92.07 | 99.05 | 80.48 | 45.00 | 47.93 | 53.69 | 62.77 | 54.85 | 42.32 | 77.03 | 89.69 | 77.83 | ||||||||||||||||||||||||||||||||||||||||||||||
33 | Heavy oil price (WCS @ Hardisty; Cdn$/bbl) | 66.08 | 66.70 | 80.72 | 68.48 | 80.11 | 70.78 | 40.86 | 44.67 | 50.38 | 51.65 | 53.14 | 41.42 | 79.63 | 90.62 | 81.67 | ||||||||||||||||||||||||||||||||||||||||||||||
34 | Natural gas price (ARP; Cdn$/GJ) | 3.58 | 3.28 | 2.98 | 2.28 | 3.28 | 3.51 | 2.21 | 2.01 | 1.82 | 1.34 | 1.39 | 2.10 | 3.48 | 4.63 | 2.07 | ||||||||||||||||||||||||||||||||||||||||||||||
35 | Exchange rate (US¢/Cdn$) | 91.90 | 98.40 | 100.70 | 99.90 | 95.00 | 88.00 | 76.50 | 76.20 | 78.00 | 76.30 | 75.20 | 75.70 | 79.80 | 75.60 | 74.20 |
a Numbers are not strictly comparable due to numerous accounting policy changes over time. 2019-20 and 2021-22 expense by function have been re-classified following re-organizations and other adjustments.
b Reflects capital grants and other support included in expense, and capital investment in government-owned assets not included in expense. Capital investment adds to capital assets, which are depreciated over time through amortization expense. Numbers for 2008-09 to 2013-14 are estimates as details required to consolidate SUCH sector capital spending with full accuracy are not readily available.
c Does not include capital lease liabilities, or debt issued on behalf of government business enterprises which is reported on a net equity basis in Other Financial Assets.
d The change in net assets / (debt) year over year does not match the surplus / (deficit) exactly in most years, due to various balance sheet adjustments, most of which are minor. A significant adjustment reducing net assets by $2 billion was made in 2012-13, to recognize the accumulated deferred capital contribution liability when the accounting standard was adopted. 2021-22 opening amounts were restated to reflect adoption of the Asset Retirement Obligation accounting standard. In 2022-23, Financial Instruments and related standards were implemented resulting in unrealized remeasurement gains and losses being included in Net Assets but not in the surplus/deficit.
14 | 2023-24 Final Results | Year-End Report |
Annual Infrastructure Report
The government is committed to securing Alberta’s future by growing the economy, creating good-paying jobs, strengthening healthcare and education, investing in affordable housing, promoting environmental stewardship to develop our natural resources, and ensuring community safety. This commitment is supported by Alberta’s strong fiscal framework.
As Alberta continues to grow, this trend is expected to persist. The projects underway and completed over the past fiscal year have significantly contributed to high-quality education, skills development, healthcare, roadways, bridges, and other public infrastructure. These efforts support a growing province and enhance the quality of life for all Albertans, benefiting individuals, families, and businesses in both urban and rural communities.
In 2023-24, Capital Plan spending totaled $6.3 billion, $0.7 billion higher compared to 2022-23, supporting new and existing capital infrastructure projects across Alberta. This included the completion of 14 school projects, 20 bridge construction and approximately 60 road rehabilitation projects, 641 housing units, 3 courthouse facility projects, and 5 health facility projects, as well as continued progress on 57 school projects and 435 housing units.
The Plan also invested $1.3 billion through the Capital Maintenance and Renewal (CMR) program to maintain our public infrastructure, deliver programs and services efficiently, and avoid costly repairs or replacements.
New projects announced in 2023-24 included the University of Calgary – Multidisciplinary Hub, Lethbridge Irrigation Planning Project, Flood Mitigation for the Town of Drumheller, Beaverlodge Health Centre Replacement, National Association of Pharmacy Regulatory Authorities Capital Program, Highway 2 Balzac Interchange Replacement, Sheriffs Communications Equipment Renewal and Upgrade Project, and the Telus Spark-World Class Gallery Development.
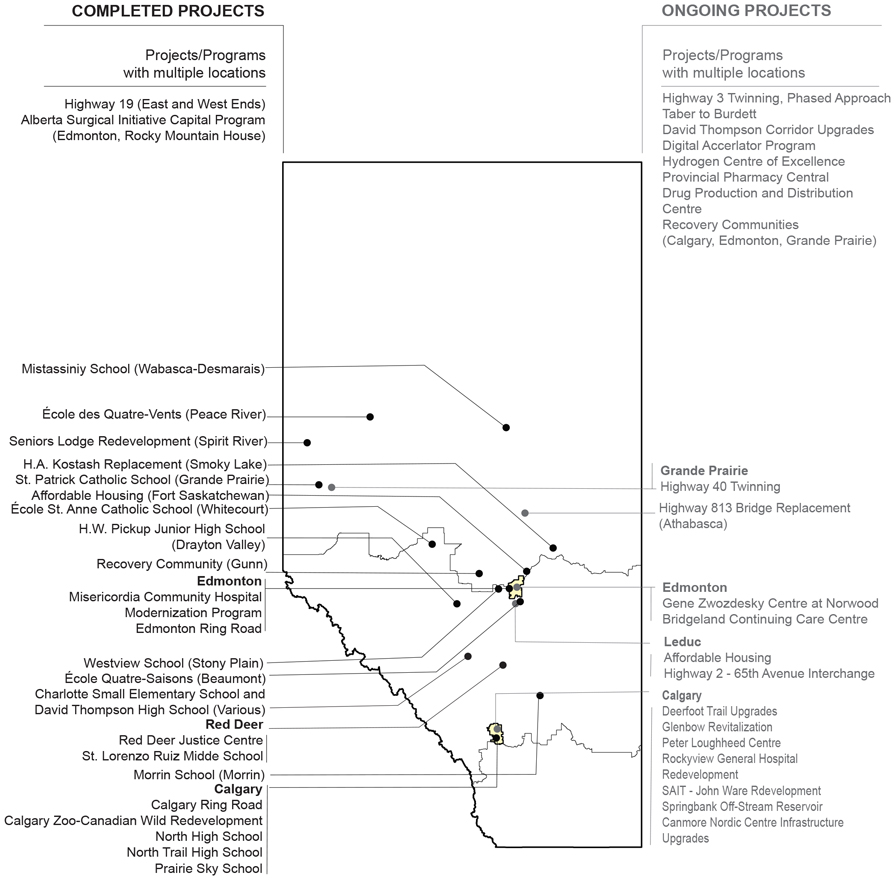
Other major projects and programs that are underway include province-wide schools, the Edmonton and Calgary light rail transit (LRT), Highway 3 Twinning (Taber to Burdett), Highway 40 Twinning South of Grande Prairie, Gene Zwozdesky Centre at Norwood (Edmonton), Recovery Communities, Affordable Housing Partnership Program, and the Rockyview General Hospital ICU/CCU/GI Redevelopment (Calgary). The Capital Plan also increased funding for initiatives like the Aboriginal Business Investment Fund to help support economic development opportunities for Indigenous people.
Capital Plan Initiatives Highlight
In 2023-24, the Capital Plan supported several key initiatives.
Economic Development in Rural Alberta Plan
• | This initiative helps rural communities thrive by providing infrastructure, supporting rural business innovation, skills development, and capacity building to spur economic growth. |
• | Rural Utilities Program allocated just over $6 million to support the installation of natural gas and electricity services to individual rural Albertans, as well as upgrades to the existing distribution system. |
• | Municipal Water and Wastewater Program (AMWWP) invested $41 million to construct high priority water supply and treatment and wastewater treatment and disposal facilities in small municipalities. |
• | Continuing to support the Strategic Transportation Infrastructure Program with $27 million this past year on transportation infrastructure for rural and smaller urban municipalities. |
Investing in Canada Infrastructure Program (ICIP)
• | The Integrated Bilateral Agreement between Alberta and the federal government was signed in 2018 for |
this program with the application intake concluding in March 2023. |
• | In 2023-24, $370 million in ICIP funding was spent on projects across the province. Of this funding $243 million was for light rail transit projects in Edmonton and Calgary. The balance was provided to other projects that include the Darwell Regional Wastewater Transmission Line –Phase B, G.H. Dawe Community Centre Expansion, ACE Regional Water Supply Extension, and Wastewater Treatment Upgrades. |
• | The Alberta government, municipalities and other organizations leveraged $3.7 billion in ICIP federal funding by adding funding toward substantial investments in community-based projects that has totalled more than $10 billion. All ICIP funding has been committed. |
Alberta Petrochemicals Incentive Program (APIP)
APIP invests in petrochemical projects, to strengthen and diversify the provincial economy.
• | The funding allocated last year was $109 million across approved projects including the Inter-Pipeline – Heartland Petrochemical Complex and Dow Expansion. |
In April 2023 a new project was announced, $21 million for the Rocky Mountain Gas to Liquids Carseland Facility.
Procurement and Project Delivery Review
The government completed a review to enhance procurement and project delivery practices through a hybrid-centralized model and streamline purchasing across ministries, simplify vendor interactions, and modernize procurement.
In October 2023, the report and action plan was posted publicly, signaling the closure of the Procurement and Project Delivery Review.
2023-24 Final Results | Year-End Report | 15 |
Budget 2023 Capital Plan Analysis
Local Government Fiscal Framework (LGFF)
The Capital Plan provides funding to Alberta’s municipalities to help them undertake projects aligned with local priorities. The 2023-24 fiscal year marked the end of the Municipal Sustainability Initiative (MSI), replaced by the Local Government Fiscal Framework (LGFF). LGFF offers municipalities a more predictable funding approach. In 2023-24, the Capital Plan provided $487 million through MSI. Baseline LGFF funding totaling $722 million commences in 2024-25.
Budget 2023 Grant and
Investment Spending
The Capital Plan includes:
• | Capital Investment – cash spent on acquisition of government of Alberta capital assets, including hospitals, schools, and provincial highways. |
These transactions are recorded as capital assets on the province’s Statement of Financial Position. |
• | Capital Grants – cash provided to entities outside of the Government of Alberta for the development of their capital assets, including municipalities, communities and other partners. Examples include the Edmonton and Calgary LRT projects, the Strategic Transportation Infrastructure Program, and the Water and Wastewater programs. These transactions are recorded as expense in the government’s Income Statement. |
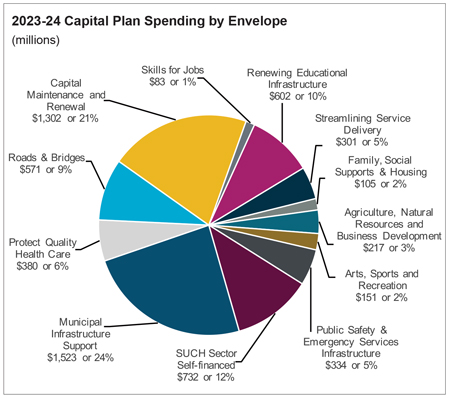
In 2023-24, Capital Plan spending totalled $6.3 billion, with $4.2 billion or 67 per cent in capital investment and $2.1 billion or 33 per cent in capital grants.
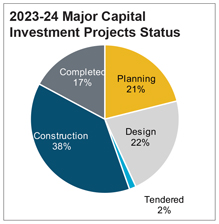
Status of Capital Investment Projects over $5 million as of March 31, 2024
The pie graph below illustrates the status of capital investment projects (excluding capital maintenance and renewal projects) that have a Total Provincial Support of $5 million and above.
Capital Plan | Change from | |||||||||||||||||||
(millions of dollars) | 2023-24 | 2022-23 | 2022-23 | |||||||||||||||||
BY MINISTRY | Budget | Actual | Actual | Budget | Actual | |||||||||||||||
Advanced Education | 492 | 575 | 478 | 83 | 97 | |||||||||||||||
Affordability and Utilities | 8 | 8 | 6 | - | 2 | |||||||||||||||
Agriculture and Irrigation | 64 | 31 | 48 | (33 | ) | (17 | ) | |||||||||||||
Arts, Culture and Status of Women | 139 | 124 | 97 | (15 | ) | 27 | ||||||||||||||
Children and Family Services | 1 | 6 | 2 | 5 | 4 | |||||||||||||||
Education | 765 | 773 | 851 | 8 | (78 | ) | ||||||||||||||
Energy and Minerals | 221 | 144 | 66 | (77 | ) | 78 | ||||||||||||||
Environment and Protected Areas | 112 | 104 | 55 | (8 | ) | 49 | ||||||||||||||
Forestry and Parks | 96 | 75 | 61 | (21 | ) | 14 | ||||||||||||||
Health | 1,273 | 735 | 841 | (538 | ) | (106 | ) | |||||||||||||
Immigration and Multiculturalism | 0 | - | 0 | - | - | |||||||||||||||
Indigenous Relations | 16 | 11 | 28 | (5 | ) | (17 | ) | |||||||||||||
Infrastructure | 423 | 351 | 301 | (72 | ) | 50 | ||||||||||||||
Jobs, Economy and Trade | 20 | 14 | 10 | (6 | ) | 4 | ||||||||||||||
Justice | 18 | 23 | 14 | 5 | 9 | |||||||||||||||
Mental Health and Addiction | 18 | 26 | 10 | 8 | 16 | |||||||||||||||
Municipal Affairs | 783 | 765 | 751 | (18 | ) | 14 | ||||||||||||||
Public Safety and Emergency Services | 6 | 7 | 4 | 1 | 3 | |||||||||||||||
Seniors, Community and Social Services | 142 | 136 | 98 | (6 | ) | 38 | ||||||||||||||
Service Alberta and Red Tape Reduction | 46 | 34 | 23 | (12 | ) | 11 | ||||||||||||||
Technology and Innovation | 361 | 128 | 68 | (233 | ) | 60 | ||||||||||||||
Tourism and Sport | - | 0 | - | - | - | |||||||||||||||
Transportation and Economic Corridors | 2,973 | 2,211 | 1,804 | (762 | ) | 407 | ||||||||||||||
Treasury Board and Finance | 28 | 18 | 13 | (10 | ) | 5 | ||||||||||||||
Legislative Assembly | 2 | 1 | 2 | (1 | ) | (1 | ) | |||||||||||||
Total Capital Plan - Fully Consolidated Basis | 8,005 | 6,300 | 5,633 | (1,705 | ) | 667 |
16 | 2023-24 Final Results | Year-End Report |
Capital Plan
(millions of dollars) | Change from | |||||||||||||||||||
2023-24 | 2022-23 | 2022-23 | ||||||||||||||||||
BY ENVELOPE | Budget | Actual | Actual | Budget | Actual | |||||||||||||||
Agriculture and Natural Resources | 371 | 217 | 139 | (154 | ) | 78 | ||||||||||||||
Arts, Sports and Recreation | 176 | 151 | 112 | (25 | ) | 39 | ||||||||||||||
Capital Maintenance and Renewal | 1,413 | 1,302 | 1,166 | (111 | ) | 136 | ||||||||||||||
Family, Social Supports and Housing | 132 | 105 | 55 | (27 | ) | 50 | ||||||||||||||
Municipal Infrastructure Support | 1,822 | 1,523 | 1,145 | (299 | ) | 378 | ||||||||||||||
Protect Quality Health Care | 834 | 380 | 500 | (454 | ) | (120 | ) | |||||||||||||
Public Safety and Emergency Infrastructure | 337 | 334 | 278 | (3 | ) | 56 | ||||||||||||||
Renewing Educational Infrastructure | 631 | 602 | 508 | (29 | ) | 94 | ||||||||||||||
Roads and Bridges | 986 | 571 | 653 | (415 | ) | (82 | ) | |||||||||||||
Skills for Jobs | 75 | 83 | 98 | 8 | (15 | ) | ||||||||||||||
Streamlining Service Delivery | 593 | 301 | 238 | (292 | ) | 63 | ||||||||||||||
Total Capital Plan - Core Government | 7,370 | 5,568 | 4,893 | (1,802 | ) | 675 | ||||||||||||||
Schools, Universities, Colleges, Health Entities | ||||||||||||||||||||
(SUCH) Sector – Self-financed Investment | 634 | 732 | 739 | 98 | (7 | ) | ||||||||||||||
Total Capital Plan-Fully Consolidated Basis | 8,005 | 6,300 | 5,633 | (1,705 | ) | 667 |
2023-24 Budget to Actual Comparison
Capital spending in 2023-24 was $1.7 billion lower than estimated in
Budget 2023.
• | Protect Quality Health Care were $454 million lower than budgeted: |
- | Net of $293 million for various health facilities including the Arthur J.E. Child Comprehensive Cancer Centre in Calgary, Rockyview General Hospital, and Gene Zwozdesky Centre at Norwood, due to changes in project scheduling from servicing agreement negotiations and cash flow requirements; |
- | $88 million lower for Continuing Care Capital Program due to the time required to complete planning for capital projects; |
- | $73 million related to various health initiatives, including Alberta Surgical Initiative, Rural Health Facilities Revitalization Program, and Urban Addiction Strategy Uplift due to timing of construction and equipment delivery timelines. |
• | Roads and Bridges $415 million lower than budgeted: |
- | $297 million due to slower-than-anticipated progress on highway |
twinning, widening and expansion projects; |
- | $104 million for the Deerfoot Trail Upgrade, primarily due to unexpected delays in the construction start and tender process; |
- | $14 million related to Edmonton and Calgary ring roads due to slower progress on minor remaining work such as deficiency corrections and noise wall constructions. |
• | Municipal Infrastructure Support declined by $299 million from budget: |
- | $138 million primarily related to Municipal Water and Wastewater program and Water for Life due to slower-than-expected construction progress by municipalities; |
- | $123 million lower in the Edmonton and Calgary LRT projects to align with project timelines and schedule managed by the municipalities; |
- | $89 million for various Investing in Canada Infrastructure Program (ICIP) projects and other capital grant programs to re-align cash flows with project progress and timelines; |
- | Offset by additional spending of $51 million new funding to support the development of the Calgary Rivers District and Event Centre. |
• | Streamlining Service Delivery spending was down $292 million from budget mainly due to Alberta Broadband Strategy, and government facilities and information technology (IT) related projects long lead times for materials and equipment. |
• | Agriculture, Natural Resources, and Business Development expenditures were $154 million lower than budgeted due to supply chain delays, slower construction progress on various irrigation projects, and the re-profiling of funds from the Alberta Petrochemicals Incentive Program and the Alberta Carbon Capture Incentive Program into future years. |
• | $111 million lower Capital Maintenance and Renewal spending for Health Facilities projects, bridge construction, highway rehabilitation and maintenance, and various government facilities due to the timing of project timelines and schedules; partly offset by capital purchases from school boards. |
• | Spending on Renewing Educational Infrastructure was $29 million lower than budgeted to align with project scope, progress, and timelines. |
2023-24 Final Results | Year-End Report | 17 |
• $47 million decrease in Arts, Sports, and Recreation, Family and Social Supports and Housing, Skillsfor Jobs and Public Safety and Emergency Infrastructure primarily to re-align cash flow requirements with project progress and timelines.
The decrease was partially offset by increase from budget in several areas:
• $98 million net increase in self-financed investment by University, Schools, Technology and Innovation, and Health entities self-financed, driven by $115 million in higher spending on capital projects for education and post-secondary institutions, was partially offset by a $17 million decrease in spending by primarily in Alberta Health Services.
Overall, the 2023-24 Capital Plan envelope spending comprised of:
• $1.5 billion in Municipal Infrastructure Support:
- $571 million in federal and provincial funding for LRT projects;
- $487 million to support municipalities through the Municipal Sustainability Initiative;
- $265 million from the federally funded Canada Community Building Fund;
- $96 million in other capital grants program including various ICIP projects, transportation grant programs, and other federal grant programs;
- $52 million for water supply, treatment, wastewater treatment and disposal system grants;
- $52 million for the Calgary Event Centre project.
• $1.3 billion in Capital Maintenance and Renewal:
- $658 million for bridge and highway rehabilitation;
- $197 million for parks, government facilities preservation, and information technology;
- $147 million for health facilities; | - $146 million for post-secondary institutions;
- $112 million for school facilities; and
- $43 million for family, social support, and housing.
• $0.6 billion for Renewing Educational Infrastructure:
- 57 school projects currently underway, and 14 completed in 2023-24.
• $0.6 billion for Roads and Bridges:
- $402 million for highway twinning, widening and expansion projects including Deerfoot Trail Upgrades, QEII and 65th Avenue interchange in Leduc, and twinning projects including Highway 3, 11, 19, and 40;
- $112 million for Calgary and Edmonton Ring Roads;
- $57 million for other municipal road support related to Yellowhead Trail, Terwillegar Expansion and 50th Street overpass in Edmonton.
• $0.4 billion for Protecting Quality Health Care: | - Recovery Communities in Edmonton, Grande Prairie, Calgary, Gunn, Red Deer, Blood Tribe, Enoch, Lethbridge, Central Alberta, Siksika, and Tsuut’ina First Nations.
• $0.3 billion for Streamlining Service Delivery:
- $269 million for General Capital and Information Technology; and
- $31 million for Alberta Broadband Strategy.
• $0.7 billion in SUCH sector self-financed projects:
- $346 million in projects self-funded by post-secondary institutions;
- $241 million in health facilities;
- $145 million in school board funded, and Technology and Alberta Innovates projects.
• $0.9 billion for Agriculture, Natural Resources and Business Development, Family, Social Supports and Housing, Public Safety and Emergency Infrastructure, Skills for Jobs, Arts, Sports, and Recreation. | ||
|
18 | 2023-24 Final Results | Year-End Report |
2023-24 Select Ongoing and Completed Projects
2023-24 Final Results | Year-End Report | 19 |
Year-end Highlights
This section highlights the total projects completed and underway by category, which also includes the total assets existing, and in operation in the province as of March 31, 2024.
12 health facility projects in progress All previously approved health facility projects that include continued renovations, modernizations, expansions and/or redevelopment. | 7 courthouse projects currently underway
3 courthouse projects completed | |||||
9 health facilities capital programs in progress |
77 owned or leased courthouse facilities existing | |||||
All previously approved health facility capital programs that include multiple projects and initiatives with ongoing implementation. |
11 correctional facilities existing | |||||
5 health facilities projects completed |
|
641 housing units completed | ||||
900+ existing owned or leased buildings Including health facilities, continuing care, community care facilities where health services are provided. |
1,187 housing units committed
435 housing units under construction | |||||
|
20 bridge construction and over ~60 road rehabilitation projects completed |
~59,850 existing affordable housing units | ||||
5 roads and bridges expansion projects completed
64,000 km highway existing (two lanes equivalent length)
~4,800 bridge structures existing |
|
57 school projects underway
14 school projects completed
1,750+ existing school buildings
6,000+ existing modular classrooms |
20 | 2023-24 Final Results | Year-End Report |
Select Ongoing and Completed Projects - Status as of March 31, 2024
Planning and Design
Total Capital Plan Funding and Expected Completion in planning and design are estimates and subject to change upon finalizing project scope.
Red Deer Regional Hospital Centre Redevelopment
Total Capital Plan Funding: $1.8 billion Expected Completion: 2029
• | The project will expand inpatient capacity, adding surgical suites, a cardiac catheterization laboratory, new medical device reprocessing space, additional ambulatory care capacity, and increases to many other clinical programs throughout the hospital. |
Foothills Medical Centre Neonatal Intensive Care Unit (Calgary)
Committed as of Budget 2023: $52 million Expected Completion: TBD
• | This project will redevelop two floors in the Main Building creating 60 neonatal intensive care spaces. |
Recovery Communities (Edmonton and Grande Prairie)
Committed as of Budget 2023: $50 million Expected Completion: 2027
• | This multi-facility program provides purpose - built facilities for the long term treatment of Albertans pursuing recovery from addiction in several locations across the province. These facilities are in various stages of planning, construction, and completion. Project planning is underway for a 75 bed facility in Edmonton and a 50 bed facility in Grande Prairie. |
Stollery Children’s Hospital Planning
Committed as of Budget 2023: $3 million Expected Completion: TBD
• | This project will provide a plan for the development of a stand-alone Stollery Children’s Hospital that will consolidate a comprehensive range of pediatric services in Edmonton. |
Highway 881 Safety and Roadway Improvements
Total Capital Plan Funding: $145 million Expected Completion: Fall 2028
• | This project will include safety and roadway improvements on Highway 881 between Lac La Biche and Highway 63. |
Highway 40 Grade Widening between Hinton and Grande Cache
Total Capital Plan Funding: $84 million Expected Completion: Fall 2027
• | This project will widen Highway 40 between Highway 16 and north of Berland River. |
Mount Royal University – Repurposing Existing Facilities
Total Capital Plan Funding: $65 million Expected Completion: 2026
• | This multi-phase project will re-purpose space in alignment with the master for the campus to improve access to programs, increase functionality and building capacity to accommodate up to 1,250 additional students. |
Affordable and Specialized Housing
Total Capital Plan Funding: $5 million Expected Completion: Spring 2026
• | Proposed development in Edmonton add specialized housing for 63 single resident occupancy units and in Calgary adding 16 affordable units under a flagship net-zero project. |
Designated Industrial Zone Pilot Project
Total Capital Plan Funding: $5 million Expected Completion: Spring 2026
• | This project will develop feasibility studies to explore cost-effective, efficient and stakeholder supportive methods to implement the Designated Industrial Zone (DIZ) in Edmonton’s heartland, create jobs, and stimulate the economy of the region. |
Big Island Provincial Park Planning
Total Capital Plan Funding: $10 million Expected Completion: Spring 2027
• | In collaboration with the city of Edmonton and the Enoch Cree Nation, this project will determine the condition and appropriate future use of the Big Island Provincial Park. |
Badlands Amphitheatre (Drumheller)
Total Capital Plan Funding: $2 million Expected Completion: TBD
• | This project includes multi-phase planning for the rehabilitation of 1,200 seats plus engineering and architectural improvements. |
The provincial commitment total is $3 billion for LRT projects in Edmonton and Calgary: | ||
| Edmonton - $1.47 billion for the Metro Line LRT Extension, West Valley Line LRT, and Capital Line LRT Extension. | |
Calgary - $1.53 billion for the Green Line LRT and Blue Line Extension
|
2023-24 Final Results | Year-End Report | 21 |
Construction in Progress
Springbank Off-Stream Reservoir
Total Capital Plan Funding: $810 million Expected Completion: Spring 2025
• | This project will provide flood protection along the Elbow River in Calgary and other downstream communities as part of an overall flood mitigation system. |
Deerfoot Trail Upgrades (Calgary)
Total Capital Plan Funding: $805 million Expected Completion: Fall 2027
• | Upgrades to the Deerfoot Trail through Calgary. |
Highway 3 Twinning (From Taber to Burdett)
Total Capital Plan Funding: $261 million Expected Completion: Fall 2026
• | This project twins Highway 3 between Taber and Burdett. |
Highway 40 Twinning, South of Grande Prairie
Total Capital Plan Funding: $228 million Expected Completion: Fall 2024
• | The project includes the construction and twinning of a second bridge across the Wapiti River in the Grande Prairie region. |
Highway 2 - 65th Avenue Interchange
Total Capital Plan Funding: $112 million Expected Completion: Fall 2026
• | This project builds a new interchange at QEII to improve roadway access to Leduc and surrounding areas, and the Edmonton International airport. |
Highway 813 Bridge
Replacement
Total Capital Plan Funding: $70 million Expected Completion: Fall 2026
• | Construction of a bridge on Highway 813 over the Athabasca River. |
Gene Zwozdesky Centre at Norwood (Edmonton)
Total Capital Plan Funding: $415 million Expected Completion: Summer 2025
• | The project will accommodate 350 enhanced long-term care beds, with a broad range of support programs and services, in more than 38,000 square metres of new and renovated space to support the growing need for these services in Edmonton. |
Peter Lougheed Centre Emergency Department, Mental Health Intensive Care Unit and Laboratory Redevelopment (Calgary)
Total Capital Plan Funding: $151 million Expected Completion: Fall 2025
• | This multi-phase project will renovate the existing space within the emergency department and add additional emergency space, a mental health short stay unit, psychiatric intensive care unit and rapid response lab development. |
Rockyview General Hospital ICU/CCU/GI Redevelopment (Calgary)
Total Capital Plan Funding: $89 million Expected Completion: Summer 2024
• | This project includes an expansion of the Intensive Care Unit (ICU) and Cardiac Care Unit (CCU) and Gastrointestinal (GI) Clinic. The redevelopment will increase single patient units in the ICU and CCU and provide space that better supports patient and family-centered care. |
Bridgeland Riverside Continuing Care Centre (Calgary)
Total Capital Plan Funding: $131 million Expected Completion: Fall 2025
• | This project will meet an urgent need to increase access to continuing and complex care. |
Recovery Communities (Calgary)
Committed in Budget 2023: $25 million Expected Completion: 2025
• | This multi-facility program provides a purpose - built facility for the long term treatment of Albertans pursuing recovery from addiction. Project construction underway for 75 beds in Calgary. |
Registries Modernization
Total Capital Plan Funding: $160 million Expected Completion: Fall 2028
• | This project accelerates system replacements for Alberta Land Titles and Motor Vehicles while other registry systems include modernization and enhancement activities. |
Rural Health Facilities Revitalization Program
Total Capital Plan Funding: $105 million Expected Completion: 2027
• | This program delivers scaled strategic projects and renovations in rural health facilities across multiple locations. |
Glenbow Revitalization (Calgary)
Total Capital Plan Funding: $40 million Expected Completion: Spring 2026
• | The Glenbow Museum will be renovated and modernized into a world-class gallery space. |
Southern Alberta Institute of Technology – John Ware Redevelopment
Total Capital Plan Funding: $41 million Expected Completion: 2026
• | This project will complete the interior redevelopment of the John Ware building providing an upgraded new center of excellence for the culinary program. |
22 | 2023-24 Final Results | Year-End Report |
Hydrogen Centre of Excellence
Total Capital Plan Funding: $5 million Expected Completion: Fall 2024
• | To provide the technology and innovation needed to achieve the goals of the Alberta’s Hydrogen Roadmap. |
Cold Lake Fish Hatchery
Total Capital Plan Funding: $12 million Expected Completion: Summer 2024
• | This project modernizes the hatchery into a recirculating aquaculture system and will result in improved utility operations. |
David Thompson Corridor Upgrades
Total Capital Plan Funding: $8 million Expected Completion: 2024
• | This project improves the infrastructure and safety for staging areas and recreational services across 12 sites along the David Thompson highway. |
Affordable Housing, Leduc
Total Capital Plan Funding: $2 million Expected Completion: Fall 2024
• | Construction of a 24-unit apartment building to meet the needs with low incomes featuring rents less than 60 per cent of the median market rent. |
Completed Projects
*Projects are defined as completed when construction has ended, however, they may continue to be supported by the Capital Plan budget due to close out and preoperational costs.
West Calgary Ring Road
Total Capital Plan Funding: $1.2 billion
• | Construction is complete for 101 kilometres of free flow traffic around the Calgary region. |
Edmonton Ring Road (Southwest Anthony Henday Drive)
Total Capital Plan Funding: $100 million
• | Construction is complete for rehabilitating existing lanes, the addition of a lane in each direction and the bridge structure widening over the North Saskatchewan River. |
Highway 19 (East and West)
Total Capital Plan Funding: $95 million
• | The construction is complete for the twinning of 3.5 km of Highway 19 from Highway 60 to 3.5 km East of Highway 60, and realignment and improvements to the Highway 19 and Highway 60 intersection and intersection improvements and service roads along the corridor. |
Red Deer Justice Centre
Total Capital Plan Funding: $203 million
• | The new justice centre features 12 courtrooms, with space for future expansion if required to address needs in the community and ensuring vital justice services are delivered effectively to residents of central Alberta. |
Misericordia Community Hospital Modernization Program
Total Capital Plan Funding: $85 million
• | The new emergency department now accommodates current and future patient volume needs, with the capacity for around 60,000 patient visits per year. |
Recovery Communities (Gunn)
Committed as of Budget 2023: $22 million
• | Construction is complete for the 100-bed Lakeview Recovery Community in Gunn, which is a purpose-built facility for the long-term treatment of Albertans pursuing recovery from addiction. |
Senior Lodge Redevelopment, Spirit River
Total Capital Plan Funding: $36 million
• | Construction completion of a new 92 unit Seniors Lodge and Continuing Care facility. |
Calgary Zoo – Canadian Wilds Redevelopment
Total Capital Plan Funding: $16 million
• | Improvements complete to the Canadian Wilds Redevelopment, which is comprised of major upgrades and expansion of the River Otter habitat and new habitats for the iconic Polar Bear and arctic species. |
Schools
The following 14 school projects were completed in 2023-24 with total capital plan funding of over $450 million:
• | Condor: Charlotte Small Elementary School and Leslieville: David Thompson High School (Various) |
• | École des Quatre-Vents (Peace River) |
• | École Quatre-Saisons (Beaumont) |
• | École St. Anne Catholic School (Whitecourt) |
• | H.A. Kostash Replacement (Smoky Lake) |
• | H.W. Pickup Junior High School (Drayton Valley) |
• | Mistassiniy School (Wabasca-Desmarais) |
• | Morrin School (Morrin) |
• | North High School (Calgary) |
• | North Trail High School (Calgary) |
• | Prairie Sky School (Calgary) |
• | St. Lorenzo Ruiz Middle School (Red Deer) |
• | St. Patrick Catholic School (Grande Prairie) |
• | Westview School (Stony Plain) |
2023-24 Final Results | Year-End Report | 23 |