Congress Large Cap Growth Fund
Congress Mid Cap Growth Fund
Congress All Cap Opportunity Fund
ANNUAL REPORT
December 31, 2016
CONGRESS FUNDS
| Shareholder Letter | | | 1 | |
| | | | | |
| Sector Allocations | | | 5 | |
| | | | | |
| Historical Performance | | | 6 | |
| | | | | |
| Schedules of Investments | | | | |
| | | | | |
| Congress Large Cap Growth Fund | | | 12 | |
| | | | | |
| Congress Mid Cap Growth Fund | | | 14 | |
| | | | | |
| Congress All Cap Opportunity Fund | | | 16 | |
| | | | | |
| Statements of Assets and Liabilities | | | 18 | |
| | | | | |
| Statements of Operations | | | 20 | |
| | | | | |
| Statements of Changes in Net Assets | | | 22 | |
| | | | | |
| Financial Highlights | | | 28 | |
| | | | | |
| Notes to Financial Statements | | | 34 | |
| | | | | |
| Report of Independent Registered Public Accounting Firm | | | 44 | |
| | | | | |
| Expense Examples | | | 45 | |
| | | | | |
| Approval of Investment Advisory Agreement | | | 47 | |
| | | | | |
| Trustees and Executive Officers | | | 51 | |
| | | | | |
| Additional Information | | | 54 | |
| | | | |
| Privacy Notice | | Inside Back Cover | |
Annual Letter to Mutual Fund Shareholders
For the year January 1, 2016 to December 31, 2016
General Market Commentary:
2016 proved to be a fascinating year from an investment perspective. The stock market withstood fears about a stagnating economy early in the year and the surprise of the Brexit vote in June to enter autumn with a modest gain. November’s election lit the trading pyre in a way that surprised many. Stocks rallied to close the year and bond prices fell, driving yields higher. The “Trump rally” as some called it favored stocks that would conceivably benefit from new infrastructure spending, higher interest rate, and less regulation. The rally was not uniform. Banks and commodity related stocks enjoyed renewed investor interest while pharmaceutical stocks lagged. Size also mattered. Small cap stocks, considered more volatile over time than large cap stocks returned 26.6% for the one year time period ending December 31, 2016 as measured by the S&P Small Cap 600 Index. In comparison, the S&P 500 Index rose 12.0% for the one year time period ending December 31, 2016.
In December, the Federal Reserve increased short term interest rates for the second time in this cycle. This followed December’s reading of quarter gross domestic product (GDP) of 3.5%, the strongest level in two years. With unemployment measuring 4.6%, the prospects for economic growth appear more stable than a couple of years ago.
Performance Highlights:
Large Cap Growth
For the year ending December 31, 2016, the Fund’s Retail Class and Institutional Class shares returned 4.48% and 4.75% respectively, compared with 7.08% for the Russell 1000 Growth Index.
Four stocks mentioned as highlights in our June 30, 2016 letter continued to perform well in the second half of the year. Industrial sector stocks, Illinois Tool Works, J.B Hunt Transport and Rockwell Automation all returned close to 30%, maintaining their momentum from earlier in the year. United Health Group, the nation’s largest health insurer posted impressive third quarter earnings and returned over 35% for the year.
On the negative side both Bristol Myers Squibb and Under Armour weighed on performance. Bristol, the large pharmaceutical company, is a leader in the expanding field of immuno oncology to fight various forms of cancer. The company suffered a setback in July as one of its therapies did not win approval for first line treatment for a specific type of lung cancer. The company continues to test and develop its two immuno oncology drugs as stand-alone therapies and in combination with other treatments.
Under Armour (UA) continues to expand its presence in the athletic and footwear markets. UA has maintained 20% revenue growth but higher distribution
costs and disruptions in the retail chain weighed on margins and profitability. The company continues to develop its direct to consumer and international businesses.
In late December, the Fund distributed $0.20 per retail share and $0.26 per institutional share representing ordinary income and capital gains for the year.
Mid Cap Growth
For the year ending December 31, 2016, the Fund’s Retail Class and Institutional Class shares returned 13.11% and 13.38% respectively, compared with 7.33% for the Russell Mid-Cap Growth Index.
Strong performance from bottom up security selection drove successful portfolio results for 2016. Further aiding returns, two companies in the portfolio were the subject of acquisition offers. These were Linear Technology, a semiconductor company, and B/E Aerospace, a supplier of aircraft interiors.
Selections within consumer discretionary and information technology aided the portfolio. Dorman Auto Products, a supplier to the automotive aftermarket, posted strong results due to increasing average automobile age, increasing miles driven domestically, and broadening product offerings. Apart from Linear Technology, strength in technology came from Cognex, a supplier of machine vision products. Cognex has been capitalizing on the trends of factory automation and manufacturing complexity, and is a major direct and indirect supplier to Apple.
Headwinds to the portfolio included G-III Apparel which suffered from weak outerwear sales at its Wilson’s Leather and G.H. Bass chains, and a perplexing offer for DKNY. Manhattan Associates, a technology supplier for retailers and logistics providers, saw weakening performance due to customer implementation delays.
In late December, the Fund distributed $0.15 per retail share and $0.18 per institutional share representing ordinary income and capital gains for the year.
All Cap Opportunity
For the year ending December 31, 2016, the Fund’s Retail Class and Institutional Class shares returned 13.18% and 13.51% respectively, compared with 12.74% for the Russell 3000 Index.
The best holding for the calendar year of 2016 was NVIDIA Corp. NVIDIA, which designs and manufactures computer graphics chips for use in personal computers, saw its stock rise 227% over the year as their gaming segment saw prodigious results. United Rentals, the largest equipment rental company in the world, also did well posting a 46% gain on an improved domestic outlook for increased construction, maintenance, and infrastructure spending. The stock price of Baker Hughes, a provider of oilfield services, products, and systems to the oil and natural gas industry, increased after it agreed to be acquired by the General Electric Company.
The primary detractors from the portfolio were also varied in nature and all were sold mid-year 2016. Hertz Global Holdings owns and operates auto and equipment rental locations and its stock fell 36% from the beginning of the year to
when it was sold by the Fund in May, amid lackluster operating results. VeriFone Systems, a manufacturer and distributor of point-of-sale electronic payment devices, found its stock price falling until it was sold in mid-July when the company ran into bottlenecks as it rushed to provide electronic chip compliant units to its customers. SUPERVALU, Inc. is a distributor of food and operator of grocery stores and witnessed its stock price falling in the first half of the year before it was sold from the Fund in May as the company faced unrelenting headwinds from depreciating wholesale food prices and slowing turnover.
In late December, the Fund distributed $0.02 per retail share and $0.04 per institutional share representing ordinary income for the year.
Portfolio Commentary:
Large Cap Growth
As of December 31, 2016, the portfolio contains 42 stocks with the technology sector comprising 30% of the portfolio. That sector includes Apple, the largest single holding at 3.3% of the portfolio. The consumer discretionary and health care sectors both represent just over 14% of the portfolio. Amongst other names, the discretionary sector includes two long term holdings, Home Depot and TJX Companies (owner of TJ Maxx and Marshalls) and newly added O’Reilly Automotive. Other recent additions to the portfolio include Chevron in the energy sector and Suntrust Banks in the financial sector. The estimated dividend yield on the portfolio holdings is 1.5% with 74% or 31 of the holdings paying a dividend.
Mid Cap Growth
As of December 31, 2016, the portfolio contains 40 names and turnover in 2016 was below 20%. More than three-quarters of the holdings are from the consumer discretionary, health care, industrial, and information technology sectors. The largest sector, Industrials, is about one-quarter of the portfolio.
Recent additions include Hasbro, a leading toy company, and Masco, a leader in home improvement and building products. Recent removals include Graco, a manufacturer of pumps and fluid dispensing equipment, and ANSYS, an engineering software supplier.
All Cap Opportunity
The Fund’s performance over the second half of the year was much improved over that from the first half of the year.
The boost in performance came from a broad variety of sectors and was accomplished without the need for increased turnover of the Fund’s holdings. Holdings in the portfolio remain concentrated with fewer than 25 stocks but span an eclectic mix of industries and products. Selective elimination of underperforming stocks assisted in the upturn.
Newer names added in the third quarter include Six Flags Entertainment Corporation, an owner and operator of regional theme parks and water parks, Carlisle Companies, a conglomerate that designs, manufactures, and sells a wide range of products that serve a diverse range of markets. Fourth quarter additions
include Broadcom, a supplier of analog and digital semiconductor chips for wired and wireless communications needs, Zayo Group, a provider of bandwidth infrastructure services, and Regal Entertainment Group, an operator of multi-screen theatres.
In Closing:
Thank you for the confidence you place in us and for your investment in the Funds. We look forward to serving your investment needs.
Sincerely,
 |  |  |
| | | |
| Daniel A. Lagan, CFA | Todd Solomon, CFA | John Beaver, CFA |
| Large Cap Growth | Mid Cap Growth | All Cap Opportunity |
Important Disclosures
Past performance is not a guarantee of future results.
The opinions provided herein are those of Congress Asset Management Company and are not intended to be a forecast of future events, a guarantee of future results, nor investment advice.
Must be preceded or accompanied by a prospectus.
Investment performance reflects fee waivers. In the absence of such waivers total returns would be reduced.
Mutual fund investing involves risk. Principal loss is possible. The Funds may invest in foreign securities which may involve greater volatility and political, economic, and currency risks and differences in accounting methods. Investments in small and mid-sized companies involve additional risks such as limited liquidity and greater volatility than larger companies. The Congress All Cap Opportunity Fund may invest in debt securities which typically decrease in value when interest rates rise. This risk is usually greater for longer-term debt securities. The Congress Large Cap Growth Fund may invest in Exchange Traded Funds (ETFs), which may trade at a discount to the aggregate value of the underlying securities and although expense ratios for ETFs are generally low, frequent trading of ETFs by the Fund can generate brokerage expenses.
The S&P 500 Index is a broad based unmanaged index of 500 stocks, which is widely recognized as representative of the equity market in general. The Russell 1000 Growth Index measures performance of the large-cap growth segment of the U.S. Equity Universe. The Russell Mid Cap Growth Index measures performance of the mid-cap growth segment of the U.S. Equity Universe. The Russell 3000 Index measures performance of the largest 3,000 U.S. companies representing approximately 98% of the U.S. Equity Universe. The S&P 600 Index is an index of small-cap stocks managed by Standard and Poor’s which covers a broad range of small cap stocks in the United States, is weighted according to market capitalization, and covers about 3-4% of the total market for equities in the United States. One cannot invest directly in an index.
Dividend yield is a financial ratio that indicates how much a company pays out in dividends each year relative to its share price, calculated by dividing the dollar value of dividends paid in a given year per share of stock held by the dollar value of one share of stock.
Fund holdings and sector allocations are subject to change and should not be considered a recommendation to buy or sell any security. For a complete list of fund holdings, please refer to the Schedules of Investment in this report.
Congress Funds are distributed by Quasar Distributors, LLC
CONGRESS FUNDS
| SECTOR ALLOCATIONS at December 31, 2016 (Unaudited) |
Congress Large Cap Growth Fund
| Sector Allocation | | Percent of Net Assets |
| Information Technology | | | 30.1 | % |
| Health Care | | | 14.3 | % |
| Consumer Discretionary | | | 14.0 | % |
| Consumer Staples | | | 11.5 | % |
| Industrials | | | 11.1 | % |
| Financials | | | 5.7 | % |
| Materials | | | 4.7 | % |
| Energy | | | 4.0 | % |
| Real Estate | | | 2.3 | % |
| Cash* | | | 2.3 | % |
| Net Assets | | | 100.0 | % |
Congress Mid Cap Growth Fund
| Sector Allocation | | Percent of Net Assets |
| Industrials | | | 24.2 | % |
| Information Technology | | | 19.7 | % |
| Health Care | | | 16.3 | % |
| Consumer Discretionary | | | 16.1 | % |
| Financials | | | 7.7 | % |
| Consumer Staples | | | 3.9 | % |
| Real Estate | | | 2.6 | % |
| Energy | | | 2.4 | % |
| Materials | | | 2.2 | % |
| Cash* | | | 4.9 | % |
| Net Assets | | | 100.0 | % |
Congress All Cap Opportunity Fund
| Sector Allocation | | Percent of Net Assets |
| Information Technology | | | 23.8 | % |
| Consumer Discretionary | | | 20.7 | % |
| Health Care | | | 16.3 | % |
| Industrials | | | 15.6 | % |
| Real Estate | | | 7.9 | % |
| Financials | | | 4.5 | % |
| Energy | | | 3.9 | % |
| Telecommunication Services | | | 3.8 | % |
| Cash* | | | 3.5 | % |
| Net Assets | | | 100.0 | % |
| * | Cash, Cash Equivalents and Other Assets in Excess of Liabilities |
CONGRESS LARGE CAP GROWTH FUND
| HISTORICAL PERFORMANCE (Unaudited) |
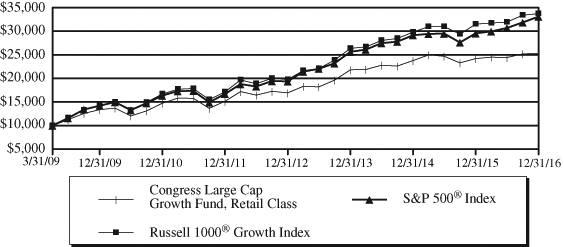
Retail Class
Value of $10,000 vs. Russell 1000® Growth Index and S&P 500® Index
Annualized Returns for the periods ended December 31, 2016
| | | | | Since | Ending |
| | One | Three | Five | Inception | Value |
| | Year | Year | Year | (3/31/2009) | (12/31/2016) |
| Congress Large Cap | | | | | |
| Growth Fund, Retail Class | 4.48% | 5.04% | 10.80% | 12.71% | $25,294 |
Russell 1000® Growth Index | 7.08% | 8.55% | 14.50% | 16.98% | 33,738 |
S&P 500® Index | 11.96% | 8.87% | 14.66% | 16.69% | 33,092 |
This chart illustrates the performance of a hypothetical $10,000 investment made on March 31, 2009, and is not intended to imply any future performance. The returns shown do not reflect the deduction of taxes that a shareholder would pay on Fund distributions or the redemption of Fund shares. The returns reflect fee waivers in effect. In the absence of such waivers, total return would be reduced. The chart assumes reinvestment of capital gains and dividends.
Performance data quoted represents past performance and does not guarantee future results. The investment return and principal value of an investment will fluctuate so that an investor’s shares, when redeemed, may be worth more or less than their original cost. Current performance of the Fund may be lower or higher than the performance quoted. Performance data current to the most recent month end may be obtained by calling 1-888-688-1299.
The Fund imposed a 1% redemption fee on shares held for less than 90 days, however, effective April 30, 2016, the 1% redemption fee was eliminated. Performance does not reflect the redemption fee. If reflected, the total return would be reduced.
CONGRESS LARGE CAP GROWTH FUND
| HISTORICAL PERFORMANCE (Unaudited) |
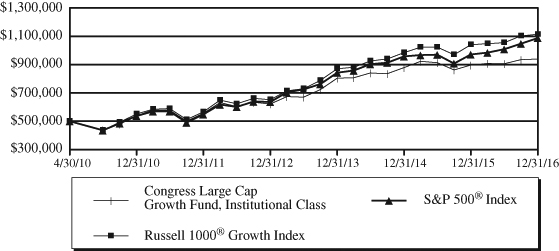
Institutional Class
Value of $500,000 vs. Russell 1000® Growth Index and S&P 500® Index
Annualized Returns for the periods ended December 31, 2016
| | | | | Since | Ending |
| | One | Three | Five | Inception | Value |
| | Year | Year | Year | (4/30/2010) | (12/31/2016) |
| Congress Large Cap Growth | | | | | |
| Fund, Institutional Class | 4.75% | 5.31% | 11.07% | 9.91% | $ 939,385 |
Russell 1000® Growth Index | 7.08% | 8.55% | 14.50% | 12.76% | 1,113,991 |
S&P 500® Index | 11.96% | 8.87% | 14.66% | 12.35% | 1,087,585 |
This chart illustrates the performance of a hypothetical $500,000 investment made on April 30, 2010, and is not intended to imply any future performance. The returns shown do not reflect the deduction of taxes that a shareholder would pay on Fund distributions or the redemption of Fund shares. The returns reflect fee waivers in effect. In the absence of such waivers, total return would be reduced. The chart assumes reinvestment of capital gains and dividends.
Performance data quoted represents past performance and does not guarantee future results. The investment return and principal value of an investment will fluctuate so that an investor’s shares, when redeemed, may be worth more or less than their original cost. Current performance of the Fund may be lower or higher than the performance quoted. Performance data current to the most recent month end may be obtained by calling 1-888-688-1299.
The Fund imposed a 1% redemption fee on shares held for less than 90 days, however, effective April 30, 2016, the 1% redemption fee was eliminated. Performance does not reflect the redemption fee. If reflected, the total return would be reduced.
CONGRESS MID CAP GROWTH FUND
| HISTORICAL PERFORMANCE (Unaudited) |
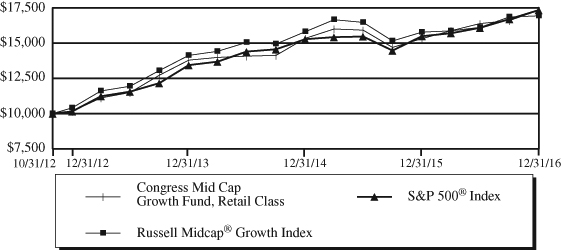
Retail Class
Value of $10,000 vs. Russell Midcap® Growth Index and S&P 500® Index
Annualized Returns for the periods ended December 31, 2016
| | One | Three | Since Inception | Ending Value |
| | Year | Year | (10/31/2012) | (12/31/2016) |
| Congress Mid Cap Growth Fund, | | | | |
| Retail Class | 13.11% | 7.90% | 14.09% | $17,321 |
Russell Midcap® Growth Index | 7.33% | 6.23% | 13.47% | 16,931 |
S&P 500® Index | 11.96% | 8.87% | 14.12% | 17,340 |
This chart illustrates the performance of a hypothetical $10,000 investment made on October 31, 2012, and is not intended to imply any future performance. The returns shown do not reflect the deduction of taxes that a shareholder would pay on Fund distributions or the redemption of Fund shares. The returns reflect fee waivers in effect. In the absence of such waivers, total return would be reduced. The chart assumes reinvestment of capital gains and dividends.
Performance data quoted represents past performance and does not guarantee future results. The investment return and principal value of an investment will fluctuate so that an investor’s shares, when redeemed, may be worth more or less than their original cost. Current performance of the Fund may be lower or higher than the performance quoted. Performance data current to the most recent month end may be obtained by calling 1-888-688-1299.
The Fund imposed a 1% redemption fee on shares held for less than 90 days, however, effective April 30, 2016, the 1% redemption fee was eliminated. Performance does not reflect the redemption fee. If reflected, the total return would be reduced.
CONGRESS MID CAP GROWTH FUND
| HISTORICAL PERFORMANCE (Unaudited) |
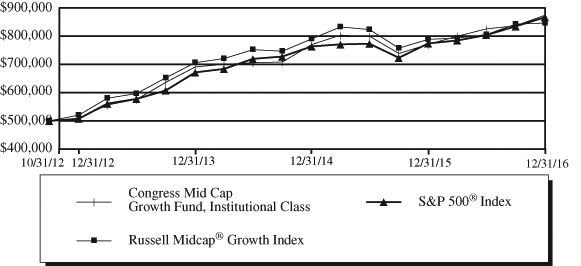
Institutional Class
Value of $500,000 vs. Russell Midcap® Growth Index and S&P 500® Index
Annualized Returns for the periods ended December 31, 2016
| | One | Three | Since Inception | Ending Value |
| | Year | Year | (10/31/2012) | (12/31/2016) |
| Congress Mid Cap Growth Fund, | | | | |
| Institutional Class | 13.38% | 8.16% | 14.35% | $874,309 |
Russell Midcap® Growth Index | 7.33% | 6.23% | 13.47% | 846,577 |
S&P 500® Index | 11.96% | 8.87% | 14.12% | 867,001 |
This chart illustrates the performance of a hypothetical $500,000 investment made on October 31, 2012, and is not intended to imply any future performance. The returns shown do not reflect the deduction of taxes that a shareholder would pay on Fund distributions or the redemption of Fund shares. The returns reflect fee waivers in effect. In the absence of such waivers, total return would be reduced. The chart assumes reinvestment of capital gains and dividends.
Performance data quoted represents past performance and does not guarantee future results. The investment return and principal value of an investment will fluctuate so that an investor’s shares, when redeemed, may be worth more or less than their original cost. Current performance of the Fund may be lower or higher than the performance quoted. Performance data current to the most recent month end may be obtained by calling 1-888-688-1299.
The Fund imposed a 1% redemption fee on shares held for less than 90 days, however, effective April 30, 2016, the 1% redemption fee was eliminated. Performance does not reflect the redemption fee. If reflected, the total return would be reduced.
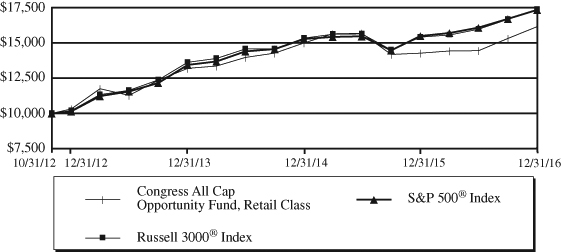
CONGRESS ALL CAP OPPORTUNITY FUND
| HISTORICAL PERFORMANCE (Unaudited) |
Retail Class
Value of $10,000 vs. Russell 3000® Index and S&P 500® Index
Annualized Returns for the periods ended December 31, 2016
| | One | Three | Since Inception | Ending Value |
| | Year | Year | (10/31/2012) | (12/31/2016) |
| Congress All Cap | | | | |
| Opportunity Fund, Retail Class | 13.18% | 6.97% | 12.19% | $16,151 |
Russell 3000® Index | 12.74% | 8.43% | 14.17% | 17,371 |
S&P 500® Index | 11.96% | 8.87% | 14.12% | 17,340 |
This chart illustrates the performance of a hypothetical $10,000 investment made on October 31, 2012, and is not intended to imply any future performance. The returns shown do not reflect the deduction of taxes that a shareholder would pay on Fund distributions or the redemption of Fund shares. The returns reflect fee waivers in effect. In the absence of such waivers, total return would be reduced. The chart assumes reinvestment of capital gains and dividends.
Performance data quoted represents past performance and does not guarantee future results. The investment return and principal value of an investment will fluctuate so that an investor’s shares, when redeemed, may be worth more or less than their original cost. Current performance of the Fund may be lower or higher than the performance quoted. Performance data current to the most recent month end may be obtained by calling 1-888-688-1299.
The Fund imposed a 1% redemption fee on shares held for less than 90 days, however, effective April 30, 2016, the 1% redemption fee was eliminated. Performance does not reflect the redemption fee. If reflected, the total return would be reduced.
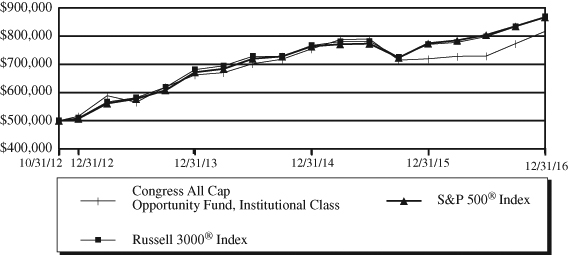
CONGRESS ALL CAP OPPORTUNITY FUND
| HISTORICAL PERFORMANCE (Unaudited) |
Institutional Class
Value of $500,000 vs. Russell 3000® Index and S&P 500® Index
Annualized Returns for the periods ended December 31, 2016
| | One | Three | Since Inception | Ending Value |
| | Year | Year | (10/31/2012) | (12/31/2016) |
| Congress All Cap Opportunity Fund, | | | | |
| Institutional Class | 13.51% | 7.23% | 12.50% | $816,726 |
Russell 3000® Index | 12.74% | 8.43% | 14.17% | 868,529 |
S&P 500® Index | 11.96% | 8.87% | 14.12% | 867,001 |
This chart illustrates the performance of a hypothetical $500,000 investment made on October 31, 2012, and is not intended to imply any future performance. The returns shown do not reflect the deduction of taxes that a shareholder would pay on Fund distributions or the redemption of Fund shares. The returns reflect fee waivers in effect. In the absence of such waivers, total return would be reduced. The chart assumes reinvestment of capital gains and dividends.
Performance data quoted represents past performance and does not guarantee future results. The investment return and principal value of an investment will fluctuate so that an investor’s shares, when redeemed, may be worth more or less than their original cost. Current performance of the Fund may be lower or higher than the performance quoted. Performance data current to the most recent month end may be obtained by calling 1-888-688-1299.
The Fund imposed a 1% redemption fee on shares held for less than 90 days, however, effective April 30, 2016, the 1% redemption fee was eliminated. Performance does not reflect the redemption fee. If reflected, the total return would be reduced.
CONGRESS LARGE CAP GROWTH FUND
| SCHEDULE OF INVESTMENTS at December 31, 2016 |
| Shares | | | | Value | |
| | |
| COMMON STOCKS: 97.7% | |
| | |
| Banks: 1.2% | |
| | 10,500 | | SunTrust Banks, Inc. | | $ | 575,925 | |
| | | | | | | | |
| | |
| Capital Goods: 8.6% | |
| | 4,600 | | Acuity Brands, Inc. | | | 1,061,956 | |
| | 12,200 | | Illinois Tool Works, Inc. | | | 1,494,012 | |
| | 10,500 | | Rockwell | | | | |
| | | | Automation, Inc. | | | 1,411,200 | |
| | | | | | | 3,967,168 | |
| | |
| Consumer Durables | |
| & Apparel: 1.3% | |
| | 9,769 | | Under Armour, | | | | |
| | | | Inc. - Class A* | | | 245,886 | |
| | 13,000 | | Under Armour, | | | | |
| | | | Inc. - Class C* | | | 377,650 | |
| | | | | | | 623,536 | |
| | |
| Consumer Services: 2.3% | |
| | 8,700 | | McDonald’s Corp. | | | 1,058,964 | |
| | | | | | | | |
| | |
| Diversified Financials: 4.5% | |
| | 7,400 | | CME Group, Inc. | | | 853,590 | |
| | 22,000 | | Intercontinental | | | | |
| | | | Exchange, Inc. | | | 1,241,240 | |
| | | | | | | 2,094,830 | |
| | |
| Energy: 4.0% | |
| | 5,000 | | Chevron Corp. | | | 588,500 | |
| | 15,200 | | Schlumberger Ltd. | | | 1,276,040 | |
| | | | | | | 1,864,540 | |
| Food & Staples Retailing: 2.4% | |
| | 7,000 | | Costco Wholesale Corp. | | | 1,120,770 | |
| | | | | |
| Food, Beverage & Tobacco: 2.5% | | | | |
| | 11,000 | | PepsiCo, Inc. | | | 1,150,930 | |
| | |
| Health Care Equipment | |
| & Services: 5.0% | |
| | 8,500 | | Stryker Corp. | | | 1,018,385 | |
| | 8,000 | | UnitedHealth | | | | |
| | | | Group, Inc. | | | 1,280,320 | |
| | | | | | | 2,298,705 | |
| Household & Personal | |
| Products: 6.6% | |
| | 9,000 | | The Clorox Co. | | | 1,080,180 | |
| | 15,300 | | Colgate-Palmolive Co. | | | 1,001,232 | |
| | 12,800 | | Estée Lauder | | | | |
| | | | Companies, Inc. - | | | | |
| | | | Class A | | | 979,072 | |
| | | | | | | 3,060,484 | |
| | |
| Materials: 4.7% | |
| | 9,300 | | Ecolab, Inc. | | | 1,090,146 | |
| | 11,300 | | PPG Industries, Inc. | | | 1,070,788 | |
| | | | | | | 2,160,934 | |
| | |
| Media: 2.6% | |
| | 11,750 | | The Walt Disney Co. | | | 1,224,585 | |
| | | | | | | | |
| | |
| Pharmaceuticals, Biotechnology | |
| & Life Sciences: 9.3% | |
| | 14,000 | | Bristol-Myers Squibb Co. | | | 818,160 | |
| | 10,000 | | Celgene Corp.* | | | 1,157,500 | |
| | 19,900 | | Merck & Co., Inc. | | | 1,171,513 | |
| | 8,200 | | Thermo Fisher | | | | |
| | | | Scientific, Inc. | | | 1,157,020 | |
| | | | | | | 4,304,193 | |
| | |
| Real Estate: 2.3% | |
| | 12,400 | | Crown Castle | | | | |
| | | | International Corp. - | | | | |
| | | | REIT | | | 1,075,948 | |
| | |
| Retailing: 7.8% | |
| | 9,700 | | The Home Depot, Inc. | | | 1,300,576 | |
| | 4,200 | | O’Reilly | | | | |
| | Automotive, Inc.* | | | 1,169,322 | |
| | 15,100 | | The TJX | | | | |
| | | | Companies, Inc. | | | 1,134,463 | |
| | | | | | | 3,604,361 | |
| Semiconductors & Semiconductor | |
| Equipment: 2.9% | |
| | 18,600 | | Analog Devices, Inc. | | | 1,350,732 | |
| | | | | | | | |
| | |
| Software & Services: 23.9% | |
| | 10,800 | | Accenture PLC | | | 1,265,004 | |
| | 13,200 | | Adobe Systems, Inc.* | | | 1,358,940 | |
| | 14,200 | | Akamai | | | | |
| | | | Technologies, Inc.* | | | 946,856 | |
The accompanying notes are an integral part of these financial statements.
CONGRESS LARGE CAP GROWTH FUND
| SCHEDULE OF INVESTMENTS at December 31, 2016 (Continued) |
| Shares | | | | Value | |
| | |
| Software & Services: 23.9% (Continued) | |
| | 975 | | Alphabet, Inc. - | | | |
| | | | Class A* | | $ | 772,639 | |
| | 777 | | Alphabet, Inc. - | | | | |
| | | | Class C* | | | 599,704 | |
| | 12,700 | | Automatic Data | | | | |
| | | | Processing, Inc. | | | 1,305,306 | |
| | 15,300 | | Electronic Arts, Inc.* | | | 1,205,028 | |
| | 10,300 | | Facebook, Inc.* | | | 1,185,015 | |
| | 28,500 | | PayPal Holdings, Inc.* | | | 1,124,895 | |
| | 17,000 | | Visa, Inc. | | | 1,326,340 | |
| | | | | | | 11,089,727 | |
| | |
| Technology Hardware | |
| & Equipment: 3.3% | |
| | 13,000 | | Apple, Inc. | | | 1,505,660 | |
| | |
| Transportation: 2.5% | |
| | 17,500 | | Canadian National | | | | |
| | | | Railway Co. | | | 1,179,500 | |
| | |
| TOTAL COMMON STOCKS | |
| (Cost $36,170,115) | | | 45,311,492 | |
| | |
| SHORT-TERM INVESTMENTS: 1.9% | |
| | | | | |
| Money Market Funds: 1.9% | | | | |
| | 879,079 | | Invesco Short-Term | | | | |
| | | | Treasury Portfolio - | | | | |
| | | | Institutional Class, | | | | |
| | | | 0.370%(1) | | | 879,079 | |
| | |
| TOTAL SHORT-TERM | |
| INVESTMENTS | | | | |
| (Cost $879,079) | | | 879,079 | |
| | |
| TOTAL INVESTMENTS | |
| IN SECURITIES: 99.6% | |
| (Cost $37,049,194) | | | 46,190,571 | |
| Other Assets in Excess | | | | |
| of Liabilities: 0.4% | | | 170,151 | |
| TOTAL NET | | | | |
| ASSETS: 100.0% | | $ | 46,360,722 | |
REIT – Real Estate Investment Trust
| * | | Non-income producing security |
(1) | | Seven-day yield as of December 31, 2016 |
The Global Industry Classification Standard (“GICS®”) was developed by and/or is the exclusive property of MSCI, Inc. and Standard and Poor’s Financial Services, LLC (“S&P”). GICS® is a service mark of MSCI, Inc and S&P and has been licensed for use by the Fund’s Administrator, U.S. Bancorp Fund Services, LLC.
The accompanying notes are an integral part of these financial statements.
CONGRESS MID CAP GROWTH FUND
| SCHEDULE OF INVESTMENTS at December 31, 2016 |
| Shares | | | | Value | |
| | |
| COMMON STOCKS: 95.1% | |
| | |
| Automobiles & Components: 2.5% | |
| | 205,000 | | Dorman | | | |
| | | | Products, Inc.* | | $ | 14,977,300 | |
| | |
| Banks: 2.7% | |
| | 110,000 | | Signature Bank* | | | 16,522,000 | |
| | |
| Capital Goods: 13.9% | |
| | 55,000 | | Acuity Brands, Inc. | | | 12,697,300 | |
| | 265,000 | | B/E Aerospace, Inc. | | | 15,950,350 | |
| | 95,000 | | Lennox | | | | |
| | | | International Inc. | | | 14,551,150 | |
| | 450,000 | | Masco Corp. | | | 14,229,000 | |
| | 95,000 | | The Middleby Corp.* | | | 12,236,950 | |
| | 85,000 | | Snap-on, Inc. | | | 14,557,950 | |
| | | | | | | 84,222,700 | |
| | |
| Commercial & | |
| Professional Services: 7.7% | |
| | 130,000 | | Cintas Corp. | | | 15,022,800 | |
| | 120,000 | | Equifax Inc. | | | 14,187,600 | |
| | 350,000 | | Robert Half | | | | |
| | | | International Inc. | | | 17,073,000 | |
| | | | | | | 46,283,400 | |
| | |
| Consumer Durables | |
| & Apparel: 6.6% | |
| | 160,000 | | Carter’s, Inc. | | | 13,822,400 | |
| | 450,000 | | G-III Apparel | | | | |
| | | | Group, Ltd.* | | | 13,302,000 | |
| | 165,000 | | Hasbro, Inc. | | | 12,835,350 | |
| | | | | | | 39,959,750 | |
| | |
| Consumer Services: 2.2% | |
| | 270,000 | | Texas Roadhouse, Inc. | | | 13,024,800 | |
| | |
| Diversified Financials: 5.0% | |
| | 90,000 | | FactSet Research | | | | |
| | | | Systems Inc. | | | 14,708,700 | |
| | 225,000 | | Raymond James | | | | |
| | | | Financial, Inc. | | | 15,585,750 | |
| | | | | | | 30,294,450 | |
| | |
| Energy: 2.4% | |
| | 120,000 | | Core | | | | |
| | | | Laboratories N.V. | | | 14,404,800 | |
| | |
| Food, Beverage & Tobacco: 1.5% | |
| | 225,000 | | The Hain Celestial | | | | |
| | | | Group, Inc.* | | | 8,781,750 | |
| | |
| Health Care Equipment | |
| & Services: 9.4% | |
| | 70,000 | | The Cooper | | | | |
| | | | Companies, Inc. | | | 12,245,100 | |
| | 95,000 | | Henry Schein Inc.* | | | 14,412,450 | |
| | 240,000 | | ResMed Inc. | | | 14,892,000 | |
| | 225,000 | | VCA Inc.* | | | 15,446,250 | |
| | | | | | | 56,995,800 | |
| | |
| Household & Personal | |
| Products: 2.4% | |
| | 330,000 | | Church & | | | | |
| | | | Dwight Co., Inc. | | | 14,582,700 | |
| | |
| Materials: 2.2% | |
| | 115,000 | | International Flavors | | | | |
| | | | & Fragrances Inc. | | | 13,550,450 | |
| | |
| Media: 2.5% | |
| | 210,000 | | Scripps Networks | | | | |
| | | | Interactive, Inc. - | | | | |
| | | | Class A | | | 14,987,700 | |
| | |
| Pharmaceuticals, Biotechnology | |
| & Life Sciences: 6.9% | |
| | 310,000 | | Cambrex Corp.* | | | 16,724,500 | |
| | 30,000 | | Mettler-Toledo | | | | |
| | | | International Inc.* | | | 12,556,800 | |
| | 190,000 | | PAREXEL | | | | |
| | | | International Corp.* | | | 12,486,800 | |
| | | | | | | 41,768,100 | |
| | |
| Real Estate: 2.6% | |
| | 185,000 | | Camden Property | | | | |
| | | | Trust - REIT | | | 15,552,950 | |
| | |
| Retailing: 2.3% | |
| | 200,000 | | Foot Locker, Inc. | | | 14,178,000 | |
| | |
| Semiconductors & Semiconductor | |
| Equipment: 2.4% | |
| | 175,000 | | Monolithic Power | | | | |
| | | | Systems, Inc. | | | 14,337,750 | |
The accompanying notes are an integral part of these financial statements.
CONGRESS MID CAP GROWTH FUND
| SCHEDULE OF INVESTMENTS at December 31, 2016 (Continued) |
| Shares | | | | Value | |
| | |
| Software & Services: 9.4% | |
| | 600,000 | | Genpact Ltd* | | $ | 14,604,000 | |
| | 165,000 | | Jack Henry & | | | | |
| | | | Associates, Inc. | | | 14,648,700 | |
| | 265,000 | | Manhattan | | | | |
| | | | Associates, Inc.* | | | 14,052,950 | |
| | 225,000 | | Synopsys, Inc.* | | | 13,243,500 | |
| | | | | | | 56,549,150 | |
| | |
| Technology Hardware | |
| & Equipment: 7.9% | |
| | 250,000 | | Cognex Corp. | | | 15,905,000 | |
| | 110,000 | | F5 Networks, Inc.* | | | 15,919,200 | |
| | 160,000 | | IPG Photonics Corp.* | | | 15,793,600 | |
| | | | | | | 47,617,800 | |
| | |
| Transportation: 2.6% | |
| | 165,000 | | J.B. Hunt Transport | | | | |
| | | | Services, Inc. | | | 16,016,550 | |
| | |
| TOTAL COMMON STOCKS | |
| (Cost $502,049,577) | | | 574,607,900 | |
| | |
| SHORT-TERM INVESTMENTS: 4.0% | |
| | |
| Money Market Funds: 4.0% | |
| | 24,328,121 | | Invesco Short-Term | | | | |
| | | | Treasury Portfolio - | | | | |
| | | | Institutional Class, | | | | |
| | | | 0.370%(1) | | | 24,328,121 | |
| | |
| TOTAL SHORT-TERM | |
| INVESTMENTS | |
| (Cost $24,328,121) | | | 24,328,121 | |
| | |
| TOTAL INVESTMENTS | |
| IN SECURITIES: 99.1% | |
| (Cost $526,377,698) | | | 598,936,021 | |
| Other Assets in Excess | | | | |
| of Liabilities: 0.9% | | | 5,403,078 | |
| TOTAL NET | | | | |
| ASSETS: 100.0% | | $ | 604,339,099 | |
REIT – Real Estate Investment Trust
| * | | Non-income producing security |
(1) | | Seven-day yield as of December 31, 2016 |
The Global Industry Classification Standard (“GICS®”) was developed by and/or is the exclusive property of MSCI, Inc. and Standard and Poor’s Financial Services, LLC (“S&P”). GICS® is a service mark of MSCI, Inc and S&P and has been licensed for use by the Fund’s Administrator, U.S. Bancorp Fund Services, LLC.
The accompanying notes are an integral part of these financial statements.
CONGRESS ALL CAP OPPORTUNITY FUND
| SCHEDULE OF INVESTMENTS at December 31, 2016 |
| Shares | | | | Value | |
| | |
| COMMON STOCKS: 96.5% | |
| | |
| Automobiles & Components: 4.1% | |
| | 32,800 | | Volkswagen AG - ADR | | $ | 940,868 | |
| | | | | | | | |
| | |
| Banks: 4.5% | |
| | 54,500 | | People’s United | | | | |
| | | | Financial, Inc. | | | 1,055,120 | |
| | | | | |
| Capital Goods: 11.9% | | | | |
| | 8,400 | | Carlisle Companies, Inc. | | | 926,436 | |
| | 28,500 | | General Electric Co. | | | 900,600 | |
| | 8,800 | | United Rentals, Inc.* | | | 929,104 | |
| | | | | | | 2,756,140 | |
| | |
| Consumer Services: 9.4% | |
| | 14,800 | | Darden Restaurants, Inc. | | | 1,076,256 | |
| | 18,500 | | Six Flags | | | | |
| | | | Entertainment Corp. | | | 1,109,260 | |
| | | | | | | 2,185,516 | |
| | |
| Energy: 3.9% | |
| | 13,950 | | Baker Hughes, Inc. | | | 906,331 | |
| | | | | | | | |
| | |
| Health Care Equipment | |
| & Services: 12.2% | |
| | 8,000 | | ABIOMED, Inc.* | | | 901,440 | |
| | 20,900 | | Surgical Care | | | | |
| | | | Affiliates, Inc.* | | | 967,043 | |
| | 6,000 | | Teleflex, Inc. | | | 966,900 | |
| | | | | | | 2,835,383 | |
| | |
| Media: 3.7% | |
| | 41,800 | | Regal | | | | |
| | | | Entertainment Group | | | 861,080 | |
| | |
| Pharmaceuticals, Biotechnology | |
| & Life Sciences: 4.1% | |
| | 18,000 | | Zoetis, Inc. | | | 963,540 | |
| | | | | | | | |
| | |
| Real Estate: 7.9% | |
| | 8,500 | | American Tower | | | | |
| | | | Corp. - REIT | | | 898,280 | |
| | 2,650 | | Equinix, Inc. - REIT | | | 947,137 | |
| | | | | | | 1,845,417 | |
| | |
| Retailing: 3.5% | |
| | 97,800 | | J.C. Penney Co., Inc.* | | | 812,718 | |
| | | | | | | | |
| | |
| Semiconductors & Semiconductor | |
| Equipment: 9.1% | |
| | 5,200 | | Broadcom Ltd. | | | 919,204 | |
| | 11,100 | | NVIDIA Corp. | | | 1,184,814 | |
| | | | | | | 2,104,018 | |
| | |
| Software & Services: 11.1% | |
| | 24,500 | | Booz Allen Hamilton | | | | |
| | | | Holding Corp. | | | 883,715 | |
| | 17,300 | | CyberArk Software Ltd.* | | | 787,150 | |
| | 26,000 | | InterXion Holding N.V.* | | | 911,820 | |
| | | | | | | 2,582,685 | |
| | |
| Technology Hardware | |
| & Equipment: 3.6% | |
| | 6,600 | | Palo Alto | | | | |
| | | | Networks, Inc.* | | | 825,330 | |
| | |
| Telecommunication | |
| Services: 3.8% | |
| | 26,700 | | Zayo Group | | | | |
| | | | Holdings, Inc.* | | | 877,362 | |
| | | | | | | | |
| | |
| Transportation: 3.7% | |
| | 6,100 | | Canadian Pacific | | | | |
| | | | Railway Ltd. | | | 870,897 | |
| | |
| TOTAL COMMON STOCKS | |
| (Cost $18,694,444) | | | 22,422,405 | |
The accompanying notes are an integral part of these financial statements.
CONGRESS ALL CAP OPPORTUNITY FUND
| SCHEDULE OF INVESTMENTS at December 31, 2016 (Continued) |
| Shares | | | | Value | |
| | |
| Money Market Funds: 3.5% | |
| | 818,014 | | Invesco Short-Term | | | |
| | | | Treasury Portfolio - | | | |
| | | | Institutional Class, | | | |
| | | | 0.370%(1) | | $ | 818,014 | |
| | |
| TOTAL SHORT-TERM | |
| INVESTMENTS | |
| (Cost $818,014) | | | 818,014 | |
| | |
| TOTAL INVESTMENTS | |
| IN SECURITIES: 100.0% | |
| (Cost $19,512,458) | | | 23,240,419 | |
| Liabilities in Excess | | | | |
of Other Assets: (0.0)%(2) | | | (11,463 | ) |
| TOTAL NET | | | | |
| ASSETS: 100.0% | | $ | 23,228,956 | |
ADR – American Depositary Receipt
REIT – Real Estate Investment Trust
| * | | Non-income producing security. |
(1) | | Seven-day yield as of December 31, 2016 |
(2) | | Does not round to (0.1)% |
The Global Industry Classification Standard (“GICS®”) was developed by and/or is the exclusive property of MSCI, Inc. and Standard and Poor’s Financial Services, LLC (“S&P”). GICS® is a service mark of MSCI, Inc and S&P and has been licensed for use by the Fund’s Administrator, U.S. Bancorp Fund Services, LLC.
The accompanying notes are an integral part of these financial statements.
CONGRESS FUNDS
| STATEMENTS OF ASSETS AND LIABILITIES at December 31, 2016 |
| | | Large | | | Mid Cap | | | All Cap | |
| | | Cap Growth | | | Growth | | | Opportunity | |
| | | Fund | | | Fund | | | Fund | |
| | | | | | | | | | |
| ASSETS: | |
| Investments in securities, at value | | | | | | | | | |
| (Cost $37,049,194, $526,377,698, and | | | | | | | | | |
| $19,512,458, respectively) | | $ | 46,190,571 | | | $ | 598,936,021 | | | $ | 23,240,419 | |
| Cash | | | 4,147 | | | | — | | | | 5,304 | |
| Receivables: | | | | | | | | | | | | |
| Fund shares sold | | | 172,711 | | | | 6,026,406 | | | | 6,877 | |
| Dividends and interest | | | 82,119 | | | | 343,487 | | | | 14,037 | |
| Due from advisor, net | | | — | | | | — | | | | 4,110 | |
| Prepaid expenses | | | 6,624 | | | | 29,843 | | | | 17,490 | |
| Total assets | | | 46,456,172 | | | | 605,335,757 | | | | 23,288,237 | |
| | | | | | | | | | | | | |
| LIABILITIES: | |
| Payables: | | | | | | | | | | | | |
| Fund shares redeemed | | | 20,132 | | | | 486,063 | | | | 4,398 | |
| Audit fees | | | 23,602 | | | | 23,600 | | | | 23,602 | |
| Transfer agent fees | | | 10,702 | | | | 41,432 | | | | 9,551 | |
| Distribution fees | | | 10,382 | | | | 33,483 | | | | 3,751 | |
| Administration fees | | | 8,157 | | | | 79,324 | | | | 4,307 | |
| Investment advisory fees, net | | | 7,493 | | | | 239,726 | | | | — | |
| Fund accounting fees | | | 6,186 | | | | 25,498 | | | | 6,111 | |
| Trustee fees | | | 2,723 | | | | 5,452 | | | | 2,605 | |
| Chief Compliance Officer fees | | | 1,499 | | | | 1,499 | | | | 1,499 | |
| Custody fees | | | 1,027 | | | | 9,605 | | | | 1,043 | |
| Other accrued expenses | | | 3,547 | | | | 50,976 | | | | 2,414 | |
| Total liabilities | | | 95,450 | | | | 996,658 | | | | 59,281 | |
| NET ASSETS | | $ | 46,360,722 | | | $ | 604,339,099 | | | $ | 23,228,956 | |
The accompanying notes are an integral part of these financial statements.
CONGRESS FUNDS
| STATEMENTS OF ASSETS AND LIABILITIES at December 31, 2016 (Continued) |
| | | Large | | | Mid Cap | | | All Cap | |
| | | Cap Growth | | | Growth | | | Opportunity | |
| | | Fund | | | Fund | | | Fund | |
| | | | | | | | | | |
| COMPONENTS OF NET ASSETS: | |
| Paid-in capital | | $ | 36,793,961 | | | $ | 531,735,660 | | | $ | 19,703,166 | |
| Undistributed net investment income | | | — | | | | — | | | | 37,983 | |
| Undistributed (accumulated) net realized | | | | | | | | | | | | |
| gain (loss) on investments | | | 425,384 | | | | 45,116 | | | | (240,175 | ) |
| Net unrealized appreciation on investments | | | 9,141,377 | | | | 72,558,323 | | | | 3,727,961 | |
| Net unrealized appreciation on translation of | | | | | | | | | | | | |
| other assets and liabilities in foreign currency | | | — | | | | — | | | | 21 | |
| Net assets | | $ | 46,360,722 | | | $ | 604,339,099 | | | $ | 23,228,956 | |
| | | | | | | | | | | | | |
| Retail Class: | | | | | | | | | | | | |
| Net assets | | $ | 10,113,312 | | | $ | 47,958,767 | | | $ | 6,182,040 | |
| Shares issued and outstanding (unlimited number | | | | | | | | | | | | |
| of shares authorized without par value) | | | 458,306 | | | | 2,965,746 | | | | 395,829 | |
| Net asset value, and redemption price per share | | $ | 22.07 | | | $ | 16.17 | | | $ | 15.62 | |
| | | | | | | | | | | | | |
| Institutional Class: | | | | | | | | | | | | |
| Net assets | | $ | 36,247,410 | | | $ | 556,380,332 | | | $ | 17,046,916 | |
| Shares issued and outstanding (unlimited number | | | | | | | | | | | | |
| of shares authorized without par value) | | | 1,643,473 | | | | 34,212,739 | | | | 1,086,759 | |
| Net asset value, and redemption price per share | | $ | 22.06 | | | $ | 16.26 | | | $ | 15.69 | |
The accompanying notes are an integral part of these financial statements.
CONGRESS FUNDS
| STATEMENTS OF OPERATIONS For the Year Ended December 31, 2016 |
| | | Large | | | Mid Cap | | | All Cap | |
| | | Cap Growth | | | Growth | | | Opportunity | |
| | | Fund | | | Fund | | | Fund | |
| | | | | | | | | | |
| INVESTMENT INCOME | |
| Dividends (net of foreign withholding tax | | | | | | | | | |
| of $3,017, $28,050, and $1,630, respectively) | | $ | 708,930 | | | $ | 4,293,442 | | | $ | 231,838 | |
| Interest | | | 3,452 | | | | 58,459 | | | | 2,718 | |
| Total investment income | | | 712,382 | | | | 4,351,901 | | | | 234,556 | |
| | | | | | | | | | | | | |
| EXPENSES | |
| Investment advisory fees | | | 226,999 | | | | 2,623,849 | | | | 135,198 | |
| Transfer agent fees | | | 54,853 | | | | 195,345 | | | | 54,048 | |
| Administration fees | | | 53,736 | | | | 418,410 | | | | 32,089 | |
| Registration fees | | | 43,104 | | | | 95,019 | | | | 42,296 | |
| Fund accounting fees | | | 39,850 | | | | 141,014 | | | | 39,204 | |
| Distribution fees - Retail Class | | | 30,702 | | | | 81,902 | | | | 12,539 | |
| Audit fees | | | 23,592 | | | | 23,590 | | | | 23,592 | |
| Trustee fees | | | 11,896 | | | | 20,861 | | | | 11,371 | |
| Chief Compliance Officer fees | | | 9,000 | | | | 9,000 | | | | 9,000 | |
| Miscellaneous expenses | | | 8,301 | | | | 15,627 | | | | 7,876 | |
| Legal fees | | | 5,983 | | | | 6,911 | | | | 7,509 | |
| Custody fees | | | 5,630 | | | | 47,512 | | | | 5,868 | |
| Reports to shareholders | | | 2,563 | | | | 46,203 | | | | 2,390 | |
| Insurance expense | | | 2,414 | | | | 3,189 | | | | 2,380 | |
| Interest expense | | | — | | | | — | | | | 67 | |
| Total expenses | | | 518,623 | | | | 3,728,432 | | | | 385,427 | |
| Less: fees waived and expenses reimbursed | | | (147,422 | ) | | | (366,720 | ) | | | (203,891 | ) |
| Net expenses | | | 371,201 | | | | 3,361,712 | | | | 181,536 | |
| Net investment income | | | 341,181 | | | | 990,189 | | | | 53,020 | |
| | | | | | | | | | | | | |
| REALIZED & UNREALIZED GAIN (LOSS) ON INVESTMENTS | |
| Net realized gain (loss) on investments | | | 671,107 | | | | 3,610,690 | | | | (116,540 | ) |
| Net increase from payments by affiliates | | | | | | | | | | | | |
| on the disposal of investments | | | | | | | | | | | | |
| in violation of restrictions | | | — | | | | — | | | | 163,910 | |
| Change in net unrealized | | | | | | | | | | | | |
| appreciation/depreciation on investments | | | 1,142,967 | | | | 52,123,786 | | | | 2,630,201 | |
| Change in net unrealized | | | | | | | | | | | | |
| appreciation/depreciation on translation of | | | | | | | | | | | | |
| other assets and liabilities in foreign currency | | | — | | | | — | | | | 13 | |
| Net realized and unrealized gain on investments | | | 1,814,074 | | | | 55,734,476 | | | | 2,677,584 | |
| Net increase in net assets | | | | | | | | | | | | |
| resulting from operations | | $ | 2,155,255 | | | $ | 56,724,665 | | | $ | 2,730,604 | |
The accompanying notes are an integral part of these financial statements.
(This Page Intentionally Left Blank.)
CONGRESS LARGE CAP GROWTH FUND
| STATEMENTS OF CHANGES IN NET ASSETS |
| | | Year Ended | | | Year Ended | |
| | | December 31, | | | December 31, | |
| | | 2016 | | | 2015 | |
| | | | | | | |
| INCREASE (DECREASE) IN NET ASSETS FROM: | |
| OPERATIONS | |
| Net investment income | | $ | 341,181 | | | $ | 250,849 | |
| Net realized gain on investments | | | 671,107 | | | | 1,062,188 | |
| Change in net unrealized | | | | | | | | |
| appreciation/depreciation on investments | | | 1,142,967 | | | | (736,945 | ) |
| Net increase in net assets | | | | | | | | |
| resulting from operations | | | 2,155,255 | | | | 576,092 | |
| | | | | | | | | |
| DISTRIBUTIONS TO SHAREHOLDERS | |
| From net investment income: | | | | | | | | |
| Retail Class | | | (52,596 | ) | | | (58,646 | ) |
| Institutional Class | | | (296,997 | ) | | | (191,924 | ) |
| From net realized gain on investments: | | | | | | | | |
| Retail Class | | | (37,906 | ) | | | (402,134 | ) |
| Institutional Class | | | (134,712 | ) | | | (783,249 | ) |
| Total distributions to shareholders | | | (522,211 | ) | | | (1,435,953 | ) |
| | | | | | | | | |
| CAPITAL SHARE TRANSACTIONS | |
| Decrease in net assets derived from | | | | | | | | |
net change in outstanding shares - Retail Class(1) | | | (5,454,208 | ) | | | (2,010,375 | ) |
| Increase in net assets derived from | | | | | | | | |
net change in outstanding shares - Institutional Class(1) | | | 5,089,319 | | | | 9,103,193 | |
| Total increase (decrease) in net assets | | | | | | | | |
| from capital share transactions | | | (364,889 | ) | | | 7,092,818 | |
| Total increase in net assets | | | 1,268,155 | | | | 6,232,957 | |
| | | | | | | | | |
| NET ASSETS | |
| Beginning of year | | | 45,092,567 | | | | 38,859,610 | |
| End of year | | $ | 46,360,722 | | | $ | 45,092,567 | |
| Undistributed net investment income | | $ | — | | | $ | 900 | |
The accompanying notes are an integral part of these financial statements.
CONGRESS LARGE CAP GROWTH FUND
| STATEMENTS OF CHANGES IN NET ASSETS (Continued) |
(1) | Summary of capital share transactions is as follows: |
| | | | Year Ended | | | Year Ended | |
| | | | December 31, 2016 | | | December 31, 2015 | |
| | | | Shares | | | Value | | | Shares | | | Value | |
| | Retail Class | | | | | | | | | | | | |
| | Shares sold | | | 46,657 | | | $ | 967,020 | | | | 41,249 | | | $ | 906,710 | |
| | Shares issued in | | | | | | | | | | | | | | | | |
| | reinvestment of distributions | | | 1,636 | | | | 36,548 | | | | 12,376 | | | | 267,806 | |
| | Shares redeemed(2) | | | (299,887 | ) | | | (6,457,776 | ) | | | (143,520 | ) | | | (3,184,891 | ) |
| | Net decrease | | | (251,594 | ) | | $ | (5,454,208 | ) | | | (89,895 | ) | | $ | (2,010,375 | ) |
(2) | Net of redemption fees of $271 and $88, respectively. Effective April 30, 2016, the 1% redemption fee was eliminated. |
| | | | Year Ended | | | Year Ended | |
| | | | December 31, 2016 | | | December 31, 2015 | |
| | | | Shares | | | Value | | | Shares | | | Value | |
| | Institutional Class | | | | | | | | | | | | |
| | Shares sold | | | 629,829 | | | $ | 13,446,703 | | | | 548,816 | | | $ | 12,319,785 | |
| | Shares issued in | | | | | | | | | | | | | | | | |
| | reinvestment of distributions | | | 14,611 | | | | 326,265 | | | | 32,745 | | | | 708,282 | |
| | Shares redeemed(3) | | | (407,511 | ) | | | (8,683,649 | ) | | | (176,763 | ) | | | (3,924,874 | ) |
| | Net increase | | | 236,929 | | | $ | 5,089,319 | | | | 404,798 | | | $ | 9,103,193 | |
(3) | Net of redemption fees of $— and $200, respectively. Effective April 30, 2016, the 1% redemption fee was eliminated. |
The accompanying notes are an integral part of these financial statements.
CONGRESS MID CAP GROWTH FUND
| STATEMENTS OF CHANGES IN NET ASSETS |
| | | Year Ended | | | Year Ended | |
| | | December 31, | | | December 31, | |
| | | 2016 | | | 2015 | |
| | | | | | | |
| INCREASE (DECREASE) IN NET ASSETS FROM: | |
| OPERATIONS | |
| Net investment income | | $ | 990,189 | | | $ | 278,228 | |
| Net realized gain on investments | | | 3,610,690 | | | | 3,793,767 | |
| Change in net unrealized | | | | | | | | |
| appreciation/depreciation on investments | | | 52,123,786 | | | | (5,629,346 | ) |
| Net increase (decrease) in net assets | | | | | | | | |
| resulting from operations | | | 56,724,665 | | | | (1,557,351 | ) |
| | | | | | | | | |
| DISTRIBUTIONS TO SHAREHOLDERS | |
| From net investment income: | | | | | | | | |
| Retail Class | | | (5,607 | ) | | | — | |
| Institutional Class | | | (997,481 | ) | | | (307,756 | ) |
| From net realized gain on investments: | | | | | | | | |
| Retail Class | | | (445,693 | ) | | | (118,699 | ) |
| Institutional Class | | | (5,030,213 | ) | | | (1,823,973 | ) |
| Total distributions to shareholders | | | (6,478,994 | ) | | | (2,250,428 | ) |
| | | | | | | | | |
| CAPITAL SHARE TRANSACTIONS | |
| Increase in net assets derived from | | | | | | | | |
net change in outstanding shares - Retail Class(1) | | | 25,972,338 | | | | 5,535,356 | |
| Increase in net assets derived from | | | | | | | | |
net change in outstanding shares - Institutional Class(1) | | | 237,279,898 | | | | 85,607,664 | |
| Total increase in net assets | | | | | | | | |
| from capital share transactions | | | 263,252,236 | | | | 91,143,020 | |
| Total increase in net assets | | | 313,497,907 | | | | 87,335,241 | |
| | | | | | | | | |
| NET ASSETS | |
| Beginning of year | | | 290,841,192 | | | | 203,505,951 | |
| End of year | | $ | 604,339,099 | | | $ | 290,841,192 | |
The accompanying notes are an integral part of these financial statements.
CONGRESS MID CAP GROWTH FUND
| STATEMENTS OF CHANGES IN NET ASSETS (Continued) |
(1) | Summary of capital share transactions is as follows: |
| | | | Year Ended | | | Year Ended | |
| | | | December 31, 2016 | | | December 31, 2015 | |
| | | | Shares | | | Value | | | Shares | | | Value | |
| | Retail Class | | | | | | | | | | | | |
| | Shares sold | | | 2,164,791 | | | $ | 33,224,753 | | | | 1,034,154 | | | $ | 15,158,492 | |
| | Shares issued in | | | | | | | | | | | | | | | | |
| | reinvestment of distributions | | | 22,775 | | | | 371,921 | | | | 6,687 | | | | 97,301 | |
| | Shares redeemed(2) | | | (490,691 | ) | | | (7,624,336 | ) | | | (663,667 | ) | | | (9,720,437 | ) |
| | Net increase | | | 1,696,875 | | | $ | 25,972,338 | | | | 377,174 | | | $ | 5,535,356 | |
(2) | Net of redemption fees of $946 and $2,097, respectively. Effective April 30, 2016, the 1% redemption fee was eliminated. |
| | | | Year Ended | | | Year Ended | |
| | | | December 31, 2016 | | | December 31, 2015 | |
| | | | Shares | | | Value | | | Shares | | | Value | |
| | Institutional Class | | | | | | | | | | | | |
| | Shares sold | | | 21,310,515 | | | $ | 326,400,822 | | | | 8,299,965 | | | $ | 123,488,033 | |
| | Shares issued in | | | | | | | | | | | | | | | | |
| | reinvestment of distributions | | | 212,607 | | | | 3,491,008 | | | | 65,590 | | | | 958,925 | |
| | Shares redeemed(3) | | | (6,111,162 | ) | | | (92,611,932 | ) | | | (2,618,528 | ) | | | (38,839,294 | ) |
| | Net increase | | | 15,411,960 | | | $ | 237,279,898 | | | | 5,747,027 | | | $ | 85,607,664 | |
(3) | Net of redemption fees of $6,606 and $12,817, respectively. Effective April 30, 2016, the 1% redemption fee was eliminated. |
The accompanying notes are an integral part of these financial statements.
CONGRESS ALL CAP OPPORTUNITY FUND
| STATEMENTS OF CHANGES IN NET ASSETS |
| | | Year Ended | | | Year Ended | |
| | | December 31, | | | December 31, | |
| | | 2016 | | | 2015 | |
| | | | | | | |
| INCREASE (DECREASE) IN NET ASSETS FROM: | |
| OPERATIONS | |
| Net investment income | | $ | 53,020 | | | $ | 261,195 | |
| Net realized loss on investments | | | (116,540 | ) | | | (366,757 | ) |
| Net increase from payments by affiliates on the | | | | | | | | |
| disposal of investments in violation of restrictions | | | 163,910 | | | | — | |
| Change in net unrealized | | | | | | | | |
| appreciation/depreciation on investments | | | 2,630,201 | | | | (1,619,945 | ) |
| Change in net unrealized | | | | | | | | |
| appreciation/depreciation on translation of | | | | | | | | |
| other assets and liabilities in foreign currency | | | 13 | | | | 8 | |
| Net increase (decrease) in net assets | | | | | | | | |
| resulting from operations | | | 2,730,604 | | | | (1,725,499 | ) |
| | | | | | | | | |
| DISTRIBUTIONS TO SHAREHOLDERS | |
| From net investment income: | | | | | | | | |
| Retail Class | | | (8,319 | ) | | | (38,245 | ) |
| Institutional Class | | | (45,847 | ) | | | (200,742 | ) |
| From net realized gain on investments: | | | | | | | | |
| Retail Class | | | — | | | | (4,123 | ) |
| Institutional Class | | | — | | | | (18,123 | ) |
| Total distributions to shareholders | | | (54,166 | ) | | | (261,233 | ) |
| | | | | | | | | |
| CAPITAL SHARE TRANSACTIONS | |
| Increase in net assets derived from | | | | | | | | |
net change in outstanding shares - Retail Class(1) | | | 827,031 | | | | 1,867,177 | |
| Increase (decrease) in net assets derived from | | | | | | | | |
net change in outstanding shares - Institutional Class(1) | | | (4,506,010 | ) | | | 8,288,246 | |
| Total increase (decrease) in net assets | | | | | | | | |
| from capital share transactions | | | (3,678,979 | ) | | | 10,155,423 | |
| Total increase (decrease) in net assets | | | (1,002,541 | ) | | | 8,168,691 | |
| | | | | | | | | |
| NET ASSETS | |
| Beginning of year | | | 24,231,497 | | | | 16,062,806 | |
| End of year | | $ | 23,228,956 | | | $ | 24,231,497 | |
| Undistributed net investment income | | $ | 37,983 | | | $ | 39,206 | |
The accompanying notes are an integral part of these financial statements.
CONGRESS ALL CAP OPPORTUNITY FUND
| STATEMENTS OF CHANGES IN NET ASSETS (Continued) |
(1) | Summary of capital share transactions is as follows: |
| | | | Year Ended | | | Year Ended | |
| | | | December 31, 2016 | | | December 31, 2015 | |
| | | | Shares | | | Value | | | Shares | | | Value | |
| | Retail Class | | | | | | | | | | | | |
| | Shares sold | | | 183,259 | | | $ | 2,571,118 | | | | 208,369 | | | $ | 3,008,925 | |
| | Shares issued in | | | | | | | | | | | | | | | | |
| | reinvestment of distributions | | | 451 | | | | 7,054 | | | | 2,464 | | | | 34,098 | |
| | Shares redeemed(2) | | | (126,843 | ) | | | (1,751,141 | ) | | | (77,102 | ) | | | (1,175,846 | ) |
| | Net increase | | | 56,867 | | | $ | 827,031 | | | | 133,731 | | | $ | 1,867,177 | |
(2) | Net of redemption fees of $135 and $892, respectively. Effective April 30, 2016, the 1% redemption fee was eliminated. |
| | | | Year Ended | | | Year Ended | |
| | | | December 31, 2016 | | | December 31, 2015 | |
| | | | Shares | | | Value | | | Shares | | | Value | |
| | Institutional Class | | | | | | | | | | | | |
| | Shares sold | | | 330,601 | | | $ | 4,411,802 | | | | 939,179 | | | $ | 14,145,340 | |
| | Shares issued in | | | | | | | | | | | | | | | | |
| | reinvestment of distributions | | | 2,112 | | | | 33,201 | | | | 11,751 | | | | 163,216 | |
| | Shares redeemed(3) | | | (656,340 | ) | | | (8,951,013 | ) | | | (428,357 | ) | | | (6,020,310 | ) |
| | Net increase (decrease) | | | (323,627 | ) | | $ | (4,506,010 | ) | | | 522,573 | | | $ | 8,288,246 | |
(3) | Net of redemption fees of $70 and $197, respectively. Effective April 30, 2016, the 1% redemption fee was eliminated. |
The accompanying notes are an integral part of these financial statements.
CONGRESS LARGE CAP GROWTH FUND
| FINANCIAL HIGHLIGHTS For a capital share outstanding throughout each year |
RETAIL CLASS
| | | Year Ended December 31, | |
| | | 2016 | | | 2015 | | | 2014 | | | 2013 | | | 2012 | |
| Net asset value, | | | | | | | | | | | | | | | |
| beginning of year | | $ | 21.31 | | | $ | 21.57 | | | $ | 21.10 | | | $ | 16.66 | | | $ | 14.97 | |
| | | | | | | | | | | | | | | | | | | | | |
| INCOME FROM INVESTMENT OPERATIONS: | |
Net investment income(1) | | | 0.12 | | | | 0.10 | | | | 0.03 | | | | 0.06 | | | | 0.08 | |
| Net realized and unrealized | | | | | | | | | | | | | | | | | | | | |
| gain on investments | | | 0.84 | | | | 0.29 | | | | 1.88 | | | | 4.74 | | | | 1.69 | |
| Total from investment operations | | | 0.96 | | | | 0.39 | | | | 1.91 | | | | 4.80 | | | | 1.77 | |
| | | | | | | | | | | | | | | | | | | | | |
| LESS DISTRIBUTIONS: | |
| From net investment income | | | (0.12 | ) | | | (0.08 | ) | | | (0.03 | ) | | | (0.04 | ) | | | (0.08 | ) |
| From net realized gain | | | (0.08 | ) | | | (0.57 | ) | | | (1.41 | ) | | | (0.32 | ) | | | — | |
| Total distributions | | | (0.20 | ) | | | (0.65 | ) | | | (1.44 | ) | | | (0.36 | ) | | | (0.08 | ) |
| Paid-in capital from | | | | | | | | | | | | | | | | | | | | |
| redemption fees | | | 0.00 | (2) | | | 0.00 | (2) | | | 0.00 | (2) | | | 0.00 | (2) | | | 0.00 | (2) |
| Net asset value, end of year | | $ | 22.07 | | | $ | 21.31 | | | $ | 21.57 | | | $ | 21.10 | | | $ | 16.66 | |
| Total return | | | 4.48 | % | | | 1.79 | % | | | 8.98 | % | | | 28.84 | % | | | 11.81 | % |
| | | | | | | | | | | | | | | | | | | | | |
| SUPPLEMENTAL DATA: | |
| Net assets, end of year (millions) | | $ | 10.1 | | | $ | 15.1 | | | $ | 17.3 | | | $ | 19.7 | | | $ | 18.1 | |
| Portfolio turnover rate | | | 33 | % | | | 31 | % | | | 36 | % | | | 51 | % | | | 52 | % |
| | | | | | | | | | | | | | | | | | | | | |
| RATIO OF EXPENSES TO AVERAGE NET ASSETS | |
| Before fees waived and | | | | | | | | | | | | | | | | | | | | |
| expenses absorbed | | | 1.32 | % | | | 1.33 | % | | | 1.42 | % | | | 1.70 | % | | | 1.97 | % |
| After fees waived and | | | | | | | | | | | | | | | | | | | | |
| expenses absorbed | | | 1.00 | % | | | 1.00 | % | | | 1.00 | % | | | 1.00 | % | | | 1.00 | % |
| | | | | | | | | | | | | | | | | | | | | |
| RATIO OF NET INVESTMENT INCOME (LOSS) | |
| TO AVERAGE NET ASSETS | |
| Before fees waived and | | | | | | | | | | | | | | | | | | | | |
| expenses absorbed | | | 0.24 | % | | | 0.10 | % | | | (0.27 | )% | | | (0.38 | )% | | | (0.46 | )% |
| After fees waived and | | | | | | | | | | | | | | | | | | | | |
| expenses absorbed | | | 0.56 | % | | | 0.43 | % | | | 0.15 | % | | | 0.32 | % | | | 0.51 | % |
(1) | Calculated based on the average number of shares outstanding |
(2) | Does not round to $0.01 |
The accompanying notes are an integral part of these financial statements.
CONGRESS LARGE CAP GROWTH FUND
| FINANCIAL HIGHLIGHTS For a capital share outstanding throughout each year |
INSTITUTIONAL CLASS
| | | Year Ended December 31, | |
| | | 2016 | | | 2015 | | | 2014 | | | 2013 | | | 2012 | |
| Net asset value, | | | | | | | | | | | | | | | |
| beginning of year | | $ | 21.31 | | | $ | 21.57 | | | $ | 21.10 | | | $ | 16.64 | | | $ | 14.97 | |
| | | | | | | | | | | | | | | | | | | | | |
| INCOME FROM INVESTMENT OPERATIONS: | |
Net investment income(1) | | | 0.18 | | | | 0.15 | | | | 0.09 | | | | 0.11 | | | | 0.01 | |
| Net realized and unrealized | | | | | | | | | | | | | | | | | | | | |
| gain on investments | | | 0.83 | | | | 0.30 | | | | 1.88 | | | | 4.76 | | | | 1.78 | |
| Total from investment operations | | | 1.01 | | | | 0.45 | | | | 1.97 | | | | 4.87 | | | | 1.79 | |
| | | | | | | | | | | | | | | | | | | | | |
| LESS DISTRIBUTIONS: | |
| From net investment income | | | (0.18 | ) | | | (0.14 | ) | | | (0.09 | ) | | | (0.09 | ) | | | (0.12 | ) |
| From net realized gain | | | (0.08 | ) | | | (0.57 | ) | | | (1.41 | ) | | | (0.32 | ) | | | — | |
| Total distributions | | | (0.26 | ) | | | (0.71 | ) | | | (1.50 | ) | | | (0.41 | ) | | | (0.12 | ) |
| Paid-in capital from | | | | | | | | | | | | | | | | | | | | |
| redemption fees | | | — | | | | 0.00 | (2) | | | — | | | | 0.00 | (2) | | | — | |
| Net asset value, end of year | | $ | 22.06 | | | $ | 21.31 | | | $ | 21.57 | | | $ | 21.10 | | | $ | 16.64 | |
| Total return | | | 4.75 | % | | | 2.05 | % | | | 9.27 | % | | | 29.27 | % | | | 11.94 | % |
| | | | | | | | | | | | | | | | | | | | | |
| SUPPLEMENTAL DATA: | |
| Net assets, end of year (millions) | | $ | 36.2 | | | $ | 30.0 | | | $ | 21.6 | | | $ | 14.8 | | | $ | 0.7 | |
| Portfolio turnover rate | | | 33 | % | | | 31 | % | | | 36 | % | | | 51 | % | | | 52 | % |
| | | | | | | | | | | | | | | | | | | | | |
| RATIO OF EXPENSES TO AVERAGE NET ASSETS | |
| Before fees waived and | | | | | | | | | | | | | | | | | | | | |
| expenses absorbed | | | 1.07 | % | | | 1.08 | % | | | 1.17 | % | | | 1.45 | % | | | 1.72 | % |
| After fees waived and | | | | | | | | | | | | | | | | | | | | |
| expenses absorbed | | | 0.75 | % | | | 0.75 | % | | | 0.75 | % | | | 0.75 | % | | | 0.75 | % |
| | | | | | | | | | | | | | | | | | | | | |
| RATIO OF NET INVESTMENT INCOME (LOSS) | |
| TO AVERAGE NET ASSETS | |
| Before fees waived and | | | | | | | | | | | | | | | | | | | | |
| expenses absorbed | | | 0.50 | % | | | 0.36 | % | | | 0.01 | % | | | (0.10 | )% | | | (0.93 | )% |
| After fees waived and | | | | | | | | | | | | | | | | | | | | |
| expenses absorbed | | | 0.82 | % | | | 0.69 | % | | | 0.43 | % | | | 0.60 | % | | | 0.04 | % |
(1) | Calculated based on the average number of shares outstanding |
(2) | Does not round to $0.01 |
The accompanying notes are an integral part of these financial statements.
CONGRESS MID CAP GROWTH FUND
| FINANCIAL HIGHLIGHTS For a capital share outstanding throughout each year/period |
RETAIL CLASS
| | | | | | | | | | | | | | | Period Ended | |
| | | Year Ended December 31, | | | December 31, | |
| | | 2016 | | | 2015 | | | 2014 | | | 2013 | | | | 2012* | |
| Net asset value, | | | | | | | | | | | | | | | | |
| beginning of year/period | | $ | 14.43 | | | $ | 14.55 | | | $ | 13.58 | | | $ | 10.16 | | | $ | 10.00 | |
| | | | | | | | | | | | | | | | | | | | | |
| INCOME FROM INVESTMENT OPERATIONS: | |
Net investment income (loss)(1) | | | 0.00 | (2) | | | (0.02 | ) | | | (0.01 | ) | | | (0.02 | ) | | | 0.03 | |
| Net realized and unrealized | | | | | | | | | | | | | | | | | | | | |
| gain (loss) on investments | | | 1.89 | | | | (0.00 | )(3) | | | 1.53 | | | | 3.63 | | | | 0.13 | |
| Total from investment operations | | | 1.89 | | | | (0.02 | ) | | | 1.52 | | | | 3.61 | | | | 0.16 | |
| | | | | | | | | | | | | | | | | | | | | |
| LESS DISTRIBUTIONS: | |
| From net investment income | | | (0.00 | )(3) | | | — | | | | — | | | | — | | | | — | |
| From net realized gain | | | (0.15 | ) | | | (0.10 | ) | | | (0.56 | ) | | | (0.21 | ) | | | — | |
| Total distributions | | | (0.15 | ) | | | (0.10 | ) | | | (0.56 | ) | | | (0.21 | ) | | | — | |
| Paid-in capital from | | | | | | | | | | | | | | | | | | | | |
| redemption fees | | | 0.00 | (2) | | | 0.00 | (2) | | | 0.01 | | | | 0.02 | | | | — | |
| Net asset value, end of year/period | | $ | 16.17 | | | $ | 14.43 | | | $ | 14.55 | | | $ | 13.58 | | | $ | 10.16 | |
| Total return | | | 13.11 | % | | | (0.15 | )% | | | 11.22 | % | | | 35.72 | % | | 1.60 | %^ |
| | | | | | | | | | | | | | | | | | | | | |
| SUPPLEMENTAL DATA: | |
| Net assets, end of | | | | | | | | | | | | | | | | | | | | |
| year/period (millions) | | $ | 48.0 | | | $ | 18.3 | | | $ | 13.0 | | | $ | 3.7 | | | $ | 0.4 | |
| Portfolio turnover rate | | | 18 | % | | | 24 | % | | | 35 | % | | | 31 | % | | 0 | %^‡ |
| | | | | | | | | | | | | | | | | | | | | |
| RATIO OF EXPENSES TO AVERAGE NET ASSETS | |
| Before fees waived and | | | | | | | | | | | | | | | | | | | | |
| expenses absorbed | | | 1.08 | % | | | 1.12 | % | | | 1.15 | % | | | 1.42 | % | | | 3.83 | %+ |
| After fees waived and | | | | | | | | | | | | | | | | | | | | |
| expenses absorbed | | | 1.00 | % | | | 1.00 | % | | | 1.00 | % | | | 1.00 | % | | | 1.00 | %+ |
| | | | | | | | | | | | | | | | | | | | | |
| RATIO OF NET INVESTMENT INCOME (LOSS) | |
| TO AVERAGE NET ASSETS | |
| Before fees waived and | | | | | | | | | | | | | | | | | | | | |
| expenses absorbed | | | (0.07 | )% | | | (0.25 | )% | | | (0.22 | )% | | | (0.62 | )% | | | (0.95 | )%+ |
| After fees waived and | | | | | | | | | | | | | | | | | | | | |
| expenses absorbed | | | 0.01 | % | | | (0.13 | )% | | | (0.07 | )% | | | (0.20 | )% | | | 1.88 | %+ |
| * | | The Fund commenced operations on October 31, 2012. |
(1) | | Calculated based on the average number of shares outstanding |
(2) | | Does not round to $0.01 |
(3) | | Does not round to $(0.01) |
| ^ | | Not annualized |
+ | | Annualized |
| ‡ | | Does not round to 1% |
The accompanying notes are an integral part of these financial statements.
CONGRESS MID CAP GROWTH FUND
| FINANCIAL HIGHLIGHTS For a capital share outstanding throughout each year/period |
INSTITUTIONAL CLASS
| | | | | | | | | | | | | | | Period Ended | |
| | | Year Ended December 31, | | | December 31, | |
| | | 2016 | | | 2015 | | | 2014 | | | 2013 | | | | 2012* | |
| Net asset value, | | | | | | | | | | | | | | | | |
| beginning of year/period | | $ | 14.50 | | | $ | 14.60 | | | $ | 13.61 | | | $ | 10.17 | | | $ | 10.00 | |
| | | | | | | | | | | | | | | | | | | | | |
| INCOME FROM INVESTMENT OPERATIONS: | |
Net investment income (loss)(1) | | | 0.04 | | | | 0.02 | | | | 0.02 | | | | 0.00 | (2) | | | (0.00 | )(3) |
| Net realized and unrealized | | | | | | | | | | | | | | | | | | | | |
| gain (loss) on investments | | | 1.90 | | | | (0.00 | )(3) | | | 1.55 | | | | 3.65 | | | | 0.17 | |
| Total from investment operations | | | 1.94 | | | | 0.02 | | | | 1.57 | | | | 3.65 | | | | 0.17 | |
| | | | | | | | | | | | | | | | | | | | | |
| LESS DISTRIBUTIONS: | |
| From net investment income | | | (0.03 | ) | | | (0.02 | ) | | | (0.02 | ) | | | — | | | | — | |
| From net realized gain | | | (0.15 | ) | | | (0.10 | ) | | | (0.56 | ) | | | (0.21 | ) | | | — | |
| Total distributions | | | (0.18 | ) | | | (0.12 | ) | | | (0.58 | ) | | | (0.21 | ) | | | — | |
| Paid-in capital from | | | | | | | | | | | | | | | | | | | | |
| redemption fees | | | 0.00 | (2) | | | 0.00 | (2) | | | 0.00 | (2) | | | 0.00 | (2) | | | 0.00 | (2) |
| Net asset value, end of year/period | | $ | 16.26 | | | $ | 14.50 | | | $ | 14.60 | | | $ | 13.61 | | | $ | 10.17 | |
| Total return | | | 13.38 | % | | | 0.10 | % | | | 11.49 | % | | | 35.88 | % | | 1.70 | %^ |
| | | | | | | | | | | | | | | | | | | | |
| SUPPLEMENTAL DATA: | |
| Net assets, end of | | | | | | | | | | | | | | | | | | | | |
| year/period (millions) | | $ | 556.4 | | | $ | 272.5 | | | $ | 190.5 | | | $ | 58.2 | | | $ | 30.4 | |
| Portfolio turnover rate | | | 18 | % | | | 24 | % | | | 35 | % | | | 31 | % | | 0 | %^‡ |
| | | | | | | | | | | | | | | | | | | | |
| RATIO OF EXPENSES TO AVERAGE NET ASSETS | |
| Before fees waived and | | | | | | | | | | | | | | | | | | | | |
| expenses absorbed | | | 0.83 | % | | | 0.87 | % | | | 0.90 | % | | | 1.17 | % | | | 3.58 | %+ |
| After fees waived and | | | | | | | | | | | | | | | | | | | | |
| expenses absorbed | | | 0.75 | % | | | 0.75 | % | | | 0.75 | % | | | 0.75 | % | | | 0.75 | %+ |
| | | | | | | | | | | | | | | | | | | | | |
| RATIO OF NET INVESTMENT INCOME (LOSS) | |
| TO AVERAGE NET ASSETS | |
| Before fees waived and | | | | | | | | | | | | | | | | | | | | |
| expenses absorbed | | | 0.16 | % | | | 0.00 | %(4) | | | 0.02 | % | | | (0.42 | )% | | | (3.12 | )%+ |
| After fees waived and | | | | | | | | | | | | | | | | | | | | |
| expenses absorbed | | | 0.24 | % | | | 0.12 | % | | | 0.17 | % | | | 0.00 | %(4) | | | (0.29 | )%+ |
| * | | The Fund commenced operations on October 31, 2012. |
(1) | | Calculated based on the average number of shares outstanding |
(2) | | Does not round to $0.01 |
(3) | | Does not round to $(0.01) |
(4) | | Does not round to 0.01% |
| ^ | | Not annualized |
+ | | Annualized |
| ‡ | | Does not round to 1% |
The accompanying notes are an integral part of these financial statements.
CONGRESS ALL CAP OPPORTUNITY FUND
| FINANCIAL HIGHLIGHTS For a capital share outstanding throughout each year/period |
RETAIL CLASS
| | | | | | | | | | | | | | | Period Ended | |
| | | Year Ended December 31, | | | December 31, | |
| | | 2016 | | | 2015 | | | 2014 | | | 2013 | | | | 2012* | |
| Net asset value, | | | | | | | | | | | | | | | | |
| beginning of year/period | | $ | 13.82 | | | $ | 14.66 | | | $ | 12.95 | | | $ | 10.29 | | | $ | 10.00 | |
| | | | | | | | | | | | | | | | | | | | | |
| INCOME FROM INVESTMENT OPERATIONS: | |
Net investment income(1) | | | 0.01 | | | | 0.16 | | | | 0.03 | | | | 0.03 | | | | 0.03 | |
| Net realized and unrealized | | | | | | | | | | | | | | | | | | | | |
| gain (loss) on investments | | | 1.72 | | | | (0.87 | ) | | | 1.74 | | | | 2.84 | | | | 0.29 | |
| Total from investment operations | | | 1.73 | | | | (0.71 | ) | | | 1.77 | | | | 2.87 | | | | 0.32 | |
| | | | | | | | | | | | | | | | | | | | | |
| LESS DISTRIBUTIONS: | |
| From net investment income | | | (0.02 | ) | | | (0.12 | ) | | | (0.00 | )(2) | | | (0.02 | ) | | | (0.03 | ) |
| From net realized gain | | | — | | | | (0.01 | ) | | | (0.06 | ) | | | (0.19 | ) | | | — | |
| Total distributions | | | (0.02 | ) | | | (0.13 | ) | | | (0.06 | ) | | | (0.21 | ) | | | (0.03 | ) |
| Paid-in capital from | | | | | | | | | | | | | | | | | | | | |
| redemption fees | | | 0.00 | (3) | | | 0.00 | (3) | | | 0.00 | (3) | | | 0.00 | (3) | | | — | |
| Reimbursement by Advisor | | | 0.09 | | | | — | | | | — | | | | — | | | | — | |
| Net asset value, end of year/period | | $ | 15.62 | | | $ | 13.82 | | | $ | 14.66 | | | $ | 12.95 | | | $ | 10.29 | |
| Total return | | | 13.18 | %(4) | | | (4.84 | )% | | | 13.67 | % | | | 27.89 | % | | 3.15 | %^ |
| | | | | | | | | | | | | | | | | | | | | |
| SUPPLEMENTAL DATA: | |
| Net assets, end of | | | | | | | | | | | | | | | | | | | | |
| year/period (millions) | | $ | 6.2 | | | $ | 4.7 | | | $ | 3.0 | | | $ | 2.1 | | | $ | 0.4 | |
| Portfolio turnover rate | | | 68 | % | | | 37 | % | | | 31 | % | | | 41 | % | | 9 | %^ |
| | | | | | | | | | | | | | | | | | | | | |
| RATIO OF EXPENSES TO AVERAGE NET ASSETS | |
| Before fees waived and | | | | | | | | | | | | | | | | | | | | |
| expenses absorbed | | | 1.91 | % | | | 1.89 | % | | | 3.01 | % | | | 5.20 | % | | | 21.16 | %+ |
| After fees waived and | | | | | | | | | | | | | | | | | | | | |
| expenses absorbed | | | 1.00 | % | | | 1.00 | % | | | 1.00 | % | | | 1.00 | % | | | 1.00 | %+ |
| | | | | | | | | | | | | | | | | | | | | |
| RATIO OF NET INVESTMENT INCOME (LOSS) | |
| TO AVERAGE NET ASSETS | |
| Before fees waived and | | | | | | | | | | | | | | | | | | | | |
| expenses absorbed | | | (0.85 | )% | | | 0.17 | % | | | (1.81 | )% | | | (3.95 | )% | | | (18.68 | )%+ |
| After fees waived and | | | | | | | | | | | | | | | | | | | | |
| expenses absorbed | | | 0.06 | % | | | 1.06 | % | | | 0.20 | % | | | 0.25 | % | | | 1.48 | %+ |
| * | | The Fund commenced operations on October 31, 2012. |
(1) | | Calculated based on the average number of shares outstanding |
(2) | | Does not round to $(0.01) |
(3) | | Does not round to $0.01 |
(4) | | Net increase from payments by affiliates on the disposal of investments in violation of investment restrictions contributed 0.65% to this return. |
| ^ | | Not annualized |
+ | | Annualized |
The accompanying notes are an integral part of these financial statements.
CONGRESS ALL CAP OPPORTUNITY FUND
| FINANCIAL HIGHLIGHTS For a capital share outstanding throughout each period/year |
INSTITUTIONAL CLASS
| | | | | | | | | | | | | | | Period Ended | |
| | | Year Ended December 31, | | | December 31, | |
| | | 2016 | | | 2015 | | | 2014 | | | 2013 | | | | 2012* | |
| Net asset value, | | | | | | | | | | | | | | | | |
| beginning of year/period | | $ | 13.86 | | | $ | 14.70 | | | $ | 12.98 | | | $ | 10.29 | | | $ | 10.00 | |
| | | | | | | | | | | | | | | | | | | | | |
| INCOME FROM INVESTMENT OPERATIONS: | |
Net investment income(1) | | | 0.04 | | | | 0.17 | | | | 0.07 | | | | 0.06 | | | | 0.03 | |
| Net realized and unrealized | | | | | | | | | | | | | | | | | | | | |
| gain (loss) on investments | | | 1.74 | | | | (0.86 | ) | | | 1.74 | | | | 2.86 | | | | 0.29 | |
| Total from investment operations | | | 1.78 | | | | (0.69 | ) | | | 1.81 | | | | 2.92 | | | | 0.32 | |
| | | | | | | | | | | | | | | | | | | | | |
| LESS DISTRIBUTIONS: | |
| From net investment income | | | (0.04 | ) | | | (0.14 | ) | | | (0.03 | ) | | | (0.04 | ) | | | (0.03 | ) |
| From net realized gain | | | — | | | | (0.01 | ) | | | (0.06 | ) | | | (0.19 | ) | | | — | |
| Total distributions | | | (0.04 | ) | | | (0.15 | ) | | | (0.09 | ) | | | (0.23 | ) | | | (0.03 | ) |
| Paid-in capital from | | | | | | | | | | | | | | | | | | | | |
| redemption fees | | | 0.00 | (2) | | | — | | | | 0.00 | (2) | | | — | | | | — | |
| Reimbursement by Advisor | | | 0.09 | | | | — | | | | — | | | | — | | | | — | |
| Net asset value, end of year/period | | $ | 15.69 | | | $ | 13.86 | | | $ | 14.70 | | | $ | 12.98 | | | $ | 10.29 | |
| Total return | | | 13.51 | %(3) | | | (4.67 | )% | | | 13.95 | % | | | 28.38 | % | | 3.18 | %^ |
| | | | | | | | | | | | | | | | | | | | |
| SUPPLEMENTAL DATA: | |
| Net assets, end of | | | | | | | | | | | | | | | | | | | | |
| year/period (millions) | | $ | 17.0 | | | $ | 19.5 | | | $ | 13.1 | | | $ | 6.3 | | | $ | 1.3 | |
| Portfolio turnover rate | | | 68 | % | | | 37 | % | | | 31 | % | | | 41 | % | | 9 | %^ |
| | | | | | | | | | | | | | | | | | | | |
| RATIO OF EXPENSES TO AVERAGE NET ASSETS | |
| Before fees waived and | | | | | | | | | | | | | | | | | | | | |
| expenses absorbed | | | 1.66 | % | | | 1.62 | % | | | 2.72 | % | | | 4.95 | % | | | 20.91 | %+ |
| After fees waived and | | | | | | | | | | | | | | | | | | | | |
| expenses absorbed | | | 0.75 | % | | | 0.75 | % | | | 0.75 | % | | | 0.75 | % | | | 0.75 | %+ |
| | | | | | | | | | | | | | | | | | | | | |
| RATIO OF NET INVESTMENT INCOME (LOSS) | |
| TO AVERAGE NET ASSETS | |
| Before fees waived and | | | | | | | | | | | | | | | | | | | | |
| expenses absorbed | | | (0.62 | )% | | | 0.29 | % | | | (1.47 | )% | | | (3.70 | )% | | | (18.63 | )%+ |
| After fees waived and | | | | | | | | | | | | | | | | | | | | |
| expenses absorbed | | | 0.29 | % | | | 1.16 | % | | | 0.50 | % | | | 0.50 | % | | | 1.53 | %+ |
| * | | The Fund commenced operations on October 31, 2012. |
(1) | | Calculated based on the average number of shares outstanding |
(2) | | Does not round to $0.01 |
(3) | | Net increase from payments by affiliates on the disposal of investments in violation of investment restrictions contributed 0.65% to this return. |
| ^ | | Not annualized |
+ | | Annualized |
The accompanying notes are an integral part of these financial statements.
CONGRESS FUNDS
| NOTES TO FINANCIAL STATEMENTS December 31, 2016 |
The Congress Large Cap Growth Fund, the Congress Mid Cap Growth Fund, and the Congress All Cap Opportunity Fund (the “Funds”) are each a diversified series of shares of beneficial interest of Professionally Managed Portfolios (the “Trust”), which is registered under the Investment Company Act of 1940, as amended (the “1940 Act”), as an open-end investment management company. Each Fund is an investment company and accordingly follows the investment company accounting and reporting guidance of the Financial Accounting Standards Board (FASB) Accounting Standard Codification Topic 946 “Financial Services—Investment Companies.” The Funds commenced operations on March 31, 2009, October 31, 2012, and October 31, 2012, respectively.
The Funds offer Retail Class and Institutional Class shares. Each class of shares has equal rights as to earnings and assets except that Retail Class shares bear distribution expenses. Each class of shares has exclusive voting rights with respect to matters that affect just that class. Income, expenses (other than expenses attributable to a specific class), and realized and unrealized gains or losses on investments, are allocated to each class of shares based on its relative net assets.
Each Fund’s investment objective is to seek long-term capital appreciation.
| NOTE 2 – SIGNIFICANT ACCOUNTING POLICIES |
The following is a summary of significant accounting policies consistently followed by the Funds. These policies are in conformity with accounting principles generally accepted in the United States of America (“U.S. GAAP”).
| | A. | Security Valuation. All equity securities, which may include Real Estate Investment Trusts (“REIT’s”), Business Development Companies (“BDC’s”), and Master Limited Partnerships (“MLP’s”), that are traded on U.S. or foreign national securities exchanges are valued at the last reported sale price on the exchange on which the security is principally traded or the exchange’s official closing price, if applicable. If, on a particular day, an exchange-traded security does not trade, then the mean between the most recent quoted bid and asked prices will be used. All equity securities, which may include REIT’s, BDC’s, and MLP’s, that are not traded on a listed exchange are valued at the last sale price in the over the counter market. If a non-exchange traded security does not trade on a particular day, then the mean between the last quoted closing bid price and asked price will be used. |
CONGRESS FUNDS
| NOTES TO FINANCIAL STATEMENTS December 31, 2016 (Continued) |
| | | Securities for which quotations are not readily available are valued at their respective fair values as determined in good faith by the Valuation Committee. When a security is “fair valued,” consideration is given to the facts and circumstances relevant to the particular situation, including a review of various factors set forth in the pricing procedures adopted by the Board of Trustees. Fair value pricing is an inherently subjective process, and no single standard exists for determining fair value. Different funds could reasonably arrive at different values for the same security. The use of fair value pricing by a fund may cause the net asset value of its shares to differ significantly from the net asset value that would be calculated without regard to such considerations. |
| | | |
| | | As described above, the Funds utilize various methods to measure the fair value of their investments on a recurring basis. U.S. GAAP establishes a hierarchy that prioritizes inputs to valuation methods. The three levels of inputs are: |
| | | Level 1 – | Unadjusted quoted prices in active markets for identical assets or liabilities that the Funds have the ability to access. |
| | | | |
| | | Level 2 – | Observable inputs other than quoted prices included in Level 1 that are observable for the asset or liability, either directly or indirectly. These inputs may include quoted prices for the identical instrument on an inactive market, prices for similar instruments, interest rates, prepayment speeds, credit risk, yield curves, default rates and similar data. |
| | | | |
| | | Level 3 – | Unobservable inputs for the asset or liability, to the extent relevant observable inputs are not available; representing the Funds’ own assumptions about the assumptions a market participant would use in valuing the asset or liability, and would be based on the best information available. |
| | | The availability of observable inputs can vary from security to security and is affected by a wide variety of factors, including, for example, the type of security, whether the security is new and not yet established in the marketplace, the liquidity of markets and other characteristics particular to the security. To the extent that valuation is based on models or inputs that are less observable or unobservable in the market, the determination of fair value requires more judgment. Accordingly, the degree of judgment exercised in determining fair value is greatest for instruments categorized in Level 3. |
CONGRESS FUNDS
| NOTES TO FINANCIAL STATEMENTS December 31, 2016 (Continued) |
| | | The inputs used to measure fair value may fall into different levels of the fair value hierarchy. In such cases, for disclosure purposes, the level in the fair value hierarchy within which the fair value measurement falls in its entirety, is determined based on the lowest level input that is significant to the fair value measurement in its entirety. |
| | | |
| | | The following is a summary of the inputs used to value the Funds’ investments as of December 31, 2016. See the Schedules of Investments for industry breakouts. |
| | | Congress Large Cap Growth Fund: | |
| | | | | Level 1 | | | Level 2 | | | Level 3 | | | Total | |
| | | Common Stocks | | $ | 45,311,492 | | | $ | — | | | $ | — | | | $ | 45,311,492 | |
| | | Short-Term Investments | | | 879,079 | | | | — | | | | — | | | | 879,079 | |
| | | Total Investments in Securities | | $ | 46,190,571 | | | $ | — | | | $ | — | | | $ | 46,190,571 | |
| | | Congress Mid Cap Growth Fund: | |
| | | | | Level 1 | | | Level 2 | | | Level 3 | | | Total | |
| | | Common Stocks | | $ | 574,607,900 | | | $ | — | | | $ | — | | | $ | 574,607,900 | |
| | | Short-Term Investments | | | 24,328,121 | | | | — | | | | — | | | | 24,328,121 | |
| | | Total Investments in Securities | | $ | 598,936,021 | | | $ | — | | | $ | — | | | $ | 598,936,021 | |
| | | Congress All Cap Opportunity Fund: | |
| | | | | Level 1 | | | Level 2 | | | Level 3 | | | Total | |
| | | Common Stocks | | $ | 22,422,405 | | | $ | — | | | $ | — | | | $ | 22,422,405 | |
| | | Short-Term Investments | | | 818,014 | | | | — | | | | — | | | | 818,014 | |
| | | Total Investments in Securities | | $ | 23,240,419 | | | $ | — | | | $ | — | | | $ | 23,240,419 | |
| | | It is the Funds’ policy to recognize transfers between levels at the end of each Fund’s reporting period. There were no transfers made into or out of Level 1, 2, or 3 during the year ended December 31, 2016. |
| | | |
| | B. | Foreign Currency. Investment securities and other assets and liabilities denominated in foreign currencies are translated into U.S. dollar amounts at the date of valuation. Purchases and sales of investment securities and income and expense items denominated in foreign currencies are translated into U.S. dollar amounts on the respective dates of such transactions. |
| | | |
| | | The Funds do not isolate that portion of the results of operations resulting from changes in foreign exchange rates on investments from the fluctuations arising from changes in market prices of securities held. Such fluctuations are included with the net unrealized and realized gain or loss from investments. |
CONGRESS FUNDS
| NOTES TO FINANCIAL STATEMENTS December 31, 2016 (Continued) |
| | | The Funds report net realized foreign exchange gains or losses that arise from sales of foreign currencies, currency gains or losses realized between the trade and settlement dates on securities transactions, and the difference between the amounts of dividends, interest, and foreign withholding taxes recorded on the Funds’ books and the U.S. dollar equivalent of the amounts actually received or paid. Net unrealized foreign exchange gains and losses arise from changes in the fair values of assets and liabilities, other than investments in securities at fiscal period end, resulting from changes in exchange rates. |
| | | |
| | C. | Federal Income Taxes. Each Fund has elected to be taxed as a “regulated investment company” and intends to distribute substantially all taxable income to its shareholders and otherwise comply with the provisions of the Internal Revenue Code applicable to regulated investment companies. Therefore, no provisions for federal income taxes or excise taxes have been made. |
| | | |
| | | In order to avoid imposition of the excise tax applicable to regulated investment companies, each Fund intends to declare each year as dividends in each calendar year at least 98.0% of its net investment income (earned during the calendar year) and 98.2% of their net realized capital gains (earned during the twelve months ended October 31) plus undistributed amounts, if any, from prior years. |
| | | |
| | | Net capital losses incurred after October 31 and within the taxable year are deemed to arise on the first business day of the Funds’ next taxable year. |
| | | |
| | | At December 31, 2016, the Congress Large Cap Growth Fund, Congress Mid Cap Growth Fund, and Congress All Cap Opportunity Fund did not defer any post October losses. |
| | | |
| | | At December 31, 2016, the Congress Large Cap Growth Fund and Congress Mid Cap Growth Fund did not have any capital loss carry-forwards. The Congress All Cap Opportunity Fund had $220,414 in short-term capital loss carry-forwards available for federal income tax purposes which do not expire and retain their original character. |
| | | |
| | | As of December 31, 2016, the Funds did not have any tax positions that did not meet the threshold of being sustained by the applicable tax authority. Generally, tax authorities can examine all the tax returns filed for the last three years. The Funds identify their major tax jurisdictions as U.S. Federal and the Commonwealth of Massachusetts. As of December 31, 2016, the Funds are not aware of any tax positions for |
CONGRESS FUNDS
| NOTES TO FINANCIAL STATEMENTS December 31, 2016 (Continued) |
| | | which it is reasonably possible that the total amounts of unrecognized tax benefits will change materially in the next twelve months. |
| | | |
| | D. | Security Transactions and Investment Income. Investment securities transactions are accounted for on the trade date. Gains and losses realized on sales of securities are determined on a specific identification basis. Discounts/premiums on debt securities purchased are accreted/amortized over the life of the respective securities using the effective interest method. Dividend income is recorded on the ex-dividend date. Dividends received from REITs generally are comprised of ordinary income, capital gains, and may include return of capital. Interest income is recorded on an accrual basis. Other non-cash dividends are recognized as investment income at the fair value of the property received. Withholding taxes on foreign dividends have been provided for in accordance with the Trust’s understanding of the applicable country’s tax rules and rates. |
| | | |
| | E. | Distributions to Shareholders. Distributions to shareholders from net investment income and net realized gains on securities for the Funds are normally declared and paid on an annual basis. Distributions are recorded on the ex-dividend date. |
| | | |
| | F. | Use of Estimates. The preparation of financial statements in conformity with U.S. GAAP requires management to make estimates and assumptions that affect the reported amounts of assets and liabilities at the date of the financial statements and the reported amount of revenue and expenses during the reporting period. Actual results could differ from those estimates. |
| | | |
| | G. | Share Valuation. The net asset value (“NAV”) per share of the Funds are calculated by dividing the sum of the value of the securities held by the Funds, plus cash or other assets, minus all liabilities (including estimated accrued expenses) by the total number of shares outstanding for the Funds, rounded to the nearest cent. The Funds’ shares will not be priced on the days on which the New York Stock Exchange is closed for trading. The offering and redemption price is equal to the Funds’ net asset value per share. The Funds charged a 1.00% redemption fee on shares held less than 90 days, however, effective April 30, 2016, the 1.00% redemption fee was eliminated. This fee was deducted from the redemption proceeds otherwise payable to the shareholder. The Funds retained the fee charged as paid-in capital and such fees became part of the Funds’ daily NAV calculation. |
CONGRESS FUNDS
| NOTES TO FINANCIAL STATEMENTS December 31, 2016 (Continued) |
| | H. | Guarantees and Indemnifications. In the normal course of business, the Funds enter into contracts with service providers that contain general indemnification clauses. The Funds’ maximum exposure under these arrangements is unknown as this would involve future claims that may be made against the Funds that have not yet occurred. However, based on experience, the Funds expect the risk of loss to be remote. |
| | | |
| | I. | Reclassifications of Capital Accounts. U.S. GAAP requires that certain components of net assets relating to permanent differences be reclassified between financial and tax reporting. These reclassifications have no effect on net assets or net asset value per share. For the year ended December 31, 2016, the following adjustments were made(a): |
| | | | | | | | Undistributed | | | | |
| | | | | Undistributed | | | (Accumulated) | | | | |
| | | | | (Accumulated) | | | Net Realized | | | | |
| | | | | Net Investment | | | Gain (Loss) | | | Paid-In | |
| | | Fund | | Income (Loss) | | | on Investments | | | Capital | |
| | | Congress Large Cap Growth Fund | | $ | 7,512 | | | $ | (7,512 | ) | | $ | — | |
| | | Congress Mid Cap Growth Fund | | $ | 12,899 | | | $ | (12,899 | ) | | $ | — | |
| | | Congress All Cap Opportunity Fund | | $ | (77 | ) | | $ | 77 | | | $ | — | |
| | | (a) These differences were primarily due to currency and distribution adjustments. |
| | | |
| | J. | Subsequent Events. In preparing these financial statements, management has evaluated events and transactions for potential recognition or disclosure through the date the financial statements were issued. Management has determined that there were no subsequent events that would need to be disclosed in the Funds’ financial statements. |
| NOTE 3 – COMMITMENTS AND OTHER RELATED PARTY TRANSACTIONS |
Congress Asset Management Company, LLP (the “Advisor”) provides each Fund with investment management services under an Investment Advisory Agreement (the “Agreement”). Under the Agreement, the Advisor furnishes all investment advice, office space, and certain administrative services, and provides most of the personnel needed by the Funds. As compensation for its services, the Advisor is entitled to a monthly fee. For the Congress Large Cap Growth Fund, the Advisor is entitled to a monthly fee at the annual rate of 0.50% based upon the average daily net assets of the Fund. For the Congress Mid Cap Growth Fund and the Congress All Cap Opportunity Fund, the Advisor is entitled to a monthly fee at the annual rate of 0.60% based upon the average daily net assets of the Funds. The advisory fees incurred during the
CONGRESS FUNDS
| NOTES TO FINANCIAL STATEMENTS December 31, 2016 (Continued) |
year ended December 31, 2016, are disclosed in the Statements of Operations. The investment advisory fees incurred are paid monthly to the Advisor, net of any monthly waiver or reimbursement discussed below.
The Advisor has contractually agreed to limit each Fund’s Retail Class annual expense ratio to 1.00% and each Fund’s Institutional Class annual expense ratio to 0.75% of each class’s average daily net assets. The contract’s term is indefinite and may be terminated only by the Board of Trustees. The amounts of expenses reimbursed during the year ended December 31, 2016, are disclosed in the Statements of Operations.
At December 31, 2016, the remaining cumulative unreimbursed amounts paid and/or waived by the Advisor on behalf of the Congress Large Cap Growth Fund, Congress Mid Cap Growth Fund, and Congress All Cap Opportunity Fund that may be reimbursed were $444,757, $905,940, and $614,647, respectively. The Advisor may recapture a portion of the above amounts no later than the dates as stated below. Any recapture of a fee waived or expense reimbursed should occur prior to the end of the third fiscal year after the reimbursement was paid.
| | Congress Large Cap Growth Fund: | |
| | | | | |
| | Expiration | | Amount | |
| | December 31, 2017 | | $ | 156,255 | |
| | December 31, 2018 | | | 141,080 | |
| | December 31, 2019 | | | 147,422 | |
| | | | $ | 444,757 | |
| | Congress Mid Cap Growth Fund: | |
| | | | | |
| | Expiration | | Amount | |
| | December 31, 2017 | | $ | 220,971 | |
| | December 31, 2018 | | | 318,249 | |
| | December 31, 2019 | | | 366,720 | |
| | | | $ | 905,940 | |
| | Congress All Cap Opportunity Fund: | |
| | | | | |
| | Expiration | | Amount | |
| | December 31, 2017 | | $ | 212,943 | |
| | December 31, 2018 | | | 197,813 | |
| | December 31, 2019 | | | 203,891 | |
| | | | $ | 614,647 | |
CONGRESS FUNDS
| NOTES TO FINANCIAL STATEMENTS December 31, 2016 (Continued) |
The Funds must pay their current ordinary operating expenses before the Advisor is entitled to any reimbursement. Any such reimbursement is also contingent upon the Board of Trustees’ review.
U.S. Bancorp Fund Services, LLC (“USBFS”), an indirect wholly-owned subsidiary of U.S. Bancorp, serves as the Funds’ administrator, fund accountant, and transfer agent. In those capacities USBFS maintains the Funds’ books and records, calculates each Fund’s NAV, prepares various federal and state regulatory filings, coordinates the payment of the Funds’ expenses, reviews expense accruals, and prepares materials supplied to the Board of Trustees. The officers of the Trust and the Chief Compliance Officer are also employees of USBFS. Fees paid by the Funds to USBFS for these services for the year ended December 31, 2016, are disclosed in the Statements of Operations.
Quasar Distributors, LLC (the “Distributor”) acts as the Funds’ principal underwriter in a continuous public offering of the Funds’ shares. U.S. Bank NA serves as custodian (the “Custodian”) to the Funds. Both the Distributor and Custodian are affiliates of the Administrator.
The Funds have adopted a Distribution Plan (the “Plan”) in accordance with Rule 12b-1 under the 1940 Act with respect to the Retail Class shares. The Plan provides that each Fund may pay a fee to the Distributor at an annual rate up to 0.25% of the average daily net assets of the Retail Class shares of each Fund. These fees may be used by the Distributor to provide compensation for sales support, distribution activities, or shareholder servicing activities. Distribution fees incurred by the Funds during the year ended December 31, 2016, are disclosed in the Statements of Operations.
During the year ended December 31, 2015, and during the year ended December 31, 2016, two security transactions were made by the Advisor that caused the Congress All Cap Opportunity Fund to be out of compliance with the diversification limits described in the Fund’s Statement of Additional Information (“SAI”). As described in the SAI, as to 75% of the Fund’s total assets, the Fund may not invest more than 5% of its total assets in the securities of a single issuer or hold more than 10% of the outstanding voting securities of a single issuer. The Advisor sold the applicable securities and reimbursed the Fund for realized losses of $139,215 and $24,695, for a total of $163,910, during the year ended December 31, 2016.
CONGRESS FUNDS
| NOTES TO FINANCIAL STATEMENTS December 31, 2016 (Continued) |
| NOTE 4 – PURCHASES AND SALES OF SECURITIES |
The cost of purchases and the proceeds from sales of securities, excluding short-term securities and U.S. Government securities for the year ended December 31, 2016, were as follows:
| | Fund | | Purchases | | | Sales | |
| | Congress Large Cap Growth Fund | | $ | 14,761,346 | | | $ | 15,380,026 | |
| | Congress Mid Cap Growth Fund | | $ | 319,552,689 | | | $ | 76,006,833 | |
| | Congress All Cap Opportunity Fund | | $ | 14,688,602 | | | $ | 17,782,256 | |
There were no purchases or sales of long-term U.S. Government securities for the Funds for the year ended December 31, 2016.
| NOTE 5 – DISTRIBUTIONS TO SHAREHOLDERS |
The tax character of distributions paid during the year ended December 31, 2016, and the year ended December 31, 2015, were as follows:
| | Congress Large Cap Growth Fund: | |
| | | | 2016 | | | 2015 | |
| | Distributions paid from: | | | | | | |
| | Ordinary Income | | $ | 341,957 | | | $ | 253,374 | |
| | Long-term capital gain | | | 180,254 | | | | 1,182,579 | |
| | | | $ | 522,211 | | | $ | 1,435,953 | |
| | Congress Mid Cap Growth Fund: | |
| | | | | 2016 | | | | 2015 | |
| | Distributions paid from: | | | | | | | | |
| | Ordinary Income | | $ | 960,661 | | | $ | 278,228 | |
| | Long-term capital gain | | | 5,518,333 | | | | 1,972,200 | |
| | | | $ | 6,478,994 | | | $ | 2,250,428 | |
| | Congress All Cap Opportunity Fund: | |
| | | | | 2016 | | | | 2015 | |
| | Distributions paid from: | | | | | | | | |
| | Ordinary Income | | $ | 54,166 | | | $ | 238,989 | |
| | Long-term capital gain | | | — | | | | 22,244 | |
| | | | $ | 54,166 | | | $ | 261,233 | |
CONGRESS FUNDS
| NOTES TO FINANCIAL STATEMENTS December 31, 2016 (Continued) |
The components of accumulated earnings (losses) on a tax basis at December 31, 2016, were as follows*:
| | | | Congress | | | Congress | | | Congress | |
| | | | Large Cap | | | Mid Cap | | | All Cap | |
| | | | Growth | | | Growth | | | Opportunity | |
| | | | Fund | | | Fund | | | Fund | |
| | Cost of Investments | | $ | 37,049,194 | | | $ | 526,335,583 | | | $ | 19,532,219 | |
| | Gross tax unrealized | | | | | | | | | | | | |
| | appreciation | | | 9,896,743 | | | | 89,258,846 | | | | 4,196,382 | |
| | Gross tax unrealized | | | | | | | | | | | | |
| | depreciation | | | (755,366 | ) | | | (16,658,408 | ) | | | (488,182 | ) |
| | Net unrealized appreciation | | $ | 9,141,377 | | | $ | 72,600,438 | | | $ | 3,708,200 | |
| | Undistributed | | | | | | | | | | | | |
| | ordinary income | | | — | | | | — | | | | 37,983 | |
| | Undistributed long-term | | | | | | | | | | | | |
| | capital gain | | | 425,384 | | | | 3,001 | | | | — | |
| | Total distributable earnings | | | 425,384 | | | | 3,001 | | | | 37,983 | |
| | Other accumulated | | | | | | | | | | | | |
| | gains/(losses) | | | — | | | | — | | | | (220,393 | ) |
| | Total accumulated gains | | $ | 9,566,761 | | | $ | 72,603,439 | | | $ | 3,525,790 | |
| | * | The difference between book and tax basis unrealized appreciation was primarily attributable to wash sale and transfer-in-kind adjustments. |
U.S. Bank NA has made available to the Funds credit facilities to be used for temporary or extraordinary purposes related to Fund redemptions. Credit facility activity for the year ended December 31, 2016, was as follows:
| | | | Large Cap | | | Mid Cap | | | All Cap | |
| | Maximum Available Credit | | $ | 2,000,000 | | | $ | 15,000,000 | | | $ | 3,000,000 | |
| | Largest Amount Outstanding | | | | | | | | | | | | |
| | on an Individual Day | | | — | | | | — | | | | 178,000 | |
| | Average Daily Loan Outstanding | | | — | | | | — | | | | 1,907 | |
| | Interest Expense | | | — | | | | — | | | | 67 | |
| | Loan Outstanding as | | | | | | | | | | | | |
| | of December 31, 2016 | | | — | | | | — | | | | — | |
| | Average Interest Rate | | | 3.50 | % | | | 3.50 | % | | | 3.50 | % |
CONGRESS FUNDS
| REPORT OF INDEPENDENT REGISTERED PUBLIC ACCOUNTING FIRM |
To the Board of Trustees of Professionally Managed Portfolios
and Shareholders of the Congress Funds
We have audited the accompanying statements of assets and liabilities of the Congress Large Cap Growth Fund, Congress Mid Cap Growth Fund, and Congress All Cap Opportunity Fund (the “Funds”), each a series of Professionally Managed Portfolios (the “Trust”), including the schedules of investments, as of December 31, 2016, and the related statements of operations for the year then ended, the statements of changes in net assets for each of the two years in the period then ended, and the financial highlights for each of the five years in the period then ended with respect to the Congress Large Cap Fund, and with respect to Congress Mid Cap Growth Fund and Congress All Cap Growth Fund, the financial highlights for the each of the four years in the period then ended and the period October 31, 2012 (commencement of operations) to December 31, 2012. These financial statements and financial highlights are the responsibility of the Funds’ management. Our responsibility is to express an opinion on these financial statements and financial highlights based on our audits.
We conducted our audits in accordance with the standards of the Public Company Accounting Oversight Board (United States). Those standards require that we plan and perform the audit to obtain reasonable assurance about whether the financial statements and financial highlights are free of material misstatement. The Funds are not required to have, nor were we engaged to perform, an audit of their internal controls over financial reporting. Our audits included consideration of internal control over financial reporting as a basis for designing audit procedures that are appropriate in the circumstances, but not for the purpose of expressing an opinion on the effectiveness of the Funds’ internal control over financial reporting. Accordingly, we express no such opinion. An audit includes examining, on a test basis, evidence supporting the amounts and disclosures in the financial statements. Our procedures included confirmation of securities owned as of December 31, 2016, by correspondence with the custodian. An audit also includes assessing the accounting principles used and significant estimates made by management, as well as evaluating the overall financial statement presentation. We believe that our audits provide a reasonable basis for our opinion.
In our opinion, the financial statements and financial highlights referred to above present fairly, in all material respects, the financial position of the Congress Large Cap Growth Fund, Congress Mid Cap Growth Fund, and Congress All Cap Opportunity Fund as of December 31, 2016, the results of their operations for the year then ended, and the changes in their net assets for each of the two years in the period then ended and their financial highlights for the periods referred to above, in conformity with accounting principles generally accepted in the United States of America.
TAIT, WELLER & BAKER LLP
Philadelphia, Pennsylvania
March 1, 2017
CONGRESS FUNDS
| EXPENSE EXAMPLES For the Six Months Ended December 31, 2016 (Unaudited) |
As a shareholder of the Congress Large Cap Growth Fund, the Congress Mid Cap Growth Fund, and the Congress All Cap Opportunity Fund (the “Funds”), you incur two types of costs: (1) transaction costs and (2) ongoing costs, including investment advisory fees, distribution and/or service fees and other Fund expenses. These examples are intended to help you understand your ongoing costs (in dollars) of investing in the Funds and to compare these costs with the ongoing costs of investing in other mutual funds. The examples are based on an investment of $1,000 invested at the beginning of the period and held for the entire period (7/1/16 – 12/31/16).
Actual Expenses
The first line of the table below provides information about actual account values based on actual returns and actual expenses. Although the Funds charge no sales load or transaction fees, you will be assessed fees for outgoing wire transfers, returned checks and stop payment orders at prevailing rates charged by U.S. Bancorp Fund Services, LLC, the Funds’ transfer agent. If you request that a redemption be made by wire transfer a $15.00 fee is currently charged by the Funds’ transfer agent. An Individual Retirement Account will be charged a $15.00 annual maintenance fee. To the extent the Funds invest in shares of other investment companies as part of their investment strategy, you will indirectly bear your proportionate share of any fees and expenses charged by the underlying funds in which the Funds invest in addition to the expenses of the Funds. Actual expenses of the underlying funds are expected to vary among the various underlying funds. These expenses are not included in the example below. The examples below include, but are not limited to, investment advisory fees, fund accounting fees, custody fees, and transfer agent fees. However, the examples below do not include portfolio trading commissions and related expenses. You may use the information in the examples, together with the amount you invested, to estimate the expenses that you paid over the period. Simply divide your account value by $1,000 (for example, an $8,600 account value divided by $1,000 = 8.6), then multiply the result by the number in the first line under the heading titled, “Expenses Paid During the Period’’ to estimate the expenses you paid on your account during this period.
Hypothetical Example for Comparison Purposes
The second line of the table below provides information about hypothetical account values and hypothetical expenses based on the Funds’ actual expense ratios and an assumed rate of return of 5% per year before expenses, which are not the Funds’ actual returns. The hypothetical account values and expenses may not be used to estimate the actual ending account balances or expenses you paid for the period. You may use this information to compare the ongoing costs of investing in the Funds and other funds. To do so, compare these 5% hypothetical examples with the 5% hypothetical examples that appear in the shareholder reports of the other funds. Please note that the expenses shown in the table are meant to highlight your ongoing costs only and do not reflect any transactional costs. Therefore, the second line of the table is useful in comparing ongoing costs only, and will not help you determine the relative total costs of owning different funds. In addition, if these transactional costs were included, your costs would have been higher.
CONGRESS FUNDS
| EXPENSE EXAMPLES For the Six Months Ended December 31, 2016 (Unaudited) (Continued) |
| Congress Large Cap Growth Fund | |
| | | Beginning | | | Ending | | | Expenses Paid | |
| | | Account Value | | | Account Value | | | During the Period | |
| | | 7/1/16 | | | 12/31/16 | | | 7/1/16 – 12/31/16 | |
| Retail Class Actual | | $ | 1,000.00 | | | $ | 1,035.60 | | | $ | 5.12 | (1) |
| Retail Class Hypothetical | | | | | | | | | | | | |
| (5% return before expenses) | | $ | 1,000.00 | | | $ | 1,020.11 | | | $ | 5.08 | (1) |
| | | | | | | | | | | | | |
| Institutional Class Actual | | $ | 1,000.00 | | | $ | 1,036.80 | | | $ | 3.84 | (2) |
| Institutional Class Hypothetical | | | | | | | | | | | | |
| (5% return before expenses) | | $ | 1,000.00 | | | $ | 1,021.37 | | | $ | 3.81 | (2) |
| | |
| Congress Mid Cap Growth Fund | |
| | | Beginning | | | Ending | | | Expenses Paid | |
| | | Account Value | | | Account Value | | | During the Period | |
| | | 7/1/16 | | | 12/31/16 | | | 7/1/16 – 12/31/16 | |
| Retail Class Actual | | $ | 1,000.00 | | | $ | 1,057.10 | | | $ | 5.17 | (1) |
| Retail Class Hypothetical | | | | | | | | | | | | |
| (5% return before expenses) | | $ | 1,000.00 | | | $ | 1,020.11 | | | $ | 5.08 | (1) |
| | | | | | | | | | | | | |
| Institutional Class Actual | | $ | 1,000.00 | | | $ | 1,058.60 | | | $ | 3.88 | (2) |
| Institutional Class Hypothetical | | | | | | | | | | | | |
| (5% return before expenses) | | $ | 1,000.00 | | | $ | 1,021.37 | | | $ | 3.81 | (2) |
| | |
| Congress All Cap Opportunity Fund | |
| | | Beginning | | | Ending | | | Expenses Paid | |
| | | Account Value | | | Account Value | | | During the Period | |
| | | 7/1/16 | | | 12/31/16 | | | 7/1/16 – 12/31/16 | |
| Retail Class Actual | | $ | 1,000.00 | | | $ | 1,118.00 | | | $ | 5.32 | (1) |
| Retail Class Hypothetical | | | | | | | | | | | | |
| (5% return before expenses) | | $ | 1,000.00 | | | $ | 1,020.11 | | | $ | 5.08 | (1) |
| | | | | | | | | | | | | |
| Institutional Class Actual | | $ | 1,000.00 | | | $ | 1,119.70 | | | $ | 4.00 | (2) |
| Institutional Class Hypothetical | | | | | | | | | | | | |
| (5% return before expenses) | | $ | 1,000.00 | | | $ | 1,021.37 | | | $ | 3.81 | (2) |
| (1) | Expenses are equal to the Class’ annualized expense ratio for the most recent six-month period of 1.00% (reflecting fee waivers in effect and expenses absorbed) multiplied by the average account value over the period multiplied by 184/366 (to reflect the one-half year period). |
| (2) | Expenses are equal to the Class’ annualized expense ratio for the most recent six-month period of 0.75% (reflecting fee waivers in effect and expenses absorbed) multiplied by the average account value over the period multiplied by 184/366 (to reflect the one-half year period). |
CONGRESS FUNDS
| APPROVAL OF INVESTMENT ADVISORY AGREEMENT (Unaudited) |
At a meeting held on August 8, 2016, the Board (which is comprised of five persons, all of whom are Independent Trustees as defined under the Investment Company Act) considered and approved the continuance of the Investment Advisory Agreement (the “Advisory Agreement”) between Professionally Managed Portfolios (the “Trust”) and Congress Asset Management Company, LLP (the “Advisor”) for the Congress Large Cap Growth Fund, Congress Mid Cap Growth Fund, and Congress All Cap Opportunity Fund (each a “Fund,” and together, the “Funds”). At this meeting and at a prior meeting held on May 23, 2016, the Board received and reviewed substantial information regarding the Funds, the Advisor and the services provided by the Advisor to the Funds under the Advisory Agreement. This information, together with the information provided to the Board throughout the course of the year, formed the primary (but not exclusive) basis for the Board’s determinations. Below is a summary of the factors considered by the Board and the conclusions that formed the basis for the Board’s approval of the continuance of the Advisory Agreement:
| | 1. | The nature, extent and quality of the services provided and to be provided by the Advisor under the Advisory Agreement. The Trustees considered the nature, extent and quality of the Advisor’s overall services provided to the Funds as well as its specific responsibilities in all aspects of day-to-day investment management of the Funds. The Board considered the qualifications, experience and responsibilities of the portfolio managers, as well as the responsibilities of other key personnel of the Advisor involved in the day-to-day activities of the Funds. The Board also considered the resources and compliance structure of the Advisor, including information regarding its compliance program, its chief compliance officer and the Advisor’s compliance record, and the Advisor’s disaster recovery/business continuity plan. The Board also considered the prior relationship between the Advisor and the Trust, as well as the Board’s knowledge of the Advisor’s operations, and noted that during the course of the prior year they had met with the Advisor in person to discuss fund performance and investment outlook, as well as, various marketing and compliance topics, including the Advisor’s risk management process. The Board concluded that the Advisor had the quality and depth of personnel, resources, investment methods and compliance policies and procedures essential to performing its duties under the Advisory Agreement and that the nature, overall quality and extent of such management services are satisfactory. |
CONGRESS FUNDS
| APPROVAL OF INVESTMENT ADVISORY AGREEMENT (Unaudited) (Continued) |
| | 2. | The Funds’ historical performance and the overall performance of the Advisor. In assessing the quality of the portfolio management delivered by the Advisor, the Board reviewed the short-term and long-term performance of each Fund on both an absolute basis, and in comparison to its peer funds utilizing Morningstar classifications and appropriate securities benchmarks. While the Board considered both short-term and long-term performance, it placed greater emphasis on longer term performance. When reviewing each Fund’s performance against its comparative peer group universe, the Board took into account that the investment objective and strategies of each Fund as well as its level of risk tolerance, may differ significantly from funds in the peer universe. |
| | | |
| | | For the Congress Large Cap Growth Fund, the Board noted that the Fund outperformed its peer group median for the year-to-date and one-year periods, underperformed its peer group median for the three-year period, and performed at the median for the five-year period, ended March 31, 2016. The Board also considered the Fund’s underperformance compared to the Advisor’s other similarly managed accounts for the one-year, three-year and five-year periods ended March 31, 2016, and the reasons given by the Advisor for that difference in performance. The Board also considered the performance of the Congress Large Cap Growth Fund against its broad-based securities market benchmark, noting it underperformed its benchmark for the one-year, three-year and five-year periods ended March 31, 2016. |
| | | |
| | | For the Congress Mid Cap Growth Fund, the Board noted that the Fund outperformed its peer group median for the year-to-date, one-year and three-year periods ended March 31, 2016. The Board also considered the Fund’s underperformance compared to the Advisor’s other similarly managed accounts for the one-year and three-year periods ended March 31, 2016, and the reasons given by the Advisor for that underperformance. The Board also considered the outperformance of the Fund against its broad-based securities market benchmark for the one-year and three-year periods ended March 31, 2016. |
| | | |
| | | For the Congress All Cap Opportunity Fund, the Board noted that the Fund outperformed its peer group median for the year-to-date and one-year periods and underperformed its peer group median for the three-year period ended March 31, 2016. The Board also noted that the Fund outperformed the Advisor’s other similarly managed accounts for the |
CONGRESS FUNDS
| APPROVAL OF INVESTMENT ADVISORY AGREEMENT (Unaudited) (Continued) |
| | | one-year period and underperformed the Advisor’s other similarly managed accounts for the three-year period ended March 31, 2016, and the Board considered the reasons given by the Advisor for that underperformance. The Board also considered the Fund’s underperformance against its broad-based securities market benchmark for the one-year and three-year periods ended March 31, 2016. |
| | | |
| | 3. | The costs of the services provided by the Advisor and the structure of the Advisor’s fees under the Advisory Agreement. In considering the advisory fee and total fees and expenses of each Fund, the Board reviewed comparisons to the peer funds and similarly managed separate accounts for other types of clients advised by the Advisor, as well as all expense waivers and reimbursements. When reviewing fees charged to other similarly managed accounts, the Board took into consideration the type of account and the differences in the management of that account that might be germane to the difference, if any, in the fees charged to such accounts. The Trustees noted that the fees charged to each Fund as compared to the fees charged by the Advisor to its similarly managed separate account clients differed due to a number of factors. |
| | | |
| | | For the Congress Large Cap Growth Fund, the Board noted that the Advisor had contractually agreed to maintain an annual expense ratio of 1.00% for the Fund’s Retail Class shares and 0.75% for its Institutional Class shares (the “Expense Caps”). The Board noted that the Fund’s advisory fee and net expense ratio (less Rule 12b-1 fees) were among the lowest of its peer group median and average. The Board concluded that the fees paid to the Advisor were fair and reasonable in light of the comparative performance and advisory fee information. |
| | | |
| | | For the Congress Mid Cap Growth Fund, the Board noted that the Advisor had contractually agreed to maintain an annual expense ratio of 1.00% for the Fund’s Retail Class shares and 0.75% for its Institutional Class shares (the “Expense Caps”). The Board noted that the Fund’s advisory fee and net expense ratio (less Rule 12b-1 fees) were among the lowest its peer group median and average. The Board concluded that the fees paid to the Advisor were fair and reasonable in light of the comparative performance and advisory fee information. |
| | | |
| | | For the Congress All Cap Opportunity Fund, the Board noted that the Advisor had contractually agreed to maintain an annual expense ratio of 1.00% for the Fund’s Retail Class shares and 0.75% for its Institutional Class shares (the “Expense Caps”). The Board noted that the Fund’s |
CONGRESS FUNDS
| APPROVAL OF INVESTMENT ADVISORY AGREEMENT (Unaudited) (Continued) |
| | | advisory fee and net expense ratio (less Rule 12b-1 fees) were among the lowest of its peer group median and average. The Board concluded that the fees paid to the Advisor were fair and reasonable in light of the comparative performance and advisory fee information. |
| | | |
| | 4. | Economies of Scale. The Board also considered whether economies of scale were being realized by the Advisor that should be shared with shareholders. The Board noted that the Advisor has contractually agreed to reduce its advisory fees or reimburse Fund expenses so that each Fund does not exceed its specified Expense Caps. The Board noted that at current asset levels, it did not appear that there were additional significant economies of scale being realized by the Advisor that should be shared with shareholders and concluded that it would continue to monitor economies of scale in the future as circumstances changed and assuming asset levels continued to increase. |
| | | |
| | 5. | The profits to be realized by the Advisor and its affiliates from their relationship with the Funds. The Board reviewed the Advisor’s financial information and took into account both the direct benefits and the indirect benefits to the Advisor from advising the Funds. The Board considered the profitability to the Advisor from its relationship with the Funds. The Board considered any additional benefits derived by the Advisor from its relationship with the Funds, particularly benefits received in exchange for “soft dollars” and Rule 12b-1 fees paid to the Advisor. The Board also reviewed information regarding fee offsets for separate accounts invested in the Funds and determined that the Advisor was not receiving an advisory fee both at the separate account and at the Fund level for these accounts, and as a result was not receiving additional fall-out benefits from these relationships. After such review, the Board determined that the profitability to the Advisor with respect to the Advisory Agreement was not excessive, and that the Advisor had maintained adequate profit levels to support the services it provides to the Funds. |
No single factor was determinative of the Board’s decision to approve the continuance of the Advisory Agreement, but rather the Board based its determination on the total combination of information available to them. Based on a consideration of all the factors in their totality, the Board determined that the advisory arrangements with the Advisor, including each Fund’s advisory fee, were fair and reasonable. The Board therefore determined that the continuance of the Advisory Agreement would be in the best interests of the Funds and their shareholders.
CONGRESS FUNDS
| TRUSTEES AND EXECUTIVE OFFICERS |
The Board is responsible for the overall management of the Trust, including general supervision and review of the investment activities of the Fund. The Board, in turn, elects the officers of the Trust, who are responsible for the day-to-day operations of the Trust and its separate series. The current Trustees and executive officers of the Trust, their birth dates, positions with the Trust, terms of office with the Trust and length of time served, their principal occupations during the past five years and other directorships are set forth in the table below.
| | | Term of | | Number of | |
| | | Office | | Portfolios | Other |
| | | and | | in Fund | Directorships |
| | Positions | Length | | Complex(2) | Held |
| Name, Address | with the | of Time | Principal Occupation | Overseen | During Past |
And Age | Trust(1) | Served | During Past Five Years | by Trustees | Five Years |
| |
Independent Trustees of the Trust(1) |
| | | | | | |
| Dorothy A. Berry | Chairman | Indefinite | Formerly, President, | 3 | Director, PNC |
| (born 1943) | and | Term; | Talon Industries, Inc. | | Funds, Inc. |
| c/o U.S. Bancorp | Trustee | Since | (business consulting); | | |
| Fund Services, LLC | | May | formerly, Executive | | |
| 2020 E. Financial Way | | 1991. | Vice President and Chief | | |
| Suite 100 | | | Operating Officer, | | |
| Glendora, CA 91741 | | | Integrated Asset | | |
| | | | Management (investment | | |
| | | | adviser and manager) and | | |
| | | | formerly, President, Value | | |
| | | | Line, Inc. (investment | | |
| | | | advisory and financial | | |
| | | | publishing firm). | | |
| | | | | | |
| Wallace L. Cook | Trustee | Indefinite | Investment Consultant; | 3 | The Dana |
| (born 1939) | | Term; | formerly, Chief Executive | | Foundation. |
| c/o U.S. Bancorp | | Since | Officer, Rockefeller Trust | | |
| Fund Services, LLC | | May | Co., (prior thereto Senior | | |
| 2020 E. Financial Way | | 1991. | Vice President), and | | |
| Suite 100 | | | Managing Director, | | |
| Glendora, CA 91741 | | | Rockefeller & Co. | | |
| | | | (Investment Manager | | |
| | | | and Financial Advisor); | | |
| | | | formerly, Senior Vice | | |
| | | | President, Norton Simon, Inc. | | |
| | | | (international consumer | | |
| | | | products conglomerate.) | | |
CONGRESS FUNDS
| TRUSTEES AND EXECUTIVE OFFICERS (Continued) |
| | | Term of | | Number of | |
| | | Office | | Portfolios | Other |
| | | and | | in Fund | Directorships |
| | Positions | Length | | Complex(2) | Held |
| Name, Address | with the | of Time | Principal Occupation | Overseen | During Past |
And Age | Trust(1) | Served | During Past Five Years | by Trustees | Five Years |
| | | | | | |
| Eric W. Falkeis | Trustee | Indefinite | Chief Operating Officer, | 3 | Interested |
| (born 1973) | | Term; | Direxion Funds since 2013; | | Trustee, |
| c/o U.S. Bancorp | | Since | formerly, Senior Vice | | Direxion |
| Fund Services, LLC | | September | President and Chief | | Funds, |
| 2020 E. Financial Way | | 2011. | Financial Officer (and other | | Direxion ETF |
| Suite 100 | | | positions), U.S. Bancorp | | Trust and |
| Glendora, CA 91741 | | | Fund Services, LLC | | Direxion |
| | | | 1997-2013. | | Variable |
| | | | | | Trust. |
| | | | | | |
| Carl A. Froebel | Trustee | Indefinite | Formerly, President and | 3 | None. |
| (born 1938) | | Term; | Founder, National Investor | | |
| c/o U.S. Bancorp | | Since | Data Services, Inc. | | |
| Fund Services, LLC | | May | (investment related | | |
| 2020 E. Financial Way | | 1991. | computer software). | | |
| Suite 100 | | | | | |
| Glendora, CA 91741 | | | | | |
| | | | | | |
| Steven J. Paggioli | Trustee | Indefinite | Consultant, since July | 3 | Independent |
| (born 1950) | | Term; | 2001; formerly, Executive | | Trustee, |
| c/o U.S. Bancorp | | Since | Vice President, Investment | | AMG Funds; |
| Fund Services, LLC | | May | Company Administration, | | Advisory |
| 2020 E. Financial Way | | 1991. | LLC (mutual fund | | Board |
| Suite 100 | | | administrator). | | Member, |
| Glendora, CA 91741 | | | | | Sustainable |
| | | | | | Growth |
| | | | | | Advisers, LP; |
| | | | | | Independent |
| | | | | | Director, |
| | | | | | Chase |
| | | | | | Investment |
| | | | | | Counsel. |
| |
| Officers of the Trust |
| | | | | | |
| Elaine E. Richards | President | Indefinite | Vice President and | Not | Not |
| (born 1968) | | Term; | Legal Compliance | Applicable. | Applicable. |
| c/o U.S. Bancorp | | Since | Officer, U.S. Bancorp | | |
| Fund Services, LLC | | March | Fund Services, LLC, | | |
| 2020 E. Financial Way | | 2013. | since July 2007. | | |
| Suite 100 | Secretary | Indefinite | | | |
| Glendora, CA 91741 | | Term; | | | |
| | | Since | | | |
| | | February | | | |
| | | 2008. | | | |
CONGRESS FUNDS
| TRUSTEES AND EXECUTIVE OFFICERS (Continued) |
| | Positions | Length | | Complex(2) | Held |
| Name, Address | with the | of Time | Principal Occupation | Overseen | During Past |
And Age | Trust(1) | Served | During Past Five Years | by Trustees | Five Years |
| | | | | | |
| Aaron J. Perkovich | Treasurer | Indefinite | Vice President, U.S. | Not | Not |
| (born 1973) | | Term; | Bancorp Fund Services, | Applicable. | Applicable. |
| c/o U.S. Bancorp | | Since | LLC, since June 2006. | | |
| Fund Services, LLC | | August | | | |
| 615 East Michigan St. | | 2016. | | | |
| Milwaukee, WI 53202 | | | | | |
| | | | | | |
| Melissa Breitzman | Assistant | Indefinite | Assistant Vice President, | Not | Not |
| (born 1983) | Treasurer | Term; | U.S. Bancorp Fund | Applicable. | Applicable. |
| c/o U.S. Bancorp | | Since | Services, LLC since | | |
| Fund Services, LLC | | August | June 2005. | | |
| 615 East Michigan St. | | 2016. | | | |
| Milwaukee, WI 53202 | | | | | |
| | | | | | |
| Craig Benton | Assistant | Indefinite | Assistant Vice President, | Not | Not |
| (born 1985) | Treasurer | Term; | U.S. Bancorp Fund | Applicable. | Applicable. |
| c/o U.S. Bancorp | | Since | Services, LLC since | | |
| Fund Services, LLC | | August | November 2007. | | |
| 615 East Michigan St. | | 2016. | | | |
| Milwaukee, WI 53202 | | | | | |
| | | | | | |
| Donna Barrette | Chief | Indefinite | Senior Vice President | Not | Not |
| (born 1966) | Compli- | Term; | and Compliance Officer, | Applicable. | Applicable. |
| c/o U.S. Bancorp | ance | Since | U.S. Bancorp Fund | | |
| Fund Services, LLC | Officer | July | Services, LLC since | | |
| 615 East Michigan St. | | 2011. | August 2004. | | |
| Milwaukee, WI | Anti- | Indefinite | | | |
| 53202 | Money | Term; | | | |
| | Laun- | Since | | | |
| | dering | July | | | |
| | Officer | 2011. | | | |
| | Vice | Indefinite | | | |
| | President | Term; | | | |
| | | Since | | | |
| | | July 2011. | | | |
| (1) | All Trustees of the Trust are not “interested persons” of the Trust as defined under the 1940 Act (“Independent Trustees”) |
| (2) | The Trust is comprised of numerous series managed by unaffiliated investment advisers. The term “Fund Complex” applies only to the Funds. The Funds do not hold themselves out as related to any other series within the Trust for purposes of investment and investor services, nor do they share the same investment advisor with any other series. |
CONGRESS FUNDS
| QUALIFIED DIVIDEND INCOME, DIVIDENDS RECEIVED DEDUCTION (Unaudited) |
For the fiscal year ended December 31, 2016, certain dividends paid by the Funds may be subject to a maximum tax rate of 23.8%, as provided for by the American Taxpayer Relief Act of 2012. The percentage of dividends declared from ordinary income designated as qualified dividend income was as follows:
| | Congress Large Cap Growth Fund | 100.00% |
| | Congress Mid Cap Growth Fund | 100.00% |
| | Congress All Cap Opportunity Fund | 100.00% |
For corporate shareholders, the percent of ordinary income distributions qualifying for the corporate dividends received deduction was as follows:
| | Congress Large Cap Growth Fund | 100.00% |
| | Congress Mid Cap Growth Fund | 100.00% |
| | Congress All Cap Opportunity Fund | 100.00% |
The percentage of taxable ordinary income distributions that are designated as short-term capital gain distributions under Internal Revenue Section 871(K)(2)(C) for the Funds were as follows:
| | Congress Large Cap Growth Fund | 0.00% |
| | Congress Mid Cap Growth Fund | 0.00% |
| | Congress All Cap Opportunity Fund | 0.00% |
| INFORMATION ABOUT PROXY VOTING (Unaudited) |
A description of the policies and procedures that the Funds use to determine how to vote proxies relating to portfolio securities is available without charge, upon request, by calling (888) 688-1299. Furthermore, you can obtain the description on the SEC’s website at www.sec.gov.
Information regarding how the Funds voted proxies relating to portfolio securities during the most recent 12-months ended June 30 is available without charge, upon request, by calling (888) 688-1299. Furthermore, you can obtain the Funds’ proxy voting records on the SEC’s website at www.sec.gov.
CONGRESS FUNDS
| INFORMATION ABOUT THE PORTFOLIO HOLDINGS (Unaudited) |
The Funds file their complete schedule of portfolio holdings for their first and third fiscal quarters with the SEC on Form N-Q. The Funds’ Form N-Q is available without charge, upon request, by calling (888) 688-1299. Furthermore, you can obtain the Form N-Q on the SEC’s website at www.sec.gov. The Funds’ Form N-Q may be reviewed and copied at the SEC’s Public Reference Room in Washington D.C. Information on the operation of the Public Reference Room may be obtained by calling 1-800-SEC-0330.
| INFORMATION ABOUT HOUSEHOLDING (Unaudited) |
To reduce expenses, we may mail only one copy of the Funds’ prospectuses and annual and semi-annual reports to those addresses shared by two or more accounts. If you wish to receive individual copies of these documents, please call us at (888) 688-1299 (or contact your financial institution). We will begin sending you individual copies thirty days after receiving your request.
| INFORMATION ABOUT THE FUNDS’ TRUSTEES (Unaudited) |
The Statement of Additional Information (“SAI”) includes additional information about the Funds’ Trustees and is available without charge, upon request, by calling (888) 688-1299. Furthermore, you can obtain the SAI on the SEC’s website www.sec.gov or the Funds’ website www.congressasset.com.
(This Page Intentionally Left Blank.)
CONGRESS FUNDS
The Funds collect non-public personal information about you from the following sources:
| | • | Information we receive about you on applications or other forms; |
| | • | Information you give us verbally; and/or |
| | • | Information about your transactions with us or others. |
We do not disclose any non-public personal information about our shareholders or former shareholders without the shareholder’s authorization, except as permitted by law or in response to inquiries from governmental authorities. We may share information with affiliated parties and unaffiliated third parties with whom we have contracts for servicing the Funds. We will provide unaffiliated third parties with only the information necessary to carry out their assigned responsibilities. All shareholder records will be disposed of in accordance with applicable law. We maintain physical, electronic and procedural safeguards to protect your non-public personal information and require third parties to treat your non-public personal information with the same high degree of confidentiality.
In the event that you hold shares of the Funds through a financial intermediary, including, but not limited to, a broker-dealer, bank or trust company, the privacy policy of your financial intermediary would govern how your non-public personal information would be shared with unaffiliated third parties.
This page is not a part of the Annual Report.
AdvisorCONGRESS ASSET MANAGEMENT COMPANY
2 Seaport Lane
Boston, Massachusetts 02210
Distributor
QUASAR DISTRIBUTORS, LLC
777 East Wisconsin Avenue
Milwaukee, Wisconsin 53202
Custodian
U.S. BANK NA
Custody Operations
1555 N. RiverCenter Drive, Suite 302
Milwaukee, Wisconsin 53212
Transfer Agent, Fund Accountant and Fund Administrator
U.S. BANCORP FUND SERVICES, LLC
615 East Michigan Street
Milwaukee, Wisconsin 53202
Independent Registered Public Accounting Firm
TAIT, WELLER & BAKER LLP
1818 Market Street, Suite 2400
Philadelphia, Pennsylvania 19103
Legal Counsel
SCHIFF HARDIN LLP
666 Fifth Avenue, Suite 1700
New York, New York 10103
| Congress Large Cap Growth Fund |
| Retail Class | Institutional Class |
| Symbol – CAMLX | Symbol – CMLIX |
| CUSIP – 742935216 | CUSIP – 74316J789 |
| Congress Mid Cap Growth Fund |
| Retail Class | Institutional Class |
| Symbol – CMIDX | Symbol – IMIDX |
| CUSIP – 74316J466 | CUSIP – 74316J458 |
| Congress All Cap Opportunity Fund |
| Retail Class | Institutional Class |
| Symbol – CACOX | Symbol – IACOX |
| CUSIP – 74316J482 | CUSIP – 74316J474 |