UNITED STATES
SECURITIES AND EXCHANGE COMMISSION
Washington, D.C. 20549
FORM N-CSR
CERTIFIED SHAREHOLDER REPORT OF REGISTERED
MANAGEMENT INVESTMENT COMPANIES
Investment Company Act file number (811-05037)
Professionally Managed Portfolios
(Exact name of registrant as specified in charter)
615 East Michigan Street
Milwaukee, WI 53202
(Address of principal executive offices) (Zip code)
Jason Hadler
Professionally Managed Portfolios
c/o U.S. Bank Global Fund Services
777 E. Wisconsin Avenue
Milwaukee, WI 53202
(Name and address of agent for service)
(414) 765-4324
Registrant's telephone number, including area code
Date of fiscal year end: September 30
Date of reporting period: March 31, 2022
Item 1. Reports to Stockholders.
BOSTON COMMON
ESG IMPACT EMERGING MARKETS FUND
(BCEMX)
BOSTON COMMON
ESG IMPACT INTERNATIONAL FUND
(BCAIX)
BOSTON COMMON
ESG IMPACT U.S. EQUITY FUND
(BCAMX)
SEMI-ANNUAL REPORT
March 31, 2022
Table of Contents
| Message from the Adviser | 1 |
| Boston Common ESG Impact Emerging Markets Fund | |
| Investment Outlook | 5 |
| Management’s Discussion of Fund Performance | 7 |
| Country Allocation | 9 |
| Schedule of Investments | 10 |
| Boston Common ESG Impact International Fund | |
| Investment Outlook | 12 |
| Management’s Discussion of Fund Performance | 14 |
| Country Allocation | 16 |
| Schedule of Investments | 17 |
| Boston Common ESG Impact U.S. Equity Fund | |
| Investment Outlook | 19 |
| Management’s Discussion of Fund Performance | 21 |
| Sector Allocation | 23 |
| Schedule of Investments | 24 |
| Statements of Assets and Liabilities | 26 |
| Statements of Operations | 27 |
| Statements of Changes in Net Assets | 28 |
| Financial Highlights | 31 |
| Notes to Financial Statements | 34 |
| Expense Examples | 45 |
| Additional Information | 47 |
| Privacy Notice | Inside Back Cover |
BOSTON COMMON ESG IMPACT FUNDS
Message from the Adviser
Dear Fellow Investors,
The world’s economic outlook has been altered by Russia’s invasion of Ukraine. The war and the ensuing coordinated sanctions have introduced new cross currents to the global economy just as many nations were emerging from the turmoil of the pandemic. These developments have dented investor sentiment and exacerbated inflationary pressures in recent weeks.
The current conflict has underlined the urgent need to address and reduce global dependence on fossil fuels. While increasing supply from renewable energy sources remains the long-term goal, we can embrace demand reduction as the other energy solution critical to energy independence. At Boston Common Asset Management (“Boston Common”), we maintain our focus on companies that provide solutions to cut energy waste, increase renewable energy use, raise energy efficiency, and offer new models for energy productivity.
Sustainable investors can finance a post-Ukraine economy by providing patient capital paired with an impatient voice for change. Hundreds of net-zero carbon commitments, big and small, have been made, but those plans often have multi-decade timelines. Recent events have once again shown that depending on countries with repressive regimes lacking internal accountability poses a high risk to investors and citizens alike. There is now a geopolitically driven urgency to pivot immediately- to cut energy demand in pursuit of energy independence.
Since 2015, Boston Common has engaged companies on the topic of Eco-Efficiency by addressing demand reduction in both energy and water use as well as the development of circular economy principles to eliminate waste. We encourage you to read further for examples of our engagement activities.
As current events play out, we may take additional tactical steps towards a more defensive posture in our shorter-term outlook. We continue to monitor signals for either the endgame to the Russian war or signs of market confidence in the Federal Reserve’s (the “Feds”) actions on inflation. For the longer term, the favorable pre-invasion expectations that were the basis for our “barbell” investment stance are still present: investment spending driven by sustainability and productivity goals, record low unemployment, and the reversal of pandemic-driven disruptions.
Thank you for your interest and investment in the Boston Common ESG Impact Funds and for your continued support as we strive to achieve sustainable financial returns and social change.
 |  |
| Geeta Aiyer | Matt Zalosh |
| President & Founder | Chief Investment Officer |
| | International Strategies |
BOSTON COMMON ESG IMPACT FUNDS
Fund Shareowner Engagement
Below, we showcase examples of how our shareowner voice can add value through targeted company and industry engagement and dialogue efforts.
Update: Proxy Season 2022
Voting proxies remains one of the key ways that shareowners can voice their opinions and provide feedback to management. But there is more to the process than a vote. Boston Common regularly highlights issue areas on which to engage with companies – looking for constructive dialogue.
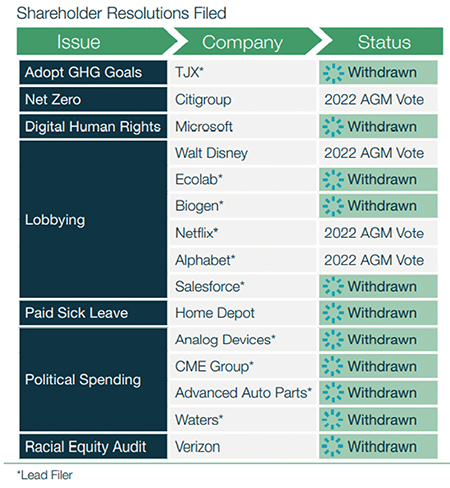
A specific focus this year was corporate political activities. Boston Common filed 10 resolutions focused on this area since the insurrection of January 6th, 2021. This year, we were successful on several fronts, withdrawing our proxy initiatives after having productive conversations with company managements. Some examples include:
Net Zero/Climate
| | • | Booking Holdings released its first Climate Action Plan, a key step for a global online travel company – which includes a near-zero emissions target for its operations by 2030 and net zero by 2040. |
Lobbying and Political Contributions
| | • | Salesforce improved its disclosure on lobbying oversight and contributions to trade associations. |
| | | |
| | • | Biogen committed to expand its disclosure on lobbying activities outside the U.S., including the European Union (the “E.U.”). |
| | | |
| | • | Analog Devices updated its political contributions and lobbying policy including detailed disclosure on their current ban on direct political contributions, public policy positions, recent lobbying activity, and oversight. |
| | | |
| | • | CME Group will expand lobbying disclosure and post an overview to its website in early 2022. |
BOSTON COMMON ESG IMPACT FUNDS
Racial and Employee Equity
| | • | Home Depot agreed to put policies in place to offer paid sick leave and has committed to make this publicly accessible. |
| | | |
| | • | Verizon agreed to conduct a third-party racial equity audit, publicly release its findings, and provide updates on its progress. |
Digital Human Rights
| | • | Microsoft will commission an independent human rights assessment report. The report is intended to identify, understand, assess, and address actual or potential adverse human rights impacts of Microsoft’s products & services and business relationships on rights-holders. |
Engaging for Net Zero
As part of Boston Common’s commitment under the Net Zero Asset Managers (NZAM) initiative, we will engage key holdings and improve our portfolios’ financed emissions over time. We are prioritizing engaging portfolio companies that have not established targets and may also engage those with insufficient targets that are not aligned with Net Zero or a 1.5°C by 2050 trajectory.
Some initial engagement with portfolio companies include:
| | • | Magna International agreed to set science-based targets and is mapping Scope 3 emissions. As a result of our dialogue, Magna posted its Carbon Disclosure Project report to allow for greater transparency on its approach to climate change. |
| | | |
| | • | Mohawk hired a head of sustainability and is considering forming an executive Environmental, Social and Governance (“ESG”) committee. |
| | | |
| | • | Steel Dynamics has set goals to reduce carbon emissions and increase renewable energy use for its steel mills. |
| | | |
| | • | Orix established an ESG committee at the board level and disclosed four environmental goals, including the reduction of greenhouse gas (GHG) emissions. |
| | | |
| | • | D.S. Smith adopted Net Zero and science-based targets by 2030. In 2022, D.S. Smith will link executive bonuses to ESG metrics. |
| | | |
| | • | Xinyi Solar took a variety of steps to track and report key ESG metrics and increase resource efficiency. Xinyi promotes use of renewables, green procurement principles, and has engaged stakeholders through materiality processes. |
Additional highlights of Boston Common engagement activity over the last six months include:
| | • | Alibaba is developing a company-wide human rights policy, recently established a board-level sustainability committee, and announced new climate targets. |
BOSTON COMMON ESG IMPACT FUNDS
| | • | Unilever will measure its product sales against major government-endorsed Nutrient Profile Models and report on this data annually, a longstanding request of Boston Common through the Access to Nutrition Index. |
| | | |
| | • | Lloyds integrated sustainability objectives into its core business planning and is linking sustainability to variable compensation for leadership. |
| | | |
| | • | Yamaha is on track to meet its sustainable timber sourcing goal this year and plans to set more ambitious targets next year. Yamaha recently joined the 30% Club of Japan and signed the Women’s Empowerment Principles. |
| | | |
| | • | Shimano has taken positive steps in ESG disclosure, supply chain oversight, and board governance reforms. We recently engaged Shimano on prioritizing its focus on gender diversity after we voted against the board in 2021 on this issue. |
BOSTON COMMON ESG IMPACT EMERGING MARKETS FUND
Investment Outlook
As we entered 2022, the economic outlook for Emerging Markets (“EM”) looked promising: improving economic activity as pandemic disruptions eased, solid growth prospects from global trade and business investment, and stabilization of China economic activities. However, with the global supply shock caused by the Russian embargo and disruption of agricultural commodities, the risks of higher inflation and lower global growth have now risen due to soaring input costs and the negative effects on real incomes. Over the past few months, we adjusted the Boston Common ESG Impact Emerging Markets Fund’s (the “EM Fund”) portfolio to reflect growing uncertainty in the outlook for inflation and economic growth by reducing the overweight to Consumer Discretionary stocks while increasing the allocation to Telecommunication Services. The EM Fund continues to be overweight both Information Technology and Industrials, given our expectation of continued global business investment, but we offset this cyclicality with defensive positioning in Consumer Staples and Health Care.
Rising agricultural prices will weigh on food affordability, especially in low-income emerging economies, exacerbating the negative trend in income inequality observed since the pandemic. However, the negative supply shock is not felt evenly across regions. In fact, commodity exporters in Latin America stand to benefit. The EM Fund is overweight to this region and should benefit as investors start to recognize the attractive valuations and economic momentum driven by the commodity tailwinds. We are mindful of the near-term political risks as Brazil goes to the polls in October and a national constitutional rewriting process unfolds in Chile.
China’s focus on supporting its domestic economic growth agenda as well as maintaining integration within the global economy provide little incentive for the direct support - financial or military - of Russia’s war. The recent spike in COVID-19 cases has stalled the economic momentum we have been expecting. The country’s reopening will be a careful and gradual process amidst its prevailing zero-COVID policy, which adds additional risk to the disruption of global supply chains. In the meantime, monetary policy appears accommodative, while recent pronouncements signal a moderation of the previous year’s regulatory tightening stance. For the rest of Asia, we remain constructive on Southeast Asia, especially Indonesia, which is benefiting from rising commodity prices, strong foreign direct investments, and improving economic activities.
Our newer positions over the last six months include two holdings in China. The EM Fund added China Merchants Bank (“CMB”). With a strong presence in retail banking that provides low-cost deposits, a competitive advantage, CMB looks to grow in mortgages, credit cards, and microfinance. Leading Chinese
BOSTON COMMON ESG IMPACT EMERGING MARKETS FUND
auto parts manufacturer Minth Group is a supplier to the global auto makers. The company is transitioning its new materials and surface treatment technologies to include electric vehicles (“EV”) while also developing a battery casing product line.
In addition, the EM Fund added Chilean lithium miner SQM, whose lithium resources in the Atacama Desert are among the lowest cost globally, and Telkom Indonesia, a beneficiary of the expected growth in digital connectivity as only 15% of the country’s households have broadband.
BOSTON COMMON ESG IMPACT EMERGING MARKETS FUND
Management Discussion
Over the past six months ending March 31, 2022, the EM Fund declined -8.32%, in line with the MSCI Emerging Markets Index, which declined -8.20%.
Health Care was the top contributor to relative returns, supported by China TCM, a leading producer of traditional Chinese medicines and PT Kalbe Farma, the Indonesian pharmaceutical manufacturer and retailer. The EM Fund’s holdings in Financials added value as well. Bank holdings in Latin America, including Itau Unibanco in Brazil and Credicorp in Peru, as well as Indonesian microfinance lender Bank Rakyat, Thailand’s Kasikornbank, and China’s Bank of Communication all outperformed. Real Estate also contributed, led by Chinese real estate developer Longfor. Other notable contributors include Korean memory manufacturer SK Hynix, Chilean lithium producer SQM, IT outsourcing beneficiary Infosys, and South African healthcare retailer Clicks Group. The EM Fund has no exposure to conventional Energy, which also helped relative results.
Materials was the largest detractor overall. The EM Fund’s holding in EV battery maker LG Chemical lagged the traditional metals and mining stocks, which lifted the Materials sector especially following the escalation of Russia’s war in Ukraine. Information Technology also detracted from relative returns over the last six months. Chinasoft International, a leading software solutions provider, was pressured by a near-term spike in its cost structure despite experiencing strong revenue growth driven by cloud and AI. Digital payment company PagSeguro came under pressure as rising rates negatively impacted its funding costs. Other notable detractors include Chinese internet companies Alibaba and Trip.com, both of which suffered from regulatory woes. Regulatory concerns around China’s evolving internet policies as well as indirect exposure to Russia weighed on Naspers. We sold out of Yandex NV, the only Russian holding in the portfolio, as the Russian President’s rhetoric raised fears of a potential invasion.
We believe the long-term implications of both the pandemic and Russia’s war in Ukraine will increase the world’s resolve for energy independence and investment in alternative energy, digital transformation, supply chain investment, while supporting the reduction of social inequalities. While the near-term outcome of the geopolitical tension is uncertain, we continue to focus on companies that can provide solutions towards these long-term sustainability challenges. Trading at a 30% discount relative to Developed Markets, a 15-year low, we believe EM equities offer ample opportunities for long-term investors.
BOSTON COMMON ESG IMPACT EMERGING MARKETS FUND
Earnings growth is not representative of the future performance.
Past performance does not guarantee future results.
Must be preceded or accompanied by a current prospectus.
Mutual fund investing involves risk. Principal loss is possible. Investments in foreign securities involve political, economic and currency risks, greater volatility and differences in accounting methods. These risks are greater for investments in emerging markets. The Fund’s sustainability policy could cause it to perform differently compared to similar funds that do not have such a policy. This policy may result in the Fund foregoing opportunities to buy certain securities when it might otherwise be advantageous to do so, or selling securities for reasons when it might be otherwise is advantageous for it to do so. Unexpected events and their aftermaths, such as the spread of deadly diseases; natural, environmental or man-made disasters; financial, political or social disruptions; terrorism and war; and other tragedies or catastrophes, can cause investor fear and panic, which can adversely affect the economies of many companies, sectors, nations, regions and the market in general, in ways that cannot necessarily be foreseen.
Diversification does not assure a profit or protect against loss in a declining market.
Boston Common Asset Management, LLC is the adviser to the Fund, which is distributed by Quasar Distributors, LLC.
The opinions expressed are subject to change, are not guaranteed and should not be considered a recommendation to buy or sell any security.
Fund holdings and sector allocations are subject to change and should not be considered a recommendation to buy or sell any securities. Please refer to the Schedule of Investments included for additional information on securities held within the Boston Common ESG Impact Funds.
The MSCI EM Index is a float-adjusted market capitalization index that is designed to measure equity market performance in 27 global emerging markets.
BOSTON COMMON ESG IMPACT EMERGING MARKETS FUND
COUNTRY ALLOCATION at March 31, 2022 (Unaudited) |
Country | % of Net Assets1 |
| China | | | 29.4 | % | |
| Taiwan | | | 13.3 | % | |
| Republic of Korea | | | 10.5 | % | |
| India | | | 8.6 | % | |
| Brazil | | | 7.1 | % | |
| Indonesia | | | 6.6 | % | |
| South Africa | | | 5.3 | % | |
| Thailand | | | 4.3 | % | |
| Peru | | | 2.7 | % | |
| Hong Kong | | | 2.4 | % | |
| United Kingdom | | | 1.9 | % | |
| Chile | | | 1.7 | % | |
| Colombia | | | 1.3 | % | |
| Mexico | | | 1.0 | % | |
| Hungary | | | 0.9 | % | |
1 | Excludes short-term investments and other assets in excess of liabilities. |
BOSTON COMMON ESG IMPACT EMERGING MARKETS FUND
SCHEDULE OF INVESTMENTS at March 31, 2022 (Unaudited) |
| Shares | | | | Value | |
| COMMON STOCKS – 93.5% | | | |
| | | | |
| Communication Services – 6.7% | | | |
| | 59,410 | | Advanced Info | | | |
| | | | Service PCL | | $ | 416,317 | |
| | 10,426 | | SK Telecom Company | | | | |
| | | | Ltd. – ADR | | | 267,218 | |
| | 874,420 | | Telkom Indonesia | | | | |
| | | | Persero Tbk PT | | | 278,198 | |
| | 7,450 | | Tencent Holdings Ltd. | | | 343,403 | |
| | | | | | | 1,305,136 | |
| Consumer Discretionary – 17.8% | | | | |
| | 2,614,625 | | Ace Hardware | | | | |
| | | | Indonesia Tbk PT | | | 186,596 | |
| | 64,290 | | Alibaba Group | | | | |
| | | | Holding Ltd.1 | | | 877,348 | |
| | 9,620 | | BYD Company | | | | |
| | | | Ltd. – Class H | | | 267,583 | |
| | 2,896 | | Coway Company Ltd. | | | 163,237 | |
| | 24,250 | | Giant Manufacturing | | | | |
| | | | Company Ltd. | | | 219,507 | |
| | 51,233 | | Lojas Renner SA | | | 297,215 | |
| | 8,642 | | MakeMyTrip Ltd.1 | | | 231,865 | |
| | 36,900 | | Midea Group Company | | | | |
| | | | Ltd. – Class A | | | 329,120 | |
| | 57,405 | | Minth Group Ltd. | | | 139,877 | |
| | 3,510 | | Naspers Ltd. – Class N | | | 396,427 | |
| | 16,039 | | Trip.com Group | | | | |
| | | | Ltd. – ADR | | | 370,822 | |
| | | | | | | 3,479,597 | |
| Consumer Staples – 5.9% | | | | |
| | 19,165 | | Clicks Group Ltd. | | | 405,334 | |
| | 54,970 | | Hengan International | | | | |
| | | | Group Company Ltd. | | | 253,289 | |
| | 141,585 | | Kimberly-Clark de | | | | |
| | | | Mexico – Class A | | | 199,671 | |
| | 421 | | LG Household & | | | | |
| | | | Health Care Ltd. | | | 296,979 | |
| | | | | | | 1,155,273 | |
| Financials – 19.0% | | | | |
| | 404,085 | | Bank of | | | | |
| | | | Communications | | | | |
| | | | Company Ltd. – | | | | |
| | | | Class H | | | 289,291 | |
| | 38,750 | | China Merchants | | | | |
| | | | Bank Company | | | | |
| | | | Ltd. – Class H | | | 301,647 | |
| | 3,063 | | Credicorp Ltd. | | | 526,438 | |
| | 13,708 | | HDFC Bank | | | | |
| | | | Ltd. – ADR | | | 840,711 | |
| | 89,670 | | Kasikornbank | | | | |
| | | | PLC – NVDR | | | 432,784 | |
| | 4,731 | | OTP Bank Nyrt | | | 171,631 | |
| | 89,785 | | Ping An Insurance | | | | |
| | | | (Group) Company of | | | | |
| | | | China Ltd. – Class H | | | 627,693 | |
| | 1,650,115 | | PT Bank | | | | |
| | | | Rakyat Indonesia | | | | |
| | | | (Persero) Tbk. | | | 532,962 | |
| | | | | | | 3,723,157 | |
| Health Care – 5.8% | | | | |
| | 675,895 | | China Traditional | | | | |
| | | | Chinese Medicine | | | | |
| | | | Holdings | | | | |
| | | | Company Ltd. | | | 350,963 | |
| | 4,035 | | Dr. Reddy’s | | | | |
| | | | Laboratories | | | | |
| | | | Ltd. – ADR | | | 224,871 | |
| | 2,558,805 | | PT Kalbe Farma Tbk. | | | 286,836 | |
| | 5,786 | | Shenzhen Mindray | | | | |
| | | | Bio-Medical | | | | |
| | | | Electronics Company | | | | |
| | | | Ltd. – Class A1 | | | 279,558 | |
| | | | | | | 1,142,228 | |
| Industrials – 5.3% | | | | |
| | 9,890 | | AirTAC International | | | | |
| | | | Group | | | 317,972 | |
| | 52,219 | | WEG SA | | | 382,782 | |
| | 208,815 | | Weichai Power | | | | |
| | | | Company Ltd. – | | | | |
| | | | Class H | | | 327,296 | |
| | | | | | | 1,028,050 | |
| Information Technology – 24.1% | | | | |
| | 343,750 | | Chinasoft | | | | |
| | | | International Ltd. | | | 281,758 | |
| | 64,280 | | Delta Electronics, Inc. | | | 595,987 | |
| | 15,230 | | Infosys Ltd. – ADR | | | 379,075 | |
| | 14,046 | | Pagseguro Digital | | | | |
| | | | Ltd. – Class A1 | | | 281,622 | |
The accompanying notes are an integral part of these financial statements.
BOSTON COMMON ESG IMPACT EMERGING MARKETS FUND
SCHEDULE OF INVESTMENTS at March 31, 2022 (Unaudited) (Continued) |
| Shares | | | | Value | |
| COMMON STOCKS – 93.5% (Continued) | | | |
| | | | |
| Information Technology – 24.1% (Continued) | | | |
| | 10,511 | | SK Hynix, Inc. | | $ | 1,011,151 | |
| | 14,090 | | Taiwan Semiconductor | | | | |
| | | | Manufacturing | | | | |
| | | | Company Ltd. – ADR | | | 1,469,024 | |
| | 34,815 | | Win Semiconductors | | | | |
| | | | Corp. | | | 320,388 | |
| | 227,780 | | Xinyi Solar | | | | |
| | | | Holdings Ltd. | | | 396,421 | |
| | | | | | | 4,735,426 | |
| Materials – 5.3% | | | | |
| | 747 | | LG Chem Ltd. | | | 326,414 | |
| | 18,944 | | Mondi PLC | | | 376,424 | |
| | 3,957 | | Sociedad Quimica y | | | | |
| | | | Minera de Chile | | | | |
| | | | SA – ADR | | | 338,719 | |
| | | | | | | 1,041,557 | |
| Real Estate – 3.0% | | | | |
| | 236,422 | | Growthpoint Properties | | | | |
| | | | Ltd. – REIT | | | 238,161 | |
| | 69,500 | | Longfor Group | | | | |
| | | | Holdings Ltd. | | | 355,504 | |
| | | | | | | 593,665 | |
| Utilities – 0.6% | | | | |
| | 396,815 | | Beijing Enterprises | | | | |
| | | | Water Group Ltd. | | | 121,404 | |
| | | | | |
| TOTAL COMMON STOCKS | | | | |
| (Cost $20,000,728) | | | 18,325,493 | |
| | | | | |
| PREFERRED STOCKS – 3.5% | | | | |
| | | | | |
| Financials – 3.5% | | | | |
| | 6,031 | | Bancolombia | | | | |
| | | | SA – ADR | | | 257,282 | |
| | 75,656 | | Itau Unibanco Holding | | | | |
| | | | SA – ADR | | | 431,996 | |
| | | | | |
| TOTAL PREFERRED STOCKS | | | | |
| (Cost $604,964) | | | 689,278 | |
| | | | | |
| SHORT-TERM INVESTMENTS – 2.8% | | | | |
| | | | | |
| Money Market Funds – 2.8% | | | | |
| | 553,832 | | First American | | | | |
| | | | Treasury Obligations | | | | |
| | | | Fund – Class X, | | | | |
| | | | 0.222%2 | |
| 553,832 | |
| | | | | |
| TOTAL SHORT-TERM INVESTMENTS | | | | |
| (Cost $553,832) | | | 553,832 | |
| | | | | |
| TOTAL INVESTMENTS – 99.8% | | | | |
| (Cost $21,159,524) | | | 19,568,603 | |
| Other Assets in Excess | | | | |
| of Liabilities – 0.2% | | | 39,152 | |
| NET ASSETS – 100.0% | | $ | 19,607,755 | |
ADR American Depositary Receipt
NVDR Non-Voting Depositary Receipt
REIT Real Estate Investment Trust
1 | Non-income producing security. |
2 | Annualized seven-day effective yield as of March 31, 2022. |
The Global Industry Classification Standard (GICS®) was developed by and/or is the exclusive property of MSCI, Inc. and Standard & Poor Financial Services, LLC (“S&P”). GICS® is a service mark of MSCI and S&P and has been licensed for use by U.S. Bancorp Fund Services, LLC.
The accompanying notes are an integral part of these financial statements.
BOSTON COMMON ESG IMPACT INTERNATIONAL FUND
Investment Outlook
Geopolitical risk will likely remain elevated as Russia’s invasion evolves into a protracted confrontation. Our base case scenario incorporates weaker growth expectations and stronger inflationary pressures, and we have moderated the cyclicality of the Boston Common ESG Impact International Fund (the “International Fund”). We are mindful of spillover risks from Russia’s war, including supply chain disruptions, tighter monetary policy, and social unrest from displaced migrants and rising costs of living. Simultaneously, many of the healthy pre-invasion conditions that were the basis for the International Fund’s pro-growth posture as we exited 2021 are still present: vibrant industrial activity, record low unemployment, and gradual normalization of pandemic-induced disruptions. When the conflict recedes, those prevailing conditions would be favorable for economies and markets.
One clear consequence of the war is an acceleration of Europe’s transition away from Russian fossil fuels. Alternative sources of energy supply will be used to fill immediate gaps, but ultimately producers of energy-efficient equipment, solar and wind power, and electric vehicles will benefit from robust demand within Europe and across the globe. These opportunities support the International Fund’s overweight of eco-efficiency solutions providers, generally categorized within Industrials, Information Technology, and Specialty Chemicals. The International Fund’s relatively large exposure to Financials reflects our expectations for higher interest rates as well as the group’s improving attention to ESG in credit decisions. In the defensive areas, our fundamental, valuation, and ESG research leads us to favor Health Care and Telecommunication over Consumer Staples and Utilities, on a relative basis. With greater conviction in our fundamental view and lower valuations for many of the holdings, we are increasingly confident in the long-term prospects for the International Fund.
Over the past six months, the International Fund has added two German health care companies: biotech company BioNTech and a supplier to the biotech industry, Sartorius Stedim. BioNTech, in partnership with Pfizer, has developed one of the most highly effective COVID-19 vaccines using mRNA technology, transforming not only our global response to this health crisis but the company’s financial position as well. Broader distribution and a booster market, similar to the seasonal flu shot, support long-term fundamentals, while the company’s pipeline adds option value. Sartorius Stedim is a leading manufacturer of bioprocessing equipment and consumables for innovative drug production. Large molecule biotech therapeutics should continue to grow in share of the pharma industry overall, including the commercial application of novel modalities such as cell & gene therapies. After a significant price decline, the stock’s valuation looks compelling.
BOSTON COMMON ESG IMPACT INTERNATIONAL FUND
Other new holdings include two U.K.-based companies: Lloyds Banking Group and Burberry. Lloyds is the largest retail, mortgage, and commercial lender in the U.K. A new CEO is working to boost its wealth management business and contribute to positive ESG momentum with lending that promotes access to finance and green building practices. The U.K. apparel retailer Burberry has improved merchandise and brand appeal, especially for younger consumers. It also has industry-leading environmental practices to reduce carbon emissions and source 100% certified organic cotton.
Several holdings were eliminated over the past few months as valuation was balanced with fundamentals and macroeconomic considerations. Given its high valuation, the Fund sold Dassault Systemes, a French provider of software for mostly industrial markets and also trimmed several holdings in the Financial and Industrial sectors.
BOSTON COMMON ESG IMPACT INTERNATIONAL FUND
Management Discussion
For the six months ended March 31, 2022, the International Fund declined -13.11%, while the MSCI EAFE Index (the “Index”) declined -3.38% over the same time frame.
The supply shock for many commodities and resulting price surges have been a challenging headwind for the International Fund. A demand-driven cycle typically benefits a broad group of industries. Over the past months, however, the International Fund’s Industrial, Information Technology, and Materials stocks declined, while Energy and Mining stocks led the Index. Surging input costs and bottlenecks compounded pressures on many manufacturers. The rise in interest rates along with expectations of slower growth also weighed on some of the International Fund’s holdings with strong long-term growth prospects.
Poor stock selection across several sectors hurt relative returns. In the Consumer area, discretionary holdings such as Japanese manufacturers of bike parts (Shimano) and musical instruments (Yamaha) and adidas weighed down the International Fund’s returns. French auto parts supplier Valeo suffered, despite its extremely low valuation and large order backlogs, as supply chain dislocations curbed auto manufacturing. The International Fund continues to hold these stocks, as they benefit from strong underlying demand that should be realized as soon as short-term problems are resolved. In Consumer Staples, disappointing relative performance was exacerbated by the International Fund’s underweight of the strong food products industry in the Index. The Materials sector was the largest single detractor, as the metals and mining industry in the Index (nearly equal the weight of the Energy sector) gained +37%, while the International Fund’s holding in electric vehicle battery supplier LG Chem declined on concerns about market share shifts. Japanese lens producer Hoya, German biotech BioNTech, and global medtech Philips detracted value in Health Care. From a regional perspective, Europe ex. U.K. was the largest drag on performance, including French payment processor Worldline and Dutch bank ING.
The International Fund’s overweight of the Financials sector added value over the past six months. Australian infrastructure investor Macquarie and Indonesian microfinance lender Bank Rakyat were positively correlated with commodities. Singaporean bank OCBC, French insurer AXA, and Japanese diversified financial services company Orix benefited from solid financial results along with higher interest rates. The International Fund’s holdings in U.K. plumbing distributor Ferguson and power management manufacturer Schneider were positive contributors, and European Pharmaceutical holdings, Novartis, Novo Nordisk, and Roche, were also among the top contributors. Regionally, an underweight to Japan contributed positively.
As we look to the future, we continue to favor opportunities in wind and solar development, electric vehicles, electrification, and green chemicals. Our integrated ESG research process leads us to companies best positioned for the sustainable transition in all sectors.
BOSTON COMMON ESG IMPACT INTERNATIONAL FUND
Earnings growth is not representative of the future performance.
Past performance does not guarantee future results.
Must be preceded or accompanied by a current prospectus.
Mutual fund investing involves risk. Principal loss is possible. Investments in foreign securities involve political, economic and currency risks, greater volatility and differences in accounting methods. The Fund’s sustainability policy could cause it to perform differently compared to similar funds that do not have such a policy. This policy may result in the Fund foregoing opportunities to buy certain securities when it might otherwise be advantageous to do so, or selling securities for reasons when it might be otherwise is advantageous for it to do so. Unexpected events and their aftermaths, such as the spread of deadly diseases; natural, environmental or man-made disasters; financial, political or social disruptions; terrorism and war; and other tragedies or catastrophes, can cause investor fear and panic, which can adversely affect the economies of many companies, sectors, nations, regions and the market in general, in ways that cannot necessarily be foreseen.
Diversification does not assure a profit or protect against loss in a declining market.
Boston Common Asset Management, LLC is the adviser to the Fund, which is distributed by Quasar Distributors, LLC.
The opinions expressed are subject to change, are not guaranteed and should not be considered a recommendation to buy or sell any security. Fund holdings and sector allocations are subject to change and should not be considered a recommendation to buy or sell any securities. Please refer to the Schedule of Investments included for additional information on securities held within the Boston Common ESG Impact Funds.
The MSCI EAFE® Index is a stock market index that is designed to measure the equity market performance of developed markets outside of the U.S. and Canada. Investment grade securities are securities that have been rated as having a relatively low risk of default. It is not possible to invest directly into an index.
BOSTON COMMON ESG IMPACT INTERNATIONAL FUND
COUNTRY ALLOCATION at March 31, 2022 (Unaudited) |
Country | % of Net Assets1 |
| Japan | | | 19.7 | % | |
| United Kingdom | | | 13.4 | % | |
| Germany | | | 11.6 | % | |
| France | | | 8.5 | % | |
| Sweden | | | 6.2 | % | |
| Switzerland | | | 5.7 | % | |
| Australia | | | 4.9 | % | |
| Denmark | | | 4.7 | % | |
| Netherlands | | | 3.5 | % | |
| Finland | | | 2.9 | % | |
| Singapore | | | 2.5 | % | |
| Hong Kong | | | 2.4 | % | |
| China | | | 2.2 | % | |
| Ireland | | | 1.9 | % | |
| Belgium | | | 1.5 | % | |
| Italy | | | 1.5 | % | |
| Indonesia | | | 1.4 | % | |
| Taiwan | | | 1.3 | % | |
| Republic of Korea | | | 1.1 | % | |
| India | | | 1.0 | % | |
1 | Excludes short-term investments and other assets in excess of liabilities. |
BOSTON COMMON ESG IMPACT INTERNATIONAL FUND
SCHEDULE OF INVESTMENTS at March 31, 2022 (Unaudited) |
| Shares | | | | Value | |
| COMMON STOCKS – 97.9% | | | |
| | | | |
| Communication Services – 3.1% | | | |
| | 876,605 | | Deutsche | | | |
| | | | Telekom AG | | $ | 16,326,092 | |
| | | | | |
| Consumer Discretionary – 12.1% | | | | |
| | 38,001 | | Adidas AG | | | 8,855,270 | |
| | 50,375 | | Alibaba Group | | | | |
| | | | Holding | | | | |
| | | | Ltd. – ADR1 | | | 5,480,800 | |
| | 1,323,135 | | Barratt | | | | |
| | | | Developments PLC | | | 9,007,625 | |
| | 190,860 | | Burberry Group PLC | | | 4,166,402 | |
| | 50,900 | | Shimano, Inc. | | | 11,656,526 | |
| | 97,650 | | Sony Group Corp. | | | 10,045,814 | |
| | 322,050 | | Valeo SA | | | 5,948,605 | |
| | 177,040 | | Yamaha Corp. | | | 7,693,464 | |
| | | | | | | 62,854,506 | |
| Consumer Staples – 7.3% | | | | |
| | 305,081 | | Essity AB – Class A | | | 7,199,616 | |
| | 88,526 | | Kerry Group PLC | | | 9,900,967 | |
| | 185,500 | | Shiseido | | | | |
| | | | Company Ltd. | | | 9,369,322 | |
| | 252,795 | | Unilever NV – ADR | | | 11,519,868 | |
| | | | | | | 37,989,773 | |
| Financials – 22.2% | | | | |
| | 744,226 | | AIA Group Ltd. | | | 7,771,123 | |
| | 529,375 | | AXA SA | | | 15,497,181 | |
| | 88,825 | | HDFC Bank | | | | |
| | | | Ltd. – ADR | | | 5,447,637 | |
| | 1,122,494 | | ING Groep NV | | | 11,719,949 | |
| | 16,170,490 | | Lloyds Banking | | | | |
| | | | Group PLC | | | 9,847,273 | |
| | 102,002 | | Macquarie Group Ltd. | | | 15,426,212 | |
| | 720,600 | | ORIX Corp. | | | 14,363,402 | |
| | 1,429,770 | | Oversea-Chinese | | | | |
| | | | Banking Corp Ltd. | | | 12,970,669 | |
| | 23,401,906 | | PT Bank | | | | |
| | | | Rakyat Indonesia | | | | |
| | | | (Persero) Tbk. | | | 7,558,459 | |
| | 309,974 | | Sampo Oyj – Class A | | | 15,146,718 | |
| | | | | | | 115,748,623 | |
| Health Care – 14.6% | | | | |
| | 38,480 | | BioNTech SE – | | | | |
| | | | ADR1 | | | 6,563,149 | |
| | 125,317 | | Dechra | | | | |
| | | | Pharmaceuticals | | | | |
| | | | PLC | | | 6,653,325 | |
| | 85,600 | | Eisai Company Ltd. | | | 3,965,728 | |
| | 97,300 | | Hoya Corp. | | | 11,088,102 | |
| | 205,406 | | Koninklijke | | | | |
| | | | Philips NV | | | 6,263,621 | |
| | 130,170 | | Novartis AG – ADR | | | 11,422,418 | |
| | 85,637 | | Novo Nordisk A/S – | | | | |
| | | | Class B | | | 9,498,526 | |
| | 370,033 | | Roche Holding | | | | |
| | | | Ltd. – ADR | | | 18,283,331 | |
| | 5,804 | | Sartorius Stedim | | | | |
| | | | Biotech | | | 2,376,255 | |
| | | | | | | 76,114,455 | |
| Industrials – 18.7% | | | | |
| | 357,828 | | Assa Abloy AB – | | | | |
| | | | Class B | | | 9,618,268 | |
| | 137,935 | | Atlas Copco AB – | | | | |
| | | | Class B | | | 6,255,289 | |
| | 54,600 | | Daikin Industries | | | 9,915,575 | |
| | 47,079 | | Ferguson PLC | | | 6,378,239 | |
| | 73,270 | | KION Group AG | | | 4,829,042 | |
| | 208,700 | | Kurita Water | | | | |
| | | | Industries Ltd. | | | 7,703,292 | |
| | 225,640 | | Prysmian SpA | | | 7,657,406 | |
| | 188,094 | | Recruit Holdings | | | | |
| | | | Company Ltd. | | | 8,172,129 | |
| | 89,918 | | Schneider Electric SE | | | 15,096,446 | |
| | 39,626 | | Spirax-Sarco | | | | |
| | | | Engineering PLC | | | 6,478,070 | |
| | 227,115 | | Vestas Wind | | | | |
| | | | Systems A/S | | | 6,662,378 | |
| | 483,040 | | Volvo AB – Class B | | | 9,011,280 | |
| | | | | | | 97,777,414 | |
| Information Technology – 8.7% | | | | |
| | 272,818 | | Infineon | | | | |
| | | | Technologies AG | | | 9,229,492 | |
| | 82,183 | | SAP SE – ADR | | | 9,119,026 | |
| | 66,373 | | Taiwan | | | | |
| | | | Semiconductor | | | | |
| | | | Manufacturing | | | | |
| | | | Company Ltd. – | | | | |
| | | | ADR | | | 6,920,049 | |
The accompanying notes are an integral part of these financial statements.
BOSTON COMMON ESG IMPACT INTERNATIONAL FUND
SCHEDULE OF INVESTMENTS at March 31, 2022 (Unaudited) (Continued) |
| Shares | | | | Value | |
| COMMON STOCKS – 97.9% (Continued) | | | |
| | | | |
| Information Technology – 8.7% (Continued) | | | |
| | 246,000 | | TDK Corp. | | $ | 8,874,984 | |
| | 125,618 | | Worldline SA1 | | | 5,451,875 | |
| | 3,408,000 | | Xinyi Solar | | | | |
| | | | Holdings Ltd. | | | 5,931,181 | |
| | | | | | | 45,526,607 | |
| Materials – 5.6% | | | | |
| | 84,490 | | Croda International | | | | |
| | | | PLC | | | 8,691,607 | |
| | 1,668,699 | | DS Smith PLC | | | 7,018,054 | |
| | 13,385 | | LG Chem Ltd. | | | 5,848,798 | |
| | 180,592 | | Umicore SA | | | 7,806,559 | |
| | | | | | | 29,365,018 | |
| Real Estate – 3.9% | | | | |
| | 2,480,000 | | Hang Lung | | | | |
| | | | Properties Ltd. | | | 4,998,630 | |
| | 5,473,370 | | Mirvac Group – | | | | |
| | | | REIT | | | 10,149,056 | |
| | 115,251 | | Vonovia SE | | | 5,371,926 | |
| | | | | | | 20,519,612 | |
| Utilities – 1.7% | | | | |
| | 68,686 | | Orsted A/S | | | 8,597,530 | |
| | | | | |
| TOTAL COMMON STOCKS | | | | |
| (Cost $476,151,087) | | | 510,819,630 | |
| | | | | |
| SHORT-TERM INVESTMENTS – 1.7% | | | | |
| | | | | |
| Money Market Funds – 1.7% | | | | |
| | 8,846,379 | | First American | | | | |
| | | | Treasury Obligations | | | | |
| | | | Fund – Class X, 0.222%2 | | | | |
| | | | |
| 8,846,379 | |
| | | | | |
| TOTAL SHORT-TERM INVESTMENTS | | | | |
| (Cost $8,846,379) | | | 8,846,379 | |
| | | | | |
| TOTAL INVESTMENTS – 99.6% | | | | |
| (Cost $484,997,466) | | | 519,666,009 | |
| Other Assets in Excess | | | | |
| of Liabilities – 0.4% | | | 2,093,957 | |
| NET ASSETS – 100.0% | | $ | 521,759,966 | |
ADR American Depositary Receipt
1 | Non-income producing security. |
2 | Annualized seven-day effective yield as of March 31, 2022. |
The Global Industry Classification Standard (GICS®) was developed by and/or is the exclusive property of MSCI, Inc. and Standard & Poor Financial Services, LLC (“S&P”). GICS® is a service mark of MSCI and S&P and has been licensed for use by U.S. Bancorp Fund Services, LLC.
The accompanying notes are an integral part of these financial statements.
BOSTON COMMON ESG IMPACT U.S. EQUITY FUND
Investment Outlook
Multiple cross currents increased investor unease and led to an overall decline in major global markets over the last few months. In the U.S., growing evidence that inflationary pressures were more structural than transitory offset the economic optimism in place at the end of 2021. In late February, geopolitics intervened, as Russia’s invasion of Ukraine exacerbated inflationary pressures and further dampened the outlook for economic growth.
Markets began the year aware that the Fed’s accommodative monetary policy would begin to reverse. However, the global supply shock caused by punitive Russian economic sanctions, the supply disruption of energy, metals and agricultural commodities, and the follow-on impact of rising costs for corporate profits and consumer wallets, have created more persistent inflation. The Fed will now adopt a more aggressive tightening stance; larger interest-rate increases should follow its first interest-rate hike in March. The yield curve has flattened, highlighting market concerns that the Fed’s actions may not guarantee a “soft landing”.
The U.S. is largely insulated from the most severe consequences of Russia’s invasion – sanctions and a refugee crisis – but domestic growth expectations are now muted. We will continue to prioritize companies with strong balance sheets most exposed to secular growth. For the longer term, favorable pre-invasion expectations underpinning our pro-growth posture in place at the end of 2021 are still present, including vibrant industrial activity, record low unemployment, and continued reversal of pandemic-induced disruptions. With conviction and patience, we remain confident in our holdings.
Portfolio Positioning
The Boston Common ESG Impact U.S. Equity Fund (the “U.S. Equity Fund”) seeks forward-looking companies attuned to the opportunities focused on ESG issues. During periods of market corrections, the U.S. Equity Fund pursues opportunities to buy higher-quality, sustainable companies where stock prices appear unduly depressed. In the most recent period, the U.S. Equity Fund initiated several new positions at attractive price points, including online payment platform PayPal, a dominate player in the payment industry that facilitates online retailing for both large and small enterprises. The U.S. Equity Fund also added Xylem, an industrial with a mission that supports the necessary investment in water infrastructure, and Enphase Energy, a niche, pure play in residential solar growth. Enphase is a leading provider of microinverter systems for the solar industry, helping to support the provision of green, affordable, and reliable energy.
Within the consumer space, the U.S. Equity Fund added global play and entertainment company Hasbro. With its storied past, the company has
BOSTON COMMON ESG IMPACT U.S. EQUITY FUND
successfully transitioned to include many online properties that support strong growth in a digital age. Hasbro’s ESG-related initiatives include plans to eliminate all plastics from new packaging by year end. The U.S. Equity Fund also added to newer holdings McCormick & Co and Sprouts Farmers Markets, both of which should benefit from long-term trends towards healthy eating and at-home cooking.
In late 2021, after a multi-year period of outperformance and multiple expansion, the U.S. Equity Fund reduced its overweight to Information Technology by scaling back software mega-cap holdings such as Alphabet, Microsoft, and Intuit. The U.S. Equity Fund maintains a focus on these innovative software companies that continue to experience very strong business sales momentum, though valuation metrics appear elevated as the U.S. enters a period of a tighter monetary policy.
BOSTON COMMON ESG IMPACT U.S. EQUITY FUND
Management Discussion
Over the past six months ending March 31, 2022, the U.S. Equity Fund declined -0.85%, lagging the S&P 500® Index (the “Index”), which rose +5.92%.
More than half of the underperformance occurred following the Russian invasion during late February. For the period overall, the major detractor from the U.S. Equity Fund’s relative performance was thematic concentration, especially within Consumer Discretionary. With rapidly rising interest rates, housing-related holdings, including homebuilder KB Home and flooring company Mohawk, declined on worries of substantially higher mortgage rates. Apparel manufacturer PVH fell after reducing annual guidance. Within the Financials sector, the overweight in asset gathers, Morgan Stanley and T. Rowe Price, hurt returns, even as futures and option exchange provider CME Group benefited from market volatility. From an allocation perspective, the U.S. Equity Fund’s performance was impacted by the lack of exposure to conventional energy, although this drag was partially offset by its holding in alternative energy, Enphase. The Industrials and Materials sectors also detracted from performance. In Health Care, biotech Biogen sold off amid uncertainty regarding its Alzheimer’s drug, yet medical information company Cerner jumped after receiving a takeover bid from Oracle. Netflix and Citigroup were other positions that held back the U.S. Equity Fund’s performance. The U.S. Equity Fund has since sold its position in Citigroup, but we remain confident in Netflix’s long-term opportunities.
Many of the U.S. Equity Fund’s top and bottom performers over the last six months were in Information Technology, which, overall, detracted from performance. Company-specific issues negatively impacted software companies Adobe Systems and Salesforce. On the positive side, dominant global tech companies Apple and Microsoft continued to perform well on absolute and relative bases. Telecommunication equipment provider Ciena Corporation rallied on very strong earnings. Companies with defensive characteristics were among the U.S. Equity Fund’s better performing holdings, which include pharmaceutical company Vertex, specialty grocer Sprouts Farmers Market, and spice company McCormick. Open-air retail real estate company Kimco was another top performer.
As macro influences play out, we expect to see opportunities to add value through stock selection. Integrating ESG research alongside financial analysis, we continue to lean into companies that seeks to address today’s challenges.
BOSTON COMMON ESG IMPACT U.S. EQUITY FUND
Past performance does not guarantee future results.
Must be preceded or accompanied by a current prospectus.
Mutual fund investing involves risk. Principal loss is possible. Investments in foreign securities involve political, economic and currency risks, greater volatility and differences in accounting methods. The Fund’s sustainability policy could cause it to perform differently compared to similar funds that do not have such a policy. This policy may result in the Fund foregoing opportunities to buy certain securities when it might otherwise be advantageous to do so, or selling securities for reasons when it might be otherwise is advantageous for it to do so. Unexpected events and their aftermaths, such as the spread of deadly diseases; natural, environmental or man-made disasters; financial, political or social disruptions; terrorism and war; and other tragedies or catastrophes, can cause investor fear and panic, which can adversely affect the economies of many companies, sectors, nations, regions and the market in general, in ways that cannot necessarily be foreseen.
Diversification does not assure a profit or protect against loss in a declining market.
Boston Common Asset Management, LLC is the adviser to the Fund, which is distributed by Quasar Distributors, LLC.
The opinions expressed are subject to change, are not guaranteed and should not be considered a recommendation to buy or sell any security.
Fund holdings and sector allocations are subject to change and should not be considered a recommendation to buy or sell any securities. Please refer to the Schedule of Investments included for additional information on securities held within the Boston Common ESG Impact Funds.
The S&P 500® Index is a capitalization weighted index of 500 large capitalization stocks which is designed to measure a broad domestic securities market. It is not possible to invest directly in an index.
BOSTON COMMON ESG IMPACT U.S. EQUITY FUND
SECTOR ALLOCATION at March 31, 2022 (Unaudited) |
Sector | % of Net Assets1 |
| Information Technology | | | 32.2 | % | |
| Consumer Discretionary | | | 12.1 | % | |
| Health Care | | | 11.9 | % | |
| Communication Services | | | 10.8 | % | |
| Financials | | | 9.1 | % | |
| Industrials | | | 7.2 | % | |
| Consumer Staples | | | 6.6 | % | |
| Real Estate | | | 5.0 | % | |
| Materials | | | 1.8 | % | |
| Utilities | | | 1.2 | % | |
1 | Excludes short-term investments and other assets in excess of liabilities. |
BOSTON COMMON ESG IMPACT U.S. EQUITY FUND
SCHEDULE OF INVESTMENTS at March 31, 2022 (Unaudited) |
| Shares | | | | Value | |
| COMMON STOCKS – 97.9% | | | |
| | | | |
| Communication Services – 10.8% | | | |
| | 9 | | Alphabet, Inc. – | | | |
| | | | Class A1 | | $ | 25,032 | |
| | 1,195 | | Alphabet, Inc. – | | | | |
| | | | Class C1 | | | 3,337,623 | |
| | 3,028 | | Netflix, Inc.1 | | | 1,134,258 | |
| | 12,250 | | The New York Times | | | | |
| | | | Company – Class A | | | 561,540 | |
| | 22,755 | | Verizon | | | | |
| | | | Communications, Inc. | | | 1,159,140 | |
| | 50 | | Walt Disney Company | | | 6,858 | |
| | | | | | | 6,224,451 | |
| Consumer Discretionary – 12.1% | | | | |
| | 3,560 | | Advance Auto | | | | |
| | | | Parts, Inc. | | | 736,778 | |
| | 280 | | Booking | | | | |
| | | | Holdings, Inc.1 | | | 657,566 | |
| | 7,120 | | Hasbro, Inc. | | | 583,270 | |
| | 1,585 | | Home Depot, Inc. | | | 474,438 | |
| | 20,385 | | KB Home | | | 660,066 | |
| | 8,645 | | Magna | | | | |
| | | | International, Inc. | | | 555,960 | |
| | 3,900 | | Mohawk | | | | |
| | | | Industries, Inc.1 | | | 484,380 | |
| | 6,525 | | PVH Corp. | | | 499,880 | |
| | 4,416 | | Target Corp. | | | 937,164 | |
| | 13,475 | | TJX Companies, Inc. | | | 816,315 | |
| | 3,297 | | TopBuild Corp.1 | | | 598,043 | |
| | | | | | | 7,003,860 | |
| Consumer Staples – 6.6% | | | | |
| | 7,620 | | Colgate-Palmolive | | | | |
| | | | Company | | | 577,825 | |
| | 2,628 | | The Estee Lauder | | | | |
| | | | Companies, Inc. – | | | | |
| | | | Class A | | | 715,657 | |
| | 9,973 | | McCormick & | | | | |
| | | | Company, Inc. – | | | | |
| | | | NVDR | | | 995,305 | |
| | 12,410 | | Mondelez | | | | |
| | | | International, Inc. – | | | | |
| | | | Class A | | | 779,100 | |
| | 23,710 | | Sprouts Farmers | | | | |
| | | | Market, Inc.1 | | | 758,246 | |
| | | | | | | 3,826,133 | |
| Financials – 9.1% | | | | |
| | 2,501 | | Ameriprise | | | | |
| | | | Financial, Inc. | | | 751,201 | |
| | 2,510 | | Aon PLC – Class A | | | 817,331 | |
| | 175 | | Citigroup, Inc. | | | 9,345 | |
| | 2,565 | | CME Group, Inc. – | | | | |
| | | | Class A | | | 610,111 | |
| | 16,550 | | Morgan Stanley | | | 1,446,470 | |
| | 5,260 | | PNC Financial | | | | |
| | | | Services Group, Inc. | | | 970,207 | |
| | 4,475 | | T. Rowe Price | | | | |
| | | | Group, Inc. | | | 676,575 | |
| | | | | | | 5,281,240 | |
| Health Care – 11.9% | | | | |
| | 5,790 | | Agilent | | | | |
| | | | Technologies, Inc. | | | 766,191 | |
| | 2,338 | | Biogen, Inc.1 | | | 492,383 | |
| | 2,855 | | Danaher Corp. | | | 837,457 | |
| | 21,400 | | Merck & | | | | |
| | | | Company, Inc. | | | 1,755,870 | |
| | 5,345 | | Novo Nordisk | | | | |
| | | | A/S – ADR | | | 593,562 | |
| | 1,498 | | Regeneron | | | | |
| | | | Pharmaceuticals, | | | | |
| | | | Inc.1 | | | 1,046,233 | |
| | 3,607 | | Vertex | | | | |
| | | | Pharmaceuticals, Inc.1 | | | 941,319 | |
| | 1,550 | | Waters Corp.1 | | | 481,104 | |
| | | | | | | 6,914,119 | |
| Industrials – 7.2% | | | | |
| | 18,555 | | Carrier Global Corp. | | | 851,118 | |
| | 3,825 | | Cummins, Inc. | | | 784,546 | |
| | 12,161 | | Emerson Electric | | | | |
| | | | Company | | | 1,192,386 | |
| | 8,226 | | Wabtec Corp. | | | 791,094 | |
| | 6,495 | | Xylem, Inc. | | | 553,764 | |
| | | | | | | 4,172,908 | |
| Information Technology – 32.2% | | | | |
| | 2,450 | | Adobe, Inc.1 | | | 1,116,269 | |
| | 3,720 | | Analog Devices, Inc. | | | 614,469 | |
| | 22,600 | | Apple, Inc. | | | 3,946,186 | |
| | 6,995 | | Applied Materials, Inc. | | | 921,941 | |
| | 14,430 | | Ciena Corp.1 | | | 874,891 | |
| | 3,030 | | Enphase Energy, Inc.1 | | | 611,393 | |
| | 6,890 | | First Solar, Inc.1 | | | 576,969 | |
| | 2,052 | | Intuit, Inc. | | | 986,684 | |
The accompanying notes are an integral part of these financial statements.
BOSTON COMMON ESG IMPACT U.S. EQUITY FUND
SCHEDULE OF INVESTMENTS at March 31, 2022 (Unaudited) (Continued) |
| Shares | | | | Value | |
| COMMON STOCKS – 97.9% (Continued) | | | |
| | | | |
| Information Technology – 32.2% (Continued) | | | |
| | 12,640 | | Micron | | | |
| | | | Technology, Inc. | | $ | 984,530 | |
| | 14,406 | | Microsoft Corp. | | | 4,441,514 | |
| | 5,805 | | PayPal Holdings, Inc.1 | | | 671,348 | |
| | 4,296 | | salesforce.com, Inc.1 | | | 912,127 | |
| | 8,870 | | Visa, Inc. – Class A | | | 1,967,100 | |
| | | | | | | 18,625,421 | |
| Materials – 1.8% | | | | |
| | 4,525 | | AptarGroup, Inc. | | | 531,688 | |
| | 2,802 | | Ecolab, Inc. | | | 494,721 | |
| | | | | | | 1,026,409 | |
| Real Estate – 5.0% | | | | |
| | 22,265 | | Hannon Armstrong | | | | |
| | | | Sustainable | | | | |
| | | | Infrastructure Capital, | | | | |
| | | | Inc. – REIT | | | 1,056,029 | |
| | 33,762 | | Kimco Realty | | | | |
| | | | Corp. – REIT | | | 833,921 | |
| | 26,710 | | Weyerhaeuser | | | | |
| | | | Company – REIT | | | 1,012,309 | |
| | | | | | | 2,902,259 | |
| Utilities – 1.2% | | | | |
| | 4,231 | | American Water | | | | |
| | | | Works Company, Inc. | | | 700,357 | |
| | | | | |
| TOTAL COMMON STOCKS | | | | |
| (Cost $34,673,989) | | | 56,677,157 | |
| | | | | |
| SHORT-TERM INVESTMENTS – 2.1% | | | | |
| | | | | |
| Money Market Funds – 2.1% | | | | |
| | 1,241,136 | | First American | | | | |
| | | | Treasury Obligations | | | | |
| | | | Fund – Class X, 0.222%2 | | | | |
| | | | | | 1,241,136 | |
| | | | | |
| TOTAL SHORT-TERM INVESTMENTS | | | | |
| (Cost $1,241,136) | | | 1,241,136 | |
| | | | | |
| TOTAL INVESTMENTS – 100.0% | | | | |
| (Cost $35,915,125) | | | 57,918,293 | |
| Other Assets in Excess | | | | |
of Liabilities – 0.0%3 | | | 12,221 | |
| NET ASSETS – 100.0% | | $ | 57,930,514 | |
NVDR Non-Voting Depositary Receipt
ADR American Depositary Receipt
1 | Non-income producing security. |
2 | Annualized seven-day effective yield as of March 31, 2022. |
3 | Does not round to 0.1% or (0.1)%, as applicable. |
The Global Industry Classification Standard (GICS®) was developed by and/or is the exclusive property of MSCI, Inc. and Standard & Poor Financial Services, LLC (“S&P”). GICS® is a service mark of MSCI and S&P and has been licensed for use by U.S. Bancorp Fund Services, LLC.
The accompanying notes are an integral part of these financial statements.
BOSTON COMMON ESG IMPACT FUNDS
STATEMENTS OF ASSETS AND LIABILITIES at March 31, 2022 (Unaudited) |
| | | Emerging | | | International | | | U.S. Equity | |
| | | Markets Fund | | | Fund | | | Fund | |
| ASSETS: | | | | | | | | | |
| Investments in securities, at value | | | | | | | | | |
| (cost $21,159,524, $484,997,466 | | | | | | | | | |
| and $35,915,125, respectively) | | $ | 19,568,603 | | | $ | 519,666,009 | | | $ | 57,918,293 | |
| Cash | | | — | | | | 195,454 | | | | — | |
| Receivables: | | | | | | | | | | | | |
| Fund shares sold | | | — | | | | 859,387 | | | | 43,083 | |
| Dividends and interest | | | 60,222 | | | | 2,021,206 | | | | 33,521 | |
| Prepaid expenses | | | 11,010 | | | | 47,556 | | | | 21,349 | |
| Total assets | | | 19,639,835 | | | | 522,789,612 | | | | 58,016,246 | |
| | | | | | | | | | | | | |
| LIABILITIES: | | | | | | | | | | | | |
| Payables: | | | | | | | | | | | | |
| Investment securities purchased | | | 51 | | | | 2,394 | | | | — | |
| Fund shares redeemed | | | — | | | | 592,325 | | | | — | |
| Investment advisory fees, net | | | 1,097 | | | | 312,615 | | | | 31,578 | |
| Fund administration & fund accounting fees | | | — | | | | 43,465 | | | | 10,529 | |
| Audit fees | | | 19,179 | | | | 33,668 | | | | 33,668 | |
| Transfer agent fees | | | 1,166 | | | | 10,364 | | | | 2,925 | |
| Custody fees | | | 7,225 | | | | 22,056 | | | | 920 | |
| Registration fees | | | 1,173 | | | | 1,727 | | | | 240 | |
| Printing and mailing expenses | | | — | | | | 5,849 | | | | 1,193 | |
| Trustee fees | | | — | | | | 3,611 | | | | 2,846 | |
| Miscellaneous expenses | | | — | | | | — | | | | 261 | |
| Chief Compliance Officer fees | | | 1,457 | | | | 1,572 | | | | 1,572 | |
| Legal fees | | | 732 | | | | — | | | | — | |
| Total liabilities | | | 32,080 | | | | 1,029,646 | | | | 85,732 | |
| NET ASSETS | | $ | 19,607,755 | | | $ | 521,759,966 | | | $ | 57,930,514 | |
| | | | | | | | | | | | | |
| COMPONENTS OF NET ASSETS: | | | | | | | | | | | | |
| Paid-in capital | | $ | 21,537,755 | | | $ | 496,021,575 | | | $ | 33,759,340 | |
| Total distributable (accumulated) | | | | | | | | | | | | |
| earnings (losses) | | | (1,930,000 | ) | | | 25,738,391 | | | | 24,171,174 | |
| Net assets | | $ | 19,607,755 | | | $ | 521,759,966 | | | $ | 57,930,514 | |
| Net assets value (unlimited shares authorized): | | | | | | | | | | | | |
| Net assets | | $ | 19,607,755 | | | $ | 521,759,966 | | | $ | 57,930,514 | |
| Shares of beneficial interest | | | | | | | | | | | | |
| issued and outstanding | | | 858,904 | | | | 16,104,496 | | | | 984,326 | |
| Net asset value, offering, and | | | | | | | | | | | | |
| redemption price per share | | $ | 22.83 | | | $ | 32.40 | | | $ | 58.85 | |
The accompanying notes are an integral part of these financial statements.
BOSTON COMMON ESG IMPACT FUNDS
STATEMENTS OF OPERATIONS For the Six Months Ended March 31, 2022 (Unaudited) |
| | | Emerging | | | International | | | U.S. Equity | |
| | | Markets Fund | | | Fund | | | Fund | |
| INVESTMENT INCOME | | | | | | | | | |
| Income: | | | | | | | | | |
| Dividends (net of foreign withholding tax | | | | | | | | | |
| and issuance fees of $20,389, $480,934 | | | | | | | | | |
| and $1,846, respectively) | | $ | 188,647 | | | $ | 3,745,404 | | | $ | 337,295 | |
| Interest | | | 11 | | | | 1,274 | | | | 310 | |
| Total investment income | | | 188,658 | | | | 3,746,678 | | | | 337,605 | |
| | | | | | | | | | | | | |
| Expenses: | | | | | | | | | | | | |
| Investment advisory fees | | | 82,289 | | | | 2,084,875 | | | | 221,247 | |
| Custody fees | | | 24,474 | | | | 68,513 | | | | 2,589 | |
| Fund administration & fund accounting fees | | | 20,132 | | | | 193,746 | | | | 39,670 | |
| Professional fees | | | 15,446 | | | | 15,540 | | | | 15,480 | |
| Registration fees | | | 13,952 | | | | 16,812 | | | | 10,933 | |
| Chief Compliance Officer fees | | | 5,980 | | | | 6,116 | | | | 6,116 | |
| Miscellaneous expense | | | 4,405 | | | | 10,792 | | | | 2,436 | |
| Insurance expenses | | | 3,401 | | | | 3,355 | | | | 2,652 | |
| Trustee fees | | | 1,607 | | | | 12,003 | | | | 8,916 | |
| Transfer agent fees | | | 1,243 | | | | 42,178 | | | | 10,974 | |
| Reports to shareholders | | | 1,125 | | | | 8,523 | | | | 1,106 | |
| Total expenses | | | 174,054 | | | | 2,462,453 | | | | 322,119 | |
| Less: fees waived | | | (78,212 | ) | | | (36,981 | ) | | | (27,122 | ) |
| Net expenses | | | 95,842 | | | | 2,425,472 | | | | 294,997 | |
| Net investment income (loss) | | | 92,816 | | | | 1,321,206 | | | | 42,608 | |
| | | | | | | | | | | | | |
| REALIZED AND UNREALIZED GAIN (LOSS) ON INVESTMENTS AND FOREIGN CURRENCY | | | | | | | | | | | | |
| Net realized gain (loss) on investments | | | | | | | | | | | | |
| and foreign currency | | | (343,706 | ) | | | 660,269 | | | | 2,389,190 | |
| Net change in unrealized | | | | | | | | | | | | |
| appreciation/depreciation on investments | | | | | | | | | | | | |
| and foreign currency | | | (1,591,639 | ) | | | (78,256,303 | ) | | | (2,821,578 | ) |
| Net realized and unrealized gain (loss) | | | | | | | | | | | | |
| on investments and foreign currency | | | (1,935,345 | ) | | | (77,596,034 | ) | | | (432,388 | ) |
| NET INCREASE (DECREASE) IN | | | | | | | | | | | | |
| NET ASSETS RESULTING | | | | | | | | | | | | |
| FROM OPERATIONS | | $ | (1,842,529 | ) | | $ | (76,274,828 | ) | | $ | (389,780 | ) |
The accompanying notes are an integral part of these financial statements.
BOSTON COMMON ESG IMPACT EMERGING MARKETS FUND
| STATEMENTS OF CHANGES IN NET ASSETS |
| | | Six Months Ended | | | | |
| | | March 31, | | | Period Ended | |
| | | 2022 | | | September 30, | |
| | | (Unaudited) | | | 20211 | |
| NET INCREASE (DECREASE) IN NET ASSETS FROM: | | | | | | |
| | | | | | | |
| OPERATIONS | | | | | | |
| Net investment income (loss) | | $ | 92,816 | | | $ | 568 | |
| Net realized gain (loss) on investments | | | | | | | | |
| and foreign currency | | | (343,706 | ) | | | (292 | ) |
| Net change in unrealized appreciation/depreciation | | | | | | | | |
| on investments and foreign currency | | | (1,591,639 | ) | | | 282 | |
| Net increase (decrease) in net assets | | | | | | | | |
| resulting from operations | | | (1,842,529 | ) | | | 558 | |
| | | | | | | | | |
| DISTRIBUTIONS TO SHAREHOLDERS | | | | | | | | |
| Net distributions to shareholders | | | (88,029 | ) | | | — | |
| | | | | | | | | |
| CAPITAL SHARE TRANSACTIONS | | | | | | | | |
Net increase (decrease) from capital share transactions2 | | | 20,787,705 | | | | 750,050 | |
| Total increase (decrease) in net assets | | | 18,857,147 | | | | 750,608 | |
| | | | | | | | | |
| NET ASSETS | | | | | | | | |
| Beginning of period | | | 750,608 | | | | — | |
| End of period | | $ | 19,607,755 | | | $ | 750,608 | |
1 | Emerging Markets Fund commenced operations on September 21, 2021. Information presented is for the period from September 21, 2021 to September 30, 2021. |
2 | A summary of share transactions is as follows: |
| | | | Six Months Ended | | | | | | | |
| | | | March 31, 2022 | | | Period Ended | |
| | | | (Unaudited) | | | September 30, 20211 | |
| | | | Shares | | | Value | | | Shares | | | Value | |
| | Shares sold | | | 828,902 | | | $ | 20,787,705 | | | | 30,002 | | | $ | 750,050 | |
| | Shares issued to holders | | | | | | | | | | | | | | | | |
| | in reinvestment | | | | | | | | | | | | | | | | |
| | of distributions | | | — | | | | — | | | | — | | | | — | |
| | Shares redeemed | | | — | | | | — | | | | — | | | | — | |
| | Net increase (decrease) | | | 828,902 | | | $ | 20,787,705 | | | | 30,002 | | | $ | 750,050 | |
| | Beginning shares | | | 30,002 | | | | | | | | — | | | | | |
| | Ending shares | | | 858,904 | | | | | | | | 30,002 | | | | | |
The accompanying notes are an integral part of these financial statements.
BOSTON COMMON ESG IMPACT INTERNATIONAL FUND
| STATEMENTS OF CHANGES IN NET ASSETS |
| | | Six Months Ended | | | Year Ended | |
| | | March 31, 2022 | | | September 30, | |
| | | (Unaudited) | | | 2021 | |
| NET INCREASE (DECREASE) IN NET ASSETS FROM: | | | | | | |
| | | | | | | |
| OPERATIONS | | | | | | |
| Net investment income (loss) | | $ | 1,321,206 | | | $ | 4,581,376 | |
| Net realized gain (loss) on investments | | | | | | | | |
| and foreign currency | | | 660,269 | | | | 19,368,544 | |
| Net change in unrealized appreciation/depreciation | | | | | | | | |
| on investments and foreign currency | | | (78,256,303 | ) | | | 39,390,751 | |
| Net increase (decrease) in net assets | | | | | | | | |
| resulting from operations | | | (76,274,828 | ) | | | 63,340,671 | |
| | | | | | | | | |
| DISTRIBUTIONS TO SHAREHOLDERS | | | | | | | | |
| Net distributions to shareholders | | | (16,589,883 | ) | | | (2,338,866 | ) |
| | | | | | | | | |
| CAPITAL SHARE TRANSACTIONS | | | | | | | | |
Net increase (decrease) from capital share transactions1 | | | 119,427,613 | | | | 113,669,434 | |
| Total increase (decrease) in net assets | | | 26,562,902 | | | | 174,671,239 | |
| | | | | | | | | |
| NET ASSETS | | | | | | | | |
| Beginning of period/year | | | 495,197,064 | | | | 320,525,825 | |
| End of period/year | | $ | 521,759,966 | | | $ | 495,197,064 | |
1 | A summary of share transactions is as follows: |
| | | | Six Months Ended | | | | | | | |
| | | | March 31, 2022 | | | Year Ended | |
| | | | (Unaudited) | | | September 30, 2021 | |
| | | | Shares | | | Value | | | Shares | | | Value | |
| | Shares sold | | | 4,332,200 | | | $ | 156,330,296 | | | | 4,232,060 | | | $ | 161,052,129 | |
| | Shares issued to holder | | | | | | | | | | | | | | | | |
| | in reinvestment | | | | | | | | | | | | | | | | |
| | of distributions | | | 350,363 | | | | 12,819,778 | | | | 47,872 | | | | 1,758,818 | |
| | Shares redeemed2 | | | (1,420,853 | ) | | | (49,722,461 | ) | | | (1,304,685 | ) | | | (49,141,513 | ) |
| | Net increase (decrease) | | | 3,261,710 | | | $ | 119,427,613 | | | | 2,975,247 | | | $ | 113,669,434 | |
| | Beginning shares | | | 12,842,786 | | | | | | | | 9,867,539 | | | | | |
| | Ending shares | | | 16,104,496 | | | | | | | | 12,842,786 | | | | | |
2 | Net of redemption fees of $3,872 and $2,936, respectively. |
The accompanying notes are an integral part of these financial statements.
BOSTON COMMON ESG IMPACT U.S. EQUITY FUND
| STATEMENTS OF CHANGES IN NET ASSETS |
| | | Six Months Ended | | | Year Ended | |
| | | March 31, 2022 | | | September 30, | |
| | | (Unaudited) | | | 2021 | |
| NET INCREASE (DECREASE) IN NET ASSETS FROM: | | | | | | |
| | | | | | | |
| OPERATIONS | | | | | | |
| Net investment income (loss) | | $ | 42,608 | | | $ | 71,534 | |
| Net realized gain (loss) on investments | | | | | | | | |
| and foreign currency and foreign currency | | | 2,389,190 | | | | 2,596,084 | |
| Net change in unrealized appreciation/depreciation | | | | | | | | |
| of investments and foreign currency | | | (2,821,578 | ) | | | 10,367,665 | |
| Net increase (decrease) in net assets | | | | | | | | |
| resulting from operations | | | (389,780 | ) | | | 13,035,283 | |
| | | | | | | | | |
| DISTRIBUTIONS TO SHAREHOLDERS | | | | | | | | |
| Net distributions to shareholders | | | (2,542,396 | ) | | | (171,071 | ) |
| | | | | | | | | |
| CAPITAL SHARE TRANSACTIONS | | | | | | | | |
| Net increase (decrease) from | | | | | | | | |
capital share transactions1 | | | 3,371,021 | | | | 1,414,574 | |
| Total increase (decrease) in net assets | | | 438,845 | | | $ | 14,278,786 | |
| | | | | | | | | |
| NET ASSETS | | | | | | | | |
| Beginning of period/year | | | 57,491,669 | | | | 43,212,883 | |
| End of period/year | | $ | 57,930,514 | | | $ | 57,491,669 | |
1 | A summary of share transactions is as follows: |
| | | | Six Months Ended | | | | | | | |
| | | | March 31, 2022 | | | Year Ended | |
| | | | (Unaudited) | | | September 30, 2021 | |
| | | | Shares | | | Value | | | Shares | | | Value | |
| | Shares sold | | | 51,130 | | | $ | 3,049,837 | | | | 99,589 | | | $ | 5,716,250 | |
| | Shares issued to holders | | | | | | | | | | | | | | | | |
| | in reinvestment | | | | | | | | | | | | | | | | |
| | of distributions | | | 34,244 | | | | 2,147,805 | | | | 2,600 | | | | 139,573 | |
| | Shares redeemed | | | (28,958 | ) | | | (1,826,621 | ) | | | (75,076 | ) | | | (4,441,249 | ) |
| | Net increase (decrease) | | | 56,416 | | | $ | 3,371,021 | | | | 27,113 | | | $ | 1,414,574 | |
| | Beginning shares | | | 927,910 | | | | | | | | 900,797 | | | | | |
| | Ending shares | | | 984,326 | | | | | | | | 927,910 | | | | | |
The accompanying notes are an integral part of these financial statements.
BOSTON COMMON ESG IMPACT EMERGING MARKETS FUND
FINANCIAL HIGHLIGHTS For a capital share outstanding throughout each period |
| | | Six Months Ended | | | | |
| | | March 31, | | | Period Ended | |
| | | 2022 | | | September 30, | |
| | | (Unaudited) | | | 20211 | |
| Net asset value, beginning of period | | $ | 25.02 | | | $ | 25.00 | |
| | | | | | | | | |
| INCOME (LOSS) FROM INVESTMENT OPERATIONS: | | | | | | | | |
Net investment income (loss)2 | | | 0.12 | | | | 0.02 | |
| Net realized and unrealized gain (loss) on investments | | | (2.91 | ) | | | — | |
| Total from operations | | | (2.79 | ) | | | 0.02 | |
| | | | | | | | | |
| LESS DISTRIBUTIONS: | | | | | | | | |
| Distributions from net investment income | | | — | | | | — | |
| Distributions from net realized gain | | | 0.60 | | | | — | |
| Total distributions | | | 0.60 | | | | — | |
| Net asset value, end of period | | $ | 22.83 | | | $ | 25.02 | |
| Total return | | | (8.32 | )%3 | | | 0.08 | %3 |
| | | | | | | | | |
| SUPPLEMENTAL DATA: | | | | | | | | |
| Net assets, end of period (000’s) | | $ | 19,608 | | | $ | 751 | |
| Expenses before fees waived | | | 1.80 | %4 | | | 63.49 | %4 |
| Expenses after fees waived | | | 0.99 | %4 | | | 0.99 | %4 |
| Net investment income before fees waived | | | 0.15 | %4 | | | (59.75 | )%4 |
| Net investment income after fees waived | | | 0.96 | %4 | | | 2.75 | %4 |
| Portfolio turnover rate | | | 0 | %3 | | | 0 | %3 |
1 | Emerging Markets Fund commenced operations on September 21, 2021. Information presented is for the period from September 21, 2021 to September 30, 2021. |
2 | Calculated based on average shares outstanding during the period. |
3 | Not Annualized. |
4 | Annualized. |
The accompanying notes are an integral part of these financial statements.
BOSTON COMMON ESG IMPACT INTERNATIONAL FUND
FINANCIAL HIGHLIGHTS For a capital share outstanding throughout each period/year |
| | | Six Months | | | | | | | | | | | | | | | | |
| | | Ended | | | | | | | | | | | | | | | | |
| | | March 31, | | | | | | | | | | | | | | | | |
| | | 2022 | | | Year Ended September 30, | |
| | | (Unaudited) | | | 2021 | | | 2020 | | | 2019 | | | 2018 | | | 2017 | |
| Net asset value, beginning | | | | | | | | | | | | | | | | | | |
| of period/year | | $ | 38.56 | | | $ | 32.48 | | | $ | 29.32 | | | $ | 30.51 | | | $ | 30.14 | | | $ | 26.12 | |
| | | | | | | | | | | | | | | | | | | | | | | | | |
| INCOME (LOSS) FROM INVESTMENT OPERATIONS: | | | | | | | | | | | | | | | | | |
| Net investment | | | | | | | | | | | | | | | | | | | | | | | | |
income (loss)1 | | | 0.09 | | | | 0.40 | | | | 0.23 | | | | 0.59 | | | | 0.42 | | | | 0.35 | |
| Net realized and unrealized | | | | | | | | | | | | | | | | | | | | | | | | |
| gain (loss) on investments | | | (6.20 | ) | | | 5.92 | | | | 3.64 | | | | (1.41 | ) | | | 0.31 | | | | 4.07 | |
| Total from operations | | | (6.11 | ) | | | 6.32 | | | | 3.87 | | | | (0.82 | ) | | | 0.73 | | | | 4.42 | |
| | | | | | | | | | | | | | | | | | | | | | | | | |
| LESS DISTRIBUTIONS: | | | | | | | | | | | | | | | | | | | | | | | | |
| Distributions from net | | | | | | | | | | | | | | | | | | | | | | | | |
| investment income | | | (0.65 | ) | | | (0.24 | ) | | | (0.71 | ) | | | (0.37 | ) | | | (0.36 | ) | | | (0.40 | ) |
| Distributions from | | | | | | | | | | | | | | | | | | | | | | | | |
| net realized gain | | | 0.60 | | | | — | | | | — | | | | — | | | | — | | | | — | |
| Total distributions | | | (0.05 | ) | | | (0.24 | ) | | | (0.71 | ) | | | (0.37 | ) | | | (0.36 | ) | | | (0.40 | ) |
| Paid-in capital from | | | | | | | | | | | | | | | | | | | | | | | | |
| redemption fees | | | 0.00 | 2 | | | 0.00 | 2 | | | 0.00 | 2 | | | 0.00 | 2 | | | 0.00 | 2 | | | 0.00 | 2 |
| Net asset value, | | | | | | | | | | | | | | | | | | | | | | | | |
| end of period/year | | $ | 32.40 | | | $ | 38.56 | | | $ | 32.48 | | | $ | 29.32 | | | $ | 30.51 | | | $ | 30.14 | |
| Total return | | | (13.11 | )%3 | | | 19.48 | % | | | 13.29 | % | | | (2.53 | )% | | | 2.43 | % | | | 17.26 | % |
| | | | | | | | | | | | | | | | | | | | | | | | | |
| SUPPLEMENTAL DATA: | | | | | | | | | | | | | | | | | | | | | | | | |
| Net assets, end of | | | | | | | | | | | | | | | | | | | | | | | | |
| period/year (000’s) | | $ | 521,760 | | | $ | 495,197 | | | $ | 320,526 | | | $ | 234,114 | | | $ | 250,694 | | | $ | 219,225 | |
| Expenses before | | | | | | | | | | | | | | | | | | | | | | | | |
| fees waived | | | 0.96 | %4 | | | 0.97 | % | | | 1.00 | % | | | 1.00 | % | | | 1.04 | % | | | 1.13 | % |
| Expenses after | | | | | | | | | | | | | | | | | | | | | | | | |
| fees waived | | | 0.95 | %4,5 | | | 0.97 | % | | | 1.00 | % | | | 1.00 | % | | | 1.04 | % | | | 1.13 | % |
| Net investment income | | | | | | | | | | | | | | | | | | | | | | | | |
| before fees waived | | | 0.49 | %4 | | | 1.07 | % | | | 0.75 | % | | | 2.09 | % | | | 1.38 | % | | | 1.28 | % |
| Net investment income | | | | | | | | | | | | | | | | | | | | | | | | |
| after fees waived | | | 0.51 | %4 | | | 1.07 | % | | | 0.75 | % | | | 2.09 | % | | | 1.38 | % | | | 1.28 | % |
| Portfolio turnover rate | | | 24 | %3 | | | 24 | % | | | 33 | % | | | 32 | % | | | 26 | % | | | 33 | % |
1 | Calculated based on average shares outstanding during the period. |
2 | Less than $0.01 or $(0.01) per share, as applicable. |
3 | Not Annualized. |
4 | Annualized. |
5 | Prior to March 1, 2022, the expense cap was 1.20%. Effective March 1, 2022, the expense cap decreased to 0.86%. |
The accompanying notes are an integral part of these financial statements.
BOSTON COMMON ESG IMPACT U.S. EQUITY FUND
FINANCIAL HIGHLIGHTS For a capital share outstanding throughout each period/year |
| | | Six Months | | | | | | | | | | | | | | | | |
| | | Ended | | | | | | | | | | | | | | | | |
| | | March 31, | | | | | | | | | | | | | | | | |
| | | 2022 | | | Year Ended September 30, | |
| | | (Unaudited) | | | 2021 | | | 2020 | | | 2019 | | | 2018 | | | 2017 | |
| Net asset value, beginning | | | | | | | | | | | | | | | | | | |
| of period/year | | $ | 61.96 | | | $ | 47.97 | | | $ | 43.69 | | | $ | 45.18 | | | $ | 41.77 | | | $ | 36.85 | |
| | | | | | | | | | | | | | | | | | | | | | | | | |
| INCOME (LOSS) FROM INVESTMENT OPERATIONS: | | | | | | | | | | | | | | | | | |
| Net investment | | | | | | | | | | | | | | | | | | | | | | | | |
income (loss)1 | | | 0.05 | | | | 0.08 | | | | 0.23 | | | | 0.29 | | | | 0.28 | | | | 0.38 | |
| Net realized and unrealized | | | | | | | | | | | | | | | | | | | | | | | | |
| gain (loss) on investments | | | (0.41 | ) | | | 14.10 | | | | 5.85 | | | | 0.25 | | | | 4.47 | | | | 5.23 | |
| Total from operations | | | (0.36 | ) | | | 14.18 | | | | 6.08 | | | | 0.54 | | | | 4.75 | | | | 5.61 | |
| | | | | | | | | | | | | | | | | | | | | | | | | |
| LESS DISTRIBUTIONS: | | | | | | | | | | | | | | | | | | | | | | | | |
| Distributions from net | | | | | | | | | | | | | | | | | | | | | | | | |
| investment income | | | (0.06 | ) | | | (0.19 | ) | | | (0.27 | ) | | | (0.29 | ) | | | (0.37 | ) | | | (0.31 | ) |
| Distributions from | | | | | | | | | | | | | | | | | | | | | | | | |
| net realized gain | | | (2.69 | ) | | | — | | | | (1.53 | ) | | | (1.74 | ) | | | (0.97 | ) | | | (0.38 | ) |
| Total distributions | | | (2.75 | ) | | | (0.19 | ) | | | (1.80 | ) | | | (2.03 | ) | | | (1.34 | ) | | | (0.69 | ) |
| Paid-in capital from | | | | | | | | | | | | | | | | | | | | | | | | |
| redemption fees | | | — | | | | — | | | | — | | | | — | | | | — | | | | 0.00 | 2 |
| Net asset value, | | | | | | | | | | | | | | | | | | | | | | | | |
| end of period/year | | $ | 58.85 | | | $ | 61.96 | | | $ | 47.97 | | | $ | 43.69 | | | $ | 45.18 | | | $ | 41.77 | |
| Total return | | | (0.85 | )%3 | | | 29.62 | % | | | 14.17 | % | | | 2.02 | % | | | 11.50 | % | | | 15.47 | % |
| | | | | | | | | | | | | | | | | | | | | | | | | |
| SUPPLEMENTAL DATA: | | | | | | | | | | | | | | | | | | | | | | | | |
| Net assets, end | | | | | | | | | | | | | | | | | | | | | | | | |
| of period/year (000’s) | | $ | 57,931 | | | $ | 57,492 | | | $ | 43,213 | | | $ | 37,974 | | | $ | 36,181 | | | $ | 33,794 | |
| Expenses before | | | | | | | | | | | | | | | | | | | | | | | | |
| fees waived | | | 1.09 | %4 | | | 1.14 | % | | | 1.27 | % | | | 1.25 | % | | | 1.30 | % | | | 1.38 | % |
| Expenses after | | | | | | | | | | | | | | | | | | | | | | | | |
| fees waived | | | 1.00 | %4 | | | 1.00 | % | | | 1.00 | % | | | 1.00 | % | | | 1.00 | % | | | 1.00 | % |
| Net investment income | | | | | | | | | | | | | | | | | | | | | | | | |
| before fees waived | | | 0.05 | %4 | | | (0.01 | )% | | | 0.23 | % | | | 0.43 | % | | | 0.34 | % | | | 0.61 | % |
| Net investment income | | | | | | | | | | | | | | | | | | | | | | | | |
| after fees waived | | | 0.14 | %4 | | | 0.13 | % | | | 0.50 | % | | | 0.68 | % | | | 0.64 | % | | | 0.99 | % |
| Portfolio turnover rate | | | 19 | %3 | | | 19 | % | | | 38 | % | | | 28 | % | | | 27 | % | | | 22 | % |
1 | Calculated based on average shares outstanding during the period. |
2 | Does not round to $0.01 or $(0.01), as applicable. |
3 | Not Annualized. |
4 | Annualized. |
The accompanying notes are an integral part of these financial statements.
BOSTON COMMON ESG IMPACT FUNDS
NOTES TO FINANCIAL STATEMENTS March 31, 2022 (Unaudited) |
The Emerging Markets Fund, International Fund and the U.S. Equity Fund (collectively the “Funds”) are each a diversified series of shares of beneficial interest of Professionally Managed Portfolios (the “Trust”), which is registered under the Investment Company Act of 1940, as amended, (the “1940 Act”) as an open-end management investment company. The Funds commenced operations on September 21, 2021, December 29, 2010 and April 30, 2012, respectively. Each Fund is an investment company and accordingly follows the investment company accounting and reporting guidance of the Financial Accounting Standards Board (FASB) Accounting Standard Codification Topic 946 “Financial Services — Investment Companies.”
The Funds’ investment objective is to seek long-term capital appreciation. The Funds seek to preserve and build capital over the long-term through investing in a diversified portfolio of common stocks and American Depositary Receipts (“ADR”) of companies it believes are high quality, sustainable and undervalued. The Emerging Markets Fund and the International Fund invest in European Depositary Receipts and Global Depositary Receipts.
| NOTE 2 – SIGNIFICANT ACCOUNTING POLICIES |
The following is a summary of significant accounting policies consistently followed by the Funds. These policies are in conformity with accounting principles generally accepted in the United States of America (“U.S. GAAP”).
| | A. | Security Valuation. Security Valuation. All equity securities, which may include Real Estate Investment Trusts (“REITs”), Business Development Companies (“BDCs”) and Master Limited Partnerships (“MLPs”), that are traded on U.S. national or foreign securities exchanges are valued at the last reported sale price on the exchange on which the security is principally traded or the exchange’s official closing price, if applicable. If, on a particular day, an exchange-traded security does not trade, then the mean between the most recent quoted bid and asked prices will be used. All equity securities, which may include REITs, BDCs and MLPs, which are not traded on a listed exchange are valued at the last sale price in the over-the-counter market. If a non-exchange traded security does not trade on a particular day, then the mean between the last quoted closing bid and asked price will be used. |
| | | |
| | | For foreign securities traded on foreign exchanges the Trust has selected ICE Data Services Fair Value Information Services (“FVIS”) to provide pricing data with respect to foreign security holdings held by the Emerging Markets Fund and the International Fund. The use of this third-party pricing service is designed to capture events occurring after |
BOSTON COMMON ESG IMPACT FUNDS
NOTES TO FINANCIAL STATEMENTS March 31, 2022 (Unaudited) (Continued) |
| | | a foreign exchange closes that may affect the value of certain holdings of the Funds’ securities traded on those foreign exchanges. The Funds utilize a confidence interval when determining the use of the FVIS provided prices. The confidence interval is a measure of the historical relationship that each foreign exchange traded security has to movements in various indices and the price of the security’s corresponding ADR, if one exists. FVIS provides the confidence interval for each security for which it provides a price. If the FVIS provided price falls within the confidence interval the Funds will value the particular security at that price. If the FVIS provided price does not fall within the confidence interval the particular security will be valued at the preceding closing price on its respective foreign exchange, or if there were no transactions on such day, at the mean between the bid and asked prices. |
| | | |
| | | Securities for which quotations are not readily available are valued at their respective fair values as determined in good faith by the Trust’s Valuation Committee of the Trust. When a security is “fair valued,” consideration is given to the facts and circumstances relevant to the particular situation, including a review of various factors set forth in the pricing procedures adopted by the Trust’s Board of Trustees (the “Board”). Fair value pricing is an inherently subjective process, and no single standard exists for determining fair value. Different funds could reasonably arrive at different values for the same security. The use of fair value pricing by a fund may cause the net asset value of its shares to differ significantly from the net asset value that would be calculated without regard to such considerations. The FVIS valued foreign securities as discussed in the paragraph above are considered fair valued securities by the International Fund. |
| | | |
| | | As described above, the Funds utilize various methods to measure the fair value of its investments on a recurring basis. U.S. GAAP establishes a hierarchy that prioritizes inputs to valuation methods. The three levels of inputs are: |
| | Level 1 – | Unadjusted quoted prices in active markets for identical assets or liabilities that the Funds have the ability to access. |
| | | |
| | Level 2 – | Observable inputs other than quoted prices included in Level 1 that are observable for the asset or liability, either directly or indirectly. These inputs may include quoted prices for the identical instrument on an inactive market, prices for similar instruments, interest rates, prepayment speeds, credit risk, yield curves, default rates and similar data. |
BOSTON COMMON ESG IMPACT FUNDS
NOTES TO FINANCIAL STATEMENTS March 31, 2022 (Unaudited) (Continued) |
| | Level 3 – | Unobservable inputs for the asset or liability, to the extent relevant observable inputs are not available; representing the Funds’ own assumptions about the assumptions a market participant would use in valuing the asset or liability and would be based on the best information available. |
| | | The availability of observable inputs can vary from security to security and is affected by a wide variety of factors, including, for example, the type of security, whether the security is new and not yet established in the marketplace, the liquidity of markets, and other characteristics particular to the security. To the extent that valuation is based on models or inputs that are less observable or unobservable in the market, the determination of fair value requires more judgment. Accordingly, the degree of judgment exercised in determining fair value is greatest for instruments categorized in Level 3. |
| | | |
| | | The inputs used to measure fair value may fall into different levels of the fair value hierarchy. In such cases, for disclosure purposes, the level in the fair value hierarchy within which the fair value measurement falls in its entirety, is determined based on the lowest level input that is significant to the fair value measurement in its entirety. |
| | | |
| | | The following is a summary of the inputs used to value the Funds’ investments as of March 31, 2022. See the Schedules of Investments for sector breakouts. |
| | | |
| | | Emerging Markets Fund |
| | Description | | Level 1 | | | Level 2 | | | Level 3 | | | Total | |
| | Common Stocks | | | | | | | | | | | | |
| | Communication | | | | | | | | | | | | |
| | Services | | $ | 413,535 | | | $ | 621,601 | | | $ | — | | | $ | 1,035,136 | |
| | Consumer Discretionary | | | 1,086,498 | | | | 2,393,099 | | | | — | | | | 3,479,597 | |
| | Consumer Staples | | | 605,005 | | | | 550,268 | | | | — | | | | 1,155,273 | |
| | Financials | | | 1,367,149 | | | | 2,356,008 | | | | — | | | | 3,723,157 | |
| | Health Care | | | 511,707 | | | | 630,521 | | | | — | | | | 1,142,228 | |
| | Industrials | | | 382,782 | | | | 645,268 | | | | — | | | | 1,028,050 | |
| | Information Technology | | | 2,129,721 | | | | 2,605,705 | | | | — | | | | 4,735,426 | |
| | Materials | | | 338,719 | | | | 702,838 | | | | — | | | | 1,041,557 | |
| | Real Estate | | | 238,161 | | | | 355,504 | | | | — | | | | 593,665 | |
| | Utilities | | | — | | | | 121,404 | | | | — | | | | 121,404 | |
| | Total Common Stocks | | | 7,343,277 | | | | 10,982,216 | | | | — | | | | 18,325,493 | |
| | Preferred Stocks | | | 689,278 | | | | — | | | | — | | | | 689,278 | |
| | Short-Term | | | | | | | | | | | | | | | | |
| | Investments | | | 553,832 | | | | — | | | | — | | | | 553,832 | |
| | Total Investments | | | | | | | | | | | | | | | | |
| | in Securities | | $ | 8,586,387 | | | $ | 10,982,216 | | | $ | — | | | $ | 19,568,603 | |
BOSTON COMMON ESG IMPACT FUNDS
NOTES TO FINANCIAL STATEMENTS March 31, 2022 (Unaudited) (Continued) |
| | International Fund | | | | | | | | | | | | |
| | | | | | | | | | | | | | |
| | Description | | Level 1 | | | Level 2 | | | Level 3 | | | Total | |
| | Common Stocks | | | | | | | | | | | | |
| | Communication | | | | | | | | | | | | |
| | Services | | $ | — | | | $ | 16,326,092 | | | $ | — | | | $ | 16,326,092 | |
| | Consumer | | | | | | | | | | | | | | | | |
| | Discretionary | | | 5,480,800 | | | | 57,373,706 | | | | — | | | | 62,854,506 | |
| | Consumer Staples | | | 21,420,835 | | | | 16,568,938 | | | | — | | | | 37,989,773 | |
| | Financials | | | 5,447,637 | | | | 110,300,986 | | | | — | | | | 115,748,623 | |
| | Health Care | | | 36,268,898 | | | | 39,845,557 | | | | — | | | | 76,114,455 | |
| | Industrials | | | — | | | | 97,777,414 | | | | — | | | | 97,777,414 | |
| | Information Technology | | | 16,039,075 | | | | 29,487,532 | | | | — | | | | 45,526,607 | |
| | Materials | | | — | | | | 29,365,018 | | | | — | | | | 29,365,018 | |
| | Real Estate | | | — | | | | 20,519,612 | | | | — | | | | 20,519,612 | |
| | Utilities | | | — | | | | 8,597,530 | | | | — | | | | 8,597,530 | |
| | Total Common Stocks | | | 84,657,245 | | | | 426,162,385 | | | | — | | | | 510,819,630 | |
| | Short-Term | | | | | | | | | | | | | | | | |
| | Investments | | | 8,846,379 | | | | — | | | | — | | | | 8,846,379 | |
| | Total Investments | | | | | | | | | | | | | | | | |
| | in Securities | | $ | 93,503,624 | | | $ | 426,162,385 | | | $ | — | | | $ | 519,666,009 | |
| | | | | | | | | | | | | | | | | | |
| | U.S. Equity Fund | | | | | | | | | | | | | | | | |
| | | | | | | | | | | | | | | | | | |
| | Description | | Level 1 | | | Level 2 | | | Level 3 | | | Total | |
| | Common Stocks | | $ | 56,677,157 | | | $ | — | | | $ | — | | | $ | 56,677,157 | |
| | Short-Term | | | | | | | | | | | | | | | | |
| | Investments | | | 1,241,136 | | | | — | | | | — | | | | 1,241,136 | |
| | Total Investments | | | | | | | | | | | | | | | | |
| | in Securities | | $ | 57,918,293 | | | $ | — | | | $ | — | | | $ | 57,918,293 | |
| | B. | Foreign Currency. Investment securities and other assets and liabilities denominated in foreign currencies are translated into U.S. dollar amounts at the date of valuation. Purchases and sales of investment securities and income and expense items denominated in foreign currencies are translated into U.S. dollar amounts on the respective dates of such transactions. |
| | | |
| | | The Funds do not isolate that portion of the results of operations resulting from changes in foreign exchange rates on investments from the fluctuations arising from changes in market prices of securities held. Such fluctuations are included with the net realized and unrealized gain or loss from investments. |
BOSTON COMMON ESG IMPACT FUNDS
NOTES TO FINANCIAL STATEMENTS March 31, 2022 (Unaudited) (Continued) |
| | | The Funds report net realized foreign exchange gains or losses that arise from sales of foreign currencies, currency gains or losses realized between the trade and settlement dates on securities transactions, and the difference between the amounts of dividends, interest, and foreign withholding taxes recorded on the Funds’ books and the U.S. dollar equivalent of the amounts actually received or paid. Net unrealized foreign exchange gains and losses arise from changes in the fair values of assets and liabilities, other than investments in securities at period end, resulting from changes in exchange rates |
| | | |
| | C. | Federal Income Taxes. Each Fund has elected to be taxed as a “regulated investment company” and intends to distribute substantially all taxable income to its shareholders and otherwise comply with the provisions of the Internal Revenue Code applicable to regulated investment companies. Therefore, no provision for federal income taxes or excise taxes has been made. |
| | | |
| | | In order to avoid imposition of the excise tax applicable to regulated investment companies, each Fund intends to declare each year as dividends in each calendar year at least 98.0% of its net investment income (earned during the calendar year) and at least 98.2% of its net realized capital gains (earned during the twelve months ended October 31) plus undistributed amounts, if any, from prior years. |
| | | |
| | | Net capital losses incurred after October 31, within the taxable year are deemed to arise on the first business day of the Funds’ next taxable year. As of the most recent fiscal year ended September 30, 2021, the Funds had no post-October losses or late year losses. During the most recent fiscal year ended September 30, 2021, the International Fund utilized $9,139,730 of short-term capital loss carryforwards and $3,088,855 of long-term capital loss carryforwards. |
| | | |
| | | As of March 31, 2022, the Funds did not have any tax positions that did not meet the “more likely than not” threshold of being sustained by the applicable tax authority. Generally, tax authorities can examine all the tax returns filed for the last three years. The Funds identify their major tax jurisdictions as U.S. Federal and the Commonwealth of Massachusetts. As of March 31, 2022, the Funds are not aware of any tax provisions for which it is reasonably possible that the total amounts of unrecognized tax benefits will change materially. |
| | | |
| | D. | Securities Transactions and Investment Income. Investment securities transactions are accounted for on the trade date. Gains and losses realized on sales of securities are determined on a specific identification |
BOSTON COMMON ESG IMPACT FUNDS
NOTES TO FINANCIAL STATEMENTS March 31, 2022 (Unaudited) (Continued) |
| | | basis. Discounts/premiums on debt securities purchased are accreted/amortized over the life of the respective securities using the effective interest method. Dividend income is recorded on the ex-dividend date. Dividends received from REITs are generally comprised of ordinary income, capital gains and may include return of capital. Interest income is recorded on an accrual basis. Other non-cash dividends are recognized as investment income at the fair value of the property received. Withholding taxes on foreign dividends have been provided for in accordance with the Trust’s understanding of the applicable country’s tax rules and rates. |
| | | |
| | E. | Distributions to Shareholders. Distributions to shareholders from net investment income and net realized gains on securities for the Funds normally are declared and paid on an annual basis. Distributions are recorded on the ex-dividend date. |
| | | |
| | F. | Use of Estimates. The preparation of financial statements in conformity with U.S. GAAP requires management to make estimates and assumptions that affect the reported amounts of assets and liabilities at the date of the financial statements, as well as the reported amounts of revenues and expenses during the period. Actual results could differ from those estimates. |
| | | |
| | G. | Share Valuation. The net asset value (“NAV”) per share of each Fund is calculated by dividing the sum of the value of the securities held by the Fund, plus cash and other assets, minus all liabilities (including estimated accrued expenses) by the total number of shares outstanding of the Fund, rounded to the nearest cent. The Funds’ shares will not be priced on the days on which the New York Stock Exchange is closed for trading. The offering and redemption price per share for each Fund is equal to the Funds’ net asset value per share. The Funds charge a 2.00% redemption fee on shares held less than 30 calendar days. These fees are deducted from the redemption proceeds otherwise payable to the shareholder. The Funds will retain the fee charged as paid-in capital and such fees become part of that Funds’ daily NAV calculation. |
| | | |
| | H. | Illiquid Securities. Pursuant to Rule 22e-4 under the 1940 Act, the Funds have adopted a Board approved liquidity risk management program that requires, among other things, that the Funds limit their illiquid investments that are assets to no more than 15% of net assets. An illiquid investment is any investment that the Funds reasonably expect cannot be sold or disposed of in current market conditions in seven calendar days or less without the sale or disposition significantly changing the market value of the investment. |
BOSTON COMMON ESG IMPACT FUNDS
NOTES TO FINANCIAL STATEMENTS March 31, 2022 (Unaudited) (Continued) |
| | I. | Guarantees and Indemnifications. In the normal course of business, the Funds enter into contracts with service providers that contain general indemnification clauses. The Funds’ maximum exposure under these arrangements is unknown as this would involve future claims that may be against the Funds that have not yet occurred. However, based on experience, the Funds expect the risk of loss to be remote. |
| | | |
| | J. | Recently Issued Accounting Pronouncements. In October 2020, the SEC adopted new Rule 12d1-4 under the 1940 Act and other regulatory changes which are expected to be effective on or about January 19, 2022. Those changes are intended to streamline and enhance the regulatory framework for investments by one fund into another fund or “fund-of-funds arrangements”. These regulatory changes may limit the Funds’ ability to pursue their principal investment strategies by investing in other investment companies or pooled investment vehicles or to invest in those investment companies or pooled investment vehicles they believe are most desirable. The Funds are currently assessing the potential impact of the new rule on the Funds’ financial statements. |
| | | |
| | | In October 2020, the Securities and Exchange Commission (the “SEC”) adopted new regulations governing the use of derivatives by registered investment companies (“Rule 18f-4”). The Funds will be required to implement and comply with Rule 18f-4 by August 19, 2022. Once implemented, Rule 18f-4 will impose limits on the amount of derivatives a fund can enter into, eliminate the asset segregation framework currently used by funds to comply with Section 18 of the 1940 Act, treat derivatives as senior securities and require funds whose use of derivatives is more than a limited specified exposure amount to establish and maintain a comprehensive derivatives risk management program and appoint a derivatives risk manager. The Funds are currently evaluating the impact, if any, of applying this provision. |
| | | |
| | | In December 2020, the SEC adopted a new rule providing a framework for fund valuation practices (“Rule 2a-5”). Rule 2a-5 establishes requirements for determining fair value in good faith for purposes of the 1940 Act. Rule 2a-5 will permit fund boards to designate certain parties to perform fair value determinations, subject to board oversight and certain other conditions. Rule 2a-5 also defines when market quotations are “readily available” for purposes of the 1940 Act and the threshold for determining whether a fund must fair value a security. In connection with Rule 2a-5, the SEC also adopted related recordkeeping requirements and is rescinding previously issued guidance, including with respect to the role of a board in determining fair value and the |
BOSTON COMMON ESG IMPACT FUNDS
NOTES TO FINANCIAL STATEMENTS March 31, 2022 (Unaudited) (Continued) |
| | | accounting and auditing of fund investments. The Funds will be required to comply with the rules by September 8, 2022. The Funds are currently evaluating the impact, if any, of applying this provision. |
| | | |
| | K. | Subsequent Events. In preparing these financial statements, the Funds have evaluated events and transactions for potential recognition or disclosure through the date the financial statements were issued. The Funds have determined that there were no subsequent events that would need to be disclosed in the Funds’ financial statements. |
| NOTE 3 – COMMITMENTS AND OTHER RELATED PARTY TRANSACTIONS |
The Adviser provides the Funds with investment management services under an Investment Advisory Agreement (the “Agreement”) for the Funds. Under the Agreement, the Adviser furnishes all investment advice, office space, facilities and certain administrative services, and provides most of the personnel needed by the Funds. As compensation for its services, the Adviser is entitled to receive a monthly fee at the annual rate of 0.85% for the Emerging Markets Fund, 0.80% for the International Fund and 0.75% for the U.S. Equity Fund based upon the average daily net assets of each Fund. For the six months ended March 31, 2022, the advisory fees incurred by the Funds are disclosed in the Statements of Operations. The investment advisory fees incurred are paid monthly to the Adviser, net of any monthly waiver or reimbursement discussed below.
The Adviser has contractually agreed to limit the annual ratio of expenses (“Expense Caps”) of each Fund’s average daily net assets to 0.99% for the Emerging Markets Fund, 0.86% for the International Fund and 1.00% for the U.S. Equity Fund, respectively. Prior to March 1, 2022, the Expense Cap for the International Fund was 1.20%. The Operating Expense Limitation Agreements have an indefinite term and may be terminated at any time, and without payment of any penalty, by the Board, on behalf of the Funds, upon sixty days written notice to the Adviser. Any fees waived and/or Fund expenses absorbed by the Adviser pursuant to an agreed-upon expense cap shall be reimbursed by the Funds to the Adviser, if so requested by the Adviser, any time before the end of the third year following the fee waiver and/or expense absorption, provided the aggregate amount of the Funds’ current operating expenses for such year does not exceed the lesser expense cap in place at the time of waiver or at the time of reimbursement. The Funds must pay their current ordinary operating expenses before the Adviser is entitled to any reimbursement of fees and/or expenses. Any such reimbursement is also contingent upon the Board’s review and approval. The amounts of fees waived and expenses absorbed by the Adviser during the six months ended March 31, 2022, are disclosed in the Statements of Operations. Any amount due from the Advisor is paid monthly to the Funds, if applicable.
BOSTON COMMON ESG IMPACT FUNDS
NOTES TO FINANCIAL STATEMENTS March 31, 2022 (Unaudited) (Continued) |
As of March 31, 2022, the remaining cumulative amounts that may be recouped by the Adviser on behalf of the Funds are shown in the following tables. The Adviser may recapture a portion of the unreimbursed amounts no later than the dates stated below.
| | | | Emerging | | | International | | | U.S. Equity | |
| | Year of Expiration | | Markets Fund | | | Fund | | | Fund | |
| | September 30, 2022 | | | N/A | | | | N/A | | | $ | 43,772 | |
| | September 30, 2023 | | | N/A | | | | N/A | | | | 106,835 | |
| | September 30, 2024 | | $ | 12,915 | | | | N/A | | | | 74,457 | |
| | March 31, 2025 | | | 78,212 | | | $ | 36,981 | | | | 27,122 | |
U.S. Bancorp Fund Services, LLC, doing business as U.S. Bank Global Fund Services (“Fund Services”) serves as the Funds’ administrator, fund accountant and transfer agent. In those capacities, Fund Services maintains the Funds’ books and records, calculates the Funds’ NAVs, prepares various federal and state regulatory filings, coordinates the payment of the Funds’ expenses, reviews expense accruals and prepares materials supplied to the Board. The officers of the Trust and the Chief Compliance Officer of the Funds are also employees of Fund Services. Fees paid by the Funds to Fund Services for these services for the six months ended March 31, 2022, are disclosed in the Statements of Operations.
Quasar Distributors, LLC (the “Distributor”) acts as the Funds’ principal underwriter in a continuous public offering of the Funds’ shares. U.S. Bank N.A. serves as the Funds’ custodian. U.S. Bank N.A. is an affiliate of Fund Services.
| NOTE 4 – PURCHASES AND SALES OF SECURITIES |
For the six months ended March 31, 2022, the cost of purchases and proceeds from the sales or maturity of securities, excluding short-term investments, were as follows:
| | | | Purchases | | | Sales/Maturities | |
| | Emerging Markets Fund | | $ | 25,458,696 | | | $ | 5,065,250 | |
| | International Fund | | | 168,358,067 | | | | 61,861,446 | |
| | U.S. Equity Fund | | | 7,244,853 | | | | 6,959,347 | |
For the six months ended March 31, 2022, there were no purchases or sales of U.S. Government obligations in the Funds.
BOSTON COMMON ESG IMPACT FUNDS
NOTES TO FINANCIAL STATEMENTS March 31, 2022 (Unaudited) (Continued) |
| NOTE 5 – DISTRIBUTIONS TO SHAREHOLDERS |
The tax character of distributions paid by the Funds during the six months ended March 31, 2022 (estimated) and the year ended September 30, 2021 were as follows:
| | | | March 31, 2022 | | | September 30, 2021 | |
| | Emerging Markets Fund | | | | | | |
| | Ordinary income | | $ | 88,029 | | | $ | — | |
| | Long-term capital gain | | | — | | | | — | |
| | | | | | | | | | |
| | International Fund | | | | | | | | |
| | Ordinary income | | $ | 8,619,331 | | | $ | 2,338,866 | |
| | Long-term capital gain | | | 7,970,552 | | | | — | |
| | | | | | | | | | |
| | U.S. Equity Fund | | | | | | | | |
| | Ordinary income | | $ | 58,468 | | | $ | 171,071 | |
| | Long-term capital gain | | | 2,483,928 | | | | — | |
The components of distributable earnings (losses) and cost basis of investments for federal income tax purposes at the most recent fiscal year ended September 30, 2021 were as follows:
Emerging Markets Fund
| | Cost of investments | | $ | 750,723 | |
| | Gross tax unrealized appreciation | | | 16,353 | |
| | Gross tax unrealized depreciation | | | (17,035 | ) |
| | Net tax unrealized appreciation (depreciation) | | | (682 | ) |
| | Undistributed ordinary income | | | 1,240 | |
| | Undistributed long-term capital gain | | | — | |
| | Total distributable earnings | | | 1,240 | |
| | Other distributable (accumulated) gains (losses) | | | — | |
| | Total distributable (accumulated) earnings (losses) | | $ | 558 | |
International Fund
| | Cost of investments | | $ | 389,782,954 | |
| | Gross tax unrealized appreciation | | | 125,914,440 | |
| | Gross tax unrealized depreciation | | | (22,036,288 | ) |
| | Net tax unrealized appreciation (depreciation) | | | 103,878,152 | |
| | Undistributed ordinary income | | | 7,240,187 | |
| | Undistributed long-term capital gain | | | 7,484,763 | |
| | Total distributable earnings | | | 14,724,950 | |
| | Other distributable (accumulated) gains (losses) | | | — | |
| | Total distributable (accumulated) earnings (losses) | | $ | 118,603,102 | |
BOSTON COMMON ESG IMPACT FUNDS
NOTES TO FINANCIAL STATEMENTS March 31, 2022 (Unaudited) (Continued) |
U.S. Equity Fund
| | Cost of investments | | $ | 32,950,550 | |
| | Gross tax unrealized appreciation | | | 25,545,633 | |
| | Gross tax unrealized depreciation | | | (958,147 | ) |
| | Net tax unrealized appreciation (depreciation) | | | 24,587,486 | |
| | Undistributed ordinary income | | | 95,364 | |
| | Undistributed long-term capital gain | | | 2,420,500 | |
| | Total distributable earnings | | | 2,515,864 | |
| | Other distributable (accumulated) gains (losses) | | | — | |
| | Total distributable (accumulated) earnings (losses) | | $ | 27,103,350 | |
U.S. Bank N.A. has made available to the International Fund and U.S. Equity Fund credit facilities pursuant to separate Loan and Security Agreements for temporary or extraordinary purposes. Interest expense for the six months ended March 31, 2022 is disclosed in the Statements of Operations, if applicable. Credit facility activity for the six months ended March 31, 2022 was as follows:
| | | | International Fund | | | U.S. Equity Fund | |
| | Maximum available credit | | $ | 10,000,000 | | | $ | 2,000,000 | |
| | Largest amount outstanding | | | | | | | | |
| | on an individual day | | | 153,000 | | | | 132,000 | |
| | Average balance when in use | | | 153,000 | | | | 131,500 | |
| | Credit facility outstanding | | | | | | | | |
| | as of March 31, 2022 | | | — | | | | — | |
| | Average interest rate | | | 3.25 | % | | | 3.25 | % |
| NOTE 7 – (COVID-19) PANDEMIC |
The global outbreak of COVID-19 (commonly referred to as “coronavirus”) has disrupted economic markets and the prolonged economic impact is uncertain. Although vaccines for COVID-19 are becoming more widely available, the ultimate economic fallout from the pandemic, amid the spread of COVID-19 variants, and the long-term impact on economies, markets, industries and individual companies are not known. The operational and financial performance of individual companies and the market in general depends on future developments, including the duration and spread of any future outbreaks and the pace of recovery which may vary from market to market, and such uncertainty may in turn adversely affect the value and liquidity of the Fund’s investments, impair the Fund’s ability to satisfy redemption requests, and negatively impact the Fund’s performance.
BOSTON COMMON ESG IMPACT FUNDS
EXPENSE EXAMPLES For the Six Months Ended March 31, 2022 (Unaudited) |
As a shareholder of the Funds, you incur two types of costs: (1) transaction costs and (2) ongoing costs, including investment advisory fees and other Fund expenses. The examples are intended to help you understand your ongoing costs (in dollars) of investing in the Funds and to compare these costs with the ongoing costs of investing in other mutual funds. The example is based on an investment of $1,000 invested at the beginning of the period and held for the entire period (10/1/21 – 3/31/22).
Actual Expenses
The “Actual” line of the following tables provides information about actual account values based on actual returns and actual expenses. Although the Funds charge no sales loads or transaction fees, you will be assessed fees for outgoing wire transfers, returned checks and stop payment orders at prevailing rates charged by Fund Services, the Funds’ transfer agent. If you request a redemption be made by wire transfer, the Funds’ transfer agent currently charges a $15.00 fee. You will be charged a redemption fee equal to 2% of the net amount of the redemption if you redeem within 30 calendar days after purchase. In addition to the Funds’ expenses, you will indirectly bear your proportionate share of any fees and expenses charged by the underlying funds of other investment companies in which the Funds have shares. Actual expenses of the underlying funds may vary. These expenses are not included in the following examples. The following examples include, but are not limited to, investment advisory fees, fund accounting fees, administration fees, custody fees and transfer agent fees. However, the following examples do not include portfolio trading commissions and related expenses and other extraordinary expenses as determined under generally accepted accounting principles. You may use the information in this line, together with the amount you invested, to estimate the expenses that you paid over the period. Simply divide your account value by $1,000 (for example, an $8,600 account value divided by $1,000 = 8.6), then multiply the result by the number in the first line under the heading entitled “Expenses Paid During the Period” to estimate the expenses you paid on your account during this period.
Hypothetical Example for Comparison Purposes
The “Hypothetical” line of the following tables provides information about hypothetical account values and hypothetical expenses based on each Fund’s actual expense ratio and an assumed rate of return of 5% per year before expenses, which is not each Fund’s actual return. The hypothetical account values and expenses may not be used to estimate the actual ending account balance or expenses you paid for the period. You may use this information to compare the ongoing costs of investing in the Funds and other funds. To do so, compare this 5% hypothetical example with the 5% hypothetical examples that
BOSTON COMMON ESG IMPACT FUNDS
EXPENSE EXAMPLES For the Six Months Ended March 31, 2022 (Unaudited) (Continued) |
appear in the shareholder reports of the other funds. Please note that the expenses shown in the tables are meant to highlight your ongoing costs only and do not reflect any transactional costs, such as sales charges (loads), redemption fees or exchange fees. Therefore, the second line of the tables are useful in comparing ongoing costs only and will not help you determine the relative total costs of owning different funds. In addition, if these transactional costs were included, your costs would have been higher.
Emerging Markets Fund
| | Beginning | Ending | Expenses Paid |
| | Account Value | Account Value | During the Period |
| | 10/1/21 | 3/31/22 | 10/1/21 – 3/31/221 |
| Actual | $1,000.00 | $916.80 | $4.73 |
| Hypothetical (5% return | | | |
| before expenses) | 1,000.00 | 1,020.00 | 4.99 |
1 | Expenses are equal to the Emerging Market Fund’s annualized expense ratio for the most recent six-month period of 0.99% (reflecting fee waivers in effect) multiplied by the average account value over the period, multiplied by 182/365 days (to reflect the one-half year period). |
International Fund
| | Beginning | Ending | Expenses Paid |
| | Account Value | Account Value | During the Period |
| | 10/1/21 | 3/31/22 | 10/1/21 – 3/31/222 |
| Actual | $1,000.00 | $868.90 | $4.43 |
| Hypothetical (5% return | | | |
| before expenses) | 1,000.00 | 1,020.19 | 4.78 |
2 | Expenses are equal to the International Fund’s annualized expense ratio for the most recent six-month period of 0.95% (reflecting fee waivers in effect) multiplied by the average account value over the period, multiplied by 182/365 days (to reflect the one-half year period). |
U.S. Equity Fund
| | Beginning | Ending | Expenses Paid |
| | Account Value | Account Value | During the Period |
| | 10/1/21 | 3/31/22 | 10/1/21 – 3/31/223 |
| Actual | $1,000.00 | $991.50 | $4.97 |
| Hypothetical (5% return | | | |
| before expenses) | 1,000.00 | 1,019.95 | 5.04 |
3 | Expenses are equal to the U.S. Equity Fund’s annualized expense ratio for the most recent six-month period of 1.00% (reflecting fee waivers in effect) multiplied by the average account value over the period, multiplied by 182/365 days (to reflect the one-half year period). |
BOSTON COMMON ESG IMPACT EMERGING MARKETS FUND
APPROVAL OF INVESTMENT ADVISORY AGREEMENT (Unaudited) |
At a meeting held on February 25, 2020, the Board (which is comprised of five persons, all of whom are Independent Trustees as defined under the Investment Company Act) considered and approved a new Investment Advisory Agreement (the “Advisory Agreement”) between Professionally Managed Portfolios (the “Trust”) and Boston Common Asset Management, LLC (“Boston Common” or the “Adviser”) for the Boston Common ESG Impact Emerging Markets Fund (the “Fund”), a new series of the Trust. At this meeting, the Board received and reviewed substantial information regarding the Fund, the Adviser and the services to be provided by the Adviser to the Fund under the Advisory Agreement. This information, together with the information provided to the Board throughout the course of the year, formed the primary (but not exclusive) basis for the Board’s determinations. Below is a summary of the factors considered by the Board and the conclusions that formed the basis for the Board’s approval of the continuance of the Advisory Agreement:
Nature, Extent and Quality of Services Provided to the Fund. The Trustees considered the nature, extent and quality of the Adviser’s overall services to be provided to the Fund as well as its specific responsibilities in all aspects of day-to-day investment management of the Fund. The Board considered the qualifications, experience and responsibilities of the portfolio managers, as well as the responsibilities of other key personnel of the Adviser that would be involved in the day-to-day activities of the Fund. The Board also considered the resources and compliance structure of the Adviser, including information regarding its compliance program, its chief compliance officer and the Adviser’s compliance record, as well as the Adviser’s cybersecurity program, business continuity plan, and risk management process. The Board considered that Boston Common was a socially responsible manager and that the Fund would invest in issuers that meet the Adviser’s specific environmental, social and governance (“ESG”) criteria. The Board noted the additional effort and infrastructure necessary to monitor and invest in accordance with the Adviser’s ESG criteria and also considered the prior relationship between the Adviser and the Trust, as well as the Board’s knowledge of the Adviser’s operations, and noted that during the course of the prior year they had met with certain personnel of the Adviser in person to discuss fund performance and investment outlook, as well as, various marketing and compliance topics. The Board concluded that the Adviser had the quality and depth of personnel, resources, investment processes and compliance policies and procedures essential to performing its duties under the Advisory Agreement and that they were satisfied with the nature, overall quality and extent of such management services.
Investment Performance of Boston Common and the Fund. As the Fund was newly created, the Board was unable to review the performance of the
BOSTON COMMON ESG IMPACT EMERGING MARKETS FUND
APPROVAL OF INVESTMENT ADVISORY AGREEMENT (Unaudited) (Continued) |
Fund. However, the Board did consider the performance history of the Boston Common All Account Emerging Markets Equity composite with similar strategies.
Costs of Services and Profits to be Realized by Boston Common. In considering the advisory fee and total fees and expenses of the Fund, the Board reviewed comparisons to the peer funds, as well as all expense waivers and reimbursements. The Trustees noted that the Adviser had contractually agreed to maintain certain annual expense ratios for the Funds.
For the Fund, the Board noted that the proposed advisory fee was 0.85%. The Board also noted that the net expense ratio the Adviser had contractually agreed to maintain was 1.00% for the Fund. The Trustees also noted that the proposed advisory fee and net expense ratio were below its category peer group median.
Extent of Economies of Scale as the Fund Grows. The Board also considered that economies of scale could be expected to be realized by the Adviser as the assets of the Funds grows. The Board noted that the Adviser has contractually agreed to reduce its advisory fees or reimburse expenses so that each Fund does not exceed its specified expense limitation. The Board concluded that there were no effective economies of scale to be shared with the Fund at current asset levels, as it had yet to commence operations, but would revisit this issue in the future as circumstances changed and asset levels increased.
Benefits Derived from the Relationship with the Fund. The Trustees discussed the likely overall profitability of the Adviser from managing the new Fund. In assessing possible profitability, the Trustees reviewed the Adviser’s financial information and took into account both the likely direct and indirect benefits to the Adviser from advising the Fund. The Trustees concluded that the Adviser’s profit from managing the Fund would likely not be excessive and, after review of relevant financial information, the Adviser would have adequate capitalization and/or would maintain adequate profit levels to support the Fund.
No single factor was determinative of the Board’s decision to approve the continuance of the Advisory Agreement, but rather the Board based its determination on the total combination of information available to them. Based on a consideration of all the factors in their totality, the Board determined that the advisory arrangements with the Adviser, including each Fund’s advisory fee, were fair and reasonable. The Board therefore determined that the continuance of the Advisory Agreement would be in the best interests of the Funds and their shareholders.
BOSTON COMMON ESG IMPACT FUNDS
INFORMATION ABOUT PROXY VOTING (Unaudited) |
A description of the policies and procedures that the Funds use to determine how to vote proxies relating to portfolio securities is available upon request without charge, by calling (877) 777-6944 or by accessing the Funds’ website at www.bostoncommonfunds.com. Furthermore, you can obtain the description on the SEC’s website at www.sec.gov. Information regarding how the Funds vote proxies relating to portfolio securities during the most recent 12-month period ended June 30 is available without charge, upon request, by calling (877) 777-6944. Furthermore, you can obtain the Funds’, proxy voting records on the SEC’s website at www.sec.gov.
INFORMATION ABOUT THE PORTFOLIO HOLDINGS (Unaudited) |
The Funds’ quarterly holdings for the most recent fiscal year can be obtained by accessing the Funds’ website at www.bostoncommonfunds.com. The Funds file their complete schedule of portfolio holdings with the SEC for the first and third quarters of each fiscal year as an exhibit to their reports on Form N-PORT. The Funds’ Form N-PORT is available on the SEC’s website at www.sec.gov. The Funds’ Form N-PORT may also be obtained by calling (877) 777-6944.
INFORMATION ABOUT HOUSEHOLDING (Unaudited) |
Each year, you are automatically sent an updated prospectus as well as annual and semi-annual reports for the Funds, if applicable. To reduce expenses, the Funds may mail only one copy of each Fund’s prospectus and each annual and semi-annual report to those addresses shared by two or more accounts. If you wish to receive individual copies of these documents, please call the Funds' transfer agent at (877) 777-6944 (or contact your financial institution). We will begin sending you individual copies thirty days after receiving your request. In addition, see the Important Notice on the cover page for changes to the distribution of the annual and semi-annual reports effective January 1, 2021.
INFORMATION ABOUT THE FUNDS’ TRUSTEES (Unaudited) |
The Statement of Additional Information (“SAI”) includes additional information about the Funds’ Trustees and is available without charge, upon request, by calling (877) 777-6944. Furthermore, you can obtain the SAI on the SEC’s website at www.sec.gov or the Funds’ website at www.bostoncommonfunds.com.
(This Page Intentionally Left Blank.)
BOSTON COMMON ESG IMPACT FUNDS
PRIVACY NOTICE (Unaudited) |
The Funds collect non-public information about you from the following sources:
• Information we receive about you on applications or other forms;
• Information you give us orally; and
• Information about your transactions with us or others.
We do not disclose any non-public personal information about our shareholders or former shareholders without the shareholder’s authorization, except as permitted by law or in response to inquiries from governmental authorities. We may share information with affiliated parties and unaffiliated third parties with whom we have contracts for servicing the Funds. We will provide unaffiliated third parties with only the information necessary to carry out their assigned responsibility. We maintain physical, electronic and procedural safeguards to protect your non-public personal information and require third parties to treat your non-public information with the same high degree of confidentiality.
In the event that you hold shares of the Funds through a financial intermediary, including, but not limited to, a broker-dealer, bank or trust company, the privacy policy of your financial intermediary would govern how your non-public personal information would be shared by those entities with unaffiliated third parties.
Adviser
BOSTON COMMON ASSET MANAGEMENT, LLC
200 State Street, 7th Floor
Boston, Massachusetts 02109
Distributor
QUASAR DISTRIBUTORS, LLC
111 East Kilbourn Avenue, Suite 2200
Milwaukee, Wisconsin 53202
Custodian
U.S. BANK N.A.
Custody Operations
1555 North RiverCenter Drive, Suite 302
Milwaukee, Wisconsin 53212
Transfer Agent, Fund Accountant and Fund Administrator
U.S. BANCORP FUND SERVICES, LLC
615 East Michigan Street
Milwaukee, Wisconsin 53202
(866) 236-0050
Independent Registered Public Accounting Firm
TAIT, WELLER & BAKER LLP
Two Liberty Place
50 South 16th Street, Suite 2900
Philadelphia, Pennsylvania 19102
Legal Counsel
SULLIVAN & WORCESTER, LLP
1633 Broadway, 32nd Floor
New York, New York 10019
Boston Common ESG Impact Emerging Markets Fund
Symbol – BCEMX
CUSIP – 74316J227
Boston Common ESG Impact International Fund
Symbol – BCAIX
CUSIP – 74316J110
Boston Common ESG Impact U.S. Equity Fund
Symbol – BCAMX
CUSIP – 74316J680
| |  Printed on 100% post-consumer waste paper | |
Item 2. Code of Ethics.
Not applicable for semi-annual reports.
Item 3. Audit Committee Financial Expert.
Not applicable for semi-annual reports.
Item 4. Principal Accountant Fees and Services.
Not applicable for semi-annual reports.
Item 5. Audit Committee of Listed Registrants.
Not applicable to registrants who are not listed issuers (as defined in Rule 10A-3 under the Securities Exchange Act of 1934).
Item 6. Investments.
(a) Schedule of Investments is included as part of the report to shareholders filed under Item 1 of this Form.
(b) Not applicable.
Item 7. Disclosure of Proxy Voting Policies and Procedures for Closed-End Management Investment Companies.
Not applicable to open-end investment companies.
Item 8. Portfolio Managers of Closed-End Management Investment Companies.
Not applicable to open-end investment companies.
Item 9. Purchases of Equity Securities by Closed‑End Management Investment Company and Affiliated Purchasers.
Not applicable to open-end investment companies.
Item 10. Submission of Matters to a Vote of Security Holders.
The registrant has adopted a nominating committee charter that contains the procedures by which shareholders may recommend nominees to the registrant’s board of trustees. There have been no material changes to the procedures by which shareholders may recommend nominees to the registrant’s board of trustees for the period.
Item 11. Controls and Procedures.
(a) | The Registrant’s Principal Executive Officer and Principal Financial Officer have reviewed the Registrant's disclosure controls and procedures (as defined in Rule 30a-3(c) under the Investment Company Act of 1940 (the “Act”)) as of a date within 90 days of the filing of this report, as required by Rule 30a-3(b) under the Act and Rules 13a-15(b) or 15d‑15(b) under the Securities Exchange Act of 1934. Based on their review, such officers have concluded that the disclosure controls and procedures are effective in ensuring that information required to be disclosed in this report is appropriately recorded, processed, summarized and reported and made known to them by others within the Registrant and by the Registrant’s service provider. |
(b) | There were no changes in the Registrant's internal control over financial reporting (as defined in Rule 30a-3(d) under the Act) that occurred during the period covered by this report that has materially affected, or is reasonably likely to materially affect, the Registrant's internal control over financial reporting. |
Item 12. Disclosure of Securities Lending Activities for Closed-End Management Investment Companies
Not applicable to open-end investment companies.
Item 13. Exhibits.
| (a) | (1) Any code of ethics or amendment thereto, that is subject of the disclosure required by Item 2, to the extent that the registrant intends to satisfy Item 2 requirements through filing an exhibit. Incorporated by reference to previous Form N-CSR filing. |
(3) Any written solicitation to purchase securities under Rule 23c‑1 under the Act sent or given during the period covered by the report by or on behalf of the registrant to 10 or more persons. Not applicable to open-end investment companies.
(4) Change in the registrant’s independent public accountant. There was no change in the registrant’s independent public accountant for the period covered by this report.
SIGNATURES
Pursuant to the requirements of the Securities Exchange Act of 1934 and the Investment Company Act of 1940, the registrant has duly caused this report to be signed on its behalf by the undersigned, thereunto duly authorized.
(Registrant) Professionally Managed Portfolios
By (Signature and Title) /s/Jason Hadler
Jason Hadler, President/Principal Executive Officer
Date June 2, 2022
Pursuant to the requirements of the Securities Exchange Act of 1934 and the Investment Company Act of 1940, this report has been signed below by the following persons on behalf of the registrant and in the capacities and on the dates indicated.
By (Signature and Title) /s/Jason Hadler
Jason Hadler, President/Principal Executive Officer
Date June 2, 2022
By (Signature and Title) /s/Craig A. Benton
Craig A. Benton, Treasurer/Principal Financial Officer
Date June 2, 2022
* Print the name and title of each signing officer under his or her signature.