UNITED STATES
SECURITIES AND EXCHANGE COMMISSION
Washington, D.C. 20549
FORM N-CSR
CERTIFIED SHAREHOLDER REPORT OF REGISTERED
MANAGEMENT INVESTMENT COMPANIES
Investment Company Act file number (811-05037)
Professionally Managed Portfolios
(Exact name of registrant as specified in charter)
615 East Michigan Street
Milwaukee, WI 53202
(Address of principal executive offices) (Zip code)
Jason Hadler
Professionally Managed Portfolios
c/o U.S. Bank Global Fund Services
777 E. Wisconsin Avenue
Milwaukee, WI 53202
(Name and address of agent for service)
(414) 516-1523
Registrant's telephone number, including area code
Date of fiscal year end: September 30
Date of reporting period: March 31, 2023
Item 1. Reports to Stockholders.
BOSTON COMMON
ESG IMPACT EMERGING MARKETS FUND
(BCEMX)
BOSTON COMMON
ESG IMPACT INTERNATIONAL FUND
(BCAIX)
BOSTON COMMON
ESG IMPACT U.S. EQUITY FUND
(BCAMX)
SEMI-ANNUAL REPORT
March 31, 2023
Table of Contents
| Boston Common ESG Impact Emerging Markets Fund | | |
| Investment Outlook | | | 5 |
| Management’s Discussion of Fund Performance | | | 7 |
| Country Allocation | | | 9 |
| Schedule of Investments | | | 10 |
| Boston Common ESG Impact International Fund | | | |
| Investment Outlook | | | 12 |
| Management’s Discussion of Fund Performance | | | 13 |
| Country Allocation | | | 15 |
| Schedule of Investments | | | 16 |
| Boston Common ESG Impact U.S. Equity Fund | | | |
| Investment Outlook | | | 18 |
| Management’s Discussion of Fund Performance | | | 19 |
| Sector Allocation | | | 21 |
| Schedule of Investments | | | 22 |
| Statements of Assets and Liabilities | | | 24 |
| Statements of Operations | | | 25 |
| Statements of Changes in Net Assets | | | 26 |
| Financial Highlights | | | 29 |
| Notes to Financial Statements | | | 32 |
| Expense Examples | | | 43 |
| Additional Information | | | 45 |
| Privacy Notice | Inside Back Cover |
BOSTON COMMON ESG IMPACT FUNDS
Mutual Fund Engagement Highlights
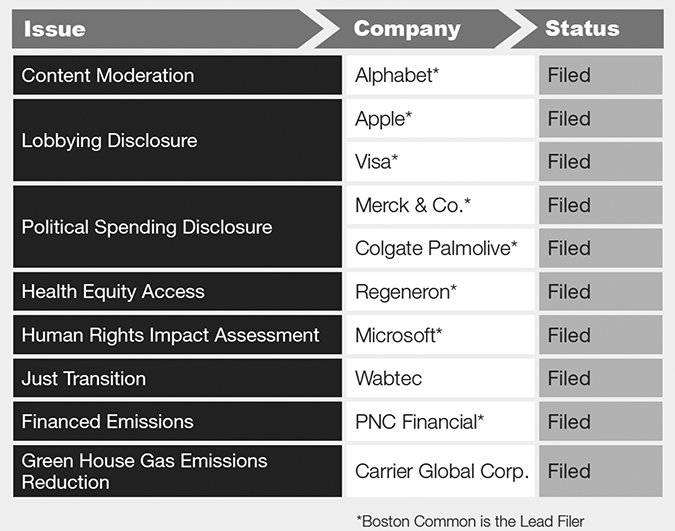
2023 Proxy Season Shareholder Resolutions Filed
2023 US Shareholder Resolution Wins
Adopting a Science-based Target (SBTi) Resolution (Co-Filer)
Carrier – We withdrew our resolution given a public commitment to SBTi and expand its Scope 3 emissions by the end of 20231. We will continue to engage on Scope 3 emissions implementation and refrigerants.
Lobbying Disclosure Resolution (Lead Filer)
Netflix – We received in 2022 a majority vote (60.4%) at Netflix on lobbying. Following this vote, we re-engaged Netflix who adopted enhanced disclosure on its lobbying oversight and process including globe scope, board oversight, alignment, escalation process and trade associations. We recommended the company expand in future disclosure on its public policy positions and alignment due diligence implementation.
_____________
1 | Scope 3 emissions are the result of activities from assets not owned or controlled by the reporting organization, but that the organization indirectly affects in its value chain. |
BOSTON COMMON ESG IMPACT FUNDS
Just Transition Resolution (Co-filer)
Wabtec – We withdrew our resolution given agreement to provide enhanced disclosure in 2023 on worker and communities in its transition plans, stakeholder engagement and workforce composition. Our ongoing focus will be Wabtec’s 2023 disclosure and guidance of the use of transition disclosure frameworks and oversight in 2024.
Activating Engagement in Asia
In the autumn of 2022, Lauren Compere, Head of Stewardship & Engagement, had the opportunity to travel to Asia for the first time in three years, visiting Japan and South Korea to continue Boston Common Asset Management’s (the “Adviser” or “Boston Common”) ongoing shareowner engagement work in person.
Boston Common’s engagement approach, conducted mostly in a virtual setting since the start of the pandemic, values in-person company meetings for providing a detailed understanding of corporate culture, sustainability governance, Environmental, Social, and Governance (ESG) momentum, the regulatory environment, and the impact of societal expectations.
To support our sustained dialogue, we used Japan’s Corporate Governance Code Revisions, a new classification of issuers from the Tokyo Stock Exchange which included its new PRIME listing and required Task Force on Climate-Related Financial Disclosure (TCFD). We focused on evolving global investors expectations like Boston Common’s 2022 Prioritizing Gender Investor Guide, the Finance Sector Deforestation Action (FSDA), issue-area benchmarks (i.e., Corporate Human Rights Benchmark, World Benchmarking Alliance (WBA) Digital Inclusion, Global Canopy Forest 500), and leveraging regional or global sector best practices to encourage companies to take needed steps to advance sustainability performance and disclosure.
Building long-term engagement relationships is pivotal to our global shareowner engagement approach. Meeting with companies in person allows us to build relationships and provide insights on knowledge or awareness gaps around emerging global investor expectations.
Across both markets, worker expectations and COVID impacts forced innovation on non-traditional work with companies implementing more flexible, hybrid, and remote work. Younger workers are demanding more work/life balance, and government initiatives in Japan encouraging men to take parental leave are having an impact.
In Japan, there are new regulations supporting governance of sustainability and advancing women in the workplace. While in Korea, regulatory drivers were less of a factor in corporate progress on sustainability issues except the required human rights due diligence related to supply chains. Korean and Japanese companies are, in many cases, subject to EU regulation and will see increased
BOSTON COMMON ESG IMPACT FUNDS
pressure as EU Corporate Sustainability Due Diligence Disclosure (CSDDD) comes into place in 2024, bringing with it due diligence requirements for both climate change and human rights.
Below is a summary of select company engagement:
WBA Digital Inclusion/Ethical AI
Boston Common and Fidelity International are the lead investors for the WBA Digital Inclusion Collective Impact Coalition focused engaging companies to adopt ethical AI policies. In March 2023, WBA released a new benchmark report which highlighted 44 out of 200 companies that had been assessed had adopted ethical AI policies.
We actively engaged SK Telecom and Tencent in 2022 and each adopted an ethical AI policy. We suggested that SK Hynix follow their model. We had substantive dialogue with Alibaba, SK Hynix, and Verizon and will continue to push for progress. Alibaba was the most improved company in the 2022 WBA benchmark given improved transparency in their new ESG report, engagement with WBA (one of Boston Common’s core engagement asks), and initiatives to provide online and offline classes on digital literacy.
BOSTON COMMON ESG IMPACT FUNDS
Deforestation & Biodiversity (Finance Sector Deforestation Action)
In 2021 Boston Common joined the Finance Sector Deforestation Action and in 2022 helped to develop new investor expectations for palm oil, soy, paper and pulp, and cattle-related deforestation. Some recent engagements include:
Essity – Wood pulp is 100% Forest Stewardship Council (FSC) or Programme for the Endorsement of Forest Certification (PEFC) certified primarily from either the Nordic countries or Brazil but never from Indonesia or the US as they cannot get 100% certified fiber. We recommended that Essity review and adopt Finance Sector Deforestation Action (FSDA) on investor expectations to ensure full traceability and integration of human rights and Free, Prior, and Informed Consent (FPIC).
Mondi – Zero Deforestation commitment for its wood fiber with a regional approach to ensure this is done (Third party certification in Brazil given sourcing from plantations versus community-centric approach in South Africa where they own the land). We recommended that Mondi adopt a more explicit integration of human rights and FPIC as part of their efforts.
BOSTON COMMON ESG IMPACT EMERGING MARKETS FUND
Investment Outlook
The rapid interest rate increases over the past year have unveiled vulnerabilities in the financial markets, as seen in the recent bank upheaval in the US and Europe. Emerging Market (EM) banks, while not immune, should be well positioned to weather the turmoil given their overall robust capitalization, better asset-liability matches, and long-term growth potential from their large unbanked populations. While financial stability in most Emerging Markets looks relatively sound, we are actively monitoring contagion risks to capital flows and growth. China’s economic recovery should be a positive development, providing tailwinds for global growth and EM assets.
Steady improvement in China’s service sector should drive the country’s economic momentum, while green shoots in housing activity are important for consumer confidence and spending. South Korea and Taiwan are likely to slow further, as external demand weakens for their globally dominant tech industries. Domestic demand remains resilient in South and Southeast Asian economies, key beneficiaries of a recovering China. Given our more constructive outlook, we have further increased the allocation to Asia while reducing the Europe, the Middle East and Africa (EMEA) overweight.
We used the market volatility during the period to increase allocation to what we believe are high-quality growth companies trading at a discount while exiting companies with more challenged outlooks. Among the new purchases were Raia Drogasil, Mercadolibre and BDO Unibank. Raia Drogasil is Brazil’s largest pharmacy operator with about 2,500 stores in a fragmented industry. We believe an aging population and increasing demands for access to healthcare should continue to support secular growth. Raia has the potential to gain market share by expanding locations, widening product selection, and enhancing ecommerce penetration. Profitability should also improve thanks to the efficiency gains. Mercadolibre offers its customers and small businesses throughout Latin America a robust ecommerce platform for online shopping, payment processing, and advertising services. With broadening product assortment, an expanding logistics network, and a strong ecommerce ecosystem, we view Mercadolibre as a key beneficiary of Latin America’s economic potential and rising digital penetration. The recent market sell-off provided a more attractive entry point for this fast-growing company with strong ESG momentum in areas such as financial inclusion and data security practices. BDO Unibank is the largest bank in the Philippines. We expect BDO to benefit from rising interest rates and improving credit quality, while low credit penetration and a young population should be sustainable long-term growth drivers.
BOSTON COMMON ESG IMPACT EMERGING MARKETS FUND
Among the portfolio exits during the period was PagSeguro in Brazil on lowered conviction and less earning visibility within a prolonged high interest rate environment. Another sale was Credicorp, a bank holding in Peru. The stock’s outperformance amid a worsening political environment and earnings headwind was a catalyst. We sold Chilean lithium producer SQM after its strong rally. We remain bullish on long-term EV demand and deployed the proceeds to names in the EV supply chain with better risk-reward prospects. We also sold PT Ace Hardware of Indonesia on concerns about weaker-than-expected demand and increased industry competition.
BOSTON COMMON ESG IMPACT EMERGING MARKETS FUND
Management Discussion
Over the past six months ending March 31, 2023, the Boston Common ESG Impact Emerging Markets Fund (the “EM Fund”) gained +17.49%, strongly outperforming the MSCI Emerging Markets Index2 (the “Index”), which returned +14.04%.
Financials was the top contributor to relative returns. Easing Covid restrictions in China boosted insurance giant Ping An, while OTP Bank in Hungary rebounded on better earnings. Stock selection in Industrials was another positive driver, as Taiwan’s industrial automation company Airtac Int’l and China’s leading engine manufacturer Weichai, both benefited from recovering demand in China. Consumer Discretionary also contributed to relative return, helped by South Africa based media company Naspers and China’s Trip.com, both beneficiaries of China’s reopening. Alibaba, which announced a corporate split likely to enhance shareholder value, also contributed.
Communication Services was the largest detractor overall. Telkom Indonesia declined on weaker-than-expected results and negative sentiment around its failed (but immaterial) investment in GoTo. Investor concerns around competitive pressures for India’s Bharti Airtel weighed on the stock’s relative performance. Technology also detracted from relative returns during the period. Brazilian digital payment provider PagSeguro suffered from higher financial expenses in a high interest rate environment. Chinasoft Int’l declined on weak near-term revenue guidance, as management maintains its focus on profitability and cashflow management. Healthcare was another drag on relative results. Brazilian healthcare provider Hapvida declined sharply on post-merger integration concerns.
The portfolio remains balanced with an overweight in defensive Staples and Healthcare, against an overweight in economically sensitive sectors such as Consumer Discretionary and Industrials. We believe several disruptive forces, such as the shift in global supply chains, sustainable consumption, and climate transition technologies, will drive the post-pandemic recovery in EM. In all sectors, the portfolio focuses on high-quality companies with strong ESG and financial attributes that can innovate and adapt to these opportunities.
_____________
2 | The MSCI EM Index is a float-adjusted market capitalization index that is designed to measure equity market performance in 27 global emerging markets. It is not possible to invest directly in an index. |
BOSTON COMMON ESG IMPACT EMERGING MARKETS FUND
Earnings growth is not representative of the future performance.
Past performance does not guarantee future results.
Must be preceded or accompanied by a current prospectus.
Mutual fund investing involves risk. Principal loss is possible. Investments in foreign securities involve political, economic and currency risks, greater volatility and differences in accounting methods. These risks are greater for investments in emerging markets. The Fund’s sustainability policy could cause it to perform differently compared to similar funds that do not have such a policy. This policy may result in the Fund foregoing opportunities to buy certain securities when it might otherwise be advantageous to do so, or selling securities for reasons when it might be otherwise is advantageous for it to do so. Unexpected events and their aftermaths, such as the spread of deadly diseases; natural, environmental or man-made disasters; financial, political or social disruptions; terrorism and war; and other tragedies or catastrophes, can cause investor fear and panic, which can adversely affect the economies of many companies, sectors, nations, regions and the market in general, in ways that cannot necessarily be foreseen.
Diversification does not assure a profit or protect against loss in a declining market.
Boston Common Asset Management, LLC is the adviser to the Fund, which is distributed by Quasar Distributors, LLC.
The opinions expressed are subject to change, are not guaranteed and should not be considered a recommendation to buy or sell any security.
Fund holdings and sector allocations are subject to change and should not be considered a recommendation to buy or sell any securities. Please refer to the Schedule of Investments included for additional information on securities held within the Boston Common ESG Impact Funds.
BOSTON COMMON ESG IMPACT EMERGING MARKETS FUND
| COUNTRY ALLOCATION at March 31, 2023 (Unaudited) |
Country | | % of Net Assets1 |
| China | | | 30.5 | % |
| India | | | 11.4 | % |
| Taiwan | | | 11.3 | % |
| Republic of Korea | | | 10.6 | % |
| Brazil | | | 6.9 | % |
| South Africa | | | 6.4 | % |
| Indonesia | | | 5.9 | % |
| Thailand | | | 3.6 | % |
| Mexico | | | 2.2 | % |
| Hong Kong | | | 1.7 | % |
| United States | | | 1.5 | % |
| United Kingdom | | | 1.5 | % |
| Colombia | | | 1.2 | % |
| Poland | | | 1.2 | % |
| Philippines | | | 1.1 | % |
| Hungary | | | 0.8 | % |
1 | Excludes short-term investments and liabilities in excess of other assets. |
BOSTON COMMON ESG IMPACT EMERGING MARKETS FUND
| SCHEDULE OF INVESTMENTS at March 31, 2023 (Unaudited) |
| Shares | | | | Value | |
| COMMON STOCKS – 95.0% | |
| | |
| Communication Services – 8.5% | |
| | 102,919 | | Advanced Info | | | |
| | | | Service PLC | | $ | 654,625 | |
| | 70,050 | | Bharti Airtel Ltd. | | | 638,821 | |
| | 21,788 | | SK Telecom | | | | |
| | | | Company Ltd. – ADR | | | 446,872 | |
| | 2,003,877 | | Telkom Indonesia | | | | |
| | | | Persero Tbk PT | | | 544,139 | |
| | 8,035 | | Tencent Holdings Ltd. | | | 392,665 | |
| | | | | | | 2,677,122 | |
| | |
| Consumer Discretionary – 20.0% | |
| | 121,635 | | Alibaba Group | | | | |
| | | | Holding Ltd.1 | | | 1,540,567 | |
| | 18,554 | | BYD Company | | | | |
| | | | Ltd. – Class H | | | 545,787 | |
| | 4,476 | | Coway Company Ltd. | | | 180,650 | |
| | 28,875 | | Giant Manufacturing | | | | |
| | | | Company Ltd. | | | 167,874 | |
| | 125,797 | | Lojas Renner SA | | | 412,006 | |
| | 371 | | MercadoLibre, Inc. | | | 489,000 | |
| | 71,900 | | Midea Group | | | | |
| | | | Company Ltd. – | | | | |
| | | | Class A | | | 562,600 | |
| | 138,320 | | Minth Group Ltd. | | | 419,825 | |
| | 6,809 | | Naspers Ltd. – Class N | | | 1,261,668 | |
| | 19,679 | | Trip.com Group | | | | |
| | | | Ltd. – ADR | | | 741,308 | |
| | | | | | | 6,321,285 | |
| | |
| Consumer Staples – 9.0% | |
| | 33,841 | | Clicks Group Ltd. | | | 486,811 | |
| | 4,174 | | Dino Polska SA1 | | | 379,126 | |
| | 53,929 | | Hengan International | | | | |
| | | | Group Company Ltd. | | | 249,802 | |
| | 323,773 | | Kimberly-Clark de | | | | |
| | | | Mexico – Class A | | | 682,582 | |
| | 1,338 | | LG Household & | | | | |
| | | | Health Care Ltd. | | | 618,154 | |
| | 87,385 | | Raia Drogasil SA | | | 420,507 | |
| | | | | | | 2,836,982 | |
| | |
| Financials – 17.2% | |
| | 56,934 | | Axis Bank Ltd. | | | 596,484 | |
| | 151,579 | | BDO Unibank, Inc. | | | 359,497 | |
| | 141,616 | | China Merchants | | | | |
| | | | Bank Company | | | | |
| | | | Ltd. – Class H | | | 719,129 | |
| | 18,941 | | HDFC Bank | | | | |
| | | | Ltd. – ADR | | | 1,262,796 | |
| | 122,450 | | Kasikornbank | | | | |
| | | | PLC – NVDR | | | 475,003 | |
| | 9,271 | | OTP Bank Nyrt | | | 264,682 | |
| | 138,848 | | Ping An Insurance | | | | |
| | | | (Group) Company | | | | |
| | | | of China Ltd. – | | | | |
| | | | Class H | | | 898,237 | |
| | 2,759,331 | | PT Bank | | | | |
| | | | Rakyat Indonesia | | | | |
| | | | (Persero) Tbk. | | | 874,302 | |
| | | | | | | 5,450,130 | |
| | |
| Health Care – 6.6% | |
| | 114,987 | | Biocon Ltd. | | | 289,233 | |
| | 1,044,664 | | China Traditional | | | | |
| | | | Chinese Medicine | | | | |
| | | | Holdings | | | | |
| | | | Company Ltd. | | | 547,314 | |
| | 260,356 | | Hapvida Participacoes | | | | |
| | | | e Investimentos SA | | | 135,098 | |
| | 3,309,634 | | PT Kalbe Farma Tbk. | | | 463,848 | |
| | 14,286 | | Shenzhen Mindray | | | | |
| | | | Bio-Medical | | | | |
| | | | Electronics Company | | | | |
| | | | Ltd. – Class A | | | 648,187 | |
| | | | | | | 2,083,680 | |
| | |
| Industrials – 8.9% | |
| | 19,434 | | AirTAC International | | | | |
| | | | Group | | | 760,052 | |
| | 47,325 | | Shenzhen Inovance | | | | |
| | | | Technology Company | | | | |
| | | | Ltd. – Class A | | | 484,827 | |
| | 24,204 | | Voltas Ltd. | | | 241,758 | |
| | 89,760 | | WEG SA | | | 717,237 | |
| | 391,376 | | Weichai Power | | | | |
| | | | Company Ltd. – | | | | |
| | | | Class H | | | 628,014 | |
| | | | | | | 2,831,888 | |
| | |
| Information Technology – 19.7% | |
| | 606,744 | | Chinasoft | | | | |
| | | | International Ltd. | | | 384,385 | |
| | 97,306 | | Delta Electronics, Inc. | | | 965,435 | |
| | 32,708 | | Infosys Ltd. – ADR | | | 570,427 | |
| | 21,868 | | SK Hynix, Inc. | | | 1,496,536 | |
The accompanying notes are an integral part of these financial statements.
BOSTON COMMON ESG IMPACT EMERGING MARKETS FUND
| SCHEDULE OF INVESTMENTS at March 31, 2023 (Unaudited) (Continued) |
| Shares | | | | Value | |
| | |
| COMMON STOCKS – 95.0% (Continued) | |
| | |
| Information Technology – 19.7% (Continued) | |
| | 21,778 | | Taiwan Semiconductor | | | |
| | | | Manufacturing | | | |
| | | | Company | | | |
| | | | Ltd. – ADR | | $ | 2,025,789 | |
| | 71,223 | | Win Semiconductors | | | | |
| | | | Corp. | | | 429,270 | |
| | 290,606 | | Xinyi Solar | | | | |
| | | | Holdings Ltd. | | | 348,378 | |
| | | | | | | 6,220,220 | |
| | |
| Materials – 3.3% | |
| | 1,086 | | LG Chem Ltd. | | | 596,425 | |
| | 28,861 | | Mondi PLC | | | 457,685 | |
| | | | | | | 1,054,110 | |
| | |
| Real Estate – 1.8% | |
| | 365,435 | | Growthpoint Properties | | | | |
| | | | Ltd. – REIT | | | 268,424 | |
| | 113,105 | | Longfor Group | | | | |
| | | | Holdings Ltd. | | | 318,998 | |
| | | | | | | 587,422 | |
| | |
| TOTAL COMMON STOCKS | |
| (Cost $32,080,734) | | | 30,062,839 | |
| | |
| PREFERRED STOCKS – 2.8% | |
| | |
| Financials – 2.8% | |
| | 15,517 | | Bancolombia | | | | |
| | | | SA – ADR | | | 389,942 | |
| | 100,356 | | Itau Unibanco | | | | |
| | | | Holding SA – ADR | | | 488,734 | |
| | |
| TOTAL PREFERRED STOCKS | |
| (Cost $993,151) | | | 878,676 | |
| | | | | | | | |
| SHORT-TERM INVESTMENTS – 4.8% | |
| | |
| Money Market Funds – 4.8% | |
| | 1,528,879 | | First American | | | | |
| | | | Treasury Obligations | | | | |
| | | | Fund – Class X, | | | | |
| |
| 4.720%2 | |
| 1,528,879 | |
| | |
| TOTAL SHORT-TERM INVESTMENTS | |
| (Cost $1,528,879) | | | 1,528,879 | |
| | | | | | | | |
| TOTAL INVESTMENTS – 102.6% | |
| (Cost $34,602,764) | | | 32,470,394 | |
| Liabilities in Excess | |
| of Other Assets – (2.6)% | | | (815,782 | ) |
| NET ASSETS – 100.0% | | $ | 31,654,612 | |
ADR – American Depositary Receipt
NVDR – Non-Voting Depository Receipt
REIT – Real Estate Investment Trust
1 | Non-income producing security. |
2 | Annualized seven-day effective yield as of March 31, 2023. |
The Global Industry Classification Standard (GICS®) sector and industry classifications were developed by and/or is the exclusive property of MSCI, Inc. and Standard & Poor Financial Services, LLC (“S&P”). GICS® is a service mark of MSCI and S&P and has been licensed for use by U.S. Bancorp Fund Service, LLC.
The accompanying notes are an integral part of these financial statements.
BOSTON COMMON ESG IMPACT INTERNATIONAL FUND
Investment Outlook
Global growth expectations have improved but remain modest and subject to volatility. Recent banking turmoil adds to headwinds from inflation, interest rates, and geopolitical risks leaving the probability of recession relatively high. However, European monetary policy should end its tightening cycle soon, while Japan continues to stand out with exceptionally loose conditions. Emergency government spending for the pandemic is receding, but fiscal support for net-zero initiatives should foster a dramatic expansion in green technology investment in coming years, projected in the hundreds of billions to trillions of dollars.
Given uncertain cyclical prospects and valuations in line with history, our portfolios are overweight defensive sectors, especially Healthcare and Consumer Staples, and underweight Energy and Materials. We have more exposure to Financials than the Index, but we emphasize insurance and Asia-Pacific and are underweight European banks. Our modest overweight of the Industrials sector reflects our conviction in long-term growth of electrification, renewable power, and energy efficient equipment like heat pumps.
Over the period, the Fund added Chinese vertically integrated electric vehicle (EV) producer BYD. EV penetration should accelerate globally, and BYD commands top share in the world’s largest market, China, is expanding into Europe, and is now the world’s second-largest EV battery manufacturer. Another purchase was Convatec, a UK medical device company focused on diabetes and chronic care. The company produces the majority of infusion sets globally, which, as part of an automated insulin delivery system, help diabetics improve blood sugar control. Convatec’s wound and other care businesses are benefiting from worsening trends in chronic conditions such as vascular disease and cancer. These stable growth markets support an enviable top-line outlook, and new management has delivered operational improvements that should drive continued profit margin expansion. We also added L’Oreal, the French leader in global beauty, a market supported by demographic trends and rebounding Chinese travel. Continued innovation, savvy digital presence, and product diversification should drive consistent sales and earnings growth. L’Oreal has committed to 100% sustainable packaging by 2025 and actively manages supply chain and climate change risks.
Among portfolio exits include Vonovia, Xinyi Solar and Taiwan Semiconductor. We sold Vonovia based on concerns over its fundamentals and strategy against a challenging interest rate and regulatory backdrop. We exited Xinyi Solar on concerns related to the Chinese company’s entry into the polysilicon business and the potential of solar glass oversupply, and we sold Taiwan Semiconductor to reposition our technology exposure. We also reduced several Financials holdings based on rising funding and credit risks for the sector.
BOSTON COMMON ESG IMPACT INTERNATIONAL FUND
Management Discussion
For the six months ended March 31, 2023, the Boston Common International Fund (the “International Fund”) gained +26.16%, while the MSCI EAFE® Index3 rose +27.27% over the same time frame. Strong stock selection in the Consumer Staples sector was the largest contributor to relative results. Dutch grocery chain Ahold delivered sound financial results thanks to its ability to pass on rising food prices. French cosmetics leader L’Oreal and Swedish personal care company Essity rallied on China’s reopening. Communication Services was another positive driver, as Deutsche Telekom’s US franchise T-Mobile continues to gain market share. Our Technology holdings outperformed. German semiconductor producer Infineon surged thanks to robust sales for its chips used in autos, especially electric vehicles. German software developer SAP and Japanese machine vision company Keyence were also strong performers.
Stock selection in Healthcare was the largest detractor from performance. Swiss pharma Roche and German BioNTech provided disappointing guidance partially driven by lower Covid estimates. Japanese drug company Eisai fell on uncertainty over insurance coverage for its new Alzheimer’s therapy. Consumer Discretionary was a drag on performance. Japanese bike parts maker Shimano and musical instrument manufacturer Yamaha were held back by the strong Yen. Our selection in Financials hurt relative performance. Nordic insurer Sampo fell out of favor with some investors after its recent capital reallocation. Low double digit returns by Singapore based OCBC lagged the strong Financials sector gains over the period. From a regional perspective, Europe ex. UK was the largest drag on performance, while UK added most to relative return.
In all sectors, we favor high-quality companies characterized by leading ESG practices, strong balance sheets, and an appealing balance of earnings prospects and valuation.
_____________
3 | MSCI EAFE® Index definition: The MSCI EAFE® Index is a stock market index that is designed to measure the equity market performance of developed markets outside of the U.S. and Canada. It is not possible to invest directly into an index. |
BOSTON COMMON ESG IMPACT INTERNATIONAL FUND
Earnings growth is not representative of the future performance.
Past performance does not guarantee future results.
Must be preceded or accompanied by a current prospectus.
Mutual fund investing involves risk. Principal loss is possible. Investments in foreign securities involve political, economic and currency risks, greater volatility and differences in accounting methods. The Fund’s sustainability policy could cause it to perform differently compared to similar funds that do not have such a policy. This policy may result in the Fund foregoing opportunities to buy certain securities when it might otherwise be advantageous to do so, or selling securities for reasons when it might be otherwise is advantageous for it to do so. Unexpected events and their aftermaths, such as the spread of deadly diseases; natural, environmental or man-made disasters; financial, political or social disruptions; terrorism and war; and other tragedies or catastrophes, can cause investor fear and panic, which can adversely affect the economies of many companies, sectors, nations, regions and the market in general, in ways that cannot necessarily be foreseen.
Diversification does not assure a profit or protect against loss in a declining market.
Boston Common Asset Management, LLC is the adviser to the Fund, which is distributed by Quasar Distributors, LLC.
The opinions expressed are subject to change, are not guaranteed and should not be considered a recommendation to buy or sell any security.
Fund holdings and sector allocations are subject to change and should not be considered a recommendation to buy or sell any securities. Please refer to the Schedule of Investments included for additional information on securities held within the Boston Common ESG Impact Funds.
BOSTON COMMON ESG IMPACT INTERNATIONAL FUND
| COUNTRY ALLOCATION at March 31, 2023 (Unaudited) |
Country | | % of Net Assets1 |
| United Kingdom | | | 18.3 | % |
| Japan | | | 16.9 | % |
| France | | | 10.9 | % |
| Germany | | | 9.5 | % |
| Sweden | | | 6.3 | % |
| Netherlands | | | 5.5 | % |
| Switzerland | | | 4.8 | % |
| Denmark | | | 4.5 | % |
| Australia | | | 3.2 | % |
| Singapore | | | 2.9 | % |
| Hong Kong | | | 2.8 | % |
| China | | | 2.4 | % |
| Finland | | | 2.2 | % |
| Spain | | | 2.0 | % |
| Italy | | | 1.9 | % |
| Ireland | | | 1.7 | % |
| Republic of Korea | | | 1.1 | % |
| Indonesia | | | 1.1 | % |
1 | Excludes short-term investments and other assets in excess of liabilities. |
BOSTON COMMON ESG IMPACT INTERNATIONAL FUND
| SCHEDULE OF INVESTMENTS at March 31, 2023 (Unaudited) |
| Shares | | | | Value | |
| COMMON STOCKS – 98.0% | |
| | |
| Communication Services – 3.9% | |
| | 821,899 | | Deutsche | | | |
| | | | Telekom AG | | $ | 19,916,585 | |
| | |
| Consumer Discretionary – 11.5% | |
| | 68,020 | | Alibaba Group | | | | |
| | | | Holding Ltd. – | | | | |
| | | | ADR1 | | | 6,950,284 | |
| | 1,276,286 | | Barratt | | | | |
| | | | Developments PLC | | | 7,344,712 | |
| | 187,538 | | Burberry Group PLC | | | 6,004,902 | |
| | 169,000 | | BYD Company | | | | |
| | | | Ltd. – Class H | | | 4,971,330 | |
| | 293,220 | | Industria de Diseno | | | | |
| | | | Textil SA | | | 9,850,832 | |
| | 25,933 | | Shimano, Inc. | | | 4,496,413 | |
| | 77,961 | | Sony Group Corp. | | | 7,100,952 | |
| | 242,318 | | Valeo SA | | | 4,972,335 | |
| | 173,430 | | Yamaha Corp. | | | 6,698,554 | |
| | | | | | | 58,390,314 | |
| | |
| Consumer Staples – 13.0% | |
| | 313,088 | | Essity AB – Class B | | | 8,943,015 | |
| | 86,937 | | Kerry Group | | | | |
| | | | PLC – Class A | | | 8,669,854 | |
| | 477,291 | | Koninklijke Ahold | | | | |
| | | | Delhaize NV | | | 16,306,778 | |
| | 26,200 | | L’Oreal SA | | | 11,707,329 | |
| | 121,457 | | Shiseido | | | | |
| | | | Company Ltd. | | | 5,694,299 | |
| | 284,079 | | Unilever NV – ADR | | | 14,752,222 | |
| | | | | | | 66,073,497 | |
| | |
| Financials – 19.0% | |
| | 891,350 | | AIA Group Ltd. | | | 9,347,907 | |
| | 467,536 | | AXA SA | | | 14,268,130 | |
| | 987,871 | | ING Groep NV | | | 11,731,360 | |
| | 18,993,511 | | Lloyds Banking | | | | |
| | | | Group PLC | | | 11,167,146 | |
| | 74,477 | | Macquarie | | | | |
| | | | Group Ltd. | | | 8,818,043 | |
| | 563,747 | | ORIX Corp. | | | 9,295,070 | |
| | 1,587,665 | | Oversea-Chinese | | | | |
| | | | Banking Corp. Ltd. | | | 14,799,876 | |
| | 16,965,546 | | PT Bank | | | | |
| | | | Rakyat Indonesia | | | | |
| | | | (Persero) Tbk. | |
| 5,375,581 | |
| | 236,705 | | Sampo Oyj – | | | | |
| | | | Class A | | | 11,169,011 | |
| | | | | | | 95,972,124 | |
| | |
| Health Care – 15.7% | |
| | 96,289 | | AstraZeneca PLC | |
| 13,341,186 | |
| | 37,808 | | BioNTech | | | | |
| | | | SE – ADR1 | | | 4,709,743 | |
| | 1,718,951 | | ConvaTec | | | | |
| | | | Group PLC | | | 4,857,413 | |
| | 171,753 | | Dechra | | | | |
| | | | Pharmaceuticals | | | | |
| | | | PLC | | | 5,623,073 | |
| | 84,517 | | Eisai Company Ltd. | | | 4,800,531 | |
| | 81,624 | | Hoya Corp. | | | 9,020,459 | |
| | 110,864 | | Novartis AG – ADR | | | 10,199,488 | |
| | 57,040 | | Novo Nordisk | | | | |
| | | | A/S – Class B | | | 9,059,172 | |
| | 391,961 | | Roche Holding | | | | |
| | | | Ltd. – ADR | | | 14,055,721 | |
| | 13,116 | | Sartorius Stedim | | | | |
| | | | Biotech | | | 4,023,944 | |
| | | | | | | 79,690,730 | |
| | |
| Industrials – 17.0% | |
| | 356,366 | | Assa Abloy AB – | | | | |
| | | | Class B | | | 8,535,852 | |
| | 561,222 | | Atlas Copco AB – | | | | |
| | | | Class B | | | 6,455,593 | |
| | 64,971 | | Daikin Industries | | | 11,656,224 | |
| | 1 | | Ferguson PLC | | | 132 | |
| | 165,237 | | Kurita Water | | | | |
| | | | Industries Ltd. | | | 7,569,016 | |
| | 232,676 | | Prysmian SpA | | | 9,770,273 | |
| | 185,947 | | Recruit Holdings | | | | |
| | | | Company Ltd. | | | 5,115,223 | |
| | 90,155 | | Schneider | | | | |
| | | | Electric SE | | | 15,067,121 | |
| | 49,981 | | Spirax-Sarco | | | | |
| | | | Engineering PLC | | | 7,338,312 | |
| | 220,031 | | Vestas Wind | | | | |
| | | | Systems A/S | | | 6,412,675 | |
| | 397,688 | | Volvo AB – Class B | | | 8,195,019 | |
| | | | | | | 86,115,440 | |
The accompanying notes are an integral part of these financial statements.
BOSTON COMMON ESG IMPACT INTERNATIONAL FUND
| SCHEDULE OF INVESTMENTS at March 31, 2023 (Unaudited) (Continued) |
| Shares | | | | Value | |
| COMMON STOCKS – 98.0% (Continued) | |
| | |
| Information Technology – 8.5% | |
| | 326,632 | | Infineon | | | |
| | | | Technologies AG | | $ | 13,413,268 | |
| | 17,700 | | Keyence Corp. | | | 8,674,925 | |
| | 80,306 | | SAP SE – ADR | | | 10,162,724 | |
| | 158,089 | | TDK Corp. | | | 5,674,786 | |
| | 115,918 | | Worldline SA1 | | | 4,926,365 | |
| | | | | | | 42,852,068 | |
| | |
| Materials – 2.7% | |
| | 100,478 | | Croda | | | | |
| | | | International PLC | | | 8,075,726 | |
| | 9,910 | | LG Chem Ltd. | | | 5,442,513 | |
| | | | | | | 13,518,239 | |
| | |
| Real Estate – 2.4% | |
| | 2,470,416 | | Hang Lung | | | | |
| | | | Properties Ltd. | | | 4,622,673 | |
| | 5,312,309 | | Mirvac | | | | |
| | | | Group – REIT | | | 7,440,513 | |
| | | | | | | 12,063,186 | |
| | |
| Utilities – 4.3% | |
| | 85,499 | | Orsted A/S | | | 7,290,327 | |
| | 645,475 | | SSE PLC | | | 14,402,956 | |
| | | | | | | 21,693,283 | |
| | |
| TOTAL COMMON STOCKS | |
| (Cost $452,721,693) | | | 496,285,466 | |
| | | | | | | | |
| SHORT-TERM INVESTMENTS – 2.0% | |
| | |
| Money Market Funds – 2.0% | |
| | 10,110,057 | | First American | | | | |
| | | | Treasury | | | | |
| | | | Obligations | | | | |
| | | | Fund – Class X, | | | | |
| | | | 4.720%2 | | $ | 10,110,057 | |
| | |
| TOTAL SHORT-TERM INVESTMENTS | |
| (Cost $10,110,057) | | | 10,110,057 | |
| | |
| TOTAL INVESTMENTS – 100.0% | |
| (Cost $462,831,750) | | | 506,395,523 | |
| Other Assets in Excess | |
| of Liabilities – 0.0% | | | 218,269 | |
| NET ASSETS – 100.0% | | $ | 506,613,792 | |
ADR – American Depositary Receipt
NVDR – Non-Voting Depository Receipt
REIT – Real Estate Investment Trust
1 | Non-income producing security. |
2 | Annualized seven-day effective yield as of March 31, 2023. |
The Global Industry Classification Standard (GICS®) sector and industry classifications were developed by and/or is the exclusive property of MSCI, Inc. and Standard & Poor Financial Services, LLC (“S&P”). GICS® is a service mark of MSCI and S&P and has been licensed for use by U.S. Bancorp Fund Service, LLC.
The accompanying notes are an integral part of these financial statements.
BOSTON COMMON ESG IMPACT U.S. EQUITY FUND
Investment Outlook
Following two years of fiscal policy stimulus, the US’ economic outlook now appears murky. The Fed faces a tough balancing act as it aims to continue raising rates without tipping the country into recession. The US’ recent regional bank failures and a distressed bank takeover in Europe have elevated concerns about systemic risk to the financial system. While we believe today’s concerns are more benign than the 2008 financial crisis, we anticipate increased regulatory scrutiny, particularly for regional banks. Current events will likely create near-term challenges for corporate profit margin expansion and earnings growth; recent corporate results indeed point to slowing profitability.
To reduce Consumer Discretionary exposure to equal weight and further increase the strategy’s market cap, we sold perennial laggard Advanced Auto Parts, whose plans for a multi-year turnaround have failed to manifest. We sold Hasbro, as management seems to have lost its grip on the transition from toy manufacturer to media company. Lastly, we sold smaller-cap Materials company Aptar, a manufacturer of consumer product and drug delivery containers. In its place, we purchased Ball Corporation, whose primary manufacture of aluminum containers offers a long-runway for bottlers’ continued conversion away from single-use plastic.
Continuing to diversify our Healthcare exposure, we purchased Edwards Lifesciences, which provides in-patient medical innovations, specifically minimally invasive artificial heart valves and hemodynamic monitoring. Another Healthcare purchase was Quest Diagnostics, which runs the world’s largest network of diagnostic laboratories that should benefit from increasing visits to physicians and rescheduled surgeries, delayed during the pandemic, as well as seasonal Covid- and flu-related testing. The company also provides access to women’s health via its proprietary breast cancer screening test, BRCA. Other portfolio additions include life insurer Metlife in Financials and Broadcom in Information Technology.
BOSTON COMMON ESG IMPACT U.S. EQUITY FUND
Management Discussion
Over the past six months ending March 31, 2023, the Boston Common ESG Impact U.S. Equity Fund (the “US Fund”) gained +15.55%, modestly in line with the S&P 500® Index4 (the “Index”), which rose +15.62%.
Stock selection in Consumer Discretionary added most to relative return, helped by Booking’s exposure to China’s reopening, as well as apparel manufacturer Ralph Lauren and off-price retailer TJX. Healthcare positively contributed, thanks to pharmaceutical companies Merck and Novo-Nordisk. Merck benefited from its Keytruda franchise while Novo Nordisk, a pharmaceutical company with products focused on treating diabetes in the US, was a portfolio standout during the period.
Technology detracted most, partly reflecting what the portfolio did not own, including AI-focused Nvidia. Following strong performance in early 2022, fund holding Enphase, the solar panel microinverter maker, recently declined on lower guidance, despite a robust production profile. Online payments system PayPal also weighed on performance. Selection in Communications Services lagged as Alphabet and Verizon did not keep up with the strong sector returns over the period, driven primarily by Facebook parent, Meta, which we do not own over concerns about governance, data security and social media’s impact on mental health.
We remain confident in our defensive tilt, especially regarding our equal and slightly underweight positioning in Consumer Discretionary and Information Technology, respectively. In every sector, we continue to seek high-quality, recession-agnostic operating models with opportunities to participate in expanding end markets or capture greater market share. These companies should likewise exhibit strong balance sheets, improving return-on-equity, and disciplined capital management that includes a commitment to dividend growth. As always, we view companies that both articulate and integrate the merits of understanding ESG criteria into their long-term strategic visions as potential secular winners.
_____________
4 | The S&P 500® Index is a capitalization weighted index of 500 large capitalization stocks which is designed to measure a broad domestic securities market. It is not possible to invest directly in an index. |
BOSTON COMMON ESG IMPACT U.S. EQUITY FUND
Earnings growth is not representative of the future performance.
Past performance does not guarantee future results.
Must be preceded or accompanied by a current prospectus.
Mutual fund investing involves risk. Principal loss is possible. Larger, more established companies are sometimes unable to attain the high growth rates of successful, smaller companies, especially during extended periods of economic expansion. The Fund’s sustainability policy could cause it to perform differently compared to similar funds that do not have such a policy. This policy may result in the Fund foregoing opportunities to buy certain securities when it might otherwise be advantageous to do so, or selling securities for reasons when it might be otherwise is advantageous for it to do so. Unexpected events and their aftermaths, such as the spread of deadly diseases; natural, environmental or man-made disasters; financial, political or social disruptions; terrorism and war; and other tragedies or catastrophes, can cause investor fear and panic, which can adversely affect the economies of many companies, sectors, nations, regions and the market in general, in ways that cannot necessarily be foreseen.
Diversification does not assure a profit or protect against loss in a declining market.
Boston Common Asset Management, LLC is the adviser to the Fund, which is distributed by Quasar Distributors, LLC.
The opinions expressed are subject to change, are not guaranteed and should not be considered a recommendation to buy or sell any security.
Fund holdings and sector allocations are subject to change and should not be considered a recommendation to buy or sell any securities. Please refer to the Schedule of Investments included for additional information on securities held within the Boston Common ESG Impact Funds.
BOSTON COMMON ESG IMPACT U.S. EQUITY FUND
| SECTOR ALLOCATION at March 31, 2023 (Unaudited) |
Sector | | % of Net Assets1 |
| Information Technology | | | 28.0 | % |
| Health Care | | | 16.7 | % |
| Financials | | | 10.6 | % |
| Consumer Discretionary | | | 10.0 | % |
| Industrials | | | 8.1 | % |
| Consumer Staples | | | 8.0 | % |
| Communication Services | | | 7.7 | % |
| Utilities | | | 3.6 | % |
| Real Estate | | | 2.6 | % |
| Materials | | | 2.2 | % |
1 | Excludes short-term investments and other assets in excess of liabilities. |
BOSTON COMMON ESG IMPACT U.S. EQUITY FUND
| SCHEDULE OF INVESTMENTS at March 31, 2023 (Unaudited) |
| Shares | | | | Value | |
| COMMON STOCKS – 97.5% | |
| | |
| Communication Services – 7.7% | |
| | 300 | | Alphabet, Inc. – | | | |
| | | | Class A1 | | $ | 31,119 | |
| | 21,605 | | Alphabet, Inc. – | | | | |
| | | | Class C1 | | | 2,246,920 | |
| | 2,699 | | Netflix, Inc.1 | | | 932,451 | |
| | 21,116 | | Verizon | | | | |
| | | | Communications, Inc. | | | 821,201 | |
| | 50 | | Walt Disney Company | | | 5,006 | |
| | | | | | | 4,036,697 | |
| | |
| Consumer Discretionary – 10.0% | |
| | 400 | | Booking | | | | |
| | | | Holdings, Inc.1 | | | 1,060,964 | |
| | 3,403 | | Home Depot, Inc. | | | 1,004,293 | |
| | 8,064 | | Ralph Lauren Corp. | | | 940,827 | |
| | 4,256 | | Target Corp. | | | 704,921 | |
| | 19,882 | | TJX Companies, Inc. | | | 1,557,954 | |
| | | | | | | 5,268,959 | |
| | |
| Consumer Staples – 8.0% | |
| | 7,437 | | Colgate-Palmolive | | | | |
| | | | Company | | | 558,891 | |
| | 1,996 | | Costco Wholesale Corp. | | | 991,752 | |
| | 4,935 | | The Estee Lauder | | | | |
| | | | Companies, Inc. – | | | | |
| | | | Class A | | | 1,216,280 | |
| | 6,517 | | McCormick & | | | | |
| | | | Company, Inc. | | | 542,280 | |
| | 13,260 | | Mondelez | | | | |
| | | | International, Inc. – | | | | |
| | | | Class A | | | 924,487 | |
| | | | | | | 4,233,690 | |
| | |
| Financials – 10.6% | |
| | 2,403 | | Ameriprise | | | | |
| | | | Financial, Inc. | | | 736,519 | |
| | 3,602 | | Aon PLC – Class A | | | 1,135,675 | |
| | 176 | | Citigroup, Inc. | | | 8,253 | |
| | 5,707 | | CME Group, Inc. – | | | | |
| | | | Class A | | | 1,093,005 | |
| | 14,096 | | MetLife, Inc. | | | 816,722 | |
| | 9,449 | | Morgan Stanley | | | 829,622 | |
| | 7,532 | | PNC Financial Services | | | | |
| | | | Group, Inc. | | | 957,317 | |
| | | | | | | 5,577,113 | |
| | |
| Health Care – 16.7% | |
| | 6,388 | | Agilent | | | | |
| | | | Technologies, Inc. | |
| 883,716 | |
| | 116 | | Biogen, Inc.1 | | | 32,252 | |
| | 3,776 | | Danaher Corp. | | | 951,703 | |
| | 8,302 | | Edwards Lifesciences | | | | |
| | | | Corp.1 | | | 686,824 | |
| | 22,060 | | Merck & | | | | |
| | | | Company, Inc. | | | 2,346,963 | |
| | 5,179 | | Novo Nordisk | | | | |
| | | | A/S – ADR | | | 824,186 | |
| | 5,795 | | Quest Diagnostics, Inc. | | | 819,877 | |
| | 1,367 | | Regeneron | | | | |
| | | | Pharmaceuticals, Inc.1 | | | 1,123,223 | |
| | 3,426 | | Vertex | | | | |
| | | | Pharmaceuticals, Inc.1 | | | 1,079,430 | |
| | | | | | | 8,748,174 | |
| | |
| Industrials – 8.1% | |
| | 16,184 | | Carrier Global Corp. | | | 740,418 | |
| | 3,735 | | Cummins, Inc. | | | 892,217 | |
| | 11,364 | | Emerson Electric | | | | |
| | | | Company | | | 990,259 | |
| | 7,854 | | Wabtec Corp. | | | 793,725 | |
| | 8,229 | | Xylem, Inc. | | | 861,576 | |
| | | | | | | 4,278,195 | |
| | |
| Information Technology – 28.0% | |
| | 2,232 | | Adobe, Inc.1 | | | 860,146 | |
| | 3,397 | | Analog Devices, Inc. | | | 669,956 | |
| | 22,278 | | Apple, Inc. | | | 3,673,642 | |
| | 3,206 | | Applied Materials, Inc. | | | 393,793 | |
| | 1,277 | | Broadcom, Inc. | | | 819,247 | |
| | 3,296 | | Enphase Energy, Inc.1 | | | 693,083 | |
| | 738 | | First Solar, Inc.1 | | | 160,515 | |
| | 2,220 | | Intuit, Inc. | | | 989,743 | |
| | 13,381 | | Microsoft Corp. | | | 3,857,742 | |
| | 7,371 | | PayPal Holdings, Inc. | | | 559,754 | |
| | 222 | | salesforce.com, Inc.1 | | | 44,351 | |
| | 8,658 | | Visa, Inc. – Class A | | | 1,952,033 | |
| | | | | | | 14,674,005 | |
| | |
| Materials – 2.2% | |
| | 7,076 | | Ball Corp. | | | 389,959 | |
| | 4,512 | | Ecolab, Inc. | | | 746,871 | |
| | | | | | | 1,136,830 | |
The accompanying notes are an integral part of these financial statements.
BOSTON COMMON ESG IMPACT U.S. EQUITY FUND
| SCHEDULE OF INVESTMENTS at March 31, 2023 (Unaudited) (Continued) |
| Shares | | | | Value | |
| COMMON STOCKS – 97.5% (Continued) | |
| | |
| Real Estate – 2.6% | |
| | 30,717 | | Kimco Realty | | | |
| | | | Corp. – REIT | | $ | 599,903 | |
| | 24,810 | | Weyerhaeuser | | | | |
| | | | Company – REIT | | | 747,525 | |
| | | | | | | 1,347,428 | |
| | |
| Utilities – 3.6% | |
| | 6,322 | | American Water Works | | | | |
| | | | Company, Inc. | | | 926,110 | |
| | 9,984 | | Consolidated | | | | |
| | | | Edison, Inc. | | | 955,169 | |
| | | | | | | 1,881,279 | |
| | |
| TOTAL COMMON STOCKS | |
| (Cost $33,063,379) | | | 51,182,370 | |
| | | | | | | | |
| SHORT-TERM INVESTMENTS – 2.5% | |
| | |
| Money Market Funds – 2.5% | |
| | 1,300,694 | | First American | | | | |
| | | | Treasury Obligations | | | | |
| | | | Fund – Class X, | | | | |
| | | | 4.720%2 | | $ | 1,300,694 | |
| | |
| TOTAL SHORT-TERM INVESTMENTS | |
| (Cost $1,300,694) | | | 1,300,694 | |
| | |
| TOTAL INVESTMENTS – 100.0% | |
| (Cost $34,364,073) | | | 52,483,064 | |
| Other Assets in Excess | |
| of Liabilities – 0.0% | | | 2,394 | |
| NET ASSETS – 100.0% | | $ | 52,485,458 | |
ADR – American Depositary Receipt
NVDR – Non-Voting Depository Receipt
REIT – Real Estate Investment Trust
1 | Non-income producing security. |
2 | Annualized seven-day effective yield as of March 31, 2023. |
The Global Industry Classification Standard (GICS®) sector and industry classifications were developed by and/or is the exclusive property of MSCI, Inc. and Standard & Poor Financial Services, LLC (“S&P”). GICS® is a service mark of MSCI and S&P and has been licensed for use by U.S. Bancorp Fund Service, LLC.
The accompanying notes are an integral part of these financial statements.
BOSTON COMMON ESG IMPACT FUNDS
| STATEMENTS OF ASSETS AND LIABILITIES at March 31, 2023 (Unaudited) |
| | | Emerging | | | International | | | U.S. Equity | |
| | | Markets Fund | | | Fund | | | Fund | |
| ASSETS: | | | | | | | | | |
| Investments in securities, at value | | | | | | | | | |
| (cost $34,602,764, $462,831,750 | | | | | | | | | |
| and $34,364,073, respectively) | | $ | 32,470,394 | | | $ | 506,395,523 | | | $ | 52,483,064 | |
| Receivables: | | | | | | | | | | | | |
| Foreign cash | | | 41,283 | | | | 2,792 | | | | — | |
| Fund shares sold | | | — | | | | 387,338 | | | | 26,766 | |
| Dividends and interest | | | 106,359 | | | | 2,092,253 | | | | 48,424 | |
| Prepaid expenses | | | 20,546 | | | | 38,267 | | | | 21,142 | |
| Total assets | | | 32,638,582 | | | | 508,916,173 | | | | 52,579,396 | |
| | | | | | | | | | | | | |
| LIABILITIES: | | | | | | | | | | | | |
| Payables: | | | | | | | | | | | | |
| Investment securities purchased | | | 955,746 | | | | — | | | | — | |
| Fund shares redeemed | | | — | | | | 1,933,037 | | | | 45,209 | |
| Investment advisory fees, net | | | 3,487 | | | | 285,774 | | | | 24,163 | |
| Audit fees | | | 8,922 | | | | 11,711 | | | | 11,711 | |
| Fund administration & fund accounting fees | | | 7,127 | | | | 25,125 | | | | 5,427 | |
| Custody fees | | | 5,370 | | | | 20,998 | | | | 537 | |
| Trustee fees | | | 1,459 | | | | 5,377 | | | | 3,092 | |
| Legal fees | | | 1,065 | | | | 910 | | | | 1,143 | |
| Chief Compliance Officer fees | | | 312 | | | | 312 | | | | 217 | |
| Registration fees | | | 142 | | | | 549 | | | | 286 | |
| Printing and mailing expenses | | | 111 | | | | 4,376 | | | | 369 | |
| Transfer agent fees | | | 229 | | | | 13,831 | | | | 1,169 | |
| Miscellaneous expenses | | | — | | | | 381 | | | | 615 | |
| Total liabilities | | | 983,970 | | | | 2,302,381 | | | | 93,938 | |
| NET ASSETS | | $ | 31,654,612 | | | $ | 506,613,792 | | | $ | 52,485,458 | |
| | | | | | | | | | | | | |
| COMPONENTS OF NET ASSETS: | | | | | | | | | | | | |
| Paid-in capital | | $ | 35,262,453 | | | $ | 503,835,216 | | | $ | 34,299,553 | |
| Total distributable (accumulated) | | | | | | | | | | | | |
| earnings (losses) | | | (3,607,841 | ) | | | 2,778,576 | | | | 18,185,905 | |
| Net assets | | $ | 31,654,612 | | | $ | 506,613,792 | | | $ | 52,485,458 | |
| Net assets value (unlimited shares authorized): | | | | | | | | | | | | |
| Net assets | | $ | 31,654,612 | | | $ | 506,613,792 | | | $ | 52,485,458 | |
| Shares of beneficial interest | | | | | | | | | | | | |
| issued and outstanding | | | 1,525,666 | | | | 16,237,562 | | | | 996,650 | |
| Net asset value, offering, and | | | | | | | | | | | | |
| redemption price per share | | $ | 20.75 | | | $ | 31.20 | | | $ | 52.66 | |
The accompanying notes are an integral part of these financial statements.
BOSTON COMMON ESG IMPACT FUNDS
| STATEMENTS OF OPERATIONS For the Six Months Ended March 31, 2023 (Unaudited) |
| | | Emerging | | | International | | | U.S. Equity | |
| | | Markets Fund | | | Fund | | | Fund | |
| INVESTMENT INCOME | | | | | | | | | |
| Income: | | | | | | | | | |
| Dividends (net of foreign withholding tax | | | | | | | | | |
| and issuance fees of $31,367, $382,158 | | | | | | | | | |
| and $906, respectively) | | $ | 203,566 | | | $ | 3,456,249 | | | $ | 410,888 | |
| Interest | | | 13,352 | | | | 102,489 | | | | 19,537 | |
| Total investment income | | | 216,918 | | | | 3,558,738 | | | | 430,425 | |
| | | | | | | | | | | | | |
| Expenses: | | | | | | | | | | | | |
| Investment advisory fees | | | 109,779 | | | | 1,891,551 | | | | 190,042 | |
| Fund administration & fund accounting fees | | | 49,992 | | | | 205,971 | | | | 43,524 | |
| Custody fees | | | 20,105 | | | | 62,498 | | | | 1,817 | |
| Professional fees | | | 12,869 | | | | 15,675 | | | | 15,829 | |
| Registration fees | | | 10,926 | | | | 20,613 | | | | 10,643 | |
| Trustee fees | | | 9,309 | | | | 12,255 | | | | 8,196 | |
| Chief Compliance Officer fees | | | 6,827 | | | | 6,826 | | | | 6,732 | |
| Miscellaneous expense | | | 5,312 | | | | 22,744 | | | | 5,248 | |
| Transfer agent fees | | | 1,065 | | | | 45,531 | | | | 11,804 | |
| Reports to shareholders | | | 949 | | | | 9,578 | | | | 1,327 | |
| Insurance expenses | | | 833 | | | | 3,741 | | | | 2,746 | |
| Interest expenses | | | — | | | | 2,685 | | | | — | |
| Total expenses | | | 227,966 | | | | 2,299,668 | | | | 297,908 | |
| Less: fees waived | | | (100,104 | ) | | | (263,568 | ) | | | (44,516 | ) |
| Net expenses | | | 127,862 | | | | 2,036,100 | | | | 253,392 | |
| Net investment income (loss) | | | 89,056 | | | | 1,522,638 | | | | 177,033 | |
| | | | | | | | | | | | | |
| REALIZED AND UNREALIZED GAIN (LOSS) ON INVESTMENTS AND FOREIGN CURRENCY | | | | | | | | | | | | |
| Net realized gain (loss) on investments | | | | | | | | | | | | |
| and foreign currency | | | (506,774 | ) | | | (27,862,061 | ) | | | 13,881 | |
| Net change in unrealized | | | | | | | | | | | | |
| appreciation/depreciation on investments | | | | | | | | | | | | |
| and foreign currency | | | 4,191,380 | | | | 132,233,507 | | | | 7,035,585 | |
| Net realized and unrealized gain (loss) | | | | | | | | | | | | |
| on investments and foreign currency | | | 3,684,606 | | | | 104,371,446 | | | | 7,049,466 | |
| NET INCREASE (DECREASE) IN | | | | | | | | | | | | |
| NET ASSETS RESULTING | | | | | | | | | | | | |
| FROM OPERATIONS | | $ | 3,773,662 | | | $ | 105,894,084 | | | $ | 7,226,499 | |
The accompanying notes are an integral part of these financial statements.
BOSTON COMMON ESG IMPACT EMERGING MARKETS FUND
| STATEMENTS OF CHANGES IN NET ASSETS |
| | | Six Months Ended | | | Year Ended | |
| | | March 31, 2023 | | | September 30, | |
| | | (Unaudited) | | | 2022 | |
| NET INCREASE (DECREASE) IN NET ASSETS FROM: | | | | | | |
| Net investment income (loss) | | $ | 89,056 | | | $ | 322,110 | |
| Net realized gain (loss) on investments | | | | | | | | |
| and foreign currency | | | (506,774 | ) | | | (788,246 | ) |
| Net change in unrealized appreciation/depreciation | | | | | | | | |
| on investments and foreign currency | | | 4,191,380 | | | | (6,324,041 | ) |
| Net increase (decrease) in net assets | | | | | | | | |
| resulting from operations | | | 3,773,662 | | | | (6,790,177 | ) |
| | | | | | | | | |
| DISTRIBUTIONS TO SHAREHOLDERS | | | | | | | | |
| Net distributions to shareholders | | | (503,855 | ) | | | (88,029 | ) |
| | | | | | | | | |
| CAPITAL SHARE TRANSACTIONS | | | | | | | | |
Net increase (decrease) from capital share transactions1 | | | 7,342,974 | | | | 27,169,429 | |
| Total increase (decrease) in net assets | | | 10,612,781 | | | | 20,291,223 | |
| | | | | | | | | |
| NET ASSETS | | | | | | | | |
| Beginning of period/year | | | 21,041,831 | | | | 750,608 | |
| End of period/year | | $ | 31,654,612 | | | $ | 21,041,831 | |
1 | A summary of share transactions is as follows: |
| | | | Six Months Ended | | | | | | | |
| | | | March 31, 2023 | | | Year Ended | |
| | | | (Unaudited) | | | September 30, 2022 | |
| | | | Shares | | | Value | | | Shares | | | Value | |
| | Shares sold | | | 353,237 | | | $ | 7,246,929 | | | | 1,137,570 | | | $ | 27,169,429 | |
| | Shares issued to holders | | | | | | | | | | | | | | | | |
| | in reinvestment | | | | | | | | | | | | | | | | |
| | of distributions | | | 7,661 | | | | 151,464 | | | | — | | | | — | |
| | Shares redeemed | | | (2,804 | ) | | | (55,419 | ) | | | — | | | | — | |
| | Net increase (decrease) | | | 358,094 | | | $ | 7,342,974 | | | | 1,137,570 | | | $ | 27,169,429 | |
| | Beginning shares | | | 1,167,572 | | | | | | | | 30,002 | | | | | |
| | Ending shares | | | 1,525,666 | | | | | | | | 1,167,572 | | | | | |
The accompanying notes are an integral part of these financial statements.
BOSTON COMMON ESG IMPACT INTERNATIONAL FUND
| STATEMENTS OF CHANGES IN NET ASSETS |
| | | Six Months Ended | | | Year Ended | |
| | | March 31, 2023 | | | September 30, | |
| | | (Unaudited) | | | 2022 | |
| NET INCREASE (DECREASE) IN NET ASSETS FROM: | | | | | | |
| Net investment income (loss) | | $ | 1,522,638 | | | $ | 9,580,733 | |
| Net realized gain (loss) on investments | | | | | | | | |
| and foreign currency | | | (27,862,061 | ) | | | (7,217,996 | ) |
| Net change in unrealized appreciation/depreciation | | | | | | | | |
| on investments and foreign currency | | | 132,233,507 | | | | (201,593,405 | ) |
| Net increase (decrease) in net assets | | | | | | | | |
| resulting from operations | | | 105,894,084 | | | | (199,230,668 | ) |
| | | | | | | | | |
| DISTRIBUTIONS TO SHAREHOLDERS | | | | | | | | |
| Net distributions to shareholders | | | (5,898,059 | ) | | | (16,589,883 | ) |
| | | | | | | | | |
| CAPITAL SHARE TRANSACTIONS | | | | | | | | |
Net increase (decrease) from capital share transactions1 | | | (7,619,182 | ) | | | 134,860,436 | |
| Total increase (decrease) in net assets | | | 92,376,843 | | | | (80,960,115 | ) |
| | | | | | | | | |
| NET ASSETS | | | | | | | | |
| Beginning of period/year | | | 414,236,949 | | | | 495,197,064 | |
| End of period/year | | $ | 506,613,792 | | | $ | 414,236,949 | |
1 | A summary of share transactions is as follows: |
| | | Six Months Ended | | | | | | | |
| | | March 31, 2023 | | | Year Ended | |
| | | (Unaudited) | | | September 30, 2022 | |
| | | Shares | | | Value | | | Shares | | | Value | |
| Shares sold | | | 2,015,375 | | | $ | 59,443,097 | | | | 7,196,432 | | | $ | 240,538,947 | |
| Shares issued to holders | | | | | | | | | | | | | | | | |
| in reinvestment | | | | | | | | | | | | | | | | |
| of distributions | | | 171,754 | | | | 4,991,170 | | | | 350,363 | | | | 12,819,778 | |
Shares redeemed2 | | | (2,494,842 | ) | | | (72,053,449 | ) | | | (3,844,306 | ) | | | (118,498,289 | ) |
| Net increase (decrease) | | | (307,713 | ) | | $ | (7,619,182 | ) | | | 3,702,489 | | | $ | 134,860,436 | |
| Beginning shares | | | 16,545,275 | | | | | | | | 12,842,786 | | | | | |
| Ending shares | | | 16,237,562 | | | | | | | | 16,545,275 | | | | | |
| | |
2 | Net of redemption fees of $2,828 and $18,834, respectively. |
The accompanying notes are an integral part of these financial statements.
BOSTON COMMON ESG IMPACT U.S. EQUITY FUND
| STATEMENTS OF CHANGES IN NET ASSETS |
| | | Six Months Ended | | | Year Ended | |
| | | March 31, 2023 | | | September 30, | |
| | | (Unaudited) | | | 2022 | |
| NET INCREASE (DECREASE) IN NET ASSETS FROM: | | | | | | |
| Net investment income (loss) | | $ | 177,033 | | | $ | 140,791 | |
| Net realized gain (loss) on investments | | | | | | | | |
| and foreign currency | | | 13,881 | | | | 3,188,979 | |
| Net change in unrealized appreciation/depreciation | | | | | | | | |
| of investments and foreign currency | | | 7,035,585 | | | | (13,741,339 | ) |
| Net increase (decrease) in net assets | | | | | | | | |
| resulting from operations | | | 7,226,499 | | | | (10,411,569 | ) |
| | | | | | | | | |
| DISTRIBUTIONS TO SHAREHOLDERS | | | | | | | | |
| Net distributions to shareholders | | | (3,014,672 | ) | | | (2,542,396 | ) |
| | | | | | | | | |
| CAPITAL SHARE TRANSACTIONS | | | | | | | | |
Net increase (decrease) from capital share transactions1 | | | 1,603,864 | | | | 2,132,063 | |
| Total increase (decrease) in net assets | | | 5,815,691 | | | | (10,821,902 | ) |
| | | | | | | | | |
| NET ASSETS | | | | | | | | |
| Beginning of period/year | | | 46,669,767 | | | | 57,491,669 | |
| End of period/year | | $ | 52,485,458 | | | $ | 46,669,767 | |
1 | A summary of share transactions is as follows: |
| | | | Six Months Ended | | | | | | | |
| | | | March 31, 2023 | | | Year Ended | |
| | | | (Unaudited) | | | September 30, 2022 | |
| | | | Shares | | | Value | | | Shares | | | Value | |
| | Shares sold | | | 25,320 | | | $ | 1,290,630 | | | | 86,209 | | | $ | 4,917,029 | |
| | Shares issued to holders | | | | | | | | | | | | | | | | |
| | in reinvestment | | | | | | | | | | | | | | | | |
| | of distributions | | | 50,546 | | | | 2,528,835 | | | | 34,244 | | | | 2,147,805 | |
| | Shares redeemed2 | | | (42,764 | ) | | | (2,215,601 | ) | | | (84,815 | ) | | | (4,932,771 | ) |
| | Net increase (decrease) | | | 33,102 | | | $ | 1,603,864 | | | | 35,638 | | | $ | 2,132,063 | |
| | Beginning shares | | | 963,548 | | | | | | | | 927,910 | | | | | |
| | Ending shares | | | 996,650 | | | | | | | | 963,548 | | | | | |
2 | Net of redemption fees of $0 and $7,064, respectively. |
The accompanying notes are an integral part of these financial statements.
BOSTON COMMON ESG IMPACT EMERGING MARKETS FUND
| FINANCIAL HIGHLIGHTS For a capital share outstanding throughout each period/year |
| | | Six Months Ended | | | Year Ended | | | Period Ended | |
| | | March 31, 2023 | | | September 30, | | | September 30, | |
| | | (Unaudited) | | | 2022 | | | | 20211 | |
| Net asset value, | | | | | | | | | | |
| beginning of period/year | | $ | 18.02 | | | $ | 25.02 | | | $ | 25.00 | |
| | | | | | | | | | | | | |
| INCOME (LOSS) FROM INVESTMENT OPERATIONS: | | | | | | | | | | | | |
| Net investment income (loss)2 | | | 0.07 | | | | 0.35 | | | | 0.02 | |
| Net realized and unrealized | | | | | | | | | | | | |
| gain (loss) on investments | | | 3.06 | | | | (7.24 | ) | | | — | |
| Total from operations | | | 3.13 | | | | (6.89 | ) | | | 0.02 | |
| | | | | | | | | | | | | |
| LESS DISTRIBUTIONS: | | | | | | | | | | | | |
| Distributions from | | | | | | | | | | | | |
| net investment income | | | (0.40 | ) | | | (0.11 | ) | | | — | |
| Distributions from net realized gain | | | — | | | | — | | | | — | |
| Total distributions | | | (0.40 | ) | | | (0.11 | ) | | | — | |
| Paid-in capital from redemption fees | | | — | | | | — | | | | — | |
| Net asset value, end of period/year | | $ | 20.75 | | | $ | 18.02 | | | $ | 25.02 | |
| Total return | | | 17.49 | %3 | | | (27.64 | )% | | | 0.08 | %3 |
| | | | | | | | | | | | | |
| SUPPLEMENTAL DATA: | | | | | | | | | | | | |
| Net assets, end of period/year (000’s) | | $ | 31,655 | | | $ | 21,042 | | | $ | 751 | |
| Expenses before fees waived | | | 1.77 | %4 | | | 1.94 | % | | | 63.49 | %4 |
| Expenses after fees waived | | | 0.99 | %4 | | | 0.99 | % | | | 0.99 | %4 |
| Net investment income | | | | | | | | | | | | |
| before fees waived | | | (0.09 | %)4 | | | 0.63 | % | | | (59.75 | %)4 |
| Net investment income | | | | | | | | | | | | |
| after fees waived | | | 0.69 | %4 | | | 1.58 | % | | | 2.75 | %4 |
| Portfolio turnover rate | | | 14 | %3 | | | 36 | % | | | 0 | %3 |
1 | Emerging Markets Fund commenced operations on September 21, 2021. Information presented is for the period from September 21, 2021 to September 30, 2021. |
2 | Calculated based on average shares outstanding during the period. |
3 | Not Annualized. |
4 | Annualized. |
The accompanying notes are an integral part of these financial statements.
BOSTON COMMON ESG IMPACT INTERNATIONAL FUND
| FINANCIAL HIGHLIGHTS For a capital share outstanding throughout each period/year |
| | | Six Months | | | | | | | | | | | | | | | | |
| | | Ended | | | | | | | | | | | | | | | | |
| | | March 31, | | | | | | | | | | | | | | | | |
| | | 2023 | | | Year Ended September 30, | |
| | | (Unaudited) | | | 2022 | | | 2021 | | | 2020 | | | 2019 | | | 2018 | |
| Net asset value, beginning | | | | | | | | | | | | | | | | | | |
| of period/year | | $ | 25.04 | | | $ | 38.56 | | | $ | 32.48 | | | $ | 29.32 | | | $ | 30.51 | | | $ | 30.14 | |
| | | | | | | | | | | | | | | | | | | | | | | | | |
| INCOME (LOSS) FROM INVESTMENT OPERATIONS: | |
| Net investment | | | | | | | | | | | | | | | | | | | | | | | | |
income (loss)1 | | | 0.09 | | | | 0.62 | | | | 0.40 | | | | 0.23 | | | | 0.59 | | | | 0.42 | |
| Net realized and unrealized | | | | | | | | | | | | | | | | | | | | | | | | |
| gain (loss) on investments | | | 6.43 | | | | (12.89 | ) | | | 5.92 | | | | 3.64 | | | | (1.41 | ) | | | 0.31 | |
| Total from operations | | | 6.52 | | | | (12.27 | ) | | | 6.32 | | | | 3.87 | | | | (0.82 | ) | | | 0.73 | |
| | | | | | | | | | | | | | | | | | | | | | | | | |
| LESS DISTRIBUTIONS: | | | | | | | | | | | | | | | | | | | | | | | | |
| Distributions from | | | | | | | | | | | | | | | | | | | | | | | | |
| net investment income | | | (0.36 | ) | | | (0.65 | ) | | | (0.24 | ) | | | (0.71 | ) | | | (0.37 | ) | | | (0.36 | ) |
| Distributions from | | | | | | | | | | | | | | | | | | | | | | | | |
| net realized gain | | | — | | | | (0.60 | ) | | | — | | | | — | | | | — | | | | — | |
| Total distributions | | | (0.36 | ) | | | (1.25 | ) | | | (0.24 | ) | | | (0.71 | ) | | | (0.37 | ) | | | (0.36 | ) |
| Paid-in capital from | | | | | | | | | | | | | | | | | | | | | | | | |
| redemption fees | | | 0.00 | 2 | | | 0.00 | 2 | | | 0.00 | 2 | | | 0.00 | 2 | | | 0.00 | 2 | | | 0.00 | 2 |
| Net asset value, | | | | | | | | | | | | | | | | | | | | | | | | |
| end of period/year | | $ | 31.20 | | | $ | 25.04 | | | $ | 38.56 | | | $ | 32.48 | | | $ | 29.32 | | | $ | 30.51 | |
| Total return | | | 26.16 | %3 | | | (32.85 | )% | | | 19.48 | % | | | 13.29 | % | | | (2.53 | )% | | | 2.43 | % |
| | | | | | | | | | | | | | | | | | | | | | | | | |
| SUPPLEMENTAL DATA: | | | | | | | | | | | | | | | | | | | | | | | | |
| Net assets, end of | | | | | | | | | | | | | | | | | | | | | | | | |
| period/year (000’s) | | $ | 506,614 | | | $ | 414,237 | | | $ | 495,197 | | | $ | 320,526 | | | $ | 234,114 | | | $ | 250,694 | |
| Expenses before | | | | | | | | | | | | | | | | | | | | | | | | |
| fees waived | | | 0.98 | %4 | | | 0.97 | % | | | 0.97 | % | | | 1.00 | % | | | 1.00 | % | | | 1.04 | % |
| Expenses after | | | | | | | | | | | | | | | | | | | | | | | | |
| fees waived | | | 0.86 | %4 | | | 0.90 | %5 | | | 0.97 | % | | | 1.00 | % | | | 1.00 | % | | | 1.04 | % |
| Net investment income | | | | | | | | | | | | | | | | | | | | | | | | |
| before fees waived | | | 0.53 | %4 | | | 1.84 | % | | | 1.07 | % | | | 0.75 | % | | | 2.09 | % | | | 1.38 | % |
| Net investment income | | | | | | | | | | | | | | | | | | | | | | | | |
| after fees waived | | | 0.65 | %4 | | | 1.91 | % | | | 1.07 | % | | | 0.75 | % | | | 2.09 | % | | | 1.38 | % |
| Portfolio turnover rate | | | 8 | %3 | | | 22 | % | | | 24 | % | | | 33 | % | | | 32 | % | | | 26 | % |
1 | Calculated based on average shares outstanding during the period. |
2 | Less than $0.01 or $(0.01) per share, as applicable. |
3 | Not Annualized. |
4 | Annualized. |
5 | Prior to March 1, 2022, the expense cap was 0.99%. Effective March 1, 2022, the expense cap is 0.86%. |
The accompanying notes are an integral part of these financial statements.
BOSTON COMMON ESG IMPACT U.S. EQUITY FUND
| FINANCIAL HIGHLIGHTS For a capital share outstanding throughout each period/year |
| | | Six Months | | | | | | | | | | | | | | | | |
| | | Ended | | | | | | | | | | | | | | | | |
| | | March 31, | | | | | | | | | | | | | | | | |
| | | 2023 | | | Year Ended September 30, | |
| | | (Unaudited) | | | 2022 | | | 2021 | | | 2020 | | | 2019 | | | 2018 | |
| Net asset value, beginning | | | | | | | | | | | | | | | | | | |
| of period/year | | $ | 48.44 | | | $ | 61.96 | | | $ | 47.97 | | | $ | 43.69 | | | $ | 45.18 | | | $ | 41.77 | |
| | | | | | | | | | | | | | | | | | | | | | | | | |
| INCOME (LOSS) FROM INVESTMENT OPERATIONS: | |
| Net investment | | | | | | | | | | | | | | | | | | | | | | | | |
income (loss)1 | | | 0.18 | | | | 0.15 | | | | 0.08 | | | | 0.23 | | | | 0.29 | | | | 0.28 | |
| Net realized and unrealized | | | | | | | | | | | | | | | | | | | | | | | | |
| gain (loss) on investments | | | 7.19 | | | | (10.92 | ) | | | 14.10 | | | | 5.85 | | | | 0.25 | | | | 4.47 | |
| Total from operations | | | 7.37 | | | | (10.77 | ) | | | 14.18 | | | | 6.08 | | | | 0.54 | | | | 4.75 | |
| | | | | | | | | | | | | | | | | | | | | | | | | |
| LESS DISTRIBUTIONS: | |
| Distributions from net | | | | | | | | | | | | | | | | | | | | | | | | |
| investment income | | | (0.12 | ) | | | (0.06 | ) | | | (0.19 | ) | | | (0.27 | ) | | | (0.29 | ) | | | (0.37 | ) |
| Distributions from | | | | | | | | | | | | | | | | | | | | | | | | |
| net realized gain | | | (3.03 | ) | | | (2.69 | ) | | | — | | | | (1.53 | ) | | | (1.74 | ) | | | (0.97 | ) |
| Total distributions | | | (3.15 | ) | | | (2.75 | ) | | | (0.19 | ) | | | (1.80 | ) | | | (2.03 | ) | | | (1.34 | ) |
| Paid-in capital from | | | | | | | | | | | | | | | | | | | | | | | | |
| redemption fees | | | — | | | | 0.00 | 2 | | | — | | | | — | | | | — | | | | — | |
| Net asset value, | | | | | | | | | | | | | | | | | | | | | | | | |
| end of period/year | | $ | 52.66 | | | $ | 48.44 | | | $ | 61.96 | | | $ | 47.97 | | | $ | 43.69 | | | $ | 45.18 | |
| Total return | | | 15.55 | %3 | | | (18.38 | )% | | | 29.62 | % | | | 14.17 | % | | | 2.02 | % | | | 11.50 | % |
| | | | | | | | | | | | | | | | | | | | | | | | | |
| SUPPLEMENTAL DATA: | |
| Net assets, end | | | | | | | | | | | | | | | | | | | | | | | | |
| of period/year (000’s) | | $ | 52,485 | | | $ | 46,670 | | | $ | 57,492 | | | $ | 43,213 | | | $ | 37,974 | | | $ | 36,181 | |
| Expenses before | | | | | | | | | | | | | | | | | | | | | | | | |
| fees waived | | | 1.18 | %4 | | | 1.14 | % | | | 1.14 | % | | | 1.27 | % | | | 1.25 | % | | | 1.30 | % |
| Expenses after | | | | | | | | | | | | | | | | | | | | | | | | |
| fees waived | | | 1.00 | %4 | | | 1.00 | % | | | 1.00 | % | | | 1.00 | % | | | 1.00 | % | | | 1.00 | % |
| Net investment income | | | | | | | | | | | | | | | | | | | | | | | | |
| before fees waived | | | 0.52 | %4 | | | 0.11 | % | | | (0.01 | )% | | | 0.23 | % | | | 0.43 | % | | | 0.34 | % |
| Net investment income | | | | | | | | | | | | | | | | | | | | | | | | |
| after fees waived | | | 0.70 | %4 | | | 0.25 | % | | | 0.13 | % | | | 0.50 | % | | | 0.68 | % | | | 0.64 | % |
| Portfolio turnover rate | | | 11 | %3 | | | 29 | % | | | 19 | % | | | 38 | % | | | 28 | % | | | 27 | % |
1 | Calculated based on average shares outstanding during the period. |
2 | Does not round to $0.01 or $(0.01), as applicable. |
3 | Not annualized. |
4 | Annualized. |
The accompanying notes are an integral part of these financial statements.
BOSTON COMMON ESG IMPACT FUNDS
| NOTES TO FINANCIAL STATEMENTS March 31, 2023 (Unaudited) |
The Emerging Markets Fund, International Fund and the U.S. Equity Fund (collectively the “Funds”) are each a diversified series of shares of beneficial interest of Professionally Managed Portfolios (the “Trust”), which is registered under the Investment Company Act of 1940, as amended, (the “1940 Act”) as an open-end management investment company. The Funds commenced operations on September 21, 2021, December 29, 2010 and April 30, 2012, respectively. Each Fund is an investment company and accordingly follows the investment company accounting and reporting guidance of the Financial Accounting Standards Board (FASB) Accounting Standard Codification Topic 946 “Financial Services — Investment Companies.”
The Funds’ investment objective is to seek long-term capital appreciation. The Funds seek to preserve and build capital over the long-term through investing in a diversified portfolio of common stocks and American Depositary Receipts (“ADR”) of companies it believes are high quality, sustainable and undervalued. The Emerging Markets Fund and the International Fund invest in European Depositary Receipts and Global Depositary Receipts.
| NOTE 2 – SIGNIFICANT ACCOUNTING POLICIES |
The following is a summary of significant accounting policies consistently followed by the Funds. These policies are in conformity with accounting principles generally accepted in the United States of America (“U.S. GAAP”).
| | A. | Security Valuation. All equity securities, which may include Real Estate Investment Trusts (“REITs”), Business Development Companies (“BDCs”) and Master Limited Partnerships (“MLPs”), that are traded on U.S. or foreign national securities exchanges are valued at the last reported sale price on the exchange on which the security is principally traded or the exchange’s official closing price, if applicable. If, on a particular day, an exchange-traded security does not trade, then the mean between the most recent quoted bid and asked prices will be used. All equity securities, which may include REITs, BDCs and MLPs, that are not traded on a listed exchange are valued at the last sale price in the over-the-counter market. If a non- exchange traded security does not trade on a particular day, then the mean between the last quoted closing bid and asked price will be used. |
| | | |
| | | For foreign securities traded on foreign exchanges the Trust has selected ICE Data Services Fair Value Information Services (“FVIS”) to provide pricing data with respect to foreign security holdings held by the Emerging Markets Fund and the International Fund. The use of this third-party pricing service is designed to capture events occurring after a |
BOSTON COMMON ESG IMPACT FUNDS
| NOTES TO FINANCIAL STATEMENTS March 31, 2023 (Unaudited) (Continued) |
| | | foreign exchange closes that may affect the value of certain holdings of the Funds’ securities traded on those foreign exchanges. The Funds utilize a confidence interval when determining the use of the FVIS provided prices. The confidence interval is a measure of the historical relationship that each foreign exchange traded security has to movements in various indices and the price of the security’s corresponding ADR, if one exists. FVIS provides the confidence interval for each security for which it provides a price. If the FVIS provided price falls within the confidence interval the Funds will value the particular security at that price. If the FVIS provided price does not fall within the confidence interval the particular security will be valued at the preceding closing price on its respective foreign exchange, or if there were no transactions on such day, at the mean between the bid and asked prices. |
| | | |
| | | Pursuant to Rule 2a-5 under the 1940 Act, the Board has adopted a Valuation Policy designating Boston Common Asset Management (the “Adviser”) as the Funds’ Valuation Designee. Under Rule 2a-5, the Valuation Designee shall determine the fair value of securities for which readily available market quotes are not available in accordance with procedures approved by the Board. |
| | | |
| | | As described above, the Funds utilize various methods to measure the fair value of its investments on a recurring basis. U.S. GAAP establishes a hierarchy that prioritizes inputs to valuation methods. The three levels of inputs are: |
| | | Level 1 – | Unadjusted quoted prices in active markets for identical assets or liabilities that the Funds have the ability to access. |
| | | | |
| | | Level 2 – | Observable inputs other than quoted prices included in Level 1 that are observable for the asset or liability, either directly or indirectly. These inputs may include quoted prices for the identical instrument on an inactive market, prices for similar instruments, interest rates, prepayment speeds, credit risk, yield curves, default rates and similar data. |
| | | | |
| | | Level 3 – | Unobservable inputs for the asset or liability, to the extent relevant observable inputs are not available; representing the Funds’ own assumptions about the assumptions a market participant would use in valuing the asset or liability and would be based on the best information available. |
| | | The availability of observable inputs can vary from security to security and is affected by a wide variety of factors, including, for example, the type of security, whether the security is new and not yet established in the marketplace, the liquidity of markets, and other characteristics particular to the security. To the extent that valuation is based on |
BOSTON COMMON ESG IMPACT FUNDS
| NOTES TO FINANCIAL STATEMENTS March 31, 2023 (Unaudited) (Continued) |
| | | models or inputs that are less observable or unobservable in the market, the determination of fair value requires more judgment. Accordingly, the degree of judgment exercised in determining fair value is greatest for instruments categorized in Level 3. |
| | | |
| | | The inputs used to measure fair value may fall into different levels of the fair value hierarchy. In such cases, for disclosure purposes, the level in the fair value hierarchy within which the fair value measurement falls in its entirety, is determined based on the lowest level input that is significant to the fair value measurement in its entirety. |
| | | |
| | | The following is a summary of the inputs used to value the Funds’ investments as of March 31, 2023. See the Schedules of Investments for the U.S. Equity Fund’s sector breakouts. |
| | | Emerging Markets Fund | | | | | | | | | | | | |
| | | | | | | | | | | | | | | |
| | | Description | | Level 1 | | | Level 2 | | | Level 3 | | | Total | |
| | | Common Stocks | | | | | | | | | | | | |
| | | Communication | | | | | | | | | | | | |
| | | Services | | $ | 446,872 | | | $ | 2,230,250 | | | $ | — | | | $ | 2,677,122 | |
| | | Consumer Discretionary | | | 1,642,313 | | | | 4,678,972 | | | | — | | | | 6,321,285 | |
| | | Consumer Staples | | | 1,103,090 | | | | 1,733,892 | | | | — | | | | 2,836,982 | |
| | | Financials | | | 1,262,796 | | | | 4,187,334 | | | | — | | | | 5,450,130 | |
| | | Health Care | | | 135,098 | | | | 1,948,582 | | | | — | | | | 2,083,680 | |
| | | Industrials | | | 717,237 | | | | 2,114,651 | | | | — | | | | 2,831,888 | |
| | | Information Technology | | | 2,596,217 | | | | 3,624,003 | | | | — | | | | 6,220,220 | |
| | | Materials | | | — | | | | 1,054,110 | | | | — | | | | 1,054,110 | |
| | | Real Estate | | | — | | | | 587,422 | | | | — | | | | 587,422 | |
| | | Total Common Stocks | | | 7,903,623 | | | | 22,159,216 | | | | — | | | | 30,062,839 | |
| | | Preferred Stocks | | | 878,676 | | | | — | | | | — | | | | 878,676 | |
| | | Short-Term | | | | | | | | | | | | | | | | |
| | | Investments | | | 1,528,879 | | | | — | | | | — | | | | 1,528,879 | |
| | | Total Investments | | | | | | | | | | | | | | | | |
| | | in Securities | | $ | 10,311,178 | | | $ | 22,159,216 | | | $ | — | | | $ | 32,470,394 | |
BOSTON COMMON ESG IMPACT FUNDS
| NOTES TO FINANCIAL STATEMENTS March 31, 2023 (Unaudited) (Continued) |
| | | International Fund | | | | | | | | | | | | |
| | | | | | | | | | | | | | | |
| | | Description | | Level 1 | | | Level 2 | | | Level 3 | | | Total | |
| | | Common Stocks | | | | | | | | | | | | |
| | | Communication | | | | | | | | | | | | |
| | | Services | | $ | — | | | $ | 19,916,585 | | | $ | — | | | $ | 19,916,585 | |
| | | Consumer Discretionary | | | 6,950,284 | | | | 51,440,030 | | | | — | | | | 58,390,314 | |
| | | Consumer Staples | | | 14,752,222 | | | | 51,321,275 | | | | — | | | | 66,073,497 | |
| | | Financials | | | — | | | | 95,972,124 | | | | — | | | | 95,972,124 | |
| | | Health Care | | | 28,964,952 | | | | 50,725,778 | | | | — | | | | 79,690,730 | |
| | | Industrials | | | — | | | | 86,115,440 | | | | — | | | | 86,115,440 | |
| | | Information Technology | | | 10,162,724 | | | | 32,689,344 | | | | — | | | | 42,852,068 | |
| | | Materials | | | — | | | | 13,518,239 | | | | — | | | | 13,518,239 | |
| | | Real Estate | | | — | | | | 12,063,186 | | | | — | | | | 12,063,186 | |
| | | Utilities | | | — | | | | 21,693,283 | | | | — | | | | 21,693,283 | |
| | | Total Common Stocks | | | 60,830,182 | | | | 435,455,284 | | | | — | | | | 496,285,466 | |
| | | Short-Term | | | | | | | | | | | | | | | | |
| | | Investments | | | 10,110,057 | | | | — | | | | — | | | | 10,110,057 | |
| | | Total Investments | | | | | | | | | | | | | | | | |
| | | in Securities | | $ | 70,940,239 | | | $ | 435,455,284 | | | $ | — | | | $ | 506,395,523 | |
| | | | | | | | | | | | | | | | | | | |
| | | U.S. Equity Fund | | | | | | | | | | | | | | | | |
| | | | | | | | | | | | | | | |
| | | Description | | Level 1 | | | Level 2 | | | Level 3 | | | Total | |
| | | Common Stocks | | $ | 51,182,370 | | | $ | — | | | $ | — | | | $ | 51,182,370 | |
| | | Short-Term | | | | | | | | | | | | | | | | |
| | | Investments | | | 1,300,694 | | | | — | | | | — | | | | 1,300,694 | |
| | | Total Investments | | | | | | | | | | | | | | | | |
| | | in Securities | | $ | 52,483,064 | | | $ | — | | | $ | — | | | $ | 52,483,064 | |
| | B. | Foreign Currency. Investment securities and other assets and liabilities denominated in foreign currencies are translated into U.S. dollar amounts at the date of valuation. Purchases and sales of investment securities and income and expense items denominated in foreign currencies are translated into U.S. dollar amounts on the respective dates of such transactions. |
| | | |
| | | The Funds do not isolate that portion of the results of operations resulting from changes in foreign exchange rates on investments from the fluctuations arising from changes in market prices of securities held. Such fluctuations are included with the net realized and unrealized gain or loss from investments. |
| | | |
| | | The Funds report net realized foreign exchange gains or losses that a rise from sales of foreign currencies, currency gains or losses realized between the trade and settlement dates on securities transactions, and |
BOSTON COMMON ESG IMPACT FUNDS
| NOTES TO FINANCIAL STATEMENTS March 31, 2023 (Unaudited) (Continued) |
| | | the difference between the amounts of dividends, interest, and foreign withholding taxes recorded on the Funds’ books and the U.S. dollar equivalent of the amounts actually received or paid. Net unrealized foreign exchange gains and losses arise from changes in the fair values of assets and liabilities, other than investments in securities at period end, resulting from changes in exchange rates. |
| | | |
| | C. | Federal Income Taxes. Each Fund has elected to be taxed as a “regulated investment company” and intends to distribute substantially all taxable income to its shareholders and otherwise comply with the provisions of the Internal Revenue Code applicable to regulated investment companies. Therefore, no provision for federal income taxes or excise taxes has been made. |
| | | |
| | | In order to avoid imposition of the excise tax applicable to regulated investment companies, each Fund intends to declare each year as dividends in each calendar year at least 98.0% of its net investment income (earned during the calendar year) and at least 98.2% of its net realized capital gains (earned during the twelve months ended October 31) plus undistributed amounts, if any, from prior years. |
| | | |
| | | Net capital losses incurred after October 31, within the taxable year are deemed to arise on the first business day of the Funds’ next taxable year. As of the most recent fiscal year ended September 30, 2022, the International Fund had post-October losses of $5,294,646. The Emerging Markets Fund and U.S Equity Fund at the most recent fiscal year ended September 30, 2022 had no post-October losses or late year losses. At September 30, 2022, the Emerging Markets Fund has $758,141 of short-term capital loss carryforwards and $3,301 of long-term capital loss carryforwards, which do not expire. |
| | | |
| | | As of March 31, 2023, the Funds did not have any tax positions that did not meet the “more likely than not” threshold of being sustained by the applicable tax authority. Generally, tax authorities can examine all the tax returns filed for the last three years. The Funds identify their major tax jurisdictions as U.S. Federal and the Commonwealth of Massachusetts. As of March 31, 2023, the Funds are not aware of any tax provisions for which it is reasonably possible that the total amounts of unrecognized tax benefits will change materially. |
| | | |
| | D. | Securities Transactions and Investment Income. Investment securities transactions are accounted for on the trade date. Gains and losses realized on sales of securities are determined on a specific identification basis. Discounts/premiums on debt securities purchased are accreted/amortized over the life of the respective securities using the |
BOSTON COMMON ESG IMPACT FUNDS
| NOTES TO FINANCIAL STATEMENTS March 31, 2023 (Unaudited) (Continued) |
| | | effective interest method. Dividend income is recorded on the ex-dividend date. Dividends received from REITs are generally comprised of ordinary income, capital gains and may include return of capital. Interest income is recorded on an accrual basis. Other non-cash dividends are recognized as investment income at the fair value of the property received. Withholding taxes on foreign dividends have been provided for in accordance with the Trust’s understanding of the applicable country’s tax rules and rates. |
| | | |
| | E. | Distributions to Shareholders. Distributions to shareholders from net investment income and net realized gains on securities for the Funds normally are declared and paid on an annual basis. Distributions are recorded on the ex-dividend date. |
| | | |
| | F. | Use of Estimates. The preparation of financial statements in conformity with U.S. GAAP requires management to make estimates and assumptions that affect the reported amounts of assets and liabilities at the date of the financial statements, as well as the reported amounts of revenues and expenses during the period. Actual results could differ from those estimates. |
| | | |
| | G. | Share Valuation. The net asset value (“NAV”) per share of each Fund is calculated by dividing the sum of the value of the securities held by the Fund, plus cash and other assets, minus all liabilities (including estimated accrued expenses) by the total number of shares outstanding of the Fund, rounded to the nearest cent. The Funds’ shares will not be priced on the days on which the New York Stock Exchange is closed for trading. The offering and redemption price per sha re for each Fund is equal to the Funds’ net asset value per share. The Funds charge a 2.00% redemption fee on shares held less than 30 calendar days. These fees are deducted from the redemption proceeds otherwise payable to the shareholder. The Funds will retain the fee charged as pa id-in capital and such fees become part of that Funds’ daily NAV calculation. |
| | | |
| | H. | Illiquid Securities. Pursuant to Rule 22e-4 under the 1940 Act, the Funds have adopted a Board approved liquidity risk management program that requires, among other things, that the Funds limit their illiquid investments that are assets to no more than 15% of net assets. An illiquid investment is any investment that the Funds reasonably expect cannot be sold or disposed of in current market conditions in seven calendar days or less without the sale or disposition significantly changing the market value of the investment. |
| | | |
| | I. | Guarantees and Indemnifications. In the normal course of business, the Funds enter into contracts with service providers that contain general |
BOSTON COMMON ESG IMPACT FUNDS
| NOTES TO FINANCIAL STATEMENTS March 31, 2023 (Unaudited) (Continued) |
| | | indemnification clauses. The Funds’ maximum exposure under these arrangements is unknown as this would involve future claims that may be against the Funds that have not yet occurred. However, based on experience, the Funds expect the risk of loss to be remote. |
| | | |
| | J. | Recently Issued Accounting Pronouncements. In June 2022, the FASB issued Accounting Standards Update 2022-03, which amends Fair Value Measurement (Topic 820): Fair Value Measurement of Equity Securities Subject to Contractual Sale Restrictions (“ASU 2022-03”). ASU 2022-03 clarifies guidance for fair value measurement of an equity security subject to a contractual sale restriction and establishes new disclosure requirements for such equity securities. ASU 2022-03 is effective for fiscal years beginning after December 15, 2023 and for interim periods within those fiscal years, with early adoption permitted. Management is currently evaluating the impact of these amendments on the financial statements. |
| | | |
| | K. | Subsequent Events. In preparing these financial statements, the Funds have evaluated events and transactions for potential recognition or disclosure through the date the financial statements were issued. The Funds have determined that there were no subsequent events that would need to be disclosed in the Funds’ financial statements. |
| NOTE 3 – COMMITMENTS AND OTHER RELATED PARTY TRANSACTIONS |
The Adviser provides the Funds with investment management services under an Investment Advisory Agreement (the “Agreement”) for the Funds. Under the Agreement, the Adviser furnishes all investment advice, office space, facilities and certain administrative services, and provides most of the personnel needed by the Funds. As compensation for its services, the Adviser is entitled to receive a monthly fee at the annual rate of 0.85% for the Emerging Markets Fund, 0.80% for the International Fund and 0.75% for the U.S. Equity Fund based upon the average daily net assets of each Fund. For the six months ended March 31, 2023, the advisory fees incurred by the Funds are disclosed in the Statements of Operations. The investment advisory fees incurred are paid monthly to the Adviser, net of any monthly waiver or reimbursement discussed below.
The Adviser has contractually agreed to limit the annual ratio of expenses (“Expense Caps”) of each Fund’s average daily net assets to 0.99% for the Emerging Markets Fund, 0.86% for the International Fund and 1.00% for the U.S. Equity Fund, respectively. Prior to March 1, 2022, the Expense Cap for the International Fund was 1.20%. The Operating Expense Limitation Agreements have an indefinite term and may be terminated at any time, and without payment of any penalty, by the Board, on behalf of the Funds, upon
BOSTON COMMON ESG IMPACT FUNDS
| NOTES TO FINANCIAL STATEMENTS March 31, 2023 (Unaudited) (Continued) |
sixty days written notice to the Adviser. Any fees waived and/or Fund expenses absorbed by the Adviser pursuant to an agreed-upon expense cap shall be reimbursed by the Funds to the Adviser, if requested by the Adviser, any time before the end of the third year following the fee waiver and/or expense absorption, provided the aggregate amount of the Funds’ current operating expenses for such year does not exceed the lesser expense cap in place at the time of waiver or at the time of reimbursement. The Funds must pay their current ordinary operating expenses before the Adviser is entitled to any reimbursement of fees and/or expenses. Any such reimbursement is also contingent upon the Board’s review and approval. The amount of fees waived and expenses absorbed by the Adviser during the six months ended March 31, 2023, are disclosed in the Statements of Operations. Any amount due from the Advisor is paid monthly to the Funds, if applicable.
As of March 31, 2023, the remaining cumulative amounts that may be recouped by the Adviser on behalf of the Funds are shown in the following tables. The Adviser may recapture a portion of the unreimbursed amounts no later than the dates stated below.
| | | Emerging | | | International | | | U.S. Equity | |
Year of Expiration | | Markets Fund | | | Fund | | | Fund | |
| September 30, 2023 | | | N/A | | | | N/A | | | $ | 62,094 | |
| September 30, 2024 | | $ | 12,915 | | | | N/A | | | | 74,457 | |
| September 30, 2025 | | | 192,810 | | | $ | 375,501 | | | | 79,175 | |
| March 31, 2026 | | | 100,104 | | | | 263,568 | | | | 44,516 | |
U.S. Bancorp Fund Services, LLC, doing business as U.S. Bank Global Fund Services (“Fund Services”) serves as the Funds’ administrator, fund accountant and transfer agent. In those capacities, Fund Services maintains the Funds’ books and records, calculates the Funds’ NAVs, prepares various federal and state regulatory filings, coordinates the payment of the Funds’ expenses, reviews expense accruals and prepares materials supplied to the Board. The officers of the Trust and the Chief Compliance Officer of the Funds are also employees of Fund Services. Fees paid by the Funds to Fund Services for these services for the six months ended March 31, 2023, are disclosed in the Statements of Operations.
Quasar Distributors, LLC (the “Distributor”) acts as the Funds’ principal underwriter in a continuous public offering of the Funds’ shares. U.S. Bank N.A. serves as the Funds’ custodian. U.S. Bank N.A. is an affiliate of Fund Services.
BOSTON COMMON ESG IMPACT FUNDS
| NOTES TO FINANCIAL STATEMENTS March 31, 2023 (Unaudited) (Continued) |
| NOTE 4 – PURCHASES AND SALES OF SECURITIES |
For the six months ended March 31, 2023, the cost of purchases and proceeds from the sales or maturity of securities, excluding short-term investments, were as follows:
| | | Purchases | | | Sales/Maturities | |
| Emerging Markets Fund | | $ | 10,837,770 | | | $ | 3,574,806 | |
| International Fund | | | 62,206,768 | | | | 79,783,045 | |
| U.S. Equity Fund | | | 5,631,297 | | | | 6,889,913 | |
For the six months ended March 31, 2023, there were no purchases or sales of U.S. Government obligations in the Funds.
| NOTE 5 – DISTRIBUTIONS TO SHAREHOLDERS |
The tax character of distributions pa id by the Funds during the six months ended March 31, 2023 (estimated) and the year ended September 30, 2022 were as follows:
| | | March 31, 2023 | | | September 30, 2022 | |
| Emerging Markets Fund | | | | | | |
| Ordinary income | | $ | 503,855 | | | $ | 88,029 | |
| Long-term capital gain | | | — | | | | — | |
| | | | | | | | | |
| International Fund | | | | | | | | |
| Ordinary income | | $ | 5,898,059 | | | $ | 8,619,331 | |
| Long-term capital gain | | | — | | | | 7,970,552 | |
| | | | | | | | | |
| U.S. Equity Fund | | | | | | | | |
| Ordinary income | | $ | 114,263 | | | $ | 121,891 | |
| Long-term capital gain | | | 2,900,409 | | | | 2,420,505 | |
BOSTON COMMON ESG IMPACT FUNDS
| NOTES TO FINANCIAL STATEMENTS March 31, 2023 (Unaudited) (Continued) |
The components of distributable earnings (losses) and cost basis of investments for federal income tax purposes at the most recent fiscal year ended September 30, 2022 were as follows:
| Emerging Markets Fund | | | |
| | | | | |
| Cost of investments | | $ | 26,908,984 | |
| Gross tax unrealized appreciation | | | 416,157 | |
| Gross tax unrealized depreciation | | | (6,797,639 | ) |
| Net tax unrealized appreciation (depreciation) | | | (6,381,482 | ) |
| Undistributed ordinary income | | | 265,276 | |
| Undistributed long-term capital gain | | | — | |
| Total distributable earnings | | | 265,276 | |
| Other distributable (accumulated) gains (losses) | | | (761,442 | ) |
| Total distributable (accumulated) earnings (losses) | | $ | (6,877,648 | ) |
| | | | | |
| International Fund | | | | |
| | | | | |
| Cost of investments | | $ | 506,992,195 | |
| Gross tax unrealized appreciation | | | 34,542,068 | |
| Gross tax unrealized depreciation | | | (132,059,786 | ) |
| Net tax unrealized appreciation (depreciation) | | | (97,517,718 | ) |
| Undistributed ordinary income | | | 5,594,915 | |
| Undistributed long-term capital gain | | | — | |
| Total distributable earnings | | | 5,594,915 | |
| Other distributable (accumulated) gains (losses) | | | (5,294,646 | ) |
| Total distributable (accumulated) earnings (losses) | | $ | (97,217,449 | ) |
| | | | | |
| U.S. Equity Fund | | | | |
| | | | | |
| Cost of investments | | $ | 35,158,062 | |
| Gross tax unrealized appreciation | | | 13,653,058 | |
| Gross tax unrealized depreciation | | | (2,693,649 | ) |
| Net tax unrealized appreciation (depreciation) | | | 10,959,409 | |
| Undistributed ordinary income | | | 114,265 | |
| Undistributed long-term capital gain | | | 2,900,404 | |
| Total distributable earnings | | | 3,014,669 | |
| Other distributable (accumulated) gains (losses) | | | — | |
| Total distributable (accumulated) earnings (losses) | | $ | 13,974,078 | |
BOSTON COMMON ESG IMPACT FUNDS
| NOTES TO FINANCIAL STATEMENTS March 31, 2023 (Unaudited) (Continued) |
U.S. Bank N.A. has made available to the International Fund and U.S. Equity Fund credit facilities pursuant to separate Loan and Security Agreements for temporary or extraordinary purposes. Interest expense for the six months ended March 31, 2023 is disclosed in the Statements of Operations, if applicable. Credit facility activity for the six months ended March 31, 2023, was as follows:
| | | International Fund | | | U.S. Equity Fund | |
| Maximum available credit | | $ | 10,000,000 | | | $ | 2,000,000 | |
| Largest amount outstanding | | | | | | | | |
| on an individual day | | | 2,725,000 | | | | 1,000 | |
| Average balance when in use | | | 1,059,417 | | | | 1,000 | |
| Credit facility outstanding | | | | | | | | |
| as of March 31, 2023 | | | — | | | | — | |
| Average interest rate | | | 6.85 | % | | | 7.50 | % |
BOSTON COMMON ESG IMPACT FUNDS
| EXPENSE EXAMPLES For the Six Months Ended March 31, 2023 (Unaudited) |
As a shareholder of the Funds, you incur two types of costs: (1) transaction costs and (2) ongoing costs, including investment advisory fees and other Fund expenses. The examples are intended to help you understand your ongoing costs (in dollars) of investing in the Funds and to compare these costs with the ongoing costs of investing in other mutual funds. The example is based on an investment of $1,000 invested at the beginning of the period and held for the entire period (10/1/22 – 3/31/23).
Actual Expenses
The “Actual” line of the following tables provides information about actual account values based on actual returns and actual expenses. Although the Funds charge no sales loads or transaction fees, you will be assessed fees for outgoing wire transfers, returned checks and stop payment orders at prevailing rates charged by Fund Services, the Funds’ transfer agent. If you request a redemption be made by wire transfer, the Funds’ transfer agent currently charges a $15.00 fee. You will be charged a redemption fee equal to 2% of the net amount of the redemption if you redeem within 30 calendar days after purchase. In addition to the Funds’ expenses, you will indirectly bear your proportionate share of any fees and expenses charged by the underlying funds of other investment companies in which the Funds have shares. Actual expenses of the underlying funds may vary. These expenses are not included in the following examples. The following examples include, but are not limited to, investment advisory fees, fund accounting fees, administration fees, custody fees and transfer agent fees. However, the following examples do not include portfolio trading commissions and related expenses and other extraordinary expenses as determined under generally accepted accounting principles. You may use the information in this line, together with the amount you invested, to estimate the expenses that you pa id over the period. Simply divide your account value by $1,000 (for example, an $8,600 account value divided by $1,000 = 8.6), then multiply the result by the number in the first line under the heading entitled “Expenses Paid During the Period” to estimate the expenses you paid on your account during this period.
Hypothetical Example for Comparison Purposes
The “Hypothetical” line of the following tables provides information about hypothetical account values and hypothetical expenses based on each Fund’s actual expense ratio and an assumed rate of return of 5% per year before expenses, which is not each Fund’s actual return. The hypothetical account values and expenses may not be used to estimate the actual ending account balance or expenses you paid for the period. You may use this information to compare the ongoing costs of investing in the Funds and other funds. To do so, compare this 5% hypothetical example with the 5% hypothetical examples that
BOSTON COMMON ESG IMPACT FUNDS
| EXPENSE EXAMPLES For the Six Months Ended March 31, 2023 (Unaudited) (Continued) |
appear in the shareholder reports of the other funds. Please note that the expenses shown in the tables are meant to highlight your ongoing costs only and do not reflect any transactional costs, such as sales charges (loads), redemption fees or exchange fees. Therefore, the second line of the tables are useful in comparing ongoing costs only and will not help you determine the relative total costs of owning different funds. In addition, if these transactional costs were included, your costs would have been higher.
Emerging Markets Fund
| | Beginning | Ending | Expenses Paid |
| | Account Value | Account Value | During the Period |
| | 10/1/22 | 3/31/23 | 10/1/22 – 3/31/231 |
| Actual | $1,000.00 | $1,174.90 | $5.37 |
| | | | |
| Hypothetical (5% return | | | |
| before expenses) | 1,000.00 | 1,020.00 | 4.99 |
1 | Expenses are equal to the Emerging Market Fund’s annualized expense ratio for the most recent six-month period of 0.99% multiplied by the average account value over the period, multiplied by 182/365 days (to reflect the one-half year period). |
International Fund
| | Beginning | Ending | Expenses Paid |
| | Account Value | Account Value | During the Period |
| | 10/1/22 | 3/31/23 | 10/1/22 – 3/31/232 |
| Actual | $1,000.00 | $1,261.60 | $4.85 |
| | | | |
| Hypothetical (5% return | | | |
| before expenses) | 1,000.00 | 1,020.64 | 4.33 |
2 | Expenses are equal to the International Fund’s annualized expense ratio for the most recent six-month period of 0.86% multiplied by the average account value over the period, multiplied by 182/365 days (to reflect the one-half year period). |
U.S. Equity Fund
| | Beginning | Ending | Expenses Paid |
| | Account Value | Account Value | During the Period |
| | 10/1/22 | 3/31/23 | 10/1/22 – 3/31/233 |
| Actual | $1,000.00 | $1,155.50 | $5.37 |
| | | | |
| Hypothetical (5% return | | | |
| before expenses) | 1,000.00 | 1,019.95 | 5.04 |
3 | Expenses are equal to the U.S. Equity Fund’s annualized expense ratio for the most recent six-month period of 1.00% (reflecting fee waivers in effect) multiplied by the average account value over the period, multiplied by 182/365 days (to reflect the one-half year period). |
BOSTON COMMON ESG IMPACT FUNDS
| STATEMENT REGARDING LIQUIDITY RISK MANAGEMENT PROGRAM (Unaudited) |
The Funds have adopted a liquidity risk management program (the “program”). The Board has designated the Adviser’s Chief Compliance Officer (“Adviser CCO”) to serve as the administrator of the program. The Adviser CCO conducts the day-to-day operation of the program pursuant to policies and procedures administered by the Adviser.
Under the program, the Adviser CCO manages the Funds’ liquidity risk, which is the risk that the Funds could not meet shareholder redemption requests without significant dilution of remaining shareholders’ interests in the Funds. This risk is managed by monitoring the degree of liquidity of the Funds’ investments, limiting the amount of the Funds’ illiquid investments, and utilizing various risk management tools and facilities available to the Funds for meeting shareholder redemptions, among other means. The Adviser CCO’s process of determining the degree of liquidity of the Funds’ investments is supported by one or more third-party liquidity assessment vendors.
The Board reviewed a report prepared by the Adviser CCO regarding the operation and effectiveness of the program for the period January 1, 2022 through December 31, 2022. No significant liquidity events impacting the Funds were noted in the report. In addition, the Adviser CCO provided its assessment that the program had been effective in managing the Funds’ liquidity risk.
BOSTON COMMON ESG IMPACT FUNDS
| INFORMATION ABOUT PROXY VOTING (Unaudited) |
A description of the policies and procedures that the Funds use to determine how to vote proxies relating to portfolio securities is available upon request without charge, by calling (877) 777-6944 or by accessing the Funds’ website at www.bostoncommonfunds.com. Furthermore, you can obtain the description on the SEC’s website at www.sec.gov. Information regarding how the Funds vote proxies relating to portfolio securities during the most recent 12-month period ended June 30 is available without charge, upon request, by calling (877) 777-6944. Furthermore, you can obtain the Funds’, proxy voting records on the SEC’s website at www.sec.gov.
| INFORMATION ABOUT THE PORTFOLIO HOLDINGS (Unaudited) |
The Funds’ quarterly holdings for the most recent fiscal year can be obtained by accessing the Funds’ website at www.bostoncommonfunds.com. The Funds file their complete schedule of portfolio holdings with the SEC for the first and third quarters of each fiscal year as an exhibit to their reports on Form N-PORT. The Funds’ Form N-PORT is available on the SEC’s website at www.sec.gov. The Funds’ Form N-PORT may also be obtained by calling (877) 777-6944.
| INFORMATION ABOUT HOUSEHOLDING (Unaudited) |
Each year, you are automatically sent an updated prospectus as well as annual and semi-annual reports for the Funds, if applicable. To reduce expenses, the Funds may mail only one copy of each Fund’s prospectus and each annual and semi-annual report to those addresses shared by two or more accounts. If you wish to receive individual copies of these documents, please call the Funds’ transfer agent at (877) 777-6944 (or contact your financial institution). We will begin sending you individual copies thirty days after receiving your request. In addition, see the Important Notice on the cover page for changes to the distribution of the annual and semi-annual reports effective January 1, 2021.
| INFORMATION ABOUT THE FUNDS’ TRUSTEES (Unaudited) |
The Statement of Additional Information (“SAI”) includes additional information about the Funds’ Trustees and is available without charge, upon request, by calling (877) 777-6944. Furthermore, you can obtain the SAI on the SEC’s website at www.sec.gov or the Funds’ website at www.bostoncommonfunds.com.
(This Page Intentionally Left Blank.)
BOSTON COMMON ESG IMPACT FUNDS
| PRIVACY NOTICE (Unaudited) |
The Funds collect non-public information about you from the following sources:
| | • | Information we receive about you on applications or other forms; |
| | | |
| | • | Information you give us orally; and |
| | | |
| | • | Information about your transactions with us or others. |
We do not disclose any non-public personal information about our shareholders or former shareholders without the shareholder’s authorization, except as permitted by law or in response to inquiries from governmental authorities. We may share information with affiliated parties and unaffiliated third parties with whom we have contracts for servicing the Funds. We will provide unaffiliated third parties with only the information necessary to carry out their assigned responsibility. We maintain physical, electronic and procedural safeguards to protect your non-public personal information and require third parties to treat your non-public information with the same high degree of confidentiality.
In the event that you hold shares of the Funds through a financial intermediary, including, but not limited to, a broker-dealer, bank or trust company, the privacy policy of your financial intermediary would govern how your non-public personal information would be shared by those entities with unaffiliated third parties.
Adviser
BOSTON COMMON ASSET MANAGEMENT, LLC
200 State Street, 7th Floor
Boston, Massachusetts 02109
Distributor
QUASAR DISTRIBUTORS, LLC
111 East Kilbourn Avenue, Suite 2200
Milwaukee, Wisconsin 53202
Custodian
U.S. BANK N.A.
Custody Operations
1555 North RiverCenter Drive, Suite 302
Milwaukee, Wisconsin 53212
Transfer Agent, Fund Accountant and Fund Administrator
U.S. BANCORP FUND SERVICES, LLC
615 East Michigan Street
Milwaukee, Wisconsin 53202
(866) 236-0050
Independent Registered Public Accounting Firm
TAIT, WELLER & BAKER LLP
Two Liberty Place
50 South 16th Street, Suite 2900
Philadelphia, Pennsylvania 19102
Legal Counsel
SULLIVAN & WORCESTER, LLP
1633 Broadway, 32nd Floor
New York, New York 10019
Boston Common ESG Impact Emerging Markets Fund
Symbol – BCEMX
CUSIP – 74316J227
Boston Common ESG Impact International Fund
Symbol – BCAIX
CUSIP – 74316J110
Boston Common ESG Impact U.S. Equity Fund
Symbol – BCAMX
CUSIP – 74316J680

Printed on 100% post-consumer waste paper
Item 2. Code of Ethics.
Not applicable for semi-annual reports.
Item 3. Audit Committee Financial Expert.
Not applicable for semi-annual reports.
Item 4. Principal Accountant Fees and Services.
Not applicable for semi-annual reports.
Item 5. Audit Committee of Listed Registrants.
Not applicable to registrants who are not listed issuers (as defined in Rule 10A-3 under the Securities Exchange Act of 1934).
Item 6. Investments.
(a) Schedule of Investments is included as part of the report to shareholders filed under Item 1 of this Form.
(b) Not applicable.
Item 7. Disclosure of Proxy Voting Policies and Procedures for Closed-End Management Investment Companies.
Not applicable to open-end investment companies.
Item 8. Portfolio Managers of Closed-End Management Investment Companies.
Not applicable to open-end investment companies.
Item 9. Purchases of Equity Securities by Closed‑End Management Investment Company and Affiliated Purchasers.
Not applicable to open-end investment companies.
Item 10. Submission of Matters to a Vote of Security Holders.
There have been no material changes to the procedures by which shareholders may recommend nominees to the registrant’s board of Trustees.
Item 11. Controls and Procedures.
| (a) | The Registrant’s President/Principal Executive Officer and Treasurer/Principal Financial Officer have reviewed the Registrant's disclosure controls and procedures (as defined in Rule 30a-3(c) under the Investment Company Act of 1940 (the “Act”)) as of a date within 90 days of the filing of this report, as required by Rule 30a-3(b) under the Act and Rules 13a-15(b) or 15d‑15(b) under the Securities Exchange Act of 1934. Based on their review, such officers have concluded that the disclosure controls and procedures are effective in ensuring that information required to be disclosed in this report is appropriately recorded, processed, summarized and reported and made known to them by others within the Registrant and by the Registrant’s service provider. |
| (b) | There were no changes in the Registrant's internal control over financial reporting (as defined in Rule 30a-3(d) under the Act) that occurred during the period covered by this report that have materially affected, or are reasonably likely to materially affect, the Registrant's internal control over financial reporting. |
Item 12. Disclosure of Securities Lending Activities for Closed-End Management Investment Companies
Not applicable to open-end investment companies.
Item 13. Exhibits.
| (a) | (1) Any code of ethics or amendment thereto, that is the subject of the disclosure required by Item 2, to the extent that the registrant intends to satisfy Item 2 requirements through filing an exhibit. Incorporated by reference to previous Form N-CSR filing.
|
(2) A separate certification for each principal executive officer and principal financial officer pursuant to Section 302 of the Sarbanes-Oxley Act of 2002. Filed herewith.
(3) Any written solicitation to purchase securities under Rule 23c‑1 under the Act sent or given during the period covered by the report by or on behalf of the registrant to 10 or more persons. Not applicable to open-end investment companies.
(4) Change in the registrant’s independent public accountant. There was no change in the registrant’s independent public accountant for the period covered by this report.
| (b) | Certifications pursuant to Section 906 of the Sarbanes‑Oxley Act of 2002. Furnished herewith. |
SIGNATURES
Pursuant to the requirements of the Securities Exchange Act of 1934 and the Investment Company Act of 1940, the registrant has duly caused this report to be signed on its behalf by the undersigned, thereunto duly authorized.
(Registrant) Professionally Managed Portfolios
By (Signature and Title) /s/ Jason Hadler
Jason Hadler, President/Principal Executive Officer
Date June 2, 2023
Pursuant to the requirements of the Securities Exchange Act of 1934 and the Investment Company Act of 1940, this report has been signed below by the following persons on behalf of the registrant and in the capacities and on the dates indicated.
By (Signature and Title) /s/ Jason Hadler
Jason Hadler, President/Principal Executive Officer
Date June 2, 2023
By (Signature and Title) /s/ Craig Benton
Craig Benton, Treasurer/Principal Financial Officer
Date June 2, 2023
* Print the name and title of each signing officer under his or her signature.