UNITED STATES
SECURITIES AND EXCHANGE COMMISSION
Washington, D.C. 20549
SECURITIES AND EXCHANGE COMMISSION
Washington, D.C. 20549
FORM N-CSR
CERTIFIED SHAREHOLDER REPORT OF REGISTERED
MANAGEMENT INVESTMENT COMPANIES
Investment Company Act file number (811-05037)
Professionally Managed Portfolios
(Exact name of registrant as specified in charter)
(Exact name of registrant as specified in charter)
615 East Michigan Street
Milwaukee, WI 53202
(Address of principal executive offices) (Zip code)
(Address of principal executive offices) (Zip code)
Jason Hadler
Professionally Managed Portfolios
c/o U.S. Bank Global Fund Services
777 E. Wisconsin Avenue
Milwaukee, WI 53202
(Name and address of agent for service)
777 E. Wisconsin Avenue
Milwaukee, WI 53202
(Name and address of agent for service)
(414) 516-1523
Registrant's telephone number, including area code
Date of fiscal year end: March 31
Date of reporting period: March 31, 2023
Item 1. Report to Stockholders.
| (a) |
| | |||
| Annual Report | |||
| For the Year Ended March 31, 2023 | |||
| Osterweis Fund | ||
| Osterweis Strategic Income Fund | ||
| Osterweis Growth & Income Fund | ||
| Osterweis Emerging Opportunity Fund | ||
| Osterweis Total Return Fund | ||
| Osterweis Short Duration Credit Fund | ||
| Osterweis Sustainable Credit Fund |

Important Notice:
Beginning on January 1, 2021, as permitted by regulations adopted by the Securities and Exchange Commission, paper copies of the Funds’ annual and semi-annual shareholder reports are no longer sent by mail, unless you specifically request paper copies of the reports. Instead, the reports are made available on the Funds’ website at www.osterweis.com/literature, and you will be notified by mail each time a report is posted and provided with a website to access the report. If you already elected to receive shareholder reports electronically, you will not be affected by this change and you need not take any action.
If you would like to receive paper copies and have not done so already, you may elect to receive paper copies of all future reports free of charge by contacting your financial intermediary or, if you invest directly with the Osterweis Funds, calling (866) 236-0050. Your election to receive paper reports will apply to all funds held within your account(s).
Disclosures
Past performance is no guarantee of future results. This commentary contains the current opinions of the author as of the referenced date, which are subject to change at any time. This commentary has been distributed for informational purposes only and is not a recommendation or offer of any particular security, strategy or investment product. Information contained herein has been obtained from sources believed to be reliable but is not guaranteed.
Fund holdings and sector allocations are subject to change at any time and should not be considered a recommendation to buy or sell any security. Current and future portfolio holdings are subject to risk. Please refer to the Schedule of Investments for complete fund holdings.
No part of this document may be reproduced in any form, or referred to in any other publication, without the express written permission of Osterweis Capital Management.
The Consumer Price Index (CPI) measures the overall change in consumer prices based on a representative basket of goods and services over time.
The S&P 500 Index is an unmanaged index that is widely regarded as the standard for measuring large-cap U.S. stock market performance.
The Bloomberg U.S. Aggregate Bond Index (BC Agg) is an unmanaged index that is widely regarded as a standard for measuring U.S. investment grade bond market performance.
The 60/40 blend is composed of 60% S&P 500 and 40% BC Agg and assumes monthly rebalancing. The Bloomberg U.S. Aggregate Bond 1 – 3 Year Index is the 1-3 Year segment of the BC Agg.
The Bloomberg U.S. Universal Bond Index (BC Univ) is an unmanaged index comprising U.S. dollar-denominated, taxable bonds that are rated investment grade or below investment grade.
The ICE 0-2 Yr Duration BB-B U.S. High Yield Constrained Index contains all securities in the ICE BofA U.S. High Yield Index rated BB1 through B3 with a duration-to-worst of less than two years.
The ICE BofA Single-B U.S. High Yield Index is a subset of ICE BofA U.S. High Yield Index including all securities rated B1 through B3.
The Russell 2000 Growth Index (Russell 2000G) is a market-capitalization-weighted index representing the small cap growth segment of U.S. equities.
These indices reflect the reinvestment of dividends and/or interest income. These indices do not incur expenses and are not available for investment.
The Underlying Inflation Gauge captures sustained movements in inflation from information contained in a broad set of price, real activity, and financial data.
A mortgage-backed security (MBS) is a type of debt security that is secured by a mortgage or collection of mortgages.
An asset-backed security (ABS) is a type of financial investment that is collateralized by an underlying pool of assets—usually ones that generate a cash flow from debt, such as loans, leases, credit card balances, or receivables.
A collateralized mortgage obligation (CMO) refers to a type of mortgage-backed security that represents a tranche in a pool of mortgages that are bundled into tranches based on their risk classifications.
A yield curve is a graph that plots bond yields vs. maturities, at a set point in time, assuming the bonds have equal credit quality. In the U.S., the yield curve generally refers to that of Treasuries.
Treasuries (including bonds, notes, and bills) are securities sold by the federal government to consumers and investors to fund its operations. They are all backed by “the full faith and credit of the United States government,” and thus are considered free of default risk.
Treasury Inflation-Protected Security (TIPS) are a type of Treasury security issued by the U.S. government that is indexed to inflation in order to protect investors from a decline in the purchasing power of their money. As inflation rises, TIPS adjust in price to maintain their real value.
All currency figures are shown in USD.
Cash flow measures the cash-generating capability of a company and is calculated by adding non-cash charges (e.g., depreciation) and interest expense to pretax income.
Spread is the difference in yield between a risk-free asset such as a U.S. Treasury bond and another security with the same maturity but of lesser quality.
Duration measures the sensitivity of a fixed income security’s price (or the aggregate market value of a portfolio of fixed income securities) to changes in interest rates. Fixed income securities with longer durations generally have more volatile prices than those of comparable quality with shorter durations.
A basis point is a unit of measure used in finance to describe the percentage change in the value or return of a financial instrument. One basis point is equal to 1/100th of 1% or 0.01% (0.0001).
Investment grade and non-investment grade (high yield) categories are determined by credit ratings from Standard and Poor’s and Moody’s, which are private independent rating services that assign grades to bonds to represent their credit quality. The issues are evaluated based on such factors as the bond issuer’s financial strength, or its ability to pay a bond’s principal and interest in a timely fashion. Standard and Poor’s ratings are expressed as letters ranging from ‘AAA’, which is the highest grade, to ‘D’, which is the lowest grade. Moody’s ratings are expressed as letters and numbers ranging from ‘Aaa’, which is the highest grade, to ‘C’, which is the lowest grade. A Standard and Poor’s rating of BBB- or higher is considered investment grade. A Moody’s rating of Baa3 or higher is considered investment grade. A Standard and Poor’s rating below BBB- is considered noninvestment grade. A Moody’s rating below Baa3 is considered non-investment grade.
The Global Industry Classification Standard (GICS) was developed by and is the exclusive property and a service mark of MSCI Inc. (MSCI) and Standard & Poor’s, a division of The McGraw-Hill Companies, Inc. (S&P) and is licensed for use by Osterweis Capital Management.
Neither MSCI, S&P, nor any other party involved in making or compiling the GICS classifications makes any express or implied warranties or representations with respect to such standard or classification (or the results to be obtained by the use thereof), and all such parties hereby expressly disclaim all warranties of originality, accuracy, completeness, merchantability and fitness for a particular purpose with respect to any such standard or classification. Without limiting any of the foregoing, in no event shall MSCI, S&P, any of their affiliates or any third party involved in making or compiling the GICS or any GICS classifications have any liability for any direct, indirect, special, punitive, consequential or any other damages (including lost profits), even if notified of the possibility of such damages.
Any ICE index data referenced herein is the property of ICE Data Indices, LLC, its affiliates (“ICE Data”) and/or its Third Party Suppliers and has been licensed for use by Osterweis Capital Management. ICE Data and its Third Party Suppliers accept no liability in connection with its use. See https://www.osterweis.com/glossary for a full copy of the Disclaimer.
This document must be preceded or accompanied by a current prospectus. Please refer to the prospectus for important information about the investment company including objectives, risks, charges and expenses.
Osterweis Capital Management Inc. is the adviser to the Osterweis Funds, while Osterweis Capital Management LLC is the adviser to the Osterweis Strategic Income Fund, the Osterweis Growth & Income Fund, the Osterweis Emerging Opportunity Fund, the Osterweis Total Return Fund, the Osterweis Short Duration Credit Fund, and the Osterweis Sustainable Credit Fund. The Osterweis Funds are distributed by Quasar Distributors, LLC. [OSTE-20230517-0874]
Table of Contents
| Letter from the Investment Teams | 2 | |
| Manager Reviews, Fund Overviews and Schedules of Investments | ||
| Osterweis Fund | ||
| Portfolio Managers’ Review | 3 | |
| Fund Overview | 4 | |
| Schedule of Investments | 5 | |
| Osterweis Strategic Income Fund | ||
| Portfolio Managers’ Review | 7 | |
| Fund Overview | 8 | |
| Schedule of Investments | 9 | |
| Osterweis Growth & Income Fund | ||
| Portfolio Managers’ Review | 15 | |
| Fund Overview | 17 | |
| Schedule of Investments | 18 | |
| Osterweis Emerging Opportunity Fund | ||
| Portfolio Managers’ Review | 23 | |
| Fund Overview | 25 | |
| Schedule of Investments | 26 | |
| Osterweis Total Return Fund | ||
| Portfolio Managers’ Review | 28 | |
| Fund Overview | 29 | |
| Schedule of Investments | 30 | |
| Osterweis Short Duration Credit Fund | ||
| Portfolio Managers’ Review | 35 | |
| Fund Overview | 36 | |
| Schedule of Investments | 37 | |
| Osterweis Sustainable Credit Fund | ||
| Portfolio Managers’ Review | 39 | |
| Fund Overview | 40 | |
| Schedule of Investments | 41 | |
| Financial Statements | ||
| Statements of Assets and Liabilities | 43 | |
| Statements of Operations | 45 | |
| Statements of Changes in Net Assets | ||
| Osterweis Fund | 47 | |
| Osterweis Strategic Income Fund | 48 | |
| Osterweis Growth & Income Fund | 49 | |
| Osterweis Emerging Opportunity Fund | 50 | |
| Osterweis Total Return Fund | 51 | |
| Osterweis Short Duration Credit Fund | 52 | |
| Osterweis Sustainable Credit Fund | 53 | |
| Financial Highlights | ||
| Osterweis Fund | 54 | |
| Osterweis Strategic Income Fund | 55 | |
| Osterweis Growth & Income Fund | 56 | |
| Osterweis Emerging Opportunity Fund | 57 | |
| Osterweis Total Return Fund | 58 | |
| Osterweis Short Duration Credit Fund | 59 | |
| Osterweis Sustainable Credit Fund | 60 | |
| Notes to Financial Statements | 61 | |
| Report of Independent Registered Public Accounting Firm | 76 | |
| Expense Examples | 78 | |
| Trustees and Executive Officers | 80 | |
| Additional Information | 83 | |
| Approval of Investment Advisory Agreements | 85 | |
| Statement Regarding Liquidity Risk Management Program | 89 | |
| Privacy Notice | 90 |
Letter from the Investment Teams
April 15, 2023
The last three years have felt a bit like running a marathon at a sprinter’s pace. Each December, market participants have exhaled, grateful for the end of a trying year, only to realize a few months later that the next one is just as trying. This year seemed like the one in which investors could finally catch their breath. With the Fed’s battle with inflation well underway, the remaining questions were not inconsequential but felt knowable and manageable: How much demand could the Fed curb, how deep a recession might they cause, and how long would it last?
Unfortunately, as per usual, things did not go according to plan. Unexpected tremors in the banking system roiled markets throughout the first quarter of 2023, creating an entirely new challenge for the Fed (in addition to the ongoing battle with inflation). Meanwhile, the debt ceiling debate has made no headway in Washington, and the June 1 default deadline is rapidly approaching.
Once again, we find ourselves in familiar territory, trying to process volatility-inducing headlines and wondering what the rest of 2023 will have in store. It is precisely this unpredictability that drives our relentless focus on fundamentals. In our experience, it is more effective to analyze the prospects of individual companies than to try forecast the direction of the broader market and/or the macro economy.
At the same time, the omnipresent economic uncertainty of the recent past has prompted us to position our portfolios a bit more defensively. As you will read in the Portfolio Managers’ Reviews in the following pages, during the last fiscal year we shifted towards investments that we expect to hold up better should the Fed fail to engineer a “soft landing.” These companies tend to have more stable customer bases and more predictable revenues, so they typically act as a ballast in a falling market
Please let us know if you have any questions. If you are not currently receiving our quarterly shareholder letters by email and would like to, please email contact@osterweis.com or call (800) 700-3316.
Sincerely,
 |  | |
| John Osterweis | Carl Kaufman | |
| Chairman & Co-CIO – | Co-CEO, Managing Director of | |
| Core Equity | Fixed Income & | |
| CIO – Strategic Income |
____________________
This commentary contains the current opinions of the author as of the date above, which are subject to change at any time. This commentary has been distributed for informational purposes only and is not a recommendation or offer of any particular security, strategy or investment product. Information contained herein has been obtained from sources believed to be reliable, but is not guaranteed.
2
Osterweis Fund | Portfolio Managers’ Review
Performance Summary
For the period of April 1, 2022 to March 31, 2023, the Osterweis Fund (the Fund) generated a total return of -10.12% versus -7.73% for the S&P 500 Index. (Please see standardized performance in the table following this review.)
Market Review
The past twelve months have been a volatile stretch in the equity markets, featuring multiple shifts in investor sentiment. Performance was stronger in the second half of the period than the first, but there were plenty of ups and downs along the way. The first fiscal quarter was particularly bearish, as concerns about inflation, Fed tightening, and a potential recession triggered a sharp selloff. Markets staged a brief recovery in the second fiscal quarter following better than expected earnings, but elevated CPI data and hawkish Fed comments ultimately caused the selloff to resume. The third fiscal quarter was the most bullish period, as inflation data improved and investors became optimistic the Fed would pivot to a more dovish stance. The rally continued into the final fiscal quarter, but unexpected issues in the banking system caused another selloff that lasted until the Fed’s March meeting, when the central bank hinted that the current hiking cycle may be nearly over.
Portfolio Review
For the twelve months ending March 31, 2023, the Fund trailed the S&P 500, which delivered negative returns during that stretch. Broadly, our underperformance was driven by a lack of defensive exposure early in the bear market. We have since adjusted and become more defensive in our positioning, as discussed below.
Security selection detracted from our relative performance during the period, as our picks in Health Care, Industrials, and Communication Services each materially lagged their counterparts in the index. In addition, our Consumer Staples, Energy, and Information Technology holdings each modestly lagged their corresponding benchmark sectors. On the plus side, our holdings in Real Estate and Materials materially outperformed, but not enough to close the gap.
Our sector weighting was additive to our relative performance during the period. We were materially overweight Industrials, which outperformed the index, and we were underweight Financials, which underperformed the index. On the downside, we were underweight Consumer Staples, which outperformed the benchmark.
Overall, we modestly decreased our cash position during the period, which helped our relative performance, though we did temporarily increase it during the first half selloff and then re-deploy it in the third and fourth fiscal quarters.
Outlook & Portfolio Positioning
Although the market finished the fiscal year on an upward trajectory, we have increased our exposure to defensive stocks, as we believe the Fed’s tightening program still has the potential to trigger a “hard landing.” Defensive companies are generally less impacted by a slowing economy, as they tend to have stable customer bases and more predictable revenues, so they typically act as a ballast in a falling market. In addition, we believe our defensive stocks are well-suited to the current interest rate environment, which is materially higher than it has been for most of the past decade.
We have also increased our investment in high-quality growth companies, which possess a combination of the following attributes: attractive returns on capital, steadily increasing revenues, and strong management teams. Our goal is to identify fundamentally sound companies that we expect to grow over a multi-year horizon. We are particularly focused on firms that benefit from long-term, structural changes in the economy, also known as secular growth trends, as they create naturally expanding markets. Moreover, these types of companies can often grow during a slowdown, as some secular trends are independent of the economic environment.
____________________
Mutual fund investing involves risk. Principal loss is possible.
The Osterweis Fund may invest in medium and smaller sized companies, which involve additional risks such as limited liquidity and greater volatility. The Fund may invest in foreign and emerging market securities, which involve greater volatility and political, economic and currency risks and differences in accounting methods. These risks may increase for emerging markets. The Fund may invest in Master Limited Partnerships, which involve risk related to energy prices, demand and changes in tax code. The Fund may invest in debt securities that are un-rated or rated below investment grade. Lower-rated securities may present an increased possibility of default, price volatility or illiquidity compared to higher-rated securities. Investments in debt securities typically decrease in value when interest rates rise. This risk is usually greater for longer-term debt securities.
3
Osterweis Fund | Fund Overview
| Average Annual Total Returns | ||||||
| Periods Ended March 31, 2023 | ||||||
| Since Inception | ||||||
| 1 Yr. | 3 Yr. | 5 Yr. | 10 Yr. | 15 Yr. | (October 1, 1993) | |
| Osterweis Fund | -10.12% | 13.32% | 9.20% | 7.66% | 7.52% | 9.90% |
| S&P 500 Index | -7.73 | 18.60 | 11.19 | 12.24 | 10.06 | 9.80 |
Gross/Net Expense Ratio as of 3/31/2022: 0.96%/0.95% 1,2
1 | As of most recent Prospectus dated June 30, 2022. Please see the Fund’s Financial Highlights in this report for the most recent expense ratio. |
2 | The Adviser has contractually agreed to waive certain fees through June 30, 2023. The net expense ratio is applicable to investors. |
The performance data quoted above represents past performance. Past performance does not guarantee future results. The investment return and principal value of an investment will fluctuate so that an investor’s shares, when redeemed, may be worth more or less than their original cost. Current performance of the Fund may be lower or higher than the performance quoted. Performance data current to the most recent month-end may be obtained by calling (866) 236-0050.
Growth of $10K (Inception to 3/31/2023) (Unaudited)

This chart illustrates the performance of a hypothetical $10,000 investment made on October 1, 1993 and is not intended to imply any future performance. The returns shown do not reflect the deduction of taxes that a shareholder would pay on Fund distributions or the redemption of Fund shares. The returns reflect fee waivers in effect. In the absence of such waivers, total return would be reduced (See Note 3). The chart assumes reinvestment of capital gains, dividends and return of capital, if applicable, for the Fund and dividends for an index.
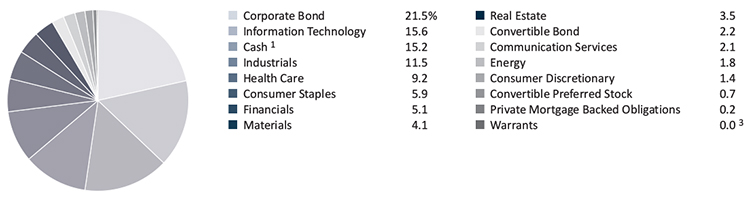
Sector Allocation (% of Net Assets) (Unaudited)

1 | Cash, cash equivalents and other assets less liabilities. |
4
Osterweis Fund | Schedule of Investments at March 31, 2023
| Shares | Value | ||||||
| Common Stocks: 92.9% | |||||||
| Aerospace & Defense: 5.8% | |||||||
| 23,395 | Airbus SE – ADR | $ | 783,265 | ||||
| 13,725 | L3Harris Technologies, Inc. | 2,693,394 | |||||
| 124,300 | Safran SA – ADR | 4,601,586 | |||||
| 8,078,245 | |||||||
| Broadline Retail: 2.7% | |||||||
| 36,000 | Amazon.com, Inc. 1 | 3,718,440 | |||||
| Chemicals: 5.3% | |||||||
| 11,250 | Air Products & Chemicals, Inc. | 3,231,112 | |||||
| 30,285 | International Flavors & | ||||||
| Fragrances, Inc. | 2,785,009 | ||||||
| 3,875 | Linde PLC | 1,377,330 | |||||
| 7,393,451 | |||||||
| Commercial Services & Supplies: 3.4% | |||||||
| 34,465 | Waste Connections, Inc. | 4,793,047 | |||||
| Consumer Staples Distribution & Retail: 8.3% | |||||||
| 20,120 | Dollar General Corp. | 4,234,455 | |||||
| 42,970 | Sysco Corp. | 3,318,573 | |||||
| 24,705 | Target Corp. | 4,091,889 | |||||
| 11,644,917 | |||||||
| Electrical Equipment: 2.6% | |||||||
| 24,685 | AMETEK, Inc. | 3,587,471 | |||||
| Financial Services: 3.5% | |||||||
| 21,510 | Visa, Inc. – Class A | 4,849,645 | |||||
| Ground Transportation: 4.8% | |||||||
| 11,778 | Old Dominion Freight Line, Inc. | 4,014,413 | |||||
| 13,530 | Union Pacific Corp. | 2,723,048 | |||||
| 6,737,461 | |||||||
| Health Care Equipment & Supplies: 7.1% | |||||||
| 14,390 | Becton Dickinson & Co. | 3,562,100 | |||||
| 90,495 | Boston Scientific Corp. 1 | 4,527,465 | |||||
| 7,455 | Teleflex, Inc. | 1,888,426 | |||||
| 9,977,991 | |||||||
| Health Care Providers & Services: 1.8% | |||||||
| 33,705 | CVS Health Corp. | 2,504,618 | |||||
| Industrial REITS: 3.0% | |||||||
| 25,025 | EastGroup Properties, Inc. | 4,137,133 | |||||
| Insurance: 5.1% | |||||||
| 47,575 | Brown & Brown, Inc. | 2,731,757 | |||||
| 30,805 | The Progressive Corp. | 4,406,963 | |||||
| 7,138,720 | |||||||
| Interactive Media & Services: 4.4% | |||||||
| 58,645 | Alphabet, Inc. – Class C 1 | 6,099,080 | |||||
| IT Services: 1.6% | |||||||
| 7,905 | Accenture PLC – Class A | 2,259,328 | |||||
| Life Sciences Tools & Services: 4.8% | |||||||
| 136,180 | Avantor, Inc. 1 | 2,878,845 | |||||
| 15,165 | Danaher Corp. | 3,822,187 | |||||
| 6,701,032 | |||||||
| Pharmaceuticals: 1.8% | |||||||
| 16,360 | Johnson & Johnson | 2,535,800 | |||||
| Semiconductors & Semiconductor Equipment: 8.7% | |||||||
| 41,566 | Advanced Micro Devices, Inc. 1 | 4,073,884 | |||||
| 17,850 | Analog Devices, Inc. | 3,520,377 | |||||
| 24,314 | Applied Materials, Inc. | 2,986,489 | |||||
| 26,310 | Micron Technology, Inc. | 1,587,545 | |||||
| 12,168,295 | |||||||
| Software: 14.1% | |||||||
| 11,116 | Adobe, Inc. 1 | 4,283,773 | |||||
| 37,795 | Microsoft Corp. | 10,896,299 | |||||
| 25,550 | Oracle Corp. | 2,374,106 | |||||
| 5,601 | Synopsys, Inc. 1 | 2,163,386 | |||||
| 19,717,564 | |||||||
| Specialized REITS: 1.8% | |||||||
| 25,635 | Lamar Advertising Co. – Class A | 2,560,680 | |||||
| Specialty Retail: 2.3% | |||||||
| 29,520 | Ross Stores, Inc. | 3,132,958 | |||||
| Total Common Stocks | |||||||
| (Cost $87,777,968) | 129,735,876 | ||||||
| Short-Term Investments: 7.0% | |||||||
| Money Market Funds: 4.9% | |||||||
| 6,861,929 | Federated Hermes U.S. Treasury | ||||||
Cash Reserves – Class I , 4.370% 2 | 6,861,929 | ||||||
| Total Money Market Funds | |||||||
| (Cost $6,861,929) | 6,861,929 | ||||||
The accompanying Notes to Financial Statements are an integral part of these financial statements.
5
Osterweis Fund | Schedule of Investments at March 31, 2023 (Continued)
| Principal | |||||||
| Amount | Value | ||||||
| Commercial Paper: 2.1% | |||||||
| Automobiles: 0.7% | |||||||
| General Motors Financial Co., Inc. | |||||||
| $ | 1,000,000 | 5.983%, 04/19/2023 3 | $ | 997,053 | |||
| Diversified REITS: 0.7% | |||||||
| Crown Castle International Corp. | |||||||
| 1,000,000 | 5.251%, 04/04/2023 3 | 999,397 | |||||
| Software: 0.7% | |||||||
| Oracle Corp. | |||||||
| 1,000,000 | 5.475%, 04/19/2023 3 | 997,492 | |||||
| Total Commercial Paper | |||||||
| (Cost $2,993,953) | 2,993,942 | ||||||
| Total Short-Term Investments | |||||||
| (Cost $9,855,882) | 9,855,871 | ||||||
| Total Investments in Securities: 99.9% | |||||||
| (Cost $97,633,850) | 139,591,747 | ||||||
| Other Assets in Excess of Liabilities: 0.1% | 133,974 | ||||||
| Total Net Assets: 100.0% | $ | 139,725,721 | |||||
ADR – American Depositary Receipt
1 | Non-income producing security. |
2 | Annualized seven-day effective yield as of March 31, 2023. |
3 | Rate represents the yield to maturity from purchase price. |
The Global Industry Classifications Standard (GICS®) sector and industry classifications was developed by and is the exclusive property of MSCI, Inc. and Standard & Poor’s (“S&P”). GICS® is a service mark of MSCI, Inc. and S&P and has been licensed for use by the Osterweis Capital Management.
The accompanying Notes to Financial Statements are an integral part of these financial statements.
6
Strategic Income Fund | Portfolio Managers’ Review
Performance Summary
For the twelve-month period ending March 31, 2023, the Osterweis Strategic Income Fund (the Fund) generated a total return of -1.49%, outperforming the Bloomberg U.S. Aggregate Bond Index (the Agg), which returned -4.78% over the same period. (Please see standardized performance in the table following this review.) The Fund also outperformed the Bloomberg U.S. Universal Bond Index (the Univ), which returned -4.61% over the same period1.
Market Review
The past year was a difficult stretch in the fixed income markets. The first two fiscal quarters were particularly bearish, as the Fed’s aggressive anti-inflation tightening program put steady downward pressure on bonds. Sentiment improved in the third fiscal quarter, as inflation data softened and investors began to anticipate a Fed pivot. The rally continued during the fourth fiscal quarter, despite substantial turmoil in the banking sector, but the gains from the second half of the year were swamped by the sharp declines of the first half.
Portfolio Review
For the twelve months ending March 31, 2023, the Fund outperformed the Univ, driven by a combination of beneficial duration management and issue selection. Sector allocation detracted somewhat from the Fund’s relative returns.
Duration management was the largest contributor to the Fund’s relative performance. Our outsized allocation to shorter-dated bonds and cash worked well this period, as interest rates rose throughout most of the fiscal year. Our lower duration profile insulated us from the losses that impacted the Univ.
Issue selection also helped our relative performance during the period. Almost all the value added came from our high yield bonds, which materially outperformed their counterparts in the Univ despite posting slightly negative absolute returns.
Sector allocation hurt the Fund’s relative results but not by much. Our overweight to equity-sensitive convertibles and high yield bonds were the primary reasons.
Outlook & Portfolio Positioning
The combination of higher rates and lingering issues in the banking system are creating a complex investment environment. At the same time, economic data has been inconsistent for the past several months, so it is difficult to gauge how significantly those headwinds are impacting the economy. Until a clearer picture emerges, we think it makes sense to stay defensive and remain vigilant. We continue to maintain a shorter duration profile, including both cash and commercial paper, as the inverted yield curve allows us to get paid without locking into longer maturities. Of course, we are always on the hunt for long-term bargains, where we can layer in higher yields for longer periods.
____________________
Mutual fund investing involves risk. Principal loss is possible.
The Osterweis Strategic Income Fund may invest in debt securities that are un-rated or rated below investment grade. Lower-rated securities may present an increased possibility of default, price volatility or illiquidity compared to higher-rated securities. The Fund may invest in foreign and emerging market securities, which involve greater volatility and political, economic and currency risks and differences in accounting methods. Investments in debt securities typically decrease in value when interest rates rise. This risk is usually greater for longer-term debt securities. Small- and mid-capitalization companies tend to have limited liquidity and greater price volatility than large-capitalization companies. Higher turnover rates may result in increased transaction costs, which could impact performance. From time to time, the Fund may have concentrated positions in one or more sectors subjecting the Fund to sector emphasis risk. The Fund may invest in municipal securities which are subject to the risk of default.
1 | The Bloomberg U.S. Universal Bond Index is used in the above fixed income analysis as its investment universe more closely resembles that of the Fund’s fixed income holdings. |
7
Strategic Income Fund | Fund Overview
| Average Annual Total Returns | ||||||
| Periods Ended March 31, 2023 | ||||||
| Since Inception | ||||||
| 1 Yr. | 3 Yr. | 5 Yr. | 10 Yr. | 15 Yr. | (August 30, 2002) | |
| Osterweis Strategic Income Fund | -1.49% | 6.10% | 2.96% | 3.56% | 5.16% | 5.88% |
| Bloomberg U.S. Aggregate Bond Index | -4.78 | -2.77 | 0.91 | 1.36 | 2.71 | 3.31 |
Gross Expense Ratio as of 3/31/2022: 0.84% 1
1 | As of most recent Prospectus dated June 30, 2022. Please see the Fund’s Financial Highlights in this report for the most recent expense ratio. |
The performance data quoted above represents past performance. Past performance does not guarantee future results. The investment return and principal value of an investment will fluctuate so that an investor’s shares, when redeemed, may be worth more or less than their original cost. Current performance of the Fund may be lower or higher than the performance quoted. Performance data current to the most recent month-end may be obtained by calling (866) 236-0050.
Growth of $10K (Inception to 3/31/2023) (Unaudited)

This chart illustrates the performance of a hypothetical $10,000 investment made on August 30, 2002 and is not intended to imply any future performance. The returns shown do not reflect the deduction of taxes that a shareholder would pay on Fund distributions or the redemption of Fund shares. The chart assumes reinvestment of capital gains, dividends and return of capital, if applicable, for the Fund and dividends for an index.
Asset/Sector Allocation (% of Net Assets) (Unaudited) 2

1 | Cash, cash equivalents and other assets less liabilities. |
2 | Equities are classified by GICS sector. Bonds are classified by bond type. |
3 | Does not round to 0.1% or (0.1)%, as applicable. |
8
Strategic Income Fund | Schedule of Investments at March 31, 2023
| Shares | Value | ||||||
| Common Stocks: 3.4% | |||||||
| Consumer Staples Distribution & Retail: 2.3% | |||||||
| 4,649,942 | Southeastern Grocers, Inc. 1,2 | $ | 105,786,181 | ||||
| 61,582,000 | Tops Holding, Litigation | ||||||
Trust Proceeds 1,2,7 | 46,248 | ||||||
| 105,832,429 | |||||||
| Metals & Mining: 1.1% | |||||||
| 800 | Real Alloy Holding, Inc. 1,2 | 51,972,050 | |||||
| Total Common Stocks | |||||||
| (Cost $105,133,214) | 157,804,479 | ||||||
| Convertible Preferred Stocks: 1.1% | |||||||
| Ground Transportation: 1.0% | |||||||
| 490,000 | Daseke, Inc., 7.625% 1,9 | 46,512,760 | |||||
| Media: 0.1% | |||||||
| 196,000 | Paramount Global, 5.750% | 5,868,240 | |||||
| Total Convertible Preferred Stocks | |||||||
| (Cost $60,662,000) | 52,381,000 | ||||||
| Principal | |||||||
| Amount | |||||||
| Bonds: 80.0% | |||||||
| Corporate Bonds: 74.1% | |||||||
| Automobile Components: 5.5% | |||||||
| Adient Global Holdings Ltd. | |||||||
| $ | 12,650,000 | 7.000%, 04/15/2028 | 13,016,976 | ||||
| American Axle & Manufacturing, Inc. | |||||||
| 17,428,000 | 6.250%, 03/15/2026 | 16,752,378 | |||||
| 9,260,000 | 6.500%, 04/01/2027 | 8,532,442 | |||||
| 40,000,000 | 6.875%, 07/01/2028 | 36,202,800 | |||||
| The Goodyear Tire & Rubber Co. | |||||||
| 78,511,000 | 9.500%, 05/31/2025 | 80,762,023 | |||||
| 14,500,000 | 5.000%, 07/15/2029 | 12,972,860 | |||||
| Patrick Industries, Inc. | |||||||
| 51,339,000 | 7.500%, 10/15/2027 | 50,905,442 | |||||
| Real Hero Merger Sub 2, Inc. | |||||||
| 54,702,000 | 6.250%, 02/01/2029 | 40,496,909 | |||||
| 259,641,830 | |||||||
| Automobiles: 1.0% | |||||||
| Ford Motor Co. | |||||||
| 9,000,000 | 9.625%, 04/22/2030 | 10,460,457 | |||||
| Ford Motor Credit Co LLC | |||||||
| 19,450,000 | 5.584%, 03/18/2024 | 19,352,361 | |||||
| Ford Motor Credit Co. LLC | |||||||
| 10,000,000 | 4.687%, 06/09/2025 | 9,643,034 | |||||
| Thor Industries, Inc. | |||||||
| 10,000,000 | 4.000%, 10/15/2029 | 8,279,600 | |||||
| 47,735,452 | |||||||
| Beverages: 0.4% | |||||||
| Primo Water Holdings, Inc. | |||||||
| 19,700,000 | 4.375%, 04/30/2029 | 17,205,559 | |||||
| Building Products: 1.5% | |||||||
| Griffon Corp. | |||||||
| 60,288,000 | 5.750%, 03/01/2028 | 55,978,915 | |||||
| PGT Innovations, Inc. | |||||||
| 17,000,000 | 4.375%, 10/01/2029 | 15,406,250 | |||||
| 71,385,165 | |||||||
| Capital Markets: 1.0% | |||||||
| Oppenheimer Holdings, Inc. | |||||||
| 50,650,000 | 5.500%, 10/01/2025 | 48,602,474 | |||||
| Chemicals: 1.5% | |||||||
| Consolidated Energy Finance SA | |||||||
| 39,500,000 | 5.625%, 10/15/2028 | 34,020,560 | |||||
| INEOS Quattro Finance 2 PLC | |||||||
| 37,474,000 | 3.375%, 01/15/2026 | 34,091,288 | |||||
| 68,111,848 | |||||||
| Commercial Services & Supplies: 1.7% | |||||||
| GFL Environmental, Inc. | |||||||
| 11,100,000 | 5.125%, 12/15/2026 | 10,864,125 | |||||
| 19,750,000 | 4.750%, 06/15/2029 | 18,466,250 | |||||
| KAR Auction Services, Inc. | |||||||
| 3,018,000 | 5.125%, 06/01/2025 | 2,984,048 | |||||
| Pitney Bowes, Inc. | |||||||
| 64,620,000 | 7.250%, 03/15/2029 | 48,346,353 | |||||
| 80,660,776 | |||||||
| Computers & Peripherals: 2.4% | |||||||
| CPI Acquisition, Inc. | |||||||
| 48,518,000 | 8.625%, 03/15/2026 | 48,076,486 | |||||
| Xerox Holdings Corp. | |||||||
| 70,000,000 | 5.000%, 08/15/2025 | 65,975,000 | |||||
| 114,051,486 | |||||||
| Construction & Engineering: 4.0% | |||||||
| APi Group DE, Inc. | |||||||
| 39,750,000 | 4.125%, 07/15/2029 | 34,178,664 | |||||
| Global Infrastructure Solutions, Inc. | |||||||
| 51,157,000 | 5.625%, 06/01/2029 | 42,260,286 | |||||
| Great Lakes Dredge & Dock Corp. | |||||||
| 25,832,000 | 5.250%, 06/01/2029 | 19,557,407 | |||||
The accompanying Notes to Financial Statements are an integral part of these financial statements.
9
Strategic Income Fund | Schedule of Investments at March 31, 2023 (Continued)
| Principal | |||||||
| Amount | Value | ||||||
| Construction & Engineering: 4.0% (Continued) | |||||||
| New Enterprise Stone & | |||||||
| Lime Co., Inc. | |||||||
| $ | 46,500,000 | 5.250%, 07/15/2028 | $ | 41,162,688 | |||
| Tutor Perini Corp. | |||||||
| 72,415,000 | 6.875%, 05/01/2025 | 51,142,007 | |||||
| 188,301,052 | |||||||
| Construction Materials: 0.1% | |||||||
| Cemex SAB de CV | |||||||
| 4,750,000 | 7.375%, 06/05/2027 | 4,919,338 | |||||
| Consumer Finance: 3.6% | |||||||
| Bread Financial Holdings, Inc. | |||||||
| 15,832,000 | 4.750%, 12/15/2024 | 14,200,164 | |||||
| 49,250,000 | 7.000%, 01/15/2026 | 43,485,134 | |||||
| Enova International, Inc. | |||||||
| 14,370,000 | 8.500%, 09/01/2024 | 14,156,449 | |||||
| 58,642,000 | 8.500%, 09/15/2025 | 55,654,483 | |||||
| FirstCash, Inc. | |||||||
| 15,000,000 | 4.625%, 09/01/2028 | 13,335,611 | |||||
| 19,500,000 | 5.625%, 01/01/2030 | 18,015,465 | |||||
| OneMain Finance Corp. | |||||||
| 9,500,000 | 8.250%, 10/01/2023 | 9,538,475 | |||||
| 168,385,781 | |||||||
| Consumer Staples Distribution & Retail: 5.5% | |||||||
| C&S Group Enterprises LLC | |||||||
| 45,765,000 | 5.000%, 12/15/2028 | 35,308,969 | |||||
| KeHE Distributors LLC / | |||||||
| KeHE Finance Corp. | |||||||
| 62,262,000 | 8.625%, 10/15/2026 | 62,229,001 | |||||
| Performance Food Group, Inc. | |||||||
| 19,500,000 | 4.250%, 08/01/2029 | 17,665,733 | |||||
| SEG Holding LLC / SEG Finance Corp. | |||||||
| 29,087,000 | 5.625%, 10/15/2028 | 27,646,966 | |||||
| United Natural Foods, Inc. | |||||||
| 32,324,000 | 6.750%, 10/15/2028 | 30,071,340 | |||||
| US Foods, Inc. | |||||||
| 61,228,000 | 6.250%, 04/15/2025 | 61,842,729 | |||||
| 23,384,000 | 4.750%, 02/15/2029 | 21,629,382 | |||||
| 256,394,120 | |||||||
| Containers & Packaging: 0.2% | |||||||
| Owens-Brockway Glass | |||||||
| Container, Inc. | |||||||
| 10,083,000 | 5.875%, 08/15/2023 | 10,077,256 | |||||
| Discontinued: 2.2% | |||||||
| Nationstar Mortgage Holdings, Inc. | |||||||
| 13,250,000 | 6.000%, 01/15/2027 | 12,036,962 | |||||
| 24,680,000 | 5.500%, 08/15/2028 | 21,188,274 | |||||
| 9,500,000 | 5.125%, 12/15/2030 | 7,309,965 | |||||
| 18,000,000 | 5.750%, 11/15/2031 | 13,965,009 | |||||
| United Wholesale Mortgage LLC | |||||||
| 24,680,000 | 5.500%, 11/15/2025 | 23,386,275 | |||||
| 7,000,000 | 5.750%, 06/15/2027 | 6,233,533 | |||||
| 20,820,000 | 5.500%, 04/15/2029 | 17,413,119 | |||||
| 101,533,137 | |||||||
| Distributors: 0.5% | |||||||
| American Builders & Contractors | |||||||
| Supply Co., Inc. | |||||||
| 30,116,000 | 3.875%, 11/15/2029 | 25,754,902 | |||||
| Diversified Consumer Services: 0.3% | |||||||
| Carriage Services, Inc. | |||||||
| 19,500,000 | 4.250%, 05/15/2029 | 16,083,015 | |||||
| Diversified Telecommunication Services: 1.2% | |||||||
| Level 3 Financing, Inc. | |||||||
| 44,668,000 | 4.625%, 09/15/2027 | 26,896,836 | |||||
| 29,755,000 | N/A%, 05/15/2030 4 | 28,601,994 | |||||
| 55,498,830 | |||||||
| Financial Services: 2.3% | |||||||
| Aviation Capital Group LLC | |||||||
| 5,500,000 | 5.500%, 12/15/2024 | 5,431,636 | |||||
| Burford Capital Global Finance LLC | |||||||
| 25,489,000 | 6.250%, 04/15/2028 | 22,207,164 | |||||
| MoneyGram International, Inc. | |||||||
| 29,490,000 | 5.375%, 08/01/2026 | 29,591,151 | |||||
| PennyMac Financial Services, Inc. | |||||||
| 56,030,000 | 5.375%, 10/15/2025 | 52,390,851 | |||||
| 109,620,802 | |||||||
| Food Products: 0.5% | |||||||
| Simmons Foods, Inc./Simmons | |||||||
| Prepared Foods, Inc./Simmons | |||||||
| Pet Food, Inc./Simmons Feed | |||||||
| 26,688,000 | 4.625%, 03/01/2029 | 21,721,630 | |||||
| Ground Transportation: 0.5% | |||||||
| XPO Escrow Sub LLC | |||||||
| 24,500,000 | 7.500%, 11/15/2027 | 25,507,073 | |||||
| Health Care Providers & Services: 0.8% | |||||||
| AMN Healthcare, Inc. | |||||||
| 8,000,000 | 4.625%, 10/01/2027 | 7,427,383 | |||||
| Owens & Minor, Inc. | |||||||
| 36,210,000 | 4.500%, 03/31/2029 | 28,290,242 | |||||
| 35,717,625 | |||||||
| Hotels, Restaurants & Leisure: 5.2% | |||||||
| Aramark Services, Inc. | |||||||
| 48,411,000 | 6.375%, 05/01/2025 | 48,810,875 | |||||
The accompanying Notes to Financial Statements are an integral part of these financial statements.
10
Strategic Income Fund | Schedule of Investments at March 31, 2023 (Continued)
| Principal | |||||||
| Amount | Value | ||||||
| Hotels, Restaurants & Leisure: 5.2% (Continued) | |||||||
| Carnival Corp. | |||||||
| $ | 23,616,000 | 7.625%, 03/01/2026 | $ | 21,585,496 | |||
| 9,500,000 | 5.750%, 03/01/2027 | 7,824,057 | |||||
| 19,750,000 | 6.000%, 05/01/2029 | 15,746,083 | |||||
| Carrols Restaurant Group, Inc. | |||||||
| 57,625,000 | 5.875%, 07/01/2029 | 46,456,410 | |||||
| GPS Hospitality Holding Co. LLC / | |||||||
| GPS Finco, Inc. | |||||||
| 44,500,000 | 7.000%, 08/15/2028 | 27,412,000 | |||||
| NCL Corp. Ltd. | |||||||
| 15,510,000 | 3.625%, 12/15/2024 | 14,441,594 | |||||
| 12,000,000 | 5.875%, 03/15/2026 | 10,212,840 | |||||
| Six Flags Entertainment Corp. | |||||||
| 48,676,000 | 4.875%, 07/31/2024 | 47,993,235 | |||||
| Six Flags Theme Parks, Inc. | |||||||
| 5,229,000 | 7.000%, 07/01/2025 | 5,287,774 | |||||
| 245,770,364 | |||||||
| Household Durables: 2.8% | |||||||
| Empire Communities Corp. | |||||||
| 63,999,000 | 7.000%, 12/15/2025 | 56,309,840 | |||||
| Installed Building Products, Inc. | |||||||
| 6,750,000 | 5.750%, 02/01/2028 | 6,224,321 | |||||
| Mattamy Group Corp. | |||||||
| 24,500,000 | 5.250%, 12/15/2027 | 23,095,047 | |||||
| The New Home Co., Inc. | |||||||
| 47,308,000 | 7.250%, 10/15/2025 | 43,656,932 | |||||
| Taylor Morrison Communities, Inc. | |||||||
| 3,500,000 | 5.750%, 01/15/2028 | 3,446,293 | |||||
| 132,732,433 | |||||||
| Industrial Conglomerates: 1.8% | |||||||
| Icahn Enterprises L.P. / Icahn | |||||||
| Enterprises Finance Corp. | |||||||
| 17,769,000 | 4.750%, 09/15/2024 | 17,350,711 | |||||
| 18,133,000 | 6.375%, 12/15/2025 | 17,822,553 | |||||
| 49,872,000 | 6.250%, 05/15/2026 | 49,123,920 | |||||
| 84,297,184 | |||||||
| IT Services: 2.2% | |||||||
| Conduent Business Services LLC / | |||||||
| Conduent State & Local | |||||||
| Solutions, Inc. | |||||||
| 74,500,000 | 6.000%, 11/01/2029 | 58,847,060 | |||||
| Unisys Corp. | |||||||
| 66,074,000 | 6.875%, 11/01/2027 | 42,223,598 | |||||
| 101,070,658 | |||||||
| Machinery: 2.2% | |||||||
| Chart Industries, Inc. | |||||||
| 5,000,000 | 7.500%, 01/01/2030 | 5,172,350 | |||||
| The Manitowoc Co., Inc. | |||||||
| 58,224,000 | 9.000%, 04/01/2026 | 58,373,345 | |||||
| Wabash National Corp. | |||||||
| 46,750,000 | 4.500%, 10/15/2028 | 40,589,195 | |||||
| 104,134,890 | |||||||
| Media: 1.1% | |||||||
| DIRECTV Holdings LLC / DIRECTV | |||||||
| Financing Co., Inc. | |||||||
| 55,300,000 | 5.875%, 08/15/2027 | 49,847,835 | |||||
| Metals & Mining: 3.5% | |||||||
| Century Aluminum Co. | |||||||
| 25,165,000 | 7.500%, 04/01/2028 | 23,963,874 | |||||
| Coeur Mining, Inc. | |||||||
| 66,150,000 | 5.125%, 02/15/2029 | 56,147,128 | |||||
| Hecla Mining Co. | |||||||
| 61,347,000 | 7.250%, 02/15/2028 | 62,034,393 | |||||
| SunCoke Energy, Inc. | |||||||
| 26,325,000 | 4.875%, 06/30/2029 | 22,786,507 | |||||
| 164,931,902 | |||||||
| Mortgage Real Estate Investment Trusts – REITS: 2.6% | |||||||
| HAT Holdings I LLC / | |||||||
| HAT Holdings II LLC | |||||||
| 26,304,000 | 6.000%, 04/15/2025 | 25,283,286 | |||||
| 31,200,000 | 3.375%, 06/15/2026 | 27,102,816 | |||||
| Oxford Finance LLC / | |||||||
| Oxford Finance Co-Issuer II, Inc. | |||||||
| 17,500,000 | 6.375%, 02/01/2027 | 16,385,314 | |||||
| Starwood Property Trust, Inc. | |||||||
| 55,031,000 | 5.500%, 11/01/2023 | 55,194,717 | |||||
| 123,966,133 | |||||||
| Oil, Gas & Consumable Fuels: 2.9% | |||||||
| Calumet Specialty Products | |||||||
| Partners L.P. / Calumet | |||||||
| Finance Corp. | |||||||
| 11,792,000 | 9.250%, 07/15/2024 | 11,861,868 | |||||
| 15,900,000 | 11.000%, 04/15/2025 | 16,444,153 | |||||
| Genesis Energy L.P. / Genesis | |||||||
| Energy Finance Corp. | |||||||
| 51,550,000 | 7.750%, 02/01/2028 | 50,030,084 | |||||
| Genesis Energy LP / Genesis | |||||||
| Energy Finance Corp. | |||||||
| 10,000,000 | 8.875%, 04/15/2030 | 10,175,000 | |||||
| Global Partners L.P. / | |||||||
| GLP Finance Corp. | |||||||
| 30,750,000 | 7.000%, 08/01/2027 | 29,544,153 | |||||
The accompanying Notes to Financial Statements are an integral part of these financial statements.
11
Strategic Income Fund | Schedule of Investments at March 31, 2023 (Continued)
| Principal | |||||||
| Amount | Value | ||||||
| Oil, Gas & Consumable Fuels: 2.9% (Continued) | |||||||
| NGL Energy Operating LLC / | |||||||
| NGL Energy Finance Corp. | |||||||
| $ | 17,390,000 | 7.500%, 02/01/2026 | $ | 16,797,791 | |||
| 134,853,049 | |||||||
| Passenger Airlines: 3.5% | |||||||
| Allegiant Travel Co. | |||||||
| 33,700,000 | 7.250%, 08/15/2027 | 33,583,398 | |||||
| American Airlines, Inc. | |||||||
| 83,624,000 | 11.750%, 07/15/2025 | 91,583,918 | |||||
| Mileage Plus Holdings LLC / | |||||||
| Mileage Plus Intellectual | |||||||
| Property Assets Ltd. | |||||||
| 17,000,000 | 6.500%, 06/20/2027 | 16,962,005 | |||||
| United Airlines Holdings, Inc. | |||||||
| 20,726,000 | 4.875%, 01/15/2025 | 20,191,580 | |||||
| 162,320,901 | |||||||
| Professional Services: 0.4% | |||||||
| KBR, Inc. | |||||||
| 20,000,000 | 4.750%, 09/30/2028 | 17,896,019 | |||||
| Software: 1.0% | |||||||
| NCR Corp. | |||||||
| 34,425,000 | 5.750%, 09/01/2027 | 33,867,143 | |||||
| 5,750,000 | 5.000%, 10/01/2028 | 5,060,000 | |||||
| 10,000,000 | 5.125%, 04/15/2029 | 8,663,111 | |||||
| 47,590,254 | |||||||
| Specialized REITS: 0.4% | |||||||
| Iron Mountain, Inc. | |||||||
| 20,000,000 | 4.500%, 02/15/2031 | 17,206,000 | |||||
| Specialty Retail: 3.0% | |||||||
| Ken Garff Automotive LLC | |||||||
| 54,664,000 | 4.875%, 09/15/2028 | 46,541,323 | |||||
| Penske Automotive Group, Inc. | |||||||
| 17,234,000 | 3.500%, 09/01/2025 | 16,224,524 | |||||
| Sonic Automotive, Inc. | |||||||
| 34,500,000 | 4.625%, 11/15/2029 | 28,954,739 | |||||
| Upbound Group, Inc. | |||||||
| 57,600,000 | 6.375%, 02/15/2029 | 48,437,100 | |||||
| 140,157,686 | |||||||
| Textiles, Apparel & Luxury Goods: 0.1% | |||||||
| The William Carter Co. | |||||||
| 3,000,000 | 5.625%, 03/15/2027 | 2,920,700 | |||||
| Trading Companies & Distributors: 4.2% | |||||||
| Avation Capital SA | |||||||
| 79,361,974 | 8.250% Cash or 9.000% | ||||||
PIK, 10/31/2026 3 | 68,749,943 | ||||||
| Castlelake Aviation Finance DAC | |||||||
| 52,500,000 | 5.000%, 04/15/2027 | 46,607,181 | |||||
| Herc Holdings, Inc. | |||||||
| 32,823,000 | 5.500%, 07/15/2027 | 31,717,685 | |||||
| WESCO Distribution, Inc. | |||||||
| 36,966,000 | 7.125%, 06/15/2025 | 37,612,905 | |||||
| 9,750,000 | 7.250%, 06/15/2028 | 10,020,855 | |||||
| 194,708,569 | |||||||
| Transportation Infrastructure: 0.5% | |||||||
| Signature Aviation US Holdings, Inc. | |||||||
| 25,600,000 | 4.000%, 03/01/2028 | 23,736,330 | |||||
| Total Corporate Bonds | |||||||
| (Cost $3,881,432,206) | 3,475,050,058 | ||||||
| Convertible Bonds: 5.7% | |||||||
| Aerospace & Defense: 0.3% | |||||||
| Parsons Corp. | |||||||
| 12,500,000 | 0.250%, 08/15/2025 | 13,837,500 | |||||
| Automobile Components: 0.2% | |||||||
| Patrick Industries, Inc. | |||||||
| 11,250,000 | 1.750%, 12/01/2028 | 10,215,000 | |||||
| Automobiles: 0.2% | |||||||
| Ford Motor Co. | |||||||
| 7,750,000 | N/A%, 03/15/2026 4 | 7,781,000 | |||||
| Broadline Retail: 0.2% | |||||||
| Etsy, Inc. | |||||||
| 7,750,000 | 0.250%, 06/15/2028 | 6,454,376 | |||||
| Consumer Finance: 0.8% | |||||||
| EZCORP, Inc. | |||||||
| 10,250,000 | 2.375%, 05/01/2025 | 9,366,656 | |||||
| 9,750,000 | 3.750%, 12/15/2029 | 9,624,817 | |||||
| LendingTree, Inc. | |||||||
| 27,517,000 | 0.500%, 07/15/2025 | 20,659,763 | |||||
| 39,651,236 | |||||||
| Health Care Equipment & Supplies: 0.6% | |||||||
| Haemonetics Corp. | |||||||
| 17,750,000 | N/A%, 03/01/2026 4 | 15,149,321 | |||||
| Integra LifeSciences Holdings Corp. | |||||||
| 13,000,000 | 0.500%, 08/15/2025 | 12,708,602 | |||||
| 27,857,923 | |||||||
The accompanying Notes to Financial Statements are an integral part of these financial statements.
12
Strategic Income Fund | Schedule of Investments at March 31, 2023 (Continued)
| Principal | |||||||
| Amount | Value | ||||||
| Hotels, Restaurants & Leisure: 0.2% | |||||||
| NCL Corp. Ltd. | |||||||
| $ | 6,835,000 | 6.000%, 05/15/2024 | $ | 8,353,085 | |||
| 2,500,000 | 1.125%, 02/15/2027 | 1,790,393 | |||||
| 10,143,478 | |||||||
| IT Services: 0.4% | |||||||
| BigBear.ai Holdings, Inc. | |||||||
| 28,350,000 | 6.000%, 12/15/2026 | 19,820,395 | |||||
| Machinery: 0.2% | |||||||
| John Bean Technologies Corp. | |||||||
| 9,450,000 | 0.250%, 05/15/2026 | 8,660,925 | |||||
| Mortgage Real Estate Investment Trusts – REITS: 0.8% | |||||||
| Starwood Property Trust, Inc. | |||||||
| 39,295,000 | 4.375%, 04/01/2023 | 39,486,044 | |||||
| Passenger Airlines: 0.2% | |||||||
| Southwest Airlines Co. | |||||||
| 7,675,000 | 1.250%, 05/01/2025 | 8,747,581 | |||||
| Pharmaceuticals: 0.3% | |||||||
| Jazz Investments I Ltd. | |||||||
| 6,000,000 | 1.500%, 08/15/2024 | 5,822,446 | |||||
| 6,650,000 | 2.000%, 06/15/2026 | 7,398,125 | |||||
| 13,220,571 | |||||||
| Real Estate Management and Development: 0.7% | |||||||
| DigitalBridge Group, Inc. | |||||||
| 34,577,000 | 5.000%, 04/15/2023 | 34,750,021 | |||||
| Software: 0.6% | |||||||
| Envestnet, Inc. | |||||||
| 9,490,000 | 0.750%, 08/15/2025 | 8,606,244 | |||||
| Jamf Holding Corp. | |||||||
| 10,600,000 | 0.125%, 09/01/2026 | 8,776,800 | |||||
| Rapid7, Inc. | |||||||
| 5,000,000 | 0.250%, 03/15/2027 | 4,367,667 | |||||
| Tyler Technologies, Inc. | |||||||
| 6,750,000 | 0.250%, 03/15/2026 | 6,480,000 | |||||
| 28,230,711 | |||||||
| Total Convertible Bonds | |||||||
| (Cost $287,062,275) | 268,856,761 | ||||||
| Private Mortgage Backed Obligations: 0.2% | |||||||
| Financial Services: 0.2% | |||||||
| HAS Capital Income | |||||||
| Opportunity Fund II | |||||||
| 21,807,000 | 8.000%, 12/31/2024 | ||||||
| (Cost $21,807,000 Acquisition | |||||||
| Dates 06/10/2016, | |||||||
09/19/2016) 1,6 | 10,602,149 | ||||||
| Total Private Mortgage Backed Obligations | |||||||
| (Cost $21,807,000) | 10,602,149 | ||||||
| Total Bonds | |||||||
| (Cost $4,190,301,481) | 3,754,508,968 | ||||||
Warrants: 0.0% 8 | |||||||
| Trading Companies & Distributors: 0.0% 8 | |||||||
| 1,601,250 | Aviation PLC, Warrants | ||||||
| (Expiration Date 10/31/2026, | |||||||
Exercise Price 114.5 GBP) 2 | 1,234,557 | ||||||
| Total Warrants | |||||||
| (Cost $–) | 1,234,557 | ||||||
| Short-Term Investments: 14.5% | |||||||
| Commercial Paper: 6.9% | |||||||
| Beverages: 0.4% | |||||||
| Constellation Brands, Inc. | |||||||
| 20,000,000 | 5.172%, 04/03/2023 10 | 19,990,973 | |||||
| Chemicals: 2.2% | |||||||
| FMC Corp. | |||||||
| 50,000,000 | 6.078%, 04/24/2023 10 | 49,815,066 | |||||
| International Flavors | |||||||
| & Fragrances, Inc. | |||||||
| 20,000,000 | 5.418%, 04/14/2023 10 | 19,959,789 | |||||
| 34,000,000 | 0.000%, 05/01/2023 10 | 33,844,828 | |||||
| 103,619,683 | |||||||
| Computers & Peripherals: 1.1% | |||||||
| HP, Inc. | |||||||
| 51,000,000 | 5.059%, 04/24/2023 10 | 50,822,248 | |||||
| Construction & Engineering: 0.6% | |||||||
| Quanta Services, Inc. | |||||||
| 27,000,000 | 5.701%, 04/17/2023 10 | 26,929,492 | |||||
| Financial Services: 0.5% | |||||||
| Global Payments, Inc. | |||||||
| 24,000,000 | 5.929%, 04/26/2023 10 | 23,900,923 | |||||
The accompanying Notes to Financial Statements are an integral part of these financial statements.
13
Strategic Income Fund | Schedule of Investments at March 31, 2023 (Continued)
| Principal | |||||||
| Amount | Value | ||||||
| Hotels, Restaurants & Leisure: 0.5% | |||||||
| Marriott International, Inc. | |||||||
| $ | 25,000,000 | 6.018%, 04/21/2023 10 | $ | 24,922,344 | |||
| Software: 0.5% | |||||||
| Oracle Corp. | |||||||
| 23,000,000 | 5.475%, 04/19/2023 10 | 22,942,305 | |||||
| Specialized REITS: 1.1% | |||||||
| Crown Castle International Corp. | |||||||
| 22,000,000 | 5.251%, 04/04/2023 10 | 21,986,741 | |||||
| 28,000,000 | 5.649%, 04/11/2023 10 | 27,953,227 | |||||
| 49,939,968 | |||||||
| Total Commercial Paper | |||||||
| (Cost $323,085,269) | 323,067,936 | ||||||
| Shares | |||||||
| Money Market Funds: 7.6% | |||||||
| 178,616,411 | Federated Hermes U.S. | ||||||
| Treasury Cash Reserves – | |||||||
Class I, 4.370% 5 | 178,616,412 | ||||||
| 178,616,411 | Morgan Stanley Institutional | ||||||
| Liquidity Funds – Treasury | |||||||
Securities Portfolio, 4.400% 5 | 178,616,411 | ||||||
| Total Money Market Funds | |||||||
| (Cost $357,232,823) | 357,232,823 | ||||||
| Total Short-Term Investments | |||||||
| (Cost $680,318,092) | 680,300,759 | ||||||
| Total Investments in Securities: 99.0% | |||||||
| (Cost $5,036,414,787) | 4,646,229,763 | ||||||
| Other Assets in Excess of Liabilities: 1.0% | 46,906,178 | ||||||
| Total Net Assets: 100.0% | $ | 4,693,135,941 | |||||
GBP – Great Britain Pound
PIK – Payment-in-Kind
USD – United States Dollar
1 | Security is fair valued under the Board of Trustees and is categorized as a Level 3 security. Significant unobservable inputs were used to determine fair value. |
2 | Non-income producing security. |
3 | Variable rate security; rate shown is the rate in effect on March 31, 2023. |
4 | Zero Coupon Security |
5 | Annualized seven-day effective yield as of March 31, 2023. |
6 | Security considered restricted. As of March 31, 2023, the value of the restricted securities was $10,602,149 or 0.2% of net assets. |
7 | Not a readily marketable security. |
8 | Does not round to 0.1% or (0.1)%, as applicable. |
9 | Company is an “affiliated person” of the Fund, as defined in the Investment Company Act of 1940. |
10 | Rate represents the yield to maturity from purchase price. |
The Global Industry Classifications Standard (GICS®) sector and industry classifications was developed by and is the exclusive property of MSCI, Inc. and Standard & Poor’s (“S&P”). GICS® is a service mark of MSCI, Inc. and S&P and has been licensed for use by the Osterweis Capital Management.
The accompanying Notes to Financial Statements are an integral part of these financial statements.
14
Growth & Income Fund | Portfolio Managers’ Review
Performance Summary
The Osterweis Growth & Income Fund (the Fund) generated a total return of -7.33% for the twelve-month period ending March 31, 2023, trailing its blended benchmark, composed of 60% S&P 500 Index (S&P 500) and 40% Bloomberg U.S. Aggregate Bond Index (the Agg), which returned -6.25% over the same period. (Please see standardized performance in the table following this letter.) The Fund’s performance also slightly trailed a blended benchmark composed of 60% S&P 500 and 40% Bloomberg U.S. Universal Bond Index (the Univ), which returned -6.20% over the period.1
Market Review
The past twelve months have been a volatile stretch in the equity and fixed income markets, featuring multiple shifts in investor sentiment. Performance was stronger in the second half of the period than the first, but there were plenty of ups and downs along the way. The first fiscal quarter was particularly bearish, as concerns about inflation, Fed tightening, and a potential recession triggered a sharp selloff. Stocks staged a brief recovery in the second fiscal quarter following better than expected earnings, but elevated CPI data and hawkish Fed comments ultimately caused the selloff to resume. The third fiscal quarter was the most bullish period, as inflation data softened and investors became optimistic the Fed would pivot to a more dovish stance. The rally continued into the final fiscal quarter, but unexpected issues in the banking system caused another selloff that lasted until the Fed’s March meeting, when the central bank hinted that the current hiking cycle may be nearly over.
The principal driver in fixed income was the Fed’s aggressive anti-inflation tightening program, which caused rates to steadily increase during the first two fiscal quarters. This put consistent downward pressure on bond prices. Sentiment began to improve in the third fiscal quarter, similar to the equity market, and the rally continued during the fourth fiscal quarter, despite substantial turmoil in the banking sector. Nonetheless, the sharp declines in the first half of the fiscal year were not offset by the recovery in the second half.
Portfolio Review
During the twelve-month period ending March 31, 2023, on average 63% of the Fund was allocated to equities, 25% to fixed income, and the rest to cash.
Equities
For the fiscal year, our equity positions slightly outperformed the S&P 500 but delivered negative absolute returns. Sector allocation drove our outperformance, while security selection detracted from our relative returns.
Our favorable sector allocation was led by our overweight to Industrials, which substantially outperformed the overall index. Additionally, we were underweight Financials, which lagged the index. On the downside, we were overweight Real Estate, which materially underperformed the overall index. In addition, we were underweight Consumer Staples, which outperformed the index.
Security selection detracted from relative returns largely due to our positions in Health Care, Communication Services, and Industrials, all of which underperformed their counterparts in the benchmark. Our positions in Energy, Financials, and Consumer Staples also each underperformed. Those losses were offset by favorable relative performances in Real Estate, Information Technology, Consumer Discretionary, and Materials.
Fixed Income
During the past fiscal year the fixed income portion of the Fund outperformed the Univ, driven by a combination of duration management and security selection. Sector allocation detracted from our relative performance.
Duration management was the largest contributor to the Fund’s relative performance. Our outsized allocation to shorter-dated bonds worked well this period, as interest rates rose throughout much of the last fiscal year. Our lower duration profile insulated us from the losses that impacted the Univ.
____________________
1 | The Bloomberg U.S. Universal Bond Index is used in the above fixed income analysis as its investment universe more closely resembles that of the Fund’s fixed income holdings. |
15
Growth & Income Fund | Portfolio Managers’ Review
Security selection was the other major contributor to the Fund’s relative performance during the period. All of the value added came from our high yield bonds, which substantially outperformed their counterparts in the Univ despite delivering negative absolute returns. On the downside, our picks in investment grade detracted slightly from our relative returns.
Sector allocation detracted from the Fund’s relative results. In particular, our overweight to equity-sensitive convertibles (the Index has a 0% weight) hurt performance versus the Univ. Our overweight to high yield was also a detractor, albeit small.
Outlook & Portfolio Positioning
Although the equity market finished the fiscal year on an upward trajectory, we have increased our exposure to defensive stocks, as we believe the Fed’s tightening program still has the potential to trigger a “hard landing.” Defensive companies are generally less impacted by a slowing economy, as they tend to have more stable customer bases and more predictable revenues, so they typically act as a ballast in a falling market. We have also increased our investment in high-quality growth companies, particularly those that benefit from long-term, structural changes in the economy, as these types of businesses can continue to grow even during a slowdown.
In fixed income, we think it makes sense to stay defensive and remain vigilant until the economic picture becomes a little clearer. We continue to maintain a shorter duration profile as the inverted yield curve allows us to get paid without locking into longer maturities. Of course, we are always on the hunt for long-term bargains, where we can layer in higher yields for longer periods.
____________________
Mutual fund investing involves risk. Principal loss is possible.
The Osterweis Growth & Income Fund may invest in small- and mid-capitalization companies, which tend to have limited liquidity and greater price volatility than large-capitalization companies. The Fund may invest in foreign and emerging market securities, which involve greater volatility and political, economic and currency risks and differences in accounting methods. These risks may increase for emerging markets. The Fund may invest in Master Limited Partnerships, which involve risk related to energy prices, demand and changes in tax code. The Fund may invest in debt securities that are un-rated or rated below investment grade. Lower-rated securities may present an increased possibility of default, price volatility or illiquidity compared to higher-rated securities. Investments in debt securities typically decrease in value when interest rates rise. This risk is usually greater for longer-term debt securities. Higher turnover rates may result in increased transaction costs, which could impact performance. From time to time, the Fund may have concentrated positions in one or more sectors subjecting the Fund to sector emphasis risk. The Fund may also make investments in derivatives that may involve certain costs and risks such as liquidity, interest rate, market, credit, management and the risk that a position could not be closed when most advantageous. Leverage may cause the effect of an increase or decrease in the value of the portfolio securities to be magnified and the fund to be more volatile than if leverage was not used. Investments in preferred securities have an inverse relationship with changes in the prevailing interest rate. Investments in Asset Backed and Mortgage Backed Securities include additional risks that investors should be aware of such as credit risk, prepayment risk, possible illiquidity and default, as well as increased susceptibility to adverse economic developments.
Investment performance reflects periods during which fee waivers were in effect. In the absence of such waivers, total return would have been reduced.
16
Growth & Income Fund | Fund Overview
| Average Annual Total Returns | |||||
| Periods Ended March 31, 2023 | |||||
| Since Inception | |||||
| 1 Yr. | 3 Yr. | 5 Yr. | 10 Yr. | (August 31, 2010) | |
| Osterweis Growth & Income Fund | -7.33% | 12.54% | 7.28% | 6.83% | 8.47% |
| 60% S&P 500 Index/40% Bloomberg | |||||
| U.S. Aggregate Bond Index | -6.25 | 9.90 | 7.34 | 8.03 | 9.09 |
| S&P 500 Index | -7.73 | 18.60 | 11.19 | 12.24 | 13.68 |
| Bloomberg U.S. Aggregate Bond Index | -4.78 | -2.77 | 0.91 | 1.36 | 1.92 |
Gross Expense Ratio as of 3/31/2022: 0.97% 1
1 | As of most recent Prospectus dated June 30, 2022. Please see the Fund’s Financial Highlights in this report for the most recent expense ratio. |
The performance data quoted above represents past performance. Past performance does not guarantee future results. The investment return and principal value of an investment will fluctuate so that an investor’s shares, when redeemed, may be worth more or less than their original cost. Current performance of the Fund may be lower or higher than the performance quoted. Performance data current to the most recent month-end may be obtained by calling (866) 236-0050.
Growth of $10K (Inception to 3/31/2023) (Unaudited)

This chart illustrates the performance of a hypothetical $10,000 investment made on August 31, 2010 and is not intended to imply any future performance. The returns shown do not reflect the deduction of taxes that a shareholder would pay on Fund distributions or the redemption of Fund shares. The returns reflect fee waivers in effect. In the absence of such waivers, total return would be reduced (See Note 3). The chart assumes reinvestment of capital gains, dividends and return of capital, if applicable, for the Fund and dividends for an index.
Asset/Sector Allocation (% of Net Assets) (Unaudited) 2
1 | Cash, cash equivalents and other assets less liabilities. |
2 | Equities are classified by GICS sector. Bonds are classified by bond type. |
3 | Does not round to 0.1% or (0.1)%, as applicable. |
17
Growth & Income Fund | Schedule of Investments at March 31, 2023
| Shares | Value | ||||||
| Common Stocks: 58.5% | |||||||
| Aerospace & Defense: 4.5% | |||||||
| 25,295 | Airbus SE – ADR | $ | 846,877 | ||||
| 16,335 | L3Harris Technologies, Inc. | 3,205,580 | |||||
| 76,965 | Safran SA – ADR | 2,849,244 | |||||
| 6,901,701 | |||||||
| Chemicals: 3.5% | |||||||
| 6,430 | Air Products & Chemicals, Inc. | 1,846,761 | |||||
| 21,750 | International Flavors | ||||||
| & Fragrances, Inc. | 2,000,130 | ||||||
| 4,171 | Linde PLC | 1,482,540 | |||||
| 5,329,431 | |||||||
| Commercial Services & Supplies: 2.1% | |||||||
| 22,420 | Waste Connections, Inc. | 3,117,949 | |||||
| Consumer Staples Distribution & Retail: 5.9% | |||||||
| 14,295 | Dollar General Corp. | 3,008,526 | |||||
| 7,928 | Southeastern Grocers, Inc. 1,2 | 180,362 | |||||
| 38,220 | Sysco Corp. | 2,951,731 | |||||
| 17,345 | Target Corp. | 2,872,852 | |||||
| 2,292,000 | Tops Holding, Litigation | ||||||
Trust Proceeds 1,2,6 | 1,721 | ||||||
| 9,015,192 | |||||||
| Electrical Equipment: 1.6% | |||||||
| 17,250 | AMETEK, Inc. | 2,506,942 | |||||
| Financial Services: 2.1% | |||||||
| 14,070 | Visa, Inc. – Class A | 3,172,222 | |||||
| Ground Transportation: 3.2% | |||||||
| 8,264 | Old Dominion Freight Line, Inc. | 2,816,702 | |||||
| 10,265 | Union Pacific Corp. | 2,065,934 | |||||
| 4,882,636 | |||||||
| Health Care Equipment & Supplies: 2.3% | |||||||
| 10,105 | Becton Dickinson & Co. | 2,501,392 | |||||
| 3,955 | Teleflex, Inc. | 1,001,841 | |||||
| 3,503,233 | |||||||
| Health Care Providers & Services: 1.2% | |||||||
| 23,970 | CVS Health Corp. | 1,781,211 | |||||
| Industrial REITS: 1.9% | |||||||
| 17,570 | EastGroup Properties, Inc. | 2,904,672 | |||||
| Insurance: 3.1% | |||||||
| 30,920 | Brown & Brown, Inc. | 1,775,427 | |||||
| 20,220 | The Progressive Corp. | 2,892,673 | |||||
| 4,668,100 | |||||||
| Interactive Media & Services: 2.1% | |||||||
| 30,770 | Alphabet, Inc. – Class C 2 | 3,200,080 | |||||
| IT Services: 1.4% | |||||||
| 7,615 | Accenture PLC – Class A | 2,176,443 | |||||
| Life Sciences Tools & Services: 1.7% | |||||||
| 10,040 | Danaher Corp. | 2,530,482 | |||||
| Metals & Mining: 0.6% | |||||||
| 15 | Real Alloy Holding, Inc. 1,2 | 944,450 | |||||
| Pharmaceuticals: 4.1% | |||||||
| 26,180 | Johnson & Johnson | 4,057,900 | |||||
| 22,890 | Novartis AG – ADR | 2,105,880 | |||||
| 6,163,780 | |||||||
| Semiconductors & Semiconductor Equipment: 7.1% | |||||||
| 22,184 | Advanced Micro Devices, Inc. 2 | 2,174,254 | |||||
| 25,285 | Analog Devices, Inc. | 4,986,708 | |||||
| 15,780 | Applied Materials, Inc. | 1,938,257 | |||||
| 26,830 | Micron Technology, Inc. | 1,618,922 | |||||
| 10,718,141 | |||||||
| Software: 7.1% | |||||||
| 28,395 | Microsoft Corp. | 8,186,278 | |||||
| 27,965 | Oracle Corp. | 2,598,508 | |||||
| 10,784,786 | |||||||
| Specialized REITS: 1.6% | |||||||
| 23,930 | Lamar Advertising Co. – Class A | 2,390,368 | |||||
| Specialty Retail: 1.4% | |||||||
| 19,800 | Ross Stores, Inc. | 2,101,374 | |||||
| Total Common Stocks | |||||||
| (Cost $60,504,161) | 88,793,193 | ||||||
| Convertible Preferred Stocks: 0.7% | |||||||
| Ground Transportation: 0.6% | |||||||
| 10,000 | Daseke, Inc., 7.625% 1,7 | 949,240 | |||||
| Media: 0.1% | |||||||
| 4,000 | Paramount Global, 5.750% | 119,760 | |||||
| Total Convertible Preferred Stocks | |||||||
| (Cost $1,238,000) | 1,069,000 | ||||||
| Partnerships & Trusts: 1.8% | |||||||
| Oil, Gas & Consumable Fuels: 1.8% | |||||||
| 104,550 | Enterprise Products Partners L.P. | 2,707,845 | |||||
| Total Partnerships & Trusts | |||||||
| (Cost $2,702,571) | 2,707,845 | ||||||
The accompanying Notes to Financial Statements are an integral part of these financial statements.
18
Growth & Income Fund | Schedule of Investments at March 31, 2023 (Continued)
| Principal | |||||||
| Amount | Value | ||||||
| Bonds: 23.8% | |||||||
| Corporate Bonds: 21.5% | |||||||
| Automobile Components: 1.8% | |||||||
| Adient Global Holdings Ltd. | |||||||
| $ | 350,000 | 7.000%, 04/15/2028 | $ | 360,153 | |||
| American Axle & Manufacturing, Inc. | |||||||
| 179,000 | 6.250%, 03/15/2026 | 172,061 | |||||
| The Goodyear Tire & Rubber Co. | |||||||
| 750,000 | 9.500%, 05/31/2025 | 771,504 | |||||
| 500,000 | 5.000%, 07/15/2029 | 447,340 | |||||
| Patrick Industries, Inc. | |||||||
| 500,000 | 7.500%, 10/15/2027 | 495,778 | |||||
| Real Hero Merger Sub 2, Inc. | |||||||
| 600,000 | 6.250%, 02/01/2029 | 444,191 | |||||
| 2,691,027 | |||||||
| Automobiles: 0.4% | |||||||
| Ford Motor Co. | |||||||
| 500,000 | 9.625%, 04/22/2030 | 581,136 | |||||
| Beverages: 0.2% | |||||||
| Primo Water Holdings, Inc. | |||||||
| 300,000 | 4.375%, 04/30/2029 | 262,014 | |||||
| Building Products: 0.3% | |||||||
| Griffon Corp. | |||||||
| 500,000 | 5.750%, 03/01/2028 | 464,262 | |||||
| Capital Markets: 0.5% | |||||||
| Oppenheimer Holdings, Inc. | |||||||
| 750,000 | 5.500%, 10/01/2025 | 719,681 | |||||
| Chemicals: 0.3% | |||||||
| Consolidated Energy Finance SA | |||||||
| 500,000 | 5.625%, 10/15/2028 | 430,640 | |||||
| Commercial Services & Supplies: 0.7% | |||||||
| GFL Environmental, Inc. | |||||||
| 220,000 | 5.125%, 12/15/2026 | 215,325 | |||||
| 250,000 | 4.750%, 06/15/2029 | 233,750 | |||||
| KAR Auction Services, Inc. | |||||||
| 28,000 | 5.125%, 06/01/2025 | 27,685 | |||||
| Pitney Bowes, Inc. | |||||||
| 750,000 | 7.250%, 03/15/2029 | 561,123 | |||||
| 1,037,883 | |||||||
| Computers & Peripherals: 0.3% | |||||||
| CPI Acquisition, Inc. | |||||||
| 468,000 | 8.625%, 03/15/2026 | 463,741 | |||||
| Construction & Engineering: 1.2% | |||||||
| Global Infrastructure Solutions, Inc. | |||||||
| 500,000 | 5.625%, 06/01/2029 | 413,045 | |||||
| Great Lakes Dredge & Dock Corp. | |||||||
| 350,000 | 5.250%, 06/01/2029 | 264,985 | |||||
| New Enterprise Stone & Lime Co., Inc. | |||||||
| 500,000 | 5.250%, 07/15/2028 | 442,610 | |||||
| Tutor Perini Corp. | |||||||
| 1,000,000 | 6.875%, 05/01/2025 | 706,235 | |||||
| 1,826,875 | |||||||
| Construction Materials: 0.2% | |||||||
| Cemex SAB de CV | |||||||
| 250,000 | 7.375%, 06/05/2027 | 258,912 | |||||
| Consumer Finance: 1.1% | |||||||
| Bread Financial Holdings, Inc. | |||||||
| 750,000 | 7.000%, 01/15/2026 | 662,210 | |||||
| FirstCash, Inc. | |||||||
| 500,000 | 5.625%, 01/01/2030 | 461,935 | |||||
| OneMain Finance Corp. | |||||||
| 500,000 | 8.250%, 10/01/2023 | 502,025 | |||||
| 1,626,170 | |||||||
| Consumer Staples Distribution & Retail: 1.4% | |||||||
| C&S Group Enterprises LLC | |||||||
| 500,000 | 5.000%, 12/15/2028 | 385,764 | |||||
| KeHE Distributors LLC / | |||||||
| KeHE Finance Corp. | |||||||
| 612,000 | 8.625%, 10/15/2026 | 611,676 | |||||
| Performance Food Group, Inc. | |||||||
| 500,000 | 4.250%, 08/01/2029 | 452,967 | |||||
| United Natural Foods, Inc. | |||||||
| 250,000 | 6.750%, 10/15/2028 | 232,577 | |||||
| US Foods, Inc. | |||||||
| 470,000 | 4.750%, 02/15/2029 | 434,734 | |||||
| 2,117,718 | |||||||
| Containers & Packaging: 0.3% | |||||||
| Owens-Brockway | |||||||
| Glass Container, Inc. | |||||||
| 454,000 | 5.875%, 08/15/2023 | 453,741 | |||||
| Discontinued: 0.5% | |||||||
| Nationstar Mortgage Holdings, Inc. | |||||||
| 250,000 | 6.000%, 01/15/2027 | 227,113 | |||||
| United Wholesale Mortgage LLC | |||||||
| 320,000 | 5.500%, 11/15/2025 | 303,225 | |||||
| 180,000 | 5.500%, 04/15/2029 | 150,546 | |||||
| 680,884 | |||||||
The accompanying Notes to Financial Statements are an integral part of these financial statements.
19
Growth & Income Fund | Schedule of Investments at March 31, 2023 (Continued)
| Principal | |||||||
| Amount | Value | ||||||
| Diversified Consumer Services: 0.3% | |||||||
| Carriage Services, Inc. | |||||||
| $ | 500,000 | 4.250%, 05/15/2029 | $ | 412,385 | |||
| Diversified Telecommunication Services: 0.2% | |||||||
| Level 3 Financing, Inc. | |||||||
| 275,000 | N/A%, 05/15/2030 4 | 264,344 | |||||
| Financial Services: 0.6% | |||||||
| Burford Capital Global Finance LLC | |||||||
| 250,000 | 6.250%, 04/15/2028 | 217,811 | |||||
| MoneyGram International, Inc. | |||||||
| 250,000 | 5.375%, 08/01/2026 | 250,857 | |||||
| PennyMac Financial Services, Inc. | |||||||
| 500,000 | 5.375%, 10/15/2025 | 467,525 | |||||
| 936,193 | |||||||
| Food Products: 0.1% | |||||||
| Simmons Foods, Inc./Simmons | |||||||
| Prepared Foods, Inc./Simmons | |||||||
| Pet Food, Inc./Simmons Feed | |||||||
| 250,000 | 4.625%, 03/01/2029 | 203,478 | |||||
| Ground Transportation: 0.3% | |||||||
| XPO Escrow Sub LLC | |||||||
| 500,000 | 7.500%, 11/15/2027 | 520,553 | |||||
| Health Care Providers & Services: 0.1% | |||||||
| Owens & Minor, Inc. | |||||||
| 250,000 | 4.500%, 03/31/2029 | 195,321 | |||||
| Hotels, Restaurants & Leisure: 1.2% | |||||||
| Aramark Services, Inc. | |||||||
| 100,000 | 5.000%, 04/01/2025 | 98,522 | |||||
| 390,000 | 6.375%, 05/01/2025 | 393,221 | |||||
| Carnival Corp. | |||||||
| 500,000 | 5.750%, 03/01/2027 | 411,792 | |||||
| 250,000 | 6.000%, 05/01/2029 | 199,318 | |||||
| Carrols Restaurant Group, Inc. | |||||||
| 600,000 | 5.875%, 07/01/2029 | 483,711 | |||||
| GPS Hospitality Holding Co. LLC / | |||||||
| GPS Finco, Inc. | |||||||
| 500,000 | 7.000%, 08/15/2028 | 308,000 | |||||
| 1,894,564 | |||||||
| Household Durables: 0.6% | |||||||
| Empire Communities Corp. | |||||||
| 500,000 | 7.000%, 12/15/2025 | 439,927 | |||||
| The New Home Co., Inc. | |||||||
| 500,000 | 7.250%, 10/15/2025 | 461,412 | |||||
| 901,339 | |||||||
| Industrial Conglomerates: 0.3% | |||||||
| Icahn Enterprises L.P. / | |||||||
| Icahn Enterprises Finance Corp. | |||||||
| 500,000 | 6.250%, 05/15/2026 | 492,500 | |||||
| IT Services: 0.5% | |||||||
| Conduent Business Services LLC / | |||||||
| Conduent State & Local Solutions, Inc. | |||||||
| 600,000 | 6.000%, 11/01/2029 | 473,936 | |||||
| Unisys Corp. | |||||||
| 500,000 | 6.875%, 11/01/2027 | 319,518 | |||||
| 793,454 | |||||||
| Machinery: 1.1% | |||||||
| The Manitowoc Co., Inc. | |||||||
| 1,000,000 | 9.000%, 04/01/2026 | 1,002,565 | |||||
| Wabash National Corp. | |||||||
| 750,000 | 4.500%, 10/15/2028 | 651,164 | |||||
| 1,653,729 | |||||||
| Media: 0.4% | |||||||
| DIRECTV Holdings LLC / | |||||||
| DIRECTV Financing Co., Inc. | |||||||
| 700,000 | 5.875%, 08/15/2027 | 630,985 | |||||
| Metals & Mining: 1.2% | |||||||
| Century Aluminum Co. | |||||||
| 335,000 | 7.500%, 04/01/2028 | 319,010 | |||||
| Coeur Mining, Inc. | |||||||
| 600,000 | 5.125%, 02/15/2029 | 509,271 | |||||
| Hecla Mining Co. | |||||||
| 500,000 | 7.250%, 02/15/2028 | 505,603 | |||||
| SunCoke Energy, Inc. | |||||||
| 500,000 | 4.875%, 06/30/2029 | 432,792 | |||||
| 1,766,676 | |||||||
| Mortgage Real Estate Investment Trusts – REITS: 0.9% | |||||||
| HAT Holdings I LLC / | |||||||
| HAT Holdings II LLC | |||||||
| 500,000 | 6.000%, 04/15/2025 | 480,598 | |||||
| Oxford Finance LLC / | |||||||
| Oxford Finance Co-Issuer II, Inc. | |||||||
| 500,000 | 6.375%, 02/01/2027 | 468,152 | |||||
| Starwood Property Trust, Inc. | |||||||
| 500,000 | 5.500%, 11/01/2023 | 501,487 | |||||
| 1,450,237 | |||||||
| Oil, Gas & Consumable Fuels: 1.0% | |||||||
| Calumet Specialty Products | |||||||
| Partners L.P. / Calumet Finance Corp. | |||||||
| 350,000 | 11.000%, 04/15/2025 | 361,978 | |||||
The accompanying Notes to Financial Statements are an integral part of these financial statements.
20
Growth & Income Fund | Schedule of Investments at March 31, 2023 (Continued)
| Principal | |||||||
| Amount | Value | ||||||
| Oil, Gas & Consumable Fuels: 1.0% (Continued) | |||||||
| Genesis Energy L.P. / Genesis | |||||||
| Energy Finance Corp. | |||||||
| $ | 450,000 | 7.750%, 02/01/2028 | $ | 436,732 | |||
| Global Partners L.P. / | |||||||
| GLP Finance Corp. | |||||||
| 500,000 | 7.000%, 08/01/2027 | 480,393 | |||||
| NGL Energy Operating LLC / | |||||||
| NGL Energy Finance Corp. | |||||||
| 250,000 | 7.500%, 02/01/2026 | 241,486 | |||||
| 1,520,589 | |||||||
| Passenger Airlines: 0.8% | |||||||
| Allegiant Travel Co. | |||||||
| 500,000 | 7.250%, 08/15/2027 | 498,270 | |||||
| American Airlines, Inc. | |||||||
| 600,000 | 11.750%, 07/15/2025 | 657,112 | |||||
| 1,155,382 | |||||||
| Software: 0.4% | |||||||
| NCR Corp. | |||||||
| 450,000 | 5.750%, 09/01/2027 | 442,708 | |||||
| 250,000 | 5.000%, 10/01/2028 | 220,000 | |||||
| 662,708 | |||||||
| Specialty Retail: 0.9% | |||||||
| Ken Garff Automotive LLC | |||||||
| 500,000 | 4.875%, 09/15/2028 | 425,704 | |||||
| Sonic Automotive, Inc. | |||||||
| 500,000 | 4.625%, 11/15/2029 | 419,634 | |||||
| Upbound Group, Inc. | |||||||
| 600,000 | 6.375%, 02/15/2029 | 504,553 | |||||
| 1,349,891 | |||||||
| Trading Companies & Distributors: 1.2% | |||||||
| Avation Capital SA | |||||||
| 452,847 | 8.250% Cash or 9.000% | ||||||
| PIK, 10/31/2026 3 | 392,294 | ||||||
| Castlelake Aviation Finance DAC | |||||||
| 500,000 | 5.000%, 04/15/2027 | 443,878 | |||||
| Herc Holdings, Inc. | |||||||
| 500,000 | 5.500%, 07/15/2027 | 483,162 | |||||
| WESCO Distribution, Inc. | |||||||
| 250,000 | 7.125%, 06/15/2025 | 254,375 | |||||
| 250,000 | 7.250%, 06/15/2028 | 256,945 | |||||
| 1,830,654 | |||||||
| Transportation Infrastructure: 0.2% | |||||||
| Signature Aviation US Holdings, Inc. | |||||||
| 400,000 | 4.000%, 03/01/2028 | 370,880 | |||||
| Total Corporate Bonds | |||||||
| (Cost $36,104,269) | 32,620,546 | ||||||
| Convertible Bonds: 2.1% | |||||||
| Automobiles: 0.2% | |||||||
| Ford Motor Co. | |||||||
| 250,000 | N/A%, 03/15/2026 4 | 251,000 | |||||
| Consumer Finance: 0.6% | |||||||
| EZCORP, Inc. | |||||||
| 250,000 | 2.375%, 05/01/2025 | 228,455 | |||||
| 250,000 | 3.750%, 12/15/2029 | 246,790 | |||||
| LendingTree, Inc. | |||||||
| 500,000 | 0.500%, 07/15/2025 | 375,400 | |||||
| 850,645 | |||||||
| Health Care Equipment & Supplies: 0.1% | |||||||
| Haemonetics Corp. | |||||||
| 250,000 | N/A%, 03/01/2026 4 | 213,371 | |||||
| Hotels, Restaurants & Leisure: 0.1% | |||||||
| NCL Corp. Ltd. | |||||||
| 160,000 | 6.000%, 05/15/2024 | 195,537 | |||||
| IT Services: 0.3% | |||||||
| BigBear.ai Holdings, Inc. | |||||||
| 650,000 | 6.000%, 12/15/2026 | 454,436 | |||||
| Machinery: 0.1% | |||||||
| John Bean Technologies Corp. | |||||||
| 250,000 | 0.250%, 05/15/2026 | 229,125 | |||||
| Passenger Airlines: 0.1% | |||||||
| Southwest Airlines Co. | |||||||
| 200,000 | 1.250%, 05/01/2025 | 227,950 | |||||
| Pharmaceuticals: 0.3% | |||||||
| Jazz Investments I Ltd. | |||||||
| 350,000 | 2.000%, 06/15/2026 | 389,375 | |||||
| Real Estate Management & Development: 0.1% | |||||||
| DigitalBridge Group, Inc. | |||||||
| 225,000 | 5.000%, 04/15/2023 | 226,126 | |||||
| Software: 0.2% | |||||||
| Tyler Technologies, Inc. | |||||||
| 250,000 | 0.250%, 03/15/2026 | 240,000 | |||||
| Total Convertible Bonds | |||||||
| (Cost $3,458,442) | 3,277,565 | ||||||
The accompanying Notes to Financial Statements are an integral part of these financial statements.
21
Growth & Income Fund | Schedule of Investments at March 31, 2023 (Continued)
| Principal | |||||||
| Amount | Value | ||||||
| Private Mortgage Backed Obligations: 0.2% | |||||||
| Financial Services: 0.2% | |||||||
| HAS Capital Income | |||||||
| Opportunity Fund II | |||||||
| $ | 642,000 | 8.000%, 12/31/2024 | |||||
| (Cost $642,000 Acquisition | |||||||
| Dates 06/10/2016, | |||||||
09/19/2016) 1,9 | $ | 312,128 | |||||
| Total Private Mortgage Backed Obligations | |||||||
| (Cost $642,000) | 312,128 | ||||||
| Total Bonds | |||||||
| (Cost $40,204,711) | 36,210,239 | ||||||
Warrants: 0.0% 8 | |||||||
Trading Companies & Distributors: 0.0% 8 | |||||||
| 8,750 | Avation PLC, Warrants | ||||||
| (Expiration Date 10/31/2026, | |||||||
Exercise Price 114.5 GBP)2 | 6,746 | ||||||
| Total Warrants | |||||||
| (Cost $–) | 6,746 | ||||||
| Short-Term Investments: 15.3% | |||||||
| Commercial Paper: 5.9% | |||||||
| Automobiles: 0.7% | |||||||
| General Motors Financial Co., Inc. | |||||||
| 1,000,000 | N/A%, 04/11/2023 4,10 | 998,330 | |||||
| Beverages: 0.7% | |||||||
| Constellation Brands, Inc. | |||||||
| 1,000,000 | 5.172%, 04/03/2023,10 | 999,549 | |||||
| Chemicals: 0.6% | |||||||
| International Flavors | |||||||
| & Fragrances, Inc. | |||||||
| 1,000,000 | N/A%, 05/01/2023 4,10 | 995,436 | |||||
| Computers & Peripherals: 0.6% | |||||||
| HP, Inc. | |||||||
| 1,000,000 | 5.059%, 04/24/202310 | 996,515 | |||||
| Construction & Engineering: 0.6% | |||||||
| Quanta Services, Inc. | |||||||
| 1,000,000 | 5.701%, 04/17/202310 | 997,389 | |||||
| Diversified REITS: 0.7% | |||||||
| Crown Castle International Corp. | |||||||
| 1,000,000 | 5.251%, 04/04/202310 | 999,397 | |||||
| Electronic Equipment, Instruments & Components: 0.7% | |||||||
| Jabil, Inc. | |||||||
| 1,000,000 | N/A%, 04/06/2023 4,10 | 999,060 | |||||
| Financial Services: 0.6% | |||||||
| Global Payments, Inc. | |||||||
| 1,000,000 | 5.929%, 04/26/202310 | 995,872 | |||||
| Software: 0.7% | |||||||
| Oracle Corp. | |||||||
| 1,000,000 | 5.475%, 04/19/202310 | 997,491 | |||||
| Total Commercial Paper | |||||||
| (Cost $8,979,972) | 8,979,039 | ||||||
| Shares | |||||||
| Money Market Funds: 9.4% | |||||||
| 14,255,774 | Federated Hermes U.S. Treasury | ||||||
Cash Reserves – Class I, 4.370% 5 | 14,255,774 | ||||||
| Total Money Market Funds | |||||||
| (Cost $14,255,774) | 14,255,774 | ||||||
| Total Short-Term Investments | |||||||
| (Cost $23,235,745) | 23,234,812 | ||||||
| Total Investments in Securities: 100.1% | |||||||
| (Cost $127,885,189) | 152,021,836 | ||||||
| Liabilities in Excess of Other Assets: (0.1)% | (130,312 | ) | |||||
| Total Net Assets: 100.0% | $ | 151,891,524 | |||||
ADR – American Depositary Receipt
GBP – Great Britain Pound
PIK – Payment-in-Kind
USD – United States Dollar
1 | Security is fair valued under the Board of Trustees and is categorized as a Level 3 security. Significant unobservable inputs were used to determine fair value. |
2 | Non-income producing security. |
3 | Variable rate security; rate shown is the rate in effect on March 31, 2023. |
4 | Zero Coupon Security |
5 | Annualized seven-day effective yield as of March 31, 2023. |
6 | Not a readily marketable security. |
7 | Company is an “affiliated person” of the Fund, as defined in the Investment Company Act of 1940. |
8 | Does not round to 0.1% or (0.1)%, as applicable. |
9 | Security considered restricted. As of March 31, 2023, the value of the restricted securities was $312,128 or 0.2% of net assets. |
10 | Rate represents the yield to maturity from purchase price. |
The Global Industry Classifications Standard (GICS®) sector and industry classifications was developed by and is the exclusive property of MSCI, Inc. and Standard & Poor’s (“S&P”). GICS® is a service mark of MSCI, Inc. and S&P and has been licensed for use by the Osterweis Capital Management.
The accompanying Notes to Financial Statements are an integral part of these financial statements.
22
Emerging Opportunity Fund | Portfolio Managers’ Review
Performance Summary
For the period of April 1, 2022 to March 31, 2023, the Osterweis Emerging Opportunity Fund (the Fund) generated a total return of -10.18% versus -10.60% for the Russell 2000 Growth Index (the index). (Please see standardized performance in the table following this review.)
Market Review
The previous twelve months started quite poorly for small cap growth stocks, as the index fell nearly 20% in the first fiscal quarter. The weak returns were driven by the Fed’s aggressive anti-inflation tightening cycle, which raised concerns about a potential recession. The second fiscal quarter opened with a brief recovery rally, but sentiment faded again following another Fed rate hike, and the index finished the quarter essentially flat. The third fiscal quarter finally saw a sustained rally in the equity markets, as investors began to anticipate a Fed pivot, but small cap value stocks benefitted more than small cap growth stocks, and the index only gained about 4%. The rally continued into the first month of the final fiscal quarter, but unexpected issues in the banking sector triggered a selloff that lasted until the FOMC meeting in March, when Chair Powell indicated the Fed may be finished raising rates. The index gained roughly 6% during the final fiscal quarter.
Portfolio Review
As the specter of continued inflation and rising interest rates hovered over the economy throughout the past fiscal year, we shortened our overall portfolio duration by emphasizing more proven companies with a greater proportion of current versus future earnings. In addition, to help manage the elevated market volatility, we invested in companies that we believed had more resilience in a volatile macro environment but could also participate when conditions improve.
For the twelve months ending March 31, 2023, the Fund slightly outperformed the index. Our results were aided by our cash allocation, which declined throughout the period (from 11.5% to 5.8%) but still provided stability and positive returns.
The equites in the fund slightly lagged the index, which delivered negative returns during the past fiscal year. Security selection contributed to our underperformance, as our picks in Financials, Industrials, and Consumer Staples each materially lagged their counterparts in the index. In addition, our holdings in Health Care, Communication Services, and Energy modestly trailed their corresponding benchmark sectors. On the plus side, our holdings in Real Estate and Information Technology materially outperformed, but not quite enough to close the gap.
Sector allocation also detracted from our relative performance. We were underweight Consumer Staples, which was the strongest performing sector relative to the rest of the index. Likewise, we were underweight Energy, Materials, and Industrials, all of which outperformed the overall index. Our relative returns were boosted by our overweight to Consumer Discretionary, which outperformed the total index.
Outlook & Portfolio Positioning
In the near to medium term, Fed policy continues to loom large over the direction of both the economy and the markets. If inflation continues to moderate and the tightening cycle is really approaching its end, prospects for equities should begin to improve – even if rates remain elevated. In this scenario, we think returns will be driven more by company-specific execution rather than exposure to macro factors, which have been very influential for the past few years.
On the other hand, lingering stress in the banking sector may constrain the availability of credit, which has the potential to slow the economy. In addition, within the small cap space, there is a sizable overhang of unsold insider shares, and as those are released into the market (by venture capitalists and large shareholders), supply could exceed demand, which could be headwind to small cap returns.
Because we focus on companies that are experiencing rapid growth, generally due to durable secular trends, our portfolio should be a little less affected by exogenous factors. In fact, growth stocks frequently outperform when the
23
Emerging Opportunity Fund | Portfolio Managers’ Review
economy softens, as investors gravitate toward the companies that are finding a way to expand when others are struggling. Additionally, based on historical valuations, small cap stocks have not been this cheap since the 1970s, which should benefit our strategy going forward.
____________________
Mutual Fund investing involves risk. Principal loss is possible.
The Osterweis Emerging Opportunity Fund may invest in unseasoned companies, which involve additional risks such as abrupt or erratic price movements. The Fund may invest in small and mid-sized companies, which may involve greater volatility than large-sized companies. The Fund may invest in IPOs and unseasoned companies that are in the early stages of their development and may pose more risk compared to more established companies. The Fund may invest in ETFs, which involve risks that do not apply to conventional Funds. Higher turnover rates may result in increased transaction costs, which could impact performance. From time to time, the Fund may have concentrated positions in one or more sectors subjecting the Fund to sector emphasis risk. The Fund may invest in foreign and emerging market securities, which involve greater volatility and political, economic and currency risks and differences in accounting methods. These risks may increase for emerging markets.
24
Emerging Opportunity Fund | Fund Overview
| Average Annual Total Returns | |||||
| Periods Ended March 31, 2023 | |||||
| Since Inception | |||||
| 1 Yr. | 3 Yr. | 5 Yr. | 10 Yr. | (October 1, 2012) | |
| Osterweis Emerging Opportunity Fund | -10.18% | 17.67% | 10.84% | 13.61% | 13.60% |
| Russell 2000 Growth Index | -10.60 | 13.36 | 4.26 | 8.49 | 9.38 |
Gross/Net Expense Ratio as of 3/31/2022: 1.17%/1.10% 1,2
1 | As of most recent Prospectus dated June 30, 2022. Please see the Fund’s Financial Highlights in this report for the most recent expense ratio. |
2 | The Adviser has contractually agreed to waive certain fees through June 30, 2023. The net expense ratio is applicable to investors. |
The performance data quoted above represents past performance. Past performance does not guarantee future results. The investment return and principal value of an investment will fluctuate so that an investor’s shares, when redeemed, may be worth more or less than their original cost. Current performance of the Fund may be lower or higher than the performance quoted. Performance data current to the most recent month-end may be obtained by calling (866) 236-0050.
Growth of $10K (Inception to 3/31/2023) (Unaudited)

This chart illustrates the performance of a hypothetical $10,000 investment made on October 1, 2012 and is not intended to imply any future performance. The returns shown do not reflect the deduction of taxes that a shareholder would pay on Fund distributions or the redemption of Fund shares. The returns reflect fee waivers in effect. In the absence of such waivers, total return would be reduced (See Note 3). The chart assumes reinvestment of capital gains, dividends and return of capital, if applicable, for the Fund and dividends for an index.
Sector Allocation (% of Net Assets) (Unaudited)

1 | Cash, cash equivalents and other assets less liabilities. |
25
Emerging Opportunity Fund | Schedule of Investments at March 31, 2023
| Shares | Value | ||||||
| Common Stocks: 94.3% | |||||||
| Aerospace & Defense: 3.8% | |||||||
| 33,265 | Axon Enterprise, Inc. 1 | $ | 7,479,635 | ||||
| Biotechnology: 2.5% | |||||||
| 52,595 | Natera, Inc. 1 | 2,920,074 | |||||
| 119,885 | Replimune Group, Inc. 1 | 2,117,169 | |||||
| 5,037,243 | |||||||
| Building Products: 3.4% | |||||||
| 74,440 | Trex Co., Inc. 1 | 3,622,995 | |||||
| 147,715 | Zurn Elkay Water Solutions Corp. | 3,155,192 | |||||
| 6,778,187 | |||||||
| Chemicals: 2.7% | |||||||
| 52,665 | Innospec, Inc. | 5,407,116 | |||||
| Commercial Services & Supplies: 1.3% | |||||||
| 71,440 | Montrose Environmental | ||||||
Group, Inc. 1 | 2,548,265 | ||||||
| Consumer Staples Distribution & Retail: 3.1% | |||||||
| 181,745 | The Chefs’ Warehouse, Inc. 1 | 6,188,417 | |||||
| Diversified Telecommunication Services: 1.4% | |||||||
| 46,020 | Iridium Communications, Inc. | 2,850,019 | |||||
| Health Care Equipment & Supplies: 16.7% | |||||||
| 93,570 | Cutera, Inc. 1 | 2,210,123 | |||||
| 27,885 | Inspire Medical Systems, Inc. 1 | 6,527,042 | |||||
| 15,839 | Insulet Corp. 1 | 5,052,008 | |||||
| 82,940 | Lantheus Holdings, Inc. 1 | 6,847,526 | |||||
| 67,555 | PROCEPT BioRobotics Corp. 1 | 1,918,562 | |||||
| 32,178 | Shockwave Medical, Inc. 1 | 6,977,156 | |||||
| 26,610 | UFP Technologies, Inc. 1 | 3,455,042 | |||||
| 32,987,459 | |||||||
| Health Care Providers & Services: 1.8% | |||||||
| 62,185 | HealthEquity, Inc. 1 | 3,650,881 | |||||
| Hotels, Restaurants & Leisure: 5.6% | |||||||
| 54,235 | Marriott Vacations Worldwide Corp. | 7,314,132 | |||||
| 48,760 | Planet Fitness, Inc. – Class A 1 | 3,787,189 | |||||
| 11,101,321 | |||||||
| Household Durables: 3.4% | |||||||
| 20,847 | Cavco Industries, Inc. 1 | 6,623,926 | |||||
| Interactive Media & Services: 1.0% | |||||||
| 118,325 | ZipRecruiter, Inc. – Class A 1 | 1,886,101 | |||||
| Leisure Products: 3.1% | |||||||
| 280,495 | Topgolf Callaway Brands Corp. 1 | 6,064,302 | |||||
| Life Sciences Tools & Services: 1.2% | |||||||
| 105,685 | BioLife Solutions, Inc. 1 | 2,298,649 | |||||
| Oil, Gas & Consumable Fuels: 2.8% | |||||||
| 256,325 | Magnolia Oil & Gas Corp. – Class A | 5,608,391 | |||||
| Professional Services: 6.1% | |||||||
| 139,425 | KBR, Inc. | 7,675,346 | |||||
| 264,905 | Verra Mobility Corp. 1 | 4,482,193 | |||||
| 12,157,539 | |||||||
| Real Estate Management & Development: 4.1% | |||||||
| 56,988 | FirstService Corp. | 8,034,738 | |||||
| Semiconductors & Semiconductor Equipment: 13.3% | |||||||
| 225,605 | ACM Research, Inc. – Class A 1 | 2,639,578 | |||||
| 139,700 | MACOM Technology | ||||||
Solutions Holdings, Inc. 1 | 9,896,348 | ||||||
| 89,662 | Onto Innovation, Inc. 1 | 7,879,497 | |||||
| 34,065 | Silicon Laboratories, Inc. 1 | 5,964,441 | |||||
| 26,379,864 | |||||||
| Software: 13.3% | |||||||
| 109,495 | Bentley Systems, Inc. – Class A | 4,707,190 | |||||
| 80,560 | Clearwater Analytics | ||||||
Holdings, Inc. – Class A 1 | 1,285,737 | ||||||
| 148,235 | DoubleVerify Holdings, Inc. 1 | 4,469,285 | |||||
| 47,485 | Five9, Inc. 1 | 3,432,691 | |||||
| 32,095 | Manhattan Associates, Inc. 1 | 4,969,911 | |||||
| 48,610 | SPS Commerce, Inc. 1 | 7,403,303 | |||||
| 26,268,117 | |||||||
| Specialty Retail: 3.7% | |||||||
| 35,235 | Boot Barn Holdings, Inc. 1 | 2,700,411 | |||||
| 46,920 | Floor & Decor Holdings, | ||||||
Inc. – Class A 1 | 4,608,482 | ||||||
| 7,308,893 | |||||||
| Total Common Stocks | |||||||
| (Cost $172,288,310) | 186,659,063 | ||||||
The accompanying Notes to Financial Statements are an integral part of these financial statements.
26
Emerging Opportunity Fund | Schedule of Investments at March 31, 2023 (Continued)
| Shares | Value | ||||||
| Short-Term Investments: 7.5% | |||||||
| Money Market Funds: 7.5% | |||||||
| 14,868,686 | Federated Hermes U.S. Treasury | ||||||
Cash Reserves – Class I, 4.370% 2 | $ | 14,868,686 | |||||
| Total Money Market Funds | |||||||
| (Cost $14,868,686) | 14,868,686 | ||||||
| Total Short-Term Investments | |||||||
| (Cost $14,868,686) | 14,868,686 | ||||||
| Total Investments in Securities: 101.8% | |||||||
| (Cost $187,156,996) | 201,527,749 | ||||||
| Liabilities in Excess of Other Assets: (1.8)% | (3,492,498 | ) | |||||
| Total Net Assets: 100.0% | $ | 198,035,251 | |||||
1 | Non-income producing security. |
2 | Annualized seven-day effective yield as of March 31, 2023. |
The Global Industry Classifications Standard (GICS®) sector and industry classifications was developed by and is the exclusive property of MSCI, Inc. and Standard & Poor’s (“S&P”). GICS® is a service mark of MSCI, Inc. and S&P and has been licensed for use by the Osterweis Capital Management.
The accompanying Notes to Financial Statements are an integral part of these financial statements.
27
Total Return Fund | Portfolio Managers’ Review
Performance Summary
For the twelve-month period ending March 31, 2023, the Osterweis Total Return Fund (the Fund) generated a total return of -0.26%, outperforming the Bloomberg U.S. Aggregate Bond Index (the Agg), which returned -4.78% over the same period. (Please see standardized performance in the table following this review.)
Market Review
The past year was a difficult stretch in the investment grade fixed income market. Yields rose substantially throughout the first two fiscal quarters as the Fed continued its anti-inflation tightening program, which put substantial downward pressure on bonds. Sentiment improved in the third fiscal quarter, but the final fiscal quarter was a volatile period featuring a brief selloff triggered by turmoil in the banking system. The market began to stabilize in the final month of the period, aided by a flight-to-quality rally.
Portfolio Review
The Fund outperformed the Agg during the first and second fiscal quarters primarily due to its lower duration profile and increased allocation to cash. We held approximately a third of the Fund in cash and cash surrogates, and we maintained a defensive posture (which was the case for much of the fiscal year).
During the third fiscal quarter, the Fund lagged the Agg largely due to its underweight to corporates and agency passthroughs. In particular, the spread duration of the Fund was significantly lower than that of the benchmark.
During the fourth fiscal quarter, the Fund also trailed the index, though very modestly. Again, its duration profile was shorter, although we steadily increased duration throughout the quarter, as the Fed indicated its tightening program was nearly over.
Outlook & Portfolio Positioning
Looking forward, we remain constructive on duration and will continue to invest in longer-dated assets. While we do not envy the task of the Federal Reserve, our preferred measure of persistent inflation, the Underlying Inflation Gauge, confirms an undeniable trend of lower inflation. Data from the fourth fiscal quarter showed a consistent monthly decline of ~30-40 basis points and a drop from the peak of last summer of over 150 basis points. We acknowledge that the path to lower inflation will not be a straight line and will likely become sticky before reaching the Fed’s 2% target. However, with long rates near 4%, the risks are skewed in favor of the Fed being successful.
In addition, long duration positions generally benefit from market uncertainty, as investors gravitate toward the safety of longer dated Treasuries. With the banking sector still unsettled we feel a longer duration profile should help our returns in the near term.
____________________
Mutual fund investing involves risk. Principal loss is possible.
The Osterweis Total Return Fund may invest fixed income securities which are subject to credit, default, extension, interest rate and prepayment risks. It may also make investments in derivatives that may involve certain costs and risks such as liquidity, interest rate, market, credit, management and the risk that a position could not be closed when most advantageous. The Fund may invest in debt securities that are un-rated or rated below investment grade. Lower-rated securities may present an increased possibility of default, price volatility or illiquidity compared to higher-rated securities. Investments in foreign and emerging market securities involve greater volatility and political, economic and currency risks and differences in accounting methods. These risks may increase for emerging markets. Leverage may cause the effect of an increase or decrease in the value of the portfolio securities to be magnified and the Fund to be more volatile than if leverage was not used. Investments in preferred securities have an inverse relationship with changes in the prevailing interest rate. Investments in Asset Backed and Mortgage Backed Securities include additional risks that investors should be aware of such as credit risk, prepayment risk, possible illiquidity and default, as well as increased susceptibility to adverse economic developments. It may also make investments in derivatives that may involve certain costs and risks such as liquidity, interest rate, market, credit, management and the risk that a position could not be closed when most advantageous. The Fund may invest in municipal securities which are subject to the risk of default.
28
Total Return Fund | Fund Overview
| Average Annual Total Returns | ||||
| Periods Ended March 31, 2023 | ||||
| Since Inception | ||||
| 1 Yr. | 3 Yr. | 5 Yr. | (December 30, 2016) | |
| Osterweis Total Return Fund | -0.26% | 0.14% | 1.77% | 1.98% |
| Bloomberg U.S. Aggregate Bond Index | -4.78 | -2.77 | 0.91 | 1.05 |
Gross Expense Ratio as of 3/31/2022: 0.66% 1
1 | As of most recent Prospectus dated June 30, 2022. Please see the Fund’s Financial Highlights in this report for the most recent expense ratio. |
The performance data quoted above represents past performance. Past performance does not guarantee future results. The investment return and principal value of an investment will fluctuate so that an investor’s shares, when redeemed, may be worth more or less than their original cost. Current performance of the Fund may be lower or higher than the performance quoted. Performance data current to the most recent month-end may be obtained by calling (866) 236-0050.
Growth of $10K (Inception to 3/31/2023) (Unaudited)

This chart illustrates the performance of a hypothetical $10,000 investment made on December 30, 2016 and is not intended to imply any future performance. The returns shown do not reflect the deduction of taxes that a shareholder would pay on Fund distributions or the redemption of Fund shares. The returns reflect fee waivers in effect. In the absence of such waivers, total return would be reduced (See Note 3). The chart assumes reinvestment of capital gains, dividends and return of capital, if applicable, for the Fund and dividends for an index.
Asset Allocation (% of Net Assets) (Unaudited)

1 | Cash, cash equivalents and other assets less liabilities. |
29
Total Return Fund | Schedule of Investments at March 31, 2023
| Principal | |||||||
| Amount | Value | ||||||
| Bonds: 88.9% | |||||||
| Corporate Bonds: 18.1% | |||||||
| Air Freight & Logistics: 1.1% | |||||||
| American Airlines 2019-1 Class B | |||||||
| Pass Through Trust | |||||||
| $ | 714,578 | 3.850%, 02/15/2028 | $ | 640,762 | |||
| British Airways 2021-1 Class A | |||||||
| Pass Through Trust | |||||||
| 969,470 | 2.900%, 03/15/2035 | 796,724 | |||||
| 1,437,486 | |||||||
| Automobiles: 0.5% | |||||||
| Ford Motor Credit Co LLC | |||||||
| 600,000 | 6.950%, 03/06/2026 | 610,452 | |||||
| Banks: 3.8% | |||||||
| Bank of America Corp. | |||||||
| 1,000,000 | 4.250%, 10/22/2026 | 968,858 | |||||
| Citigroup, Inc. | |||||||
| 1,000,000 | 6.123% (SOFR + 1.372%), | ||||||
05/24/2025 2 | 1,000,715 | ||||||
| HSBC Holdings PLC | |||||||
| 1,000,000 | 4.250%, 03/14/2024 | 974,391 | |||||
| The PNC Financial Services Group, Inc. | |||||||
| 1,120,000 | 8.492% (3 Month LIBOR | ||||||
USD + 3.678%), 05/01/2023 1,2 | 1,108,691 | ||||||
| Santander UK Group Holdings PLC | |||||||
| 1,000,000 | 6.833% (SOFR + 2.749%), | ||||||
11/21/2026 2,9 | 1,013,140 | ||||||
| 5,065,795 | |||||||
| Biotechnology: 0.6% | |||||||
| Amgen, Inc. | |||||||
| 1,000,000 | 3.150%, 02/21/2040 | 784,218 | |||||
| Capital Markets: 1.3% | |||||||
| Morgan Stanley | |||||||
| 1,000,000 | 4.350%, 09/08/2026 | 974,847 | |||||
| 1,000,000 | 2.484% (SOFR + 1.360%), | ||||||
09/16/2036 2,9 | 759,826 | ||||||
| 1,734,673 | |||||||
| Chemicals: 0.7% | |||||||
| Celanese US Holdings LLC | |||||||
| 1,000,000 | 5.900%, 07/05/2024 | 1,000,498 | |||||
| Diversified Telecommunication Services: 0.5% | |||||||
| AT&T, Inc. | |||||||
| 1,000,000 | 3.500%, 09/15/2053 | 723,227 | |||||
| Electric Utilities: 1.2% | |||||||
| Edison International | |||||||
| 760,000 | 5.000% (5 Year CMT | ||||||
Rate + 3.901%), 12/15/2026 1,2,9 | 631,752 | ||||||
| PacifiCorp | |||||||
| 1,000,000 | 5.350%, 12/01/2053 | 1,021,835 | |||||
| 1,653,587 | |||||||
| Electronic Equipment, | |||||||
| Instruments & Components: 0.8% | |||||||
| TD SYNNEX Corp. | |||||||
| 1,110,000 | 1.250%, 08/09/2024 | 1,038,776 | |||||
| Financial Services: 0.7% | |||||||
| Aviation Capital Group LLC | |||||||
| 1,000,000 | 1.950%, 01/30/2026 | 889,501 | |||||
| Insurance: 2.3% | |||||||
| Metropolitan Life Global Funding I | |||||||
| 1,000,000 | 2.800%, 03/21/2025 | 965,694 | |||||
| 1,000,000 | 5.150%, 03/28/2033 | 1,009,486 | |||||
| New York Life Insurance Co. | |||||||
| 1,000,000 | 5.875%, 05/15/2033 | 1,055,692 | |||||
| SBL Holdings, Inc. | |||||||
| 25,000 | 6.500% (5 Year CMT | ||||||
Rate + 5.620%), 11/13/2026 1,2,9 | 17,688 | ||||||
| 3,048,560 | |||||||
| Media: 0.2% | |||||||
| Comcast Corp. | |||||||
| 500,000 | 2.887%, 11/01/2051 | 340,329 | |||||
| Oil, Gas & Consumable Fuels: 0.7% | |||||||
| Energy Transfer L.P. | |||||||
| 1,000,000 | 6.500% (5 Year CMT | ||||||
Rate + 5.694%), 11/15/2026 1,2,9 | 883,528 | ||||||
| Passenger Airlines: 1.7% | |||||||
| Air Canada 2020-2 Class A | |||||||
| Pass Through Trust | |||||||
| 830,190 | 5.250%, 04/01/2029 | 809,482 | |||||
| British Airways 2020-1 Class A | |||||||
| Pass Through Trust | |||||||
| 527,955 | 4.250%, 11/15/2032 | 494,301 | |||||
| United Airlines 2020-1 Class A | |||||||
| Pass Through Trust | |||||||
| 935,621 | 5.875%, 10/15/2027 | 933,463 | |||||
| 2,237,246 | |||||||
| Software: 0.6% | |||||||
| Oracle Corp. | |||||||
| 1,000,000 | 3.650%, 03/25/2041 | 771,207 | |||||
| Trading Companies & Distributors: 1.4% | |||||||
| Air Lease Corp. | |||||||
| 520,000 | 4.125% (5 Year CMT | ||||||
Rate + 3.149%), 12/15/2026 1,2,9 | 354,900 | ||||||
The accompanying Notes to Financial Statements are an integral part of these financial statements.
30
Total Return Fund | Schedule of Investments at March 31, 2023 (Continued)
| Principal | |||||||
| Amount | Value | ||||||
| Trading Companies & Distributors: 1.4% (Continued) | |||||||
| Aviation Capital Group LLC | |||||||
| $ | 1,500,000 | 6.250%, 04/15/2028 | $ | 1,499,592 | |||
| 1,854,492 | |||||||
| Total Corporate Bonds | |||||||
| (Cost $24,996,411) | 24,073,575 | ||||||
| Asset Backed Securities: 16.3% | |||||||
| Aaset 2021-2 Trust 2021-2 | |||||||
| 856,033 | 2.798%, 01/15/2047 | 736,438 | |||||
| American Credit Acceptance | |||||||
| Receivables Trust 2021-1 | |||||||
| 1,500,000 | 1.140%, 03/15/2027 | 1,430,932 | |||||
| American Credit Acceptance | |||||||
| Receivables Trust 2021-2 | |||||||
| 655,022 | 0.970%, 07/13/2027 | 645,210 | |||||
| Cartiga Asset Finance | |||||||
| Trust 2023-1 LLC | |||||||
| 1,424,399 | 7.000%, 03/15/2035 11 | 1,422,690 | |||||
| Carvana Auto Receivables | |||||||
| Trust 2021-N1 | |||||||
| 513,235 | 1.300%, 01/10/2028 | 477,380 | |||||
| Carvana Auto Receivables | |||||||
| Trust 2021-N2 | |||||||
| 848,701 | 1.270%, 03/10/2028 | 813,473 | |||||
| CLI Funding VIII LLC | |||||||
| 1,965,417 | 1.640%, 02/18/2046 | 1,708,392 | |||||
| CPS Auto Receivables Trust 2019-C | |||||||
| 34,425 | 3.170%, 06/16/2025 | 34,338 | |||||
| DT Auto Owner Trust 2019-1 | |||||||
| 1,000,000 | 4.940%, 02/17/2026 | 999,380 | |||||
| DT Auto Owner Trust 2021-1 | |||||||
| 500,000 | 0.840%, 10/15/2026 | 485,022 | |||||
| FCI Funding 2021-1 LLC 2021-1 | |||||||
| 122,997 | 1.130%, 04/15/2033 | 119,663 | |||||
| Flagship Credit Auto Trust 2018-2 | |||||||
| 80,769 | 4.230%, 09/16/2024 | 80,689 | |||||
| Flagship Credit Auto Trust 2019-2 | |||||||
| 28,960 | 3.090%, 05/15/2025 | 28,895 | |||||
| Flagship Credit Auto Trust 2020-4 | |||||||
| 500,000 | 1.280%, 02/16/2027 | 479,172 | |||||
| Flagship Credit Auto Trust 2021-2 | |||||||
| 1,000,000 | 1.270%, 06/15/2027 | 933,642 | |||||
| HERO Funding Trust 2021-1 | |||||||
| 586,611 | 2.240%, 09/20/2051 | 510,943 | |||||
| Libra Solutions 2023-1 LLC | |||||||
| 1,487,569 | 7.000%, 02/15/2035 | 1,484,726 | |||||
| MVW 2021-1W LLC | |||||||
| 253,058 | 1.440%, 01/22/2041 | 231,089 | |||||
| Navigator Aircraft ABS Ltd. | |||||||
| 2,128,646 | 2.771%, 11/15/2046 10 | 1,843,296 | |||||
| Nyctl 2021-A Trust 2021-A | |||||||
| 321,277 | 2.100%, 11/10/2034 | 309,314 | |||||
| Progress Residential 2021-SFR1 | |||||||
| 500,000 | 1.555%, 04/17/2038 | 438,182 | |||||
| Santander Drive Auto | |||||||
| Receivables Trust 2019-2 | |||||||
| 875,234 | 3.220%, 07/15/2025 | 870,627 | |||||
| Santander Drive Auto | |||||||
| Receivables Trust 2021-2 | |||||||
| 1,000,000 | 1.350%, 07/15/2027 | 943,816 | |||||
| Stonepeak 2021-1 ABS 2021-1 | |||||||
| 706,813 | 2.301%, 02/28/2033 | 653,307 | |||||
| Thrust Engine Leasing 2021 DAC | |||||||
| 1,849,554 | 4.163%, 07/15/2040 | 1,535,976 | |||||
| Triton Container Finance VIII LLC | |||||||
| 1,660,000 | 1.860%, 03/20/2046 | 1,427,546 | |||||
| Westlake Automobile | |||||||
| Receivables Trust 2019-2 | |||||||
| 965,000 | 4.020%, 04/15/2025 | 962,238 | |||||
| Westlake Automobile | |||||||
| Receivables Trust 2020-1 | |||||||
| 24,391 | 2.520%, 04/15/2025 | 24,361 | |||||
| Westlake Automobile | |||||||
| Receivables Trust 2020-3 | |||||||
| 87,000 | 1.240%, 11/17/2025 | 85,491 | |||||
| 21,716,228 | |||||||
| Total Asset Backed Securities | |||||||
| (Cost $23,358,332) | 21,716,228 | ||||||
| Commercial Mortgage-Backed Securities: 1.4% | |||||||
| BX Commercial Mortgage | |||||||
| Trust 2021-VOLT | |||||||
| Series BX 2021-VOLT C | |||||||
| 1,000,000 | 5.784% (1 Month LIBOR | ||||||
USD + 1.100%), 09/15/2036 2 | 944,441 | ||||||
| Life 2021-BMR Mortgage Trust | |||||||
| Series LIFE 2021-BMR C | |||||||
| 982,970 | 6.041% (1 Month LIBOR | ||||||
USD + 1.214%), 03/15/2038 2 | 935,454 | ||||||
| 1,879,895 | |||||||
| Total Commercial Mortgage-Backed Securities | |||||||
| (Cost $1,982,970) | 1,879,895 | ||||||
The accompanying Notes to Financial Statements are an integral part of these financial statements.
31
Total Return Fund | Schedule of Investments at March 31, 2023 (Continued)
| Principal | |||||||
| Amount | Value | ||||||
| Mortgage Backed Securities: 34.6% | |||||||
| Federal Home Loan Mortgage | |||||||
| Corporation: 11.6% | |||||||
| FR SD1900 | |||||||
| $ | 4,088,706 | 3.500%, 06/01/2052 | $ | 3,820,883 | |||
| FR SD8258 | |||||||
| 6,915,108 | 5.000%, 10/01/2052 | 6,898,267 | |||||
| FR SD1884 | |||||||
| 4,750,926 | 5.000%, 11/01/2052 | 4,739,356 | |||||
| 15,458,506 | |||||||
| Federal Home Loan Mortgage | |||||||
| Corporation REMICS: 1.9% | |||||||
| Series FHR 2512 SI | |||||||
| 73,529 | 2.816% (1 Month LIBOR | ||||||
USD + 7.500%), 04/15/2024 2,3,8 | 773 | ||||||
| Series FHR 4048 IK | |||||||
| 1,516,608 | 3.000%, 05/15/2027 3 | 59,736 | |||||
| Series FHR 4093 DS | |||||||
| 3,178,125 | 1.616% (1 Month LIBOR | ||||||
USD + 6.300%), 08/15/2027 2,3,8 | 106,579 | ||||||
| Series FHR 4216 EI | |||||||
| 1,853,195 | 3.000%, 06/15/2028 3 | 97,326 | |||||
| Series FHR 4360 BI | |||||||
| 770,344 | 2.500%, 11/15/2028 3 | 19,682 | |||||
| Series FHR 4341 MI | |||||||
| 1,001,561 | 4.000%, 11/15/2031 3 | 83,081 | |||||
| Series FHR 4093 IB | |||||||
| 1,208,488 | 4.000%, 08/15/2032 3 | 108,320 | |||||
| Series FHR 4114 MI | |||||||
| 1,549,631 | 3.500%, 10/15/2032 3 | 146,610 | |||||
| Series FHR 4170 IU | |||||||
| 2,435,027 | 3.000%, 02/15/2033 3 | 209,046 | |||||
| Series FHR 3171 OJ | |||||||
| 710,420 | N/A%, 06/15/2036 4,5 | 574,978 | |||||
| Series FHR 3824 LS | |||||||
| 461,405 | 2.416% (1 Month LIBOR | ||||||
USD + 7.100%), 08/15/2036 2,3,8 | 58,243 | ||||||
| Series FHR 3236 KF | |||||||
| 57,127 | 4.984% (1 Month LIBOR | ||||||
USD + 0.300%), 11/15/2036 2 | 56,036 | ||||||
| Series FHR 3339 JS | |||||||
| 26,665 | 12.386% (1 Month LIBOR | ||||||
USD + 42.835%), 07/15/2037 2,8 | 36,988 | ||||||
| Series FHR 3380 FM | |||||||
| 134,358 | 5.274% (1 Month LIBOR | ||||||
USD + 0.590%), 10/15/2037 2 | 133,344 | ||||||
| Series FHR 3721 FB | |||||||
| 105,859 | 5.184% (1 Month LIBOR | ||||||
USD + 0.500%), 09/15/2040 2 | 104,567 | ||||||
| Series FHR 4105 LS | |||||||
| 1,980,283 | 1.466% (1 Month LIBOR | ||||||
USD + 6.150%), 08/15/2041 2,3,8 | 72,378 | ||||||
| Series FHR 3933 QS | |||||||
| 1,486,555 | 1.366% (1 Month LIBOR | ||||||
USD + 6.050%), 10/15/2041 2,3,8 | 102,714 | ||||||
| Series FHR 4340 US | |||||||
| 996,494 | 1.916% (1 Month LIBOR | ||||||
USD + 6.600%), 05/15/2042 2,3,8 | 145,062 | ||||||
| Series FHR 4076 LF | |||||||
| 138,555 | 4.984% (1 Month LIBOR | ||||||
USD + 0.300%), 07/15/2042 2 | 135,718 | ||||||
| Series FHR 4495 PI | |||||||
| 174,364 | 4.000%, 09/15/2043 3 | 14,736 | |||||
| Series FHR 4313 CS | |||||||
| 1,918,566 | 1.366% (1 Month LIBOR | ||||||
USD + 6.050%), 03/15/2044 2,3,8 | 201,891 | ||||||
| Series FHR 4911 IH | |||||||
| 638,494 | 4.000%, 04/15/2049 3 | 50,306 | |||||
| 2,518,114 | |||||||
| Federal Home Loan Mortgage | |||||||
| Corporation Strips: 0.2% | |||||||
| Series FHS 288 IO | |||||||
| 1,046,465 | 3.000%, 10/15/2027 3 | 47,105 | |||||
| Series FHS 272 F2 | |||||||
| 196,700 | 5.234% (1 Month LIBOR | ||||||
USD + 0.550%), 08/15/2042 2 | 192,848 | ||||||
| 239,953 | |||||||
| Federal National Mortgage | |||||||
| Association Interest Strips: 0.3% | |||||||
| Pool FNS 419 C1 | |||||||
| 2,211,493 | 2.500%, 09/25/2028 3 | 97,371 | |||||
| Pool FNS 419 C2 | |||||||
| 2,607,497 | 3.000%, 05/25/2029 3 | 124,615 | |||||
| Pool FNS 421 C4 | |||||||
| 1,019,329 | 4.500%, 01/25/2030 3 | 72,749 | |||||
| Pool FNS 421 C3 | |||||||
| 77,201 | 4.000%, 07/25/2030 3 | 5,687 | |||||
| Pool FNS 387 7 | |||||||
| 302,148 | 5.500%, 04/25/2038 3 | 88,702 | |||||
| 389,124 | |||||||
| Federal National Mortgage | |||||||
| Association Pool: 14.6% | |||||||
| FN AL2519 | |||||||
| 633,947 | 4.500%, 07/01/2040 | 637,485 | |||||
| FN AS5460 | |||||||
| 606,667 | 3.500%, 07/01/2045 | 572,335 | |||||
| FN AS6520 | |||||||
| 807,313 | 3.500%, 01/01/2046 | 759,756 | |||||
| FN MA3101 | |||||||
| 652,529 | 4.500%, 08/01/2047 | 650,329 | |||||
| FN FS2991 | |||||||
| 6,842,812 | 3.000%, 07/01/2051 | 6,147,200 | |||||
The accompanying Notes to Financial Statements are an integral part of these financial statements.
32
Total Return Fund | Schedule of Investments at March 31, 2023 (Continued)
| Principal | |||||||
| Amount | Value | ||||||
| Federal National Mortgage | |||||||
| Association Pool: 14.6% (Continued) | |||||||
| FN MA4805 | |||||||
| $ | 7,814,671 | 4.500%, 11/01/2052 | $ | 7,655,569 | |||
| FN MA4841 | |||||||
| 3,118,786 | 5.000%, 12/01/2052 | 3,111,592 | |||||
| 19,534,266 | |||||||
| Federal National Mortgage | |||||||
| Association REMICS: 3.4% | |||||||
| Series FNR 1996-45 SI | |||||||
| 42,845 | 2.405% (1 Month LIBOR | ||||||
USD + 7.250%), 02/25/2024 2,3,8 | 359 | ||||||
| Series FNR 1997-65 SI | |||||||
| 319,267 | 3.291% (1 Month LIBOR | ||||||
USD + 8.000%), 09/17/2027 2,3,8 | 12,769 | ||||||
| Series FNR 2012-139 DI | |||||||
| 2,383,915 | 3.000%, 12/25/2027 3 | 89,130 | |||||
| Series FNR 2013-29 BI | |||||||
| 3,000,510 | 2.500%, 04/25/2028 3 | 131,256 | |||||
| Series FNR 2015-34 AI | |||||||
| 9,421 | 4.500%, 06/25/2030 2,3 | 5 | |||||
| Series FNR 2010-119 PS | |||||||
| 1,829,079 | 1.855% (1 Month LIBOR | ||||||
USD + 6.700%), 09/25/2030 2,3,8 | 89,274 | ||||||
| Series FNR 2016-8 CI | |||||||
| 4,597,473 | 3.000%, 03/25/2031 3 | 300,566 | |||||
| Series FNR 2013-51 PI | |||||||
| 1,726,546 | 3.000%, 11/25/2032 3 | 152,987 | |||||
| Series FNR 2014-81 TI | |||||||
| 291,923 | 4.500%, 12/25/2034 3 | 24,487 | |||||
| Series FNR 2016-24 IB | |||||||
| 3,778,980 | 3.500%, 05/25/2036 3 | 397,056 | |||||
| Series FNR 2007-2 FT | |||||||
| 139,544 | 5.095% (1 Month LIBOR | ||||||
USD + 0.250%), 02/25/2037 2 | 136,148 | ||||||
| Series FNR 2016-78 CS | |||||||
| 2,275,350 | 1.255% (1 Month LIBOR | ||||||
USD + 6.100%), 05/25/2039 2,3,8 | 175,437 | ||||||
| Series FNR 2012-82 PS | |||||||
| 1,388,278 | 1.255% (1 Month LIBOR | ||||||
USD + 6.100%), 08/25/2041 2,3,8 | 49,935 | ||||||
| Series FNR 2011-100 S | |||||||
| 2,601,289 | 1.605% (1 Month LIBOR | ||||||
USD + 6.450%), 10/25/2041 2,3,8 | 296,814 | ||||||
| Series FNR 2012-15 SW | |||||||
| 2,892,618 | 1.105% (1 Month LIBOR | ||||||
USD + 5.950%), 03/25/2042 2,3,8 | 307,099 | ||||||
| Series FNR 2012-79 FM | |||||||
| 108,833 | 5.295% (1 Month LIBOR | ||||||
USD + 0.450%), 07/25/2042 2 | 106,213 | ||||||
| Series FNR 2012-128 ST | |||||||
| 1,019,985 | 1.305% (1 Month LIBOR | ||||||
USD + 6.150%), 11/25/2042 2,3,8 | 172,749 | ||||||
| Series FNR 2013-22 TO | |||||||
| 331,991 | N/A%, 03/25/2043 4,5 | 222,613 | |||||
| Series FNR 2013-20 QS | |||||||
| 3,996,191 | 1.305% (1 Month LIBOR | ||||||
USD + 6.150%), 03/25/2043 2,3,8 | 485,812 | ||||||
| Series FNR 2014-37 PI | |||||||
| 615,680 | 5.500%, 06/25/2044 3 | 68,138 | |||||
| Series FNR 2014-50 WS | |||||||
| 415,196 | 1.355% (1 Month LIBOR | ||||||
USD + 6.200%), 08/25/2044 2,3,8 | 28,360 | ||||||
| Series FNR 2016-83 BS | |||||||
| 329,463 | 1.255% (1 Month LIBOR | ||||||
USD + 6.100%), 11/25/2046 2,3,8 | 29,112 | ||||||
| Series FNR 2018-51 IO | |||||||
| 421,305 | 6.500%, 07/25/2048 3 | 54,158 | |||||
| Series FNR 2019-41 SB | |||||||
| 1,089,587 | 1.205% (1 Month LIBOR | ||||||
USD + 6.050%), 08/25/2049 2,3,8 | 128,534 | ||||||
| Series FNR 2020-88 QI | |||||||
| 10,780,780 | 2.000%, 05/25/2050 3 | 1,063,664 | |||||
| 4,522,675 | |||||||
| Goldman Sachs Mortgage-Backed | |||||||
| Securities Corp Trust: 0.3% | |||||||
| Series GSMBS 2020-PJ4 A2 | |||||||
| 484,029 | 3.000%, 01/25/2051 | 415,271 | |||||
| Government National | |||||||
| Mortgage Association: 0.5% | |||||||
| Series GNR 2014-74 GI | |||||||
| 92,759 | 4.000%, 05/16/2029 3 | 2,428 | |||||
| Series GNR 2010-47 BX | |||||||
| 237,268 | 1.822% (1 Month LIBOR | ||||||
USD + 6.550%), 08/16/2034 2,3,8 | 9,505 | ||||||
| Series GNR 2011-61 WS | |||||||
| 2,790,217 | 1.709% (1 Month LIBOR | ||||||
USD + 6.470%), 02/20/2038 2,3,8 | 107,416 | ||||||
| Series GNR 2010-6 FG | |||||||
| 100,183 | 5.328% (1 Month LIBOR | ||||||
USD + 0.600%), 01/16/2040 2 | 100,094 | ||||||
| Series GNR 2016-31 CS | |||||||
| 3,264,186 | 1.489% (1 Month LIBOR | ||||||
USD + 6.250%), 07/20/2044 2,3,8 | 374,904 | ||||||
| Series GNR 2016-112 WI | |||||||
| 4,113,070 | N/A%, 03/20/2045 3,4 | 64,591 | |||||
| 658,938 | |||||||
| JP Morgan Mortgage Trust: 0.3% | |||||||
| Series JPMMT 2014-IVR3 3A1 | |||||||
| 160,522 | 3.167%, 09/25/2044 | 157,926 | |||||
| Series JPMMT 2020-7 A3 | |||||||
| 323,241 | 3.000%, 01/25/2051 | 278,128 | |||||
| 436,054 | |||||||
The accompanying Notes to Financial Statements are an integral part of these financial statements.
33
Total Return Fund | Schedule of Investments at March 31, 2023 (Continued)
| Principal | |||||||
| Amount | Value | ||||||
| RCKT Mortgage Trust | |||||||
| 2021-6 – 0: 1.1% | |||||||
| Series RCKT 2021-6 A1 | |||||||
| $ | 1,821,234 | 2.500%, 12/25/2051 | $ | 1,482,516 | |||
| Wells Fargo Mortgage Backed | |||||||
| Securities Trust: 0.4% | |||||||
| Series WFMBS 2019-4 A17 | |||||||
| 54,703 | 3.500%, 09/25/2049 | 48,788 | |||||
| Series WFMBS 2020-3 A3 | |||||||
| 136,011 | 3.000%, 06/25/2050 | 129,539 | |||||
| Series WFMBS 2020-4 A1 | |||||||
| 437,297 | 3.000%, 07/25/2050 | 376,266 | |||||
| 554,593 | |||||||
| Total Mortgage Backed Securities | |||||||
| (Cost $50,013,592) | 46,210,010 | ||||||
| United States Government Securities: 18.5% | |||||||
| United States Treasury Notes/Bonds | |||||||
| 6,000,000 | 3.500%, 02/15/2033 | 6,005,156 | |||||
| 2,000,000 | 1.375%, 09/30/2023 | 1,967,657 | |||||
| 5,000,000 | 0.375%, 10/31/2023 | 4,875,723 | |||||
| 2,500,000 | 2.000%, 11/15/2041 | 1,885,352 | |||||
| 4,000,000 | 3.000%, 11/15/2044 | 3,484,063 | |||||
| 4,000,000 | 3.000%, 02/15/2047 | 3,472,812 | |||||
| 3,000,000 | 3.625%, 02/15/2053 | 2,966,484 | |||||
| 24,657,247 | |||||||
| Total United States Government Securities | |||||||
| (Cost $24,608,043) | 24,657,247 | ||||||
| Total Bonds | |||||||
| (Cost $124,959,347) | 118,536,954 | ||||||
| Short-Term Investments: 12.4% | |||||||
| United States Government Securities: 4.4% | |||||||
| United States Treasury Bills | |||||||
| 5,000,000 | 4.689%, 06/29/2023 7 | 4,944,039 | |||||
| 1,000,000 | 4.456%, 10/05/2023 7 | 976,271 | |||||
| Total United States Government Securities | |||||||
| (Cost $5,921,169) | 5,920,310 | ||||||
| Shares | |||||||
| Money Market Funds: 8.0% | |||||||
| 10,707,381 | Morgan Stanley Institutional | ||||||
| Liquidity Funds – Government | |||||||
Portfolio, 4.730% 6 | 10,707,381 | ||||||
| Total Money Market Funds | |||||||
| (Cost $10,707,381) | 10,707,381 | ||||||
| Total Short-Term Investments | |||||||
| (Cost $16,628,550) | 16,627,691 | ||||||
| Total Investments in Securities: 101.3% | |||||||
| (Cost $141,587,898) | 135,164,646 | ||||||
| Liabilities in Excess of Other Assets: (1.3)% | (1,728,309 | ) | |||||
| Total Net Assets: 100.0% | $ | 133,436,337 | |||||
CMT – Constant Maturity Treasury Rate
LIBOR – London Interbank Offered Rate
SOFR – Secured Overnight Financing Rate
USD – United States Dollar
1 | Perpetual call date security. Date shown is next call date. |
2 | Variable rate security; rate shown is the rate in effect on March 31, 2023. |
3 | Interest only security. |
4 | Zero coupon security. |
5 | Principal only security. |
6 | Annualized seven-day effective yield as of March 31, 2023. |
7 | Rate represents the yield to maturity from purchase price. |
8 | Inverse floating rate security. Reference interest rates are typically based on a negative multiplier or slope. Interest rate may also be subject to a ceiling or floor. |
9 | Fixed-to-variable or fixed-to float bond; rate shown is the rate in effect on March 31, 2023. |
10 | Step-up bond. The interest rate will step up if the issuer does not redeem the bond by an expected redemption date. The interest rate shown is the rate in effect as of March 31, 2023. |
11 | Security is fair valued under the Board of Trustees and is categorized as a Level 3 security. Significant unobservable inputs were used to determine fair value. |
The Global Industry Classifications Standard (GICS®) sector and industry classifications was developed by and is the exclusive property of MSCI, Inc. and Standard & Poor’s (“S&P”). GICS® is a service mark of MSCI, Inc. and S&P and has been licensed for use by the Osterweis Capital Management.
The accompanying Notes to Financial Statements are an integral part of these financial statements.
34
Short Duration Credit Fund | Portfolio Managers’ Review
Performance Summary
For the eleven-month period ending March 31, 2023, the Osterweis Short Duration Credit Fund (the Fund) generated a total return of -4.53% versus 2.68% for the Fund’s current benchmark, the ICE BofA 0-2 Yr BB-B U.S. High Yield Index (ICE BofA 0-2 Yr) and -1.03% for the Fund’s former benchmark, the Bloomberg U.S. Aggregate Bond Index (the Agg) over the same period. (Please see standardized performance in the table following this review.)
Market Review
The past year was a difficult stretch in the fixed income markets. The first two fiscal quarters were particularly bearish, as the Fed’s aggressive anti-inflation tightening program put steady downward pressure on bonds. Sentiment improved in the third fiscal quarter, as inflation data softened and investors began to anticipate a Fed pivot. The rally continued during the fourth fiscal quarter, despite substantial turmoil in the banking sector, but the gains from the second half of the year were not large enough to overcome the sharp declines of the first half.
Portfolio Review
For the eleven months ending March 31, 2023, the Fund trailed both benchmarks. The underperformance versus the broad market was driven by the portfolio’s exposure to lower-rated bonds and sector allocation, which was partially offset by our floating rate loan exposure and the short duration nature of the portfolio. The trend of refinancings in the credit markets in the prior two years shifted short duration opportunities toward secured debt (e.g., floating rate loans) and lower-rated bonds yet to refinance. For the latter, attractive fundamentals could be found with more in-depth analysis, but as the market concerns around inflation, supply chain challenges, and limited new issuance in the high yield credit market developed, this portion of the portfolio underperformed.
Sector allocation also played a role in the underperformance as high-beta sectors like Energy, Gaming, and Aerospace & Defense were some of the best-performing in the broader markets, and due to our focus on sustainability we have historically avoided these sectors. The portfolio benefited from our exposure to floating rate loans, one of the best performing asset classes during this period, and the short duration nature of our holdings, which mitigated market sensitivity as expected.
Outlook & Portfolio Positioning
The markets looking forward are not pointing toward less uncertainty anytime soon. Between Fed decisions on interest rates, bank failures, and debt ceiling negotiations, there is no shortage of near-term event catalysts with a complicated economic picture as a backdrop. Labor markets and consumer demand remain strong enough that a soft landing may yet occur (bullish), but the Fed may interpret the same data to keep rates elevated or go even higher, making a recession more likely (bearish).
As a result, we continue to focus on issuer fundamentals to drive investment decisions. With potential for significant market moves in both directions, we are also focused on mitigating sensitivity to market sentiment. We believe it prudent to prioritize portfolio characteristics such as income and volatility management, which reduce market beta and align with an “absolute return” mindset. We have also positioned ourselves to capitalize on the extraordinary opportunities found in misunderstood, mispriced, and misrated securities in today’s markets.
____________________
Mutual fund investing involves risk. Principal loss is possible.
The Osterweis Short Duration Credit Fund may invest in debt securities that are un-rated or rated below investment grade. Lower-rated securities may present an increased possibility of default, price volatility, or illiquidity compared to higher-rated securities. Investments in debt securities typically decrease in value when interest rates rise. This risk is usually greater for longer-term debt securities. The Fund may invest more than 5% of its total assets in the securities of one or more issuers. Fundamental investing that integrates sustainability factors will entail deviations from the benchmark, potentially without resulting in favorable Environmental, Social, or Governance (ESG) outcomes.
35
Short Duration Credit Fund | Fund Overview
| Average Annual Total Returns | |||||
Periods Ended March 31, 2023 1 | |||||
| Since Inception | |||||
| 1 Yr. | 3 Yr. | 5 Yr. | 10 Yr. | (May 31, 2011) | |
| Osterweis Short Duration Credit Fund | -6.75% | 2.64% | 0.64% | 1.78% | 1.98% |
| Bloomberg U.S. Aggregate Bond Index | -4.78 | -2.77 | 0.91 | 1.36 | 1.89 |
| ICE BofA 0-2Yr Duration BB-B High Yield | |||||
| Constrained Index | 1.74 | 4.36 | 2.78 | 3.26 | 3.65 |
Gross Expense Ratio as of 10/10/2022: 0.85% 2
1 | The information shown reflects the historical performance of the Zeo Short Duration Income Fund (the “Predecessor Fund”), a series of Northern Lights Fund Trust. Effective as of the close of business day on October 7, 2022, the Predecessor Fund reorganized into the Osterweis Short Duration Credit Fund. |
2 | As of most recent Prospectus dated October 10, 2022. Please see the Fund’s Financial Highlights in this report for the most recent expense ratio. |
The performance data quoted above represents past performance. Past performance does not guarantee future results. The investment return and principal value of an investment will fluctuate so that an investor’s shares, when redeemed, may be worth more or less than their original cost. Current performance of the Fund may be lower or higher than the performance quoted. Performance data current to the most recent month-end may be obtained by calling (866) 236-0050.
Growth of $10K (Inception to 3/31/2023) (Unaudited)

This chart illustrates the performance of a hypothetical $10,000 investment made on May 31, 2011 and is not intended to imply any future performance. The returns shown do not reflect the deduction of taxes that a shareholder would pay on Fund distributions or the redemption of Fund shares. The returns reflect fee waivers in effect. In the absence of such waivers, total return would be reduced (See Note 3). The chart assumes reinvestment of capital gains, dividends and return of capital, if applicable, for the Fund and dividends for an index.
Asset Allocation (% of Net Assets) (Unaudited)
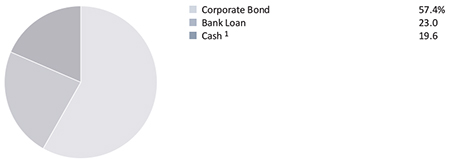
1 | Cash, cash equivalents and other assets less liabilities. |
36
Short Duration Credit Fund | Schedule of Investments at March 31, 2023
| Principal | |||||||
| Amount | Value | ||||||
| Bonds: 57.4% | |||||||
| Corporate Bonds: 57.4% | |||||||
| Air Freight & Logistics: 3.1% | |||||||
| Western Global Airlines LLC | |||||||
| $ | 13,325,000 | 10.375%, 08/15/2025 | $ | 5,451,657 | |||
| Automobile Components: 2.0% | |||||||
| Patrick Industries, Inc. | |||||||
| 3,482,000 | 7.500%, 10/15/2027 | 3,452,594 | |||||
| Commercial Services & Supplies: 4.5% | |||||||
| Cimpress PLC | |||||||
| 9,585,000 | 7.000%, 06/15/2026 | 7,841,153 | |||||
| Computers & Peripherals: 2.1% | |||||||
| Diebold Nixdorf, Inc. | |||||||
| 14,640,407 | 8.500% Cash or 8.500% | ||||||
PIK, 10/15/2026 1 | 3,737,989 | ||||||
| Construction & Engineering: 3.3% | |||||||
| Brundage-Bone Concrete | |||||||
| Pumping Holdings, Inc. | |||||||
| 4,558,000 | 6.000%, 02/01/2026 | 4,278,708 | |||||
| Great Lakes Dredge & Dock Corp. | |||||||
| 1,847,000 | 5.250%, 06/01/2029 | 1,398,364 | |||||
| 5,677,072 | |||||||
| Consumer Finance: 7.0% | |||||||
| Bread Financial Holdings, Inc. | |||||||
| 1,940,000 | 4.750%, 12/15/2024 | 1,740,040 | |||||
| 6,658,000 | 7.000%, 01/15/2026 | 5,878,661 | |||||
| PRA Group, Inc. | |||||||
| 4,560,000 | 7.375%, 09/01/2025 | 4,544,659 | |||||
| 12,163,360 | |||||||
| Diversified Consumer Services: 5.9% | |||||||
| Cengage Learning, Inc. | |||||||
| 10,598,000 | 9.500%, 06/15/2024 | 10,256,744 | |||||
| Food Products: 2.4% | |||||||
| B&G Foods, Inc. | |||||||
| 4,817,000 | 5.250%, 09/15/2027 | 4,135,250 | |||||
| Hotels, Restaurants & Leisure: 2.2% | |||||||
| Arrow Bidco LLC | |||||||
| 3,821,000 | 9.500%, 03/15/2024 | 3,825,394 | |||||
| Household Durables: 5.2% | |||||||
| American Greetings Corp. | |||||||
| 9,183,000 | 8.750%, 04/15/2025 | 9,076,477 | |||||
| Interactive Media & Services: 6.2% | |||||||
| Getty Images, Inc. | |||||||
| 7,127,000 | 9.750%, 03/01/2027 | 7,128,069 | |||||
| Millennium Escrow Corp. | |||||||
| 5,564,000 | 6.625%, 08/01/2026 | 3,623,611 | |||||
| 10,751,680 | |||||||
| IT Services: 1.3% | |||||||
| Virtusa Corp. | |||||||
| 2,797,000 | 7.125%, 12/15/2028 | 2,201,441 | |||||
| Machinery: 4.9% | |||||||
| The Manitowoc Co., Inc. | |||||||
| 3,118,000 | 9.000%, 04/01/2026 | 3,125,998 | |||||
| Werner FinCo L.P. / Werner FinCo, Inc. | |||||||
| 6,706,000 | 8.750%, 07/15/2025 | 5,441,114 | |||||
| 8,567,112 | |||||||
| Software: 1.4% | |||||||
| Veritas U.S., Inc / Veritas Bermuda Ltd. | |||||||
| 3,244,000 | 7.500%, 09/01/2025 | 2,447,562 | |||||
| Specialty Retail: 4.8% | |||||||
| At Home Group, Inc. | |||||||
| 1,976,000 | 4.875%, 07/15/2028 | 1,341,190 | |||||
| The Michaels Cos., Inc. | |||||||
| 6,338,000 | 5.250%, 05/01/2028 | 5,288,871 | |||||
| 2,428,000 | 7.875%, 05/01/2029 | 1,710,223 | |||||
| 8,340,284 | |||||||
| Textiles, Apparel & Luxury Goods: 1.1% | |||||||
| Hanesbrands, Inc. | |||||||
| 2,000,000 | 4.875%, 05/15/2026 | 1,897,440 | |||||
| Total Corporate Bonds | |||||||
| (Cost $127,264,012) | 99,823,209 | ||||||
| Total Bonds | |||||||
| (Cost $127,264,012) | 99,823,209 | ||||||
| Bank Loans: 23.0% | |||||||
| Beverages: 3.3% | |||||||
| 6,416,070 | Chill Merger Sub, Inc. | ||||||
| 8.659% (1 month | |||||||
LIBOR + 3.500%), 3/20/2024 1,2 | 5,815,237 | ||||||
| Commercial Services & Supplies: 0.8% | |||||||
| LRS Holdings LLC | |||||||
| 1,427,925 | 9.090% (1 month | ||||||
LIBOR + 4.250%), 8/31/2028 1,2 | 1,399,366 | ||||||
| Diversified Consumer Services: 2.3% | |||||||
| APX Group, Inc. | |||||||
| 3,940,000 | 10.250% (Prime + | ||||||
2.250%), 7/09/2028 1,2 | 3,928,397 | ||||||
The accompanying Notes to Financial Statements are an integral part of these financial statements.
37
Short Duration Credit Fund | Schedule of Investments at March 31, 2023 (Continued)
| Principal | |||||||
| Amount | Value | ||||||
| Machinery: 1.0% | |||||||
| Werner FinCo L.P. | |||||||
| $ | 1,808,720 | 9.159% (2 months | |||||
LIBOR + 4.000%), 7/24/2024 1,2 | $ | 1,703,028 | |||||
| Software: 14.2% | |||||||
| A&V Holdings Midco LLC | |||||||
| 2,385,738 | 10.534% (6 months | ||||||
LIBOR + 5.375%), 3/10/2027 1,2 | 2,352,934 | ||||||
| Hyland Software, Inc. | |||||||
| 3,281,213 | 8.340% (1 month | ||||||
LIBOR + 3.500%), 7/01/2024 1,2 | 3,251,124 | ||||||
| 12,892,000 | 11.090% (1 month | ||||||
LIBOR + 6.250%), 7/10/2025 1,2 | 12,376,320 | ||||||
| Magenta Buyer LLC | |||||||
| 4,572,125 | 9.580% (3 months | ||||||
LIBOR + 4.750%), 7/27/2028 1,2 | 3,786,702 | ||||||
| Veritas U.S., Inc. | |||||||
| 3,716,914 | 9.840% (3 months | ||||||
LIBOR + 5.000%), 9/01/2025 1,2 | 2,842,399 | ||||||
| 24,609,479 | |||||||
| Specialty Retail: 1.4% | |||||||
| At Home Group, Inc. | |||||||
| 3,202,463 | 9.004% (3 months | ||||||
LIBOR + 4.250%), 7/23/2028 1,2 | 2,512,477 | ||||||
| Total Bank Loans | |||||||
| (Cost $43,346,705) | 39,967,984 | ||||||
| Shares | |||||||
| Short-Term Investments: 18.6% | |||||||
| Money Market Funds: 18.6% | |||||||
| 32,418,396 | U.S. Bank Money Market | ||||||
Deposit Account, 4.480% 3 | 32,418,396 | ||||||
| Total Money Market Funds | |||||||
| (Cost $32,418,396) | 32,418,396 | ||||||
| Total Short-Term Investments | |||||||
| (Cost $32,418,396) | 32,418,396 | ||||||
| Total Investments in Securities: 99.0% | |||||||
| (Cost $203,029,113) | 172,209,589 | ||||||
| Other Assets in Excess of Liabilities: 1.0% | 1,688,174 | ||||||
| Total Net Assets: 100.0% | $ | 173,897,763 | |||||
LIBOR – London Interbank Offered Rate
PIK – Payment-in-Kind
PRIME – United States Federal Reserve Overnight Rate
1 | Variable rate security; rate shown is the rate in effect on March 31, 2023. |
2 | Bank loans generally pay interest at rates which are periodically determined by reference to a base lending rate plus a premium. All loans carry a variable rate of interest. These base lending rates are generally (i) the Prime Rate offered by one or more major United States banks, (ii) the lending rate offered by one or more European banks such as the London Interbank Offered Rate (“LIBOR”) or (iii) the Certificate of Deposit rate. Bank Loans, while exempt from registration, under the Securities Act of 1933, contain certain restrictions on resale and cannot be sold publicly. Floating rate bank loans often require prepayments from excess cash flow or permit the borrower to repay at its election. The degree to which borrowers repay, whether as a contractual requirement or at their election, cannot be predicted with accuracy. |
3 | The Money Market Deposit Account (the “MMDA”) is a short-term investment vehicle in which the Fund holds cash balances. The MMDA will bear interest at a variable rate that is determined based on conditions and may change daily and by any amount. The rate shown is as of March 31, 2023. |
The Global Industry Classifications Standard (GICS®) sector and industry classifications was developed by and is the exclusive property of MSCI, Inc. and Standard & Poor’s (“S&P”). GICS® is a service mark of MSCI, Inc. and S&P and has been licensed for use by the Osterweis Capital Management.
The accompanying Notes to Financial Statements are an integral part of these financial statements.
38
Sustainable Credit Fund | Portfolio Managers’ Review
Performance Summary
For the eleven-month period ending March 31, 2023, the Osterweis Sustainable Credit Fund (the Fund) generated a total return of -4.56% versus -0.47% for the Fund’s current benchmark, the ICE BofA Single-B U.S. High Yield Index (ICE BofA Single-B) and -1.03% for the Fund’s former benchmark, the Bloomberg U.S. Aggregate Bond Index (the Agg) over the same period. (Please see standardized performance in the table following this review.)
Market Review
The past year was a difficult stretch in the fixed income markets. The first two fiscal quarters were particularly bearish, as the Fed’s aggressive anti-inflation tightening program put steady downward pressure on bonds. Sentiment improved in the third fiscal quarter, as inflation data softened and investors began to anticipate a Fed pivot. The rally continued during the fourth fiscal quarter, despite substantial turmoil in the banking sector, but the gains from the second half of the year were not large enough to overcome the sharp declines of the first half.
Portfolio Review
For the eleven months ending March 31, 2023, the Fund trailed both benchmarks. The underperformance versus the broad market was driven by the portfolio’s exposure to lower-rated bonds and sector allocation, which was partially offset by our floating rate loan exposure and a decision to keep the portfolio’s duration short. The trend of refinancings in the credit markets in the prior two years shifted opportunities toward longer duration low coupon bonds, secured debt (e.g., floating rate loans), and lower-rated short duration bonds yet to refinance. For the latter, attractive fundamentals could be found with more in-depth analysis, but as the market concerns around inflation, supply chain challenges, and limited new issuance in the high yield credit market developed, this portion of the portfolio underperformed.
Sector allocation also played a role in the underperformance as high-beta sectors like Energy, Gaming, and Aerospace & Defense were some of the best-performing in the broader markets, and due to our focus on sustainability we have historically avoided these sectors. Benefitting the portfolio was our exposure to floating rate loans, one of the best performing asset classes during this period, and the shorter duration of the portfolio at this time, which mitigated market sensitivity.
Outlook & Portfolio Positioning
The markets looking forward are not pointing toward less uncertainty anytime soon. Between Fed decisions on interest rates, bank failures and debt ceiling negotiations, there is no shortage of near-term event catalysts with a complicated economic picture as a backdrop. Labor markets and consumer demand remain strong enough that a soft landing may yet occur (bullish), but the Fed may interpret the same data to keep rates elevated or go even higher, making a recession more likely (bearish).
As a result, we continue to focus on issuer fundamentals to drive investment decisions. With potential for significant market moves in both directions, we are also focused on mitigating sensitivity to market sentiment. We are cautious on duration, as we see the risk of higher long-term rates to be significant in the medium term. We believe it prudent to prioritize income and keep durations short to reduce directional market risk while still capitalizing on the extraordinary opportunities found in misunderstood, mispriced, and misrated securities in today’s markets.
____________________
Mutual fund investing involves risk. Principal loss is possible.
The Osterweis Sustainable Credit Fund may invest in debt securities that are un-rated or rated below investment grade. Lower-rated securities may present an increased possibility of default, price volatility, or illiquidity compared to higher-rated securities. Investments in debt securities typically decrease in value when interest rates rise. This risk is usually greater for longer-term debt securities. The Fund is non-diversified, meaning it concentrates its assets in fewer individual holdings than a diversified fund. The Fund may invest more than 5% of its total assets in the securities of one or more issuers. Fundamental investing that integrates sustainability factors will entail deviations from the benchmark, potentially without resulting in favorable Environmental, Social, or Governance (ESG) outcomes.
39
Sustainable Credit Fund | Fund Overview
| Average Annual Total Returns | |||
Periods Ended March 31, 2023 1 | |||
| Since Inception | |||
| 1 Yr. | 3 Yr. | (May 31, 2019) | |
| Osterweis Sustainable Credit Fund | -6.43% | 2.64% | -0.62% |
| Bloomberg U.S. Aggregate Bond Index | -4.78 | -2.77 | -0.43 |
| ICE BofA Single-B U.S. HY Index | -3.86 | 5.51 | 1.90 |
Gross/Net Expense Ratio as of 10/10/2022: 2.22%/0.99% 2,3
1 | The information shown reflects the historical performance of the Zeo Sustainable Credit Fund (the “Predecessor Fund”), a series of Northern Lights Fund Trust. Effective as of the close of business day on October 7, 2022, the Predecessor Fund reorganized into the Osterweis Sustainable Credit Fund. |
2 | As of most recent Prospectus dated October 10, 2022. Please see the Fund’s Financial Highlights in this report for the most recent expense ratio. |
3 | The Adviser has contractually agreed to waive certain fees through October 10, 2024. The net expense ratio is applicable to investors. |
The performance data quoted above represents past performance. Past performance does not guarantee future results. The investment return and principal value of an investment will fluctuate so that an investor’s shares, when redeemed, may be worth more or less than their original cost. Current performance of the Fund may be lower or higher than the performance quoted. Performance data current to the most recent month-end may be obtained by calling (866) 236-0050.
Growth of $10K (Inception to 3/31/2023) (Unaudited)

This chart illustrates the performance of a hypothetical $10,000 investment made on May 31, 2019 and is not intended to imply any future performance. The returns shown do not reflect the deduction of taxes that a shareholder would pay on Fund distributions or the redemption of Fund shares. The returns reflect fee waivers in effect. In the absence of such waivers, total return would be reduced (See Note 3). The chart assumes reinvestment of capital gains, dividends and return of capital, if applicable, for the Fund and dividends for an index.
Asset Allocation (% of Net Assets) (Unaudited)

1 | Cash, cash equivalents and other assets less liabilities. |
40
Sustainable Credit Fund | Schedule of Investments at March 31, 2023
| Principal | |||||||
| Amount | Value | ||||||
| Bonds: 51.4% | |||||||
| Corporate Bonds: 51.4% | |||||||
| Air Freight & Logistics: 3.2% | |||||||
| Western Global Airlines LLC | |||||||
| $ | 372,000 | 10.375%, 08/15/2025 | $ | 152,196 | |||
| Commercial Services & Supplies: 5.6% | |||||||
| Cimpress PLC | |||||||
| 329,000 | 7.000%, 06/15/2026 | 269,144 | |||||
| Computers & Peripherals: 2.0% | |||||||
| Diebold Nixdorf, Inc. | |||||||
| 379,517 | 8.500% Cash or 8.500% | ||||||
PIK, 10/15/2026 1 | 96,898 | ||||||
| Construction & Engineering: 3.5% | |||||||
| Great Lakes Dredge & Dock Corp. | |||||||
| 222,000 | 5.250%, 06/01/2029 | 168,076 | |||||
| Consumer Finance: 2.3% | |||||||
| Bread Financial Holdings, Inc. | |||||||
| 60,000 | 4.750%, 12/15/2024 | 53,816 | |||||
| 65,000 | 7.000%, 01/15/2026 | 57,391 | |||||
| 111,207 | |||||||
| Diversified Consumer Services: 5.9% | |||||||
| Cengage Learning, Inc. | |||||||
| 292,000 | 9.500%, 06/15/2024 | 282,598 | |||||
| Food Products: 1.8% | |||||||
| B&G Foods, Inc. | |||||||
| 100,000 | 5.250%, 09/15/2027 | 85,847 | |||||
| Hotels, Restaurants & Leisure: 2.0% | |||||||
| Arrow Bidco LLC | |||||||
| 94,000 | 9.500%, 03/15/2024 | 94,108 | |||||
| Household Durables: 5.8% | |||||||
| American Greetings Corp. | |||||||
| 282,000 | 8.750%, 04/15/2025 | 278,729 | |||||
| Interactive Media & Services: 3.9% | |||||||
| Getty Images, Inc. | |||||||
| 91,000 | 9.750%, 03/01/2027 | 91,013 | |||||
| Millennium Escrow Corp. | |||||||
| 149,000 | 6.625%, 08/01/2026 | 97,038 | |||||
| 188,051 | |||||||
| IT Services: 3.4% | |||||||
| Virtusa Corp. | |||||||
| 203,000 | 7.125%, 12/15/2028 | 159,776 | |||||
| Machinery: 4.8% | |||||||
| The Manitowoc Co., Inc. | |||||||
| 82,000 | 9.000%, 04/01/2026 | 82,210 | |||||
| Werner FinCo L.P. / Werner FinCo, Inc. | |||||||
| 183,000 | 8.750%, 07/15/2025 | 148,483 | |||||
| 230,693 | |||||||
| Software: 1.9% | |||||||
| Veritas U.S., Inc / Veritas Bermuda Ltd. | |||||||
| 121,000 | 7.500%, 09/01/2025 | 91,293 | |||||
| Specialty Retail: 5.3% | |||||||
| The Michaels Cos., Inc | |||||||
| 161,000 | 5.250%, 05/01/2028 | 134,350 | |||||
| The Michaels Cos., Inc. | |||||||
| 172,000 | 7.875%, 05/01/2029 | 121,152 | |||||
| 255,502 | |||||||
| Total Corporate Bonds | |||||||
| (Cost $3,077,588) | 2,464,118 | ||||||
| Total Bonds | |||||||
| (Cost $3,077,588) | 2,464,118 | ||||||
| Bank Loans: 32.1% | |||||||
| Beverages: 1.1% | |||||||
| Chill Merger Sub, Inc. | |||||||
| 56,000 | 8.659% (1 Month | ||||||
LIBOR + 3.500%) ,03/20/2024 1,2 | 50,756 | ||||||
| Commercial Services & Supplies: 1.1% | |||||||
| LRS Holdings LLC | |||||||
| 53,325 | 9.090% (1 Month | ||||||
LIBOR + 4.250%), 08/31/2028 1,2 | 52,258 | ||||||
| Machinery: 2.9% | |||||||
| Werner FinCo L.P. | |||||||
| 149,829 | 9.159% (2 Months | ||||||
LIBOR + 4.000%), 07/24/2024 1,2 | 141,074 | ||||||
| Software: 22.8% | |||||||
| A&V Holdings Midco LLC | |||||||
| 288,354 | 10.534% (6 Months | ||||||
LIBOR + 5.375%), 03/10/2027 1,2 | 284,390 | ||||||
| Hyland Software, Inc. | |||||||
| 382,800 | 11.090% (1 Month | ||||||
LIBOR + 6.250%), 07/10/2025 1,2 | 367,488 | ||||||
| Magenta Buyer LLC | |||||||
| 365,375 | 9.580% (3 Months | ||||||
LIBOR + 4.750%), 07/27/2028 1,2 | 302,609 | ||||||
The accompanying Notes to Financial Statements are an integral part of these financial statements.
41
Sustainable Credit Fund | Schedule of Investments at March 31, 2023 (Continued)
| Principal | |||||||
| Amount | Value | ||||||
| Software: 22.8% (Continued) | |||||||
| Veritas U.S., Inc. | |||||||
| $ | 183,311 | 9.840% (3 Months | |||||
LIBOR + 5.000%), 09/01/2025 1,2 | $ | 140,181 | |||||
| 1,094,668 | |||||||
| Specialty Retail: 4.2% | |||||||
| At Home Group, Inc. | |||||||
| 253,788 | 9.004% (3 Months | ||||||
LIBOR + 4.250%), 7/23/2028 1,2 | 199,108 | ||||||
| Total Bank Loans | |||||||
| (Cost $1,692,916) | 1,537,864 | ||||||
| Shares | |||||||
| Short-Term Investments: 15.2% | |||||||
| Money Market Funds: 15.2% | |||||||
| 727,546 | U.S. Bank Money Market | ||||||
Deposit Account, 4.480% 3 | 727,546 | ||||||
| Total Money Market Funds | |||||||
| (Cost $727,546) | 727,546 | ||||||
| Total Short-Term Investments | |||||||
| (Cost $727,546) | 727,546 | ||||||
| Total Investments in Securities: 98.7% | |||||||
| (Cost $5,498,050) | 4,729,528 | ||||||
| Other Assets in Excess of Liabilities: 1.3% | 62,831 | ||||||
| Total Net Assets: 100.0% | $ | 4,792,359 | |||||
LIBOR – London Interbank Offered Rate
PIK – Payment-in-Kind
1 | Variable rate security; rate shown is the rate in effect on March 31, 2023. |
2 | Bank loans generally pay interest at rates which are periodically determined by reference to a base lending rate plus a premium. All loans carry a variable rate of interest. These base lending rates are generally (i) the Prime Rate offered by one or more major United States banks, (ii) the lending rate offered by one or more European banks such as the London Interbank Offered Rate (“LIBOR”) or (iii) the Certificate of Deposit rate. Bank Loans, while exempt from registration, under the Securities Act of 1933, contain certain restrictions on resale and cannot be sold publicly. Floating rate bank loans often require prepayments from excess cash flow or permit the borrower to repay at its election. The degree to which borrowers repay, whether as a contractual requirement or at their election, cannot be predicted with accuracy. |
3 | The Money Market Deposit Account (the “MMDA”) is a short-term investment vehicle in which the Fund holds cash balances. The MMDA will bear interest at a variable rate that is determined based on conditions and may change daily and by any amount. The rate shown is as of March 31, 2023. |
The Global Industry Classifications Standard (GICS®) sector and industry classifications was developed by and is the exclusive property of MSCI, Inc. and Standard & Poor’s (“S&P”). GICS® is a service mark of MSCI, Inc. and S&P and has been licensed for use by the Osterweis Capital Management.
The accompanying Notes to Financial Statements are an integral part of these financial statements.
42
Osterweis Funds | Statements of Assets and Liabilities at March 31, 2023
| Growth & | Emerging | |||||||||||||||
| Osterweis | Strategic | Income | Opportunity | |||||||||||||
| Fund | Income Fund | Fund | Fund | |||||||||||||
| ASSETS | ||||||||||||||||
| Investments in unaffiliated securities, at value | $ | 139,591,747 | $ | 4,599,717,003 | $ | 151,072,596 | $ | 201,527,749 | ||||||||
| (cost $97,633,850, $4,987,414,787, $126,885,189, | ||||||||||||||||
| and $187,156,996, respectively) | ||||||||||||||||
| Investments in affiliated securities, at value | — | 46,512,760 | 949,240 | — | ||||||||||||
| (cost $—, $49,000,000, $1,000,000, and $—, respectively) | ||||||||||||||||
| Cash | — | 14,337,258 | 235,824 | — | ||||||||||||
| Receivables: | ||||||||||||||||
| Investment securities sold | — | 11,143,680 | 60,176 | 767,820 | ||||||||||||
| Fund shares sold | 161,863 | 7,045,697 | 359,772 | 70,233 | ||||||||||||
| Dividends and interest | 139,893 | 69,098,826 | 859,507 | 87,151 | ||||||||||||
| Return of capital | — | — | — | — | ||||||||||||
| Variation margin | — | — | — | — | ||||||||||||
| Prepaid expenses | 12,373 | 61,566 | 9,708 | 12,956 | ||||||||||||
| Total assets | 139,905,876 | 4,747,916,790 | 153,546,823 | 202,465,909 | ||||||||||||
| LIABILITIES | ||||||||||||||||
| Payables: | ||||||||||||||||
| Investment securities purchased | — | 49,934,217 | 1,497,515 | 4,165,765 | ||||||||||||
| Fund shares redeemed | 42,906 | 1,283,909 | — | 35,167 | ||||||||||||
| Distributions to shareholders | — | — | — | — | ||||||||||||
| Investment advisory fees, net | 87,220 | 2,847,397 | 94,653 | 135,279 | ||||||||||||
| Variation margin Payable | — | — | — | — | ||||||||||||
| Administration fees | 3,834 | 85,603 | 4,270 | 3,751 | ||||||||||||
| Custody fees | 1,286 | 39,275 | 2,461 | 11,183 | ||||||||||||
| Fund accounting fees | 4,820 | 58,513 | 3,932 | 1,874 | ||||||||||||
| Transfer agent fees | 2,949 | 436,128 | 4,939 | 39,480 | ||||||||||||
| Trustee fees | 2,560 | 13,389 | 2,584 | 2,641 | ||||||||||||
| Audit fees | 29,600 | 29,600 | 26,900 | 24,100 | ||||||||||||
| Chief Compliance Officer fees | 833 | 833 | 833 | 834 | ||||||||||||
| Loans payable | — | — | — | — | ||||||||||||
| Other accrued expenses | 4,147 | 51,985 | 17,212 | 10,584 | ||||||||||||
| Total Liabilities | 180,155 | 54,780,849 | 1,655,299 | 4,430,658 | ||||||||||||
| NET ASSETS | $ | 139,725,721 | $ | 4,693,135,941 | $ | 151,891,524 | $ | 198,035,251 | ||||||||
| COMPUTATION OF NET ASSETS: | ||||||||||||||||
| Net assets value (unlimited shares authorized): | $ | 139,725,721 | $ | 4,693,135,941 | $ | 151,891,524 | $ | 198,035,251 | ||||||||
| Shares (unlimited number of shares authorized without par value) | 8,224,145 | 448,590,858 | 9,979,763 | 15,689,467 | ||||||||||||
| Net assets value, offering, and redemption price per share | $ | 16.99 | $ | 10.46 | $ | 15.22 | $ | 12.62 | ||||||||
| COMPONENTS OF NET ASSETS: | ||||||||||||||||
| Paid-in capital | $ | 98,617,127 | $ | 5,493,187,647 | $ | 127,558,024 | $ | 225,165,100 | ||||||||
| Total distributable (accumulated) earnings (losses) | 41,108,594 | (800,051,706 | ) | 24,333,500 | (27,129,849 | ) | ||||||||||
| Net assets | $ | 139,725,721 | $ | 4,693,135,941 | $ | 151,891,524 | $ | 198,035,251 | ||||||||
The accompanying Notes to Financial Statements are an integral part of these financial statements.
43
Osterweis Funds | Statements of Assets and Liabilities at March 31, 2023 (Continued)
| Total | Short | Sustainable | ||||||||||
| Return | Duration | Credit | ||||||||||
| Fund | Credit Fund 1 | Fund 1 | ||||||||||
| ASSETS | ||||||||||||
| Investments in unaffiliated securities, at value | $ | 135,164,646 | $ | 172,209,589 | $ | 4,729,528 | ||||||
| (cost $141,587,898, $203,029,113, and $5,498,050, respectively) | ||||||||||||
| Investments in affiliated securities, at value | — | — | — | |||||||||
| (cost $—, $—, and $—, respectively) | ||||||||||||
| Cash | — | 159,576 | 8,786 | |||||||||
| Deposit at broker | 250,000 | — | — | |||||||||
| Receivables: | ||||||||||||
| Investment securities sold | 497,200 | — | — | |||||||||
| Fund shares sold | 21,203 | 131,265 | 2,300 | |||||||||
| Dividends and interest | 704,176 | 2,345,578 | 72,834 | |||||||||
| Return of capital | — | — | — | |||||||||
| Due from investment advisor | — | — | 11,620 | |||||||||
| Prepaid expenses | 17,079 | 14,546 | 3,779 | |||||||||
| Total assets | 136,654,304 | 174,860,554 | 4,828,847 | |||||||||
| LIABILITIES | ||||||||||||
| Payables: | ||||||||||||
| Investment securities purchased | 2,955,223 | — | — | |||||||||
| Fund shares redeemed | 160,019 | 760,637 | — | |||||||||
| Distributions to shareholders | — | — | — | |||||||||
| Investment advisory fees, net | 52,256 | 111,326 | — | |||||||||
| Variation margin Payable | — | — | — | |||||||||
| Administration fees | 2,844 | 4,277 | 1,215 | |||||||||
| Custody fees | 1,965 | 6,864 | 937 | |||||||||
| Fund accounting fees | 3,423 | 3,014 | 756 | |||||||||
| Transfer agent fees | 5,543 | 46,049 | 1,873 | |||||||||
| Trustee fees | 2,544 | 3,623 | 2,472 | |||||||||
| Audit fees | 24,100 | 24,100 | 21,089 | |||||||||
| Chief Compliance Officer fees | 2,843 | 1,250 | 1,325 | |||||||||
| Loans payable | — | — | — | |||||||||
| Other accrued expenses | 7,207 | 1,651 | 6,821 | |||||||||
| Total Liabilities | 3,217,967 | 962,791 | 36,488 | |||||||||
| NET ASSETS | $ | 133,436,337 | $ | 173,897,763 | $ | 4,792,359 | ||||||
| COMPUTATION OF NET ASSETS: | ||||||||||||
| Net assets value (unlimited shares authorized): | $ | 133,436,337 | $ | 173,897,763 | $ | 4,792,359 | ||||||
| Shares (unlimited number of shares authorized without par value) | 13,956,252 | 21,272,048 | 592,419 | |||||||||
| Net assets value, offering, and redemption price per share | $ | 9.56 | $ | 8.17 | $ | 8.09 | ||||||
| COMPONENTS OF NET ASSETS: | ||||||||||||
| Paid-in capital | $ | 145,702,196 | $ | 228,177,427 | $ | 5,822,670 | ||||||
| Total distributable (accumulated) earnings (losses) | (12,265,859 | ) | (54,279,664 | ) | (1,030,311 | ) | ||||||
| Net assets | $ | 133,436,337 | $ | 173,897,763 | $ | 4,792,359 | ||||||
1 | The Osterweis Short Duration Credit Fund and Osterweis Sustainable Credit Fund changed fiscal year ends from April 30 to March 31 effective close of business October 7, 2022. |
The accompanying Notes to Financial Statements are an integral part of these financial statements.
44
Osterweis Funds | Statements of Operations For the Year Ended March 31, 2023
| Growth & | Emerging | |||||||||||||||||||
| Osterweis | Strategic | Income | Opportunity | Total Return | ||||||||||||||||
| Fund | Income Fund | Fund | Fund | Fund | ||||||||||||||||
| INVESTMENT INCOME | ||||||||||||||||||||
| Income: | ||||||||||||||||||||
| Dividends from unaffiliated investments | $ | 1,532,815 | $ | 1,362,625 | $ | 1,542,077 | $ | 454,664 | $ | 1,192 | ||||||||||
| (net of $5,975, $—, $16,952, $7,143, | ||||||||||||||||||||
| and $—, respectively, in foreign | ||||||||||||||||||||
| withholding taxes and issuance fees) | ||||||||||||||||||||
| Dividends from affiliated investments | — | 3,736,252 | 76,252 | — | — | |||||||||||||||
| Interest | 377,181 | 264,273,407 | 3,007,111 | 475,063 | 3,123,295 | |||||||||||||||
| Other income | 1,334 | 6,602 | 1,328 | 1,363 | 6,539 | |||||||||||||||
| Total investment income | 1,911,330 | 269,378,886 | 4,626,768 | 931,090 | 3,131,026 | |||||||||||||||
| EXPENSES | ||||||||||||||||||||
| Investment advisory fees | 1,097,603 | 34,423,324 | 1,156,190 | 1,792,498 | 588,602 | |||||||||||||||
| Administration fees | 42,881 | 1,012,199 | 46,264 | 46,937 | 39,381 | |||||||||||||||
| Fund accounting fees | 24,063 | 691,532 | 39,396 | 23,712 | 43,374 | |||||||||||||||
| Sub-transfer agent fees | 30,587 | 3,691,767 | 23,821 | 121,189 | 50,747 | |||||||||||||||
| Transfer agent fees | 31,259 | 427,799 | 31,484 | 59,271 | 28,275 | |||||||||||||||
| Audit fees | 31,044 | 31,044 | 28,194 | 25,244 | 25,244 | |||||||||||||||
| Registration fees | 19,368 | 85,380 | 24,783 | 24,258 | 22,615 | |||||||||||||||
| Trustee fees | 19,133 | 102,418 | 19,313 | 19,587 | 18,908 | |||||||||||||||
| Miscellaneous expense | 12,586 | 93,569 | 24,500 | 9,967 | 12,321 | |||||||||||||||
| Custody fees | 8,192 | 246,571 | 14,005 | 24,956 | 12,448 | |||||||||||||||
| Chief Compliance Officer fees | 10,500 | 10,500 | 10,500 | 10,500 | 12,509 | |||||||||||||||
| Legal fees | 7,123 | 12,123 | 8,123 | 10,123 | 10,895 | |||||||||||||||
| Reports to shareholders | 5,332 | 157,988 | 3,440 | 12,113 | 3,223 | |||||||||||||||
| Insurance expense | 6,084 | 29,765 | 5,992 | 14,257 | 5,952 | |||||||||||||||
| Interest expense | — | — | — | — | — | |||||||||||||||
| Futures commissions merchant interest expense | — | — | — | — | 1,767 | |||||||||||||||
| Total expenses | 1,345,755 | 41,015,979 | 1,436,005 | 2,194,612 | 876,261 | |||||||||||||||
| Fees (waived) recouped by the Adviser | 44,542 | — | — | (222,867 | ) | — | ||||||||||||||
| Net expenses | 1,390,297 | 41,015,979 | 1,436,005 | 1,971,745 | 876,261 | |||||||||||||||
| Net investment income (loss) | 521,033 | 228,362,907 | 3,190,763 | (1,040,655 | ) | 2,254,765 | ||||||||||||||
| REALIZED AND UNREALIZED GAIN (LOSS) ON INVESTMENTS | ||||||||||||||||||||
| Net realized gain (loss) on: | ||||||||||||||||||||
| Investments | (1,370,325 | ) | 3,317,196 | 244,495 | (26,974,002 | ) | (9,438,592 | ) | ||||||||||||
| Futures contracts | — | — | — | — | 3,697,417 | |||||||||||||||
| Change in net unrealized appreciation/depreciation on: | ||||||||||||||||||||
| Investments | (17,250,533 | ) | (326,091,714 | ) | (16,205,466 | ) | 9,811,152 | 2,849,728 | ||||||||||||
| Affiliated investments | — | (9,958,368 | ) | (203,232 | ) | — | — | |||||||||||||
| Futures contracts | — | — | — | — | (63,353 | ) | ||||||||||||||
| Net realized and unrealized | ||||||||||||||||||||
| gain (loss) on investments | (18,620,858 | ) | (332,732,886 | ) | (16,164,203 | ) | (17,162,850 | ) | (2,954,800 | ) | ||||||||||
| Net increase (decrease) in net assets | ||||||||||||||||||||
| resulting from operations | $ | (18,099,825 | ) | $ | (104,369,979 | ) | $ | (12,973,440 | ) | $ | (18,203,505 | ) | $ | (700,035 | ) | |||||
The accompanying Notes to Financial Statements are an integral part of these financial statements.
45
Osterweis Funds | Statements of Operations For the Period Ended March 31, 2023 (Continued)
| Short | ||||||||||||||||
| Duration | Sustainable | |||||||||||||||
| Short | Credit Fund | Sustainable | Credit Fund | |||||||||||||
| Duration | Year Ended | Credit | Year Ended | |||||||||||||
Credit Fund 1 | April 30, 2022 | Fund 1 | April 30, 2022 | |||||||||||||
| INVESTMENT INCOME | ||||||||||||||||
| Income: | ||||||||||||||||
| Dividends from unaffiliated investments | $ | — | $ | — | $ | — | $ | — | ||||||||
| (net of $—, $—, $—, and $—, respectively, in foreign | ||||||||||||||||
| withholding taxes and issuance fees) | ||||||||||||||||
| Dividends from affiliated investments | — | — | — | — | ||||||||||||
| Interest | 13,534,960 | 12,645,502 | 469,572 | 550,062 | ||||||||||||
| Other income | — | — | — | — | ||||||||||||
| Total investment income | 13,534,960 | 12,645,502 | 469,572 | 550,062 | ||||||||||||
| EXPENSES | ||||||||||||||||
| Investment advisory fees | 1,308,521 | 1,740,152 | 38,819 | 71,448 | ||||||||||||
| Administration fees | 107,062 | 219,955 | 19,632 | 36,877 | ||||||||||||
| Fund accounting fees | 18,127 | — | 3,487 | — | ||||||||||||
| Sub-transfer agent fees | 133,290 | 93,149 | 1,720 | 14,148 | ||||||||||||
| Transfer agent fees | 34,394 | 39,859 | 18,652 | 17,583 | ||||||||||||
| Audit fees | 22,951 | 19,944 | 21,601 | 18,517 | ||||||||||||
| Registration fees | 40,716 | 41,810 | 12,130 | 6,488 | ||||||||||||
| Trustee fees | 14,136 | 15,557 | 14,164 | 15,228 | ||||||||||||
| Miscellaneous expense | 15,171 | 3,903 | 9,539 | 2,465 | ||||||||||||
| Custody fees | 41,628 | 26,013 | 9,022 | 6,559 | ||||||||||||
| Chief Compliance Officer fees | 5,417 | 25,705 | 5,492 | 7,480 | ||||||||||||
| Legal fees | 12,619 | 43,045 | 15,288 | 20,827 | ||||||||||||
| Reports to shareholders | 14,547 | 15,350 | 777 | 365 | ||||||||||||
| Insurance expense | 4,544 | 5,204 | 3,501 | 2,059 | ||||||||||||
| Interest expense | — | — | — | — | ||||||||||||
| Futures commissions merchant interest expense | — | — | — | — | ||||||||||||
| Total expenses | 1,773,123 | 2,289,646 | 173,824 | 220,044 | ||||||||||||
| Fees (waived) recouped by the Adviser | (77,764 | ) | — | (122,614 | ) | (117,579 | ) | |||||||||
| Net expenses | 1,695,359 | 2,289,646 | 51,210 | 102,465 | ||||||||||||
| Net investment income (loss) | 11,839,601 | 10,355,856 | 418,362 | 447,597 | ||||||||||||
| REALIZED AND UNREALIZED GAIN (LOSS) ON INVESTMENTS | ||||||||||||||||
| Net realized gain (loss) on: | ||||||||||||||||
| Investments | (25,872,101 | ) | 1,618,162 | (923,199 | ) | 420,078 | ||||||||||
| Futures contracts | — | — | — | — | ||||||||||||
| Change in net unrealized appreciation/depreciation on: | ||||||||||||||||
| Investments | 4,526,788 | (14,491,254 | ) | 245,987 | (659,019 | ) | ||||||||||
| Affiliated investments | — | — | — | — | ||||||||||||
| Futures contracts | — | — | — | — | ||||||||||||
| Net realized and unrealized gain (loss) on investments | (21,345,313 | ) | (12,873,092 | ) | (677,212 | ) | (238,941 | ) | ||||||||
| Net increase (decrease) in net assets resulting from operations | $ | (9,505,712 | ) | $ | (2,517,236 | ) | $ | (258,850 | ) | $ | 208,656 | |||||
1 | The Osterweis Short Duration Credit Fund and Osterweis Sustainable Credit Fund changed fiscal year ends from April 30 to March 31 effective close of business October 7, 2022. Amounts shown reflect the activity for the 11 months ended March 31, 2023. 2022 information is presented for these Funds due to the fiscal year end change. |
The accompanying Notes to Financial Statements are an integral part of these financial statements.
46
Osterweis Fund | Statements of Changes in Net Assets
| Year Ended | Year Ended | |||||||
| March 31, 2023 | March 31, 2022 | |||||||
| INCREASE (DECREASE) IN NET ASSETS FROM: | ||||||||
| OPERATIONS | ||||||||
| Net investment income (loss) | $ | 521,033 | $ | (128,995 | ) | |||
| Net realized gain (loss) on investments and distributions | (1,370,325 | ) | 21,894,242 | |||||
| Change in net unrealized appreciation/depreciation of investments | (17,250,533 | ) | (12,303,567 | ) | ||||
| Net increase (decrease) in net assets resulting from operations | (18,099,825 | ) | 9,461,680 | |||||
| DISTRIBUTIONS TO SHAREHOLDERS | ||||||||
| Net distributions to shareholders | (9,739,072 | ) | (17,968,550 | ) | ||||
| CAPITAL SHARE TRANSACTIONS | ||||||||
Net increase (decrease) in net assets derived from net change in outstanding shares 1 | (9,397,072 | ) | 16,556,412 | |||||
| Total increase (decrease) in net assets | (37,235,969 | ) | 8,049,542 | |||||
| NET ASSETS | ||||||||
| Beginning of year | 176,961,690 | 168,912,148 | ||||||
| End of year | $ | 139,725,721 | $ | 176,961,690 | ||||
1 | A summary of share transactions is as follows: |
| Year Ended | Year Ended | ||||||||||||||||
| March 31, 2023 | March 31, 2022 | ||||||||||||||||
| Shares | Value | Shares | Value | ||||||||||||||
| Shares sold | 357,233 | $ | 6,032,281 | 430,612 | $ | 9,412,570 | |||||||||||
| Shares issued in reinvestment of distributions | 571,975 | 9,260,278 | 790,930 | 17,107,842 | |||||||||||||
| Shares redeemed | (1,398,115 | ) | (24,689,631 | ) | (444,825 | ) | (9,964,000 | ) | |||||||||
| Net increase (decrease) | (468,907 | ) | $ | (9,397,072 | ) | 776,717 | $ | 16,556,412 | |||||||||
The accompanying Notes to Financial Statements are an integral part of these financial statements.
47
Strategic Income Fund | Statements of Changes in Net Assets
| Year Ended | Year Ended | |||||||
| March 31, 2023 | March 31, 2022 | |||||||
| INCREASE (DECREASE) IN NET ASSETS FROM: | ||||||||
| OPERATIONS | ||||||||
| Net investment income (loss) | $ | 228,362,907 | $ | 224,595,484 | ||||
| Net realized gain (loss) on investments and distributions | 3,317,196 | 108,256,664 | ||||||
| Change in unrealized appreciation/depreciation on investments | (326,091,714 | ) | (225,910,564 | ) | ||||
| Change in unrealized appreciation/depreciation on affiliated investments | (9,958,368 | ) | (3,017,808 | ) | ||||
| Net increase (decrease) in net assets resulting from operations | (104,369,979 | ) | 103,923,776 | |||||
| DISTRIBUTIONS TO SHAREHOLDERS | ||||||||
| Net distributions to shareholders | (230,705,874 | ) | (221,810,712 | ) | ||||
| CAPITAL SHARE TRANSACTIONS | ||||||||
Net increase (decrease) in net assets derived from net change in outstanding shares 1 | (361,850,022 | ) | 304,059,065 | |||||
| Total increase (decrease) in net assets | (696,925,875 | ) | 186,172,129 | |||||
| NET ASSETS | ||||||||
| Beginning of year | 5,390,061,816 | 5,203,889,687 | ||||||
| End of year | $ | 4,693,135,941 | $ | 5,390,061,816 | ||||
1 | A summary of share transactions is as follows: |
| Year Ended | Year Ended | ||||||||||||||||
| March 31, 2023 | March 31, 2022 | ||||||||||||||||
| Shares | Value | Shares | Value | ||||||||||||||
| Shares sold | 145,973,792 | $ | 1,539,672,572 | 128,821,112 | $ | 1,479,116,650 | |||||||||||
| Shares issued in reinvestment of distributions | 19,679,719 | 204,043,520 | 17,180,037 | 195,883,020 | |||||||||||||
| Shares redeemed | (200,632,808 | ) | (2,105,566,114 | ) | (119,966,375 | ) | (1,370,940,605 | ) | |||||||||
| Net increase (decrease) | (34,979,297 | ) | $ | (361,850,022 | ) | 26,034,774 | $ | 304,059,065 | |||||||||
The accompanying Notes to Financial Statements are an integral part of these financial statements.
48
Growth & Income Fund | Statements of Changes in Net Assets
| Year Ended | Year Ended | |||||||
| March 31, 2023 | March 31, 2022 | |||||||
| INCREASE (DECREASE) IN NET ASSETS FROM: | ||||||||
| OPERATIONS | ||||||||
| Net investment income (loss) | $ | 3,190,763 | $ | 2,459,121 | ||||
| Net realized gain (loss) on investments and distributions | 244,495 | 15,099,827 | ||||||
| Change in net unrealized appreciation/depreciation of investments | (16,205,466 | ) | (5,743,024 | ) | ||||
| Change in unrealized appreciation/depreciation on affiliated investments | (203,232 | ) | (61,588 | ) | ||||
| Net increase (decrease) in net assets resulting from operations | (12,973,440 | ) | 11,754,336 | |||||
| DISTRIBUTIONS TO SHAREHOLDERS | ||||||||
| Net distributions to shareholders | (12,505,014 | ) | (13,234,956 | ) | ||||
| CAPITAL SHARE TRANSACTIONS | ||||||||
Net increase (decrease) in net assets derived from net change in outstanding shares 1 | 6,333,445 | 15,240,238 | ||||||
| Total increase (decrease) in net assets | (19,145,009 | ) | 13,759,618 | |||||
| NET ASSETS | ||||||||
| Beginning of year | 171,036,533 | 157,276,915 | ||||||
| End of year | $ | 151,891,524 | $ | 171,036,533 | ||||
1 | A summary of share transactions is as follows: |
| Year Ended | Year Ended | ||||||||||||||||
| March 31, 2023 | March 31, 2022 | ||||||||||||||||
| Shares | Value | Shares | Value | ||||||||||||||
| Shares sold | 684,256 | $ | 10,863,406 | 716,232 | $ | 13,419,001 | |||||||||||
| Shares issued in reinvestment of distributions | 617,056 | 9,271,392 | 620,144 | 11,514,975 | |||||||||||||
| Shares redeemed | (881,411 | ) | (13,801,353 | ) | (523,566 | ) | (9,693,738 | ) | |||||||||
| Net increase (decrease) | 419,901 | $ | 6,333,445 | 812,810 | $ | 15,240,238 | |||||||||||
The accompanying Notes to Financial Statements are an integral part of these financial statements.
49
Emerging Opportunity Fund | Statements of Changes in Net Assets
| Year Ended | Year Ended | |||||||
| March 31, 2023 | March 31, 2022 | |||||||
| INCREASE (DECREASE) IN NET ASSETS FROM: | ||||||||
| OPERATIONS | ||||||||
| Net investment income (loss) | $ | (1,040,655 | ) | $ | (2,335,803 | ) | ||
| Net realized gain (loss) on investments and distributions | (26,974,002 | ) | 4,005,086 | |||||
| Change in unrealized appreciation/depreciation on investments | 9,811,152 | (36,387,907 | ) | |||||
| Net increase (decrease) in net assets resulting from operations | (18,203,505 | ) | (34,718,624 | ) | ||||
| DISTRIBUTIONS TO SHAREHOLDERS | ||||||||
| Net distributions to shareholders | — | (44,290,126 | ) | |||||
| CAPITAL SHARE TRANSACTIONS | ||||||||
Net increase (decrease) in net assets derived from net change in outstanding shares 1 | 22,073,773 | 41,458,646 | ||||||
| Total increase (decrease) in net assets | 3,870,268 | (37,550,104 | ) | |||||
| NET ASSETS | ||||||||
| Beginning of year | 194,164,983 | 231,715,087 | ||||||
| End of year | $ | 198,035,251 | $ | 194,164,983 | ||||
1 | A summary of share transactions is as follows: |
| Year Ended | Year Ended | ||||||||||||||||
| March 31, 2023 | March 31, 2022 | ||||||||||||||||
| Shares | Value | Shares | Value | ||||||||||||||
| Shares sold | 5,330,670 | $ | 63,569,915 | 3,850,297 | $ | 70,459,601 | |||||||||||
| Shares issued in reinvestment of distributions | — | — | 1,876,104 | 31,143,309 | |||||||||||||
| Shares redeemed | (3,466,267 | ) | (41,496,142 | ) | (3,492,979 | ) | (60,144,264 | ) | |||||||||
| Net increase (decrease) | 1,864,403 | $ | 22,073,773 | 2,233,422 | $ | 41,458,646 | |||||||||||
The accompanying Notes to Financial Statements are an integral part of these financial statements.
50
Total Return Fund | Statements of Changes in Net Assets
| Year Ended | Year Ended | |||||||
| March 31, 2023 | March 31, 2022 | |||||||
| INCREASE (DECREASE) IN NET ASSETS FROM: | ||||||||
| OPERATIONS | ||||||||
| Net investment income (loss) | $ | 2,254,765 | $ | 1,088,745 | ||||
| Net realized gain (loss) on investments and futures contracts | (5,741,175 | ) | 712,207 | |||||
| Change in net unrealized appreciation/depreciation on investments and futures contracts | 2,786,375 | (7,120,668 | ) | |||||
| Net increase (decrease) in net assets resulting from operations | (700,035 | ) | (5,319,716 | ) | ||||
| DISTRIBUTIONS TO SHAREHOLDERS | ||||||||
| Net distributions to shareholders | (2,248,460 | ) | (1,464,552 | )1 | ||||
| CAPITAL SHARE TRANSACTIONS | ||||||||
Net increase (decrease) in net assets derived from net change in outstanding shares1 | (13,162,756 | ) | (53,748,786 | ) | ||||
| Total increase (decrease) in net assets | (16,111,251 | ) | (60,533,054 | ) | ||||
| NET ASSETS | ||||||||
| Beginning of year | 149,547,588 | 210,080,642 | ||||||
| End of year | $ | 133,436,337 | $ | 149,547,588 | ||||
1 | A summary of share transactions is as follows: |
| Year Ended | Year Ended | ||||||||||||||||
| March 31, 2023 | March 31, 2022 | ||||||||||||||||
| Shares | Value | Shares | Value | ||||||||||||||
| Shares sold | 8,049,230 | $ | 76,024,068 | 3,083,695 | $ | 31,326,779 | |||||||||||
| Shares issued in reinvestment of distributions | 129,866 | 1,227,150 | 82,646 | 834,741 | |||||||||||||
| Shares redeemed | (9,564,826 | ) | (90,413,974 | ) | (8,455,572 | ) | (85,910,306 | ) | |||||||||
| Net increase (decrease) | (1,385,730 | ) | $ | (13,162,756 | ) | (5,289,231 | ) | $ | (53,748,786 | ) | |||||||
The accompanying Notes to Financial Statements are an integral part of these financial statements.
51
Short Duration Credit Fund | Statements of Changes in Net Assets
| Period Ended | Year Ended | Year Ended | ||||||||||
March 31, 2023 2 | April 30, 2022 | April 30, 2021 | ||||||||||
| INCREASE (DECREASE) IN NET ASSETS FROM: | ||||||||||||
| OPERATIONS | ||||||||||||
| Net investment income (loss) | $ | 11,839,601 | $ | 10,355,856 | $ | 11,021,847 | ||||||
| Net realized gain (loss) on investments and distributions | (25,872,101 | ) | 1,618,162 | 4,954,159 | ||||||||
| Change in unrealized appreciation/depreciation on investments | 4,526,788 | (14,491,254 | ) | 9,653,271 | ||||||||
| Net increase (decrease) in net assets resulting from operations | (9,505,712 | ) | (2,517,236 | ) | 25,629,277 | |||||||
| DISTRIBUTIONS TO SHAREHOLDERS | ||||||||||||
| Net distributions to shareholders | (11,910,126 | ) | (10,226,272 | ) | (11,177,092 | ) | ||||||
| CAPITAL SHARE TRANSACTIONS | ||||||||||||
| Net increase (decrease) in net assets derived | ||||||||||||
from net change in outstanding shares 1 | (22,297,366 | ) | (438,877 | ) | (88,841,465 | ) | ||||||
| Total increase (decrease) in net assets | (43,713,204 | ) | (13,182,385 | ) | (74,389,280 | ) | ||||||
| NET ASSETS | ||||||||||||
| Beginning of year | 217,610,967 | 230,793,352 | 305,182,632 | |||||||||
| End of year | $ | 173,897,763 | $ | 217,610,967 | $ | 230,793,352 | ||||||
1 | A summary of share transactions is as follows: |
| Period Ended | Year Ended | Year Ended | |||||||||||||||||||||||
March 31, 2023 2 | April 30, 2022 | April 30, 2021 | |||||||||||||||||||||||
| Shares | Value | Shares | Value | Shares | Value | ||||||||||||||||||||
| Shares sold | 4,720,933 | $ | 40,101,066 | 7,806,845 | $ | 75,005,512 | 5,789,094 | $ | 55,176,566 | ||||||||||||||||
| Shares issued in | |||||||||||||||||||||||||
| reinvestment of distributions | 1,289,565 | 10,877,999 | 963,283 | 9,238,077 | 1,055,473 | 10,015,580 | |||||||||||||||||||
| Shares redeemed | (8,599,259 | ) | (73,276,431 | ) | (8,789,923 | ) | (84,682,466 | )3 | (16,300,658 | ) | (154,033,611 | )4 | |||||||||||||
| Net increase (decrease) | (2,588,761 | ) | $ | (22,297,366 | ) | (19,795 | ) | $ | (438,877 | ) | (9,456,091 | ) | $ | (88,841,465 | ) | ||||||||||
2 | The Osterweis Short Duration Credit Fund changed fiscal year end from April 30 to March 31 effective close of business October 7, 2022. Amounts shown reflect the activity for the 11 months ended March 31, 2023. 2021 information is presented for the Fund due to the fiscal year end change. |
3 | Net of redemption fees of $4,088, respectively. |
4 | Net of redemption fees of $4,670, respectively. |
The accompanying Notes to Financial Statements are an integral part of these financial statements.
52
Sustainable Credit Fund | Statements of Changes in Net Assets
| Period Ended | Year Ended | Year Ended | ||||||||||
March 31, 2023 2 | April 30, 2022 | April 30, 2021 | ||||||||||
| INCREASE (DECREASE) IN NET ASSETS FROM: | ||||||||||||
| OPERATIONS | ||||||||||||
| Net investment income (loss) | $ | 418,362 | $ | 447,597 | $ | 527,444 | ||||||
| Net realized gain (loss) on investments and distributions | (923,199 | ) | 420,078 | 284,846 | ||||||||
| Change in unrealized appreciation/depreciation on investments | 245,987 | (659,019 | ) | 494,834 | ||||||||
| Net increase (decrease) in net assets resulting from operations | (258,850 | ) | 208,656 | 1,307,124 | ||||||||
| DISTRIBUTIONS TO SHAREHOLDERS | ||||||||||||
| Net distributions to shareholders | (426,645 | ) | (443,074 | ) | (524,320 | ) | ||||||
| CAPITAL SHARE TRANSACTIONS | ||||||||||||
| Net increase (decrease) in net assets derived | ||||||||||||
| from net change in outstanding shares1 | (925,980 | ) | (12,800,565 | ) | 8,378,904 | |||||||
| Total increase (decrease) in net assets | (1,611,475 | ) | (13,034,983 | ) | 9,161,708 | |||||||
| NET ASSETS | ||||||||||||
| Beginning of year | 6,403,834 | 19,438,817 | 10,277,109 | |||||||||
| End of year | $ | 4,792,359 | $ | 6,403,834 | $ | 19,438,817 | ||||||
1 | A summary of share transactions is as follows: |
| Period Ended | Year Ended | Year Ended | |||||||||||||||||||||||
March 31, 2023 2 | April 30, 2022 | April 30, 2021 | |||||||||||||||||||||||
| Shares | Value | Shares | Value | Shares | Value | ||||||||||||||||||||
| Shares sold | 501,552 | $ | 4,241,128 | 262,363 | $ | 2,552,463 | 1,101,189 | $ | 10,438,989 | ||||||||||||||||
| Shares issued in | |||||||||||||||||||||||||
| reinvestment of distributions | 35,936 | 302,572 | 35,349 | 341,096 | 51,941 | 494,655 | |||||||||||||||||||
| Shares redeemed | (644,382 | ) | (5,469,680 | ) | (1,607,980 | ) | (15,694,124 | )3 | (267,707 | ) | (2,554,740 | ) | |||||||||||||
| Net increase (decrease) | (106,894 | ) | $ | (925,980 | ) | (1,310,268 | ) | $ | (12,800,565 | ) | 885,423 | $ | 8,378,904 | ||||||||||||
2 | The Osterweis Sustainable Credit Fund changed fiscal year end from April 30 to March 31 effective close of business October 7, 2022. Amounts shown reflect the activity for the 11 months ended March 31, 2023. 2021 information is presented for the Fund due to the fiscal year end change. |
3 | Net of redemption fees of $416, respectively. |
The accompanying Notes to Financial Statements are an integral part of these financial statements.
53
Osterweis Fund | Financial Highlights
For a capital share outstanding throughout each year
| Year Ended March 31, | ||||||||||||||||||||
| 2023 | 2022 | 2021 | 2020 | 2019 | ||||||||||||||||
| Net asset value, beginning of year | $ | 20.36 | $ | 21.34 | $ | 14.68 | $ | 16.25 | $ | 19.15 | ||||||||||
| INCOME FROM INVESTMENT OPERATIONS: | ||||||||||||||||||||
Net investment income (loss) 1 | 0.06 | (0.02 | ) | 0.03 | 0.04 | 0.08 | ||||||||||||||
| Net realized and unrealized gain (loss) on investments | (2.18 | ) | 1.33 | 7.75 | (0.31 | ) | 1.24 | |||||||||||||
| Total from investment operations | (2.12 | ) | 1.31 | 7.78 | (0.27 | ) | 1.32 | |||||||||||||
| LESS DISTRIBUTIONS: | ||||||||||||||||||||
| From net investment income | — | (0.19 | ) | (0.10 | ) | (0.07 | ) | (0.76 | ) | |||||||||||
| From net realized gain | (1.25 | ) | (2.10 | ) | (1.02 | ) | (1.23 | ) | (3.46 | ) | ||||||||||
| Total distributions | (1.25 | ) | (2.29 | ) | (1.12 | ) | (1.30 | ) | (4.22 | ) | ||||||||||
| Net asset value, end of year | $ | 16.99 | $ | 20.36 | $ | 21.34 | $ | 14.68 | $ | 16.25 | ||||||||||
| Total return | (10.12 | )% | 5.49 | % | 53.48 | % | (2.88 | )% | 9.86 | % | ||||||||||
| SUPPLEMENTAL DATA: | ||||||||||||||||||||
| Net assets, end of year (millions) | $ | 139.7 | $ | 177.0 | $ | 168.9 | $ | 110.8 | $ | 128.5 | ||||||||||
| Portfolio turnover rate | 54 | % | 38 | % | 37 | % | 35 | % | 43 | % | ||||||||||
| RATIOS OF EXPENSES TO AVERAGE NET ASSETS: | ||||||||||||||||||||
| Before fees/expenses waived or recouped | 0.92 | % | 0.96 | % | 1.19 | % | 1.19 | % | 1.17 | % | ||||||||||
| After fees/expenses waived or recouped | 0.95 | % | 0.95 | % | 0.95 | % | 0.95 | % | 0.95 | %2 | ||||||||||
| RATIOS OF NET INVESTMENT INCOME TO AVERAGE NET ASSETS: | ||||||||||||||||||||
| Before fees/expenses waived or recouped | 0.39 | % | (0.08 | )% | (0.08 | )% | (0.02 | )% | 0.21 | % | ||||||||||
| After fees/expenses waived or recouped | 0.36 | % | (0.07 | )% | 0.16 | % | 0.22 | % | 0.43 | %2 | ||||||||||
1 | Calculated based on average shares outstanding during the period. |
2 | Effective January 1, 2018 the Adviser agreed to contractually limit expenses for the Fund to not exceed 0.95% of average net assets. Prior to January 1, 2018, Fund expenses were not subject to an expense limitation agreement. |
The accompanying Notes to Financial Statements are an integral part of these financial statements.
54
Strategic Income Fund | Financial Highlights
For a capital share outstanding throughout each year
| Year Ended March 31, | ||||||||||||||||||||
| 2023 | 2022 | 2021 | 2020 | 2019 | ||||||||||||||||
| Net asset value, beginning of year | $ | 11.15 | $ | 11.37 | $ | 9.97 | $ | 11.05 | $ | 11.27 | ||||||||||
| INCOME FROM INVESTMENT OPERATIONS: | ||||||||||||||||||||
Net investment income (loss) 1 | 0.50 | 0.47 | 0.45 | 0.47 | 0.50 | |||||||||||||||
| Net realized and unrealized gain (loss) on investments | (0.68 | ) | (0.22 | ) | 1.40 | (1.06 | ) | (0.21 | ) | |||||||||||
| Total from investment operations | (0.18 | ) | 0.25 | 1.85 | (0.59 | ) | 0.29 | |||||||||||||
| LESS DISTRIBUTIONS: | ||||||||||||||||||||
| From net investment income | (0.51 | ) | (0.47 | ) | (0.45 | ) | (0.49 | ) | (0.51 | ) | ||||||||||
| Total distributions | (0.51 | ) | (0.47 | ) | (0.45 | ) | (0.49 | ) | (0.51 | ) | ||||||||||
| Net asset value, end of year | $ | 10.46 | $ | 11.15 | $ | 11.37 | $ | 9.97 | $ | 11.05 | ||||||||||
| Total return | (1.49 | )% | 2.13 | % | 18.73 | % | (5.63 | )% | 2.67 | % | ||||||||||
| SUPPLEMENTAL DATA: | ||||||||||||||||||||
| Net assets, end of year (millions) | $ | 4,693.1 | $ | 5,390.1 | $ | 5,203.9 | $ | 3,995.6 | $ | 5,541.4 | ||||||||||
| Portfolio turnover rate | 10 | % | 49 | % | 60 | % | 40 | % | 46 | % | ||||||||||
| RATIO OF EXPENSES TO AVERAGE NET ASSETS: | ||||||||||||||||||||
| Ratio of expenses to average net assets | 0.85 | % | 0.84 | % | 0.86 | % | 0.86 | % | 0.84 | % | ||||||||||
| RATIO OF NET INVESTMENT INCOME TO AVERAGE NET ASSETS: | ||||||||||||||||||||
| Ratio of net investment income to average net assets | 4.74 | % | 4.10 | % | 4.14 | % | 4.32 | % | 4.52 | % | ||||||||||
1 | Calculated based on average shares outstanding during the period. |
The accompanying Notes to Financial Statements are an integral part of these financial statements.
55
Growth & Income Fund | Financial Highlights
For a capital share outstanding throughout each year
| Year Ended March 31, | ||||||||||||||||||||
| 2023 | 2022 | 2021 | 2020 | 2019 | ||||||||||||||||
| Net asset value, beginning of year | $ | 17.89 | $ | 17.98 | $ | 13.02 | $ | 14.30 | $ | 14.87 | ||||||||||
| INCOME FROM INVESTMENT OPERATIONS: | ||||||||||||||||||||
Net investment income (loss) 1 | 0.33 | 0.27 | 0.23 | 0.23 | 0.28 | |||||||||||||||
| Net realized and unrealized gain (loss) on investments | (1.68 | ) | 1.10 | 5.35 | (0.96 | ) | 0.44 | |||||||||||||
| Total from investment operations | (1.35 | ) | 1.37 | 5.58 | (0.73 | ) | 0.72 | |||||||||||||
| LESS DISTRIBUTIONS: | ||||||||||||||||||||
| From net investment income | (0.31 | ) | (0.54 | ) | (0.11 | ) | (0.18 | ) | (0.37 | ) | ||||||||||
| From net realized gain | (1.01 | ) | (0.92 | ) | (0.51 | ) | (0.37 | ) | (0.92 | ) | ||||||||||
| Total distributions | (1.32 | ) | (1.46 | ) | (0.62 | ) | (0.55 | ) | (1.29 | ) | ||||||||||
| Net asset value, end of year | $ | 15.22 | $ | 17.89 | $ | 17.98 | $ | 13.02 | $ | 14.30 | ||||||||||
| Total return | (7.33 | )% | 7.46 | % | (43.15 | )% | (5.67 | )% | 5.69 | % | ||||||||||
| SUPPLEMENTAL DATA: | ||||||||||||||||||||
| Net assets, end of year (millions) | $ | 151.9 | $ | 171.0 | $ | 157.3 | $ | 110.0 | $ | 131.7 | ||||||||||
| Portfolio turnover rate | 33 | % | 34 | % | 51 | % | 51 | % | 47 | % | ||||||||||
| RATIO OF EXPENSES TO AVERAGE NET ASSETS: | ||||||||||||||||||||
| Ratio of expenses to average net assets | 0.93 | % | 0.97 | % | 1.19 | % | 1.20 | % | 1.19 | % | ||||||||||
| RATIO OF NET INVESTMENT INCOME TO AVERAGE NET ASSETS: | ||||||||||||||||||||
| Ratio of net investment income to average net assets | 2.07 | % | 1.44 | % | 1.44 | % | 1.57 | % | 1.91 | % | ||||||||||
1 | Calculated based on average shares outstanding during the period. |
The accompanying Notes to Financial Statements are an integral part of these financial statements.
56
Emerging Opportunity Fund | Financial Highlights
For a capital share outstanding throughout each year
| Year Ended March 31, | ||||||||||||||||||||
| 2023 | 2022 | 2021 | 2020 | 2019 | ||||||||||||||||
| Net asset value, beginning of year | $ | 14.04 | $ | 19.99 | $ | 10.48 | $ | 12.06 | $ | 11.73 | ||||||||||
| INCOME FROM INVESTMENT OPERATIONS: | ||||||||||||||||||||
Net investment income (loss) 1 | (0.07 | ) | (0.19 | ) | (0.18 | ) | (0.10 | ) | (0.11 | ) | ||||||||||
| Net realized and unrealized gain (loss) on investments | (1.35 | ) | (2.08 | ) | 11.81 | (0.70 | ) | 1.25 | ||||||||||||
| Total from investment operations | (1.42 | ) | (2.27 | ) | 11.63 | (0.80 | ) | 1.14 | ||||||||||||
| LESS DISTRIBUTIONS: | ||||||||||||||||||||
| From net realized gain | — | (3.68 | ) | (2.12 | ) | (0.78 | ) | (0.81 | ) | |||||||||||
| Total distributions | — | (3.68 | ) | (2.12 | ) | (0.78 | ) | (0.81 | ) | |||||||||||
| Net asset value, end of year | $ | 12.62 | $ | 14.04 | $ | 19.99 | $ | 10.48 | $ | 12.06 | ||||||||||
| Total return | (10.18 | )% | (14.14 | )% | 111.27 | % | (7.60 | )% | 11.12 | % | ||||||||||
| SUPPLEMENTAL DATA: | ||||||||||||||||||||
| Net assets, end of year (millions) | $ | 198.0 | $ | 194.2 | $ | 231.7 | $ | 90.2 | $ | 97.0 | ||||||||||
| Portfolio turnover rate | 124 | % | 133 | % | 111 | % | 213 | % | 215 | % | ||||||||||
| RATIOS OF EXPENSES TO AVERAGE NET ASSETS: | ||||||||||||||||||||
| Before fees/expenses waived or recouped | 1.22 | % | 1.17 | % | 1.19 | % | 1.24 | % | 1.22 | % | ||||||||||
| After fees/expenses waived or recouped | 1.10 | % | 1.10 | % | 1.10 | % | 1.13 | %3 | 1.25 | %2 | ||||||||||
| RATIOS OF NET INVESTMENT LOSS TO AVERAGE NET ASSETS: | ||||||||||||||||||||
| Before fees/expenses waived or recouped | (0.70 | )% | (1.05 | )% | (1.08 | )% | (0.88 | )% | (0.88 | )% | ||||||||||
| After fees/expenses waived or recouped | (0.58 | )% | (0.98 | )% | (0.99 | )% | (0.77 | )%3 | (0.91 | )%2 | ||||||||||
1 | Calculated based on average shares outstanding during the period. |
2 | Effective June 30, 2017 the Adviser agreed to contractually limit expenses for the Fund to not exceed 1.25% of average net assets. Prior to June 30, 2017, Fund expenses were limited to 1.50% of average net assets. |
3 | Effective June 30, 2019 the Adviser agreed to contractually limit expenses for the Fund to not exceed 1.10% of average net assets. Prior to June 30, 2017, Fund expenses were limited to 1.25% of average net assets. |
The accompanying Notes to Financial Statements are an integral part of these financial statements.
57
Total Return Fund | Financial Highlights
For a capital share outstanding throughout each year
| Year Ended March 31, | ||||||||||||||||||||
| 2023 | 2022 | 2021 | 2020 | 2019 | ||||||||||||||||
| Net asset value, beginning of year | $ | 9.75 | $ | 10.18 | $ | 10.08 | $ | 10.14 | $ | 9.93 | ||||||||||
| INCOME FROM INVESTMENT OPERATIONS: | ||||||||||||||||||||
Net investment income (loss) 1 | 0.16 | 0.06 | 0.12 | 0.26 | 0.33 | |||||||||||||||
| Net realized and unrealized gain (loss) on investments | (0.19 | ) | (0.40 | ) | 0.31 | 0.01 | 0.23 | |||||||||||||
| Total from investment operations | (0.03 | ) | (0.34 | ) | 0.43 | 0.27 | 0.56 | |||||||||||||
| LESS DISTRIBUTIONS: | ||||||||||||||||||||
| From net investment income | (0.16 | ) | (0.08 | ) | (0.14 | ) | (0.28 | ) | (0.34 | ) | ||||||||||
| From net realized gain | — | (0.01 | ) | (0.19 | ) | (0.05 | ) | (0.01 | ) | |||||||||||
| Total distributions | (0.16 | ) | (0.09 | ) | (0.33 | ) | (0.33 | ) | (0.35 | ) | ||||||||||
| Net asset value, end of year | $ | 9.56 | $ | 9.75 | $ | 10.18 | $ | 10.08 | $ | 10.14 | ||||||||||
| Total return | (0.26 | )% | (3.41 | )% | 4.25 | % | 2.74 | % | 5.78 | % | ||||||||||
| SUPPLEMENTAL DATA: | ||||||||||||||||||||
| Net assets, end of year (millions) | $ | 133.4 | $ | 149.5 | $ | 210.1 | $ | 158.3 | $ | 106.6 | ||||||||||
| Portfolio turnover rate | 279 | % | 311 | % | 616 | % | 214 | % | 163 | % | ||||||||||
| Portfolio turnover rate excluding | ||||||||||||||||||||
to-be-announced (“TBA”) transactions 2 | 186 | %2 | 203 | % | — | % | — | % | — | % | ||||||||||
| RATIOS OF EXPENSES TO AVERAGE NET ASSETS: | ||||||||||||||||||||
| Before fees/expenses waived or recouped | 0.67 | % | 0.65 | % | 0.65 | % | 0.66 | % | 0.67 | % | ||||||||||
| After fees/expenses waived or recouped | 0.67 | % | 0.65 | % | 0.65 | % | 0.66 | % | 0.67 | % | ||||||||||
| RATIOS OF NET INVESTMENT INCOME (LOSS) TO AVERAGE NET ASSETS: | ||||||||||||||||||||
| Before fees/expenses waived or recouped | 1.72 | % | 0.59 | % | 1.18 | % | 2.51 | % | 3.27 | % | ||||||||||
| After fees/expenses waived or recouped | 1.72 | % | 0.59 | % | 1.18 | % | 2.51 | % | 3.26 | % | ||||||||||
1 | Calculated based on average shares outstanding during the period. |
2 | See Note (1.D.) and (1.E.) regarding TBA transactions and mortgage dollar rolls. |
The accompanying Notes to Financial Statements are an integral part of these financial statements.
58
Short Duration Credit Fund 1 | Financial Highlights
For a capital share outstanding throughout each period/year
| Period | |||||||||||||||||||||||
| Ended | |||||||||||||||||||||||
| March 31, | Year Ended April 30, | ||||||||||||||||||||||
2023 2 | 2022 | 2021 | 2020 | 2019 | 2018 | ||||||||||||||||||
| Net asset value, beginning of period/year | $ | 9.12 | $ | 9.66 | $ | 9.15 | $ | 9.99 | $ | 9.95 | $ | 9.97 | |||||||||||
| INCOME FROM INVESTMENT OPERATIONS: | |||||||||||||||||||||||
Net investment income (loss) 3 | 0.53 | 0.43 | 0.40 | 0.39 | 0.35 | 0.25 | |||||||||||||||||
| Net realized and unrealized | |||||||||||||||||||||||
| gain (loss) on investments | (0.94 | ) | (0.54 | ) | 0.53 | (0.83 | ) | 0.03 | (0.02 | ) | |||||||||||||
| Total from investment operations | (0.41 | ) | (0.11 | ) | 0.93 | (0.44 | ) | 0.38 | 0.23 | ||||||||||||||
| Paid-in-capital redemption fees | — | 0.00 | 4 | 0.00 | 4 | 0.00 | 4 | 0.00 | 4 | 0.00 | 4 | ||||||||||||
| LESS DISTRIBUTIONS: | |||||||||||||||||||||||
| From net investment income | (0.54 | ) | (0.43 | ) | (0.42 | ) | (0.40 | ) | (0.34 | ) | (0.25 | ) | |||||||||||
| From net realized gain | — | — | — | — | — | — | |||||||||||||||||
| Total distributions | (0.54 | ) | (0.43 | ) | (0.42 | ) | (0.40 | ) | (0.34 | ) | (0.25 | ) | |||||||||||
| Net asset value, end of period/year | $ | 8.17 | $ | 9.12 | $ | 9.66 | $ | 9.15 | $ | 9.99 | $ | 9.95 | |||||||||||
| Total return | (4.53 | )%5 | (1.30 | )% | 10.33 | % | (4.63 | )% | 3.92 | % | 2.28 | % | |||||||||||
| SUPPLEMENTAL DATA: | |||||||||||||||||||||||
| Net assets, end of period/year (millions) | $ | 173.9 | $ | 217.6 | $ | 230.8 | $ | 305.2 | $ | 377.4 | $ | 279.0 | |||||||||||
| Portfolio turnover rate | 22 | %5 | 131 | % | 94 | % | 95 | % | 135 | % | 152 | % | |||||||||||
| RATIOS OF EXPENSES TO AVERAGE NET ASSETS: | |||||||||||||||||||||||
| Before fees/expenses waived or recouped | 1.02 | %6 | 0.99 | %7 | 1.05 | % | 1.01 | % | 1.01 | % | 1.27 | % | |||||||||||
| After fees/expenses waived or recouped | 0.97 | %6 | 0.99 | %7 | 1.05 | % | 1.01 | % | 1.01 | % | 1.27 | % | |||||||||||
| RATIOS OF NET INVESTMENT INCOME TO AVERAGE NET ASSETS: | |||||||||||||||||||||||
| Before fees/expenses waived or recouped | 6.74 | %6 | 4.46 | % | 4.28 | % | 3.97 | % | 3.48 | % | 2.51 | % | |||||||||||
| After fees/expenses waived or recouped | 6.79 | %6 | 4.46 | % | 4.28 | % | 3.97 | % | 3.48 | % | 2.51 | % | |||||||||||
1 | Activity presented prior to close of business October 7, 2022, represents the historical operating results of the Zeo Short Duration Income Fund. See Note 9 in Notes to Financial Statements. |
2 | The Osterweis Short Duration Credit Fund changed fiscal year end from April 30 to March 31 effective close of business October 7, 2022. Amounts shown reflect the activity for the 11 months ended March 31, 2023. |
3 | Calculated based on average shares outstanding during the period. |
4 | Less than $0.005 per share. |
5 | Not annualized. |
6 | Annualized. |
7 | Effective July 1, 2021, the operating expense limitation was reduced to 0.99% from 1.25%. |
The accompanying Notes to Financial Statements are an integral part of these financial statements.
59
Sustainable Credit Fund 1 | Financial Highlights
For a capital share outstanding throughout each period/year
| Period | Period | |||||||||||||||
| Ended | Ended | |||||||||||||||
| March 31, | Year Ended April 30, | April 30, | ||||||||||||||
2023 2 | 2022 | 2021 | 2020 3 | |||||||||||||
| Net asset value, beginning of period/year | $ | 9.16 | $ | 9.67 | $ | 9.14 | $ | 10.00 | ||||||||
| INCOME FROM INVESTMENT OPERATIONS: | ||||||||||||||||
Net investment income (loss) 4 | 0.63 | 0.45 | 0.33 | 0.25 | ||||||||||||
| Net realized and unrealized gain (loss) on investments | (1.04 | ) | (0.43 | ) | 0.52 | (0.89 | ) | |||||||||
| Total from investment operations | (0.41 | ) | 0.02 | 0.85 | (0.64 | ) | ||||||||||
| Paid-in-capital redemption fees | — | 0.00 | 5 | — | 0.00 | 5 | ||||||||||
| LESS DISTRIBUTIONS: | ||||||||||||||||
| From net investment income | (0.64 | ) | (0.53 | ) | (0.32 | ) | (0.22 | ) | ||||||||
| From net realized gain | (0.02 | ) | — | — | — | |||||||||||
| Total distributions | (0.66 | ) | — | — | — | |||||||||||
| Net asset value, end of period/year | $ | 8.09 | $ | 9.16 | $ | 9.67 | $ | 9.14 | ||||||||
| Total return | (4.56 | )%6 | 0.04 | % | 9.41 | % | (6.53 | )%6 | ||||||||
| SUPPLEMENTAL DATA: | ||||||||||||||||
| Net assets, end of period/year (millions) | $ | 4.8 | $ | 6.4 | $ | 19.4 | $ | 10.3 | ||||||||
| Portfolio turnover rate | 37 | %6 | 69 | % | 75 | % | 62 | %6 | ||||||||
| RATIOS OF EXPENSES TO AVERAGE NET ASSETS: | ||||||||||||||||
| Before fees/expenses waived or recouped | 3.36 | %7 | 2.32 | % | 1.66 | % | 2.51 | %7 | ||||||||
| After fees/expenses waived or recouped | 0.99 | %7 | 1.08 | %8 | 1.25 | % | 1.25 | %7 | ||||||||
| RATIOS OF NET INVESTMENT INCOME TO AVERAGE NET ASSETS: | ||||||||||||||||
| Before fees/expenses waived or recouped | 5.71 | %7 | 3.48 | % | 3.07 | % | 1.58 | %7 | ||||||||
| After fees/expenses waived or recouped | 8.08 | %7 | 4.72 | % | 3.48 | % | 2.85 | %7 | ||||||||
1 | Activity presented prior to close of business October 7, 2022, represents the historical operating results of the Zeo Sustainable Credit Fund. See Note 9 in Notes to Financial Statements. |
2 | The Osterweis Sustainable Credit Fund changed fiscal year end from April 30 to March 31 effective close of business October 7, 2022. Amounts shown reflect the activity for the 11 months ended March 31, 2023. |
3 | The fund commenced operations on June 5, 2019. |
4 | Calculated based on average shares outstanding during the period. |
5 | Less than $0.005 per share. |
6 | Not Annualized. |
7 | Annualized. |
8 | Effective July 1, 2021, the operating expense limitation was reduced to 0.99% from 1.25%. |
The accompanying Notes to Financial Statements are an integral part of these financial statements.
60
Osterweis Funds | Notes to Financial Statements at March 31, 2023
| Note 1 – Organization |
The Osterweis Fund, Osterweis Strategic Income Fund, Osterweis Growth & Income Fund, Osterweis Emerging Opportunity Fund, Osterweis Total Return Fund, Osterweis Short Duration Credit Fund, and Osterweis Sustainable Credit Fund (each a “Fund”, collectively the “Funds”) are diversified series of shares of beneficial interest of Professionally Managed Portfolios (the “Trust”), which is registered under the Investment Company Act of 1940, as amended (the “1940 Act”) as an open-end management investment company. The Funds are investment companies and accordingly follow the investment company accounting and reporting guidance of the Financial Accounting Standards Board (FASB) Accounting Standard Codification Topic 946 “Financial Services — Investment Companies.” The Funds commenced operations on October 1, 1993, August 30, 2002, August 31, 2010, November 30, 2016, December 30, 2016, May 31, 2011, and June 5, 2019, respectively.
The investment objective of the Osterweis Fund is to attain long-term total returns, which it seeks by investing primarily in equity securities. The investment objective of the Osterweis Strategic Income Fund is to preserve capital and attain long- term total returns through a combination of current income and moderate capital appreciation, which it seeks by investing primarily in income bearing securities. The investment objective of the Osterweis Growth & Income Fund is to attain long- term total returns and capital preservation, which it seeks by investing in both equity and fixed income securities that the Adviser believes can deliver attractive long-term returns and enhanced capital preservation. The investment objective of the Osterweis Emerging Opportunity Fund is to attain long-term capital appreciation. The investment objective of the Osterweis Total Return Fund is to preserve capital and attain long-term total returns through a combination of current income and moderate capital appreciation. The investment objective of the Osterweis Short Duration Credit Fund is to seek low volatility and absolute returns consisting of income and moderate capital appreciation. The investment objective of the Osterweis Sustainable Credit Fund is to seek risk-adjustment total returns consisting of income and moderate capital appreciation. Osterweis Capital Management, Inc. and Osterweis Capital Management, LLC may be referred to individually or collectively as the “Adviser” or “Advisers” throughout this report.
| Note 2 – Significant Accounting Policies |
The following is a summary of significant accounting policies consistently followed by the Funds. These policies are in conformity with accounting principles generally accepted in the United States of America (“U.S. GAAP”).
| A. | Security Valuation. All equity securities, which may include Real Estate Investment Trusts (“REITs”), Business Development Companies (“BDCs”) and Master Limited Partnerships (“MLPs”), that are traded on U.S. national or foreign securities exchanges are valued either at the last reported sale price on the exchange on which the security is principally traded or the exchange’s official closing price. If, on a particular day, an exchange-traded security does not trade, then the mean between the most recent quoted bid and asked prices will be used. All equity securities which may include REITs, BDCs and MLPs that are not traded on a listed exchange are valued at the last sale price in the over-the-counter market. If a non-exchange traded security does not trade on a particular day, then the mean between the last quoted closing bid and asked price will be used. | |
| Debt securities, including short-term debt instruments having a maturity of less than 60 days, are valued by using the evaluated mean price supplied by an approved independent pricing service. The independent pricing service may use various valuation methodologies including matrix pricing and other analytical pricing models as well as market transactions and dealer quotations. These models generally consider such factors as yields or prices of bonds of comparable quality, type of issue, coupon, maturity, ratings and general market conditions. In the absence of a price from a pricing service, securities are valued at their respective fair values as determined in good faith by the Valuation Committee until September 7, 2022. After which Rule 2a-5 became effective. | ||
| Futures contracts are priced by an approved independent pricing service. Futures contracts are valued at the settlement price on the exchange on which they are principally traded. | ||
| Prior to the compliance date of Rule 2a-5 of the 1940 Act (“Rule 2a-5”) on September 8, 2022, the Board of Trustees (the “Board”) had delegated day-to-day valuation issues to a Valuation Committee of the Trust which is comprised of representatives from the Funds’ administrator, U.S. Bancorp Fund Services, LLC, doing business as U.S. Bank Global Fund Services (“Fund Services”). The function of the Valuation Committee was to value securities where current and reliable market quotations are not readily available or the closing price does not represent fair value by following procedures approved by the Board. These procedures considered many factors, |
61
Osterweis Funds | Notes to Financial Statements at March 31, 2023 (Continued)
| including the type of security, size of holding, trading volume and news events. All actions taken by the Valuation Committee were subsequently reviewed and ratified by the Board. The Valuation Committee served until September 7, 2022. Effective September 8, 2022, the Board approved Osterweis Capital Management (the “Adviser”), as the Funds’ valuation designee under Rule 2a-5 which shall determine fair value of securities for which readily available market quotes are not available in accordance with procedures approved by the Board. | ||
| As described above, the Funds utilize various methods to measure the fair value of their investments on a recurring basis. U.S. GAAP establishes a hierarchy that prioritizes inputs to valuation methods. The three levels of inputs are: |
| Level 1 – | Unadjusted quoted prices in active markets for identical assets or liabilities that the Funds have the ability to access. | |
| Level 2 – | Observable inputs other than quoted prices included in Level 1 that are observable for the asset or liability, either directly or indirectly. These inputs may include quoted prices for the identical instrument on an inactive market, prices for similar instruments, interest rates, prepayment speeds, credit risk, yield curves, default rates and similar data. | |
| Level 3 – | Unobservable inputs for the asset or liability, to the extent relevant observable inputs are not available, representing the Funds’ own assumptions about the assumptions a market participant would use in valuing the asset or liability, and would be based on the best information available. |
| The availability of observable inputs can vary from security to security and is affected by a wide variety of factors, including, for example, the type of security, whether the security is new and not yet established in the marketplace, the liquidity of markets, and other characteristics particular to the security. To the extent that valuation is based on models or inputs that are less observable or unobservable in the market, the determination of fair value requires more judgment. Accordingly, the degree of judgment exercised in determining fair value is greatest for instruments categorized in Level 3. | ||
| The inputs used to measure fair value may fall into different levels of the fair value hierarchy. In such cases, for disclosure purposes, the level in the fair value hierarchy within which the fair value measurement falls in its entirety is determined based on the lowest level input that is significant to the fair value measurement in its entirety. | ||
| The following is a summary of the inputs used to value the Funds’ investments and derivative positions as of March 31, 2023: | ||
| The following is a summary of the inputs used to value the Fund’s investments as of March 31, 2023: |
| Osterweis Fund | Level 1 | Level 2 | Level 3 | Total | |||||||||||||
| Assets: | |||||||||||||||||
Common Stocks 1 | $ | 129,735,876 | $ | — | $ | — | $ | 129,735,876 | |||||||||
| Short-Term Investments | 6,861,929 | 2,993,942 | — | 9,855,871 | |||||||||||||
| Total Assets: | $ | 136,597,805 | $ | 2,993,942 | $ | — | $ | 139,591,747 | |||||||||
1 See Schedule of Investments for industry breakouts. | |||||||||||||||||
| The following is a summary of the inputs used to value the Fund’s investments as of March 31, 2023: |
| Osterweis Strategic Income Fund | Level 1 | Level 2 | Level 3 | Total | |||||||||||||
| Assets: | |||||||||||||||||
Common Stocks 1,2 | $ | — | $ | — | $ | 157,804,479 | $ | 157,804,479 | |||||||||
Convertible Preferred Stocks 1,2 | 5,868,240 | — | 46,512,760 | 52,381,000 | |||||||||||||
Corporate Bonds 1 | — | 3,475,050,058 | — | 3,475,050,058 | |||||||||||||
Convertible Bonds 1 | — | 268,856,761 | — | 268,856,761 | |||||||||||||
Private Mortgage Backed Obligations 2 | — | — | 10,602,149 | 10,602,149 | |||||||||||||
Warrants 1 | 1,234,557 | — | — | 1,234,557 | |||||||||||||
| Short-Term Investments | 357,232,823 | 323,067,936 | — | 680,300,759 | |||||||||||||
| Total Assets: | $ | 364,335,620 | $ | 4,066,974,755 | $ | 214,919,388 | $ | 4,646,229,763 | |||||||||
1 See Schedule of Investments for industry breakouts. | |||||||||||||||||
2 See Schedule of Investments for disclosure of Level 3 securities. | |||||||||||||||||
62
Osterweis Funds | Notes to Financial Statements at March 31, 2023 (Continued)
| The following is a reconciliation of the Fund’s Level 3 assets for which significant unobservable inputs were used to determine fair value: |
| Private | |||||||||||||||||||||||||
| Convertible | Mortgage | ||||||||||||||||||||||||
| Common | Preferred | Corporate | Backed | ||||||||||||||||||||||
| Stocks | Stocks | Bonds 1 | Obligations | Warrants | Total | ||||||||||||||||||||
| Balance as of March 31, 2022 | $ | 153,957,917 | $ | 56,471,128 | $ | 13,002,248 | $ | 15,204,037 | $ | 514,300 | $ | 239,149,630 | |||||||||||||
| Acquisitions | — | — | — | — | — | — | |||||||||||||||||||
| Dispositions | (1,495,000 | ) | — | — | — | — | (1,495,000 | ) | |||||||||||||||||
| Accrued discounts/premiums | — | — | 66,368 | — | — | 66,368 | |||||||||||||||||||
| Realized gain (loss) | 51,185 | — | — | — | — | 51,185 | |||||||||||||||||||
| Change in unrealized | |||||||||||||||||||||||||
| appreciation/depreciation | 5,290,377 | (9,958,368 | ) | (66,368 | ) | (4,601,888 | ) | — | (9,336,247 | ) | |||||||||||||||
| Transfer in and/or out of Level 3 | — | — | (13,002,248 | ) | — | (514,300 | ) | (13,516,548 | ) | ||||||||||||||||
| Balance as of March 31, 2023 | $ | 157,804,479 | $ | 46,512,760 | $ | — | $ | 10,602,149 | $ | — | $ | 214,919,388 | |||||||||||||
| Change in unrealized | |||||||||||||||||||||||||
| appreciation/depreciation | |||||||||||||||||||||||||
| for Level 3 investments | |||||||||||||||||||||||||
| held at March 31, 2023 | $ | 5,290,377 | $ | (9,958,368 | ) | $ | (66,368 | ) | $ | (4,601,888 | ) | $ | — | $ | (9,336,247 | ) | |||||||||
1 Transfer made out of Level 3 due to security being paid off and no longer held. | |||||||||||||||||||||||||
| Fair Value | ||||||||
| Type of Security | at 3/31/23 | Valuation Techniques | Unobservable Input | Input Value(s) | ||||
| Common Stocks | Market Comparable | Discount Rate, | ||||||
| Approach | EBITDA Multiple | 3.0%/5.5x | ||||||
| Broker Quotes | Market Data | $22.75 | ||||||
| $ | 157,804,479 | Estimated Proceeds | Market Data | $0.0007514 | ||||
| Convertible | Convertible | |||||||
| Preferred Stocks | $ | 46,512,760 | Valuation Model | Adjustment to yield | 550 bps | |||
| Private Mortgage | ||||||||
| Backed Obligations | $ | 10,602,149 | Discounted Cash Flow | Adjustment to yield | 344 bps | |||
| Significant increases (decreases) in any of those inputs in isolation would result in a significantly higher (lower) fair value measurement. Increases in the adjustment to yield would decrease price and decreases in the adjustment to yield would increase price. | ||
| The Valuation Committee oversaw valuation techniques though September 7, 2022. Effective September 8, 2022, the Adviser, as the Fund’s Valuation Designee, oversees valuation techniques. | ||
| The following is a summary of the inputs used to value the Fund’s investments as of March 31, 2023: |
| Osterweis Growth & Income Fund | Level 1 | Level 2 | Level 3 | Total | |||||||||||||
| Assets: | |||||||||||||||||
Common Stocks 1,2 | $ | 87,666,660 | $ | — | $ | 1,126,533 | $ | 88,793,193 | |||||||||
Convertible Preferred Stocks 1,2 | 119,760 | — | 949,240 | 1,069,000 | |||||||||||||
Partnerships & Trusts 1 | 2,707,845 | — | — | 2,707,845 | |||||||||||||
Corporate Bonds 1 | — | 32,620,546 | — | 32,620,546 | |||||||||||||
Convertible Bonds 1 | — | 3,277,565 | — | 3,277,565 | |||||||||||||
Private Mortgage Backed Obligations 1,2 | — | — | 312,128 | 312,128 | |||||||||||||
Warrants 1 | 6,746 | — | — | 6,746 | |||||||||||||
| Short-Term Investments | 14,255,774 | 8,979,039 | — | 23,234,813 | |||||||||||||
| Total Assets: | $ | 104,756,785 | $ | 44,877,150 | $ | 2,387,901 | $ | 152,021,836 | |||||||||
1 See Schedule of Investments for industry breakouts. | |||||||||||||||||
2 See Schedule of Investments for disclosure of Level 3 securities. | |||||||||||||||||
63
Osterweis Funds | Notes to Financial Statements at March 31, 2023 (Continued)
| The following is a reconciliation of the Fund’s Level 3 assets for which significant unobservable inputs were used to determine fair value: |
| Private | |||||||||||||||||||||||||
| Convertible | Mortgage | ||||||||||||||||||||||||
| Common | Preferred | Corporate | Backed | ||||||||||||||||||||||
| Stocks | Stocks | Bonds 1 | Obligations | Warrants | Total | ||||||||||||||||||||
| Balance as of March 31, 2022 | $ | 1,058,331 | $ | 1,152,472 | $ | 220,377 | $ | 447,608 | $ | 2,810 | $ | 2,881,598 | |||||||||||||
| Acquisitions | — | — | — | — | — | — | |||||||||||||||||||
| Dispositions | (130,000 | ) | — | — | — | — | (130,000 | ) | |||||||||||||||||
| Accrued discounts/premiums | — | — | 981 | — | — | 981 | |||||||||||||||||||
| Realized gain (loss) | 4,370 | — | — | — | — | 4,370 | |||||||||||||||||||
| Change in unrealized | |||||||||||||||||||||||||
| appreciation/depreciation | 193,832 | (203,232 | ) | (981 | ) | (135,480 | ) | — | (145,861 | ) | |||||||||||||||
| Transfer in and/or out of Level 3 | — | — | (220,377 | ) | — | (2,810 | ) | (223,187 | ) | ||||||||||||||||
| Balance as of March 31, 2023 | $ | 1,126,533 | $ | 949,240 | $ | — | $ | 312,128 | $ | — | $ | 2,387,901 | |||||||||||||
| Change in unrealized | |||||||||||||||||||||||||
| appreciation/depreciation | |||||||||||||||||||||||||
| for Level 3 investments | |||||||||||||||||||||||||
| held at March 31, 2023 | $ | 193,832 | $ | (203,232 | ) | $ | (981 | ) | $ | (135,480 | ) | $ | — | $ | (145,861 | ) | |||||||||
1 Transfer made out of Level 3 due to security being paid off and no longer held. | |||||||||||||||||||||||||
| Fair Value | ||||||||
| Type of Security | at 3/31/23 | Valuation Techniques | Unobservable Input | Input Value(s) | ||||
| Common Stocks | Market Comparable | Discount Rate, | ||||||
| Approach | EBITDA Multiple | 3.0%/5.5x | ||||||
| Broker Quotes | Market Data | $22.75 | ||||||
| $ | 1,126,533 | Estimated Proceeds | Market Data | $0.0007514 | ||||
| Convertible | Convertible | |||||||
| Preferred Stocks | $ | 949,240 | Valuation Model | Adjustment to yield | 550 bps | |||
| Private Mortgage | ||||||||
| Backed Obligations | $ | 312,128 | Discounted Cash Flow | Adjustment to yield | 344 bps | |||
| Significant increases (decreases) in any of those inputs in isolation would result in a significantly higher (lower) fair value measurement. Increases in the adjustment to yield would decrease price and decreases in the adjustment to yield would increase price. | ||
| The Valuation Committee oversaw valuation techniques though September 7, 2022. Effective September 8, 2022, the Adviser, as the Fund’s Valuation Designee, oversees valuation techniques. | ||
| The following is a summary of the inputs used to value the Fund’s investments as of March 31, 2023: |
| Osterweis Emerging | |||||||||||||||||
| Opportunity Fund | Level 1 | Level 2 | Level 3 | Total | |||||||||||||
| Assets: | |||||||||||||||||
Common Stocks 1 | $ | 186,659,063 | $ | — | $ | — | $ | 186,659,063 | |||||||||
| Short-Term Investments | 14,868,686 | — | — | 14,868,686 | |||||||||||||
| Total Assets: | $ | 201,527,749 | $ | — | $ | — | $ | 201,527,749 | |||||||||
1 See Schedule of Investments for industry breakouts. | |||||||||||||||||
64
Osterweis Funds | Notes to Financial Statements at March 31, 2023 (Continued)
| The following is a summary of the inputs used to value the Fund’s investments as of March 31, 2023: |
| Osterweis Total Return Fund | Level 1 | Level 2 | Level 3 | Total | |||||||||||||
| Assets: | |||||||||||||||||
Corporate Bonds 1 | $ | — | $ | 24,073,575 | $ | — | $ | 24,073,575 | |||||||||
Asset Backed Securities 2 | — | 20,293,538 | 1,422,690 | 21,716,228 | |||||||||||||
| Commercial Mortgage-Backed Securities | — | 1,879,895 | — | 1,879,895 | |||||||||||||
| Mortgage Backed Securities | — | 46,210,010 | — | 46,210,010 | |||||||||||||
| United States Government Notes/Bonds | — | 24,657,247 | — | 24,657,247 | |||||||||||||
| Short-Term Investments | 10,707,381 | 5,920,310 | — | 16,627,691 | |||||||||||||
| Total Assets: | $ | 10,707,381 | $ | 123,034,575 | $ | 1,422,690 | $ | 135,164,646 | |||||||||
1 | See Schedule of Investments for industry breakouts. | |
2 | See Schedule of Investments for disclosure of Level 3 securities. |
| The Following is a reconciliation of the Fund's Level 3 assets for which significant unobservable inputs were used to determine fair value: |
| Asset Backed Securities | |||||
| Balance as of March 31, 2022 | $ | — | |||
| Acquisitions | 1,498,200 | ||||
| Dispositions | (75,601 | ) | |||
| Accrued discounts/premiums | — | ||||
| Realized gain (loss) | 91 | ||||
| Change in unrealized appreciation/depreciation | — | ||||
| Transfer in and/or out of Level 3 | — | ||||
| Balance as of March 31, 2023 | $ | 1,422,690 | |||
| Change in unrealized appreciation/depreciation for | |||||
| Level 3 investments held at March 31, 2023 | $ | — | |||
| Fair Value | ||||||||
| Type of Security | at 3/31/23 | Valuation Techniques | Unobservable Input | Input Value(s) | ||||
| Asset Backed Securities | $ | 1,422,690 | Issue Price | Market Data | $99.88 | |||
| Significant increases (decreases) in any of those inputs in isolation would result in a significantly higher (lower) fair value measurement. Increases in the adjustment to yield would decrease price and decreases in the adjustment to yield would increase price. | ||
| The Adviser, as the Funds' Valuation Designee, oversees valuation techniques. | ||
| The following is a summary of the inputs used to value the Fund’s investments as of March 31, 2023: |
| Osterweis Short Duration | |||||||||||||||||
| Credit Fund | Level 1 | Level 2 | Level 3 | Total | |||||||||||||
| Assets: | |||||||||||||||||
Corporate Bonds 1 | $ | — | $ | 99,823,209 | $ | — | $ | 99,823,209 | |||||||||
| Bank Loans | — | 39,967,984 | — | 39,967,984 | |||||||||||||
| Short-Term Investments | 32,418,396 | — | — | 32,418,396 | |||||||||||||
| Total Assets: | $ | 32,418,396 | $ | 139,791,193 | $ | — | $ | 172,209,589 | |||||||||
1 | See Schedule of Investments for industry breakouts. |
65
Osterweis Funds | Notes to Financial Statements at March 31, 2023 (Continued)
| The following is a reconciliation of the Fund’s Level 3 assets for which significant unobservable inputs were used to determine fair value: |
| Corporate Bonds | |||||
| Balance as of April 30, 2022 | $ | 298,881 | |||
| Acquisitions | — | ||||
| Dispositions | 323,600 | ||||
| Accrued discounts/premiums | — | ||||
| Realized gain (loss) | (22,718,236 | ) | |||
| Change in unrealized appreciation/depreciation | 22,095,755 | ||||
| Transfer in and/or out of Level 3 | — | ||||
| Balance as of March 31, 2023 | $ | — | |||
| Change in unrealized appreciation/depreciation for | |||||
| Level 3 investments held at March 31, 2023 | $ | 22,095,755 | |||
| The Adviser, as the Funds’ Valuation Designee, oversees valuation techniques. | ||
| The following is a summary of the inputs used to value the Fund’s investments as of March 31, 2023: |
| Osterweis Sustainable Credit Fund | Level 1 | Level 2 | Level 3 | Total | |||||||||||||
| Assets: | |||||||||||||||||
Corporate Bonds 1 | $ | — | $ | 2,464,118 | $ | — | $ | 2,464,118 | |||||||||
| Bank Loans | — | 1,537,864 | — | 1,537,864 | |||||||||||||
| Short-Term Investments | 727,546 | — | — | 727,546 | |||||||||||||
| Total Assets: | $ | 727,546 | $ | 4,001,982 | $ | — | $ | 4,729,528 | |||||||||
1 | See Schedule of Investments for industry breakouts. |
| The following is a reconciliation of the Fund’s Level 3 assets for which significant unobservable inputs were used to determine fair value: |
| Corporate Bonds | |||||
| Balance as of April 30, 2022 | $ | 11,847 | |||
| Acquisitions | — | ||||
| Dispositions | 12,827 | ||||
| Accrued discounts/premiums | — | ||||
| Realized gain (loss) | (711,424 | ) | |||
| Change in unrealized appreciation/depreciation | 686,750 | ||||
| Transfer in and/or out of Level 3 | — | ||||
| Balance as of March 31, 2023 | $ | — | |||
| Change in unrealized appreciation/depreciation | |||||
| for Level 3 investments held at March 31, 2023 | $ | 686,750 | |||
| The Adviser, as the Funds’ Valuation Designee, oversees valuation techniques. | ||
| The Funds have provided additional disclosures below regarding derivatives and hedging activity intending to improve financial reporting by enabling investors to understand how and why the Funds use futures contracts (a type of derivative), how they are accounted for and how they affect an entity’s results of operations and financial position. The Funds may use derivatives for risk management purposes or as part of its investment strategies. Derivatives are financial contracts whose values depend on, or are derived from, the value of an underlying asset, reference rate or index. The Funds may use derivatives to earn income and enhance returns, to hedge or adjust the risk profile of its portfolio, to replace more traditional direct investments and to obtain exposure to otherwise inaccessible markets. | ||
| Rule 18f-4 imposes limits on the amount of derivatives a fund can enter into, eliminates the asset segregation framework currently used by funds to comply with Section 18 of the 1940 Act, treats derivatives as senior |
66
Osterweis Funds | Notes to Financial Statements at March 31, 2023 (Continued)
| securities and requires funds whose use of derivatives is more than a limited specified exposure amount to establish and maintain a comprehensive derivatives risk management program and appoint a derivatives risk manager. Effective August 19, 2022, the Osterweis Total Return Fund has adopted a Full Derivatives Fund Program and the Adviser has nominated a Derivative Risk Manager. | ||
| The average notional amount for futures contracts is based on the monthly notional amounts. The notional amount for futures contracts represents the U.S. dollar value of the contract as of the day of opening the transaction or latest contract reset date. The Osterweis Total Return Fund’s average notional value of futures contracts outstanding during the year ended March 31, 2023, was $55,162,750. The following table shows the effects of derivative instruments on the financial statements. | ||
| Statements of Operations | ||
| The effect of derivative instruments on the Statements of Operations for the year ended March 31, 2023: | ||
| Osterweis Total Return Fund |
| Change in Unrealized | ||||
| Location of Gain (Loss) | Realized Gain | Appreciation/Depreciation | ||
| on Derivatives | (Loss) on Derivatives | on Derivatives | ||
Instrument | Recognized in Income | Recognized in Income | Recognized in Income | |
| Interest Rate | Realized and Unrealized Gain | |||
| Contracts — Futures | (Loss) on Investments | $3,697,417 | $(63,353) |
| The Osterweis Fund, Osterweis Strategic Income Fund, Osterweis Growth & Income Fund, Osterweis Emerging Opportunity Fund, Osterweis Short Duration Credit Fund, and Osterweis Sustainable Credit Fund did not have derivatives activity during the year/period ended March 31, 2023. | ||
| B. | Foreign Currency. Foreign currency amounts, other than the cost of investments, are translated into U.S. dollar values based upon the spot exchange rate prior to the close of regular trading. The cost of investments is translated at the rates of exchange prevailing on the dates the portfolio securities were acquired. The Funds include foreign exchange gains and losses from dividends receivable, interest receivable and other foreign currency denominated payables and receivables in Change in net unrealized appreciation/depreciation on foreign currency translation and Net realized gain (loss) on foreign currency translation. The Funds do not isolate that portion of realized and unrealized gain (loss) on investments resulting from changes in foreign exchange rates on investments from fluctuations arising from changes in the market price of securities for financial reporting purposes. Fluctuations in foreign exchange rates on investments are thus included in Change in net unrealized appreciation/depreciation on investments and Net realized gain (loss) on investments. | |
| C. | Futures Contracts. Each Fund may purchase or sell futures contracts and options thereon to hedge against changes in interest rates, securities (through index futures or options) or currencies. The purchase of futures contracts may be more efficient or cost-effective than buying the underlying securities or assets. A futures contract is an agreement that obligates the buyer to buy and the seller to sell a specified quantity of an underlying asset (or settle for cash the value of a contract based on an underlying asset, rate or index) at a specific price on the contract maturity date. Upon entering into a futures contract, each Fund is required to pledge to the counterparty an amount of cash, U.S. Government securities or other high-quality debt securities equal to the minimum “initial margin” requirements of the exchange or the broker. Pursuant to a contract entered into with a futures commission merchant, each Fund agrees to receive from or pay to the firm an amount of cash equal to the cumulative daily fluctuation in the value of the contract. Such receipts or payments are known as “variation margin” and are recorded by the Funds as unrealized gains or losses. When the contract is closed, the Funds record a gain or loss equal to the difference between the value of the contract at the time it was opened and the value at the time it was closed. Each Fund will cover its current obligations under futures contracts by the segregation of liquid assets or by entering into offsetting transactions or owning positions covering its obligations. The Funds’ use of futures contracts may involve risks that are different from, or possibly greater than, the risk associated with investing directly in securities or other more traditional instruments. These risks include the risk that the value of |
67
Osterweis Funds | Notes to Financial Statements at March 31, 2023 (Continued)
| the futures contracts may not correlate perfectly, or at all, with the value of the assets, reference rates or indices that they are designed to track. Other risks include: an illiquid secondary market for a particular instrument and possible exchange-imposed price fluctuation limits, either of which may make it difficult or impossible to close out a position when desired; the risk that adverse price movements in an instrument can result in a loss substantially greater than the Funds’ initial investment in that instrument (in some cases, the potential loss is unlimited); and the risk that a counterparty will not perform its obligations. The Osterweis Total Return Fund had futures contracts activity during the year ended March 31, 2023. Realized and unrealized gains and losses are included in the Statements of Operations. The Osterweis Fund, Osterweis Strategic Income Fund, Osterweis Growth & Income Fund, Osterweis Emerging Opportunity Fund, Osterweis Short Duration Credit Fund, and Osterweis Sustainable Credit Fund did not have futures contracts activity during the year/period ended March 31, 2023. | ||
| D. | To-be-announced (“TBA”) Commitments. Each Fund may enter into TBA purchase commitments. In a TBA transaction, the TBA unit price and the estimated principal amount are established when a Fund enters into a contract, with the actual principal amount being within a specified range of the estimate. Securities purchased on a TBA basis are not settled until they are delivered to the Fund, which can be 15 to 45 days later. Beginning on the date the Fund enters into a TBA transaction, cash, U.S. government securities or other liquid securities are segregated in an amount equal in value to the purchase price of the TBA security. The Funds may enter into TBA sale commitments to hedge their portfolio positions or to sell securities they own under delayed delivery arrangements. Proceeds of TBA sale commitments are not received until the contractual settlement date. Unsettled TBA sale commitments are valued at current market value of the underlying securities. If the TBA sale commitment is closed through the acquisition of an offsetting purchase commitment, a Fund realizes a gain or loss on the commitment without regard to any unrealized gain or loss on the underlying security. If a Fund delivers securities under the commitment, the Fund realizes a gain or loss from the sale of the securities based upon the unit price established at the date the commitment was entered. Transactions in TBAs are accounted for as purchases and sales and may result in an increase to the Fund’s portfolio turnover rate. The Osterweis Total Return Fund had TBAs during the year ended March 31, 2023. The Osterweis Fund, Osterweis Strategic Income Fund, Osterweis Growth & Income Fund, Osterweis Emerging Opportunity Fund, Osterweis Short Duration Credit Fund, and Osterweis Sustainable Credit Fund did not have TBA’s during the year/period ended March 31, 2023. | |
| Statements of Operations | ||
| The effect of TBA commitments on the Statements of Operations for the year ended March 31, 2023: | ||
| Osterweis Total Return Fund |
| Change in Unrealized | ||||
| Location of Gain | Realized Gain | Appreciation/Depreciation | ||
| (Loss) on Derivatives | (Loss) on Derivatives | on Derivatives | ||
Instrument | Recognized in Income | Recognized in Income | Recognized in Income | |
| TBA | Realized and Unrealized Gain | |||
| Commitments | (Loss) on Investments | $342,773 | $ — |
| E. | Mortgage Dollar Rolls. The Funds enter into mortgage dollar rolls, typically on a TBA basis. Mortgage dollar rolls are agreements between the Fund and a financial institution where the Fund sells (or buys) mortgage-backed securities for delivery on a specified date and simultaneously contracts to repurchase (or sell) substantially similar (same type, coupon, and maturity) securities at a future date and at a predetermined price. Gains or losses are realized on the initial sale, and the difference between the repurchase price and the sale price is recorded as an unrealized gain or loss to the Fund upon entering into the mortgage dollar roll. In addition, the Fund may invest the cash proceeds that are received from the initial sale. During the period between the sale and repurchase, the Fund is not entitled to principal and interest paid on the mortgage backed securities. Transactions in mortgage dollar rolls are accounted for as purchases and sales and may result in an increase to the Fund’s portfolio turnover rate. The risks of mortgage dollar roll transactions include the potential inability of the counterparty to fulfill its obligations. |
68
Osterweis Funds | Notes to Financial Statements at March 31, 2023 (Continued)
| F. | Federal Income Taxes. Each Fund has elected to be taxed as a “regulated investment company” and intends to distribute substantially all taxable income to its shareholders and otherwise comply with the provisions of the Internal Revenue Code applicable to regulated investment companies. Therefore, no provision for federal income taxes or excise taxes has been made. | |
| In order to avoid imposition of the excise tax applicable to regulated investment companies, each Fund intends to declare each year as dividends, in each calendar year, at least 98.0% of its net investment income (earned during the calendar year) and 98.2% of its net realized capital gains (earned during the twelve months ended October 31) plus undistributed amounts, if any, from prior years. | ||
| Net capital losses incurred after October 31, and within the taxable year, are deemed to arise on the first business day of each Fund’s next taxable year. Net investment losses incurred after December 31, and within the taxable year, are deemed to arise on the first business day of the Fund’s next taxable year. | ||
| As of the most recent fiscal year/period end March 31, 2023, there were $272,123 of late-year losses for Emerging Opportunity Fund. There were no post-October losses for the Funds. | ||
| As of the most recent fiscal year/period end March 31, 2023, the Funds had the following capital loss carryovers available for federal income tax purposes: |
| Capital Loss Carryovers | |||||||||
| Short-Term | Long-Term | ||||||||
| Osterweis Fund | $ | (1,370,325 | ) | $ | — | ||||
| Osterweis Strategic Income Fund | — | (417,013,678 | ) | ||||||
| Osterweis Growth & Income Fund | — | — | |||||||
| Osterweis Emerging Opportunity Fund | (37,607,519 | ) | (1,147,060 | ) | |||||
| Osterweis Total Return Fund | (3,835,209 | ) | (2,070,161 | ) | |||||
| Osterweis Short Duration Credit Fund | (7,812,652 | ) | (15,710,488 | ) | |||||
| Osterweis Sustainable Credit Fund | (108,873 | ) | (162,003 | ) | |||||
| As of March 31, 2023, the Funds did not have any tax positions that did not meet the “more likely-than-not” threshold of being sustained by the applicable tax authority. Generally, tax authorities can examine all the tax returns filed for the last three years. The Funds identify their major tax jurisdictions as U.S. Federal and the Commonwealth of Massachusetts; however, as of March 31, 2023, the Funds are not aware of any tax positions for which it is reasonably possible that the total amounts of unrecognized tax benefits will change materially. | ||
| G. | Security Transactions and Investment Income. Investment securities transactions are accounted for on the trade date. Gains and losses realized on sales of securities are determined on an identified cost basis. Discounts/premiums on debt securities purchased are accreted/amortized over the life of the respective securities using the effective interest method. Dividend income is recorded on the ex-dividend date. Dividends received from REITs and MLPs are generally comprised of ordinary income, capital gains and may include return of capital. Interest income is recorded on an accrual basis. Withholding taxes on foreign dividends have been provided for in accordance with the Trust’s understanding of the applicable country’s tax rules and rates. | |
| H. | Distributions to Shareholders. Distributions to shareholders from net investment income and net realized gains on securities for the Osterweis Fund and Osterweis Emerging Opportunity Fund normally are declared and paid on an annual basis. Distributions to shareholders from net investment income for the Osterweis Strategic Income Fund and Osterweis Growth & Income Fund normally are declared and paid on a quarterly basis, and distributions to shareholders from net realized gains on securities normally are declared and paid on an annual basis. Distributions to shareholders from net investment income for the Osterweis Total Return Fund, Osterweis Short Duration Credit Fund, and Osterweis Sustainable Credit Fund normally are declared and paid on a monthly basis, and distributions to shareholders from net realized gains on securities normally are declared and paid on an annual basis. Distributions are recorded on the ex-dividend date. |
69
Osterweis Funds | Notes to Financial Statements at March 31, 2023 (Continued)
| I. | Use of Estimates. The preparation of financial statements in conformity with U.S. GAAP requires management to make estimates and assumptions that affect the reported amounts of assets and liabilities at the date of the financial statements and the reported amount of revenue and expenses during the reporting period. Actual results could differ from those estimates. | |
| J. | Share Valuation. The net asset value (“NAV”) per share of each Fund is calculated by dividing the sum of the value of the securities held by each Fund, plus cash and other assets, minus all liabilities by the total number of shares outstanding for each Fund, rounded to the nearest cent. The Funds’ shares will not be priced on the days on which the New York Stock Exchange is closed for trading. The offering and redemption price per share for each Fund is equal to each Fund’s net asset value per share. | |
| K. | Guarantees and Indemnifications. In the normal course of business, the Funds enter into contracts with service providers that contain general indemnification clauses. The Funds’ maximum exposure under these arrangements is unknown as this would involve future claims that may be made against the Funds that have not yet occurred. However, based on experience, the Funds expect the risk of loss to be remote. | |
| L. | Illiquid Securities. Pursuant to Rule 22e-4 under the 1940 Act, the Funds have adopted a Board approved liquidity risk management program that requires, among other things, that the Funds limit their illiquid investments that are assets to no more than 15% of net assets. An illiquid investment is any security which may not reasonably be expected to be sold or disposed of in current market conditions in seven calendar days or less without the sale or disposition significantly changing the market value of the investment. | |
| M. | Offsetting Agreements. The Funds are subject to various netting arrangements, which govern the terms of certain transactions with counterparties. The arrangements allow the Funds to close out and net their total exposure to a counterparty in the event of a default with respect to all transactions governed under a single agreement with a counterparty. As of March 31, 2023, there were no derivative financial instruments that were subject to enforceable netting arrangements, collateral arrangements, or other similar agreements. | |
| N. | Restricted Cash. Restricted cash represents amounts that are held by third parties under certain of the Fund’s derivative transactions. Such cash is excluded from cash and equivalents in the Statements of Assets and Liabilities. Interest income earned on restricted cash is recorded in other income on the Statements of Operations. | |
| O. | Recently Issued Accounting Pronouncements. In June 2022, the FASB issued Accounting Standards Update 2022-03, which amends Fair Value Measurement (Topic 820): Fair Value Measurement of Equity Securities Subject to Contractual Sale Restrictions (“ASU 2022-03”). ASU 2022-03 clarifies guidance for fair value measurement of an equity security subject to a contractual sale restriction and establishes new disclosure requirements for such equity securities. ASU 2022-03 is effective for fiscal years beginning after December 15, 2023 and for interim periods within those fiscal years, with early adoption permitted. Management is currently evaluating the impact of these amendments on the financial statements. | |
| In March 2020, the FASB issued Accounting Standards Update 2020-04, Reference Rate Reform (Topic 848) – Facilitation of the Effects of Reference Rate Reform on Financial Reporting (“ASU 2020-04”), which provides optional, temporary relief with respect to the financial reporting of contracts subject to certain types of modifications due to the planned discontinuation of the London Interbank Offered Rate (“LIBOR”) and other interbank offered rates as of the end of 2021. The temporary relief provided by ASU 2020-04 is effective for certain reference rate- related contract modifications that occur during the period from March 12, 2020 through December 31, 2022. Management is evaluating the impact of ASU 2020-04 on the fund’s investments, derivatives, debt and other contracts that will undergo reference rate-related modifications as a result of the reference rate reform. The Financial Accounting Standards Board (“FASB”) approved an (optional) 2-year extension, until December 31, 2024, for temporary relief of transitioning away from the LIBOR. LIBOR is set to expire June 30, 2023. Companies were initially provided temporary relief through December 31, 2022 to update contracts moving away from LIBOR. |
70
Osterweis Funds | Notes to Financial Statements at March 31, 2023 (Continued)
| P. | Reclassification of Capital Accounts. U.S. GAAP requires that certain components of net assets relating to permanent differences be reclassified between financial and tax reporting. These reclassifications have no effect on net assets or net asset value per share. For the year ended March 31, 2023, the following adjustments were made: |
| Distributable (Accumulated) | |||||||||
| Earnings (Losses) | Paid-In Capital | ||||||||
| Osterweis Fund | $ | — | $ | — | |||||
| Osterweis Strategic Income Fund | — | — | |||||||
| Osterweis Growth & Income Fund | (244,429 | ) | 244,429 | ||||||
| Osterweis Emerging Opportunity Fund | 1,229,618 | (1,229,618 | ) | ||||||
| Osterweis Total Return Fund | — | — | |||||||
| Osterweis Short Duration Credit Fund | — | — | |||||||
| Osterweis Sustainable Credit Fund | — | — | |||||||
| The permanent differences are primarily due to net operating losses and equalization. | ||
| Q. | Subsequent Events. In preparing these financial statements, the Funds have evaluated events and transactions for potential recognition or disclosure through the date the financial statements were issued. The Funds have determined that there were no subsequent events that would need to be disclosed in the Funds’ financial statements. |
| Note 3 – Commitments and Other Related Party Transactions |
The Advisers provide the Funds with investment management services under separate Investment Advisory Agreements (the “Advisory Agreements”). Under the Advisory Agreements, the Advisers furnish all investment advice, office space, certain administrative services, and most of the personnel needed by each Fund. As compensation for their services, the Advisers are entitled to a monthly fee. For the Osterweis Fund, the Adviser is entitled to a monthly fee at an annual rate of 0.75%. For the Osterweis Strategic Income Fund, the Adviser is entitled to a monthly fee at an annual rate of 1.00% of the average daily net assets up to $250 million, 0.75% of the average daily net assets from $250 million to $2.5 billion, and 0.65% of the average daily net assets greater than $2.5 billion. For the Osterweis Growth & Income Fund, the Adviser is entitled to a monthly fee at the annual rate of 0.75%. For the Osterweis Emerging Opportunity Fund, the Adviser is entitled to a monthly fee at an annual rate of 1.00% of the average daily net assets up to $500 million, 0.85% of the average daily net assets from $500 million to $1 billion, and 0.75% of the average daily net assets greater than $1 billion. For the Osterweis Total Return Fund, the Adviser is entitled to a monthly fee at an annual rate of 0.45% of the average daily net assets. For the Osterweis Short Duration Credit Fund, the Adviser is entitled to a monthly fee at an annual rate of 0.75% of the average daily net assets. For the Osterweis Sustainable Credit Fund, the Adviser is entitled to a monthly fee at an annual rate of 0.75% of the average daily net assets. The amount of investment advisory fees incurred by the Funds for the year ended March 31, 2023 is disclosed in the Statements of Operations. The investment advisory fees incurred are paid monthly to the Adviser, net of any waiver or reimbursement discussed below.
The Adviser has contractually agreed to limit the annual ratio of expenses (Expense Cap) for the Osterweis Fund, Osterweis Emerging Opportunity Fund, Osterweis Total Return Fund, Osterweis Short Duration Credit Fund, and Osterweis Sustainable Credit Fund by reducing all or a portion of their fees and reimbursing Fund expenses so that each Fund’s ratios of expenses to average net assets will not exceed 0.95%, 1.10%, 0.75%, 0.99%, and 0.99%, respectively. Each Operating Expenses Limitation Agreement has an indefinite term and may be terminated at any time, and without payment of any penalty, by the Board, on behalf of the Fund, upon sixty (60) days’ written notice to the Adviser. Any fees waived and/or any Fund expenses absorbed by the Adviser pursuant to an agreed-upon expense cap shall be reimbursed by the Fund to the Adviser, if so requested by the Adviser, any time before the end of the third year following the fee waiver and/or expense absorption, provided the aggregate amount of the Fund’s current operating expenses for such year does not exceed the lesser expense cap in place at the time of waiver or at the time of reimbursement. The Fund must pay its current ordinary operating expenses before the Adviser is entitled to any reimbursements of fees and/or expenses. Any such reimbursement is also contingent upon Board review and approval. Any amount due from the Adviser is paid monthly to the Funds, if applicable. For the year ended March 31, 2023, the Adviser recaptured $44,542 in fees in the Osterweis Fund. The Adviser waived $222,867 in fees in the Osterweis Emerging Opportunity Fund, $77,764 in the Osterweis Short Duration Credit Fund, and $122,614 in fees in the Osterweis Sustainable Credit Fund. As of March 31, 2023, the remaining cumulative amount the Adviser may be reimbursed
71
Osterweis Funds | Notes to Financial Statements at March 31, 2023 (Continued)
is $426,742 for Osterweis Fund, $534,042 for Osterweis Emerging Opportunity Fund, $77,764 for Osterweis Short Duration Credit Fund, and $122,614 for Osterweis Sustainable Credit Fund.
Note, the year period referenced above for the Osterweis Short Duration Credit Fund and the Osterweis Sustainable Credit Fund includes the period for which the Zeo Short Duration Income Fund and Zeo Sustainable Credit Fund, each a series of Northern Lights Fund Trust (together, the “Predecessor Funds”), were managed by the Adviser through October 7, 2022. The Adviser served as interim investment adviser of the Predecessor Funds from May 1-September 28, 2022 and as investment adviser from September 28 – October 7, 2022, upon which time, the Predecessor Funds were reorganized into the Funds.
The Adviser may recapture a portion of the above no later than the years as stated below:
| March 31, 2024 | March 31, 2025 | March 31, 2026 | Total | ||||||||||||||
| Osterweis Fund | $ | 345,519 | $ | 81,223 | $ | — | $ | 426,742 | |||||||||
| Osterweis Emerging Opportunity Fund | $ | 146,407 | $ | 164,768 | $ | 222,867 | $ | 534,042 | |||||||||
| Osterweis Short Duration Credit Fund | $ | — | $ | — | $ | 77,764 | $ | 77,764 | |||||||||
| Osterweis Sustainable Credit Fund | $ | — | $ | — | $ | 122,614 | $ | 122,614 | |||||||||
U.S. Bancorp Fund Services, LLC, doing business as U.S. Bank Global Fund Services (“Fund Services”), acts as the Funds’ administrator, fund accountant and transfer agent. In those capacities Fund Services maintains the Funds’ books and records, calculates the Funds’ NAV, prepares various federal and state regulatory filings, coordinates the payment of fund expenses, reviews expense accruals and prepares materials supplied to the Board. The officers of the Trust and the Chief Compliance Officer are also employees of Fund Services. Fees paid by the Funds to Fund Services for these services for the year/period ended March 31, 2023, are disclosed in the Statements of Operations.
Quasar Distributors, LLC (the “Distributor”) acts as the Funds’ principal underwriter in a continuous public offering of the Funds’ shares. U.S. Bank N.A. serves as custodian to the Funds. U.S. Bank N.A. is an affiliate of Fund Services.
The Funds have entered into Sub-Transfer Agent Arrangements (the “Arrangements”). All Arrangements must be approved by the Board. For the year/period ended March 31, 2023, the Sub-Transfer Agent Fees and Transfer Agent Fees incurred by the Funds are disclosed in the Statements of Operations.
| Note 4 – Purchases and Sales of Securities |
For the year/period ended March 31, 2023, the cost of purchases and proceeds from sales and maturities of securities, excluding short-term investments, were as follows:
| Purchases | Sales | ||||||||
| Osterweis Fund | $ | 70,886,800 | $ | 86,561,804 | |||||
| Osterweis Strategic Income Fund | 410,872,602 | 807,424,084 | |||||||
| Osterweis Growth & Income Fund | 45,441,930 | 69,200,567 | |||||||
| Osterweis Emerging Opportunity Fund | 228,060,011 | 195,685,688 | |||||||
| Osterweis Total Return Fund | 256,901,339 | 278,907,767 | |||||||
| Osterweis Short Duration Credit Fund | 38,525,960 | 83,104,990 | |||||||
| Osterweis Sustainable Credit Fund | 1,943,603 | 3,533,216 | |||||||
For the year ended March 31, 2023, the cost of purchases and proceeds from sales and maturities of long-term U.S. Government securities included above were as follows:
| Purchases | Sales | ||||||||
| Osterweis Growth & Income Fund | $ | — | $ | 4,659,866 | |||||
| Osterweis Total Return Fund | 152,266,239 | 146,408,956 | |||||||
The Osterweis Fund, Osterweis Strategic Income Fund, Osterweis Emerging Opportunity Fund, Osterweis Short Duration Credit Fund, and Osterweis Sustainable Credit Fund did not purchase or sell long-term U.S. Government securities during the year/period ended March 31, 2023.
72
Osterweis Funds | Notes to Financial Statements at March 31, 2023 (Continued)
| Note 5 – Distributions to Shareholders |
The tax character of distributions paid during the year/period ended March 31, 2023 and the year ended March 31, 2022, was as follows:
| Ordinary Income | |||||||||
| March 31, 2023 | March 31, 2022 | ||||||||
| Osterweis Fund | $ | 11 | $ | 1,459,601 | |||||
| Osterweis Strategic Income Fund | 230,705,874 | 221,810,712 | |||||||
| Osterweis Growth & Income Fund | 3,015,079 | 5,855,980 | |||||||
| Osterweis Emerging Opportunity Fund | — | 21,552,756 | |||||||
| Osterweis Total Return Fund | 2,248,460 | 1,464,552 | |||||||
| Osterweis Short Duration Credit Fund | 11,910,126 | — | |||||||
| Osterweis Sustainable Credit Fund | 426,645 | — | |||||||
Long-Term Capital Gains 1 | |||||||||
| March 31, 2023 | March 31, 2022 | ||||||||
| Osterweis Fund | $ | 9,739,061 | $ | 16,508,949 | |||||
| Osterweis Strategic Income Fund | — | — | |||||||
| Osterweis Growth & Income Fund | 9,489,935 | 7,378,976 | |||||||
| Osterweis Emerging Opportunity Fund | — | 22,737,370 | |||||||
| Osterweis Total Return Fund | — | — | |||||||
| Osterweis Short Duration Credit Fund | — | — | |||||||
| Osterweis Sustainable Credit Fund | — | — | |||||||
1 Designated as long-term capital gain dividend, pursuant to Internal Revenue Code Section 852(b)(3).
The cost basis of investments for federal income tax purposes at most recent fiscal year/period end, March 31, 2023, was as follows:
| Growth & | Emerging | ||||||||||||||||
| Osterweis | Strategic | Income | Opportunity | ||||||||||||||
| Fund | Income Fund | Fund | Fund | ||||||||||||||
| Cost of investments | $ | 97,633,850 | $ | 5,041,102,201 | $ | 127,885,492 | $ | 189,630,896 | |||||||||
| Gross tax unrealized appreciation | 44,117,735 | 72,173,076 | 29,775,688 | 23,220,281 | |||||||||||||
| Gross tax unrealized depreciation | (2,159,838 | ) | (467,045,514 | ) | (5,639,344 | ) | (11,323,428 | ) | |||||||||
| Net tax unrealized appreciation/depreciation | 41,957,897 | (394,872,438 | ) | 24,136,344 | 11,896,853 | ||||||||||||
| Undistributed ordinary income | 521,022 | 11,834,410 | 197,156 | — | |||||||||||||
| Undistributed long-term capital gain | — | — | — | — | |||||||||||||
| Total distributable earnings | 521,022 | 11,834,410 | 197,156 | — | |||||||||||||
| Other accumulated gain/(loss) | (1,370,325 | ) | (417,013,678 | ) | — | (39,026,702 | ) | ||||||||||
| Total distributable (accumulated) earnings (losses) | $ | 41,108,594 | $ | (800,051,706 | ) | $ | 24,333,500 | $ | (27,129,849 | ) | |||||||
| Total Return | Short Duration | Sustainable | |||||||||||||||
| Fund | Credit Fund | Credit Fund | |||||||||||||||
| Cost of investments | $ | 141,594,914 | $ | 203,029,113 | $ | 5,498,050 | |||||||||||
| Gross tax unrealized appreciation | 989,614 | 241,835 | 53,828 | ||||||||||||||
| Gross tax unrealized depreciation | (7,419,882 | ) | (31,061,359 | ) | (822,350 | ) | |||||||||||
| Net tax unrealized appreciation/depreciation | (6,430,268 | ) | (30,819,524 | ) | (768,522 | ) | |||||||||||
| Undistributed ordinary income | 69,779 | 63,000 | 9,087 | ||||||||||||||
| Undistributed long-term capital gain | — | — | — | ||||||||||||||
| Total distributable earnings | 69,779 | 63,000 | 9,087 | ||||||||||||||
| Other accumulated gain/(loss) | (5,905,370 | ) | (23,523,140 | ) | (270,876 | ) | |||||||||||
| Total distributable (accumulated) earnings (losses) | $ | (12,265,859 | ) | $ | (54,279,664 | ) | $ | (1,030,311 | ) | ||||||||
The tax difference between book basis and tax basis unrealized appreciation is attributable to wash sale deferrals.
73
Osterweis Funds | Notes to Financial Statements at March 31, 2023 (Continued)
| Note 6 – Investments in Affiliates |
Affiliated companies are those that are “affiliated persons” as defined in Section 2(a)(3) of the 1940 Act. They include, among other entities, issuers 5% or more of whose outstanding voting shares are held by the Fund. For the year ended March 31, 2023, the Funds had the following transactions with affiliated companies:
| Osterweis Strategic Income Fund | |||||||||
| Share | Change in | ||||||||
| Balance | Value | Realized | Unrealized | Value | |||||
| Convertible | March 31, | March 31, | Acqui- | Dispo- | Gain | Appreciation/ | March 31, | Dividend | |
Preferred Stocks | 2023 | 2022 | sitions | sitions | (Loss) | Depreciation | 2023 | Income | |
| Daseke, Inc., 7.625% | 490,000 | $56,471,128 | $ — | $ — | $ — | $(9,958,368) | $46,512,760 | $3,736,252 | |
| Osterweis Growth & Income Fund | |||||||||
| Share | Change in | ||||||||
| Balance | Value | Realized | Unrealized | Value | |||||
| Convertible | March 31, | March 31, | Acqui- | Dispo | Gain | Appreciation/ | March 31, | Dividend | |
Preferred Stocks | 2023 | 2022 | sitions | sitions | (Loss) | Depreciation | 2023 | Income | |
| Daseke, Inc., 7.625% | 10,000 | $1,152,472 | $ — | $ — | $ — | $(203,232) | $949,240 | $76,252 | |
| Note 7 – Credit Facility |
U.S. Bank N.A. has made available to the Funds credit facilities pursuant to separate Loan and Security Agreements for temporary or extraordinary purposes. Credit facility details for the year ended March 31, 2023, are as follows:
| Osterweis | Osterweis | Osterweis | Osterweis | Osterweis | ||||||||||||||||||
| Strategic | Growth & | Emerging | Total | Short | Osterweis | |||||||||||||||||
| Osterweis | Income | Income | Opportunity | Return | Duration | Sustainable | ||||||||||||||||
| Fund | Fund | Fund | Fund | Fund | Credit Fund | Credit Fund | ||||||||||||||||
| Maximum available | ||||||||||||||||||||||
| credit | $ | 20,000,000 | $ | 300,000,000 | $ | 20,000,000 | $ | 15,000,000 | $ | 10,000,000 | $ | 20,000,000 | $ | — | ||||||||
| Largest amount | ||||||||||||||||||||||
| outstanding on | ||||||||||||||||||||||
| an individual day | — | — | — | — | — | — | — | |||||||||||||||
| Average balance | ||||||||||||||||||||||
| when in use | — | — | — | — | — | — | — | |||||||||||||||
| Credit facility outstanding | ||||||||||||||||||||||
| as of March 31, 2023 | — | — | — | — | — | — | — | |||||||||||||||
| Average interest | ||||||||||||||||||||||
| rate when in use | — | — | — | — | — | — | — | |||||||||||||||
Interest expenses for the year ended March 31, 2023, are disclosed in the Statements of Operations, as applicable.
| Note 8 – Risks Associated with the Discontinuation of the London Interbank Offered Rate (“LIBOR”) |
The Funds invest significantly in corporate bonds that have interest rate provisions linked to LIBOR. LIBOR is used extensively in the U.S. and globally as a “benchmark” or “reference rate” for such loans. It is expected that a number of private-sector banks currently reporting information used to set LIBOR will stop doing so after 2021 when their current reporting commitment ends, which could either cause LIBOR to stop publication immediately or cause LIBOR’s regulator to determine that its quality has degraded to the degree that it is no longer representative of its underlying market. The expected discontinuation of LIBOR may impact the functioning, liquidity, and value of these.
74
Osterweis Funds | Notes to Financial Statements at March 31, 2023 (Continued)
| Note 9 – Fund Reorganization |
The Board of Trustees (the “Board”) of Northern Lights Fund Trust (the “Trust”) has approved the reorganization (the “Reorganization”) of the Zeo Short Duration Income Fund and Zeo Sustainable Credit Fund (each a “Predecessor Fund”) into a corresponding new series of the Professionally Managed Portfolios (each an “Acquiring Fund”), to be managed by Osterweis Capital Management, LLC the investment adviser of the Predecessor Funds. As the Osterweis Sustainable Credit Fund and the Osterweis Short Duration Credit Fund have no history prior to the Reorganization, they assumed the accounting and performance history of the Zeo Short Duration Income Fund and the Zeo Sustainable Credit Fund, respectively. For the Osterweis Short Duration Credit Fund and the Osterweis Sustainable Credit Fund, the Reorganization was accomplished by a tax-free exchange of 22,356,059 shares for 22,356,059 shares and 633,153 shares for 633,153 shares, respectively, which occurred on October 7, 2022.
75
Report of Independent Registered Public Accounting Firm
To the Board of Trustees of Professionally Managed Portfolios
and Shareholders of the Osterweis Funds
Opinion on the Financial Statements
We have audited the accompanying statements of assets and liabilities of Osterweis Fund, Osterweis Strategic Income Fund, Osterweis Growth & Income Fund, Osterweis Emerging Opportunity Fund, Osterweis Total Return Fund, Osterweis Short Duration Credit Fund (formerly Zeo Short Duration Income Fund), and Osterweis Sustainable Credit Fund (formerly Zeo Sustainable Credit Fund) (the “Funds”), each a series of Professionally Managed Portfolios (the “Trust”), including the schedules of investments, as of March 31, 2023, the related statements of operations, the statements of changes in net assets, and the financial highlights for each of the periods indicated in the table below, and the related notes (collectively referred to as the “financial statements”). In our opinion, the financial statements present fairly, in all material respects, the financial position of the Funds as of March 31, 2023, the results of their operations, the changes in their net assets, and their financial highlights for each of the periods indicated in the table below, in conformity with accounting principles generally accepted in the United States of America.
| Individual Funds constituting | Statement of | Statements of | |
Osterweis Funds | operations | changes in net assets | Financial highlights |
| Osterweis Fund, | |||
| Osterweis Strategic Income Fund, | For the | For each of the two years | For each of the five years |
| Osterweis Growth & Income Fund, | year ended | in the period ended | in the period ended |
| Osterweis Emerging Opportunity Fund, | March 31, 2023 | March 31, 2023 | March 31, 2023 |
| and Osterweis Total Return Fund | |||
| Osterweis Short Duration Credit Fund | For the | For the period ended | For the period ended |
| and Osterweis Sustainable Credit Fund | period ended | March 31, 2023 | March 31, 2023 |
| March 31, 2023 |
With respect to Osterweis Short Duration Credit Fund, the statement of changes in net assets for the years ended April 30, 2022 and 2021 and the financial highlights for each of the five years in the period ended April 30, 2022, were audited by other auditors, whose report dated June 24, 2022 expressed an unqualified opinion on such statement and financial highlights.
With respect to Osterweis Sustainable Credit Fund, the statement of changes in net assets for the years ended April 30, 2022 and 2021 and the financial highlights for each of the two years in the period ended April 30, 2022 and for the period of June 5, 2019 (commencement of operations) to April 30, 2020, were audited by other auditors, whose report dated June 24, 2022 expressed an unqualified opinion on such statement and financial highlights.
Basis for Opinion
These financial statements are the responsibility of the Funds’ management. Our responsibility is to express an opinion on the Funds’ financial statements based on our audits. We are a public accounting firm registered with the Public Company Accounting Oversight Board (United States) (“PCAOB”) and are required to be independent with respect to the Funds in accordance with the U.S. federal securities laws and the applicable rules and regulations of the Securities and Exchange Commission and the PCAOB. We have served as the auditor of one or more of the funds in the Trust since 1995.
We conducted our audits in accordance with the standards of the PCAOB. Those standards require that we plan and perform the audits to obtain reasonable assurance about whether the financial statements are free of material misstatement, whether due to error or fraud. The Funds are not required to have, nor were we engaged to perform, an audit of the Funds’ internal control over financial reporting. As part of our audits we are required to obtain an understanding of internal control over financial reporting, but not for the purpose of expressing an opinion on the effectiveness of the Funds’ internal control over financial reporting. Accordingly, we express no such opinion.
76
Report of Independent Registered Public Accounting Firm (Continued)
Our audits included performing procedures to assess the risks of material misstatement of the financial statements, whether due to error or fraud, and performing procedures that respond to those risks. Such procedures included examining, on a test basis, evidence regarding the amounts and disclosures in the financial statements. Our audits also included evaluating the accounting principles used and significant estimates made by management, as well as evaluating the overall presentation of the financial statements. Our procedures included confirmation of securities owned as of March 31, 2023 by correspondence with the custodian and brokers; when replies were not received from brokers, we performed other auditing procedures. We believe that our audits provide a reasonable basis for our opinion.
TAIT, WELLER & BAKER LLP
Philadelphia, Pennsylvania
May 30, 2023
77
Osterweis Funds | Expense Examples For the Six Months Ended March 31, 2023 (Unaudited)
As a shareholder of the Funds, you incur ongoing costs, including investment advisory fees and other Fund expenses. These examples are intended to help you understand your ongoing costs (in dollars) of investing in the Funds and to compare these costs with the ongoing costs of investing in other mutual funds. These examples are based on an investment of $1,000 invested at the beginning of the period and held for the entire period (October 1, 2022– March 31, 2023).
Actual Expenses
The “Actual” line for each of the following tables provides information about actual account values based on actual returns and actual expenses. Although the Funds charge no sales load or other transaction fees, you will be assessed fees for outgoing wire transfers, returned checks and stop payment orders at prevailing rates charged by Fund Services, the Funds’ transfer agent. If you request that a redemption be made by wire transfer, the Funds’ transfer agent currently charges a $15.00 fee. An Individual Retirement Account will be charged an annual maintenance fee. To the extent the Funds invest in shares of other investment companies as part of their strategies, you will indirectly bear your proportionate share of any fees and expenses charged by the underlying funds in which the Funds invest in addition to the expenses of the Funds. Actual expenses of the underlying funds may vary. These expenses are not included in the following examples. The following examples include, but are not limited to, investment advisory fees, fund accounting fees, fund administration fees, custody fees and transfer agent fees. However, the following examples do not include portfolio trading commissions and related expenses. You may use the information in this line, together with the amount you invested, to estimate the expenses that you paid over the period. Simply divide your account value by $1,000 (for example, an $8,600 account value divided by $1,000 = 8.6), then multiply the result by the number in the first line under the heading titled “Expenses Paid During the Period” to estimate the expenses you paid on your account during this period.
Hypothetical Example for Comparison Purposes
The “Hypothetical” line for each of the following tables provides information about hypothetical account values and hypothetical expenses based on the Funds’ actual expense ratios and an assumed rate of return of 5% per year before expenses, which is not the Funds’ actual return. The hypothetical account values and expenses may not be used to estimate the actual ending account balance or expenses you paid for the period. You may use this information to compare the ongoing costs of investing in the Funds and other funds. To do so, compare this 5% hypothetical example with the 5% hypothetical examples that appear in the shareholder reports of the other funds.
| Beginning | Ending | ||
| Account Value | Account Value | Expenses Paid | |
10/1/22 | 3/31/23 | During the Period 1 | |
| Osterweis Fund | |||
| Actual | $1,000.00 | $1,126.10 | $5.04 |
| Hypothetical (5% annual return before expenses) | 1,000.00 | 1,020.19 | 4.78 |
| Strategic Income Fund | |||
| Actual | 1,000.00 | 1,067.30 | 4.38 |
| Hypothetical (5% annual return before expenses) | 1,000.00 | 1,020.69 | 4.28 |
| Growth & Income Fund | |||
| Actual | 1,000.00 | 1,092.30 | 4.90 |
| Hypothetical (5% annual return before expenses) | 1,000.00 | 1,020.24 | 4.73 |
| Emerging Opportunity Fund | |||
| Actual | 1,000.00 | 1,130.80 | 5.84 |
| Hypothetical (5% annual return before expenses) | 1,000.00 | 1,019.45 | 5.54 |
| Total Return Fund | |||
| Actual | 1,000.00 | 1,037.20 | 3.40 |
| Hypothetical (5% annual return before expenses) | 1,000.00 | 1,021.59 | 3.38 |
78
Osterweis Funds | Expense Examples For the Six Months Ended March 31, 2023 (Unaudited) (Continued)
| Beginning | Ending | ||
| Account Value | Account Value | Expenses Paid | |
10/1/22 | 3/31/23 | During the Period 1 | |
| Short Duration Credit Fund | |||
| Actual | $1,000.00 | $1,013.30 | $4.77 |
| Hypothetical (5% annual return before expenses) | 1,000.00 | 1,020.19 | 4.78 |
| Sustainable Credit Fund | |||
| Actual | 1,000.00 | 1,015.50 | 4.97 |
| Hypothetical (5% annual return before expenses) | 1,000.00 | 1,020.00 | 4.99 |
1 | Expenses are equal to the annualized net expense ratio for the most recent six-month period. The annualized six-month expense ratios for the Osterweis Fund, Osterweis Strategic Income Fund, Osterweis Growth & Income Fund, Osterweis Emerging Opportunity Fund, Osterweis Total Return Fund, Osterweis Short Duration Credit Fund, and Osterweis Sustainable Credit Fund were 0.95%, 0.85%, 0.94%, 1.10%, 0.67%, 0.95% and 0.99% (reflecting fee waivers and recoupments in effect), respectively, multiplied by the average account value over the period multiplied by 182/365 (to reflect the one-half year period). |
79
Osterweis Funds | Trustees and Executive Officers (Unaudited)
The Board is responsible for the overall management of the Trust, including general supervision and review of the investment activities of the Funds. The Board, in turn, elects the officers of the Trust, who are responsible for administering the day-to-day operations of the Trust and its separate series. The current trustees and officers of the Trust, their year of birth, positions with the Trust, terms of office with the Trust and length of time served, their principal occupations for the past five years and other directorships are set forth in the table below.
| Term of | Number of | ||||
Office(2) | Portfolios | Other | |||
| and | in Fund | Directorships | |||
| Position | Length | Complex(3) | Held | ||
| Name, Address | with the | of Time | Principal Occupation | Overseen | During the |
| and Age | Trust(1) | Served | During Past Five Years | by Trustees | Past 5 Years |
| Independent Trustees of the Trust | |||||
| Kathleen T. Barr | Trustee | Indefinite | Retired; Chair of the Governing Council, | 7 | Independent |
| (born 1955) | Term; Since | Independent Directors Council (since 2020); | Director, Muzinich | ||
| c/o U.S. Bank Global | November | formerly, President, owner of a registered | BDC, Inc. (2019 | ||
| Fund Services | 2018. | investment adviser, Productive Capital | to present); | ||
| 615 East Michigan St. | Chairperson | Indefinite | Management, Inc. (2010 to 2013); formerly, Chief | Independent | |
| Milwaukee, WI 53202 | Term; Since | Administrative Officer, Senior Vice President and | Trustee for the | ||
| February | Senior Managing Director of Allegiant Asset | William Blair | |||
| 2023. | Management Company (merged with PNC Capital | Funds (2013 | |||
| Advisors, LLC in 2009); formerly, Chief | to present) | ||||
| Administrative Officer, Chief Compliance Officer | (18 series). | ||||
| and Senior Vice President of PNC Funds and | |||||
| PNC Advantage Funds (f/k/a Allegiant Funds) | |||||
| (registered investment companies). | |||||
| Eric W. Falkeis | Trustee | Indefinite | Chief Growth Officer, Tidal Financial Group | 7 | Interested Trustee, |
| (born 1973) | Term; Since | (2022 to present); Chief Executive Officer, | Tidal ETF Trust II | ||
| c/o U.S. Bank Global | September | Tidal ETF Services LLC (2018 to present); | (2022 to present) | ||
| Fund Services | 2011. | formerly, Chief Operating Officer, Direxion Funds | (7 series); | ||
| 615 East Michigan St. | (2013 to 2018); formerly, Senior Vice President | Independent | |||
| Milwaukee, WI 53202 | and Chief Financial Officer (and other positions), | Director, Muzinich | |||
| U.S. Bancorp Fund Services, LLC (1997 to 2013). | BDC, Inc. (2019 | ||||
| to present); | |||||
| Interested Trustee, | |||||
| Tidal ETF Trust | |||||
| 2018 to present) | |||||
| (36 series); Former | |||||
| Interested Trustee, | |||||
| Direxion Funds | |||||
| (22 series), | |||||
| Direxion Shares | |||||
| ETF Trust | |||||
| (112 series) and | |||||
| Direxion Insurance | |||||
| Trust (2013 | |||||
| to 2018). | |||||
80
Osterweis Funds | Trustees and Executive Officers (Unaudited) (Continued)
| Term of | Number of | ||||
Office(2) | Portfolios | Other | |||
| and | in Fund | Directorships | |||
| Position | Length | Complex(3) | Held | ||
| Name, Address | with the | of Time | Principal Occupation | Overseen | During the |
| and Age | Trust(1) | Served | During Past Five Years | by Trustees | Past 5 Years |
| Independent Trustees of the Trust | |||||
| Steven J. Paggioli | Trustee | Indefinite | Consultant; formerly, Executive Vice President, | 7 | Independent |
| (born 1950) | Term; Since | Investment Company Administration, LLC | Director, Muzinich | ||
| c/o U.S. Bank Global | May 1991. | (mutual fund administrator). | BDC, Inc. (2019 | ||
| Fund Services | to present); | ||||
| 615 East Michigan St. | Independent | ||||
| Milwaukee, WI 53202 | Trustee, AMG | ||||
| Funds (1993 | |||||
| to present) | |||||
| (42 series). | |||||
| Ashi S. Parikh | Trustee | Indefinite | Investment professional; formerly, Chief | 7 | Board of Directors |
| (born 1966) | Term; Since | Executive and Chief Investment Officer and | Member, | ||
| c/o U.S. Bank Global | June 2020. | various other positions, RidgeWorth Investments, | Investment | ||
| Fund Services | LLC (global investment management firm) | Working Group, | |||
| 615 East Michigan St. | (2006 to 2017); formerly, Chief Investment Officer | The Ohio State | |||
| Milwaukee, WI 53202 | Institutional Growth Equities, Eagle Asset | University | |||
| Management (investment management firm); | Endowments and | ||||
| formerly Sr. Managing Director, Growth Equities, | Foundation (2016 | ||||
| Banc One Investment Advisors | to present); Board | ||||
| (investment management firm). | of Directors, World | ||||
| Methodist Council, | |||||
| Investment | |||||
| Committee (2018 | |||||
| to present); | |||||
| Independent | |||||
| Trustee, PNC | |||||
| Funds (2018 to | |||||
| 2019) (32 series); | |||||
| Interested Trustee, | |||||
| RidgeWorth | |||||
| Funds (2014 to | |||||
| 2017) (35 series). | |||||
| Cynthia M. Fornelli | Trustee | Indefinite | Independent Director of TriplePoint Venture | 7 | Independent |
| (born 1960) | Term; Since | Growth BDC Corp. (2019 to present); Retired; | Director, | ||
| c/o U.S. Bank Global | January 2022. | formerly, Executive Director of the Center for | TriplePoint Private | ||
| Fund Services | Audit Quality (2007-2019); formerly, Senior Vice | Venture Credit, | |||
| 615 East Michigan St. | President of Regulatory Conflicts Management at | Inc. (2020 | |||
| Milwaukee, WI 53202 | Bank of America (2005-2007); formerly, Deputy | to present). | |||
| Director, Division of Investment Management | |||||
| with the U.S. Securities and Exchange | |||||
| Commission (1998-2005). | |||||
81
Osterweis Funds | Trustees and Executive Officers (Unaudited) (Continued)
| Term of | Number of | ||||
Office(2) | Portfolios | Other | |||
| and | in Fund | Directorships | |||
| Position | Length | Complex(3) | Held | ||
| Name, Address | with the | of Time | Principal Occupation | Overseen | During the |
| and Age | Trust(1) | Served | During Past Five Years | by Trustees | Past 5 Years |
| Officers of the Trust | |||||
| Jason F. Hadler | President | Indefinite | Senior Vice President and Head of Client | Not | Not |
| (born 1975) | & Principal | Term; Since | Experience, U.S. Bank Global Fund Services, | Applicable. | Applicable. |
| c/o U.S. Bank Global | Executive | September | since March 2022; Senior Vice President | ||
| Fund Services | Officer | 2021. | and Head of Fund Services Fund Administration | ||
| 615 East Michigan St. | Department, U.S. Bank Global Fund Services | ||||
| Milwaukee, WI 53202 | (December 2003-March 2022). | ||||
| Carl G. Gee, Esq. | Secretary | Indefinite | Assistant Secretary of the Trust (2020-2021); | Not | Not |
| (born 1990) | & Vice | Term; Since | Assistant Vice President and Counsel, U.S. Bank | Applicable. | Applicable. |
| c/o U.S. Bank Global | President | February | Global Fund Services since August 2016; | ||
| Fund Services | 2021. | Summer Associate, Husch Blackwell LLP (2015); | |||
| 615 East Michigan St. | Law Clerk, Brady Corporation (global printing | ||||
| Milwaukee, WI 53202 | systems, labels and safety products company) | ||||
| (2014-2015). | |||||
| Craig Benton | Treasurer | Indefinite | Assistant Treasurer of the Trust (2016-2021); | Not | Not |
| (born 1985) | & Vice | Term; Since | Assistant Vice President, U.S. Bank Global Fund | Applicable. | Applicable. |
| c/o U.S. Bank Global | President | December | Services since November 2007. | ||
| Fund Services | 2021. | ||||
| 615 East Michigan St. | |||||
| Milwaukee, WI 53202 | |||||
| Kyle J. Buscemi | Assistant | Indefinite | Mutual Funds Administrator, U.S. Bank Global | Not | Not |
| (born 1996) | Treasurer | Term; Since | Fund Services since June 2018; Business | Applicable. | Applicable. |
| c/o U.S. Bank Global | June 2022. | Administration Student, 2014-2018. | |||
| Fund Services | |||||
| 615 East Michigan St. | |||||
| Milwaukee, WI 53202 | |||||
| Jennifer N. Smith | Assistant | Indefinite | Mutual Funds Administrator, U.S. Bank Global | Not | Not |
| (born 1985) | Treasurer | Term; Since | Fund Services since 2007. | Applicable. | Applicable. |
| c/o U.S. Bank Global | February 2023. | ||||
| Fund Services | |||||
| 615 East Michigan St. | |||||
| Milwaukee, WI 53202 | |||||
| Gazala Khan | Chief | Indefinite | Vice President and Compliance Officer, U.S. | Not | Not |
| (born 1969) | Compliance | Term; Since | Bank Global Fund Services since July 2022; Chief | Applicable. | Applicable. |
| c/o U.S. Bank Global | Officer | November | Compliance Officer Matthews Asia Fund | ||
| Fund Services | 2022. | (May 2019-July 15, 2022); Chief Compliance Officer | |||
| 615 East Michigan St. | Anti- | GS Trust/VIT (June 2009-May 2019); Vice President | |||
| Milwaukee, WI 53202 | Money | GSAM (May 2005-June 2009); Staff Accountant, | |||
| Laundering | SEC Office of Compliance Inspection and | ||||
| Officer | Examination (1999-2005). | ||||
(1) | All Trustees of the Trust who are not “interested persons” of the Trust as defined under the 1940 Act (“Independent Trustees”). |
(2) | Under the terms of the Board’s retirement policy, a Trustee shall retire at the end of the calendar year in which he or she reaches the age of 78. |
(3) | The Trust is comprised of numerous series managed by unaffiliated investment advisers. The term “Fund Complex” applies only to the Funds. The Funds do not hold themselves out as related to any other series within the Trust for investment purposes, nor do they share the same investment advisor with any other series. |
82
Additional Information
Federal Tax Information (Unaudited) |
For the fiscal year ended March 31, 2023, certain dividends paid by the Funds may be subject to a maximum tax rate of 23%, as provided for by the Tax Cuts and Jobs Act of 2017.
The percentage of dividends declared from ordinary income designated as qualified dividend income was as follows:
| Osterweis Fund | 100.00% | ||
| Strategic Income | 2.77% | ||
| Osterweis Growth & Income | 43.84% | ||
| Osterweis Emerging Opportunity Fund | 0.00% | ||
| Osterweis Total Return Fund | 0.00% | ||
| Osterweis Short Duration Credit Fund | 0.00% | ||
| Osterweis Sustainable Credit Fund | 0.00% |
For corporate shareholders, the percent of ordinary income distributions qualifying for the corporate dividends received deduction for the fiscal year ended March 31, 2023, was as follows:
| Osterweis Fund | 100.00% | ||
| Strategic Income | 2.90% | ||
| Osterweis Growth & Income | 39.23% | ||
| Osterweis Emerging Opportunity Fund | 0.00% | ||
| Osterweis Total Return Fund | 0.00% | ||
| Osterweis Short Duration Credit Fund | 0.00% | ||
| Osterweis Sustainable Credit Fund | 0.00% |
The Percentage of taxable ordinary income distributions that are designated as short-term capital gain distributions under Internal Revenue Section 871(k)(2)(C) for the fiscal year ended March 31, 2023, was as follows (unaudited).
| Osterweis Fund | 0.00% | ||
| Strategic Income | 0.00% | ||
| Osterweis Growth & Income | 0.00% | ||
| Osterweis Emerging Opportunity Fund | 0.00% | ||
| Osterweis Total Return Fund | 0.00% | ||
| Osterweis Short Duration Credit Fund | 0.00% | ||
| Osterweis Sustainable Credit Fund | 2.98% |
| Information About Proxy Voting |
A description of the policies and procedures that the Funds use to determine how to vote proxies relating to portfolio securities is available upon request without charge by calling toll-free at (866) 236-0050 or by accessing the U.S. Securities and Exchange Commission’s (SEC) website at www.sec.gov.
Information regarding how the Funds voted proxies relating to portfolio securities during the most recent twelve months ended June 30 is available upon request without charge by calling toll-free at (866) 236-0050 or by accessing the SEC’s website at www.sec.gov.
| Information About the Portfolio Holdings |
The Funds’ quarterly holdings for the most recent fiscal year can be obtained by accessing the Funds’ website at www.osterweis.com/literature. The Funds file their complete schedule of portfolio holdings with the SEC for the first and third quarters of each fiscal year as an exhibit to their reports on Form N-PORT. The Funds’ Form N-PORT is available on the SEC’s website at www.sec.gov. The Fund’s Form N-PORT may also be obtained by calling (866) 236-0050.
83
Additional Information (Continued)
| Householding |
Each year, you are automatically sent an updated prospectus as well as annual and semi-annual reports for the Funds, if applicable. To reduce expenses, the Funds may mail only one copy of each Fund’s prospectus and each annual and semi-annual report to those addresses shared by two or more accounts. If you wish to receive individual copies of these documents, please call the Funds’ transfer agent at (877) 777-6944 (or contact your financial institution). We will begin sending you individual copies thirty days after receiving your request.
| Information About the Funds Trustees |
The Statement of Additional Information (“SAI”) includes additional information about the Funds’ Trustees and is available without charge, upon request, by calling (866) 236-0050. Furthermore, you can obtain the SAI on the SEC’s website at www.sec.gov or the Funds’ website at www.osterweis.com.
84
Approval of Investment Advisory Agreements (Unaudited)
OSTERWEIS FUND
OSTERWEIS STRATEGIC INCOME FUND
OSTERWEIS GROWTH & INCOME FUND
OSTERWEIS EMERGING OPPORTUNITY FUND
OSTERWEIS TOTAL RETURN FUND
At a meeting held on August 17-18, 2022, the Board (which is comprised of five persons, all of whom are Independent Trustees as defined under the Investment Company Act) considered and approved the continuance of the Investment Advisory Agreements (the “Advisory Agreements”) between Professionally Managed Portfolios (the “Trust”) and Osterweis Capital Management, Inc. for Osterweis Fund and Osterweis Capital Management, LLC for each of the Osterweis Strategic Income Fund, the Osterweis Growth & Income Fund, the Osterweis Emerging Opportunity Fund and the Osterweis Total Return Fund (each a “Fund,” and together, the “Funds”). Osterweis Capital Management, Inc. and Osterweis Capital Management, LLC are referred to individually as an “Adviser” and collectively as the “Advisers” or “Osterweis.” At this meeting and at a prior meeting held on June 16, 2022, the Board received and reviewed substantial information regarding the Funds, the Advisers and the services provided by the Advisers to the Funds under the Advisory Agreements. This information, together with the information provided to the Board throughout the course of the year, formed the primary (but not exclusive) basis for the Board’s determinations. Below is a summary of the factors considered by the Board and the conclusions that formed the basis for the Board’s approval of the continuance of the Advisory Agreements:
| 1. | The nature, extent and quality of the services provided and to be provided by the Advisers under the Advisory Agreements. The Trustees considered the nature, extent and quality of the Advisers’ overall services provided to the Funds as well as their specific responsibilities in all aspects of day-to-day investment management of the Funds. The Board considered the qualifications, experience and responsibilities of the portfolio managers, as well as the responsibilities of other key personnel of the Advisers involved in the day-to-day activities of the Funds. The Board also considered the resources and compliance structure of the Advisers, including information regarding their compliance program, their chief compliance officer and the Advisers’ compliance record, as well as the Advisers’ cybersecurity program, business continuity plan and risk management process. The Board also considered the prior relationship between the Advisers and the Trust, as well as the Board’s knowledge of the Advisers’ operations, and noted that during the course of the prior year they had met with certain personnel of the Advisers to discuss fund performance and investment outlook, as well as, various marketing and compliance topics, including the Advisers’ risk management process. The Board concluded that the Advisers had the quality and depth of personnel, resources, investment processes and compliance policies and procedures essential to performing their duties under the Advisory Agreements, and that they were satisfied with the nature, overall quality and extent of such management services. | |
| 2. | The Funds’ historical performance and the overall performance of the Advisers. In assessing the quality of the portfolio management delivered by the Advisers, the Board reviewed the short-term and long-term performance of each Fund on both an absolute basis, and in comparison to its peer funds utilizing Morningstar classifications, appropriate securities market benchmarks and the Advisers’ similarly managed accounts, all for periods ended March 31, 2022. The Board also considered performance against a smaller group of peers selected by an independent third-party consultant engaged by the Board to assist it in its 15(c) review (the “Cohort”). While the Board considered both short-term and long-term performance, it placed greater emphasis on longer term performance. When reviewing each Fund’s performance against its comparative peer group universe, the Board took into account that the investment objective and strategies of each Fund, as well as its level of risk tolerance, may differ significantly from funds in its respective peer universe. When reviewing the Funds’ performance against broad market benchmarks, the Board took into account the differences in portfolio construction between the Funds and such benchmarks as well as other differences between actively managed funds and passive benchmarks, such as objectives and risks. In assessing periods of relative underperformance or outperformance, the Board took into account that relative performance can be significantly impacted by performance measurement periods and that some periods of underperformance may be transitory in nature while others may reflect more significant underlying issues. |
85
Approval of Investment Advisory Agreements (Unaudited) (Continued)
| For the Osterweis Fund, the Board noted that the Fund underperformed its peer group median for the one-, three- and five-year periods. The Board also noted that the Fund underperformed the average of its Cohort for the one-, three- and five-year periods. The Board also considered the underperformance of the Fund against its broad- based securities market benchmark for the one-, three- and five-year periods. The Board also considered the Fund’s underperformance compared to the Adviser’s core equity composite for the one-, three- and five-year periods, noting such differences were not significant. | ||
| For the Osterweis Strategic Income Fund, the Board noted that the Fund outperformed its peer group median for the one-year, three year and five-year periods. The Board also noted that the Fund outperformed the average of its Cohort for the one- and three-year periods and underperformed for the five-year period. The Board also considered the outperformance of the Fund against its broad-based securities market benchmark for the one- year, three-year, five-year periods. The Board also considered the Fund’s underperformance compared to the Adviser’s strategic income composite for the one-year, three-year, and five-year periods, noting such differences were not significant. | ||
| For the Osterweis Growth & Income Fund, the Board noted that the Fund had outperformed its peer group median for the one-year, three-year and five-year periods. The Board also noted that the Fund outperformed the average of its Cohort for the one-year, three-year and five-year periods. The Board also considered the performance of the Fund against its broad-based securities market benchmark, noting it underperformed for the one- and five-year periods and outperformed for the three-year period. The Board also considered the Fund’s underperformance compared to the Adviser’s flexible balanced composite for the one-year, three-year, and five- year periods, noting such differences were not significant. | ||
| For the Osterweis Emerging Opportunity Fund, the Board noted that the Fund had underperformed its peer group median for the one-year period and outperformed for the three- and five-year periods. The Board also noted that the Fund outperformed the average of its Cohort for the one-, three- and five-year periods. The Board also considered the performance of the Fund against its broad-based securities market benchmark, noting it outperformed for the one-, three- and -year periods. The Board also considered the Fund’s underperformance compared to the Adviser’s emerging growth composite for the one-, three- and five-year periods, noting such differences were not significant. | ||
| For the Osterweis Total Return Fund, the Board noted that the Fund had underperformed its peer group median for the one-, three- and five-year periods. The Board also noted that the Fund outperformed the average of its Cohort for the one-year period and underperformed the average for the three- and five-year periods. The Board also considered the performance of the Fund against its broad-based securities market benchmark, noting it underperformed for the one-year period and outperformed for the three- and five-year periods. The Trustees noted that the Adviser does not replicate the Osterweis Total Return Fund’s investment style in separately managed accounts. | ||
| 3. | The costs of the services provided by the Advisers and the structure of the Advisers’ fees under the Advisory Agreements. In considering the advisory fee and total fees and expenses of each Fund, the Board reviewed comparisons to the peer funds and similarly managed separate accounts for other types of clients advised by the Advisers, as well as all expense waivers and reimbursements. When reviewing fees charged to other similarly managed accounts, the Board took into consideration the type of account and the differences in the management of that account that might be germane to the difference, if any, in the fees charged to such accounts. | |
| For the Osterweis Fund, the Board noted that the Adviser had contractually agreed to maintain an annual expense ratio of 0.95% excluding certain operating expenses (the “Expense Cap”). The Board noted that the Fund’s advisory fee and net expense ratio were higher than its peer group median and average. The Board noted that the Fund’s net expense ratio was lower than the average of its Cohort. The Board noted that, after discussions with the Board, the Adviser recently implemented the removal of breakpoints from the advisory fee with all assets being charged an advisory fee of 0.75% (previously was 1.00% on the first $250 million and 0.75% thereafter). The Board |
86
Approval of Investment Advisory Agreements (Unaudited) (Continued)
| noted that the fees charged to other similarly managed account clients were higher than, equal to, or lower than those charged to the Osterweis Fund depending on the level of assets. The Board concluded that the fees paid to the Adviser were fair and reasonable in light of the comparative performance and advisory fee information. | ||
| For the Osterweis Strategic Income Fund, the Board noted that the Fund’s advisory fee was higher than that of its peer group median and average. The Board noted the net expense ratio was above the median and below the average. The Board noted that the Fund’s net expense ratio was lower than the average of its Cohort. The Board considered that the advisory fee included breakpoints in order to share economies of scale with the Fund and that the breakpoints were currently in effect. The Board noted that the fees charged to other similarly managed account clients were higher than or equal to those charged to the Osterweis Strategic Income Fund depending on the level of assets. The Board concluded that the fees paid to the Adviser were fair and reasonable in light of the comparative performance and advisory fee information. | ||
| For the Osterweis Growth & Income Fund, the Board noted that the Fund’s advisory fee and net expense ratio were higher than those of its peer group median and average. The Board noted that the Fund’s net expense ratio was higher than the average of its Cohort. The Board noted the Adviser, after discussions with the Board, recently implemented the removal of breakpoints from the advisory fee with all assets being charged an advisory fee of 0.75% (previously was 1.00% on the first $500 million and 0.75% thereafter). The Board noted that the fees charged to other similarly managed account clients were higher than, equal to, or lower than those charged to the Osterweis Growth & Income Fund depending on the level of assets. The Board concluded that the fees paid to the Adviser were fair and reasonable in light of the comparative performance and advisory fee information. | ||
| For the Osterweis Emerging Opportunity Fund, the Board noted that the Adviser had contractually agreed to maintain an annual expense ratio of 1.10% (the “Expense Cap”). The Board noted that the Fund’s advisory fee was higher than that of its peer group median and average, and the net expense ratio was at the median and below the average. The Board noted that the Fund’s net expense ratio was higher than the average of its Cohort. The Board considered that the advisory fee included breakpoints in order to share economies of scale with the Fund, although Fund assets had not yet grown to a point where the breakpoint has been reached. The Board noted that the fees charged to other similarly managed account clients were higher than or equal to those charged to the Osterweis Emerging Opportunity Fund depending on the level of assets. The Board concluded that the fees paid to the Adviser were fair and reasonable in light of the comparative performance and advisory fee information. | ||
| For the Osterweis Total Return Fund, the Board noted that the Adviser had contractually agreed to maintain an annual expense ratio of 0.75% (the “Expense Cap”) although the Fund is currently operating below that level. The Board noted that the Fund’s advisory fee and net expense ratio were lower than those of its peer group median and average. The Board noted that the Fund’s net expense ratio was lower than the average of its Cohort. The Trustees noted that the Adviser does not replicate the Osterweis Total Return Fund’s investment style in separately managed accounts. The Board concluded that the fees paid to the Adviser were fair and reasonable in light of the comparative performance and advisory fee information. | ||
| 4. | Economies of Scale. The Board also considered whether economies of scale were being realized by the Advisers that should be shared with shareholders. The Board noted that the Advisory Agreements for the Osterweis Strategic Income Fund and Osterweis Emerging Opportunity Fund contain breakpoints in the advisory fee. The Board also noted that the Adviser has contractually agreed to reduce its advisory fees or reimburse expenses so that the Osterweis Fund, Osterweis Emerging Opportunity Fund, and Osterweis Total Return Fund do not exceed their respective Expense Cap. The Board noted that at current asset levels, it did not appear that there were additional significant economies of scale being realized by the Adviser that should be shared with shareholders and concluded that it would continue to monitor economies of scale in the future as circumstances changed and assuming asset levels continued to increase. |
87
Approval of Investment Advisory Agreements (Unaudited) (Continued)
| 5. | The profits to be realized by the Advisers and their affiliates from their relationship with the Funds. The Board reviewed the Advisers’ financial information and took into account both the direct benefits and the indirect benefits to the Advisers from advising the Funds. The Board considered the profitability to the Advisers from their relationship with the Funds and considered any additional material benefits derived by the Advisers from their relationship with the Funds, particularly benefits received in exchange for “soft dollars” paid to the Advisers. After such review, the Board determined that the profitability to the Advisers with respect to the Advisory Agreements was not excessive, and that the Advisers had maintained adequate financial resources to support the services they provide to the Funds. |
No single factor was determinative of the Board’s decision to approve the continuance of the Advisory Agreements, but rather the Board based its determination on the total mix of information available to the Trustees. Based on a consideration of all the factors in their totality, the Board determined that the advisory arrangements with the Advisers, including each Fund’s advisory fee, were fair and reasonable. The Board therefore determined that the continuance of the Advisory Agreements would be in the best interest of each Fund and its shareholders.
88
Statement Regarding Liquidity Risk Management Program (Unaudited)
The Funds have adopted a liquidity risk management program (the “program”). The Board has designated the Adviser to serve as the administrator of the program. Personnel of the Adviser conduct the day-to-day operation of the program pursuant to policies and procedures administered by the Adviser.
Under the program, the Adviser manages the Funds’ liquidity risk, which is the risk that the Funds could not meet shareholder redemption requests without significant dilution of remaining shareholders’ interests in the Funds. This risk is managed by monitoring the degree of liquidity of each Funds’ investments, limiting the amount of the Funds’ illiquid investments, and utilizing various risk management tools and facilities available to the Funds for meeting shareholder redemptions, among other means. The Adviser’s process of determining the degree of liquidity of the Funds’ investments is supported by one or more third-party liquidity assessment vendors.
The Board reviewed a report prepared by the Adviser regarding the operation and effectiveness of the program for the period January 1, 2022 through December 31, 2022. No significant liquidity events impacting any of the Funds were noted in the report. In addition, the Adviser provided its assessment that the program had been effective in managing the Funds’ liquidity risk.
89
Osterweis Funds | Privacy Notice (Unaudited)
The Funds collect non-public information about you from the following sources:
• Information we receive about you on applications or other forms;
• Information you give us orally; and
• Information about your transactions with us or others.
The Funds do not disclose any non-public personal information about our customers or former customers without the customer’s authorization, except as permitted by law or in response to inquiries from governmental authorities. The Funds may share information with affiliated parties and unaffiliated third parties with whom we have contracts for servicing the Funds. The Funds will provide unaffiliated third parties with only the information necessary to carry out their assigned responsibility. The Funds maintain physical, electronic and procedural safeguards to guard your non-public personal information and require third parties to treat your non-public information with the same high degree of confidentiality.
In the event that you hold shares of a Fund through a financial intermediary, including, but not limited to, a broker-dealer, bank or trust company, the privacy policy of your financial intermediary would govern how your non-public personal information would be shared by those entities with unaffiliated third parties.
90
(This Page Intentionally Left Blank.)
Advisers
OSTERWEIS CAPITAL MANAGEMENT, INC.
OSTERWEIS CAPITAL MANAGEMENT, LLC
One Maritime Plaza, Suite 800
San Francisco, CA 94111
Distributor
QUASAR DISTRIBUTORS, LLC
111 East Kilbourn Avenue, Suite 2200
Milwaukee, WI 53202
Custodian
U.S. BANK N.A.
Custody Operations
1555 North RiverCenter Drive, Suite 302
Milwaukee, WI 53212
Transfer Agent, Fund Accountant and Fund Administrator
U.S. BANCORP FUND SERVICES, LLC
615 East Michigan Street
Milwaukee, WI 53202
(866) 236-0050
Independent Registered Public Accounting Firm
TAIT, WELLER & BAKER LLP
Two Liberty Place
50 South 16th Street, Suite 2900
Philadelphia, PA 19102
Legal Counsel
SULLIVAN & WORCESTER LLP
1633 Broadway, 32nd Floor
New York, NY 10019
Fund Information
| Fund | Symbol | CUSIP | ||
| Osterweis Fund | OSTFX | 742935406 | ||
| Osterweis Strategic Income Fund | OSTIX | 742935489 | ||
| Osterweis Growth & Income Fund | OSTVX | 74316J771 | ||
| Osterweis Emerging Opportunity Fund | OSTGX | 74316P744 | ||
| Osterweis Total Return Fund | OSTRX | 74316P736 | ||
| Osterweis Short Duration Credit Fund | ZEOIX | 74316P694 | ||
| Osterweis Sustainable Credit Fund | ZSRIX | 74316P686 |
OWRPANN – 0323
| (b) | Not applicable. |
Item 2. Code of Ethics.
The registrant has adopted a code of ethics that applies to the registrant’s principal executive officer and principal financial officer. The registrant has not made any amendments to its code of ethics during the period covered by this report. The registrant has not granted any waivers from any provisions of the code of ethics during the period covered by this report.
A copy of the registrant’s Code of Ethics is filed herewith.
Item 3. Audit Committee Financial Expert.
The registrant’s Board of Trustees of the Trust has determined that there is at least one audit committee financial expert serving on its audit committee. Ms. Kathleen T. Barr, Ms. Cynthia M. Fornelli, Eric W. Falkeis, Steven J. Paggioli, and Ashi S. Parikh and are each an “audit committee financial expert” and are considered to be “independent” as each term is defined in Item 3 of Form N-CSR.
Item 4. Principal Accountant Fees and Services.
The registrant has engaged its principal accountant to perform audit services, audit-related services, tax services and other services during the past two fiscal years. “Audit services” refer to performing an audit of the registrant's annual financial statements or services that are normally provided by the accountant in connection with statutory and regulatory filings or engagements for those fiscal years. “Audit-related services” refer to the assurance and related services by the principal accountant that are reasonably related to the performance of the audit. “Tax services” refer to professional services rendered by the principal accountant for tax compliance, tax advice, and tax planning. There were no “Other services” provided by the principal accountant. The following table details the aggregate fees billed or expected to be billed for each of the last two fiscal years for audit fees, audit-related fees, tax fees and other fees by the principal accountant.
Osterweis Fund
FYE 3/31/2023 | FYE 3/31/2022 | |
Audit Fees | $26,700 | $26,200 |
Audit-Related Fees | N/A | N/A |
Tax Fees | $2,900 | $2,800 |
All Other Fees | N/A | N/A |
Osterweis Strategic Income Fund
FYE 3/31/2023 | FYE 3/31/2022 | |
Audit Fees | $26,700 | $26,200 |
Audit-Related Fees | N/A | N/A |
Tax Fees | $2,900 | $2,800 |
All Other Fees | N/A | N/A |
Osterweis Growth & Income Fund
FYE 3/31/2023 | FYE 3/31/2022 | |
Audit Fees | $24,000 | $23,500 |
Audit-Related Fees | N/A | N/A |
Tax Fees | $2,900 | $2,800 |
All Other Fees | N/A | N/A |
Osterweis Emerging Opportunity Fund
FYE 3/31/2023 | FYE 3/31/2022 | |
Audit Fees | $21,200 | $20,800 |
Audit-Related Fees | N/A | N/A |
Tax Fees | $2,900 | $2,800 |
All Other Fees | N/A | N/A |
Osterweis Total Return Fund
FYE 3/31/2023 | FYE 3/31/2022 | |
Audit Fees | $21,200 | $20,800 |
Audit-Related Fees | N/A | N/A |
Tax Fees | $2,900 | $2,800 |
All Other Fees | N/A | N/A |
Osterweis Short Duration Credit Fund
Period Ended 3/31/2023 | FYE 4/30/2022 | |
Audit Fees | $21,200 | $15,500 |
Audit-Related Fees | N/A | N/A |
Tax Fees | $2,900 | $2,500 |
All Other Fees | N/A | N/A |
Osterweis Sustainable Credit Fund
Period Ended 3/31/2023 | FYE 4/30/2022 | |
Audit Fees | $18,000 | $15,500 |
Audit-Related Fees | N/A | N/A |
Tax Fees | $2,900 | $2,500 |
All Other Fees | N/A | N/A |
The audit committee has adopted pre-approval policies and procedures that require the audit committee to pre‑approve all audit and non‑audit services of the registrant, including services provided to any entity affiliated with the registrant. All of the principal accountant’s hours spent on auditing the registrant’s financial statements were attributed to work performed by full-time permanent employees of the principal accountant.
The percentages of fees billed by Tait, Weller & Baker LLP (fiscal year/period ended 3/31/23 and 3/31/22) and Cohen & Company, Ltd. (fiscal year ended 4/30/22) applicable to non-audit services pursuant to waiver of pre-approval requirement were as follows:
Osterweis Fund
Non-Audit Related Fees | FYE 3/31/2023 | FYE 3/31/2022 |
Registrant | N/A | N/A |
Registrant’s Investment Adviser | N/A | N/A |
Osterweis Strategic Income Fund
Non-Audit Related Fees | FYE 3/31/2023 | FYE 3/31/2022 |
Registrant | N/A | N/A |
Registrant’s Investment Adviser | N/A | N/A |
Osterweis Growth & Income Fund
Non-Audit Related Fees | FYE 3/31/2023 | FYE 3/31/2022 |
Registrant | N/A | N/A |
Registrant’s Investment Adviser | N/A | N/A |
Osterweis Emerging Opportunity Fund
Non-Audit Related Fees | FYE 3/31/2023 | FYE 3/31/2022 |
Registrant | N/A | N/A |
Registrant’s Investment Adviser | N/A | N/A |
Osterweis Total Return Fund
Non-Audit Related Fees | FYE 3/31/2023 | FYE 3/31/2022 |
Registrant | N/A | N/A |
Registrant’s Investment Adviser | N/A | N/A |
Osterweis Short Duration Credit Fund
Non-Audit Related Fees | Period Ended 3/31/2023 | FYE 4/30/2022 |
Registrant | N/A | $2,500 |
Registrant’s Investment Adviser | N/A | N/A |
Osterweis Sustainable Credit Fund
Non-Audit Related Fees | Period Ended 3/31/2023 | FYE 4/30/2022 |
Registrant | N/A | $2,500 |
Registrant’s Investment Adviser | N/A | N/A |
The registrant has not been identified by the U.S. Securities and Exchange Commission as having filed and annual report issued by a registered public accounting firm branch or office that is located in a foreign jurisdiction where the Public Company Accounting Oversight Board is unable to inspect or completely investigate because of a position taken by an authority in that jurisdiction.
The registrant is not a foreign issuer.
Item 5. Audit Committee of Listed Registrants.
Not applicable to open-end investment companies.
Item 6. Investments.
Schedule of Investments is included as part of the report to shareholders filed under Item 1 of this Form.
(b) Not applicable.
Item 7. Disclosure of Proxy Voting Policies and Procedures for Closed-End Management Investment Companies.
Not applicable to open-end investment companies.
Item 8. Portfolio Managers of Closed-End Management Investment Companies.
Not applicable to open-end investment companies.
Item 9. Purchases of Equity Securities by Closed‑End Management Investment Company and Affiliated Purchasers.
Not applicable to open-end investment companies.
Item 10. Submission of Matters to a Vote of Security Holders.
The registrant has adopted a nominating committee charter that contains the procedures by which shareholders may recommend nominees to the registrant’s board of trustees. There have been no material changes to the procedures by which shareholders may recommend nominees to the registrant’s board of trustees for the period.
Item 11. Controls and Procedures.
| (a) | The Registrant’s President and Treasurer have reviewed the Registrant's disclosure controls and procedures (as defined in Rule 30a-3(c) under the Investment Company Act of 1940 (the “Act”)) as of a date within 90 days of the filing of this report, as required by Rule 30a-3(b) under the Act and Rules 13a-15(b) or 15d‑15(b) under the Securities Exchange Act of 1934. Based on their review, such officers have concluded that the disclosure controls and procedures are effective in ensuring that information required to be disclosed in this report is appropriately recorded, processed, summarized and reported and made known to them by others within the Registrant and by the Registrant’s service provider. |
| (b) | There were no changes in the Registrant's internal control over financial reporting (as defined in Rule 30a-3(d) under the Act) that occurred during the fourth fiscal quarter of the period covered by this report that has materially affected, or is reasonably likely to materially affect, the Registrant's internal control over financial reporting. |
Item 12. Disclosure of Securities Lending Activities for Closed-End Management Investment Companies.
Not applicable to open-end investment companies.
Item 13. Exhibits.
(3) Any written solicitation to purchase securities under Rule 23c‑1 under the Act sent or given during the period covered by the report by or on behalf of the registrant to 10 or more persons. Not applicable to open-end investment companies.
SIGNATURES
Pursuant to the requirements of the Securities Exchange Act of 1934 and the Investment Company Act of 1940, the registrant has duly caused this report to be signed on its behalf by the undersigned, thereunto duly authorized.
(Registrant) Professionally Managed Portfolios
By (Signature and Title) /s/Jason Hadler
Jason Hadler, President/Principal Executive Officer
Date June 7, 2023
Pursuant to the requirements of the Securities Exchange Act of 1934 and the Investment Company Act of 1940, this report has been signed below by the following persons on behalf of the registrant and in the capacities and on the dates indicated.
By (Signature and Title) /s/Jason Hadler
Jason Hadler, President/Principal Executive Officer
Date June 7, 2023
By (Signature and Title) /s/Craig Benton
Craig Benton, Treasurer/Principal Financial Officer
Date June 8, 2023
* Print the name and title of each signing officer under his or her signature.