| | |
| | |
| | |
| | Semi-Annual Report |
| | For the Six-Months Ended September 30, 2023 |
| | |
| | |
| | Osterweis Fund | |
| | Osterweis Strategic Income Fund | |
| | Osterweis Growth & Income Fund | |
| | Osterweis Emerging Opportunity Fund | |
| | Osterweis Total Return Fund | |
| | Osterweis Short Duration Credit Fund | |
| | Osterweis Sustainable Credit Fund | |
Important Notice:
Beginning on January 1, 2021, as permitted by regulations adopted by the Securities and Exchange Commission, paper copies of the Funds’ annual and semi-annual shareholder reports are no longer sent by mail, unless you specifically request paper copies of the reports. Instead, the reports are made available on the Funds’ website at www.osterweis.com/literature, and you will be notified by mail each time a report is posted and provided with a website to access the report. If you already elected to receive shareholder reports electronically, you will not be affected by this change and you need not take any action.
If you would like to receive paper copies and have not done so already, you may elect to receive paper copies of all future reports free of charge by contacting your financial intermediary or, if you invest directly with the Osterweis Funds, calling (866) 236-0050. Your election to receive paper reports will apply to all funds held within your account(s).
Disclosures
Past performance does not guarantee future results. This commentary contains the current opinions of the authors as of the referenced date, which are subject to change at any time. This commentary has been distributed for informational purposes only and is not a recommendation or offer of any particular security, strategy, or investment product. Information contained herein has been obtained from sources believed to be reliable but is not guaranteed.
Fund holdings and sector allocations are subject to change at any time and should not be considered a recommendation to buy or sell any security. Current and future portfolio holdings are subject to risk. Please refer to the Schedule of Investments for complete fund holdings.
No part of this document may be reproduced in any form, or referred to in any other publication, without the express written permission of Osterweis Capital Management.
Consumer Price Index (CPI) reflects the weighted average of prices of a basket of consumer goods and services, such as transportation, food, and medical care.
The fed funds rate is the rate at which depository institutions (banks) lend their reserve balances to other banks on an overnight basis.
West Texas Intermediate (WTI) is a light, sweet crude oil that serves as one of the main global oil benchmarks.
The S&P 500 Index is an unmanaged index that is widely regarded as the standard for measuring large-cap U.S. stock market performance.
The Bloomberg U.S. Aggregate Bond Index (Agg) is widely regarded as the standard for measuring U.S. investment grade bond market performance. The Bloomberg U.S. Aggregate Bond 1–3 Year Index is the 1-3 Year segment of the Agg.
The 60/40 blend is composed of 60% S&P 500 and 40% Agg and assumes monthly rebalancing.
The ICE 0-2 Yr Duration BB-B U.S. High Yield Constrained Index contains all securities in the ICE BofA U.S. High Yield Index rated BB1 through B3 with a duration-to-worst of less than two years.
The ICE BofA Single-B U.S. High Yield Index is a subset of ICE BofA U.S. High Yield Index including all securities rated B1 through B3.
The Russell 2000 Growth Index (Russell 2000G) is a market-capitalization-weighted index representing the small cap growth segment of U.S. equities.
These indices reflect the reinvestment of dividends and/or interest income. These indices do not incur expenses except where noted and are not available for investment.
All currency figures are shown in USD.
Duration measures the sensitivity of a fixed income security’s price to changes in interest rates. Fixed income securities with longer durations generally have more volatile prices than those of comparable quality with shorter durations.
Treasuries (including bonds, notes, and bills) are securities sold by the federal government to consumers and investors to fund its operations. They are all backed by “the full faith and credit of the United States government” and thus are considered free of default risk.
Investment grade and non-investment grade (high yield) categories are determined by credit ratings from Standard and Poor’s and Moody’s, which are private independent rating services that assign grades to bonds to represent their credit quality. The issues are evaluated based on such factors as the bond issuer’s financial strength, or its ability to pay a bond’s principal and interest in a timely fashion. Standard and Poor’s ratings are expressed as letters ranging from ‘AAA’, which is the highest grade, to ‘D’, which is the lowest grade. Moody’s ratings are expressed as letters and numbers ranging from ‘Aaa’, which is the highest grade, to ‘C’, which is the lowest grade. A Standard and Poor’s rating of BBB- or higher is considered investment grade. A Moody’s rating of Baa3 or higher is considered investment grade. A Standard and Poor’s rating below BBB- is considered non-investment grade. A Moody’s rating below Baa3 is considered non-investment grade.
The Global Industry Classification Standard (GICS) was developed by and is the exclusive property and a service mark of MSCI Inc. (MSCI) and Standard & Poor’s (S&P), a division of The McGraw-Hill Companies, Inc. and is licensed for use by Osterweis Capital Management.
Neither MSCI, S&P, nor any other party involved in making or compiling the GICS classifications makes any express or implied warranties or representations with respect to such standard or classification (or the results to be obtained by the use thereof), and all such parties hereby expressly disclaim all warranties of originality, accuracy, completeness, merchantability, and fitness for a particular purpose with respect to any such standard or classification. Without limiting any of the foregoing, in no event shall MSCI, S&P, any of their affiliates or any third party involved in making or compiling the GICS, or any GICS classifications have any liability for any direct, indirect, special, punitive, consequential, or any other damages (including lost profits), even if notified of the possibility of such damages.
Any ICE index data referenced herein is the property of ICE Data Indices, LLC, its affiliates (“ICE Data”) and/or its Third Party Suppliers and has been licensed for use by Osterweis Capital Management. ICE Data and its Third Party Suppliers accept no liability in connection with its use. See https://www.osterweis.com/glossary for a full copy of the Disclaimer.
Source for any Bloomberg index is Bloomberg Index Services Limited. BLOOMBERG® is a trademark and service mark of Bloomberg Finance L.P. and its affiliates (collectively “Bloomberg”). Bloomberg owns all proprietary rights in the Bloomberg Indices. Bloomberg does not approve or endorse this material, or guarantees the accuracy or completeness of any information herein, or makes any warranty, express or implied, as to the results to be obtained therefrom and, to the maximum extent allowed by law, neither shall have any liability or responsibility for injury or damages arising in connection therewith.
This document must be preceded or accompanied by a current prospectus. Please refer to the prospectus for important information about the investment company including objectives, risks, charges and expenses.
Osterweis Capital Management is the adviser to the Osterweis Funds, which are distributed by Quasar Distributors, LLC. [OCMI-457875-2023-11-15]
Table of Contents
| Letter from the Investment Teams | | 2 |
| Standardized Performance Summary | | 4 |
| Sector Allocations | | 5 |
| Schedule of Investments | | |
| Osterweis Fund | | 8 |
| Osterweis Strategic Income Fund | | 9 |
| Osterweis Growth & Income Fund | | 15 |
| Osterweis Emerging Opportunity Fund | | 20 |
| Osterweis Total Return Fund | | 22 |
Osterweis Short Duration Credit Fund | | 25 |
Osterweis Sustainable Credit Fund | | 26 |
| Financial Statements | | |
| Statements of Assets and Liabilities | | 27 |
| Statements of Operations | | 29 |
| Statements of Changes in Net Assets | | |
| Osterweis Fund | | 31 |
| Osterweis Strategic Income Fund | | 32 |
| Osterweis Growth & Income Fund | | 33 |
| Osterweis Emerging Opportunity Fund | | 34 |
| Osterweis Total Return Fund | | 35 |
Osterweis Short Duration Credit Fund | | 36 |
Osterweis Sustainable Credit Fund | | 37 |
| Financial Highlights | | |
| Osterweis Fund | | 38 |
| Osterweis Strategic Income Fund | | 39 |
| Osterweis Growth & Income Fund | | 40 |
| Osterweis Emerging Opportunity Fund | | 41 |
| Osterweis Total Return Fund | | 42 |
Osterweis Short Duration Credit Fund | | 43 |
Osterweis Sustainable Credit Fund | | 44 |
| Notes to Financial Statements | | 45 |
| Expense Examples | | 60 |
| Additional Information | | 62 |
| Approval of Investment Advisory Agreements | | 63 |
| Statement Regarding Liquidity Risk Management Program | | 67 |
| Privacy Notice | | 68 |
Letter from the Investment Teams
October 15, 2023
The past two fiscal quarters have been a bit of a rollercoaster for investors. At the conclusion of the first fiscal quarter, optimism was high and markets were firmly in the black. Persistent rate hikes seemed to be taming inflation without slowing the economy or dramatically raising unemployment, and it appeared that the Fed’s elusive soft landing might happen.
However, sentiment shifted significantly during the second fiscal quarter, and by the end of the period most major markets were negative. Although CPI continued to fall, with the August release reporting a 3.7% year-over-year increase (far lower than the eye-popping 8.3% from August 2022), the quarter produced a litany of other worrying developments from an inflation standpoint:
| | 1) | Oil prices soared due to tightening supply, with West Texas Intermediate (WTI) climbing from just $70 at the end of June to as high as $91 in the middle of September; |
| | | |
| | 2) | A long simmering trade battle between the U.S. and Europe on one side and China on the other escalated further; |
| | | |
| | 3) | The United Auto Workers (UAW) called the biggest strike in decades, with the UAW walking out on several of the Detroit Three automakers’ plants and threatening to widen the strike. |
The net effect of significantly higher oil prices, a worsening trade war with China, and a large and potentially widening labor strike could very well mean renewed and persistent inflation. The soft landing that seemed tantalizingly close at the end of the first fiscal quarter may now be in jeopardy.
Given the strong economy and risk of persistent inflation, the Fed announced a “hawkish pause” at the end of September, keeping the fed funds rate at an elevated 5.25-5.50%, as was widely expected. However, the Fed’s updated “dot plot” that forecasts future interest rates indicated most Fed participants support hiking the rate once more in 2023 to 5.50-5.75%, and the Fed now anticipates holding interest rates higher for longer due to the risk of elevated and persistent inflation.
As a result, Treasury yields spiked in the second fiscal quarter, with the all-important 10-year Treasury trading near 5%, the highest yield (and lowest price) since 2007. As one would expect, equities also reversed their gains from the first fiscal quarter, as the market digested the possibility of persistently high interest rates.
As always, predicting the near-term path of the economy, inflation, and interest rates is fraught with uncertainty. In fact, earlier in 2023 virtually every professional economist thought the U.S. was headed into a recession, and the question was simply one of timing — whether the economy would go into recession in mid-2023, late 2023, or early 2024. As noted above, however, the economy appears quite healthy at the moment.
Therefore, we make economic (and company-level) projections with great humility, acknowledging that the range of potential outcomes is wide. From our vantage point, a soft landing is still possible, especially if the Fed’s more hawkish projection is merely jawboning, with the intended effect of dampening demand to help tamp down inflation without having to actually raise interest rates. Recent wage gains in excess of inflation and low unemployment mean that the average consumer is actually in decent shape, further greasing the wheels for a potential soft landing. Furthermore, savers’ ability to generate a real return on cash for the first time in years — due to higher interest rates — creates added income for well-capitalized companies and consumers. Lastly, companies and consumers who locked in debt at historically low rates the past few years may well be shielded from higher rates for now.
However, we think it is equally possible that elevated interest rates materially reduce demand across the economy and send us into a recession. This possibility becomes more acute the longer high interest rates persist.
Looking forward, the optimist in us takes comfort in the resilience of the American consumer, who drives roughly 70% of economic activity. However, our pessimistic side keeps us paranoid and thinking about the potential risks ahead.
Letter from the Investment Teams
We invite you visit www.osterweis.com for more information about each fund, including our latest market commentary as well as our portfolio holdings and fund performance. If you would like to receive our quarterly shareholder letters by email, please sign up online, email us at contact@osterweis.com, or call (800) 700-3316.
Sincerely,
| |  |  |
| | John Osterweis | Carl Kaufman |
| | Chairman & Co-CIO – | Co-CEO, Managing Director of |
| | Core Equity | Fixed Income & |
| | CIO – Strategic Income | |
____________________
This commentary contains the current opinions of the author as of the date above, which are subject to change at any time. This commentary has been distributed for informational purposes only and is not a recommendation or offer of any particular security, strategy or investment product. Information contained herein has been obtained from sources believed to be reliable, but is not guaranteed.
Osterweis Funds | Fund Overview (Unaudited)
| Average Annual Total Returns | | | | | | | |
| Periods Ended September 30, 2023 | | | | | | | |
| | | | | | | | Since Inception |
| | Six Months | 1 Yr. | 3 Yr. | 5 Yr. | 10 Yr. | 15 Yr. | (October 1, 1993) |
| Osterweis Fund | 1.53% | 14.34% | 4.48% | 7.83% | 6.87% | 8.03% | 9.79% |
| S&P 500 Index | 5.18 | 21.62 | 10.15 | 9.92 | 11.91 | 11.28 | 9.81 |
Gross Expense Ratio as of 3/31/2023: 0.97% 1 | | | | | | | |
| | | | | | | | Since Inception |
| | Six Months | 1 Yr. | 3 Yr. | 5 Yr. | 10 Yr. | 15 Yr. | (August 30, 2002) |
| Osterweis Strategic Income Fund | 4.19% | 11.20% | 3.61% | 3.34% | 3.81% | 5.45% | 5.94% |
| Bloomberg U.S. Aggregate Bond Index | -4.05 | 0.64 | -5.21 | 0.10 | 1.13 | 2.53 | 3.03 |
Gross Expense Ratio as of 3/31/2023: 0.86% 1 | | | | | | | |
| | | | | | | | Since Inception |
| | Six Months | 1 Yr. | 3 Yr. | 5 Yr. | 10 Yr. | | (August 31, 2010) |
| Osterweis Growth & Income Fund | 0.71% | 10.00% | 5.19% | 6.23% | 6.12% | | 8.19% |
| 60% S&P 500 Index/40% Bloomberg | | | | | | | |
| U.S. Aggregate Bond Index | 1.47 | 13.01 | 4.01 | 6.27 | 7.74 | | 8.85 |
| S&P 500 Index | 5.18 | 21.62 | 10.15 | 9.92 | 11.91 | | 13.56 |
| Bloomberg U.S. Aggregate Bond Index | -4.05 | 0.64 | -5.21 | 0.10 | 1.13 | | 1.52 |
Gross Expense Ratio as of 3/31/2023: 0.94%1 | | | | | | | |
| | | | | | | | Since Inception |
| | Six Months | 1 Yr. | 3 Yr. | 5 Yr. | 10 Yr. | | (October 1, 2012) |
| Osterweis Emerging Opportunity Fund | 0.55% | 13.71% | -0.38% | 6.44% | 10.67% | | 13.00% |
| Russell 2000 Growth Index | -0.78 | 9.59 | 1.09 | 1.55 | 6.72 | | 8.86 |
Gross/Net Expense Ratio as of 3/31/2023: 1.25%/1.13% 1,2 | | | | | | |
| | | | | | | | Since Inception |
| | Six Months | 1 Yr. | 3 Yr. | 5 Yr. | | | (December 30, 2016) |
| Osterweis Total Return Fund | -3.04% | 0.57% | -2.27% | 0.57% | | | 1.37% |
| Bloomberg U.S. Aggregate Bond Index | -4.05 | 0.64 | -5.21 | 0.10 | | | 0.35 |
Gross Expense Ratio as of 3/31/2023: 0.68% 1 | | | | | | | |
| | | | | | | | Since Inception |
| | Six Months | 1 Yr. | 3 Yr. | 5 Yr. | 10 Yr. | | (May 31, 2011) |
| Osterweis Short Duration Credit Fund | -1.69% | -0.38% | -0.80% | -0.02% | 1.48% | | 1.76% |
| Bloomberg U.S. Aggregate Bond Index | -4.05 | 0.64 | -5.21 | 0.10 | 1.13 | | 1.47 |
| ICE BofA 0-2Yr Duration BB-B | | | | | | | |
| High Yield Constrained Index | 3.76 | 8.93 | 3.38 | 3.01 | 3.47 | | 3.81 |
Gross Expense Ratio as of 3/31/2023: 0.99% 1 | | | | | | | |
| | | | | | | | Since Inception |
| | Six Months | 1 Yr. | 3 Yr. | | | | (May 31, 2019) |
| Osterweis Sustainable Credit Fund | -1.10% | 0.43% | -0.24% | | | | -0.80% |
| Bloomberg U.S. Aggregate Bond Index | -4.05 | 0.64 | -5.21 | | | | -1.33 |
| ICE BofA Single-B U.S. HY Index | 2.81 | 11.35 | 1.90 | | | | 2.33 |
Gross/Net Expense Ratio as of 3/31/2023: 3.00%/0.99% 1,3 | | | | | | |
1 | As of most recent Prospectus dated June 30, 2023. Please see the Fund’s Financial Highlights in this report for the most recent expense ratio. |
2 | The Adviser has contractually agreed to waive certain fees through June 30, 2024. The net expense ratio is applicable to investors. |
3 | The Adviser has contractually agreed to waive certain fees through October 10, 2024. The net expense ratio is applicable to investors. |
The performance data quoted above represents past performance. Past performance does not guarantee future results. The investment return and principal value of an investment will fluctuate so that an investor’s shares, when redeemed, may be worth more or less than their original cost. Current performance of the Fund may be lower or higher than the performance quoted. Performance data current to the most recent month-end may be obtained by calling (866) 236-0050.
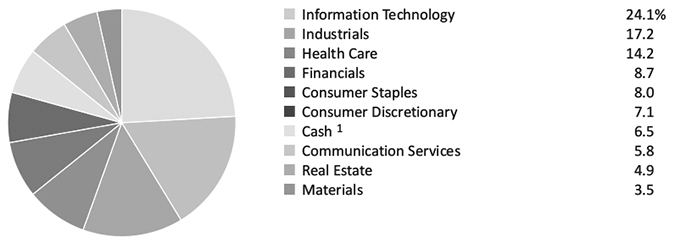
Osterweis Funds | Sector Allocations (Unaudited)
Osterweis Fund
Sector Allocation (% of Net Assets) (Unaudited)
Osterweis Strategic Income Fund
Asset/Sector Allocation (% of Net Assets) (Unaudited) 2
Osterweis Growth & Income Fund
Asset/Sector Allocation (% of Net Assets) (Unaudited) 2
1 | Cash, cash equivalents and other assets less liabilities. |
2 | Equities are classified by GICS sector. Bonds are classified by bond type. |
3 | Does not round to 0.1%. |
Osterweis Funds | Sector Allocations (Unaudited) (Continued)
Osterweis Emerging Opportunity Fund
Sector Allocation (% of Net Assets) (Unaudited)
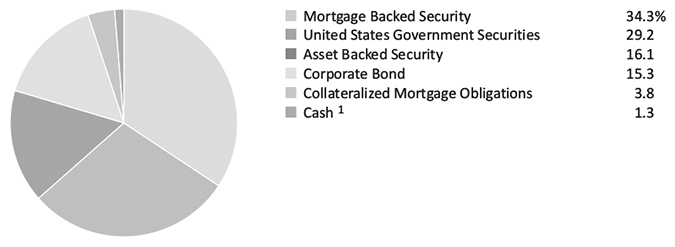
Osterweis Total Return Fund
Asset Allocation (% of Net Assets) (Unaudited)
1 | Cash, cash equivalents and other assets less liabilities. |
Osterweis Funds | Sector Allocations (Unaudited) (Continued)
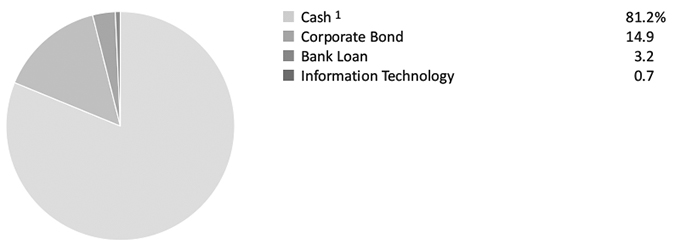
Osterweis Short Duration Credit Fund
Asset/Sector Allocation (% of Net Assets) (Unaudited)
Osterweis Sustainable Credit Fund
Asset/Sector Allocation (% of Net Assets) (Unaudited)
1 | Cash, cash equivalents and other assets less liabilities. |
Osterweis Fund | Schedule of Investments at September 30, 2023 (Unaudited)
| Shares | | | | Value | |
| Common Stocks: 93.5% | | | |
| | | | | | |
| Aerospace & Defense: 7.7% | | | |
| | 78,620 | | Airbus SE – ADR | | $ | 2,630,625 | |
| | 27,730 | | L3Harris Technologies, Inc. | | | 4,828,348 | |
| | 69,760 | | Safran SA – ADR | | | 2,730,407 | |
| | | | | | | 10,189,380 | |
| Broadline Retail: 4.0% | | | | |
| | 42,005 | | Amazon.com, Inc. 1 | | | 5,339,676 | |
| | | | | |
| Chemicals: 3.5% | | | | |
| | 11,250 | | Air Products & Chemicals, Inc. | | | 3,188,250 | |
| | 3,875 | | Linde PLC | | | 1,442,856 | |
| | | | | | | 4,631,106 | |
| Commercial Services & Supplies: 3.0% | | | | |
| | 29,795 | | Waste Connections, Inc. | | | 4,001,468 | |
| | | | | |
| Consumer Staples Distribution & Retail: 5.8% | | | | |
| | 61,380 | | Sysco Corp. | | | 4,054,149 | |
| | 32,995 | | Target Corp. | | | 3,648,257 | |
| | | | | | | 7,702,406 | |
| Electrical Equipment: 2.5% | | | | |
| | 22,210 | | AMETEK, Inc. | | | 3,281,750 | |
| | | | | |
| Financial Services: 3.2% | | | | |
| | 18,730 | | Visa, Inc. – Class A | | | 4,308,087 | |
| | | | | |
| Ground Transportation: 4.1% | | | | |
| | 6,615 | | Old Dominion Freight Line, Inc. | | | 2,706,461 | |
| | 13,530 | | Union Pacific Corp. | | | 2,755,114 | |
| | | | | | | 5,461,575 | |
| Health Care Equipment & Supplies: 7.5% | | | | |
| | 14,390 | | Becton Dickinson & Co. | | | 3,720,247 | |
| | 90,495 | | Boston Scientific Corp. 1 | | | 4,778,136 | |
| | 7,455 | | Teleflex, Inc. | | | 1,464,236 | |
| | | | | | | 9,962,619 | |
| Industrial REITs: 3.0% | | | | |
| | 23,835 | | EastGroup Properties, Inc. | | | 3,969,243 | |
| | | | | |
| Insurance: 5.4% | | | | |
| | 47,575 | | Brown & Brown, Inc. | | | 3,322,638 | |
| | 28,270 | | The Progressive Corp. | | | 3,938,011 | |
| | | | | | | 7,260,649 | |
| Interactive Media & Services: 5.8% | | | | |
| | 58,645 | | Alphabet, Inc. – Class C 1 | | | 7,732,343 | |
| | | | | |
| IT Services: 1.8% | | | | |
| | 7,905 | | Accenture PLC – Class A | | | 2,427,705 | |
| | | | | |
| Life Sciences Tools & Services: 6.8% | | | | |
| | 17,545 | | Agilent Technologies, Inc. | | | 1,961,882 | |
| | 172,380 | | Avantor, Inc. 1 | | | 3,633,770 | |
| | 13,750 | | Danaher Corp. | | | 3,411,375 | |
| | | | | | | 9,007,027 | |
| Personal Care Products: 2.2% | | | | |
| | 148,588 | | Kenvue, Inc. | | | 2,983,647 | |
| | | | | |
| Semiconductors & Semiconductor Equipment: 8.6% | | | | |
| | 27,006 | | Advanced Micro Devices, Inc. 1 | | | 2,776,757 | |
| | 17,850 | | Analog Devices, Inc. | | | 3,125,356 | |
| | 19,589 | | Applied Materials, Inc. | | | 2,712,097 | |
| | 40,800 | | Micron Technology, Inc. | | | 2,775,624 | |
| | | | | | | 11,389,834 | |
| Software: 13.7% | | | | |
| | 10,445 | | Adobe, Inc. 1 | | | 5,325,905 | |
| | 33,829 | | Microsoft Corp. | | | 10,681,507 | |
| | 4,828 | | Synopsys, Inc. 1 | | | 2,215,907 | |
| | | | | | | 18,223,319 | |
| Specialized REITs: 1.9% | | | | |
| | 31,130 | | Lamar Advertising Co. – Class A | | | 2,598,421 | |
| | | | | |
| Specialty Retail: 3.0% | | | | |
| | 35,810 | | Ross Stores, Inc. | | | 4,044,740 | |
| | | | | |
| Total Common Stocks | | | | |
| (Cost $86,521,817) | | | 124,514,995 | |
| | | | | | | | |
| Short-Term Investments: 4.1% | | | | |
| | | | | | | | |
| Money Market Funds: 4.1% | | | | |
| | 5,504,489 | | Federated Hermes U.S. Treasury | | | | |
| | | | Cash Reserves – Class I, 5.206% 2 | | | 5,504,489 | |
| TOTAL SHORT-TERM INVESTMENTS | | | | |
| (Cost $5,504,489) | | | 5,504,489 | |
| TOTAL INVESTMENTS IN SECURITIES: 97.6% | | | | |
| (Cost $92,026,306) | | | 130,019,484 | |
| Other Assets in Excess of Liabilities: 2.4% | | | 3,158,042 | |
| TOTAL NET ASSETS: 100.0% | | $ | 133,177,526 | |
ADR – American Depositary Receipt
REIT – Real Estate Investment Trust
1 | Non-income producing security. |
2 | Annualized seven-day effective yield as of September 30, 2023. |
The Global Industry Classification Standard (GICS®) was developed by and/or is the exclusive property of MSCI, Inc. (“MSCI”) and Standard & Poor’s Financial Services LLC (“S&P”). GICS is a service mark of MSCI and S&P and has been licensed for use by the administrator, U.S. Bancorp Fund Services, LLC.
The accompanying Notes to Financial Statements are an integral part of these financial statements.
Strategic Income Fund | Schedule of Investments at September 30, 2023 (Unaudited)
| Shares | | | | Value | |
| Common Stocks: 3.3% | | | |
| | | | | | |
| Consumer Staples Distribution & Retail: 2.5% | | | |
| | 4,649,942 | | Southeastern Grocers, Inc. 1,7 | | $ | 117,411,036 | |
| | 61,582,000 | | Tops Holding, Litigation | | | | |
| | | | Trust Proceeds 1,7,8 | | | 46,248 | |
| | | | | | | 117,457,284 | |
| Metals & Mining: 0.8% | | | | |
| | 705 | | Real Alloy Holding, Inc. 1,7 | | | 39,455,920 | |
| | | | | |
| Total Common Stocks | | | | |
| (Cost $99,169,632) | | | 156,913,204 | |
| | | | | | | | |
| Convertible Preferred Stocks: 0.9% | | | | |
| | | | | | | | |
| Ground Transportation: 0.9% | | | | |
| | 490,000 | | Daseke, Inc., 7.630% 4,7 | | | 40,452,440 | |
| | | | | |
| Total Convertible Preferred Stocks | | | | |
| (Cost $49,000,000) | | | 40,452,440 | |
| | | | | | | | |
| | | | | | | | |
| Contracts | | | | | | |
| WARRANT: 0.0% | | | | |
| | | | | | | | |
| Trading Companies & Distributors: 0.0% | | | | |
| | 1,601,250 | | Avation PLC, | | | | |
| | | | (Expiration date 10/31/2026, | | | | |
| | | | Exercise Price 114.5 GBP) 1 | | | 976,848 | |
| | | | | |
| Total Warrant | | | | |
| (Cost $–) | | | 976,848 | |
| | | | | | | | |
| Principal | | | | | | |
| Amount | | | | | | |
| Corporate Bonds: 81.9% | | | | |
| | | | | | | | |
| Automobile Components: 5.5% | | | | |
| | | | Adient Global Holdings Ltd. | | | | |
| $ | 12,650,000 | | 7.000%, 04/15/2028 2 | | | 12,561,494 | |
| | | | American Axle & Manufacturing, Inc. | | | | |
| | 17,428,000 | | 6.250%, 03/15/2026 | | | 16,924,712 | |
| | 9,260,000 | | 6.500%, 04/01/2027 | | | 8,801,284 | |
| | 40,000,000 | | 6.875%, 07/01/2028 | | | 36,351,400 | |
| | | | Patrick Industries, Inc. | | | | |
| | 51,339,000 | | 7.500%, 10/15/2027 2 | | | 49,211,769 | |
| | | | Real Hero Merger Sub 2, Inc. | | | | |
| | 54,702,000 | | 6.250%, 02/01/2029 2 | | | 42,269,215 | |
| | | | The Goodyear Tire & Rubber Co. | | | | |
| | 78,511,000 | | 9.500%, 05/31/2025 | | | 79,766,848 | |
| | 14,500,000 | | 5.000%, 07/15/2029 | | | 12,508,384 | |
| | | | | | | 258,395,106 | |
| Automobiles: 1.7% | | | | |
| | | | Ford Motor Co. | | | | |
| 9,000,000 | | 9.625%, 04/22/2030 | | | 10,290,051 | |
| | | | Ford Motor Credit Co. LLC | | | | |
| | 53,252,000 | | 5.584%, 03/18/2024 | | | 52,969,956 | |
| | 10,000,000 | | 4.687%, 06/09/2025 | | | 9,619,834 | |
| | | | Thor Industries, Inc. | | | | |
| | 10,000,000 | | 4.000%, 10/15/2029 2 | | | 8,250,000 | |
| | | | | | | 81,129,841 | |
| Beverages: 0.4% | | | | |
| | | | Primo Water Holdings, Inc. | | | | |
| | 19,700,000 | | 4.375%, 04/30/2029 2 | | | 16,864,776 | |
| | | | | |
| Building Products: 1.3% | | | | |
| | | | Griffon Corp. | | | | |
| | 60,288,000 | | 5.750%, 03/01/2028 | | | 54,794,630 | |
| | | | PGT Innovations, Inc. | | | | |
| | 5,000,000 | | 4.375%, 10/01/2029 | | | 4,615,907 | |
| | | | | | | 59,410,537 | |
| Capital Markets: 1.9% | | | | |
| | | | Ares Capital Corp. | | | | |
| | 40,357,000 | | 4.200%, 06/10/2024 | | | 39,634,731 | |
| | | | Oppenheimer Holdings, Inc. | | | | |
| | 50,650,000 | | 5.500%, 10/01/2025 | | | 48,949,173 | |
| | | | | | | 88,583,904 | |
| Chemicals: 1.4% | | | | |
| | | | Consolidated Energy Finance SA | | | | |
| | 39,500,000 | | 5.625%, 10/15/2028 2 | | | 32,675,980 | |
| | | | INEOS Quattro Finance 2 PLC | | | | |
| | 37,474,000 | | 3.375%, 01/15/2026 2 | | | 34,177,278 | |
| | | | | | | 66,853,258 | |
| Commercial Services & Supplies: 1.6% | | | | |
| | | | GFL Environmental, Inc. | | | | |
| | 11,100,000 | | 5.125%, 12/15/2026 2 | | | 10,584,890 | |
| | 19,750,000 | | 4.750%, 06/15/2029 2 | | | 17,580,020 | |
| | | | Pitney Bowes, Inc. | | | | |
| | 64,620,000 | | 7.250%, 03/15/2029 2 | | | 47,489,238 | |
| | | | | | | 75,654,148 | |
| Computers & Peripherals: 2.5% | | | | |
| | | | CPI Acquisition, Inc. | | | | |
| | 50,543,000 | | 8.625%, 03/15/2026 2 | | | 49,843,232 | |
| | | | Xerox Holdings Corp. | | | | |
| | 70,000,000 | | 5.000%, 08/15/2025 2 | | | 66,561,306 | |
| | | | | | | 116,404,538 | |
| Construction & Engineering: 4.3% | | | | |
| | | | APi Group DE, Inc. | | | | |
| | 39,750,000 | | 4.125%, 07/15/2029 2 | | | 33,453,204 | |
The accompanying Notes to Financial Statements are an integral part of these financial statements.
Strategic Income Fund | Schedule of Investments at September 30, 2023 (Unaudited) (Continued)
| Principal | | | | | |
| Amount | | | | Value | |
| Construction & Engineering: 4.3% (Continued) | | | |
| | | Global Infrastructure Solutions, Inc. | | | |
| $ | 51,157,000 | | 5.625%, 06/01/2029 2 | | $ | 42,216,035 | |
| | | | Great Lakes Dredge & Dock Corp. | | | | |
| | 25,832,000 | | 5.250%, 06/01/2029 2 | | | 21,220,430 | |
| | | | New Enterprise Stone | | | | |
| | | | & Lime Co., Inc. | | | | |
| | 46,500,000 | | 5.250%, 07/15/2028 2 | | | 41,785,143 | |
| | | | Tutor Perini Corp. | | | | |
| | 72,415,000 | | 6.875%, 05/01/2025 2 | | | 66,362,562 | |
| | | | | | | 205,037,374 | |
| Consumer Finance: 5.5% | | | | |
| | | | Ally Financial, Inc. | | | | |
| | 44,963,000 | | 1.450%, 10/02/2023 | | | 44,963,000 | |
| | 14,820,000 | | 3.875%, 05/21/2024 | | | 14,547,023 | |
| | | | Bread Financial Holdings, Inc. | | | | |
| | 15,832,000 | | 4.750%, 12/15/2024 2 | | | 15,461,573 | |
| | 49,250,000 | | 7.000%, 01/15/2026 2 | | | 46,181,421 | |
| | | | Enova International, Inc. | | | | |
| | 4,960,000 | | 8.500%, 09/01/2024 2 | | | 4,940,482 | |
| | 68,837,000 | | 8.500%, 09/15/2025 2 | | | 67,361,479 | |
| | | | FirstCash, Inc. | | | | |
| | 15,000,000 | | 4.625%, 09/01/2028 2 | | | 13,308,258 | |
| | 19,500,000 | | 5.625%, 01/01/2030 2 | | | 17,566,920 | |
| | | | OneMain Finance Corp. | | | | |
| | 29,957,000 | | 8.250%, 10/01/2023 | | | 29,957,000 | |
| | 6,777,000 | | 6.125%, 03/15/2024 | | | 6,761,801 | |
| | | | | | | 261,048,957 | |
| Consumer Staples Distribution & Retail: 4.3% | | | | |
| | | | C&S Group Enterprises LLC | | | | |
| | 45,765,000 | | 5.000%, 12/15/2028 2 | | | 34,845,402 | |
| | | | KeHE Distributors LLC / | | | | |
| | | | KeHE Finance Corp. | | | | |
| | 62,262,000 | | 8.625%, 10/15/2026 2 | | | 62,509,955 | |
| | | | Performance Food Group, Inc. | | | | |
| | 19,500,000 | | 4.250%, 08/01/2029 2 | | | 16,868,733 | |
| | | | SEG Holding LLC / SEG Finance Corp. | | | | |
| | 29,087,000 | | 5.625%, 10/15/2028 2 | | | 29,177,259 | |
| | | | United Natural Foods, Inc. | | | | |
| | 50,549,000 | | 6.750%, 10/15/2028 | | | 38,601,744 | |
| | | | US Foods, Inc. | | | | |
| | 23,384,000 | | 4.750%, 02/15/2029 2 | | | 20,927,172 | |
| | | | | | | 202,930,265 | |
| Discontinued: 1.9% | | | | |
| | | | Nationstar Mortgage Holdings, Inc. | | | | |
| | 24,680,000 | | 5.500%, 08/15/2028 2 | | | 21,796,993 | |
| | 9,500,000 | | 5.125%, 12/15/2030 2 | | | 7,725,567 | |
| | 18,000,000 | | 5.750%, 11/15/2031 2 | | | 14,915,158 | |
| | | | United Wholesale Mortgage LLC | | | | |
| | 24,680,000 | | 5.500%, 11/15/2025 2 | | | 23,469,160 | |
| | 7,000,000 | | 5.750%, 06/15/2027 2 | | | 6,343,645 | |
| | 20,820,000 | | 5.500%, 04/15/2029 2 | | | 17,618,717 | |
| | | | | | | 91,869,240 | |
| Distributors: 0.5% | | | | |
| | | | American Builders & Contractors | | | | |
| | | | Supply Co., Inc. | | | | |
| | 30,116,000 | | 3.875%, 11/15/2029 2 | | | 25,127,378 | |
| | | | | |
| Diversified Consumer Services: 0.1% | | | | |
| | | | Carriage Services, Inc. | | | | |
| | 7,800,000 | | 4.250%, 05/15/2029 2 | | | 6,681,549 | |
| | | | | |
| Diversified Telecommunication Services: 0.6% | | | | |
| | | | Level 3 Financing, Inc. | | | | |
| | 29,755,000 | | 10.500%, 05/15/2030 2 | | | 29,975,248 | |
| | | | | |
| Electrical Equipment: 0.5% | | | | |
| | | | GrafTech Global Enterprises, Inc. | | | | |
| | 23,500,000 | | 9.875%, 12/15/2028 2 | | | 22,295,625 | |
| | | | | |
| Entertainment: 0.4% | | | | |
| | | | Banijay Entertainment SASU | | | | |
| | 19,500,000 | | 8.125%, 05/01/2029 2 | | | 19,367,888 | |
| | | | | |
| Financial Services: 2.2% | | | | |
| | | | AerCap Ireland Capital DAC / | | | | |
| | | | AerCap Global Aviation Trust | | | | |
| | 17,000,000 | | 1.150%, 10/29/2023 | | | 16,936,008 | |
| | | | Aviation Capital Group LLC | | | | |
| | 5,500,000 | | 5.500%, 12/15/2024 2 | | | 5,409,770 | |
| | | | Burford Capital Global Finance LLC | | | | |
| | 25,489,000 | | 6.250%, 04/15/2028 2 | | | 23,532,842 | |
| | | | HAS Capital Income | | | | |
| | | | Opportunity Fund II | | | | |
| | 21,807,000 | | 8.000%, 12/31/2024 | | | | |
| | | | (Acquisition dates 06/10/2026, | | | | |
| | | | 09/19/2016) 2,5,7 | | | 10,958,192 | |
| | | | Nationstar Mortgage Holdings, Inc. | | | | |
| | 13,250,000 | | 5.000%, 02/01/2026 2 | | | 12,388,881 | |
| | | | PennyMac Financial Services, Inc. | | | | |
| | 56,030,000 | | 5.375%, 10/15/2025 2 | | | 53,325,712 | |
| | | | | | | 105,615,397 | |
| Food Products: 0.6% | | | | |
| | | | Simmons Foods, Inc. / Simmons | | | | |
| | | | Prepared Foods, Inc./Simmons | | | | |
| | | | Pet Food, Inc. / Simmons Feed | | | | |
| | 35,438,000 | | 4.625%, 03/01/2029 2 | | | 29,115,946 | |
The accompanying Notes to Financial Statements are an integral part of these financial statements.
Strategic Income Fund | Schedule of Investments at September 30, 2023 (Unaudited) (Continued)
| Principal | | | | | |
| Amount | | | | Value | |
| Ground Transportation: 0.5% | | | |
| | | XPO Escrow Sub LLC | | | |
| $ | 24,500,000 | | 7.500%, 11/15/2027 2 | | $ | 24,811,762 | |
| | | | | |
| Health Care Providers & Services: 0.8% | | | | |
| | | | AMN Healthcare, Inc. | | | | |
| | 8,000,000 | | 4.625%, 10/01/2027 2 | | | 7,238,560 | |
| | | | Owens & Minor, Inc. | | | | |
| | 36,210,000 | | 4.500%, 03/31/2029 2 | | | 29,836,678 | |
| | | | | | | 37,075,238 | |
| Hotels, Restaurants & Leisure: 5.8% | | | | |
| | | | Aramark Services, Inc. | | | | |
| | 48,411,000 | | 6.375%, 05/01/2025 2 | | | 49,182,671 | |
| | | | Carnival Corp. | | | | |
| | 23,616,000 | | 7.625%, 03/01/2026 2 | | | 22,985,475 | |
| | 9,500,000 | | 5.750%, 03/01/2027 2 | | | 8,606,179 | |
| | 19,750,000 | | 6.000%, 05/01/2029 | | | 16,828,633 | |
| | | | Carrols Restaurant Group, Inc. | | | | |
| | 57,625,000 | | 5.875%, 07/01/2029 2 | | | 48,447,889 | |
| | | | GPS Hospitality Holding Co. LLC / | | | | |
| | | | GPS Finco, Inc. | | | | |
| | 37,675,000 | | 7.000%, 08/15/2028 2 | | | 25,926,817 | |
| | | | Las Vegas Sands Corp. | | | | |
| | 56,853,900 | | 3.200%, 08/08/2024 | | | 55,039,556 | |
| | | | NCL Corp. Ltd. | | | | |
| | 15,510,000 | | 3.625%, 12/15/2024 2 | | | 14,909,256 | |
| | 12,000,000 | | 5.875%, 03/15/2026 2 | | | 11,089,813 | |
| | | | Six Flags Theme Parks, Inc. | | | | |
| | 22,731,000 | | 7.000%, 07/01/2025 2 | | | 22,694,821 | |
| | | | | | | 275,711,110 | |
| Household Durables: 3.4% | | | | |
| | | | Adams Homes, Inc. | | | | |
| | 24,500,000 | | 9.250%, 10/15/2028 2 | | | 24,568,951 | |
| | | | Empire Communities Corp. | | | | |
| | 63,999,000 | | 7.000%, 12/15/2025 2 | | | 61,058,869 | |
| | | | Installed Building Products, Inc. | | | | |
| | 6,750,000 | | 5.750%, 02/01/2028 | | | 6,221,728 | |
| | | | Mattamy Group Corp. | | | | |
| | 24,500,000 | | 5.250%, 12/15/2027 2 | | | 22,386,851 | |
| | | | The New Home Co., Inc. | | | | |
| | 47,308,000 | | 8.250%, 10/15/2027 2 | | | 44,000,349 | |
| | | | | | | 158,236,748 | |
| Industrial Conglomerates: 1.5% | | | | |
| | | | Icahn Enterprises L.P. / | | | | |
| | | | Icahn Enterprises Finance Corp. | | | | |
| | 17,769,000 | | 4.750%, 09/15/2024 | | | 17,129,908 | |
| | 18,133,000 | | 6.375%, 12/15/2025 | | | 17,272,241 | |
| | 36,763,000 | | 6.250%, 05/15/2026 | | | 34,214,041 | |
| | | | | | | 68,616,190 | |
| Industrial Power and Renewable Electricity Products: 0.6% | | | | |
| | | | Vistra Operations Co. LLC | | | | |
| | 28,000,000 | | 3.550%, 07/15/2024 2 | | | 27,314,551 | |
| | | | | |
| IT Services: 2.4% | | | | |
| | | | Conduent Business Services LLC / | | | | |
| | | | Conduent State & | | | | |
| | | | Local Solutions, Inc. | | | | |
| | 74,500,000 | | 6.000%, 11/01/2029 2 | | | 63,701,970 | |
| | | | Unisys Corp. | | | | |
| | 66,074,000 | | 6.875%, 11/01/2027 2 | | | 49,574,001 | |
| | | | | | | 113,275,971 | |
| Leisure Products: 0.1% | | | | |
| | | | Acushnet Co. | | | | |
| | 3,000,000 | | 7.375%, 10/15/2028 | | | 3,026,250 | |
| | | | | |
| Machinery: 2.5% | | | | |
| | | | The Manitowoc Co., Inc. | | | | |
| | 58,224,000 | | 9.000%, 04/01/2026 2 | | | 58,144,815 | |
| | | | Wabash National Corp. | | | | |
| | 46,750,000 | | 4.500%, 10/15/2028 2 | | | 39,438,839 | |
| | | | Westinghouse Air Brake | | | | |
| | | | Technologies Corp. | | | | |
| | 19,500,000 | | 4.150%, 03/15/2024 | | | 19,318,220 | |
| | | | | | | 116,901,874 | |
| Media: 1.0% | | | | |
| | | | DIRECTV Holdings LLC / DIRECTV | | | | |
| | | | Financing Co., Inc. | | | | |
| | 55,300,000 | | 5.875%, 08/15/2027 | | | 49,047,232 | |
| | | | | |
| Metals & Mining: 3.5% | | | | |
| | | | Century Aluminum Co. | | | | |
| | 25,165,000 | | 7.500%, 04/01/2028 2 | | | 23,902,693 | |
| | | | Coeur Mining, Inc. | | | | |
| | 66,150,000 | | 5.125%, 02/15/2029 2 | | | 57,263,929 | |
| | | | Hecla Mining Co. | | | | |
| | 61,347,000 | | 7.250%, 02/15/2028 | | | 59,436,091 | |
| | | | SunCoke Energy, Inc. | | | | |
| | 26,325,000 | | 4.875%, 06/30/2029 2 | | | 22,401,522 | |
| | | | | | | 163,004,235 | |
| Mortgage Real Estate Investment Trusts – REITS: 3.1% | | | | |
| | | | HAT Holdings I LLC / | | | | |
| | | | HAT Holdings II LLC | | | | |
| | 29,304,000 | | 6.000%, 04/15/2025 2 | | | 28,546,155 | |
| | 31,200,000 | | 3.375%, 06/15/2026 2 | | | 27,765,129 | |
| | | | Oxford Finance LLC / | | | | |
| | | | Oxford Finance Co-Issuer II, Inc. | | | | |
| | 17,500,000 | | 6.375%, 02/01/2027 2 | | | 16,282,966 | |
| | | | Starwood Property Trust, Inc. | | | | |
| | 73,555,000 | | 5.500%, 11/01/2023 2 | | | 73,478,135 | |
| | | | | | | 146,072,385 | |
The accompanying Notes to Financial Statements are an integral part of these financial statements.
Strategic Income Fund | Schedule of Investments at September 30, 2023 (Unaudited) (Continued)
| Principal | | | | | |
| Amount | | | | Value | |
| Oil, Gas & Consumable Fuels: 3.9% | | | |
| | | Calumet Specialty Products | | | |
| | | Partners L.P. / Calumet | | | |
| | | Finance Corp. | | | |
| $ | 39,778,000 | | 9.250%, 07/15/2024 2 | | $ | 39,945,664 | |
| | 7,229,000 | | 11.000%, 04/15/2025 2 | | | 7,355,114 | |
| | 29,232,000 | | 9.750%, 07/15/2028 2 | | | 28,903,039 | |
| | | | Genesis Energy L.P. / Genesis | | | | |
| | | | Energy Finance Corp. | | | | |
| | 51,550,000 | | 7.750%, 02/01/2028 | | | 48,923,435 | |
| | 10,000,000 | | 8.875%, 04/15/2030 | | | 9,773,192 | |
| | | | Global Partners L.P. / | | | | |
| | | | GLP Finance Corp. | | | | |
| | 30,750,000 | | 7.000%, 08/01/2027 | | | 29,995,765 | |
| | | | NGL Energy Operating LLC / | | | | |
| | | | NGL Energy Finance Corp. | | | | |
| | 17,390,000 | | 7.500%, 02/01/2026 2 | | | 17,212,397 | |
| | | | | | | 182,108,606 | |
| Passenger Airlines: 3.9% | | | | |
| | | | Allegiant Travel Co. | | | | |
| | 33,700,000 | | 7.250%, 08/15/2027 2 | | | 31,762,924 | |
| | | | American Airlines, Inc. | | | | |
| | 83,624,000 | | 11.750%, 07/15/2025 2 | | | 89,945,305 | |
| | | | Delta Air Lines, Inc. | | | | |
| | 18,627,000 | | 2.900%, 10/28/2024 | | | 17,943,028 | |
| | | | Mileage Plus Holdings LLC / | | | | |
| | | | Mileage Plus Intellectual | | | | |
| | | | Property Assets Ltd. | | | | |
| | 15,000,000 | | 6.500%, 06/20/2027 2 | | | 14,879,750 | |
| | | | United Airlines, Inc. | | | | |
| | 33,074,000 | | 4.375%, 04/15/2026 2 | | | 30,616,562 | |
| | | | | | | 185,147,569 | |
| Pharmaceuticals: 0.6% | | | | |
| | | | Bayer US Finance II LLC | | | | |
| | 30,061,000 | | 3.875%, 12/15/2023 2 | | | 29,936,792 | |
| | | | | |
| Professional Services: 0.4% | | | | |
| | | | KBR, Inc. | | | | |
| | 20,000,000 | | 4.750%, 09/30/2028 2 | | | 17,623,605 | |
| | | | | |
| Software: 1.1% | | | | |
| | | | GGAM Finance Ltd. | | | | |
| | 39,500,000 | | 7.750%, 05/15/2026 2 | | | 39,230,111 | |
| | | | NCR Corp. | | | | |
| | 5,750,000 | | 5.000%, 10/01/2028 2 | | | 5,152,408 | |
| | 10,000,000 | | 5.125%, 04/15/2029 2 | | | 8,820,643 | |
| | | | | | | 53,203,162 | |
| Specialized REITs: 0.4% | | | | |
| | | | Iron Mountain, Inc. | | | | |
| | 20,000,000 | | 5.250%, 03/15/2028 2 | | | 18,515,546 | |
| | | | | |
| Specialty Retail: 3.0% | | | | |
| | | | Ken Garff Automotive LLC | | | | |
| | 54,664,000 | | 4.875%, 09/15/2028 2 | | | 46,760,360 | |
| | | | Penske Automotive Group, Inc. | | | | |
| | 17,234,000 | | 3.500%, 09/01/2025 | | | 16,325,075 | |
| | | | Sonic Automotive, Inc. | | | | |
| | 34,500,000 | | 4.625%, 11/15/2029 2 | | | 28,653,972 | |
| | | | Upbound Group, Inc. | | | | |
| | 57,600,000 | | 6.375%, 02/15/2029 | | | 51,184,224 | |
| | | | | | | 142,923,631 | |
| Textiles, Apparel & Luxury Goods: 0.1% | | | | |
| | | | The William Carter Co. | | | | |
| | 3,000,000 | | 5.625%, 03/15/2027 2 | | | 2,888,460 | |
| | | | | |
| Trading Companies & Distributors: 5.6% | | | | |
| | | | AerCap Ireland Capital DAC / | | | | |
| | | | AerCap Global Aviation Trust | | | | |
| | 17,000,000 | | 1.150%, 10/29/2023 | | | 16,936,008 | |
| | | | Aircastle Ltd. | | | | |
| | 25,133,000 | | 4.125%, 05/01/2024 | | | 24,779,585 | |
| | | | Avation Capital SA | | | | |
| | 80,353,998 | | 8.250% Cash or 9.00% PIK, | | | | |
| | | | 10/31/2026 2 | | | 68,814,762 | |
| | | | Castlelake Aviation Finance DAC | | | | |
| | 52,500,000 | | 5.000%, 04/15/2027 2 | | | 48,009,213 | |
| | | | Herc Holdings, Inc. | | | | |
| | 32,823,000 | | 5.500%, 07/15/2027 2 | | | 31,068,370 | |
| | | | Macquarie Airfinance Holdings Ltd. | | | | |
| | 19,500,000 | | 8.375%, 05/01/2028 2 | | | 19,788,307 | |
| | 7,000,000 | | 8.125%, 03/30/2029 2 | | | 7,014,525 | |
| | | | WESCO Distribution, Inc. | | | | |
| | 36,966,000 | | 7.125%, 06/15/2025 2 | | | 37,090,760 | |
| | 9,750,000 | | 7.250%, 06/15/2028 2 | | | 9,834,767 | |
| | | | | | | 263,336,297 | |
| Transportation Infrastructure: 0.5% | | | | |
| | | | Signature Aviation US Holdings, Inc. | | | | |
| | 25,600,000 | | 4.000%, 03/01/2028 2 | | | 22,910,256 | |
| | | | | |
| Total Corporate Bonds | | | | |
| (Cost $4,213,692,995) | | | 3,864,048,445 | |
The accompanying Notes to Financial Statements are an integral part of these financial statements.
Strategic Income Fund | Schedule of Investments at September 30, 2023 (Unaudited) (Continued)
| Principal | | | | | |
| Amount | | | | Value | |
| CONVERTIBLE BONDS: 3.8% | | | |
| | | | | | |
| Automobile Components: 0.2% | | | |
| | | Patrick Industries, Inc. | | | |
| $ | 11,250,000 | | 1.750%, 12/01/2028 | | $ | 10,670,625 | |
| | | | | |
| Automobiles: 0.1% | | | | |
| | | | Ford Motor Co. | | | | |
| | 5,775,000 | | 0.000%, 03/15/2026 | | | 5,702,812 | |
| | | | | |
| Broadline Retail: 0.1% | | | | |
| | | | Etsy, Inc. | | | | |
| | 7,750,000 | | 0.250%, 06/15/2028 | | | 5,913,250 | |
| | | | | |
| Consumer Finance: 0.9% | | | | |
| | | | EZCORP, Inc. | | | | |
| | 10,250,000 | | 2.375%, 05/01/2025 | | | 9,660,625 | |
| | 9,750,000 | | 3.750%, 12/15/2029 2 | | | 9,487,725 | |
| | | | LendingTree, Inc. | | | | |
| | 27,517,000 | | 0.500%, 07/15/2025 | | | 21,944,808 | |
| | | | | | | 41,093,158 | |
| Health Care Equipment & Supplies: 0.6% | | | | |
| | | | Haemonetics Corp. | | | | |
| | 17,750,000 | | 0.000%, 03/01/2026 | | | 15,486,875 | |
| | | | Integra LifeSciences Holdings Corp. | | | | |
| | 13,000,000 | | 0.500%, 08/15/2025 | | | 11,921,000 | |
| | | | | | | 27,407,875 | |
| Hotels, Restaurants & Leisure: 0.0% | | | | |
| | | | NCL Corp. Ltd. | | | | |
| | 2,500,000 | | 1.125%, 02/15/2027 | | | 2,081,250 | |
| | | | | |
| IT Services: 0.4% | | | | |
| | | | BigBear.ai Holdings, Inc. | | | | |
| | 28,350,000 | | 6.000%, 12/15/2026 2 | | | 19,419,750 | |
| | | | | |
| Machinery: 0.2% | | | | |
| | | | John Bean Technologies Corp. | | | | |
| | 9,450,000 | | 0.250%, 05/15/2026 | | | 8,523,900 | |
| | | | | |
| Passenger Airlines: 0.2% | | | | |
| | | | Southwest Airlines Co. | | | | |
| | 7,675,000 | | 1.250%, 05/01/2025 | | | 7,646,219 | |
| | | | | |
| Pharmaceuticals: 0.3% | | | | |
| | | | Jazz Investments I Ltd. | | | | |
| | 6,000,000 | | 1.500%, 08/15/2024 | | | 5,803,500 | |
| | 6,650,000 | | 2.000%, 06/15/2026 | | | 6,803,781 | |
| | | | | | | 12,607,281 | |
| Professional Services: 0.3% | | | | |
| | | | Parsons Corp. | | | | |
| | 9,340,000 | | 0.250%, 08/15/2025 | | | 11,903,830 | |
| | | | | |
| Software: 0.5% | | | | |
| | | | Envestnet, Inc. | | | | |
| | 9,490,000 | | 0.750%, 08/15/2025 | | | 8,786,590 | |
| | | | Jamf Holding Corp. | | | | |
| | 10,600,000 | | 0.125%, 09/01/2026 | | | 8,930,500 | |
| | | | Tyler Technologies, Inc. | | | | |
| | 6,750,000 | | 0.250%, 03/15/2026 | | | 6,550,875 | |
| | | | | | | 24,267,965 | |
| Total Convertible Bonds | | | | |
| (Cost $197,057,085) | | | 177,237,915 | |
| | | | | | | | |
| Short-Term Investments: 8.6% | | | | |
| Commercial Paper: 4.3% | | | | |
| | | | | | | | |
| Automobiles: 0.7% | | | | |
| | | | Harley-Davidson Corp. | | | | |
| | 20,000,000 | | 6.176%, 10/05/2023 6 | | | 19,981,587 | |
| | 13,000,000 | | 5.981%, 10/06/2023 6 | | | 12,986,034 | |
| | | | | | | 32,967,621 | |
| Chemicals: 1.0% | | | | |
| | | | FMC Corp. | | | | |
| | 49,000,000 | | 6.294%, 10/04/2023 6 | | | 48,958,833 | |
| | | | | |
| Consumer Staples Distribution & Retail: 1.1% | | | | |
| | | | Walgreens Boots Alliance, Inc. | | | | |
| | 50,000,000 | | 6.064%, 10/06/2023 6 | | | 49,942,882 | |
| | | | | |
| Financial Services: 0.5% | | | | |
| | | | Global Payments Inc. | | | | |
| | 20,900,000 | | 6.062%, 10/03/2023 6 | | | 20,886,123 | |
| | | | | |
| Metals & Mining: 1.0% | | | | |
| | | | Glencore LLC | | | | |
| | 24,000,000 | | 5.888%, 10/18/2023 6 | | | 23,929,016 | |
| | 25,000,000 | | 5.790%, 10/20/2023 6 | | | 24,917,852 | |
| | | | | | | 48,846,868 | |
| Total Commercial Paper | | | | |
| (Cost $201,661,330) | | | 201,602,327 | |
The accompanying Notes to Financial Statements are an integral part of these financial statements.
Strategic Income Fund | Schedule of Investments at September 30, 2023 (Unaudited) (Continued)
| Shares | | | | Value | |
| Money Market Funds: 4.3% | | | |
| | | | | | |
| | 101,775,966 | | Federated Hermes U.S. | | | |
| | | | Treasury Cash Reserves – | | | |
| | | | Class I, 5.206% 3 | | $ | 101,775,966 | |
| | 101,775,966 | | Morgan Stanley Institutional | | | | |
| | | | Liquidity Funds – Treasury | | | | |
| | | | Securities Portfolio – | | | | |
| | | | Class I, 5.215% 3 | | | 101,775,966 | |
| | | | | | | 203,551,932 | |
| Total Short-Term Investments | | | | |
| (Cost $405,213,262) | | | 405,154,259 | |
| Total Investments in Securities: 98.5% | | | | |
| (Cost $4,964,132,974) | | | 4,644,783,111 | |
| Other Assets in Excess of Liabilities: 1.5% | | | 71,847,835 | |
| Total Net Assets: 100.0% | | $ | 4,716,630,945 | |
GBP – Great British Pound
PIK – Payment In Kind
REIT – Real Estate Investment Trust
1 | Non-income producing security. |
2 | Security exempt from registration under Rule 144A of the Securities Act of 1933. These securities may be resold in transactions exempt from registration to qualified institutional buyers. These securities are determined to be liquid by the Adviser, unless otherwise noted, under procedures established by the Trust’s Board of Trustees. |
3 | Annualized seven-day effective yield as of September 30, 2023. |
4 | Company is an “affiliated person” of the Fund, as defined in the Investment Company Act of 1940. |
5 | Security considered restricted. As of September 30, 2023, the value of the restricted securities was $10,958,192 or 0.2% of net assets. |
6 | Rate represents the yield to maturity from purchase price. |
7 | Security is fair valued under the Board of Trustees and is categorized as a Level 3 security. Significant unobservable inputs were used to determine fair value. |
8 | Not a readily marketable security. |
The Global Industry Classification Standard (GICS®) was developed by and/or is the exclusive property of MSCI, Inc. (“MSCI”) and Standard & Poor’s Financial Services LLC (“S&P”). GICS is a service mark of MSCI and S&P and has been licensed for use by the administrator, U.S. Bancorp Fund Services, LLC.
The accompanying Notes to Financial Statements are an integral part of these financial statements.
Growth & Income Fund | Schedule of Investments at September 30, 2023 (Unaudited)
| Shares | | | | Value | |
| COMMON STOCKS: 58.0% | | | |
| | | | | | |
| Aerospace & Defense: 6.1% | | | |
| | 55,250 | | Airbus SE - ADR | | $ | 1,848,665 | |
| | 31,335 | | L3Harris Technologies, Inc. | | | 5,456,050 | |
| | 57,195 | | Safran SA - ADR | | | 2,238,612 | |
| | | | | | | 9,543,327 | |
| Chemicals: 2.3% | | | | |
| | 6,870 | | Air Products & Chemicals, Inc. | | | 1,946,958 | |
| | 4,460 | | Linde PLC | | | 1,660,681 | |
| | | | | | | 3,607,639 | |
| Commercial Services & Supplies: 2.0% | | | | |
| | 23,980 | | Waste Connections, Inc. | | | 3,220,514 | |
| | | | | |
| Consumer Staples Distribution & Retail: 3.8% | | | | |
| | 7,928 | | Southeastern Grocers, Inc. 1,7 | | | 200,182 | |
| | 46,045 | | Sysco Corp. | | | 3,041,272 | |
| | 24,390 | | Target Corp. | | | 2,696,803 | |
| | 2,292,000 | | Tops Holding, Litigation | | | | |
| | | | Trust Proceeds 1,7,8 | | | 1,721 | |
| | | | | | | 5,939,978 | |
| Electrical Equipment: 1.7% | | | | |
| | 18,455 | | AMETEK, Inc. | | | 2,726,911 | |
| | | | | |
| Financial Services: 2.2% | | | | |
| | 15,040 | | Visa, Inc. – Class A | | | 3,459,350 | |
| | | | | |
| Ground Transportation: 3.2% | | | | |
| | 6,640 | | Old Dominion Freight Line, Inc. | | | 2,716,690 | |
| | 10,970 | | Union Pacific Corp. | | | 2,233,821 | |
| | | | | | | 4,950,511 | |
| Health Care Equipment & Supplies: 2.6% | | | | |
| | 10,800 | | Becton Dickinson & Co. | | | 2,792,124 | |
| | 6,820 | | Teleflex, Inc. | | | 1,339,516 | |
| | | | | | | 4,131,640 | |
| Industrial REITs: 2.0% | | | | |
| | 18,795 | | EastGroup Properties, Inc. | | | 3,129,931 | |
| | | | | |
| Insurance: 3.4% | | | | |
| | 33,070 | | Brown & Brown, Inc. | | | 2,309,609 | |
| | 21,525 | | The Progressive Corp. | | | 2,998,432 | |
| | | | | | | 5,308,041 | |
| Interactive Media & Services: 2.8% | | | | |
| | 32,910 | | Alphabet, Inc. – Class C 1 | | | 4,339,184 | |
| | | | | |
| IT Services: 1.6% | | | | |
| | 8,142 | | Accenture PLC – Class A | | | 2,500,490 | |
| | | | | |
| Life Sciences Tools & Services: 2.8% | | | | |
| | 16,160 | | Agilent Technologies, Inc. | | | 1,807,011 | |
| | 10,410 | | Danaher Corp. | | | 2,582,721 | |
| | | | | | | 4,389,732 | |
| Metals & Mining: 0.3% | | | | |
| | 10 | | Real Alloy Holding, Inc. 1,7 | | | 533,680 | |
| | | | | |
| Oil, Gas & Consumable Fuels: 2.0% | | | | |
| | 111,810 | | Enterprise Products Partners L.P. | | | 3,060,240 | |
| | | | | |
| Personal Care Products: 2.0% | | | | |
| | 157,538 | | Kenvue, Inc. | | | 3,163,363 | |
| | | | | |
| Pharmaceuticals: 1.6% | | | | |
| | 24,480 | | Novartis AG - ADR | | | 2,493,533 | |
| | | | | |
| Semiconductors & Semiconductor Equipment: 5.7% | | | | |
| | 27,030 | | Analog Devices, Inc. | | | 4,732,683 | |
| | 14,880 | | Applied Materials, Inc. | | | 2,060,136 | |
| | 31,325 | | Micron Technology, Inc. | | | 2,131,040 | |
| | | | | | | 8,923,859 | |
| Software: 6.1% | | | | |
| | 30,363 | | Microsoft Corp. | | | 9,587,117 | |
| | | | | |
| Specialized REITs: 1.9% | | | | |
| | 36,160 | | Lamar Advertising Co. – Class A | | | 3,018,275 | |
| | | | | |
| Specialty Retail: 1.9% | | | | |
| | 26,940 | | Ross Stores, Inc. | | | 3,042,873 | |
| | | | | |
| Total Common Stocks | | | | |
| (Cost $66,594,118) | | | 91,070,188 | |
| | | | | | | | |
| Convertible Preferred Stocks: 0.5% | | | | |
| | | | | | | | |
| Ground Transportation: 0.5% | | | | |
| | 10,000 | | Daseke, Inc., 7.630% 4,7 | | | 825,560 | |
| | | | | |
| Total Convertible Preferred Stocks | | | | |
| (Cost $1,000,000) | | | 825,560 | |
| | | | | | | | |
| Contracts | | | | | | |
| WARRANT: 0.0% | | | | |
| | | | | | | | |
| Trading Companies & Distributors: 0.0% | | | | |
| | 8,750 | | Avation PLC, | | | | |
| | | | (Expiration date 10/31/2026, | | | | |
| | | | Exercise Price 114.5 GBP) 1 | | | 5,338 | |
| Total Warrant | | | | |
| (Cost $—) | | | 5,338 | |
The accompanying Notes to Financial Statements are an integral part of these financial statements.
Growth & Income Fund | Schedule of Investments at September 30, 2023 (Unaudited) (Continued)
| Principal | | | | | |
| Amount | | | | Value | |
| Corporate Bonds: 25.2% | | | |
| | | | | | |
| Automobile Components: 1.7% | | | |
| | | Adient Global Holdings Ltd. | | | |
| $ | 350,000 | | 7.000%, 04/15/2028 2 | | $ | 347,551 | |
| | | | American Axle & | | | | |
| | | | Manufacturing, Inc. | | | | |
| | 179,000 | | 6.250%, 03/15/2026 | | | 173,831 | |
| | | | Patrick Industries, Inc. | | | | |
| | 500,000 | | 7.500%, 10/15/2027 2 | | | 479,283 | |
| | | | Real Hero Merger Sub 2, Inc. | | | | |
| | 600,000 | | 6.250%, 02/01/2029 2 | | | 463,631 | |
| | | | The Goodyear Tire & Rubber Co. | | | | |
| | 750,000 | | 9.500%, 05/31/2025 | | | 761,997 | |
| | 500,000 | | 5.000%, 07/15/2029 | | | 431,323 | |
| | | | | | | 2,657,616 | |
| Automobiles: 0.4% | | | | |
| | | | Ford Motor Co. | | | | |
| | 500,000 | | 9.625%, 04/22/2030 | | | 571,669 | |
| | | | | |
| Beverages: 0.2% | | | | |
| | | | Primo Water Holdings, Inc. | | | | |
| | 300,000 | | 4.375%, 04/30/2029 2 | | | 256,824 | |
| | | | | |
| Building Products: 0.3% | | | | |
| | | | Griffon Corp. | | | | |
| | 500,000 | | 5.750%, 03/01/2028 | | | 454,441 | |
| | | | | |
| Capital Markets: 0.8% | | | | |
| | | | Ares Capital Corp. | | | | |
| | 500,000 | | 4.200%, 06/10/2024 | | | 491,052 | |
| | | | Oppenheimer Holdings, Inc. | | | | |
| | 750,000 | | 5.500%, 10/01/2025 | | | 724,815 | |
| | | | | | | 1,215,867 | |
| Chemicals: 0.3% | | | | |
| | | | Consolidated Energy Finance SA | | | | |
| | 500,000 | | 5.625%, 10/15/2028 2 | | | 413,620 | |
| | | | | |
| Commercial Services & Supplies: 0.6% | | | | |
| | | | GFL Environmental, Inc. | | | | |
| | 220,000 | | 5.125%, 12/15/2026 2 | | | 209,791 | |
| | 250,000 | | 4.750%, 06/15/2029 2 | | | 222,532 | |
| | | | Pitney Bowes, Inc. | | | | |
| | 750,000 | | 7.250%, 03/15/2029 2 | | | 551,175 | |
| | | | | | | 983,498 | |
| Computers & Peripherals: 0.3% | | | | |
| | | | CPI Acquisition, Inc. | | | | |
| | 500,000 | | 8.625%, 03/15/2026 2 | | | 493,077 | |
| | | | | |
| Construction & Engineering: 1.3% | | | | |
| | | | Global Infrastructure Solutions, Inc. | | | | |
| | 500,000 | | 5.625%, 06/01/2029 2 | | | 412,613 | |
| | | | Great Lakes Dredge & Dock Corp. | | | | |
| | 350,000 | | 5.250%, 06/01/2029 2 | | | 287,517 | |
| | | | New Enterprise Stone | | | | |
| | | | & Lime Co., Inc. | | | | |
| | 500,000 | | 5.250%, 07/15/2028 2 | | | 449,303 | |
| | | | Tutor Perini Corp. | | | | |
| | 1,000,000 | | 6.875%, 05/01/2025 2 | | | 916,420 | |
| | | | | | | 2,065,853 | |
| Consumer Finance: 1.4% | | | | |
| | | | Ally Financial, Inc. | | | | |
| | 500,000 | | 1.450%, 10/02/2023 | | | 500,000 | |
| | | | Bread Financial Holdings, Inc. | | | | |
| | 750,000 | | 7.000%, 01/15/2026 2 | | | 703,270 | |
| | | | FirstCash, Inc. | | | | |
| | 500,000 | | 5.625%, 01/01/2030 2 | | | 450,434 | |
| | | | OneMain Finance Corp. | | | | |
| | 500,000 | | 8.250%, 10/01/2023 | | | 500,000 | |
| | | | | | | 2,153,704 | |
| Consumer Staples Distribution & Retail: 1.5% | | | | |
| | | | C&S Group Enterprises LLC | | | | |
| | 500,000 | | 5.000%, 12/15/2028 2 | | | 380,699 | |
| | | | KeHE Distributors LLC / | | | | |
| | | | KeHE Finance Corp. | | | | |
| | 612,000 | | 8.625%, 10/15/2026 2 | | | 614,437 | |
| | | | Performance Food Group, Inc. | | | | |
| | 500,000 | | 4.250%, 08/01/2029 2 | | | 432,532 | |
| | | | United Natural Foods, Inc. | | | | |
| | 625,000 | | 6.750%, 10/15/2028 | | | 477,281 | |
| | | | US Foods, Inc. | | | | |
| | 470,000 | | 4.750%, 02/15/2029 2 | | | 420,620 | |
| | | | | | | 2,325,569 | |
| Discontinued: 0.3% | | | | |
| | | | United Wholesale Mortgage LLC | | | | |
| | 320,000 | | 5.500%, 11/15/2025 2 | | | 304,300 | |
| | 180,000 | | 5.500%, 04/15/2029 2 | | | 152,323 | |
| | | | | | | 456,623 | |
| Diversified Consumer Services: 0.1% | | | | |
| | | | Carriage Services, Inc. | | | | |
| | 200,000 | | 4.250%, 05/15/2029 2 | | | 171,322 | |
| | | | | |
| Diversified Telecommunication Services: 0.2% | | | | |
| | | | Level 3 Financing, Inc. | | | | |
| | 275,000 | | 10.500%, 05/15/2030 2 | | | 277,036 | |
The accompanying Notes to Financial Statements are an integral part of these financial statements.
Growth & Income Fund | Schedule of Investments at September 30, 2023 (Unaudited) (Continued)
| Principal | | | | | |
| Amount | | | | Value | |
| Electrical Equipment: 0.3% | | | |
| | | GrafTech Global Enterprises, Inc. | | | |
| $ | 500,000 | | 9.875%, 12/15/2028 2 | | $ | 474,375 | |
| | | | | |
| Entertainment: 0.3% | | | | |
| | | | Banijay Entertainment SASU | | | | |
| | 500,000 | | 8.125%, 05/01/2029 2 | | | 496,612 | |
| | | | | |
| Financial Services: 0.8% | | | | |
| | | | Burford Capital Global Finance LLC | | | | |
| | 250,000 | | 6.250%, 04/15/2028 2 | | | 230,814 | |
| | | | HAS Capital Income | | | | |
| | | | Opportunity Fund II | | | | |
| | 642,000 | | 8.000%, 12/31/2024 | | | | |
| | | | (Cost $642,000, Acquisition dates | | | | |
| | | | 06/10/2026, 09/19/2016) 2,5,7 | | | 322,610 | |
| | | | Nationstar Mortgage Holdings, Inc. | | | | |
| | 250,000 | | 5.000%, 02/01/2026 2 | | | 233,752 | |
| | | | PennyMac Financial Services, Inc. | | | | |
| | 500,000 | | 5.375%, 10/15/2025 2 | | | 475,868 | |
| | | | | | | 1,263,044 | |
| Food Products: 0.3% | | | | |
| | | | Simmons Foods, Inc./Simmons | | | | |
| | | | Prepared Foods, Inc./Simmons | | | | |
| | | | Pet Food, Inc./Simmons Feed | | | | |
| | 500,000 | | 4.625%, 03/01/2029 2 | | | 410,801 | |
| | | | | |
| Ground Transportation: 0.3% | | | | |
| | | | XPO Escrow Sub LLC | | | | |
| | 500,000 | | 7.500%, 11/15/2027 2 | | | 506,362 | |
| | | | | |
| Health Care Providers & Services: 0.1% | | | | |
| | | | Owens & Minor, Inc. | | | | |
| | 250,000 | | 4.500%, 03/31/2029 2 | | | 205,998 | |
| | | | | |
| Hotels, Restaurants & Leisure: 1.5% | | | | |
| | | | Aramark Services, Inc. | | | | |
| | 100,000 | | 5.000%, 04/01/2025 2 | | | 98,443 | |
| | 390,000 | | 6.375%, 05/01/2025 2 | | | 396,217 | |
| | | | Carnival Corp. | | | | |
| | 500,000 | | 5.750%, 03/01/2027 2 | | | 452,957 | |
| | 250,000 | | 6.000%, 05/01/2029 | | | 213,020 | |
| | | | Carrols Restaurant Group, Inc. | | | | |
| | 600,000 | | 5.875%, 07/01/2029 2 | | | 504,446 | |
| | | | GPS Hospitality Holding Co. | | | | |
| | | | LLC / GPS Finco, Inc. | | | | |
| | 375,000 | | 7.000%, 08/15/2028 2 | | | 258,064 | |
| | | | Las Vegas Sands Corp. | | | | |
| | 500,000 | | 3.200%, 08/08/2024 | | | 484,044 | |
| | | | | | | 2,407,191 | |
| Household Durables: 0.9% | | | | |
| | | | Adams Homes, Inc. | | | | |
| | 500,000 | | 9.250%, 10/15/2028 2 | | | 501,407 | |
| | | | Empire Communities Corp. | | | | |
| | 500,000 | | 7.000%, 12/15/2025 2 | | | 477,030 | |
| | | | The New Home Co., Inc. | | | | |
| | 500,000 | | 8.250%, 10/15/2027 2 | | | 465,041 | |
| | | | | | | 1,443,478 | |
| Industrial Conglomerates: 0.2% | | | | |
| | | | Icahn Enterprises L.P. / | | | | |
| | | | Icahn Enterprises Finance Corp. | | | | |
| | 400,000 | | 6.250%, 05/15/2026 | | | 372,266 | |
| | | | | |
| IT Services: 0.6% | | | | |
| | | | Conduent Business Services LLC / | | | | |
| | | | Conduent State & Local Solutions, Inc. | | | | |
| | 600,000 | | 6.000%, 11/01/2029 2 | | | 513,036 | |
| | | | Unisys Corp. | | | | |
| | 500,000 | | 6.875%, 11/01/2027 2 | | | 375,140 | |
| | | | | | | 888,176 | |
| Machinery: 1.4% | | | | |
| | | | The Manitowoc Co., Inc. | | | | |
| | 1,000,000 | | 9.000%, 04/01/2026 2 | | | 998,640 | |
| | | | Wabash National Corp. | | | | |
| | 750,000 | | 4.500%, 10/15/2028 2 | | | 632,709 | |
| | | | Westinghouse Air Brake | | | | |
| | | | Technologies Corp. | | | | |
| | 500,000 | | 4.150%, 03/15/2024 | | | 495,339 | |
| | | | | | | 2,126,688 | |
| Media: 0.4% | | | | |
| | | | DIRECTV Holdings LLC / | | | | |
| | | | DIRECTV Financing Co., Inc. | | | | |
| | 700,000 | | 5.875%, 08/15/2027 | | | 620,851 | |
| | | | | |
| Metals & Mining: 1.1% | | | | |
| | | | Century Aluminum Co. | | | | |
| | 335,000 | | 7.500%, 04/01/2028 2 | | | 318,196 | |
| | | | Coeur Mining, Inc. | | | | |
| | 600,000 | | 5.125%, 02/15/2029 2 | | | 519,401 | |
| | | | Hecla Mining Co. | | | | |
| | 500,000 | | 7.250%, 02/15/2028 | | | 484,425 | |
| | | | SunCoke Energy, Inc. | | | | |
| | 500,000 | | 4.875%, 06/30/2029 2 | | | 425,480 | |
| | | | | | | 1,747,502 | |
| Mortgage Real Estate Investment Trusts – REITS: 0.9% | | | | |
| | | | HAT Holdings I LLC / | | | | |
| | | | HAT Holdings II LLC | | | | |
| | 500,000 | | 6.000%, 04/15/2025 2 | | | 487,069 | |
The accompanying Notes to Financial Statements are an integral part of these financial statements.
Growth & Income Fund | Schedule of Investments at September 30, 2023 (Unaudited) (Continued)
| Principal | | | | | |
| Amount | | | | Value | |
| Mortgage Real Estate Investment | | | |
| Trusts – REITS: 0.9% (Continued) | | | |
| | | Oxford Finance LLC / | | | |
| | | Oxford Finance Co-Issuer II, Inc. | | | |
| $ | 500,000 | | 6.375%, 02/01/2027 2 | | $ | 465,228 | |
| | | | Starwood Property Trust, Inc. | | | | |
| | 500,000 | | 5.500%, 11/01/2023 2 | | | 499,477 | |
| | | | | | | 1,451,774 | |
| Oil, Gas & Consumable Fuels: 1.0% | | | | |
| | | | Calumet Specialty Products Partners | | | | |
| | | | L.P. / Calumet Finance Corp. | | | | |
| | 160,000 | | 11.000%, 04/15/2025 2 | | | 162,791 | |
| | | | Calumet Specialty Products Partners | | | | |
| | | | LP / Calumet Finance Corp. | | | | |
| | 250,000 | | 9.750%, 07/15/2028 2 | | | 247,186 | |
| | | | Genesis Energy L.P. / | | | | |
| | | | Genesis Energy Finance Corp. | | | | |
| | 450,000 | | 7.750%, 02/01/2028 | | | 427,072 | |
| | | | Global Partners L.P. / | | | | |
| | | | GLP Finance Corp. | | | | |
| | 500,000 | | 7.000%, 08/01/2027 | | | 487,736 | |
| | | | NGL Energy Operating LLC / | | | | |
| | | | NGL Energy Finance Corp. | | | | |
| | 250,000 | | 7.500%, 02/01/2026 2 | | | 247,447 | |
| | | | | | | 1,572,232 | |
| Passenger Airlines: 1.1% | | | | |
| | | | Allegiant Travel Co. | | | | |
| | 500,000 | | 7.250%, 08/15/2027 2 | | | 471,260 | |
| | | | American Airlines, Inc. | | | | |
| | 600,000 | | 11.750%, 07/15/2025 2 | | | 645,355 | |
| | | | Delta Air Lines, Inc. | | | | |
| | 250,000 | | 2.900%, 10/28/2024 | | | 240,820 | |
| | | | United Airlines, Inc. | | | | |
| | 500,000 | | 4.375%, 04/15/2026 2 | | | 462,850 | |
| | | | | | | 1,820,285 | |
| Pharmaceuticals: 0.6% | | | | |
| | | | Bayer US Finance II LLC | | | | |
| | 1,000,000 | | 3.875%, 12/15/2023 2 | | | 995,868 | |
| | | | | |
| Software: 0.4% | | | | |
| | | | GGAM Finance Ltd. | | | | |
| | 500,000 | | 7.750%, 05/15/2026 2 | | | 496,584 | |
| | | | NCR Corp. | | | | |
| | 250,000 | | 5.000%, 10/01/2028 2 | | | 224,018 | |
| | | | | | | 720,602 | |
| Specialty Retail: 0.9% | | | | |
| | | | Ken Garff Automotive LLC | | | | |
| | 500,000 | | 4.875%, 09/15/2028 2 | | | 427,707 | |
| | | | Sonic Automotive, Inc. | | | | |
| | 500,000 | | 4.625%, 11/15/2029 2 | | | 415,275 | |
| | | | Upbound Group, Inc. | | | | |
| | 600,000 | | 6.375%, 02/15/2029 | | | 533,169 | |
| | | | | | | 1,376,151 | |
| Trading Companies & Distributors: 2.4% | | | | |
| | | | AerCap Ireland Capital DAC / | | | | |
| | | | AerCap Global Aviation Trust | | | | |
| | 1,000,000 | | 1.150%, 10/29/2023 | | | 996,236 | |
| | | | Aircastle Ltd. | | | | |
| | 500,000 | | 4.125%, 05/01/2024 | | | 492,969 | |
| | | | Avation Capital SA | | | | |
| | 458,507 | | 8.250% Cash or 9.00% | | | | |
| | | | PIK, 10/31/2026 2 | | | 392,663 | |
| | | | Castlelake Aviation Finance DAC | | | | |
| | 500,000 | | 5.000%, 04/15/2027 2 | | | 457,231 | |
| | | | Herc Holdings, Inc. | | | | |
| | 500,000 | | 5.500%, 07/15/2027 2 | | | 473,272 | |
| | | | Macquarie Airfinance Holdings Ltd. | | | | |
| | 500,000 | | 8.375%, 05/01/2028 | | | 507,392 | |
| | | | WESCO Distribution, Inc. | | | | |
| | 250,000 | | 7.125%, 06/15/2025 2 | | | 250,844 | |
| | 250,000 | | 7.250%, 06/15/2028 2 | | | 252,173 | |
| | | | | | | 3,822,780 | |
| Transportation Infrastructure: 0.2% | | | | |
| | | | Signature Aviation US Holdings, Inc. | | | | |
| | 400,000 | | 4.000%, 03/01/2028 2 | | | 357,973 | |
| | | | | |
| Total Corporate Bonds | | | | |
| (Cost $43,007,743) | | | 39,577,728 | |
| | | | | | | | |
| Convertible Bonds: 1.8% | | | | |
| | | | | | | | |
| Automobiles: 0.1% | | | | |
| | | | Ford Motor Co. | | | | |
| | 225,000 | | 0.000%, 03/15/2026 | | | 222,187 | |
| | | | | |
| Consumer Finance: 0.6% | | | | |
| | | | EZCORP, Inc. | | | | |
| | 250,000 | | 2.375%, 05/01/2025 | | | 235,625 | |
| | 250,000 | | 3.750%, 12/15/2029 2 | | | 243,275 | |
| | | | LendingTree, Inc. | | | | |
| | 500,000 | | 0.500%, 07/15/2025 | | | 398,750 | |
| | | | | | | 877,650 | |
| Health Care Equipment & Supplies: 0.1% | | | | |
| | | | Haemonetics Corp. | | | | |
| | 250,000 | | 0.000%, 03/01/2026 | | | 218,125 | |
| | | | | |
| IT Services: 0.3% | | | | |
| | | | BigBear.ai Holdings, Inc. | | | | |
| | 650,000 | | 6.000%, 12/15/2026 2 | | | 445,250 | |
The accompanying Notes to Financial Statements are an integral part of these financial statements.
Growth & Income Fund | Schedule of Investments at September 30, 2023 (Unaudited) (Continued)
| Principal | | | | | |
| Amount | | | | Value | |
| Machinery: 0.2% | | | |
| | | John Bean Technologies Corp. | | | |
| $ | 250,000 | | 0.250%, 05/15/2026 | | $ | 225,500 | |
| | | | | |
| Passenger Airlines: 0.1% | | | | |
| | | | Southwest Airlines Co. | | | | |
| | 200,000 | | 1.250%, 05/01/2025 | | | 199,250 | |
| | | | | |
| Pharmaceuticals: 0.2% | | | | |
| | | | Jazz Investments I Ltd. | | | | |
| | 350,000 | | 2.000%, 06/15/2026 | | | 358,094 | |
| | | | | |
| Software: 0.2% | | | | |
| | | | Tyler Technologies, Inc. | | | | |
| | 250,000 | | 0.250%, 03/15/2026 | | | 242,625 | |
| Total Convertible Bonds | | | | |
| (Cost $3,073,109) | | | 2,788,681 | |
| | | | | | | | |
| Short-Term Investments: 14.1% | | | | |
| Commercial Paper: 8.3% | | | | |
| | | | | | | | |
| Automobiles: 0.7% | | | | |
| | | | Harley-Davidson Corp. | | | | |
| | 1,000,000 | | 5.981%, 10/06/2023 6 | | | 998,926 | |
| | | | | |
| Broadline Retail: 1.3% | | | | |
| | | | Canadian Tire Corp., Ltd. | | | | |
| | 1,000,000 | | 5.625%, 10/18/2023 6 | | | 997,107 | |
| | | | Dollarama, Inc. | | | | |
| | 1,000,000 | | 5.669%, 10/02/2023 2,6 | | | 999,548 | |
| | | | | | | 1,996,655 | |
| Chemicals: 1.3% | | | | |
| | | | FMC Corp. | | | | |
| | 1,000,000 | | 6.294%, 10/04/2023 6 | | | 999,160 | |
| | | | Nutrien Ltd. | | | | |
| | 1,000,000 | | 5.654%, 10/23/2023 6 | | | 996,303 | |
| | | | | | | 1,995,463 | |
| Construction & Engineering: 0.6% | | | | |
| | | | Quanta Services, Inc. | | | | |
| | 1,000,000 | | 5.883%, 10/12/2023 6 | | | 997,905 | |
| | | | | |
| Consumer Staples Distribution & Retail: 1.3% | | | | |
| | | | Alimentation Couche-Tard, Inc. | | | | |
| | 1,000,000 | | 5.619%, 10/23/2023 6 | | | 996,276 | |
| | | | Walgreens Boots Alliance, Inc. | | | | |
| | 1,000,000 | | 6.093%, 10/13/2023 2,6 | | | 997,674 | |
| | | | | | | 1,993,950 | |
| Electronic Equipment, Instruments & Components: 1.3% | | | | |
| | | | Arrow Electronics, Inc. | | | | |
| | 1,000,000 | | 5.813%, 10/04/2023 6 | | | 999,202 | |
| | | | Jabil, Inc. | | | | |
| | 1,000,000 | | 6.113%, 10/05/2023 6 | | | 998,977 | |
| | | | | | | 1,998,179 | |
| Metals & Mining: 0.6% | | | | |
| | | | Glencore LLC | | | | |
| | 1,000,000 | | 5.888%, 10/18/2023 6 | | | 997,042 | |
| | | | | |
| Semiconductors & Semiconductor Equipment: 0.6% | | | | |
| | | | Microchip Technology, Inc. | | | | |
| | 1,000,000 | | 5.633%, 10/30/2023 6,7 | | | 994,089 | |
| | | | | |
| Specialized REITs: 0.6% | | | | |
| | | | Crown Castle International Corp. | | | | |
| | 1,000,000 | | 6.006%, 10/24/2023 6 | | | 995,961 | |
| | | | | |
| Total Commercial Paper | | | | |
| (Cost $12,973,012) | | | 12,968,170 | |
| | | | | | | | |
| Shares | | | | | | |
| Money Market Funds: 5.8% | | | | |
| | 9,121,995 | | Federated Hermes U.S. Treasury | | | | |
| | | | Cash Reserves - Class I, 5.206% 3 | | | 9,121,995 | |
| Total Short-Term Investments | | | | |
| (Cost $22,095,007) | | | 22,090,165 | |
| Total Investments In Securities: 99.6% | | | | |
| (Cost $135,769,977) | | | 156,357,660 | |
| Other Assets in Excess of Liabilities: 0.4% | | | 549,599 | |
| TOTAL NET ASSETS: 100.0% | | $ | 156,907,259 | |
ADR – American Depositary Receipt
GBP – Great British Pound
PIK – Payment In Kind
REIT – Real Estate Investment Trust
1 | Non-income producing security. |
2 | Security exempt from registration under Rule 144A of the Securities Act of 1933. These securities may be resold in transactions exempt from registration to qualified institutional buyers. These securities are determined to be liquid by the Adviser, unless otherwise noted, under procedures established by the Trust’s Board of Trustees. |
3 | Annualized seven-day effective yield as of September 30, 2023. |
4 | Company is an “affiliated person” of the Fund, as defined in the Investment Company Act of 1940. |
5 | Security considered restricted. As of September 30, 2023, the value of the restricted securities was $322,610 or 0.2% of net assets. |
6 | Rate represents the yield to maturity from purchase price. |
7 | Security is fair valued under the Board of Trustees and is categorized as a Level 3 security. Significant unobservable inputs were used to determine fair value. |
8 | Not a readily marketable security. |
The Global Industry Classification Standard (GICS®) was developed by and/or is the exclusive property of MSCI, Inc. (“MSCI”) and Standard & Poor’s Financial Services LLC (“S&P”). GICS is a service mark of MSCI and S&P and has been licensed for use by the administrator, U.S. Bancorp Fund Services, LLC.
The accompanying Notes to Financial Statements are an integral part of these financial statements.
Emerging Opportunity Fund | Schedule of Investments at September 30, 2023 (Unaudited)
| Shares | | | | Value | |
| Common Stocks: 90.4% | | | |
| | | | | | |
| Aerospace & Defense: 3.9% | | | |
| | 37,860 | | Axon Enterprise, Inc. 1 | | $ | 7,533,761 | |
| | | | | |
| Biotechnology: 2.3% | | | | |
| | 6,112 | | Madrigal Pharmaceuticals, Inc. 1 | | | 892,596 | |
| | 63,660 | | Natera, Inc. 1 | | | 2,816,955 | |
| | 40,545 | | Replimune Group, Inc. 1 | | | 693,725 | |
| | | | | | | 4,403,276 | |
| Building Products: 2.5% | | | | |
| | 174,695 | | Zurn Elkay Water Solutions Corp. | | | 4,894,954 | |
| | | | | |
| Chemicals: 3.4% | | | | |
| | 65,150 | | Innospec, Inc. | | | 6,658,330 | |
| | | | | |
| Consumer Staples Distribution & Retail: 1.2% | | | | |
| | 109,800 | | The Chefs’ Warehouse, Inc. 1 | | | 2,325,564 | |
| | | | | |
| Electrical Equipment: 0.5% | | | | |
| | 8,960 | | Generac Holdings, Inc. 1 | | | 976,282 | |
| | | | | |
| Financial Services: 4.8% | | | | |
| | 123,330 | | dLocal Ltd. – Class A 1 | | | 2,364,236 | |
| | 672,910 | | Payoneer Global, Inc. 1 | | | 4,118,209 | |
| | 113,890 | | Remitly Global, Inc. 1 | | | 2,872,306 | |
| | | | | | | 9,354,751 | |
| Health Care Equipment & Supplies: 13.6% | | | | |
| | 48,395 | | Axonics, Inc. 1 | | | 2,715,927 | |
| | 17,621 | | Inspire Medical Systems, Inc. 1 | | | 3,496,711 | |
| | 30,950 | | Insulet Corp. 1 | | | 4,936,216 | |
| | 66,845 | | Lantheus Holdings, Inc. 1 | | | 4,644,391 | |
| | 29,688 | | Shockwave Medical, Inc. 1 | | | 5,910,880 | |
| | 28,620 | | TransMedics Group, Inc. 1 | | | 1,566,945 | |
| | 19,115 | | UFP Technologies, Inc. 1 | | | 3,086,117 | |
| | | | | | | 26,357,187 | |
| Health Care Providers & Services: 4.9% | | | | |
| | 63,540 | | HealthEquity, Inc. 1 | | | 4,641,597 | |
| | 53,065 | | The Ensign Group, Inc. | | | 4,931,330 | |
| | | | | | | 9,572,927 | |
| Hotels, Restaurants & Leisure: 1.4% | | | | |
| | 27,675 | | Marriott Vacations | | | | |
| | | | Worldwide Corp. | | | 2,784,935 | |
| | | | | |
| Household Durables: 2.1% | | | | |
| | 15,327 | | Cavco Industries, Inc. 1 | | | 4,071,771 | |
| | | | | |
| Machinery: 3.4% | | | | |
| | 27,855 | | RBC Bearings, Inc. 1 | | | 6,521,691 | |
| | | | | |
| Oil, Gas & Consumable Fuels: 2.9% | | | | |
| | 245,730 | | Magnolia Oil & Gas Corp. – Class A | | | 5,629,674 | |
| | | | | |
| Professional Services: 6.5% | | | | |
| | 150,140 | | KBR, Inc. | | | 8,849,252 | |
| | 197,300 | | Verra Mobility Corp. 1 | | | 3,689,510 | |
| | | | | | | 12,538,762 | |
| Real Estate Management & Development: 4.1% | | | | |
| | 55,003 | | FirstService Corp. | | | 8,005,136 | |
| | | | | |
| Semiconductors & Semiconductor Equipment: 13.9% | | | | |
| | 445,260 | | ACM Research, Inc. – Class A 1 | | | 8,061,432 | |
| | 113,165 | | MACOM Technology | | | | |
| | | | Solutions Holdings, Inc. 1 | | | 9,232,001 | |
| | 49,557 | | Onto Innovation, Inc. 1 | | | 6,319,509 | |
| | 28,780 | | Silicon Laboratories, Inc. 1 | | | 3,335,314 | |
| | | | | | | 26,948,256 | |
| Software: 16.9% | | | | |
| | 34,810 | | Bentley Systems, Inc. – Class B | | | 1,746,070 | |
| | 330,520 | | Clearwater Analytics Holdings, | | | | |
| | | | Inc. – Class A 1 | | | 6,392,257 | |
| | 139,700 | | DoubleVerify Holdings, Inc. 1 | | | 3,904,615 | |
| | 59,800 | | Five9, Inc. 1 | | | 3,845,140 | |
| | 28,400 | | Manhattan Associates, Inc. 1 | | | 5,613,544 | |
| | 59,365 | | Procore Technologies, Inc. 1 | | | 3,877,722 | |
| | 42,665 | | SPS Commerce, Inc. 1 | | | 7,279,076 | |
| | | | | | | 32,658,424 | |
| Specialty Retail: 1.6% | | | | |
| | 33,605 | | Floor & Decor Holdings, | | | | |
| | | | Inc. – Class A 1 | | | 3,041,253 | |
| | | | | |
| Trading Companies & Distributors: 0.5% | | | | |
| | 27,225 | | FTAI Aviation Ltd. | | | 967,849 | |
| | | | | |
| Total Common Stocks | | | | |
| (Cost $163,028,540) | | | 175,244,783 | |
The accompanying Notes to Financial Statements are an integral part of these financial statements.
Emerging Opportunity Fund | Schedule of Investments at September 30, 2023 (Unaudited) (Continued)
| Shares | | | | Value | |
| Short-Term Investments: 11.1% | | | |
| | | | | | |
| Money Market Funds: 11.1% | | | |
| | 21,570,977 | | Federated Hermes U.S. Treasury | | | |
| | | | Cash Reserves – Class I, 5.206% 2 | | $ | 21,570,977 | |
| Total Short-Term Investments | | | | |
| (Cost $21,570,977) | | | 21,570,977 | |
| Total Investments In Securities: 101.5% | | | | |
| (Cost $184,599,517) | | | 196,815,760 | |
| Liabilities in Excess of Other Assets: (1.5)% | | | (2,909,622 | ) |
| TOTAL NET ASSETS: 100.0% | | $ | 193,906,138 | |
1 | Non-income producing security. |
2 | Annualized seven-day effective yield as of September 30, 2023. |
The Global Industry Classification Standard (GICS®) was developed by and/or is the exclusive property of MSCI, Inc. (“MSCI”) and Standard & Poor’s Financial Services LLC (“S&P”). GICS is a service mark of MSCI and S&P and has been licensed for use by the administrator, U.S. Bancorp Fund Services, LLC.
The accompanying Notes to Financial Statements are an integral part of these financial statements.
Total Return Fund | Schedule of Investments at September 30, 2023 (Unaudited)
| Principal | | | | | |
| Amount | | | | Value | |
| Mortgage Backed Securities: 34.3% | | | |
| | | | | | |
| | | Federal Home Loan | | | |
| | | Mortgage Corporation | | | |
| $ | 3,963,859 | | 3.500%, FR SD1900, 06/01/2052 | | $ | 3,442,056 | |
| | 6,677,258 | | 5.000%, FR SD8258, 10/01/2052 | | | 6,312,194 | |
| | 4,477,339 | | 5.000%, FR SD1884, 11/01/2052 | | | 4,231,181 | |
| | | | Federal Home Loan Mortgage | | | | |
| | | | Corporation Strips | | | | |
| | 852,672 | | 3.000%, Series FHS | | | | |
| | | | 288 IO, 10/15/2027 | | | 34,037 | |
| | | | Federal National Mortgage | | | | |
| | | | Association Interest Strips | | | | |
| | 67,290 | | 4.000%, Pool FNS | | | | |
| | | | 421 C3, 07/25/2030 | | | 4,597 | |
| | | | Federal National | | | | |
| | | | Mortgage Association Pool | | | | |
| | 600,446 | | 4.500%, FN AL2519, 07/01/2040 | | | 567,934 | |
| | 585,782 | | 3.500%, FN AS5460, 07/01/2045 | | | 515,266 | |
| | 767,087 | | 3.500%, FN AS6520, 01/01/2046 | | | 672,703 | |
| | 611,896 | | 4.500%, FN MA3101, 08/01/2047 | | | 574,444 | |
| | 6,613,363 | | 3.000%, FN FS2991, 07/01/2051 | | | 5,492,468 | |
| | 9,908,763 | | 4.500%, FN FS3520, 11/01/2052 | | | 9,113,532 | |
| | 3,010,040 | | 5.000%, FN MA4841, 12/01/2052 | | | 2,845,477 | |
| | 9,705,468 | | 5.000%, FN FS4239, 03/01/2053 | | | 9,170,296 | |
| | | | | | | 42,976,185 | |
| Total Mortgage Backed Securities | | | | |
| (Cost $45,674,967) | | | 42,976,185 | |
| | | | | | | | |
| U.S. Government Notes/Bonds: 29.2% | | | | |
| | | | | | | | |
| | | | United States Treasury Note/Bond | | | | |
| | 5,000,000 | | 4.000%, 02/29/2028 | | | 4,872,266 | |
| | 5,000,000 | | 4.000%, 02/28/2030 | | | 4,823,438 | |
| | 5,000,000 | | 3.875%, 08/15/2033 | | | 4,726,172 | |
| | 4,915,000 | | 3.875%, 02/15/2043 | | | 4,274,514 | |
| | 4,000,000 | | 3.000%, 02/15/2047 | | | 2,934,531 | |
| | 7,000,000 | | 3.375%, 11/15/2048 | | | 5,484,062 | |
| | 3,000,000 | | 4.125%, 08/15/2053 | | | 2,720,625 | |
| | 7,000,000 | | 4.125%, 08/31/2030 | | | 6,796,563 | |
| | | | | | | 36,632,171 | |
| Total U.S. Government Notes/Bonds | | | | |
| (Cost $38,230,189) | | | 36,632,171 | |
| | | | | | | | |
| Asset Backed Securities: 16.1% | | | | |
| | | | | | | | |
| | | | Aaset 2021-2 Trust 2021-2 | | | | |
| | 825,616 | | 2.798%, 2021-2A, 01/15/2047 1 | | | 709,172 | |
| | | | American Credit Acceptance | | | | |
| | | | Receivables Trust | | | | |
| | 1,500,000 | | 1.140%, 2021-1, 03/15/2027 1 | | | 1,458,350 | |
| | 220,887 | | 0.970%, 2021-2, 07/13/2027 1 | | | 219,368 | |
| | | | Cartiga Asset Finance | | | | |
| | | | Trust 2023-1 LLC | | | | |
| | 919,131 | | 7.000%, 2023-1, 03/15/2035 1,5 | | | 912,854 | |
| | | | Carvana Auto Receivables Trust | | | | |
| | 740,197 | | 6.360%, 2023-N1, 04/12/2027 1 | | | 741,384 | |
| | 409,143 | | 1.300%, 2021-N1, 01/10/2028 | | | 382,122 | |
| | 392,614 | | 1.270%, 2021-N2, 03/10/2028 | | | 374,337 | |
| | | | CLI Funding VIII LLC | | | | |
| | 1,831,845 | | 1.640%, 2021-1A, 02/18/2046 1 | | | 1,567,378 | |
| | | | DT Auto Owner Trust | | | | |
| | 329,354 | | 0.840%, 2021-1A, 10/15/2026 1 | | | 323,396 | |
| | | | DT Auto Owner Trust 2019-3 | | | | |
| | 54,157 | | 2.960%, 2019-3A, 04/15/2025 1 | | | 53,983 | |
| | | | Flagship Credit Auto Trust | | | | |
| | 474,632 | | 1.280%, 02/16/2027 1 | | | 461,776 | |
| | 1,000,000 | | 1.270%, 2021-2, 06/15/2027 1 | | | 940,406 | |
| | | | Golden Pear Securitization | | | | |
| | 1,437,693 | | 7.420%, 2023-1, 07/15/2035 1 | | | 1,430,797 | |
| | | | LFS LLC | | | | |
| | 1,794,128 | | 7.173%, 2023-A, 07/15/2035 1 | | | 1,782,057 | |
| | | | Libra Solutions LLC | | | | |
| | 1,108,335 | | 7.000%, 2023-1A, 02/15/2035 1 | | | 1,103,306 | |
| | | | MVW Owner Trust | | | | |
| | 206,092 | | 1.440%, 2021-1WA, 01/22/2041 1 | | | 185,941 | |
| | | | Navigator Aircraft ABS Ltd. | | | | |
| | 2,044,896 | | 2.771%, 2021-1, 11/15/2046 1,4 | | | 1,782,126 | |
| | | | Progress Residential Trust | | | | |
| | 500,000 | | 1.555%, 04/17/2038 1 | | | 441,631 | |
| | | | Pvone 2023-1 LLC | | | | |
| | 893,605 | | 7.250%, 2023-1A, 07/16/2035 1,5 | | | 890,248 | |
| | | | Stonepeak 2021-1 ABS 2021-1 | | | | |
| | 977,329 | | 2.301%, 2021-1A, 02/28/2033 1 | | | 887,172 | |
| | | | Thrust Engine Leasing 2021 DAC | | | | |
| | 2,572,634 | | 4.163%, 2021-1A, 07/15/2040 1 | | | 2,220,079 | |
| | | | Triton International Ltd. | | | | |
| | 1,575,000 | | 1.860%, 2021-1A, 03/20/2046 1 | | | 1,318,064 | |
| | | | Westlake Automobile Receivables Trust | | | | |
| | 27,549 | | 1.240%, 2020-3A, 11/17/2025 1 | | | 27,374 | |
| | | | | | | 20,213,321 | |
| Total Asset Backed Securities | | | | |
| (Cost $21,581,870) | | | 20,213,321 | |
| | | | | | | | |
| Corporate Bonds: 15.3% | | | �� | |
| | | | | | | | |
| Air Freight & Logistics: 0.5% | | | | |
| | | | American Airlines Group, Inc. | | | | |
| | 666,627 | | 3.850%, 02/15/2028 | | | 589,730 | |
The accompanying Notes to Financial Statements are an integral part of these financial statements.
Total Return Fund | Schedule of Investments at September 30, 2023 (Unaudited) (Continued)
| Principal | | | | | |
| Amount | | | | Value | |
| Banks: 4.0% | | | |
| | | Citigroup, Inc. | | | |
| $ | 1,000,000 | | 6.537% (SOFR + 1.372%), | | | |
| | | | 05/24/2025 2 | | $ | 1,004,321 | |
| | | | HSBC Holdings PLC | | | | |
| | 1,000,000 | | 6.547% (SOFR + 2.980%), | | | | |
| | | | 06/20/2034 2 | | | 949,539 | |
| | | | Mizuho Financial Group, Inc. | | | | |
| | 1,000,000 | | 5.748% (1 Year CMT | | | | |
| | | | Rate + 1.900%), 07/06/2034 2 | | | 955,720 | |
| | | | Santander UK Group Holdings PLC | | | | |
| | 1,000,000 | | 6.833% (SOFR + 2.749%), | | | | |
| | | | 11/21/2026 2 | | | 1,006,118 | |
| | | | The PNC Financial Services Group, Inc. | | | | |
| | 1,030,000 | | 9.312% (SOFR 3 Month | | | | |
| | | | + 3.940%), 11/01/2023 2 | | | 1,030,937 | |
| | | | | | | 4,946,635 | |
| Biotechnology: 0.6% | | | | |
| | | | Amgen, Inc. | | | | |
| | 1,000,000 | | 3.150%, 02/21/2040 | | | 706,103 | |
| | | | | |
| Capital Markets: 1.3% | | | | |
| | | | Morgan Stanley | | | | |
| | 1,000,000 | | 4.350%, 09/08/2026 | | | 955,439 | |
| | 1,000,000 | | 2.484% (SOFR + 1.360%), | | | | |
| | | | 09/16/2036 2 | | | 727,228 | |
| | | | | | | 1,682,667 | |
| Diversified Telecommunication Services: 0.5% | | | | |
| | | | AT&T, Inc. | | | | |
| | 1,000,000 | | 3.500%, 09/15/2053 | | | 619,863 | |
| | | | | |
| Electric Utilities: 1.2% | | | | |
| | | | Edison International | | | | |
| | 725,000 | | 5.000% (5 Year CMT | | | | |
| | | | Rate + 3.901%), 12/15/2026 2 | | | 621,436 | |
| | | | PacifiCorp | | | | |
| | 1,000,000 | | 5.350%, 12/01/2053 | | | 831,520 | |
| | | | | | | 1,452,956 | |
| Health Care Providers & Services: 0.7% | | | | |
| | | | CVS Health Corp. | | | | |
| | 1,000,000 | | 5.875%, 06/01/2053 | | | 925,090 | |
| | | | | |
| Insurance: 1.6% | | | | |
| | | | Metropolitan Life Global Funding I | | | | |
| | 1,000,000 | | 5.150%, 03/28/2033 1 | | | 948,077 | |
| | | | New York Life Insurance Co. | | | | |
| | 1,000,000 | | 5.875%, 05/15/2033 1 | | | 994,206 | |
| | | | SBL Holdings, Inc. | | | | |
| | 25,000 | | 6.500% (5 Year CMT | | | | |
| | | | Rate + 5.620%), 11/13/2026 1,2 | | | 14,277 | |
| | | | | | | 1,956,560 | |
| Media: 0.2% | | | | |
| | | | Comcast Corp. | | | | |
| | 500,000 | | 2.887%, 11/01/2051 | | | 295,731 | |
| | | | | |
| Oil, Gas & Consumable Fuels: 0.7% | | | | |
| | | | Energy Transfer L.P. | | | | |
| | 1,000,000 | | 6.500% (5 Year CMT | | | | |
| | | | Rate + 5.694%), 11/15/2026 2 | | | 921,185 | |
| | | | | |
| Passenger Airlines: 2.0% | | | | |
| | | | Air Canada | | | | |
| | 760,488 | | 5.250%, 04/01/2029 1 | | | 735,179 | |
| | | | British Airways PLC | | | | |
| | 509,462 | | 4.250%, 11/15/2032 1 | | | 458,021 | |
| | | | United Airlines 2020-1 Class A | | | | |
| | | | Pass Through Trust | | | | |
| | 1,365,667 | | 5.875%, 10/15/2027 | | | 1,355,747 | |
| | | | | | | 2,548,947 | |
| Pharmaceuticals: 0.7% | | | | |
| | | | Pfizer Investment Enterprises Pte Ltd. | | | | |
| | 1,000,000 | | 5.110%, 05/19/2043 | | | 919,692 | |
| | | | | |
| Software: 0.6% | | | | |
| | | | Oracle Corp. | | | | |
| | 1,000,000 | | 3.650%, 03/25/2041 | | | 713,688 | |
| | | | | |
| Wireless Telecommunication Services: 0.7% | | | | |
| | | | T-Mobile USA, Inc. | | | | |
| | 1,000,000 | | 5.750%, 01/15/2054 | | | 922,702 | |
| | | | | |
| Total Corporate Bonds | | | | |
| (Cost $20,438,314) | | | 19,201,549 | |
| | | | | | | | |
| Collateralized Mortgage Obligation: 3.8% | | | | |
| | | | | | | | |
| | | | BX Trust | | | | |
| | 1,000,000 | | 6.547%, 2021-VOLT (1 Month | | | | |
| | | | SOFR + 1.214%), 09/15/2036 1,2 | | | 962,506 | |
| | | | Federal Home Loan Mortgage | | | | |
| | | | Corporation REMICS | | | | |
| | 26,080 | | 2.072%, Series FHR | | | | |
| | | | 2512 SI (1 Month SOFR | | | | |
| | | | + 7.386%), 04/15/2024 2 | | | 128 | |
| | 1,192,395 | | 3.000%, Series FHR | | | | |
| | | | 4048 IK, 05/15/2027 | | | 41,057 | |
| | 586,198 | | 2.500%, Series FHR | | | | |
| | | | 4360 BI, 11/15/2028 | | | 11,824 | |
| | 155,911 | | 4.000%, Series FHR | | | | |
| | | | 4495 PI, 09/15/2043 | | | 13,220 | |
| | 631,776 | | 4.000%, Series FHR | | | | |
| | | | 4911 IH, 04/15/2049 | | | 49,692 | |
The accompanying Notes to Financial Statements are an integral part of these financial statements.
Total Return Fund | Schedule of Investments at September 30, 2023 (Unaudited) (Continued)
| Principal | | | | | |
| Amount | | | | Value | |
| | | Federal National Mortgage | | | |
| | | Association REMICS | | | |
| $ | 12,957 | | 1.821%, Series FNR | | | |
| | | | 1996-45 SI (1 Month SOFR | | | |
| | | | + 7.136%), 02/25/2024 2 | | $ | 44 | |
| | 264,011 | | 2.572%, Series FNR | | | | |
| | | | 1997-65 SI (1 Month SOFR | | | | |
| | | | + 7.886%), 09/17/2027 2 | | | 8,240 | |
| | 252,684 | | 4.500%, Series FNR | | | | |
| | | | 2014-81 TI, 12/25/2034 | | | 19,724 | |
| | 1,105,867 | | 0.671%, Series FNR | | | | |
| | | | 2012-82 PS (1 Month SOFR | | | | |
| | | | + 5.986%), 08/25/2041 2 | | | 27,347 | |
| | 365,306 | | 0.771%, Series FNR | | | | |
| | | | 2014-50 WS (1 Month SOFR | | | | |
| | | | + 6.086%), 08/25/2044 2 | | | 18,731 | |
| | 299,439 | | 0.671%, Series FNR | | | | |
| | | | 2016-83 BS (1 Month SOFR | | | | |
| | | | + 5.986%), 11/25/2046 2 | | | 19,521 | |
| | 367,181 | | 6.500%, Series FNR | | | | |
| | | | 2018-51 IO, 07/25/2048 | | | 44,984 | |
| | | | Goldman Sachs Mortgage- | | | | |
| | | | Backed Securities Corp Trust | | | | |
| | 465,239 | | 3.000%, Series GSMBS | | | | |
| | | | 2020-PJ4 A2, 01/25/2051 1,2 | | | 382,335 | |
| | | | HUD Office of the Secretary | | | | |
| | 62,177 | | 4.000%, Series GNR | | | | |
| | | | 2014-74 GI, 05/16/2029 | | | 1,251 | |
| | 211,687 | | 1.105%, Series GNR | | | | |
| | | | 2010-47 BX (1 Month SOFR | | | | |
| | | | + 6.436%), 08/16/2034 2 | | | 5,000 | |
| | | | JP Morgan Mortgage Trust | | | | |
| | 103,002 | | 5.446%, Series JPMMT | | | | |
| | | | 2014-IVR3 3A1, 09/25/2044 1,2 | | | 102,060 | |
| | 310,909 | | 3.000%, Series JPMMT | | | | |
| | | | 2020-7 A3, 01/25/2051 1,2 | | | 247,943 | |
| | | | Life Mortgage Trust US | | | | |
| | 982,970 | | 6.546%, 2021-BMR (1 Month | | | | |
| | | | SOFR + 1.214%), 03/15/2038 1,2 | | | 955,876 | |
| | | | RCKT Mortgage Trust 2021-6 – 0 | | | | |
| | 1,761,478 | | 2.500%, 2021-6, 12/25/2051 1,2 | | | 1,339,287 | |
| | | | Wells Fargo Mortgage | | | | |
| | | | Backed Securities Trust | | | | |
| | 52,977 | | 3.500%, 2019-4, 09/25/2049 1,2 | | | 44,916 | |
| | 110,985 | | 3.000%, Series WFMBS | | | | |
| | | | 2020-3 A3, 06/25/2050 1,2 | | | 105,515 | |
| | 418,600 | | 3.000%, Series WFMBS | | | | |
| | | | 2020-4 A1, 07/25/2050 1,2 | | | 335,910 | |
| | | | | | | 4,737,111 | |
| Total Collateralized Mortgage Obligation | | | | |
| (Cost $5,973,215) | | | 4,737,111 | |
| | | | | | | | |
| Shares | | | | | | |
| Short-Term Investments: 0.7% | | | | |
| | | | | | | | |
| Money Market Funds: 0.7% | | | | |
| | 884,835 | | Morgan Stanley Institutional | | | | |
| | | | Liquidity Funds – Government | | | | |
| | | | Portfolio – Class I, 5.266% 3 | |
| 884,835 | |
| Total Short-Term Investments | | | | |
| (Cost $884,835) | | | 884,835 | |
| Total Investments In Securities: 99.4% | | | | |
| (Cost $132,783,390) | | | 124,645,172 | |
| Other Assets in Excess of Liabilities: 0.6% | | | 708,381 | |
| TOTAL NET ASSETS: 100.0% | | $ | 125,353,553 | |
CMT – Constant Maturity Treasury Rate
SOFR – Secured Overnight Financing Rate
USD – United States Dollar
1 | Security exempt from registration under Rule 144A of the Securities Act of 1933. These securities may be resold in transactions exempt from registration to qualified institutional buyers. These securities are determined to be liquid by the Adviser, unless otherwise noted, under procedures established by the Trust’s Board of Trustees. |
2 | Variable rate security; rate shown is the rate in effect on September 30, 2023. An index may have a negative rate. Interest rate may also be subject to a cap or floor. |
3 | Annualized seven-day effective yield as of September 30, 2023. |
4 | Step-up bond. The interest rate will step up if the issuer does not redeem the bond by an expected redemption date. The interest rate shown is the rate in effect as of September 30, 2023. |
5 | Security is fair valued under the Board of Trustees and is categorized as a Level 3 security. Significant unobservable inputs were used to determine fair value. |
The Global Industry Classification Standard (GICS®) was developed by and/or is the exclusive property of MSCI, Inc. (“MSCI”) and Standard & Poor’s Financial Services LLC (“S&P”). GICS is a service mark of MSCI and S&P and has been licensed for use by the administrator, U.S. Bancorp Fund Services, LLC.
The accompanying Notes to Financial Statements are an integral part of these financial statements.
Short Duration Credit Fund | Schedule of Investments at September 30, 2023 (Unaudited)
| Shares | | | | Value | |
| Common Stocks: 0.7% | | | |
| | | | | | |
| Computers & Peripherals: 0.7% | | | |
| | 24,069 | | Diebold Nixdorf, Inc. 1 | | $ | 455,867 | |
| | | | | |
| Total Common Stocks | | | | |
| (Cost $13,595,921) | | | 455,867 | |
| | | | | | | | |
| Principal | | | | | | |
| Amount | | | | | | |
| Corporate Bonds: 14.9% | | | | |
| | | | | | | | |
| Air Freight & Logistics: 0.1% | | | | |
| | | | Western Global Airlines LLC 10.375%, 08/15/2025 2 | | | | |
| $ | 18,199,000 | | | | 45,498 | |
| | | | | |
| Consumer Finance: 3.0% | | | | |
| | | | Bread Financial Holdings, Inc. 4.750%, 12/15/2024 2 | | | | |
| | 1,940,000 | | | | 1,894,609 | |
| | | | | |
| Diversified Consumer Services: 1.1% | | | | |
| | | | Cengage Learning, Inc. 9.500%, 06/15/2024 2 | | | | |
| | 662,000 | | | | 666,506 | |
| | | | | |
| Specialty Retail: 10.7% | | | | |
| | | | The Michaels Cos., Inc 5.250%, 05/01/2028 2 | | | | |
| | 6,338,000 | | | | 5,069,037 | |
| | 2,428,000 | | 7.875%, 05/01/2029 2 | | | 1,587,633 | |
| | | | | | | 6,656,670 | |
| Total Corporate Bonds | | | | |
| (Cost $23,351,002) | | | 9,263,283 | |
| | | | | | | | |
| BANK LOANS: 3.2% | | | | |
| | | | | | | | |
| Air Freight & Logistics: 3.2% | | | | |
| | | | Western Global DIP Loans 14.300%, 12/06/2023 3,4,6 | | | | |
| | 2,005,131 | | | | 2,005,131 | |
| | | | | |
| Total Bank Loans | | | | |
| (Cost $1,971,858) | | | 2,005,131 | |
| | | | | | | | |
| Shares | | | | | | |
| Short-Term Investments: 95.1% | | | | |
| | | | | | | | |
| Money Market Funds: 95.1% | | | | |
| | 59,059,308 | | U.S. Bank Money Market Deposit Account, 5.200% 5 | | | | |
| | | | | $ | 59,059,308 | |
| Total Short-Term Investments | | | | |
| (Cost $59,059,308) | | | 59,059,308 | |
| Total Investments In Securities: 113.9% | | | | |
| (Cost $97,978,089) | | | 70,783,589 | |
| Liabilities in Excess of Other Assets: (13.9)% | | | (8,658,905 | ) |
| TOTAL NET ASSETS: 100.0% | | $ | 62,124,684 | |
1 | Non-income producing security. |
2 | Security exempt from registration under Rule 144A of the Securities Act of 1933. These securities may be resold in transactions exempt from registration to qualified institutional buyers. These securities are determined to be liquid by the Adviser, unless otherwise noted, under procedures established by the Trust’s Board of Trustees. |
3 | Bank loans generally pay interest at rates which are periodically determined by reference to a base lending rate plus a premium. All loans carry a variable rate of interest. These base lending rates are generally (i) the Prime Rate offered by one or more European banks such as the London Interbank Offered Rate (“LIBOR”) or (iii) the Certificate of Deposit rate. Bank Loans, while exempt from registration, under the Securities Act of 1933, contain certain restrictions on resale and cannot be sold publicly. Floating rate bank loans often require prepayments from excess cash flow or permit the borrower to repay at its election. The degree to which borrowers repay, whether as a contractual requirement or at their election, cannot be predicted with accuracy. |
4 | Variable rate security; rate shown is the rate in effect on September 30, 2023. An index may have a negative rate. Interest rate may also be subject to a cap or floor. |
5 | Annualized seven-day effective yield as of September 30, 2023. |
6 | Security is fair valued under the Board of Trustees and is categorized as a Level 3 security. Significant unobservable inputs were used to determine fair value. |
The Global Industry Classification Standard (GICS®) was developed by and/or is the exclusive property of MSCI, Inc. (“MSCI”) and Standard & Poor’s Financial Services LLC (“S&P”). GICS is a service mark of MSCI and S&P and has been licensed for use by the administrator, U.S. Bancorp Fund Services, LLC.
The accompanying Notes to Financial Statements are an integral part of these financial statements.
Sustainable Credit Fund | Schedule of Investments at September 30, 2023 (Unaudited)
| Shares | | | | Value | |
| Common Stocks: 0.3% | | | |
| | | | | | |
| Computers & Peripherals: 0.3% | | | |
| | 623 | | Diebold Nixdorf, Inc. 1 | | $ | 11,800 | |
| | | | | |
| Total Common Stocks | | | | |
| (Cost $319,303) | | | 11,800 | |
| | | | | | | | |
| Principal | | | | | | |
| Amount | | | | | | |
| Corporate Bonds: 8.4% | | | | |
| | | | | | | | |
| Air Freight & Logistics: 0.0% | | | | |
| | | | Western Global Airlines LLC | | | | |
| $ | 498,000 | | 10.375%, 08/15/2025 2 | | | 1,245 | |
| | | | | |
| Consumer Finance: 1.5% | | | | |
| | | | Bread Financial Holdings, Inc. | | | | |
| | 60,000 | | 4.750%, 12/15/2024 2 | | | 58,596 | |
| | | | | |
| Diversified Consumer Services: 0.5% | | | | |
| | | | Cengage Learning, Inc. | | | | |
| | 18,000 | | 9.500%, 06/15/2024 2 | | | 18,123 | |
| | | | | |
| Specialty Retail: 6.4% | | | | |
| | | | The Michaels Cos., Inc | | | | |
| | 161,000 | | 5.250%, 05/01/2028 2 | | | 128,765 | |
| | 172,000 | | 7.875%, 05/01/2029 2 | | | 112,468 | |
| | | | | | | 241,233 | |
| Total Corporate Bonds | | | | |
| (Cost $706,417) | | | 319,197 | |
| | | | | | | | |
| Bank Loans: 1.4% | | | | |
| | | | | | | | |
| Air Freight & Logistics: 1.4% | | | | |
| | | | Western Global DIP Loans | | | | |
| | 54,869 | | 14.300%, 12/06/2023 3,4,6 | | | 54,869 | |
| | | | | |
| Total Bank Loans | | | | |
| (Cost $53,958) | | | 54,869 | |
| | | | | | | | |
| Shares | | | | | | |
| Short-Term Investments: 81.4% | | | | |
| | | | | | | | |
| Money Market Funds: 81.4% | | | | |
| | 3,081,749 | | U.S. Bank Money Market Deposit | | | | |
| | | | Account, 5.200% 5 | | | 3,081,749 | |
| Total Short-Term Investments | | | | |
| (Cost $3,081,749) | | | 3,081,749 | |
| Total Investments In Securities: 91.5% | | | | |
| (Cost $4,161,427) | | | 3,467,615 | |
| Other Assets in Excess of Liabilities: 8.5% | | | 320,560 | |
| TOTAL NET ASSETS: 100.0% | | $ | 3,788,175 | |
1 | Non-income producing security. |
2 | Security exempt from registration under Rule 144A of the Securities Act of 1933. These securities may be resold in transactions exempt from registration to qualified institutional buyers. These securities are determined to be liquid by the Adviser, unless otherwise noted, under procedures established by the Trust’s Board of Trustees. |
3 | Bank loans generally pay interest at rates which are periodically determined by reference to a base lending rate plus a premium. All loans carry a variable rate of interest. These base lending rates are generally (i) the Prime Rate offered by one or more European banks such as the London Interbank Offered Rate (“LIBOR”) or (iii) the Certificate of Deposit rate. Bank Loans, while exempt from registration, under the Securities Act of 1933, contain certain restrictions on resale and cannot be sold publicly. Floating rate bank loans often require prepayments from excess cash flow or permit the borrower to repay at its election. The degree to which borrowers repay, whether as a contractual requirement or at their election, cannot be predicted with accuracy. |
4 | Variable rate security; rate shown is the rate in effect on September 30, 2023. An index may have a negative rate. Interest rate may also be subject to a cap or floor. |
5 | Annualized seven-day effective yield as of September 30, 2023. |
6 | Security is fair valued under the Board of Trustees and is categorized as a Level 3 security. Significant unobservable inputs were used to determine fair value. |
The Global Industry Classification Standard (GICS®) was developed by and/or is the exclusive property of MSCI, Inc. (“MSCI”) and Standard & Poor’s Financial Services LLC (“S&P”). GICS is a service mark of MSCI and S&P and has been licensed for use by the administrator, U.S. Bancorp Fund Services, LLC.
The accompanying Notes to Financial Statements are an integral part of these financial statements.
Osterweis Funds | Statements of Assets and Liabilities at September 30, 2023 (Unaudited)
| | | | | | | | | | Growth & | | | Emerging | |
| | | | Osterweis | | | Strategic | | | Income | | | Opportunity | |
| | | | Fund | | | Income Fund | | | Fund | | | Fund | |
| | ASSETS | | | | | | | | | | | | |
| | Investments in unaffiliated securities, at value | | $ | 130,019,484 | | | $ | 4,604,330,671 | | | $ | 155,532,100 | | | $ | 196,815,760 | |
| | (cost $92,026,306, $4,915,132,974, $134,769,977, | | | | | | | | | | | | | | | | |
| | and $184,599,517, respectively) | | | | | | | | | | | | | | | | |
| | Investments in affiliated securities, at value | | | — | | | | 40,452,440 | | | | 825,560 | | | | — | |
| | (cost $—, $49,000,000, $1,000,000, and $-, respectively) | | | | | | | | | | | | | | | | |
| | Cash | | | — | | | | — | | | | — | | | | — | |
| | Receivables: | | | | | | | | | | | | | | | | |
| | Investment securities sold | | | 3,290,589 | | | | 34,896,670 | | | | 456,166 | | | | 896,165 | |
| | Fund shares sold | | | 5,829 | | | | 1,916,559 | | | | 14,294 | | | | 100,847 | |
| | Dividends and interest | | | 117,724 | | | | 74,556,603 | | | | 971,197 | | | | 139,422 | |
| | Return of capital | | | — | | | | — | | | | — | | | | — | |
| | Variation margin | | | — | | | | — | | | | — | | | | — | |
| | Due from investment advisor | | | — | | | | — | | | | — | | | | — | |
| | Prepaid expenses | | | 18,493 | | | | 77,944 | | | | 19,629 | | | | 9,184 | |
| | Total assets | | | 133,452,119 | | | | 4,756,230,887 | | | | 157,818,946 | | | | 197,961,378 | |
| | | | | | | | | | | | | | | | | | |
| | LIABILITIES | | | | | | | | | | | | | | | | |
| | Payables: | | | | | | | | | | | | | | | | |
| | Investment securities purchased | | | 143,664 | | | | 30,249,528 | | | | 635,483 | | | | 3,826,535 | |
| | Fund shares redeemed | | | 8,880 | | | | 5,784,146 | | | | 127,772 | | | | 10,924 | |
| | Distributions to shareholders | | | — | | | | — | | | | — | | | | — | |
| | Investment advisory fees, net | | | 87,083 | | | | 2,798,085 | | | | 98,233 | | | | 150,519 | |
| | Variation margin Payable | | | — | | | | — | | | | — | | | | — | |
| | Administration fees | | | 6,159 | | | | 162,209 | | | | 7,190 | | | | 7,645 | |
| | Custody fees | | | 1,456 | | | | 37,711 | | | | 2,071 | | | | 8,841 | |
| | Fund accounting fees | | | 4,456 | | | | 110,906 | | | | 6,247 | | | | 3,823 | |
| | Transfer agent fees | | | 4,390 | | | | 372,464 | | | | 5,651 | | | | 31,696 | |
| | Trustee fees | | | 1,087 | | | | 7,036 | | | | 1,241 | | | | 1,189 | |
| | Audit fees | | | 14,177 | | | | 14,721 | | | | 13,378 | | | | 8,304 | |
| | Chief Compliance Officer fees | | | 1,287 | | | | 1,633 | | | | 1,629 | | | | 1,660 | |
| | Loans payable | | | — | | | | — | | | | — | | | | — | |
| | Other accrued expenses | | | 1,954 | | | | 61,503 | | | | 12,792 | | | | 4,104 | |
| | Total Liabilities | | | 274,593 | | | | 39,599,942 | | | | 911,687 | | | | 4,055,240 | |
| | NET ASSETS | | $ | 133,177,526 | | | $ | 4,716,630,945 | | | $ | 156,907,259 | | | $ | 193,906,138 | |
| | | | | | | | | | | | | | | | | | |
| | COMPUTATION OF NET ASSETS: | | | | | | | | | | | | | | | | |
| | Net assets value (unlimited shares authorized): | | $ | 133,177,526 | | | $ | 4,716,630,945 | | | $ | 156,907,259 | | | $ | 193,906,138 | |
| | Shares (unlimited number of shares authorized without par value) | | | 7,720,169 | | | | 446,393,782 | | | | 10,384,904 | | | | 15,283,194 | |
| | Net assets value, offering, and redemption price per share | | $ | 17.25 | | | $ | 10.57 | | | $ | 15.11 | | | $ | 12.69 | |
| | | | | | | | | | | | | | | | | | |
| | COMPONENTS OF NET ASSETS: | | | | | | | | | | | | | | | | |
| | Paid-in capital | | $ | 89,704,295 | | | $ | 5,468,993,891 | | | $ | 133,702,694 | | | $ | 219,752,923 | |
| | Total distributable (accumulated) earnings (losses) | | | 43,473,231 | | | | (752,362,946 | ) | | | 23,204,565 | | | | (25,846,785 | ) |
| | Net assets | | $ | 133,177,526 | | | $ | 4,716,630,945 | | | $ | 156,907,259 | | | $ | 193,906,138 | |
The accompanying Notes to Financial Statements are an integral part of these financial statements.
Osterweis Funds | Statements of Assets and Liabilities at September 30, 2023 (Unaudited) (Continued)
| | | | Total | | | Short | | | Sustainable | |
| | | | Return | | | Duration | | | Credit | |
| | | | Fund | | | Credit Fund | | | Fund | |
| | ASSETS | | | | | | | | | |
| | Investments in unaffiliated securities, at value | | $ | 124,645,172 | | | $ | 70,783,589 | | | $ | 3,467,615 | |
| | (cost $132,783,390, $97,978,089, and $4,161,427, respectively) | | | | | | | | | | | | |
| | Investments in affiliated securities, at value | | | — | | | | — | | | | — | |
| | (cost $—, $—, and $—, respectively) | | | | | | | | | | | | |
| | Cash | | | 5,988 | | | | — | | | | — | |
| | Receivables: | | | | | | | | | | | | |
| | Investment securities sold | | | 30,179 | | | | 2,695,133 | | | | 317,682 | |
| | Fund shares sold | | | 2,204 | | | | — | | | | — | |
| | Dividends and interest | | | 783,487 | | | | 533,924 | | | | 26,265 | |
| | Return of capital | | | — | | | | — | | | | — | |
| | Variation margin | | | — | | | | — | | | | — | |
| | Due from investment advisor | | | — | | | | — | | | | 8,609 | |
| | Prepaid expenses | | | 11,411 | | | | 13,289 | | | | 15 | |
| | Total assets | | | 125,478,441 | | | | 74,025,935 | | | | 3,820,186 | |
| | | | | | | | | | | | | | |
| | LIABILITIES | | | | | | | | | | | | |
| | Payables: | | | | | | | | | | | | |
| | Investment securities purchased | | | — | | | | 371,963 | | | | 10,178 | |
| | Fund shares redeemed | | | 37,792 | | | | 11,417,337 | | | | — | |
| | Distributions to shareholders | | | — | | | | — | | | | — | |
| | Investment advisory fees, net | | | 47,174 | | | | 31,736 | | | | — | |
| | Variation margin Payable | | | — | | | | — | | | | — | |
| | Administration fees | | | 6,454 | | | | 8,661 | | | | 1,819 | |
| | Custody fees | | | 2,269 | | | | 21,657 | | | | 1,995 | |
| | Fund accounting fees | | | 7,381 | | | | 6,315 | | | | 1,172 | |
| | Transfer agent fees | | | 8,869 | | | | 33,940 | | | | 2,983 | |
| | Trustee fees | | | 1,273 | | | | — | | | | 720 | |
| | Audit fees | | | 6,160 | | | | 8,115 | | | | 6,122 | |
| | Chief Compliance Officer fees | | | 2,970 | | | | 1,497 | | | | 1,561 | |
| | Loans payable | | | — | | | | — | | | | — | |
| | Other accrued expenses | | | 4,546 | | | | 30 | | | | 5,461 | |
| | Total Liabilities | | | 124,888 | | | | 11,901,251 | | | | 32,011 | |
| | NET ASSETS | | $ | 125,353,553 | | | $ | 62,124,684 | | | $ | 3,788,175 | |
| | | | | | | | | | | | | | |
| | COMPUTATION OF NET ASSETS: | | | | | | | | | | | | |
| | Net assets value (unlimited shares authorized): | | $ | 125,353,553 | | | $ | 62,124,684 | | | $ | 3,788,175 | |
| | Shares (unlimited number of shares authorized without par value) | | | 13,739,902 | | | | 7,983,353 | | | | 491,799 | |
| | Net assets value, offering, and redemption price per share | | $ | 9.12 | | | $ | 7.78 | | | $ | 7.70 | |
| | | | | | | | | | | | | | |
| | COMPONENTS OF NET ASSETS: | | | | | | | | | | | | |
| | Paid-in capital | | $ | 143,715,836 | | | $ | 122,811,242 | | | $ | 5,020,771 | |
| | Total distributable (accumulated) earnings (losses) | | | (18,362,283 | ) | | | (60,686,558 | ) | | | (1,232,596 | ) |
| | Net assets | | $ | 125,353,553 | | | $ | 62,124,684 | | | $ | 3,788,175 | |
The accompanying Notes to Financial Statements are an integral part of these financial statements.
Osterweis Funds | Statements of Operations For the Six Months Ended September 30, 2023 (Unaudited)
| | | | | | | | | | Growth & | | | Emerging | |
| | | | Osterweis | | | Strategic | | | Income | | | Opportunity | |
| | | | Fund | | | Income Fund | | | Fund | | | Fund | |
| | INVESTMENT INCOME | | | | | | | | | | | | |
| | Income: | | | | | | | | | | | | |
| | Dividends from unaffiliated investments | | $ | 797,827 | | | $ | 19,989,250 | | | $ | 1,073,440 | | | $ | 261,044 | |
| | (net of $18,361, $—, $12,244, and $3,838, respectively, | | | | | | | | | | | | | | | | |
| | in foreign withholding taxes and issuance fees) | | | | | | | | | | | | | | | | |
| | Dividends from affiliated investments | | | — | | | | 1,868,126 | | | | 38,126 | | | | — | |
| | Interest | | | 144,930 | | | | 143,254,846 | | | | 1,958,737 | | | | 454,015 | |
| | Other income | | | 670 | | | | 3,102 | | | | 676 | | | | 700 | |
| | Total investment income | | | 943,427 | | | | 165,115,324 | | | | 3,070,979 | | | | 715,759 | |
| | | | | | | | | | | | | | | | | | |
| | EXPENSES | | | | | | | | | | | | | | | | |
| | Investment advisory fees | | | 524,273 | | | | 17,006,515 | | | | 597,802 | | | | 1,005,894 | |
| | Administration fees | | | 19,570 | | | | 491,163 | | | | 22,186 | | | | 26,438 | |
| | Fund accounting fees | | | 8,045 | | | | 335,807 | | | | 19,029 | | | | 13,834 | |
| | Sub-transfer agent fees | | | 14,518 | | | | 1,809,130 | | | | 12,589 | | | | 70,882 | |
| | Transfer agent fees | | | 15,493 | | | | 222,051 | | | | 14,340 | | | | 7,725 | |
| | Audit fees | | | 14,177 | | | | 14,721 | | | | 13,378 | | | | 15,545 | |
| | Registration fees | | | 9,146 | | | | 38,666 | | | | 6,527 | | | | 13,630 | |
| | Trustee fees | | | 9,019 | | | | 50,448 | | | | 9,331 | | | | 9,667 | |
| | Miscellaneous expense | | | 5,672 | | | | 45,668 | | | | 3,090 | | | | — | |
| | Custody fees | | | 4,286 | | | | 119,190 | | | | 7,635 | | | | 4,282 | |
| | Chief Compliance Officer fees | | | 4,620 | | | | 4,966 | | | | 4,963 | | | | 4,993 | |
| | Legal fees | | | 3,025 | | | | 2,145 | | | | 3,105 | | | | 2,335 | |
| | Reports to shareholders | | | 1,743 | | | | 84,416 | | | | 904 | | | | 2,504 | |
| | Insurance expense | | | 2,688 | | | | 13,343 | | | | 2,915 | | | | — | |
| | Interest expense | | | — | | | | — | | | | — | | | | — | |
| | Futures commissions merchant interest expense | | | — | | | | — | | | | — | | | | — | |
| | Total expenses | | | 636,275 | | | | 20,238,229 | | | | 717,794 | | | | 1,177,729 | |
| | Fees (waived) recouped by the Adviser | | | 27,805 | | | | — | | | | — | | | | (71,245 | ) |
| | Net expenses | | | 664,080 | | | | 20,238,229 | | | | 717,794 | | | | 1,106,484 | |
| | Net investment income (loss) | | | 279,347 | | | | 144,877,095 | | | | 2,353,185 | | | | (390,725 | ) |
| | | | | | | | | | | | | | | | | | |
| | REALIZED AND UNREALIZED GAIN (LOSS) ON INVESTMENTS | | | | | | | | | | | | | | | | |
| | Net realized gain (loss) on: | | | | | | | | | | | | | | | | |
| | Investments | | | 6,050,009 | | | | (23,462,053 | ) | | | 2,395,376 | | | | 3,828,299 | |
| | Affiliated investments | | | — | | | | — | | | | — | | | | — | |
| | Futures contracts | | | — | | | | — | | | | — | | | | — | |
| | Change in net unrealized appreciation/depreciation on: | | | | | | | | | | | | | | | | |
| | Investments | | | (3,964,719 | ) | | | 76,895,481 | | | | (3,425,284 | ) | | | (2,154,510 | ) |
| | Affiliated investments | | | — | | | | (6,060,320 | ) | | | (123,680 | ) | | | — | |
| | Futures contracts | | | — | | | | — | | | | — | | | | — | |
| | Net realized and unrealized gain (loss) on investments | | | 2,085,290 | | | | 47,373,108 | | | | (1,153,588 | ) | | | 1,673,789 | |
| | Net increase (decrease) in net assets resulting from operations | | $ | 2,364,637 | | | $ | 192,250,203 | | | $ | 1,199,597 | | | $ | 1,283,064 | |
The accompanying Notes to Financial Statements are an integral part of these financial statements.
Osterweis Funds | Statements of Operations For the Six Months Ended September 30, 2023 (Unaudited) (Continued)
| | | | Total | | | Short | | | Sustainable | |
| | | | Return | | | Duration | | | Credit | |
| | | | Fund | | | Credit Fund | | | Fund | |
| | INVESTMENT INCOME | | | | | | | | | |
| | Income: | | | | | | | | | |
| | Dividends from unaffiliated investments | | $ | — | | | $ | — | | | $ | — | |
| | (net of $—, $—, and $—, respectively, in foreign withholding taxes and issuance fees) | | | | | | | | | | | | |
| | Dividends from affiliated investments | | | — | | | | — | | | | — | |
| | Interest | | | 2,548,396 | | | | 3,700,576 | | | | 156,119 | |
| | Other income | | | 670 | | | | 697 | | | | 598 | |
| | Total investment income | | | 2,549,066 | | | | 3,701,273 | | | | 156,717 | |
| | | | | | | | | | | | | | |
| | EXPENSES | | | | | | | | | | | | |
| | Investment advisory fees | | | 298,093 | | | | 391,498 | | | | 14,557 | |
| | Administration fees | | | 20,985 | | | | 20,742 | | | | 6,075 | |
| | Fund accounting fees | | | 22,373 | | | | 12,767 | | | | 2,433 | |
| | Sub-transfer agent fees | | | 35,657 | | | | 28,935 | | | | 682 | |
| | Transfer agent fees | | | 13,285 | | | | 19,593 | | | | 8,484 | |
| | Audit fees | | | 6,160 | | | | 8,115 | | | | 6,849 | |
| | Registration fees | | | 9,720 | | | | 13,749 | | | | 11,585 | |
| | Trustee fees | | | 9,146 | | | | 6,212 | | | | 7,350 | |
| | Miscellaneous expense | | | 6,864 | | | | 2,515 | | | | 5,212 | |
| | Custody fees | | | 6,670 | | | | 20,273 | | | | 2,401 | |
| | Chief Compliance Officer fees | | | 4,295 | | | | 4,413 | | | | 4,403 | |
| | Legal fees | | | 2,464 | | | | 2,905 | | | | 2,517 | |
| | Reports to shareholders | | | 1,229 | | | | 2,690 | | | | — | |
| | Insurance expense | | | 2,889 | | | | 3,076 | | | | — | |
| | Interest expense | | | — | | | | — | | | | — | |
| | Futures commissions merchant interest expense | | | 80 | | | | — | | | | — | |
| | Total expenses | | | 439,910 | | | | 537,483 | | | | 72,548 | |
| | Fees (waived) recouped by the Adviser | | | — | | | | (35,947 | ) | | | (53,332 | ) |
| | Net expenses | | | 439,910 | | | | 501,536 | | | | 19,216 | |
| | Net investment income (loss) | | | 2,109,156 | | | | 3,199,737 | | | | 137,501 | |
| | | | | | | | | | | | | | |
| | REALIZED AND UNREALIZED GAIN (LOSS) ON INVESTMENTS | | | | | | | | | | | | |
| | Net realized gain (loss) on: | | | | | | | | | | | | |
| | Investments | | | (4,413,399 | ) | | | (9,996,819 | ) | | | (269,377 | ) |
| | Affiliated investments | | | — | | | | — | | | | — | |
| | Futures contracts | | | 61,642 | | | | — | | | | — | |
| | Change in net unrealized appreciation/depreciation on: | | | | | | | | | | | | |
| | Investments | | | (1,714,966 | ) | | | 3,625,024 | | | | 74,710 | |
| | Affiliated investments | | | — | | | | — | | | | — | |
| | Futures contracts | | | — | | | | — | | | | — | |
| | Net realized and unrealized gain (loss) on investments | | | (6,066,723 | ) | | | (6,371,795 | ) | | | (194,667 | ) |
| | Net increase (decrease) in net assets resulting from operations | | $ | (3,957,567 | ) | | $ | (3,172,058 | ) | | $ | (57,166 | ) |
The accompanying Notes to Financial Statements are an integral part of these financial statements.
Osterweis Fund | Statements of Changes in Net Assets
| | | | Six Months Ended | | | | |
| | | September 30, 2023 | | Year Ended | |
| | | | (Unaudited) | | | March 31, 2023 | |
| | INCREASE (DECREASE) IN NET ASSETS FROM: | | | | | | |
| | OPERATIONS | | | | | | |
| | Net investment income (loss) | | $ | 279,347 | | | $ | 521,033 | |
| | Net realized gain (loss) on investments and distributions | | | 6,050,009 | | | | (1,370,325 | ) |
| | Change in net unrealized appreciation/depreciation of investments | | | (3,964,719 | ) | | | (17,250,533 | ) |
| | Net increase (decrease) in net assets resulting from operations | | | 2,364,637 | | | | (18,099,825 | ) |
| | | | | | | | | | |
| | DISTRIBUTIONS TO SHAREHOLDERS | | | | | | | | |
| | Net distributions to shareholders | | | — | | | | (9,739,072 | ) |
| | | | | | | | | | |
| | CAPITAL SHARE TRANSACTIONS | | | | | | | | |
| | Net increase (decrease) in net assets derived from net change in outstanding shares 1 | | | (8,912,832 | ) | | | (9,397,072 | ) |
| | Total increase (decrease) in net assets | | | (6,548,195 | ) | | | (37,235,969 | ) |
| | | | | | | | | | |
| | NET ASSETS | | | | | | | | |
| | Beginning of period/year | | | 139,725,721 | | | | 176,961,690 | |
| | End of period/year | | $ | 133,177,526 | | | $ | 139,725,721 | |
| | 1 | A summary of share transactions is as follows: |
| | | | Six Months Ended | | | | | | | |
| | | | September 30, 2023 | | | Year Ended | |
| | | | (Unaudited) | | | March 31, 2023 | |
| | | | Shares | | | Value | | | Shares | | | Value | |
| | Shares sold | | | 67,532 | | | $ | 1,189,551 | | | | 357,233 | | | $ | 6,032,281 | |
| | Shares issued in reinvestment of distributions | | | — | | | | — | | | | 571,975 | | | | 9,260,278 | |
| | Shares redeemed | | | (571,508 | ) | | | (10,102,383 | ) | | | (1,398,115 | ) | | | (24,689,631 | ) |
| | Net increase (decrease) | | | (503,976 | ) | | $ | (8,912,832 | ) | | | (468,907 | ) | | $ | (9,397,072 | ) |
The accompanying Notes to Financial Statements are an integral part of these financial statements.
Strategic Income Fund | Statements of Changes in Net Assets
| | | | Six Months Ended | | | | |
| | | September 30, 2023 | | Year Ended | |
| | | | (Unaudited) | | | March 31, 2023 | |
| | INCREASE (DECREASE) IN NET ASSETS FROM: | | | | | | |
| | OPERATIONS | | | | | | |
| | Net investment income (loss) | | $ | 144,877,095 | | | $ | 228,362,907 | |
| | Net realized gain (loss) on investments and distributions | | | (23,462,053 | ) | | | 3,317,196 | |
| | Change in unrealized appreciation/depreciation on investments | | | 76,895,481 | | | | (326,091,714 | ) |
| | Change in unrealized appreciation/depreciation on affiliated investments | | | (6,060,320 | ) | | | (9,958,368 | ) |
| | Net increase (decrease) in net assets resulting from operations | | | 192,250,203 | | | | (104,369,979 | ) |
| | | | | | | | | | |
| | DISTRIBUTIONS TO SHAREHOLDERS | | | | | | | | |
| | Net distributions to shareholders | | | (144,561,443 | ) | | | (230,705,874 | ) |
| | | | | | | | | | |
| | CAPITAL SHARE TRANSACTIONS | | | | | | | | |
| | Net increase (decrease) in net assets derived from net change in outstanding shares 1 | | | (24,193,756 | ) | | | (361,850,022 | ) |
| | Total increase (decrease) in net assets | | | 23,495,004 | | | | (696,925,875 | ) |
| | | | | | | | | | |
| | NET ASSETS | | | | | | | | |
| | Beginning of period/year | | | 4,693,135,941 | | | | 5,390,061,816 | |
| | End of period/year | | $ | 4,716,630,945 | | | $
| 4,693,135,941 | |
| | 1 | A summary of share transactions is as follows: |
| | | | Six Months Ended | | | | | | | |
| | | | September 30, 2023 | | | Year Ended | |
| | | | (Unaudited) | | | March 31, 2023 | |
| | | | Shares | | | Value | | | Shares | | | Value | |
| | Shares sold | | | 47,213,519 | | | $ | 500,909,208 | | | | 145,973,792 | | | $ | 1,539,672,572 | |
| | Shares issued in reinvestment of distributions | | | 12,027,233 | | | | 127,236,046 | | | | 19,679,719 | | | | 204,043,520 | |
| | Shares redeemed | | | (61,437,828 | ) | | | (652,339,010 | ) | | | (200,632,808 | ) | | | (2,105,566,114 | ) |
| | Net increase (decrease) | | | (2,197,076 | ) | | $ | (24,193,756 | ) | | | (34,979,297 | ) | | $ | (361,850,022 | ) |
The accompanying Notes to Financial Statements are an integral part of these financial statements.
Growth & Income Fund | Statements of Changes in Net Assets
| | | | Six Months Ended | | | | |
| | | September 30, 2023 | | Year Ended | |
| | | | (Unaudited) | | | March 31, 2023 | |
| | INCREASE (DECREASE) IN NET ASSETS FROM: | | | | | | |
| | OPERATIONS | | | | | | |
| | Net investment income (loss) | | $ | 2,353,185 | | | $ | 3,190,763 | |
| | Net realized gain (loss) on investments and distributions | | | 2,395,376 | | | | 244,495 | |
| | Change in net unrealized appreciation/depreciation of investments | | | (3,425,284 | ) | | | (16,205,466 | ) |
| | Change in unrealized appreciation/depreciation on affiliated investments | | | (123,680 | ) | | | (203,232 | ) |
| | Net increase (decrease) in net assets resulting from operations | | | 1,199,597 | | | | (12,973,440 | ) |
| | | | | | | | | | |
| | DISTRIBUTIONS TO SHAREHOLDERS | | | | | | | | |
| | Net distributions to shareholders | | | (2,328,532 | ) | | | (12,505,014 | ) |
| | | | | | | | | | |
| | CAPITAL SHARE TRANSACTIONS | | | | | | | | |
| | Net increase (decrease) in net assets derived from net change in outstanding shares 1 | | | 6,144,670 | | | | 6,333,445 | |
| | Total increase (decrease) in net assets | | | 5,015,735 | | | | (19,145,009 | ) |
| | | | | | | | | | |
| | NET ASSETS | | | | | | | | |
| | Beginning of period/year | | | 151,891,524 | | | | 171,036,533 | |
| | End of period/year | | $ | 156,907,259 | | | $ | 151,891,524 | |
| | 1 | A summary of share transactions is as follows: |
| | | | Six Months Ended | | | | | | | |
| | | | September 30, 2023 | | | Year Ended | |
| | | | (Unaudited) | | | March 31, 2023 | |
| | | | Shares | | | Value | | | Shares | | | Value | |
| | Shares sold | | | 787,903 | | | $ | 12,091,972 | | | | 684,256 | | | $ | 10,863,406 | |
| | Shares issued in reinvestment of distributions | | | 115,215 | | | | 1,783,579 | | | | 617,056 | | | | 9,271,392 | |
| | Shares redeemed | | | (497,977 | ) | | | (7,730,881 | ) | | | (881,411 | ) | | | (13,801,353 | ) |
| | Net increase (decrease) | | | 405,141 | | | $ | 6,144,670 | | | | 419,901 | | | $ | 6,333,445 | |
The accompanying Notes to Financial Statements are an integral part of these financial statements.
Emerging Opportunity Fund | Statements of Changes in Net Assets
| | | | Six Months Ended | | | | |
| | | September 30, 2023 | | Year Ended | |
| | | | (Unaudited) | | | March 31, 2023 | |
| | INCREASE (DECREASE) IN NET ASSETS FROM: | | | | | | |
| | OPERATIONS | | | | | | |
| | Net investment income (loss) | | $ | (390,725 | ) | | $ | (1,040,655 | ) |
| | Net realized gain (loss) on investments and distributions | | | 3,828,299 | | | | (26,974,002 | ) |
| | Change in unrealized appreciation/depreciation on investments | | | (2,154,510 | ) | | | 9,811,152 | |
| | Net increase (decrease) in net assets resulting from operations | | | 1,283,064 | | | | (18,203,505 | ) |
| | | | | | | | | | |
| | DISTRIBUTIONS TO SHAREHOLDERS | | | | | | | | |
| | Net distributions to shareholders | | | — | | | | — | |
| | | | | | | | | | |
| | CAPITAL SHARE TRANSACTIONS | | | | | | | | |
| | Net increase (decrease) in net assets derived from net change in outstanding shares 1 | | | (5,412,177 | ) | | | 22,073,773 | |
| | Total increase (decrease) in net assets | | | (4,129,113 | ) | | | 3,870,268 | |
| | | | | | | | | | |
| | NET ASSETS | | | | | | | | |
| | Beginning of period/year | | | 198,035,251 | | | | 194,164,983 | |
| | End of period/year | | $ | 193,906,138 | | | $ | 198,035,251 | |
| | 1 | A summary of share transactions is as follows: |
| | | | Six Months Ended | | | | | | | |
| | | | September 30, 2023 | | | Year Ended | |
| | | | (Unaudited) | | | March 31, 2023 | |
| | | | Shares | | | Value | | | Shares | | | Value | |
| | Shares sold | | | 910,032 | | | $ | 11,818,626 | | | | 5,330,670 | | | $ | 63,569,915 | |
| | Shares issued in reinvestment of distributions | | | — | | | | — | | | | — | | | | — | |
| | Shares redeemed | | | (1,316,305 | ) | | | (17,230,803 | ) | | | (3,466,267 | ) | | | (41,496,142 | ) |
| | Net increase (decrease) | | | (406,273 | ) | | $ | (5,412,177 | ) | | | 1,864,403 | | | $ | 22,073,773 | |
The accompanying Notes to Financial Statements are an integral part of these financial statements.
Total Return Fund | Statements of Changes in Net Assets
| | | | Six Months Ended | | | | |
| | | September 30, 2023 | | Year Ended | |
| | | | (Unaudited) | | | March 31, 2023 | |
| | INCREASE (DECREASE) IN NET ASSETS FROM: | | | | | | |
| | OPERATIONS | | | | | | |
| | Net investment income (loss) | | $ | 2,109,156 | | | $ | 2,254,765 | |
| | Net realized gain (loss) on investments and futures contracts | | | (4,351,757 | ) | | | (5,741,175 | ) |
| | Change in net unrealized appreciation/depreciation on investments and futures contracts | | | (1,714,966 | ) | | | 2,786,375 | |
| | Net increase (decrease) in net assets resulting from operations | | | (3,957,567 | ) | | | (700,035 | ) |
| | | | | | | | | | |
| | DISTRIBUTIONS TO SHAREHOLDERS | | | | | | | | |
| | Net distributions to shareholders | | | (2,138,857 | ) | | | (2,248,460 | )1 |
| | | | | | | | | | |
| | CAPITAL SHARE TRANSACTIONS | | | | | | | | |
| | Net increase (decrease) in net assets derived from net change in outstanding shares 1 | | | (1,986,360 | ) | | | (13,162,756 | ) |
| | Total increase (decrease) in net assets | | | (8,082,784 | ) | | | (16,111,251 | ) |
| | | | | | | | | | |
| | NET ASSETS | | | | | | | | |
| | Beginning of period/year | | | 133,436,337 | | | | 149,547,588 | |
| | End of period/year | | $ | 125,353,553 | | | $
| 133,436,337 | |
| | 1 | A summary of share transactions is as follows: |
| | | | Six Months Ended | | | | | | | |
| | | | September 30, 2023 | | | Year Ended | |
| | | | (Unaudited) | | | March 31, 2023 | |
| | | | Shares | | | Value | | | Shares | | | Value | |
| | Shares sold | | | 1,196,108 | | | $ | 11,345,609 | | | | 8,049,230 | | | $ | 76,024,068 | |
| | Shares issued in reinvestment of distributions | | | 125,488 | | | | 1,178,385 | | | | 129,866 | | | | 1,227,150 | |
| | Shares redeemed | | | (1,537,946 | ) | | | (14,510,354 | ) | | | (9,564,826 | ) | | | (90,413,974 | ) |
| | Net increase (decrease) | | | (216,350 | ) | | $ | (1,986,360 | ) | | | (1,385,730 | ) | | $ | (13,162,756 | ) |
The accompanying Notes to Financial Statements are an integral part of these financial statements.
Short Duration Credit Fund | Statements of Changes in Net Assets
| | | | Six Months Ended | | | | | | | |
| | | September 30, 2023 | | Period Ended | | | Year Ended | |
| | | | (Unaudited) | | | March 31, 2023 2 | | | April 30, 2022 | |
| | INCREASE (DECREASE) IN NET ASSETS FROM: | | | | | | | | | |
| | OPERATIONS | | | | | | | | | |
| | Net investment income (loss) | | $ | 3,199,737 | | | $ | 11,839,601 | | | $ | 10,355,856 | |
| | Net realized gain (loss) on investments and distributions | | | (9,996,819 | ) | | | (25,872,101 | ) | | | 1,618,162 | |
| | Change in unrealized appreciation/depreciation on investments | | | 3,625,024 | | | | 4,526,788 | | | | (14,491,254 | ) |
| | Net increase (decrease) in net assets resulting from operations | | | (3,172,058 | ) | | | (9,505,712 | ) | | | (2,517,236 | ) |
| | | | | | | | | | | | | | |
| | DISTRIBUTIONS TO SHAREHOLDERS | | | | | | | | | | | | |
| | Net distributions to shareholders | | | (3,172,058 | ) | | | (11,910,126 | ) | | | (10,226,272 | ) |
| | | | | | | | | | | | | | |
| | CAPITAL SHARE TRANSACTIONS | | | | | | | | | | | | |
| | Net increase (decrease) in net assets derived from | | | | | | | | | | | | |
| | net change in outstanding shares 1 | | | (105,366,185 | ) | | | (22,297,366 | ) | | | (438,877 | ) |
| | Total increase (decrease) in net assets | | | (111,773,079 | ) | | | (43,713,204 | ) | | | (13,182,385 | ) |
| | | | | | | | | | | | | | |
| | NET ASSETS | | | | | | | | | | | | |
| | Beginning of period/year | | | 173,897,763 | | | | 217,610,967 | | | | 230,793,352 | |
| | End of period/year | | $ | 62,124,684 | | | $ | 173,897,763 | | | $ | 217,610,967 | |
| | 1 | A summary of share transactions is as follows: |
| | | | Six Months Ended | | | Period Ended | | | Year Ended | |
| | | | September 30, 2023 | | | March 31, 2023 2 | | | April 30, 2022 | |
| | | | Shares | | | Value | | | Shares | | | Value | | | Shares | | | Value | |
| | Shares sold | | | 794,352 | | | $ | 6,233,455 | | | | 4,720,933 | | | $ | 40,101,066 | | | | 7,806,845 | | | $ | 75,005,512 | |
| | Shares issued in reinvestment | | | | | | | | | | | | | | | | | | | | | | | | |
| | of distributions | | | 369,092 | | | | 2,881,703 | | | | 1,289,565 | | | | 10,877,999 | | | | 963,283 | | | | 9,238,077 | |
| | Shares redeemed | | | (14,452,139 | ) | | | (114,481,343 | ) | | | (8,599,259 | ) | | | (73,276,431 | ) | | | (8,789,923 | ) | | | (84,682,466 | ) |
| | Net increase (decrease) | | | (13,288,695 | ) | | $ | (105,366,185 | ) | | | (2,588,761 | ) | | $ | (22,297,366 | ) | | | (19,795 | ) | | $ | (438,877 | ) |
| | 2 | The Osterweis Short Duration Credit Fund changed fiscal year end from April 30 to March 31 effective close of business October 7, 2022. Amounts shown reflect the activity for the 17 months ended March 31, 2023. 2022 information is presented for the Fund due to the fiscal year end change. |
The accompanying Notes to Financial Statements are an integral part of these financial statements.
Sustainable Credit Fund | Statements of Changes in Net Assets
| | | | Six Months Ended | | | | | | | |
| | | September 30, 2023 | | Period Ended | | | Year Ended | |
| | | | (Unaudited) | | | March 31, 2023 2 | | | April 30, 2022 | |
| | INCREASE (DECREASE) IN NET ASSETS FROM: | | | | | | | | | |
| | OPERATIONS | | | | | | | | | |
| | Net investment income (loss) | | $ | 137,501 | | | $ | 418,362 | | | $ | 447,597 | |
| | Net realized gain (loss) on investments and distributions | | | (269,377 | ) | | | (923,199 | ) | | | 420,078 | |
| | Change in unrealized appreciation/depreciation on investments | | | 74,710 | | | | 245,987 | | | | (659,019 | ) |
| | Net increase (decrease) in net assets resulting from operations | | | (57,166 | ) | | | (258,850 | ) | | | 208,656 | |
| | | | | | | | | | | | | | |
| | DISTRIBUTIONS TO SHAREHOLDERS | | | | | | | | | | | | |
| | Net distributions to shareholders | | | (145,119 | ) | | | (426,645 | ) | | | (443,074 | ) |
| | | | | | | | | | | | | | |
| | CAPITAL SHARE TRANSACTIONS | | | | | | | | | | | | |
| | Net increase (decrease) in net assets derived from | | | | | | | | | | | | |
| | net change in outstanding shares 1 | | | (801,899 | ) | | | (925,980 | ) | | | (12,800,565 | ) |
| | Total increase (decrease) in net assets | | | (1,004,184 | ) | | | (1,611,475 | ) | | | (13,034,983 | ) |
| | | | | | | | | | | | | | |
| | NET ASSETS | | | | | | | | | | | | |
| | Beginning of period/year | | | 4,792,359 | | | | 6,403,834 | | | | 19,438,817 | |
| | End of period/year | | $ | 3,788,175 | | | $ | 4,792,359 | | | $ | 6,403,834 | |
| | 1 | A summary of share transactions is as follows: |
| | | | Six Months Ended | | | Period Ended | | | Year Ended | |
| | | | September 30, 2023 | | | March 31, 2023 2 | | | April 30, 2022 | |
| | | | Shares | | | Value | | | Shares | | | Value | | | Shares | | | Value | |
| | Shares sold | | | 55,693 | | | $ | 438,656 | | | | 501,552 | | | $ | 4,241,128 | | | | 262,363 | | | $ | 2,552,463 | |
| | Shares issued in reinvestment | | | | | | | | | | | | | | | | | | | | | | | | |
| | of distributions | | | 16,631 | | | | 128,420 | | | | 35,936 | | | | 302,572 | | | | 35,349 | | | | 341,096 | |
| | Shares redeemed | | | (172,944 | ) | | | (1,368,975 | ) | | | (644,382 | ) | | | (5,469,680 | ) | | | (1,607,980 | ) | | | (15,694,124 | ) |
| | Net increase (decrease) | | | (100,620 | ) | | $ | (801,899 | ) | | | (106,894 | ) | | $ | (925,980 | ) | | | (1,310,268 | ) | | $ | (12,800,565 | ) |
| | 2 | The Osterweis Sustainable Credit Fund changed fiscal year end from April 30 to March 31 effective close of business October 7, 2022. Amounts shown reflect the activity for the 17 months ended March 31, 2023. 2022 information is presented for the Fund due to the fiscal year end change. |
The accompanying Notes to Financial Statements are an integral part of these financial statements.
Osterweis Fund | Financial Highlights
For a capital share outstanding throughout each period/year
| | | | Six Months | | | | | | | | | | | | | | | | |
| | | | Ended | | | | | | | | | | | | | | | | |
| | | | September 30, | | | Year Ended March 31, | |
| | | | 2023 | |
| | | | (Unaudited) | | | | 2023 | | | | 2022 | | | | 2021 | | | | 2020 | | | | 2019 | |
| | Net asset value, beginning of period/year | | $ | 16.99 | | | $ | 20.36 | | | $ | 21.34 | | | $ | 14.68 | | | $ | 16.25 | | | $ | 19.15 | |
| | | | | | | | | | | | | | | | | | | | | | | | | | |
| | INCOME FROM INVESTMENT OPERATIONS: | | | | | | | | | | | | | | | | | |
| | Net investment income (loss) 1 | | | 0.04 | | | | 0.06 | | | | (0.02 | ) | | | 0.03 | | | | 0.04 | | | | 0.08 | |
| | Net realized and unrealized | | | | | | | | | | | | | | | | | | | | | | | | |
| | gain (loss) on investments | | | 0.22 | | | | (2.18 | ) | | | 1.33 | | | | 7.75 | | | | (0.31 | ) | | | 1.24 | |
| | Total from investment operations | | | 0.26 | | | | (2.12 | ) | | | 1.31 | | | | 7.78 | | | | (0.27 | ) | | | 1.32 | |
| | | | | | | | | | | | | | | | | | | | | | | | | | |
| | LESS DISTRIBUTIONS: | | | | | | | | | | | | | | | | | | | | | | | | |
| | From net investment income | | | — | | | | — | | | | (0.19 | ) | | | (0.10 | ) | | | (0.07 | ) | | | (0.76 | ) |
| | From net realized gain | | | — | | | | (1.25 | ) | | | (2.10 | ) | | | (1.02 | ) | | | (1.23 | ) | | | (3.46 | ) |
| | Total distributions | | | — | | | | (1.25 | ) | | | (2.29 | ) | | | (1.12 | ) | | | (1.30 | ) | | | (4.22 | ) |
| | Net asset value, end of period/year | | $ | 17.25 | | | $ | 16.99 | | | $ | 20.36 | | | $ | 21.34 | | | $ | 14.68 | | | $ | 16.25 | |
| | Total return | | | 1.53 | %2 | | | (10.12 | )% | | | 5.49 | % | | | 53.48 | % | | | (2.88 | )% | | | 9.68 | % |
| | | | | | | | | | | | | | | | | | | | | | | | | | |
| | SUPPLEMENTAL DATA: | | | | | | | | | | | | | | | | | | | | | | | | |
| | Net assets, end of period/year (millions) | | $ | 133.2 | | | $ | 139.7 | | | $ | 177.0 | | | $ | 168.9 | | | $ | 110.8 | | | $ | 128.5 | |
| | Portfolio turnover rate | | | 13 | %2 | | | 54 | % | | | 38 | % | | | 37 | % | | | 35 | % | | | 43 | % |
| | | | | | | | | | | | | | | | | | | | | | | | | | |
| | RATIOS OF EXPENSES TO AVERAGE NET ASSETS: | | | | | | | | | | | | | | | | | |
| | Before fees/expenses waived or recouped | | | 0.91 | %3 | | | 0.92 | % | | | 0.96 | % | | | 1.19 | % | | | 1.19 | % | | | 1.17 | % |
| | After fees/expenses waived or recouped | | | 0.95 | %3 | | | 0.95 | % | | | 0.95 | % | | | 0.95 | % | | | 0.95 | % | | | 0.95 | %4 |
| | | | | | | | | | | | | | | | | | | | | | | | | | |
| | RATIOS OF NET INVESTMENT INCOME TO AVERAGE NET ASSETS: | | | | | | | | | | | | | |
| | Before fees/expenses waived or recouped | | | 0.44 | %3 | | | 0.39 | % | | | (0.08 | )% | | | (0.08 | )% | | | (0.02 | )% | | | 0.21 | % |
| | After fees/expenses waived or recouped | | | 0.40 | %3 | | | 0.36 | % | | | (0.07 | )% | | | 0.16 | % | | | 0.22 | % | | | 0.43 | %4 |
1 | Calculated based on average shares outstanding during the period. |
2 | Not Annualized. |
3 | Annualized. |
4 | Effective January 1, 2018 the Adviser agreed to contractually limit expenses for the Fund to not exceed 0.95% of average net assets. Prior to January 1, 2018, Fund expenses were not subject to an expense limitation agreement. |
The accompanying Notes to Financial Statements are an integral part of these financial statements.
Strategic Income Fund | Financial Highlights
For a capital share outstanding throughout each period/year
| | | | Six Months | | | | | | | | | | | | | | | | |
| | | | Ended | | | | | | | | | | | | | | | | |
| | | | September 30, | | | Year Ended March 31, | |
| | | | 2023 | |
| | | | (Unaudited) | | | | 2023 | | | | 2022 | | | | 2021 | | | | 2020 | | | | 2019 | |
| | Net asset value, beginning of period/year | | $ | 10.46 | | | $ | 11.15 | | | $ | 11.37 | | | $ | 9.97 | | | $ | 11.05 | | | $ | 11.27 | |
| | | | | | | | | | | | | | | | | | | | | | | | | | |
| | INCOME FROM INVESTMENT OPERATIONS: | | | | | | | | | | | | | |
| | Net investment income (loss) 1 | | | 0.32 | | | | 0.50 | | | | 0.47 | | | | 0.45 | | | | 0.47 | | | | 0.50 | |
| | Net realized and unrealized | | | | | | | | | | | | | | | | | | | | | | | | |
| | gain (loss) on investments | | | (0.12 | ) | | | (0.68 | ) | | | (0.22 | ) | | | 1.40 | | | | (1.06 | ) | | | (0.21 | ) |
| | Total from investment operations | | | 0.44 | | | | (0.18 | ) | | | 0.25 | | | | 1.85 | | | | (0.59 | ) | | | 0.29 | |
| | | | | | | | | | | | | | | | | | | | | | | | | | |
| | LESS DISTRIBUTIONS: | | | | | | | | | | | | | | | | | | | | | | | | |
| | From net investment income | | | (0.33 | ) | | | (0.51 | ) | | | (0.47 | ) | | | (0.45 | ) | | | (0.49 | ) | | | (0.51 | ) |
| | Total distributions | | | (0.33 | ) | | | (0.51 | ) | | | (0.47 | ) | | | (0.45 | ) | | | (0.49 | ) | | | (0.51 | ) |
| | Net asset value, end of period/year | | $ | 10.57 | | | $ | 10.46 | | | $ | 11.15 | | | $ | 11.37 | | | $ | 9.97 | | | $ | 11.05 | |
| | Total return | | | 4.19 | %2 | | | (1.49 | )% | | | 2.13 | % | | | 18.73 | % | | | (5.63 | )% | | | 2.67 | % |
| | | | | | | | | | | | | | | | | | | | | | | | | | |
| | SUPPLEMENTAL DATA: | | | | | | | | | | | | | | | | | | | | | | | | |
| | Net assets, end of period/year (millions) | | $ | 4,716.6 | | | $ | 4,693.1 | | | $ | 5,390.1 | | | $ | 5,203.9 | | | $ | 3,995.6 | | | $ | 5,541.4 | |
| | Portfolio turnover rate | | | 9 | %2 | | | 10 | % | | | 49 | % | | | 60 | % | | | 40 | % | | | 46 | % |
| | | | | | | | | | | | | | | | | | | | | | | | | | |
| | RATIO OF EXPENSES TO AVERAGE NET ASSETS: | | | | | | | | | | | | | | | | | |
| | Ratio of expenses to average net assets | | | 0.85 | %3 | | | 0.85 | % | | | 0.84 | % | | | 0.86 | % | | | 0.86 | % | | | 0.84 | % |
| | | | | | | | | | | | | | | | | | | | | | | | | | |
| | RATIO OF NET INVESTMENT INCOME TO AVERAGE NET ASSETS: | | | | | | | | | | | | | |
| | Ratio of net investment income | | | | | | | | | | | | | | | | | | | | | | | | |
| | to average net assets | | | 6.08 | %3 | | | 4.74 | % | | | 4.10 | % | | | 4.14 | % | | | 4.32 | % | | | 4.52 | % |
1 | Calculated based on average shares outstanding during the period. |
2 | Not Annualized. |
3 | Annualized. |
The accompanying Notes to Financial Statements are an integral part of these financial statements.
Growth & Income Fund | Financial Highlights
For a capital share outstanding throughout each period/year
| | | | Six Months | | | | | | | | | | | | | | | | |
| | | | Ended | | | | | | | | | | | | | | | | |
| | | | September 30, | | | Year Ended March 31, | |
| | | | 2023 | |
| | | | (Unaudited) | | | | 2023 | | | | 2022 | | | | 2021 | | | | 2020 | | | | 2019 | |
| | Net asset value, beginning of period/year | | $ | 15.22 | | | $ | 17.89 | | | $ | 17.98 | | | $ | 13.02 | | | $ | 14.30 | | | $ | 14.87 | |
| | | | | | | | | | | | | | | | | | | | | | | | | | |
| | INCOME FROM INVESTMENT OPERATIONS: | | | | | | | | | | | | | |
| | Net investment income (loss) 1 | | | 0.23 | | | | 0.33 | | | | 0.27 | | | | 0.23 | | | | 0.23 | | | | 0.28 | |
| | Net realized and unrealized | | | | | | | | | | | | | | | | | | | | | | | | |
| | gain (loss) on investments | | | (0.12 | ) | | | (1.68 | ) | | | 1.10 | | | | 5.35 | | | | (0.96 | ) | | | 0.44 | |
| | Total from investment operations | | | 0.11 | | | | (1.35 | ) | | | 1.37 | | | | 5.58 | | | | (0.73 | ) | | | 0.72 | |
| | | | | | | | | | | | | | | | | | | | | | | | | | |
| | LESS DISTRIBUTIONS: | | | | | | | | | | | | | | | | | | | | | | | | |
| | From net investment income | | | (0.22 | ) | | | (0.31 | ) | | | (0.54 | ) | | | (0.11 | ) | | | (0.18 | ) | | | (0.37 | ) |
| | From net realized gain | | | — | | | | (1.01 | ) | | | (0.92 | ) | | | (0.51 | ) | | | (0.37 | ) | | | (0.92 | ) |
| | Total distributions | | | (0.22 | ) | | | (1.32 | ) | | | (1.46 | ) | | | (0.62 | ) | | | (0.55 | ) | | | (1.29 | ) |
| | Net asset value, end of period/year | | $ | 15.11 | | | $ | 15.22 | | | $ | 17.89 | | | $ | 17.98 | | | $ | 13.02 | | | $ | 14.30 | |
| | Total return | | | 0.71 | %2 | | | (7.33 | )% | | | 7.46 | % | | | (43.15 | )% | | | (5.67 | )% | | | 5.69 | % |
| | | | | | | | | | | | | | | | | | | | | | | | | | |
| | SUPPLEMENTAL DATA: | | | | | | | | | | | | | | | | | | | | | | | | |
| | Net assets, end of period/year (millions) | | $ | 156.9 | | | $ | 151.9 | | | $ | 171.0 | | | $ | 157.3 | | | $ | 110.0 | | | $ | 131.7 | |
| | Portfolio turnover rate | | | 15 | %2 | | | 33 | % | | | 34 | % | | | 51 | % | | | 51 | % | | | 47 | % |
| | | | | | | | | | | | | | | | | | | | | | | | | | |
| | RATIO OF EXPENSES TO AVERAGE NET ASSETS: | | | | | | | | | |
| | Ratio of expenses to average net assets | | | 0.90 | %3 | | | 0.93 | % | | | 0.97 | % | | | 1.19 | % | | | 1.20 | % | | | 1.19 | % |
| | | | | | | | | | | | | | | | | | | | | | | | | | |
| | RATIO OF NET INVESTMENT INCOME TO AVERAGE NET ASSETS: | | | | | | | | | |
| | Ratio of net investment income | | | | | | | | | | | | | | | | | | | | | | | | |
| | to average net assets | | | 2.94 | %3 | | | 2.07 | % | | | 1.44 | % | | | 1.44 | % | | | 1.57 | % | | | 1.91 | % |
1 | Calculated based on average shares outstanding during the period. |
2 | Not Annualized. |
3 | Annualized. |
The accompanying Notes to Financial Statements are an integral part of these financial statements.
Emerging Opportunity Fund | Financial Highlights
For a capital share outstanding throughout each period/year
| | | | Six Months | | | | | | | | | | | | | | | | |
| | | | Ended | | | | | | | | | | | | | | | | |
| | | | September 30, | | | Year Ended March 31, | |
| | | | 2023 | |
| | | | (Unaudited) | | | | 2023 | | | | 2022 | | | | 2021 | | | | 2020 | | | | 2019 | |
| | Net asset value, beginning of period/year | | $ | 12.62 | | | $ | 14.04 | | | $ | 19.99 | | | $ | 10.48 | | | $ | 12.06 | | | $ | 11.73 | |
| | | | | | | | | | | | | | | | | | | | | | | | | | |
| | INCOME FROM INVESTMENT OPERATIONS: | | | | | | | | | | | | | |
| | Net investment income (loss) 1 | | | (0.03 | ) | | | (0.07 | ) | | | (0.19 | ) | | | (0.18 | ) | | | (0.10 | ) | | | (0.11 | ) |
| | Net realized and unrealized | | | | | | | | | | | | | | | | | | | | | | | | |
| | gain (loss) on investments | | | 0.10 | | | | (1.35 | ) | | | (2.08 | ) | | | 11.81 | | | | (0.70 | ) | | | 1.25 | |
| | Total from investment operations | | | 0.07 | | | | (1.42 | ) | | | (2.27 | ) | | | 11.63 | | | | (0.80 | ) | | | 1.14 | |
| | | | | | | | | | | | | | | | | | | | | | | | | | |
| | LESS DISTRIBUTIONS: | | | | | | | | | | | | | | | | | | | | | | | | |
| | From net realized gain | | | — | | | | — | | | | (3.68 | ) | | | (2.12 | ) | | | (0.78 | ) | | | (0.81 | ) |
| | Total distributions | | | — | | | | — | | | | (3.68 | ) | | | (2.12 | ) | | | (0.78 | ) | | | (0.81 | ) |
| | Net asset value, end of period/year | | $ | 12.69 | | | $ | 12.62 | | | $ | 14.04 | | | $ | 19.99 | | | $ | 10.48 | | | $ | 12.06 | |
| | Total return | | | 0.55 | %2 | | | (10.18 | )% | | | (14.14 | )% | | | 111.27 | % | | | (7.60 | )% | | | 11.12 | % |
| | | | | | | | | | | | | | | | | | | | | | | | | | |
| | SUPPLEMENTAL DATA: | | | | | | | | | | | | | | | | | | | | | | | | |
| | Net asset value, end of period/year (millions) | $ | 193.9 | | | $ | 198.0 | | | $ | 194.2 | | | $ | 231.7 | | | $ | 90.2 | | | $ | 97.0 | |
| | Portfolio turnover rate | | | 45 | %2 | | | 124 | % | | | 133 | % | | | 111 | % | | | 213 | % | | | 215 | % |
| | | | | | | | | | | | | | | | | | | | | | | | | | |
| | RATIOS OF EXPENSES TO AVERAGE NET ASSETS: | | | | | | | | | | | | | |
| | Before fees/expenses waived or recouped | | | 1.17 | %3 | | | 1.22 | % | | | 1.17 | % | | | 1.19 | % | | | 1.24 | % | | | 1.22 | % |
| | After fees/expenses waived or recouped | | | 1.10 | %3 | | | 1.10 | % | | | 1.10 | % | | | 1.10 | % | | | 1.13 | %5 | | | 1.25 | %4 |
| | | | | | | | | | | | | | | | | | | | | | | | | | |
| | RATIOS OF NET INVESTMENT LOSS TO AVERAGE NET ASSETS: | | | | | | | | | |
| | Before fees/expenses waived or recouped | | | (0.46 | )%3 | | | (0.70 | )% | | | (1.05 | )% | | | (1.08 | )% | | | (0.88 | )% | | | (0.88 | )% |
| | After fees/expenses waived or recouped | | | (0.39 | )%3 | | | (0.58 | )% | | | (0.98 | )% | | | (0.99 | )% | | | (0.77 | )%5 | | | (0.91 | )%4 |
1 | Calculated based on average shares outstanding during the period. |
2 | Not Annualized. |
3 | Annualized. |
4 | Effective June 30, 2017 the Adviser agreed to contractually limit expenses for the Fund to not exceed 1.25% of average net assets. Prior to June 30, 2017, Fund expenses were limited to 1.50% of average net assets. |
5 | Effective June 30, 2019 the Adviser agreed to contractually limit expenses for the Fund to not exceed 1.10% of average net assets. Prior to June 30, 2017, Fund expenses were limited to 1.25% of average net assets. |
The accompanying Notes to Financial Statements are an integral part of these financial statements.
Total Return Fund | Financial Highlights
For a capital share outstanding throughout each period/year
| | | | Six Months | | | | | | | | | | | | | | | | |
| | | | Ended | | | | | | | | | | | | | | | | |
| | | | September 30, | | | Year Ended March 31, | |
| | | | 2023 | |
| | | | (Unaudited) | | | | 2023 | | | | 2022 | | | | 2021 | | | | 2020 | | | | 2019 | |
| | Net asset value, beginning of period/year | | $ | 9.56 | | | $ | 9.75 | | | $ | 10.18 | | | $ | 10.08 | | | $ | 10.14 | | | $ | 9.93 | |
| | | | | | | | | | | | | | | | | | | | | | | | | | |
| | INCOME FROM INVESTMENT OPERATIONS: | | | | | | | | | | | | | |
| | Net investment income (loss) 1 | | | 0.15 | | | | 0.16 | | | | 0.06 | | | | 0.12 | | | | 0.26 | | | | 0.33 | |
| | Net realized and unrealized | | | | | | | | | | | | | | | | | | | | | | | | |
| | gain (loss) on investments | | | (0.44 | ) | | | (0.19 | ) | | | (0.40 | ) | | | 0.31 | | | | 0.01 | | | | 0.23 | |
| | Total from investment operations | | | (0.29 | ) | | | (0.03 | ) | | | (0.34 | ) | | | 0.43 | | | | 0.27 | | | | 0.56 | |
| | | | | | | | | | | | | | | | | | | | | | | | | | |
| | LESS DISTRIBUTIONS: | | | | | | | | | | | | | | | | | | | | | | | | |
| | From net investment income | | | (0.15 | ) | | | (0.16 | ) | | | (0.08 | ) | | | (0.14 | ) | | | (0.28 | ) | | | (0.34 | ) |
| | From net realized gain | | | — | | | | — | | | | (0.01 | ) | | | (0.19 | ) | | | (0.05 | ) | | | (0.01 | ) |
| | Total distributions | | | (0.15 | ) | | | (0.16 | ) | | | (0.09 | ) | | | (0.33 | ) | | | (0.33 | ) | | | (0.35 | ) |
| | Net asset value, end of period/year | | $ | 9.12 | | | $ | 9.56 | | | $ | 9.75 | | | $ | 10.18 | | | $ | 10.08 | | | $ | 10.14 | |
| | Total return | | | (3.04 | )%2 | | | (0.26 | )% | | | (3.41 | )% | | | 4.25 | % | | | 2.74 | % | | | 5.78 | % |
| | | | | | | | | | | | | | | | | | | | | | | | | | |
| | SUPPLEMENTAL DATA: | | | | | | | | | | | | | | | | | | | | | | | | |
| | Net asset value, end of period/year (millions) | | $ | 125.4 | | | $ | 133.4 | | | $ | 149.5 | | | $ | 210.1 | | | $ | 158.3 | | | $ | 106.6 | |
| | Portfolio turnover rate | | | 81 | %2 | | | 279 | % | | | 311 | % | | | 616 | % | | | 214 | % | | | 163 | % |
| | Portfolio turnover rate excluding | | | | | | | | | | | | | | | | | | | | | | | | |
| | to-be-announced (“TBA”) transactions 2 | | | 74 | %2,4 | | | 186 | % | | | 203 | % | | | — | % | | | — | % | | | 0 | % |
| | | | | | | | | | | | | | | | | | | | | | | | | | |
| | RATIOS OF EXPENSES TO AVERAGE NET ASSETS: | | | | | | | | | | | | | |
| | Before fees/expenses waived or recouped | | | 0.66 | %3 | | | 0.67 | % | | | 0.65 | % | | | 0.65 | % | | | 0.66 | % | | | 0.67 | % |
| | After fees/expenses waived or recouped | | | 0.66 | %3 | | | 0.67 | % | | | 0.65 | % | | | 0.65 | % | | | 0.66 | % | | | 0.67 | % |
| | | | | | | | | | | | | | | | | | | | | | | | | | |
| | RATIOS OF NET INVESTMENT INCOME (LOSS) TO AVERAGE NET ASSETS: | | | | | | | | | |
| | Before fees/expenses waived or recouped | | | 3.18 | %3 | | | 1.72 | % | | | 0.59 | % | | | 1.18 | % | | | 2.51 | % | | | 3.27 | % |
| | After fees/expenses waived or recouped | | | 3.18 | %3 | | | 1.72 | % | | | 0.59 | % | | | 1.18 | % | | | 2.51 | % | | | 3.26 | % |
1 | Calculated based on average shares outstanding during the period. |
2 | Not Annualized. |
3 | Annualized. |
4 | See Note (1.D.) and (1.E.) regarding TBA transactions and mortgage dollar rolls. |
The accompanying Notes to Financial Statements are an integral part of these financial statements.
Short Duration Credit Fund 1 | Financial Highlights
For a capital share outstanding throughout each period/year
| | | Six Months | | | | | | | | | | | | | | | | | | | |
| | | Ended | | | Period | | | | | | | | | | | | | | | | |
| | | September 30, | | | Ended | | | Year Ended April 30, | |
| | | 2023 | | | March 31, | |
| | | (Unaudited) | | | 2023 2 | | | | 2022 | | | | 2021 | | | | 2020 | | | | 2019 | | | | 2018 | |
| | Net asset value, beginning of year | $ | 8.17 | | | $ | 9.12 | | | $ | 9.66 | | | $ | 9.15 | | | $ | 9.99 | | | $ | 9.95 | | | $ | 9.97 | |
| | | | | | | | | | | | | | | | | | | | | | | | | | | | | |
| | INCOME FROM INVESTMENT OPERATIONS: | | | | | | | | | | | | | | | | | | | | | |
| | Net investment income (loss) 3 | | 0.24 | | | | 0.53 | | | | 0.43 | | | | 0.40 | | | | 0.39 | | | | 0.35 | | | | 0.25 | |
| | Net realized and unrealized | | | | | | | | | | | | | | | | | | | | | | | | | | | |
| | gain (loss) on investments | | (0.38 | ) | | | (0.94 | ) | | | (0.54 | ) | | | 0.53 | | | | (0.83 | ) | | | 0.03 | | | | (0.02 | ) |
| | Total from investment operations | | (0.14 | ) | | | (0.41 | ) | | | (0.11 | ) | | | 0.93 | | | | (0.44 | ) | | | 0.38 | | | | 0.23 | |
| | Paid-in-capital redemption fees | | — | | | | — | | | | 0.00 | 4 | | | 0.00 | 4 | | | 0.00 | 4 | | | 0.00 | 4 | | | 0.00 | 4 |
| | | | | | | | | | | | | | | | | | | | | | | | | | | | | |
| | LESS DISTRIBUTIONS: | | | | | | | | | | | | | | | | | | | | | | | | | | | |
| | From net investment income | | (0.25 | ) | | | (0.54 | ) | | | (0.43 | ) | | | (0.42 | ) | | | (0.40 | ) | | | (0.34 | ) | | | (0.25 | ) |
| | From net realized gain | | — | | | | — | | | | — | | | | — | | | | — | | | | — | | | | — | |
| | Total distributions | | (0.25 | ) | | | (0.54 | ) | | | (0.43 | ) | | | (0.42 | ) | | | (0.40 | ) | | | (0.34 | ) | | | (0.25 | ) |
| | Net asset value, end of period/year | $ | 7.78 | | | $ | 8.17 | | | $ | 9.12 | | | $ | 9.66 | | | $ | 9.15 | | | $ | 9.99 | | | $ | 9.95 | |
| | Total return | | (1.69 | )%5 | | | (4.53 | )%5 | | | (1.30 | )% | | | 10.33 | % | | | (4.63 | )% | | | 3.92 | % | | | 2.28 | % |
| | | | | | | | | | | | | | | | | | | | | | | | | | | | | |
| | SUPPLEMENTAL DATA: | | | | | | | | | | | | | | | | | | | | | | | | | | | |
| | Net assets, end of year (millions) | $ | 62.1 | | | $ | 173.9 | | | $ | 217.6 | | | $ | 230.8 | | | $ | 305.2 | | | $ | 377.4 | | | $ | 279.0 | |
| | Portfolio turnover rate | | 4 | %5 | | | 22 | %5 | | | 131 | % | | | 94 | % | | | 95 | % | | | 135 | % | | | 152 | % |
| | | | | | | | | | | | | | | | | | | | | | | | | | | | | |
| | RATIOS OF EXPENSES TO AVERAGE NET ASSETS: | | | | | | | | | | | | | | | | | |
| | Before fees/expenses | | | | | | | | | | | | | | | | | | | | | | | | | | | |
| | waived or recouped | | 1.03 | %6 | | | 1.02 | %6 | | | 0.99 | %7 | | | 1.05 | % | | | 1.01 | % | | | 1.01 | % | | | 1.27 | % |
| | After fees/expenses | | | | | | | | | | | | | | | | | | | | | | | | | | | |
| | waived or recouped | | 0.96 | %6 | | | 0.97 | %6 | | | 0.99 | %7 | | | 1.05 | % | | | 1.01 | % | | | 1.01 | % | | | 1.27 | % |
| | | | | | | | | | | | | | | | | | | | | | | | | | | | | |
| | RATIOS OF NET INVESTMENT INCOME TO AVERAGE NET ASSETS: | | | | | | | | | | | | | | | | | |
| | Before fees/expenses | | | | | | | | | | | | | | | | | | | | | | | | | | | |
| | waived or recouped | | 6.04 | %6 | | | 6.74 | %6 | | | 4.46 | % | | | 4.28 | % | | | 3.97 | % | | | 3.48 | % | | | 2.51 | % |
| | After fees/expenses | | | | | | | | | | | | | | | | | | | | | | | | | | | |
| | waived or recouped | | 6.11 | %6 | | | 6.79 | %6 | | | 4.46 | % | | | 4.28 | % | | | 3.97 | % | | | 3.48 | % | | | 2.51 | % |
1 | Activity presented prior to close of business October 7, 2022, represents the historical operating results of the Zeo Short Duration Income Fund. |
2 | The Osterweis Short Duration Credit Fund changed fiscal year end from April 30 to March 31 effective close of business October 7, 2022. Amounts shown reflect the activity for the 17 months ended March 31, 2023. |
3 | Calculated based on average shares outstanding during the period. |
4 | Less than $0.005 per share. |
5 | Not Annualized. |
6 | Annualized. |
7 | Effective July 1, 2021, the operating expense limitation was reduced to 0.99% from 1.25% |
The accompanying Notes to Financial Statements are an integral part of these financial statements.
Sustainable Credit Fund 1 | Financial Highlights
For a capital share outstanding throughout each period/year
| | | | Six Months | | | | | | | | | | | | | |
| | | | Ended | | | Period | | | | | | | | | Period | |
| | | | September 30, | | | Ended | | | Year Ended April 30, | | | Ended | |
| | | | 2023 | | | March 31, | | | April 30, | |
| | | | (Unaudited) | | | 2023 2 | | | | 2022 | | | | 2021 | | | 20203
|
|
| | Net asset value, beginning of year | | $ | 8.09 | | | $ | 9.16 | | | $ | 9.67 | | | $ | 9.14 | | | $ | 10.00 | |
| | | | | | | | | | | | | | | | | | | | | | |
| | INCOME FROM INVESTMENT OPERATIONS: | | | | | | | | | | | | | | | | | | | | |
| | Net investment income (loss) 4 | | | 0.28 | | | | 0.63 | | | | 0.45 | | | | 0.33 | | | | 0.25 | |
| | Net realized and unrealized gain (loss) on investments | | | (0.37 | ) | | | (1.04 | ) | | | (0.43 | ) | | | 0.52 | | | | (0.89 | ) |
| | Total from investment operations | | | (0.09 | ) | | | (0.41 | ) | | | 0.02 | | | | 0.85 | | | | (0.64 | ) |
| | Paid-in-capital redemption fees | | | — | | | | — | | | | 0.00 | 5 | | | — | | | | 0.00 | 5 |
| | | | | | | | | | | | | | | | | | | | | | |
| | LESS DISTRIBUTIONS: | | | | | | | | | | | | | | | | | | | | |
| | From net investment income | | | (0.30 | ) | | | (0.64 | ) | | | (0.53 | ) | | | (0.32 | ) | | | (0.22 | ) |
| | From net realized gain | | | — | | | | (0.02 | ) | | | — | | | | — | | | | — | |
| | Total distributions | | | (0.30 | ) | | | (0.66 | ) | | | — | | | | — | | | | — | |
| | Net asset value, end of period/year | | $ | 7.70 | | | $ | 8.09 | | | $ | 9.16 | | | $ | 9.67 | | | $ | 9.14 | |
| | Total return | | | (1.10 | )%6 | | | (4.56 | )%6 | | | 0.04 | % | | | 9.41 | % | | | (6.53 | )%6 |
| | | | | | | | | | | | | | | | | | | | | | |
| | SUPPLEMENTAL DATA: | | | | | | | | | | | | | | | | | | | | |
| | Net assets, end of year (millions) | | $ | 3.8 | | | $ | 4.8 | | | $ | 6.4 | | | $ | 19.4 | | | $ | 10.3 | |
| | Portfolio turnover rate | | | 20 | %6 | | | 37 | %6 | | | 69 | % | | | 75 | % | | | 62 | %6 |
| | | | | | | | | | | | | | | | | | | | | | |
| | RATIOS OF EXPENSES TO AVERAGE NET ASSETS: | | | | | | | | | | | | | | | | | |
| | Before fees/expenses waived or recouped | | | 3.73 | %7 | | | 3.36 | %7 | | | 2.32 | % | | | 1.66 | % | | | 2.51 | %7 |
| | After fees/expenses waived or recouped | | | 0.99 | %7 | | | 0.99 | %7 | | | 1.08 | %8 | | | 1.25 | % | | | 1.25 | %7 |
| | | | | | | | | | | | | | | | | | | | | | |
| | RATIOS OF NET INVESTMENT INCOME TO AVERAGE NET ASSETS: | | | | | | | | | | | | | |
| | Before fees/expenses waived or recouped | | | 4.32 | %7 | | | 5.71 | % | | | 3.48 | % | | | 3.07 | % | | | 1.58 | %7 |
| | After fees/expenses waived or recouped | | | 7.07 | %7 | | | 8.08 | % | | | 4.72 | % | | | 3.48 | % | | | 2.85 | %7 |
1 | Activity presented prior to close of business October 7, 2022, represents the historical operating results of the Zeo Sustainable Credit Fund. |
2 | The Osterweis Sustainable Credit Fund changed fiscal year end from April 30 to March 31 effective close of business October 7, 2022. Amounts shown reflect the activity for the 17 months ended March 31, 2023. |
3 | The fund commenced operations on May 31, 2019. |
4 | Calculated based on average shares outstanding during the period. |
5 | Less than $0.005 per share. |
6 | Not Annualized. |
7 | Annualized. |
8 | Effective July 1, 2021, the operating expense limitation was reduced to 0.99% from 1.25% |
The accompanying Notes to Financial Statements are an integral part of these financial statements.
Osterweis Funds | Notes to Financial Statements at September 30, 2023 (Unaudited)
The Osterweis Fund, Osterweis Strategic Income Fund, Osterweis Growth & Income Fund, Osterweis Emerging Opportunity Fund, Osterweis Total Return Fund, Osterweis Short Duration Credit Fund, and Osterweis Sustainable Credit Fund (each a “Fund”, collectively the “Funds”) are diversified series of shares of beneficial interest of Professionally Managed Portfolios (the “Trust”), which is registered under the Investment Company Act of 1940, as amended (the “1940 Act”) as an open-end management investment company. The Funds are investment companies and accordingly follow the investment company accounting and reporting guidance of the Financial Accounting Standards Board (FASB) Accounting Standard Codification Topic 946 “Financial Services — Investment Companies.” The Funds commenced operations on October 1, 1993, August 30, 2002, August 31, 2010, November 30, 2016, December 30, 2016, May 31, 2011, and June 5, 2019, respectively.
The investment objective of the Osterweis Fund is to attain long-term total returns, which it seeks by investing primarily in equity securities. The investment objective of the Osterweis Strategic Income Fund is to preserve capital and attain long- term total returns through a combination of current income and moderate capital appreciation, which it seeks by investing primarily in income bearing securities. The investment objective of the Osterweis Growth & Income Fund is to attain long- term total returns and capital preservation, which it seeks by investing in both equity and fixed income securities that the Adviser believes can deliver attractive long-term returns and enhanced capital preservation. The investment objective of the Osterweis Emerging Opportunity Fund is to attain long-term capital appreciation. The investment objective of the Osterweis Total Return Fund is to preserve capital and attain long-term total returns through a combination of current income and moderate capital appreciation. The investment objective of the Osterweis Short Duration Credit Fund is to seek low volatility and absolute returns consisting of income and moderate capital appreciation. The investment objective of the Osterweis Sustainable Credit Fund is to seek risk-adjustment total returns consisting of income and moderate capital appreciation. Osterweis Capital Management, Inc. and Osterweis Capital Management, LLC may be referred to individually or collectively as the “Adviser” or “Advisers” throughout this report.
The Osterweis Total Return Fund, Osterweis Short Duration Credit Fund, and Osterweis Sustainable Credit Fund have entered a Plan of Liquidation, and will close on December 15, 2023.
| Note 2 – Significant Accounting Policies |
The following is a summary of significant accounting policies consistently followed by the Funds. These policies are in conformity with accounting principles generally accepted in the United States of America (“U.S. GAAP”).
| | A. | Security Valuation. All equity securities, which may include Real Estate Investment Trusts (“REITs”), Business Development Companies (“BDCs”) and Master Limited Partnerships (“MLPs”), that are traded on U.S. national or foreign securities exchanges are valued either at the last reported sale price on the exchange on which the security is principally traded or the exchange’s official closing price. If, on a particular day, an exchange-traded security does not trade, then the mean between the most recent quoted bid and asked prices will be used. All equity securities which may include REITs, BDCs and MLPs that are not traded on a listed exchange are valued at the last sale price in the over-the-counter market. If a non-exchange traded security does not trade on a particular day, then the mean between the last quoted closing bid and asked price will be used. |
| | | |
| | | Debt securities, including short-term debt instruments having a maturity of less than 60 days, are valued by using the evaluated mean price supplied by an approved independent pricing service. The independent pricing service may use various valuation methodologies including matrix pricing and other analytical pricing models as well as market transactions and dealer quotations. These models generally consider such factors as yields or prices of bonds of comparable quality, type of issue, coupon, maturity, ratings and general market conditions. |
| | | |
| | | Futures contracts are priced by an approved independent pricing service. Futures contracts are valued at the settlement price on the exchange on which they are principally traded. |
Osterweis Funds | Notes to Financial Statements at September 30, 2023 (Unaudited) (Continued)
| | | Pursuant to Rule 2a-5 under the 1940 Act, the Board has adopted a Valuation Policy designating Osterweis Capital Management (the “Adviser”) as the Funds’ Valuation Designee. Under Rule 2a-5, the Valuation Designee shall determine the fair value of securities for which readily available market quotes are not available in accordance with procedures approved by the Board. |
| | | |
| | | As described above, the Funds utilize various methods to measure the fair value of their investments on a recurring basis. U.S. GAAP establishes a hierarchy that prioritizes inputs to valuation methods. The three levels of inputs are: |
| | Level 1 – | Unadjusted quoted prices in active markets for identical assets or liabilities that the Funds have the ability to access. |
| | | |
| | Level 2 – | Observable inputs other than quoted prices included in Level 1 that are observable for the asset or liability, either directly or indirectly. These inputs may include quoted prices for the identical instrument on an inactive market, prices for similar instruments, interest rates, prepayment speeds, credit risk, yield curves, default rates and similar data. |
| | | |
| | Level 3 – | Unobservable inputs for the asset or liability, to the extent relevant observable inputs are not available, representing the Funds’ own assumptions about the assumptions a market participant would use in valuing the asset or liability, and would be based on the best information available. |
| | | The availability of observable inputs can vary from security to security and is affected by a wide variety of factors, including, for example, the type of security, whether the security is new and not yet established in the marketplace, the liquidity of markets, and other characteristics particular to the security. To the extent that valuation is based on models or inputs that are less observable or unobservable in the market, the determination of fair value requires more judgment. Accordingly, the degree of judgment exercised in determining fair value is greatest for instruments categorized in Level 3. |
| | | |
| | | The inputs used to measure fair value may fall into different levels of the fair value hierarchy. In such cases, for disclosure purposes, the level in the fair value hierarchy within which the fair value measurement falls in its entirety is determined based on the lowest level input that is significant to the fair value measurement in its entirety. |
| | | |
| | | The following is a summary of the inputs used to value the Funds’ investments and derivative positions as of September 30, 2023: |
| | Osterweis Fund | | Level 1 | | | Level 2 | | | Level 3 | | | Total | |
| | Common Stocks | | $ | 124,514,995 | | | $ | — | | | $ | — | | | $ | 124,514,995 | |
| | Short-Term Investments | | | 5,504,489 | | | | — | | | | — | | | | 5,504,489 | |
| | Total Investments in Securities | | $ | 130,019,484 | | | $ | — | | | $ | — | | | $ | 130,019,484 | |
| | | The following is a summary of the inputs used to value the Fund’s investments as of September 30, 2023: |
| | Osterweis Strategic Income Fund | | Level 1 | | | Level 2 | | | Level 3 | | | Total | |
| | Common Stocks | | $ | — | | | $ | — | | | $ | 156,913,204 | | | $ | 156,913,204 | |
| | Convertible Bonds | | | — | | | | 177,237,915 | | | | — | | | | 177,237,915 | |
| | Convertible Preferred Stocks | | | — | | | | — | | | | 40,452,440 | | | | 40,452,440 | |
| | Corporate Bonds | | | — | | | | 3,853,090,253 | | | | 10,958,192 | | | | 3,864,048,445 | |
| | Short-Term Investments | | | 203,551,932 | | | | 201,602,327 | | | | — | | | | 405,154,259 | |
| | Warrant | | | 976,848 | | | | — | | | | — | | | | 976,848 | |
| | Total Investments in Securities | | $ | 204,528,780 | | | $ | 4,231,930,494 | | | $ | 208,323,836 | | | $ | 4,644,783,111 | |
Osterweis Funds | Notes to Financial Statements at September 30, 2023 (Unaudited) (Continued)
| | | The following is a reconciliation of the Fund’s Level 3 assets for which significant unobservable inputs were used to determine fair value: |
| | | | | | | Convertible | | | Private | | | | |
| | | | Common | | | Preferred | | | Mortgage Backed | | | | |
| | | | Stocks | | | Stocks | | | Obligations | | | Total | |
| | Balance as of March 31, 2023 | | $ | 157,804,479 | | | $ | 46,512,760 | | | $ | 10,602,149 | | | $ | 214,919,388 | |
| | Acquisitions | | | — | | | | — | | | | — | | | | — | |
| | Dispositions | | | (5,320,000 | ) | | | — | | | | — | | | | (5,320,000 | ) |
| | Accrued discounts/premiums | | | — | | | | — | | | | — | | | | — | |
| | Realized gain (loss) | | | (643,582 | ) | | | — | | | | — | | | | (643,582 | ) |
| | Change in unrealized appreciation/depreciation | | | 5,072,307 | | | | (6,060,320 | ) | | | 356,043 | | | | (631,970 | ) |
| | Transfer in and/or out of Level 3 | | | — | | | | — | | | | — | | | | — | |
| | Balance as of September 30, 2023 | | $ | 156,913,204 | | | $ | 40,452,440 | | | $ | 10,958,192 | | | $ | 208,323,836 | |
| | Change in unrealized | | | | | | | | | | | | | | | | |
| | appreciation/depreciation for Level 3 | | | | | | | | | | | | | | | | |
| | investments held at September 30, 2023 | | $ | 5,072,307 | | | $ | (6,060,320 | ) | | $ | 356,043 | | | $ | (631,970 | ) |
| | | Fair Value | | | |
| | Type of Security | at 9/30/23 | Valuation Techniques | Unobservable Input | Input Value(s) |
| | Common Stocks | | Market Comparable | Discount Rate, | |
| | | | Approach | EBITDA Multiple | 3.0%/5.5x |
| | | | Broker Quotes | Market Data | $22.2500 |
| | | $156,913,204 | Estimated Proceeds | Market Data | $0.0007514 |
| | Convertible | | Convertible | | |
| | Preferred Stocks | $ 40,452,440 | Valuation Model | Adjustment to yield | 200 bps |
| | Private Mortgage | | | | |
| | Backed Obligations | $ 10,958,192 | Discounted Cash Flow | Adjustment to yield | 344 bps |
| | | Significant increases (decreases) in any of those inputs in isolation would result in a significantly higher (lower) fair value measurement. Increases in the adjustment to yield would decrease price and decreases in the adjustment to yield would increase price. |
| | | |
| | | The Adviser, as the Funds’ Valuation Designee, oversees valuation techniques. |
| | | |
| | | The following is a summary of the inputs used to value the Fund’s investments as of September 30, 2023: |
| | Osterweis Growth & Income Fund | | Level 1 | | | Level 2 | | | Level 3 | | | Total | |
| | Common Stocks | | $ | 90,334,605 | | | $ | — | | | $ | 735,583 | | | $ | 91,070,188 | |
| | Convertible Bonds | | | — | | | | 2,788,681 | | | | — | | | | 2,788,681 | |
| | Convertible Preferred Stocks | | | — | | | | — | | | | 825,560 | | | | 825,560 | |
| | Corporate Bonds | | | — | | | | 39,255,118 | | | | 322,610 | | | | 39,577,728 | |
| | Short-Term Investments | | | 9,121,995 | | | | 11,974,081 | | | | 994,089 | | | | 22,090,165 | |
| | Warrant | | | 5,338 | | | | — | | | | — | | | | 5,338 | |
| | Total Investments in Securities | | $ | 99,461,938 | | | $ | 54,017,880 | | | $ | 2,877,842 | | | $ | 156,357,660 | |
Osterweis Funds | Notes to Financial Statements at September 30, 2023 (Unaudited) (Continued)
| | | The following is a reconciliation of the Fund’s Level 3 assets for which significant unobservable inputs were used to determine fair value: |
| | | | | | | | | | Private | | | | | | | |
| | | | | | | Convertible | | | Mortgage | | | | | | | |
| | | | Common | | | Preferred | | | Backed | | | Commercial | | | | |
| | | | Stocks | | | Stocks | | | Obligations | | | Paper | | | Total | |
| | Balance as of March 31, 2023 | | $ | 1,126,533 | | | $ | 949,240 | | | $ | 312,128 | | | $ | — | | | $ | 2,387,901 | |
| | Acquisitions | | | — | | | | — | | | | — | | | | 994,089 | | | | 994,089 | |
| | Dispositions | | | (280,000 | ) | | | — | | | | — | | | | — | | | | (280,000 | ) |
| | Accrued discounts/premiums | | | — | | | | — | | | | — | | | | 1,400 | | | | 1,400 | |
| | Realized gain (loss) | | | (34,075 | ) | | | — | | | | — | | | | — | | | | (34,075 | ) |
| | Change in unrealized appreciation/depreciation | | | (76,875 | ) | | | (123,680 | ) | | | 10,482 | | | | (1,400 | ) | | | (191,473 | ) |
| | Transfer in and/or out of Level 3 | | | — | | | | — | | | | — | | | | — | | | | — | |
| | Balance as of September 30, 2023 | | $ | 735,583 | | | $ | 825,560 | | | $ | 322,610 | | | $ | 994,089 | | | $ | 2,877,842 | |
| | Change in unrealized | | | | | | | | | | | | | | | | | | | | |
| | appreciation/depreciation for Level 3 | | | | | | | | | | | | | | | | | | | | |
| | investments held at September 30, 2023 | | $ | (76,875 | ) | | $ | (123,680 | ) | | $ | 10,482 | | | $ | (1,400 | ) | | $ | (191,473 | ) |
| | | Fair Value | | | |
| | Type of Security | at 9/30/23 | Valuation Techniques | Unobservable Input | Input Value(s) |
| | Common Stocks | | Market Comparable | Discount Rate, | |
| | | | Approach | EBITDA Multiple | 3.0%/5.5x |
| | | | Broker Quotes | Market Data | $22.2500 |
| | | $735,583 | Estimated Proceeds | Market Data | $0.0007514 |
| | Convertible | | Convertible | | |
| | Preferred Stocks | $825,560 | Valuation Model | Adjustment to yield | 200 bps |
| | Private Mortgage | | | | |
| | Backed Obligations | $322,610 | Discounted Cash Flow | Adjustment to yield | 344 bps |
| | Commercial Paper | $994,089 | Purchase Price | Market Data | $99.4100 |
| | | Significant increases (decreases) in any of those inputs in isolation would result in a significantly higher (lower) fair value measurement. Increases in the adjustment to yield would decrease price and decreases in the adjustment to yield would increase price. |
| | | |
| | | The Adviser, as the Funds’ Valuation Designee, oversees valuation techniques. |
| | | |
| | | The following is a summary of the inputs used to value the Fund’s investments as of September 30, 2023: |
| | Osterweis Emerging | | | | | | | | | | | | |
| | Opportunity Fund | | Level 1 | | | Level 2 | | | Level 3 | | | Total | |
| | Common Stocks | | $ | 175,244,783 | | | $ | — | | | $ | — | | | $ | 175,244,783 | |
| | Short-Term Investments | | | 21,570,977 | | | | — | | | | — | | | | 21,570,977 | |
| | Total Investments in Securities | | $ | 196,815,760 | | | $ | — | | | $ | — | | | $ | 196,815,760 | |
Osterweis Funds | Notes to Financial Statements at September 30, 2023 (Unaudited) (Continued)
| | | The following is a summary of the inputs used to value the Fund’s investments as of September 30, 2023: |
| | Osterweis Total Return Fund | | Level 1 | | | Level 2 | | | Level 3 | | | Total | |
| | Asset Backed Securities | | $ | — | | | $ | 18,410,219 | | | $ | 1,803,102 | | | $ | 20,213,321 | |
| | Collateralized Mortgage Obligation | | | — | | | | 4,737,111 | | | | — | | | | 4,737,111 | |
| | Corporate Bonds | | | — | | | | 19,201,549 | | | | — | | | | 19,201,549 | |
| | Mortgage Backed Securities | | | — | | | | 42,976,185 | | | | — | | | | 42,976,185 | |
| | Short-Term Investments | | | 884,835 | | | | — | | | | — | | | | 884,835 | |
| | U.S. Government Notes/Bonds | | | — | | | | 36,632,171 | | | | — | | | | 36,632,171 | |
| | Total Investments in Securities | | $ | 884,835 | | | $ | 121,957,235 | | | $ | 1,803,102 | | | $ | 124,645,172 | |
| | | The following is a reconciliation of the Fund’s Level 3 assets for which significant unobservable inputs were used to determine fair value: |
| | | Asset Backed Securities |
| | Balance as of March 31, 2023 | | $ | 1,422,690 | |
| | Acquisitions | | | 999,432 | |
| | Dispositions | | | (611,664 | ) |
| | Accrued discounts/premiums | | | — | |
| | Realized gain (loss) | | | 562 | |
| | Change in unrealized appreciation/depreciation | | | (7,918 | ) |
| | Transfer in and/or out of Level 3 | | | — | |
| | Balance as of September 30, 2023 | | $ | 1,803,102 | |
| | Change in unrealized appreciation/depreciation for | | | | |
| | Level 3 investments held at September 30, 2023 | | $ | (7,918 | ) |
| | | Fair Value | | | |
| | Type of Security | at 9/30/23 | Valuation Techniques | Unobservable Input | Input Value(s) |
| | Asset Backed Securities | | Issue Price | Market Data | $99.94 |
| | | $1,803,102 | Issue Price | Market Data | $99.88 |
| | | Significant increases (decreases) in any of those inputs in isolation would result in a significantly higher (lower) fair value measurement. Increases in the adjustment to yield would decrease price and decreases in the adjustment to yield would increase price. |
| | | |
| | | The Adviser, as the Funds’ Valuation Designee, oversees valuation techniques. |
| | | |
| | | The following is a summary of the inputs used to value the Fund’s investments as of September 30, 2023: |
| | Osterweis Short Duration | | | | | | | | | | | | |
| | Credit Fund | | Level 1 | | | Level 2 | | | Level 3 | | | Total | |
| | Bank Loans | | $ | — | | | $ | — | | | $ | 2,005,131 | | | $ | 2,005,131 | |
| | Common Stocks | | | 455,867 | | | | — | | | | — | | | | 455,867 | |
| | Corporate Bonds | | | — | | | | 9,263,283 | | | | — | | | | 9,263,283 | |
| | Short-Term Investments | | | 59,059,308 | | | | — | | | | — | | | | 59,059,308 | |
| | Total Investments in Securities | | $ | 59,515,175 | | | $ | 9,263,283 | | | $ | 2,005,131 | | | $ | 70,783,589 | |
Osterweis Funds | Notes to Financial Statements at September 30, 2023 (Unaudited) (Continued)
| | | The Following is a reconciliation of the Fund’s Level 3 assets for which significant unobservable inputs were used to determine fair value: |
| | | | Bank Loans | |
| | Balance as of March 31, 2023 | | $ | — | |
| | Acquisitions | | | 1,946,729 | |
| | Dispositions | | | — | |
| | Accrued discounts/premiums | | | 25,137 | |
| | Realized gain (loss) | | | — | |
| | Change in unrealized appreciation/depreciation | | | 33,265 | |
| | Transfer in and/or out of Level 3 | | | — | |
| | Balance as of September 30, 2023 | | $ | 2,005,131 | |
| | Change in unrealized appreciation/depreciation for | | | | |
| | Level 3 investments held at September 30, 2023 | | $ | 33,265 | |
| | | Fair Value | | | |
| | Type of Security | at 9/30/23 | Valuation Techniques | Unobservable Input | Input Value(s) |
| | Bank Loans | $2,005,131 | Purchase Price | Market Data | $100.00 |
| | | Significant increases (decreases) in any of those inputs in isolation would result in a significantly higher (lower) fair value measurement. Increases in the adjustment to yield would decrease price and decreases in the adjustment to yield would increase price. |
| | | |
| | | The Adviser, as the Funds’ Valuation Designee, oversees valuation techniques. |
| | | |
| | | The following is a summary of the inputs used to value the Fund’s investments as of September 30, 2023: |
| | Osterweis Sustainable Credit Fund | | Level 1 | | | Level 2 | | | Level 3 | | | Total | |
| | Bank Loans | | $ | — | | | $ | — | | | $ | 54,869 | | | $ | 54,869 | |
| | Common Stocks | | | 11,800 | | | | — | | | | — | | | | 11,800 | |
| | Corporate Bonds | | | — | | | | 319,197 | | | | — | | | | 319,197 | |
| | Short-Term Investments | | | 3,081,749 | | | | — | | | | — | | | | 3,081,749 | |
| | Total Investments in Securities | | $ | 3,093,549 | | | $ | 319,197 | | | $ | 54,869 | | | $ | 3,467,615 | |
| | | The Following is a reconciliation of the Fund’s Level 3 assets for which significant unobservable inputs were used to determine fair value: |
| | | | Bank Loans | |
| | Balance as of March 31, 2023 | | $ | — | |
| | Acquisitions | | | 53,271 | |
| | Dispositions | | | — | |
| | Accrued discounts/premiums | | | 688 | |
| | Realized gain (loss) | | | — | |
| | Change in unrealized appreciation/depreciation | | | 910 | |
| | Transfer in and/or out of Level 3 | | | — | |
| | Balance as of September 30, 2023 | | $ | 54,869 | |
| | Change in unrealized appreciation/depreciation for | | | | |
| | Level 3 investments held at September 30, 2023 | | $ | 910 | |
| | | Fair Value | | | |
| | Type of Security | at 9/30/23 | Valuation Techniques | Unobservable Input | Input Value(s) |
| | Bank Loans | $54,869 | Purchase Price | Market Data | $100.00 |
| | | Significant increases (decreases) in any of those inputs in isolation would result in a significantly higher (lower) fair value measurement. Increases in the adjustment to yield would decrease price and decreases in the adjustment to yield would increase price. |
Osterweis Funds | Notes to Financial Statements at September 30, 2023 (Unaudited) (Continued)
| | | The Adviser, as the Funds’ Valuation Designee, oversees valuation techniques. |
| | | |
| | | The Osterweis Total Return Fund has provided additional disclosures below regarding derivatives and hedging activity intending to improve financial reporting by enabling investors to understand how and why the Osterweis Total Return Fund uses futures contracts (a type of derivative), how they are accounted for and how they affect an entity’s results of operations and financial position. The Osterweis Total Return Fund may use derivatives for risk management purposes or as part of its investment strategies. Derivatives are financial contracts whose values depend on, or are derived from, the value of an underlying asset, reference rate or index. The Fund may use derivatives to earn income and enhance returns, to hedge or adjust the risk profile of its portfolio, to replace more traditional direct investments and to obtain exposure to otherwise inaccessible markets. |
| | | |
| | | Rule 18f-4 imposes limits on the amount of derivatives a fund can enter into, eliminates the asset segregation framework currently used by funds to comply with Section 18 of the 1940 Act, treats derivatives as senior securities and requires funds whose use of derivatives is more than a limited specified exposure amount to establish and maintain a comprehensive derivatives risk management program and appoint a derivatives risk manager. Effective August 19, 2022, the Osterweis Total Return Fund has adopted a Full Derivatives Fund Program and the Adviser has nominated a Derivative Risk Manager. |
| | | |
| | | The average notional amount for futures contracts is based on the monthly notional amounts. The notional amount for futures contracts represents the U.S. dollar value of the contract as of the day of opening the transaction or latest contract reset date. There was no average notational value of futures for the Osterweis Total Return Fund during the six months ended September 30, 2023. The following table shows the effects of derivative instruments on the financial statements. |
| | | |
| | | Statements of Operations |
| | | |
| | | The effect of derivative instruments on the Statements of Operations for the year ended September 30, 2023: |
| | | |
| | | Osterweis Total Return Fund |
| | | | | Change in Unrealized |
| | | Location of Gain | Realized Gain | Appreciation/Depreciation |
| | | (Loss) on Derivatives | (Loss) on Derivatives | on Derivatives |
| | Instrument | Recognized in Income | Recognized in Income | Recognized in Income |
| | Interest Rate | Realized and Unrealized Gain | | |
| | Contracts – Futures | (Loss) on Investments | $61,642 | $ — |
| | | The Osterweis Fund, Osterweis Strategic Income Fund, Osterweis Growth & Income Fund, Osterweis Emerging Opportunity Fund, Osterweis Short Duration Credit Fund, and Osterweis Sustainable Credit Fund did not have derivatives activity during the six months ended September 30, 2023. |
| | | |
| | B. | Foreign Currency. Foreign currency amounts, other than the cost of investments, are translated into U.S. dollar values based upon the spot exchange rate prior to the close of regular trading. The cost of investments is translated at the rates of exchange prevailing on the dates the portfolio securities were acquired. The Funds include foreign exchange gains and losses from dividends receivable, interest receivable and other foreign currency denominated payables and receivables in Change in net unrealized appreciation/depreciation on foreign currency translation and Net realized gain (loss) on foreign currency translation. The Funds do not isolate that portion of realized and unrealized gain (loss) on investments resulting from changes in foreign exchange rates on investments from fluctuations arising from changes in the market price of securities for financial reporting purposes. Fluctuations in foreign exchange rates on investments are thus included in Change in net unrealized appreciation/depreciation on investments and Net realized gain (loss) on investments. |
| | | |
| | C. | Futures Contracts. The Osterweis Total Return Fund may purchase or sell futures contracts and options thereon to hedge against changes in interest rates, securities (through index futures or options) or currencies. The purchase of futures contracts may be more efficient or cost-effective than buying the underlying securities or assets. A futures contract is an agreement that obligates the buyer to buy and the seller to sell a specified quantity of an underlying asset (or settle for cash the value of a contract based on an underlying asset, rate or index) at a specific price on the |
Osterweis Funds | Notes to Financial Statements at September 30, 2023 (Unaudited) (Continued)
| | | contract maturity date. Upon entering into a futures contract, the Fund is required to pledge to the counterparty an amount of cash, U.S. Government securities or other high-quality debt securities equal to the minimum “initial margin” requirements of the exchange or the broker. Pursuant to a contract entered into with a futures commission merchant, the Fund agrees to receive from or pay to the firm an amount of cash equal to the cumulative daily fluctuation in the value of the contract. Such receipts or payments are known as “variation margin” and are recorded by the Fund as unrealized gains or losses. When the contract is closed, the Fund records a gain or loss equal to the difference between the value of the contract at the time it was opened and the value at the time it was closed. The Fund will cover its current obligations under futures contracts by the segregation of liquid assets or by entering into offsetting transactions or owning positions covering its obligations. The Fund’s use of futures contracts may involve risks that are different from, or possibly greater than, the risk associated with investing directly in securities or other more traditional instruments. These risks include the risk that the value of the futures contracts may not correlate perfectly, or at all, with the value of the assets, reference rates or indices that they are designed to track. Other risks include: an illiquid secondary market for a particular instrument and possible exchange-imposed price fluctuation limits, either of which may make it difficult or impossible to close out a position when desired; the risk that adverse price movements in an instrument can result in a loss substantially greater than the Fund’s initial investment in that instrument (in some cases, the potential loss is unlimited); and the risk that a counterparty will not perform its obligations. The Osterweis Total Return Fund had futures contracts activity during the six months ended September 30, 2023. Realized and unrealized gains and losses are included in the Statements of Operations. The Osterweis Fund, Osterweis Strategic Income Fund, Osterweis Growth & Income Fund, Osterweis Emerging Opportunity Fund, Osterweis Short Duration Credit Fund, and Osterweis Sustainable Credit Fund did not have futures contracts activity during the six months ended September 30, 2023. |
| | | |
| | D. | To-be-announced (“TBA”) Commitments. The Osterweis Total Return Fund may enter into TBA purchase commitments. In a TBA transaction, the TBA unit price and the estimated principal amount are established when a Fund enters into a contract, with the actual principal amount being within a specified range of the estimate. Securities purchased on a TBA basis are not settled until they are delivered to the Fund, which can be 15 to 45 days later. Beginning on the date the Fund enters into a TBA transaction, cash, U.S. government securities or other liquid securities are segregated in an amount equal in value to the purchase price of the TBA security. The Osterweis Total Return Fund may enter into TBA sale commitments to hedge its portfolio positions or to sell securities it owns under delayed delivery arrangements. Proceeds of TBA sale commitments are not received until the contractual settlement date. Unsettled TBA sale commitments are valued at current market value of the underlying securities. If the TBA sale commitment is closed through the acquisition of an offsetting purchase commitment, a Fund realizes a gain or loss on the commitment without regard to any unrealized gain or loss on the underlying security. If a Fund delivers securities under the commitment, the Fund realizes a gain or loss from the sale of the securities based upon the unit price established at the date the commitment was entered. Transactions in TBAs are accounted for as purchases and sales and may result in an increase to the Fund’s portfolio turnover rate. The Osterweis Total Return Fund had TBAs during the six months ended September 30, 2023. The Osterweis Fund, Osterweis Strategic Income Fund, Osterweis Growth & Income Fund, Osterweis Emerging Opportunity Fund, Osterweis Short Duration Credit Fund, and Osterweis Sustainable Credit Fund did not have TBA’s during the six months ended September 30, 2023. |
| | | |
| | | Statements of Operations |
| | | |
| | | The effect of TBA commitments on the Statements of Operations for the year ended September 30, 2023: |
| | | |
| | | Osterweis Total Return Fund |
| | | | | Change in Unrealized |
| | | Location of Gain | Realized Gain | Appreciation/Depreciation |
| | | (Loss) on Derivatives | (Loss) on Derivatives | on Derivatives |
| | Instrument | Recognized in Income | Recognized in Income | Recognized in Income |
| | TBA | Realized and Unrealized Gain | | |
| | Commitments | (Loss) on Investments | $(15,625) | $ — |
| | E. | Mortgage Dollar Rolls. The Osterweis Total Return Fund enters into mortgage dollar rolls, typically on a TBA basis. Mortgage dollar rolls are agreements between the Fund and a financial institution where the Fund sells (or buys) |
Osterweis Funds | Notes to Financial Statements at September 30, 2023 (Unaudited) (Continued)
| | | mortgage-backed securities for delivery on a specified date and simultaneously contracts to repurchase (or sell) substantially similar (same type, coupon, and maturity) securities at a future date and at a predetermined price. Gains or losses are realized on the initial sale, and the difference between the repurchase price and the sale price is recorded as an unrealized gain or loss to the Fund upon entering into the mortgage dollar roll. In addition, the Fund may invest the cash proceeds that are received from the initial sale. During the period between the sale and repurchase, the Fund is not entitled to principal and interest paid on the mortgage backed securities. Transactions in mortgage dollar rolls are accounted for as purchases and sales and may result in an increase to the Fund’s portfolio turnover rate. The risks of mortgage dollar roll transactions include the potential inability of the counterparty to fulfill its obligations. |
| | | |
| | F. | Federal Income Taxes. Each Fund has elected to be taxed as a “regulated investment company” and intends to distribute substantially all taxable income to its shareholders and otherwise comply with the provisions of the Internal Revenue Code applicable to regulated investment companies. Therefore, no provision for federal income taxes or excise taxes has been made. |
| | | |
| | | In order to avoid imposition of the excise tax applicable to regulated investment companies, each Fund intends to declare each year as dividends, in each calendar year, at least 98.0% of its net investment income (earned during the calendar year) and 98.2% of its net realized capital gains (earned during the twelve months ended October 31) plus undistributed amounts, if any, from prior years. |
| | | |
| | | Net capital losses incurred after October 31, and within the taxable year, are deemed to arise on the first business day of each Fund’s next taxable year. Net investment losses incurred after December 31, and within the taxable year, are deemed to arise on the first business day of the Fund’s next taxable year. |
| | | |
| | | As of the most recent fiscal year/period end March 31, 2023, there were $272,123 of late-year losses for Emerging Opportunity Fund. There were no post-October losses for the Funds. |
| | | |
| | | As of the most recent fiscal year/period end March 31, 2023, the Funds had the following capital loss carryovers available for federal income tax purposes: |
| | | | Capital Loss Carryovers | |
| | | | Short-Term | | | Long-Term | |
| | Osterweis Fund | | $ | (1,370,325 | ) | | $ | — | |
| | Osterweis Strategic Income Fund | | | — | | | | (417,013,678 | ) |
| | Osterweis Growth & Income Fund | | | — | | | | — | |
| | Osterweis Emerging Opportunity Fund | | | (37,607,519 | ) | | | (1,147,060 | ) |
| | Osterweis Total Return Fund | | | (3,835,209 | ) | | | (2,070,161 | ) |
| | Osterweis Short Duration Credit Fund | | | (7,812,652 | ) | | | (15,710,488 | ) |
| | Osterweis Sustainable Credit Fund | | | (108,873 | ) | | | (162,003 | ) |
| | | As of September 30, 2023, the Funds did not have any tax positions that did not meet the “more likely-than-not” threshold of being sustained by the applicable tax authority. Generally, tax authorities can examine all the tax returns filed for the last three years. The Funds identify their major tax jurisdictions as U.S. Federal and the Commonwealth of Massachusetts; however, as of September 30, 2023, the Funds are not aware of any tax positions for which it is reasonably possible that the total amounts of unrecognized tax benefits will change materially. |
| | | |
| | G. | Security Transactions and Investment Income. Investment securities transactions are accounted for on the trade date. Gains and losses realized on sales of securities are determined on an identified cost basis. Discounts/premiums on debt securities purchased are accreted/amortized over the life of the respective securities using the effective interest method. Dividend income is recorded on the ex-dividend date. Dividends received from REITs and MLPs are generally comprised of ordinary income, capital gains and may include return of capital. Interest income is recorded on an accrual basis. Withholding taxes on foreign dividends have been provided for in accordance with the Trust’s understanding of the applicable country’s tax rules and rates. |
| | | |
| | H. | Distributions to Shareholders. Distributions to shareholders from net investment income and net realized gains on securities for the Osterweis Fund and Osterweis Emerging Opportunity Fund normally are declared and paid on an annual basis. Distributions to shareholders from net investment income for the Osterweis Strategic Income |
Osterweis Funds | Notes to Financial Statements at September 30, 2023 (Unaudited) (Continued)
| | | Fund and Osterweis Growth & Income Fund normally are declared and paid on a quarterly basis, and distributions to shareholders from net realized gains on securities normally are declared and paid on an annual basis. Distributions to shareholders from net investment income for the Osterweis Total Return Fund, Osterweis Short Duration Credit Fund, and Osterweis Sustainable Credit Fund normally are declared and paid on a monthly basis, and distributions to shareholders from net realized gains on securities normally are declared and paid on an annual basis. Distributions are recorded on the ex-dividend date. |
| | | |
| | I. | Use of Estimates. The preparation of financial statements in conformity with U.S. GAAP requires management to make estimates and assumptions that affect the reported amounts of assets and liabilities at the date of the financial statements and the reported amount of revenue and expenses during the reporting period. Actual results could differ from those estimates. |
| | | |
| | J. | Share Valuation. The net asset value (“NAV”) per share of each Fund is calculated by dividing the sum of the value of the securities held by each Fund, plus cash and other assets, minus all liabilities by the total number of shares outstanding for each Fund, rounded to the nearest cent. The Funds’ shares will not be priced on the days on which the New York Stock Exchange is closed for trading. The offering and redemption price per share for each Fund is equal to each Fund’s net asset value per share. |
| | | |
| | K. | Guarantees and Indemnifications. In the normal course of business, the Funds enter into contracts with service providers that contain general indemnification clauses. The Funds’ maximum exposure under these arrangements is unknown as this would involve future claims that may be made against the Funds that have not yet occurred. However, based on experience, the Funds expect the risk of loss to be remote. |
| | | |
| | L. | Illiquid Securities. Pursuant to Rule 22e-4 under the 1940 Act, the Funds have adopted a Board approved liquidity risk management program that requires, among other things, that the Funds limit their illiquid investments that are assets to no more than 15% of net assets. An illiquid investment is any security which may not reasonably be expected to be sold or disposed of in current market conditions in seven calendar days or less without the sale or disposition significantly changing the market value of the investment. |
| | | |
| | M. | Offsetting Agreements. The Funds are subject to various netting arrangements, which govern the terms of certain transactions with counterparties. The arrangements allow the Funds to close out and net their total exposure to a counterparty in the event of a default with respect to all transactions governed under a single agreement with a counterparty. As of September 30, 2023, there were no derivative financial instruments that were subject to enforceable netting arrangements, collateral arrangements, or other similar agreements. |
| | | |
| | N. | Restricted Cash. Restricted cash represents amounts that are held by third parties under certain of the Fund’s derivative transactions. Such cash is excluded from cash and equivalents in the Statements of Assets and Liabilities. Interest income earned on restricted cash is recorded in other income on the Statements of Operations. |
| | | |
| | O. | Recently Issued Accounting Pronouncements. In June 2022, the FASB issued Accounting Standards Update 2022-03, which amends Fair Value Measurement (Topic 820): Fair Value Measurement of Equity Securities Subject to Contractual Sale Restrictions (“ASU 2022-03”). ASU 2022-03 clarifies guidance for fair value measurement of an equity security subject to a contractual sale restriction and establishes new disclosure requirements for such equity securities. ASU 2022-03 is effective for fiscal years beginning after December 15, 2023 and for interim periods within those fiscal years, with early adoption permitted. Management is currently evaluating the impact of these amendments on the financial statements. |
| | | |
| | | In March 2020, the FASB issued Accounting Standards Update 2020-04, Reference Rate Reform (Topic 848) – Facilitation of the Effects of Reference Rate Reform on Financial Reporting (“ASU 2020-04”), which provides optional, temporary relief with respect to the financial reporting of contracts subject to certain types of modifications due to the planned discontinuation of the London Interbank Offered Rate (“LIBOR”) and other interbank offered rates as of the end of 2021. The temporary relief provided by ASU 2020-04 is effective for certain reference rate- related contract modifications that occur during the period from March 12, 2020 through December 31, 2022. Management is evaluating the impact of ASU 2020-04 on the fund’s investments, derivatives, debt and other contracts that will undergo reference rate-related modifications as a result of the reference rate reform. The |
Osterweis Funds | Notes to Financial Statements at September 30, 2023 (Unaudited) (Continued)
| | | Financial Accounting Standards Board (“FASB”) approved an (optional) 2-year extension, until December 31, 2024, for temporary relief of transitioning away from the LIBOR. LIBOR is set to expire June 30, 2023. Companies were initially provided temporary relief through December 31, 2022 to update contracts moving away from LIBOR. |
| | | |
| | | In October 2022, the Securities and Exchange Commission (the “SEC”) adopted a final rule relating to Tailored Shareholder Reports for Mutual Funds and Exchange-Traded Funds; Fee Information in Investment Company Advertisements. The rule and form amendments will, among other things, require the Fund to transmit concise and visually engaging shareholder reports that highlight key information. The amendments will require that funds tag information in a structured data format and that certain more in-depth information be made available online and available for delivery free of charge to investors on request. The amendments became effective January 24, 2023. There is an 18-month transition period after the effective date of the amendment. |
| | | |
| | P. | Subsequent Events. In preparing these financial statements, the Funds have evaluated events and transactions for potential recognition or disclosure through the date the financial statements were issued. Plans of Liquidation have been approved by the Board for the Osterweis Total Return Fund, Osterweis Short Duration Credit Fund, and Osterweis Sustainable Credit Fund. The Funds will liquidate on December 15th, 2023. For further information, please refer to https://www.osterweis.com/. |
| Note 3 – Commitments and Other Related Party Transactions |
The Advisers provide the Funds with investment management services under separate Investment Advisory Agreements (the “Advisory Agreements”). Under the Advisory Agreements, the Advisers furnish all investment advice, office space, certain administrative services, and most of the personnel needed by each Fund. As compensation for their services, the Advisers are entitled to a monthly fee. For the Osterweis Fund, the Adviser is entitled to a monthly fee at an annual rate of 0.75%. For the Osterweis Strategic Income Fund, the Adviser is entitled to a monthly fee at an annual rate of 1.00% of the average daily net assets up to $250 million, 0.75% of the average daily net assets from $250 million to $2.5 billion, and 0.65% of the average daily net assets greater than $2.5 billion. For the Osterweis Growth & Income Fund, the Adviser is entitled to a monthly fee at the annual rate of 0.75%. For the Osterweis Emerging Opportunity Fund, the Adviser is entitled to a monthly fee at an annual rate of 1.00% of the average daily net assets up to $500 million, 0.85% of the average daily net assets from $500 million to $1 billion, and 0.75% of the average daily net assets greater than $1 billion. For the Osterweis Total Return Fund, the Adviser is entitled to a monthly fee at an annual rate of 0.45% of the average daily net assets. For the Osterweis Short Duration Credit Fund, the Adviser is entitled to a monthly fee at an annual rate of 0.75% of the average daily net assets. For the Osterweis Sustainable Credit Fund, the Adviser is entitled to a monthly fee at an annual rate of 0.75% of the average daily net assets. The amount of investment advisory fees incurred by the Funds for the six months ended September 30, 2023 is disclosed in the Statements of Operations. The investment advisory fees incurred are paid monthly to the Adviser, net of any waiver or reimbursement discussed below.
The Adviser has contractually agreed to limit the annual ratio of expenses (Expense Cap) for the Osterweis Fund, Osterweis Emerging Opportunity Fund, Osterweis Total Return Fund, Osterweis Short Duration Credit Fund, and Osterweis Sustainable Credit Fund by reducing all or a portion of their fees and reimbursing Fund expenses so that each Fund’s ratios of expenses to average net assets will not exceed 0.95%, 1.10%, 0.75%, 0.99%, and 0.99%, respectively. Each Operating Expenses Limitation Agreement has an indefinite term and may be terminated at any time, and without payment of any penalty, by the Board, on behalf of the Fund, upon sixty (60) days’ written notice to the Adviser. Any fees waived and/or any Fund expenses absorbed by the Adviser pursuant to an agreed-upon expense cap shall be reimbursed by the Fund to the Adviser, if so requested by the Adviser, any time before the end of the third year following the fee waiver and/or expense absorption, provided the aggregate amount of the Fund’s current operating expenses for such year does not exceed the lesser expense cap in place at the time of waiver or at the time of reimbursement. The Fund must pay its current ordinary operating expenses before the Adviser is entitled to any reimbursements of fees and/or expenses. Any such reimbursement is also contingent upon Board review and approval. Any amount due from the Adviser is paid monthly to the Funds, if applicable. For the six months ended September 30, 2023, the Adviser recaptured $27,805 in fees in the Osterweis Fund. The Adviser waived $71,245 in fees in the Osterweis Emerging Opportunity Fund, $35,947 in the Osterweis Short Duration Credit Fund, and $53,332 in fees in the Osterweis Sustainable Credit Fund. As of September 30, 2023, the remaining cumulative amount the Adviser may be reimbursed is $289,348 for Osterweis Fund, $546,266 for Osterweis Emerging Opportunity Fund, $113,711 for Osterweis Short Duration Credit Fund, and $229,277 for Osterweis Sustainable Credit Fund.
Osterweis Funds | Notes to Financial Statements at September 30, 2023 (Unaudited) (Continued)
The Adviser may recapture a portion of the above no later than the years as stated below:
| | | | March 31, 2024 | | | March 31, 2025 | | | March 31, 2026 | | | September 30, 2027 | | | Total | |
| | Osterweis Fund | | $ | 208,125 | | | $ | 81,223 | | | $ | — | | | $ | — | | | $ | 289,348 | |
| | Osterweis Emerging Opportunity Fund | | $ | 87,387 | | | $ | 164,768 | | | $ | 222,867 | | | $ | 71,245 | | | $ | 546,266 | |
| | Osterweis Short Duration Credit Fund | | $ | — | | | $ | — | | | $ | 77,764 | | | $ | 35,947 | | | $ | 113,711 | |
| | Osterweis Sustainable Credit Fund | | $ | — | | | $ | — | | | $ | 122,613 | | | $ | 53,332 | | | $ | 175,945 | |
U.S. Bancorp Fund Services, LLC, doing business as U.S. Bank Global Fund Services (“Fund Services”), acts as the Funds’ administrator, fund accountant and transfer agent. In those capacities Fund Services maintains the Funds’ books and records, calculates the Funds’ NAV, prepares various federal and state regulatory filings, coordinates the payment of fund expenses, reviews expense accruals and prepares materials supplied to the Board. The officers of the Trust and the Chief Compliance Officer are also employees of Fund Services. Fees paid by the Funds to Fund Services for these services for the six months ended September 30, 2023, are disclosed in the Statements of Operations.
Quasar Distributors, LLC (the “Distributor”) acts as the Funds’ principal underwriter in a continuous public offering of the Funds’ shares. U.S. Bank N.A. serves as custodian to the Funds. U.S. Bank N.A. is an affiliate of Fund Services.
The Funds have entered into Sub-Transfer Agent Arrangements (the “Arrangements”). All Arrangements must be approved by the Board. For the six months ended September 30, 2023, the Sub-Transfer Agent Fees and Transfer Agent Fees incurred by the Funds are disclosed in the Statements of Operations.
| Note 4 – Purchases and Sales of Securities |
For the six months ended September 30, 2023, the cost of purchases and proceeds from sales and maturities of securities, excluding short-term investments, were as follows:
| | | | Purchases | | | Sales | |
| | Osterweis Fund | | $ | 16,910,499 | | | $ | 24,143,406 | |
| | Osterweis Strategic Income Fund | | | 343,243,798 | | | | 364,346,062 | |
| | Osterweis Growth & Income Fund | | | 23,387,955 | | | | 20,408,075 | |
| | Osterweis Emerging Opportunity Fund | | | 82,998,810 | | | | 96,023,312 | |
| | Osterweis Total Return Fund | | | 119,477,029 | | | | 101,204,308 | |
| | Osterweis Short Duration Credit Fund | | | 2,822,775 | | | | 126,551,398 | |
| | Osterweis Sustainable Credit Fund | | | 458,328 | | | | 3,950,357 | |
For the six months ended September 30, 2023, the cost of purchases and proceeds from sales and maturities of long-term U.S. Government securities included above were as follows:
| | | | Purchases | | | Sales | |
| | Osterweis Total Return Fund | | $ | 51,973,649 | | | $ | 33,218,969 | |
The Osterweis Fund, Osterweis Strategic Income Fund, Osterweis Emerging Opportunity Fund, Osterweis Short Duration Credit Fund, and Osterweis Sustainable Credit Fund did not purchase or sell U.S. Government securities during the six months ended September 30, 2023.
Osterweis Funds | Notes to Financial Statements at September 30, 2023 (Unaudited) (Continued)
| Note 5 – Distributions to Shareholders |
The tax character of distributions paid during the six months ended September 30, 2023 and the year/period ended March 31, 2023, was as follows:
| | | | Ordinary Income | |
| | | | September 30, 2023 | | | | |
| | | | (Estimated) | | | March 31, 2023 | |
| | Osterweis Fund | | $ | — | | | $ | 11 | |
| | Osterweis Strategic Income Fund | | | 144,561,443 | | | | 230,705,874 | |
| | Osterweis Growth & Income Fund | | | 2,328,532 | | | | 3,015,079 | |
| | Osterweis Emerging Opportunity Fund | | | — | | | | — | |
| | Osterweis Total Return Fund | | | 2,138,857 | | | | 2,248,460 | |
| | Osterweis Short Duration Credit Fund | | | 3,234,836 | | | | 11,910,126 | |
| | Osterweis Sustainable Credit Fund | | | 145,119 | | | | 426,645 | |
| | | | | | | | | | |
| | | | Long-Term Capital Gains 1 | |
| | | | September 30, 2023 | | | | | |
| | | | (Estimated) | | | March 31, 2023 | |
| | Osterweis Fund | | $ | — | | | $ | 9,739,061 | |
| | Osterweis Strategic Income Fund | | | — | | | | — | |
| | Osterweis Growth & Income Fund | | | — | | | | 9,489,935 | |
| | Osterweis Emerging Opportunity Fund | | | — | | | | — | |
| | Osterweis Total Return Fund | | | — | | | | — | |
| | Osterweis Short Duration Credit Fund | | | — | | | | — | |
| | Osterweis Sustainable Credit Fund | | | — | | | | — | |
1 Designated as long-term capital gain dividend, pursuant to Internal Revenue Code Section 852(b)(3).
The cost basis of investments for federal income tax purposes at most recent fiscal year/period end, March 31, 2023, was as follows:
| | | | | | | | | | Growth & | | | Emerging | |
| | | | Osterweis | | | Strategic | | | Income | | | Opportunity | |
| | | | Fund | | | Income Fund | | | Fund | | | Fund | |
| | Cost of investments | | $ | 97,633,850 | | | $ | 5,041,102,201 | | | $ | 127,885,492 | | | $ | 189,630,896 | |
| | Gross tax unrealized appreciation | | | 44,117,735 | | | | 72,173,076 | | | | 29,775,688 | | | | 23,220,281 | |
| | Gross tax unrealized depreciation | | | (2,159,838 | ) | | | (467,045,514 | ) | | | (5,639,344 | ) | | | (11,323,428 | ) |
| | Net tax unrealized appreciation/depreciation | | | 41,957,897 | | | | (394,872,438 | ) | | | 24,136,344 | | | | 11,896,853 | |
| | Undistributed ordinary income | | | 521,022 | | | | 11,834,410 | | | | 197,156 | | | | — | |
| | Undistributed long-term capital gain | | | — | | | | — | | | | — | | | | — | |
| | Total distributable earnings | | | 521,022 | | | | 11,834,410 | | | | 197,156 | | | | — | |
| | Other accumulated gain/(loss) | | | (1,370,325 | ) | | | (417,013,678 | ) | | | — | | | | (39,026,702 | ) |
| | Total distributable (accumulated) earnings (losses) | | $ | 41,108,594 | | | $ | (800,051,706 | ) | | $ | 24,333,500 | | | $ | (27,129,849 | ) |
| | | | | | | | | | | | | | | | | | |
| | | | | | | | Total Return | | | Short Duration | | | Sustainable | |
| | | | | | | | Fund | | | Credit Fund | | | Credit Fund | |
| | Cost of investments | | | | | | $ | 141,594,914 | | | $ | 203,029,113 | | | $ | 5,498,050 | |
| | Gross tax unrealized appreciation | | | | | | | 989,614 | | | | 241,835 | | | | 53,828 | |
| | Gross tax unrealized depreciation | | | | | | | (7,419,882 | ) | | | (31,061,359 | ) | | | (822,350 | ) |
| | Net tax unrealized appreciation/depreciation | | | | | | | (6,430,268 | ) | | | (30,819,524 | ) | | | (768,522 | ) |
| | Undistributed ordinary income | | | | | | | 69,779 | | | | 63,000 | | | | 9,087 | |
| | Undistributed long-term capital gain | | | | | | | — | | | | — | | | | — | |
| | Total distributable earnings | | | | | | | 69,779 | | | | 63,000 | | | | 9,087 | |
| | Other accumulated gain/(loss) | | | | | | | (5,905,370 | ) | | | (23,523,140 | ) | | | (270,876 | ) |
| | Total distributable (accumulated) earnings (losses) | | | | | | $ | (12,265,859 | ) | | $ | (54,279,664 | ) | | $ | (1,030,311 | ) |
The tax difference between book basis and tax basis unrealized appreciation is attributable to wash sale deferrals.
Osterweis Funds | Notes to Financial Statements at September 30, 2023 (Unaudited) (Continued)
| Note 6 – Investments in Affiliates |
Affiliated companies are those that are “affiliated persons” as defined in Section 2(a)(3) of the 1940 Act. They include, among other entities, issuers 5% or more of whose outstanding voting shares are held by the Fund. For the six months ended September 30, 2023, the Funds had the following transactions with affiliated companies:
| | Osterweis Strategic Income Fund | | | | |
| | | | | | | | | | |
| | Affiliates | | | | | | | | |
| | | | | | | | | | |
| | | Share | | | | | Change in | | |
| | | Balance | Value | | | Realized | Unrealized | Value | |
| | Convertible | September 30, | March 31, | Acqui- | Dispo- | Gain | Appreciation/ | September 30, | Dividend |
| | Preferred Stocks | 2023 | 2023 | sitions | sitions | (Loss) | Depreciation | 2023 | Income |
| | Daseke, Inc., | | | | | | | | |
| | 7.625% | 490,000 | $46,512,760 | $— | $— | $— | $(6,060,320) | $40,452,440 | $1,868,126 |
| | | | | | |
| | Osterweis Growth & Income Fund | | | | |
| | | | | | | | | | |
| | | Share | | | | | Change in | | |
| | | Balance | Value | | | Realized | Unrealized | Value | |
| | Convertible | September 30, | March 31, | Acqui- | Dispo- | Gain | Appreciation/ | September 30, | Dividend |
| | Preferred Stocks | 2023 | 2023 | sitions | sitions | (Loss) | Depreciation | 2023 | Income |
| | Daseke, Inc., | | | | | | | | |
| | 7.625% | 10,000 | $949,240 | $— | $— | $— | $(123,680) | $825,560 | $38,126 |
U.S. Bank N.A. has made available to the Funds credit facilities pursuant to separate Loan and Security Agreements for temporary or extraordinary purposes. Credit facility details for the six months ended September 30, 2023, are as follows:
| | | | | | Osterweis | | | Osterweis | | | Osterweis | | | Osterweis | | | Osterweis | | | | |
| | | | | | Strategic | | | Growth & | | | Emerging | | | Total | | | Short | | | Osterweis | |
| | | Osterweis | | | Income | | | Income | | | Opportunity | | | Return | | | Duration | | | Sustainable | |
| | | Fund | | | Fund | | | Fund | | | Fund | | | Fund | | | Credit Fund | | | Credit Fund | |
| | Maximum available | | | | | | | | | | | | | | | | | | | | |
| | credit | $ | 20,000,000 | | | $ | 300,000,000 | | | $ | 20,000,000 | | | $ | 15,000,000 | | | $ | 10,000,000 | | | $ | 15,000,000 | | | $ | — | |
| | Largest amount | | | | | | | | | | | | | | | | | | | | | | | | | | | |
| | outstanding on | | | | | | | | | | | | | | | | | | | | | | | | | | | |
| | an individual day | | — | | | | — | | | | — | | | | — | | | | — | | | | — | | | | — | |
| | Average balance | | | | | | | | | | | | | | | | | | | | | | | | | | | |
| | when in use | | — | | | | — | | | | — | | | | — | | | | — | | | | — | | | | — | |
| | Credit facility outstanding | | | | | | | | | | | | | | | | | | | | | | | | | | |
| | as of September 30, 2023 | — | | | | — | | | | — | | | | — | | | | — | | | | — | | | | — | |
| | Average interest | | | | | | | | | | | | | | | | | | | | | | | | | | | |
| | rate when in use | | — | | | | — | | | | — | | | | — | | | | — | | | | — | | | | — | |
Interest expenses for the six months ended September 30, 2023, are disclosed in the Statements of Operations, as applicable.
| Note 8 – Risks Associated with the Discontinuation of the London Interbank Offered Rate (“LIBOR”) |
Several of the Funds invest in corporate bonds that have interest rate provisions linked to LIBOR. LIBOR is used extensively in the U.S. and globally as a “benchmark” or “reference rate” for such loans. It is expected that a number of private-sector banks currently reporting information used to set LIBOR will stop doing so after 2021 when their current reporting commitment ends, which could either cause LIBOR to stop publication immediately or cause LIBOR’s regulator to determine that its quality has degraded to the degree that it is no longer representative of its underlying market. The expected discontinuation of LIBOR may impact the functioning, liquidity, and value of these.
Osterweis Funds | Expense Examples For the Six Months Ended September 30, 2023 (Unaudited)
As a shareholder of the Funds, you incur ongoing costs, including investment advisory fees and other Fund expenses. These examples are intended to help you understand your ongoing costs (in dollars) of investing in the Funds and to compare these costs with the ongoing costs of investing in other mutual funds. These examples are based on an investment of $1,000 invested at the beginning of the period and held for the entire period (April 1, 2023 – September 30, 2023).
Actual Expenses
The “Actual” line for each of the following tables provides information about actual account values based on actual returns and actual expenses. Although the Funds charge no sales load or other transaction fees, you will be assessed fees for outgoing wire transfers, returned checks and stop payment orders at prevailing rates charged by Fund Services, the Funds’ transfer agent. If you request that a redemption be made by wire transfer, the Funds’ transfer agent currently charges a $15.00 fee. An Individual Retirement Account will be charged an annual maintenance fee. To the extent the Funds invest in shares of other investment companies as part of their strategies, you will indirectly bear your proportionate share of any fees and expenses charged by the underlying funds in which the Funds invest in addition to the expenses of the Funds. Actual expenses of the underlying funds may vary. These expenses are not included in the following examples. The following examples include, but are not limited to, investment advisory fees, fund accounting fees, fund administration fees, custody fees and transfer agent fees. However, the following examples do not include portfolio trading commissions and related expenses. You may use the information in this line, together with the amount you invested, to estimate the expenses that you paid over the period. Simply divide your account value by $1,000 (for example, an $8,600 account value divided by $1,000 = 8.6), then multiply the result by the number in the first line under the heading titled “Expenses Paid During the Period” to estimate the expenses you paid on your account during this period.
Hypothetical Example for Comparison Purposes
The “Hypothetical” line for each of the following tables provides information about hypothetical account values and hypothetical expenses based on the Funds’ actual expense ratios and an assumed rate of return of 5% per year before expenses, which is not the Funds’ actual return. The hypothetical account values and expenses may not be used to estimate the actual ending account balance or expenses you paid for the period. You may use this information to compare the ongoing costs of investing in the Funds and other funds. To do so, compare this 5% hypothetical example with the 5% hypothetical examples that appear in the shareholder reports of the other funds.
| | | Beginning | | | Ending | | | | |
| | | Account Value | | | Account Value | | | Expenses Paid | |
| | | 4/1/23 | | | 9/30/23 | | During the Period 1 |
| Osterweis Fund | | | | | | | | | |
| Actual | | $ | 1,000.00 | | | $ | 1,015.30 | | | $ | 4.79 | |
| Hypothetical (5% annual return before expenses) | | | 1,000.00 | | | | 1,020.25 | | | | 4.80 | |
| | | | | | | | | | | | | |
| Strategic Income Fund | | | | | | | | | | | | |
| Actual | | | 1,000.00 | | | | 1,041.90 | | | | 4.34 | |
| Hypothetical (5% annual return before expenses) | | | 1,000.00 | | | | 1,020.75 | | | | 4.29 | |
| | | | | | | | | | | | | |
| Growth & Income Fund | | | | | | | | | | | | |
| Actual | | | 1,000.00 | | | | 1,007.10 | | | | 4.52 | |
| Hypothetical (5% annual return before expenses) | | | 1,000.00 | | | | 1,020.50 | | | | 4.55 | |
| | | | | | | | | | | | | |
| Emerging Opportunity Fund | | | | | | | | | | | | |
| Actual | | | 1,000.00 | | | | 1,005.50 | | | | 5.52 | |
| Hypothetical (5% annual return before expenses) | | | 1,000.00 | | | | 1,019.50 | | | | 5.55 | |
| | | | | | | | | | | | | |
| Total Return Fund | | | | | | | | | | | | |
| Actual | | | 1,000.00 | | | | 969.60 | | | | 3.25 | |
| Hypothetical (5% annual return before expenses) | | | 1,000.00 | | | | 1,021.70 | | | | 3.34 | |
Osterweis Funds | Expense Examples For the Six Months Ended September 30, 2023 (Unaudited) (Continued)
| | | Beginning | | | Ending | | | | |
| | | Account Value | | | Account Value | | | Expenses Paid | |
| | | 4/1/23 | | | 9/30/23 | | During the Period 1 |
| Short Duration Credit Fund | | | | | | | | | |
| Actual | | $ | 1,000.00 | | | $ | 983.10 | | | $ | 4.76 | |
| Hypothetical (5% annual return before expenses) | | | 1,000.00 | | | | 1,020.20 | | | | 4.85 | |
| | | | | | | | | | | | | |
| Sustainable Credit Fund | | | | | | | | | | | | |
| Actual | | | 1,000.00 | | | | 989.00 | | | | 4.92 | |
| Hypothetical (5% annual return before expenses) | | | 1,000.00 | | | | 1,020.05 | | | | 5.00 | |
1 | Expenses are equal to the annualized net expense ratio for the most recent six-month period. The annualized six-month expense ratios for the Osterweis Fund, Osterweis Strategic Income Fund, Osterweis Growth & Income Fund, Osterweis Emerging Opportunity Fund, Osterweis Total Return Fund, Osterweis Short Duration Credit Fund, and Osterweis Sustainable Credit Fund were Duration Credit Fund, and the Osterweis Sustainable Credit Fund were 0.95%, 0.85%, 0.90%, 1.10%, 0.66%, 0.96%, and 0.99% (reflecting fee waivers and recoupments in effect), respectively, multiplied by the average account value over the period multiplied by 183/366 (to reflect the one-half year period). |
Additional Information
| Information About Proxy Voting |
A description of the policies and procedures that the Funds use to determine how to vote proxies relating to portfolio securities is available upon request without charge by calling toll-free at (866) 236-0050 or by accessing the U.S. Securities and Exchange Commission’s (SEC) website at www.sec.gov.
Information regarding how the Funds voted proxies relating to portfolio securities during the most recent twelve months ended June 30 is available upon request without charge by calling toll-free at (866) 236-0050 or by accessing the SEC’s website at www.sec.gov.
| Information About the Portfolio Holdings |
The Funds’ quarterly holdings for the most recent fiscal year can be obtained by accessing the Funds’ website at www.osterweis.com/literature. The Funds file their complete schedule of portfolio holdings with the SEC for the first and third quarters of each fiscal year as an exhibit to their reports on Form N-PORT. The Funds’ Form N-PORT is available on the SEC’s website at www.sec.gov. The Fund’s Form N-PORT may also be obtained by calling (866) 236-0050.
Each year, you are automatically sent an updated prospectus as well as annual and semi-annual reports for the Funds, if applicable. To reduce expenses, the Funds may mail only one copy of each Fund’s prospectus and each annual and semi-annual report to those addresses shared by two or more accounts. If you wish to receive individual copies of these documents, please call the Funds’ transfer agent at (866) 236-0050 (or contact your financial institution). We will begin sending you individual copies thirty days after receiving your request.
| Information About the Funds Trustees |
The Statement of Additional Information (“SAI”) includes additional information about the Funds’ Trustees and is available without charge, upon request, by calling (866) 236-0050. Furthermore, you can obtain the SAI on the SEC’s website at www.sec.gov or the Funds’ website at www.osterweis.com.
Approval of Investment Advisory Agreements (Unaudited)
OSTERWEIS FUND
OSTERWEIS STRATEGIC INCOME FUND
OSTERWEIS GROWTH & INCOME FUND
OSTERWEIS EMERGING OPPORTUNITY FUND
OSTERWEIS TOTAL RETURN FUND
At a meeting held on August 17-18, 2023, the Board (which is comprised of five persons, all of whom are Independent Trustees as defined under the Investment Company Act) considered and approved the continuance of the Investment Advisory Agreements (the “Advisory Agreements”) between Professionally Managed Portfolios (the “Trust”) and Osterweis Capital Management, Inc. for the Osterweis Fund and Osterweis Capital Management, LLC for each of the Osterweis Strategic Income Fund, the Osterweis Growth & Income Fund, the Osterweis Emerging Opportunity Fund and the Osterweis Total Return Fund (each a “Fund,” and together, the “Funds”). Osterweis Capital Management, Inc. and Osterweis Capital Management, LLC are referred to individually as an “Adviser” and collectively as the “Advisers” or “Osterweis.” At this meeting and at a prior meeting held on June 26, 2023, the Board received and reviewed substantial information regarding the Funds, the Advisers and the services provided by the Advisers to the Funds under the Advisory Agreements. This information, together with the information provided to the Board throughout the course of the year, formed the primary (but not exclusive) basis for the Board’s determinations. Below is a summary of the factors considered by the Board and the conclusions that formed the basis for the Board’s approval of the continuance of the Advisory Agreements:
| | 1. | The nature, extent and quality of the services provided and to be provided by the Advisers under the Advisory Agreements. The Trustees considered the nature, extent and quality of the Advisers’ overall services provided to the Funds as well as their specific responsibilities in all aspects of day-to-day investment management of the Funds. The Board considered the qualifications, experience and responsibilities of the portfolio managers, as well as the responsibilities of other key personnel of the Advisers involved in the day-to-day activities of the Funds. The Board also considered the resources and compliance structure of the Advisers, including information regarding their compliance program, their chief compliance officer and the Advisers’ compliance record, as well as the Advisers’ cybersecurity program, business continuity plan and risk management process. The Board also considered the prior relationship between the Advisers and the Trust, as well as the Board’s knowledge of the Advisers’ operations, and noted that during the course of the prior year they had met with certain personnel of the Advisers to discuss fund performance and investment outlook, as well as, various marketing and compliance topics, including the Advisers’ risk management process. The Board concluded that the Advisers had the quality and depth of personnel, resources, investment processes and compliance policies and procedures essential to performing their duties under the Advisory Agreements, and that they were satisfied with the nature, overall quality and extent of such management services. |
| | | |
| | 2. | The Funds’ historical performance and the overall performance of the Advisers. In assessing the quality of the portfolio management delivered by the Advisers, the Board reviewed the short-term and long-term performance of each Fund on both an absolute basis, and in comparison to its peer funds utilizing Morningstar classifications, appropriate securities market benchmarks and the Advisers’ similarly managed accounts, all for periods ended March 31, 2023. The Board also considered performance against a smaller group of peers selected by an independent third-party consultant engaged by the Board to assist it in its 15(c) review (the “Cohort”). While the Board considered both short-term and long-term performance, it placed greater emphasis on longer term performance. When reviewing each Fund’s performance against its comparative peer group universe, the Board took into account that the investment objective and strategies of each Fund, as well as its level of risk tolerance, may differ significantly from funds in its respective peer universe. When reviewing the Funds’ performance against broad market benchmarks, the Board took into account the differences in portfolio construction between the Funds and such benchmarks as well as other differences between actively managed funds and passive benchmarks, such as objectives and risks. In assessing periods of relative underperformance or outperformance, the Board took into account that relative performance can be significantly impacted by performance measurement periods and that some periods of underperformance may be transitory in nature while others may reflect more significant underlying issues. |
Approval of Investment Advisory Agreements (Unaudited) (Continued)
| | | For the Osterweis Fund, the Board noted that the Fund underperformed its Morningstar peer group average for the one-, three- and ten-year periods and outperformed for the five-year period. The Board also noted that the Fund outperformed the average of its Cohort for the one-year period and underperformed for the three-, five-, and ten-year periods. The Board also considered the underperformance of the Fund against its broad-based securities market benchmark for the one-, three-, five-, and ten-year periods. The Board also considered the Fund’s outperformance compared to the Adviser’s core equity composite for the one-, three- and five-year periods and underperformed for the ten-year period. |
| | | |
| | | For the Osterweis Strategic Income Fund, the Board noted that the Fund outperformed its Morningstar peer group average for the one-, three- , five-, and ten-year periods. The Board also noted that the Fund outperformed the average of its Cohort for the one- and three-year periods and underperformed for the five- and ten-year periods. The Board also considered the outperformance of the Fund against its broad-based securities market benchmark for the one-, three-, five-, and ten-year periods. The Trustees noted that the Adviser does not replicate the Osterweis Strategic Income Fund’s investment style in separately managed accounts. |
| | | |
| | | For the Osterweis Growth & Income Fund, the Board noted that the Fund had underperformed its Morningstar peer group average for the one-year period and outperformed for the three-, five- and ten-year periods. The Board also noted that the Fund underperformed the average of its Cohort for the one- and ten-year periods and performed for the three- and five-year periods. The Board also considered the performance of the Fund against its broad-based securities market benchmark, noting it underperformed for the one-year period and outperformed for the three-, five-, and ten-year periods. The Board also considered the Fund’s outperformance compared to the Adviser’s growth & income composite for the one- and three-year periods and underperformance for the five- and ten-year periods, noting such differences were not significant. |
| | | |
| | | For the Osterweis Emerging Opportunity Fund, the Board noted that the Fund had outperformed its Morningstar peer group average for the one-, three-, five-, and ten-year periods. The Board also noted that the Fund outperformed the average of its Cohort for the one-, three-, five- and ten-year periods. The Board also considered the performance of the Fund against its broad-based securities market benchmark, noting it outperformed for the one-, three- and five-, and ten-year periods. The Board also considered the Fund’s underperformance compared to the Adviser’s emerging growth composite for the one-, three-, five-, and ten-year periods, noting such differences were not significant. |
| | | |
| | | For the Osterweis Total Return Fund, the Board noted that the Fund had outperformed its Morningstar peer group average for the one- and five-year periods and underperformed for the three-year period. The Board also noted that the Fund outperformed the average of its Cohort for the one-, three-, and five-year periods. The Board also considered the performance of the Fund against its broad-based securities market benchmark, noting it outperformed for the one-, three-, and five-year periods. The Trustees noted that the Adviser does not replicate the Osterweis Total Return Fund’s investment style in separately managed accounts. |
| | | |
| | 3. | The costs of the services provided by the Advisers and the structure of the Advisers’ fees under the Advisory Agreements. In considering the advisory fee and total fees and expenses of each Fund, the Board reviewed comparisons to the peer funds and similarly managed separate accounts for other types of clients advised by the Advisers, as well as all expense waivers and reimbursements. When reviewing fees charged to other similarly managed accounts, the Board took into consideration the type of account and the differences in the management of that account that might be germane to the difference, if any, in the fees charged to such accounts. |
| | | |
| | | For the Osterweis Fund, the Board noted that the Adviser had contractually agreed to maintain an annual expense ratio of 0.95% excluding certain operating expenses (the “Expense Cap”). The Board noted that the Fund’s net expense ratio was higher than its peer group average. The Board noted that the Fund’s advisory fee was above the average of its Cohort and below the median and the Fund’s net expense ratio was lower than the median of its Cohort and above the average. The Board noted that the fees charged to other similarly managed account clients were higher than, equal to, or lower than those charged to the Osterweis Fund depending on the level of assets. |
Approval of Investment Advisory Agreements (Unaudited) (Continued)
| | | The Board concluded that the fees paid to the Adviser were fair and reasonable in light of the comparative performance and advisory fee information. |
| | | |
| | | For the Osterweis Strategic Income Fund, the Board noted that the Fund’s net expense ratio was lower than its peer group average. The Board noted that the Fund’s advisory fee and net expense ratio were higher than the median and average of its Cohort. The Board considered that the advisory fee included breakpoints in order to share economies of scale with the Fund and that the breakpoints were currently in effect. The Trustees noted that the Adviser does not replicate the Osterweis Strategic Income Fund’s investment style in separately managed accounts. The Board concluded that the fees paid to the Adviser were fair and reasonable in light of the comparative performance and advisory fee information. |
| | | |
| | | For the Osterweis Growth & Income Fund, the Board noted that the Fund’s net expense ratio was higher than the average of its peer group median. The Board also noted that the Fund’s advisory fee and net expense ratio were higher than the Cohort median and average. The Board noted that the fees charged to other similarly managed account clients were higher than, equal to, or lower than those charged to the Osterweis Growth & Income Fund depending on the level of assets. The Board concluded that the fees paid to the Adviser were fair and reasonable in light of the comparative performance and advisory fee information. |
| | | |
| | | For the Osterweis Emerging Opportunity Fund, the Board noted that the Adviser had contractually agreed to maintain an annual expense ratio of 1.10% (the “Expense Cap”). The Board noted that the Fund’s net expense ratio was lower than that of its peer group average. The Board noted that the Fund’s advisory fee and net expense ratio were higher than the median and average of its Cohort. The Board considered that the advisory fee included breakpoints in order to share economies of scale with the Fund, although Fund assets had not yet grown to a point where the breakpoint has been reached. The Board noted that the fees charged to other similarly managed account clients were higher than or equal to those charged to the Osterweis Emerging Opportunity Fund depending on the level of assets. The Board concluded that the fees paid to the Adviser were fair and reasonable in light of the comparative performance and advisory fee information. |
| | | |
| | | For the Osterweis Total Return Fund, the Board noted that the Adviser had contractually agreed to maintain an annual expense ratio of 0.75% (the “Expense Cap”) although the Fund is currently operating below that level. The Board noted that the Fund’s net expense ratio was lower than that of its peer group average. The Board noted that the Fund’s advisory fee and net expense ratio were higher than the median and average of its Cohort. The Trustees noted that the Adviser does not replicate the Osterweis Total Return Fund’s investment style in separately managed accounts. The Board concluded that the fees paid to the Adviser were fair and reasonable in light of the comparative performance and advisory fee information. |
| | | |
| | 4. | Economies of Scale. The Board also considered whether economies of scale were being realized by the Advisers that should be shared with shareholders. The Board noted that the Advisory Agreements for the Osterweis Strategic Income Fund and Osterweis Emerging Opportunity Fund contain breakpoints in the advisory fee. The Board also noted that the Adviser has contractually agreed to reduce its advisory fees or reimburse expenses so that the Osterweis Fund, Osterweis Emerging Opportunity Fund, and Osterweis Total Return Fund do not exceed their respective Expense Cap. The Board noted that at current asset levels, it did not appear that there were additional significant economies of scale being realized by the Adviser that should be shared with shareholders and concluded that it would continue to monitor economies of scale in the future as circumstances changed and assuming asset levels continued to increase. |
Approval of Investment Advisory Agreements (Unaudited) (Continued)
| | 5. | The profits to be realized by the Advisers and their affiliates from their relationship with the Funds. The Board reviewed the Advisers’ financial information and took into account both the direct benefits and the indirect benefits to the Advisers from advising the Funds. The Board considered the profitability to the Advisers from their relationship with the Funds and considered any additional material benefits derived by the Advisers from their relationship with the Funds, particularly benefits received in exchange for “soft dollars” paid to the Advisers. After such review, the Board determined that the profitability to the Advisers with respect to the Advisory Agreements was not excessive, and that the Advisers had maintained adequate financial resources to support the services they provide to the Funds. |
No single factor was determinative of the Board’s decision to approve the continuance of the Advisory Agreements, but rather the Board based its determination on the total mix of information available to the Trustees. Based on a consideration of all the factors in their totality, the Board determined that the advisory arrangements with the Advisers, including each Fund’s advisory fee, were fair and reasonable. The Board therefore determined that the continuance of the Advisory Agreements would be in the best interest of each Fund and its shareholders.
Statement Regarding Liquidity Risk Management Program (Unaudited)
The Funds have adopted a liquidity risk management program (the “program”). The Board has designated the Adviser to serve as the administrator of the program. Personnel of the Adviser conduct the day-to-day operation of the program pursuant to policies and procedures administered by the Adviser.
Under the program, the Adviser manages the Funds’ liquidity risk, which is the risk that the Funds could not meet shareholder redemption requests without significant dilution of remaining shareholders’ interests in the Funds. This risk is managed by monitoring the degree of liquidity of each Funds’ investments, limiting the amount of the Funds’ illiquid investments, and utilizing various risk management tools and facilities available to the Funds for meeting shareholder redemptions, among other means. The Adviser’s process of determining the degree of liquidity of the Funds’ investments is supported by one or more third-party liquidity assessment vendors.
The Board reviewed a report prepared by the Adviser regarding the operation and effectiveness of the program for the period January 1, 2022 through December 31, 2022. No significant liquidity events impacting any of the Funds were noted in the report. In addition, the Adviser provided its assessment that the program had been effective in managing the Funds’ liquidity risk.
Osterweis Funds | Privacy Notice (Unaudited)
The Funds collect non-public information about you from the following sources:
• Information we receive about you on applications or other forms;
• Information you give us orally; and
• Information about your transactions with us or others.
The Funds do not disclose any non-public personal information about our customers or former customers without the customer’s authorization, except as permitted by law or in response to inquiries from governmental authorities. The Funds may share information with affiliated parties and unaffiliated third parties with whom we have contracts for servicing the Funds. The Funds will provide unaffiliated third parties with only the information necessary to carry out their assigned responsibility. The Funds maintain physical, electronic and procedural safeguards to guard your non-public personal information and require third parties to treat your non-public information with the same high degree of confidentiality.
In the event that you hold shares of a Fund through a financial intermediary, including, but not limited to, a broker-dealer, bank or trust company, the privacy policy of your financial intermediary would govern how your non-public personal information would be shared by those entities with unaffiliated third parties.
(This Page Intentionally Left Blank.)
Advisers
OSTERWEIS CAPITAL MANAGEMENT, INC.
OSTERWEIS CAPITAL MANAGEMENT, LLC
One Maritime Plaza, Suite 800
San Francisco, CA 94111
Distributor
QUASAR DISTRIBUTORS, LLC
111 East Kilbourn Avenue, Suite 2200
Milwaukee, WI 53202
Custodian
U.S. BANK N.A.
Custody Operations
1555 North RiverCenter Drive, Suite 302
Milwaukee, WI 53212
Transfer Agent, Fund Accountant and Fund Administrator
U.S. BANCORP FUND SERVICES, LLC
615 East Michigan Street
Milwaukee, WI 53202
(866) 236-0050
Independent Registered Public Accounting Firm
TAIT, WELLER & BAKER LLP
Two Liberty Place
50 South 16th Street, Suite 2900
Philadelphia, PA 19102
Legal Counsel
SULLIVAN & WORCESTER LLP
1633 Broadway, 32nd Floor
New York, NY 10019
Fund Information
| | Fund | Symbol | CUSIP | |
| | Osterweis Fund | OSTFX | 742935406 | |
| | Osterweis Strategic Income Fund | OSTIX | 742935489 | |
| | Osterweis Growth & Income Fund | OSTVX | 74316J771 | |
| | Osterweis Emerging Opportunity Fund | OSTGX | 74316P744 | |
| | Osterweis Total Return Fund | OSTRX | 74316P736 | |
| | Osterweis Short Duration Credit Fund | ZEOIX | 74316P694 | |
| | Osterweis Sustainable Credit Fund | ZSRIX | 74316P686 | |
OWRPSEMI – 0923
Item 2. Code of Ethics.
Not applicable for semi-annual reports.
Item 3. Audit Committee Financial Expert.
Not applicable for semi-annual reports.
Item 4. Principal Accountant Fees and Services.
Not applicable for semi-annual reports.
Item 5. Audit Committee of Listed Registrants.
Not applicable to registrants who are not listed issuers (as defined in Rule 10A-3 under the Securities Exchange Act of 1934).
Item 6. Investments.
(a) Schedule of Investments is included as part of the report to shareholders filed under Item 1 of this Form.
(b) Not applicable.
Item 7. Disclosure of Proxy Voting Policies and Procedures for Closed-End Management Investment Companies.
Not applicable to open-end investment companies.
Item 8. Portfolio Managers of Closed-End Management Investment Companies.
Not applicable to open-end investment companies.
Item 9. Purchases of Equity Securities by Closed‑End Management Investment Company and Affiliated Purchasers.
Not applicable to open-end investment companies.
Item 10. Submission of Matters to a Vote of Security Holders.
There have been no material changes to the procedures by which shareholders may recommend nominees to the registrant’s board of Trustees.
Item 11. Controls and Procedures.
| (a) | The Registrant’s President/Principal Executive Officer and Treasurer/Principal Financial Officer have reviewed the Registrant's disclosure controls and procedures (as defined in Rule 30a-3(c) under the Investment Company Act of 1940 (the “Act”)) as of a date within 90 days of the filing of this report, as required by Rule 30a-3(b) under the Act and Rules 13a-15(b) or 15d‑15(b) under the Securities Exchange Act of 1934. Based on their review, such officers have concluded that the disclosure controls and procedures are effective in ensuring that information required to be disclosed in this report is appropriately recorded, processed, summarized and reported and made known to them by others within the Registrant and by the Registrant’s service provider. |
| (b) | There were no changes in the Registrant's internal control over financial reporting (as defined in Rule 30a-3(d) under the Act) that occurred during the period covered by this report that have materially affected, or are reasonably likely to materially affect, the Registrant's internal control over financial reporting. |
Item 12. Disclosure of Securities Lending Activities for Closed-End Management Investment Companies
Not applicable to open-end investment companies.
Item 13. Exhibits.
| (a) | (1) Any code of ethics or amendment thereto, that is the subject of the disclosure required by Item 2, to the extent that the registrant intends to satisfy Item 2 requirements through filing an exhibit. Incorporated by reference to previous Form N-CSR filing. |
(3) Any written solicitation to purchase securities under Rule 23c‑1 under the Act sent or given during the period covered by the report by or on behalf of the registrant to 10 or more persons. Not applicable to open-end investment companies.
(4) Change in the registrant’s independent public accountant. There was no change in the registrant’s independent public accountant for the period covered by this report.
SIGNATURES
Pursuant to the requirements of the Securities Exchange Act of 1934 and the Investment Company Act of 1940, the registrant has duly caused this report to be signed on its behalf by the undersigned, thereunto duly authorized.
(Registrant) Professionally Managed Portfolios
By (Signature and Title) /s/Jason Hadler
Jason Hadler, President/Principal Executive Officer
Date December 8, 2023
Pursuant to the requirements of the Securities Exchange Act of 1934 and the Investment Company Act of 1940, this report has been signed below by the following persons on behalf of the registrant and in the capacities and on the dates indicated.
By (Signature and Title) /s/Jason Hadler
Jason Hadler, President/Principal Executive Officer
Date December 8, 2023
By (Signature and Title) /s/Craig Benton
Craig Benton, Treasurer/Principal Financial Officer
Date December 8, 2023
* Print the name and title of each signing officer under his or her signature.