UNITED STATES
SECURITIES AND EXCHANGE COMMISSION
Washington, D.C. 20549
SECURITIES AND EXCHANGE COMMISSION
Washington, D.C. 20549
FORM N-CSR
CERTIFIED SHAREHOLDER REPORT OF REGISTERED
MANAGEMENT INVESTMENT COMPANIES
Investment Company Act file number (811-05037)
Professionally Managed Portfolios
(Exact name of registrant as specified in charter)
(Exact name of registrant as specified in charter)
615 East Michigan Street
Milwaukee, WI 53202
(Address of principal executive offices) (Zip code)
(Address of principal executive offices) (Zip code)
Jason Hadler
Professionally Managed Portfolios
c/o U.S. Bank Global Fund Services
777 E. Wisconsin Ave.
777 E. Wisconsin Ave.
Milwaukee, WI 53202
(Name and address of agent for service)
(Name and address of agent for service)
(414) 516-1523
Registrant's telephone number, including area code
Date of fiscal year end: December 31
Date of reporting period: December 31, 2023
Item 1. Report to Stockholders.
(a)
Ticker: BRGIX
Annual
Shareholder Report
December 31, 2023
Table of Contents
Shareholder Letter | 1 | ||
Sector Allocation | 6 | ||
Performance Chart and Analysis | 7 | ||
Schedule of Investments | 8 | ||
Statement of Assets and Liabilities | 10 | ||
Statement of Operations | 11 | ||
Statements of Changes in Net Assets | 12 | ||
Financial Highlights | 13 | ||
Notes to Financial Statements | 14 | ||
Report of Independent Registered Public Accounting Firm | 21 | ||
Expense Example | 22 | ||
Approval of Investment Advisory Agreement | 24 | ||
Trustees and Executive Officers | 27 | ||
Additional Information | 33 | ||
Privacy Notice | 35 | ||
January 15, 2024
Dear Shareholder:
Performance
Bridges Investment Fund had a total return of 38.91% for the one-year period ending December 31, 2023. By comparison, the S&P 500 had a total return of 26.29% during 2023. The Fund had annualized total returns of 7.62%, 15.80%, and 11.13% for the 3, 5, and 10-year periods ending December 31, 2023, compared to total returns of 10.00%, 15.69%, and 12.03% for the S&P 500. Three, five, and ten-year periods are annualized. The Fund’s gross expense ratio is 0.75% from the prospectus dated April 30, 2023.
Performance data quoted represents past performance. Past performance does not guarantee future results. The investment return and principal value of an investment will fluctuate so that an investor’s shares, when redeemed, may be worth more or less than their original cost. The current performance of the Fund may be lower or higher than the performance stated above. Performance data current to the most recent month end may be obtained by calling 866-934-4700.
Review of 2023 and Outlook for 2024
For most investors, 2023 was the mirror image of 2022.
U.S stocks declined sharply in 2022 as interest rates rose sharply during the year. The S&P 500 had a total return of -18.11%, the Russell 2000 had a total return of -20.46%, and the Nasdaq 100 had a total return of -32.38%, making 2022 one of the worst years for investors in several decades.
The rapid and large increase in interest rates in 2022 had the effect of significantly contracting the valuations of long-duration assets; the S&P 500 P/E on twelve-month trailing earnings declined from 24.7x at year-end 2021 to 18.7x at year-end 2022.
In 2023, there was continued interest rate volatility throughout the year. The benchmark 10-year Treasury ended 2022 at 3.87%, fell to 3.37% on January 18 (a 50 basis point decline in less than three weeks!), rallied to 4.06% on March 2, and then fell back to 3.31% on April 2 (a 75 basis point drop in four weeks!!).
From April 2, the 10-year yield rallied to 4.99% on October 19 – the first time the 10-year had traded at that level since July 2, 2007.
Investors rushed to capture the highest yields in years, which sparked a bond market rally through year-end, with the 10-year yield closing 2023 at 3.88%, one basis point higher than where it started the year.
But, unlike 2022, when sharply higher interest rates contracted equity valuations, 2023 saw investors accept higher interest rates with much more equanimity.
Between March 31 and October 19, the 10-year yield increased by 168 basis points, which typically would present a significant headwind for stocks. However, the S&P 500 returned 5% over that stretch, and then added another 11.86% over the rest of the year, to finish 2023 with a 26.29% total return.
1
We believe that the marked change in investor behavior in 2023 was primarily due to two factors: 1) while interest rates were peaking in October, the trend in inflation data over the course of the year had begun to slow meaningfully, which prompted equity investors to begin to anticipate eventual interest rate cuts by the Fed (consensus expectations centered on Fed transitioning to a less hawkish stance by mid-2024), and 2) corporate earnings held in well during 2023, confounding many who expected the onset of a recession at some point during the year. A recession never materialized, and corporate earnings performance was strong enough to support higher stock prices and valuations across the year.
Entering 2024, we expect that those two factors — interest rates, and corporate earnings — will likely have a significant impact on the path of stock prices over the next twelve months, and beyond.
Fortunately, our success as investors is not dependent on our ability to predict events over a one-year period.
Rather, our success is determined by our ability to invest capital in businesses that have demonstrated an ability to grow their intrinsic value for shareholders over the long run, and which, based on our analysis, appear likely to be able to continue to generate financial performance in the future that is consistent with the strength and durability of their competitive advantage.
While we seek to be aware of the opportunity set in front of us in capital markets, our primary focus is on assessing the quality, growth prospects, and valuations of exceptional businesses that have durable competitive advantage, and the fundamental attributes of those businesses that will impact their ability to grow their value over a long investment horizon.
We expect significant capital markets volatility again in 2024, but we will seek to use elevated levels of volatility to opportunistically improve the quality of the portfolio’s holdings and increase the portfolio’s aggregate implied forward return.
Consistent with the last five years, we expect that 2024 will be challenging, volatile, and full of surprises. Our job is to continue to allocate the Fund’s capital well within the context of a long time horizon, by investing in businesses that can compound shareholder value at attractive rates over the long-term.
In last year’s annual shareholder letter, we noted that while 2022 was a difficult year (S&P 500 down 18%, the Fund down 29%), history shows that stocks typically recover well in the five years subsequent to large equity market drawdowns, averaging 111% total returns over the five years off bear market lows.
From 2022’s low on October 12 through year-end 2023, the S&P 500 had a total return of 36.05%, and the Fund had a total return of 43.85%. The recovery that we believed would eventually occur is well underway, and while our near-term expectations are muted given the sharp advance in stock prices and valuations in 2023, we remain constructive on the long-term outlook for U.S. public equities in general, and the Fund’s holdings specifically.
Our Portfolio
The Fund’s investment philosophy is based on our belief that companies that have durable competitive advantage and significant opportunities to grow over long periods of time can compound returns that they earn on their equity capital to drive growth in shareholder value at attractive rates.
2
As such, our investment process focuses on identifying business that clearly demonstrate the elements that we believe are most important in our investment philosophy:
| 1. | High quality business — as evidenced by a strong balance sheet, and a demonstrated ability to generate free cash flow | |
| 2. | Durable competitive advantage — as evidenced by the ability to earn high returns on equity capital over many years. | |
| 3. | Shareholder friendly management that uses adroit capital allocation skills to grow a business’ intrinsic value. | |
| 4. | Opportunities to leverage competitive advantage by competing in markets that appear to have long runways for growth, and/or the opportunity to meaningfully increase share in slower-growing markets. | |
| 5. | Are available at valuations that are sensible given the elements outlined above, and that trade near, or well below, our estimate of “fair value” over a long investment horizon. |
Consistent with our investment philosophy and our investment process, the Fund’s portfolio is comprised primarily of companies with strong balance sheets, high levels of profitability, and a demonstrated ability to grow free cash flow and business value over the long-term despite periodically challenging economic conditions.
The Fund’s ten largest individual stock holdings as a percent of net assets as of December 31, 2023, were:
| Alphabet | 10.8 | |||
| Microsoft | 9.4 | |||
| Apple | 8.3 | |||
| Amazon | 7.3 | |||
| Nvidia | 4.6 | |||
| Mastercard | 4.5 | |||
| Visa | 4.0 | |||
| Old Dominion | 3.9 | |||
| Palo Alto Networks | 3.8 | |||
| United Health Group | 3.3 |
The following table summarizes the changes we made in the Fund in 2023:
| New Buys: | Adds: | Trims: | Sells: |
| Copart | Alcon | Adobe | Cable One |
| Generac | Casey’s General | Alphabet | Edwards |
| Lithia Motors | Stores | American Tower | Lifesciences |
| Pool Corporation | EOG Resources | Apple | IAA, Inc. |
| Zoetis | Intuitive Surgical | Berkshire Hathaway | IQVIA |
| ServiceNow | Blackrock | Sherwin Williams | |
| Home Depot | SVB Financial | ||
| JPMorgan Chase | Group | ||
| Lowes | Texas Pacific Land | ||
| Mastercard | Corporation | ||
| Meta Platforms | TransUnion | ||
| Nvidia | |||
| Old Dominion | |||
| Freight Line | |||
| Palo Alto Networks | |||
| S&P Global, Inc. | |||
| Thermo Fisher | |||
| Scientific | |||
| Union Pacific | |||
| Visa |
3
The companies that were the most additive to the Fund’s return in 2023 included Nvidia, Apple, Microsoft, Amazon, and Meta.
The companies that were the largest drag on the Fund’s return in 2023 included SVB Financial Group, Texas Pacific Land Corporation, PayPal, Cable One, and Thermo Fisher Scientific.
We believe the Fund’s holdings are both 1) well-positioned to grow their business value over the next several years, and 2) valued at levels that are attractive over the long run given our assessment of their quality, the durability of their competitive advantage, and their long-term business value growth potential.
From a valuation standpoint, we believe the Fund’s holdings are attractively valued looking out over the next several years. At present, the Fund’s portfolio trades at 24.1x estimated 2024 earnings and 23.3x estimated 2025 earnings, with a projected long-term annual earnings growth of 16-18%, which compares with the 20.0x 2024 P/E, 17.7x 2025 P/E, and 7-9% long term annual earnings growth projected for the S&P 500.
Charlie Munger
Charlie Munger, Warren Buffett’s long time investing partner at Berkshire Hathaway, passed away in November at the age of 99. He would have been 100 on January 1 of this year.
Charlie is credited with encouraging Warren Buffett to evolve his investment approach from seeking to invest in an “ok business at a great price” to a investing in a “great business at a sensible price.” We believe that Buffett’s transition to this approach was responsible for much of the success of Berkshire’s public equity portfolio since the late 1980’s.
Buffett’s purchase of Coca Cola in 1988 marked the beginning of his emphasis on owning exceptional businesses able to compound their intrinsic value at high rates for decades; Berkshire’s investment in Apple has arguably been its most impactful public equity investment, and in our view is the best example of Buffett’s “great business at a sensible price” perspective. The value of Berkshire’s Apple holding is now more than 20% of Berkshire’s market capitalization.
We share Munger’s insistence on owning high quality businesses that have durable competitive advantage and take to heart his advice to think about one’s investments like a business owner who seeks to compound the return on their invested capital for a very long time.
Munger’s insights on investing will be missed, but his mark on the art and science of investing is likely to prove to be indelible.
Gratitude
We are grateful for your patience and support and your continued investment in Bridges Investment Fund.
Sincerely, | |
 | |
Edson L. Bridges III | |
Chief Executive Officer and | |
Chairman of the Board |
4
Must be preceded or accompanied by a Prospectus.
The opinions expressed herein are those of Edson L. Bridges III and are subject to change. They are not guarantees and should not be considered investment advice.
Holdings are subject to change and are not a recommendation to buy or sell any security.
The S&P 500 Index is a broadly based unmanaged composite of 500 stocks which is widely recognized as representative of price changes for the U.S. equity market in general. You cannot invest directly in a specific index.
The price-to-earnings ratio is the ratio for valuing a company that measures its current share price relative to its earnings per share (EPS). EPS is calculated as a company’s profit divided by the outstanding shares of its common stock. The resulting number serves as an indicator of a company’s profitability.
Cash Flows: The total amount of money being transferred into and out of a business, especially as it affects liquidity.
Free Cash Flow is a measure of financial performance calculated as operating cash flow minus capital expenditures. Free cash flow (FCF) represents the cash that a company is able to generate after laying out the money required to maintain or expand its asset base.
Mutual fund investing involves risk. Principal loss is possible. Small and medium capitalization companies tend to have limited liquidity and greater price volatility than large-capitalization companies. Investments in debt securities typically decrease in value when interest rates rise. This risk is usually greater for longer-term debt securities. The Fund invests in foreign securities which involve political, economic and currency risks, greater volatility, and differences in accounting methods.
The Bridges Investment Fund is distributed by Quasar Distributors, LLC.
5
Bridges Investment Fund®
SECTOR ALLOCATION at December 31, 2023 (Unaudited) |
| Sector | % of Net Assets | |||
| Professional Scientific & Technical Services | 17.2 | % | ||
| Computer & Electronic Product Manufacturing | 14.8 | % | ||
| Publishing Industries (Except Internet) | 12.6 | % | ||
| Administrative & Support Services | 9.6 | % | ||
| Insurance Carriers & Related Activities | 8.5 | % | ||
| Nonstore Retailers | 7.3 | % | ||
| Securities, Commodity Contracts, & Other | ||||
| Financial Investments & Related Activities | 6.2 | % | ||
| Truck Transportation | 3.9 | % | ||
| Building Material & Garden Equipment | 3.1 | % | ||
| Other Information Services | 2.9 | % | ||
| Credit Intermediation & Related Activities | 2.1 | % | ||
| Rail Transportation | 1.9 | % | ||
| Funds, Trusts, & Other Financial Vehicles | 1.4 | % | ||
| Food Services & Drinking Places | 1.1 | % | ||
| Merchant Wholesalers, Durable Goods | 1.0 | % | ||
| Cash & Cash Equivalents | 1.0 | %1 | ||
| Oil & Gas Extraction | 0.9 | % | ||
| Miscellaneous Manufacturing | 0.9 | % | ||
| Health & Personal Care Stores | 0.8 | % | ||
| Motor Vehicle & Parts Dealers | 0.8 | % | ||
| Plastics & Rubber Products Manufacturing | 0.7 | % | ||
| Real Estate | 0.5 | % | ||
| Electrical Equipment Appliance & Component | 0.4 | % | ||
| Chemical Manufacturing | 0.3 | % | ||
| Fabricated Metal Product Manufacturing | 0.1 | % | ||
| Total | 100.0 | % | ||
1 | Includes short-term investments & liabilities in excess of other assets. |
6
Bridges Investment Fund®
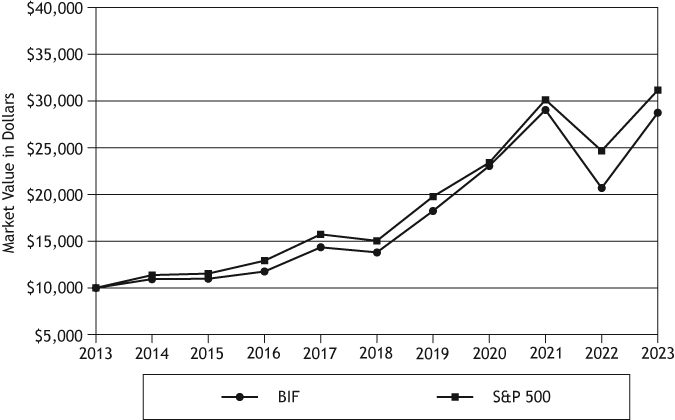
Value of $10,000 vs. S&P 500® Index
(Unaudited)
| Value of | |||||
| Average Annual Returns | One | Three | Five | Ten | $10,000 |
Periods Ended December 31, 2023 | Year | Year | Year | Year | (12/31/23) |
Bridges Investment Fund® | 38.91% | 7.62% | 15.80% | 11.13% | 28,731 |
S&P 500® Index | 26.29% | 10.00% | 15.69% | 12.03% | 31,149 |
This chart illustrates the performance of a hypothetical $10,000 investment made on December 31, 2013, and is not intended to imply any future performance. The returns shown do not reflect the deduction of taxes that a shareholder would pay on Fund distributions or the redemption of Fund shares. The returns reflect fee waivers in effect. In the absence of such waivers, total return would be reduced. The chart assumes reinvestment of capital gains and dividends.
Performance data quoted represents past performance; past performance does not guarantee future results. The investment return and principal value of an investment will fluctuate so that an investor’s shares, when redeemed, may be worth more or less than their original cost. Current performance of the Fund may be lower or higher than the performance quoted. Current performance data to the most recent month end may be obtained by visiting 866-934-4700.
7
Bridges Investment Fund®
SCHEDULE OF INVESTMENTS at December 31, 2023 |
| Shares | Value | ||||||
| COMMON STOCKS: 99.0% | |||||||
| Administrative & Support Services: 9.6% | |||||||
22,000 | Mastercard, Inc. - | ||||||
Class A | $ | 9,383,220 | |||||
35,000 | PayPal | ||||||
Holdings, Inc.1 | 2,149,350 | ||||||
32,000 | Visa, Inc. - Class A | 8,331,200 | |||||
19,863,770 | |||||||
| Building Material & Garden | |||||||
| Equipment & Supplies Dealers: 3.1% | |||||||
10,000 | Home Depot, Inc. | 3,465,500 | |||||
13,500 | Lowe’s | ||||||
Companies, Inc. | 3,004,425 | ||||||
6,469,925 | |||||||
| Chemical Manufacturing: 0.3% | |||||||
2,800 | Zoetis, Inc. | 552,636 | |||||
| Computer & Electronic Product | |||||||
| Manufacturing: 14.8% | |||||||
90,000 | Apple, Inc. | 17,327,700 | |||||
19,500 | NVIDIA Corp. | 9,656,790 | |||||
7,000 | Thermo Fisher | ||||||
Scientific, Inc. | 3,715,530 | ||||||
30,700,020 | |||||||
| Credit Intermediation & Related | |||||||
| Activities: 2.1% | |||||||
26,000 | JPMorgan | ||||||
Chase & Co. | 4,422,600 | ||||||
| Electrical Equipment, Appliance, | |||||||
| & Component Manufacturing: 0.4% | |||||||
7,000 | Generac | ||||||
Holdings, Inc.1 | 904,680 | ||||||
| Fabricated Metal Product | |||||||
| Manufacturing: 0.1% | |||||||
4,000 | BWX | ||||||
Technologies, Inc. | 306,920 | ||||||
| Food Services & Drinking Places: 1.1% | |||||||
8,500 | Casey’s General | ||||||
Stores, Inc. | 2,335,290 | ||||||
| Funds, Trusts, & Other | |||||||
| Financial Vehicles: 1.4% | |||||||
37,500 | Alcon, Inc. | 2,929,500 | |||||
| Health & Personal Care Stores: 0.8% | |||||||
3,500 | Ulta Beauty, Inc.1 | 1,714,965 | |||||
| Insurance Carriers & | |||||||
| Related Activities: 8.5% | |||||||
17,000 | Berkshire Hathaway, | ||||||
Inc. - Class B1 | 6,063,220 | ||||||
30,000 | The Progressive Corp. | 4,778,400 | |||||
13,000 | UnitedHealth | ||||||
Group, Inc. | 6,844,110 | ||||||
17,685,730 | |||||||
| Merchant Wholesalers, | |||||||
| Durable Goods: 1.0% | |||||||
30,000 | Copart, Inc.1 | 1,470,000 | |||||
1,400 | Pool Corp. | 558,194 | |||||
2,028,194 | |||||||
| Miscellaneous Manufacturing: 0.9% | |||||||
5,500 | Intuitive | ||||||
Surgical, Inc.1 | 1,855,480 | ||||||
| Motor Vehicle & Parts Dealers: 0.8% | |||||||
5,000 | Lithia Motors, Inc. | 1,646,400 | |||||
| Nonstore Retailers: 7.3% | |||||||
100,000 | Amazon.com, Inc.1 | 15,194,000 | |||||
| Oil & Gas Extraction: 0.9% | |||||||
16,000 | EOG Resources, Inc. | 1,935,200 | |||||
| Other Information Services: 2.9% | |||||||
17,000 | Meta Platforms, | ||||||
Inc. - Class A1 | 6,017,320 | ||||||
| Plastics & Rubber Products | |||||||
| Manufacturing: 0.7% | |||||||
12,000 | AptarGroup, Inc. | 1,483,440 | |||||
| Professional, Scientific, & | |||||||
| Technical Services: 17.2% | |||||||
80,000 | Alphabet, Inc. - | ||||||
Class A1 | 11,175,200 | ||||||
79,000 | Alphabet, Inc. - | ||||||
Class C1 | 11,133,470 | ||||||
26,500 | Palo Alto | ||||||
Networks, Inc.1 | 7,814,320 | ||||||
8,000 | ServiceNow, Inc.1 | 5,651,920 | |||||
35,774,910 | |||||||
The accompanying notes are an integral part of these financial statements.
8
Bridges Investment Fund®
SCHEDULE OF INVESTMENTS at December 31, 2023, Continued |
| Shares | Value | ||||||
| Publishing Industries (Except | |||||||
| Internet): 12.6% | |||||||
11,000 | Adobe, Inc.1 | $ | 6,562,600 | ||||
52,000 | Microsoft Corp. | 19,554,080 | |||||
26,116,680 | |||||||
| Rail Transportation: 1.9% | |||||||
16,050 | Union Pacific Corp. | 3,942,201 | |||||
| Real Estate: 0.5% | |||||||
5,000 | American Tower | ||||||
Corp. - REIT | 1,079,400 | ||||||
| Securities, Commodity Contracts, & | |||||||
| Other Financial Investments & | |||||||
| Related Activities: 6.2% | |||||||
3,900 | BlackRock, Inc. | 3,166,020 | |||||
4,000 | Chemed Corp. | 2,339,000 | |||||
20,000 | Intercontinental | ||||||
Exchange, Inc. | 2,568,600 | ||||||
11,000 | S&P Global, Inc. | 4,845,720 | |||||
12,919,340 | |||||||
| Truck Transportation: 3.9% | |||||||
20,000 | Old Dominion Freight | ||||||
Line, Inc. | 8,106,600 | ||||||
| TOTAL COMMON STOCKS | |||||||
| (Cost $57,352,900) | 205,985,201 | ||||||
| SHORT-TERM INVESTMENTS: 1.0% | |||||||
| Money Market Funds: 1.0% | |||||||
2,026,765 | First American | ||||||
Treasury | |||||||
Obligations Fund - | |||||||
Class X, 5.285%2 | 2,026,765 | ||||||
| Total Money Market | |||||||
| Funds: 1.0% | 2,026,765 | ||||||
| TOTAL SHORT-TERM | |||||||
| INVESTMENTS | |||||||
| (Cost $2,026,765) | 2,026,765 | ||||||
| TOTAL INVESTMENTS | |||||||
| IN SECURITIES: 100.0% | |||||||
| (Cost $59,379,665) | 208,011,966 | ||||||
Liabilities in Excess of | |||||||
Other Assets: (0.0)%3 | (79,600 | ) | |||||
| TOTAL NET ASSETS: 100.0% | $ | 207,932,366 | |||||
REIT - Real Estate Investment Trust
1 | Non-income producing security. |
2 | Annualized seven-day effective yield as of December 31, 2023. |
3 | Does not round to 0.0% or (0.0)%, as applicable. |
The accompanying notes are an integral part of these financial statements.
9
Bridges Investment Fund®
STATEMENT OF ASSETS AND LIABILITIES at December 31, 2023 |
| ASSETS: | ||||
| Investments in securities, at value (cost $59,379,665) | $ | 208,011,966 | ||
| Cash | 34,371 | |||
| Receivables: | ||||
| Fund shares sold | 120 | |||
| Dividends and interest | 23,955 | |||
| Prepaid expenses | 17,972 | |||
| Total assets | 208,088,384 | |||
| LIABILITIES: | ||||
| Payables: | ||||
| Fund shares redeemed | 1,000 | |||
| Investment advisory fees | 87,449 | |||
| Audit fees | 21,987 | |||
| Transfer agent fees | 11,301 | |||
| Printing and mailing expenses | 11,256 | |||
| Fund administration fees | 9,661 | |||
| Fund accounting fees | 5,769 | |||
| Custody fees | 4,932 | |||
| Miscellaneous expenses | 1,272 | |||
| Chief Compliance Officer fees | 1,209 | |||
| Legal fees | 182 | |||
| Total liabilities | 156,018 | |||
| NET ASSETS | $ | 207,932,366 | ||
| COMPONENTS OF NET ASSETS: | ||||
| Paid-in capital | $ | 53,896,644 | ||
| Total distributable (accumulated) earnings (losses) | 154,035,722 | |||
| Net assets | $ | 207,932,366 | ||
| Net assets value (unlimited shares authorized): | ||||
| Net assets | $ | 207,932,366 | ||
| Shares of beneficial interest issued and outstanding | 2,226,615 | |||
| Net asset value, offering, and redemption price per share | $ | 93.38 | ||
The accompanying notes are an integral part of these financial statements.
10
Bridges Investment Fund®
STATEMENT OF OPERATIONS For the Year Ended December 31, 2023 |
| INVESTMENT INCOME | ||||
| Income: | ||||
| Dividends (net of foreign withholding | ||||
| tax and issuance fees of $1,325) | $ | 1,266,998 | ||
| Interest | 95,776 | |||
| Other income | 610 | |||
| Total investment income | 1,363,384 | |||
| EXPENSES | ||||
| Investment advisory fees | 956,295 | |||
| Fund administration fees | 118,059 | |||
| Transfer agent fees | 82,421 | |||
| Fund accounting fees | 70,607 | |||
| Professional fees | 33,777 | |||
| Registration fees | 28,499 | |||
| Custody fees | 27,247 | |||
| Miscellaneous expense | 26,988 | |||
| Trustee fees | 26,664 | |||
| Chief Compliance Officer fees | 14,989 | |||
| Reports to shareholders | 13,759 | |||
| Insurance expenses | 5,316 | |||
| Total expenses | 1,404,621 | |||
| Net investment income (loss) | (41,237 | ) | ||
| REALIZED AND UNREALIZED GAIN (LOSS) ON INVESTMENTS | ||||
| Net realized gain (loss) on investments | 19,287,419 | |||
| Net change in unrealized appreciation/depreciation | ||||
| on investments | 43,957,212 | |||
| Net realized and unrealized gain (loss) on investments | 63,244,631 | |||
| NET INCREASE (DECREASE) IN NET ASSETS | ||||
| RESULTING FROM OPERATIONS | $ | 63,203,394 | ||
The accompanying notes are an integral part of these financial statements.
11
Bridges Investment Fund®
STATEMENTS OF CHANGES IN NET ASSETS |
| Year Ended | Year Ended | |||||||
| December 31, 2023 | December 31, 2022 | |||||||
| NET INCREASE (DECREASE) IN NET ASSETS FROM: | ||||||||
| Net investment income (loss) | $ | (41,237 | ) | $ | (205,014 | ) | ||
| Net realized gain (loss) on investments | 19,287,419 | 10,585,699 | ||||||
| Net change in unrealized appreciation/ | ||||||||
| depreciation on investments | 43,957,212 | (86,564,264 | ) | |||||
| Net increase (decrease) in net assets | ||||||||
| resulting from operations | 63,203,394 | (76,183,579 | ) | |||||
| DISTRIBUTIONS TO SHAREHOLDERS | ||||||||
| Net distributions to shareholders | (7,268,111 | ) | (12,288,326 | ) | ||||
| CAPITAL SHARE TRANSACTIONS | ||||||||
| Net increase (decrease) from | ||||||||
capital share transactions1 | (23,054,816 | ) | (6,600,193 | ) | ||||
| Total increase (decrease) in net assets | 32,880,467 | (95,072,098 | ) | |||||
| NET ASSETS | ||||||||
| Beginning of year | 175,051,899 | 270,123,997 | ||||||
| End of year | $ | 207,932,366 | $ | 175,051,899 | ||||
1 | A summary of share transactions is as follows: |
Year Ended | Year Ended | ||||||||||||||||
December 31, 2023 | December 31, 2022 | ||||||||||||||||
| Shares | Value | Shares | Value | ||||||||||||||
Shares sold | 22,377 | $ | 1,840,058 | 83,296 | $ | 6,567,356 | |||||||||||
Shares issued to holders | |||||||||||||||||
in reinvestment | |||||||||||||||||
of distributions | 38,282 | 3,477,356 | 76,390 | 5,680,347 | |||||||||||||
Shares redeemed | (347,604 | ) | (28,372,230 | ) | (235,455 | ) | (18,847,896 | ) | |||||||||
Net increase (decrease) | (286,945 | ) | $ | (23,054,816 | ) | (75,769 | ) | $ | (6,600,193 | ) | |||||||
The accompanying notes are an integral part of these financial statements.
12
Bridges Investment Fund®
FINANCIAL HIGHLIGHTS For a capital share outstanding throughout each year |
| Year Ended December 31, | ||||||||||||||||||||
| 2023 | 2022 | 2021 | 2020 | 2019 | ||||||||||||||||
| Net asset value, beginning of year | $ | 69.64 | $ | 104.32 | $ | 88.73 | $ | 73.02 | $ | 57.40 | ||||||||||
| INCOME (LOSS) FROM INVESTMENT OPERATIONS: | ||||||||||||||||||||
Net investment income (loss)1 | (0.02 | ) | (0.08 | ) | (0.12 | ) | 0.03 | 0.28 | ||||||||||||
| Net realized and unrealized | ||||||||||||||||||||
| gain (loss) on investments | 27.03 | (29.59 | ) | 22.81 | 19.14 | 18.06 | ||||||||||||||
| Total from operations | 27.01 | (29.67 | ) | 22.69 | 19.17 | 18.34 | ||||||||||||||
| LESS DISTRIBUTIONS: | ||||||||||||||||||||
| Distributions from net | ||||||||||||||||||||
| investment income | (0.01 | ) | — | — | (0.08 | ) | (0.29 | ) | ||||||||||||
| Distributions from | ||||||||||||||||||||
| net realized gain | (3.26 | ) | (5.01 | ) | (7.10 | ) | (3.38 | ) | (2.43 | ) | ||||||||||
| Total distributions | (3.27 | ) | (5.01 | ) | (7.10 | ) | (3.46 | ) | (2.72 | ) | ||||||||||
| Net asset value, end of year | $ | 93.38 | $ | 69.64 | $ | 104.32 | $ | 88.73 | $ | 73.02 | ||||||||||
| Total return | 38.91 | % | (28.75 | )% | 25.93 | % | 26.44 | % | 32.13 | % | ||||||||||
| SUPPLEMENTAL DATA: | ||||||||||||||||||||
| Net assets, end of year (000’s) | $ | 207,932 | $ | 175,052 | $ | 270,124 | $ | 238,235 | $ | 195,798 | ||||||||||
| Ratio of net expenses to | ||||||||||||||||||||
| average net assets | 0.72 | % | 0.77 | % | 0.72 | % | 0.77 | % | 0.79 | % | ||||||||||
| Ratio of net investment income (loss) | ||||||||||||||||||||
| to average net assets | (0.02 | %) | (0.10 | %) | (0.12 | %) | 0.05 | % | 0.42 | % | ||||||||||
| Portfolio turnover rate | 5.0 | %2 | 10.9 | % | 9.2 | % | 8.9 | % | 16.9 | % | ||||||||||
1 | Calculated based on average shares outstanding during the period. |
2 | Portfolio turnover rate excludes the impact of in-kind transactions. |
The accompanying notes are an integral part of these financial statements.
13
Bridges Investment Fund®
NOTES TO FINANCIAL STATEMENTS December 31, 2023 |
| NOTE 1 – ORGANIZATION |
The Bridges Investment Fund® (the “Fund”) is a diversified series of shares of beneficial interest of Professionally Managed Portfolios (the “Trust”), which is registered under the Investment Company Act of 1940, as amended (the “1940 Act”) as an open-end management investment company. The Fund is an investment company and accordingly follows the investment company accounting and reporting guidance of the Financial Accounting Standards Board (FASB) Accounting Standard Codification Topic 946 “Financial Services—Investment Companies”. Prior to converting to the Trust on January 3, 2023, the Fund was organized as a standalone entity incorporated in the State of Nebraska. The Fund commenced operations on July 1, 1963.
The investment objective of the Fund is to seek long-term capital appreciation, with a secondary objective of generating a modest amount of current income.
NOTE 2 – SIGNIFICANT ACCOUNTING POLICIES |
The following is a summary of significant accounting policies consistently followed by the Fund. These policies are in conformity with accounting principles generally accepted in the United States of America (“U.S. GAAP”).
| A. | Security Valuation. All equity securities, which may include Real Estate Investment Trusts (“REITs”), Business Development Companies (“BDCs”) and Master Limited Partnerships (“MLPs”), that are traded on U.S. or foreign national securities exchanges are valued either at the last reported sale price on the exchange on which the security is principally traded or the exchange’s official closing price, if applicable. If, on a particular day, an exchange-traded security does not trade, then the mean between the most recent quoted bid and asked prices will be used. All equity securities, which may include REITs, BDCs and MLPs, that are not traded on a listed exchange are valued at the last sale price in the over-the-counter market. If a non-exchange traded security does not trade on a particular day, then the mean between the last quoted closing bid and asked price will be used. | |
| Pursuant to Rule 2a-5 under the 1940 Act, The Board of Trustees (the “Board”) has adopted a Valuation Policy designating Bridges Investment Management, Inc. (the “Adviser”) as the Fund’s Valuation Designee. Under Rule 2a-5, the Valuation Designee shall determine the fair value of securities for which readily available market quotes are not available in accordance with procedures approved by the Board. | ||
| As described above, the Fund utilizes various methods to measure the fair value of its investments on a recurring basis. U.S. GAAP establishes a hierarchy that prioritizes inputs to valuation methods. The three levels of inputs are: |
| Level 1 – | Unadjusted quoted prices in active markets for identical assets or liabilities that the Fund has the ability to access. |
14
Bridges Investment Fund®
NOTES TO FINANCIAL STATEMENTS December 31, 2023, Continued |
| Level 2 – | Observable inputs other than quoted prices included in Level 1 that are observable for the asset or liability, either directly or indirectly. These inputs may include quoted prices for the identical instrument on an inactive market, prices for similar instruments, interest rates, prepayment speeds, credit risk, yield curves, default rates and similar data. |
| Level 3 – | Unobservable inputs for the asset or liability, to the extent relevant observable inputs are not available; representing the Fund’s own assumptions about the assumptions a market participant would use in valuing the asset or liability and would be based on the best information available. |
| The availability of observable inputs can vary from security to security and is affected by a wide variety of factors, including, for example, the type of security, whether the security is new and not yet established in the marketplace, the liquidity of markets, and other characteristics particular to the security. To the extent that valuation is based on models or inputs that are less observable or unobservable in the market, the determination of fair value requires more judgment. Accordingly, the degree of judgment exercised in determining fair value is greatest for instruments categorized in Level 3. | |
| The inputs used to measure fair value may fall into different levels of the fair value hierarchy. In such cases, for disclosure purposes, the level in the fair value hierarchy within which the fair value measurements fall in its entirety, is determined based on the lowest level input that is significant to the fair value measurement in its entirety. | |
| The following is a summary of the inputs used to value the Fund’s investments as of December 31, 2023. See the Schedule of Investments for industry breakouts. |
Description | Level 1 | Level 2 | Level 3 | Total | |||||||||||||
Common Stocks | $ | 205,985,201 | $ | — | $ | — | $ | 205,985,201 | |||||||||
Short-Term Investments | 2,026,765 | — | — | 2,026,765 | |||||||||||||
| Total Investments | |||||||||||||||||
| in Securities | $ | 208,011,966 | $ | — | $ | — | $ | 208,011,966 | |||||||||
| B. | Federal Income Taxes. The Fund has elected to be taxed as a “regulated investment company” and intends to distribute substantially all taxable income to its shareholders and otherwise comply with the provisions of the Internal Revenue Code applicable to regulated investment companies. Therefore, no provision for federal income taxes or excise taxes has been made. | |
| In order to avoid imposition of the excise tax applicable to regulated investment companies, the Fund intends to declare dividends in each calendar year of at least 98.0% of its net investment income (earned during the calendar year) and 98.2% of its net realized capital gains (earned during the twelve months ended October 31) plus undistributed amounts, if any, from prior years. |
15
Bridges Investment Fund®
NOTES TO FINANCIAL STATEMENTS December 31, 2023, Continued |
| Net capital losses incurred after October 31 and within the taxable year are deemed to arise on the first business day of the Fund’s next taxable year. At the most recent fiscal year ended December 31, 2023, the Fund had no post- October losses or late year losses. At the most recent fiscal year ended December 31, 2023, the Fund had no capital loss carryovers available for federal income tax purposes. |
As December 31, 2023, the Fund did not have any tax positions that did not meet the “more-likely-than-not” threshold of being sustained by the applicable tax authority. Generally, tax authorities can examine all the tax returns filed for the last three years. The Fund identifies major tax jurisdiction as U.S. Federal and the Commonwealth of Massachusetts (State of Nebraska for periods prior to converting to the Trust on January 3, 2023). As of December 31, 2023, the Fund is not aware of any tax positions for which it is reasonably possible that the total amounts of unrecognized tax benefits will change materially. | ||
| C. | Securities Transactions and Investment Income. Investment securities transactions are accounted for on the trade date. Gains and losses realized on sales of securities are determined on a specific identification basis. Discounts/premiums on debt securities purchased are accreted/amortized over the life of the respective securities using the effective interest method. Dividend income is recorded on the ex-dividend date. Interest income and securities lending income are recorded on an accrual basis. Other non-cash dividends are recognized as investment income at the fair value of the property received. Withholding taxes on foreign dividends have been provided for in accordance with the Trust’s understanding of the applicable country’s tax rules and rates. | |
| D. | Distributions to Shareholders. Distributions to shareholders from net investment income for the Fund normally are declared and paid on a quarterly basis. Distributions to shareholders from net realized gains on securities normally are declared and paid on an annual basis. Distributions are recorded on the ex-dividend date. | |
| E. | Use of Estimates. The preparation of financial statements in conformity with U.S. GAAP requires management to make estimates and assumptions that affect the reported amounts of assets and liabilities and disclosure of contingent assets and liabilities at the date of the financial statements and the reported amount of revenue and expenses during the reporting period. Actual results could differ from those estimates. | |
| F. | Share Valuation. The net asset value (“NAV”) per share of the Fund is calculated by dividing the sum of the value of the securities held by the Fund, plus cash and other assets, minus all liabilities (including estimated accrued expenses) by the total number of shares outstanding for the Fund, rounded to the nearest cent. The Fund’s shares will not be priced on the days on which the New York Stock Exchange is closed for trading. The offering and redemption price per share for the Fund is equal to the Fund’s NAV per share. |
16
Bridges Investment Fund®
NOTES TO FINANCIAL STATEMENTS December 31, 2023, Continued |
| G. | Guarantees and Indemnifications. In the normal course of business, the Fund enters into contracts with service providers that contain general indemnification clauses. The Fund’s maximum exposure under these arrangements is unknown as this would involve future claims that may be made against the Fund that have not yet occurred. However, based on experience, the Fund expects the risk of loss to be remote. |
| H. | Illiquid Securities. Pursuant to Rule 22e-4 under the 1940 Act, the Fund has adopted a Board approved liquidity risk management program that requires, among other things, that the Fund limit its illiquid investments to no more than 15% of net assets. An illiquid investment is any investment that the Fund reasonably expects cannot be sold or disposed of in current market conditions in seven calendar days or less without the sale or disposition significantly changing the market value of the investment. | |
| I. | Reclassification of Capital Accounts. U.S. GAAP requires that certain components of net assets relating to permanent differences by reclassified between financial and tax reporting. These reclassifications have no effect on net asset or net asset value per share. For the year ended December 31, 2023, the following adjustments were made1: |
| Distributable (accumulated) | |||
Paid-in Capital | earnings (losses) | ||
| Bridges Investment Fund | $7,973,865 | $(7,973,865) |
1 | These differences were primarily due to redemptions in-kind and net operating loss. |
| J. | Recently Issued Accounting Pronouncements. In June 2022, the FASB issued Accounting Standards Update 2022-03, which amends Fair Value Measurement (Topic 820): Fair Value Measurement of Equity Securities Subject to Contractual Sale Restrictions (“ASU 2022-03”). ASU 2022-03 clarifies guidance for fair value measurement of an equity security subject to a contractual sale restriction and establishes new disclosure requirements for such equity securities. ASU 2022-03 is effective for fiscal years beginning after December 15, 2023 and for interim periods within those fiscal years, with early adoption permitted. Management is currently evaluating the impact of these amendments on the financial statements. | |
| In October 2022, the Securities and Exchange Commission (the “SEC”) adopted a final rule relating to Tailored Shareholder Reports for Mutual Funds and Exchange-Traded Funds; Fee Information in Investment Company Advertisements. The rule and form amendments will, among other things, require the Fund to transmit concise and visually engaging shareholder reports that highlight key information. The amendments will require that funds tag information in a structured data format and that certain more in-depth information be made available, online and available for delivery free of charge to investors on request. The amendments became effective January 24, 2023. There is an 18-month transition period after the effective date of the amendment. |
17
Bridges Investment Fund®
NOTES TO FINANCIAL STATEMENTS December 31, 2023, Continued |
| K. | Subsequent Events. In preparing these financial statements, the Fund has evaluated events and transactions for potential recognition or disclosure through the date the financial statements were issued. The Fund has determined that there were no subsequent events that would need to be disclosed in the Fund’s financial statements. |
| NOTE 3 – COMMITMENTS AND OTHER RELATED PARTY TRANSACTIONS |
The Adviser provides the Fund with investment management services under an Investment Advisory Agreement (the “Advisory Agreement”). Under the Advisory Agreement, the Adviser furnishes all investment advice, office space, and certain administrative services, and provides most of the personnel needed by the Fund. As compensation for its services, the Adviser is entitled to receive a monthly fee at the annual rate of 0.50% based upon the average daily net assets of the Fund. For the year ended December 31, 2023, the advisory fees incurred by the Fund are disclosed in the Statement of Operations. The investment advisory fees incurred are paid monthly to the Adviser, net of any monthly waiver or reimbursement discussed below.
The Adviser has contractually agreed to limit the annual ratio of expenses (“Expense Cap”) to 1.05% of the Fund’s average daily net assets (excluding any front-end or contingent deferred loads, taxes, interest expenses, brokerage commissions, acquired fund fees and expenses, expenses incurred in connection with any merger or reorganization, and extraordinary expenses such as litigation). The Operating Expense Limitation Agreement has an indefinite term and may be terminated at any time, and without payment of any penalty, by the Board, on behalf of the Fund, upon sixty days written notice to the Adviser. The Adviser is permitted to be reimbursed for fee reductions and/or expense payments made in the prior thirty-six months from the date the fees were waived and/or expenses were paid. The Fund must pay their current ordinary operating expenses before the Adviser is entitled to any reimbursements of fees and/or expenses. Any such reimbursement is subject to the Board’s review and approval. This reimbursement may be requested by the Adviser if the aggregate amount actually paid by the Fund towards operating expenses for such period (taking into account any reimbursement) does not exceed the lesser of the Expense Cap in place at the time of waiver or at the time of reimbursement. The Fund operated below the current Expense Cap and accordingly, the Adviser did not waive any fees or reimburse expenses for the year ended December 31, 2023. Any fees reimbursed to the advisor prior to the reorganization into the Trust are not subject to recoupment. Any amount due from the Adviser is paid monthly to the Fund, if applicable.
U.S. Bancorp Fund Services, LLC, doing business as U.S. Bank Global Fund Services (“Fund Services”), serves as the Fund’s administrator, fund accountant, and transfer agent. In those capacities, Fund Services maintains the Fund’s books and records, calculates the Fund’s NAV, prepares various federal and state regulatory filings, coordinates the payment of the Fund’s expenses, reviews expense accruals, and prepares materials supplied to the Trustees. The officers of the Trust and the
18
Bridges Investment Fund®
NOTES TO FINANCIAL STATEMENTS December 31, 2023, Continued |
Chief Compliance Officer are also employees of Fund Services. Fees paid by the Fund to Fund Services for these services for the year ended December 31, 2023 are disclosed in the Statement of Operations.
Quasar Distributors, LLC (the “Distributor”) acts as the Fund’s principal underwriter in a continuous public offering of the Fund’s shares.
U.S. Bank N.A. serves as the Fund’s custodian. U.S. Bank N.A. is an affiliate of Fund Services.
| NOTE 4 – PURCHASES AND SALES OF SECURITIES |
For the year ended December 31, 2023, the cost of purchases and the proceeds from the sale and maturity of securities, excluding short-term investments, were $9,686,901 and $40,293,5101 respectively.
1 $8,270,494 of this figure relates to in-kind transactions.
For the year ended December 31, 2023, there were no purchases, sales or maturities of long-term U.S. Government obligations in the Fund.
| NOTE 5 – DISTRIBUTIONS TO SHAREHOLDERS |
The tax character of distributions paid during the year ended December 31, 2023 (estimated), and the year ended December 31, 2022, for the Fund was as follows:
| December 31, 2023 | December 31, 2022 | |||||||
| Ordinary income | $ | — | $ | — | ||||
| Long-term capital gain | 7,268,111 | 12,288,326 | ||||||
The components of distributable earnings (losses) and cost basis of investments for federal income tax purposes at the most recent fiscal year ended December 31, 2023 were as follows:
| Cost of investments | $ | 59,720,649 | ||
| Gross tax unrealized appreciation | 148,291,546 | |||
| Gross tax unrealized depreciation | — | |||
| Net tax unrealized appreciation (depreciation) | 148,291,546 | |||
| Undistributed ordinary income | — | |||
| Undistributed long-term capital gain | 5,744,176 | |||
| Total distributable earnings | 5,744,176 | |||
| Other distributable (accumulated) gains (losses) | — | |||
| Total distributable (accumulated) earnings (losses) | $ | 154,035,722 |
| NOTE 6 – INVESTMENT TRANSACTIONS |
During the year ended December 31, 2023, the Fund realized net capital gains and losses resulting from in-kind redemptions, in which shareholders exchanged Fund shares for securities held by the Fund rather than for cash. Because such gains are not taxable to the Fund, and are not distributed to shareholders, they have
19
Bridges Investment Fund®
NOTES TO FINANCIAL STATEMENTS December 31, 2023, Continued |
been reclassified from distributable earnings (accumulated losses) to paid in- capital. The amounts of realized gains and losses from in-kind redemptions included in realized gain/(loss) on investments in the Statement of Operations is as follows:
| Redemptions | ||
In Kind | Realized Gains | Realized Losses |
| $8,270,494 | $8,015,102 | $— |
| NOTE 7 – Fund Reorganization |
The Board of Bridges Investment Management has approved the reorganization (the “Reorganization”) of the Bridges Investment Fund (the “Predecessor Fund”) into a corresponding new series of the Professionally Managed Portfolios (the “Acquiring Fund”), to be managed by Bridges Investment Management, the investment adviser of the Predecessor Fund. As the Acquiring Fund had no history prior to the Reorganization, it assumed the accounting and performance history of the Predecessor Fund.
The purpose of the reorganization was to seek to achieve greater economies of scale for the Bridges Investment Fund due to the larger assets of the multiple series trust platform and to obtain greater access to the resources offered by the multiple series trust platform including experienced professionals that provide operational, legal and compliance services as well as systems and infrastructure to address regulatory changes and increasing industry complexity.
For the Bridges Investment Fund, the Reorganization was accomplished by a tax-free exchange of 2,513,560 shares for 2,513,560 shares. As a tax-free reorganization, any unrealized appreciation or depreciation on the securities on the date of reorganization was treated as a non-taxable event, thus the cost basis of the securities held reflect the historical cost basis as of the date of reorganization. Immediately prior to the reorganization, the net assets, fair value of investments, and net unrealized appreciation of the Bridges Investment Fund were $175,034,898, $175,325,272 and $103,912,070 respectively. There were undistributed long-term capital gains in the amount of $2,164,743. The Reorganization was effective January 3, 2023. The Adviser paid for all costs of the Reorganization.
20
Bridges Investment Fund®
| REPORT OF INDEPENDENT REGISTERED PUBLIC ACCOUNTING FIRM |
To the Shareholders and Board of Directors of Bridges Investment Fund, Inc.
Opinion on the Financial Statements
We have audited the accompanying statement of assets and liabilities, including the schedule of investments, of Bridges Investment Fund (the “Fund”), a series of Professionally Managed Portfolios, as of December 31, 2023, the related statement of operations for the year then ended, the statements of changes in net assets for each of the two years in the period then ended, the related notes, and the financial highlights for each of the five years in the period then ended (collectively referred to as the “financial statements”). In our opinion, the financial statements present fairly, in all material respects, the financial position of the Fund as of December 31, 2023, the results of its operations for the year then ended, the changes in net assets for each of the two years in the period then ended, and the financial highlights for each of the five years in the period then ended, in conformity with accounting principles generally accepted in the United States of America.
Basis for Opinion
These financial statements are the responsibility of the Fund’s management. Our responsibility is to express an opinion on the Fund’s financial statements based on our audits. We are a public accounting firm registered with the Public Company Accounting Oversight Board (United States) (“PCAOB”) and are required to be independent with respect to the Fund in accordance with the U.S. federal securities laws and the applicable rules and regulations of the Securities and Exchange Commission and the PCAOB.
We conducted our audits in accordance with the standards of the PCAOB. Those standards require that we plan and perform the audit to obtain reasonable assurance about whether the financial statements are free of material misstatement whether due to error or fraud.
Our audits included performing procedures to assess the risks of material misstatement of the financial statements, whether due to error or fraud, and performing procedures that respond to those risks. Such procedures included examining, on a test basis, evidence regarding the amounts and disclosures in the financial statements. Our procedures included confirmation of securities owned as of December 31, 2023, by correspondence with the custodian. Our audits also included evaluating the accounting principles used and significant estimates made by management, as well as evaluating the overall presentation of the financial statements. We believe that our audits provide a reasonable basis for our opinion.
We have served as the Fund’s auditor since 2011.

COHEN & COMPANY, LTD.
Milwaukee, Wisconsin
February 29, 2024
21
Bridges Investment Fund®
EXPENSE EXAMPLE For the Year Ended December 31, 2023 (Unaudited) |
As a shareholder of the Fund you incur two types of costs: (1) transaction costs and (2) ongoing costs, including investment advisory fees and other Fund expenses. This example is intended to help you understand your ongoing costs (in dollars) of investing in the Fund and to compare these costs with the ongoing costs of investing in other mutual funds. The example is based on an investment of $1,000 invested at the beginning of the period and held for the entire period (7/1/23 – 12/31/23).
Actual Expenses
The Actual line of the following tables provide information about actual account values based on actual returns and actual expenses. Although the Fund charges no sales load, you will be assessed fees for outgoing wire transfers, returned checks and stop payment orders at prevailing rates charged by Fund Services, the Fund’s transfer agent. If you request a redemption be made by wire transfer, the Fund’s transfer agent currently charges a $15.00 fee. In addition to the Fund’s expenses, you will indirectly bear your proportionate share of any fees and expenses charged by the underlying funds of other investment companies in which the Fund has shares. Actual expenses of the underlying funds may vary. These expenses are not included in the following examples. The following examples include, but are not limited to, investment advisory fees, fund accounting fees, administration fees, custody fees and transfer agent fees. However, the following examples do not include portfolio trading commissions and related expenses and other extraordinary expenses as determined under generally accepted accounting principles. You may use the information in this line, together with the amount you invested, to estimate the expenses that you paid over the period. Simply divide your account value by $1,000 (for example, an $8,600 account value divided by $1,000 = 8.6), then multiply the result by the number in the first line under the heading entitled “Expenses Paid During the Period” to estimate the expenses you paid on your account during this period.
Hypothetical Example for Comparison Purposes
The Hypothetical line of the following tables include information about hypothetical account values and hypothetical expenses based on the Fund’s actual expense ratio and an assumed rate of return of 5% per year before expenses, which is not the Fund’s actual return. The hypothetical account values and expenses may not be used to estimate the actual ending account balance or expenses you paid for the period. You may use this information to compare the ongoing costs of investing in the Fund and other funds. To do so, compare this 5% hypothetical example with the 5% hypothetical example that appears in the shareholder reports of the other funds. Please note that the expenses shown in the tables are meant to highlight your ongoing costs only and do not reflect any transactional costs, such as redemption fees. Therefore, the hypothetical line of the table is useful in comparing ongoing costs only and will not help you determine the relative total costs of owning different funds. In addition, if these transactional costs were included, your costs would have been higher.
22
Bridges Investment Fund®
EXPENSE EXAMPLE For the Year Ended December 31, 2023 (Unaudited), Continued |
| Beginning | Ending | Expenses Paid | |
| Account Value | Account Value | During the Period | |
7/1/23 | 12/31/23 | 7/1/23 - 12/31/231 | |
Actual | $1,000.00 | $1,091.50 | $3.69 |
Hypothetical | |||
(5% return | |||
before expenses) | $1,000.00 | $1,021.68 | $3.57 |
1 | Expenses are equal to the Bridges Investment Fund’s annualized expense ratio for the most recent six-month period of 0.70% multiplied by the average account value over the period, multiplied by 184/365 days (to reflect the one-half year period). |
23
Bridges Investment Fund®
APPROVAL OF INVESTMENT ADVISORY AGREEMENT (Unaudited) |
At a meeting held on September 20, 2022, the Board (which is comprised of five persons, all of whom are Independent Trustees as defined under the Investment Company Act) considered the initial approval of an Investment Advisory Agreement (the “Advisory Agreement”) for the Bridges Investment Fund (the “Fund”), a new series of Professionally Managed Portfolios with Bridges Investment Management, Inc. (the “Adviser”). At this meeting, the Board received and reviewed substantial information regarding the Fund, the Adviser and the services to be provided by the Adviser to the Fund under the Advisory Agreement. This information formed the primary (but not exclusive) basis for the Board’s determinations. Below is a summary of the factors considered by the Board and the conclusions that formed the basis for the Board’s initial approval of the Advisory Agreement:
1. | The nature, extent and quality of the services provided and to be provided by the Adviser under the Advisory Agreement. The Trustees discussed the nature, extent and quality of the Adviser’s overall services to be provided to the Fund as well as its specific responsibilities in all aspects of the day-to-day management of the Fund. The Board considered the qualifications, experience and responsibilities of the portfolio managers, as well as the responsibilities of other key personnel at the Adviser that would be involved in the day-to-day activities of the Fund. The Trustees noted that the Fund will be the successor to a series of Bridges Investment Fund, Inc., a standalone entity incorporated in the State of Nebraska, managed by the Adviser and reorganized into the Fund (the “Predecessor Fund”). The Board reviewed the proposed services the Adviser would provide to the Fund, including services that extended beyond portfolio management and the receipt of any additional fees by the Adviser or its affiliates. The Trustees reviewed information provided by the Adviser in a due diligence questionnaire, and the Board considered the structure of the Adviser’s compliance procedures and the trading capability of the Adviser. The Trustees also considered the Adviser’s overall financial condition, as well as the implementation and operational effectiveness of the Adviser’s business continuity plan. After reviewing the Adviser’s compliance policies and procedures, the Board concluded that the policies and procedures were reasonably designed to prevent a violation of the federal securities laws. The Board then concluded that the Adviser had sufficient quality and depth of personnel, resources, investment methods and compliance policies and procedures essential to performing its duties under the proposed Advisory Agreement and that, in the Board’s view, the nature, overall quality, and extent of the management services to be provided would be satisfactory. |
2. | The Fund’s historical performance and the overall performance of the Adviser. As the Fund was newly created, the Board was unable to review the performance of the Fund, the Trustees considered the historical performance of the Predecessor Fund, which is managed by the portfolio managers in nearly identical respects as they will manage the Fund. The Trustees noted that the Fund will not commence operations until after the closing of the reorganization of the Predecessor Fund with and into the Fund, at which time |
24
Bridges Investment Fund®
APPROVAL OF INVESTMENT ADVISORY AGREEMENT (Unaudited), Continued |
| the Fund will adopt the performance history of the Predecessor Fund. The Trustees discussed the performance of the Predecessor Fund for the year-to-date, one-year, three-year, five-year, ten-year and since inception periods ended July 31, 2022. In assessing the quality of the portfolio management services to be provided by the Adviser, the Trustees compared the short-term and longer-term performance of the Predecessor Fund on both an absolute basis and in comparison to a benchmark index (the S&P 500 Index for the Predecessor Fund). | ||
| The Trustees noted that the Predecessor Fund outperformed the S&P 500 Index for the year-to-date, one-year, and three-year periods ended July 31, 2022. The Trustees noted that the Predecessor Fund underperformed the S&P 500 Index for the five-year and ten-year periods ended July 31, 2022. | ||
| After considering all of the information and noting that past performance is not a guarantee or indication of future results, the Trustees determined that the Fund and its shareholders were likely to benefit from the Adviser’s management. | ||
| 3. | Costs of Services Provided and Profits Realized by the Adviser. In considering the proposed advisory fee and total fees and expenses of the Fund, the Board reviewed comparisons to its peer funds as determined by Morningstar, as well as all expense waivers and reimbursements. The Trustees noted that the Adviser had contractually agreed to maintain certain annual expense ratios for the Fund. | |
| The Board noted that the proposed advisory fee was 0.50% of average net assets. The Board also noted that the Adviser had contractually agreed to limit the expenses of the Fund to 1.05%, (before acquired fund fees and expenses, brokerage commissions, etc.). The Trustees also noted that the proposed advisory fee was below its category peer group median, while the Fund’s current net expense ratio was below its category peer group median. | ||
| The Trustees also considered the overall profitability that may result from the Adviser’s management of the Fund and reviewed the Adviser’s financial information. The Trustees also examined the level of profits that could be realized by the Adviser from the fees payable under the Agreement based on a pro forma profitability analysis provided by the Adviser. | ||
| The Board concluded that the fees to be received by the Adviser were fair and reasonable. | ||
| 4. | Economies of Scale. The Board also considered that economies of scale could be expected to be realized by the Adviser as the assets of the Fund grows. The Board noted that the Adviser has contractually agreed to reduce its advisory fees or reimburse expenses so that the Fund does not exceed its specified expense limitation. The Board concluded that there were no effective economies of scale to be shared with the Fund at current asset levels, as it had yet to commence operations, but would revisit this issue in the future as circumstances changed and asset levels increased. |
25
Bridges Investment Fund®
APPROVAL OF INVESTMENT ADVISORY AGREEMENT (Unaudited), Continued |
| 5. | The profits to be realized by the Adviser and its affiliates from their relationship with the Fund. The Trustees discussed the likely overall profitability of the Adviser from managing the new Fund. In assessing possible profitability, the Trustees reviewed the Adviser’s financial information and took into account both the likely direct and indirect benefits to the Adviser from advising the Fund. The Trustees concluded that the Adviser’s profit from managing the Fund would likely not be excessive and, after review of relevant financial information, the Adviser would have adequate capitalization and/or would maintain adequate profit levels to support the Fund. |
No single factor was determinative of the Board’s decision to approve the Advisory Agreement, but rather, the Board based its determination on the total mix of information available to them. Based on a consideration of all the factors in their totality, the Board determined that the advisory arrangements with the Adviser, including the advisory fees, were fair and reasonable. The Board therefore determined that the Advisory Agreement would be in the best interests of the Fund and its shareholders.
26
Bridges Investment Fund®
TRUSTEES AND EXECUTIVE OFFICERS (Unaudited) |
The Board is responsible for the overall management of the Trust, including general supervision and review of the investment activities of the Funds. The Board, in turn, elects the officers of the Trust, who are responsible for administering the day-to-day operations of the Trust and its separate series. The current trustees and officers of the Trust, their year of birth, positions with the Trust, terms of office with the Trust and length of time served, their principal occupations for the past five years and other directorships are set forth in the table below.
| Term of | Number of | ||||
Office2 | Portfolios | Other | |||
| and | Principal | in Fund | Directorships | ||
| Position | Length | Occupation | Complex3 | Held | |
| Name, Address | with | of Time | During Past | Overseen | During Past |
And Age | the Trust1 | Served | Five Years | by Trustees | Five Years |
Independent Trustees of the Trust | |||||
Kathleen T. Barr | Trustee | Indefinite | Retired; Chair of | [ 1 ] | Independent |
(born 1955) | Term; | the Governing | Director, | ||
c/o U.S. Bank | Since | Council, Independent | Muzinich | ||
Global Fund | November | Directors Council | BDC, Inc. | ||
Services | 2018. | (since 2020); | (2019 to | ||
615 E. Michigan St. | Chair- | Indefinite | formerly, President, | present); | |
Milwaukee, WI | person | Term; | owner of a registered | Independent | |
53202 | Executive | Since | investment adviser, | Trustee for | |
February | Productive Capital | the William | |||
2023. | Management, Inc. | Blair Funds | |||
(2010 to 2013); | (2013 to | ||||
formerly, Chief | present) | ||||
Administrative | (18 series). | ||||
Officer, Senior Vice | |||||
President and Senior | |||||
Managing Director | |||||
of Allegiant Asset | |||||
Management Company | |||||
(merged with PNC | |||||
Capital Advisors, LLC | |||||
in 2009); formerly, | |||||
Chief Administrative | |||||
Officer, Chief | |||||
Compliance Officer | |||||
and Senior Vice | |||||
President of PNC Funds | |||||
and PNC Advantage | |||||
Funds (f/k/a Allegiant | |||||
Funds) (registered | |||||
investment companies). | |||||
27
Bridges Investment Fund®
TRUSTEES AND EXECUTIVE OFFICERS (Unaudited), Continued |
| Term of | Number of | ||||
Office2 | Portfolios | Other | |||
| and | Principal | in Fund | Directorships | ||
| Position | Length | Occupation | Complex3 | Held | |
| Name, Address | with | of Time | During Past | Overseen | During Past |
And Age | the Trust1 | Served | Five Years | by Trustees | Five Years |
Eric W. Falkeis | Trustee | Indefinite | Chief Growth | [ 1 ] | Interested |
(born 1973) | Term; | Officer, Tidal | Trustee, | ||
c/o U.S. Bank | Since | Financial Group | Tidal ETF | ||
Global Fund | September | (2022 to present); | Trust II (2022 | ||
Services | 2011. | Chief Executive | to present) | ||
615 E. Michigan St. | Officer, Tidal ETF | (7 series); | |||
Milwaukee, WI | Services LLC (2018 to | Independent | |||
53202 | present); formerly, | Director, | |||
Chief Operating | Muzinich | ||||
Officer, Direxion Funds | BDC, Inc. | ||||
(2013 to 2018); | (2019 to | ||||
formerly, Senior Vice | present); | ||||
President and Chief | Interested | ||||
Financial Officer | Trustee, | ||||
(and other positions), | Tidal ETF | ||||
U.S. Bancorp Fund | Trust (2018 | ||||
Services, LLC | to Present) | ||||
(1997 to 2013). | (36 series); | ||||
Former | |||||
Interested | |||||
Trustee, | |||||
Direxion | |||||
Funds | |||||
(22 series), | |||||
Direxion | |||||
Shares ETF | |||||
Trust (112 | |||||
series) and | |||||
Direxion | |||||
Insurance | |||||
Trust (2013 | |||||
to 2018). | |||||
Steven J. Paggioli | Trustee | Indefinite | Consultant; formerly, | [ 1 ] | Independent |
(born 1950) | Term; | Executive Vice | Director, | ||
c/o U.S. Bank | Since | President, Investment | Muzinich | ||
Global Fund | May | Company | BDC, Inc. | ||
Services | 1991. | Administration, LLC | (2019 to | ||
615 E. Michigan St. | (mutual fund | present); | |||
Milwaukee, WI | administrator). | Independent | |||
53202 | Trustee, AMG | ||||
Funds (1993 | |||||
to present) | |||||
(42 series). |
28
Bridges Investment Fund®
TRUSTEES AND EXECUTIVE OFFICERS (Unaudited), Continued |
| Term of | Number of | ||||
Office2 | Portfolios | Other | |||
| and | Principal | in Fund | Directorships | ||
| Position | Length | Occupation | Complex3 | Held | |
| Name, Address | with | of Time | During Past | Overseen | During Past |
And Age | the Trust1 | Served | Five Years | by Trustees | Five Years |
Ashi S. Parikh | Trustee | Indefinite | Investment | [ 1 ] | Board of |
(born 1966) | Term; | professional; | Directors | ||
c/o U.S. Bank | Since | formerly, Chief | Member, | ||
Global Fund | June | Executive and Chief | Investment | ||
Services | 2020. | Investment Officer | Working | ||
615 E. Michigan St. | and various other | Group, The | |||
Milwaukee, WI | positions, RidgeWorth | Ohio State | |||
53202 | Investments, LLC | University | |||
(global investment | Endowments | ||||
management firm) | and | ||||
(2006 to 2017); | Foundation | ||||
formerly, Chief | (2016 to | ||||
Investment Officer | present); | ||||
Institutional Growth | Board of | ||||
Equities, Eagle Asset | Directors, | ||||
Management (investment | World | ||||
management firm); | Methodist | ||||
formerly Sr. Managing | Council, | ||||
Director, Growth | Investment | ||||
Equities, Banc One | Committee | ||||
Investment Advisors | (2018 to | ||||
(investment | present); | ||||
management firm). | Independent | ||||
Trustee, PNC | |||||
Funds (2018 | |||||
to 2019) | |||||
(32 series); | |||||
Interested | |||||
Trustee, | |||||
RidgeWorth | |||||
Funds (2014 | |||||
to 2017) | |||||
(35 series). |
29
Bridges Investment Fund®
TRUSTEES AND EXECUTIVE OFFICERS (Unaudited), Continued |
| Term of | Number of | ||||
Office2 | Portfolios | Other | |||
| and | Principal | in Fund | Directorships | ||
| Position | Length | Occupation | Complex3 | Held | |
| Name, Address | with | of Time | During Past | Overseen | During Past |
And Age | the Trust1 | Served | Five Years | by Trustees | Five Years |
Cynthia M. Fornelli | Trustee | Indefinite | Independent | [ 1 ] | Independent |
(born 1960) | Term; | Director of | Director, | ||
c/o U.S. Bank | Since | TriplePoint Venture | TriplePoint | ||
Global Fund | January | Growth BDC Corp. | Private | ||
Services | 2022. | (2019 to present); | Venture | ||
615 E. Michigan St. | Retired; formerly, | Credit, Inc. | |||
Milwaukee, WI | Executive Director of | (2020 to | |||
53202 | the Center for Audit | present). | |||
Quality (2007-2019); | |||||
formerly, Senior Vice | |||||
President of | |||||
Regulatory Conflicts | |||||
Management at Bank | |||||
of America (2005-2007); | |||||
formerly, Deputy | |||||
Director, Division of | |||||
Investment Management | |||||
with the U.S. Securities | |||||
and Exchange | |||||
Commission (1998-2005). | |||||
Officers of the Trust | |||||
Jason F. Hadler | President | Indefinite | Senior Vice | Not | Not |
(born 1975) | & | Term; | President and | Applicable. | Applicable. |
c/o U.S. Bank | Principal | Since | Head of Client | ||
Global Fund | Executive | September | Experience, U.S. | ||
Services | Officer | 2021. | Bank Global Fund | ||
615 E. Michigan St. | Services, since | ||||
Milwaukee, WI | March 2022; Senior | ||||
53202 | Vice President and | ||||
Head of Fund Services | |||||
Fund Administration | |||||
Department, U.S. Bank | |||||
Global Fund Services | |||||
(December 2003- | |||||
March 2022). | |||||
30
Bridges Investment Fund®
TRUSTEES AND EXECUTIVE OFFICERS (Unaudited), Continued |
| Term of | Number of | ||||
Office2 | Portfolios | Other | |||
| and | Principal | in Fund | Directorships | ||
| Position | Length | Occupation | Complex3 | Held | |
| Name, Address | with | of Time | During Past | Overseen | During Past |
And Age | the Trust1 | Served | Five Years | by Trustees | Five Years |
Carl G. Gee, Esq. | Secretary | Indefinite | Assistant Secretary | Not | Not |
(born 1990) | & Vice | Term; | of the Trust | Applicable. | Applicable. |
c/o U.S. Bank | President | Since | (2020-2021); | ||
Global Fund | February | Assistant Vice | |||
Services | 2021. | President and | |||
615 E. Michigan St. | Counsel, U.S. Bank | ||||
Milwaukee, WI | Global Fund Services | ||||
53202 | since August 2016; | ||||
Summer Associate, | |||||
Husch Blackwell LLP | |||||
(2015); Law Clerk, | |||||
Brady Corporation | |||||
(global printing systems, | |||||
labels and safety | |||||
products company) | |||||
(2014-2015). | |||||
Craig Benton | Treasurer | Indefinite | Assistant Treasurer | Not | Not |
(born 1985) | & Vice | Term; | of the Trust | Applicable. | Applicable. |
c/o U.S. Bank | President | Since | (2016-2021); | ||
Global Fund | December | Assistant Vice | |||
Services | 2021. | President, U.S. Bank | |||
615 E. Michigan St. | Global Fund Services | ||||
Milwaukee, WI | since November 2007. | ||||
53202 | |||||
Kyle J. Buscemi | Assistant | Indefinite | Mutual Funds | Not | Not |
(born 1996) | Treasurer | Term; | Administrator, | Applicable. | Applicable. |
c/o U.S. Bank | Since | U.S. Bank Global | |||
Global Fund | June | Fund Services since | |||
Services | 2022. | June 2018; Business | |||
615 E. Michigan St. | Administration | ||||
Milwaukee, WI | Student, 2014-2018. | ||||
53202 | |||||
Kathryn E. LaPlante | Assistant | Indefinite | Mutual Funds | Not | Not |
Johnson | Treasurer | Term; | Administrator, | Applicable. | Applicable. |
(born 1998) | Since | U.S. Bank Global | |||
c/o U.S. Bank | November | Fund Services since | |||
Global Fund | 2023. | June 2020; Business | |||
Services | Administration | ||||
615 E. Michigan St. | Student, 2017-2021. | ||||
Milwaukee, WI | |||||
53202 |
31
Bridges Investment Fund®
TRUSTEES AND EXECUTIVE OFFICERS (Unaudited), Continued |
| Term of | Number of | ||||
Office2 | Portfolios | Other | |||
| and | Principal | in Fund | Directorships | ||
| Position | Length | Occupation | Complex3 | Held | |
| Name, Address | with | of Time | During Past | Overseen | During Past |
And Age | the Trust1 | Served | Five Years | by Trustees | Five Years |
Gazala Khan | Chief | Indefinite | Vice President and | Not | Not |
(born 1969) | Compliance | Term; | Compliance Officer, | Applicable. | Applicable. |
c/o U.S. Bank | Officer | Since | U.S. Bank Global | ||
Global Fund | November | Fund Services since | |||
Services | Anti-Money | 2022. | July 2022; Chief | ||
615 E. Michigan St. | Laundering | Compliance Officer | |||
Milwaukee, WI | Officer | Matthews Asia Fund | |||
53202 | (May 2019- | ||||
July 15, 2022); Chief | |||||
Compliance Officer | |||||
GS Trust/VIT | |||||
(June2009-May 2019); | |||||
Vice President GSAM | |||||
(May 2005-June 2009); | |||||
Staff Accountant, | |||||
SEC Office of | |||||
Compliance Inspection | |||||
and Examination | |||||
(1999-2005) |
1 | All Trustees of the Trust who are not “interested persons” of the Trust as defined under the 1940 Act (“Independent Trustees”). |
2 | Under the terms of the Board’s retirement policy, a Trustee shall retire at the end of the calendar year in which he or she reaches the age of 78. |
3 | The Trust is comprised of numerous series managed by unaffiliated investment advisers. The term “Fund Complex” applies only to the Fund. The Fund does not hold itself out as related to any other series within the Trust for investment purposes, nor does it share the same investment advisor with any other series. |
32
Bridges Investment Fund®
QUALIFIED DIVIDEND INCOME/DIVIDENDS RECEIVED DEDUCTION (Unaudited) |
For the year ended December 31, 2023, certain dividends paid by the Fund may be subject to a maximum tax rate of 15%, as provided for by the Jobs and Growth Tax Relief Reconciliation Act of 2003 and the Tax Cuts and Jobs Act of 2017. The percentage of dividends declared from the net investment income designated as qualified dividend income was as follows:
| Bridges Investment Fund | 0.00% |
For corporate shareholders, the percent of ordinary income distributions qualifying for the corporate dividends received deduction for the year ended December 31, 2023 was as follows:
| Bridges Investment Fund | 0.00% |
The percentage of taxable ordinary income distributions that are designated as short-term capital gain distributions under Internal Revenue Section 871(k)(2)(C) for the Fund were as follows (unaudited):
| Bridges Investment Fund | 0.00% |
INFORMATION ABOUT PROXY VOTING (Unaudited) |
A description of the policies and procedures that the Fund uses to determine how to vote proxies relating to portfolio securities is available upon request without charge, by calling 866-934-4700 or by accessing the Fund’s website at www.bridgesfund.com. Furthermore, you can obtain the description on the SEC’s website at www.sec.gov.
Information regarding how the Fund voted proxies relating to portfolio securities during the most recent 12-month period ended June 30 is available without charge, upon request, by calling 866-934-4700 Furthermore, you can obtain the Fund’s proxy voting records on the Fund’s website at www.bridgesfund.com and on the SEC’s website at www.sec.gov.
33
Bridges Investment Fund®
INFORMATION ABOUT THE PORTFOLIO HOLDINGS (Unaudited) |
The Fund’s quarterly holdings for the most recent fiscal year can be obtained by accessing the Fund’s website at www.bridgesfund.com. The Fund files its complete schedule of portfolio holdings with the SEC for the first and third quarters of the fiscal year as an exhibit to their reports on Form N-PORT. The Fund’s Form N-PORT is available on the SEC’s website at www.sec.gov. The Fund’s Form N-PORT may also be obtained by calling 866-934-4700.
INFORMATION ABOUT HOUSEHOLDING (Unaudited) |
Each year, you are automatically sent an updated summary prospectus, as well as annual and semi-annual reports for the Fund, if applicable. In an effort to decrease costs, the Fund will reduce the number of duplicate summary prospectuses, proxy statements, and annual and semi-annual reports that you receive by sending only one copy of each to those addresses shown by two or more accounts. Please call the Fund’s transfer agent toll free at 866-934-4700 to request individual copies of these documents. The Fund will begin sending individual copies 30 days after receiving your request. This policy does not apply to account statements.
INFORMATION ABOUT THE FUND’S TRUSTEES (Unaudited) |
The Statement of Additional Information (“SAI”) includes additional information about the Fund’s Trustees and is available without charge, upon request, by calling 866-934-4700. Furthermore, you can obtain the SAI on the SEC’s website at www.sec.gov or the Fund’s website at www.bridgesfund.com.
34
Bridges Investment Fund®
PRIVACY NOTICE (Unaudited) |
The Fund collects non-public information about you from the following sources:
| • | Information we receive about you on applications or other forms; |
| • | Information you give us orally; and |
| • | Information about your transactions with us or others. |
We do not disclose any non- public personal information about our shareholders or former shareholders without the shareholder’s authorization, except as permitted by law or in response to inquiries from governmental authorities. We may share information with affiliated parties and unaffiliated third parties with whom we have contracts for servicing the Fund. We will provide unaffiliated third parties with only the information necessary to carry out their assigned responsibility. We maintain physical, electronic and procedural safeguards to protect your non-public personal information and require third parties to treat your non-public information with the same high degree of confidentiality.
In the event that you hold shares of the Fund through a financial intermediary, including, but not limited to, a broker-dealer, bank or trust company, the privacy policy of your financial intermediary would govern how your non-public personal information would be shared by those entities with unaffiliated third parties.
35
(This Page Intentionally Left Blank.)
Bridges Investment Fund®
C/O U.S. Bancorp Fund Services
615 East Michigan Street
Milwaukee, Wisconsin 53202
Adviser
BRIDGES INVESTMENT MANAGEMENT, INC.
P.O. Box 542021
Omaha, Nebraska 68154
Distributor
QUASAR DISTRIBUTORS, LLC
3 Canal Plaza, Suite 100
Portland, Maine 04101
Custodian
U.S. BANK N.A.
Custody Operations
1555 North RiverCenter Drive, Suite 302
Milwaukee, Wisconsin 53212
Transfer Agent, Fund Accountant and Fund Administrator
U.S. BANCORP FUND SERVICES, LLC
615 East Michigan Street
Milwaukee, Wisconsin 53202
(866) 236-0050
Independent Registered Public Accounting Firm
COHEN & COMPANY, LTD.
324 North Water Street, Suite 830
Milwaukee, Wisconsin 53202
Legal Counsel
SULLIVAN & WORCESTER, LLP
1633 Broadway, 32nd Floor
New York, New York 10019
Bridges Investment Fund®
Symbol – BRGIX
CUSIP – 74316P652
(b) Not applicable.
Item 2. Code of Ethics.
The registrant has adopted a code of ethics that applies to the registrant’s principal executive officer and principal financial officer. The registrant has not made any amendments to its code of ethics during the period covered by this report. The registrant has not granted any waivers from any provisions of the code of ethics during the period covered by this report.
A copy of the registrant’s Code of Ethics is filed herewith.
Item 3. Audit Committee Financial Expert.
The registrant’s Board of Trustees of the Trust has determined that there is at least one audit committee financial expert serving on its audit committee. Ms. Kathleen T. Barr, Ms. Cynthia M. Fornelli, Messrs. Eric W. Falkeis, Steven J. Paggioli and Ashi S. Parikh are each an “audit committee financial expert” and are considered to be “independent” as each term is defined in Item 3 of Form N-CSR.
Item 4. Principal Accountant Fees and Services.
The registrant has engaged its principal accountant to perform audit services, audit-related services, tax services and other services during the past two fiscal years. “Audit services” refer to performing an audit of the registrant's annual financial statements or services that are normally provided by the accountant in connection with statutory and regulatory filings or engagements for those fiscal years. “Audit-related services” refer to the assurance and related services by the principal accountant that are reasonably related to the performance of the audit. “Tax services” refer to professional services rendered by the principal accountant for tax compliance, tax advice, and tax planning. The following table details the aggregate fees billed or expected to be billed for each of the last two fiscal years for audit fees, audit-related fees, tax fees and other fees by the principal accountant.
Bridges Investment Fund
FYE 12/31/2023 | FYE 12/31/2022 | |
Audit Fees | $17,000 | $14,500 |
Audit-Related Fees | N/A | N/A |
Tax Fees | $3,500 | $3,500 |
All Other Fees | N/A | $800 |
The audit committee has adopted pre-approval policies and procedures that require the audit committee to pre‑approve all audit and non‑audit services of the registrant, including services provided to any entity affiliated with the registrant.
The percentage of fees billed by Cohen & Company, LTD. applicable to non-audit services pursuant to waiver of pre-approval requirement were as follows:
FYE 12/31/2023 | FYE 12/31/2022 | |
Audit-Related Fees | 0% | 0% |
Tax Fees | 0% | 0% |
All Other Fees | 0% | 0% |
All of the principal accountant’s hours spent on auditing the registrant’s financial statements were attributed to work performed by full‑time permanent employees of the principal accountant.
The following table indicates the non-audit fees billed or expected to be billed by the registrant’s accountant for services to the registrant and to the registrant’s investment adviser (and any other controlling entity, etc.—not sub-adviser) for the last two years. The audit committee of the board of trustees/directors has considered whether the provision of non-audit services that were rendered to the registrant's investment adviser is compatible with maintaining the principal accountant's independence and has concluded that the provision of such non-audit services by the accountant has not compromised the accountant’s independence.
Non-Audit Related Fees | FYE 12/31/2023 | FYE 12/31/2022 |
Registrant | N/A | N/A |
Registrant’s Investment Advisor | N/A | N/A |
Item 5. Audit Committee of Listed Registrants.
Not applicable to registrants who are not listed issuers (as defined in Rule 10A-3 under the Securities Exchange Act of 1934).
Item 6. Investments.
(a) Schedule of Investments is included as part of the report to shareholders filed under Item 1 of this Form.
(b) Not applicable.
Item 7. Disclosure of Proxy Voting Policies and Procedures for Closed-End Management Investment Companies.
Not applicable to open-end investment companies.
Item 8. Portfolio Managers of Closed-End Management Investment Companies.
Not applicable to open-end investment companies.
Item 9. Purchases of Equity Securities by Closed‑End Management Investment Company and Affiliated Purchasers.
Not applicable to open-end investment companies.
Item 10. Submission of Matters to a Vote of Security Holders.
The registrant has adopted a nominating committee charter that contains the procedures by which shareholders may recommend nominees to the registrant’s board of trustees. There have been no material changes to the procedures by which shareholders may recommend nominees to the registrant’s board of Trustees.
Item 11. Controls and Procedures.
| (a) | The Registrant’s Principal Executive Officer and Principal Financial Officer have reviewed the Registrant's disclosure controls and procedures (as defined in Rule 30a-3(c) under the Investment Company Act of 1940 (the “Act”)) as of a date within 90 days of the filing of this report, as required by Rule 30a-3(b) under the Act and Rules 13a-15(b) or 15d‑15(b) under the Securities Exchange Act of 1934. Based on their review, such officers have concluded that the disclosure controls and procedures are effective in ensuring that information required to be disclosed in this report is appropriately recorded, processed, summarized and reported and made known to them by others within the Registrant and by the Registrant’s service provider. |
| (b) | There were no changes in the Registrant's internal control over financial reporting (as defined in Rule 30a-3(d) under the Act) that occurred during the period covered by this report that has materially affected, or is reasonably likely to materially affect, the Registrant's internal control over financial reporting. |
Item 12. Disclosure of Securities Lending Activities for Closed-End Management Investment Companies
Not applicable to open-end investment companies.
Item 13. Exhibits.
(3) Any written solicitation to purchase securities under Rule 23c‑1 under the Act sent or given during the period covered by the report by or on behalf of the registrant to 10 or more persons. Not applicable to open-end investment companies.
(4) Change in the registrant’s independent public accountant. There was no change in the registrant’s independent public accountant for the period covered by this report.
SIGNATURES
Pursuant to the requirements of the Securities Exchange Act of 1934 and the Investment Company Act of 1940, the registrant has duly caused this report to be signed on its behalf by the undersigned, thereunto duly authorized.
(Registrant) Professionally Managed Portfolios
By (Signature and Title) /s/Jason Hadler
Jason Hadler, President/Principal Executive Officer
Date March 8, 2024
Pursuant to the requirements of the Securities Exchange Act of 1934 and the Investment Company Act of 1940, this report has been signed below by the following persons on behalf of the registrant and in the capacities and on the dates indicated.
By (Signature and Title) /s/Jason Hadler
Jason Hadler, President/Principal Executive Officer
Date March 8, 2024
By (Signature and Title) /s/Craig Benton
Craig Benton, Treasurer/Principal Financial Officer
Date March 8, 2024
* Print the name and title of each signing officer under his or her signature.