CONGRESS FUNDS
Congress Intermediate Bond ETF
Congress Large Cap Growth ETF
Congress SMid Growth ETF
Core Financial Statements
October 31, 2024
UNITED STATES
SECURITIES AND EXCHANGE COMMISSION
Washington, D.C. 20549
FORM N-CSR
CERTIFIED SHAREHOLDER REPORT OF REGISTERED
MANAGEMENT INVESTMENT COMPANIES
Investment Company Act file number (811-05037)
Professionally Managed Portfolios
(Exact name of registrant as specified in charter)
615 East Michigan Street
Milwaukee, WI 53202
(Address of principal executive offices) (Zip code)
Jason Hadler
Professionally Managed Portfolios
c/o U.S. Bank Global Fund Services
777 E. Wisconsin Avenue
Milwaukee, WI 53202
(Name and address of agent for service)
(414) 516-1523
Registrant’s telephone number, including area code
Date of fiscal year end: October 31
Date of reporting period: October 31, 2024
Item 1. Report to Stockholders.
| (a) | ||
 | Congress Intermediate Bond ETF |  |
CAFX (Principal U.S. Listing Exchange: NYSE ArcaNYSEArca) | ||
| Annual Shareholder Report | October 31, 2024 |
Fund Name | Costs of a $10,000 investment | Costs paid as a percentage of a $10,000 investment |
| Congress Intermediate Bond ETF | $5 | 0.35% |
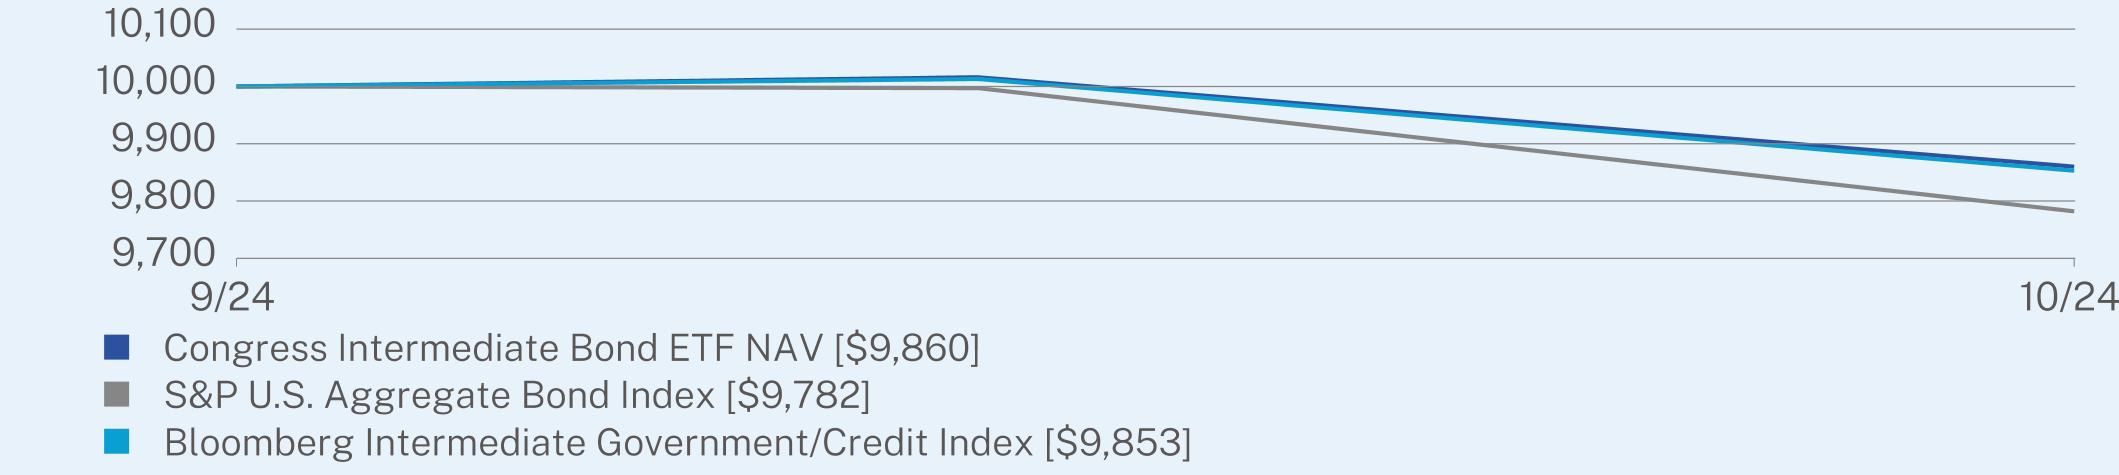
Since Inception (09/09/2024) | |
Congress Intermediate Bond ETF NAV | -1.40 |
S&P U.S. Aggregate Bond Index | -2.18 |
Bloomberg Intermediate Government/Credit Index | -1.47 |
| Congress Intermediate Bond ETF | PAGE 1 | TSR-AR-74316P587 |
| * | The Fund’s past performance is not a good predictor of how the Fund will perform in the future. The graph and table do not reflect the deduction of taxes that a shareholder would pay on Fund distributions or redemption of Fund shares. |
Net Assets | $85,984,148 |
Number of Holdings | 33 |
Net Advisory Fee | $28,277 |
Portfolio Turnover | 7% |
Average Credit Quality | AA-/A+ |
Effective Duration | 3.63 Years |
30-Day SEC Yield | 4.08% |
30-Day SEC Yield Unsubsidized | 4.08% |
Weighted Average Maturity | 4.34 Years |
Top Holdings | (% of Net Assets) |
United States Treasury Note/Bond | 5.5% |
United States Treasury Note/Bond | 5.0% |
United States Treasury Note/Bond | 4.7% |
United States Treasury Note/Bond | 4.6% |
United States Treasury Note/Bond | 4.4% |
United States Treasury Note/Bond | 4.2% |
United States Treasury Note/Bond | 4.1% |
United States Treasury Note/Bond | 3.9% |
Comcast Corp. | 3.8% |
Goldman Sachs Group, Inc. | 3.7% |
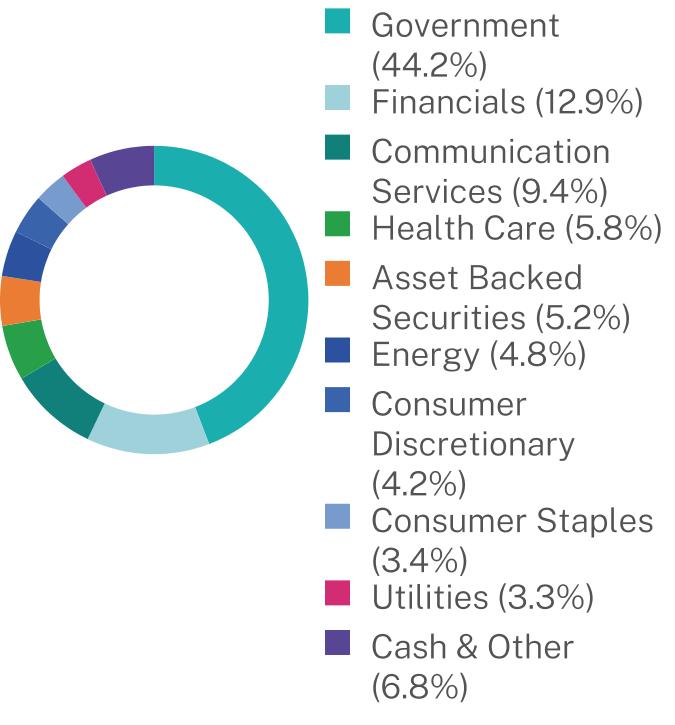
Industry | (% of Net Assets) |
Sovereign | 36.4% |
Banks | 9.2% |
Public Finance Activities | 7.8% |
Diversified Telecommunication Services | 5.6% |
Automobile ABS | 5.2% |
Auto Manufacturers | 4.2% |
Media | 3.8% |
Capital Markets | 3.7% |
Electric | 3.3% |
Cash & Other | 20.8% |
| * | The Global Industry Classification Standard (“GICS®”) was developed by and/or is the exclusive property of MSCI, Inc. (“MSCI”) and Standard & Poor’s Financial Services LLC (“S&P”). GICS® is a service mark of MSCI and S&P and has been licensed for use by U.S. Bank Global Fund Services. |
| Congress Intermediate Bond ETF | PAGE 2 | TSR-AR-74316P587 |
 | Congress Large Cap Growth ETF |  |
CAML (Principal U.S. Listing Exchange: NYSE ArcaNYSEArca) | ||
| Annual Shareholder Report | October 31, 2024 |
Fund Name | Costs of a $10,000 investment | Costs paid as a percentage of a $10,000 investment |
| Congress Large Cap Growth ETF | $77 | 0.65% |
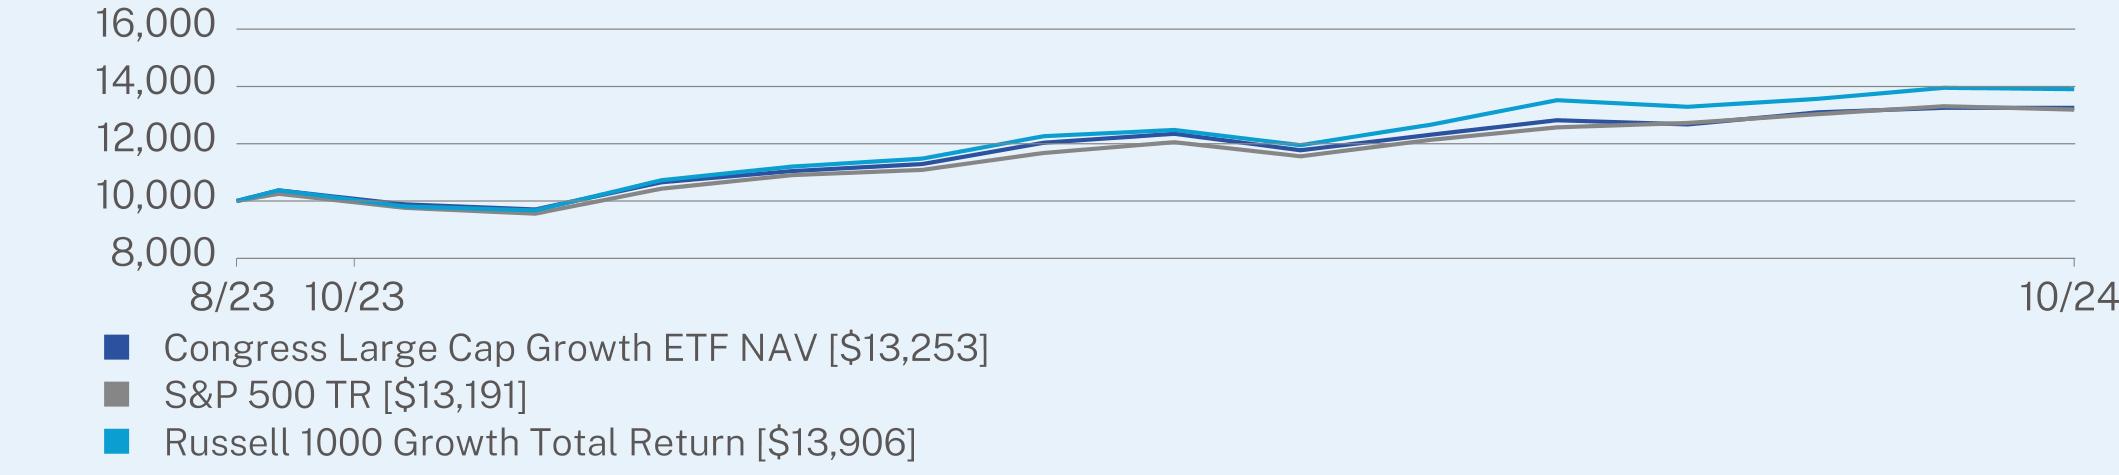
1 Year | Since Inception (08/21/2023) | |
Congress Large Cap Growth ETF NAV | 36.55 | 26.58 |
S&P 500 TR | 38.02 | 26.09 |
Russell 1000 Growth Total Return | 43.77 | 31.79 |
| * | The Fund’s past performance is not a good predictor of how the Fund will perform in the future. The graph and table do not reflect the deduction of taxes that a shareholder would pay on Fund distributions or redemption of Fund shares. |
| Congress Large Cap Growth ETF | PAGE 1 | TSR-AR-74316P637 |
Net Assets | $248,445,687 |
Number of Holdings | 40 |
Net Advisory Fee | $932,371 |
Portfolio Turnover | 33% |
Top Holdings | (% of Net Assets) |
NVIDIA Corp. | 5.2% |
Apple, Inc. | 3.7% |
Costco Wholesale Corp. | 3.3% |
Meta Platforms, Inc. - Class A | 3.3% |
Eli Lilly & Co. | 3.1% |
ServiceNow, Inc. | 3.1% |
Arista Networks, Inc. | 3.1% |
Eaton Corp. PLC | 3.1% |
Microsoft Corp. | 3.1% |
O’Reilly Automotive, Inc. | 2.8% |
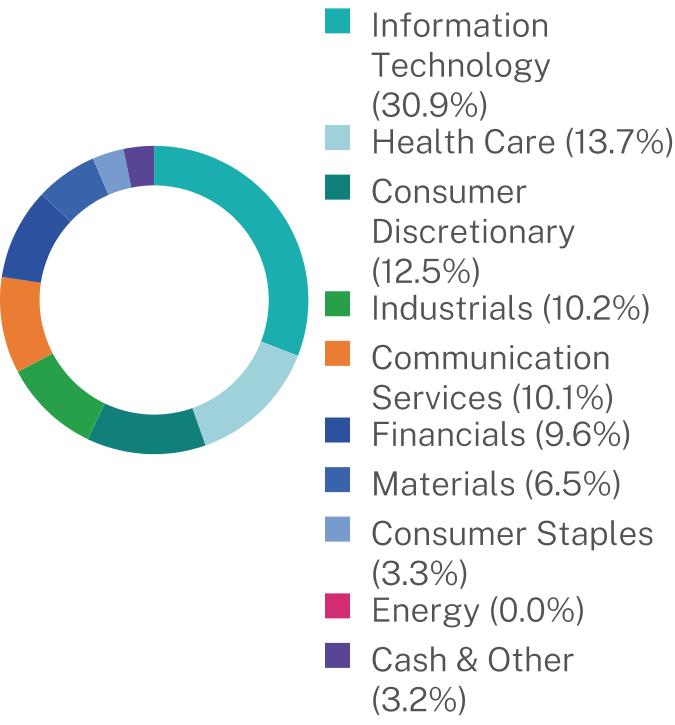
Industry | (% of Net Assets) |
Software | 14.8% |
Semiconductors & Semiconductor Equipment | 9.3% |
Specialty Retail | 7.7% |
Interactive Media & Services | 6.0% |
Health Care Equipment & Supplies | 5.2% |
Pharmaceuticals | 5.0% |
Chemicals | 4.5% |
Capital Markets | 4.4% |
Technology Hardware, Storage & Peripherals | 3.7% |
Cash & Other | 39.4% |
| * | The Global Industry Classification Standard (“GICS®”) was developed by and/or is the exclusive property of MSCI, Inc. (“MSCI”) and Standard & Poor’s Financial Services LLC (“S&P”). GICS® is a service mark of MSCI and S&P and has been licensed for use by U.S. Bank Global Fund Services. |
| Congress Large Cap Growth ETF | PAGE 2 | TSR-AR-74316P637 |
 | Congress SMid Growth ETF |  |
CSMD (Principal U.S. Listing Exchange: NYSE ArcaNYSEArca) | ||
| Annual Shareholder Report | October 31, 2024 |
Fund Name | Costs of a $10,000 investment | Costs paid as a percentage of a $10,000 investment |
| Congress SMid Growth ETF | $77 | 0.68% |
1 Year | Since Inception (08/21/2023) | |
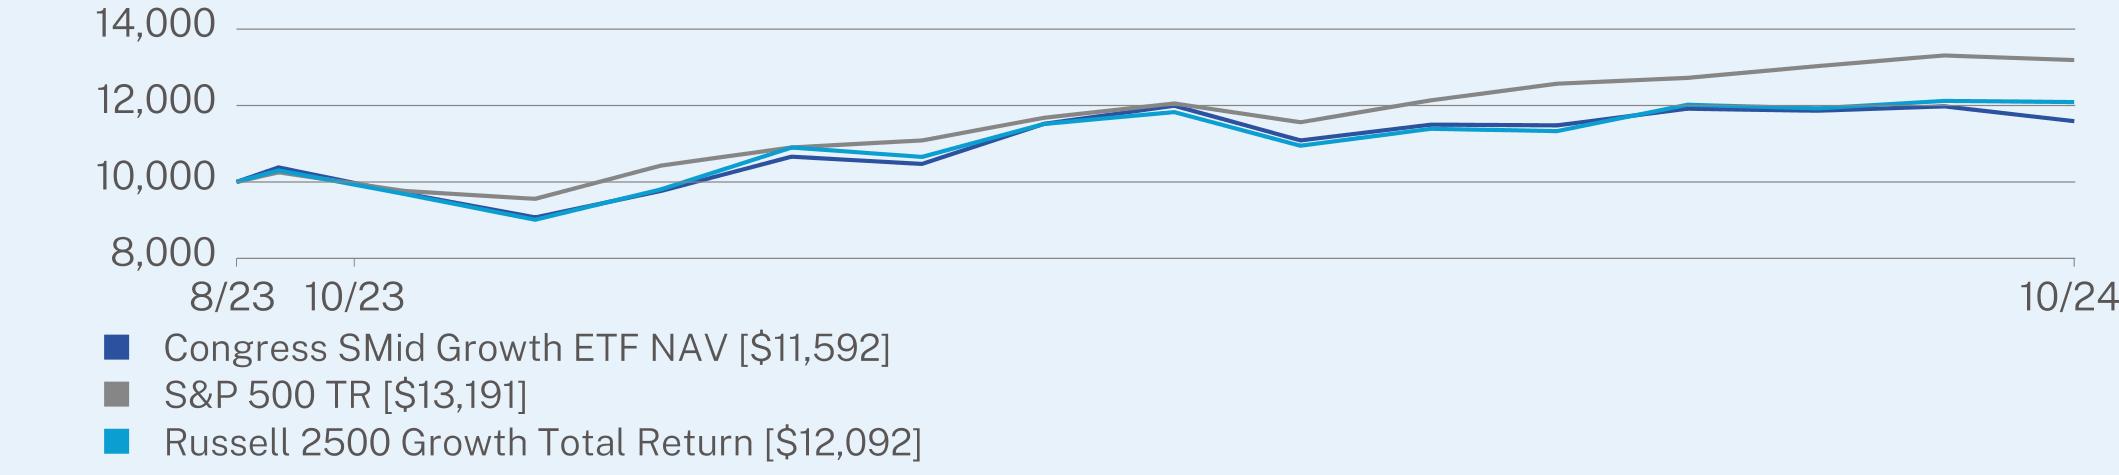
Congress SMid Growth ETF NAV | 27.78 | 13.17 |
S&P 500 TR | 38.02 | 26.09 |
Russell 2500 Growth Total Return | 34.21 | 17.24 |
| * | The Fund’s past performance is not a good predictor of how the Fund will perform in the future. The graph and table do not reflect the deduction of taxes that a shareholder would pay on Fund distributions or redemption of Fund shares. |
| Congress SMid Growth ETF | PAGE 1 | TSR-AR-74316P645 |
Net Assets | $196,445,627 |
Number of Holdings | 44 |
Net Advisory Fee | $788,744 |
Portfolio Turnover | 23% |
30-Day SEC Yield | -0.05% |
30-Day SEC Yield Unsubsidized | -0.05% |
Top Holdings | (% of Net Assets) |
Comfort Systems USA, Inc. | 4.1% |
CyberArk Software Ltd. | 3.6% |
Curtiss-Wright Corp. | 3.4% |
SPS Commerce, Inc. | 3.0% |
Valmont Industries, Inc. | 3.0% |
PTC, Inc. | 3.0% |
Tractor Supply Co. | 2.9% |
First American Treasury Obligations Fund | 2.8% |
BJ’s Wholesale Club Holdings, Inc. | 2.8% |
Summit Materials, Inc. - Class A | 2.7% |
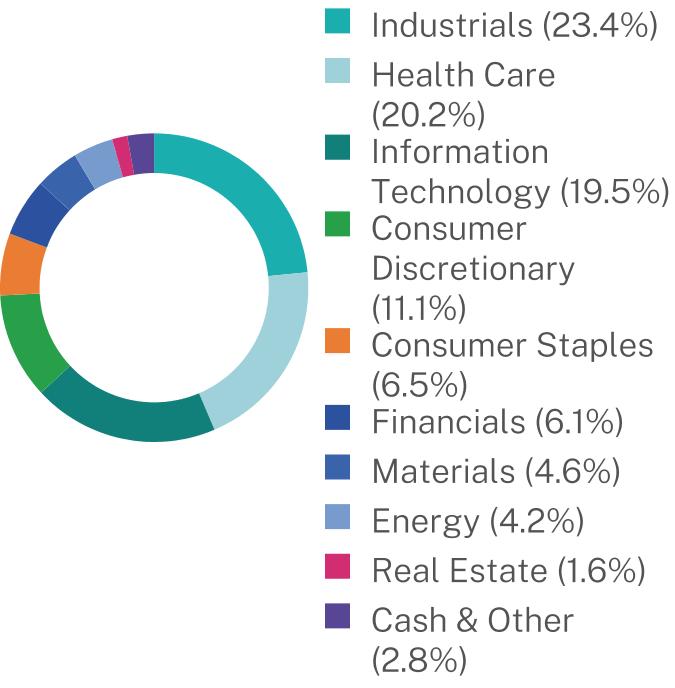
Industry | (% of Net Assets) |
Software | 11.7% |
Health Care Equipment & Supplies | 10.1% |
Construction & Engineering | 9.6% |
Specialty Retail | 5.4% |
Electronic Equipment, Instruments & Components | 4.1% |
Life Sciences Tools & Services | 4.0% |
Aerospace & Defense | 3.4% |
Consumer Staples Distribution & Retail | 2.8% |
Construction Materials | 2.7% |
Cash & Other | 46.2% |
| * | The Global Industry Classification Standard (“GICS®”) was developed by and/or is the exclusive property of MSCI, Inc. (“MSCI”) and Standard & Poor’s Financial Services LLC (“S&P”). GICS® is a service mark of MSCI and S&P and has been licensed for use by U.S. Bank Global Fund Services. |
| Congress SMid Growth ETF | PAGE 2 | TSR-AR-74316P645 |
| (b) | Not applicable. |
Item 2. Code of Ethics.
The registrant has adopted a code of ethics that applies to the registrant’s principal executive officer and principal financial officer. The registrant has not made any amendments to its code of ethics during the period covered by this report. The registrant has not granted any waivers from any provisions of the code of ethics during the period covered by this report.
A copy of the registrant’s Code of Ethics is filed herewith.
Item 3. Audit Committee Financial Expert.
The registrant’s Board of Trustees of the Trust has determined that there is at least one audit committee financial expert serving on its audit committee. Ms. Kathleen T. Barr, Ms. Cynthia M. Fornelli, Messrs. Eric W. Falkeis, Steven J. Paggioli and Ashi S. Parikh are each an “audit committee financial expert” and are considered to be “independent” as each term is defined in Item 3 of Form N-CSR.
Item 4. Principal Accountant Fees and Services.
The registrant has engaged its principal accountant to perform audit services, audit-related services, tax services and other services during the past two fiscal years. “Audit services” refer to performing an audit of the registrant’s annual financial statements or services that are normally provided by the accountant in connection with statutory and regulatory filings or engagements for those fiscal years. “Audit-related services” refer to the assurance and related services by the principal accountant that are reasonably related to the performance of the audit. “Tax services” refer to professional services rendered by the principal accountant for tax compliance, tax advice, and tax planning. There were no “Other services” provided by the principal accountant. The following tables detail the aggregate fees billed or expected to be billed for each of the last two fiscal years for audit fees, audit-related fees, tax fees and other fees by the principal accountant.
Congress Large Cap Growth ETF
| FYE 10/31/2024 | FYE 10/31/2023 | |
| Audit Fees | $12,500 | $12,500 |
| Audit-Related Fees | N/A | N/A |
| Tax Fees | $2,500 | $2,500 |
| All Other Fees | N/A | N/A |
Congress SMid Growth ETF
| FYE 10/31/2024 | FYE 10/31/2023 | |
| Audit Fees | $12,500 | $12,500 |
| Audit-Related Fees | N/A | N/A |
| Tax Fees | $2,500 | $2,500 |
| All Other Fees | N/A | N/A |
Congress Intermediate Bond ETF
| FYE 10/31/2024 | FYE 10/31/2023 | |
| Audit Fees | $7,500 | N/A |
| Audit-Related Fees | N/A | N/A |
| Tax Fees | $2,500 | N/A |
| All Other Fees | N/A | N/A |
(e)(1) The audit committee has adopted pre-approval policies and procedures that require the audit committee to pre-approve all audit and non-audit services of the registrant, including services provided to any entity affiliated with the registrant.
(e)(2) The percentages of fees billed by Tait, Weller & Baker LLP applicable to non-audit services pursuant to waiver of pre-approval requirement were as follows:
Congress Large Cap Growth ETF
| FYE 10/31/2024 | FYE 10/31/2023 | |
Audit-Related Fees | 0% | 0% |
| Tax Fees | 0% | 0% |
| All Other Fees | 0% | 0% |
Congress SMid Growth ETF
| FYE 10/31/2024 | FYE 10/31/2023 | |
Audit-Related Fees | 0% | 0% |
| Tax Fees | 0% | 0% |
| All Other Fees | 0% | 0% |
Congress Intermediate Bond ETF
| FYE 10/31/2024 | FYE 10/31/2023 | |
Audit-Related Fees | 0% | N/A |
| Tax Fees | 0% | N/A |
| All Other Fees | 0% | N/A |
(f) N/A
(g) The following table indicates the non-audit fees billed or expected to be billed by the registrant’s accountant for services to the registrant and to the registrant’s investment advisor (and any other controlling entity, etc.—not sub-advisor) for the last two years.
Congress Large Cap Growth ETF
| Non-Audit Related Fees | FYE 10/31/2024 | FYE 10/31/2023 |
| Registrant | N/A | N/A |
| Registrant’s Investment Adviser | N/A | N/A |
Congress SMid Growth ETF
| Non-Audit Related Fees | FYE 10/31/2024 | FYE 10/31/2023 |
| Registrant | N/A | N/A |
| Registrant’s Investment Adviser | N/A | N/A |
Congress Intermediate Bond ETF
| Non-Audit Related Fees | FYE 10/31/2024 | FYE 10/31/2023 |
| Registrant | N/A | N/A |
| Registrant’s Investment Adviser | N/A | N/A |
(h) The audit committee of the board of trustees has considered whether the provision of non-audit services that were rendered to the registrant’s investment advisor is compatible with maintaining the principal accountant’s independence and has concluded that the provision of such non-audit services by the accountant has not compromised the accountant’s independence.
The registrant has not been identified by the U.S. Securities and Exchange Commission as having filed an annual report issued by a registered public accounting firm branch or office that is located in a foreign jurisdiction where the Public Company Accounting Oversight Board is unable to inspect or completely investigate because of a position taken by an authority in that jurisdiction.
The registrant is not a foreign issuer.
Item 5. Audit Committee of Listed Registrants.
Not applicable.
Item 6. Investments.
(a) Schedule of Investments is included within the financial statements filed under Item 7 of this Form.
(b) Not applicable.
Item 7. Financial Statements and Financial Highlights for Open-End Investment Companies.
(a)
Page | |||
Par | Value | |||||
CORPORATE BONDS - 47.1% | ||||||
Auto Manufacturers - 4.2% | ||||||
Mercedes-Benz Finance North America LLC, 3.45%, 01/06/2027(a) | $450,000 | $439,379 | ||||
Toyota Motor Credit Corp., 5.05%, 05/16/2029 | 3,100,000 | 3,141,274 | ||||
3,580,653 | ||||||
Banks - 9.2% | ||||||
Bank of America Corp., 3.42% to 12/20/2027 then 3 mo. Term SOFR + 1.30%, 12/20/2028 | 2,901,000 | 2,781,669 | ||||
JPMorgan Chase & Co., 5.57% to 04/22/2027 then SOFR + 0.93%, 04/22/2028 | 2,069,000 | 2,105,957 | ||||
Wells Fargo & Co., 3.00%, 04/22/2026 | 3,125,000 | 3,050,368 | ||||
7,937,994 | ||||||
Beverages - 0.8% | ||||||
Diageo Capital PLC, 2.00%, 04/29/2030 | 750,000 | 652,287 | ||||
Capital Markets - 3.7% | ||||||
Goldman Sachs Group, Inc., 3.50%, 11/16/2026 | 3,223,000 | 3,146,561 | ||||
Consumer Staples Distribution & Retail - 2.6% | ||||||
Target Corp., 3.38%, 04/15/2029 | 2,361,000 | 2,257,119 | ||||
Diversified Telecommunication Services - 5.6% | ||||||
AT&T, Inc., 2.75%, 06/01/2031 | 2,670,000 | 2,345,468 | ||||
Verizon Communications, Inc., 3.15%, 03/22/2030 | 2,661,000 | 2,443,939 | ||||
4,789,407 | ||||||
Electric - 3.3% | ||||||
Florida Power & Light Co., 5.05%, 04/01/2028 | 2,782,000 | 2,820,562 | ||||
Health Care Providers & Services - 3.2% | ||||||
UnitedHealth Group, Inc., 4.90%, 04/15/2031 | 2,736,000 | 2,751,212 | ||||
Machinery - Diversified - 0.9% | ||||||
John Deere Capital Corp., 4.75%, 01/20/2028 | 800,000 | 806,745 | ||||
Media - 3.8% | ||||||
Comcast Corp., 4.15%, 10/15/2028 | 3,340,000 | 3,280,409 | ||||
Mining - 2.4% | ||||||
BHP Billiton Finance USA Ltd., 5.25%, 09/08/2033 | 2,065,000 | 2,099,214 | ||||
Oil & Gas - 2.6% | ||||||
BP Capital Markets America, Inc., 2.72%, 01/12/2032 | 2,606,000 | 2,257,496 | ||||
Par | Value | |||||
Oil, Gas & Consumable Fuels - 2.2% | ||||||
Kinder Morgan, Inc., 5.00%, 02/01/2029 | $1,921,000 | $1,922,871 | ||||
Pharmaceuticals - 2.6% | ||||||
Bristol-Myers Squibb Co., 5.20%, 02/22/2034 | 2,157,000 | 2,195,616 | ||||
TOTAL CORPORATE BONDS (Cost $41,296,259) | 40,498,146 | |||||
U.S. TREASURY SECURITIES - 44.2% | ||||||
United States Treasury Note/Bond | ||||||
2.13%, 05/15/2025 | 4,080,000 | 4,029,717 | ||||
2.13%, 05/31/2026 | 4,924,000 | 4,769,355 | ||||
3.75%, 08/31/2026 | 3,945,000 | 3,914,950 | ||||
4.13%, 09/30/2027 | 4,334,000 | 4,334,677 | ||||
4.13%, 07/31/2028 | 1,750,000 | 1,747,676 | ||||
3.63%, 08/31/2029 | 1,566,000 | 1,530,398 | ||||
3.88%, 09/30/2029 | 3,672,000 | 3,623,662 | ||||
4.63%, 09/30/2030 | 3,716,000 | 3,797,723 | ||||
4.25%, 02/28/2031 | 2,716,000 | 2,720,986 | ||||
3.63%, 09/30/2031 | 750,000 | 723,164 | ||||
4.13%, 11/15/2032 | 3,545,000 | 3,518,136 | ||||
4.50%, 11/15/2033 | 3,279,000 | 3,333,565 | ||||
TOTAL U.S. TREASURY SECURITIES (Cost $38,797,719) | 38,044,009 | |||||
ASSET-BACKED SECURITIES - 5.2% | ||||||
Ford Credit Auto Owner Trust, Series 2023-A, Class A3, 4.65%, 02/15/2028 | 2,000,000 | 2,001,004 | ||||
GM Financial Leasing Trust, Series 2024-2, Class A2A, 5.43%, 09/21/2026 | 2,489,450 | 2,500,130 | ||||
TOTAL ASSET-BACKED SECURITIES (Cost $4,511,022) | 4,501,134 | |||||
Shares | ||||||
SHORT-TERM INVESTMENTS - 2.6% | ||||||
Money Market Funds - 2.6% | ||||||
First American Treasury Obligations Fund - Class X, 4.79%(b) | 2,193,534 | 2,193,534 | ||||
TOTAL SHORT-TERM INVESTMENTS (Cost $2,193,534) | 2,193,534 | |||||
TOTAL INVESTMENTS - 99.1% (Cost $86,798,534) | $85,236,823 | |||||
Other Assets in Excess of Liabilities - 0.9% | 747,325 | |||||
TOTAL NET ASSETS - 100.0% | $85,984,148 | |||||
1 |
(a) | Security is exempt from registration pursuant to Rule 144A under the Securities Act of 1933, as amended. These securities may only be resold in transactions exempt from registration to qualified institutional investors. As of October 31, 2024, the value of these securities total $439,379 or 0.5% of the Fund’s net assets. |
(b) | The rate shown represents the 7-day annualized effective yield as of October 31, 2024. |
2 |
Shares | Value | |||||
COMMON STOCKS - 96.8% | ||||||
Aerospace & Defense - 2.7% | ||||||
Howmet Aerospace, Inc. | 66,970 | $6,678,249 | ||||
Biotechnology - 1.8% | ||||||
Vertex Pharmaceuticals, Inc.(a) | 9,494 | 4,518,954 | ||||
Broadline Retail - 2.7% | ||||||
Amazon.com, Inc.(a) | 35,297 | 6,579,361 | ||||
Capital Markets - 4.4% | ||||||
Goldman Sachs Group, Inc. | 11,645 | 6,029,664 | ||||
Moody’s Corp. | 10,514 | 4,773,777 | ||||
10,803,441 | ||||||
Chemicals - 4.5% | ||||||
Ecolab, Inc. | 23,632 | 5,807,091 | ||||
Sherwin-Williams Co. | 15,020 | 5,388,726 | ||||
11,195,817 | ||||||
Commercial Services & Supplies - 2.3% | ||||||
Cintas Corp. | 28,168 | 5,797,256 | ||||
Communications Equipment - 3.1% | ||||||
Arista Networks, Inc.(a) | 19,832 | 7,663,878 | ||||
Construction Materials - 2.0% | ||||||
Martin Marietta Materials, Inc. | 8,512 | 5,041,998 | ||||
Consumer Staples Distribution & Retail - 3.3% | ||||||
Costco Wholesale Corp. | 9,312 | 8,140,364 | ||||
Electrical Equipment - 3.1% | ||||||
Eaton Corp. PLC | 23,030 | 7,636,287 | ||||
Entertainment - 2.1% | ||||||
Netflix, Inc.(a) | 6,969 | 5,268,773 | ||||
Financial Services - 2.6% | ||||||
Visa, Inc. - Class A | 21,779 | 6,312,643 | ||||
Health Care Equipment & Supplies - 5.2% | ||||||
Boston Scientific Corp.(a) | 73,598 | 6,183,704 | ||||
Intuitive Surgical, Inc.(a) | 13,518 | 6,810,909 | ||||
12,994,613 | ||||||
Hotels, Restaurants & Leisure - 2.1% | ||||||
Chipotle Mexican Grill, Inc.(a) | 94,987 | 5,297,425 | ||||
Insurance - 2.6% | ||||||
Arthur J Gallagher & Co. | 22,871 | 6,431,325 | ||||
Interactive Media & Services - 6.0% | ||||||
Alphabet, Inc. - Class A | 39,052 | 6,682,188 | ||||
Meta Platforms, Inc. - Class A | 14,283 | 8,106,745 | ||||
14,788,933 | ||||||
Shares | Value | |||||
Life Sciences Tools & Services -1.7% | ||||||
Thermo Fisher Scientific, Inc. | 7,865 | $4,296,807 | ||||
Machinery - 2.1% | ||||||
Parker-Hannifin Corp. | 8,385 | 5,316,677 | ||||
Media - 2.0% | ||||||
Trade Desk, Inc. - Class A(a) | 42,056 | 5,055,552 | ||||
Oil Gas & Consumable Fuels - 0.0%(b) | ||||||
Exxon Mobil Corp. | 480 | 56,055 | ||||
Pharmaceuticals - 5.0% | ||||||
Eli Lilly & Co. | 9,412 | 7,809,513 | ||||
Zoetis, Inc. | 26,285 | 4,699,232 | ||||
12,508,745 | ||||||
Semiconductors & Semiconductor Equipment - 9.3% | ||||||
NVIDIA Corp. | 97,118 | 12,893,386 | ||||
NXP Semiconductors NV | 24,032 | 5,635,504 | ||||
Onto Innovation, Inc.(a) | 22,580 | 4,478,291 | ||||
23,007,181 | ||||||
Software - 14.8% | ||||||
Intuit, Inc. | 9,763 | 5,958,359 | ||||
Microsoft Corp. | 18,775 | 7,629,221 | ||||
Palo Alto Networks, Inc.(a) | 13,588 | 4,896,164 | ||||
Salesforce, Inc. | 15,170 | 4,420,083 | ||||
ServiceNow, Inc.(a) | 8,261 | 7,707,430 | ||||
Synopsys, Inc.(a) | 12,016 | 6,171,538 | ||||
36,782,795 | ||||||
Specialty Retail - 7.7% | ||||||
O’Reilly Automotive, Inc.(a) | 6,018 | 6,939,596 | ||||
The Home Depot, Inc. | 15,020 | 5,914,125 | ||||
TJX Cos., Inc. | 55,826 | 6,310,013 | ||||
19,163,734 | ||||||
Technology Hardware, Storage & Peripherals - 3.7% | ||||||
Apple, Inc. | 40,554 | 9,161,554 | ||||
TOTAL COMMON STOCKS (Cost $209,653,776) | 240,498,417 | |||||
SHORT-TERM INVESTMENTS - 1.1% | ||||||
Money Market Funds - 1.1% | ||||||
First American Treasury Obligations Fund - Class X, 4.79%(c) | 2,805,651 | 2,805,651 | ||||
TOTAL SHORT-TERM INVESTMENTS (Cost $2,805,651) | 2,805,651 | |||||
TOTAL INVESTMENTS - 97.9% (Cost $212,459,427) | $243,304,068 | |||||
Other Assets in Excess of Liabilities - 2.1% | 5,141,619 | |||||
TOTAL NET ASSETS - 100.0% | $248,445,687 | |||||
3 |
(a) | Non-income producing security. |
(b) | Represents less than 0.05% of net assets. |
(c) | The rate shown represents the 7-day annualized effective yield as of October 31, 2024. |
4 |
Shares | Value | |||||
COMMON STOCKS - 95.6% | ||||||
Aerospace & Defense - 3.4% | ||||||
Curtiss-Wright Corp. | 19,473 | $6,717,406 | ||||
Banks - 2.0% | ||||||
Western Alliance Bancorp | 46,831 | 3,896,808 | ||||
Biotechnology - 2.4% | ||||||
Halozyme Therapeutics, Inc.(a) | 93,839 | 4,745,438 | ||||
Broadline Retail - 2.0% | ||||||
Ollie’s Bargain Outlet Holdings, Inc.(a) | 42,070 | 3,863,288 | ||||
Building Products - 2.4% | ||||||
AZEK Co., Inc.(a) | 106,990 | 4,707,560 | ||||
Capital Markets - 2.4% | ||||||
Morningstar, Inc. | 14,149 | 4,641,580 | ||||
Communications Equipment - 1.3% | ||||||
Calix, Inc.(a) | 73,382 | 2,596,255 | ||||
Construction & Engineering - 9.6% | ||||||
Comfort Systems USA, Inc. | 20,720 | 8,102,349 | ||||
Sterling Infrastructure, Inc.(a) | 32,314 | 4,990,897 | ||||
Valmont Industries, Inc. | 18,784 | 5,854,597 | ||||
18,947,843 | ||||||
Construction Materials - 2.7% | ||||||
Summit Materials, Inc. - Class A(a) | 111,708 | 5,296,076 | ||||
Consumer Staples Distribution & Retail - 2.8% | ||||||
BJ’s Wholesale Club Holdings, Inc.(a) | 63,942 | 5,417,806 | ||||
Containers & Packaging - 1.9% | ||||||
Avery Dennison Corp. | 18,110 | 3,749,313 | ||||
Distributors - 2.0% | ||||||
Pool Corp. | 10,696 | 3,868,101 | ||||
Electrical Equipment - 2.3% | ||||||
nVent Electric PLC | 59,967 | 4,471,739 | ||||
Electronic Equipment, Instruments & Components - 4.1% | ||||||
Badger Meter, Inc. | 19,628 | 3,926,581 | ||||
CDW Corp./DE | 22,154 | 4,170,048 | ||||
8,096,629 | ||||||
Energy Equipment & Services - 2.4% | ||||||
Cactus, Inc. - Class A | 79,444 | 4,710,235 | ||||
Food Products - 1.6% | ||||||
Simply Good Foods Co.(a) | 92,263 | 3,105,573 | ||||
Ground Transportation - 1.5% | ||||||
Werner Enterprises, Inc. | 82,814 | 3,055,009 | ||||
Shares | Value | |||||
Health Care Equipment & Supplies - 10.1% | ||||||
Cooper Cos., Inc.(a) | 44,400 | $4,647,792 | ||||
Insulet Corp.(a) | 19,458 | 4,505,111 | ||||
Penumbra, Inc.(a) | 10,292 | 2,355,530 | ||||
STERIS PLC | 17,436 | 3,868,176 | ||||
UFP Technologies, Inc.(a) | 16,795 | 4,484,265 | ||||
19,860,874 | ||||||
Health Care Providers & Services - 1.3% | ||||||
Option Care Health, Inc.(a) | 111,084 | 2,559,375 | ||||
Hotels, Restaurants & Leisure - 1.7% | ||||||
Choice Hotels International, Inc. | 24,200 | 3,376,142 | ||||
Insurance - 1.7% | ||||||
Kinsale Capital Group, Inc. | 7,630 | 3,266,479 | ||||
Life Sciences Tools & Services - 4.0% | ||||||
Medpace Holdings, Inc.(a) | 15,871 | 4,986,986 | ||||
Repligen Corp.(a) | 20,831 | 2,796,978 | ||||
7,783,964 | ||||||
Machinery - 1.8% | ||||||
Lincoln Electric Holdings, Inc. | 18,522 | 3,566,596 | ||||
Oil, Gas & Consumable Fuels - 1.8% | ||||||
Range Resources Corp. | 118,495 | 3,558,405 | ||||
Personal Care Products - 2.1% | ||||||
e.l.f Beauty, Inc.(a) | 38,549 | 4,057,282 | ||||
Pharmaceuticals - 2.4% | ||||||
Prestige Consumer Healthcare, Inc.(a) | 64,616 | 4,765,430 | ||||
Professional Services - 2.4% | ||||||
KBR, Inc. | 71,356 | 4,781,566 | ||||
Semiconductors & Semiconductor Equipment - 2.4% | ||||||
Entegris, Inc. | 45,070 | 4,719,280 | ||||
Software - 11.7% | ||||||
CommVault Systems, Inc.(a) | 26,297 | 4,107,328 | ||||
CyberArk Software Ltd.(a) | 25,524 | 7,057,897 | ||||
PTC, Inc.(a) | 31,590 | 5,854,575 | ||||
SPS Commerce, Inc.(a) | 35,634 | 5,879,610 | ||||
22,899,410 | ||||||
Specialty Retail - 5.4% | ||||||
Tractor Supply Co. | 21,480 | 5,703,155 | ||||
Williams-Sonoma, Inc. | 37,109 | 4,977,430 | ||||
10,680,585 | ||||||
TOTAL COMMON STOCKS (Cost $175,794,478) | 187,762,047 | |||||
5 |
Shares | Value | |||||
REAL ESTATE INVESTMENT TRUSTS - 1.6% | ||||||
Terreno Realty Corp. | 53,832 | $3,227,228 | ||||
TOTAL REAL ESTATE INVESTMENT TRUSTS (Cost $3,255,342) | 3,227,228 | |||||
SHORT-TERM INVESTMENTS - 2.8% | ||||||
Money Market Funds - 2.8% | ||||||
First American Treasury Obligations Fund - Class X, 4.79%(b) | 5,462,196 | 5,462,196 | ||||
TOTAL SHORT-TERM INVESTMENTS (Cost $5,462,196) | 5,462,196 | |||||
TOTAL INVESTMENTS - 100.0% (Cost $184,512,016) | $196,451,471 | |||||
Liabilities in Excess of Other Assets - (0.0)%(c) | (5,844) | |||||
TOTAL NET ASSETS - 100.0% | $196,445,627 | |||||
(a) | Non-income producing security. |
(b) | The rate shown represents the 7-day annualized effective yield as of October 31, 2024. |
(c) | Represents less than 0.05% of net assets. |
6 |
Congress Intermediate Bond ETF | Congress Large Cap Growth ETF | Congress SMid Growth ETF | |||||||
ASSETS: | |||||||||
Investments, at value | $85,236,823 | $243,304,068 | $196,451,471 | ||||||
Interest receivable | 686,768 | 10,643 | 20,756 | ||||||
Cash | 84,800 | — | — | ||||||
Receivable for investments sold | — | 5,233,182 | — | ||||||
Receivable for fund shares sold | — | 992,412 | 1,158,972 | ||||||
Dividends receivable | — | 11,310 | 35,981 | ||||||
Receivable for transaction fee | — | 59 | — | ||||||
Prepaid expenses and other assets | — | 104 | 104 | ||||||
Total assets | 86,008,391 | 249,551,778 | 197,667,284 | ||||||
LIABILITIES: | |||||||||
Payable to adviser | 24,075 | 133,785 | 111,466 | ||||||
Payable for transaction fee | 168 | — | — | ||||||
Payable for investments purchased | — | 972,306 | 1,110,191 | ||||||
Total liabilities | 24,243 | 1,106,091 | 1,221,657 | ||||||
NET ASSETS | $85,984,148 | $248,445,687 | $196,445,627 | ||||||
NET ASSETS CONSISTS OF: | |||||||||
Paid-in capital | $87,549,804 | $220,991,766 | $185,440,655 | ||||||
Total distributable earnings/(accumulated losses) | (1,565,656) | 27,453,921 | 11,004,972 | ||||||
Total net assets | $85,984,148 | $248,445,687 | $196,445,627 | ||||||
Net assets | $85,984,148 | $248,445,687 | $196,445,627 | ||||||
Shares issued and outstanding | 3,500,000 | 7,510,000 | 6,780,000 | ||||||
Net asset value per share | $24.57 | $33.08 | $28.97 | ||||||
Cost: | |||||||||
Investments, at cost | $86,798,534 | $212,459,427 | $184,512,016 | ||||||
7 |
Congress Intermediate Bond ETF(a) | Congress Large Cap Growth ETF | Congress SMid Growth ETF | |||||||
INVESTMENT INCOME: | |||||||||
Dividend income | $— | $1,022,914 | $555,012 | ||||||
Less: Dividend withholding taxes | — | (8,918) | — | ||||||
Interest income | 338,887 | 85,361 | 128,190 | ||||||
Other income | — | 654 | 644 | ||||||
Total investment income | 338,887 | 1,100,011 | 683,846 | ||||||
EXPENSES: | |||||||||
Investment advisory fee | 28,277 | 932,371 | 788,744 | ||||||
Total expenses | 28,277 | 932,371 | 788,744 | ||||||
Net investment income/(loss) | 310,610 | 167,640 | (104,898) | ||||||
REALIZED AND UNREALIZED GAIN/(LOSS) | |||||||||
Net realized gain/(loss) from: | |||||||||
Investments | (25,464) | (3,480,481) | (818,331) | ||||||
Redemptions in-kind | — | 1,231,235 | 324,652 | ||||||
Net realized loss | (25,464) | (2,249,246) | (493,679) | ||||||
Net change in unrealized appreciation/(depreciation) on: | |||||||||
Investments | (1,561,711) | 30,890,150 | 12,196,029 | ||||||
Net change in unrealized appreciation/(depreciation) | (1,561,711) | 30,890,150 | 12,196,029 | ||||||
Net realized and unrealized gain/(loss) | (1,587,175) | 28,640,904 | 11,702,350 | ||||||
NET INCREASE/(DECREASE) IN NET ASSETS RESULTING FROM OPERATIONS | $(1,276,565) | $28,808,544 | $11,597,452 | ||||||
(a) | Inception date of the Fund was September 9, 2024. |
8 |
Congress Intermediate Bond | Congress Large Cap Growth ETF | ||||||||
Period Ended October 31, 2024(a) | Year Ended October 31, 2024 | Period Ended October 31, 2023(b) | |||||||
OPERATIONS: | |||||||||
Net investment income | $310,610 | $167,640 | $798 | ||||||
Net realized loss | (25,464) | (2,249,246) | (5,838) | ||||||
Net change in unrealized appreciation/(depreciation) | (1,561,711) | 30,890,150 | (45,509) | ||||||
Net increase/(decrease) in net assets from operations | (1,276,565) | 28,808,544 | (50,549) | ||||||
DISTRIBUTIONS TO SHAREHOLDERS: | |||||||||
Distributions to shareholders | (289,091) | (72,862) | — | ||||||
Total distributions to shareholders | (289,091) | (72,862) | — | ||||||
CAPITAL TRANSACTIONS: | |||||||||
Subscriptions | 87,545,786 | 211,147,173 | 13,152,129 | ||||||
Redemptions | — | (4,539,517) | — | ||||||
ETF transaction fees (See Note #6) | 4,018 | 769 | — | ||||||
Net increase in net assets from capital transactions | 87,549,804 | 206,608,425 | 13,152,129 | ||||||
Net increase in net assets | 85,984,148 | 235,344,107 | 13,101,580 | ||||||
NET ASSETS: | |||||||||
Beginning of the period | — | 13,101,580 | — | ||||||
End of the period | $85,984,148 | $248,445,687 | $13,101,580 | ||||||
SHARES TRANSACTIONS | |||||||||
Subscriptions | 3,500,000 | 7,110,000 | 540,000 | ||||||
Redemptions | — | (140,000) | — | ||||||
Total increase in shares outstanding | 3,500,000 | 6,970,000 | 540,000 | ||||||
(a) | Inception date of the Fund was September 9, 2024. |
(b) | Inception date of the Fund was August 21, 2023. |
9 |
Congress SMid Growth ETF | ||||||
Year Ended October 31, 2024 | Period Ended October 31, 2023(a) | |||||
OPERATIONS: | ||||||
Net investment income/(loss) | $(104,898) | $230 | ||||
Net realized loss | (493,679) | (2,806) | ||||
Net change in unrealized appreciation/(depreciation) | (12,196,029) | (256,574) | ||||
Net increase/(decrease) in net assets from operations | 11,597,452 | (259,150) | ||||
DISTRIBUTIONS TO SHAREHOLDERS: | ||||||
Distributions to shareholders | (8,678) | — | ||||
Total distributions to shareholders | (8,678) | — | ||||
CAPITAL TRANSACTIONS: | ||||||
Subscriptions | 174,707,781 | 11,598,562 | ||||
Redemptions | (1,190,340) | — | ||||
Net increase in net assets from capital transactions | 173,517,441 | 11,598,562 | ||||
Net increase in net assets | 185,106,215 | 11,339,412 | ||||
NET ASSETS: | ||||||
Beginning of the period | 11,339,412 | — | ||||
End of the period | $196,445,627 | $11,339,412 | ||||
SHARES TRANSACTIONS | ||||||
Subscriptions | 6,320,000 | 500,000 | ||||
Redemptions | (40,000) | — | ||||
Total increase in shares outstanding | 6,280,000 | 500,000 | ||||
(a) | Inception date of the Fund was August 21, 2023. |
10 |
Period Ended October 31, 2024(a) | |||
PER SHARE DATA: | |||
Net asset value, beginning of period | $25.00 | ||
INVESTMENT OPERATIONS: | |||
Net investment income(b) | 0.14 | ||
Net realized and unrealized loss on investments(c) | (0.49) | ||
Total from investment operations | (0.35) | ||
LESS DISTRIBUTIONS FROM | |||
Net investment income | (0.08) | ||
Total distributions | (0.08) | ||
ETF transaction fees per share | 0.00(d) | ||
Net asset value, end of period | $24.57 | ||
Total return at NAV(e)(h) | −1.40% | ||
Total return at MKT(e)(h) | −1.28% | ||
SUPPLEMENTAL DATA AND RATIOS: | |||
Net assets, end of period (in thousands) | $85,984 | ||
Ratio of expenses to average net assets(f) | 0.35% | ||
Ratio of net investment income to average net assets(f) | 3.84% | ||
Portfolio turnover rate(e)(g) | 7% | ||
(a) | Inception date of the Fund was September 9, 2024. |
(b) | Net investment income per share has been calculated based on average shares outstanding during the period. |
(c) | Realized and unrealized gains and losses per share in the caption are balancing amounts necessary to reconcile the change in net asset value per share for the years, and may not reconcile with the aggregate gains and losses in the Statement of Operations due to share transactions for the year. |
(d) | Amount represents less than $0.005 per share. |
(e) | Not annualized for periods less than one year. |
(f) | Annualized for periods less than one year. |
(g) | Portfolio turnover rate excludes in-kind transactions. |
(h) | Net asset value total investment return is calculated assuming an initial investment made at the net asset value at the beginning of the period, reinvestment of all dividends and distributions, if any, at net asset value during the period, and redemption at the net asset value on the last day of the period. Market value total return is calculated assuming an initial investment made at the market value at the beginning of the period, reinvestment of all dividends and distributions at the net asset value during the period, and sale at the market value on the last day of the period. The market price per share as of October 31, 2024 was $24.60. |
11 |
Year Ended October 31, 2024 | Period Ended October 31, 2023(a) | |||||
PER SHARE DATA: | ||||||
Net asset value, beginning of period | $24.26 | $25.00 | ||||
INVESTMENT OPERATIONS: | ||||||
Net investment income(b) | 0.04 | 0.01 | ||||
Net realized and unrealized gain (loss) on investments(c) | 8.82 | (0.75) | ||||
Total from investment operations | 8.86 | (0.74) | ||||
LESS DISTRIBUTIONS FROM: | ||||||
Net investment income | (0.04) | — | ||||
Total distributions | (0.04) | — | ||||
ETF transaction fees per share | 0.00(d) | — | ||||
Net asset value, end of period | $33.08 | $24.26 | ||||
Total return at NAV(f)(h) | 36.55% | −2.95% | ||||
Total return at MKT(f)(h) | 36.44% | — | ||||
SUPPLEMENTAL DATA AND RATIOS: | ||||||
Net assets, end of period (in thousands) | $248,446 | $13,102 | ||||
Ratio of expenses to average net assets(e) | 0.65% | 0.65% | ||||
Ratio of net investment income to average net assets(e) | 0.12% | 0.20% | ||||
Portfolio turnover rate(g) | 33% | 7% | ||||
(a) | Inception date of the Fund was August 21, 2023. |
(b) | Net investment income per share has been calculated based on average shares outstanding during the year. |
(c) | Realized and unrealized gains and losses per share in the caption are balancing amounts necessary to reconcile the change in net asset value per share for the years, and may not reconcile with the aggregate gains and losses in the Statement of Operations due to share transactions for the year. |
(d) | Amount represents less than $0.005 per share. |
(e) | Annualized for periods less than one year. |
(f) | Not annualized for periods less than one year. |
(g) | Portfolio turnover rate excludes in-kind transactions. |
(h) | Net asset value total investment return is calculated assuming an initial investment made at the net asset value at the beginning of the period, reinvestment of all dividends and distributions, if any, at net asset value during the period, and redemption at the net asset value on the last day of the period. Market value total return is calculated assuming an initial investment made at the market value at the beginning of the period, reinvestment of all dividends and distributions at the net asset value during the period, and sale at the market value on the last day of the period. The market price per share as of October 31, 2024 was $33.06. |
12 |
Year Ended October 31, 2024 | Period Ended October 31, 2023(a) | |||||
PER SHARE DATA: | ||||||
Net asset value, beginning of period | $22.68 | $25.00 | ||||
INVESTMENT OPERATIONS: | ||||||
Net investment loss(b) | (0.03) | — | ||||
Net realized and unrealized gain (loss) on investments(c) | 6.33 | (2.32) | ||||
Total from investment operations | 6.30 | (2.32) | ||||
Net investment income | (0.01) | — | ||||
Total distributions | (0.01) | — | ||||
Net asset value, end of period | $28.97 | $22.68 | ||||
Total return at NAV(f)(g) | 27.78% | −9.28% | ||||
Total return at MKT(f)(g) | 27.89% | — | ||||
SUPPLEMENTAL DATA AND RATIOS: | ||||||
Net assets, end of period (in thousands) | $196,446 | $11,339 | ||||
Ratio of expenses to average net assets(d) | 0.68% | 0.68% | ||||
Ratio of net investment income (loss) to average net assets(d) | (0.09)% | 0.06% | ||||
Portfolio turnover rate(e) | 23% | 1% | ||||
(a) | Inception date of the Fund was August 21, 2023. |
(b) | Net investment income per share has been calculated based on average shares outstanding during the year. |
(c) | Realized and unrealized gains and losses per share in the caption are balancing amounts necessary to reconcile the change in net asset value per share for the years, and may not reconcile with the aggregate gains and losses in the Statement of Operations due to share transactions for the year. |
(d) | Annualized for periods less than one year. |
(e) | Portfolio turnover rate excludes in-kind transactions. |
(f) | Not annualized for periods less than one year. |
(g) | Net asset value total investment return is calculated assuming an initial investment made at the net asset value at the beginning of the period, reinvestment of all dividends and distributions, if any, at net asset value during the period, and redemption at the net asset value on the last day of the period. Market value total return is calculated assuming an initial investment made at the market value at the beginning of the period, reinvestment of all dividends and distributions at the net asset value during the period, and sale at the market value on the last day of the period. The market price per share as of October 31, 2024 was $29.01. |
13 |
| A. | Security Valuation. All equity securities, which may include Real Estate Investment Trusts (“REITs”), Business Development Companies (“BDCs”), and Master Limited Partnerships (“MLPs”), that are traded on U.S. or foreign national securities exchanges are valued at the last reported sale price on the exchange on which the security is principally traded or the exchange’s official closing price, if applicable. If, on a particular day, an exchange-traded security does not trade, then the mean between the most recent quoted bid and asked prices will be used. All equity securities, which may include REITs, BDCs, and MLPs, that are not traded on a listed exchange are valued at the last sale price in the over the counter market. If a non-exchange traded security does not trade on a particular day, then the mean between the last quoted closing bid price and asked price will be used. |
| Level 1 – | Unadjusted quoted prices in active markets for identical assets or liabilities that the Funds have the ability to access. |
| Level 2 – | Observable inputs other than quoted prices included in Level 1 that are observable for the asset or liability, either directly or indirectly. These inputs may include quoted prices for the identical instrument on an inactive market, prices for similar instruments, interest rates, prepayment speeds, credit risk, yield curves, default rates and similar data. |
| Level 3 – | Unobservable inputs for the asset or liability, to the extent relevant observable inputs are not available; representing the Funds’ own assumptions about the assumptions a market participant would use in valuing the asset or liability, and would be based on the best information available. |
14 |
Level 1 | Level 2 | Level 3 | Total | |||||||||
Corporate Bonds | $— | $40,498,146 | $ — | $ 40,498,146 | ||||||||
U.S. Treasury Securities | — | 38,044,009 | — | 38,044,009 | ||||||||
Asset-Backed Securities | — | 4,501,134 | — | 4,501,134 | ||||||||
Money Market Funds | 2,193,534 | — | — | 2,193,534 | ||||||||
Total Investments in Securities | $2,193,534 | $83,043,289 | $— | $85,236,823 | ||||||||
Level 1 | Level 2 | Level 3 | Total | |||||||||
Common Stocks | $240,498,417 | $ — | $ — | $240,498,417 | ||||||||
Short-Term Investments | 2,805,651 | — | — | 2,805,651 | ||||||||
Total Investments in Securities | $243,304,068 | $— | $— | $243,304,068 | ||||||||
Level 1 | Level 2 | Level 3 | Total | |||||||||
Common Stocks | $187,762,047 | $ — | $ — | $187,762,047 | ||||||||
Real Estate Investment Trusts | 3,227,228 | — | — | 3,227,228 | ||||||||
Money Market Funds | 5,462,196 | — | — | 5,462,196 | ||||||||
Total Investments in Securities | $196,451,471 | $— | $— | $196,451,471 | ||||||||
| B. | Foreign Currency. Investment securities and other assets and liabilities denominated in foreign currencies are translated into U.S. dollar amounts at the date of valuation. Purchases and sales of investment securities and income and expense items denominated in foreign currencies are translated into U.S. dollar amounts on the respective dates of such transactions. |
| C. | Federal Income Taxes. Each Fund has elected to be taxed as a “regulated investment company” and intends to distribute substantially all taxable income to its shareholders and otherwise comply with the provisions of the Internal Revenue Code applicable to regulated investment companies. Therefore, no provisions for federal income taxes or excise taxes have been made. |
15 |
Capital Loss Carryover | Post-October Losses | |||||||||||
Short-Term | Long-Term | Capital | Ordinary Late Year Losses | |||||||||
Intermediate Bond ETF | $24,806 | $ — | $ — | $ — | ||||||||
Large Cap Growth ETF | 3,440,995 | — | — | — | ||||||||
SMid Growth ETF | 795,954 | — | — | 113,346 | ||||||||
| D. | Security Transactions and Investment Income. Investment securities transactions are accounted for on the trade date. Gains and losses realized on sales of securities are determined on a specific identification basis. Discounts/premiums on debt securities purchased are accreted/amortized over the life of the respective securities using the effective interest method. Dividend income is recorded on the ex- dividend date. Dividends received from MLPs & REITs generally are comprised of ordinary income, capital gains, and may include return of capital. Interest income is recorded on an accrual basis. Other non-cash dividends are recognized as investment income at the fair value of the property received. Withholding taxes on foreign dividends have been provided for in accordance with the Trust’s understanding of the applicable country’s tax rules and rates. |
| E. | Distributions to Shareholders. Distributions to shareholders from net investment income and net realized gains on securities for the Funds are normally declared and paid on an annual basis. Distributions are recorded on the ex-dividend date. |
| F. | Use of Estimates. The preparation of financial statements in conformity with U.S. GAAP requires management to make estimates and assumptions that affect the reported amounts of assets and liabilities at the date of the financial statements and the reported amount of revenue and expenses during the reporting period. Actual results could differ from those estimates. |
| G. | Share Valuation. The net asset value (“NAV”) per share of the Funds are calculated by dividing the sum of the value of the securities held by the Funds, plus cash or other assets, minus all liabilities (including estimated accrued expenses) by the total number of shares outstanding for the Funds, rounded to the nearest cent. The Funds’ shares will not be priced on the days on which the New York Stock Exchange is closed for trading. |
| H. | Guarantees and Indemnifications. In the normal course of business, the Funds enter into contracts with service providers that contain general indemnification clauses. The Funds’ maximum exposure under these arrangements is unknown as this would involve future claims that may be made against the Funds that have not yet occurred. However, based on experience, the Funds expect the risk of loss to be remote. |
| I. | Illiquid Securities: Pursuant to Rule 22e-4 under the 1940 Act, the Funds have adopted a Board approved liquidity risk management program (the “program”) that requires, among other things, that the Funds limit |
16 |
| J. | Reclassification of Capital Accounts. U.S. GAAP requires that certain components of net assets relating to permanent differences be reclassified between financial and tax reporting. These reclassifications have no effect on net assets or net asset value per share. For the year and period ended October 31, 2024, the following adjustments were made1: |
Distributable (Accumulated) Earnings (Losses) | Paid-In Capital | |||||
Intermediate Bond ETF | $— | $ — | ||||
Large Cap Growth ETF | (1,231,212) | 1,231,212 | ||||
SMid Growth ETF | (324,652) | 324,652 | ||||
| K. | Subsequent Events. In preparing these financial statements, the Funds have evaluated events and transactions for potential recognition or disclosure through the date the financial statements were issued. The Funds have determined that there were no subsequent events that would need to be disclosed in the Funds financial statements. |
Current | |||
Intermediate Bond ETF | 0.35% | ||
Large Cap Growth ETF | 0.65% | ||
SMid Growth ETF | 0.68% | ||
17 |
Fund | Purchases | Sales/Maturities | Purchases In-Kind | Sales In-Kind | ||||||||
Intermediate Bond ETF | $8,367,367 | $5,211,205 | $42,665,718 | — | ||||||||
Large Cap Growth ETF | 46,167,497 | 50,242,902 | 207,458,063 | 4,444,221 | ||||||||
SMid Growth ETF | 26,966,337 | 26,201,278 | 168,785,426 | 1,153,408 | ||||||||
2024 | |||
Distributions paid from: | |||
Ordinary income | $289,091 | ||
Long-term capital gain1 | — | ||
$289,091 | |||
2024 | |||
Distributions paid from: | |||
Ordinary income | $72,862 | ||
Long-term capital gain1 | — | ||
$72,862 | |||
2024 | |||
Distributions paid from: | |||
Ordinary income | $ 8,678 | ||
Long-term capital gain1 | — | ||
$8,678 | |||
18 |
Intermediate Bond ETF | Large Cap Growth ETF | SMid Growth ETF | |||||||
Cost of investments | $86,799,262 | $212,504,728 | $184,537,199 | ||||||
Gross tax unrealized appreciation | — | 33,454,526 | 20,995,304 | ||||||
Gross tax unrealized depreciation | (1,562,439) | (2,655,186) | (9,081,032) | ||||||
Net unrealized appreciation (depreciation) | (1,562,439) | 30,799,340 | 11,914,272 | ||||||
Undistributed ordinary income | 21,589 | 95,576 | — | ||||||
Undistributed long-term capital gain | — | — | — | ||||||
Total distributable earnings | 21,589 | 95,576 | — | ||||||
Other accumulated gains (losses) | (24,806) | (3,440,995) | (909,300) | ||||||
Total distributable (accumulated) earnings (losses) | $(1,565,656) | $27,453,921 | $11,004,972 | ||||||
19 |
Individual Funds constituting Professionally Managed Portfolios | Statement of operations | Statements of changes in net assets | Financial Highlights | ||||||
Congress Intermediate Bond ETF | For the period September 9, 2024 (commencement of operations) through October 31, 2024 | For the period September 9, 2024 (commencement of operations) through October 31, 2024 | For the period September 9, 2024 (commencement of operations) through October 31, 2024 | ||||||
Congress Large Cap Growth ETF, Congress SMID Growth ETF | For the year ended October 31, 2024 | For the year ended October 31, 2024 and for the period August 21, 2023 (commencement of operations) through October 31, 2023 | For the year ended October 31, 2024 and for the period August 21, 2023 (commencement of operations) through October 31, 2023 | ||||||
20 |

21 |
22 |
23 |
24 |
25 |
Congress Large Cap Growth ETF | 100.00% | ||
Congress SMid Growth ETF | 100.00% | ||
Congress Intermediate Bond ETF | 0.00% | ||
Congress Large Cap Growth ETF | 100.00% | ||
Congress SMid Growth ETF | 100.00% | ||
Congress Intermediate Bond ETF | 0.00% | ||
Congress Large Cap Growth ETF | 0.00% | ||
Congress SMid Growth ETF | 0.00% | ||
Congress Intermediate Bond ETF | 0.00% | ||
26 |
(b) Financial Highlights are included within the financial statements filed under Item 7 of this Form.
Item 8. Changes in and Disagreements with Accountants for Open-End Investment Companies.
There were no changes in or disagreements with accountants during the period covered by this report.
Item 9. Proxy Disclosure for Open-End Investment Companies.
There were no matters submitted to a vote of shareholders during the period covered by this report.
Item 10. Remuneration Paid to Directors, Officers, and Others of Open-End Investment Companies.
See Item 7(a).
Item 11. Statement Regarding Basis for Approval of Investment Advisory Contract.
See Item 7(a).
Item 12. Disclosure of Proxy Voting Policies and Procedures for Closed-End Management Investment Companies.
Not applicable to open-end investment companies.
Item 13. Portfolio Managers of Closed-End Management Investment Companies.
Not applicable to open-end investment companies.
Item 14. Purchases of Equity Securities by Closed-End Management Investment Company and Affiliated Purchasers.
Not applicable to open-end investment companies.
Item 15. Submission of Matters to a Vote of Security Holders.
There have been no material changes to the procedures by which shareholders may recommend nominees to the registrant’s board of trustees.
Item 16. Controls and Procedures.
| (a) | The Registrant’s Principal Executive Officer and Principal Financial Officer have reviewed the Registrant’s disclosure controls and procedures (as defined in Rule 30a-3(c) under the Investment Company Act of 1940 (the “Act”)) as of a date within 90 days of the filing of this report, as required by Rule 30a-3(b) under the Act and Rules 13a-15(b) or 15d-15(b) under the Securities Exchange Act of 1934. Based on their review, such officers have concluded that the disclosure controls and procedures are effective in ensuring that information required to be disclosed in this report is appropriately recorded, processed, summarized and reported and made known to them by others within the Registrant and by the Registrant’s service provider. |
| (b) | There were no changes in the Registrant’s internal control over financial reporting (as defined in Rule 30a-3(d) under the Act) that occurred during the period covered by this report that has materially affected, or is reasonably likely to materially affect, the Registrant’s internal control over financial reporting. |
Item 17. Disclosure of Securities Lending Activities for Closed-End Management Investment Companies
Not applicable to open-end investment companies.
Item 18. Recovery of Erroneously Awarded Compensation.
Not applicable.
Item 19. Exhibits.
(a) (1) Any code of ethics or amendment thereto, that is the subject of the disclosure required by Item 2, to the extent that the registrant intends to satisfy Item 2 requirements through filing an exhibit. Filed herewith.
(2) Any policy required by the listing standards adopted pursuant to Rule 10D-1 under the Exchange Act (17 CFR 240.10D-1) by the registered national securities exchange or registered national securities association upon which the registrant’s securities are listed. Not applicable.
(4) Any written solicitation to purchase securities under Rule 23c-1 under the Act sent or given during the period covered by the report by or on behalf of the registrant to 10 or more persons. Not applicable to open-end investment companies.
(5) Change in the registrant’s independent public accountant. Provide the information called for by Item 4 of Form 8-K under the Exchange Act (17 CFR 249.308). Unless otherwise specified by Item 4, or related to and necessary for a complete understanding of information not previously disclosed, the information should relate to events occurring during the reporting period. Not applicable to open-end investment companies.
(b) Certifications pursuant to Section 906 of the Sarbanes-Oxley Act of 2002. Furnished herewith.
SIGNATURES
Pursuant to the requirements of the Securities Exchange Act of 1934 and the Investment Company Act of 1940, the registrant has duly caused this report to be signed on its behalf by the undersigned, thereunto duly authorized.
| (Registrant) | Professionally Managed Portfolios |
| By (Signature and Title) | /s/ Jason Hadler | ||
| Jason Hadler, President/Principal Executive Officer |
| Date | 1/10/2025 |
Pursuant to the requirements of the Securities Exchange Act of 1934 and the Investment Company Act of 1940, this report has been signed below by the following persons on behalf of the registrant and in the capacities and on the dates indicated.
| By (Signature and Title) | /s/ Jason Hadler | ||
| Jason Hadler, President/Principal Executive Officer |
| Date | 1/10/2025 |
| By (Signature and Title) | /s/ Craig Benton | ||
| Craig Benton, Treasurer/Principal Financial Officer |
| Date | 1/10/2025 |
* Print the name and title of each signing officer under his or her signature.