Exhibit 99.1
| Growing Forward Citigroup Power Gas & Utilities Conference June 5-6, 2008 David W. Joos President and Chief Executive Officer |
| This presentation contains "forward-looking statements" as defined in Rule 3b-6 of the Securities Exchange Act of 1934, as amended, Rule 175 of the Securities Act of 1933, as amended, and relevant legal decisions. The forward-looking statements are subject to risks and uncertainties. They should be read in conjunction with "FORWARD-LOOKING STATEMENTS AND INFORMATION" and "RISK FACTORS" each found in the MANAGEMENT'S DISCUSSION AND ANALYSIS sections of CMS Energy's Form 10-K and Consumers Energy's Form 10-K each for the Year Ended December 31, 2007 and as updated in CMS Energy's and Consumers Energy's Forms 10-Q for the Quarter ended March 31, 2008. These sections discuss important factors that could cause actual results to differ materially from those anticipated in such statements. The presentation also includes non-GAAP measures when describing CMS Energy's results of operations and financial performance. A reconciliation of each of these measures to the most directly comparable GAAP measure is included in the appendix and posted on our website at www.cmsenergy.com. CMS Energy expects 2008 reported earnings to be about the same as adjusted earnings. Reported earnings could vary because of gains or charges relating to previously sold assets and business operations or other factors. CMS Energy is not providing reported earnings guidance reconciliation because of the uncertainties associated with those factors. |
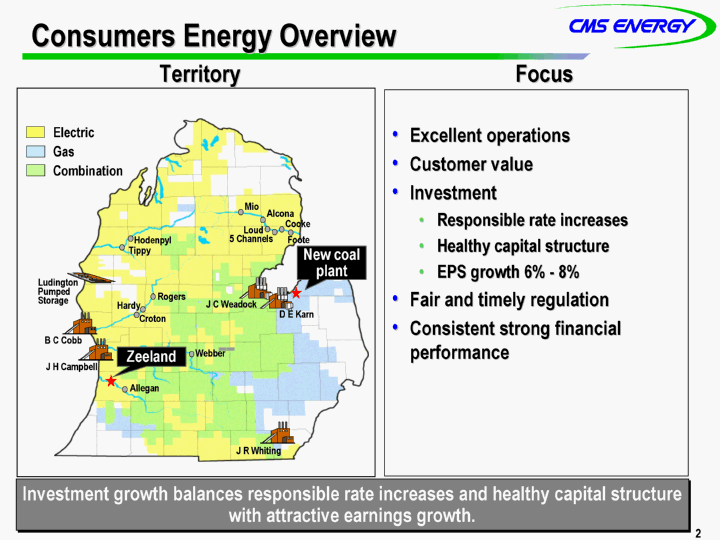
| Consumers Energy Overview Excellent operations Customer value Investment Responsible rate increases Healthy capital structure EPS growth 6% - 8% Fair and timely regulation Consistent strong financial performance Ludington Pumped Storage B C Cobb J H Campbell D E Karn J C Weadock J R Whiting Mio Alcona Cooke Foote Loud 5 Channels Hodenpyl Tippy Rogers Hardy Croton Webber Allegan Electric Gas Combination Zeeland New coal plant Focus Territory Investment growth balances responsible rate increases and healthy capital structure with attractive earnings growth. |
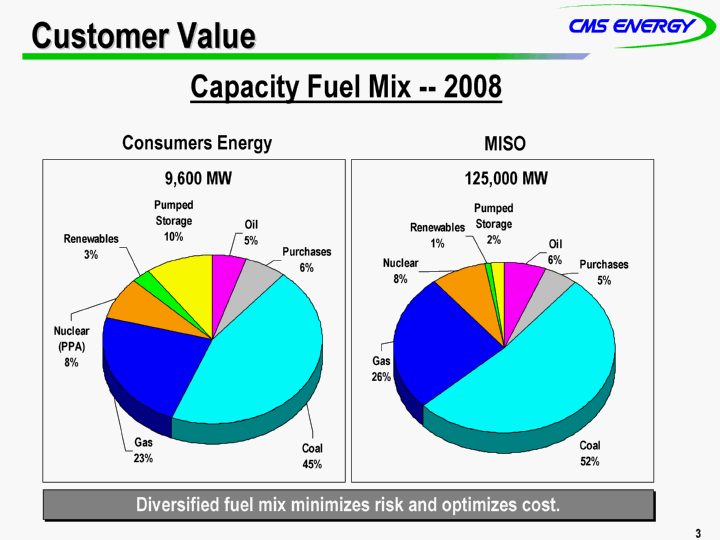
| Customer Value Coal Gas Nuclear Renewables Pumped Storage Oil Purchases 2008 0.45 0.23 0.08 0.03 0.1 0.05 0.06 Consumers Energy Coal Gas Nuclear Renewables Pumped Storage Oil Purchases 2006 0.52 0.26 0.08 0.01 0.02 0.06 0.05 9,600 MW MISO 125,000 MW Capacity Fuel Mix -- 2008 Diversified fuel mix minimizes risk and optimizes cost. |
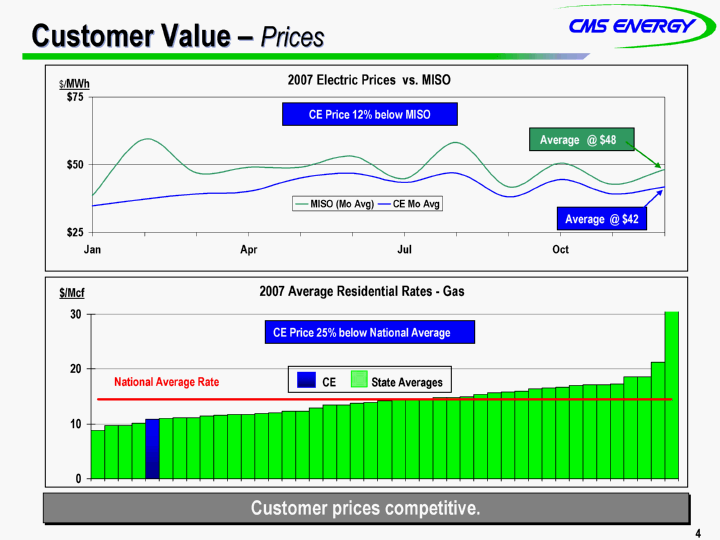
| Customer Value - Prices 1st Qtr 2nd Qtr 3rd Qtr 4th Qtr East 20.4 27.4 90 20.4 West 30.6 38.6 34.6 31.6 North 45.9 46.9 45 43.9 Jan Feb Mar Apr May Jun Jul Aug Sep Oct Nov Dec MISO (Mo Avg) 38.6 59.48 47.06 49.08 49.11 53.08 44.78 58.15 41.83 50.61 42.7 48.29 CE Mo Avg 34.86 37.28 39.14 40.14 45.07 46.83 43.4 46.81 38.17 44.6 39.26 41.84 2007 Electric Prices vs. MISO CE Price 12% below MISO Average @ $48 Average @ $42 $/MWh Alaska Utah North Dakota Montana CONSUMERS ENERGY Illinois South Dakota MICHIGAN Minnesota California Kentucky Indiana Idaho New Mexico Oklahoma Iowa Arkansas Kansas Ohio Missouri Tennessee Louisiana Washington Nevada New Jersey Pennsylvania West Virginia Oregon Virginia District of Columbia North Carolina Vermont Connecticut Massachusetts Rhode Island New Hampshire Maine Delaware Arizon a Alabama Georgia Florida Hawaii Rates 8.74 9.64 9.65 10.14 10.76 10.98 11.07 11.15 11.39 11.62 11.72 11.75 11.85 12.05 12.31 12.36 12.93 13.4 13.5 13.69 13.96 14.21 14.4 14.45 14.65 14.71 14.8 14.95 15.42 15.73 15.8 15.92 16.35 16.6 16.68 16.93 17.07 17.12 17.31 18.6 18.61 21.29 33.69 14.42 14.42 14.42 14.42 14.42 14.42 14.42 14.42 14.42 14.42 14.42 14.42 14.42 14.42 14.42 14.42 14.42 14.42 14.42 14.42 14.42 14.42 14.42 14.42 14.42 14.42 14.42 14.42 14.42 14.42 14.42 14.42 14.42 14.42 14.42 14.42 14.42 14.42 14.42 14.42 14.42 14.42 14.42 2007 Average Residential Rates - Gas National Average Rate $/Mcf CE Price 25% below National Average CE State Averages Customer prices competitive. |
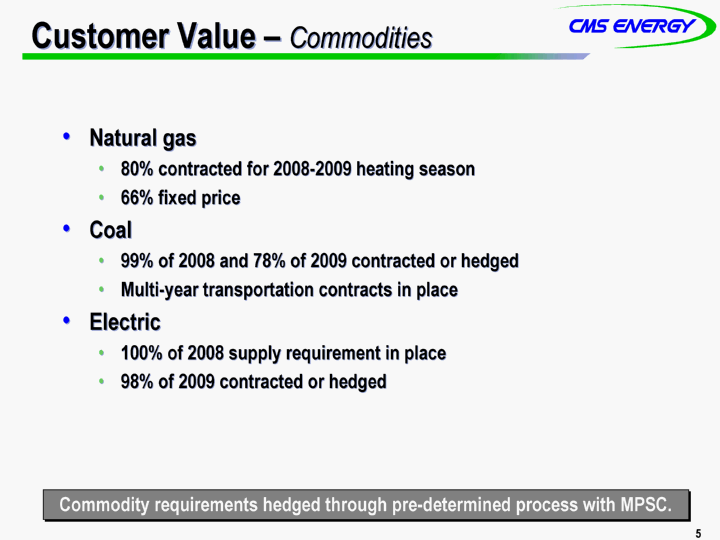
| Customer Value - Commodities Natural gas 80% contracted for 2008-2009 heating season 66% fixed price Coal 99% of 2008 and 78% of 2009 contracted or hedged Multi-year transportation contracts in place Electric 100% of 2008 supply requirement in place 98% of 2009 contracted or hedged Commodity requirements hedged through pre-determined process with MPSC. |
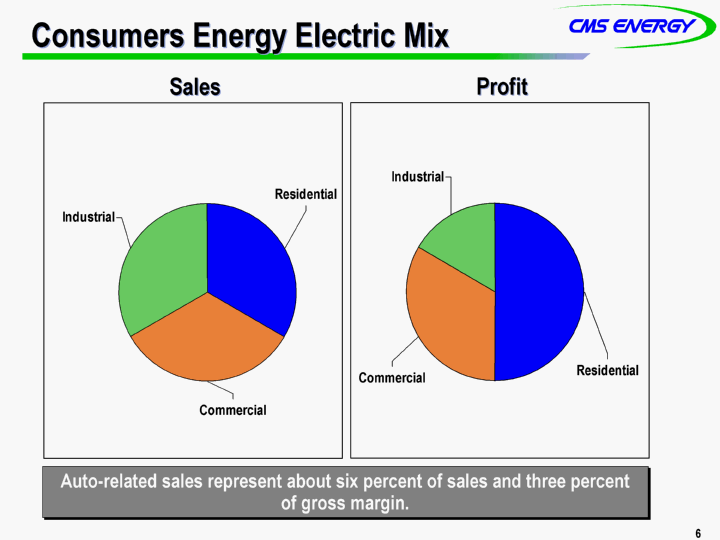
| Auto-related sales represent about six percent of sales and three percent of gross margin. Consumers Energy Electric Mix Residential Commercial Industrial Sales 0.33 0.33 0.33 Sales Residential Commercial Industrial Sales 0.5 0.333 0.1666 Profit |
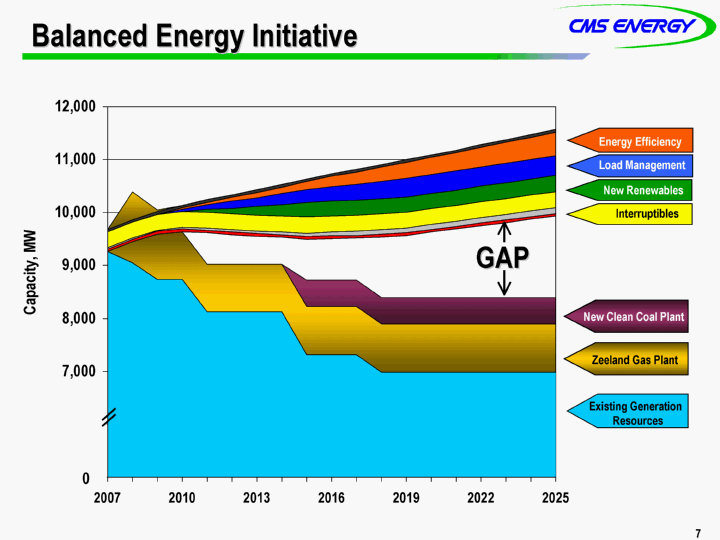
| Balanced Energy Initiative 2007 2008 2009 2010 2011 2012 2013 2014 2015 2016 2017 2018 2019 2020 2021 2022 2023 2024 2025 Existing Fleet with Retirements 7841 7841 7841 7841 7841 7841 7841 7841 7030 7030 7030 6702 6702 6702 6702 6702 6702 6702 6702 Existing Renewables 284 284 284 284 284 284 284 284 284 284 284 284 284 284 284 284 284 284 284 Short-term purchases 1134 924 604 604 Zeeland 0 395 865 901 901 901 901 901 901 901 901 901 901 901 901 901 901 901 901 New Clean Coal Plant 0 0 0 0 0 0 0 0 500 500 500 500 500 500 500 500 500 500 500 Capacity shortfall 0 0 0 10 591 555 525 501 781 797 800 1147 1179 1240 1300 1362 1421 1483 1545 Net requirements 50 50 50 50 50 50 50 50 50 50 50 50 50 50 50 50 50 50 50 Reserve required 22 22 22 29 37 44 51 58 66 73 81 88 94 97 100 106 106 109 112 Interruptibles 300 300 300 300 300 300 300 300 300 300 300 300 300 300 300 300 300 300 300 New Renewables 0 0 0 0 53 106 160 216 271 280 281 284 284 289 283 295 299 303 306 Load Management 0 0 0 46 89 130 170 207 242 276 308 338 357 360 363 366 369 372 375 Energy Efficiency 0 0 0 24 48 73 98 123 158 192 226 261 295 320 345 370 394 418 442 Total requirements 50 50 50 50 50 50 50 50 50 50 50 50 50 50 50 50 50 50 50 Surplus capacity 0 529 36 0 0 0 0 0 0 0 0 0 0 0 0 0 0 0 0 Energy Efficiency New Renewables New Clean Coal Plant Existing Generation Resources Zeeland Gas Plant Load Management Interruptibles GAP Capacity, MW 0 |
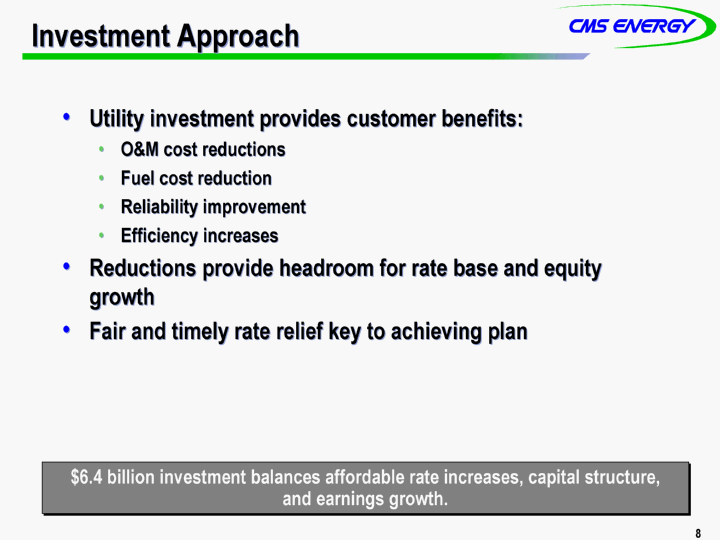
| Investment Approach Utility investment provides customer benefits: O&M cost reductions Fuel cost reduction Reliability improvement Efficiency increases Reductions provide headroom for rate base and equity growth Fair and timely rate relief key to achieving plan $6.4 billion investment balances affordable rate increases, capital structure, and earnings growth. |
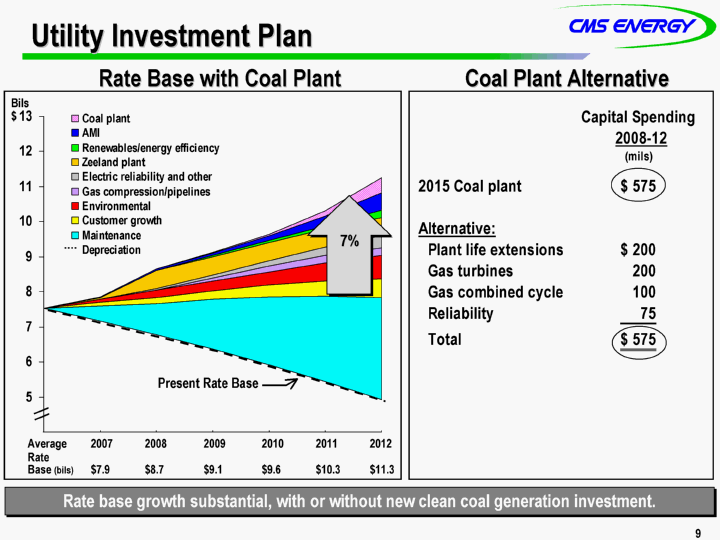
| 2007 2008 2009 2010 2011 2012 Depreciation 7.534 7.173 6.785 6.366 5.918 5.436 4.926 Maintenance 0.429 0.866 1.413 1.937 2.444 2.911 Customer growth 0.091 0.173 0.258 0.344 0.433 0.525 Environmental 0.107 0.215 0.278 0.368 0.517 0.669 Gas compression/pipelines 0 0.018 0.087 0.171 0.217 0.232 Electric reliability and other 0 0.025 0.083 0.151 0.219 0.335 Zeeland plant 0.043 0.519 0.519 0.519 0.519 0.519 Renewables/energy efficiency 0 0.009 0.031 0.057 0.101 0.212 AMI 0.004 0.03 0.076 0.143 0.268 0.506 Coal plant 0.004 0.011 0.018 0.03 0.156 0.428 Coal Plant Alternative Rate Base with Coal Plant Bils $ Present Rate Base Average 2007 2008 2009 2010 2011 2012 Rate Base (bils) $7.9 $8.7 $9.1 $9.6 $10.3 $11.3 7% Rate base growth substantial, with or without new clean coal generation investment. Utility Investment Plan |
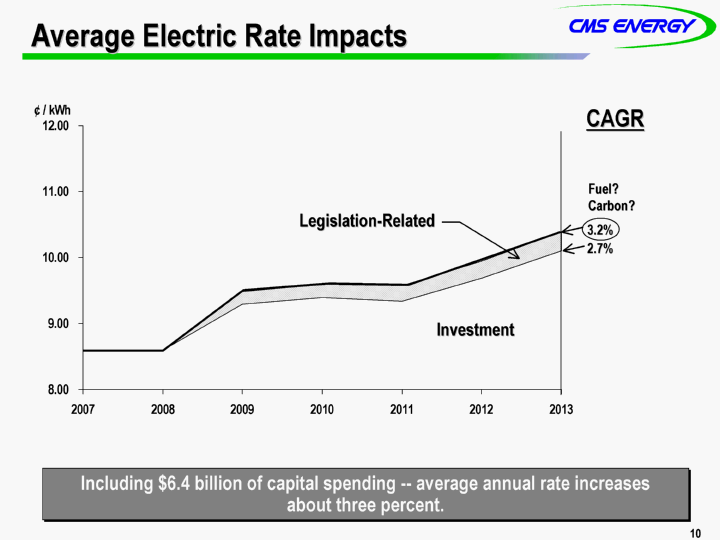
| Average Electric Rate Impacts Including $6.4 billion of capital spending -- average annual rate increases about three percent. 2007 2008 2009 2010 2011 2012 2013 Base 8.59 8.59 9.29 9.39 9.34 9.68 10.1 Base +EEI 0 0 0.19 0.2 0.23 0.26 0.29 Base + EEI + fuel 0 0.04 0.52 0.75 0.88 0.75 0.71 0.5 0.5 CAGR 3.2% 2.7% Investment Fuel? Carbon? Legislation-Related |
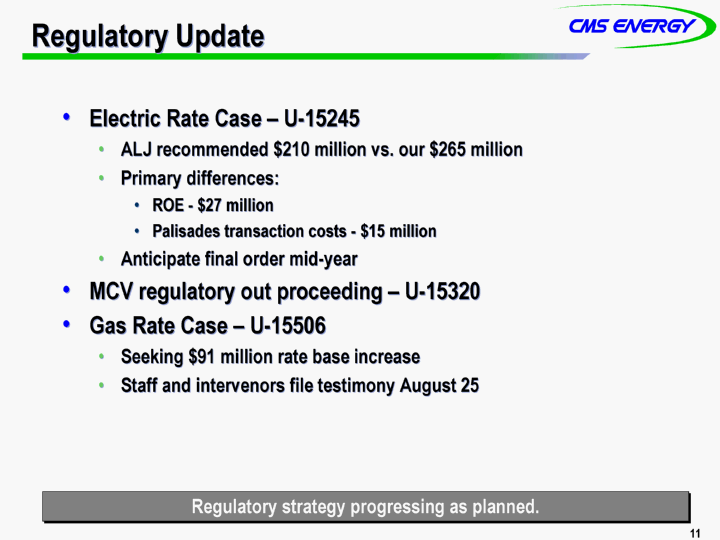
| Regulatory Update Electric Rate Case - U-15245 ALJ recommended $210 million vs. our $265 million Primary differences: ROE - $27 million Palisades transaction costs - $15 million Anticipate final order mid-year MCV regulatory out proceeding - U-15320 Gas Rate Case - U-15506 Seeking $91 million rate base increase Staff and intervenors file testimony August 25 Regulatory strategy progressing as planned. |
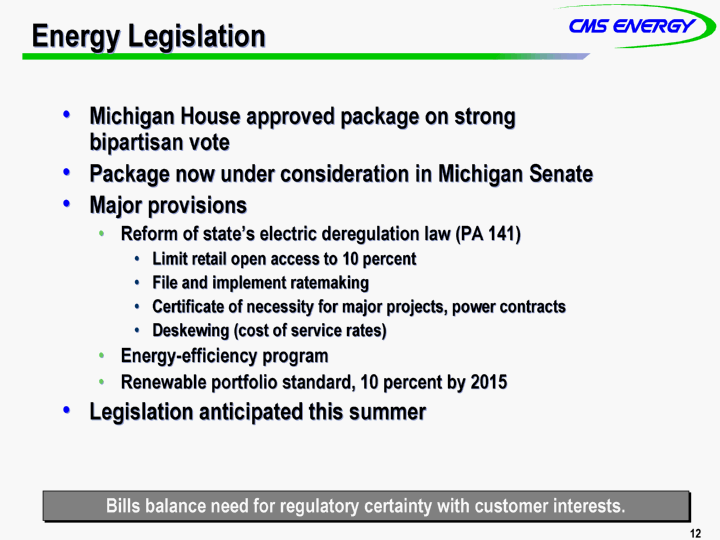
| Energy Legislation Michigan House approved package on strong bipartisan vote Package now under consideration in Michigan Senate Major provisions Reform of state's electric deregulation law (PA 141) Limit retail open access to 10 percent File and implement ratemaking Certificate of necessity for major projects, power contracts Deskewing (cost of service rates) Energy-efficiency program Renewable portfolio standard, 10 percent by 2015 Legislation anticipated this summer Bills balance need for regulatory certainty with customer interests. |
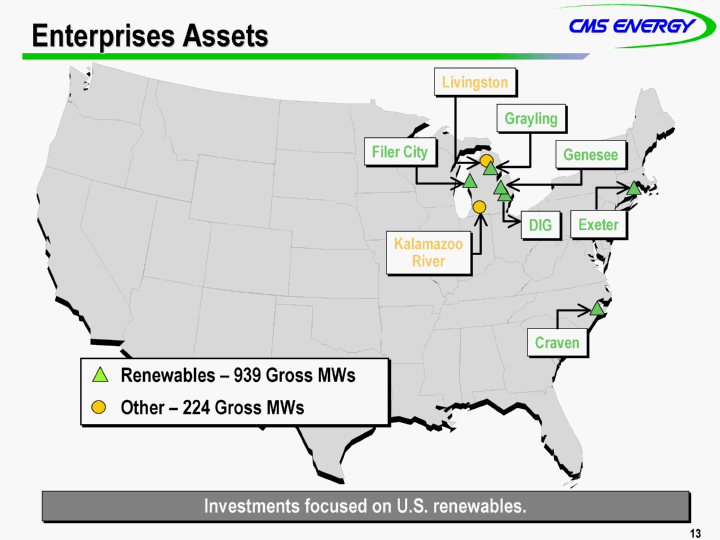
| Enterprises Assets Kalamazoo River Craven Exeter Filer City Livingston Grayling Genesee DIG Investments focused on U.S. renewables. Renewables - 939 Gross MWs Other - 224 Gross MWs |

| Adjusted (non-GAAP) EPS Guidance 2007 Equity & Return MCV "Reg Out" Assets Sold DIG Restructuring Cost & Other 2008 grey hatch 0.42 0.44 grey 0.42 0.76 no fill 0.84 1.15 1.11 1.1 1.15 red hatch 0.11 red 0.04 green hatch 0.03 0.05 0.04 0.05 green 0.28 0.06 Utility Enterprises + Parent $0.34 To Go $0 To Go $0.84 $1.20 To Go Completed First Quarter |

| CMS Adjusted (non-GAAP) Earnings* 2007 restructuring set stage for utility growth. 2003 2004 2005 2006 2007 2008 Future 0.81 0.9 0.96 1.08 0.84 1.2 target _ _ _ _ _ * Adjusted (non-GAAP) EPS excluding MTM in 2004 - 2006 6% - 8% Growth |
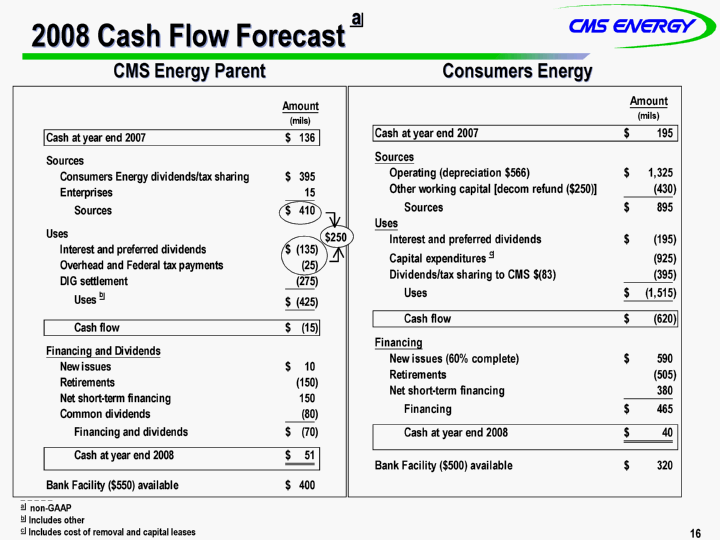
| 2008 Cash Flow Forecast CMS Energy Parent Consumers Energy $250 a _ _ _ _ _ a non-GAAP b Includes other c Includes cost of removal and capital leases |
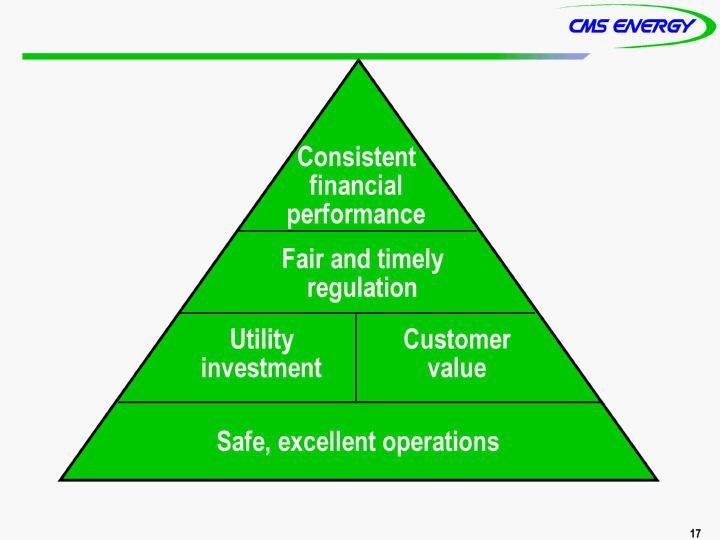
| Consistent financial performance Fair and timely regulation Utility investment Customer value Safe, excellent operations 33 |
CMS Energy
Earnings Reconciliation By Quarter and Year
December 31
Reconciliation of reported measures prepared in accordance with
Generally Accepted Accounting Principles (GAAP) versus non-GAAP measures
| | | | | | | | | | | | | | | | | | | | | |
| | | Unaudited Quarters |
| (millions, except per share amounts) | | 1Q03 | | 2Q03 | | 3Q03 | | 4Q03 | | FY 2003 |
| |
Reported net income | | $ | 82 | | | $ | (65 | ) | | $ | (69 | ) | | $ | 8 | | | $ | (44 | ) |
| |
After-tax items: | | | | | | | | | | | | | | | | | | | | |
| Electric and gas utility other | | | | | | | | | | | | | | | 30 | | | | 30 | |
| Enterprises other | | | 5 | | | | 7 | | | | 62 | | | | 37 | | | | 111 | |
| Corporate other | | | 1 | | | | | | | | 19 | | | | 4 | | | | 24 | |
| Discontinued operations | | | (31 | ) | | | 53 | | | | (2 | ) | | | (43 | ) | | | (23 | ) |
| Cumulative accounting changes | | | 24 | | | | | | | | | | | | | | | | 24 | |
| |
Ongoing earnings (non-GAAP) | | $ | 81 | | | $ | (5 | ) | | $ | 10 | | | $ | 36 | | | $ | 122 | |
| |
| | | | | | | | | | | | | | | | | | | | | |
Average shares outstanding, basic | | | 144.1 | | | | 144.1 | | | | 152.2 | | | | 161.1 | | | | 150.4 | |
| | | | | | | | | | | | | | | | | | | | | |
Average shares outstanding, diluted | | | 165.0 | | | | 144.1 | | | | 152.2 | | | | 161.1 | | | | 150.4 | |
| | | | | | | | | | | | | | | | | | | | | |
| |
Reported earnings per share | | $ | 0.52 | | | $ | (0.45 | ) | | $ | (0.46 | ) | | $ | 0.05 | | | $ | (0.30 | ) |
| |
After-tax items | | | | | | | | | | | | | | | | | | | | |
| Electric and gas utility other | | | | | | | | | | | | | | | 0.19 | | | | 0.21 | |
| Enterprises other | | | 0.03 | | | | 0.05 | | | | 0.41 | | | | 0.23 | | | | 0.74 | |
| Corporate other | | | | | | | | | | | 0.12 | | | | 0.02 | | | | 0.16 | |
| Discontinued operations | | | (0.19 | ) | | | 0.37 | | | | (0.01 | ) | | | (0.27 | ) | | | (0.16 | ) |
| Cumulative accounting changes | | | 0.14 | | | | | | | | | | | | | | | | 0.16 | |
| |
Ongoing earnings per share (non-GAAP) | | $ | 0.50 | | | $ | (0.03 | ) | | $ | 0.06 | | | $ | 0.22 | | | $ | 0.81 | |
| |
Note: Year-to-date (YTD) EPS may not equal sum of quarters due to share count differences.
A-1
CMS Energy
Earnings Reconciliation By Quarter and Year
Reconciliation of reported measures prepared in accordance with
Generally Accepted Accounting Principles (GAAP) versus non-GAAP measures
| | | | | | | | | | | | | | | | | | | | | |
| | | Unaudited | | 31-Dec | |
| (millions, except per share amounts) | | 1Q04* | | | 2Q04 | | | 3Q04 | | | 4Q04 | | | FY 2004 | |
| | | | |
Reported net income — GAAP | | $ | (9 | ) | | $ | 16 | | | $ | 56 | | | $ | 47 | | | $ | 110 | |
| | | | |
After-tax items: | | | | | | | | | | | | | | | | | | | | |
| Electric and gas utility other | | | | | | | | | | | | | | | (67 | ) | | | (67 | ) |
| Enterprises other | | | 88 | | | | | | | | (29 | ) | | | 48 | | | | 107 | |
| Corporate other | | | (7 | ) | | | | | | | (1 | ) | | | 1 | | | | (7 | ) |
| Discontinued operations | | | 2 | | | | | | | | (8 | ) | | | 10 | | | | 4 | |
| Cumulative accounting changes | | | 2 | | | | | | | | | | | | | | | | 2 | |
| | | | |
Adjusted earnings, including M-T-M | | $ | 76 | | | $ | 16 | | | $ | 18 | | | $ | 39 | | | $ | 149 | |
| Mark-to-market impacts | | NM | | | | (13 | ) | | | 9 | | | | 9 | | | | 5 | |
| | | | |
Adjusted earnings, excluding M-T-M | | $ | 76 | | | $ | 3 | | | $ | 27 | | | $ | 48 | | | $ | 154 | |
| | | | |
| |
Average shares outstanding, basic | | | 161.1 | | | | 161.2 | | | | 161.5 | | | | 190.2 | | | | 168.6 | |
| | | | | | | | | | | | | | | | | | | | | |
Average shares outstanding, diluted | | | 161.1 | | | | 164.2 | | | | 165.0 | | | | 194.0 | | | | 172.1 | |
| | | | | | | | | | | | | | | | | | | | | |
| | | | |
Reported earnings per share — GAAP | | $ | (0.06 | ) | | $ | 0.10 | | | $ | 0.34 | | | $ | 0.24 | | | $ | 0.64 | |
| | | | |
After-tax items | | | | | | | | | | | | | | | | | | | | |
| Electric and gas utility other | | | | | | | | | | | | | | | (0.35 | ) | | | (0.39 | ) |
| Enterprises other | | | 0.56 | | | | | | | | (0.17 | ) | | | 0.25 | | | | 0.62 | |
| Corporate other | | | (0.05 | ) | | | | | | | (0.01 | ) | | | 0.01 | | | | (0.03 | ) |
| Discontinued operations | | | 0.01 | | | | | | | | (0.05 | ) | | | 0.05 | | | | 0.02 | |
| Cumulative accounting changes | | | 0.01 | | | | | | | | | | | | | | | | 0.01 | |
| | | | |
Adjusted earnings per share, including M-T-M | | $ | 0.47 | | | $ | 0.10 | | | $ | 0.11 | | | $ | 0.20 | | | $ | 0.87 | |
| Mark-to-market impacts | | NM | | | | (0.08 | ) | | | 0.06 | | | | 0.05 | | | | 0.03 | |
| | | | |
Adjusted earnings per share, excluding M-T-M | | $ | 0.47 | | | $ | 0.02 | | | $ | 0.17 | | | $ | 0.25 | | | $ | 0.90 | |
| | | | |
Note: Year-to-date & full-year EPS may not equal sum of quarters due to share count differences.
| | | |
| * | | Quarterly amounts differ from amounts previously reported due to accelerating the measurement date on our benefit plans by one month and the remeasurement of our post retirement obligation. |
NM: Not meaningful.
A-2
CMS Energy
Earnings Reconciliation By Quarter and Year
Reconciliation of reported measures prepared in accordance with
Generally Accepted Accounting Principles (GAAP) versus non-GAAP measures
| | | | | | | | | | | | | | | | | | | | | |
| | | Unaudited | | 31-Dec | |
| (millions, except per share amounts) | | 1Q05 | | 2Q05 | | 3Q05 | | 4Q05 | | FY 2005 | |
| | | | | |
Reported net income — GAAP | | $ | 150 | | | $ | 27 | | | $ | (265 | ) | | $ | (6 | ) | | $ | (94 | ) |
| | | | | |
After-tax items: | | | | | | | | | | | | | | | | | | | | |
| Electric and gas utility other | | | | | | | | | | | | | | | | | | | | |
| Enterprises other | | | (2 | ) | | | (1 | ) | | | (1 | ) | | | 13 | | | | 9 | |
| Corporate other | | | | | | | 1 | | | | | | | | 8 | | | | 9 | |
| Discontinued operations | | | | | | | | | | | | | | | (14 | ) | | | (14 | ) |
| Asset impairment | | | | | | | | | | | 385 | | | | | | | | 385 | |
| | | | | |
Adjusted earnings, including M-T-M | | $ | 148 | | | $ | 27 | | | $ | 119 | | | $ | 1 | | | $ | 295 | |
| Mark-to-market impacts | | | (75 | ) | | | 19 | | | | (75 | ) | | | 40 | | | | (91 | ) |
| | | | | |
Adjusted earnings, excluding M-T-M | | $ | 73 | | | $ | 46 | | | $ | 44 | | | $ | 41 | | | $ | 204 | |
| | | | | |
| | | | | | | | | | | | | | | | | | | | | |
Average shares outstanding, basic | | | 195.3 | | | | 217.9 | | | | 219.6 | | | | 218.5 | | | | 211.8 | |
| | | | | | | | | | | | | | | | | | | | | |
Average shares outstanding, diluted | | | 206.3 | | | | 228.9 | | | | 219.6 | | | | 218.5 | | | | 211.8 | |
| | | | | | | | | | | | | | | | | | | | | |
| | | | | |
Reported earnings per share — GAAP | | $ | 0.74 | | | $ | 0.12 | | | $ | (1.21 | ) | | $ | (0.03 | ) | | $ | (0.44 | ) |
| | | | | |
After-tax items | | | | | | | | | | | | | | | | | | | | |
| Electric and gas utility other | | | | | | | | | | | | | | | | | | | | |
| Enterprises other | | | (0.01 | ) | | NM | | NM | | | 0.06 | | | | 0.04 | |
| Corporate other | | | | | | NM | | | | | | | 0.03 | | | | 0.04 | |
| Discontinued operations | | | | | | | | | | | | | | | (0.06 | ) | | | (0.07 | ) |
| Asset impairment | | | | | | | | | | | 1.75 | | | | | | | | 1.82 | |
| | | | | |
Adjusted earnings per share, including M-T-M | | $ | 0.73 | | | $ | 0.12 | | | $ | 0.54 | | | $ | 0.00 | | | $ | 1.39 | |
| Mark-to-market impacts | | | (0.36 | ) | | | 0.08 | | | | (0.34 | ) | | | 0.19 | | | | (0.43 | ) |
| | | | | |
Adjusted earnings per share, excluding M-T-M | | $ | 0.37 | | | $ | 0.20 | | | $ | 0.20 | | | $ | 0.19 | | | $ | 0.96 | |
| | | | | | |
Note: Year-to-date & full-year EPS may not equal sum of quarters due to share count differences.
A-3
CMS Energy
Earnings Reconciliation By Quarter and Year
Reconciliation of reported measures prepared in accordance with
Generally Accepted Accounting Principles (GAAP) versus non-GAAP measures
| | | | | | | | | | | | | | | | | | | | | |
| | | Unaudited | | |
| | | 2006 | | 2006 | |
| (In millions, except per share amounts) | | 1Q | | 2Q | | 3Q | | 4Q | | Dec YTD | |
| | | | | |
Reported net income — GAAP | | $ | (27 | ) | | $ | 72 | | | $ | (103 | ) | | $ | (32 | ) | | $ | (90 | ) |
| | | | | |
After-tax items: | | | | | | | | | | | | | | | | | | | | |
| Electric and gas utility other | | | — | | | | — | | | | — | | | | — | | | | — | |
| Enterprises other | | | — | | | | — | | | | (29 | ) | | | 25 | | | | (4 | ) |
| Corporate interest and other | | | 2 | | | | (15 | ) | | | 4 | | | | 82 | | | | 73 | |
| Discontinued operations (gain) | | | (1 | ) | | | (2 | ) | | | (1 | ) | | | (2 | ) | | | (6 | ) |
| Asset impairment charges | | | — | | | | — | | | | 169 | | | | — | | | | 169 | |
| | | | | |
Adjusted earnings, including MTM | | $ | (26 | ) | | $ | 55 | | | $ | 40 | | | $ | 73 | | | $ | 142 | |
| Mark-to-market impacts | | | 74 | | | | 21 | | | | 30 | | | | (13 | ) | | | 112 | |
| | | | | |
Adjusted earnings, excluding MTM | | $ | 48 | | | $ | 76 | | | $ | 70 | | | $ | 60 | | | $ | 254 | |
| | | | | |
| | | | | | | | | | | | | | | | | | | | | |
Average shares outstanding, basic | | | 219.1 | | | | 219.6 | | | | 220.1 | | | | 220.6 | | | | 219.9 | |
Average shares outstanding, diluted | | | 219.1 | | | | 229.6 | | | | 220.1 | | | | 220.6 | | | | 219.9 | |
| | | | | | | | | | | | | | | | | | | | | |
| | | | | |
Reported earnings per share — GAAP | | $ | (0.12 | ) | | $ | 0.31 | | | $ | (0.47 | ) | | $ | (0.15 | ) | | $ | (0.41 | ) |
| | | | | |
After-tax items | | | | | | | | | | | | | | | | | | | | |
| Electric and gas utility other | | | — | | | | — | | | | — | | | | — | | | | — | |
| Enterprises other | | | — | | | | — | | | | (0.13 | ) | | | 0.11 | | | | (0.02 | ) |
| Corporate other | | | 0.01 | | | | (0.07 | ) | | | 0.02 | | | | 0.38 | | | | 0.27 | |
| Discontinued operations | | | (0.01 | ) | | | (0.01 | ) | | | — | | | | (0.01 | ) | | | (0.03 | ) |
| Asset impairment charges | | | — | | | | — | | | | 0.76 | | | | — | | | | 0.76 | |
| | | | | |
Adjusted earnings per share, including MTM | | $ | (0.12 | ) | | $ | 0.23 | | | $ | 0.18 | | | $ | 0.33 | | | $ | 0.57 | |
| Mark-to-market impacts | | | 0.34 | | | | 0.10 | | | | 0.13 | | | | (0.06 | ) | | | 0.51 | |
| | | | | |
Adjusted earnings per share, excluding MTM | | $ | 0.22 | | | $ | 0.33 | | | $ | 0.31 | | | $ | 0.27 | | | $ | 1.08 | |
| | | | | |
Note: Year-to-date (YTD) EPS may not equal sum of quarters due to share count differences.
A-4
CMS Energy
Earnings Reconciliation By Quarter and Year
Reconciliation of reported measures prepared in accordance with
Generally Accepted Accounting Principles (GAAP) versus non-GAAP measures
| | | | | | | | | | | | | | | | | | | | | |
| | | 2007 | |
| (In millions, except per share amounts) | | 1Q | | | 2Q | | | 3Q | | | 4Q | | | Dec YTD | |
Reported net income (loss) — GAAP | | $ | (215 | ) | | $ | 33 | | | $ | 82 | | | $ | (127 | ) | | $ | (227 | ) |
| | | | | | | | | | | | | | | | |
After-tax items: | | | | | | | | | | | | | | | | | | | | |
| Electric and gas utility | | | 4 | | | | — | | | | — | | | | — | | | | 4 | |
| Enterprises | | | 49 | | | | 19 | | | | (10 | ) | | | 222 | | | | 280 | |
| Corporate interest and other | | | (81 | ) | | | 32 | | | | 9 | | | | (38 | ) | | | (78 | ) |
| Discontinued operations | | | 178 | | | | (91 | ) | | | — | | | | 2 | | | | 89 | |
| Asset impairment charges, net | | | 157 | | | | 25 | | | | (49 | ) | | | — | | | | 133 | |
| | | | | | | | | | | | | | | | |
Adjusted income, including MTM of $1, $3, $4, $3 and $11 | | $ | 92 | | | $ | 18 | | | $ | 32 | | | $ | 59 | | | $ | 201 | |
| | | | | | | | | | | | | | | | |
| | | | | | | | | | | | | | | | | | | | | |
Average shares outstanding, basic | | | 221.5 | | | | 222.6 | | | | 223.0 | | | | 223.4 | | | | 222.6 | |
Average shares outstanding, diluted | | | 221.5 | | | | 222.6 | | | | 241.3 | | | | 223.4 | | | | 222.6 | |
| | | | | | | | | | | | | | | | | | | | | |
| | | | | | | | | | | | | | | | |
Reported earnings (loss) per share — GAAP | | $ | (0.97 | ) | | $ | 0.15 | | | $ | 0.34 | | | $ | (0.57 | ) | | $ | (1.02 | ) |
| | | | | | | | | | | | | | | | |
After-tax items: | | | | | | | | | | | | | | | | | | | | |
| Electric and gas utility | | | 0.01 | | | | — | | | | — | | | | — | | | | (0.07 | ) |
| Enterprises | | | 0.23 | | | | 0.08 | | | | (0.04 | ) | | | 0.99 | | | | 1.25 | |
| Corporate interest and other | | | (0.36 | ) | | | 0.15 | | | | 0.03 | | | | (0.17 | ) | | | (0.32 | ) |
| Discontinued operations | | | 0.80 | | | | (0.41 | ) | | | — | | | | 0.01 | | | | 0.40 | |
| Asset impairment charges, net | | | 0.71 | | | | 0.11 | | | | (0.20 | ) | | | — | | | | 0.60 | |
| | | | | | | | | | | | | | | | |
Adjusted earnings per share, including MTM of $0.01, $0.01, $0.02, $0.02 and $0.05 | | $ | 0.42 | | | $ | 0.08 | | | $ | 0.13 | | | $ | 0.26 | | | $ | 0.84 | |
| | | | | | | | | | | | | | | | |
| |
| |
| Note: | Year-to-date (YTD) EPS may not equal sum of quarters due to share count differences. |
A-5
CMS Energy
Earnings Reconciliation By Quarter and Year
Reconciliation of reported measures prepared in accordance with
Generally Accepted Accounting Principles (GAAP) versus non-GAAP measures
| | | | | |
| | | 2008 |
| (In millions, except per share amounts) | | 1Q |
| |
Reported net income — GAAP | | $ | 103 | |
| |
After-tax items: | | | | |
| Electric and gas utility | | | — | |
| Enterprises | | | * | |
| Corporate interest and other | | | — | |
| Discontinued operations | | | (* | ) |
| Asset impairment charges, net | | | — | |
| |
Adjusted income — non-GAAP | | $ | 103 | |
| |
| | | | | |
Average shares outstanding, basic | | | 223.5 | |
Average shares outstanding, diluted | | | 236.6 | |
| | | | | |
| |
Reported earnings per share — GAAP | | $ | 0.44 | |
| |
After-tax items: | | | | |
| Electric and gas utility | | | — | |
| Enterprises | | | * | |
| Corporate interest and other | | | — | |
| Discontinued operations | | | (* | ) |
| Asset impairment charges, net | | | — | |
| |
Adjusted earnings per share — non-GAAP | | $ | 0.44 | |
| |
| | |
| |
| Note: | | Year-to-date (YTD) EPS may not equal sum of quarters due to share count differences. |
| |
| * | | Less than $500 thousand or $0.01 per share. |
A-6
CMS ENERGY
Earnings Segment Results GAAP Reconciliation
For Periods Ended March 31
(Unaudited — In Millions, Except per Share Amounts)
| | | | | | | | | |
| | | Three Months | |
| | | EPS | |
| | | 2008 | | | 2007 | |
Electric Utility | | | | | | | | |
| Reported | | $ | 0.28 | | | $ | 0.23 | |
| Asset Sales Loss and Other, net | | | — | | | | 0.01 | |
| | | | | | | |
| Adjusted | | $ | 0.28 | | | $ | 0.24 | |
| | | | | | | |
| |
Gas Utility | | | | | | | | |
| Reported and Adjusted | | $ | 0.26 | | | $ | 0.26 | |
| | | | | | | |
| |
Enterprises | | | | | | | | |
| Reported | | $ | (* | ) | | $ | (0.90 | ) |
| Asset Impairment Charges, net | | | — | | | | 0.71 | |
| Asset Sales Loss and Other, net | | | * | | | | 0.23 | |
| | | | | | | |
| Adjusted | | $ | (* | ) | | $ | 0.04 | |
| | | | | | | |
| |
Corporate Interest and Other | | | | | | | | |
| Reported | | $ | (0.10 | ) | | $ | 0.24 | |
| Asset Sales Gain and Other, net | | | — | | | | (0.36 | ) |
| | | | | | | |
| Adjusted | | $ | (0.10 | ) | | $ | (0.12 | ) |
| | | | | | | |
| |
Discontinued Operations | | | | | | | | |
| Reported | | | * | | | $ | (0.80 | ) |
| Discontinued Operations (Gain) Loss | | | (* | ) | | | 0.80 | |
| | | | | | | |
| Adjusted | | $ | — | | | $ | — | |
| | | | | | | |
| |
Totals | | | | | | | | |
| Reported | | $ | 0.44 | | | $ | (0.97 | ) |
| Discontinued Operations (Gain) Loss | | | (* | ) | | | 0.80 | |
| Asset Impairment Charges, net | | | — | | | | 0.71 | |
| Asset Sales Gain and Other, net | | | * | | | | (0.12 | ) |
| | | | | | | |
| Adjusted | | $ | 0.44 | | | $ | 0.42 | |
| | | | | | | |
| |
| Average Common Shares Outstanding — Diluted | | | 236.6 | | | | 221.5 | |
| | | | | | | |
| | |
| * | | Less than $0.01 per share. |
A-7
Consumers Energy
2008 Cash Flow GAAP Reconciliation (in millions)
| | | | | | | | | | | | | | | | | | | | | | | | | | | | | | | | | | | | | | | |
| | | | | | | Reclassifications From Sources and Uses to Statement of Cash Flows | | | | |
| Presentation Sources and Uses | | | | | Tax | | | Interest | | | Accts/Rec | | | Capital | | | Securitization | | | Preferred | | | Common | | | Consolidated Statements of Cash Flows |
| | | non-GAAP | | | Sharing | | | Payments | | | Financing | | | Lease Pymts | | | Debt Pymts | | | Dividends | | | Dividends | | | GAAP | | | |
| Description | | Amount | | | Operating | | | as Operating | | | as Operating | | | as Financing | | | as Financing | | | as Financing | | | as Financing | | | Amount | | | Description |
| Cash at year end 2007 | | $ | 195 | | | $ | — | | | $ | — | | | $ | — | | | $ | — | | | $ | — | | | $ | — | | | $ | — | | | $ | 195 | | | Cash at year end 2007 |
| |
Sources | | | | | | | | | | | | | | | | | | | | | | | | | | | | | | | | | | | | | | |
| Operating | | $ | 1,325 | | | $ | (83 | ) | | $ | (193 | ) | | $ | 325 | | | $ | 16 | | | $ | 32 | | | $ | — | | | $ | — | | | $ | 1,422 | | | |
| Other working capital | | | (430 | ) | | | — | | | | — | | | | — | | | | — | | | | — | | | | — | | | | — | | | | (430 | ) | | |
| | | | | | | | | | | | | | | | | | | | | | | | | | | | | |
| Sources | | $ | 895 | | | $ | (83 | ) | | $ | (193 | ) | | $ | 325 | | | $ | 16 | | | $ | 32 | | | $ | | | | $ | | | | $ | 992 | | | Net cash provided by operating activities |
| | | | | | | | | | | | | | | | | | | | | | | | | | | | | | | | | | | | | | | |
Uses | | | | | | | | | | | | | | | | | | | | | | | | | | | | | | | | | | | | | | |
| Interest and preferred dividends | | $ | (195 | ) | | $ | — | | | $ | 193 | | | $ | — | | | $ | — | | | $ | — | | | $ | 2 | | | $ | — | | | $ | — | | | |
| Capital expenditures | | | (925 | ) | | | — | | | | — | | | | — | | | | — | | | | — | | | | — | | | | — | | | | (925 | ) | | |
| Dividends/tax sharing to CMS | | | (395 | ) | | | 83 | | | | — | | | | — | | | | — | | | | — | | | | — | | | | 312 | | | | — | | | |
| | | | | | | | | | | | | | | | | | | | | | | | | | | | | |
| Uses | | $ | (1,515 | ) | | $ | 83 | | | $ | 193 | �� | | $ | — | | | $ | — | | | $ | — | | | $ | 2 | | | $ | 312 | | | $ | (925 | ) | | Net cash provided byinvesting activities |
| | | | | | | | | | | | | | | | | | | | | | | | | | | | | | | | | | | | | | | |
| | | | | | | | | | | | | | | | | | | | | | | | | | | | | |
Cash flow | | $ | (620 | ) | | $ | — | | | $ | — | | | $ | 325 | | | $ | 16 | | | $ | 32 | | | $ | 2 | | | $ | 312 | | | $ | 67 | | | Cash flow fromoperating and investing activities |
| | | | | | | | | | | | | | | | | | | | | | | | | | | | | | | | | | | | | | | |
Financing | | | | | | | | | | | | | | | | | | | | | | | | | | | | | | | | | | | | | | |
| New Issues | | $ | 590 | | | $ | — | | | $ | — | | | $ | (325 | ) | | | | | | $ | — | | | $ | (2 | ) | | $ | — | | | $ | 263 | | | |
| Retirements | | | (505 | ) | | | — | | | | — | | | | — | | | | (16 | ) | | | (32 | ) | | | | | | | (312 | ) | | | (865 | ) | | |
| Net short-term financing | | | 380 | | | | — | | | | — | | | | — | | | | — | | | | — | | | | — | | | | — | | | | 380 | | | |
| | | | | | | | | | | | | | | | | | | | | | | | | | | | | |
| Financing | | $ | 465 | | | $ | — | | | $ | — | | | $ | (325 | ) | | $ | (16 | ) | | $ | (32 | ) | | $ | (2 | ) | | $ | (312 | ) | | $ | (222 | ) | | Net cash provided byfinancing activities |
| |
Net change in cash | | $ | (155 | ) | | $ | | | | $ | — | | | $ | — | | | $ | — | | | $ | — | | | $ | — | | | $ | — | | | $ | (155 | ) | | Net change in cash |
| | | | | | | | | | | | | | | | | | | | | | | | | | | | | |
| |
Cash at year end 2008 | | $ | 40 | | | $ | — | | | $ | — | | | $ | — | | | $ | — | | | $ | — | | | $ | — | | | $ | — | | | $ | 40 | | | Cash at year end 2008 |
| | | | | | | | | | | | | | | | | | | | | | | | | | | | | |
A-8
CMS Energy Parent
2008 Cash Flow GAAP Reconciliation (in millions)
| | | | | | | | | | | | | | | | | | | | | | | | | | | | | | | | | | | | | |
| | | | | | | Reclassifications From Sources and Uses to Statement of Cash Flows | | | | |
| Presentation Sources and Uses | | | Interest | | | Overheads & | | | DIG | | | Other | | | Preferred | | | Cash From | | | Consolidated Statements of Cash Flows | |
| | | non-GAAP | | | Payments | | | Tax Payments | | | Settlement | | | Uses (a) | | | Dividends | | | Consolidated | | | GAAP | | | | |
| Description | | Amount | | | as Operating | | | as Operating | | | as Operating | | | as Operating | | | as Financing | | | Companies | | | Amount | | | Description | |
| Cash at year end 2007 | | $ | 136 | | | $ | — | | | $ | — | | | $ | — | | | $ | — | | | $ | — | | | $ | 17 | | | $ | 153 | | | Cash at year end 2007 |
| | | | | | | | | | | | | | | | | | | | | | | | | | | | | | | | | | | | | |
Sources | | | | | | | | | | | | | | | | | | | | | | | | | | | | | | | | | | | | |
| Consumers Energy dividends/tax sharing | | $ | 395 | | | $ | (124 | ) | | $ | (25 | ) | | $ | — | | | $ | — | | | $ | — | | | $ | — | | | $ | 246 | | | | | |
| Enterprises | | | 15 | | | | — | | | | — | | | | (275 | ) | | | 10 | | | | — | | | | — | | | | (250 | ) | | |
| | | | | | | | | | | | | | | | | | | | | | | | | | | | |
| Sources | | $ | 410 | | | $ | (124 | ) | | $ | (25 | ) | | $ | (275 | ) | | $ | 10 | | | $ | — | | | $ | — | | | $ | (4 | ) | | Net cash provided by operating activities |
| | | | | | | | | | | | | | | | | | | | | | | | | | | | | | | | | | | | | |
Uses | | | | | | | | | | | | | | | | | | | | | | | | | | | | | | | | | | | | |
| Interest and preferred dividends | | $ | (135 | ) | | $ | 124 | | | $ | — | | | $ | — | | | $ | — | | | $ | 11 | | | $ | — | | | $ | — | | | | | |
| Overhead and Federal tax payments | | | (25 | ) | | | — | | | | 25 | | | | — | | | | — | | | | — | | | | — | | | | — | | | | | |
| DIG settlement | | | (275 | ) | | | — | | | | — | | | | 275 | | | | (10 | ) | | | — | | | | (53 | ) | | | (63 | ) | | |
| | | | | | | | | | | | | | | | | | | | | | | | | | | | | |
| Uses (a) | | $ | (425 | ) | | $ | 124 | | | $ | 25 | | | $ | 275 | | | $ | (10 | ) | | $ | 11 | | | $ | (53 | ) | | $ | (53 | ) | | Net cash provided by investing activities |
| | | | | | | | | | | | | | | | | | | | | | | | | | | | | | | | | | | | | |
| | | | | | | | | | | | | | | | | | | | | | | | | | | | |
Cash flow | | $ | (15 | ) | | $ | — | | | $ | — | | | $ | — | | | $ | — | | | $ | 11 | | | $ | (53 | ) | | $ | (57 | ) | | Cash flow from operating and investing activities |
| | | | | | | | | | | | | | | | | | | | | | | | | | | | | | | | | | | | | |
Financing and dividends | | | | | | | | | | | | | | | | | | | | | | | | | | | | | | | | | | | | |
| New Issues | | $ | 10 | | | $ | — | | | $ | — | | | $ | — | | | $ | — | | | $ | (11 | ) | | $ | 53 | | | $ | 52 | | | | | |
| Retirements | | | (150 | ) | | | — | | | | — | | | | — | | | | — | | | | — | | | | — | | | | (150 | ) | | | | |
| Net short-term financing | | | 150 | | | | — | | | | — | | | | — | | | | — | | | | — | | | | — | | | | 150 | | | | | |
| Common dividend | | | (80 | ) | | | — | | | | — | | | | — | | | | — | | | | — | | | | — | | | | (80 | ) | | |
| | | | | | | | | | | | | | | | | | | | | | | | | | | | | |
| Financing | | $ | (70 | ) | | $ | — | | | $ | — | | | $ | — | | | $ | — | | | $ | (11 | ) | | $ | 53 | | | $ | (28 | ) | | Net cash provided by financing activities |
| | | | | | | | | | | | | | | | | | | | | | | | | | | | | | | | | | | |
| | | | | | | | | | | | | | | | | | | | | | | | | | | | | |
Net change in cash | | $ | (85 | ) | | $ | — | | | $ | — | | | $ | — | | | $ | — | | | $ | — | | | $ | — | | | $ | (85 | ) | | Net change in cash |
| | | | | | | | | | | | | | | | | | | | | | | | | | | | | |
| |
Cash at year end 2008 | | $ | 51 | | | $ | — | | | $ | — | | | $ | — | | | $ | — | | | $ | — | | | $ | 17 | | | $ | 68 | | | Cash at year end 2008 |
| | | | | | | | | | | | | | | | | | | | | | | | | | | | |
A-9
Consolidated CMS Energy
2008 Consolidation of Consumers Energy and CMS Energy Parent Statements of Cash Flow (in millions)
| | | | | | | | | | | | | | | | | | | | | | | | | |
| | | | | | | | | | | Eliminations/Reclassifications to Arrive at the | | | | |
| | | | | | | | | | | Consolidated Statement of Cash Flows | | | | |
| Statements of Cash Flows | | | Consumers | | | Equity | | | | |
| | | Consumers | | | CMS Parent | | | Common Dividend | | | Infusions to | | | Consolidated Statements of Cash Flows |
| Description | | Amount | | | Amount | | | as Financing | | | Consumers | | | Amount | | | Description |
Cash at year end 2007 | | $ | 195 | | | $ | 153 | | | $ | — | | | $ | — | | | $ | 348 | | | Cash at year end 2007 |
| | | | | | | | | | | | | | | | | | | | | | | | | |
Net cash provided by operating activities | | $ | 992 | | | $ | (4 | ) | | $ | (312 | ) | | $ | — | | | $ | 676 | | | Net cash provided by operating activities |
| | | | | | | | | | | | | | | | | | | | | | | | | |
Net cash provided by investing activities | | | (925 | ) | | | (53 | ) | | | — | | | | — | | | | (978 | ) | | Net cash provided by investing activities |
| | | | | | | | | | | | | | | | | | | | |
| | | | | | | | | | | | | | | | | | | | | | | | | |
Cash flow from operating and investing activities | | $ | 67 | | | $ | (57 | ) | | $ | (312 | ) | | $ | — | | | $ | (302 | ) | | Cash flow from operating and investing activities |
| | | | | | | | | | | | | | | | | | | | | | | | | |
Net cash provided by financing activities | | $ | (222 | ) | | $ | (28 | ) | | $ | 312 | | | $ | — | | | $ | 62 | | | Net cash provided by financing activities |
| | | | | | | | | | | | | | | | | | | | | | | | | |
| | | | | | | | | | | | | | | | | | | | |
Net change in cash | | $ | (155 | ) | | $ | (85 | ) | | $ | — | | | $ | — | | | $ | (240 | ) | | Net change in cash |
| | | | | | | | | | | | | | | | | | | | |
| |
Cash at year end 2008 | | $ | 40 | | | $ | 68 | | | $ | — | | | $ | — | | | $ | 108 | | | Cash at year end 2008 |
| | | | | | | | | | | | | | | | | | | | |
A-10


