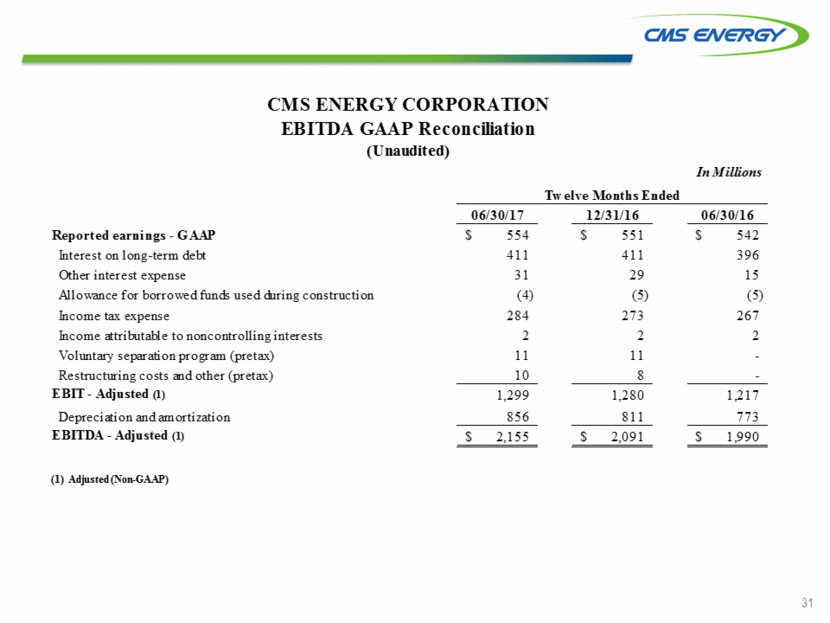
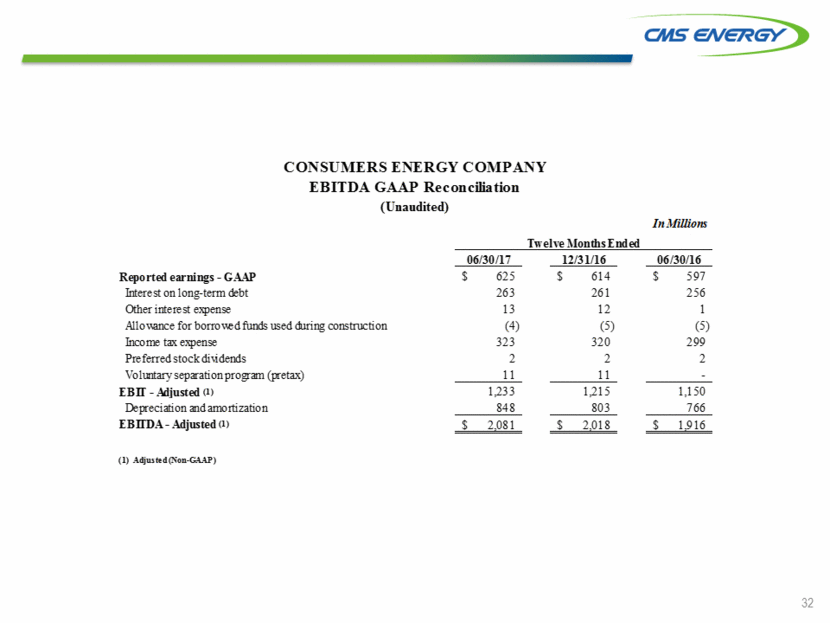
31 In Millions Twelve Months Ended 03/31/17 12/31/16 03/31/16 EBIT (1) Adjusted Non-GAAP Consolidated $ 1,339 $ 1,280 $ 1,133 Consumers Energy 1,274 1,215 1,077 Depreciation/Amortization Consolidated $ 835 $ 811 $ 766 Consumers Energy 826 803 761 EBITDA (1) Adjusted Non-GAAP Consolidated $ 2,174 $ 2,091 $ 1,899 Consumers Energy 2,100 2,018 1,838 Dividends and Other Distributions From Subsidiaries $ 492 $ 499 $ 532 Interest Expense, Net Consolidated $ 436 $ 435 $ 401 Energy Parent 149 150 136 Consumers Energy 269 268 252 As of 03/31/17 12/31/16 03/31/16 Book Value Per Share $ 15.61 $ 15.23 $ 14.72 Shares Outstanding - End of Period 280.0 279.2 279.2 Shares Outstanding - Year-to-Date Average Basic 278.9 277.9 276.7 Diluted 279.9 278.9 277.9 Debt Energy Parent debt (2) $ 3,026 $ 2,678 $ 2,606 CMS Capital debt (2) (3) 1,169 1,198 1,111 Consumers Energy debt (excluding securitization bonds) (2) 5,522 5,830 5,164 Consolidated (excluding securitization bonds) 9,717 9,706 8,881 Securitization Bonds 328 328 353 Consolidated $ 10,045 $ 10,034 $ 9,234 Unrestricted Cash & Cash Equivalents Consumers Energy $ 182 $ 131 $ 27 CMS Treasury Services 170 43 87 Other 81 61 63 Consolidated $ 433 $ 235 $ 177 Consumers Energy Common Equity Ratio - Ratemaking (Average) Electric 41.0% 41.4% Gas 40.9% 41.3% Rate Base (Average) Electric $ 10,184 $ 9,739 Gas 4,024 3,682 Return on Average Common Equity - Financial Electric (4) 11.2% 11.2% Gas (4) 9.4% 7.2% Return on Rate Base Electric 6.6% 6.3% Gas 5.9% 5.2% (1) EBIT equals Net Income+Accounting Change+Discontinued Operations+Noncontrolling Interests+Income Taxes+Interest Charges+Writedown+Losses-Gains on Asset Sales. EBITDA equals EBIT + Depreciation/Amortization (2) Includes current maturities, leases and notes payable (3) Includes EnerBank certificates of deposit (4) Weather normal ROE's are Electric %, Gas %
