Investor Meetings
May 2012
Foote Hydro 1918
Zeeland 2007
Lake Winds 2012
|
 |
This presentation is made as of the date hereof and contains “forward - looking statements” as defined in Rule 3b- 6 of the Securities Exchange Act of 1934, as amended, Rule 175 of the Securities Act of 1933, as amended, and relevant legal decisions. The forward - looking statements are subject to risks and uncertainties. They should be read in conjunction with “FORWARD - LOOKING STATEMENTS AND INFORMATION “ and “RISK FACTORS “ sections of CMS Energy’s and Consumers Energy’s Form 10- K for the year ended December 31 and as updated in subsequent 10- Qs. CMS Energy’s and Consumers Energy’s “FORWARD - LOOKING STATEMENTS AND INFORMATION” and “RISK FACTORS” sections are incorporated herein by reference and discuss important factors that could cause CMS Energy’s and Consumers Energy’s results to differ materially from those anticipated in such statements. CMS Energy and Consumers Energy undertake no obligation to update any of the information presented herein to reflect facts, events or circumstances after the date hereof.
The presentation also includes non- GAAP measures when describing CMS Energy’s results of operations and financial performance A reconciliation of each of these measures to the most directly comparable GAAP measure is included in the appendix and posted on our website . at www.cmsenergy. com
CMS Energy provides financial results on both a reported (Generally Accepted Accounting Principles) and adjusted (non- GAAP) basis. Management views adjusted earnings as a key measure of the company’s present operating financial performance, unaffected by discontinued operations, asset sales, impairments, regulatory items from prior years, or other items. Certain of these items have the potential to impact, favorably or unfavorably, the company’s reported earnings in 2012. The company is not able to estimate the impact of these matters and is not providing reported earnings guidance.
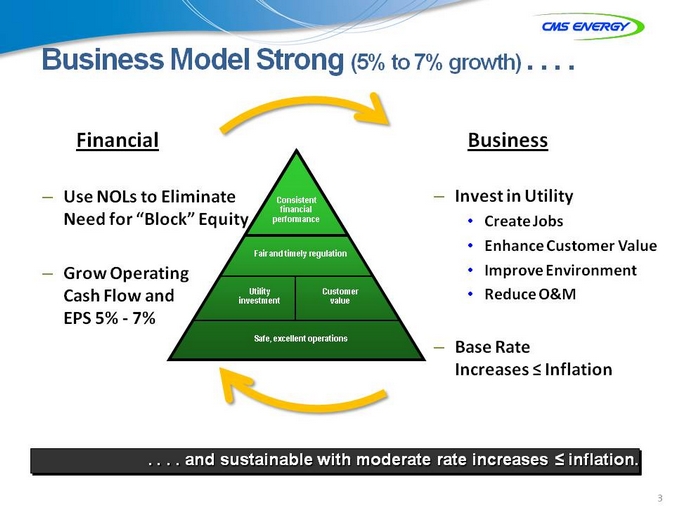
Business Model Strong (5% to 7% growth) . . . .
Financial
Use NOLs to Eliminate Need for “Block” Equity
Grow Operating Cash Flow and EPS 5% ? 7%
Consistent financial performance
Fair and timely regulation
Utility Customer investment value
Safe, excellent operations
Business
Invest in Utility
Create Jobs
Enhance Customer Value Improve Environment Reduce O&M
Base Rate Increases Inflation
. . . . and sustainable with moderate rate increases inflation.
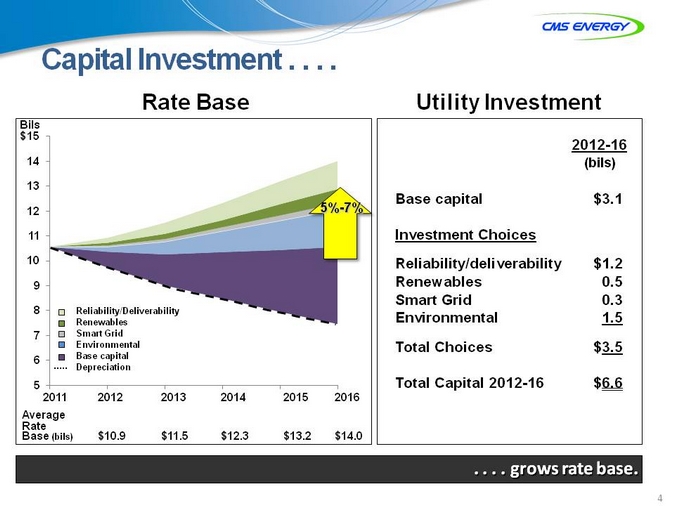
Capital Investment . . . .
Rate Base
Bils
$15 14 13 12 11 10 9 8 7 6 5
Reliability/Deliverability Renewables
Smart Grid Environmental Base capital Depreciation
2011 2012 2013 2014 2015 2016
Average Rate
Base (bils) $10.9 $11.5 $12.3 $13.2 $14.0
Utility Investment
2012-16
(bils)
Base capital $3.1
Investment Choices
Reliability/deliverability $1.2
Renewables 0.5
Smart Grid 0.3
Environmental 1.5
Total Choices $3.5
Total Capital 2012-16 $6.6
. . . . grows rows rate base.
5%-7%
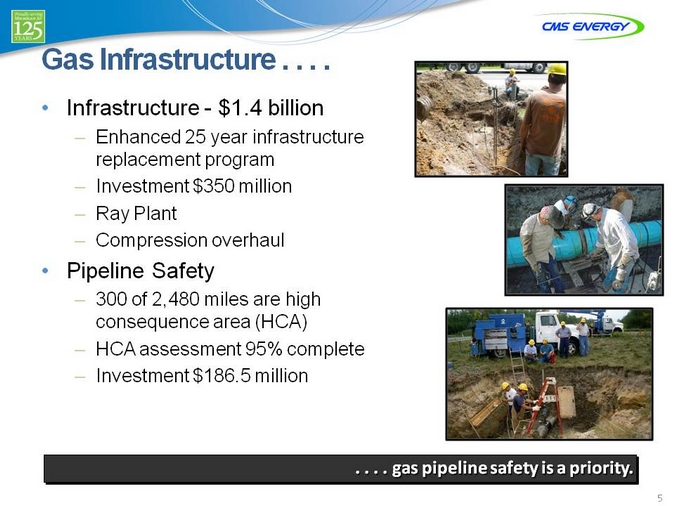
Gas Infrastructure . . . .
Infrastructure—$1.4 billion
Enhanced 25 year infrastructure replacement program Investment $350 million
Ray Plant
Compression overhaul
Pipeline Safety
300 of 2,480 miles are high consequence area (HCA) HCA assessment 95% complete Investment $186.5 million
. . . . gas pipeline safety is a priority.
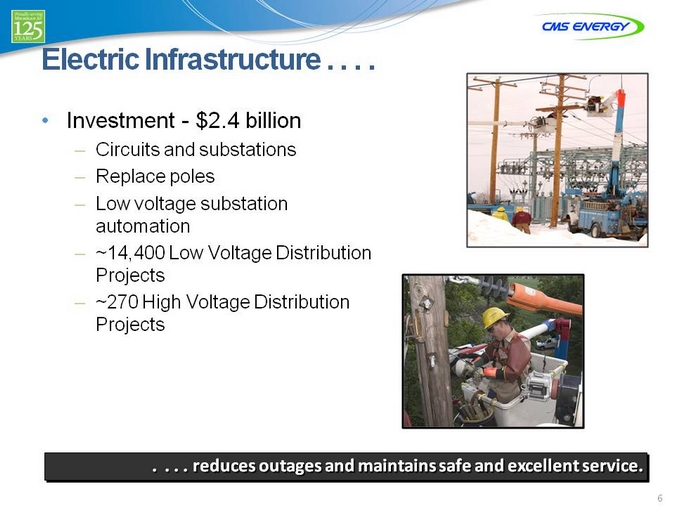
Electric Infrastructure . . . .
Investment—$2.4 billion
Circuits and substations Replace poles Low voltage substation automation
~14,400 Low Voltage Distribution Projects ~270 High Voltage Distribution Projects
. . . . reduces outages and maintains safe and excellent service.
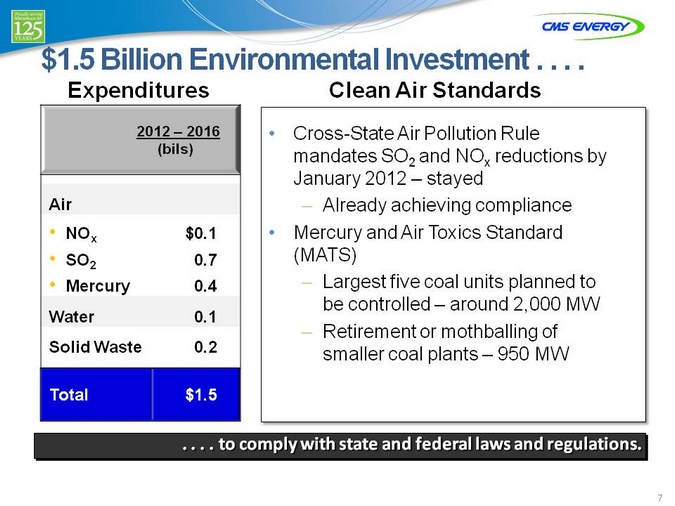
$1.5 Billion Environmental Investment . . . .
Expenditures
2012 – 2016 (bils)
Air
NOx $0.1 SO2 0.7 Mercury 0.4
Water 0.1 Solid Waste 0.2
Total $1.5
Clean Air Standards
Cross-State Air Pollution Rule mandates SO2 and NOx reductions by January 2012 – stayed
Already achieving compliance
Mercury and Air Toxics Standard (MATS)
Largest five coal units planned to be controlled – around 2,000 MW Retirement or mothballing of smaller coal plants – 950 MW
. . . . to comply with state and federal laws and regulations.
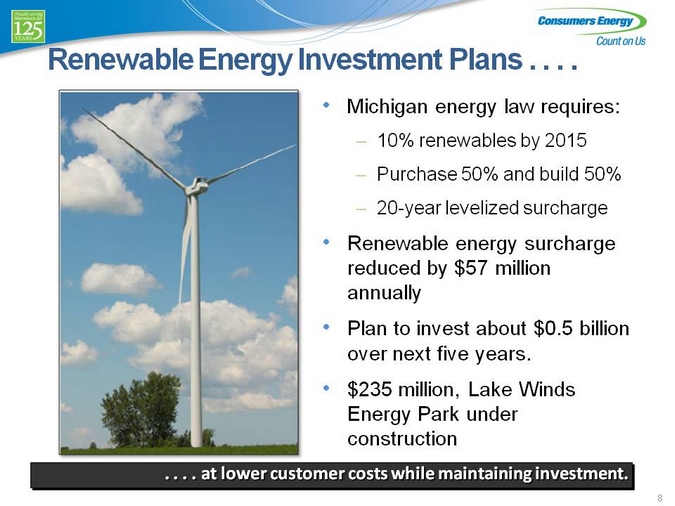
Renewable Energy Investment Plans . . . .
Michigan energy law requires:
10% renewables by 2015
Purchase 50% and build 50% 20-year levelized surcharge
Renewable energy surcharge reduced by $57 million annually Plan to invest about $0.5 billion over next five years. $235 million, Lake Winds Energy Park under construction
. . . . at lower customer costs while maintaining investment.
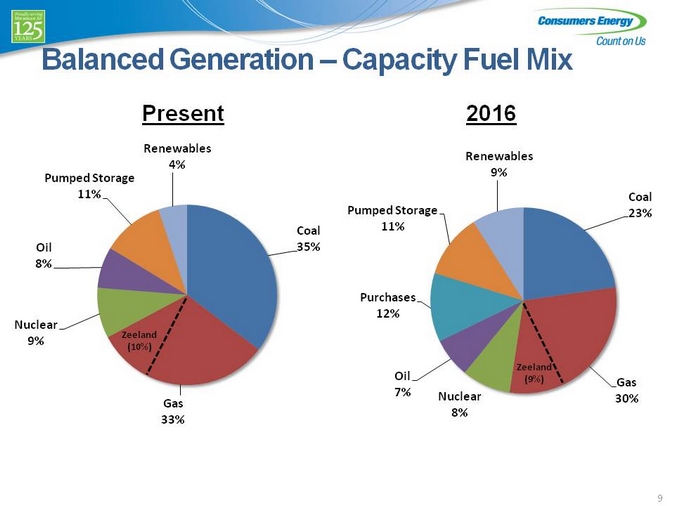
Balanced Generation – Capacity Fuel Mix
Present
Renewables 4%
Coal 35%
Gas 33%
Nuclear 9%
Oil 8%
Pumped Storage
11%
2016
Renewables 9%
Coal 23%
Gas 30%
Zeeland (10%)
Nuclear 8%
Oil 7%
Purchases 12%
Pumped Storage
11%
Zeeland (9%)
9
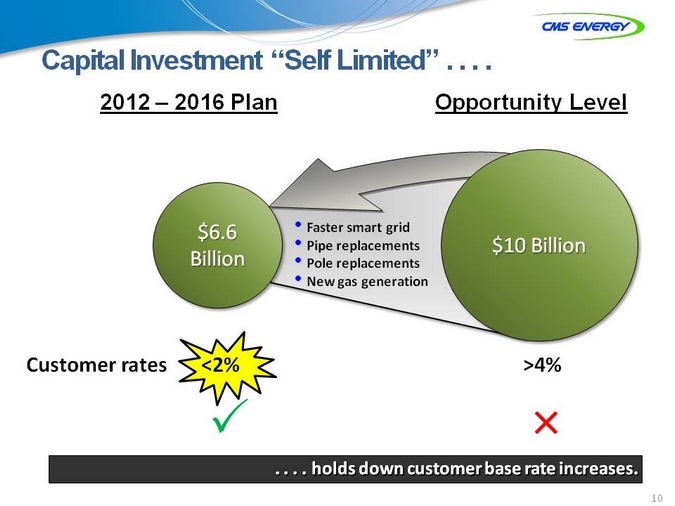
Capital Investment “Self Limited” . . . .
2012 – 2016 Plan
$6.6 Billion
Customer rates
<2%
Faster smart grid Pipe replacements Pole replacements New gas generation
$10 Billion
>4%
. . . . holds down customer base rate increases.
olds
Opportunity Level
10
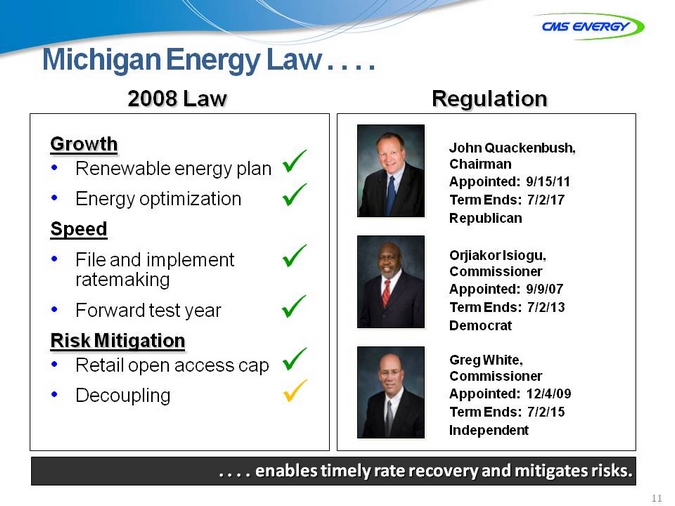
Michigan Energy Law . . . .
2008 Law
Growth
Renewable energy plan Energy optimization
Speed
File and implement ratemaking Forward test year
Risk Mitigation
Retail open access cap Decoupling
Regulation
John Quackenbush, Chairman Appointed: 9/15/11 Term Ends: 7/2/17 Republican
Orjiakor Isiogu, Commissioner Appointed: 9/9/07 Term Ends: 7/2/13 Democrat
Greg White, Commissioner Appointed: 12/4/09 Term Ends: 7/2/15 Independent
. . . . enables timely rate recovery and mitigates risks.
11
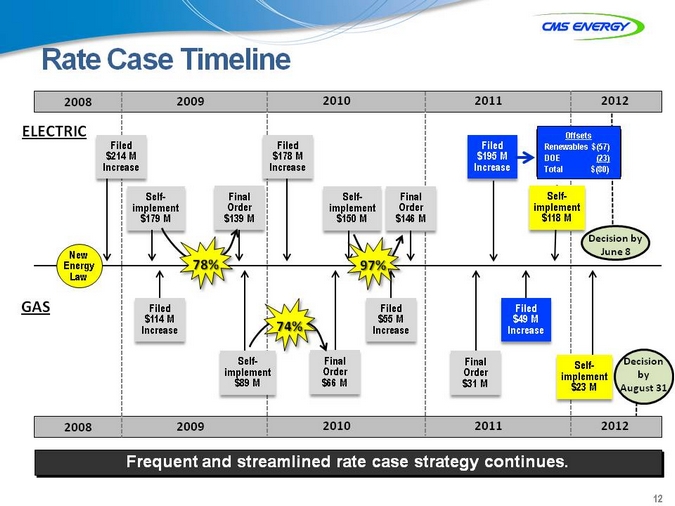
Rate Case Timeline
2008 2009 2010 2011 2012
ELECTRIC
$214 MFiled Increase
Energy New Law
GAS
2008
implement Self- $179 M
$114 MFiled Increase
78%
Order Final $139 M
$178 MFiled Increase
implement Self- $89 M
2009
74%
implement Self-$150 M
97%
Order Final $66 M
$55 MFiled Increase
Order Final $146 M
$195 MFiled Increase
Order Final $31 M
$49 MFiled Increase
Offsets
Renewables $(57) DOE (23) Total $(80)
implement Self- $118 M
implement Self-$23 M
Decision by June 8
Decision by August 31
Frequent and streamlined rate case strategy continues.
12
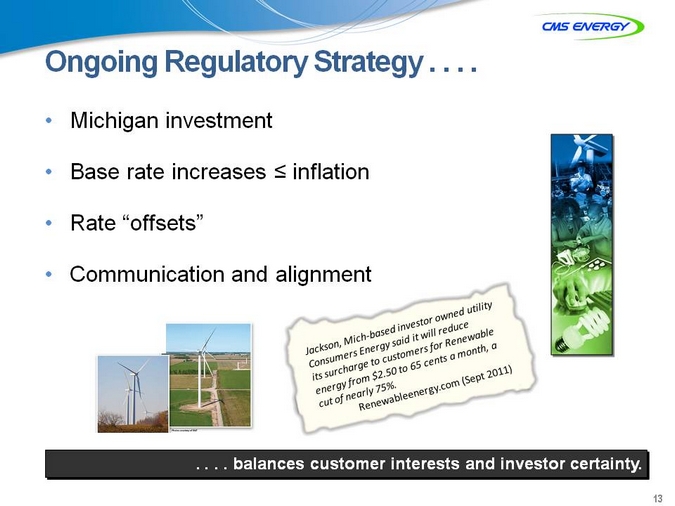
Ongoing Regulatory Strategy . . . .
Michigan investment
Base rate increases inflation Rate “offsets” Communication and alignment
. . . . balances customer interests and investor certainty.
13
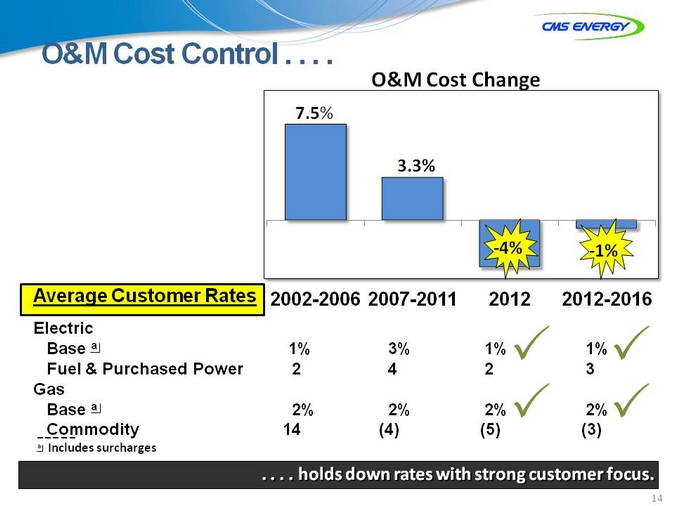
O&M Cost Control . . . .
O&M Cost Change
% 7.5
3.3%
? 4%
? 1%
Average Customer Rates 2002-2006 2007-2011 2012 2012-2016 Electric Base a 1% 3% 1%3 1% 3 Fuel & Purchased Power 2 4 2 3 Gas Base a 2% 2% 2%3 2% 3
Commodity 14 (4) (5) (3)
a Includes surcharges
. . . . holds down rates with strong customer focus.
14
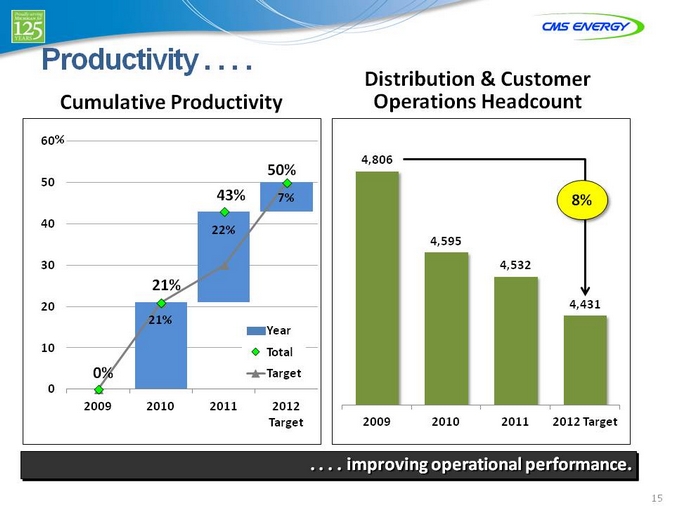
Productivity . . . .
Cumulative Productivity
60% 50 40 30 20 10 0
50% 43% 7%
22%
21%
21% Year Total
0% Target
2009 2010 2011 2012 Target
Distribution & Customer Operations Headcount
4,806
4,595
4,532
4,431
8%
2009 2010 2011 2012 Target
. . . . improving operational performance.
15
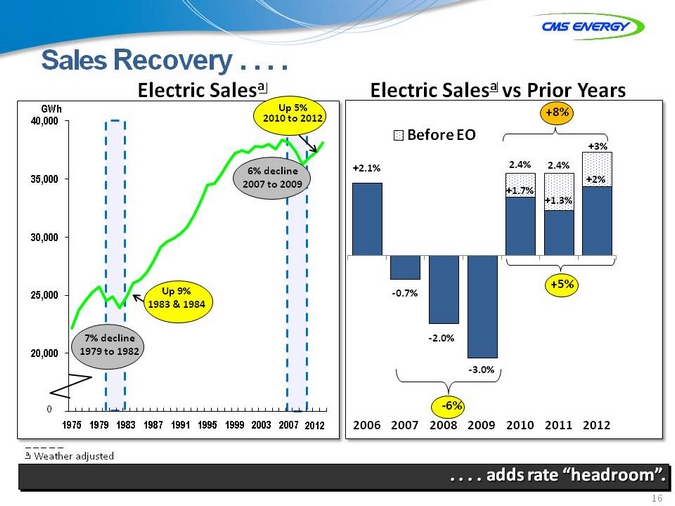
Sales Recovery . . . .
Electric Salesa
Up 5% 2010 to 2012
GWh 40,000
35,000 30,000 25,000 20,000 15,000 0
7% decline 1979 to 1982
Up 9% 1983 & 1984
6% decline 2007 to 2009
1975 1979 1983 1987 1991 1995 1999 2003 2007 2012 2011
a Weather adjusted
Electric Salesa vs Prior Years
+8%
Before EO
+3% +2.1% 2.4% 2.4% +2% +1.7% +1.3%
? 0.7%
? 2.0%
? 3.0%
+5%
? 6%
2006 2007 2008 2009 2010 2011 2012
. . . . adds rate “headroom” .
16
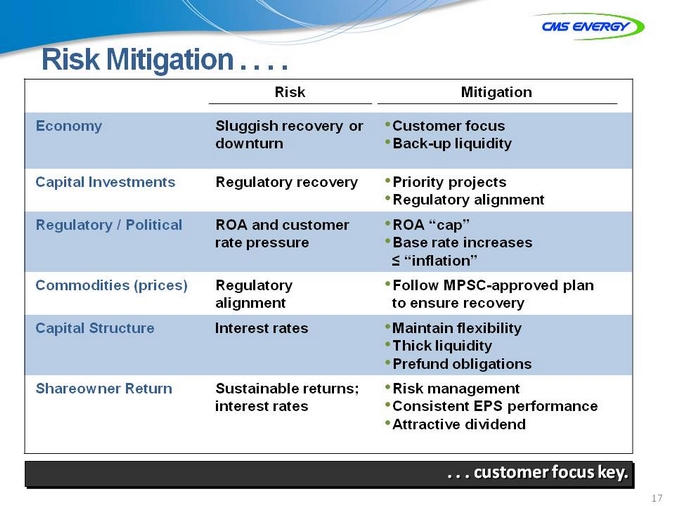
Risk Mitigation . . . .
Risk
Mitigation
Economy Capital Investments Regulatory / Political Commodities (prices) Capital Structure Shareowner Return
Sluggish recovery or downturn
Regulatory recovery
ROA and customer rate pressure
Regulatory alignment Interest rates
Sustainable returns; interest rates
Customer focus Back-up liquidity
Priority projects Regulatory alignment ROA “cap” Base rate increases “inflation”
Follow MPSC-approved plan to ensure recovery Maintain flexibility Thick liquidity Prefund obligations Risk management Consistent EPS performance Attractive dividend
. . . customer focus key.
17
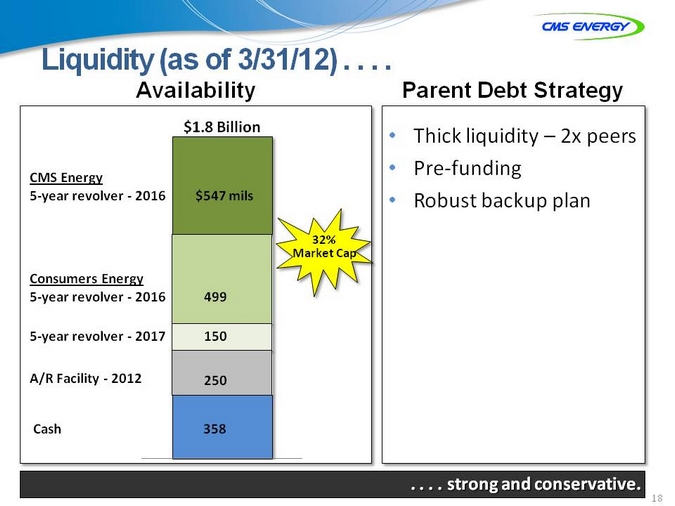
Liquidity (as of 3/31/12) . . . .
Availability
$1.8 Billion
CMS Energy
5- year revolver - 2016
Consumers Energy 5- year revolver - 2016
5- year revolver - 2017 A/R Facility - 2012 Cash
$547 mils
499 150 250 358
32% Market Cap
Parent Debt Strategy
Thick liquidity – 2x peers Pre- funding Robust backup plan
. . . . strong and conservative.
18
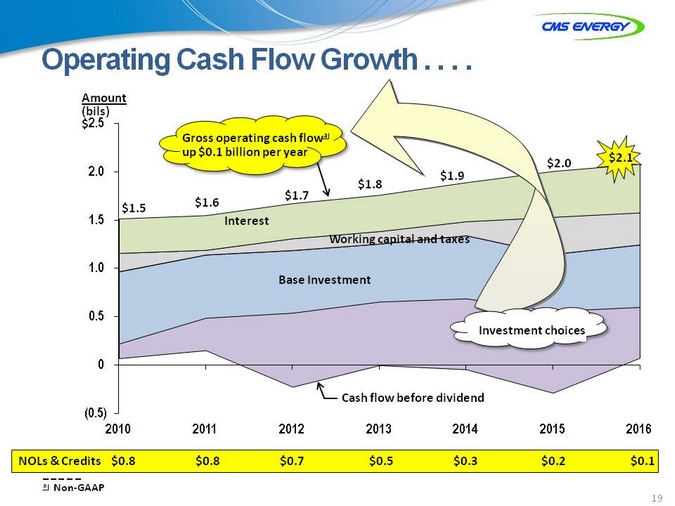
Operating Cash Flow Growth . . . .
Amount (bils)
$2.5 2.0 1.5 1.0 0.5 0.0 (0.5)
Gross operating cash flowa up $0.1 billion per year
$1.9 $1.8 $1.7 $1.6 $1.5
$2.0
$2.1
Interest
Working capital and taxes
Base Investment
Investment choices
Cash flow before dividend
2010 2011 2012 2013 2014 2015 2016
NOLs & Credits $0.8 $0.8 $0.7 $0.5 $0.3 $0.2 $0.1
a Non? GAAP
19
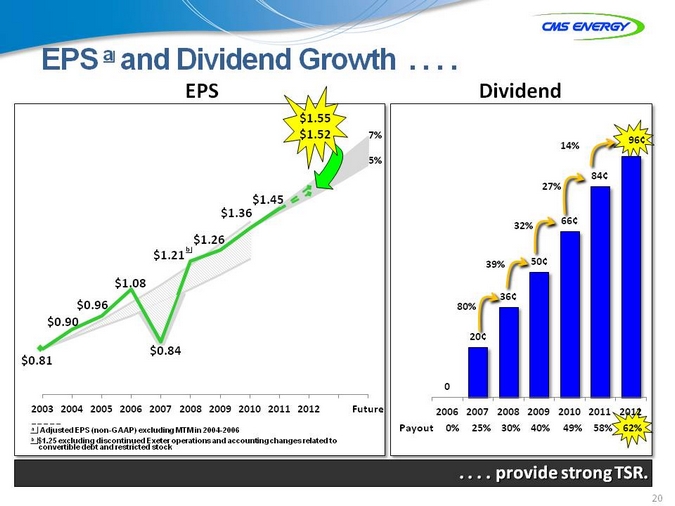
EPS a and Dividend Growth . . . .
EPS
$1.55 $1.52
7%
5%
$1.45 $1.36
$1.26 b $1.21
$1.08 $0.96 $0.90
$0.81 $0.84
2003 2004 2005 2006 2007 2008 2009 2010 2011 2012 Future
a Adjusted EPS (non-GAAP) excluding MTM in 2004-2006 b $1.25 excluding discontinued Exeter operations and accounting changes related to convertible debt and restricted stock
Dividend
96¢
14%
84¢ 27%
66¢ 32%
39% 50¢
36¢ 80%
20¢
0
2006 2007 2008 2009 2010 2011 2012
Payout 0% 25% 30% 40% 49% 58% 62%
. . . . provide strong TSR.
20
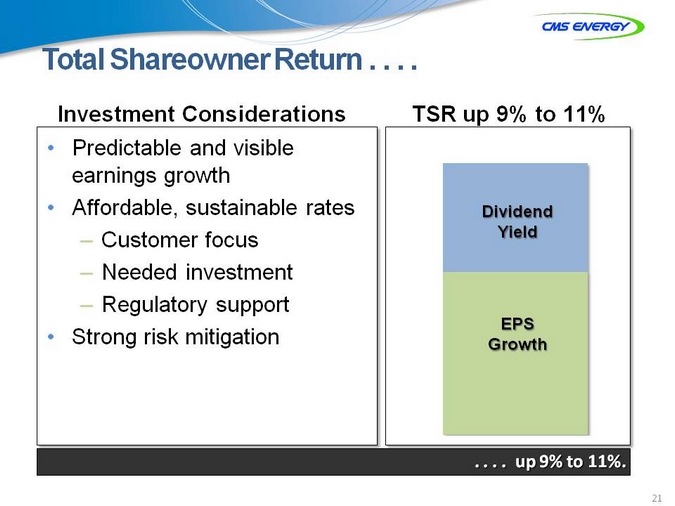
Total Shareowner Return . . . .
Investment Considerations
Predictable and visible earnings growth Affordable , sustainable rates
Customer focus Needed investment Regulatory support
Strong risk mitigation
TSR up 9% to 11%
Dividend Yield
EPS Growth
. . . . up 9% to 11%.
21

APPENDIX
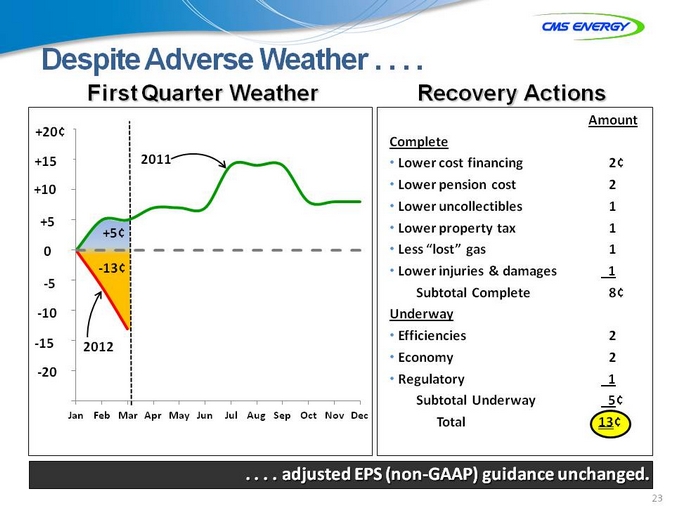
Despite Adverse Weather . . . .
First Quarter Weather
1 | +20¢ .75 +15 .70 +10 .65 |
1+5 .60 1.55 0
1.50 ? 5 1.45 ? 10 ? 115 .40 1.35 ? 20
2011
+5¢
? 13¢
2012
Jan Feb Mar Apr May Jun Jul Aug Sep Oct Nov Dec
Recovery Actions
Amount Complete
Lower cost financing 2¢ Lower pension cost 2 Lower uncollectibles 1 Lower property tax 1 Less “lost” gas 1 Lower injuries & damages 1 Subtotal Complete 8¢
Underway
Efficiencies 2 Economy 2 Regulatory 1
Subtotal Underway 5¢
Total 13¢
. . . . adjusted EPS (non? GAAP) guidance unchanged.
23
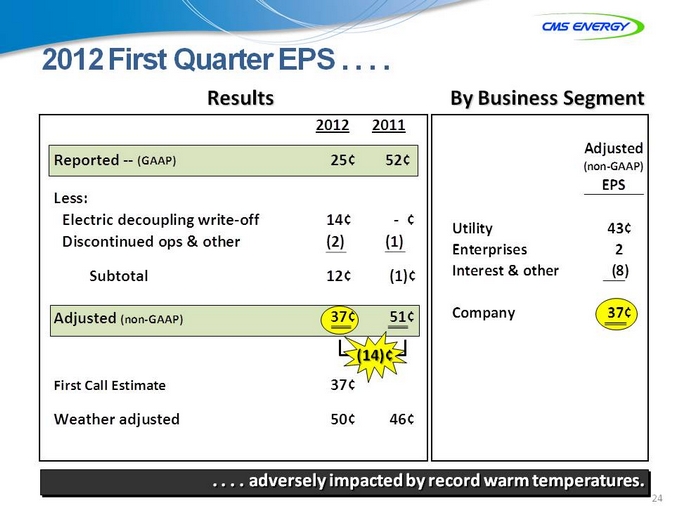
2012 First Quarter EPS . . . .
Results
2012 2011
Reported ?? (GAAP) 25¢ 52¢
Less:
Electric decoupling write? off 14¢ ¢ Discontinued ops & other (2) (1)
Subtotal 12¢ (1)¢
Adjusted (non? GAAP) 37¢ 51¢ (14)¢ First Call Estimate 37¢ Weather adjusted 50¢ 46¢
By Business Segment
Adjusted
(non? GAAP)
EPS
?
Utility 43¢ Enterprises 2 Interest & other (8)
Company 37¢
. . . . adversely impacted by record warm temperatures.
24
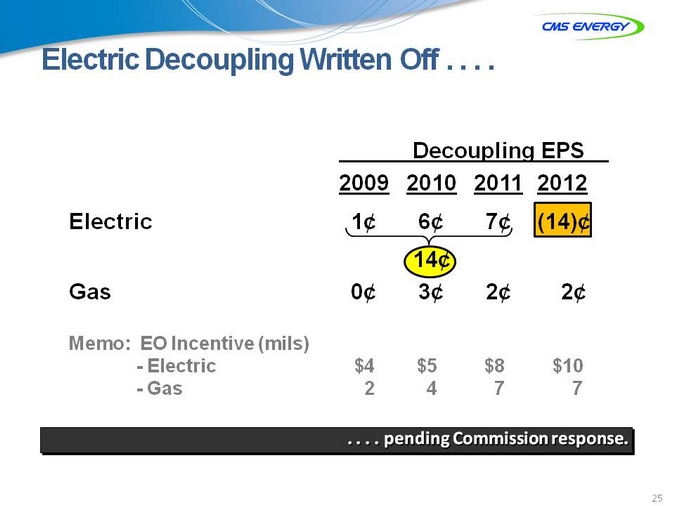
Electric Decoupling Written Off . . . .
Decoupling EPS 2009 2010 2011 2012 Electric 1¢ 6¢ 7¢ (14)¢ 14¢ Gas 0¢ 3¢ 2¢ 2¢
Memo: EO Incentive (mils)
- Electric $4 $5 $8 $10
- Gas 2 4 7 7
. . . . pending Commission response.
25
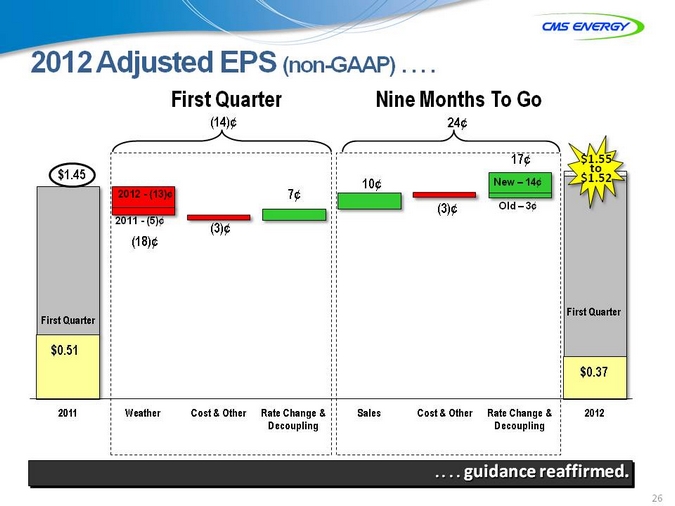
2012 Adjusted EPS (non-GAAP) . . . .
First Quarter
$1.45
2012—(13)¢ 7¢
2011—(5)¢
First Quarter
$0.51
2011 Weather Cost & Other Rate Change & Decoupling
Nine Months To Go
24¢
17¢
10¢ New – 14¢ (3)¢ Old – 3¢
$1.55 to $1.52
First Quarter
$0.37
2012
. . . . guidance reaffirmed.
26
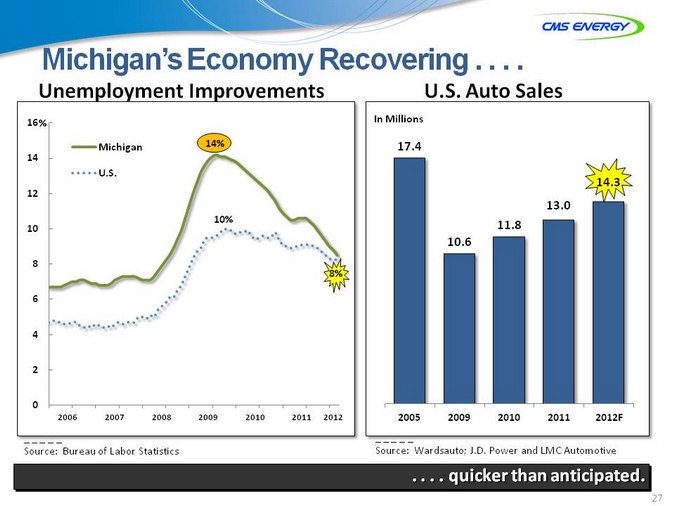
Michigan’s Economy Recovering . . . .
Unemployment Improvements
16%
Michigan 14% 14 U.S.
12
10% 10
8% 6 4 2
0
2006 2007 2008 2009 2010 2011 2012
U.S. Auto Sales
In Millions
17.4
14.3
13.0 11.8 10.6
2005 2009 2010 2011 2012F
Source: Bureau of Labor Statistics
Source: Wardsauto; J.D. Power and LMC Automotive
. . . . quicker than anticipated.
27
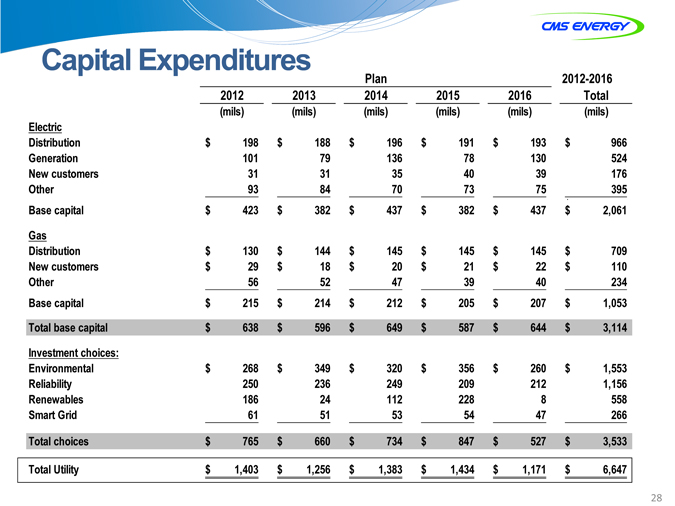
Capital Expenditures
Plan 2012-2016 2012 2013 2014 2015 2016 Total (mils) (mils) (mils) (mils) (mils) (mils) Electric Distribution $ 198 $ 188 $ 196 $ 191 $ 193 $ 966 Generation 101 79 136 78 130 524 New customers 31 31 35 40 39 176 Other 93 84 70 73 75 $ 395 Base capital $ 423 $ 382 $ 437 $ 382 $ 437 $ 2,061 Gas Distribution $ 130 $ 144 $ 145 $ 145 $ 145 $ 709 New customers $ 29 $ 18 $ 20 $ 21 $ 22 $ 110 Other 56 52 47 39 40 234 Base capital $ 215 $ 214 $ 212 $ 205 $ 207 $ 1,053 Total base capital $ 638 $ 596 $ 649 $ 587 $ 644 $ 3,114 Investment choices: Environmental $ 268 $ 349 $ 320 $ 356 $ 260 $ 1,553 Reliability 250 236 249 209 212 1,156 Renewables 186 24 112 228 8 558 Smart Grid 61 51 53 54 47 266
Total choices $ 765 $ 660 $ 734 $ 847 $ 527 $ 3,533
Total Utility $ 1,403 $ 1,256 $ 1,383 $ 1,434 $ 1,171 $ 6,647
28
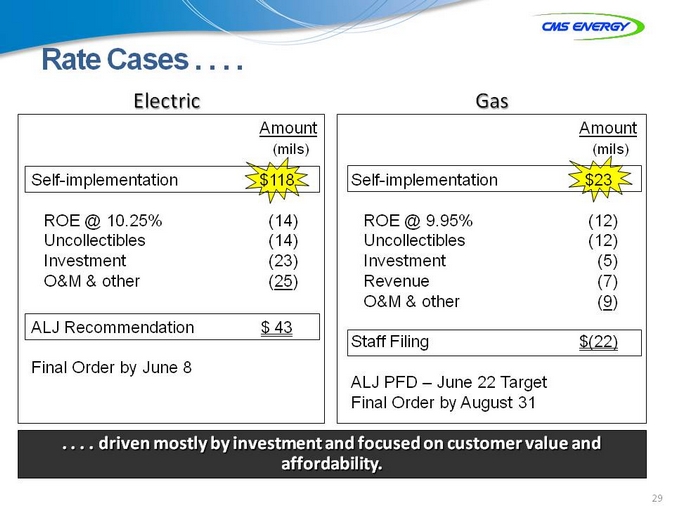
Rate Cases . . . .
Electric
Amount
) (mils
Self-implementation $118
ROE @ 10 25%. (14) Uncollectibles (14) Investment (23) O&M & other (25)
ALJ Recommendation $ 43
Final Order by June 8
Gas
Amount
) (mils
Self-implementation $23
.95% ROE @ 9 (12) Uncollectibles (12) Investment (5) 7 ) Revenue ( O&M & other (9)
Staff Filing $(22)
ALJ PFD – June 22 Target Final Order by August 31
. . . . driven mostly by investment and focused on customer value and affordability.
29
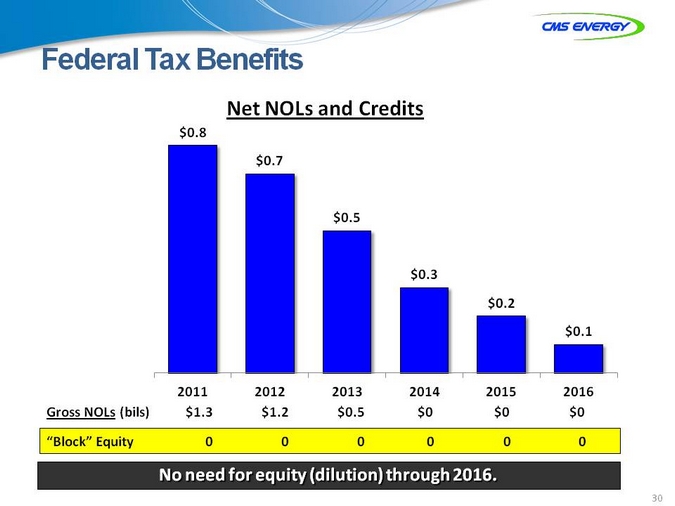
Federal Tax Benefits
Net NOLs and Credits
$0.8
$0.7
$0.5
$0.3
$0.2
$0.1
2011 2012 2013 2014 2015 2016 Gross NOLs (bils) $1.3 $1.2 $0.5 $0 $0 $0
“Block” Equity 0 0 0 0 0 0
No need for equity (dilution) through 2016.
30
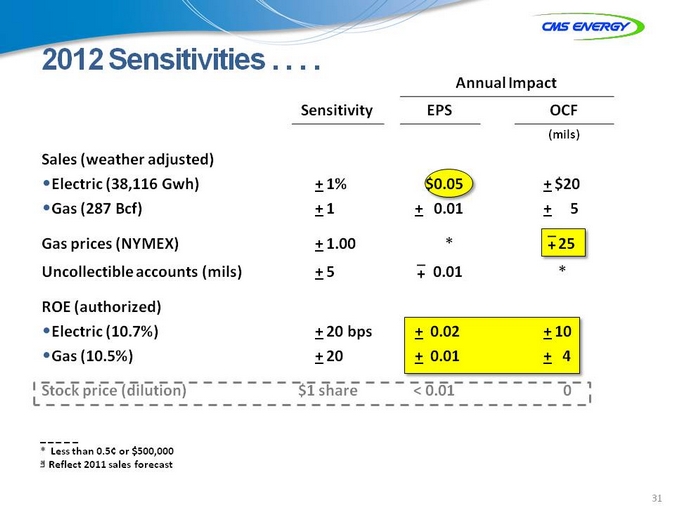
2012 Sensitivities . . . .
Annual Impact Sensitivity EPS OCF
(mils)
Sales (weather adjusted)
•Electric (38,116 Gwh) + 1% $0.05 + $20
•Gas (287 Bcf) + 1 + 0.01 + 5 –Gas prices (NYMEX) + 1.00 * + 25 –Uncollectible accounts (mils) + 5 + 0.01 *
ROE (authorized)
•Electric (10.7%) + 20 bps + 0.02 + 10
•Gas (10.5%) + 20 + 0.01 + 4 Stock price (dilution) $1 share < 0.01 0
* | Less than 0.5¢ or $500,000 a Reflect 2011 sales forecast |
31
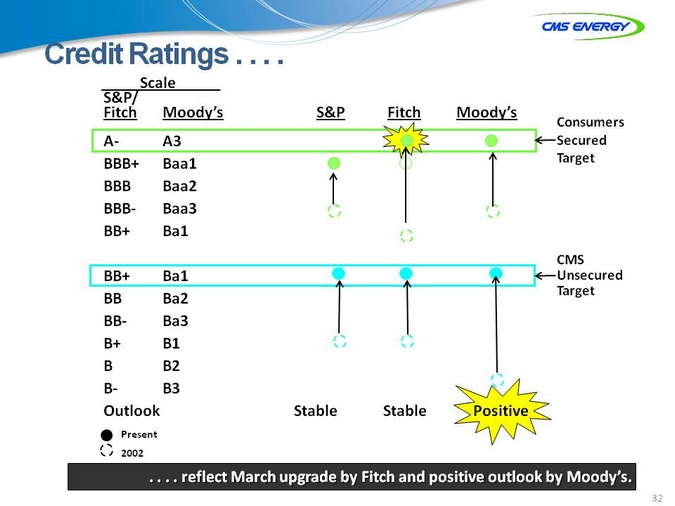
Credit Ratings . . . .
Scale
S&P/
Fitch Moody’s S&P Fitch Moody’s
Consumers A- A3 Secured BBB+ Baa1 Target BBB Baa2 BBB- Baa3 BB+ Ba1
CMS BB+ Ba1 Unsecured Target BB Ba2 BB- Ba3 B+ B1 B B2 B- B3 Outlook Stable Stable Positive
Present 2002
. . . . reflect March upgrade by Fitch and positive outlook by Moody’s.
32
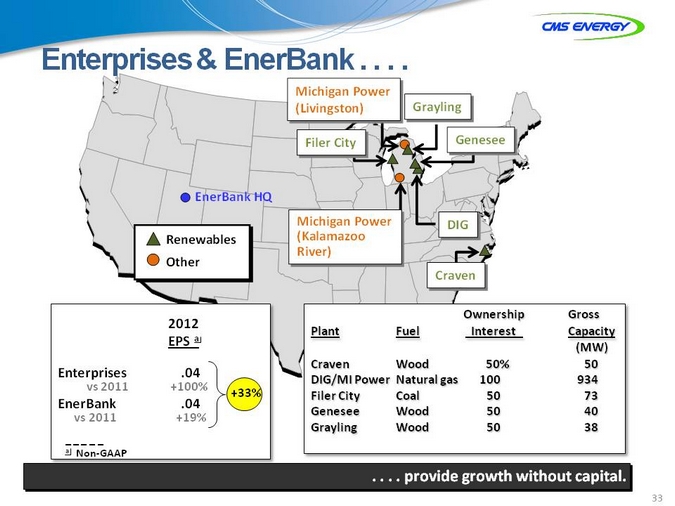
Enterprises & EnerBank . .
Michigan Power (Livingston)
Grayling
Filer City
Genesee
Michigan Power (Kalamazoo River)
EnerBank HQ
Renewables Other
DIG
Craven
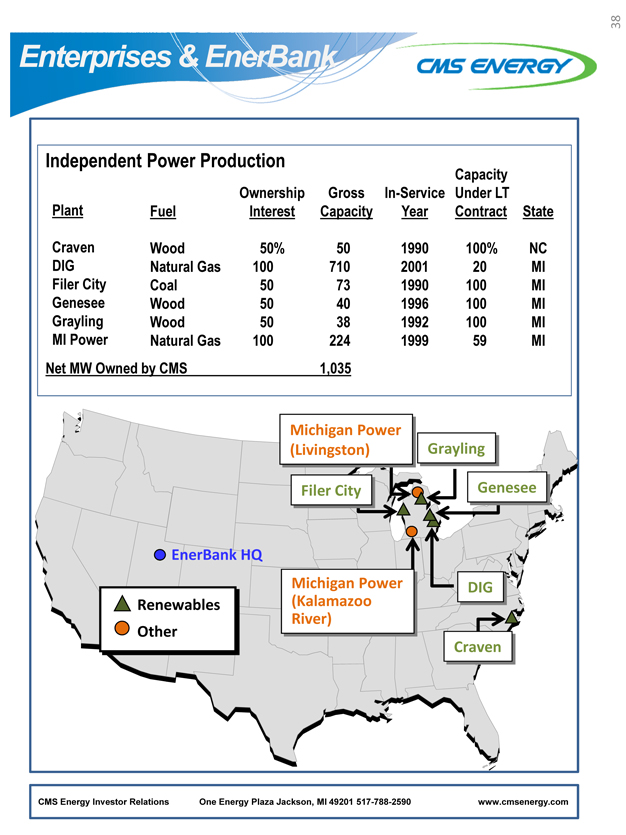
2012 EPS a
Enterprises .04
vs 2011 +100%
EnerBank .04
vs 2011 +19%
+33%
a Non? GAAP
Ownership Gross Plant Fuel Interest Capacity (MW) Craven Wood 50% 50 DIG/MI Power Natural gas 100 934 Filer City Coal 50 73 Genesee Wood 50 40 Grayling Wood 50 38
. . . . provide growth without capital.
33
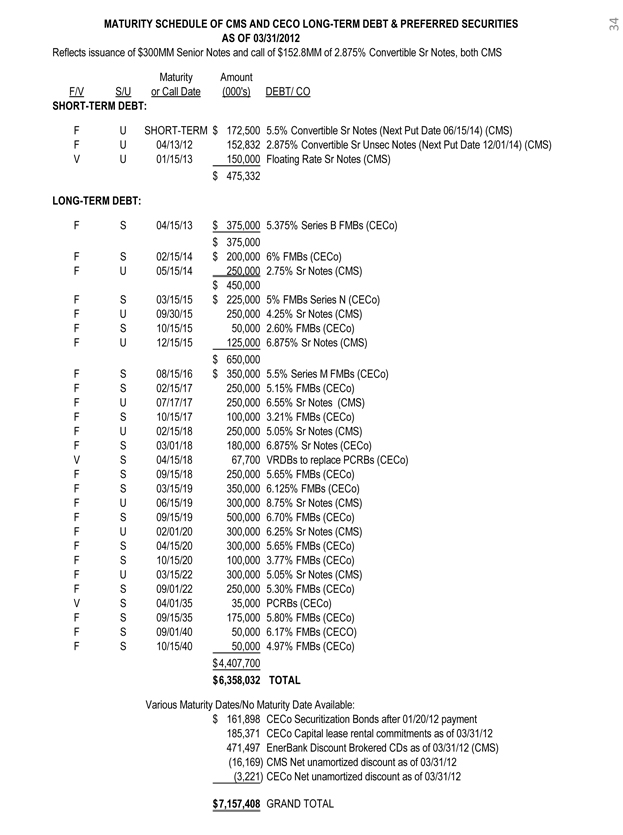
MATURITY SCHEDULE OF CMS AND CECO LONG-TERM DEBT & PREFER RED SECURITIES AS OF 03/31/2012
Reflects issuance of $300MM Senior Notes and call of $152.8MM of 2.875% Convertible Sr Notes, both CMS
Maturity Amount
F/V S/U or Call Date (000’s) DEBT/ CO
SHORT-TERM DEBT:
F U SHORT-TERM $ 172,500 5.5% Convertible Sr Notes (Next Put Date 06/15/14) (CMS)
F U 04/13/12 152,832 2.875% Convertible Sr Unsec Notes (Next Put Date 12/01/14) (CMS)
V U 01/15/13 150,000 Floating Rate Sr Notes (CMS)
$ 475,332
LONG-TERM DEBT:
F S 04/15/13 $ 375,000 5.375% Series B FMBs (CECo)
$ 375,000
F S 02/15/14 $ 200,000 6% FMBs (CECo)
F U 05/15/14 250,000 2.75% Sr Notes (CMS)
$ 450,000
F S 03/15/15 $ 225,000 5% FMBs Series N (CECo)
F U 09/30/15 250,000 4.25% Sr Notes (CMS)
F S 10/15/15 50,000 2.60% FMBs (CECo)
F U 12/15/15 125,000 6.875% Sr Notes (CMS)
$ 650,000
F S 08/15/16 $ 350,000 5.5% Series M FMBs (CECo)
F S 02/15/17 250,000 5.15% FMBs (CECo)
F U 07/17/17 250,000 6.55% Sr Notes (CMS)
F S 10/15/17 100,000 3.21% FMBs (CECo)
F U 02/15/18 250,000 5.05% Sr Notes (CMS)
F S 03/01/18 180,000 6.875% Sr Notes (CECo)
V S 04/15/18 67,700 VRDBs to replace PCRBs (CECo)
F S 09/15/18 250,000 5.65% FMBs (CECo)
F S 03/15/19 350,000 6.125% FMBs (CECo)
F U 06/15/19 300,000 8.75% Sr Notes (CMS)
F S 09/15/19 500,000 6.70% FMBs (CECo)
F U 02/01/20 300,000 6.25% Sr Notes (CMS)
F S 04/15/20 300,000 5.65% FMBs (CECo)
F S 10/15/20 100,000 3.77% FMBs (CECo)
F U 03/15/22 300,000 5.05% Sr Notes (CMS)
F S 09/01/22 250,000 5.30% FMBs (CECo)
V S 04/01/35 35,000 PCRBs (CECo)
F S 09/15/35 175,000 5.80% FMBs (CECo)
F S 09/01/40 50,000 6.17% FMBs (CECO)
F S 10/15/40 50,000 4.97% FMBs (CECo)
$ 4,407,700
$ 6,358,032 TOTAL
Various Maturity Dates/No Maturity Date Available:
$ 161,898 CECo Securitization Bonds after 01/20/12 payment
185,371 CECo Capital lease rental commitments as of 03/31/12
471,497 EnerBank Discount Brokered CDs as of 03/31/12 (CMS)
(16,169) CMS Net unamortized discount as of 03/31/12
(3,221) CECo Net unamortized discount as of 03/31/12
$ 7,157,408 GRAND TOTAL
34
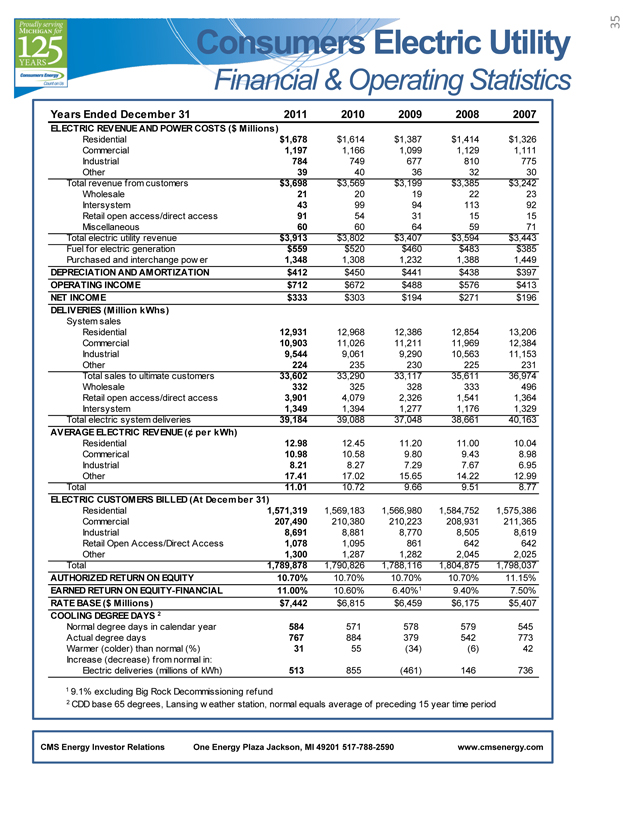
Consumers Electric Utility
Financial & Operating Statistics
35
Years Ended December 31 2011 2010 2009 2008 2007
ELECTRIC REVENUE AND POWER COSTS ($ Millions)
Residential $1,678 $1,614 $1,387 $1,414 $1,326
Commercial 1,197 1,166 1,099 1,129 1,111
Industrial 784 749 677 810 775
Other 39 40 36 32 30
Total revenue from customers $3,698 $3,569 $3,199 $3,385 $3,242
Wholesale 21 20 19 22 23
Intersystem 43 99 94 113 92
Retail open access/direct access 91 54 31 15 15
Miscellaneous 60 60 64 59 71
Total electric utility revenue $3,913 $3,802 $3,407 $3,594 $3,443
Fuel for electric generation $559 $520 $460 $483 $385
Purchased and interchange power 1,348 1,308 1,232 1,388 1,449
DEPRECIATION AND AMORTIZATION $412 $450 $441 $438 $397
OPERATING INCOME $712 $672 $488 $576 $413
NET INCOME $333 $303 $194 $271 $196
DELIVERIES (Million kWhs)
System sales
Residential 12,931 12,968 12,386 12,854 13,206
Commercial 10,903 11,026 11,211 11,969 12,384
Industrial 9,544 9,061 9,290 10,563 11,153
Other 224 235 230 225 231
Total sales to ultimate customers 33,602 33,290 33,117 35,611 36,974
Wholesale 332 325 328 333 496
Retail open access/direct access 3,901 4,079 2,326 1,541 1,364
Intersystem 1,349 1,394 1,277 1,176 1,329
Total electric system deliveries 39,184 39,088 37,048 38,661 40,163
AVERAGE ELECTRIC REVENUE (¢ per kWh)
Residential 12.98 12.45 11.20 11.00 10.04
Commercial 10.98 10.58 9.80 9.43 8.98
Industrial 8.21 8.27 7.29 7.67 6.95
Other 17.41 17.02 15.65 14.22 12.99
Total 11.01 10.72 9.66 9.51 8.77
ELECTRIC CUSTOMERS BILLED (At December 31)
Residential 1,571,319 1,569,183 1,566,980 1,584,752 1,575,386
Commercial 207,490 210,380 210,223 208,931 211,365
Industrial 8,691 8,881 8,770 8,505 8,619
Retail Open Access/Direct Access 1,078 1,095 861 642 642
Other 1,300 1,287 1,282 2,045 2,025
Total 1,789,878 1,790,826 1,788,116 1,804,875 1,798,037
AUTHORIZED RETURN ON EQUITY 10.70% 10.70% 10.70% 10.70% 11.15%
EARNED RETURN ON EQUITY-FINANCIAL 11.00% 10.60% 6.40%1 9.40% 7.50%
RATE BASE ($ Millions) $7,442 $6,815 $6,459 $6,175 $5,407
COOLING DEGREE DAYS 2
Normal degree days in calendar year 584 571 578 579 545
Actual degree days 767 884 379 542 773
Warmer (colder) than normal (%) 31 55 (34) (6) 42
Increase (decrease) from normal in:
Electric deliveries (millions of kWh) 513 855 (461) 146 736
1 | 9.1% excluding Big Rock Decommissioning refund |
2 | CDD base 65 degrees, Lansing weather station, normal equals average of preceding 15 year time period |
CMS Energy Investor Relations One Energy Plaza Jackson, MI 49201 517-788-2590 www.cmsenergy. com
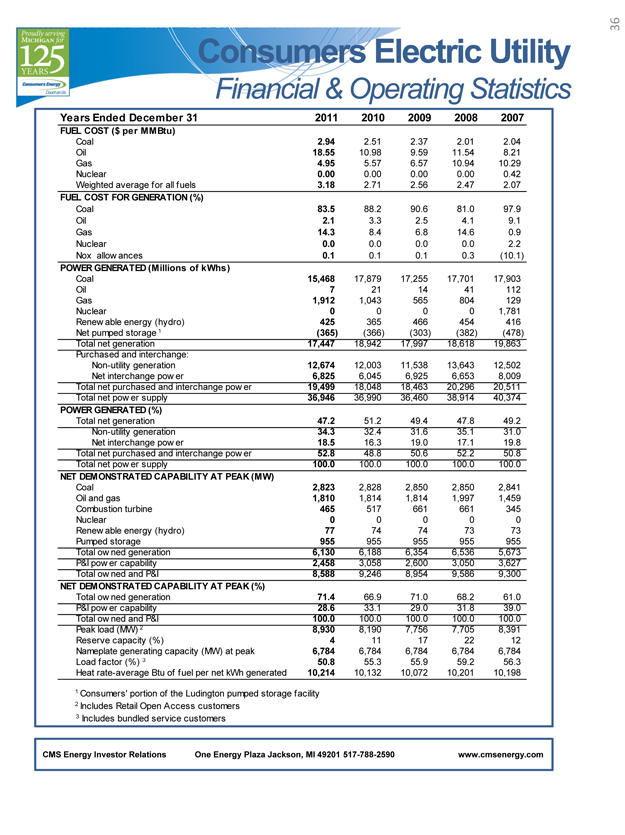
Consumers Electric Utility
Financial & Operating Statistics
36
Years Ended December 31 2011 2010 2009 2008 2007
FUEL COST ($ per MMBtu)
Coal 2.94 2.51 2.37 2.01 2.04
Oil 18.55 10.98 9.59 11.54 8.21
Gas 4.95 5.57 6.57 10.94 10.29
Nuclear 0.00 0.00 0.00 0.00 0.42
Weighted average for all fuels 3.18 2.71 2.56 2.47 2.07
FUEL COST FOR GENERATION (%)
Coal 83.5 88.2 90.6 81.0 97.9
Oil 2.1 3.3 2.5 4.1 9.1
Gas 14.3 8.4 6.8 14.6 0.9
Nuclear 0.0 0.0 0.0 0.0 2.2
Nox allow ances 0.1 0.1 0.1 0.3 (10.1)
POWER GENERATED (Millions of kWhs)
Coal 15,468 17,879 17,255 17,701 17,903
Oil 7 21 14 41 112
Gas 1,912 1,043 565 804 129
Nuclear 0 0 0 0 1,781
Renew able energy (hydro) 425 365 466 454 416
Net pumped storage 1 (365) (366) (303) (382) (478)
Total net generation 17,447 18,942 17,997 18,618 19,863
Purchased and interchange:
Non-utility generation 12,674 12,003 11,538 13,643 12,502
Net interchange pow er 6,825 6,045 6,925 6,653 8,009
Total net purchased and interchange pow er 19,499 18,048 18,463 20,296 20,511
Total net pow er supply 36,946 36,990 36,460 38,914 40,374
POWER GENERATED (%)
Total net generation 47.2 51.2 49.4 47.8 49.2
Non-utility generation 34.3 32.4 31.6 35.1 31.0
Net interchange pow er 18.5 16.3 19.0 17.1 19.8
Total net purchased and interchange pow er 52.8 48.8 50.6 52.2 50.8
Total net pow er supply 100.0 100.0 100.0 100.0 100.0
NET DEMONSTRATED CAPABILITY AT PEAK (M W)
Coal 2,823 2,828 2,850 2,850 2,841
Oil and gas 1,810 1,814 1,814 1,997 1,459
Combustion turbine 465 517 661 661 345
Nuclear 0 0 0 0 0
Renew able energy (hydro) 77 74 74 73 73
Pumped storage 955 955 955 955 955
Total ow ned generation 6,130 6,188 6,354 6,536 5,673
P&I pow er capability 2,458 3,058 2,600 3,050 3,627
Total ow ned and P&I 8,588 9,246 8,954 9,586 9,300
NET DEMONSTRATED CAPABILITY AT PEAK (%)
Total ow ned generation 71.4 66.9 71.0 68.2 61.0
P&I pow er capability 28.6 33.1 29.0 31.8 39.0
Total ow ned and P&I 100.0 100.0 100.0 100.0 100.0
Peak load (MW) 2 8,930 8,190 7,756 7,705 8,391
Reserve capacity (%) 4 11 17 22 12
Nameplate generating capacity (MW) at peak 6,784 6,784 6,784 6,784 6,784
Load factor (%) 3 50.8 55.3 55.9 59.2 56.3
Heat rate-average Btu of fuel per net kWh generated 10,214 10,132 10,072 10,201 10,198
1 | Consumers’ portion of the Ludington pumped storage facility |
2 | Includes Retail Open Access customers 3 Includes bundled service customers |
CMS Energy Investor Relations One Energy Plaza Jackson, MI 49201 517-788-2590 www.cmsenergy. com
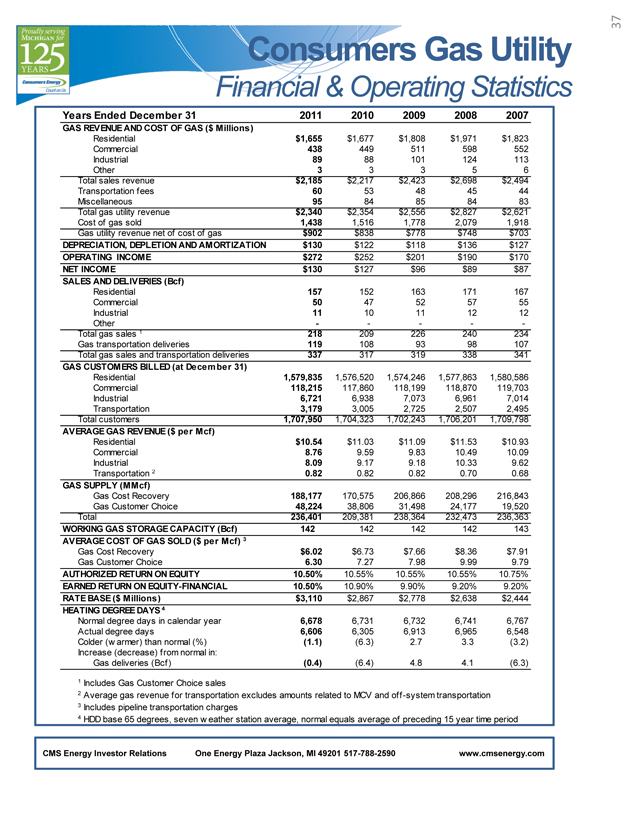
Consumers Gas Utility
Financial & Operating Statistics
[Graphic Appears Here]
Years Ended December 31 2011 2010 2009 2008 2007
GAS REVENUE AND COST OF GAS ($ Millions)
Residential $1,655 $1,677 $1,808 $1,971 $1,823
Commercial 438 449 511 598 552
Industrial 89 88 101 124 113
Other 3 3 3 5 6
Total sales revenue $2,185 $2,217 $2,423 $2,698 $2,494
Transportation fees 60 53 48 45 44
Miscellaneous 95 84 85 84 83
Total gas utility revenue $2,340 $2,354 $2,556 $2,827 $2,621
Cost of gas sold 1,438 1,516 1,778 2,079 1,918
Gas utility revenue net of cost of gas $902 $838 $778 $748 $703
DEPRECIATION, DEPLETION AND AMORTIZATION $130 $122 $118 $136 $127
OPERATING INCOME $272 $252 $201 $190 $170
NET INCOME $130 $127 $96 $89 $87
SALES AND DELIVERIES (Bcf)
Residential 157 152 163 171 167
Commercial 50 47 52 57 55
Industrial 11 10 11 12 12
Other ———— -
Total gas sales 1 218 209 226 240 234
Gas transportation deliveries 119 108 93 98 107
Total gas sales and transportation deliveries 337 317 319 338 341
GAS CUSTOMERS BILLED (at December 31)
Residential 1,579,835 1,576,520 1,574,246 1,577,863 1,580,586
Commercial 118,215 117,860 118,199 118,870 119,703
Industrial 6,721 6,938 7,073 6,961 7,014
Transportation 3,179 3,005 2,725 2,507 2,495
Total customers 1,707,950 1,704,323 1,702,243 1,706,201 1,709,798
AVERAGE GAS REVENUE ($ per Mcf)
Residential $10.54 $11.03 $11.09 $11.53 $10.93
Commercial 8.76 9.59 9.83 10.49 10.09
Industrial 8.09 9.17 9.18 10.33 9.62
Transportation 2 0.82 0.82 0.82 0.70 0.68
GAS SUPPLY (MMcf)
Gas Cost Recovery 188,177 170,575 206,866 208,296 216,843
Gas Customer Choice 48,224 38,806 31,498 24,177 19,520
Total 236,401 209,381 238,364 232,473 236,363
WORKING GAS STORAGE CAPACITY (Bcf) 142 142 142 142 143
AVERAGE COST OF GAS SOLD ($ per Mcf) 3
Gas Cost Recovery $6.02 $6.73 $7.66 $8.36 $7.91
Gas Customer Choice 6.30 7.27 7.98 9.99 9.79
AUTHORIZED RETURN ON EQUITY 10.50% 10.55% 10.55% 10.55% 10.75%
EARNED RETURN ON EQUITY-FINANCIAL 10.50% 10.90% 9.90% 9.20% 9.20%
RATE BASE ($ Millions) $3,110 $2,867 $2,778 $2,638 $2,444
HEATING DEGREE DAYS 4
Normal degree days in calendar year 6,678 6,731 6,732 6,741 6,767
Actual degree days 6,606 6,305 6,913 6,965 6,548
Colder (warmer) than normal (%) (1.1) (6.3) 2.7 3.3 (3.2)
Increase (decrease) from normal in:
Gas deliveries (Bcf) (0.4) (6.4) 4.8 4.1 (6.3)
1 | Includes Gas Customer Choice sales |
2 Average gas revenue for transportation excludes amounts related to MCV and off-system transportation 3 Includes pipeline transportation charges
4 | HDD base 65 degrees, seven w eather station average, normal equals average of preceding 15 year time period |
CMS Energy Investor Relations One Energy Plaza Jackson, MI 49201 517-788-2590 www.cmsenergy. com
38
Independent Power Production
Capacity
Ownership Gross In-Service Under LT
Plant Fuel Interest Capacity Year Contract State
Craven Wood 50% 50 1990 100% NC
DIG Natural Gas 100 710 2001 20 MI
Filer City Coal 50 73 1990 100 MI
Genesee Wood 50 40 1996 100 MI
Grayling Wood 50 38 1992 100 MI
MI Power Natural Gas 100 224 1999 59 MI
Net MW Owned by CMS 1,035
Michigan Power (Livingston)
Grayling
Filer City
Genesee
Michigan Power (Kalamaz oo River)
EnerBank HQ
Renewables Other
DIG
Craven
CMS Energy Investor Relations One Energy Plaza Jackson, MI 49201 517-788-2590 www.cmsenergy.com
GAAP RECONCILIATION
CMS ENERGY CORPORATION
Earnings Per Share By Year GAAP Reconciliation
(Unaudited)
| | | | | | | | | | | | | | | | | | | | | | | | | | | | | | | | |
| | | 2003 | | | 2004 | | | 2005 | | | 2006 | | | 2007 | | | 2008 | | | 2009 | | | 2010 | |
Reported earnings (loss) per share - GAAP | | | ($0.30 | ) | | $ | 0.64 | | | | ($0.44 | ) | | | ($0.41 | ) | | | ($1.02 | ) | | $ | 1.20 | | | $ | 0.91 | | | $ | 1.28 | |
| | | | | | | | | | | | | | | | | | | | | | | | | | | | | | | | |
After-tax items: | | | | | | | | | | | | | | | | | | | | | | | | | | | | | | | | |
Electric and gas utility | | | 0.21 | | | | (0.39 | ) | | | — | | | | — | | | | (0.07 | ) | | | 0.05 | | | | 0.33 | | | | 0.03 | |
Enterprises | | | 0.74 | | | | 0.62 | | | | 0.04 | | | | (0.02 | ) | | | 1.25 | | | | (0.02 | ) | | | 0.09 | | | | (0.03 | ) |
Corporate interest and other | | | 0.16 | | | | (0.03 | ) | | | 0.04 | | | | 0.27 | | | | (0.32 | ) | | | (0.02 | ) | | | 0.01 | | | | * | |
Discontinued operations (income) loss | | | (0.16 | ) | | | 0.02 | | | | (0.07 | ) | | | (0.03 | ) | | | 0.40 | | | | (*) | | | | (0.08 | ) | | | 0.08 | |
Asset impairment charges, net | | | — | | | | — | | | | 1.82 | | | | 0.76 | | | | 0.60 | | | | — | | | | — | | | | — | |
Cumulative accounting changes | | | 0.16 | | | | 0.01 | | | | — | | | | — | | | | — | | | | — | | | | — | | | | — | |
| | | | | | | | | | | | | | | | | | | | | | | | | | | | | | | | |
Adjusted earnings per share, including MTM - non-GAAP | | $ | 0.81 | | | $ | 0.87 | | | $ | 1.39 | | | $ | 0.57 | | | $ | 0.84 | | | $ | 1.21 | (a) | | $ | 1.26 | | | $ | 1.36 | |
Mark-to-market impacts | | | | | | | 0.03 | | | | (0.43 | ) | | | 0.51 | | | | | | | | | | | | | | | | | |
| | | | | | | | | | | | | | | | | | | | | | | | | | | | | | | | |
Adjusted earnings per share, excluding MTM - non-GAAP | | | NA | | | $ | 0.90 | | | $ | 0.96 | | | $ | 1.08 | | | | NA | | | | NA | | | | NA | | | | NA | |
| | | | | | | | | | | | | | | | | | | | | | | | | | | | | | | | |
| * | Less than $500 thousand or $0.01 per share. |
| (a) | $1.25 excluding discontinued Exeter operations and accounting changes related to convertible debt and restricted stock. |
2003-10 EPS
CMS ENERGY CORPORATION
Earnings By Quarter and Year GAAP Reconciliation
(Unaudited)
| | | | | | | | | | | | | | | | | | | | |
(In millions, except per share amounts) | | 2011 | |
| | | 1Q | | | 2Q | | | 3Q | | | 4Q | | | YTD Dec | |
Reported net income - GAAP | | $ | 135 | | | $ | 100 | | | $ | 139 | | | $ | 41 | | | $ | 415 | |
| | | | | | | | | | | | | | | | | | | | |
After-tax items: | | | | | | | | | | | | | | | | | | | | |
Electric and gas utility | | | — | | | | — | | | | — | | | | — | | | | — | |
Enterprises | | | * | | | | (28 | ) | | | * | | | | 1 | | | | (27 | ) |
Corporate interest and other | | | — | | | | (4 | ) | | | — | | | | * | | | | (4 | ) |
Discontinued operations income | | | (2 | ) | | | * | | | | * | | | | * | | | | (2 | ) |
| | | | | | | | | | | | | | | | | | | | |
Adjusted income - non-GAAP | | $ | 133 | | | $ | 68 | | | $ | 139 | | | $ | 42 | | | $ | 382 | |
| | | | | | | | | | | | | | | | | | | | |
Average shares outstanding, basic | | | 250.0 | | | | 250.3 | | | | 251.3 | | | | 251.7 | | | | 250.8 | |
Average shares outstanding, diluted | | | 261.7 | | | | 261.9 | | | | 263.9 | | | | 265.5 | | | | 263.4 | |
| | | | | | | | | | | | | | | | | | | | |
Reported earnings per share - GAAP | | $ | 0.52 | | | $ | 0.38 | | | $ | 0.53 | | | $ | 0.15 | | | $ | 1.58 | |
| | | | | | | | | | | | | | | | | | | | |
After-tax items: | | | | | | | | | | | | | | | | | | | | |
Electric and gas utility | | | — | | | | — | | | | — | | | | — | | | | — | |
Enterprises | | | * | | | | (0.11 | ) | | | * | | | | * | | | | (0.11 | ) |
Corporate interest and other | | | — | | | | (0.01 | ) | | | — | | | | * | | | | (0.01 | ) |
Discontinued operations income | | | (0.01 | ) | | | * | | | | * | | | | * | | | | (0.01 | ) |
| | | | | | | | | | | | | | | | | | | | |
Adjusted earnings per share - non-GAAP | | $ | 0.51 | | | $ | 0.26 | | | $ | 0.53 | | | $ | 0.15 | | | $ | 1.45 | |
| | | | | | | | | | | | | | | | | | | | |
| | | | |
(In millions, except per share amounts) | | 2012 | |
| | | 1Q | |
Reported net income - GAAP | | $ | 67 | |
| | | | |
After-tax items: | | | | |
Electric and gas utility | | | 36 | |
Enterprises | | | 1 | |
Corporate interest and other | | | — | |
Discontinued operations income | | | (7 | ) |
| | | | |
Adjusted income - non-GAAP | | $ | 97 | |
| | | | |
Average shares outstanding, basic | | | 255.6 | |
Average shares outstanding, diluted | | | 266.9 | |
| | | | |
Reported earnings per share - GAAP | | $ | 0.25 | |
| | | | |
After-tax items: | | | | |
Electric and gas utility | | | 0.14 | |
Enterprises | | | 0.01 | |
Corporate interest and other | | | — | |
Discontinued operations income | | | (0.03 | ) |
| | | | |
Adjusted earnings per share - non-GAAP | | $ | 0.37 | |
| | | | |
Note: Year-to-date (YTD) EPS may not equal sum of quarters due to share count differences.
| * | Less than $500 thousand or $0.01 per share. |
2012 A-1
CMS Energy
Reconciliation of Gross Operating Cash Flow to GAAP Operating Activities
(unaudited)
(mils)
| | | | | | | | | | | | | | | | | | | | | | | | | | | | | | | | |
| | | 2009 | | | 2010 | | | 2011 | | | 2012 | | | 2013 | | | 2014 | | | 2015 | | | 2016 | |
Consumers Operating Income + Depreciation & Amortization | | $ | 1,248 | | | $ | 1,498 | | | $ | 1,527 | | | $ | 1,651 | | | $ | 1,735 | | | $ | 1,860 | | | $ | 1,977 | | | $ | 2,051 | |
Enterprises Project Cash Flows | | | 16 | | | | 39 | | | | 24 | | | | 25 | | | | 27 | | | | 33 | | | | 35 | | | | 35 | |
| | | | | | | | | | | | | | | | | | | | | | | | | | | | | | | | |
Gross Operating Cash Flow | | $ | 1,264 | | | $ | 1,537 | | | $ | 1,551 | | | $ | 1,676 | | | $ | 1,762 | | | $ | 1,893 | | | $ | 2,012 | | | $ | 2,086 | |
Other operating activities including taxes, interest payments and working capital | | | (416 | ) | | | (578 | ) | | | (382 | ) | | | (426 | ) | | | (412 | ) | | | (443 | ) | | | (757 | ) | | | (776 | ) |
| | | | | | | | | | | | | | | | | | | | | | | | | | | | | | | | |
Net cash provided by operating activities | | $ | 848 | | | $ | 959 | | | $ | 1,169 | | | $ | 1,250 | | | $ | 1,350 | | | $ | 1,450 | | | $ | 1,255 | | | $ | 1,310 | |
| | | | | | | | | | | | | | | | | | | | | | | | | | | | | | | | |
2009-15 OCF