Exhibit 99.1

Exhibit 99.1
Morgan Stanley Conference
March 7, 2013
Cross Winds Energy Park
Gas Combined Cycle Plant
Consumers Smart Energy Program
This presentation is made as of the date hereof and contains “forward-looking statements” as defined in Rule 3b-6 of the Securities Exchange Act of 1934, as amended, Rule 175 of the Securities Act of 1933, as amended, and relevant legal decisions. The forward-looking statements are subject to risks and uncertainties. They should be read in conjunction with “FORWARD-LOOKING STATEMENTS AND INFORMATION” and “RISK FACTORS” sections of CMS Energy’s and Consumers Energy’s Form 10-K for the year ended December 31 and as updated in subsequent 10-Qs. CMS Energy’s and Consumers Energy’s “FORWARD-LOOKING STATEMENTS AND INFORMATION” and “RISK FACTORS” sections are incorporated herein by reference and discuss important factors that could cause CMS Energy’s and Consumers Energy’s results to differ materially from those anticipated in such statements. CMS Energy and Consumers Energy undertake no obligation to update any of the information presented herein to reflect facts, events or circumstances after the date hereof.
The presentation also includes non-GAAP measures when describing CMS Energy’s results of operations and financial performance. A reconciliation of each of these measures to the most directly comparable GAAP measure is included in the appendix and posted on our website at www.cmsenergy.com.
CMS Energy provides financial results on both a reported (Generally Accepted Accounting Principles) and adjusted (non-GAAP) basis. Management views adjusted earnings as a key measure of the company’s present operating financial performance, unaffected by discontinued operations, asset sales, impairments, regulatory items from prior years, or other items. Certain of these items have the potential to impact, favorably or unfavorably, the company’s reported earnings in 2013. The company is not able to estimate the impact of these matters and is not providing reported earnings guidance.
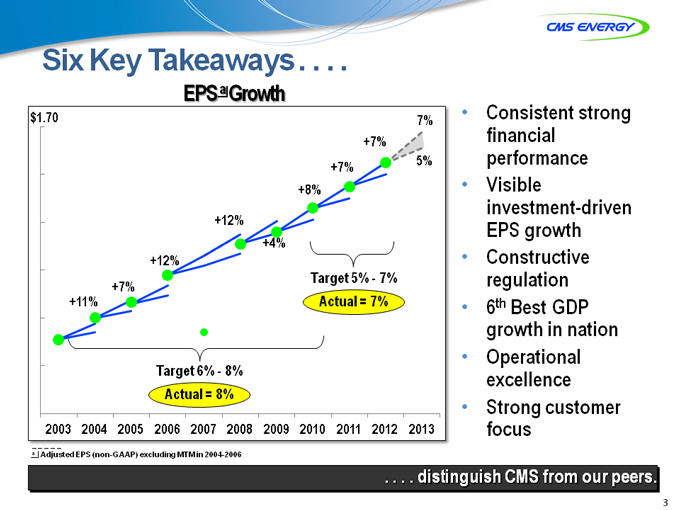
Six Key Takeaways . . . .
EPS a Growth
$1.70 7%
+7%
+7% 5%
+8%
+12%
+4%
+12%
+7% Target 5%—7%
+11% Actual = 7%
Target 6%—8%
Actual = 8%
2003 _ 2004 2005 2006 2007 2008 2009 2010 2011 2012 2013
a Adjusted EPS (non-GAAP) excluding MTM in 2004-2006
Consistent strong financial performance Visible investment-driven EPS growth Constructive regulation 6th Best GDP growth in nation Operational excellence Strong customer focus
. . . . distinguish CMS from our peers.
3
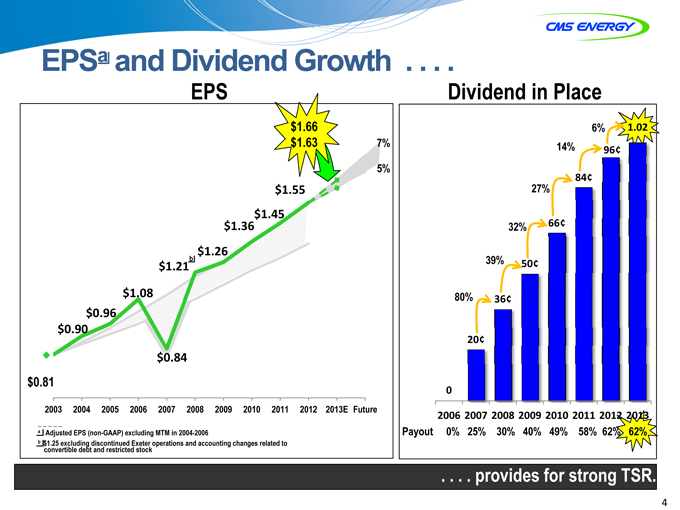
EPSa and Dividend Growth . . . .
EPS
$1 66.
$1.63 7%
5%
$1.55
$1.45
$1.36
$1.26
$1.21b
$1.08
$0.96
$0.90
$0.84
$0 81.
2003 2004 2005 2006 2007 2008 2009 2010 2011 2012 2013E Future
a Adjusted EPS (non-GAAP) excluding MTM in 2004-2006
b $1.25 excluding discontinued Exeter operations and accounting changes related to
convertible debt and restricted stock
Dividend in Place
6% 102.
14% 96¢
84¢
27%
32% 66¢
39% 50¢
80% 36¢
20¢
0
2006 2007 2008 2009 2010 2011 2012 2013
Payout 0% 25% 30% 40% 49% 58% 62% 62%
. . . . provides for strong trong TSR.
4
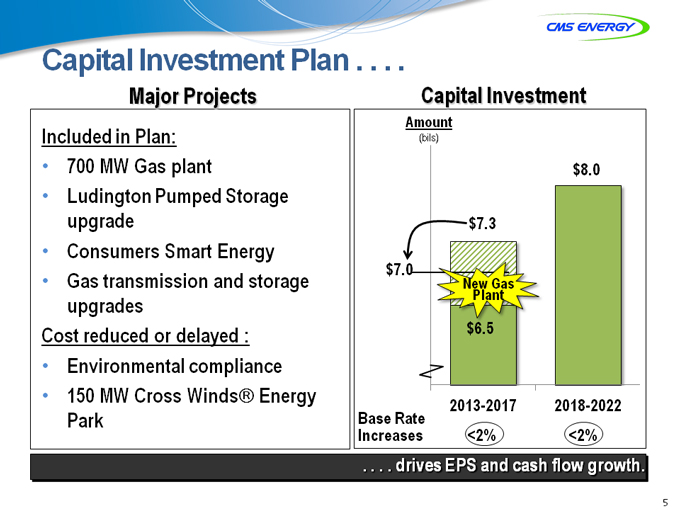
Capital Investment Plan . . . .
Major Projects
Included in Plan:
• 700 MW Gas plant
• Ludington Pumped Storage upgrade
• Consumers Smart Energy
• Gas transmission and storage upgrades Cost reduced or delayed :
• Environmental compliance
• 150 MW Cross Winds Energy Park
Capital Investment
Amount
(bils)
$8.0
$7.3
$7.0
New Gas
Plant
$6.5
2013-2017 2018-2022
Base Rate
Increases <2% <2%
. . . . drivesrives EPS and cash flow growth.
5
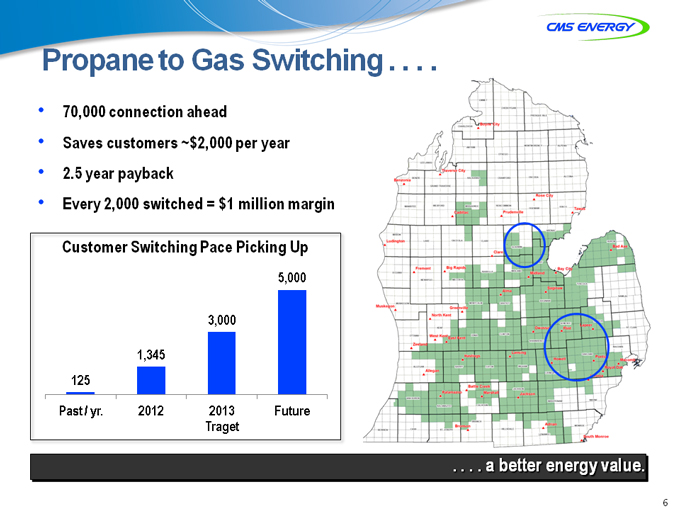
Propane to Gas Switching . . . .
70,000 connection onnection ahead head
Saves customers ~$2,000 per year 2.5 year payback Every 2,000 switched = $1 million margin
Customer Switching Pace Picking Up
5,000
3,000
1,345
125
Past / yr. 2012 2013 Future
Traget
. . . . a better etter energy value.
6
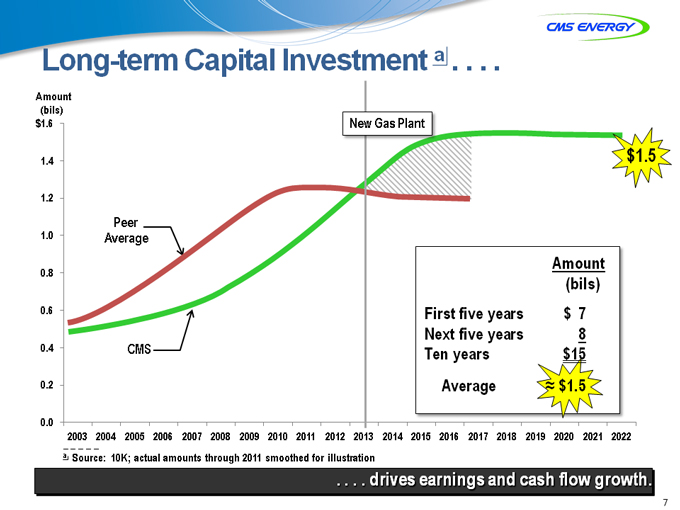
Long-term Capital Investment a . . . .
Amount
(bils)
$1.6 New Gas Plant
1.4 $1.5
1.2
Peer
10. Average
Amount
08.(bils)
06. First five years $ 7
Next five years 8
0.4 CMS Ten years $15
0.2 Average $1.5
0.0
_ 2003 2004 2005 2006 2007 2008 2009 2010 2011 2012 2013 2014 2015 2016 2017 2018 2019 2020 2021 2022
a Source: 10K; actual amounts through 2011 smoothed for illustration
. . . . drives earnings and cash flow growth.
7
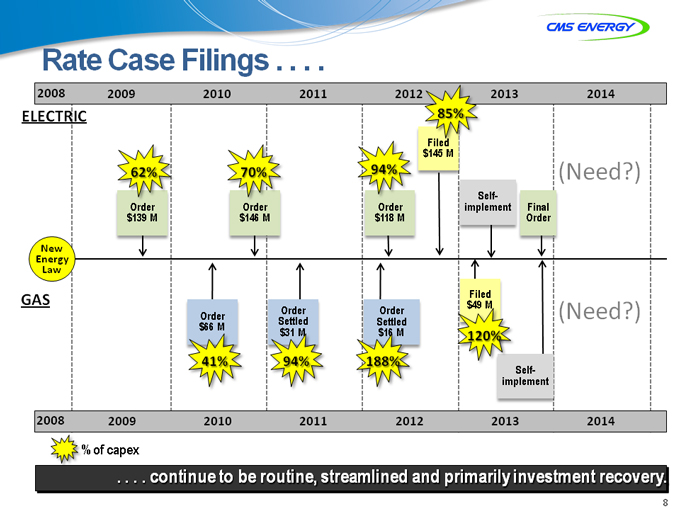
Rate Case Filings . . . .
2008 2009 2010 2011 2012 2013 2014
ELECTRIC 85%
Filed
$145 M
62% 70% 94%94%(Need )
Self-
Order Order Order implement Final
$139 M $146 M $118 M Order
New
Energy
Law
Filed
GAS Order Order Order $49 M(Need )
$66 M Settled Settled
$31 M $16 M 120%
41% 94% 188% Self-
implement
2008 2009 2010 2011 2012 2013 2014
% of capex
. . . . continue to be routine, streamlined and primarily investment recovery.
8
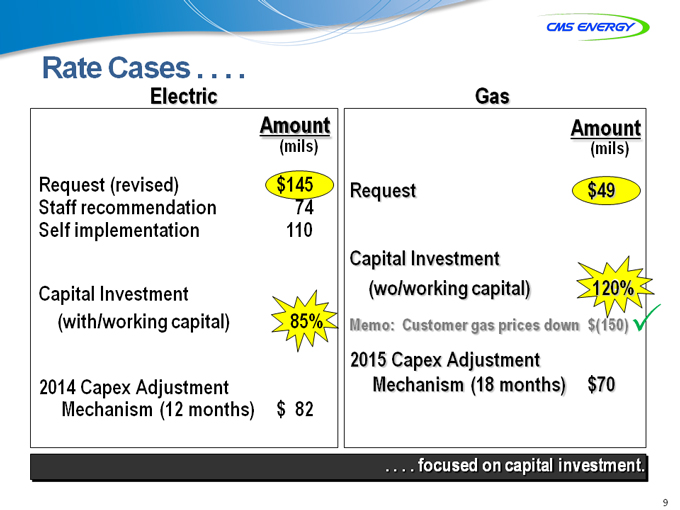
Rate Cases .. . . .
Electric
Amount
(mils)
Request (revised) $ 145
Staff recommendation 74
Self implementation 110
Capital Investment
(with/working capital) 85%
2014 Capex Adjustment
Mechanism (12 months) $ 82
Gas
Amount
(mils)
Request $49
Capital Investment
(wo/working capital) 120%
Memo: Customer gas prices down $(150)
2015 Capex Adjustment
Mechanism (18 months) $70
. . . . focused on capital investment.
9
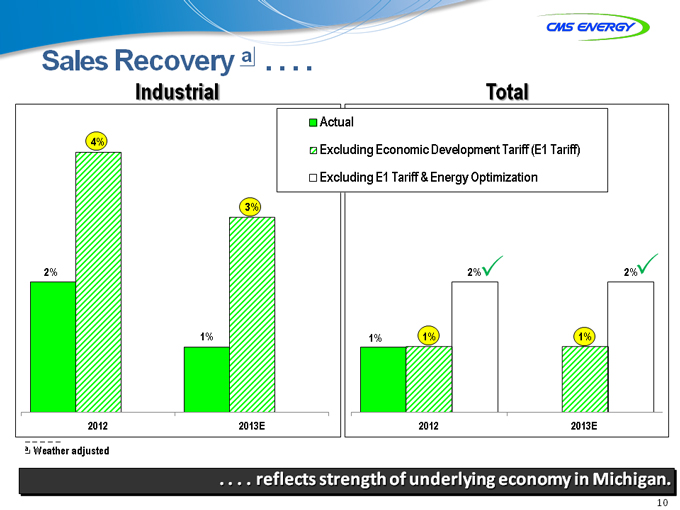
Sales Recovery a . . . .
Actual
Excluding Economic Development Tariff (E1 Tariff) Excluding E1 Tariff & Energy Optimization
Industrial
4%
3%
2%
1%
2012 2013E
a Weather adjusted
Total
2% 2%
1% 1% 1%
2012 2013E
. . . . reeflects strength of underlying economy in Michigan.
10
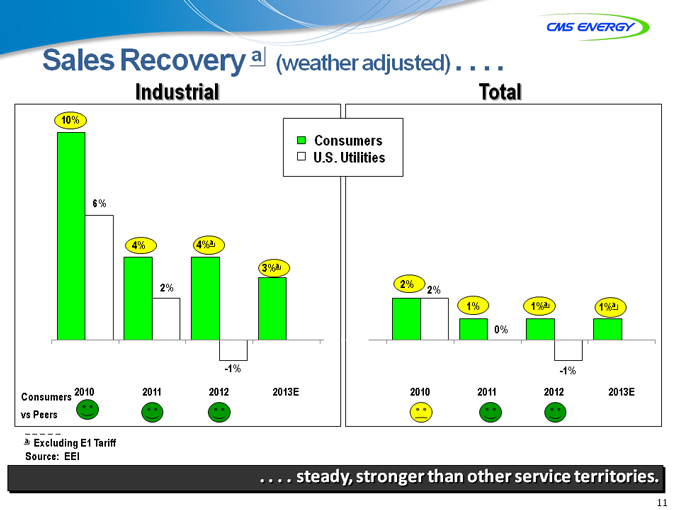
Sales Recovery a (weather adjusted) . . . .
Industrial
10%
6%
4% 4%a
3%a
2%
-1%
Consumers 2010 2011 2012 2013E
vs _ Peers
a Excluding E1 Tariff
Source: EEI
Consumers U.S. Utilities
Total
2% 2%
1% 1%a 1%a
0%
-1%
2010 2011 2012 2013E
. . . . steady, stronger than other service territories.
11
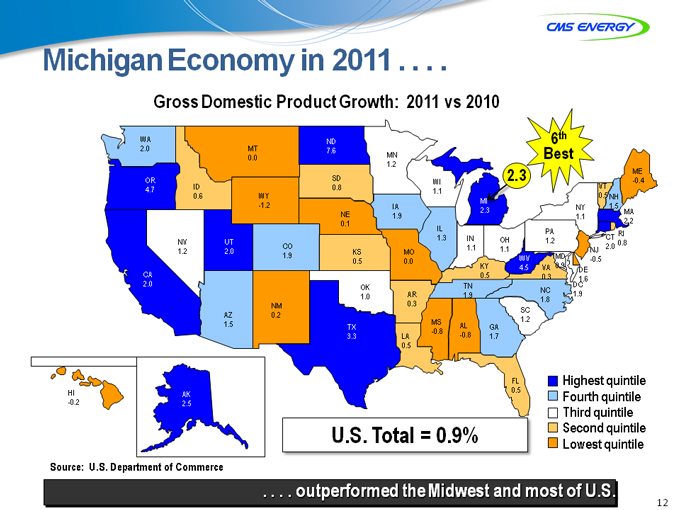
Michigan Economy in 2011 . . . .
Gross Domestic Product Growth: 2011 vs 2010
WA ND 6th
2.0 MT 7.6 MN Best
0.0
12.
2.3 ME
OR SD WI -04.
4.7 ID 0.8 1.1 VT
0.6 WY 0.5 NH
MI
-1.2 IA NY 1.5
NE 1.9 2.3 1.1 MA
0.1 2.2
IL PA RI
NV UT 1.3 IN OH 1.2 CT 0.8
1.2 2.0 CO KS MO 1.1 1.1 NJ 2.0
19. 0.5 0.0 WV MD -0.5
KY 4.5 VA 0.9 DE
CA 0.5 0.3 1.6
2.0 OK TN DC
1.0 AR 1.9 NC 1.9
1.8
NM 0.3 SC
AZ 0.2
1.5 TX MS AL GA 1.2
3.3 LA -0.8 -0.8 1.7
05.
FL Highest quintile
HI AK 0.5 Fourth quintile
-0.2 2.5
Third quintile
US Total=09%. Lowest Second quintile quintile
Source: U.S. Department of Commerce
. . . . outperformed the Midwest and most of US . .
12
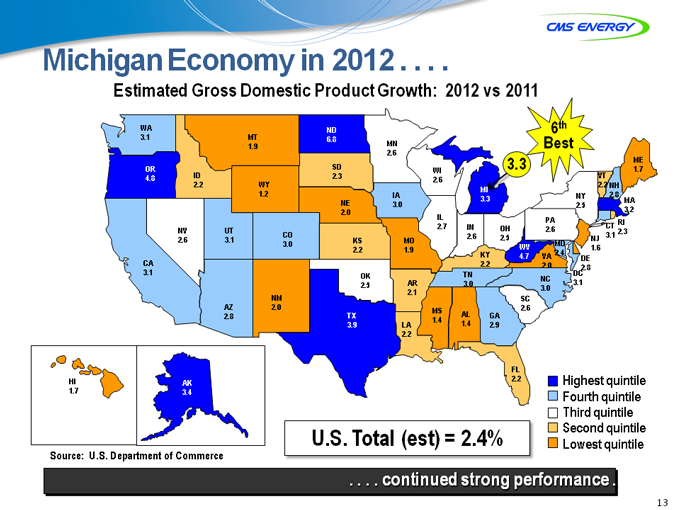
Michigan Economy in 2012 . . . .
Estimated Gross Domestic Product Growth: 2012 vs 2011
WA ND 6th
3.1 MT 6.8 MN Best
19.
2.6
3.3 ME
OR SD WI 1.7
4.8 ID 2.3 2.6 VT
2.2 WY 2.2 NH
MI
1.2 IA NY 2.8
NE 3.0 33. 2.5 MA
2.0 3.2
IL PA RI
NV UT 2.7 IN OH 2.6 CT 2.3
2.6 3.1 CO KS MO 26. 2.5 NJ 3.1
3.0 WV MD
2.2 1.9 1.6
KY 4.7 VA 2.4 DE
CA 2.2 2.0 2.8
31. OK TN DC
2.5 AR 3.0 NC 3.1
2.1 3.0
NM SC
AZ 2.0 MS 26.
2.8 TX AL GA
3.9 LA 1.4 1.4 2.9
2.2
FL
HI AK 2.2 Highest quintile
1.7 3.4 Fourth quintile
Third quintile
US Total(est)=24%. Lowest Second quintile quintile
Source: U.S. Department of Commerce
. . . . continued strong performance .
13
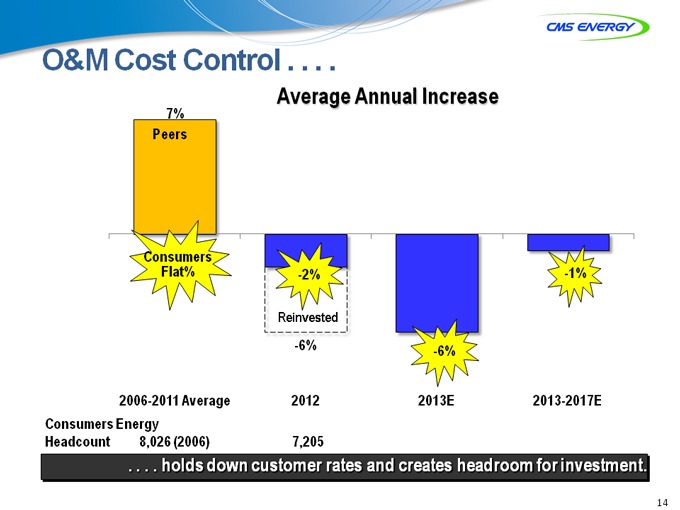
O&M Cost Control . . . .
Average Annual Increase
7%
Peers
Consumers
Flat% -2% -1%
-2%
Reinvested
-6% -6%
2006-2011 Average 2012 2013E 2013-2017E
Consumers Energy
Headcount 8,026 (2006) 7,205
. . . . holdsolds down customer rates and creates headroom for investment.
14
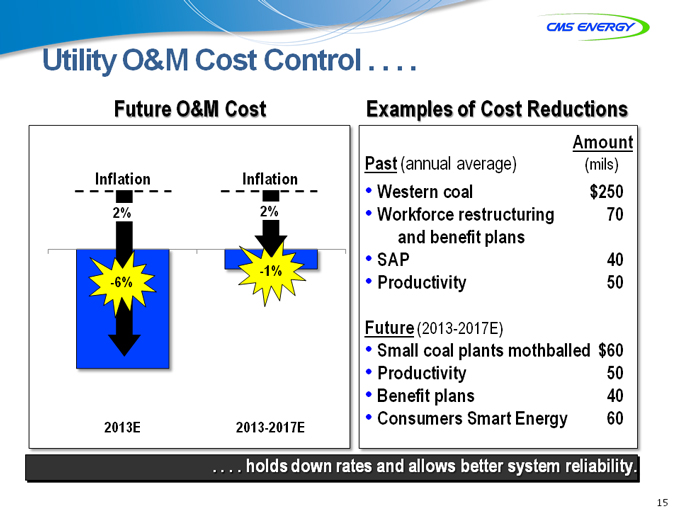
Utility O&M Cost Control . . . .
Future O&M Cost
Inflation Inflation
2% 2%
-1%
-6%
2013E 2013-2017E
Examples of Cost Reductions
Amount
Past (annual average)(mils)
• Western coal $250
• Workforce restructuring 70
and benefit plans
• SAP 40
• Productivity 50
Future (2013-2017E)
• Small coal plants mothballed $60
• Productivity 50
• Benefit plans 40
• Consumers Smart Energy 60
. . . . holds down rates and allows better system reliability
15
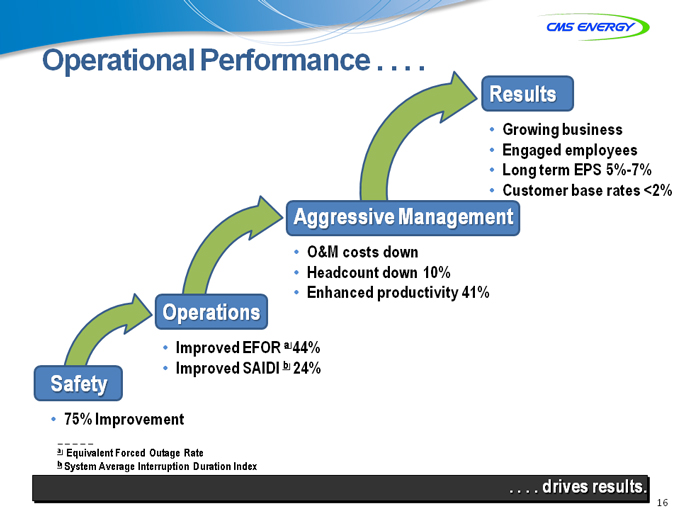
Operational Performance . . . .
Results
• Growing business
• Engaged employees
• Long term EPS 5%-7%
• Customer base rates <2%
Aggressive Management
• O&M costs down
• Headcount down 10%
• Enhanced productivity 41%
Operations
• Improved EFOR a 44%
• Improved SAIDI b 24%
Safety
• _ 75% Improvement
a Equivalent Forced Outage Rate
b System Average Interruption Duration Index
. drives results.
16
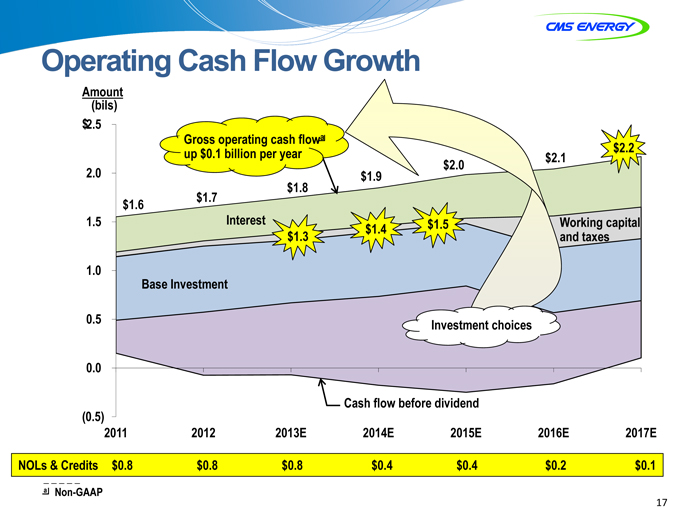
Operating Cash Flow Growth
Amount
(bils)
$2.5
Gross operating cash flowa
up $0.1 billion per year $2.2
2.0 .
$ 1.8
$1.6 $1.7
1.5 Interest $1.4 $1.5 king capital
$1.3 taxes
1 0.
Base Investment
0.5 Investment choices
0
Cash flow before dividend
(0.5)
2011 2012 2013E 2014E 2015E 2016E 2017E
NOLs & Credits $0.8 $0.8 $0.8 $0.4 $0.4 $0.2 $0.1
a Non-GAAP
17
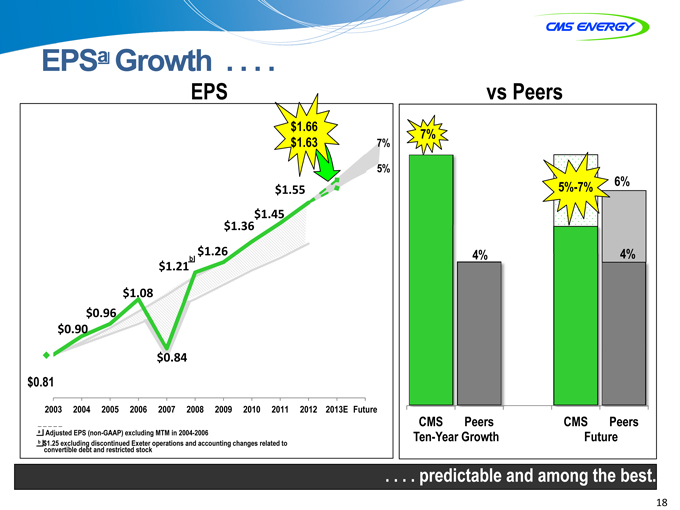
EPSa Growth . . . .
EPS
$1 66.
$1.63 7%
5%
$1.55
$1.45
$1.36
$1.26
$1.21b
$1.08
$0.96
$0.90
$0.84
$0 81.
2003 2004 2005 2006 2007 2008 2009 2010 2011 2012 2013E Future
a Adjusted EPS (non-GAAP) excluding MTM in 2004-2006
b $1.25 excluding discontinued Exeter operations and accounting changes related to
convertible debt and restricted stock
vs Peers
7%
5%-7% 6%
5%
4% 4%
CMS Peers CMS Peers
Ten-Year Growth Future
. . . . predictable and among mong the best est.
18

Six Key Takeaways . . . .
EPS Growth
$1.70 7%
+7%
+7% 5%
+8%
+12%
+4%
+12%
+7% Target 5%—7%
+11% Actual = 7%
Target 6%—8%
Actual = 8%
2003 _ 2004 2005 2006 2007 2008 2009 2010 2011 2012 2013
a Adjusted EPS (non-GAAP) excluding MTM in 2004-2006
Consistent strong financial performance Visible investment-driven EPS growth Constructive regulation 6th Best GDP growth in nation Operational excellence Strong customer focus
. . . . distinguish CMS from our peers.
19

Appendix
20
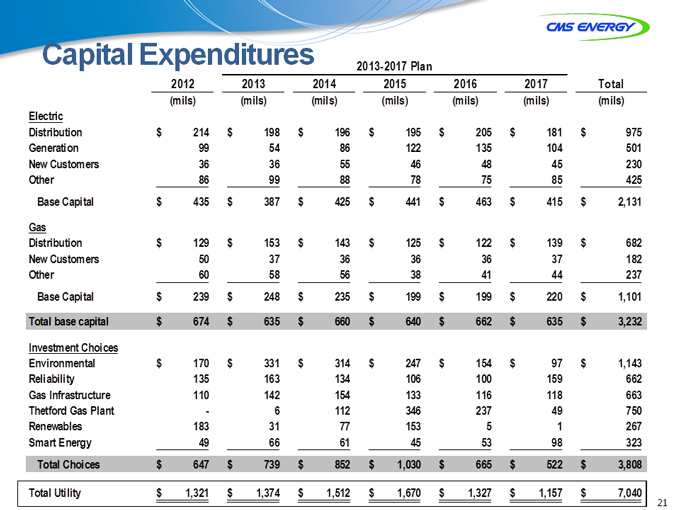
Capital Expenditures
2013-2017 Plan
2012 2013 2014 2015 2016 2017 Total
(mils)(mils)(mils)(mils)(mils)(mils)(mils)
Electric
Distribution $ 214 $ 198 $ 196 $ 195 $ 205 $ 181 $ 975
Generation 99 54 86 122 135 104 501
New Customers 36 36 55 46 48 45 230
Other 86 99 88 78 75 85 425
Base Capital $ 435 $ 387 $ 425 $ 441 $ 463 $ 415 $ 2,131
Gas
Distribution $ 129 $ 153 $ 143 $ 125 $ 122 $ 139 $ 682
New Customers 50 37 36 36 36 37 182
Other 60 58 56 38 41 44 237
Base Capital $ 239 $ 248 $ 235 $ 199 $ 199 $ 220 $ 1,101
Total base capital $ 674 $ 635 $ 660 $ 640 $ 662 $ 635 $ 3,232
Investment Choices
Environmental $ 170 $ 331 $ 314 $ 247 $ 154 $ 97 $ 1,143
Reliability 135 163 134 106 100 159 662
Gas Infrastructure 110 142 154 133 116 118 663
Thetford Gas Plant—6 112 346 237 49 750
Renewables 183 31 77 153 5 1 267
Smart Energy 49 66 61 45 53 98 323
Total Choices $ 647 $ 739 $ 852 $ 1,030 $ 665 $ 522 $ 3,808
Total Utility $ 1,321 $ 1,374 $ 1,512 $ 1,670 $ 1,327 $ 1,157 $ 7,040
21
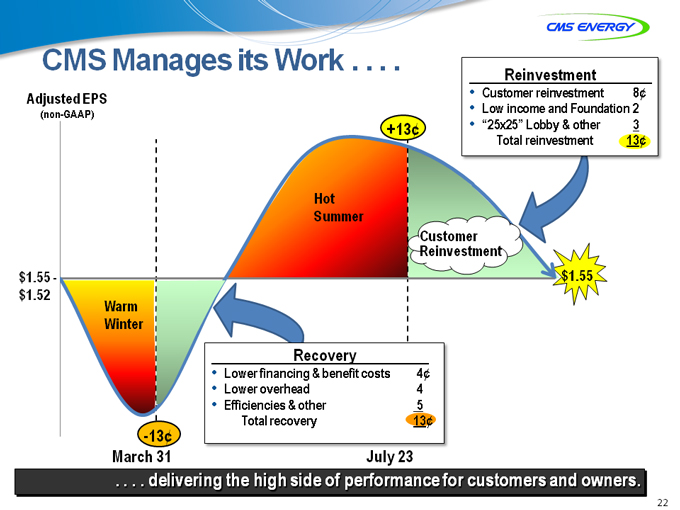
CMS Manages its Work . . . .
Adjusted EPS • Customer reinvestment 8¢
(non-GAAP) • Low income and Foundation 2
+13¢ • “25x25” Lobby & other 3
Total reinvestment 13¢
Hot
Summer
Customer
Reinvestment
$ 1.55—$ 1.55
$ 1.52
Warm
Winter
Recovery
• Lower financing & benefit costs 4¢
• Lower overhead 4
• Efficiencies & other 5
Total recovery 13¢
-13¢
March 31 July 23
Reinvestment
. . . . delivering the high side of performance for customers and owners.
22
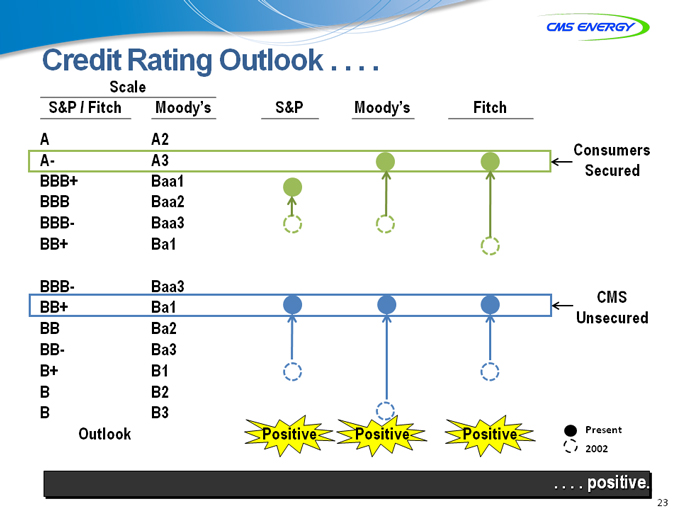
Credit Rating Outlook . . . .
Scale
S&P / Fitch Moody’s S&P Moody’s Fitch
A A2
A- A3 Consumers
BBB+ Baa1 Secured
BBB Baa2
BBB- Baa3
BB+ Ba1
BBB- Baa3
BB+ Ba1 CMS
BB Ba2 Unsecured
BB- Ba3
B+ B1
B B2
B B3
Outlook Positive Positive Positive Present
2002
. . . . positive.
23
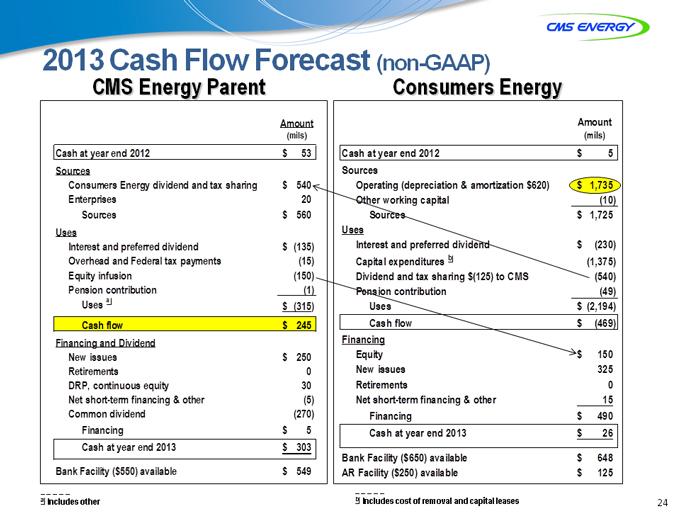
2013 Cash Flow Forecast (non-GAAP)
CMS Energy Parent Consumers Energy
Amount Amount
(mils)(mils)
Cash at year end 2012 $ 53 Cash at year end 2012 $ 5
Sources Sources
Consumers Energy dividend and tax sharing $ 540 Operating (depreciation & amortization $620) $ 1,735
Enterprises 20 Other working capital(10)
Sources $ 560 Sources $ 1,725
Uses Uses
Interest and preferred dividend $(135) Interest and preferred dividend $ (230)
Overhead and Federal tax payments(15) Capital expenditures b(1,375)
Equity infusionsion(150) Dividend and tax sharing $(125) to CMS(540)
Pension contribution(1) Pension contribution(49)
Uses a $(315) Uses $ (2,194)
Cash flow $ 245 Cash flow $ (469)
Financing and Dividend Financing
New issues $ 250 Equity $ 150
Retirements 0 New issues 325
DRP, continuous equity 30 Retirements 0
Net short-term financing & other(5) Net short-term financing & other 15
Common dividend(270) Financing $ 490
Financing $ 5 Cash at year end 2013 $ 26
Cash at year end 2013 $ 303
Bank Facility ($650) available $ 648
Bank _ Facility ($550) available $ 549 AR _ Facility ($250) available $ 125
a Includes other b Includes cost of removal and capital leases
24
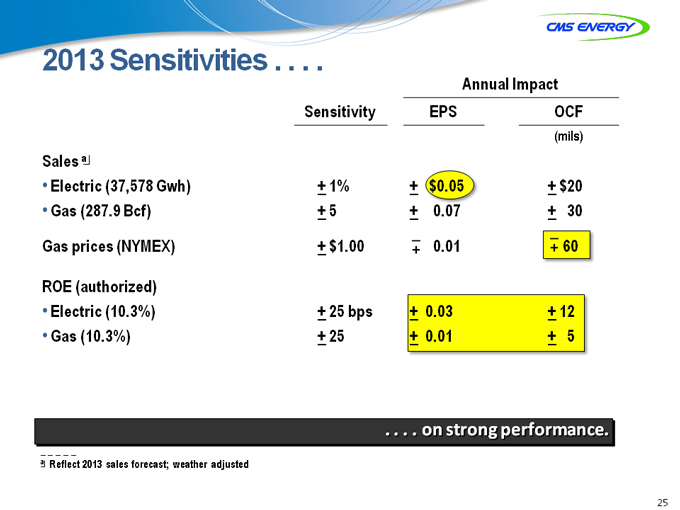
2013 Sensitivities . . . .
Annual Impact
Sensitivity EPS OCF
(mils)
Sales a
• Electric (37,578 Gwh) + 1% + $0.05 + $20
• Gas (287.9 Bcf) + 5 + 0.07 + 30
Gas prices (NYMEX) + $1.00 –+ 0.01 –+ 60
ROE (authorized)
• Electric (10.3%) + 25 bps + 0.03 + 12
• Gas (10.3%) + 25 + 0.01 + 5
. . . . onn strong performance.
a Reflect 2013 sales forecast; weather adjusted
25
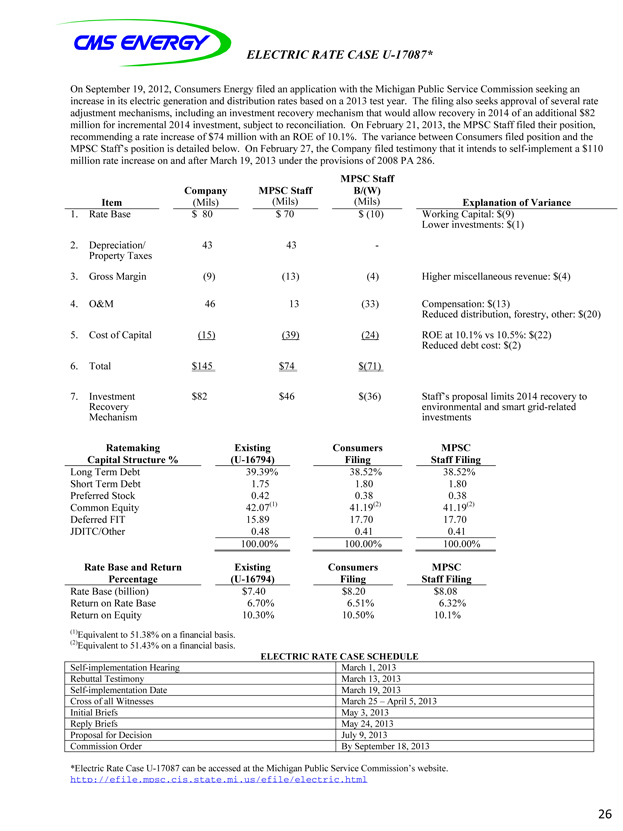
ELECTRIC RATE CASE U-17087*
On September 19, 2012, Consumers Energy filed an application with the Michigan Public Service Commission seeking an increase in its electric generation and distribution rates based on a 2013 test year. The filing also seeks approval of several rate adjustment mechanisms, including an investment recovery mechanism that would allow recovery in 2014 of an additional $82 million for incremental 2014 investment, subject to reconciliation. On February 21, 2013, the MPSC Staff filed their position, recommending a rate increase of $74 million with an ROE of 10.1%. The variance between Consumers filed position and the MPSC Staff’s position is detailed below. On February 27, the Company filed testimony that it intends to self-implement a $110 million rate increase on and after March 19, 2013 under the provisions of 2008 PA 286.
MPSC Staff
Company MPSC Staff B/(W)
Item(Mils)(Mils)(Mils) Explanation of Variance
1. Rate Base $ 80 $ 70 $ (10) Working Capital: $(9)
Lower investments: $(1)
2. Depreciation/ 43 43 -
Property Taxes
3. Gross Margin(9)(13)(4) Higher miscellaneous revenue: $(4)
4. O&M 46 13(33) Compensation: $(13)
Reduced distribution, forestry, other: $(20)
5. Cost of Capital(15)(39)(24) ROE at 10.1% vs 10.5%: $(22)
Reduced debt cost: $(2)
6. Total $ 145 $74 $(71)
7. Investment $ 82 $46 $(36) Staff’s proposal limits 2014 recovery to
Recovery environmental and smart grid-related
Mechanism investments
Ratemaking Existing Consumers MPSC
Capital Structure %(U-16794) Filing Staff Filing
Long Term Debt 39.39% 38.52% 38.52%
Short Term Debt 1.75 1.80 1.80
Preferred Stock 0.42 0.38 0.38
Common Equity 42.07(1) 41.19(22) 41.19(2)
Deferred FIT 15.89 17.70 17.70
JDITC/Other 0.48 0.41 0.41
100.00% 100.00% 100.00%
Rate Base and Return Existing Consumers MPSC
Percentage(U-16794) Filing Staff Filing
Rate Base (billion) $7.40 $8.20 $8.08
Return on Rate Base 6.70% 6.51% 6.32%
Return on Equity 10.30% 10.50% 10.1%
(1)Equivalent to 51.38% on a financial basis.
(2)Equivalent to 51.43% on a financial basis.
ELECTRIC RATE CASE SCHEDULE
Self-implementation Hearing March 1, 2013
Rebuttal Testimony March 13, 2013
Self-implementation Date March 19, 2013
Cross of all Witnesses March 25 – April 5, 2013
Initial Briefs May 3, 2013
Reply Briefs May 24, 2013
Proposal for Decision July 9, 2013
Commission Order By September 18, 2013
*Electric Rate Case U-17087 can be accessed at the Michigan Public Service Commission’s website.
http://eefile.mpssc.cis.state.mi.us/efile/electric.html
26
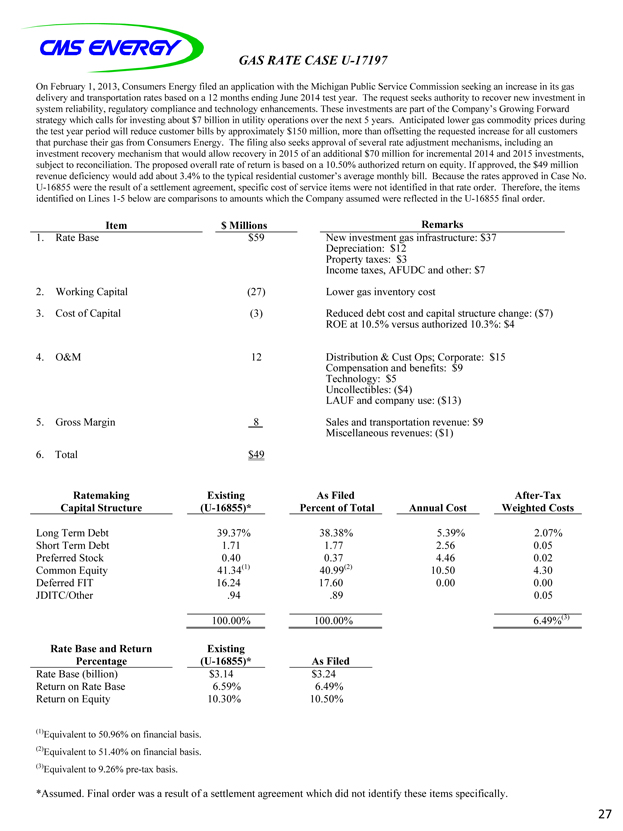
GAS RATE CASE U-17197
On February 1, 2013, Consumers Energy filed an application with the Michigan Public Service Commission seeking an increase in its gas delivery and transportation rates based on a 12 months ending June 2014 test year. The request seeks authority to recover new investment in system reliability, regulatory compliance and technology enhancements. These investments are part of the Company’s Growing Forward strategy which calls for investing about $7 billion in utility operations over the next 5 years. Anticipated lower gas commodity prices during the test year period will reduce customer bills by approximately $150 million, more than offsetting the requested increase for all customers that purchase their gas from Consumers Energy. The filing also seeks approval of several rate adjustment mechanisms, including an investment recovery mechanism that would allow recovery in 2015 of an additional $70 million for incremental 2014 and 2015 investments, subject to reconciliation. The proposed overall rate of return is based on a 10.50% authorized return on equity. If approved, the $49 million revenue deficiency would add about 3.4% to the typical residential customer’s average monthly bill. Because the rates approved in Case No. U-16855 were the result of a settlement agreement, specific cost of service items were not identified in that rate order. Therefore, the items identified on Lines 1-5 be elow are comparisons to amounts which the Company assumed were reflected in the U-16855 final order.
Item $ Millions Remarks
1. Rate Base $59 New investment gas infrastructure: $37
Depreciation: $12
Property taxes: $3
Income taxes, AFUDC and other: $7
2. Working Capital(27) Lower gas inventory cost
3. Cost of Capital(3) Reduced debt cost and capital structure change: ($7)
ROE at 10.5% versus authorized 10.3%: $4
4. O&M 12 Distribution & Cust Ops; Corporate: $15
Compensation and benefits: $9
Technology: $5
Uncollectibles: ($4)
LAUF and compaany use: ($13)
5. Gross Margin 8 Sales and transportation revenue: $9
Miscellaneous revenues: ($1)
6. Total $49
Ratemaking Existing As Filed After-Tax
Capital Structure(U-16855)* Percent of Total Annual Cost Weighted Costs
Long Term Debt 39.37% 38.38% 5.39% 2.07%
Short Term Debt 1.71 1.77 2.56 0.05
Preferred Stock 0.40 0.37 4.46 0.02
Common Equity 41.34(1) 40.99(2) 10.50 4.30
Deferred FIT 16.24 17.60 0.00 0.00
JDITC/Other .94 .89 0.05
100.00% 100.00% 6.49%(3)
Rate Base and Return Existing
Percentage(U-16855)* As Filed
Rate Base (billion) $3.14 $3.24
Return on Rate Base 6.59% 6.49%
Return on Equity 10.30% 10.50%
(1)Equivalent to 50.96% on financial basis. (2)Equivalent to 51.40% on financial basis.
(3)
Equivalent to 9.26% pre-tax basis.
*Assumed. Final order was a result of a settlement agreement which did not identify these items specifically.
27
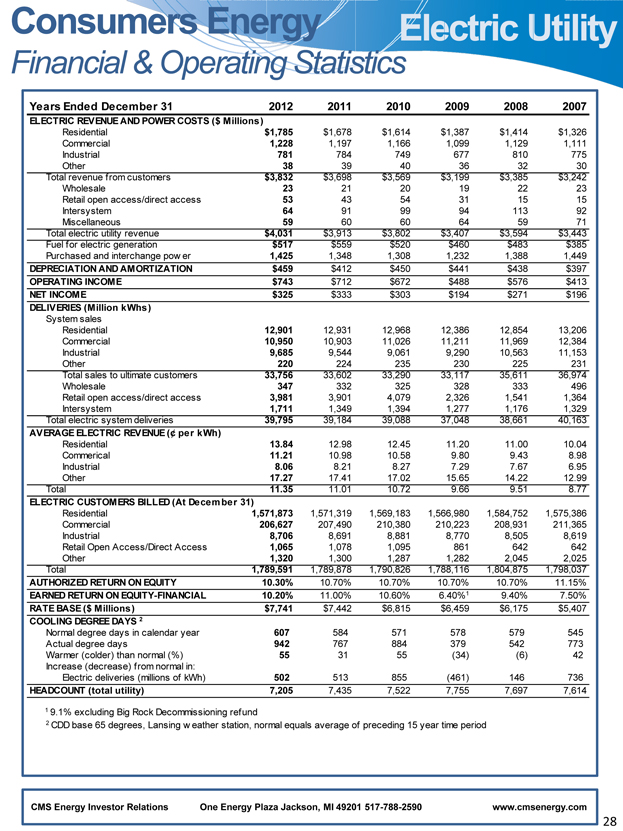
Financial & Operating Statistics
Years Ended December 31 2012 2011 2010 2009 2008 2007
ELECTRIC REVENUE AND POWER COSTS ($ Millions)
Residential $1,785 $1,678 $1,614 $1,38 $1,414 $1,326
Commercial 1,228 1,197 1,166 1,09 1,129 1,111
I dustrial 781 784 749 67 810 775
Other 38 39 40 3 32 30
Total revenue from customers $3,832 $3,698 $3,569 $3,19 $3,385 $3,242
holesale 23 21 20 1 22 23
Retail open access/direct a cess 53 43 54 3 15 15
I tersystem 64 91 99 9 113 92
Miscellaneous 59 60 60 6 59 71
Total electric utility revenue $4,031 $3,913 $3,802 $3,40 $3,594 $3,443
Fuel for electric generation $517 $559 $520 $46 $483 $385
Purchased and interchange pow er 1,425 1,348 1,308 1,23 1,388 1,449
DEPRECIATION AND AM ORTIZATION $459 $412 $450 $441 $438 $397
OPERATING INCOME $743 $712 $672 $488 $576 $413
NET INCOME $325 $333 $303 $194 $271 $196
DELIVERIES (Million kWhs)
System sales
Residential 12,901 12,931 12,968 12,38 12,854 13,206
Commercial 10,950 10,903 11,026 11,21 11,969 12,384
I dustrial 9,685 9,544 9,061 9,29 10,563 11,153
Other 220 224 235 23 225 231
Total sales to ultimate customers 33,756 33,602 33,290 33,11 35,611 36,974
holesale 347 332 325 32 333 496
Retail open access/direct a cess 3,981 3,901 4,079 2,32 1,541 1,364
I tersystem 1,711 1,349 1,394 1,27 1,176 1,329
Total electric system deliv ries 39,795 39,184 39,088 37,04 38,661 40,163
AVERAGE ELECTRIC REVENUE (¢ per k Wh)
Residential 13.84 12.98 12.45 11.2 11.00 10.04
Commerical 11.21 10.98 10.58 9.8 9.43 8.98
I dustrial 8.06 8.21 8.27 7.2 7.67 6.95
Other 17.27 17.41 17.02 15.6 14.22 12.99
Total 11.35 11.01 10.72 9.6 9.51 8.77
ELECTRIC CUSTOMERS BILLED (At De cem ber 31)
Residential 1,571,873 1,571,319 1,569,183 1,566,98 ,584,752 1, 75,386
Commercial 206,627 207,490 210,380 210,22 208,931 11,365
I dustrial 8,706 8,691 8,881 8,77 8,505 8,619
Retail Open Access/Direct ccess 1,065 1,078 1,095 86 642 642
Other 1,320 1,300 1,287 1,28 2,045 2,025
Total 1,789,591 1,789,878 1,790,826 1,788,11 ,804,875 1, 98,037
AUTHORIZED RETURN ON EQUITY 10.30% 10.70% 10.70% 10.70% 10.70% 11.15%
EARNED RETURN ON EQUITY-FINANCIAL 10.20% 11.00% 10.60% 6.40%1 9.40% 7.50%
RATE BASE ($ Millions) $7,741 $7,442 $6,815 $6,459 $6,175 $5,407
COOLING DEGREE DAYS 2
Normal degree days in calendar year 607 584 571 578 579 545
Actual degree days 942 767 884 379 542 773
War er (colder) than normal (%) 55 31 55(34)(6) 42
Increase (decrease) from normal in:
Electric deli eries (millions of kWh) 502 513 855(461) 146 736
HEADCOUNT (total utility) 7,205 7,435 7,522 7,755 7,697 7,614
1 9.1% excluding Big Rock Decommissioning ref und
2 CDD base 65 degrees, Lansing w eather station, normal equals average of preceding 15 year time period
CMS Energy Investor Relations One Energy Plaza Jackson, MI 49201 517-788-2590 www.cmsenergy.com
28
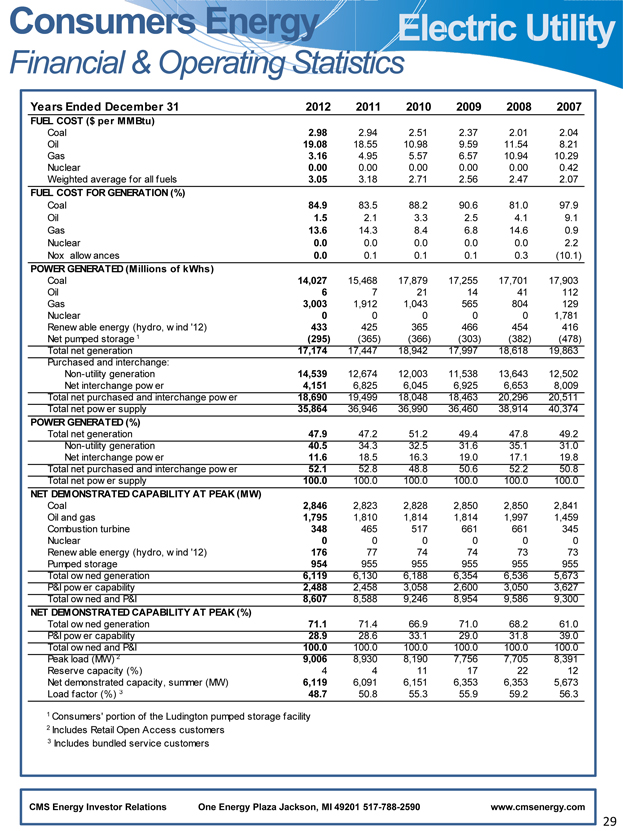
Financial & Operating Statistics
Years Ended Decembe r 31 2012 2011 2010 2009 2008 2007
FUEL COST ($ pe r MM Btu)
Coal .98 2.94 2.51 2.37 2.01 2.04
Oil 1 .08 18.55 10.98 9.59 11.54 8.21
Gas .16 4.95 5.57 6.57 10.94 10.29
Nuclear .00 0.00 0.00 0.00 0.00 0.42
Weighted average f or all fuels .05 3.18 2.71 2.56 2.47 2.07
FUEL COST FOR GENERATION (%)
Coal 84.9 83.5 88.2 90.6 81.0 97.9
Oil 1.5 2.1 3.3 2.5 4.1 9.1
Gas 13.6 14.3 8.4 6.8 14.6 0.9
Nuclear 0.0 0.0 0.0 0.0 0.0 2.2
Nox allow ances 0.0 0.1 0.1 0.1 0.3(10.1)
POWER GENERATED (Millions of kWhs)
Coal 14,027 15,468 17,879 17,255 17,701 17,903
Oil 6 7 21 14 41 112
Gas 3,003 1,912 1,043 565 804 129
Nuclear 0 0 0 0 0 1,781
Renew able energy (hydro, w ind ‘12) 433 425 365 466 454 416
Net pumped storage 1(295)(365)(366)(303)(382)(478)
Total net generation 17,174 17,447 18,942 17,997 18,618 19,863
Purchased and interchange:
Non-utility generation 14,539 12,674 12,003 11,538 13,643 12,502
Net interchange pow er 4,151 6,825 6,045 6,925 6,653 8,009
Total net purchased and interchange pow er 18,690 19,499 18,048 18,463 20,296 20,511
Total net pow er supply 35,864 36,946 36,990 36,460 38,914 40,374
POWER GENERATED (%)
Total net generation 7.9 47.2 51.2 49.4 47.8 49.2
Non-utility generation 0.5 34.3 32.5 31.6 35.1 31.0
Net interchange pow er 1.6 18.5 16.3 19.0 17.1 19.8
Total net purchased and interchange pow er 2.1 52.8 48.8 50.6 52.2 50.8
Total net pow er supply 1 0.0 100.0 100.0 100.0 100.0 100.0
NET DEMONSTRATED CAPABILITY AT PEAK (MW)
Coal 2,846 2,823 2,828 2,850 2,850 2,841
Oil and gas 1,795 1,810 1,814 1,814 1,997 1,459
Combustion turbine 348 465 517 661 661 345
Nuclear 0 0 0 0 0 0
Renew able energy (hydro, w ind ‘12) 176 77 74 74 73 73
Pumped storage 954 955 955 955 955 955
Total ow ned generation 6,119 6,130 6,188 6,354 6,536 5,673
P&I pow er capability 2,488 2,458 3,058 2,600 3,050 3,627
Total ow ned and P&I 8,607 8,588 9,246 8,954 9,586 9,300
NET DEMONSTRATED CAPABILITY AT PEAK (%)
Total ow ned generation 1.1 71.4 66.9 71.0 68.2 61.0
P&I pow er capability 8.9 28.6 33.1 29.0 31.8 39.0
Total ow ned and P&I 1 0.0 100.0 100.0 100.0 100.0 100.0
Peak load (MW) 2 9,006 8,930 8,190 7,756 7,705 8,391
Reserve capacity (%) 4 4 11 17 22 12
Net demonstrated capacity, summer (MW) 6,119 6,091 6,151 6,353 6,353 5,673
Load factor (%) 3 8.7 50.8 55.3 55.9 59.2 56.3
1 Consumers’ portion of the Ludington pumped storage f acility
2 Includes Retail Open Access customers
3 Includes bundled service customers
CMS Energy Investor Relations One Energy Plaza Jackson, MI 49201 517-788-2590 www.cmsenergy.com
29
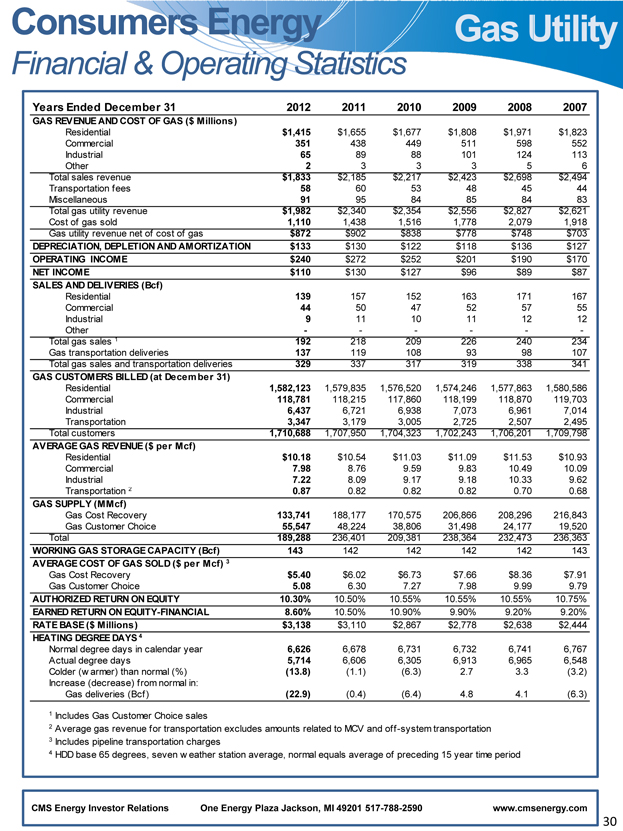
Financial & Operating Statistics
Years Ended December 31 2012 2011 2010 2009 2008 2007
GAS REVENUE AND COST OF GAS ($ Millions)
Residential $1,415 $1,655 $1,677 $1,808 $ ,971 $1,823
Commercial 351 438 449 511 598 552
Industrial 65 89 88 101 124 113
Other 2 3 3 3 5 6
Total sales revenue $1,833 $2,185 $2,217 $2,423 $ ,698 $2,494
Transportation fees 58 60 53 48 45 44
Miscellaneous 91 95 84 85 84 83
Total gas utility revenue $1,982 $2,340 $2,354 $2,556 $ ,827 $2,621
Cost of gas sold 1,110 1,438 1,516 1,778 ,079 1,918
Gas utility revenue net of cost of gas $872 $902 $838 $778 $748 $703
DEPRECIATION, DEPLETION AND AMORTIZATION $133 $130 $122 $118 $136 $127
OPERATING INCOME $240 $272 $252 $201 $190 $170
NET INCOME $110 $130 $127 $96 $89 $87
SALES AND DELIVERIES (Bcf)
Residential 139 157 152 163 171 167
Commercial 44 50 47 52 57 55
Industrial 9 11 10 11 12 12
Other — — —
Total gas sales 1 192 218 209 226 240 234
Gas transportation deliveries 137 119 108 93 98 107
Total gas sales and transportation deliveries 329 337 317 319 338 341
GAS CUSTOMERS BILLED (at De cem ber 31)
Residential 1,582,123 1,579,835 1,576,520 1,574,246 1,57 ,863 1,580,586
Commercial 118,781 118,215 117,860 118,199 11 ,870 119,703
Industrial 6,437 6,721 6,938 7,073 ,961 7,014
Transportation 3,347 3,179 3,005 2,725 ,507 2,495
Total customers 1,710,688 1,707,950 1,704,323 1,702,243 1,70 ,201 1,709,798
AVERAGE GAS REVENUE ($ per Mcf)
Residential $10.18 $10.54 $11.03 $11.09 $ 1.53 $10.93
Commercial 7.98 8.76 9.59 9.83 0.49 10.09
Industrial 7.22 8.09 9.17 9.18 0.33 9.62
Transportation 2 0.87 0.82 0.82 0.82 0.70 0.68
GAS SUPPLY (MM cf)
Gas Cost Recovery 133,741 188,177 170,575 206,866 20 ,296 216,843
Gas Customer Choice 55,547 48,224 38,806 31,498 2 ,177 19,520
Total 189,288 236,401 209,381 238,364 23 ,473 236,363
WORKING GAS STORAGE CAPACITY (Bcf) 143 142 142 142 142 143
AVERAGE COST OF GAS SOLD ($ per Mcf) 3
Gas Cost Recovery $5.40 $6.02 $6.73 $7.66 8.36 $7.91
Gas Customer Choice 5.08 6.30 7.27 7.98 9.99 9.79
AUTHORIZED RETURN ON EQUITY 10.30% 10.50% 10.55% 10.55% 10.55% 10.75%
EARNED RETURN ON EQUITY-FINANCIAL 8.60% 10.50% 10.90% 9.90% 9.20% 9.20%
RATE BASE ($ Millions ) $3,138 $3,110 $2,867 $2,778 $2,638 $2,444
HEATING DEGREE DAYS 4
Normal degree days in calendar year 6,626 6,678 6,731 6,732 ,741 6,767
Actual degree days 5,714 6,606 6,305 6,913 ,965 6,548
Colder (w armer) than normal (%)(13.8)(1.1)(6.3) 2.7 3.3(3.2)
Increase (decrease) from normal in:
Gas deliveries (Bcf)(22.9)(0.4)(6.4) 4.8 4.1(6.3)
1 Includes Gas Customer Choice sales
2 Average gas revenue for transportation excludes amounts related to MCV and off-system transportation
3 Includes pipeline transportation charges
4 HDD base 65 degrees, seven w eather station average, normal equals average of preceding 15 year time period
CMS Energy Investor Relations One Energy Plaza Jackson, MI 49201 517-788-2590 www.cmsenergy.com
30
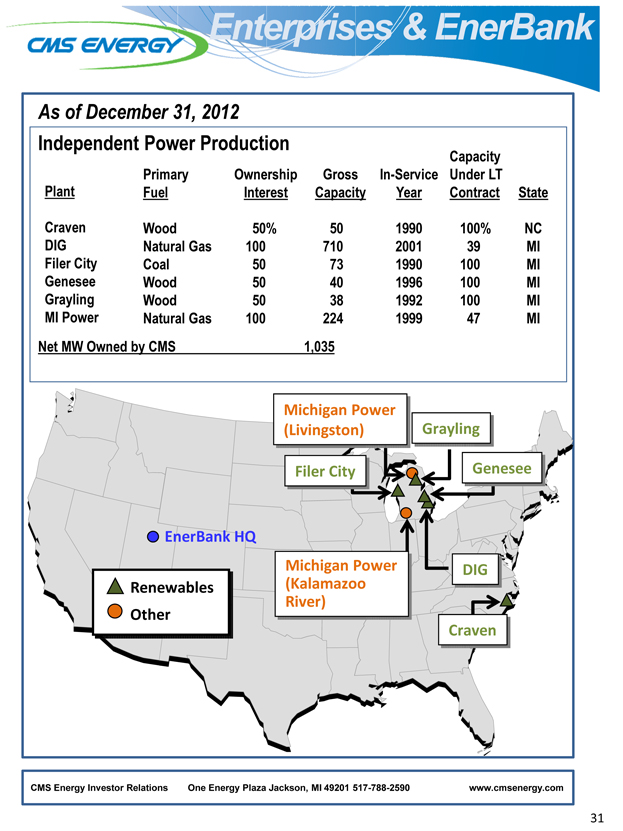
As of December 31, 2012
Independent Power Production
Capacity
Primary Ownership Gross In-Service Under LT
Plant Fuel Interest Capacity Year Contract State
Craven Wood 50% 50 1990 100% NC
DIG Natural Gas 100 710 2001 39 MI
Filer City Coal 50 73 1990 100 MI
Genesee Wood 50 40 1996 100 MI
Grayling Wood 50 38 1992 100 MI
MI Power Natural Gas 100 224 1999 47 MI
Net MW Owned by CMS 1,035
Michigan Power
(Livingston) Grayling
Filer City Genesee
EnerBank HQ
Michigan Power DIG
Renewables(Kalamazoo
River)
Other
Craven
CMS Energy Investor Relations One Energy Plaza Jackson, MI 49201 517-788-2590 www.cmsenergy.com
31

GAAP Reconciliation
32
CMS ENERGY CORPORATION
Earnings Per Share By Year GAAP Reconciliation
(Unaudited)
| | | | | | | | | | | | | | | | | | | | | | | | | | | | | | | | | | | | | | | | |
| | | 2003
| | | 2004
| | | 2005
| | | 2006
| | | 2007
| | | 2008
| | | 2009
| | | 2010
| | | 2011
| | | 2012
| |
Reported earnings (loss) per share - GAAP | | ($ | 0.30 | ) | | $ | 0.64 | | | ($ | 0.44 | ) | | ($ | 0.41 | ) | | ($ | 1.02 | ) | | $ | 1.20 | | | $ | 0.91 | | | $ | 1.28 | | | $ | 1.58 | | | $ | 1.42 | |
| | |
|
|
| |
|
|
| |
|
|
| |
|
|
| |
|
|
| |
|
|
| |
|
|
| |
|
|
| |
|
|
| |
|
|
|
After-tax items: | | | | | | | | | | | | | | | | | | | | | | | | | | | | | | | | | | | | | | | | |
Electric and gas utility | | | 0.21 | | | | (0.39 | ) | | | — | | | | — | | | | (0.07 | ) | | | 0.05 | | | | 0.33 | | | | 0.03 | | | | 0.00 | | | | 0.17 | |
Enterprises | | | 0.74 | | | | 0.62 | | | | 0.04 | | | | (0.02 | ) | | | 1.25 | | | | (0.02 | ) | | | 0.09 | | | | (0.03 | ) | | | (0.11 | ) | | | (0.01 | ) |
Corporate interest and other | | | 0.16 | | | | (0.03 | ) | | | 0.04 | | | | 0.27 | | | | (0.32 | ) | | | (0.02 | ) | | | 0.01 | | | | * | | | | (0.01 | ) | | | * | |
Discontinued operations (income) loss | | | (0.16 | ) | | | 0.02 | | | | (0.07 | ) | | | (0.03 | ) | | | 0.40 | | | | (*) | | | | (0.08 | ) | | | 0.08 | | | | (0.01 | ) | | | (0.03 | ) |
Asset impairment charges, net | | | — | | | | — | | | | 1.82 | | | | 0.76 | | | | 0.60 | | | | — | | | | — | | | | — | | | | — | | | | — | |
Cumulative accounting changes | | | 0.16 | | | | 0.01 | | | | — | | | | — | | | | — | | | | — | | | | — | | | | — | | | | — | | | | — | |
| | |
|
|
| |
|
|
| |
|
|
| |
|
|
| |
|
|
| |
|
|
| |
|
|
| |
|
|
| |
|
|
| |
|
|
|
Adjusted earnings per share, including MTM - non-GAAP | | $ | 0.81 | | | $ | 0.87 | | | $ | 1.39 | | | $ | 0.57 | | | $ | 0.84 | | | | $1.21 | (a) | | $ | 1.26 | | | $ | 1.36 | | | $ | 1.45 | | | $ | 1.55 | |
Mark-to-market impacts | | | | | | | 0.03 | | | | (0.43 | ) | | | 0.51 | | | | | | | | | | | | | | | | | | | | | | | | | |
| | |
|
|
| |
|
|
| |
|
|
| |
|
|
| |
|
|
| |
|
|
| |
|
|
| |
|
|
| |
|
|
| |
|
|
|
Adjusted earnings per share, excluding MTM - non-GAAP | | | NA | | | $ | 0.90 | | | $ | 0.96 | | | $ | 1.08 | | | | NA | | | | NA | | | | NA | | | | NA | | | | NA | | | | NA | |
| | |
|
|
| |
|
|
| |
|
|
| |
|
|
| |
|
|
| |
|
|
| |
|
|
| |
|
|
| |
|
|
| |
|
|
|
| * | | Less than $500 thousand or $0.01 per share. |
| (a) | | $1.25 excluding discontinued Exeter operations and accounting changes related to convertible debt and restricted stock. |
2003-12 EPS
CMS Energy
Reconciliation of Gross Operating Cash Flow to GAAP Operating Activities
(unaudited)
(mils)
| | | | | | | | | | | | | | | | | | | | | | | | | | | | |
| | | 2011
| | | 2012
| | | 2013
| | | 2014
| | | 2015
| | | 2016
| | | 2017
| |
Consumers Operating Income + Depreciation & Amortization | | $ | 1,527 | | | $ | 1,635 | | | $ | 1,735 | | | $ | 1,821 | | | $ | 1,948 | | | $ | 2,011 | | | $ | 2,113 | |
Enterprises Project Cash Flows | | | 24 | | | | 17 | | | | 20 | | | | 29 | | | | 37 | | | | 44 | | | | 56 | |
| | |
|
|
| |
|
|
| |
|
|
| |
|
|
| |
|
|
| |
|
|
| |
|
|
|
Gross Operating Cash Flow | | $ | 1,551 | | | $ | 1,652 | | | $ | 1,755 | | | $ | 1,850 | | | $ | 1,985 | | | $ | 2,055 | | | $ | 2,169 | |
Other operating activities including taxes, interest payments and working capital | | | (382 | ) | | | (411 | ) | | | (405 | ) | | | (400 | ) | | | (435 | ) | | | (805 | ) | | | (819 | ) |
| | |
|
|
| |
|
|
| |
|
|
| |
|
|
| |
|
|
| |
|
|
| |
|
|
|
Net cash provided by operating activities | | $ | 1,169 | | | $ | 1,241 | | | $ | 1,350 | | | $ | 1,450 | | | $ | 1,550 | | | $ | 1,250 | | | $ | 1,350 | |
| | |
|
|
| |
|
|
| |
|
|
| |
|
|
| |
|
|
| |
|
|
| |
|
|
|
2011-17 OCF
CMS Energy
2012 Reconciliation of Gross Operating Cash Flow to GAAP Operating Activities
(unaudited)
(mils)
| | | | |
| | | 2012
| |
Consumers Operating Income + Depreciation & Amortization | | $ | 1,635 | (a) |
Enterprises Project Cash Flows | | | 17 | |
| | |
|
|
|
Gross Operating Cash Flow | | $ | 1,652 | |
Other operating activities including taxes, interest payments and working capital | | | (411 | ) |
| | |
|
|
|
Net cash provided by operating activities | | $ | 1,241 | |
| | |
|
|
|
| (a) | | Excludes impact of $59 million electric decoupling write off |
2012 OCF
Consumers Energy
2013 Forecasted Cash Flow GAAP Reconciliation (in millions) (unaudited)
| | | | | | | | | | | | | | | | | | | | | | | | | | | | | | | | | | | | | | |
| | | Reclassifications From Sources and Uses to Statement of Cash Flows
| | | |
Presentation Sources and Uses
| | | Tax
Sharing
Operating
| | | Interest
Payments
as
Operating
| | | Other
Working
Capital
as
Investing
| | | Capital
Lease
Pymts as
Financing
| | | Securitization
Debt Pymts
as
Financing
| | | Preferred
Dividends
as
Financing
| | | Common
Dividends
as
Financing
| | | Consolidated Statements of
Cash Flows
|
Description
| | non-GAAP
Amount
| | | | | | | | | | GAAP
Amount
| | | Description
|
Cash at year end 2012 | | $ | 5 | | | $ | — | | | $ | — | | | $ | — | | | $ | — | | | $ | — | | | $ | — | | | $ | — | | | $ | 5 | | | Cash at year end 2012 |
| | | | | | | | | | |
Sources | | | | | | | | | | | | | | | | | | | | | | | | | | | | | | | | | | | | | | |
Operating (dep & amort $620) | | $ | 1,735 | | | | | | | | | | | | | | | | | | | | | | | | | | | | | | | | | | | |
Other working capital | | | (10) | | | | | | | | | | | | | | | | | | | | | | | | | | | | | | | | | | | |
| | |
|
|
| |
|
|
| |
|
|
| |
|
|
| |
|
|
| |
|
|
| |
|
|
| |
|
|
| |
|
|
| | |
Sources | | $ | 1,725 | | | $ | (125 | ) | | $ | (228 | ) | | $ | (101 | ) | | $ | 28 | | | $ | 41 | | | $ | — | | | $ | — | | | $ | 1,340 | | | Net cash provided by operating activities |
| | | | | | | | | | |
Uses | | | | | | | | | | | | | | | | | | | | | | | | | | | | | | | | | | | | | | |
Interest and preferred dividends | | $ | (230) | | | | | | | | | | | | | | | | | | | | | | | | | | | | | | | | | | | |
Pension Contribution | | | (49) | | | | | | | | | | | | | | | | | | | | | | | | | | | | | | | | | | | |
Capital expendituresa | | | (1,375) | | | | | | | | | | | | | | | | | | | | | | | | | | | | | | | | | | | |
Dividends/tax sharing to CMS | | | (540) | | | | | | | | | | | | | | | | | | | | | | | | | | | | | | | | | | | |
| | |
|
|
| |
|
|
| |
|
|
| |
|
|
| |
|
|
| |
|
|
| |
|
|
| |
|
|
| |
|
|
| | |
Uses | | $ | (2,194) | | | $ | 125 | | | $ | 228 | | | $ | 101 | | | $ | — | | | $ | — | | | $ | 2 | | | $ | 415 | | | $ | (1,323 | ) | | Net cash provided by investing activities |
| | |
|
|
| |
|
|
| |
|
|
| |
|
|
| |
|
|
| |
|
|
| |
|
|
| |
|
|
| |
|
|
| | |
Cash flow | | $ | (469 | ) | | $ | — | | | $ | — | | | $ | — | | | $ | 28 | | | $ | 41 | | | $ | 2 | | | $ | 415 | | | $ | 17 | | | Cash flow from operating and investing activities |
| | | | | | | | | | |
Financing | | | | | | | | | | | | | | | | | | | | | | | | | | | | | | | | | | | | | | |
Equity | | $ | 150 | | | | | | | | | | | | | | | | | | | | | | | | | | | | | | | | | | | |
New Issues | | | 325 | | | | | | | | | | | | | | | | | | | | | | | | | | | | | | | | | | | |
Retirements | | | — | | | | | | | | | | | | | | | | | | | | | | | | | | | | | | | | | | | |
Net short-term financing & other | | | 15 | | | | | | | | | | | | | | | | | | | | | | | | | | | | | | | | | | | |
| | |
|
|
| |
|
|
| |
|
|
| |
|
|
| |
|
|
| |
|
|
| |
|
|
| |
|
|
| |
|
|
| | |
Financing | | $ | 490 | | | $ | — | | | $ | — | | | $ | — | | | $ | (28 | ) | | $ | (41 | ) | | $ | (2 | ) | | $ | (415 | ) | | $ | 4 | | | Net cash provided by financing activities |
| | |
|
|
| |
|
|
| |
|
|
| |
|
|
| |
|
|
| |
|
|
| |
|
|
| |
|
|
| |
|
|
| | |
Net change in cash | | $ | 21 | | | $ | — | | | $ | — | | | $ | — | | | $ | — | | | $ | — | | | $ | — | | | $ | — | | | $ | 21 | | | Net change in cash |
| | |
|
|
| |
|
|
| |
|
|
| |
|
|
| |
|
|
| |
|
|
| |
|
|
| |
|
|
| |
|
|
| | |
Cash at year end 2013 | | $ | 26 | | | $ | — | | | $ | — | | | $ | — | | | $ | — | | | $ | — | | | $ | — | | | $ | — | | | $ | 26 | | | Cash at year end 2013 |
| | |
|
|
| |
|
|
| |
|
|
| |
|
|
| |
|
|
| |
|
|
| |
|
|
| |
|
|
| |
|
|
| | |
| a | | Includes cost of removal and capital leases |
2013 B-1
CMS Energy Parent
2013 Forecasted Cash Flow GAAP Reconciliation
(in millions) (unaudited)
| | | | | | | | | | | | | | | | | | | | | | | | | | |
| | | Reclassifications From Sources and Uses to Statement of Cash Flows
| | | | | | |
Presentation Sources and Uses
| | | Interest | | | Overheads & | | | Other | | | Cash From | | | Consolidated Statements of
Cash Flows
|
Description
| | non-GAAP
Amount
| | | Payments
as Operating
| | | Tax Payments
as Operating
| | | Uses (a)
as Operating
| | | Consolidated
Companies
| | | GAAP
Amount
| | | Description
|
Cash at year end 2012 | | $ | 53 | | | $ | — | | | $ | — | | | $ | — | | | $ | 35 | | | $ | 88 | | | Cash at year end 2012 |
Sources | | | | | | | | | | | | | | | | | | | | | | | | | | |
Consumers Energy dividends/tax sharing | | $ | 540 | | | | | | | | | | | | | | | | | | | | | | | |
Enterprises | | | 20 | | | | | | | | | | | | | | | | | | | | | | | |
| | |
|
|
| |
|
|
| |
|
|
| |
|
|
| |
|
|
| |
|
|
| |
|
Sources | | $ | 560 | | | $ | (135 | ) | | $ | (15 | ) | | $ | (6 | ) | | $ | 23 | | | $ | 427 | | | Net cash provided by operating activities |
Uses | | | | | | | | | | | | | | | | | | | | | | | | | | |
Interest and preferred dividends | | $ | (135 | ) | | | | | | | | | | | | | | | | | | | | | | |
Overhead and Federal tax payments | | | (15 | ) | | | | | | | | | | | | | | | | | | | | | | |
Equity infusions | | | (150 | ) | | | | | | | | | | | | | | | | | | | | | | |
Pension Contribution | | | (1 | ) | | | | | | | | | | | | | | | | | | | | | | |
| | |
|
|
| |
|
|
| |
|
|
| |
|
|
| |
|
|
| |
|
|
| | |
Uses(a) | | $ | (315 | ) | | $ | 135 | | | $ | 15 | | | $ | 6 | | | $ | (86 | ) | | $ | (245 | ) | | Net cash provided by investing activities |
| | |
|
|
| |
|
|
| |
|
|
| |
|
|
| |
|
|
| |
|
|
| | |
Cash flow | | $ | 245 | | | $ | — | | | $ | — | | | $ | — | | | $ | (63 | ) | | $ | 182 | | | Cash flow from operating and investing activities |
Financing and dividends | | | | | | | | | | | | | | | | | | | | | | | | | | |
New Issues | | $ | 250 | | | | | | | | | | | | | | | | | | | | | | | |
Retirements | | | — | | | | | | | | | | | | | | | | | | | | | | | |
Equity programs (DRP, continuous equity) | | | 30 | | | | | | | | | | | | | | | | | | | | | | | |
Net short-term financing & other | | | (5 | ) | | | | | | | | | | | | | | | | | | | | | | |
Common dividend | | | (270 | ) | | | | | | | | | | | | | | | | | | | | | | |
| | |
|
|
| |
|
|
| |
|
|
| |
|
|
| |
|
|
| |
|
|
| | |
Financing | | $ | 5 | | | $ | — | | | $ | — | | | $ | — | | | $ | 72 | | | $ | 77 | | | Net cash provided by financing activities |
| | |
|
|
| |
|
|
| |
|
|
| |
|
|
| |
|
|
| |
|
|
| | |
Net change in cash | | $ | 250 | | | $ | — | | | $ | — | | | $ | — | | | $ | 9 | | | $ | 259 | | | Net change in cash |
| | |
|
|
| |
|
|
| |
|
|
| |
|
|
| |
|
|
| |
|
|
| | |
Cash at year end 2013 | | $ | 303 | | | $ | — | | | $ | — | | | $ | — | | | $ | 44 | | | $ | 347 | | | Cash at year end 2013 |
| | |
|
|
| |
|
|
| |
|
|
| |
|
|
| |
|
|
| |
|
|
| | |
2013 B-2
Consolidated CMS Energy
2013 Forecasted Consolidation of Consumers Energy and CMS Energy Parent Statements of Cash Flow
(in millions) (unaudited)
| | | | | | | | | | | | | | | | | | | | | | | | | | |
| | | | Eliminations/Reclassifications to Arrive at the
Consolidated Statement of Cash Flows
| | | | | | |
Statements of Cash Flows
| | | Consumers | | | Consumers | | | Equity | | | Consolidated Statements of
Cash Flows
|
Description
| | Consumers
Amount
| | | CMS Parent
Amount
| | | Common Dividend
as Financing
| | | Preferred Dividend
as Operating
| | | Infusions to
Consumers
| | | Amount
| | | Description
|
Cash at year end 2012 | | $ | 5 | | | $ | 88 | | | $ | — | | | $ | — | | | $ | — | | | $ | 93 | | | Cash at year end 2012 |
Net cash provided by operating activities | | $ | 1,340 | | | $ | 427 | | | $ | (415 | ) | | $ | (2 | ) | | $ | — | | | $ | 1,350 | | | Net cash provided by operating activities |
Net cash provided by investing activities | | | (1,323 | ) | | | (245 | ) | | | — | | | | — | | | | 150 | | | | (1,418 | ) | | Net cash provided by investing activities |
| | |
|
|
| |
|
|
| |
|
|
| |
|
|
| |
|
|
| |
|
|
| | |
Cash flow from operating and investing activities | | $ | 17 | | | $ | 182 | | | $ | (415 | ) | | $ | (2 | ) | | $ | 150 | | | $ | (68 | ) | | Cash flow from operating and investing activities |
Net cash provided by financing activities | | $ | 4 | | | $ | 77 | | | $ | 415 | | | $ | 2 | | | $ | (150 | ) | | $ | 348 | | | Net cash provided by financing activities |
| | |
|
|
| |
|
|
| |
|
|
| |
|
|
| |
|
|
| |
|
|
| | |
Net change in cash | | $ | 21 | | | $ | 259 | | | $ | — | | | $ | — | | | $ | — | | | $ | 280 | | | Net change in cash |
| | |
|
|
| |
|
|
| |
|
|
| |
|
|
| |
|
|
| |
|
|
| | |
Cash at year end 2013 | | $ | 26 | | | $ | 347 | | | $ | — | | | $ | — | | | $ | — | | | $ | 373 | | | Cash at year end 2013 |
| | |
|
|
| |
|
|
| |
|
|
| |
|
|
| |
|
|
| |
|
|
| | |
2013 B-3