Exhibit 99.1

Exhibit 99.1
Investor Meetings
April 30, 2013
Cross Winds Energy Park
Gas Combined Cycle Plant
Consumers Smart Energy Program
This presentation is made as of the date hereof and contains “forward-looking statements” as defined in Rule 3b-6 of the
Securities Exchange Act of 1934, as amended, Rule 175 of the Securities Act of 1933, as amended, and relevant legal decisions. The forward-looking statements are subject to risks and uncertainties. They should be read in conjunction with “FORWARD-LOOKING STATEMENTS AND INFORMATION” and “RISK FACTORS” sections of CMS Energy’s and Consumers Energy’s Form 10-K for the year ended December 31 and as updated in subsequent 10-Qs. CMS Energy’s and Consumers Energy’s “FORWARD-LOOKING STATEMENTS AND INFORMATION” and “RISK FACTORS” sections are incorporated herein by reference and discuss important factors that could cause CMS Energy’s and Consumers Energy’s results to differ materially from those anticipated in such statements. CMS Energy and Consumers Energy undertake no obligation to update any of the information presented herein to reflect facts, events or circumstances after the date hereof.
The presentation also includes non-GAAP measures when describing CMS Energy’s results of operations and financial performance. A reconciliation of each of these measures to the most directly comparable GAAP measure is included in the appendix and posted on our website at www.cmsenergy.com.
CMS Energy provides financial results on both a reported (Generally Accepted Accounting Principles) and adjusted (non-GAAP) basis. Management views adjusted earnings as a key measure of the company’s present operating financial performance, unaffected by discontinued operations, asset sales, impairments, regulatory items from prior years, or other items. Certain of these items have the potential to impact, favorably or unfavorably, the company’s reported earnings in 2013. The company is not able to estimate the impact of these matters and is not providing reported earnings guidance.
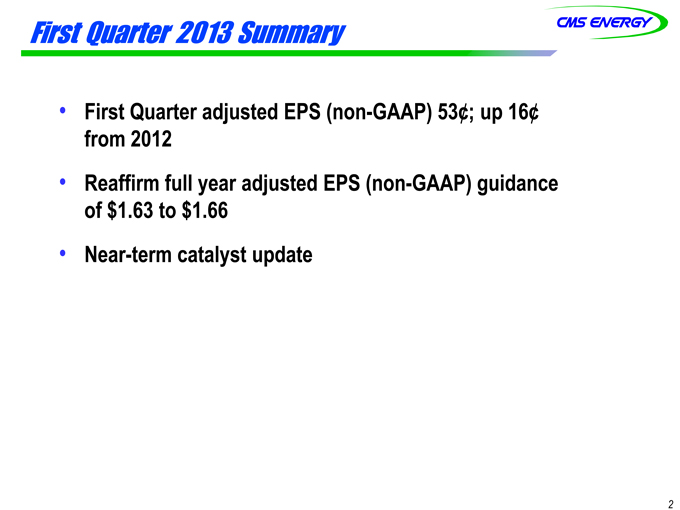
First Quarter 2013 Summary
First Quarter adjusted EPS (non-GAAP) 53¢; up 16¢ from 2012
Reaffirm full year adjusted EPS (non-GAAP) guidance of $1.63 to $1.66
Near-term catalyst update
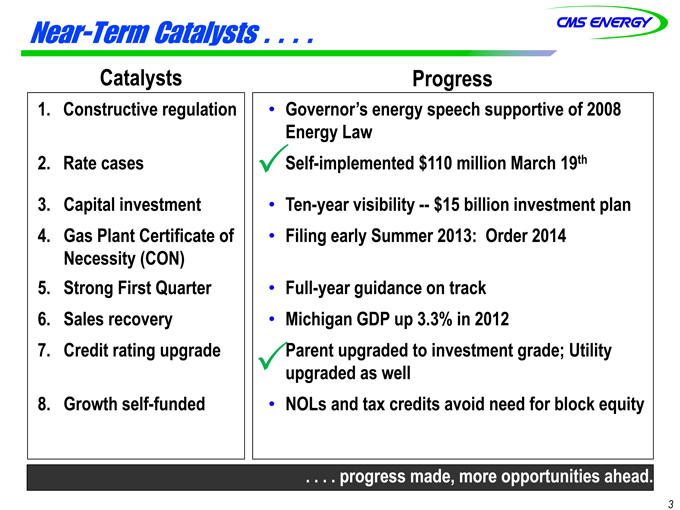
Near-Term Catalysts . . . .
Catalysts
Progress
1. Constructive regulation
Governor’s energy speech supportive of 2008 Energy Law
2. Rate cases
Self-implemented $110 million March 19th
3. Capital investment
Ten-year visibility — $15 billion investment plan
4. Gas Plant Certificate of Necessity (CON)
Filing early Summer 2013: Order 2014
5. Strong First Quarter
Full-year guidance on track
6. Sales recovery
Michigan GDP up 3.3% in 2012
7. Credit rating upgrade
Parent upgraded to investment grade; Utility upgraded as well
8. Growth self-funded
NOLs and tax credits avoid need for block equity
. . . . progressrogress made, more opportunities ahead.
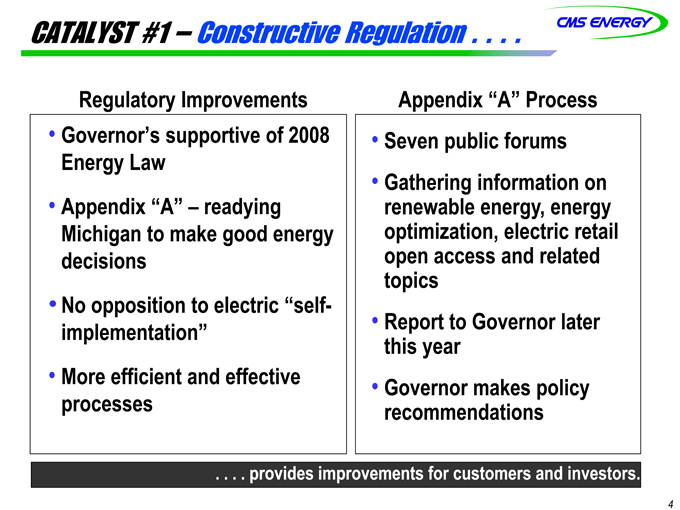
CATALYST #1 – Constructive Regulation . . . .
Regulatory Improvements
Appendix “A” Process
Governor’s supportive of 2008 Energy Law
Seven public forums
Appendix “A” – readying Michigan to make good energy decisions
Gathering information on renewable energy, energy optimization, electric retail open access and related topics
No opposition to electric “self-implementation”
Report to Governor later this year
More efficient and effective processes
Governor makes policy recommendations
. . . . providesrovides improvements for customers and investors.
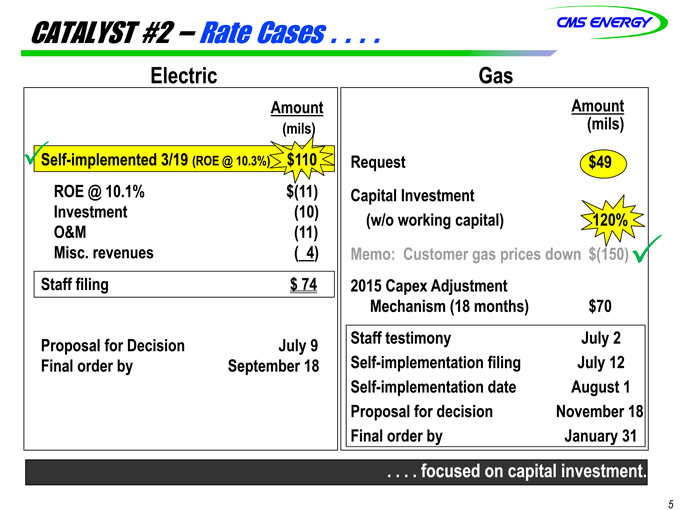
CATALYST #2 – Rate Cases . . . .
Electric
Gas
Amount
(mils)
Self-implemented 3/19 (ROE @ 10.3%)
$110
ROE @ 10.1%
$(11)
Investment
O&M
Misc. revenues
( 4)
Staff filing
$ 74
Proposal for Decision
July 9
Final order by
September 18
Amount
(mils)
Request
$49
Capital Investment
(w/o working capital)
120%
Memo: Customer gas prices down
$(150)
2015 Capex Adjustment Mechanism (18 months)
$70
Staff testimony
July 2
Self-implementation filing
July 12
Self-implementation date
August 1
Proposal for decision
November 18
Final order by
January 31
. . . . focusedocused on capital investment.
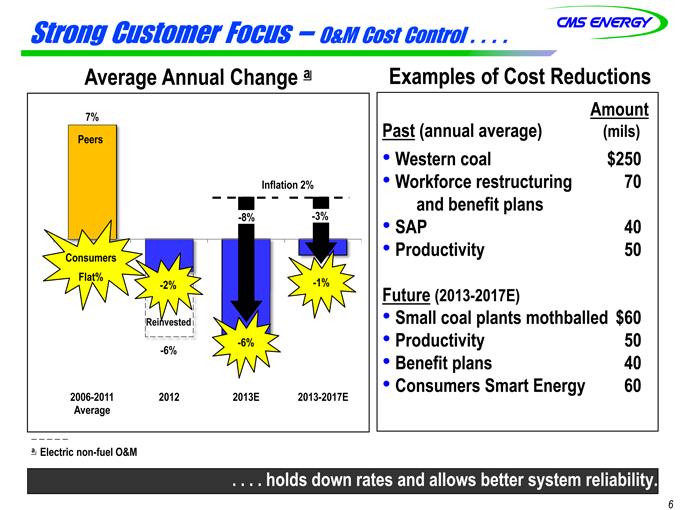
Strong Customer Focus – O&M Cost Control . . . .
Average Annual Change a
7%
Peers
Inflation 2%
-8%
-3%
Consumers Flat%
—2%
-6%
-1%
Reinvested
-6%
2006-2011 Average
2012
2013E
2013-2017E
Examples of Cost Reductions
Amount
(mils)
Past (annual average)
Western coal
$250
Workforce restructuring and benefit plans
70
SAP
40
Productivity
50
Future (2013-2017E)
Small coal plants mothballed
$60
Productivity
50
Benefit plans
40
Consumers Smart Energy
60
a Electric non-fuel O&M
. . . . holds down rates and allows better system reliability.
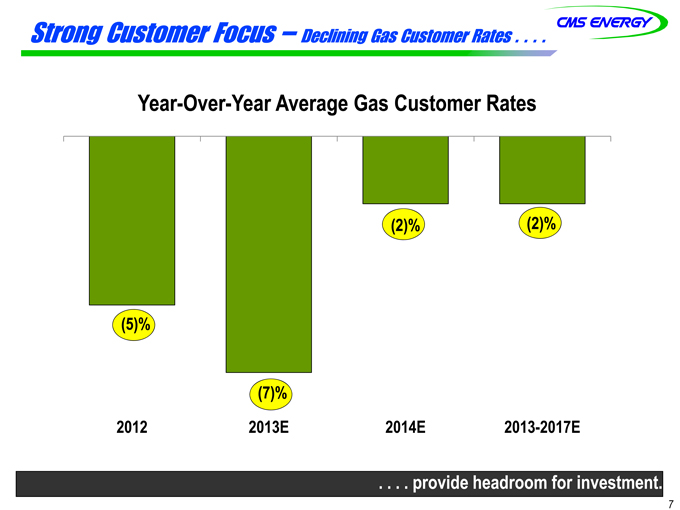
Strong Customer Focus – Declining Gas Customer Rates . . . .
Year-Over-Year ear Average Gas Customer Rates
(5)%
(7)%
(2)%
(2)%
2012
2013E
2014E
2013-2017E
. . . . providerovide headroom for investment.
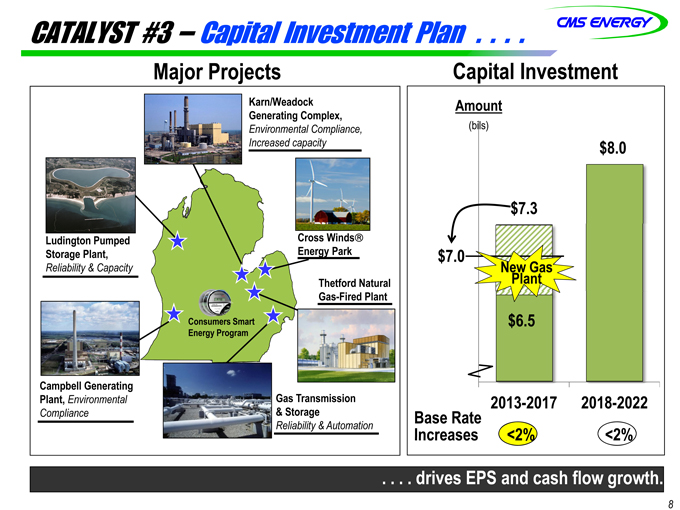
CATALYST #3 – Capital Investment Plan . . . .
Major Projects
Karn/Weadock Generating Complex,
Environmental Compliance, Increased capacity
Ludington Pumped Storage Plant,
Reliability & Capacity
Cross Winds??Energy Park
Thetford Natural Gas-Fired Plant
Campbell Generating Plant, Environmental Compliance
Gas Transmission
& Storage
Reliability & Automation
Consumers Smart Energy Program
Capital Investment
Amount
(bils)
$7.0
$7.3
$808.0
New Gas Plant
$6.5
2013-2017
2018-2022
Base Rate Increases
<2%
<2%
. . . . drivesrives EPS and cash flow growth.
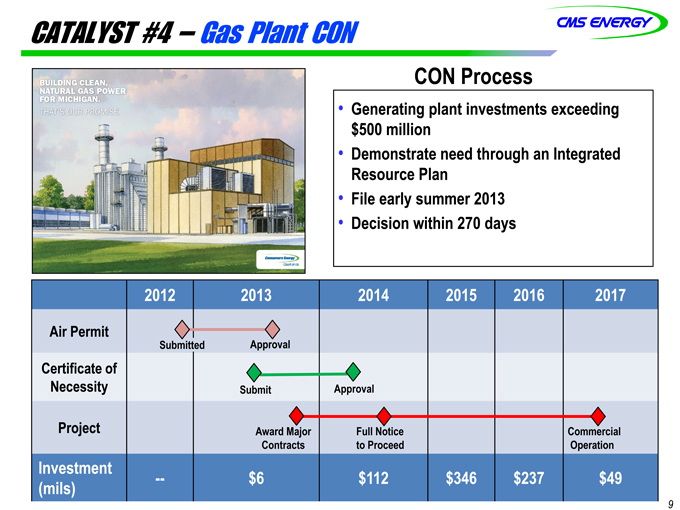
CATALYST #4 – Gas Plant CON
CON Process
Generating plant investments exceeding $500 million
Demonstrate need through an Integrated Resource Plan
File early summer 2013
Decision within 270 days
2012 2013 2014 2015 2016 2017
Air Permit
Submitted
Approval
Certificate of Necessity
Submit
Approval
Project
Award Major Contracts
Full Notice to Proceed
Commercial Operation
Investment
— $6 $112 $346 $237 $49 (mils)
9
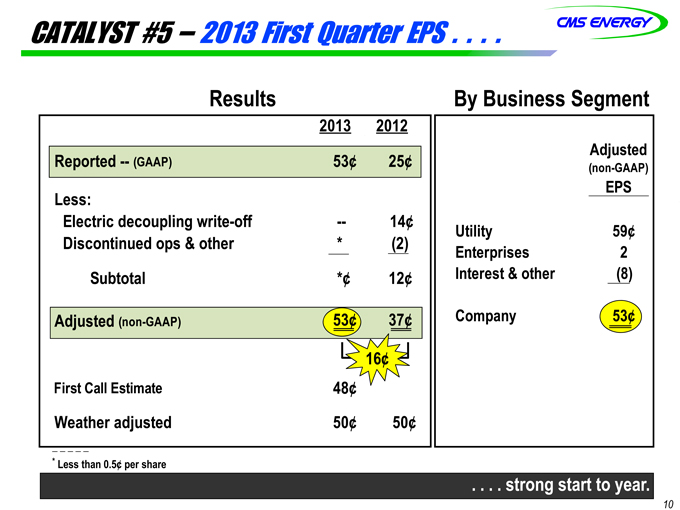
CATALYST #5 – 2013 First Quarter EPS . . . .
Results
2013 2012
Reported — (GAAP) 53¢ 25¢
Less:
Electric decoupling write-off
—
14¢
Discontinued ops & other
Subtotal *¢ 12¢
Adjusted (non-GAAP) 53¢ 37¢
16¢
First Call Estimate 48¢
Weather adjusted 50¢ 50¢
By Business Segment
Adjusted
(non-GAAP)
EPS
Utility 59¢
Enterprises 2
Interest & other (8)
Company 53¢
* | | Less than 0.5¢ per share |
. . . . strong start to year.
10
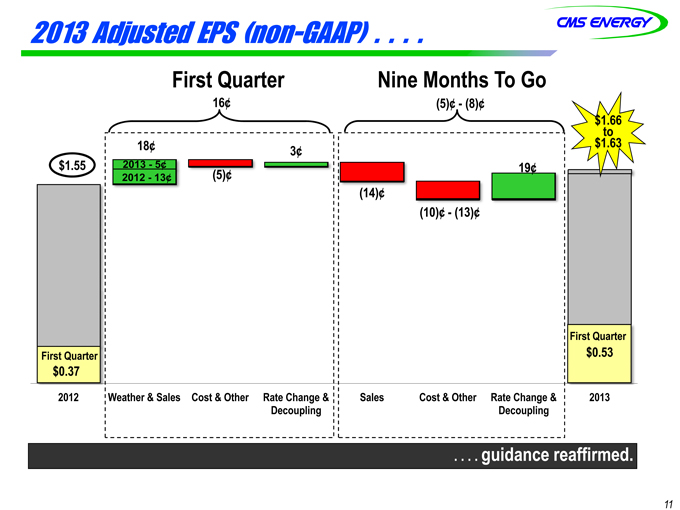
2013 Adjusted EPS (non-GAAP) . . . .
First Quarter
16¢
$1.55
18¢
2013—5¢ 2012 -13¢
First Quarter $0.37
2012
Weather & Sales Cost & Other Rate Change & Decoupling
Nine Months To Go
19¢
$1.66 to $1.63
First Quarter $0.53
2013
Sales
Cost & Other
Rate Change & Decoupling
. . . . guidance reaffirmed.
11
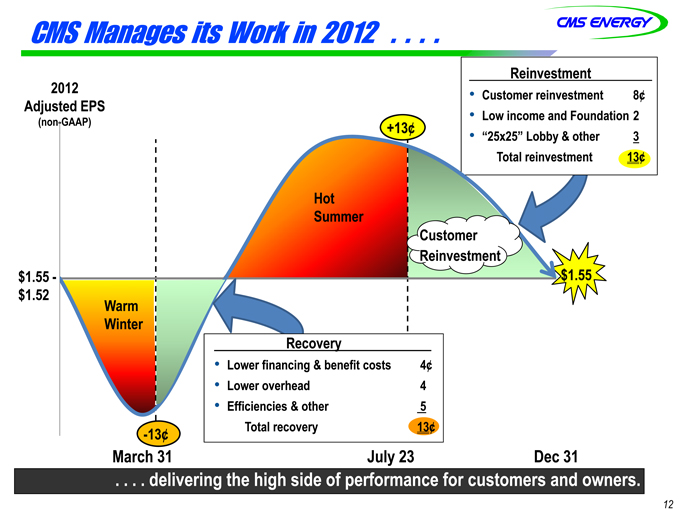
CMS Manages its Work in 2012 . . . .
2012 Adjusted EPS
(non-GAAP)
Reinvestment
Customer reinvestment 8¢
Low income and Foundation 2
“25x25” Lobby & other 3
Total reinvestment 13?
$1.55 -$1.52
+13¢
Hot Summer
Customer Reinvestment
$1.55
Warm Winter
-13¢
March 31
July 23
Dec 31
Recovery
Lower financing & benefit costs 4¢
Lower overhead 4
Efficiencies & other 5
Total recovery 13¢
. . . . deliveringelivering the high side of performance for customers and owners.
12
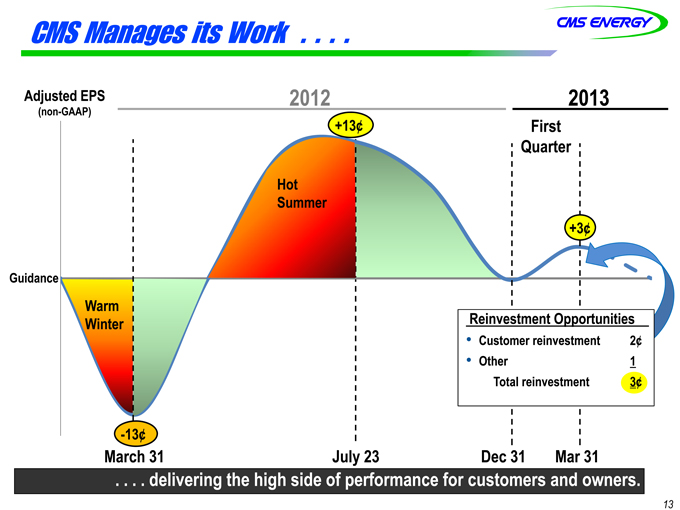
CMS Manages its Work . . . .
Adjusted EPS
(non-GAAP)
2012
2013
+13¢
First Quarter
Hot Summer
+3¢
Guidance
Warm Winter
-13¢
Reinvestment Opportunities
Customer reinvestment 2¢
Other 1
Total reinvestment 3¢
March 31 July 23 Dec 31 Mar 31
. . . . deliveringelivering the high side of performance for customers and owners.
13
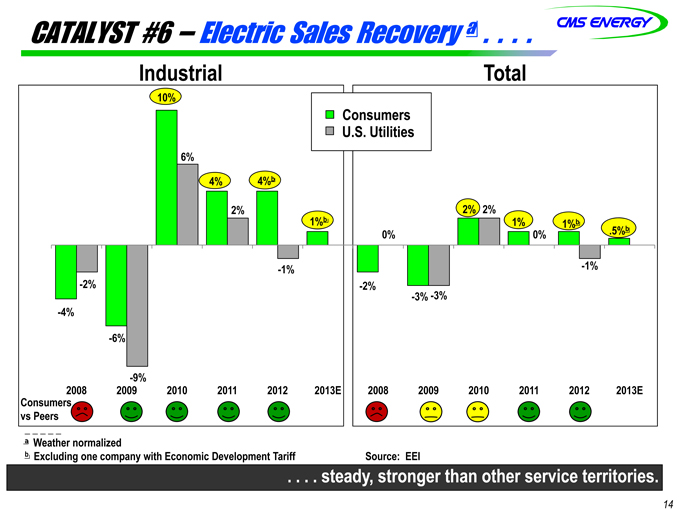
CATALYST #6 – Electric Sales Recovery a . . . .
Industrial
10%
6%
4% 4%b
2%
1%b
-1%
Consumers U.S. Utilities
-1% -2%
-4%
-6%
-9%
2008 2009 2010 2011 2012 2013E
Consumers vs Peers
2% 2%
1% 1%b .5%b
0% 0%
-1% -2% -3% -3%
Total
2008 2009 2010 2011 2012 2013E
a Weather normalized b Excluding one company with Economic Development Tariff Source: EEI
. . . . steady, stronger than other service territories.
14
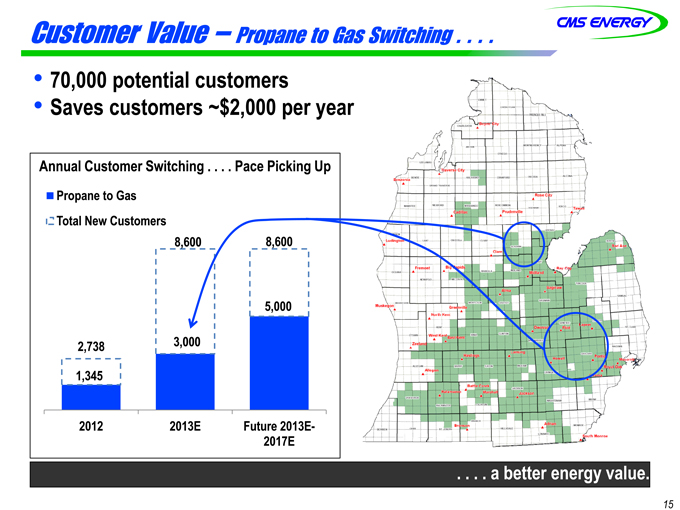
Customer Value – Propane to Gas Switching . . . .
70,000 potential customers Saves customers ~$2,000 per year
Annual Customer Switching . . . . Pace Picking Up
Propane to Gas Total New Customers
8,600 8,600
5,000
2,738 3,000 1,345
2012 2013E Future 2013E-2017E
. . . . a better etter energy value.
15
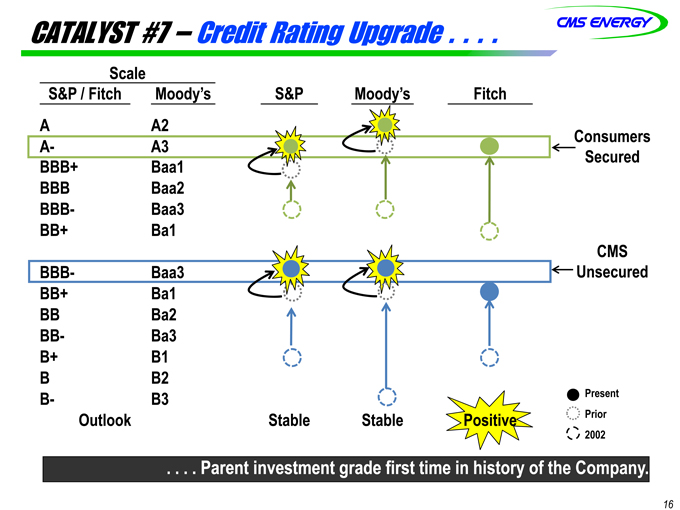
CATALYST #7 – Credit Rating Upgrade . . . .
Scale
S&P / Fitch Moody’s S&P Moody’s Fitch
A A2
A- A3 Consumers
BBB+ Baa1 Secured
BBB Baa2
BBB- Baa3
BB+ Ba1
CMS
BBB- Baa3 Unsecured
BB+ Ba1
BB Ba2
BB- Ba3
B+ B1
B B2
B- B3 Present
Outlook Stable Stable Positive Prior
2002
. . . . Parent investment grade first time in history of the Company.
16
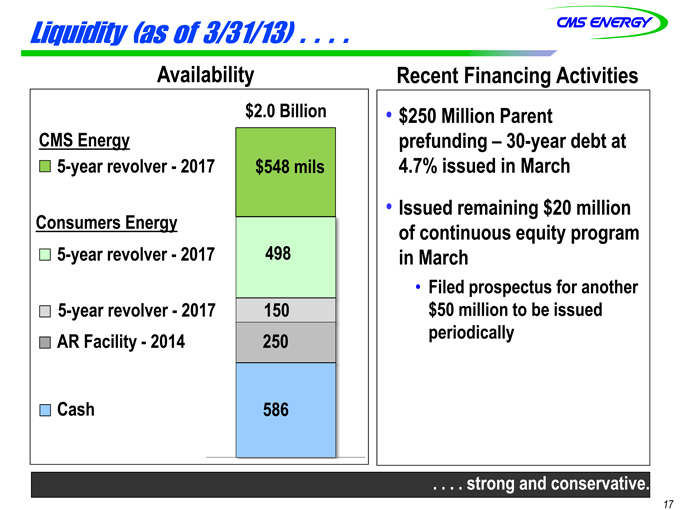
Liquidity (as of 3/31/13) . . . .
Availability Recent Financing Activities
$2.0 Billion
CMS Energy
5-year revolver—2017 $548 mils
Consumers Energy
5-year revolver—2017 498
5-year revolver—2017 150
AR Facility—2014 250
Cash 586
$250 Million Parent prefunding – 30-year debt at 4.7% issued in March
Issued remaining $20 million of continuous equity program in March
Filed prospectus for another $50 million to be issued periodically
. . . . strong and conservative.
17
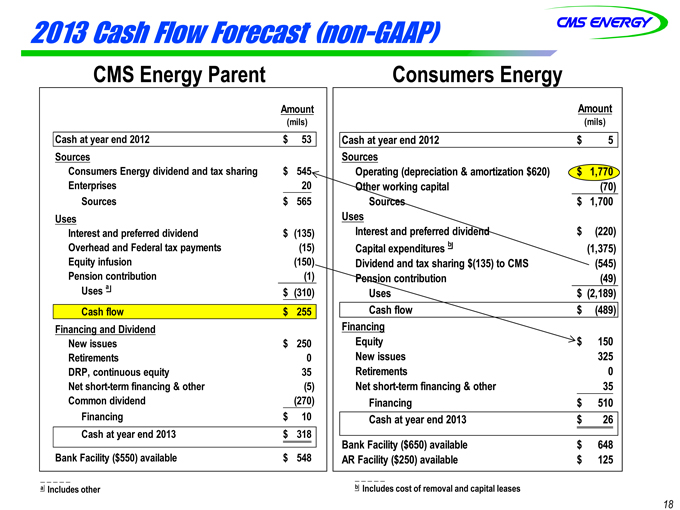
2013 Cash Flow Forecast (non-GAAP)
CMS Energy Parent Consumers Energy
Amount
(mils)
Cash at year end 2012 $ 53
Sources
Consumers Energy dividend and tax sharing $ 545
Enterprises 20
Sources $ 565
Uses
Interest and preferred dividend $ (135)
Overhead and Federal tax payments (15)
Equity infusion (150)
Pension contribution (1)
Uses a $ (310)
Cash flow $ 255
Financing and Dividend
New issues $ 250
Retirements 0
DRP, continuous equity 35
Net short-term financing & other (5)
Common dividend (270)
Financing $ 10
Cash at year end 2013 $ 318
Bank Facility ($550) available $ 548
Amount
(mils)
Cash at year end 2012 $ 5
Sources
Operating (depreciation & amortization $620) $ 1,770
Other working capital (70)
Sources $ 1,700
Uses
Interest and preferred dividend $ (220)
Capital expenditures b (1,375)
Dividend and tax sharing $(135) to CMS (545)
Pension contribution (49)
Uses $ (2,189)
Cash flow $ (489)
Financing
Equity $ 150
New issues 325
Retirements 0
Net short-term financing & other 35
Financing $ 510
Cash at year end 2013 $ 26
Bank Facility ($650) available $ 648
AR Facility ($250) available $ 125
a Includes other
b Includes cost of removal and capital leases
18
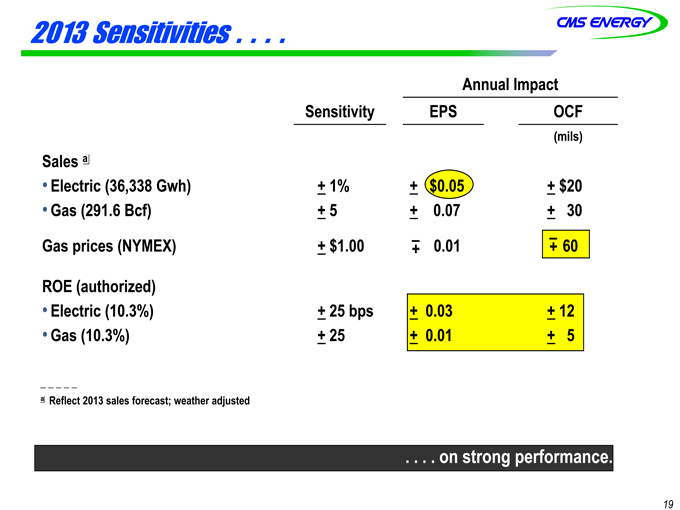
2013 Sensitivities . . . .
Annual Impact
Sensitivity EPS OCF
(mils)
Sales a
Electric (36,338 Gwh) + 1% + $0.05 + $20
Gas (291.6 Bcf) + 5 + 0.07 + 30
Gas prices (NYMEX) + $1.00 –+ 0.01 –+ 60
ROE (authorized)
Electric (10.3%) + 25 bps + 0.03 + 12
Gas (10.3%) + 25 + 0.01 + 5
a Reflect 2013 sales forecast; weather adjusted
. . . . on strong performance.
19
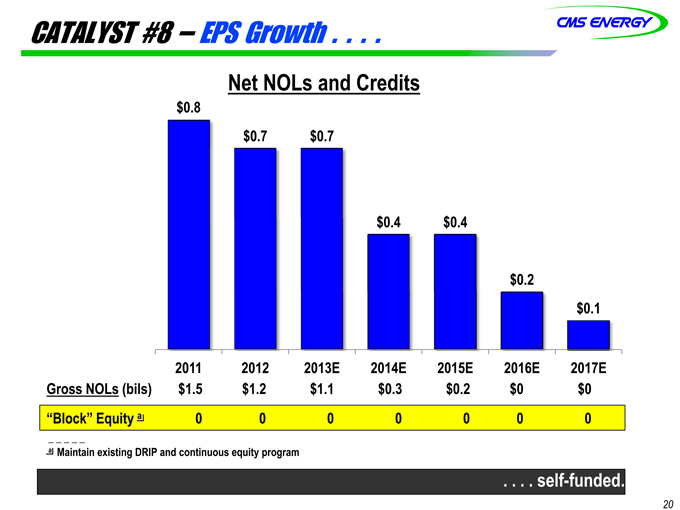
CATALYST #8 – EPS Growth . . . .
Net NOLs and Credits
$0.8
$0.7 $0.7
$0.4 $0.4
$0.2
$0.1
2011 2012 2013E 2014E 2015E 2016E 2017E Gross NOLs (bils) $1.5 $1.2 $1.1 $0.3 $0.2 $0 $0 “Block” Equity a 0 0 0 0 0 0 0
a Maintain existing DRIP and continuous equity program
. . . . self-funded.
20
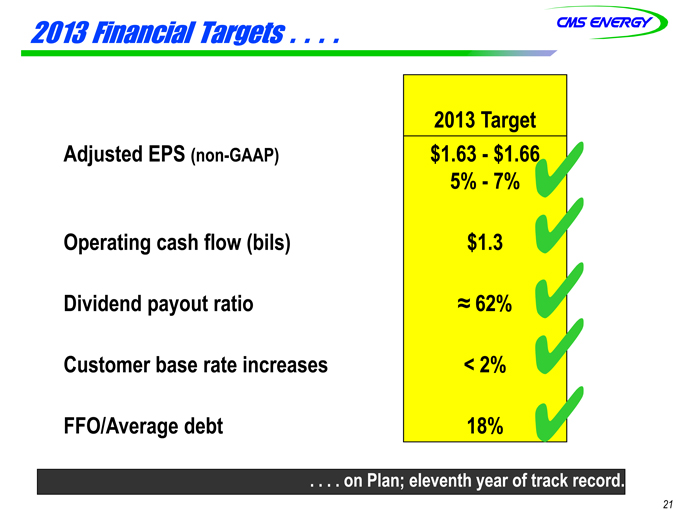
2013 Financial Targets . . . .
2013 Target
Adjusted EPS (non-GAAP) $1.63—$1.66
5%—7%
Operating cash flow (bils) $1.3
Dividend payout ratio ? 62%
Customer base rate increases < 2%
FFO/Average debt 18%
. . . . on Plan; eleventh year of track record.
21
GAAP Reconciliation
CMS ENERGY CORPORATION
Earnings Per Share By Year GAAP Reconciliation
(Unaudited)
| | | | | | | | | | | | | | | | | | | | | | | | | | | | | | | | | | | | | | | | |
| | | 2003
| | | 2004
| | | 2005
| | | 2006
| | | 2007
| | | 2008
| | | 2009
| | | 2010
| | | 2011
| | | 2012
| |
Reported earnings (loss) per
share - GAAP | | ($ | 0.30 | ) | | $ | 0.64 | | | ($ | 0.44 | ) | | ($ | 0.41 | ) | | ($ | 1.02 | ) | | $ | 1.20 | | | $ | 0.91 | | | $ | 1.28 | | | $ | 1.58 | | | $ | 1.42 | |
| | |
|
|
| |
|
|
| |
|
|
| |
|
|
| |
|
|
| |
|
|
| |
|
|
| |
|
|
| |
|
|
| |
|
|
|
After-tax items: | | | | | | | | | | | | | | | | | | | | | | | | | | | | | | | | | | | | | | | | |
Electric and gas utility | | | 0.21 | | | | (0.39 | ) | | | — | | | | — | | | | (0.07 | ) | | | 0.05 | | | | 0.33 | | | | 0.03 | | | | 0.00 | | | | 0.17 | |
Enterprises | | | 0.74 | | | | 0.62 | | | | 0.04 | | | | (0.02 | ) | | | 1.25 | | | | (0.02 | ) | | | 0.09 | | | | (0.03 | ) | | | (0.11 | ) | | | (0.01 | ) |
Corporate interest and other | | | 0.16 | | | | (0.03 | ) | | | 0.04 | | | | 0.27 | | | | (0.32 | ) | | | (0.02 | ) | | | 0.01 | | | | * | | | | (0.01 | ) | | | * | |
Discontinued operations (income) loss | | | (0.16 | ) | | | 0.02 | | | | (0.07 | ) | | | (0.03 | ) | | | 0.40 | | | | ( | *) | | | (0.08 | ) | | | 0.08 | | | | (0.01 | ) | | | (0.03 | ) |
Asset impairment charges, net | | | — | | | | — | | | | 1.82 | | | | 0.76 | | | | 0.60 | | | | — | | | | — | | | | — | | | | — | | | | — | |
Cumulative accounting changes | | | 0.16 | | | | 0.01 | | | | — | | | | — | | | | — | | | | — | | | | — | | | | — | | | | — | | | | — | |
| | |
|
|
| |
|
|
| |
|
|
| |
|
|
| |
|
|
| |
|
|
| |
|
|
| |
|
|
| |
|
|
| |
|
|
|
Adjusted earnings per share, including MTM - non-GAAP | | $ | 0.81 | | | $ | 0.87 | | | $ | 1.39 | | | $ | 0.57 | | | $ | 0.84 | | | $ | 1.21 | (a) | | $ | 1.26 | | | $ | 1.36 | | | $ | 1.45 | | | $ | 1.55 | |
Mark-to-market impacts | | | | | | | 0.03 | | | | (0.43 | ) | | | 0.51 | | | | | | | | | | | | | | | | | | | | | | | | | |
| | |
|
|
| |
|
|
| |
|
|
| |
|
|
| |
|
|
| |
|
|
| |
|
|
| |
|
|
| |
|
|
| |
|
|
|
Adjusted earnings per share, excluding MTM - non-GAAP | | | NA | | | $ | 0.90 | | | $ | 0.96 | | | $ | 1.08 | | | | NA | | | | NA | | | | NA | | | | NA | | | | NA | | | | NA | |
| | |
|
|
| |
|
|
| |
|
|
| |
|
|
| |
|
|
| |
|
|
| |
|
|
| |
|
|
| |
|
|
| |
|
|
|
| * | | Less than $500 thousand or $0.01 per share. |
| (a) | | $1.25 excluding discontinued Exeter operations and accounting changes related to convertible debt and restricted stock. |
2003-12 EPS
CMS ENERGY CORPORATION
Earnings By Quarter and Year GAAP Reconciliation
(Unaudited)
| | | | | | | | | | | | | | | | | | | | |
(In Millions, Except Per Share Amounts)
| | 2012
| |
| | | 1Q
| | | 2Q
| | | 3Q
| | | 4Q
| | | YTD Dec
| |
Reported net income - GAAP | | $ | 67 | | | $ | 100 | | | $ | 148 | | | $ | 67 | | | $ | 382 | |
| | |
|
|
| |
|
|
| |
|
|
| |
|
|
| |
|
|
|
After-tax items: | | | | | | | | | | | | | | | | | | | | |
Electric and gas utility | | | 36 | | | | 7 | | | | * | | | | ( | *) | | | 43 | |
Enterprises | | | 1 | | | | 1 | | | | (3 | ) | | | ( | *) | | | (1 | ) |
Corporate interest and other | | | — | | | | — | | | | — | | | | * | | | | * | |
Discontinued operations income | | | (7 | ) | | | * | | | | * | | | | * | | | | (7 | ) |
| | |
|
|
| |
|
|
| |
|
|
| |
|
|
| |
|
|
|
Adjusted income - non-GAAP | | $ | 97 | | | $ | 108 | | | $ | 145 | | | $ | 67 | | | $ | 417 | |
| | |
|
|
| |
|
|
| |
|
|
| |
|
|
| |
|
|
|
Average shares outstanding, basic | | | 255.6 | | | | 261.2 | | | | 262.9 | | | | 263.0 | | | | 260.7 | |
Average shares outstanding, diluted | | | 266.8 | | | | 268.2 | | | | 269.0 | | | | 269.5 | | | | 268.6 | |
| | |
|
|
| |
|
|
| |
|
|
| |
|
|
| |
|
|
|
Reported earnings per share - GAAP | | $ | 0.25 | | | $ | 0.37 | | | $ | 0.55 | | | $ | 0.25 | | | $ | 1.42 | |
| | |
|
|
| |
|
|
| |
|
|
| |
|
|
| |
|
|
|
After-tax items: | | | | | | | | | | | | | | | | | | | | |
Electric and gas utility | | | 0.14 | | | | 0.03 | | | | * | | | | ( | *) | | | 0.17 | |
Enterprises | | | 0.01 | | | | * | | | | (0.01 | ) | | | ( | *) | | | (0.01 | ) |
Corporate interest and other | | | — | | | | — | | | | — | | | | * | | | | * | |
Discontinued operations income | | | (0.03 | ) | | | * | | | | * | | | | * | | | | (0.03 | ) |
| | |
|
|
| |
|
|
| |
|
|
| |
|
|
| |
|
|
|
Adjusted earnings per share - non-GAAP | | $ | 0.37 | | | $ | 0.40 | | | $ | 0.54 | | | $ | 0.25 | | | $ | 1.55 | |
| | |
|
|
| |
|
|
| |
|
|
| |
|
|
| |
|
|
|
| | | | | |
(In Millions, Except Per Share Amounts)
| | 2013
| | | | | | | | | | | | | |
| | | 1Q
| | | | | | | | | | | | | |
Reported net income - GAAP | | $ | 144 | | | | | | | | | | | | | | | | | |
| | |
|
|
| | | | | | | | | | | | | | | | |
After-tax items: | | | | | | | | | | | | | | | | | | | | |
Electric and gas utility | | | — | | | | | | | | | | | | | | | | | |
Enterprises | | | * | | | | | | | | | | | | | | | | | |
Corporate interest and other | | | — | | | | | | | | | | | | | | | | | |
Discontinued operations loss | | | * | | | | | | | | | | | | | | | | | |
| | |
|
|
| | | | | | | | | | | | | | | | |
Adjusted income - non-GAAP | | $ | 144 | | | | | | | | | | | | | | | | | |
| | |
|
|
| | | | | | | | | | | | | | | | |
Average shares outstanding, basic | | | 263.6 | | | | | | | | | | | | | | | | | |
Average shares outstanding, diluted | | | 270.9 | | | | | | | | | | | | | | | | | |
| | |
|
|
| | | | | | | | | | | | | | | | |
Reported earnings per share - GAAP | | $ | 0.53 | | | | | | | | | | | | | | | | | |
| | |
|
|
| | | | | | | | | | | | | | | | |
After-tax items: | | | | | | | | | | | | | | | | | | | | |
Electric and gas utility | | | — | | | | | | | | | | | | | | | | | |
Enterprises | | | * | | | | | | | | | | | | | | | | | |
Corporate interest and other | | | — | | | | | | | | | | | | | | | | | |
Discontinued operations loss | | | * | | | | | | | | | | | | | | | | | |
| | |
|
|
| | | | | | | | | | | | | | | | |
Adjusted earnings per share - non-GAAP | | $ | 0.53 | | | | | | | | | | | | | | | | | |
| | |
|
|
| | | | | | | | | | | | | | | | |
Note: Year-to-date (YTD) EPS may not equal sum of quarters due to share count differences.
| * | | Less than $500 thousand or $0.01 per share. |
2013 A-1
CMS Energy Corporation
Earnings Segment Results GAAP Reconciliation
(Unaudited)
| | | | | | | | |
| | Three Months Ended
| |
March 31
| | 2013
| | | 2012
| |
Electric Utility | | | | | | | | |
Reported | | $ | 0.24 | | | $ | 0.08 | |
Electric Decoupling Court Order | | | — | | | | 0.14 | |
| | |
|
|
| |
|
|
|
Adjusted | | $ | 0.24 | | | $ | 0.22 | |
| | |
|
|
| |
|
|
|
Gas Utility | | | | | | | | |
Reported | | $ | 0.35 | | | $ | 0.21 | |
Restructuring Costs | | | — | | | | — | |
| | |
|
|
| |
|
|
|
Adjusted | | $ | 0.35 | | | $ | 0.21 | |
| | |
|
|
| |
|
|
|
Enterprises | | | | | | | | |
Reported | | $ | 0.02 | | | $ | 0.01 | |
Restructuring Costs | | | * | | | | 0.01 | |
| | |
|
|
| |
|
|
|
Adjusted | | $ | 0.02 | | | $ | 0.02 | |
| | |
|
|
| |
|
|
|
Corporate Interest and Other | | | | | | | | |
Reported | | $ | (0.08 | ) | | $ | (0.08 | ) |
Restructuring Costs | | | — | | | | — | |
| | |
|
|
| |
|
|
|
Adjusted | | $ | (0.08 | ) | | $ | (0.08 | ) |
| | |
|
|
| |
|
|
|
Discontinued Operations | | | | | | | | |
Reported | | | (* | ) | | $ | 0.03 | |
Discontinued Operations Income | | | * | | | | (0.03 | ) |
| | |
|
|
| |
|
|
|
Adjusted | | $ | — | | | $ | — | |
| | |
|
|
| |
|
|
|
Totals | | | | | | | | |
Reported | | $ | 0.53 | | | $ | 0.25 | |
Discontinued Operations Income | | | * | | | | (0.03 | ) |
Electric Decoupling Court Order | | | — | | | | 0.14 | |
Restructuring Costs | | | * | | | | 0.01 | |
| | |
|
|
| |
|
|
|
Adjusted | | $ | 0.53 | | | $ | 0.37 | |
| | |
|
|
| |
|
|
|
Average Common Shares Outstanding - Diluted (in millions) | | | 270.9 | | | | 266.8 | |
| | |
|
|
| |
|
|
|
* Less than $0.01 per share.
2013 A-2
Consumers Energy
2013 Forecasted Cash Flow GAAP Reconciliation (in millions) (unaudited)
| | | | | | | | | | | | | | | | | | | | | | | | | | | | | | | | | | | | | | |
| | | | Reclassifications From Sources and Uses to Statement of Cash Flows
| | | | | | |
Presentation Sources and Uses
| | | Tax | | | Interest | | | Other Working | | | Capital | | | Securitization | | | Preferred | | | Common | | | Consolidated Statements of Cash Flows
|
Description
| | non-GAAP
Amount
| | | Sharing
Operating
| | | Payments
as Operating
| | | Capital
as Investing
| | | Lease Pymts
as Financing
| | | Debt Pymts
as Financing
| | | Dividends
as Financing
| | | Dividends
as Financing
| | | GAAP
Amount
| | | Description
|
Cash at year end 2012 | | $ | 5 | | | $ | — | | | $ | — | | | $ | — | | | $ | — | | | $ | — | | | $ | — | | | $ | — | | | $ | 5 | | | Cash at year end 2012 |
Sources | | | | | | | | | | | | | | | | | | | | | | | | | | | | | | | | | | | | | | |
Operating (dep & amort $620) | | $ | 1,770 | | | | | | | | | | | | | | | | | | | | | | | | | | | | | | | | | | | |
Other working capital | | | (70 | ) | | | | | | | | | | | | | | | | | | | | | | | | | | | | | | | | | | |
| | |
|
|
| |
|
|
| |
|
|
| |
|
|
| |
|
|
| |
|
|
| |
|
|
| |
|
|
| |
|
|
| | |
Sources | | $ | 1,700 | | | $ | (135 | ) | | $ | (218 | ) | | $ | (108 | ) | | $ | 28 | | | $ | 41 | | | $ | — | | | $ | — | | | $ | 1,308 | | | Net cash provided by operating activities |
Uses | | | | | | | | | | | | | | | | | | | | | | | | | | | | | | | | | | | | | | |
Interest and preferred dividend | | $ | (220 | ) | | | | | | | | | | | | | | | | | | | | | | | | | | | | | | | | | | |
Capital expendituresa | | | (1,375 | ) | | | | | | | | | | | | | | | | | | | | | | | | | | | | | | | | | | |
Dividends and tax sharing $(135) to CMS | | | (545 | ) | | | | | | | | | | | | | | | | | | | | | | | | | | | | | | | | | | |
Pension Contribution | | | (49 | ) | | | | | | | | | | | | | | | | | | | | | | | | | | | | | | | | | | |
| | |
|
|
| |
|
|
| |
|
|
| |
|
|
| |
|
|
| |
|
|
| |
|
|
| |
|
|
| |
|
|
| | |
Uses | | $ | (2,189 | ) | | $ | 135 | | | $ | 218 | | | $ | 108 | | | $ | — | | | $ | — | | | $ | 2 | | | $ | 410 | | | $ | (1,316 | ) | | Net cash provided by investing activities |
| | |
|
|
| |
|
|
| |
|
|
| |
|
|
| |
|
|
| |
|
|
| |
|
|
| |
|
|
| |
|
|
| | |
Cash flow | | $ | (489 | ) | | $ | — | | | $ | — | | | $ | — | | | $ | 28 | | | $ | 41 | | | $ | 2 | | | $ | 410 | | | $ | (8 | ) | | Cash flow from operating and investing activities |
Financing | | | | | | | | | | | | | | | | | | | | | | | | | | | | | | | | | | | | | | |
Equity | | $ | 150 | | | | | | | | | | | | | | | | | | | | | | | | | | | | | | | | | | | |
New Issues | | | 325 | | | | | | | | | | | | | | | | | | | | | | | | | | | | | | | | | | | |
Retirements | | | — | | | | | | | | | | | | | | | | | | | | | | | | | | | | | | | | | | | |
Net short-term financing & other | | | 35 | | | | | | | | | | | | | | | | | | | | | | | | | | | | | | | | | | | |
| | |
|
|
| |
|
|
| |
|
|
| |
|
|
| |
|
|
| |
|
|
| |
|
|
| |
|
|
| |
|
|
| | |
Financing | | $ | 510 | | | $ | — | | | $ | — | | | $ | — | | | $ | (28 | ) | | $ | (41 | ) | | $ | (2 | ) | | $ | (410 | ) | | $ | 29 | | | Net cash provided by financing activities |
| | |
|
|
| |
|
|
| |
|
|
| |
|
|
| |
|
|
| |
|
|
| |
|
|
| |
|
|
| |
|
|
| | |
Net change in cash | | $ | 21 | | | $ | — | | | $ | — | | | $ | — | | | $ | — | | | $ | — | | | $ | — | | | $ | — | | | $ | 21 | | | Net change in cash |
| | |
|
|
| |
|
|
| |
|
|
| |
|
|
| |
|
|
| |
|
|
| |
|
|
| |
|
|
| |
|
|
| | |
Cash at year end 2013 | | $ | 26 | | | $ | — | | | $ | — | | | $ | — | | | $ | — | | | $ | — | | | $ | — | | | $ | — | | | $ | 26 | | | Cash at year end 2013 |
| | |
|
|
| |
|
|
| |
|
|
| |
|
|
| |
|
|
| |
|
|
| |
|
|
| |
|
|
| |
|
|
| | |
a Includes cost of removal and capital leases
2013 B-1
CMS Energy Parent
2013 Forecasted Cash Flow GAAP Reconciliation (in millions) (unaudited)
| | | | | | | | | | | | | | | | | | | | | | | | | | |
| | | Reclassifications From Sources and Uses to Statement of Cash Flows
| | | | | | |
Presentation Sources and Uses
| | | Interest | | | Overheads & | | | Other | | | Cash From | | | Consolidated Statements of Cash Flows
|
Description
| | non-GAAP
Amount
| | | Payments
as Operating
| | | Tax Payments
as Operating
| | | Uses (a)
as Operating
| | | Consolidated
Companies
| | | GAAP
Amount
| | | Description
|
Cash at year end 2012 | | $ | 53 | | | $ | — | | | $ | — | | | $ | — | | | $ | 35 | | | $ | 88 | | | Cash at year end 2012 |
| | | | | | | |
Sources | | | | | | | | | | | | | | | | | | | | | | | | | | |
Consumers Energy dividends/tax sharing | | $ | 545 | | | | | | | | | | | | | | | | | | | | | | | |
Enterprises | | | 20 | | | | | | | | | | | | | | | | | | | | | | | |
| | |
|
|
| |
|
|
| |
|
|
| |
|
|
| |
|
|
| |
|
|
| | |
Sources | | $ | 565 | | | $ | (135 | ) | | $ | (15 | ) | | $ | (9 | ) | | $ | 23 | | | $ | 429 | | | Net cash provided by operating activities |
| | | | | | | |
Uses | | | | | | | | | | | | | | | | | | | | | | | | | | |
Interest and preferred dividends | | $ | (135 | ) | | | | | | | | | | | | | | | | | | | | | | |
Overhead and Federal tax payments | | | (15 | ) | | | | | | | | | | | | | | | | | | | | | | |
Equity infusions | | | (150 | ) | | | | | | | | | | | | | | | | | | | | | | |
Pension Contribution | | | (1 | ) | | | | | | | | | | | | | | | | | | | | | | |
| | |
|
|
| |
|
|
| |
|
|
| |
|
|
| |
|
|
| |
|
|
| | |
Uses (a) | | $ | (310 | ) | | $ | 135 | | | $ | 15 | | | $ | 9 | | | $ | (86 | ) | | $ | (237 | ) | | Net cash provided by investing activities |
| | | | | | | | | | | | | | | | | | | | | | | | | | | |
| | |
|
|
| |
|
|
| |
|
|
| |
|
|
| |
|
|
| |
|
|
| | |
| | | | | | | |
Cash flow | | $ | 255 | | | $ | — | | | $ | — | | | $ | — | | | $ | (63 | ) | | $ | 192 | | | Cash flow from operating and investing activities |
| | | | | | | | | | | | | | | | | | | | | | | | | | | |
| | | | | | | |
Financing and dividends | | | | | | | | | | | | | | | | | | | | | | | | | | |
New Issues | | $ | 250 | | | | | | | | | | | | | | | | | | | | | | | |
Retirements | | | — | | | | | | | | | | | | | | | | | | | | | | | |
DRP, continuous equity | | | 35 | | | | | | | | | | | | | | | | | | | | | | | |
Net short-term financing & other | | | (5 | ) | | | | | | | | | | | | | | | | | | | | | | |
Common dividend | | | (270 | ) | | | | | | | | | | | | | | | | | | | | | | |
| | |
|
|
| |
|
|
| |
|
|
| |
|
|
| |
|
|
| |
|
|
| | |
Financing | | $ | 10 | | | $ | — | | | $ | — | | | $ | — | | | $ | 72 | | | $ | 82 | | | Net cash provided by financing activities |
| | |
|
|
| |
|
|
| |
|
|
| |
|
|
| |
|
|
| |
|
|
| | |
Net change in cash | | $ | 265 | | | $ | — | | | $ | — | | | $ | — | | | $ | 9 | | | $ | 274 | | | Net change in cash |
| | |
|
|
| |
|
|
| |
|
|
| |
|
|
| |
|
|
| |
|
|
| | |
Cash at year end 2013 | | $ | 318 | | | $ | — | | | $ | — | | | $ | — | | | $ | 44 | | | $ | 362 | | | Cash at year end 2013 |
| | |
|
|
| |
|
|
| |
|
|
| |
|
|
| |
|
|
| |
|
|
| | |
2013 B-2
Consolidated CMS Energy
2013 Forecasted Consolidation of Consumers Energy and CMS Energy Parent Statements of Cash Flow (in millions) (unaudited)
| | | | | | | | | | | | | | | | | | | | | | | | | | |
Statements of Cash Flows
| | | Eliminations/Reclassifications to Arrive at the
Consolidated Statement of Cash Flows
| | | Consolidated Statements of Cash Flows
|
| | Consumers
Common Dividend
as Financing
| | | Consumers
Preferred Dividend
as Operating
| | | Equity
Infusions to
Consumers
| | |
| | | Consumers
Amount
| | | CMS Parent
Amount
| | | | | |
Description
| | | | | | | Amount
| | | Description
|
Cash at year end 2012 | | $ | 5 | | | $ | 88 | | | $ | — | | | $ | — | | | $ | — | | | $ | 93 | | | Cash at year end 2012 |
Net cash provided by operating activities | | $ | 1,308 | | | $ | 429 | | | $ | (410 | ) | | $ | (2 | ) | | $ | — | | | $ | 1,325 | | | Net cash provided by operating activities |
Net cash provided by investing activities | | | (1,316 | ) | | | (237 | ) | | | — | | | | — | | | | 150 | | | | (1,403 | ) | | Net cash provided by investing activities |
| | |
|
|
| |
|
|
| |
|
|
| |
|
|
| |
|
|
| |
|
|
| | |
Cash flow from operating and investing activities | | $ | (8 | ) | | $ | 192 | | | $ | (410 | ) | | $ | (2 | ) | | $ | 150 | | | $ | (78 | ) | | Cash flow from operating and investing activities |
Net cash provided by financing activities | | $ | 29 | | | $ | 82 | | | $ | 410 | | | $ | 2 | | | $ | (150 | ) | | $ | 373 | | | Net cash provided by financing activities |
| | |
|
|
| |
|
|
| |
|
|
| |
|
|
| |
|
|
| |
|
|
| | |
Net change in cash | | $ | 21 | | | $ | 274 | | | $ | — | | | $ | — | | | $ | — | | | $ | 295 | | | Net change in cash |
| | |
|
|
| |
|
|
| |
|
|
| |
|
|
| |
|
|
| |
|
|
| | |
Cash at year end 2013 | | $ | 26 | | | $ | 362 | | | $ | — | | | $ | — | | | $ | — | | | $ | 388 | | | Cash at year end 2013 |
| | |
|
|
| |
|
|
| |
|
|
| |
|
|
| |
|
|
| |
|
|
| | |
2013 B-3