Exhibit 99.1

CMS ENERGY
2013 Annual Shareholders’ Meeting
CMS ENERGY
Annual Shareholders’ Meeting
John Russell
May 17, 2013
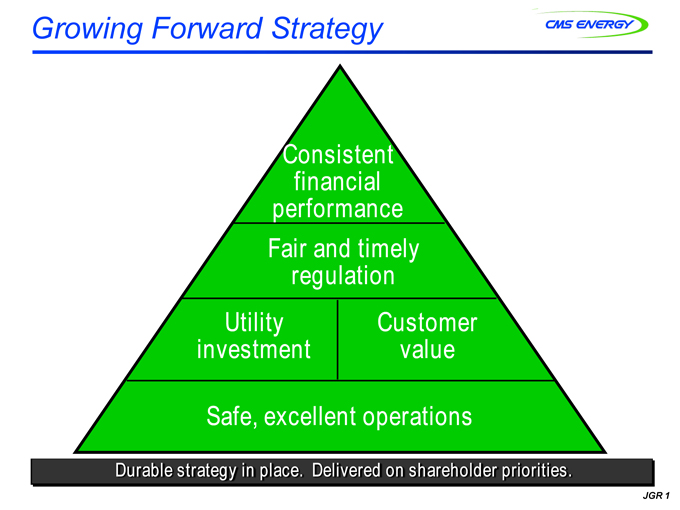
Growing Forward Strategy
CMS ENERGY
Consistent financial performance
Fair and timely regulation
Utility investment
Customer value
Safe, excellent operations
Durable strategy in place. Delivered on shareholder priorities.
JGR 1
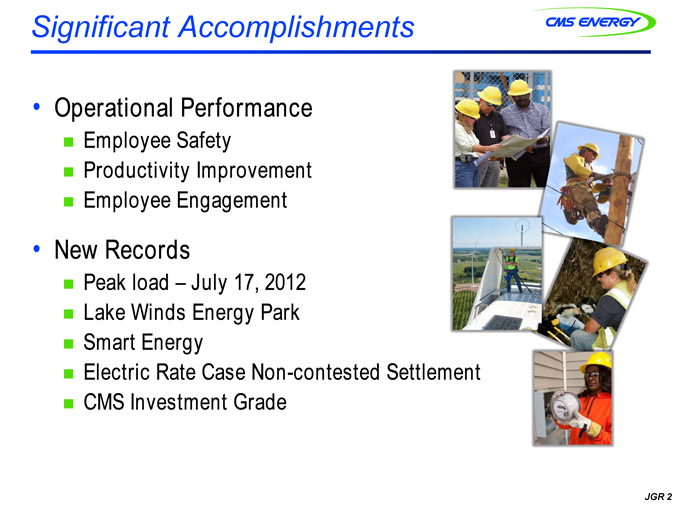
Significant Accomplishments
CMS ENERGY
• Operational Performance
Employee Safety
Productivity Improvement
Employee Engagement
• New Records
Peak load – July 17, 2012
Lake Winds Energy Park
Smart Energy
Electric Rate Case Non-contested Settlement
CMS Investment Grade
JGR 2
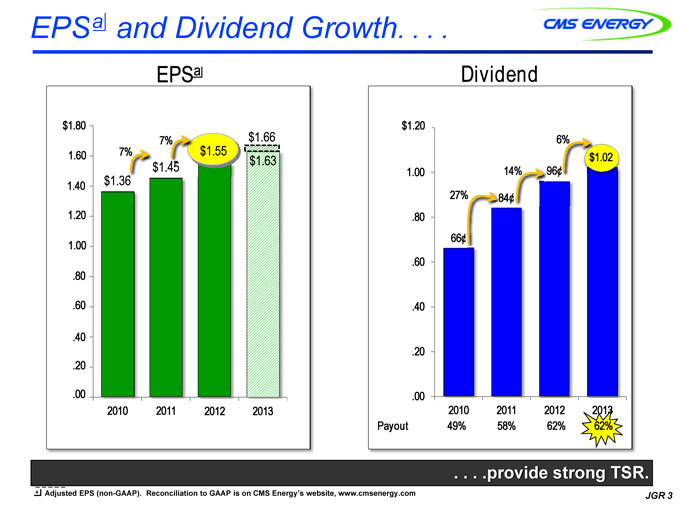
EPS a and Dividend Growth. . . .
CMS ENERGY
EPSa
$1.66
$1.80
7%
$1.55
$1.63
1.60
7%
$1.45
1.40
$1.36
1.20
1.00
.80
.60
.40
.20
.00
2010
2011
2012
2013
Dividend
6%
$1. 02
$1.20
96¢
1.00
14%
.80
27%
84¢
.60
66¢
.40
.20
.00
2010
2011
2012
2013
Payout
49%
58%
62%
62%
. . . .provide strong TSR.
a Adjusted EPS (non-GAAP). Reconciliation to GAAP is on CMS Energy’s website, www.cmsenergy.com
JGR 3
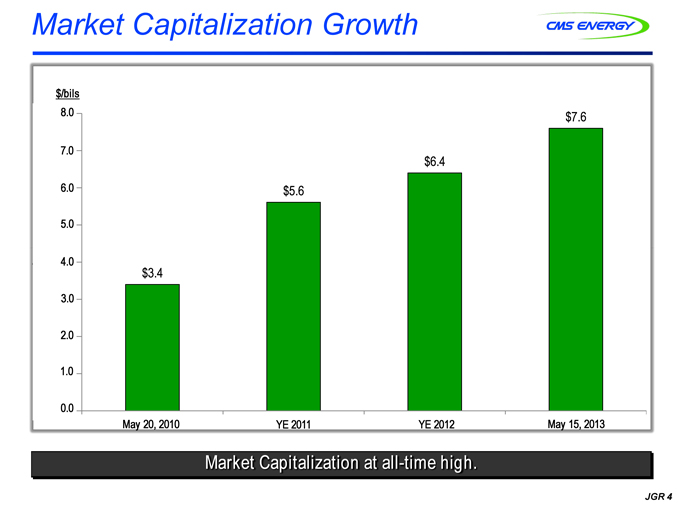
Market Capitalization Growth
CMS ENERGY
$/bils
$7.6
8.0
$6.4
7.0
$5.6
6.0
5.0
4.0
$3.4
3.0
2.0
1.0
0.0
May 20, 2010
YE 2011
YE 2012
May 15, 2013
Market Capitalization at all-time high.
JGR 4
Three-year Stock Performance
CMS ENERGY
120%
$28.95
100
CMS 96%
80
60
40
Peers 54%
Philadelphia Utility
Index 37%
20
0
$14.74
-20
May
Aug
Nov
Feb
May
Aug
Nov
Feb
May
Aug
Nov
Feb
May
2010
2011
2012
2013
Start date May 20, 2010
End date May 15, 2013
JGR 5
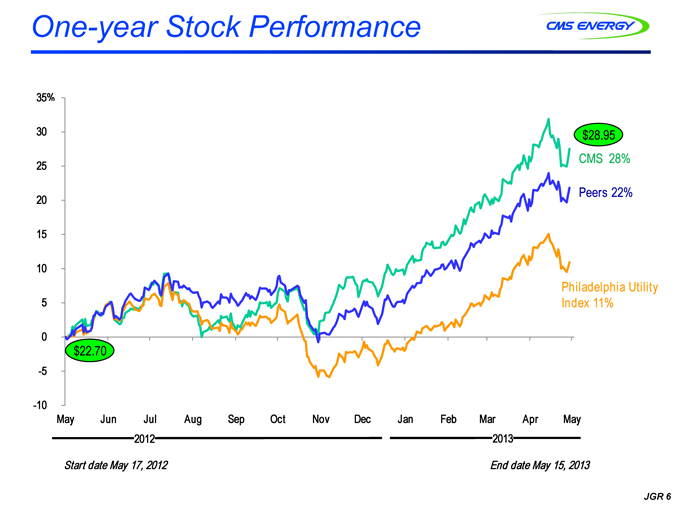
One-year Stock Performance
CMS ENERGY
35%
$28.95
30
CMS 28%
25
Peers 22%
20
15
10
Philadelphia Utility
5
Index 11%
0
$22.70
-5
-10
May
Jun
Jul
Aug
Sep
Oct
Nov
Dec
Jan
Feb
Mar
Apr
May
2012
2013
Start date May 17, 2012
End date May 15, 2013
JGR 6

Q & A
CMS ENERGY
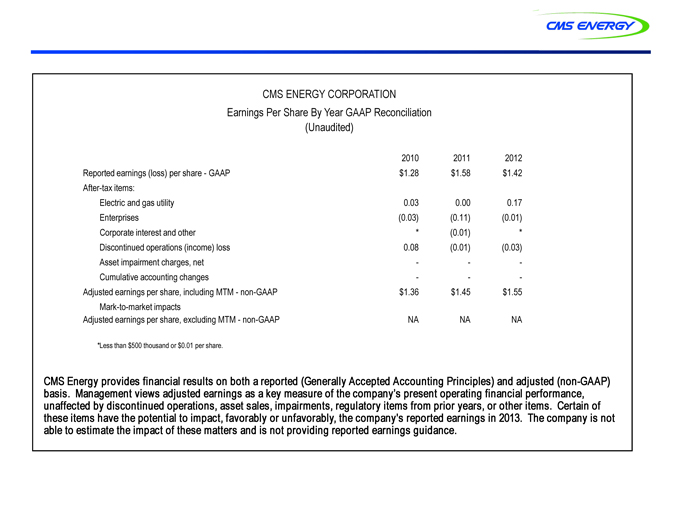
CMS ENERGY CORPORATION
Earnings Per Share By Year GAAP Reconciliation (Unaudited)
2010
2011
2012
Reported earnings (loss) per share - GAAP
$1.28
$1.58
$1.42
After-tax items:
Electric and gas utility
0.03
0.00
0.17
Enterprises
(0.03)
(0.11)
(0.01)
Corporate interest and other *
(0.01) *
Discontinued operations (income) loss
0.08
(0.01)
(0.03)
Asset impairment charges, net
-
-
-
Cumulative accounting changes
-
-
-
Adjusted earnings per share, including MTM - non-GAAP
$1.36
$1.45
$1.55
Mark-to-market impacts
Adjusted earnings per share, excluding MTM - non-GAAP
NA
NA
NA
*Less than $500 thousand or $0.01 per share.
CMS Energy provides financial results on both a reported (Generally Accepted Accounting Principles) and adjusted (non-GAAP) basis. Management views adjusted earnings as a key measure of the company’s present operating financial performance, unaffected by discontinued operations, asset sales, impairments, regulatory items from prior years, or other items. Certain of these items have the potential to impact, favorably or unfavorably, the company’s reported earnings in 2013. The company is not able to estimate the impact of these matters and is not providing reported earnings guidance.