Exhibit 99.1

Investor Meetings May 25-31, 2013 Cross WindsEnergy Park Consumers Smart Energy Program
This presentation is made as of the date hereof and contains “forward-looking statements” as defined in Rule 3b-6 of the Securities Exchange Act of 1934, as amended, Rule 175 of the Securities Act of 1933, as amended, and relevant legal decisions. The forward-looking statements are subject to risks and uncertainties. They should be read in conjunction with “FORWARD-LOOKING STATEMENTS AND INFORMATION” and “RISK FACTORS” sections of CMS Energy’s and Consumers Energy’s Form 10-K for the year ended December 31 and as updated in subsequent 10-Qs. CMS Energy’s and Consumers Energy’s “FORWARD-LOOKING STATEMENTS AND INFORMATION” and “RISK FACTORS” sections are incorporated herein by reference and discuss important factors that could cause CMS Energy’s and Consumers Energy’s results to differ materially from those anticipated in such statements. CMS Energy and Consumers Energy undertake no obligation to update any of the information presented herein to reflect facts, events or circumstances after the date hereof. The presentation also includes non-GAAP measures when describing CMS Energy’s results of operations and financial performance. A reconciliation of each of these measures to the most directly comparable GAAP measure is included in the appendix and posted on our website at www.cmsenergy.com. CMS Energy provides financial results on both a reported (Generally Accepted Accounting Principles) and adjusted (non-GAAP) basis. Management views adjusted earnings as a key measure of the company’s present operating financial performance, unaffected by discontinued operations, asset sales, impairments, regulatory items from prior years, or other items. Certain of these items have the potential to impact, favorably or unfavorably, the company's reported earnings in 2013. The company is not able to estimate the impact of these matters and is not providing reported earnings guidance.
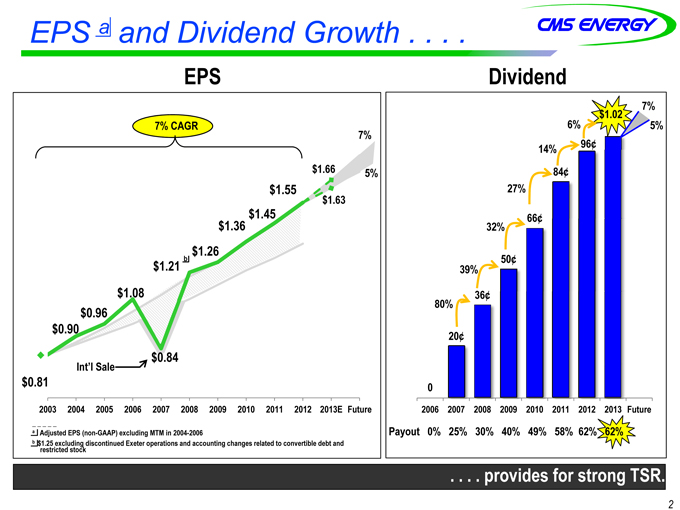
EPS a and Dividend Growth . . Dividend 0 20¢ 36¢ 50¢ 66¢ 84¢ 96¢ $1.02 2006 2007 2008 2009 2010 2011 2012 2013 Future Payout 0% 25% 30% 40% 49% 58% 62% 62% 32% 27% 14% 39% 80% 6% $0.81 b a Adjusted EPS (non-GAAP) excluding MTM in 2004-2006 b $1.25 excluding discontinued Exeter operations and accounting changes related to convertible debt and restricted stock $0.90 $0.96 $1.08 $0.84 $1.21 $1.26 $1.36 $1.45 $1.55 2003 2004 2005 2006 2007 2008 2009 2010 2011 2012 2013E Future
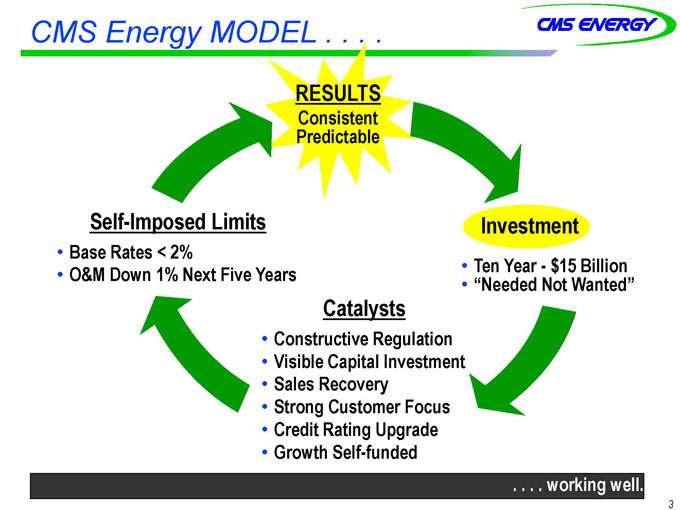
CMS Energy MODEL . . . .
Investment
•Ten Year—$15 Billion
•“Needed Not Wanted” Catalysts
•Constructive Regulation
•Visible Capital Investment
•Sales Recovery
•Strong Customer Focus
•Credit Rating Upgrade
•Growth Self-funded
Self-Imposed Limits
•Base Rates < 2%
•O&M Down 1% Next Five Years
RESULTS
Consistent
Predictable
. . . . work
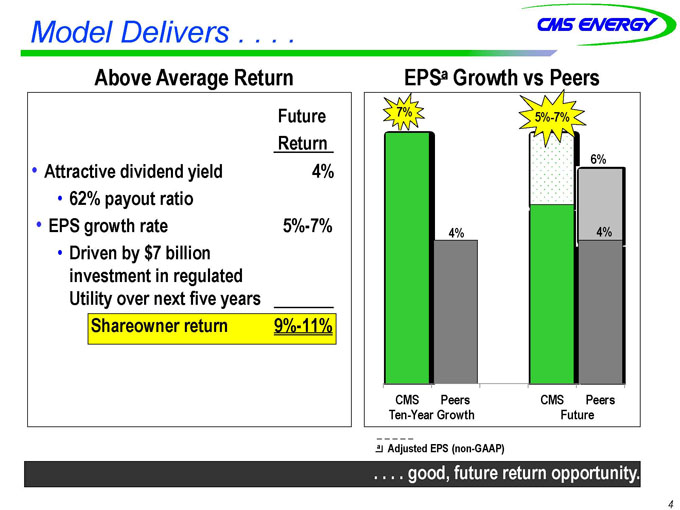
Model Delivers . . . . . . . . g. good, future return ood, opportunity.
Above Average ReturnAbove Return EPSEPSaa Growth vsvs PeersPeers
Future
Return
•Attractive dividend yield 4%
•62% payout ratio
•EPS growth rate 5%-7%
•Driven by $7 billion investment in regulated Utility over next five years
Shareowner return 9%-11% ing well. well.
Ten-Year Growth
CMS
Peers Future
a Adjusted EPS (non-GAAP)
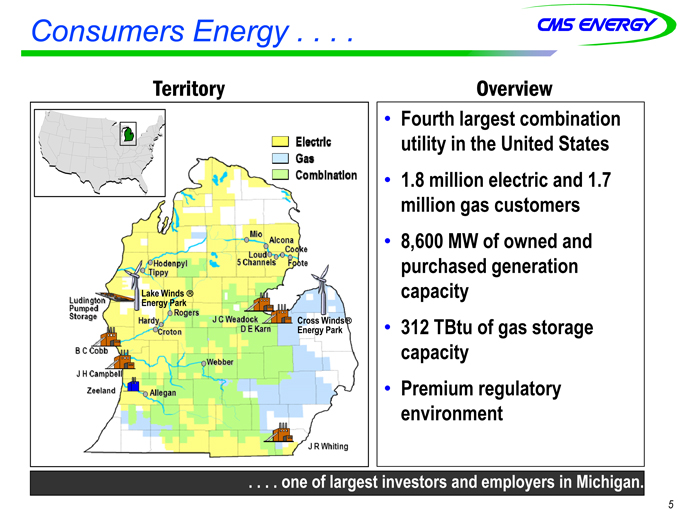
Consumers Energy . . . .
•Fourth largest combination utility in the United States
•1.8 | | million electric and 1.7 million gas customers |
•8,600 MW of owned and purchased generation capacity
•312 TBtu of gas storage capacity
•Premium regulatory environment
OverviewOverview TerritoryTerritory
. . . . one of largest investors and employers in Michigan.
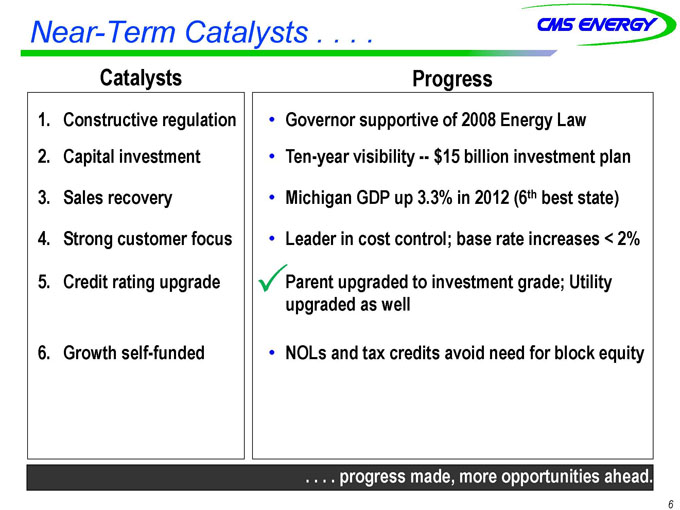
Near-Term Catalysts. Michigan.
1.Constructive regulation
•Governor supportive of 2008 Energy Law
•Ten-year visibility——$15 billion investment plan
•Michigan GDP up 3.3% in 2012 (6th best state)
•Leader in cost control; base rate increases < 2%
Parent upgraded to investment grade; Utility upgraded as well
•NOLs and tax credits avoid need for block equity

CATALYST #1 – Constructive Regulation . . . . . . . . p. provides impvements for customers and investors. rovides
CommissionCommission
2008 Energy Law2008 Law
GrowthGrowth
•Renewable energy plan
•Energy optimization
SpeedSpeed
•File and implement ratemaking
•Forward test year
Risk MitigationRisk Mitigation
•Retail open access cap
•Decoupling
OpportunitiesOpportunities
•Further streamline rate case processes
•Future investment recovery mechanism
John Quackenbush, Chairman
Term Ends: July 2, 2017
Orjiakor Isiogu Term Ends: July 2, 2013
Greg White Term Ends: July 2, 2015
Consumers Energy Electric Rate Case –
First uncontested settlement ever!
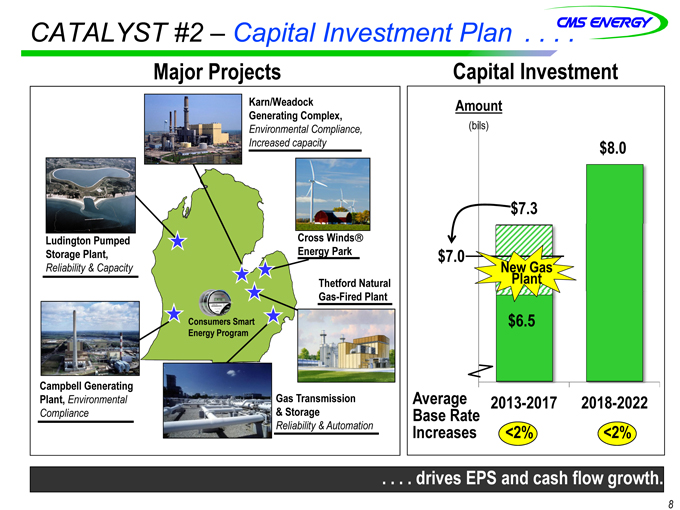
CATALYST #2 – Capital Investment Plan . . . . 8
Major ProjectsMajor Projects
Capital InvestmentCapital Investment
Karn/Weadock Generating Complex,
Environmental Compliance, Increased capacity
Cross WindsEnergy Park Thetford Natural Gas-Fired Plant
Consumers Smart Energy Program
Gas Transmission & Storage
Reliability & Automation
Amount
(bils)
New Gas Plant
$7.3
Average Base Rate Increases
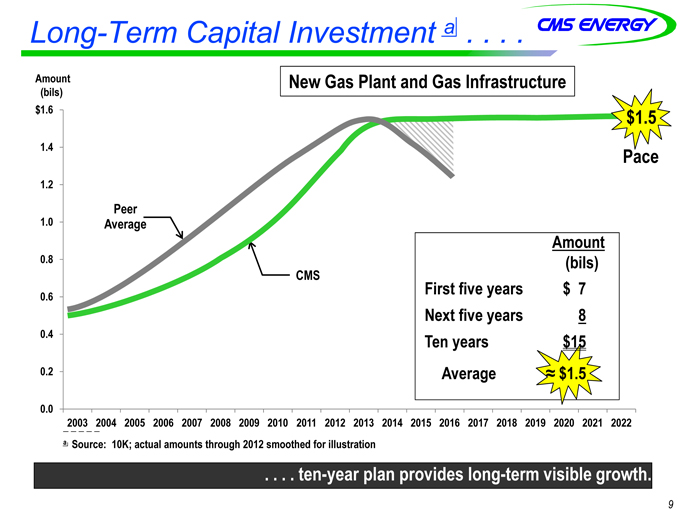
Long-Term Capital Investment a . . . .
. . . . t. tenen—year plan provides longyear long—term visible growth.
a Source: 10K; actual amounts through 2012 smoothed for illustration
0.0 0.2 0.4 0.6 0.8 1.0 1.2 1.4 1.6 2003 2004 2005 2006 2007 2008 2009 2010 011 2012 2013 2014 2015 2016 2017 2018 2019 2020 2021 2022
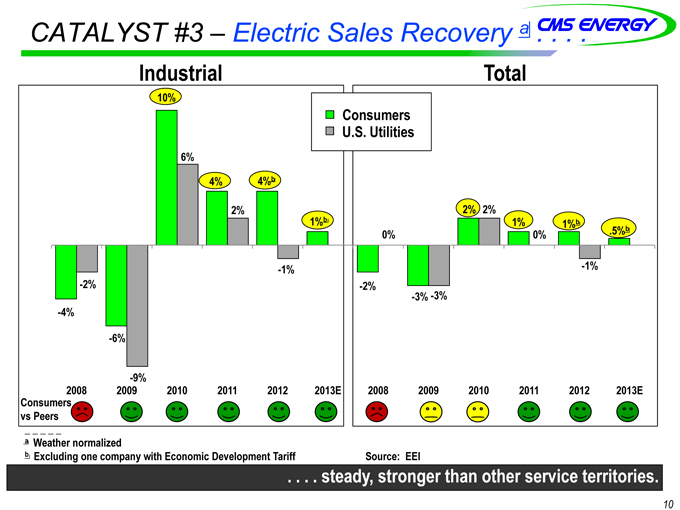
CATALYST #3 – Electric Sales Recovery a . . . .
10 . . . . steady, stronger than other service territories. territories.
a Weather normalized
b Excluding one company with Economic Development Tariff Source: EEI IndustrialIndustrial
TotalTotal
Consumers
vs Peers—4% —6% 10% 4% 4%b 1%b—2%—3% 2% 1% 1%b .5%b —2% —9% 6% 2%—1% 0% —3% 2% 0%—1% 2008 2009 2010 2011 2012 2013E 2008 2009 2010 2011 2012 2013E
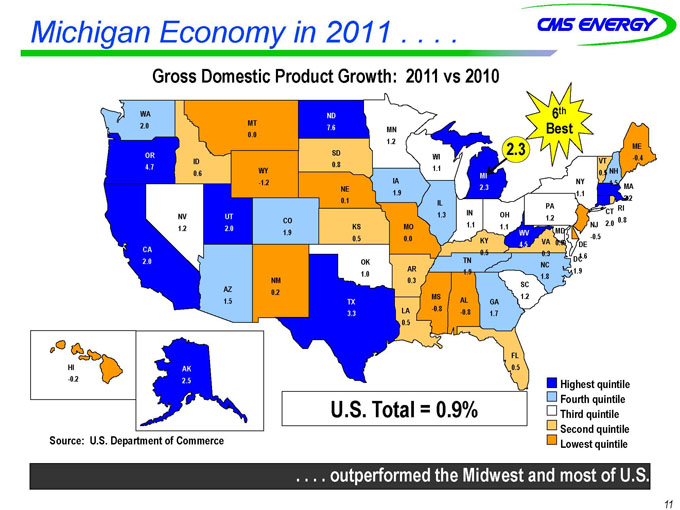
Michigan Economy in 2011
Gross Domestic Product Growth: 2011 vs 2010 Highest quintile
Fourth quintile
Third quintile
Second quintile
Lowest quintile
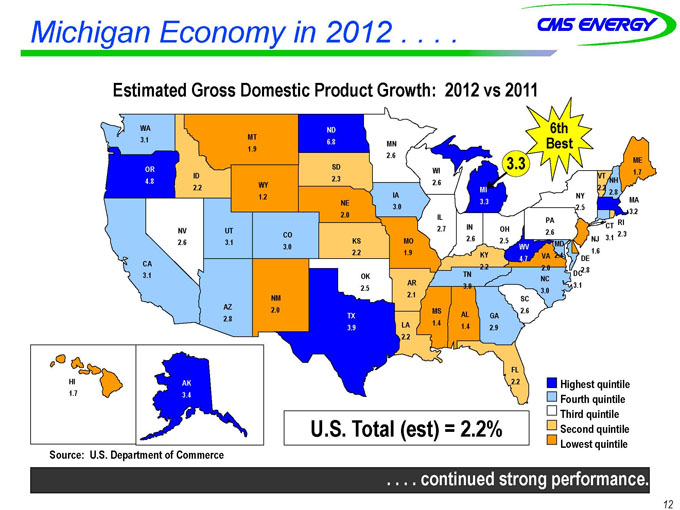
Michigan Economy in 2012 . . .
. . continued strong performance. Estimated Gross Domestic Product Growth: 2012 vs 2011
Source: U.S. Department of Commerce
Highest quintile
Fourth quintile
Third quintile
Second quintile
Lowest quintile
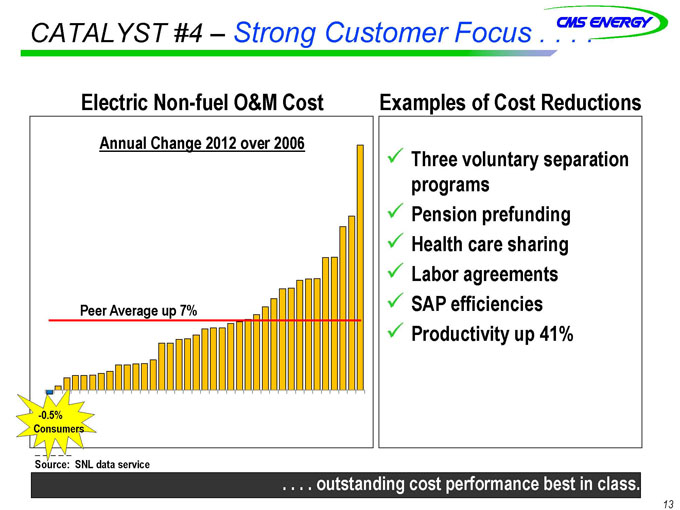
CATALYST #4 – Strong Customer Focus . . . .
inExamples of Cost ReductionsExamples Reductions
Electric NonElectric Non—fuel O&M Costfuel Cost
Source: SNL data service
üThree voluntary separation programs
üPension prefunding
üHealth care sharing
üLabor agreements
üSAP efficiencies
üProductivity up 41%
-0.5% Consumers
Peer Average up 7%
Annual Change 2012 over 2006 543945-001 23May13
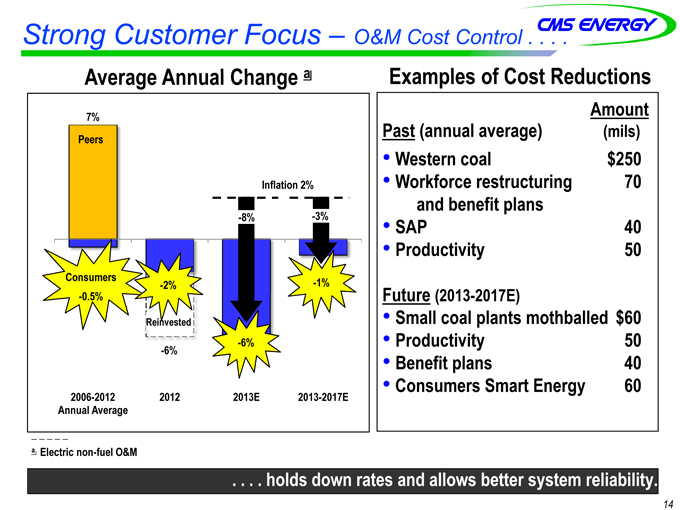
Strong Customer Focus – O&M Cost Control . . . .
Examples of Cost ReductionsExamples Reductions Amount Past (annual average) (mils)
•Western coal $250
•Workforce restructuring 70 and benefit plans
•SAP 40
•Productivity 50 Future (2013-2017E)
•Small coal plants mothballed $60
•Productivity 50
•Benefit plans 40
•Consumers Smart Energy 60
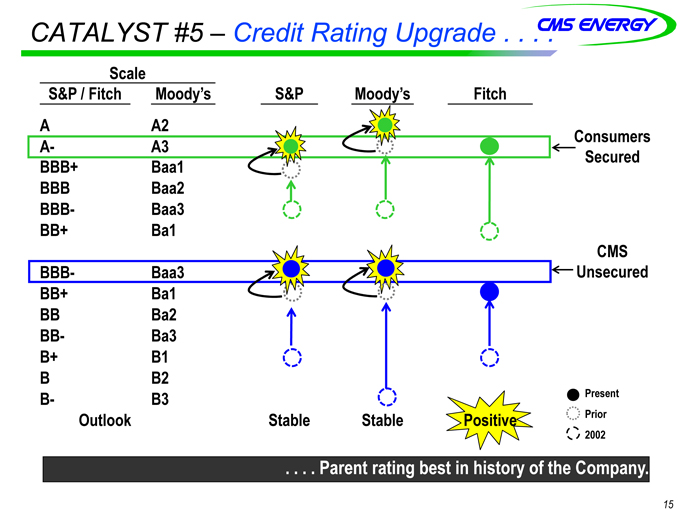
CATALYST #5 – Credit Rating Upgrade
Scale S&P / Fitch Moody’s S&P Moody’s Fitch A A2 Consumers Secured A— A3 BBB+ Baa1 BBB Baa2 BBB— Baa3 BB+ Ba1 CMS Unsecured BBB— Baa3 BB+ Ba1 BB Ba2 BB— Ba3 B+ B1 B B2 B— B3 Outlook Stable Stable Positive
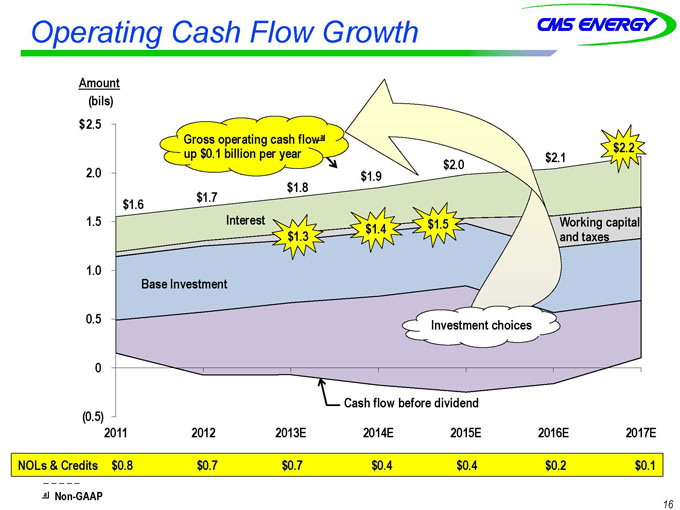
Operating Cash Flow Growth
16 (0.5) 0.0 0.5 1.0 1.5 2.0 2.5 2011 2012 2013E 2014E 2015E 2016E 2017E Amount (bils) $ $2.1 Interest Working capital and taxes Base Investment $1.6 $1.9 $2.0 Cash flow before dividend Investment choices a Non-GAAP NOLs & Credits $0.8 $0.7 $0.7 $0.4 $0.4 $0.2 $0.1
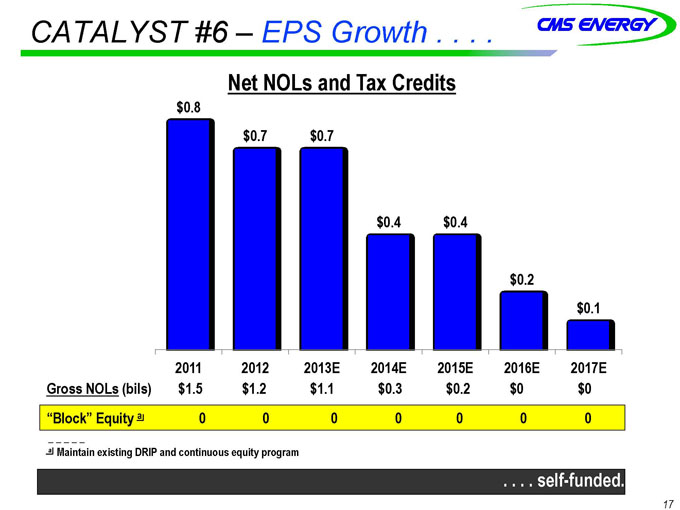
CATALYST #6 – EPS Growth
$0.8 $0.7 $0.7 $0.4 $0.4 $0.2 $0.1 2011 2012 2013E 2014E 2015E 2016E 2017E Gross NOLs (bils) $1.5 $1.2 $1.1 $0.3 $0.2 $0 $0 “Block” Equity a 0 0 0 0 0 0 0 Net NOLs and Tax CreditsNet Credits a Maintain existing DRIP and continuous equity program 543945-001 23May13 13:40 Page 22
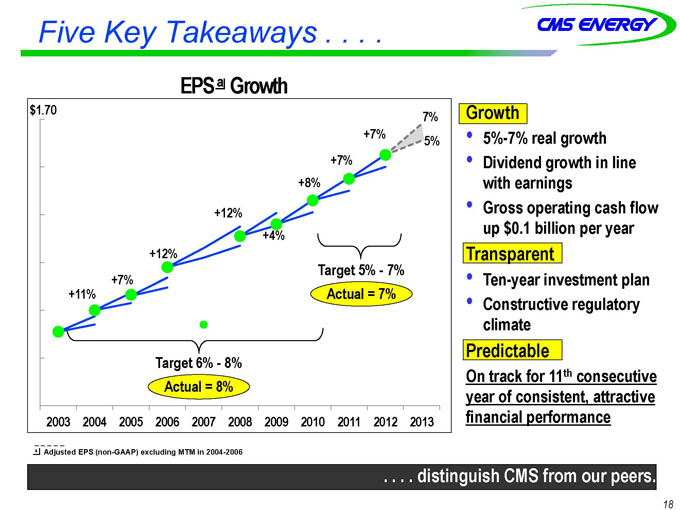
Five Key Takeaways . . . .
18 +11% +7% +12% +12% +4% +8% +7% Target 6%—8% Actual = 8% Target 5%—7% Actual = 7% a Adjusted EPS (non-GAAP) excluding MTM in 2004-2006 EPS a Growth 2003 2004 2005 2006 2007 2008 2009 2010 2011 2012 2013 +7% 7% $1.70 5% Growth •5%-7% real growth •Dividend growth in line with earnings •Gross operating cash flow up $0.1 billion per year Transparent •Ten-year investment plan •Constructive regulatory climate Predictable On track for 11th consecutive year of consistent, attractive financial performance

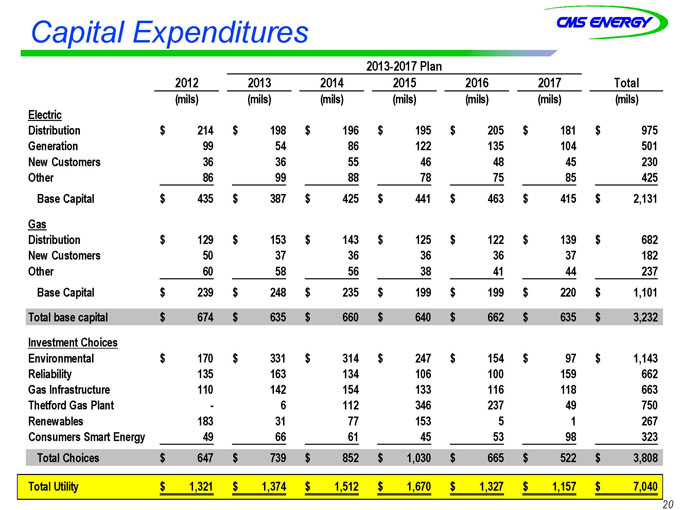
Capital Expenditures 201220132014201520162017Total(mils)(mils)(mils)(mils)(mils)(mils)(mils)ElectricDistribution214$ 198$ 196$ 195$ 205$ 181$ 975$ Generation99 54 86 122 135 104 501 New Customers36 36 55 46 48 45 230 Other86 99 88 78 75 85 425 Base Capital435$ 387$ 425$ 441$ 463$ 415$ 2,131$ GasDistribution129$ 153$ 143$ 125$ 122$ 139$ 682$ New Customers50 37 36 36 36 37 182 Other60 58 56 38 41 44 237—Base Capital239$ 248$ 235$ 199$ 199$ 220$ 1,101$ Total base capital674$ 635$ 660$ 640$ 662$ 635$ 3,232$ Investment ChoicesEnvironmental170$ 331$ 314$ 247$ 154$ 97$ 1,143$ Reliability135 163 134 106 100 159 662 Gas Infrastructure110 142 154 133 116 118 663 Thetford Gas Plant—6 112 346 237 49 750 Renewables183 31 77 153 5 1 267 Consumers Smart Energy49 66 61 45 53 98 323 Total Choices647$ 739$ 852$ 1,030$ 665$ 522$ 3,80
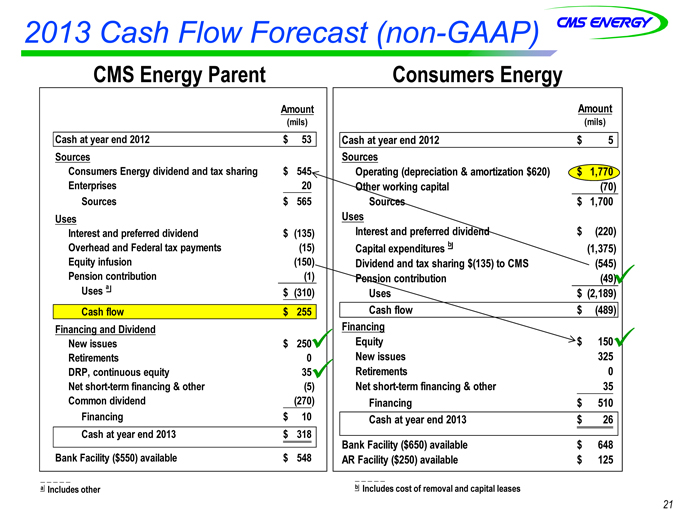
2013 Cash Flow Forecast (non-GAAP)
21
CMS Energy ParentCMS Parent Cash at year end 201253$ SourcesConsumers Energy dividend and tax sharing545$ Enterprises20 Sources565$ UsesInterest and preferred dividend(135)$ Overhead and Federal tax payments(15) Equity infusion(150) Pension contribution(1)Uses a(310)$ Cash flow255$ Financing and DividendNew issues250$ Retirements 0DRP, continuous equity35 Net short-term financing & other(5) Common dividend(270) Financing10$ Cash at year end 2013318$ Bank Facility ($550) available548$ Amount(mils)
Consumers EnergyConsumers Energy
a Includes other
b Includes cost of removal and capital leases Cash at year end 20125$ SourcesOperating (depreciation & amortization $620)1,770$ Other working capital(70)Sources1,700$ UsesInterest
and preferred dividend(220)$ Capital expenditures b(1,375) Dividend and tax sharing $(135) to CMS(545) Pension contribution(49)Uses(2,189)$ Cash flow(489)$ FinancingEquity150$ New issues325 Retirements0Net short-term financing & other35 Financing510$ Cash at year end 201326$ Bank Facility ($650) available648$ AR Facility ($250) available125
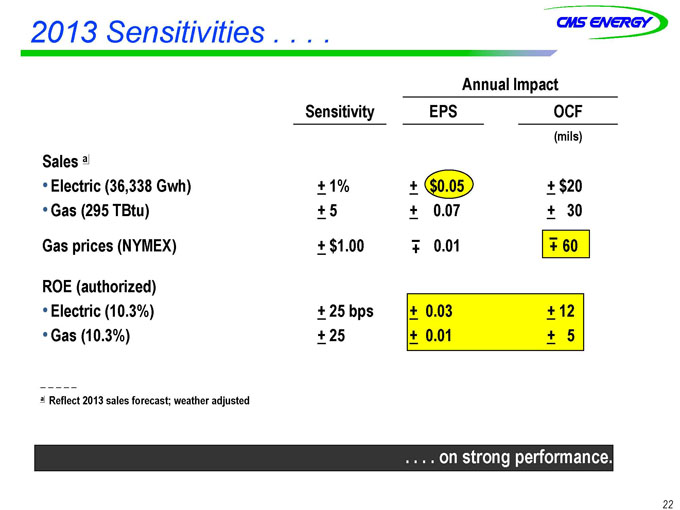
2013 Sensitivities
Annual Impact Sensitivity EPS OCF (mils) Sales a •Electric (36,338 Gwh) •Gas (295 TBtu) + 1% + 5 + $0.05 + 0.07 + $20 + 30 Gas prices (NYMEX) + $1.00 0.01 60 ROE (authorized) •Electric (10.3%) •Gas (10.3%) + 25 bps + 25 + 0.03 + 0.01 + 12 + 5
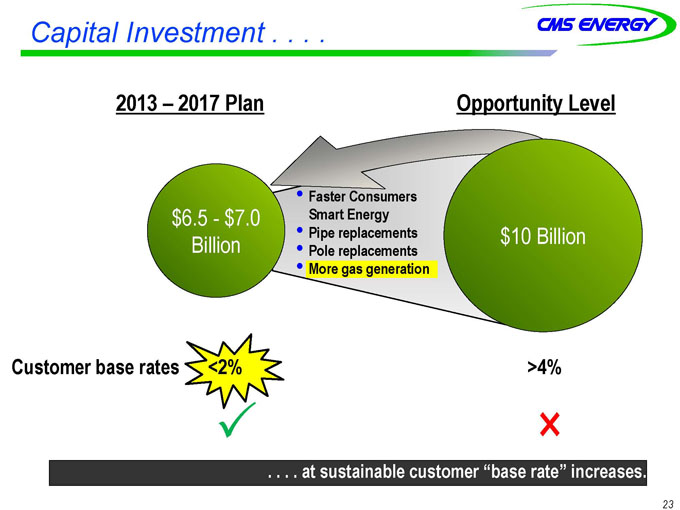
Capital Investment . . . .
. . . . a. at sustainable t customer “base rate” increases.
2013 –– 2017 Plan2017 Plan
Customer base rates <2% >4%>4%
Opportunity LevelOpportunity Level
•Faster Consumers Smart Energy
•Pipe replacements
•Pole replacements
•More gas generation
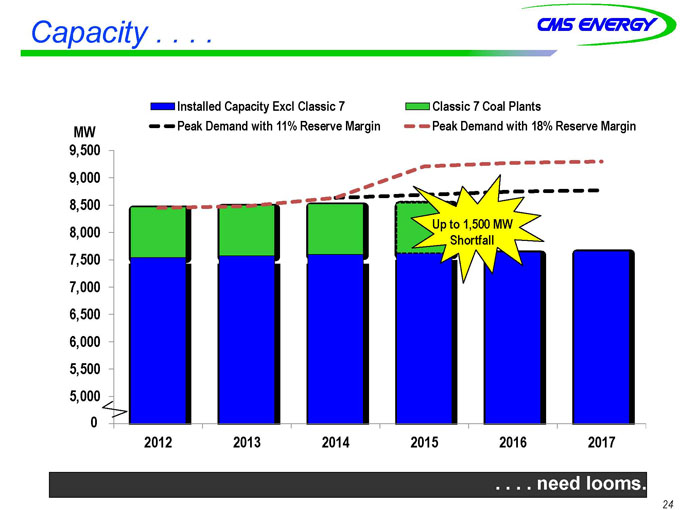
Capacity . .. . .
4,500 5,000 5,500 6,000 6,500 7,000 7,500 8,000 8,500 9,000 9,500 2012 2013 2014 2015 2016 2017 Installed Capacity Excl Classic 7 Classic 7 Coal Plants Peak Demand with 11% Reserve Margin Peak Demand with 18% Reserve Margin Up to 1,500 MW
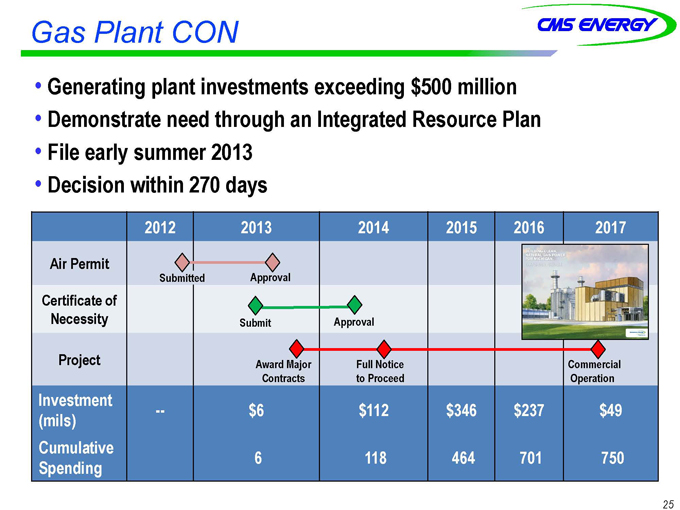
Gas Plant CON
Generating plant investments exceeding $500 millionGenerating million
••Demonstrate need through an Integrated Resource PlanDemonstrate Plan
••File early summer 2013File 2013
••Decision within 270 daysDecision days
2017
Air Permit
Certificate of Necessity
Project
Investment (mils)
$6
$112
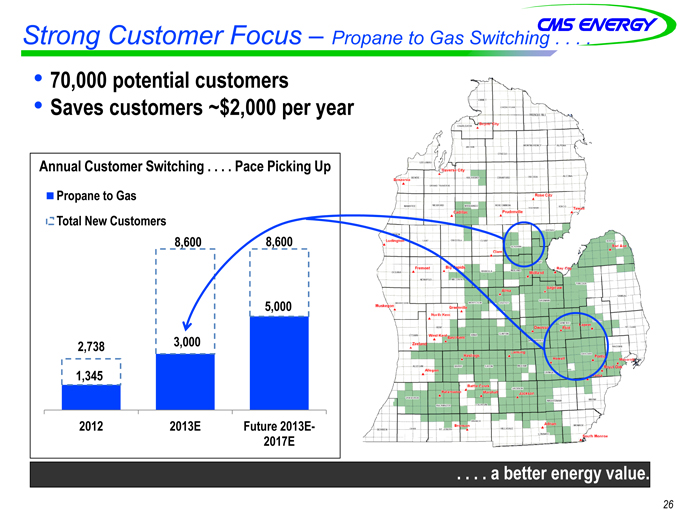
trong Customer Focus – Propane to Gas Switching . . . .
26 ••70,000 potential customers70,000 customers
••Saves customers ~$2,000 per yearSaves year 1,345 3,000 5,000 2,738 8,600 8,600 2012 2013E Future 2013E-2017E Propane to Gas Total New Customers Annual Customer Switching . . . . Pace Picking UpAnnual Up
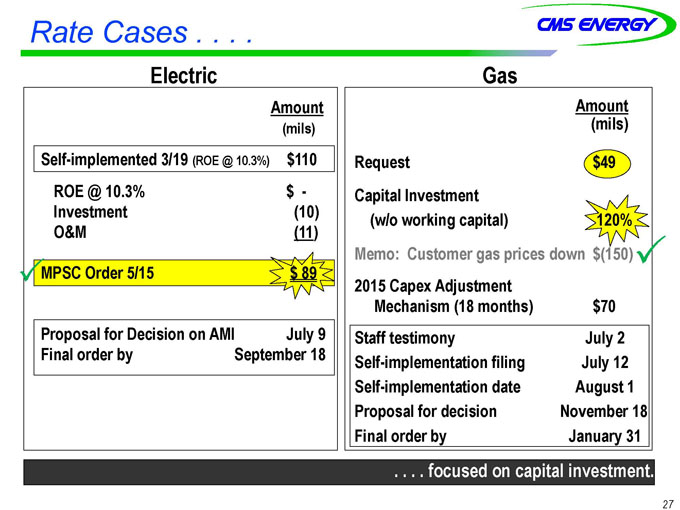
Rate Cases .. . . .
GasGas
Amount (mils)
Request $49 Capital Investment (w/o working capital) 120% Memo: Customer gas prices down $(150) 2015 Capex Adjustment Mechanism (18 months) $70 Staff testimony July 2 Self-implementation filing July 12 Self-implementation date August 1 Proposal for decision November 18
Final order by January 31 focused on capital investment. ocused ElectricElectric
Amount (mils) Self-implemented 3/19 (ROE @ 10.3%) $110 ROE @ 10.3% $— Investment (10) O&M (11) MPSC Order 5/15 $ 89 Proposal for Decision on AMI July 9 Final order by September 18
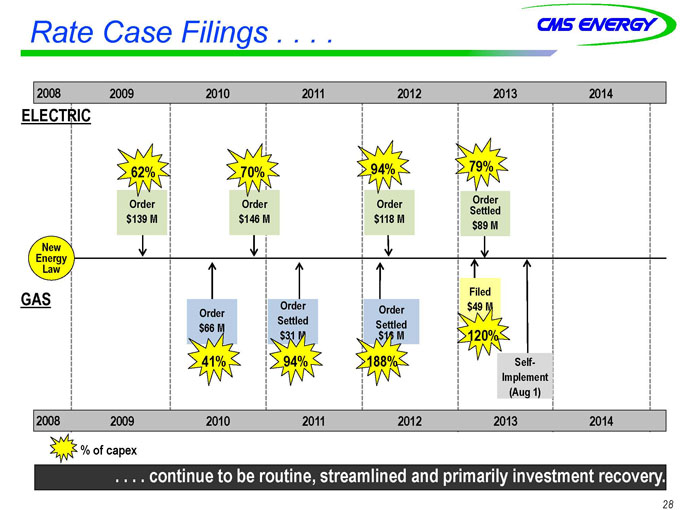
Rate Case Filings . . . .
20082008
ELECTRICELECTRIC GASGAS OrderOrder $66 M$M OrderOrder SettledSettled $31 M$M NewNew EnergyEnergy LawLaw OrderOrder SettledSettled $16 MM FiledFiled $49 M$M 41% 20082008 SelfSelf— ImplementImplement (Aug 1)(1) OrderOrder $139 M$M OrderOrder $146 M$M OrderOrder $118 M$M OrderOrder SettledSettled $89 M$M 62% 70% 94% 94% 188% 120% % of capexcapex 20142014 20132013 20122012 20112011 20102010 20092009 20142014 20132013 20122012 20112011 20102010 20092009 79%
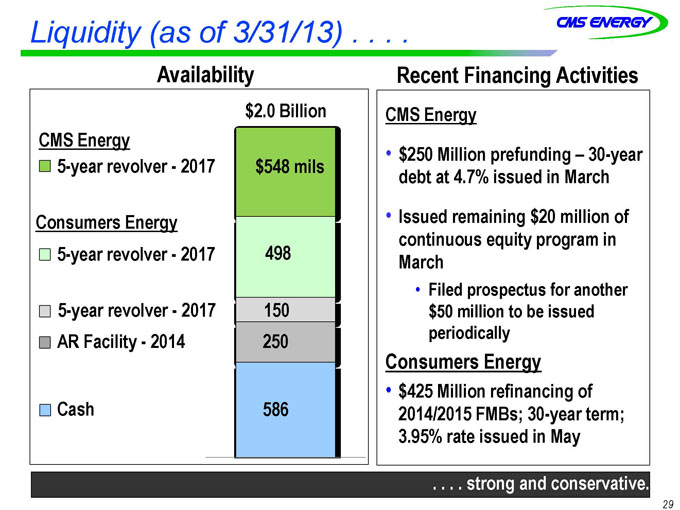
Liquidity (as of 3/31/13) . . . .
. . . strong and conservative. conservative.
$2.0 Billion$Billion CMS Energy 5-year revolver—2017 Consumers Energy Cash AR Facility—2014 5-year revolver—2017 5-year revolver—2017 $548 mils 498 150 250 586 AvailabilityAvailability Recent Financing ActivitiesRecent Activities CMS Energy •$250 Million prefunding – 30-year debt at 4.7% issued in March •Issued remaining $20 million of continuous equity program in March •Filed prospectus for another $50 million to be issued periodically Consumers Energy •$425 Million refinancing of 2014/2015 FMBs; 30-year term; 3.95% rate issued in May
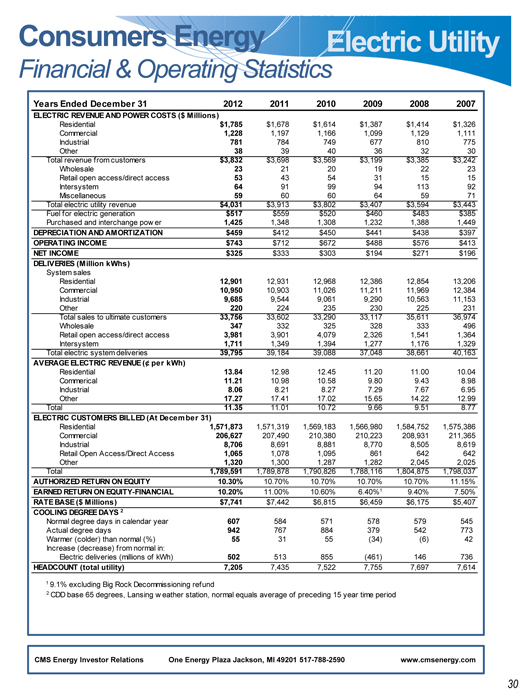
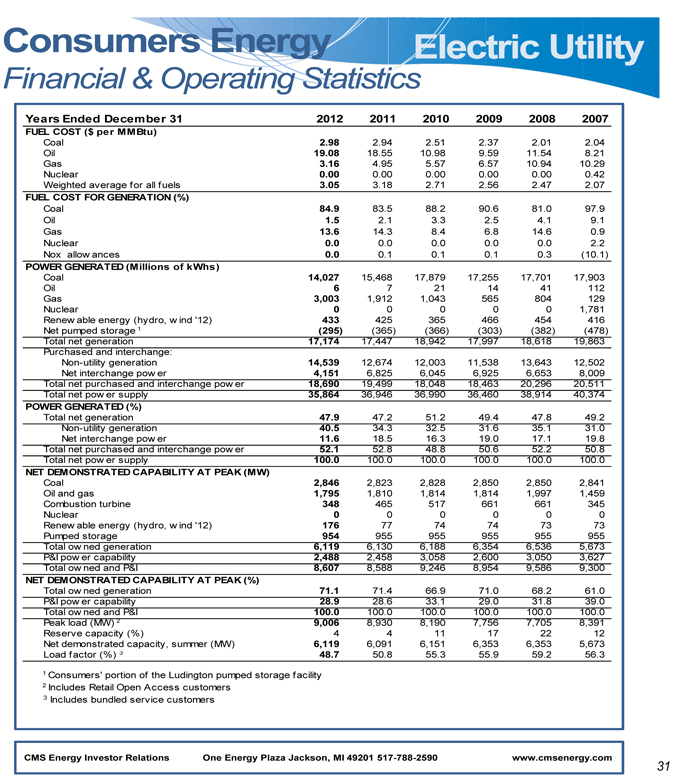
2590Consumers & Operating StatisticsElectric 31201220112010200920082007ELECTRIC COSTS ($ Millions)Residential$1,785$1,678$1,614$1,387$1,414$1,326Commercial1,2281,1971,1661,0991,1291,111Industrial781784749677810775Other383940363230Total customers$3,832$3,698$3,569$3,199$3,385$3,242Wholesale232120192223Retail access534354311515Intersystem 6491999411392Miscellaneous596060645971Total revenue$4,031$3,913$3,802$3,407$3,594$3,443Fuel generation$517$559$520$460$483$385Purchased power1,4251,3481,3081,2321,3881,449DEPRECIATION AMORTIZATION$459$412$450$441$438$397OPERATING INCOME$743$712$672$488$576$413NET INCOME$325$333$303$194$271$196DELIVERIES 0,56311,153Other220224235230225231Total customers33,75633,60233,29033,11735,61136,974Wholesale347332325328333496Retail access3,9813,9014,0792,3261,5411,364Intersystem 1,7111,3491,3941,2771,1761,329Total deliveries39,79539,18439,08837,04838,66140,163AVERAGE kWh)Residential13.8412.9812.4511.2011.0010.04Commerical11.2110.9810.589.809.438.98Industrial8.068.218.277.297.676.95Other17.2717.41.0215.6514.2212.99Total11.3511.0110.729.669.518.77ELECTRIC December 31)Residential1,571,8731,571,3191,569,1831,566,9801,584,7521,575,386Commercial206,627207,490210,380210,223208,931211,365Industrial7068,6918,8818,7708,5058,619Retail Access1,0651,0781,095861642642Other1,3201,3001,2871,2822,0452,025Total1,789,5911,789,8781,790,8261,788,1161,804,8751,798,037AUTEQUITY10.30%10.70%10.70%10.70%10.70%11.15%FINANCIAL10.20%11.00%10.60%6.40%19.40%7.50%Millions)$7,741$7,442$6,815$6,459$6,175$5,407COOLING year607584571578579545Actual days942767884379542773Warmer 55 31 55 (34) (6) 42 502513855(461)146736HEADCOUNT 7,2057,4357,5227,7557,6977,6141 Decommissioning refund2 weather station, normal equals average of preceding 15 year time period 5
Energy Investor Relationswww.cmsenergy.comOne
2590Consumers & Operating StatisticsElectric 31201220112010200920082007FUEL Coal2.982.942.512.372.012.04Oil19.0818.5510.989.5911.548.21Gas3.164.955.576.5710.9410.29Nuclear0.000.000.000.000.000.42Weighted fuels3.053.182.712.562.472.07FUEL Coal84.983.588.290.681.097.9Oil1.52.13.32.54.19.1Gas13.614.38.46.814.60.9Nuclear0.00.00.00.00.02.2Nox allowances0.00.10.10.10.3(10.1)Coal14,02715,46817,87917,25517,70117,903Oil67211441112Gas3,0031,9121,043565804129Nuclear000001,781Renewable 433425365466454416Net 1(295)(365)(366)(303)(382)(478)generation17,17417,44718,94217,99718,61819,863Purchased generation14,53912,67412,00311,53813,64312,502Net power4,1516,8256,0456,9256,6538,009Total power18,69019,49918,04818,46320,29620,511Total supply35,86436,94636,99036,46038,91440,374POWER generation47.9 47.2 51.2 49.4 47.8 49.2 generation40.5 34.3 32.5 31.6 35.1 31.0 power11.6 18.5 16.3 19.0 17.1 19.8 power52.1 52.8 48.8 50.6 52.2 50.8 supply100.0 100.0 100.0 100.0 100.0 100.0 PEAK (MW)Coal2,8462,8232,8282,8502,8502,841Oil gas1,7951,8101,8141,8141,9971,459Combustion turbine348465517661661345Nuclear000000Renewable 1767774747373Pumped storage954955955955955955Total generation6,1196,1306,1886,3546,5365,673P&capability2,4882,4583,0582,6003,0503,627Total I8,6078,5889,2468,9549,5869,300NET PEAK (%)generation71.1 71.4 66.9 71.0 68.2 61.0 capability28.9 28.6 33.1 29.0 31.8 39.0 I100.0 100.0 100.0 100.0 100.0 100.0 29,0068,9308,1907,7567,7058,391Reserve 4411172212Net 6,1196,0916,1516,3536,3535,673Load 348.750.855.355.959.256.31 pumped storage facility2
Investor Relationswww.cmsenergy.comOne
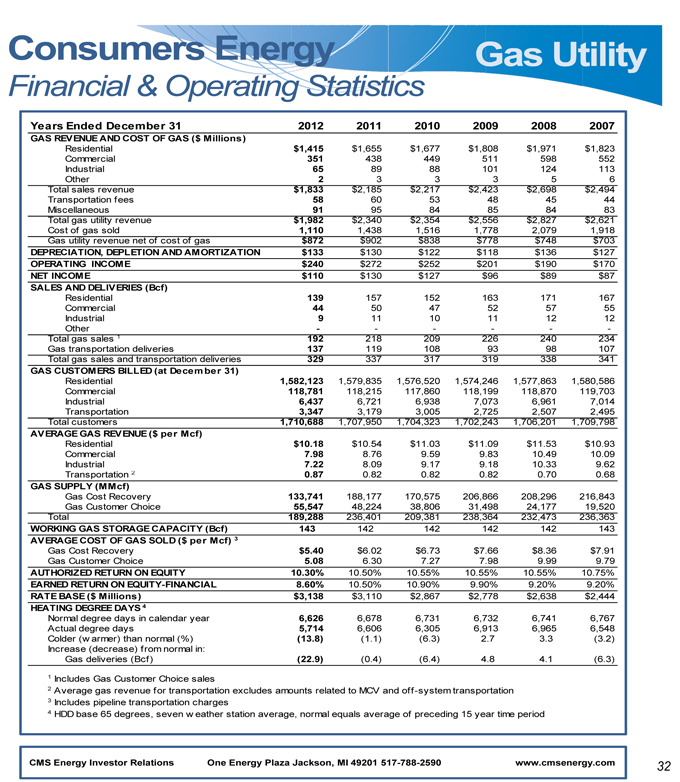
2590Consumers & Operating StatisticsGas 31201220112010200920082007GAS ($ Millions)Residential$1,415$1,655$1,677$1,808$1,971$1,823Commercial351438449511598552Industrial658988101124113Other233356Total revenue$1,833$2,185$2,217$2,423$2,698$2,494Transportation fees586053484544Miscellaneous919584858483Total revenue$1,982$2,340$2,354$2,556$2,827$2,621Cost sold1,1101,4381,5161,7782,0791,918Gas gas$872$902$838$778$748$703DEPRECIATION, AMORTIZATION$133$130$122$118$136$127OPERATING INCOME$240$272$252$201$190$170NET INCOME$110$130$127$96$89$87SALES Residential139157152163171167Commercial445047525755Industrial91110111212Other——— 1192218209226240234Gas deliveries1371191089398107Total deliveries329337317319338341GAS December 31)Residential1,582,1231,579,8351,576,5201,574,2461,577,8631,580,586Commercial118,781118,215117,860118,199118,870119,703Industrial4376,7216,9387,0736,9617,014Transportation3,3473,1793,0052,7252,5072,495Total customers1,710,6881,707,9501,704,3231,702,2431,706,2011,709,798AVERAGE Mcf)Residential$10.18$10.54$11.03$11.09$11.53$10.93Commercial7.988.769.599.8310.4910.09Industrial7.228.099.179.1810.339.62Transportation 20.870.820.820.820.700.68GAS Recovery133,741188,177170,575206,866208,296216,843Gas Choice55,54748,22438,80631,49824,17719,520Total189,288236,401209,381238,364232,473236,363WORKING CAPACITY (Bcf)143142142142142143AVERAGE per Mcf) 3Gas Recovery$5.40$6.02$6.73$7.66$8.36$7.91Gas Choice5.086.307.277.989.999.79AUTHORIZED EQUITY10.30%10.50%10.55%10.55%10.55%10.75%FINANCIAL8.60%10.50%10.90%9.90%9.20%9.20%Millions)$3,138$3,110$2,867$2,778$2,638$2,444HEATING year6,6266,6786,7316,7326,7416,767Actual days5,7146,6066,3056,9136,9656,548Colder (%)(13.8) (1.1) (6.3) 2.7 3.3 (3.2) in:Bcf)(22.9)(0.4)(6.4)4.84.1(6.3)sales2 transportation excludes amounts related to MCV and off-system transportation3 charges4 weather station average, normal equals average of preceding 15 year time period
Investor Relationswww.cmsenergy.comOne Energy Plaza Jackson, MI 49201 517-788-2590Consumers
Enterprises Power(GraylingMichigan Power(KalamazooRiver)CravenGeneseeDIGEnerBank ProductionTotal MW1,035 (net owned) 1,135PlantCravenDIGFiler GasCoalWoodWoodNatural GasOwnershipInterest50%100505050100GrossCapacity50710734038224In-ServiceYear199020011990199619921999CapacityUnder LTContract100%3910010010047StateNCMIMIMIMIMIAs December 31, 2012
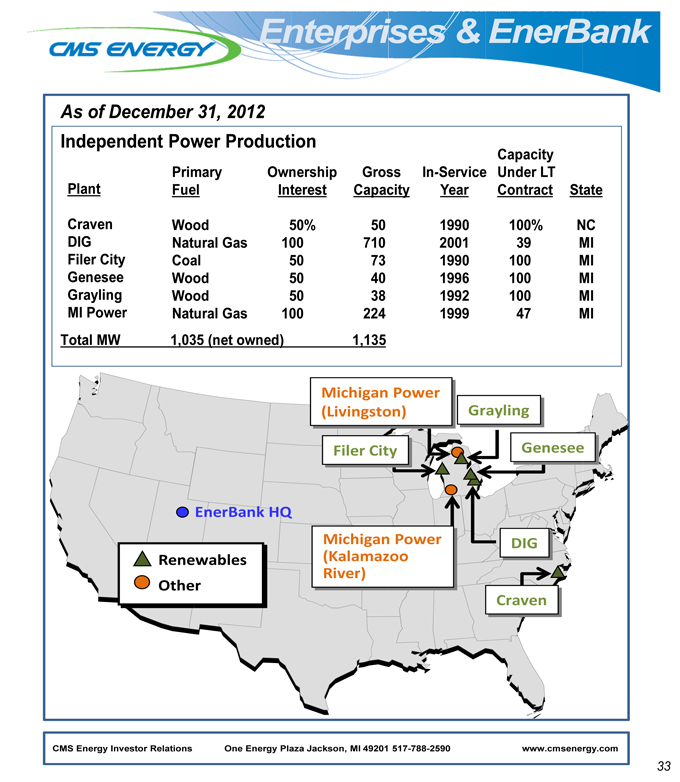
33 Investor Relationswww.cmsenergy.comOne Energy Plaza Jackson, MI 49201 517-788-2590Enterprises Power(GraylingMichigan Power(KalamazooRiver)CravenGeneseeDIGEnerBank ProductionTotal MW1,035 (net owned) 1,135PlantCravenDIGFiler GasCoalWoodWoodNatural GasOwnershipInterest50%100505050100GrossCapacity50710734038224In-ServiceYear199020011990199619921999CapacityUnder LTContract100%3910010010047StateNCMIMIMIMIMIAs December 31, 2012

Reconciliation

CMS ENERGY CORPORATION
Earnings Per Share By Year GAAP Reconciliation
(Unaudited)
| | | | | | | | | | | | | | | | | | | | | | | | | | | | | | | | | | | | | | | | |
| | | 2003
| | | 2004
| | | 2005
| | | 2006
| | | 2007
| | | 2008
| | | 2009
| | | 2010
| | | 2011
| | | 2012
| |
Reported earnings (loss) per share - GAAP | | ($ | 0.30 | ) | | $ | 0.64 | | | ($ | 0.44 | ) | | ($ | 0.41 | ) | | ($ | 1.02 | ) | | $ | 1.20 | | | $ | 0.91 | | | $ | 1.28 | | | $ | 1.58 | | | $ | 1.42 | |
| | |
|
|
| |
|
|
| |
|
|
| |
|
|
| |
|
|
| |
|
|
| |
|
|
| |
|
|
| |
|
|
| |
|
|
|
After-tax items: | | | | | | | | | | | | | | | | | | | | | | | | | | | | | | | | | | | | | | | | |
Electric and gas utility | | | 0.21 | | | | (0.39 | ) | | | — | | | | — | | | | (0.07 | ) | | | 0.05 | | | | 0.33 | | | | 0.03 | | | | 0.00 | | | | 0.17 | |
Enterprises | | | 0.74 | | | | 0.62 | | | | 0.04 | | | | (0.02 | ) | | | 1.25 | | | | (0.02 | ) | | | 0.09 | | | | (0.03 | ) | | | (0.11 | ) | | | (0.01 | ) |
Corporate interest and other | | | 0.16 | | | | (0.03 | ) | | | 0.04 | | | | 0.27 | | | | (0.32 | ) | | | (0.02 | ) | | | 0.01 | | | | * | | | | (0.01 | ) | | | * | |
Discontinued operations (income) loss | | | (0.16 | ) | | | 0.02 | | | | (0.07 | ) | | | (0.03 | ) | | | 0.40 | | | | ( | *) | | | (0.08 | ) | | | 0.08 | | | | (0.01 | ) | | | (0.03 | ) |
Asset impairment charges, net | | | — | | | | — | | | | 1.82 | | | | 0.76 | | | | 0.60 | | | | — | | | | — | | | | — | | | | — | | | | — | |
Cumulative accounting changes | | | 0.16 | | | | 0.01 | | | | — | | | | — | | | | — | | | | — | | | | — | | | | — | | | | — | | | | — | |
| | |
|
|
| |
|
|
| |
|
|
| |
|
|
| |
|
|
| |
|
|
| |
|
|
| |
|
|
| |
|
|
| |
|
|
|
Adjusted earnings per share, including MTM - non-GAAP | | $ | 0.81 | | | $ | 0.87 | | | $ | 1.39 | | | $ | 0.57 | | | $ | 0.84 | | | $ | 1.21 | (a) | | $ | 1.26 | | | $ | 1.36 | | | $ | 1.45 | | | $ | 1.55 | |
Mark-to-market impacts | | | | | | | 0.03 | | | | (0.43 | ) | | | 0.51 | | | | | | | | | | | | | | | | | | | | | | | | | |
| | |
|
|
| |
|
|
| |
|
|
| |
|
|
| |
|
|
| |
|
|
| |
|
|
| |
|
|
| |
|
|
| |
|
|
|
Adjusted earnings per share, excluding MTM - non-GAAP | | | NA | | | $ | 0.90 | | | $ | 0.96 | | | $ | 1.08 | | | | NA | | | | NA | | | | NA | | | | NA | | | | NA | | | | NA | |
| | |
|
|
| |
|
|
| |
|
|
| |
|
|
| |
|
|
| |
|
|
| |
|
|
| |
|
|
| |
|
|
| |
|
|
|
| * | | Less than $500 thousand or $0.01 per share. |
| (a) | | $1.25 excluding discontinued Exeter operations and accounting changes related to convertible debt and restricted stock. |
35
CMS Energy
Reconciliation of Gross Operating Cash Flow to GAAP Operating Activities
(unaudited)
(mils)
| | | | | | | | | | | | | | | | | | | | | | | | | | | | |
| | | 2011
| | | 2012
| | | 2013
| | | 2014
| | | 2015
| | | 2016
| | | 2017
| |
Consumers Operating Income + Depreciation & Amortization | | $ | 1,527 | | | $ | 1,635 | | | $ | 1,735 | | | $ | 1,821 | | | $ | 1,948 | | | $ | 2,011 | | | $ | 2,113 | |
Enterprises Project Cash Flows | | | 24 | | | | 17 | | | | 20 | | | | 29 | | | | 37 | | | | 44 | | | | 56 | |
| | |
|
|
| |
|
|
| |
|
|
| |
|
|
| |
|
|
| |
|
|
| |
|
|
|
Gross Operating Cash Flow | | $ | 1,551 | | | $ | 1,652 | | | $ | 1,755 | | | $ | 1,850 | | | $ | 1,985 | | | $ | 2,055 | | | $ | 2,169 | |
Other operating activities including taxes, interest payments and working capital | | | (382 | ) | | | (411 | ) | | | (405 | ) | | | (400 | ) | | | (435 | ) | | | (805 | ) | | | (819 | ) |
| | |
|
|
| |
|
|
| |
|
|
| |
|
|
| |
|
|
| |
|
|
| |
|
|
|
Net cash provided by operating activities | | $ | 1,169 | | | $ | 1,241 | | | $ | 1,350 | | | $ | 1,450 | | | $ | 1,550 | | | $ | 1,250 | | | $ | 1,350 | |
| | |
|
|
| |
|
|
| |
|
|
| |
|
|
| |
|
|
| |
|
|
| |
|
|
|
36
Consumers Energy
2013 Forecasted Cash Flow GAAP Reconciliation (in millions) (unaudited)
| | | | | | | | | | | | | | | | | | | | | | | | | | | | | | | | | | | | | | |
| | | | Reclassifications From Sources and Uses to Statement of Cash Flows
| | | | | | |
Presentation Sources and Uses
| | | Tax | | | Interest | | | Other Working | | | Capital | | | Securitization | | | Preferred | | | Common | | | Consolidated Statements of Cash Flows
|
Description
| | non-GAAP
Amount
| | | Sharing
Operating
| | | Payments
as Operating
| | | Capital
as Investing
| | | Lease Pymts
as Financing
| | | Debt Pymts
as Financing
| | | Dividends
as Financing
| | | Dividends
as Financing
| | | GAAP
Amount
| | | Description
|
Cash at year end 2012 | | $ | 5 | | | $ | — | | | $ | — | | | $ | — | | | $ | — | | | $ | — | | | $ | — | | | $ | — | | | $ | 5 | | | Cash at year end 2012 |
Sources | | | | | | | | | | | | | | | | | | | | | | | | | | | | | | | | | | | | | | |
Operating (dep & amort $620) | | $ | 1,770 | | | | | | | | | | | | | | | | | | | | | | | | | | | | | | | | | | | |
Other working capital | | | (70 | ) | | | | | | | | | | | | | | | | | | | | | | | | | | | | | | | | | | |
| | |
|
|
| |
|
|
| |
|
|
| |
|
|
| |
|
|
| |
|
|
| |
|
|
| |
|
|
| |
|
|
| | |
Sources | | $ | 1,700 | | | $ | (135 | ) | | $ | (218 | ) | | $ | (108 | ) | | $ | 28 | | | $ | 41 | | | $ | — | | | $ | — | | | $ | 1,308 | | | Net cash provided by operating activities |
Uses | | | | | | | | | | | | | | | | | | | | | | | | | | | | | | | | | | | | | | |
Interest and preferred dividend | | $ | (220 | ) | | | | | | | | | | | | | | | | | | | | | | | | | | | | | | | | | | |
Capital expendituresa | | | (1,375 | ) | | | | | | | | | | | | | | | | | | | | | | | | | | | | | | | | | | |
Dividends and tax sharing $(135) to CMS | | | (545 | ) | | | | | | | | | | | | | | | | | | | | | | | | | | | | | | | | | | |
Pension Contribution | | | (49 | ) | | | | | | | | | | | | | | | | | | | | | | | | | | | | | | | | | | |
| | |
|
|
| |
|
|
| |
|
|
| |
|
|
| |
|
|
| |
|
|
| |
|
|
| |
|
|
| |
|
|
| | |
Uses | | $ | (2,189 | ) | | $ | 135 | | | $ | 218 | | | $ | 108 | | | $ | — | | | $ | — | | | $ | 2 | | | $ | 410 | | | $ | (1,316 | ) | | Net cash provided by investing activities |
| | |
|
|
| |
|
|
| |
|
|
| |
|
|
| |
|
|
| |
|
|
| |
|
|
| |
|
|
| |
|
|
| | |
| | | | | | | | | | | | | | | | | | | | | | | | | | | | | | | | | | | | | | | |
Cash flow | | $ | (489 | ) | | $ | — | | | $ | — | | | $ | — | | | $ | 28 | | | $ | 41 | | | $ | 2 | | | $ | 410 | | | $ | (8 | ) | | Cash flow from operating and investing activities |
| | | | | | | | | | | | | | | | | | | | | | | | | | | | | | | | | | | | | | | |
| | | | | | | | | | | | | | | | | | | | | | | | | | | | | | | | | | | | | | | |
Financing | | | | | | | | | | | | | | | | | | | | | | | | | | | | | | | | | | | | | | |
Equity | | $ | 150 | | | | | | | | | | | | | | | | | | | | | | | | | | | | | | | | | | | |
New Issues | | | 325 | | | | | | | | | | | | | | | | | | | | | | | | | | | | | | | | | | | |
Retirements | | | — | | | | | | | | | | | | | | | | | | | | | | | | | | | | | | | | | | | |
Net short-term financing & other | | | 35 | | | | | | | | | | | | | | | | | | | | | | | | | | | | | | | | | | | |
| | |
|
|
| |
|
|
| |
|
|
| |
|
|
| |
|
|
| |
|
|
| |
|
|
| |
|
|
| |
|
|
| | |
Financing | | $ | 510 | | | $ | — | | | $ | — | | | $ | — | | | $ | (28 | ) | | $ | (41 | ) | | $ | (2 | ) | | $ | (410 | ) | | $ | 29 | | | Net cash provided by financing activities |
| | |
|
|
| |
|
|
| |
|
|
| |
|
|
| |
|
|
| |
|
|
| |
|
|
| |
|
|
| |
|
|
| | |
Net change in cash | | $ | 21 | | | $ | — | | | $ | — | | | $ | — | | | $ | — | | | $ | — | | | $ | — | | | $ | — | | | $ | 21 | | | Net change in cash |
| | |
|
|
| |
|
|
| |
|
|
| |
|
|
| |
|
|
| |
|
|
| |
|
|
| |
|
|
| |
|
|
| | |
Cash at year end 2013 | | $ | 26 | | | $ | — | | | $ | — | | | $ | — | | | $ | — | | | $ | — | | | $ | — | | | $ | — | | | $ | 26 | | | Cash at year end 2013 |
| | |
|
|
| |
|
|
| |
|
|
| |
|
|
| |
|
|
| |
|
|
| |
|
|
| |
|
|
| |
|
|
| | |
a Includes cost of removal and capital leases
37
CMS Energy Parent
2013 Forecasted Cash Flow GAAP Reconciliation (in millions) (unaudited)
| | | | | | | | | | | | | | | | | | | | | | | | | | |
| | | Reclassifications From Sources and Uses to Statement of Cash Flows
| | | | | | |
Presentation Sources and Uses
| | | Interest | | | Overheads & | | | Other | | | Cash From | | | Consolidated Statements of Cash Flows
|
Description
| | non-GAAP
Amount
| | | Payments
as Operating
| | | Tax Payments
as Operating
| | | Uses (a) as
Operating
| | | Consolidated
Companies
| | | GAAP
Amount
| | | Description
|
Cash at year end 2012 | | $ | 53 | | | $ | — | | | $ | — | | | $ | — | | | $ | 35 | | | $ | 88 | | | Cash at year end 2012 |
| | | | | | | |
Sources | | | | | | | | | | | | | | | | | | | | | | | | | | |
Consumers Energy dividends/tax sharing | | $ | 545 | | | | | | | | | | | | | | | | | | | | | | | |
Enterprises | | | 20 | | | | | | | | | | | | | | | | | | | | | | | |
| | |
|
|
| |
|
|
| |
|
|
| |
|
|
| |
|
|
| |
|
|
| | |
Sources | | $ | 565 | | | $ | (135 | ) | | $ | (15 | ) | | $ | | (9) | | $ | 23 | | | $ | 429 | | | Net cash provided by operating activities |
| | | | | | | |
Uses | | | | | | | | | | | | | | | | | | | | | | | | | | |
Interest and preferred dividends | | $ | (135 | ) | | | | | | | | | | | | | | | | | | | | | | |
Overhead and Federal tax payments | | | (15 | ) | | | | | | | | | | | | | | | | | | | | | | |
Equity infusions | | | (150 | ) | | | | | | | | | | | | | | | | | | | | | | |
Pension Contribution | | | (1 | ) | | | | | | | | | | | | | | | | | | | | | | |
| | |
|
|
| |
|
|
| |
|
|
| |
|
|
| |
|
|
| |
|
|
| | |
Uses (a) | | $ | (310 | ) | | $ | 135 | | | $ | 15 | | | $ | 9 | | | $ | (86 | ) | | $ | (237 | ) | | Net cash provided by investing activities |
| | | | | | | | | | | | | | | | | | | | | | | | | | | |
| | |
|
|
| |
|
|
| |
|
|
| |
|
|
| |
|
|
| |
|
|
| | |
| | | | | | | |
Cash flow | | $ | 255 | | | $ | — | | | $ | — | | | $ | — | | | $ | (63 | ) | | $ | 192 | | | Cash flow from operating and investing activities |
| | | | | | | |
Financing and dividends | | | | | | | | | | | | | | | | | | | | | | | | | | |
New Issues | | $ | 250 | | | | | | | | | | | | | | | | | | | | | | | |
Retirements | | | — | | | | | | | | | | | | | | | | | | | | | | | |
DRP, continuous equity | | | 35 | | | | | | | | | | | | | | | | | | | | | | | |
Net short-term financing & other | | | (5 | ) | | | | | | | | | | | | | | | | | | | | | | |
Common dividend | | | (270 | ) | | | | | | | | | | | | | | | | | | | | | | |
| | |
|
|
| |
|
|
| |
|
|
| |
|
|
| |
|
|
| |
|
|
| | |
Financing | | $ | 10 | | | $ | — | | | $ | — | | | $ | — | | | $ | 72 | | | $ | 82 | | | Net cash provided by financing activities |
| | |
|
|
| |
|
|
| |
|
|
| |
|
|
| |
|
|
| |
|
|
| | |
Net change in cash | | $ | 265 | | | $ | — | | | $ | — | | | $ | — | | | $ | 9 | | | $ | 274 | | | Net change in cash |
| | |
|
|
| |
|
|
| |
|
|
| |
|
|
| |
|
|
| |
|
|
| | |
Cash at year end 2013 | | $ | 318 | | | $ | — | | | $ | — | | | $ | — | | | $ | 44 | | | $ | 362 | | | Cash at year end 2013 |
| | |
|
|
| |
|
|
| |
|
|
| |
|
|
| |
|
|
| |
|
|
| | |
38
Consolidated CMS Energy
2013 Forecasted Consolidation of Consumers Energy and CMS Energy Parent Statements of Cash Flow (in millions) (unaudited)
| | | | | | | | | | | | | | | | | | | | | | | | | | |
Statements of Cash Flows
| | | Eliminations/Reclassifications to Arrive at the
Consolidated Statement of Cash Flows
| | | Consolidated Statements of Cash Flows
|
| | Consumers
Common Dividend
as Financing
| | | Consumers
Preferred Dividend
as Operating
| | | Equity
Infusions to
Consumers
| | |
| | | Consumers
Amount
| | | CMS Parent
Amount
| | | | | |
Description
| | | | | | | Amount
| | | Description
|
Cash at year end 2012 | | $ | 5 | | | $ | 88 | | | $ | — | | | $ | — | | | $ | — | | | $ | 93 | | | Cash at year end 2012 |
Net cash provided by operating activities | | $ | 1,308 | | | $ | 429 | | | $ | (410 | ) | | $ | (2 | ) | | $ | — | | | $ | 1,325 | | | Net cash provided by operating activities |
Net cash provided by investing activities | | | (1,316 | ) | | | (237 | ) | | | — | | | | — | | | | 150 | | | | (1,403 | ) | | Net cash provided by investing activities |
| | |
|
|
| |
|
|
| |
|
|
| |
|
|
| |
|
|
| |
|
|
| | |
Cash flow from operating and investing activities | | $ | (8 | ) | | $ | 192 | | | $ | (410 | ) | | $ | (2 | ) | | $ | 150 | | | $ | (78 | ) | | Cash flow from operating and investing activities |
Net cash provided by financing activities | | $ | 29 | | | $ | 82 | | | $ | 410 | | | $ | 2 | | | $ | (150 | ) | | $ | 373 | | | Net cash provided by financing activities |
| | |
|
|
| |
|
|
| |
|
|
| |
|
|
| |
|
|
| |
|
|
| | |
Net change in cash | | $ | 21 | | | $ | 274 | | | $ | — | | | $ | — | | | $ | — | | | $ | 295 | | | Net change in cash |
| | |
|
|
| |
|
|
| |
|
|
| |
|
|
| |
|
|
| |
|
|
| | |
Cash at year end 2013 | | $ | 26 | | | $ | 362 | | | $ | — | | | $ | — | | | $ | — | | | $ | 388 | | | Cash at year end 2013 |
| | |
|
|
| |
|
|
| |
|
|
| |
|
|
| |
|
|
| |
|
|
| | |
39