Exhibit 99.1
CMS ENERGY
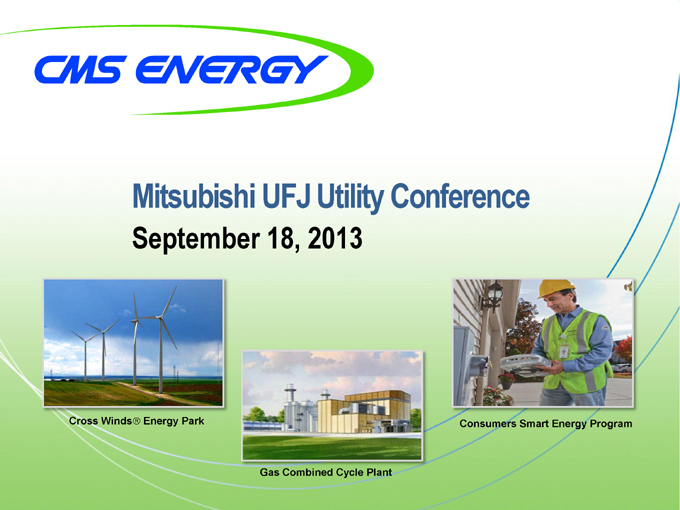
Mitsubishi UFJ Utility Conference
September 18, 2013
Cross Winds® Energy Park
Gas Combined Cycle Plant
Consumers Smart Energy Program
CMS ENERGY
This presentation is made as of the date hereof and contains “forward-looking statements” as defined in Rule 3b-6 of the
Securities Exchange Act of 1934, Rule 175 of the Securities Act of 1933, and relevant legal decisions. The forward-looking statements are subject to risks and uncertainties. All forward-looking statements should be considered in the context of the risk and other factors detailed from time to time in CMS Energy’s and Consumers Energy’s Securities and Exchange Commission filings. Forward-looking statements should be read in conjunction with “FORWARD-LOOKING STATEMENTS AND
INFORMATION” and “RISK FACTORS” sections of CMS Energy’s and Consumers Energy’s Form 10-K for the year ended December 31, 2012 and as updated in subsequent 10-Qs. CMS Energy’s and Consumers Energy’s “FORWARD-LOOKING STATEMENTS AND INFORMATION” and “RISK FACTORS” sections are incorporated herein by reference and discuss important factors that could cause CMS Energy’s and Consumers Energy’s results to differ materially from those anticipated in such statements. CMS Energy and Consumers Energy undertake no obligation to update any of the information presented herein to reflect facts, events or circumstances after the date hereof.
The presentation also includes non-GAAP measures when describing CMS Energy’s results of operations and financial performance. A reconciliation of each of these measures to the most directly comparable GAAP measure is included in the appendix and posted on our website at www.cmsenergy.com.
CMS Energy provides historical financial results on both a reported (Generally Accepted Accounting Principles) and adjusted (non-GAAP) basis and provides forward-looking guidance on an adjusted basis. Management views adjusted earnings as a key measure of the company’s present operating financial performance, unaffected by discontinued operations, asset sales, impairments, regulatory items from prior years, or other items. These items have the potential to impact, favorably or unfavorably, the company’s reported earnings in future periods. Because the company is not able to estimate the impact of these matters, the company is not providing a reconciliation to the comparable future period reported earnings.
2
CMS ENERGY
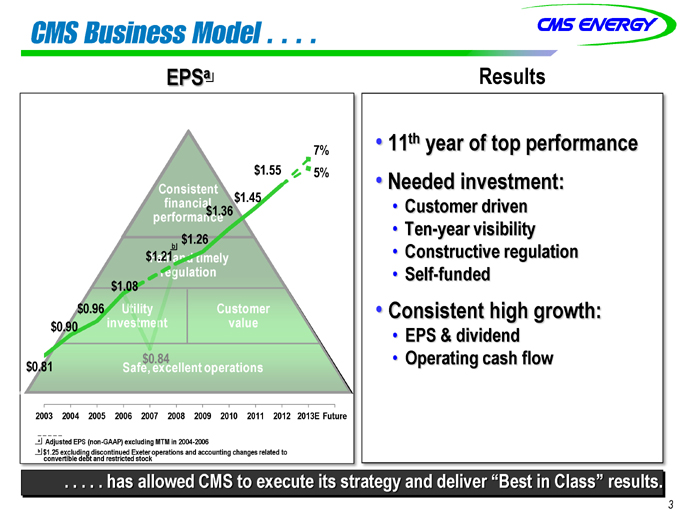
CMS Business Model . . . .
EPSa
Results
7%
$1.55
5%
Consistent financial performance
$1.45
$1.36
$1.26
$1.21b
Fair and timely regulation
$1.08
$0.96
Utility investment
Customer value
$0.90
$0.84
$0.81
Safe, excellent operations
2003 2004 2005 2006 2007 2008 2009 2010 2011 2012 2013E Future
11th year of top performance
Needed investment:
Customer driven
Ten-year visibility
Constructive regulation
Self-funded
Consistent high growth:
EPS & dividend
Operating cash flow
a Adjusted EPS (non-GAAP) excluding MTM in 2004-2006
b $1.25 excluding discontinued Exeter operations and accounting changes related to convertible debt and restricted stock
. . . . . has allowed CMS to execute its strategy and deliver “Best in Class” results.
3
CMS ENERGY
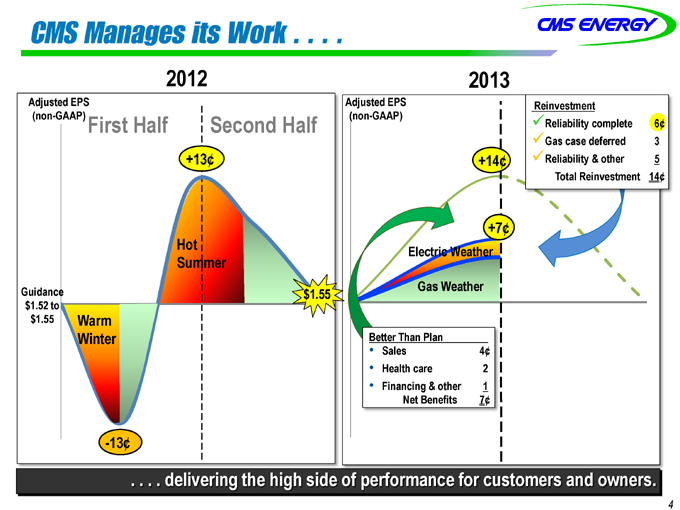
CMS Manages its Work . . . .
2012
Adjusted EPS
(non-GAAP)
First Half
Second Half
+13¢
Hot Summer
Guidance $1.52
to $1.55
$1.55
Warm Winter
-13¢
2013
Adjusted EPS (non-GAAP) Reinvestment
Reliability complete 6¢
Gas case deferred 3
+14¢ Reliability & other 5
Total Reinvestment 14¢
+7¢
Electric Weather
Gas Weather
Better Than Plan
Sales 4¢
Health care 2
Financing & other 1
Net Benefits 7¢
. . . . delivering the high side of performance for customers and owners.
4
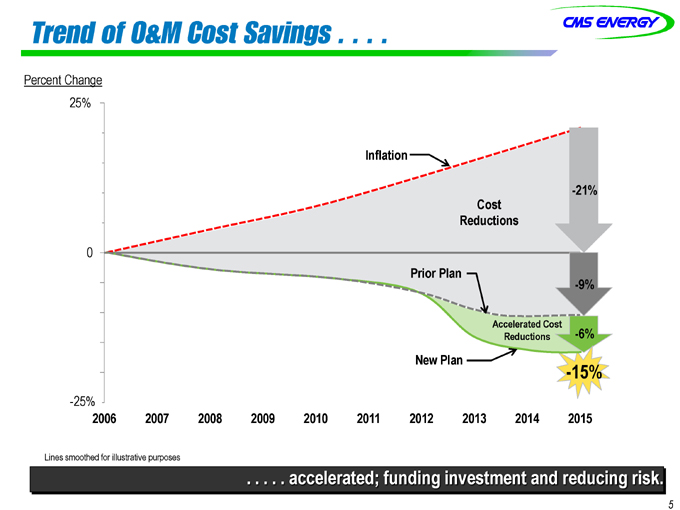
Trend of O&M Cost Savings . . . .
CMS ENERGY
Percent Change
25%
Inflation
-21%
Cost Reductions
0
Prior Plan
-9%
Accelerated Cost
Reductions
-6%
New Plan
-15%
-25%
2006 2007 2008 2009 2010 2011 2012 2013 2014 2015
Lines smoothed for illustrative purposes
. . . . . accelerated; funding investment and reducing risk.
5
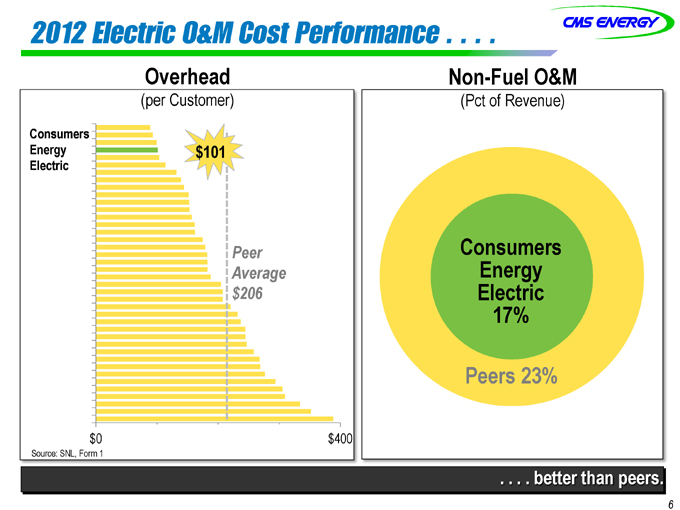
2012 Electric O&M Cost Performance . . . .
CMS ENERGY
Overhead
(per Customer)
Consumers
Energy $101 Electric
Peer Average $206
$0 $400
Source: SNL, Form 1
Non-Fuel O&M
(Pct of Revenue)
Consumers Energy Electric 17%
Peers 23%
. . . . better than peers.
6
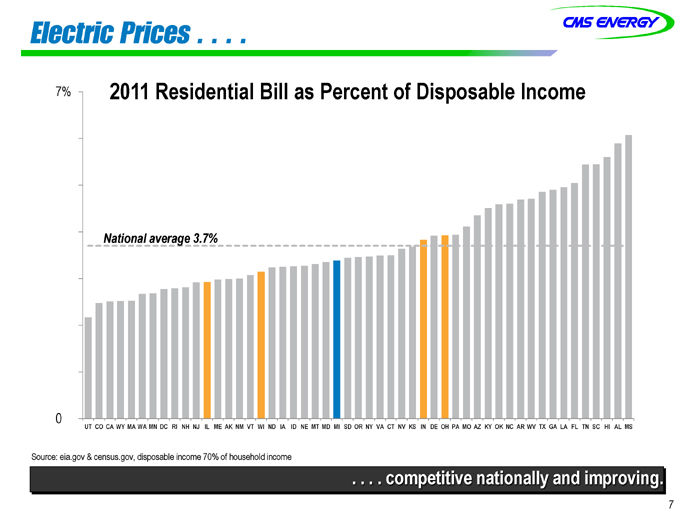
Electric Prices . . . .
CMS ENERGY
7%
2011 Residential Bill as Percent of Disposable Income
National average 3.7%
0
UT CO CA WY MA WA MN DC RI NH NJ IL ME AK NM VT WI ND IA ID NE MT MD MI SD OR NY VA CT NV KS IN DE OH PA MO AZ KY OK NC AR WV TX GA LA FL TN SC HI AL MS
Source: eia.gov & census.gov, disposable income 70% of household income
. . . . competitive nationally and improving.
7
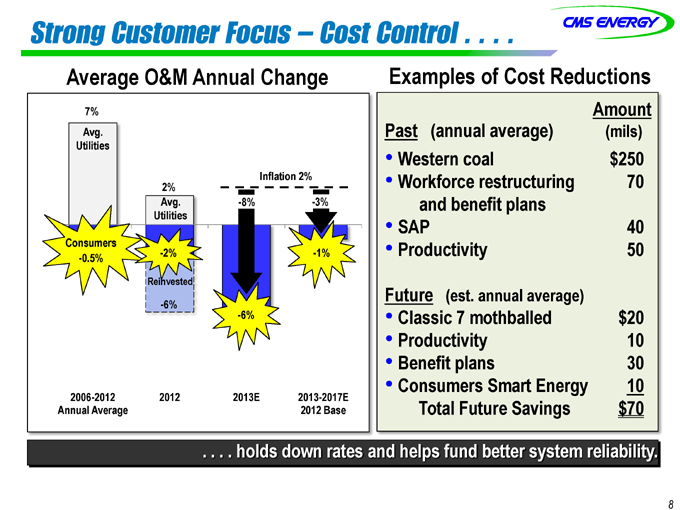
Strong Customer Focus - Cost Control . . . .
CMS ENERGY
Average O&M Annual Change
7% Avg.
Utilities
2% Inflation 2% Avg. -8% -3% Utilities
Consumers
-0.5% -2% -1%
Reinvested
-6% -6%
2006-2012 2012 2013E 2013-2017E Annual Average 2012 Base
Examples of Cost Reductions
Amount Past (annual average) (mils)
Western coal $250
Workforce restructuring 70 and benefit plans
SAP 40
Productivity 50
Future (est. annual average)
Classic 7 mothballed $20
Productivity 10
Benefit plans 30
Consumers Smart Energy 10 Total Future Savings $70
. . . . holds down rates and helps fund better system reliability.
8
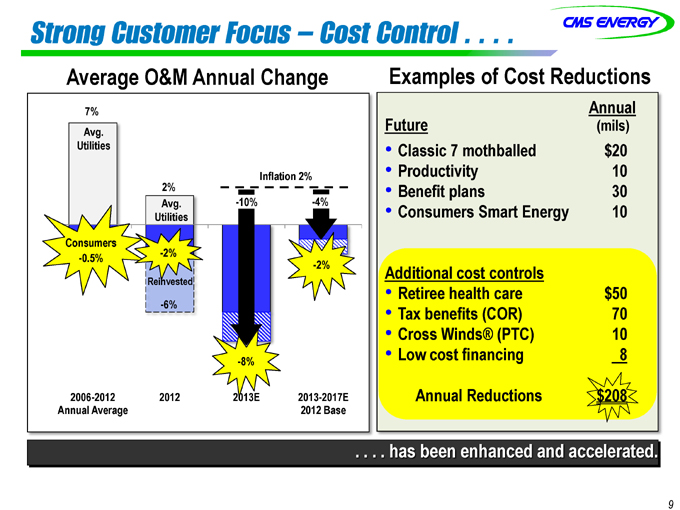
Strong Customer Focus - Cost Control . . . .
CMS ENERGY
Average O&M Annual Change
7% Avg.
Utilities
2% Inflation 2% Avg. -10% -4%
Utilities
Consumers
-0.5% -2%
-2%
Reinvested
-6%
-8%
2006-2012 2012 2013E 2013-2017E Annual Average 2012 Base
Examples of Cost Reductions
Annual Future (mils)
Classic 7 mothballed $20
Productivity 10
Benefit plans 30
Consumers Smart Energy 10
Additional cost controls
Retiree health care $50
Tax benefits (COR) 70
Cross Winds® (PTC) 10
Low cost financing 8 Annual Reductions $208
. . . . has been enhanced and accelerated.
9
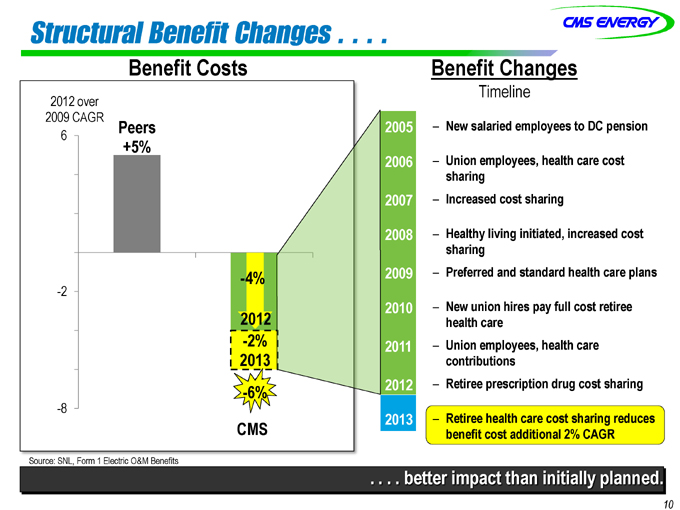
Structural Benefit Changes . . . .
Benefit Costs
2012 over 2009 CAGR
Peers +5%
6
-2
-8
-4%
2012
-2%
2013
-6%
2005 2006 2007 2008 2009 2010 2011 2012 2013
CMS
Benefit Changes
Timeline
– New salaried employees to DC pension
– Union employees, health care cost sharing
– Increased cost sharing
– Healthy living initiated, increased cost sharing
– Preferred and standard health care plans
– New union hires pay full cost retiree health care
– Union employees, health care contributions
– Retiree prescription drug cost sharing
– Retiree health care cost sharing reduces benefit cost additional 2% CAGR
Source: SNL, Form 1 Electric O&M Benefits
. . . . better impact than initially planned.
10
New Cost Savings . . . .
Gas Rate Case Avoideda
$49 Benefits
Tax/Other
$0
2013 2014
Electric Rate Case Avoideda
$100 Benefits
Tax
Cross Winds®
$0
2014
a Until 2015 test year
. . . . fund elimination of next gas and electric cases!
11
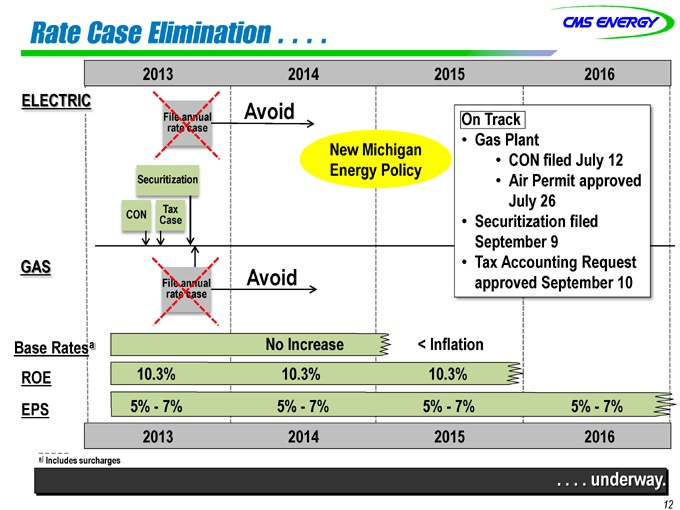
Rate Case Elimination . . . .
2013 2014 2015 2016
ELECTRIC
Avoid
File annual rate case
New Michigan Energy Policy
CON
Tax Case
Avoid
File annual rate case
On Track
Gas Plant
CON filed July 12
Air Permit approved July 26
Securitization filed September 9 GAS
Tax Accounting Request File annual Avoid approved September 10 rate case
Base Ratesa
No Increase
< Inflation ROE
10.3% 10.3% 10.3%
EPS 5% - 7% 5% - 7% 5% - 7% 5% - 7%
2013 2014 2015 2016
a Includes surcharges
. . . . underway.
12
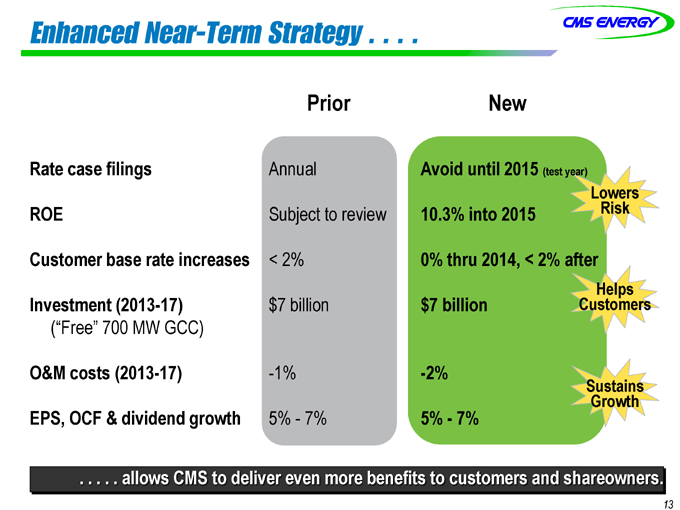
Enhanced Near-Term Strategy . . . .
Prior
New
Rate case filings Annual Avoid until 2015 (test year)
ROE Subject to review 10.3% into 2015
Customer base rate increases < 2% 0% thru 2014, < 2% after
Investment (2013-17) $7 billion $7 billion
(“Free” 700 MW GCC)
O&M costs (2013-17) -1% -2%
EPS, OCF & dividend growth 5% - 7% 5% - 7%
Lowers Risk
Helps Customers
Sustains Growth
. . . . . allows CMS to deliver even more benefits to customers and shareowners.
13
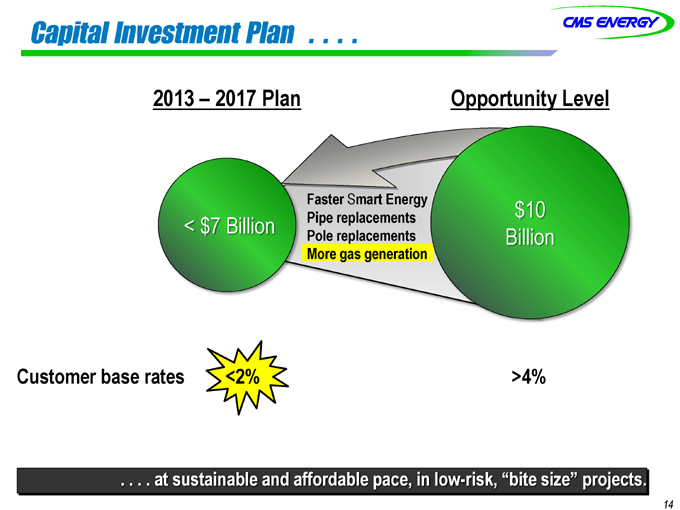
Capital Investment Plan . . . .
2013 – 2017 Plan
Opportunity Level
Faster Smart Energy Pipe replacements Pole replacements More gas generation
$10 Billion
< $7 Billion
Customer base rates <2% >4%
. . . . at sustainable and affordable pace, in low-risk, “bite size” projects.
14
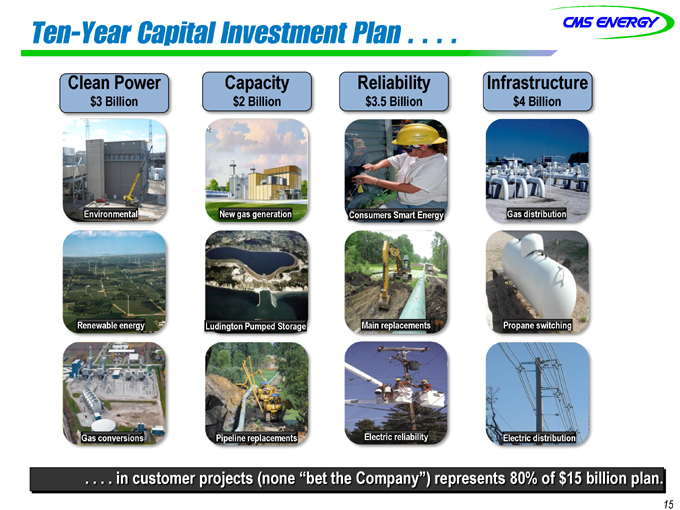
Ten-Year Capital Investment Plan . . . .
Clean Power Capacity Reliability Infrastructure
$3 Billion $2 Billion $3.5 Billion $4 Billion
Environmental New gas generation Consumers Smart Energy Gas distribution Renewable energy Ludington Pumped Storage Main replacements Propane switching Gas conversions Pipeline replacements Electric reliability Electric distribution
. . . . in customer projects (none “bet the Company”) represents 80% of $15 billion plan.
15
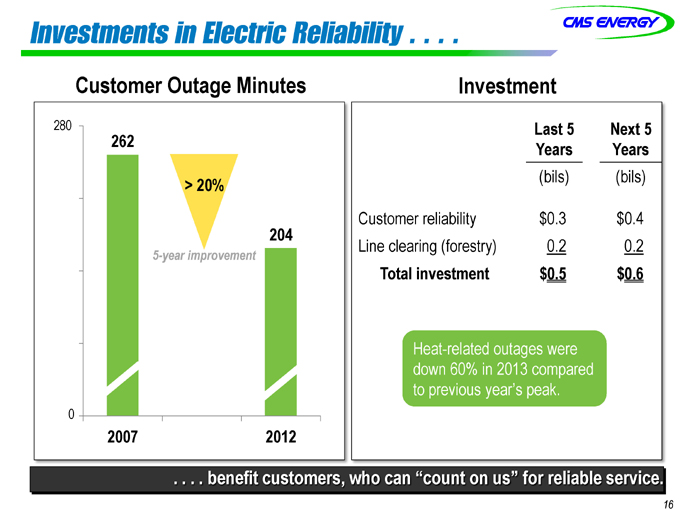
Investments in Electric Reliability . . . .
Customer Outage Minutes
280
262
> 20%
204
5-year improvement
0
2007 2012
Investment
Last 5 Next 5 Years Years
(bils) (bils)
Customer reliability $0.3 $0.4 Line clearing (forestry) 0.2 0.2
Total investment $0.5 $0.6
Heat-related outages were down 60% in 2013 compared to previous year’s peak.
. . . . benefit customers, who can “count on us” for reliable service.
16
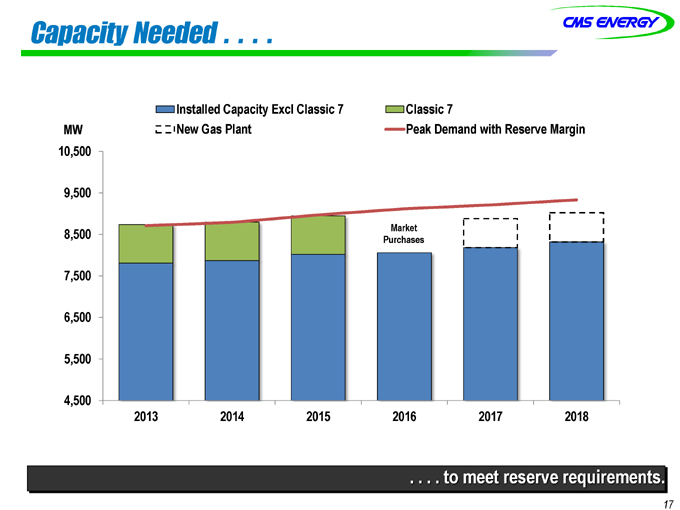
Capacity Needed . . . .
Installed Capacity Excl Classic 7 Classic 7
MW New Gas Plant Peak Demand with Reserve Margin 10,500
9,500
8,500 Market Purchases
7,500 6,500 5,500
4,500
2013 2014 2015 2016 2017 2018
. . . . to meet reserve requirements.
17
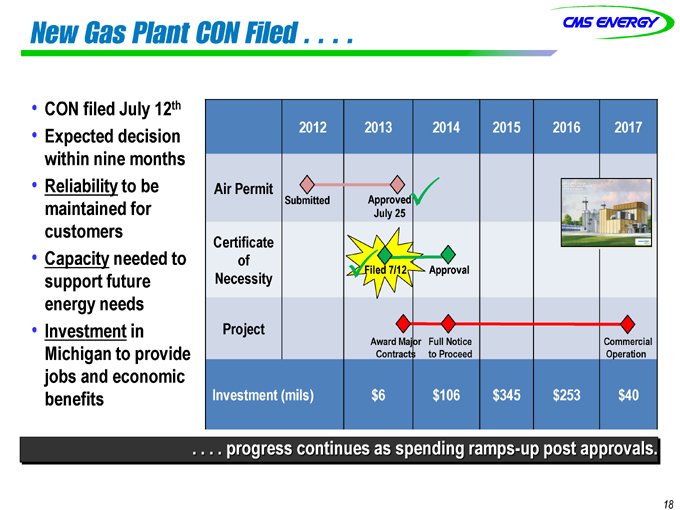
New Gas Plant CON Filed . . . .
CON filed July 12th Expected decision within nine months Reliability to be maintained for customers Capacity needed to support future energy needs Investment in Michigan to provide jobs and economic benefits
2012 2013 2014 2015 2016 2017
Air Permit
Submitted Approved
July 25
Certificate
of
Filed 7/12 Approval
Necessity
Project
Award Major Full Notice Commercial
Contracts to Proceed Operation
Investment (mils) $6 $106 $345 $253 $40
. . . . progress continues as spending ramps-up post approvals.
18
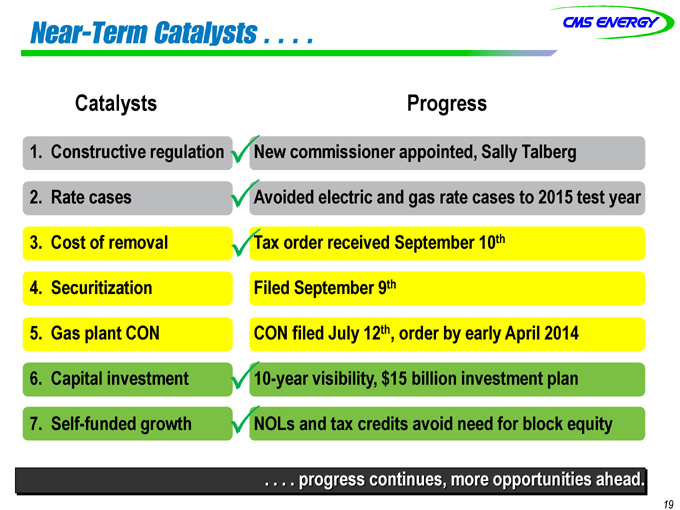
Near-Term Catalysts . . . .
Catalysts
1. Constructive regulation
2. Rate cases
3. Cost of removal
4. Securitization
5. Gas plant CON
6. Capital investment
7. Self-funded growth
Progress
New commissioner appointed, Sally Talberg
Avoided electric and gas rate cases to 2015 test year Tax order received September 10th Filed September 9th
CON filed July 12th, order by early April 2014 10-year visibility, $15 billion investment plan NOLs and tax credits avoid need for block equity
. . . . progress continues, more opportunities ahead.
19
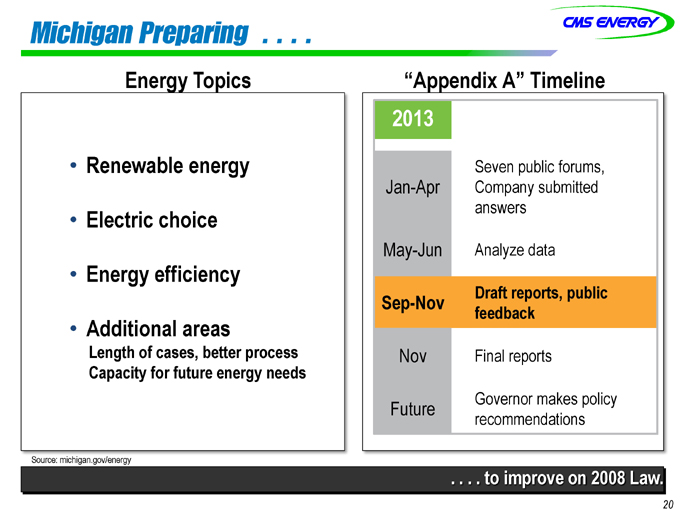
Michigan Preparing ....
Energy Topics
Renewable energy
Electric choice
Energy efficiency
Additional areas
Length of cases, better process Capacity for future energy needs
“Appendix A” Timeline
2013
Seven public forums, Jan-Apr Company submitted answers
May-Jun Analyze data
Draft reports, public
Sep-Nov
feedback
Nov Final reports
Governor makes policy
Future
recommendations
Source: michigan.gov/energy
. . . . to improve on 2008 Law.
20
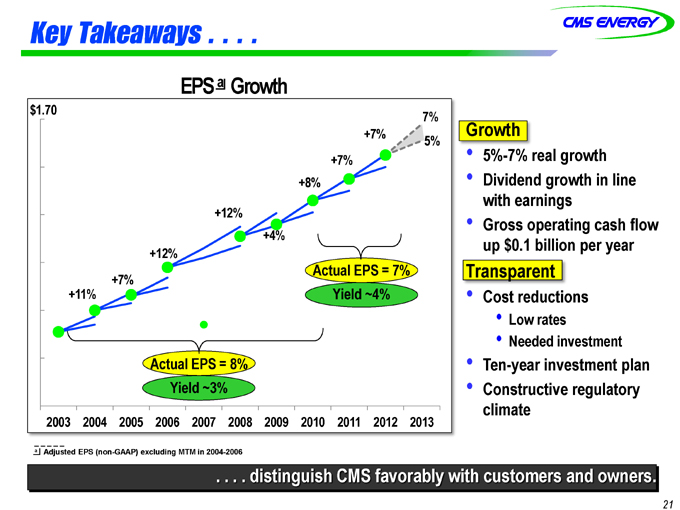
Key Takeaways...
EPS a Growth
$1.70
7%
+7%
5%
+7% +8%
+12%
+4%
+12%
Actual EPS = 7%
+7%
+11% Yield ~4%
Actual EPS = 8% Yield ~3%
2003 2004 2005 2006 2007 2008 2009 2010 2011 2012 2013
Growth
5%-7% real growth
Dividend growth in line with earnings
Gross operating cash flow up $0.1 billion per year
Transparent
Cost reductions
Low rates
Needed investment
Ten-year investment plan
Constructive regulatory climate
a Adjusted EPS (non-GAAP) excluding MTM in 2004-2006
. . . . distinguish CMS favorably with customers and owners.
21

APPENDIX

Michigan’s Constructive Regulation....
New Commissioner
Previous Experience
Public Sector Consultants
Provided support for 2008 energy law
Provided research for Appendix A
Michigan Public Service Commission
Michigan Department of Environmental Quality
Public Utility Commission of Texas
Education
BS - Michigan State University
MPA - University of Texas-Austin
Commission
John Quackenbush (R), Chairman Term Ends: July 2, 2017
Sally Talberg (I) Greg White (I) Term Ends: July 2, 2019 Term Ends: July 2, 2015
. . . . strong law on the books supported by a quality commission.
23
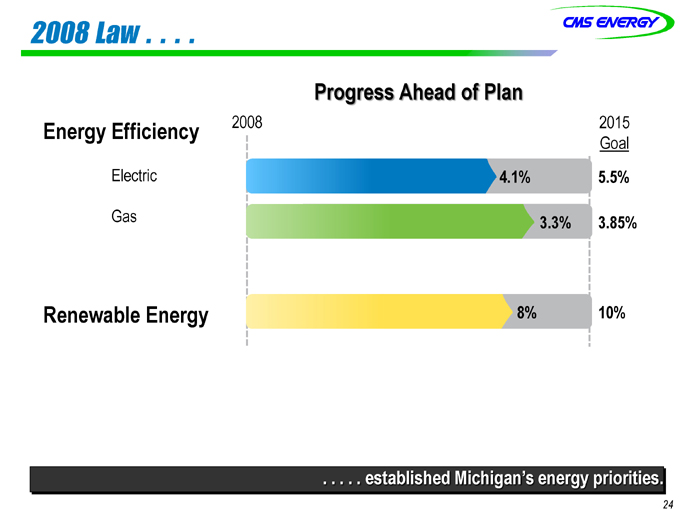
2008 Law....
Progress Ahead of Plan
Energy Efficiency 2008 2015
Goal Electric 4.1% 5.5%
Gas 3.3% 3.85%
Renewable Energy 8% 10%
. . . . . established Michigan’s energy priorities.
24
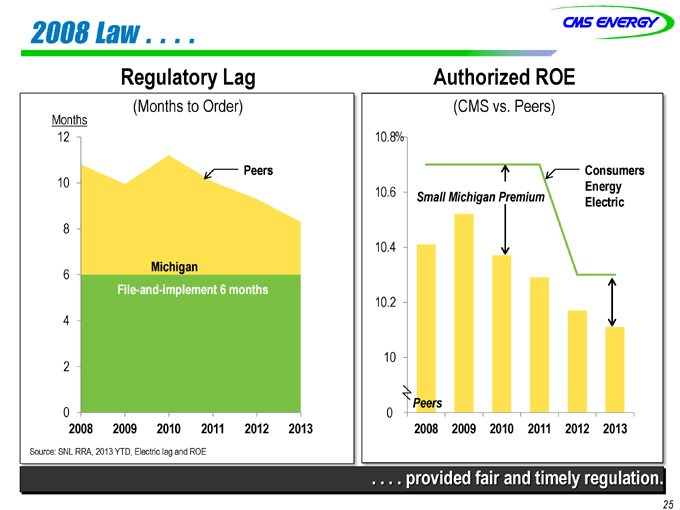
2008 Law . .. . .
Regulatory Lag
Months (Months to Order)
12
10 Peers
8
Michigan
6
File-and-implement 6 months
4
2
0
2008 2009 2010 2011 2012 2013
Source: SNL RRA, 2013 YTD, Electric lag and ROE
Authorized ROE
(CMS vs. Peers)
10.8%
Consumers Energy Electric
10.6
Small Michigan Premium
10.4
10.2
10
Peers
0
2008 2009 2010 2011 2012 2013
. . . . provided fair and timely regulation.
25
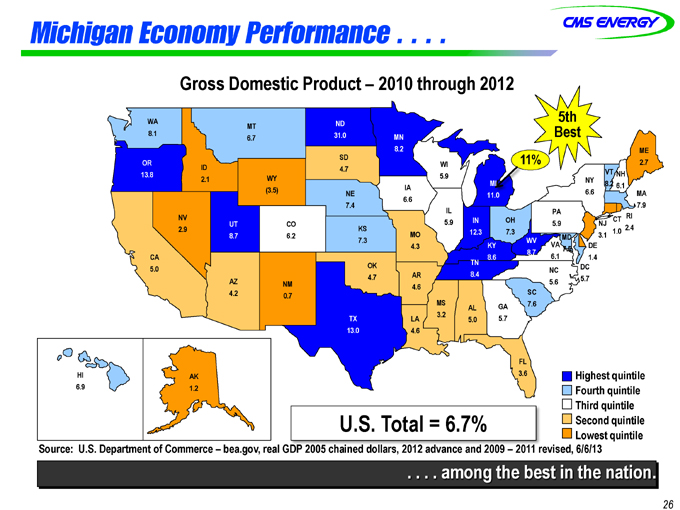
Michigan Economy Performance . . . .
Gross Domestic Product – 2010 through 2012
5th Best
11%
WA 8.1
MT 6.7
ND 31.0
MN 8.2
OR 13.8
ID 2.1
WY (3.5)
SD 4.7
WI 5.9
NE 7.4
IA 6.6
NV 2.9
UT 8.7
CO 6.2
KS 7.3
MO 4.3
IL 5.9
MI 11.0
IN 12.3
OH 7.3
PA 5.9
NY 6.6
VT 8.2
NH 6.1
ME 2.7
MA 7.9
RI 2.4
CT 1.0
NJ 3.1
DE 1.4
DC 5.7
MD 7.5
VA 6.1
NC 5.6
WV 8.7
SC 7.6
KY 8.6
TN 8.4
GA 5.7
FL 3.6
AL 5.0
MS 3.2
AR 4.6
LA 4.6
OK 4.7
TX 13.0
NM 0.7
AZ 4.2
CA 5.0
HI 6.9
AK 1.2
U.S. Total = 6.7%
Highest quintile
Fourth quintile Third quintile Second quintile Lowest quintile
Source: U.S. Department of Commerce - bea.gov, real GDP 2005 chained dollars, 2012 advance and 2009 - 2011 revised, 6/6/13
. . . . among the best in the nation.
26
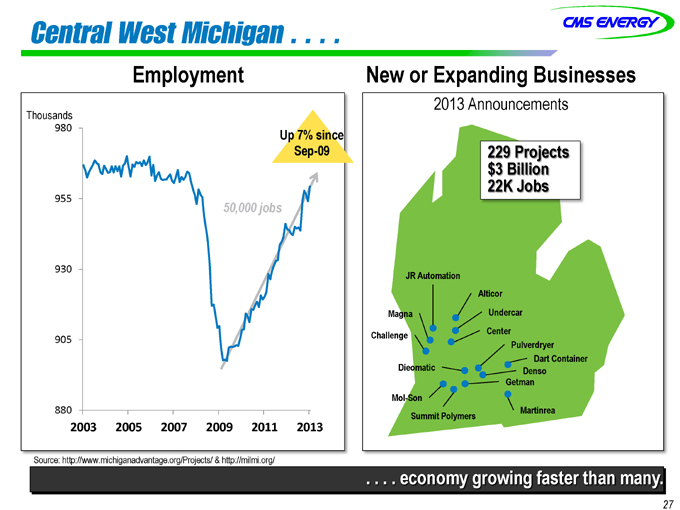
Central West Michigan . . . .
Employment
Thousands
980 Up 7% since Sep-09
955
50,000 jobs
930
905
880
2003 2005 2007 2009 2011 2013
New or Expanding Businesses
2013 Announcements Statewide Numbers
Projects 216
Investment $3.3B
229 Projects 21,608
$3 Billion 22K Jobs
JR Automation
Alticor Magna Undercar Challenge Center
Pulverdryer
Dieomatic Dart Container Denso Getman Mol-Son Martinrea Summit Polymers
Source: http://www.michiganadvantage.org/Projects/ & http://milmi.org/
. . . . economy growing faster than many.
27

GAAP Reconciliation
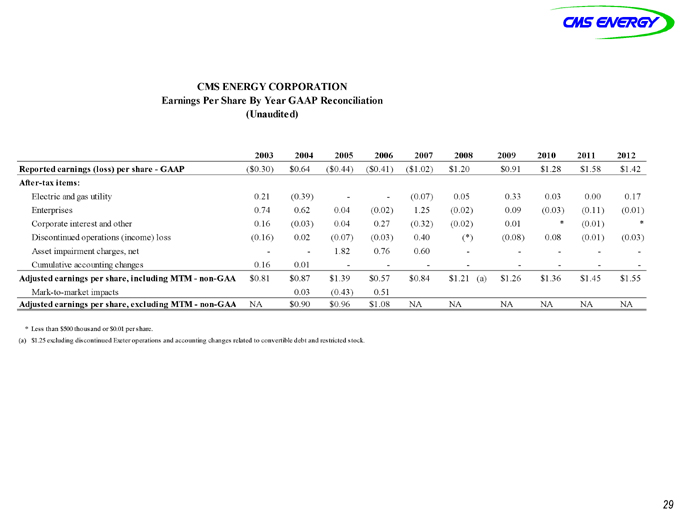
CMS ENERGY CORPORATION
Earnings Per Share By Year GAAP Reconciliation (Unaudited)
2003 2004 2005 2006 2007 2008 2009 2010 2011 2012
Reported earnings (loss) per share - GAAP ($0.30) $0.64 ($0.44) ($0.41) ($1.02) $1.20 $0.91 $1.28 $1.58 $1.42
After-tax items:
Electric and gas utility 0.21 (0.39) - - (0.07) 0.05 0.33 0.03 0.00 0.17
Enterprises 0.74 0.62 0.04 (0.02) 1.25 (0.02) 0.09 (0.03) (0.11) (0.01)
Corporate interest and other 0.16 (0.03) 0.04 0.27 (0.32) (0.02) 0.01 * (0.01) *
Discontinued operations (income) loss (0.16) 0.02 (0.07) (0.03) 0.40 (*) (0.08) 0.08 (0.01) (0.03)
Asset impairment charges, net - - 1.82 0.76 0.60 - - - - -
Cumulative accounting changes 0.16 0.01 - - - - - - - -
Adjusted earnings per share, including MTM - non-GAA $0.81 $0.87 $1.39 $0.57 $0.84 $1.21 (a) $1.26 $1.36 $1.45 $1.55
Mark-to-market impacts 0.03 (0.43) 0.51
Adjusted earnings per share, excluding MTM - non-GAA NA $0.90 $0.96 $1.08 NA NA NA NA NA NA
* Less than $500 thousand or $0.01 per share.
(a) $1.25 excluding discontinued Exeter operations and accounting changes related to convertible debt and restricted stock.
29