Exhibit 99.1
Wolfe Research Power & Gas Leaders Conference
Growing Ratebase & Managing Costs
September 25, 2013
Cross Winds Energy Park Consumers Smart Energy Program
Gas Combined Cycle Plant
This presentation is made as of the date hereof and contains “forward-looking statements” as defined in Rule 3b-6 of the
Securities Exchange Act of 1934, Rule 175 of the Securities Act of 1933, and relevant legal decisions. The forward-looking statements are subject to risks and uncertainties. All forward-looking statements should be considered in the context of the risk and other factors detailed from time to time in CMS Energy’s and Consumers Energy’s Securities and Exchange Commission filings. Forward-looking statements should be read in conjunction with “FORWARD-LOOKING STATEMENTS AND
INFORMATION” and “RISK FACTORS” sections of CMS Energy’s and Consumers Energy’s Form 10-K for the year ended
December 31, 2012 and as updated in subsequent 10-Qs. CMS Energy’s and Consumers Energy’s “FORWARD-LOOKING
STATEMENTS AND INFORMATION” and “RISK FACTORS” sections are incorporated herein by reference and discuss important factors that could cause CMS Energy’s and Consumers Energy’s results to differ materially from those anticipated in such statements. CMS Energy and Consumers Energy undertake no obligation to update any of the information presented herein to reflect facts, events or circumstances after the date hereof.
The presentation also includes non-GAAP measures when describing CMS Energy’s results of operations and financial performance. A reconciliation of each of these measures to the most directly comparable GAAP measure is included in the appendix and posted on our website at www.cmsenergy.com.
CMS Energy provides historical financial results on both a reported (Generally Accepted Accounting Principles) and adjusted (non-GAAP) basis and provides forward-looking guidance on an adjusted basis. Management views adjusted earnings as a key measure of the company’s present operating financial performance, unaffected by discontinued operations, asset sales, impairments, regulatory items from prior years, or other items. These items have the potential to impact, favorably or unfavorably, the company’s reported earnings in future periods. Because the company is not able to estimate the impact of these matters, the company is not providing a reconciliation to the comparable future period reported earnings.
2
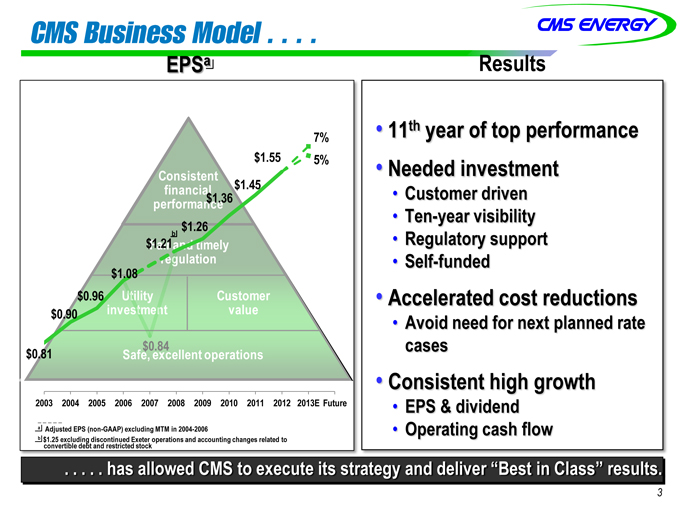
CMS Business Model
EPSa Results
7% 11th year of top performance
$1.55 5% Needed investment
Consistent $1.45
performance financial$1.36 Customer driven
$1.26 Ten-year visibility
$1.21b Regulatory support
Fair and timely
regulation Self-funded
$1.08
$0.96 Utility Customer Accelerated cost reductions
$0.90 investment value
Avoid need for next planned rate
$0.84 cases
$0.81 Safe, excellent operations
Consistent high growth
2003 2004 2005 2006 2007 2008 2009 2010 2011 2012 2013E Future EPS & dividend
a Adjusted EPS (non-GAAP) excluding MTM in 2004-2006 Operating cash flow
. . . . . has allowed CMS to execute its strategy and deliver “Best in Class” results.
3
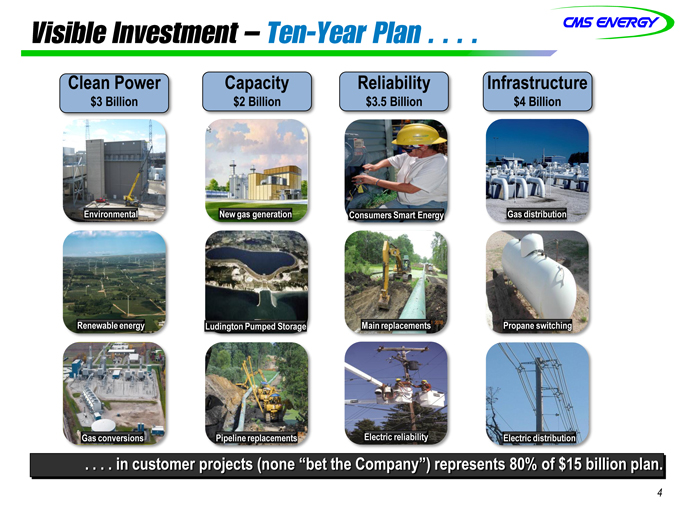
Visible Investment – Ten-Year Plan
Clean Power Capacity Reliability Infrastructure
$3 Billion $2 Billion $3.5 Billion $4 Billion
Environmental New gas generation Consumers Smart Energy Gas distribution
Renewable energy Ludington Pumped Storage Main replacements Propane switching
Gas conversions Pipeline replacements Electric reliability Electric distribution
. . . . in customer projects (none “bet the Company”) represents 80% of $15 billion plan.
4
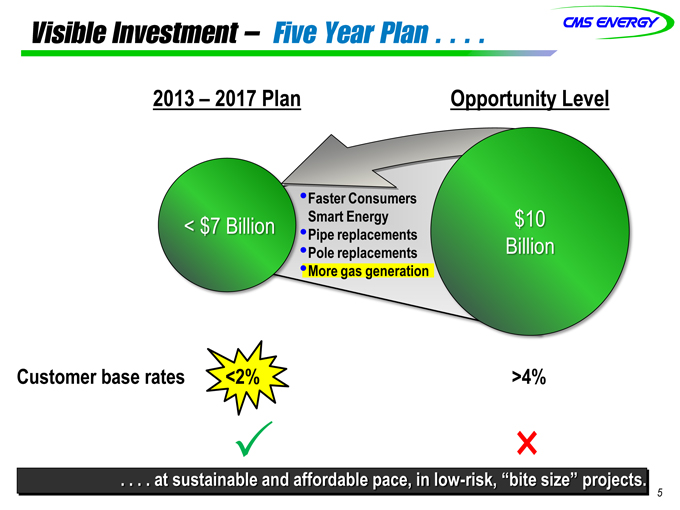
Visible Investment – Five Year Plan
2013 – 2017 Plan Opportunity Level
Faster Consumers
< $7 Billion Pipe Smart replacements Energy $10
Pole replacements Billion
More gas generation
Customer base rates <2% >4%
×
. . . . at sustainable and affordable pace, in low-risk, “bite size” projects.
5
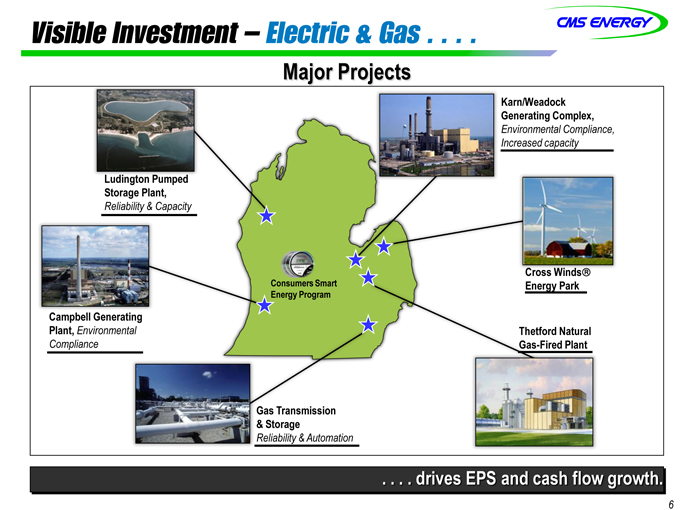
Visible Investment – Electric & Gas
Major Projects
Karn/Weadock
Generating Complex,
Environmental Compliance,
Increased capacity
Storage Plant,
Reliability & Capacit
Consumers Smart gy Park
Energy Program
Campbell Generating
Plant, Environmental ord Natural
Compliance Fired Plant
& Storage
Reliability & Automation
. . . . drives EPS and cash flow growth.
6
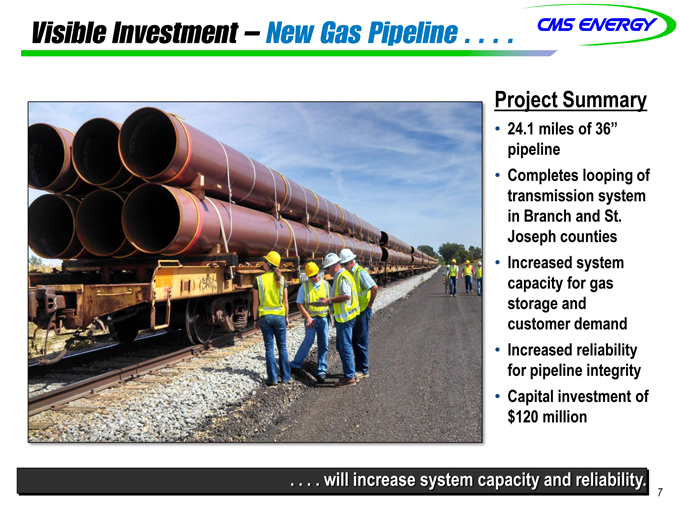
Visible Investment – New Gas Pipeline
Project Summary
24.1 miles of 36” pipeline
Completes looping of transmission system in Branch and St.
Joseph counties
Increased system capacity for gas storage and customer demand
Increased reliability for pipeline integrity
Capital investment of $120 million
. . . . will increase system capacity and reliability.
7
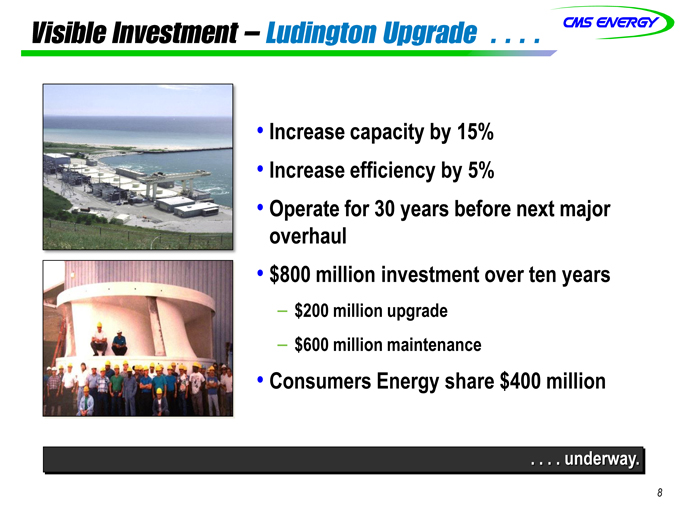
Visible Investment – Ludington Upgrade
Increase capacity by 15%
Increase efficiency by 5%
Operate for 30 years before next major overhaul
$800 million investment over ten years
$200 million upgrade
$600 million maintenance
Consumers Energy share $400 million
. . . . underway.
8
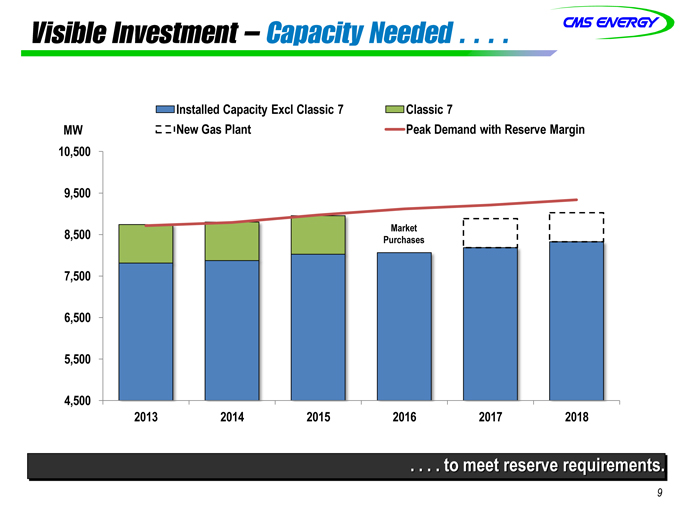
Visible Investment – Capacity Needed
Installed Capacity Excl Classic 7 Classic 7
MW New Gas Plant Peak Demand with Reserve Margin
10,500
9,500
Market
8,500 Purchases
7,500
6,500
5,500
4,500
2013 2014 2015 2016 2017 2018
. . . . to meet reserve requirements.
9
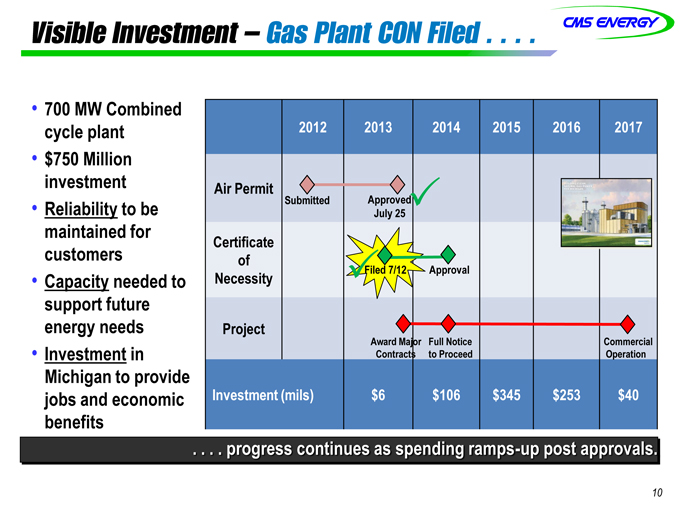
Visible Investment – Gas Plant CON Filed
700 MW Combined cycle plant
$750 Million investment
Reliability to be maintained for customers
Capacity needed to support future energy needs
Investment in Michigan to provide jobs and economic benefits
2012 2013 2014 2015 2016 2017
Air Permit
Submitted Approved
July 25
Certificate
of
Necessity Filed 7/12 Approval
Project
Award Major Full Notice Commercial
Contracts to Proceed Operation
Investment (mils) $6 $106 $345 $253 $40
. . . . progress continues as spending ramps-up post approvals.
10
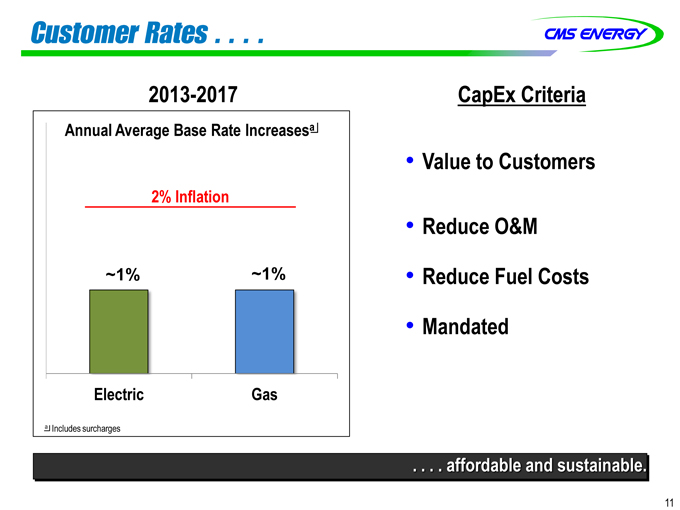
Customer Rates
2013-2017
Annual Average Base Rate Increasesa
2% Inflation
~1%
Electric
~1%
Gas
a Includes surcharges
CapEx
Criteria
Value to Customers
Reduce O&M
Reduce Fuel Costs
Mandated
. . . . affordable and sustainable.
11
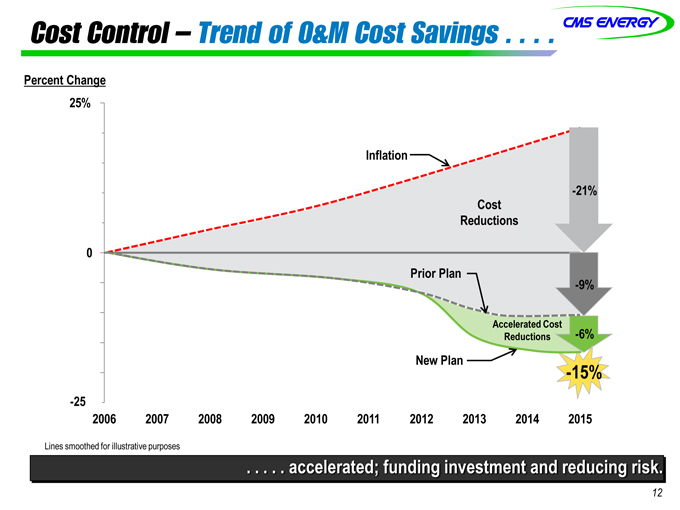
Cost Control – Trend of O&M Cost Savings
Percent Change
25%
Inflation
-21%
Cost
Reductions
0
Prior Plan
-9%
Accelerated Cost
Reductions
-6%
New Plan
-15%
-25%
2006
2007
2008
2009
2010
2011
2012
2013
2014
2015
Lines smoothed for illustrative purposes
. . . .
.
accelerated; funding investment and reducing
risk.
12
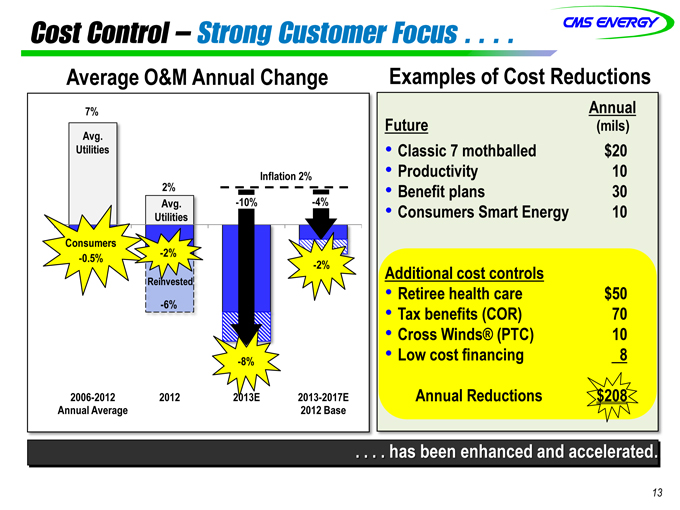
Cost Control – Strong Customer Focus
Average O&M Annual Change
7%
Avg.
Utilities
Inflation 2%
2%
Avg. -10% -4%
Utilities
Consumers
-0.5% -2%
-2%
Reinvested
-6%
-8%
2006-2012 2012 2013E 2013-2017E
Annual Average 2012 Base
Examples of Cost Reductions
Annual
Future(mils)
Classic 7 mothballed $20
Productivity 10
Benefit plans 30
Consumers Smart Energy 10
Additional cost controls
Retiree health care $50
Tax benefits (COR) 70
Cross Winds® (PTC) 10
Low cost financing 8
Annual Reductions $208
[Graphic Appears Here]
. . . . has been enhanced and accelerated.
13
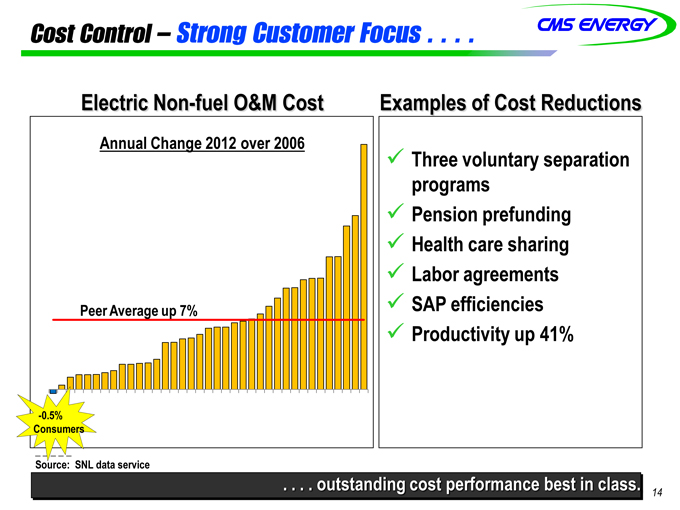
Cost Control – Strong Customer Focus
Electric Non-fuel O&M Cost Examples of Cost Reductions
Annual Change 2012 over 2006
Three voluntary separation
programs
Pension prefunding
Health care sharing
Labor agreements
Peer Average up 7% SAP efficiencies
Productivity up 41%
-0.5%
Consumers
Source: SNL data service
. . . . outstanding cost performance best in class.
14
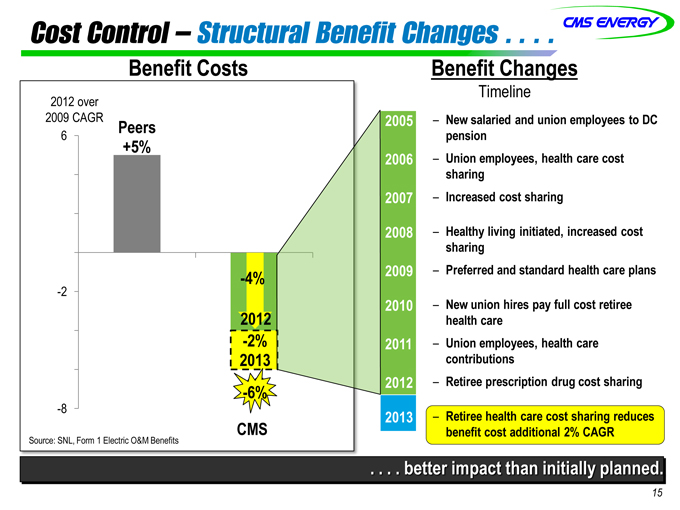
Cost Control – Structural Benefit Changes
Benefit Costs
2012 over
2009 CAGR Peers 2005
6
+5%
2006
2007
2008
-4% 2009
-2
2010
2012
-2% 2011
2013
-6% 2012
-6%
-8 2013
CMS
Source: SNL, Form 1 Electric O&M Benefits
Benefit Changes
Timeline
New salaried and union employees to DC pension
Union employees, health care cost sharing
Increased cost sharing
Healthy living initiated, increased cost sharing
Preferred and standard health care plans
New union hires pay full cost retiree health care
Union employees, health care contributions
Retiree prescription drug cost sharing
Retiree health care cost sharing reduces benefit cost additional 2% CAGR
. . . . better impact than initially planned.
15
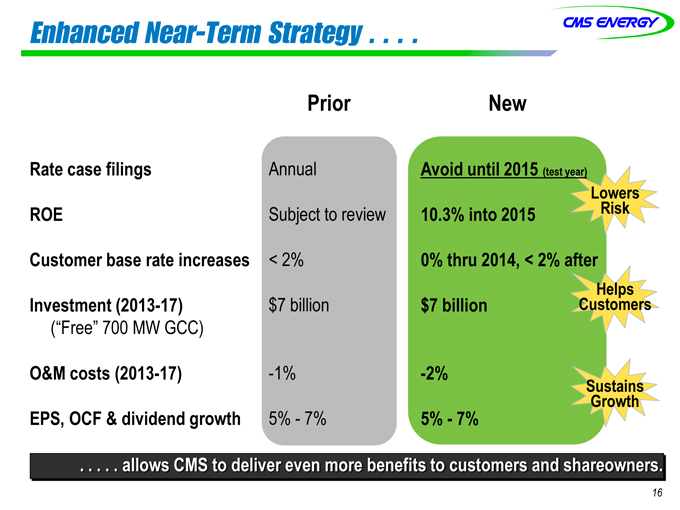
Enhanced Near-Term Strategy
Prior New
Rate case filings Annual Avoid until 2015 (test year)
Lowers
ROE Subject to review 10.3% into 2015 Risk
Customer base rate increases < 2% 0% thru 2014, < 2% after
Helps
Investment (2013-17) $7 billion $7 billion Customers
(“Free” 700 MW GCC)
O&M costs (2013-17) -1% -2%
Sustains
Growth
EPS, OCF & dividend growth 5%—7% 5%—7%
. . . . . allows CMS to deliver even more benefits to customers and shareowners.
16
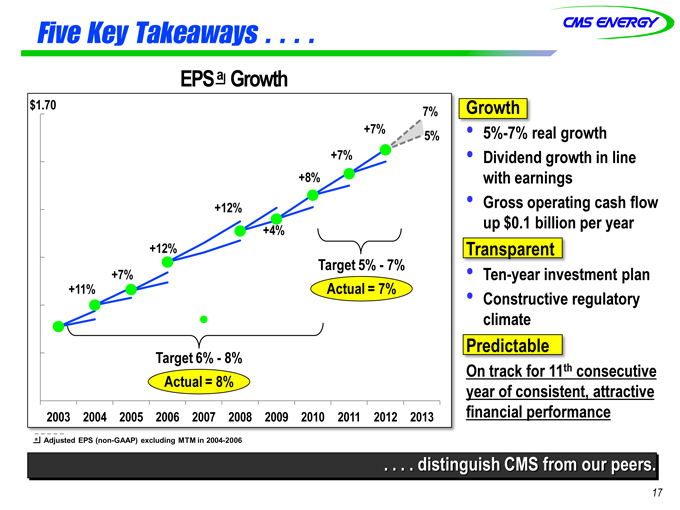
Five Key Takeaways
EPS a Growth
$1.70 7%
+7% 5%
+7%
+8%
+12%
+4%
+12%
+7% Target 5%—7%
+11% Actual = 7%
Target 6%—8%
Actual = 8%
2003 2004 2005 2006 2007 2008 2009 2010 2011 2012 2013
Growth
5%-7% real growth
Dividend growth in line
with earnings
Gross operating cash flow
up $0.1 billion per year
Transparent
Ten-year investment plan
Constructive regulatory
climate
Predictable
On track for 11th consecutive
year of consistent, attractive
financial performance
a Adjusted EPS (non-GAAP) excluding MTM in 2004-2006
. . . . distinguish CMS from our peers.
17

Appendix
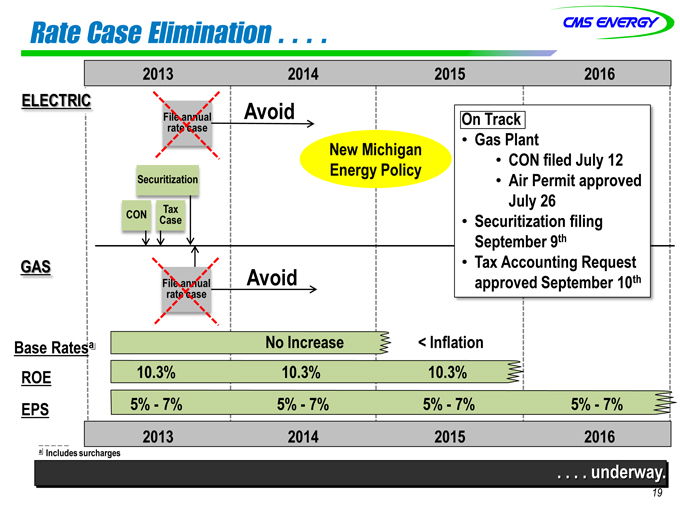
Rate Case Elimination
2013 2014 2015 2016
ELECTRIC Avoid
File annual On Track
rate case
New Michigan Gas Plant
Energy Policy CON filed July 12
Securitization Air Permit approved
July 26
CON Case Tax Securitization filing
September 9th
GAS Tax Accounting Request
File annual Avoid approved September 10th
rate case
Base Ratesa No Increase < Inflation
ROE 10.3% 10.3% 10.3%
EPS 5%—7% 5%—7% 5%—7% 5% -5%7%- 7%
2013 2014 2015 2016
a Includes surcharges
. . . . underway.
19
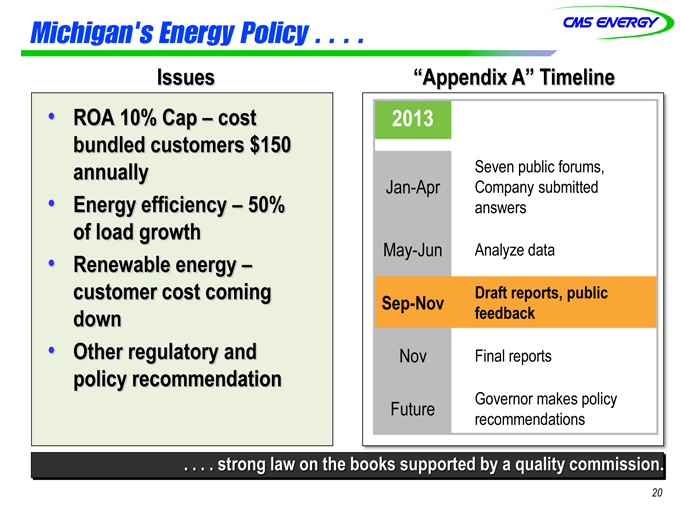
Michigan’s Energy Policy
Issues
ROA 10% Cap – cost bundled customers $150 annually
Energy efficiency – 50% of load growth
Renewable energy – customer cost coming down
Other regulatory and policy recommendation
“Appendix A” Timeline
2013
Seven public forums,
Jan-Apr Company submitted
answers
May-Jun Analyze data
Draft reports, public
Sep-Nov feedback
Nov Final reports
Future Governor makes policy
recommendations
. . . . strong law on the books supported by a quality commission.
20
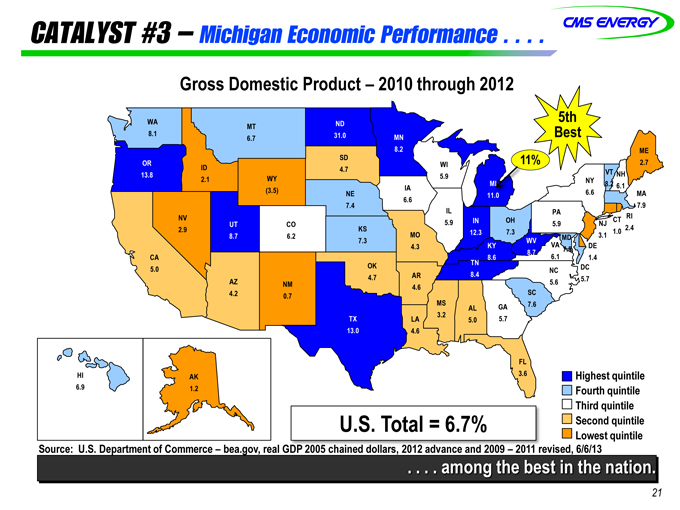
CATALYST#3 – Michigan Economic Performance
Gross Domestic Product – 2010 through 2012
WA ND 5th
MT
8.1 6.7 31.0 MN Best
8.2 ME
OR SD WI 11% 2.7
13.8 ID 4.7 5.9 VT NH
2.1 WY MI NY
IA 8.2 6.1
(3.5) NE 11.0 6.6 MA
6.6
7.4 7.9
IL PA
NV UT CO 5.9 IN OH 5.9 NJ CT RI
2.9 KS 12.3 7.3 1.0 2.4
8.7 6.2 7.3 MO WV MD 3.1
4.3 KY VA 7.5 DE
8.7
CA 8.6 6.1 1.4
OK TN
5.0 NC DC
AZ 4.7 AR 8.4 5.6 5.7
NM 4.6
4.2 0.7 SC
MS AL GA 7.6
3.2
TX LA 5.0 5.7
13.0 4.6
FL
HI AK 3.6 Highest quintile
6.9 1.2 Fourth quintile
Third quintile
U.S. Total = 6.7% Second quintile
Lowest quintile
Source: U.S. Department of Commerce – bea.gov, real GDP 2005 chained dollars, 2012 advance and 2009 – 2011 revised, 6/6/13
. . . . among the best in the nation.
21
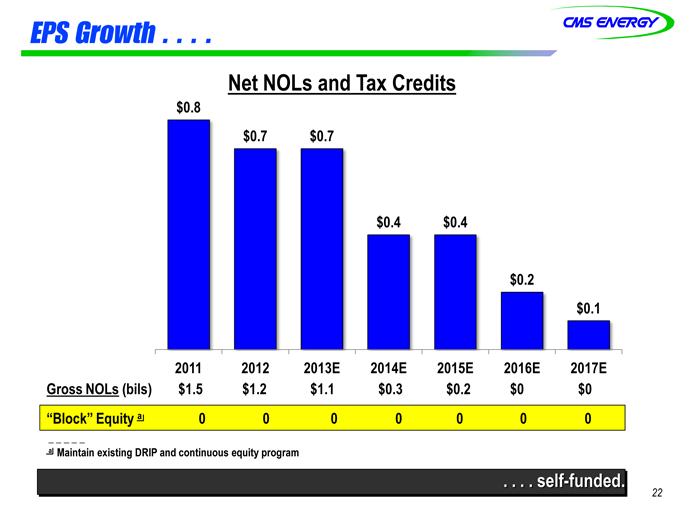
EPS Growth
Net NOLs and Tax Credits
$0.8
$0.7 $0.7
$0.4 $0.4
$0.2
$0.1
2011 2012 2013E 2014E 2015E 2016E 2017E
Gross NOLs (bils) $1.5 $1.2 $1.1 $0.3 $0.2 $0 $0
“Block” Equity a 0 0 0 0 0 0 0
a Maintain existing DRIP and continuous equity program
. . . . self-funded.
22
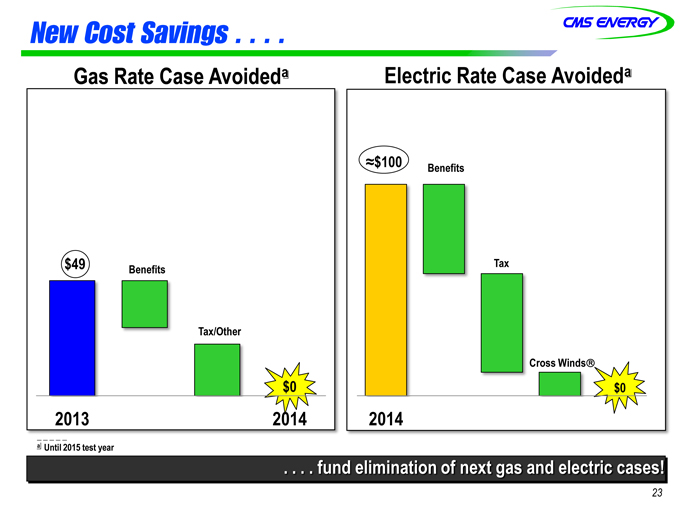
New Cost Savings
Gas Rate Case Avoideda Electric Rate Case Avoideda
$100 Benefits
$49 Benefits Tax
Tax/Other
Cross Winds
$0 $0
2013 2014 2014
a Until 2015 test year
. . . . fund elimination of next gas and electric cases!
23
GAAP Reconciliation
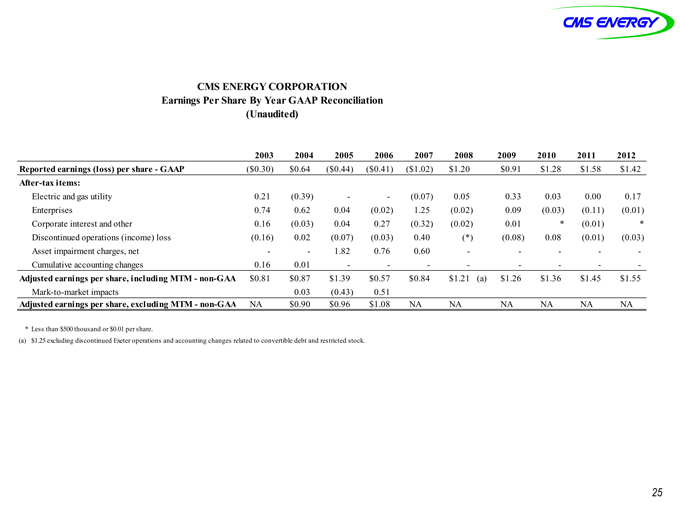
CMS ENERGY CORPORATION
Earnings Per Share By Year GAAP Reconciliation
(Unaudited)
2003 2004 2005 2006 2007 2008 2009 2010 2011 2012
Reported earnings (loss) per share—GAAP($0.30) $0.64($0.44)($0.41)($1.02) $1.20 $0.91 $1.28 $1.58 $1.42
After-tax items:
Electric and gas utility 0.21(0.39) —(0.07) 0.05 0.33 0.03 0.00 0.17
Enterprises 0.74 0.62 0.04(0.02) 1.25(0.02) 0.09(0.03)(0.11)(0.01)
Corporate interest and other 0.16(0.03) 0.04 0.27(0.32)(0.02) 0.01*(0.01)*
Discontinued operations (income) loss(0.16) 0.02(0.07)(0.03) 0.40(*)(0.08) 0.08(0.01)(0.03)
Asset impairment charges, net — 1.82 0.76 0.60 — — -
Cumulative accounting changes 0.16 0.01 — — — —
Adjusted earnings per share, including MTM—non-GAA $0.81 $0.87 $1.39 $0.57 $0.84 $1.21(a) $1.26 $1.36 $1.45 $1.55
Mark-to-market impacts 0.03(0.43) 0.51
Adjusted earnings per share, excluding MTM—non-GAA NA $0.90 $0.96 $1.08 NA NA NA NA NA NA
* Less than $500 thousand or $0.01 per share.
(a) $1.25 excluding discontinued Exeter operations and accounting changes related to convertible debt and restricted stock.
25