Exhibit 99.1

Exhibit 99.1
Investor Meeting
November 19, 2013
Cross Winds® Energy Park
Gas Combined Cycle Plant
Consumers Smart Energy Program
This presentation is made as of the date hereof and contains “forward-looking statements” as defined in Rule 3b-6 of the
Securities Exchange Act of 1934, Rule 175 of the Securities Act of 1933, and relevant legal decisions. The forward-looking statements are subject to risks and uncertainties. All forward-looking statements should be considered in the context of the risk and other factors detailed from time to time in CMS Energy’s and Consumers Energy’s Securities and Exchange Commission filings. Forward-looking statements should be read in conjunction with “FORWARD-LOOKING STATEMENTS AND
INFORMATION” and “RISK FACTORS” sections of CMS Energy’s and Consumers Energy’s Form 10-K for the year ended
December 31, 2012 and as updated in subsequent 10-Qs. CMS Energy’s and Consumers Energy’s “FORWARD-LOOKING
STATEMENTS AND INFORMATION” and “RISK FACTORS” sections are incorporated herein by reference and discuss important factors that could cause CMS Energy’s and Consumers Energy’s results to differ materially from those anticipated in such statements. CMS Energy and Consumers Energy undertake no obligation to update any of the information presented herein to reflect facts, events or circumstances after the date hereof.
The presentation also includes non-GAAP measures when describing CMS Energy’s results of operations and financial performance. A reconciliation of each of these measures to the most directly comparable GAAP measure is included in the appendix and posted on our website at www.cmsenergy.com.
CMS Energy provides historical financial results on both a reported (Generally Accepted Accounting Principles) and adjusted (non-GAAP) basis and provides forward-looking guidance on an adjusted basis. Management views adjusted earnings as a key measure of the company’s present operating financial performance, unaffected by discontinued operations, asset sales, impairments, regulatory items from prior years, or other items. These items have the potential to impact, favorably or unfavorably, the company’s reported earnings in future periods. Because the company is not able to estimate the impact of these matters, the company is not providing a reconciliation to the comparable future period reported earnings.
1
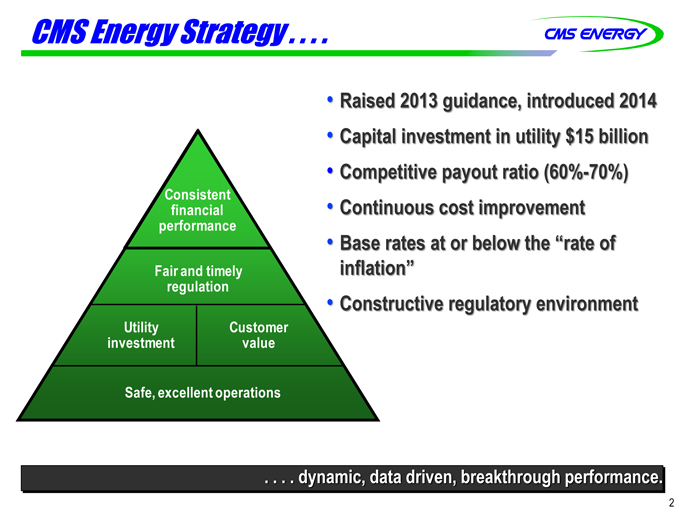
CMS Energy Strategy . . . .
Raised 2013 guidance, introduced 2014
Capital investment in utility $15 billion
Competitive payout ratio (60%-70%)
Consistent
financial • Continuous cost improvement performance below the “rate of
Base rates at or
Fair and timely inflation”
regulation Constructive regulatory environment
Utility Customer investment value
Safe, excellent operations
. . . . dynamic, data driven, breakthrough performance.
2
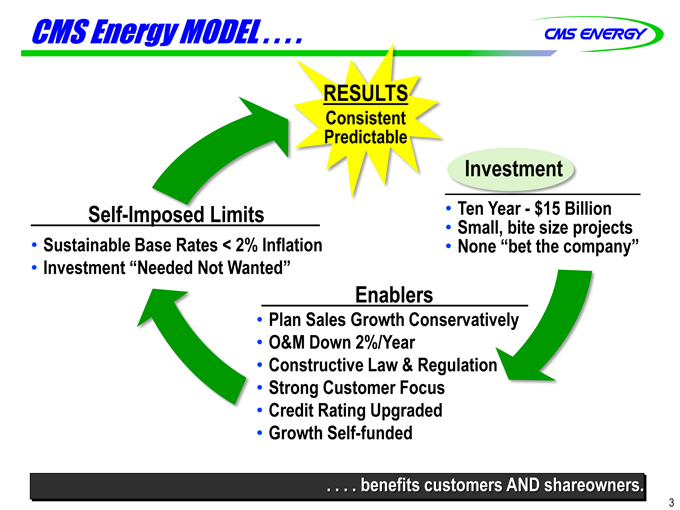
CMS Energy MODEL . . . .
RESULTS
Consistent Predictable
Investment
Self-Imposed Limits • Ten Year-$15 Billion Sustainable Base Rates < 2% Inflation • Small, bite size projects
None “bet the company”
Investment “Needed Not Wanted”
Enablers
Plan Sales Growth Conservatively
O&M Down 2%/Year
Constructive Law & Regulation
Strong Customer Focus
Credit Rating Upgraded
Growth Self-funded
. . . . benefits customers AND shareowners.
3
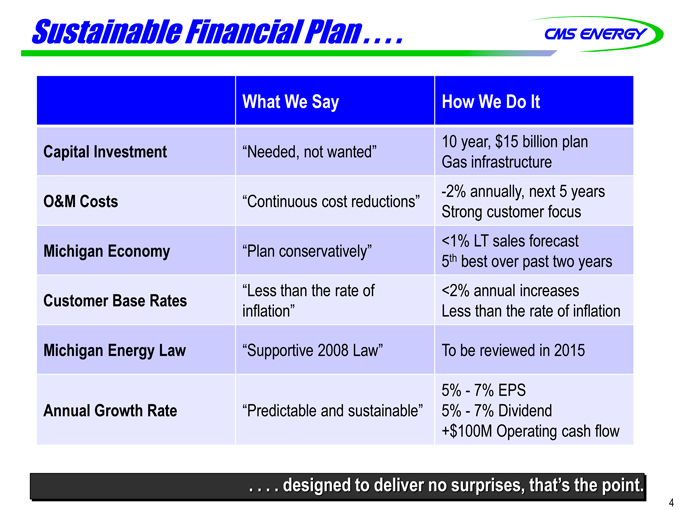
Sustainable Financial Plan
What We Say How We Do It
10 year, $15 billion plan
Capital Investment “Needed, not wanted”
Gas infrastructure
-2% annually, next 5 years
O&M Costs “Continuous cost reductions”
Strong customer focus <1% LT sales forecast
Michigan Economy “Plan conservatively” th
5 best over past two years
“Less than the rate of <2% annual increases
Customer Base Rates inflation” Less than the rate of inflation
Michigan Energy Law “Supportive 2008 Law” To be reviewed in 2015
5%-7% EPS
Annual Growth Rate “Predictable and sustainable” 5%-7% Dividend
+$100M Operating cash flow
. . . . designed to deliver no surprises, that’s the point.
4
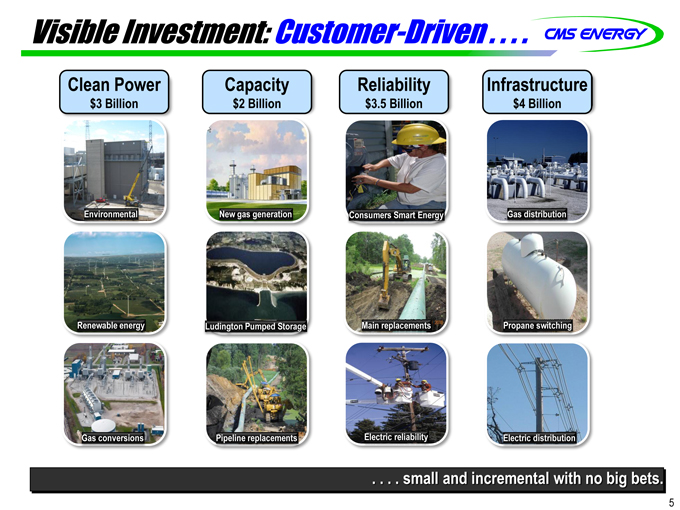
Visible Investment: Customer-Driven . . . .
Clean Power Capacity Reliability Infrastructure
$3 Billion $2 Billion $3.5 Billion $4 Billion
Environmental New gas generation Consumers Smart Energy Gas distribution
Renewable energy Ludington Pumped Storage Main replacements Propane switching
Gas conversions Pipeline replacements Electric reliability Electric distribution
. . . . small and incremental with no big bets.
5
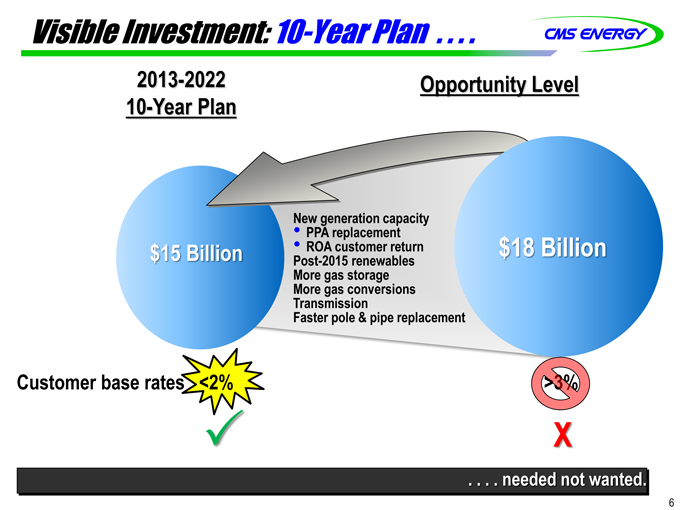
Visible Investment: 10-Year Plan . . . .
2013-2022 Opportunity Level
10-Year Plan
New generation capacity
PPA replacement
$15 Billion • ROA customer return $18 Billion
Post-2015 renewables
More gas storage More gas conversions Transmission
Faster pole & pipe replacement
Customer base rates <2% >3%
X
. . . . needed wanted.
6
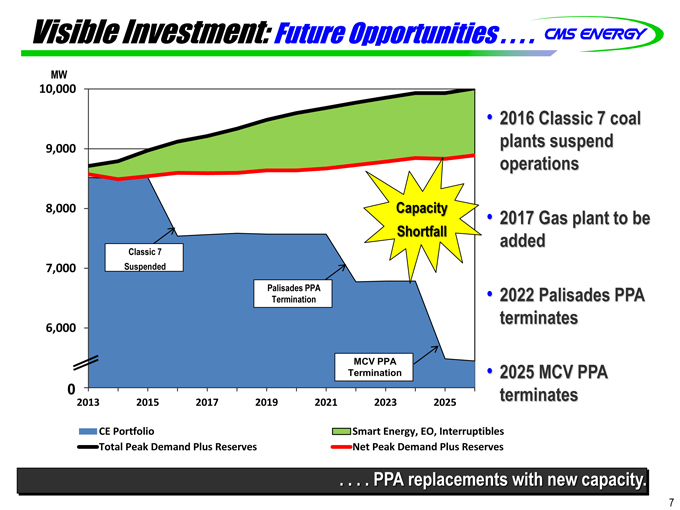
Visible Investment: Future Opportunities . . . .
MW
10,000
2016 Classic 7 coal plants suspend
9,000
operations
8,000 Capacity • 2017 Gas plant to be
Shortfall added
Classic 7
7,000 Suspended
Palisades PPA • 2022 Palisades PPA
Termination
terminates
6,000
MCV PPA
Termination • 2025 MCV PPA 0 terminates
2013 2015 2017 2019 2021 2023 2025
CE Portfolio Smart Energy, EO, Interruptibles Total Peak Demand Plus Reserves Net Peak Demand Plus Reserves
. . . . PPA replacements with new capacity.
7
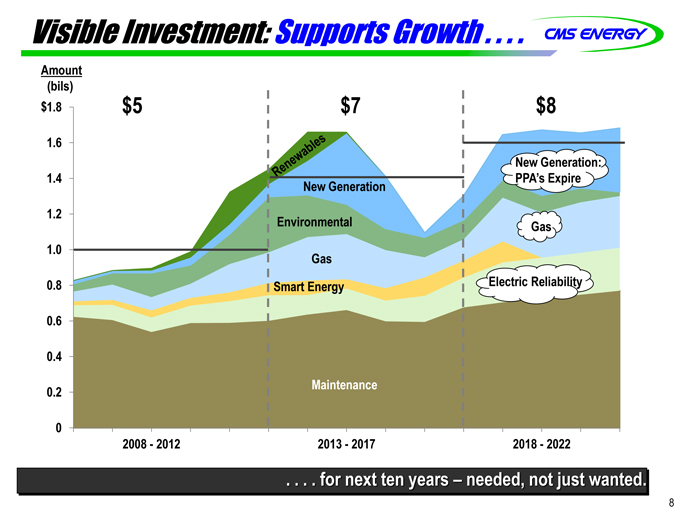
Visible Investment: Supports Growth . . . .
Amount
(bils)
$1 .8 $5 $7 $8
1.6
New Generation:
1.4 PPA’s Expire
New Generation
1.2
Environmental Gas
1.0
Gas
0.8 Smart Energy Electric Reliability
0.6
0.4
Maintenance
0.2
0
2008-2012 2013-2017 2018-2022
. . . . for next ten years – needed, not just wanted.
8
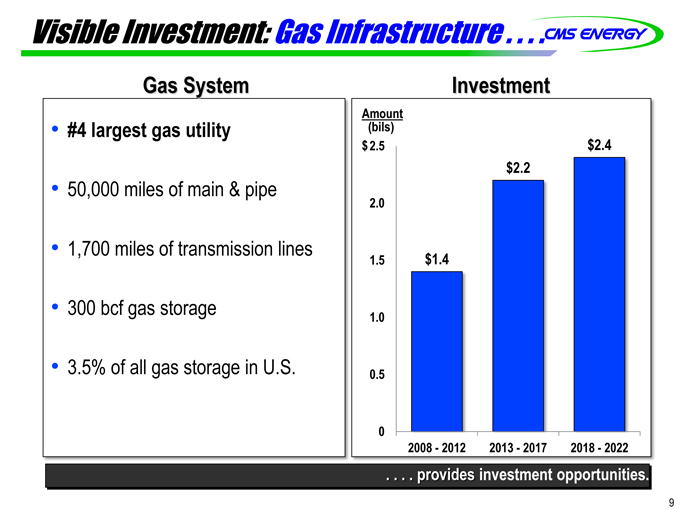
Visible Investment: Gas Infrastructure . . . .
Gas System
#4 largest gas utility
50,000 miles of main & pipe
1,700 miles of transmission lines
300 bcf gas storage
3.5% of all gas storage in U.S.
Investment
Amount (bils)
$ 2.5 $2.4
$2.2
2.0
1.5 $1.4
1.0
0.5
0
2008-2012
2013-2017
2018-2022
. . . . provides investment opportunities.
9
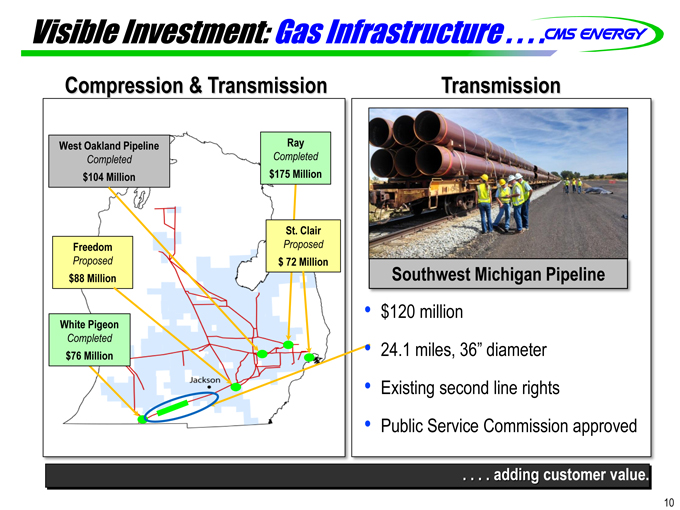
Visible Investment: Gas Infrastructure
Compression & Transmission
West Oakland Pipeline Ray
Completed Completed $104 Million $175 Million
St. Clair Freedom Proposed Proposed $ 72 Million
$88 Million
White Pigeon
Completed
$76 Million
Transmission
Southwest Michigan Pipeline
Jackson
$120 million
24.1 miles, 36” diameter
Existing second line rights
Public Service Commission approved
adding customer value.
10
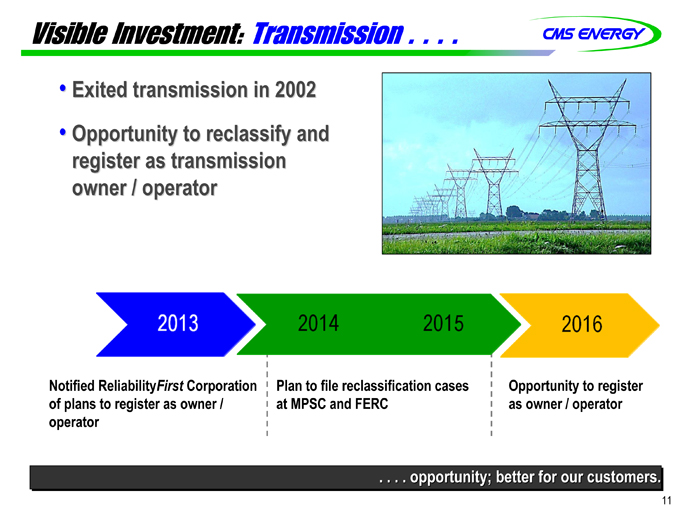
Visible Investment: Transmission
. .
Exited transmission in 2002
Opportunity to reclassify and register as transmission owner / operator
2013
2014
2015
2016
Notified ReliabilityFirst Corporation Plan to file reclassification cases Opportunity to register of plans to register as owner / at MPSC and FERC as owner / operator operator
opportunity; better for our customers.
11
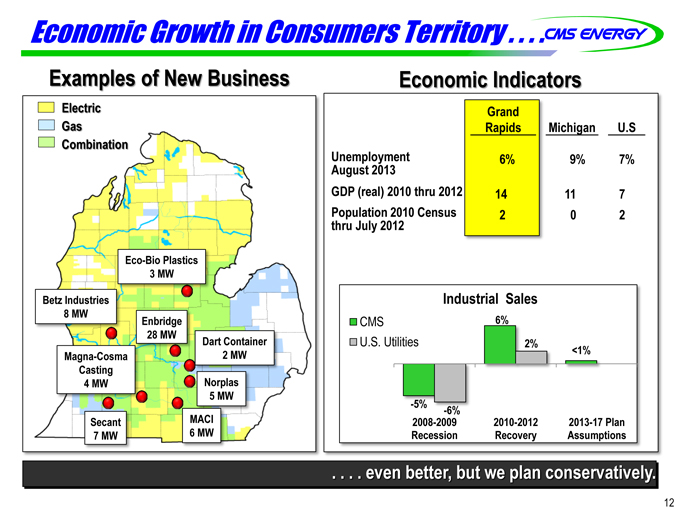
Economic Growth in Consumers Territory
Examples of New Business
Electric
Gas
Combination
Eco-Bio Plastics
3 MW
Betz Industries
8 MW
Enbridge
28 MW
Dart Container
Magna-Cosma 2 MW Casting
4 MW Norplas
5 MW
Secant MACI
7 MW 6 MW
Economic Indicators
Grand
Rapids Michigan U.S
Unemployment 6% 9% 7% August 2013 GDP (real) 2010 thru 2012 14 11 7 Population 2010 Census 2 0 2 thru July 2012
Industrial Sales
CMS 6% U.S. Utilities 2%
<1%
-5%
-6%
2008-2009 2010-2012 2013-17 Plan Recession Recovery Assumptions
even better, but we plan conservatively.
12
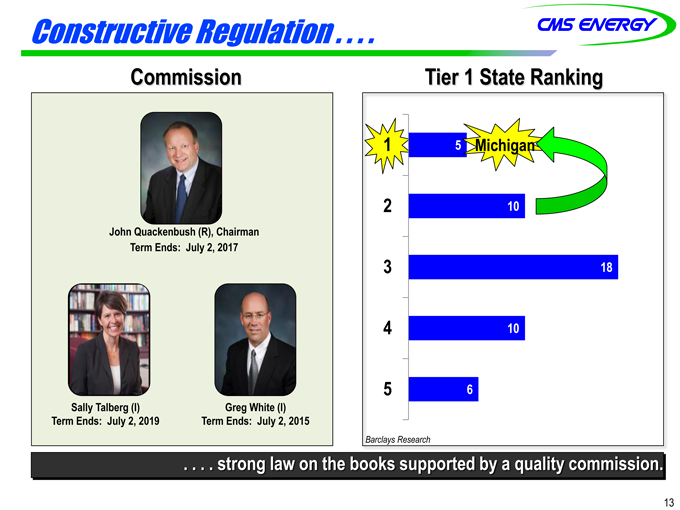
Constructive Regulation
Commission Tier 1 State Ranking
Michigan
John Quackenbush (R), Chairman Term Ends: July 2, 2017
Sally Talberg (I) Greg White (I) Term Ends: July 2, 2019 Term Ends: July 2, 2015
1 2 3 4 5
5 10 18 10 6
Barclays Research
strong law on the books supported by a quality commission.
13
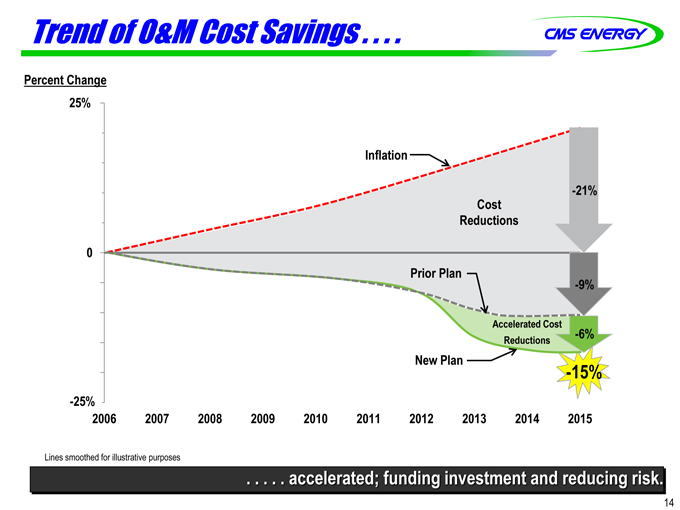
Trend of O&M Cost Savings
Percent Change
25%
Inflation
-21% Cost Reductions
0
Prior Plan
-9%
Accelerated Cost
-6%
Reductions
New Plan
-15%
-25%
2006 2007 2008 2009 2010 2011 2012 2013 2014 2015
Lines smoothed for illustrative purposes
accelerated; funding investment and reducing risk.
14
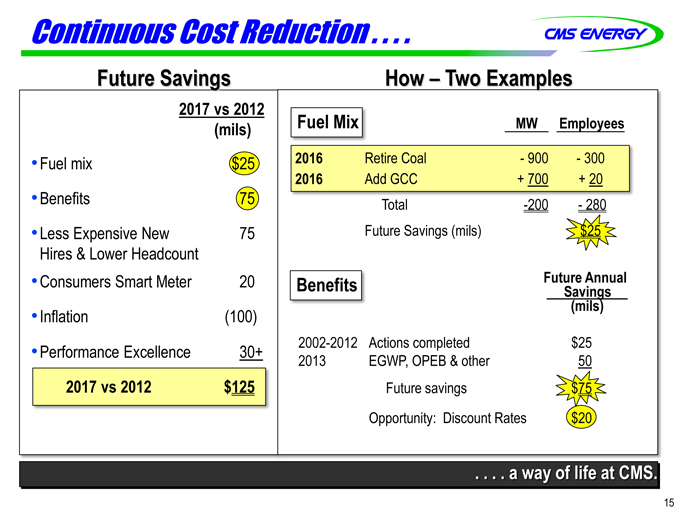
Continuous Cost Reduction
Future Savings How – Two Examples
2017 vs 2012
(mils) Fuel Mix MW Employees
Fuel mix $25 2016 Retire Coal -900 -300 2016 Add GCC + 700 + 20
Benefits 75 Total -200 -280
Less Expensive New 75 Future Savings (mils) $25
Hires & Lower Headcount
Consumers Smart Meter 20 Benefits Future Savings Annual (mils)
Inflation (100)
2002-2012 Actions completed $25
Performance Excellence 30+
2013 EGWP, OPEB & other 50 2017 vs 2012 $125 Future savings $75 Opportunity: Discount Rates $20
a way of life at CMS.
15
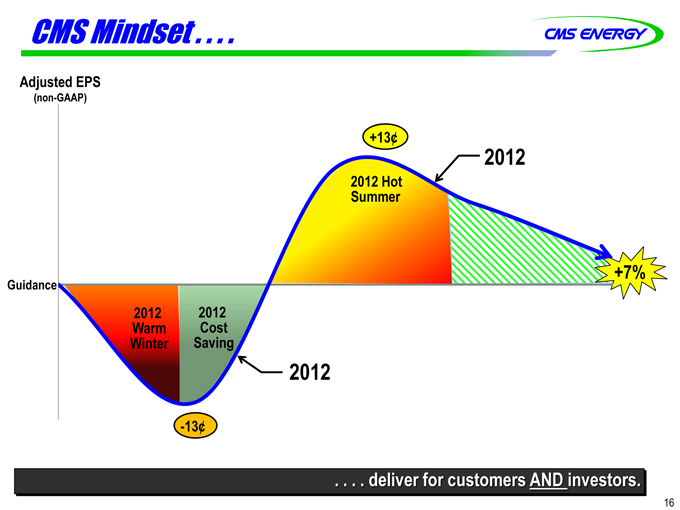
CMS Mindset
Adjusted EPS
(non-GAAP)
Guidance
2012 2012 Warm Cost Winter Saving
-13¢
+13¢
2012
2012 Hot Summer
+7%
2012
deliver for customers AND investors.
16
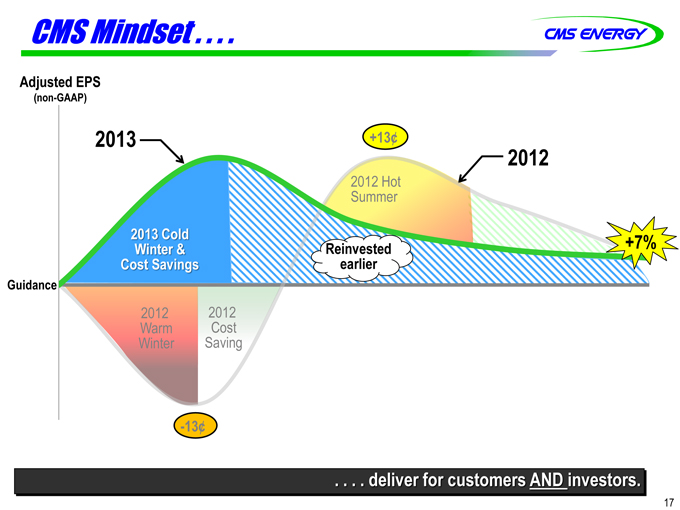
CMS Mindset
Adjusted EPS
(non-GAAP)
2013 +13¢
2012
2012 Hot Summer
2013 Cold +7% Winter & Reinvested Cost Savings earlier
Guidance
2012 2012 Warm Cost Winter Saving
-13¢
deliver for customers AND investors.
17
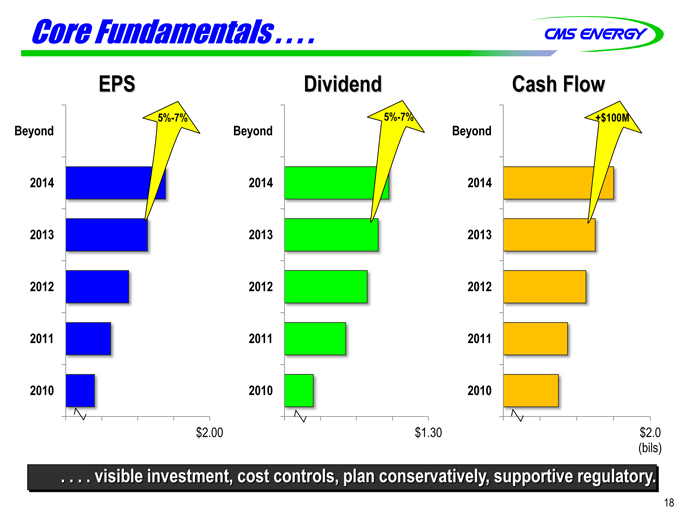
Core Fundamentals
EPS Dividend Cash Flow
5%-7% 5%-7% +$100M
Beyond Beyond Beyond
2014 2014 2014 2013 2013 2013 2012 2012 2012 2011 2011 2011 2010 2010 2010
$2.00 $1.30 $2.0 (bils)
visible investment, cost controls, plan conservatively, supportive regulatory.
18
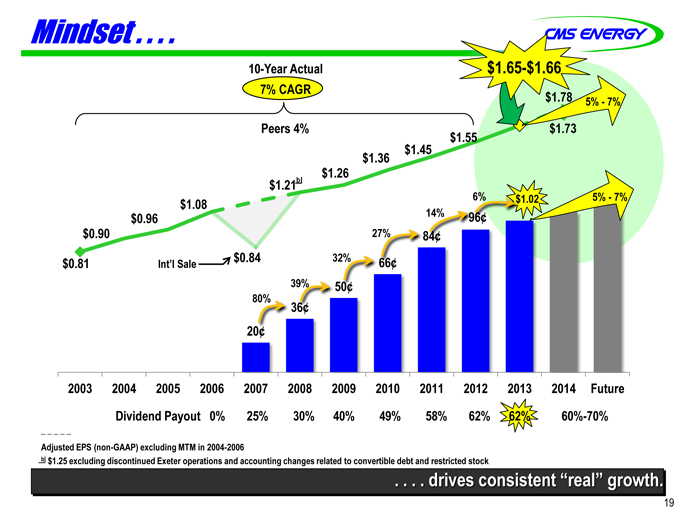
Mindset . .. . .
10-Year Actual $1.65-$1.66
7% CAGR
$1.78 5%-7% Peers 4% $1.73
$1.45 $1.55
$1.36
$1.26
$1.21b
6% $1.02 5%-7%
$1.08 80% 39% 32% 27% 36¢ 50¢ 66¢ 84¢ 96¢
$0.96 14%
$0.90
$0.84
$0.81 Int’l Sale
20¢
2003 2004 2005 2006 2007 2008 2009 2010 2011 2012 2013 2014 Future Dividend Payout 0% 25% 30% 40% 49% 58% 62% 62% 60%-70%
Adjusted EPS (non-GAAP) excluding MTM in 2004-2006 b $1.25 excluding discontinued Exeter operations and accounting changes related to convertible debt and restricted stock
drives consistent “real” growth.
19

APPENDIX
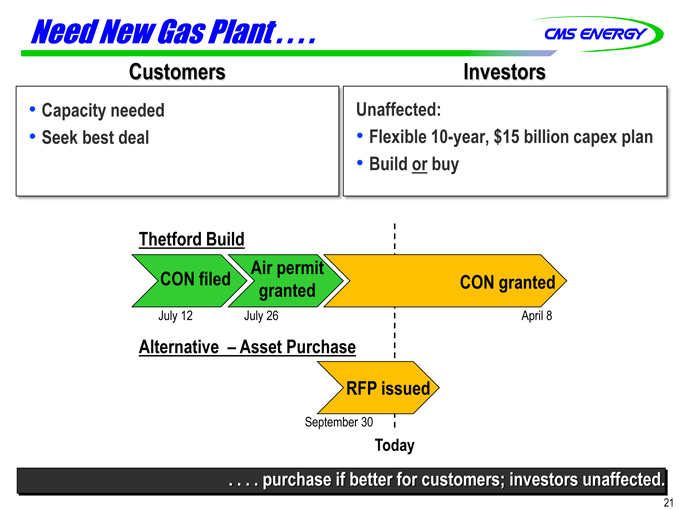
Need New Gas Plant . . . .
Customers Investors
Capacity needed Unaffected:
Seek best deal Flexible 10-year, $15 billion capex plan
Build or buy
Thetford Build
Air permit
CON filed CON granted granted
July 12 July 26 April 8
Alternative – Asset Purchase
RFP issued
September 30
Today
. . . . purchase if better for customers; investors unaffected.
21
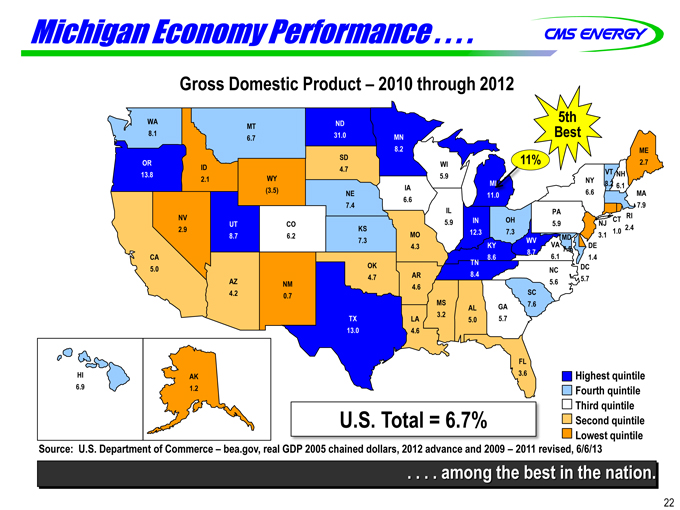
Michigan Economy Performance . . . .
Gross Domestic Product – 2010 through 2012
HI - 6.9
AK - 1.2
WA 5th
MT ND
8.1 31.0 Best
6.7 MN
8.2 ME
SD 11%
OR WI 2.7 ID 4.7
13.8 VT NH
2.1 WY 5.9
MI NY 8.2 IA 6.1
(3.5) NE 6.6 MA
11.0
6.6
7.4 7.9 IL PA
NV RI
5.9 IN OH CT
UT CO 5.9 NJ
2.9 KS 2.4
12.3 7.3 1.0
8.7 6.2 MO MD 3.1
7.3 WV
4.3 KY VA DE
8.7 6.1 7.5
CA 8.6 1.4 OK TN
5.0 8.4 NC DC
4.7 AR 5.7 AZ NM 5.6
4.6
4.2 SC
0.7 MS
GA 7.6 AL
3.2
TX LA 5.0 5.7
13.0 4.6
FL
HI AK 3.6 Highest quintile
6.9 1.2 Fourth quintile Third quintile
U.S. Total = 6.7% Second quintile
Lowest quintile
Source: U.S. Department of Commerce – bea.gov, real GDP 2005 Chained dollars, 2012 advance and 2009 - 2011 revised, 6/6/13
. . . . among the best in the nation.
22

Continuous Cost Reduction . . . .
2012 over 2006 Electric Non-fuel How – One Example
O&M Cost Headcount
7,600
7,200
$100k Each
600
Peer Average up 6%
$60k
1,000 Each
-0.4%
Consumers 2010 2012
_ _ _ _ _ People Productivity = $64 Million
Source: SNL data service
. . . . . part of CMS mindset.
23
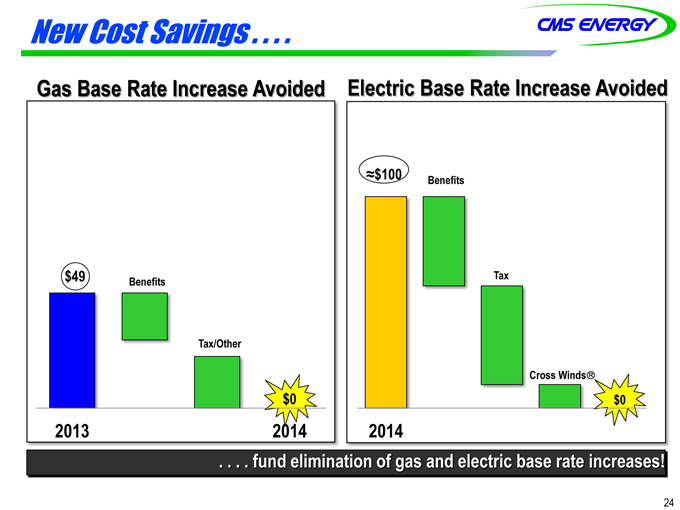
New Cost Savings . . . .
Gas Base Rate Increase Avoided Electric Base Rate Increase Avoided
$100 Benefits
$49 Tax
Benefits
Tax/Other
Cross Winds
$0 $0
2013 2014 2014
. . . . fund elimination of gas and electric base rate increases!
24
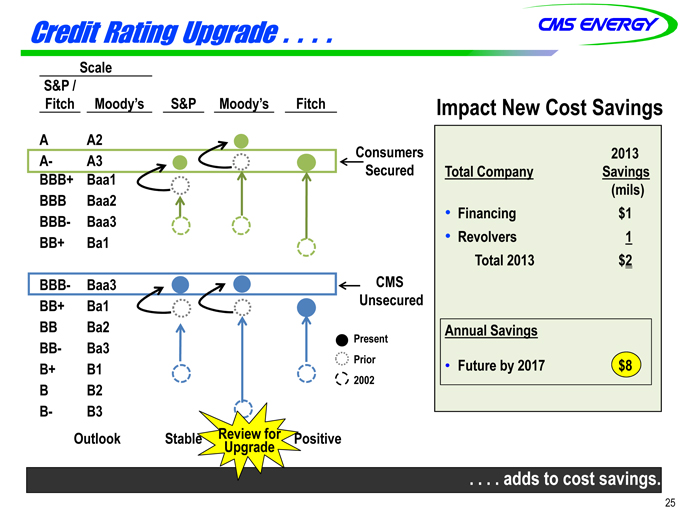
Credit Rating Upgrade . . . .
Scale
S&P /
Fitch Moody’s S&P Moody’s Fitch
A A2
A- A3 Consumers
BBB+ Baa1 Secured
BBB Baa2
BBB- Baa3
BB+ Ba1
BBB- Baa3 CMS
BB+ Ba1 Unsecured
BB Ba2
Present
BB- Ba3
Prior
B+ B1
2002
B B2
B- B3
Outlook Stable Review for Positive
Upgrade
Impact New Cost Savings
2013
Total Company Savings
(mils)
Total 2013 $ 2
Annual Savings
. . . . addsdds to cost savings.
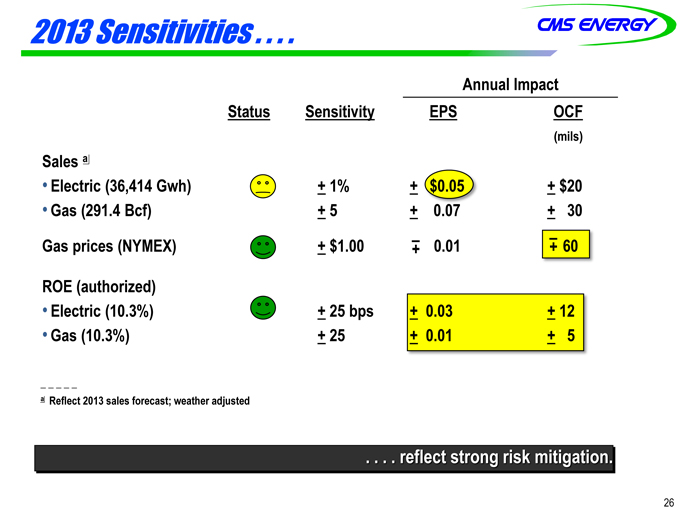
2013 Sensitivities
Annual Impact
Status Sensitivity EPS OCF
(mils)
Sales a
Electric (36,414 Gwh) +1% +$0.05 +$20
Gas (291.4 Bcf) +5 +0.07 +30
Gas prices (NYMEX) +$1.00 +0.01 +60
ROE (authorized)
Electric (10.3%) + 25 bps + 0.03 + 12
Gas (10.3%) + 25 + 0.01 + 5
_ _ _ _ _ a Reflect 2013 sales forecast; weather adjusted
. . . . reflect strong risk mitigation.
26
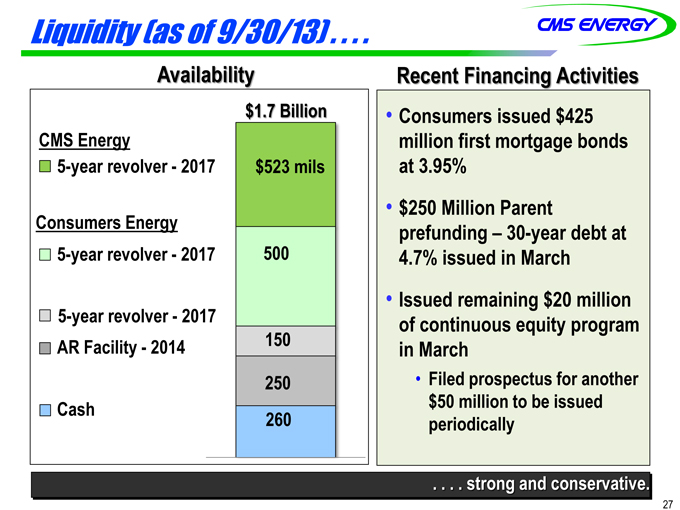
Liquidity (as of 9/30/13). . . .
Availability
$1.7 Billion CMS Energy
5-year revolver-2017 $523 mils
Consumers Energy
5-year revolver-2017 500
5-year revolver-2017
AR Facility-2014 150 250 Cash 260
Recent Financing Activities
Consumers issued $425 million first mortgage bonds at 3.95%
$250 Million Parent prefunding – 30-year debt at
4.7% issued in March
Issued remaining $20 million of continuous equity program in March
Filed prospectus for another $50 million to be issued periodically
. . . . strong and conservative.
27
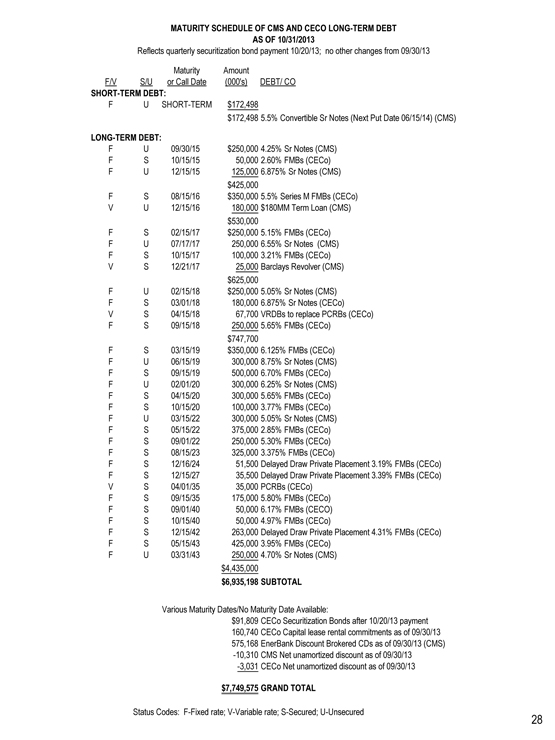
MATURITY SCHEDULE OF CMS AND CECO LONG-TERM DEBT AS OF 10/31/2013
Reflects quarterly securitization bond payment 10/20/13; no other changes from 09/30/13
Maturity Amount
F/V S/U or Call Date (000’s) DEBT/ CO
SHORT-TERM DEBT:
F U SHORT-TERM $172,498
$172,498 5.5% Convertible Sr Notes (Next Put Date 06/15/14) (CMS)
LONG-TERM DEBT:
F U 09/30/15 $250,000 4.25% Sr Notes (CMS)
F S 10/15/15 50,000 2.60% FMBs (CECo)
F U 12/15/15 125,000 6.875% Sr Notes (CMS)
$425,000
F S 08/15/16 $350,000 5.5% Series M FMBs (CECo)
V U 12/15/16 180,000 $180MM Term Loan (CMS)
$530,000
F S 02/15/17 $250,000 5.15% FMBs (CECo)
F U 07/17/17 250,000 6.55% Sr Notes (CMS)
F S 10/15/17 100,000 3.21% FMBs (CECo)
V S 12/21/17 25,000 Barclays Revolver (CMS)
$625,000
F U 02/15/18 $250,000 5.05% Sr Notes (CMS)
F S 03/01/18 180,000 6.875% Sr Notes (CECo)
V S 04/15/18 67,700 VRDBs to replace PCRBs (CECo)
F S 09/15/18 250,000 5.65% FMBs (CECo)
$747,700
F S 03/15/19 $350,000 6.125% FMBs (CECo)
F U 06/15/19 300,000 8.75% Sr Notes (CMS)
F S 09/15/19 500,000 6.70% FMBs (CECo)
F U 02/01/20 300,000 6.25% Sr Notes (CMS)
F S 04/15/20 300,000 5.65% FMBs (CECo)
F S 10/15/20 100,000 3.77% FMBs (CECo)
F U 03/15/22 300,000 5.05% Sr Notes (CMS)
F S 05/15/22 375,000 2.85% FMBs (CECo)
F S 09/01/22 250,000 5.30% FMBs (CECo)
F S 08/15/23 325,000 3.375% FMBs (CECo)
F S 12/16/24 51,500 Delayed Draw Private Placement 3.19% FMBs (CECo)
F S 12/15/27 35,500 Delayed Draw Private Placement 3.39% FMBs (CECo)
V S 04/01/35 35,000 PCRBs (CECo)
F S 09/15/35 175,000 5.80% FMBs (CECo)
F S 09/01/40 50,000 6.17% FMBs (CECO)
F S 10/15/40 50,000 4.97% FMBs (CECo)
F S 12/15/42 263,000 Delayed Draw Private Placement 4.31% FMBs (CECo)
F S 05/15/43 425,000 3.95% FMBs (CECo)
F U 03/31/43 250,000 4.70% Sr Notes (CMS)
$4,435,000
$6,935,198 SUBTOTAL
Various Maturity Dates/No Maturity Date Available:
$91,809 CECo Securitization Bonds after 10/20/13 payment
160,740 CECo Capital lease rental commitments as of 09/30/13
575,168 EnerBank Discount Brokered CDs as of 09/30/13 (CMS)
-10,310 CMS Net unamortized discount as of 09/30/13
-3,031 CECo Net unamortized discount as of 09/30/13
$7,749,575 GRAND TOTAL
Status Codes: F-Fixed rate; V-Variable rate; S-Secured; U-Unsecured
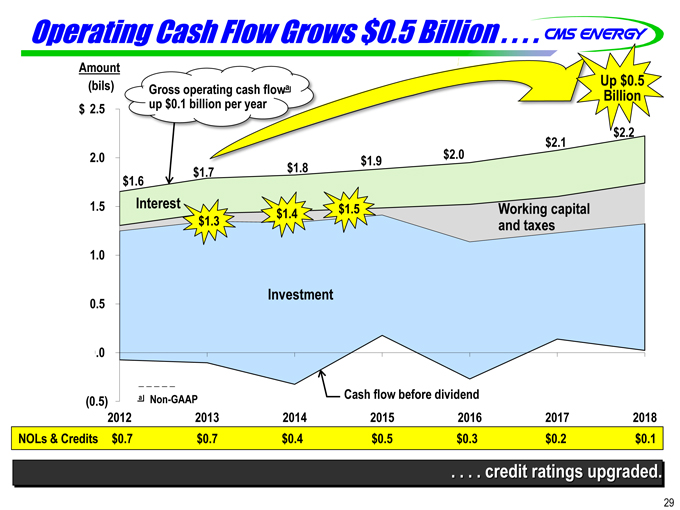
Operating Cash Flow Grows $0.5 Billion . . . .
Amount
(bils)
Gross operating cash flowa up $0.1 billion per year
Up $0.5 Billion
$ 2.5 2.0 1.5 1.0 0.5 .0 (0.5)
2012 2013 2014 2015 2016 2017 2018
NOLs & Credits $0.7 $0.7 $0.4 $0.5 $0.3 $0.2 $0.1
$1.6 $1.7 $1.8 $1.9 $2.0 $2.1 $2.2
Interest $1.3 $1.4 $1.5 Working capital and taxes
Investment
a Non-GAAP Cash flow before dividend
. . . . credit ratings upgraded.
29
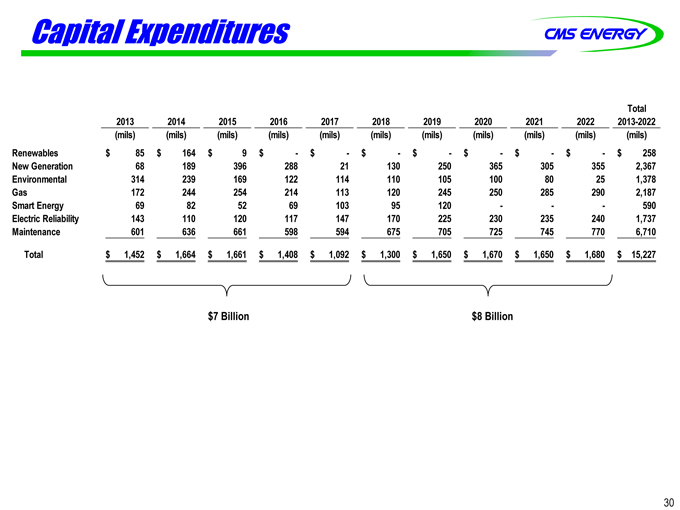
Capital Expenditures
Total 2013 2014 2015 2016 2017 2018 2019 2020 2021 2022 2013-2022 (mils) (mils) (mils) (mils) (mils) (mils) (mils) (mils) (mils) (mils) (mils) Renewables $ 85 $ 164 $ 9 $ -$ -$ -$ -$ -$ -$ -$ 258 New Generation 68 189 396 288 21 130 250 365 305 355 2,367 Environmental 314 239 169 122 114 110 105 100 80 25 1,378 Gas 172 244 254 214 113 120 245 250 285 290 2,187 Smart Energy 69 82 52 69 103 95 120 - - - 590 Electric Reliability 143 110 120 117 147 170 225 230 235 240 1,737 Maintenance 601 636 661 598 594 675 705 725 745 770 6,710
Total $ 1,452 $ 1,664 $ 1,661 $ 1,408 $ 1,092 $ 1,300 $ 1,650 $ 1,670 $ 1,650 $ 1,680 $ 15,227
$7 Billion $8 Billion
30
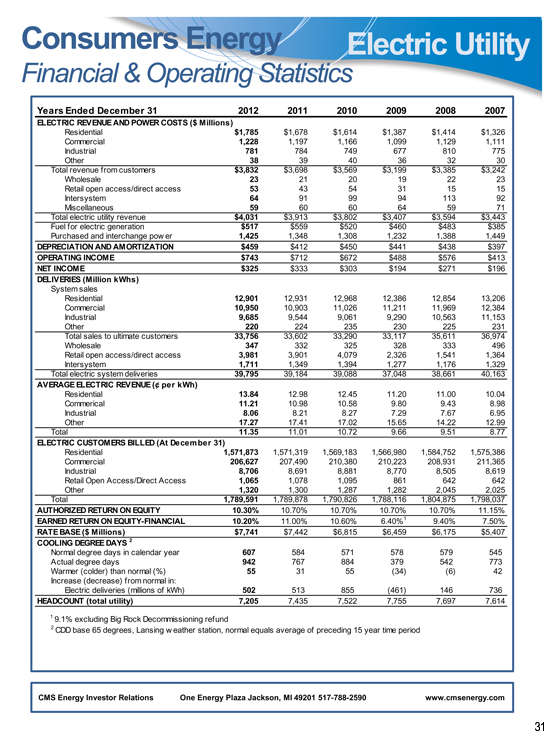
Consumers Energy Electric Utility
Financial & Operating Statistics
Years Ended December 31 2012 2011 2010 2009 2008 2007
ELECTRIC REVENUE AND POWER COSTS ($ Millions)
Residential $1,785 $1,678 $1,614 $1,387 $1,414 $1,326 Commercial 1,228 1,197 1,166 1,099 1,129 1,111 Industrial 781 784 749 677 810 775 Other 38 39 40 36 32 30 Total revenue from customers $3,832 $3,698 $3,569 $3,199 $3,385 $3,242 Wholesale 23 21 20 19 22 23 Retail open access/direct access 53 43 54 31 15 15 Intersystem 64 91 99 94 113 92 Miscellaneous 59 60 60 64 59 71 Total electric utility revenue $4,031 $3,913 $3,802 $3,407 $3,594 $3,443 Fuel for electric generation $517 $559 $520 $460 $483 $385 Purchased and interchange pow er 1,425 1,348 1,308 1,232 1,388 1,449
DEPRECIATION AND AMORTIZATION $459 $412 $450 $441 $438 $397
OPERATING INCOME $743 $712 $672 $488 $576 $413 NET INCOME $325 $333 $303 $194 $271 $196
DELIVERIES (Million kWhs)
System sales
Residential 12,901 12,931 12,968 12,386 12,854 13,206 Commercial 10,950 10,903 11,026 11,211 11,969 12,384 Industrial 9,685 9,544 9,061 9,290 10,563 11,153 Other 220 224 235 230 225 231 Total sales to ultimate customers 33,756 33,602 33,290 33,117 35,611 36,974 Wholesale 347 332 325 328 333 496 Retail open access/direct access 3,981 3,901 4,079 2,326 1,541 1,364 Intersystem 1,711 1,349 1,394 1,277 1,176 1,329 Total electric system deliveries 39,795 39,184 39,088 37,048 38,661 40,163
AVERAGE ELECTRIC REVENUE (¢ per kWh)
Residential 13.84 12.98 12.45 11.20 11.00 10.04 Commerical 11.21 10.98 10.58 9.80 9.43 8.98 Industrial 8.06 8.21 8.27 7.29 7.67 6.95 Other 17.27 17.41 17.02 15.65 14.22 12.99 Total 11.35 11.01 10.72 9.66 9.51 8.77
ELECTRIC CUSTOMERS BILLED (At December 31)
Residential 1,571,873 1,571,319 1,569,183 1,566,980 1,584,752 1,575,386 Commercial 206,627 207,490 210,380 210,223 208,931 211,365 Industrial 8,706 8,691 8,881 8,770 8,505 8,619 Retail Open Access/Direct Access 1,065 1,078 1,095 861 642 642 Other 1,320 1,300 1,287 1,282 2,045 2,025 Total 1,789,591 1,789,878 1,790,826 1,788,116 1,804,875 1,798,037
AUTHORIZED RETURN ON EQUITY 10.30% 10.70% 10.70% 10.70% 10.70% 11.15% EARNED RETURN ON EQUITY-FINANCIAL 10.20% 11.00% 10.60% 6.40%1 9.40% 7.50%
RATE BASE ($ Millions) $7,741 $7,442 $6,815 $6,459 $6,175 $5,407
COOLING DEGREE DAYS 2
Normal degree days in calendar year 607 584 571 578 579 545 Actual degree days 942 767 884 379 542 773 Warmer (colder) than normal (%) 55 31 55 (34) (6) 42 Increase (decrease) from normal in: Electric deliveries (millions of kWh) 502 513 855 (461) 146 736
HEADCOUNT (total utility) 7,205 7,435 7,522 7,755 7,697 7,614
1 9.1% excluding Big Rock Decommissioning refund
2 CDD base 65 degrees, Lansing w eather station, normal equals average of preceding 15 year time period
CMS Energy Investor Relations One Energy Plaza Jackson, MI 49201 517-788-2590 www.cmsenergy.com
31
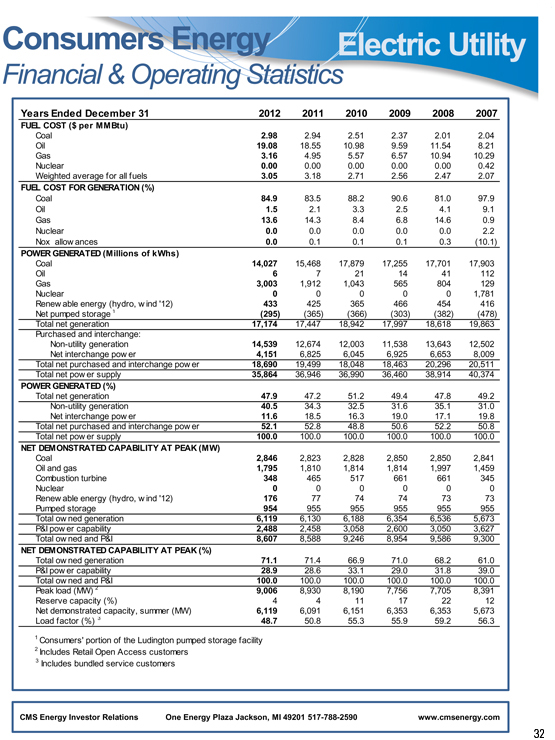
Consumers Energy Electric Utility
Financial & Operating Statistics
Years Ended December 31 2012 2011 2010 2009 2008 2007
FUEL COST ($ per MMBtu)
Coal 2.98 2.94 2.51 2.37 2.01 2.04 Oil 19.08 18.55 10.98 9.59 11.54 8.21 Gas 3.16 4.95 5.57 6.57 10.94 10.29 Nuclear 0.00 0.00 0.00 0.00 0.00 0.42 Weighted average for all fuels 3.05 3.18 2.71 2.56 2.47 2.07
FUEL COST FOR GENERATION (%)
Coal 84.9 83.5 88.2 90.6 81.0 97.9 Oil 1.5 2.1 3.3 2.5 4.1 9.1 Gas 13.6 14.3 8.4 6.8 14.6 0.9 Nuclear 0.0 0.0 0.0 0.0 0.0 2.2 Nox
allowances 0.0 0.1 0.1 0.1 0.3 (10.1)
POWER GENERATED (Millions of kWhs)
Coal 14,027 15,468 17,879 17,255 17,701 17,903 Oil 6 7 21 14 41 112 Gas 3,003 1,912 1,043 565 804 129 Nuclear 0 0 0 0 0 1,781 Renewable energy (hydro, wind ‘12) 433 425 365 466 454 416 Net pumped storage 1 (295) (365) (366) (303) (382) (478) Total net generation 17,174 17,447 18,942 17,997 18,618 19,863 Purchased and interchange: Non-utility generation 14,539 12,674 12,003 11,538 13,643 12,502 Net interchange power 4,151 6,825 6,045 6,925 6,653 8,009 Total net purchased and interchange power 18,690 19,499 18,048 18,463 20,296 20,511 Total net power supply 35,864 36,946 36,990 36,460 38,914 40,374
POWER GENERATED (%)
Total net generation 47.9 47.2 51.2 49.4 47.8 49.2 Non-utility generation 40.5 34.3 32.5 31.6 35.1 31.0 Net interchange power 11.6 18.5 16.3 19.0 17.1 19.8 Total net purchased and interchange power 52.1 52.8 48.8 50.6 52.2 50.8 Total net power supply 100.0 100.0 100.0 100.0 100.0 100.0
NET DEMONSTRATED CAPABILITY AT PEAK (MW)
Coal 2,846 2,823 2,828 2,850 2,850 2,841 Oil and gas 1,795 1,810 1,814 1,814 1,997 1,459 Combustion turbine 348 465 517 661 661 345 Nuclear 0 0 0 0 0 0 Renewable energy (hydro, wind ‘12) 176 77 74 74 73 73 Pumped storage 954 955 955 955 955 955 Total owned generation 6,119 6,130 6,188 6,354 6,536 5,673 P&I power capability 2,488 2,458 3,058 2,600 3,050 3,627 Total owned and P&I 8,607 8,588 9,246 8,954 9,586 9,300
NET DEMONSTRATED CAPABILITY AT PEAK (%)
Total owned generation 71.1 71.4 66.9 71.0 68.2 61.0 P&I power capability 28.9 28.6 33.1 29.0 31.8 39.0 Total owned and P&I 100.0 100.0 100.0 100.0 100.0 100.0 Peak load (MW) 2 9,006 8,930 8,190 7,756 7,705 8,391 Reserve capacity (%) 4 4 11 17 22 12 Net demonstrated capacity, summer (MW) 6,119 6,091 6,151 6,353 6,353 5,673 Load factor (%) 3 48.7 50.8 55.3 55.9 59.2 56.3
1 Consumers’ portion of the Ludington pumped storage facility
2 Includes Retail Open Access customers
3 Includes bundled service customers
CMS Energy Investor Relations One Energy Plaza Jackson, MI 49201 517-788-2590 www.cmsenergy.com
32
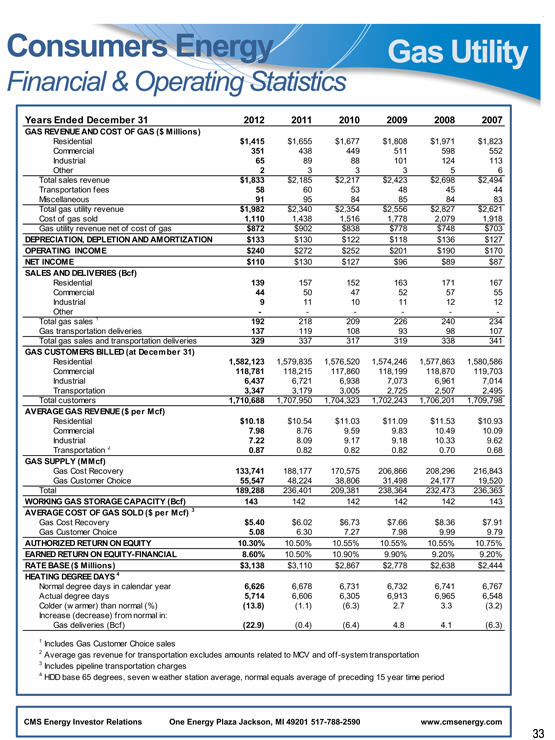
Consumers Energy Gas Utility
Financial & Operating Statistics
Years Ended December 31 2012 2011 2010 2009 2008 2007
GAS REVENUE AND COST OF GAS ($ Millions)
Residential $1,415 $1,655 $1,677 $1,808 $1,971 $1,823 Commercial 351 438 449 511 598 552 Industrial 65 89 88 101 124 113 Other 2 3 3 3 5 6 Total sales revenue $1,833 $2,185 $2,217 $2,423 $2,698 $2,494 Transportation fees 58 60 53 48 45 44 Miscellaneous 91 95 84 85 84 83 Total gas utility revenue $1,982 $2,340 $2,354 $2,556 $2,827 $2,621 Cost of gas sold 1,110 1,438 1,516 1,778 2,079 1,918 Gas utility revenue net of cost of gas $872 $902 $838 $778 $748 $703
DEPRECIATION, DEPLETION AND AMORTIZATION $133 $130 $122 $118 $136 $127
OPERATING INCOME $240 $272 $252 $201 $190 $170 NET INCOME $110 $130 $127 $96 $89 $87
SALES AND DELIVERIES (Bcf)
Residential 139 157 152 163 171 167 Commercial 44 50 47 52 57 55 Industrial 9 11 10 11 12 12 Other - - - - - -Total gas sales 1 192 218 209 226 240 234 Gas transportation deliveries 137 119 108 93 98 107 Total gas sales and transportation deliveries 329 337 317 319 338 341
GAS CUSTOMERS BILLED (at December 31)
Residential 1,582,123 1,579,835 1,576,520 1,574,246 1,577,863 1,580,586 Commercial 118,781 118,215 117,860 118,199 118,870 119,703 Industrial 6,437 6,721 6,938 7,073 6,961 7,014 Transportation 3,347 3,179 3,005 2,725 2,507 2,495 Total customers 1,710,688 1,707,950 1,704,323 1,702,243 1,706,201 1,709,798
AVERAGE GAS REVENUE ($ per Mcf)
Residential $10.18 $10.54 $11.03 $11.09 $11.53 $10.93 Commercial 7.98 8.76 9.59 9.83 10.49 10.09 Industrial 7.22 8.09 9.17 9.18 10.33 9.62 Transportation 2 0.87 0.82 0.82 0.82 0.70 0.68
GAS SUPPLY (MMcf)
Gas Cost Recovery 133,741 188,177 170,575 206,866 208,296 216,843 Gas Customer Choice 55,547 48,224 38,806 31,498 24,177 19,520 Total 189,288 236,401 209,381 238,364 232,473 236,363
WORKING GAS STORAGE CAPACITY (Bcf) 143 142 142 142 142 143 AVERAGE COST OF GAS SOLD ($ per Mcf) 3
Gas Cost Recovery $5.40 $6.02 $6.73 $7.66 $8.36 $7.91 Gas Customer Choice 5.08 6.30 7.27 7.98 9.99 9.79
AUTHORIZED RETURN ON EQUITY 10.30% 10.50% 10.55% 10.55% 10.55% 10.75% EARNED RETURN ON EQUITY-FINANCIAL 8.60% 10.50% 10.90% 9.90% 9.20% 9.20%
RATE BASE ($ Millions) $3,138 $3,110 $2,867 $2,778 $2,638 $2,444
HEATING DEGREE DAYS 4
Normal degree days in calendar year 6,626 6,678 6,731 6,732 6,741 6,767 Actual degree days 5,714 6,606 6,305 6,913 6,965 6,548 Colder (warmer) than normal (%) (13.8) (1.1) (6.3) 2.7 3 .3 ( 3.2) Increase (decrease) from normal in: Gas deliveries (Bcf) (22.9) (0.4) (6.4) 4.8 4.1 (6.3)
1 Includes Gas Customer Choice sales
2 Average gas revenue for transportation excludes amounts related to MCV and off-system transportation
3 Includes pipeline transportation charges
4 HDD base 65 degrees, seven weather station average, normal equals average of preceding 15 year time period
CMS Energy Investor Relations One Energy Plaza Jackson, MI 49201 517-788-2590 www.cmsenergy.com
33
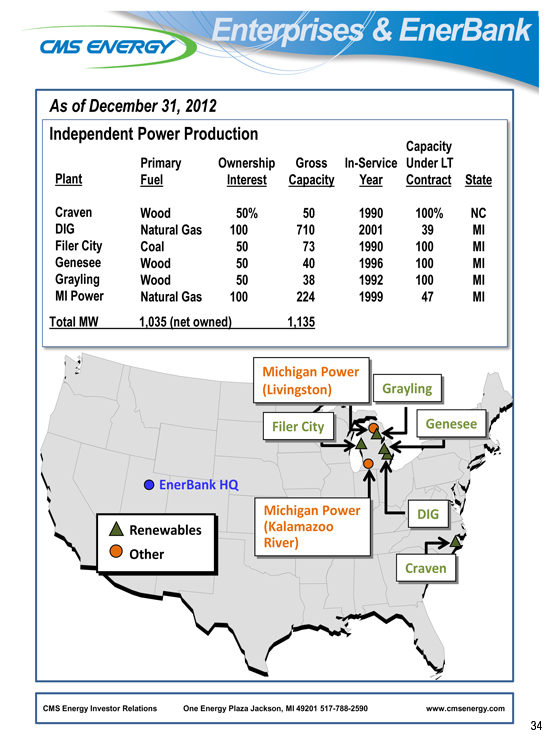
Enterprises & EnerBank
As of December 31, 2012
Independent Power Production
Capacity Primary Ownership Gross In-Service Under LT
Plant Fuel Interest Capacity Year Contract State
Craven Wood 50% 50 1990 100% NC DIG Natural Gas 100 710 2001 39 MI Filer City Coal 50 73 1990 100 MI Genesee Wood 50 40 1996 100 MI Grayling Wood 50 38 1992 100 MI MI Power Natural Gas 100 224 1999 47 MI
Total MW 1,035 (net owned) 1,135
Michigan P
(Livingston) Grayling
Filer city Genesee
EnerBank HQ
Michigan Power DIG Renewables (Kalamazoo
River)
Craven
CMS Energy Investor Relations One Energy Plaza Jackson, MI 49201 517-788-2590 www.cmsenergy.com
34

GAAP RECONCILIATION
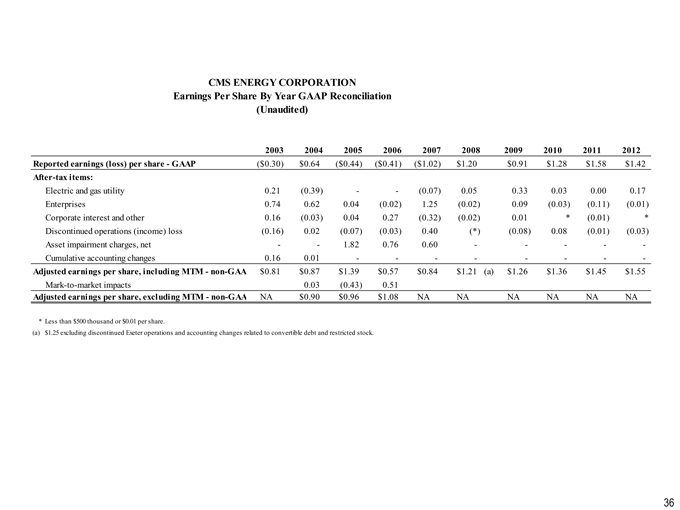
CMS ENERGY CORPORATION
Earnings Per Share By Year GAAP Reconciliation (Unaudited)
2003 2004 2005 2006 2007 2008 2009 2010 2011 2012 Reported earnings (loss) per share-GAAP ($0.30) $0.64 ($0.44) ($0.41) ($1.02) $1.20 $0.91 $1.28 $1.58 $1.42
After-tax items:
Electric and gas utility 0.21 (0.39) - -(0.07) 0.05 0.33 0.03 0.00 0.17 Enterprises 0.74 0.62 0.04 (0.02) 1.25 (0.02) 0.09 (0.03) (0.11) (0.01) Corporate interest and other 0.16 (0.03) 0.04 0.27 (0.32) (0.02) 0.01 * (0.01) * Discontinued operations (income) loss (0.16) 0.02 (0.07) (0.03) 0.40 (*) (0.08) 0.08 (0.01) (0.03) Asset impairment charges, net - -1.82 0.76 0.60 - - - - -Cumulative accounting changes 0.16 0.01 - - - - - - - -
Adjusted earnings per share, including MTM-non-GAA $0.81 $0.87 $1.39 $0.57 $0.84 $1.21 (a) $1.26 $1.36 $1.45 $1.55 Mark-to-market impacts 0.03 (0.43) 0.51
Adjusted earnings per share, excluding MTM-non-GAA NA $0.90 $0.96 $1.08 NA NA NA NA NA NA
* Less than $500 thousand or $0.01 per share.
(a) $1.25 excluding discontinued Exeter operations and accounting changes related to convertible debt and restricted stock.
36
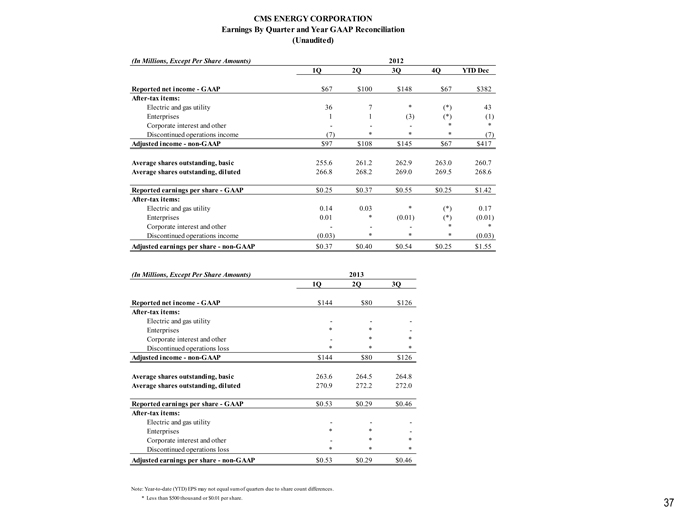
CMS ENERGY CORPORATION
Earnings By Quarter and Year GAAP Reconciliation (Unaudited)
(In Millions, Except Per Share Amounts) 2012
1Q 2Q 3Q 4Q YTD Dec
Reported net income-GAAP $67 $100 $148 $67 $382 After-tax items:
Electric and gas utility 36 7 * (*) 43 Enterprises 1 1 (3) (*) (1) Corporate interest and other - - -* * Discontinued operations income (7) * * * (7)
Adjusted income-non-GAAP $97 $108 $145 $67 $417
Average shares outstanding, basic 255.6 261.2 262.9 263.0 260.7 Average shares outstanding, diluted 266.8 268.2 269.0 269.5 268.6
Reported earnings per share-GAAP $0.25 $0.37 $0.55 $0.25 $1.42 After-tax items:
Electric and gas utility 0.14 0.03 * (*) 0.17 Enterprises 0.01 * (0.01) (*) (0.01) Corporate interest and other - - -* * Discontinued operations income (0.03) * * * (0.03)
Adjusted earnings per share-non-GAAP $0.37 $0.40 $0.54 $0.25 $1.55
(In Millions, Except Per Share Amounts) 2013
1Q 2Q 3Q
Reported net income-GAAP $144 $80 $126 After-tax items:
Electric and gas utility - - -Enterprises * * - Corporate interest and other - * * Discontinued operations loss * * *
Adjusted income-non-GAAP $144 $80 $126
Average shares outstanding, basic 263.6 264.5 264.8 Average shares outstanding, diluted 270.9 272.2 272.0
Reported earnings per share-GAAP $0.53 $0.29 $0.46 After-tax items:
Electric and gas utility - - -Enterprises * * - Corporate interest and other - * * Discontinued operations loss * * *
Adjusted earnings per share-non-GAAP $0.53 $0.29 $0.46
Note: Year-to-date (YTD) EPS may not equal sum of quarters due to share count differences.
*Less than $500 thousand or $0.01 per share.
37
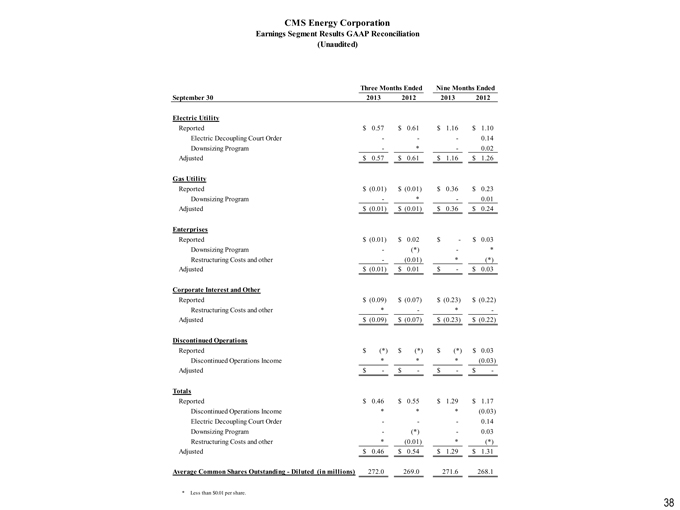
CMS Energy Corporation
Earnings Segment Results GAAP Reconciliation (Unaudited)
Three Months Ended Nine Months Ended September 30 2013 2012 2013 2012
Electric Utility
Reported $ 0.57 $ 0.61 $ 1.16 $ 1.10 Electric Decoupling Court Order - - - 0.14 Downsizing Program -* - 0.02 Adjusted $ 0.57 $ 0.61 $ 1.16 $ 1.26
Gas Utility
Reported $ (0.01) $ (0.01) $ 0.36 $ 0.23 Downsizing Program -* - 0.01 Adjusted $ (0.01) $ (0.01) $ 0.36 $ 0.24
Enterprises
Reported $ (0.01) $ 0.02 $ -$ 0.03 Downsizing Program - (*) - * Restructuring Costs and other - (0.01) * (*) Adjusted $ (0.01) $ 0.01 $ -$ 0.03
Corporate Interest and Other
Reported $ (0.09) $ (0.07) $ (0.23) $ (0.22) Restructuring Costs and other * - * -Adjusted $ (0.09) $ (0.07) $ (0.23) $ (0.22)
Discontinued Operations
Reported $ (*) $ (*) $ (*) $ 0.03 Discontinued Operations Income * * * (0.03) Adjusted $ -$ -$ -$ -
Totals
Reported $ 0.46 $ 0.55 $ 1.29 $ 1.17 Discontinued Operations Income * * * (0.03) Electric Decoupling Court Order - - - 0.14 Downsizing Program -(*) - 0.03 Restructuring Costs and other * (0.01) * (*) Adjusted $ 0.46 $ 0.54 $ 1.29 $ 1.31
Average Common Shares Outstanding-Diluted (in millions) 272.0 269.0 271.6 268.1
* Less than $0.01 per share.
38
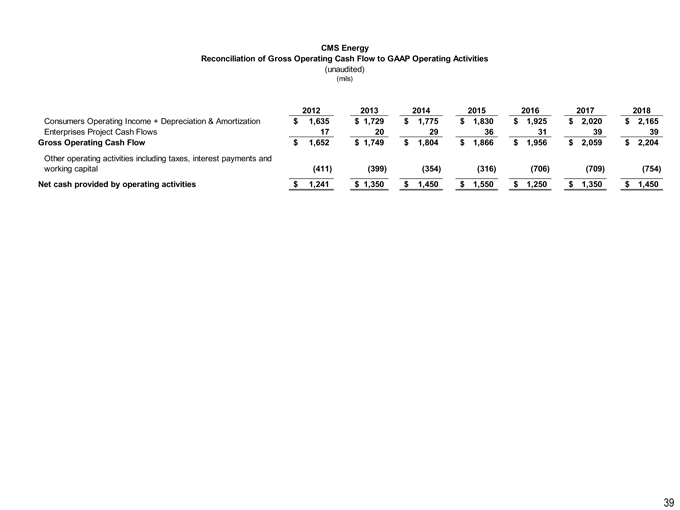
CMS Energy
Reconciliation of Gross Operating Cash Flow to GAAP Operating Activities
(unaudited)
(mils)
2012 2013 2014 2015 2016 2017 2018
Consumers Operating Income + Depreciation & Amortization $ 1,635 $ 1,729 $ 1,775 $ 1,830 $ 1,925 $ 2,020 $ 2,165
Enterprises Project Cash Flows 17 20 29 36 31 39 39 Gross Operating Cash Flow $ 1,652 $ 1,749 $ 1,804 $ 1,866 $ 1,956 $ 2,059 $ 2,204
Other operating activities including taxes, interest payments and working capital (411) (399) (354) (316) (706) (709) (754) Net cash provided by operating activities $ 1,241 $ 1,350 $ 1,450 $ 1,550 $ 1,250 $ 1,350 $ 1,450
39