UNITED STATES
SECURITIES AND EXCHANGE COMMISSION
Washington, D.C. 20549
FORM N-CSR
CERTIFIED SHAREHOLDER REPORT OF REGISTERED
MANAGEMENT INVESTMENT COMPANIES
Investment Company Act file number: 811-5038
---------------------------------------------
Clearwater Investment Trust
------------------------------------------------------------------------
(Exact name of registrant as specified in charter)
2000 Wells Fargo Place, 30 East 7th Street, Saint Paul, Minnesota 55101-4930
------------------------------------------------------------------------
(Address of principal executive offices) (Zip code)
Susanne S. Smith, Esq.
Chief Compliance Officer
Fiduciary Counselling, Inc.
2000 Wells Fargo Place, 30 East 7th Street
Saint Paul, Minnesota 55101-4930
(Name and address of agent for service)
Copy to:
Timothy Silva, Esq.
Wilmer, Cutler, Pickering, Hale and Dorr, LLP
60 State Street
Boston, Massachusetts 02109
------------------------------------------------------------------------
(Name and address for agent for service)
Registrant’s telephone number, including area code:
651-228-0935
Date of fiscal year end: December 31, 2005
Date of reporting period: December 31, 2005
Form N-CSR is to be used by management investment companies to file reports with the Commission not later than 10 days after the transmission to stockholders of any report that is required to be transmitted to stockholders under Rule 30e-1 under the Investment Company Act of 1940 (17 CFR 270.30e-1). The Commission may use the information provided on Form N-CSR in its regulatory, disclosure review, inspection, and policymaking roles.
A registrant is required to disclose the information specified by Form N-CSR, and the Commission will make this information public. A registrant is not required to respond to the collection of information contained in Form N-CSR unless the Form displays a currently valid Office of Management and Budget (“OMB”) control number. Please direct comments concerning the accuracy of the information collection burden estimate and any suggestions for reducing the burden to Secretary, Securities and Exchange Commission, 450 Fifth Street, NW, Washington, DC 20549-0609. The OMB has reviewed this collection of information under the clearance requirements of 44 U.S.C. ss. 3507.
| |
 |
| |
| |
| |
| |
| |
CLEARWATER INVESTMENT TRUST Financial Statements December 31, 2005 and 2004 (With Independent Auditors’ Report Thereon) |
| |
| |
| |
| |
| |
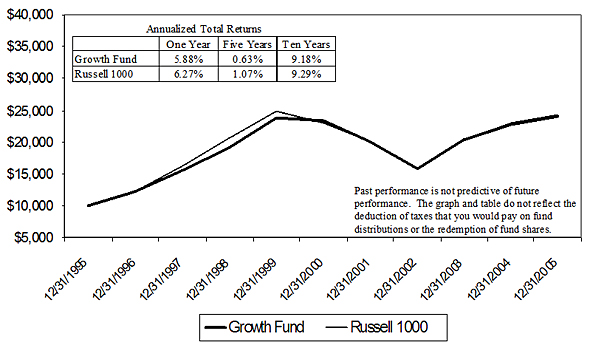
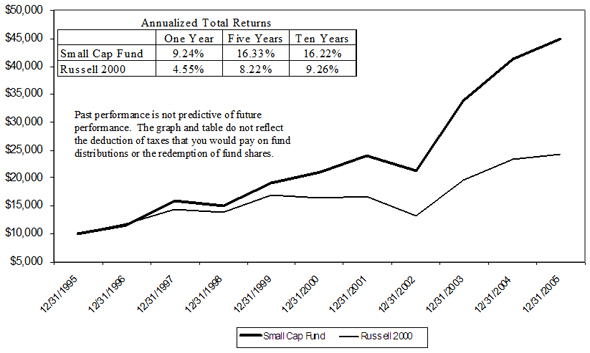
Clearwater Investment Trust February 2006 To: Our Unit Holders: On December 31, 2005 the net asset value of the Clearwater Growth Fund was $26.03 per unit. The net asset value of the Clearwater Small Cap Fund was $18.09 per unit. On a total return basis for 2005, the Clearwater Growth Fund increased by 5.9% versus the Russell 1000 increase of 6.3%, while the Clearwater Small Cap Fund increased by 9.2% versus the Russell 2000 increase of 4.6%. For the fourth quarter, the Clearwater Growth Fund increased by 2.1%, matching the Russell 1000, while the Clearwater Small Cap Fund decreased by 0.1% versus an increase of 1.1% for the Russell 2000. On December 31, 2005 the net asset value of the Clearwater Tax Exempt Bond Fund was $10.00 per unit. On a total return basis for 2005 the fund increased 4.6% with a fourth quarter return of 1.2%. For comparative purposes, the Lehman 5-Year Municipal Bond Index increased 1.0% for the year with a 0.3% increase in the fourth quarter. Parametric Portfolio Associates, the sub-advisor for the Clearwater Growth Fund, made the following comments: While not the robust holiday rally investors were hoping for, US stocks did rise in the final quarter of 2005, with the S&P 500 Index up a modest 2.1% for the last three months of the year. The S&P 500 Index also finished the year in positive territory, albeit a lower-than-average 4.9% for 2005. The end of the year saw some reversal in economic sector performance, as top performing sectors in the fourth quarter, materials, +11.2%, financials, +8.2%, and industrials, +5.0%, were the weakest sectors in the prior three quarters. Conversely, the worst performing sectors in the fourth quarter, energy, -7.4%, and utilities, -5.5%, were the top performers in the first nine months. In spite of this sector reversal, investment style was not a factor in driving stock returns in the fourth quarter, as value, growth, mid-cap and small-cap performed similarly to the large-cap S&P 500 Index (S&P 500/Citigroup Value Index, formerly S&P/Barra Value Index +2.2%; S&P 500/Citigroup Growth Index, formerly S&P/Barra Growth Index +2.0%; S&P MidCap 400 Index, +3.3%; S&P SmallCap 600 Index, +0.4%). As 2005 wound down, there was much hand wringing over the historical connection between an inverted yield curve (short-term interest rates higher than long-term interest rates, which occurred three times in the last week of the year) and US economic recession. Then again, consumer confidence rose in late December to pre-hurricane |
| levels, providing support for US economic growth, and consumer prices fell in December by the most in over 55 years, easing concerns over inflation. All eyes will stay on the Fed in 2006 to see if the trend of thirteen straight interest rate increases will continue in the New Year. |
| |
Comparison of the Change in Value of a $10,000 Investment in the
Clearwater Growth Fund and the Russell 1000 Index. |
| |
|
| |
Kennedy Capital Management, the sub-advisor for the Clearwater Small Cap Fund, made the following comments: PERFORMANCE: The Russell 2000 had a return of 4.6% in 2005, lagging the S&P 500 return of 4.9%. This underperformance by small cap stocks versus large cap came after 6 consecutive years of outperformance. The R2000 lagged the S&P 500 during the final quarter of the year, only the 9th time over the last 25 quarters the R2000 has underperformed its large cap counterpart. Growth stocks continued to outperform during the quarter. As the economy marginally slows in the coming quarters, stocks that can show growth will be in demand by the investment community. Your portfolio includes exposure to both growth and value issues. For the year, the Clearwater Small Cap Fund out performed the benchmark, with a return of 9.2% as compared to 4.6% for the Russell 2000. We outperformed the Russell 2000 Index in the first quarter (a down quarter) and the third quarter of 2005, and lagged the benchmark during the second and final quarters of the year. |
SECTOR WEIGHTINGS The sector weightings for the Clearwater Small Cap Fund experienced modest changes in the second half of 2005 as compared to the beginning half of the year. During the latter half of 2005, significant over-weights relative to our benchmark included Autos and Transportation (6.0% vs the benchmark at 3.6%), Materials and Processing (12.1% vs 9.4%), and Producer Durables (11.3% vs 7.6%). Underweighted sectors included Consumer Discretionary (12.7% vs 18.5%) and Financials (12.5% vs 23.5%). Overall, however, the impact of sector weightings in your portfolio was relatively modest, adding about 160 basis points to relative performance. PERFORMANCE ATTRIBUTION Kennedy’s forte has always been in stock selection. True to form, our performance relative to the benchmark was most significantly aided by stock selections during the course of the full year. Our stock selections had positive impact in several areas, including Consumer Discretionary, Materials and Processing, and Producer Durables. Our stock picks in Healthcare impeded results. We have maintained a relatively low rate of turnover in your portfolio. Many of the stocks that were “Top 10”s at year end were also major positions in your account at mid-year. And many of these holdings were also significant contributors to performance for the year, including Cleveland-Cliffs, Oil States International and Trident Microsystems. To give you a flavor of the breadth of companies we select as holdings in your portfolio, here’s a brief description of three of these major portfolio holdings: Cleveland-Cliffs is a leading producer of iron ore pellets, a key component of steelmaking. It owns or holds stakes in six iron ore properties, including Northshore Mining and Empire Iron, which represent more than 45% of North American iron ore pellet production capacity. Oil States provides tubular services and offers casing, premium tubing, and line pipes. The company’s well site services range from remote-site accommodations to hydraulic well control equipment. It also offers offshore products, including flex-element technology and deepwater mooring systems. Trident Microsystems offers integrated circuits (ICs) for digital television, LCD TV, and digital applications. The company’s video processors enhance the quality of both analog and digital TV outputs, while its encoder chips optimize the display of computer images on TV. Trident outsources its manufacturing and sells primarily to OEMs located in Asia. PORTFOLIO CHARACTERISTICS At Kennedy, we have clearly noted the element of fear that crept into the market in the 2nd quarter due to high energy prices and accelerated with the hurricane damage in the Gulf during the 3rd quarter. This fear component gradually dissipated during the 4th quarter, and our performance gradually returned to better levels as Q4 ended and we moved into the New Year. The consumer seems to have adjusted to gas prices in the $2.00 to $3.00 range, and a mild winter (at least so far) is keeping heating bills in check. |
Here are a few specific observations we have on the current market environment: (1). We have been underweighted in several industry groups such as Consumer Discretionary, and Financials, since we felt most of the stocks in these groups were overvalued. In recent months, valuations in these groups have declined enough in price to give us several buying opportunities. We will be closely examining issues in these sectors going forward to see if their current valuations and fundamentals warrant increased exposure in your portfolio. (2). The resumption of the upward move that started in early November has been dominated by companies showing top line growth. We believe this will continue, and will be emphasizing stocks that exhibit this growth. We continue to concentrate our attention on uncovering those companies that are most uniquely positioned for future capital appreciation potential. As always, our process begins with screening and analyzing those segments of our investment universe that are most overlooked and undervalued. Of course every year presents its new set of macro and micro-oriented challenges. We believe, however, that our fundamentally based research process will continue to be the key to not only weathering these challenges but also discovering many exciting investment opportunities in 2006. |
| |
Comparison of the Change in Value of a $ 10,000 Investment in the
Clearwater Small Cap Fund and the Russell 2000 Index. |
| |
|
SIT Investment Associates: the sub-advisor for the Clearwater Tax Exempt Bond Fund, made the following comments: The fixed income markets completed a difficult year in 2005, with performance being especially strong in long Treasuries and municipals, and mortgages. Heavy issuance in the government, mortgage, corporate, and municipal markets continued, and while demand was not as strong as in 2004, it was more than able to absorb the supply. The Federal Reserve began its tightening cycle in June 2004, raising the federal funds rate by 25 basis points at each of the FOMC meetings through December 2005. The U. S. Treasury and municipal yield curves flattened considerably during the past year. Many in the market now believe that the Fed is nearing the end of its tightening cycle. Moderating but acceptable growth in the domestic economy accompanied by a still troublesome federal budget deficit, with moderate and apparently contained inflation despite high oil prices support this expectation. However, any evidence of stronger growth or worsening inflation could be met with further short-term interest rate hikes. We expect the Fed to continue to raise the federal funds rate during the first half of 2006 to 4.75%, with the most likely level at mid-year 2006 being in the 4.50% to 5.00% range. While we do not anticipate any easing in the second half of 2006, the market may begin to anticipate a reduction in the federal funds rate by the latter half of 2006. As we postulated in our semi-annual report, revenue bonds outperformed general obligation bonds during 2005, and lower quality issues outperformed those of higher credit quality, as investors continued to seek yield aggressively. We expect revenue bonds to continue to be strong performers in 2006. General obligation bond performance should improve on a relative basis, however, as many cities, counties and states, have, with the help of solid economic growth, adequately addressed their most urgent budget problems. The Fund’s performance, with its heavy emphasis on revenue bonds, was strong on an absolute basis due to the high current income it produces, and much stronger than that of its benchmark, despite its shorter duration, primarily due to its use of non-rated revenue bonds, whose spreads tightened considerably with the continued strong demand for yield in the municipal market. Non-rated and rated revenue bonds significantly enhance total return performance in periods of stable or rising interest rates. The economy has now produced seventeen consecutive quarters of solid growth, although the fourth quarter of 2005 was a bit weak. We expect growth to rebound in the first half of 2006, but to moderate somewhat in the second half of the year. With the Fed continuing its tightening cycle, interest rates are likely to rise. Short rates may continue to rise faster than intermediate and long rates, however, until the Fed completes its tightening cycle, which we expect will occur in the first half of 2006. Given our expectation that the Fed is close to done with its tightening, we lengthened the Fund’s average life duration, a measure of the Fund’s sensitivity to changes in interest rates, from 3.0 to 3.4 years during the year, accompanied by a small increase in yield. For comparison, the Fund’s benchmark, the Lehman 5-Year Index, had duration of 4.1 years at December 31, 2005. The Fund’s shorter duration and its use of non-rated bonds have positioned it defensively for the modest rise in interest rates that we expect in 2006. We |
| expect to lengthen duration further once the Fed is through with its tightening cycle. The Fund’s strong yield should continue to produce high tax-exempt income for its shareholders in the current and expected market environment. Investment of new cash flows will be focused on maturities in the 3-20 year range. |
| |
Comparison of the Change in Value of a $10,000 Investment in the
Clearwater Tax-Exempt Bond Fund and the Lehman Brothers 5-Year
Municipal Bond Index. |
| |
|
|
| |
Clearwater Investment Trust
P.W. Pascoe, President and CEO
L.R. Jones
L.H. King
C.W. Rasmussen
L. Rasmussen
F.T. Weyerhaeuser | | Clearwater Management Company
P.W. Pascoe, Chairman and Treasurer
W.T. Weyerhaeuser, V.P. and Secretary
S.B. Carr, Jr.
W. J. Driscoll
E.D. Hlavka
C.W. Morley
F.W. Piasecki
D.C. Titcomb
G.H. Weyerhaeuser, Jr. |
Shareholder Expense Example As a shareholder of the Fund, you incur costs, including management fees and other Fund expenses. This Example is intended to help you to understand your ongoing costs (in dollars) of investing in the Fund and to compare these costs with the ongoing costs of investing in other mutual funds. The example is based on an investment of $1,000 invested at the beginning of the period and held for the entire period from July 1, 2005 to December 31, 2005. Actual Expenses The first section of the table below provides information about actual account values and actual expenses. You may use the information in this section, together with the amount you invested, to estimate the expenses that you incurred over the period. Simply divide your account value by $1,000 (for example, an $8,600 account value divided by $1,000 = 8.6), then multiply the result by the number in the first section under the heading entitled “Expenses Paid During Period” to estimate the expenses attributable to your investment during this period. Hypothetical Example for Comparison Purposes The second section of the table below provides information about hypothetical account values and hypothetical expenses based on the Fund’s actual expense ratio and an assumed rate of return of 5% per year before expenses, which is not the Fund’s actual return. Thus, you should not use the hypothetical account values and expenses to estimate the actual ending account balance or your expenses for the period. Rather, these figures are provided to enable you to compare the ongoing costs of investing in the Fund and other funds. To do so, compare this 5% hypothetical example with the 5% hypothetical examples that appear in the shareholder reports of the other funds. Please note that the expenses shown in the second section of the table are meant to highlight your ongoing costs only. Therefore, the second section of the table is useful in comparing ongoing costs only, and will not help you determine the relative total costs of owning different funds that charge transaction costs, such as sales charges (loads) on purchase or redemption payments, with the Clearwater funds where you do not incur such charges. |
| Actual | Beginning Account
Value
July 1, 2005 | | Ending Account
Value
December 31,
2005 | | Expenses Paid
During the
Period*
July 1, 2005 thru
December 31,
2005 | |
|---|
| |
| |
| |
| |
|---|
| Growth Fund | | $1,000.00 | | | $1,058.33 | | | $1.82 | |
| Small Cap Fund | | $1,000.00 | | | $1,079.45 | | | $5.87 | |
| Tax-Exempt Bond Fund | | $1,000.00 | | | $1,019.79 | | | $2.39 | |
| |
Hypothetical (5% return
before expenses) |
| Growth Fund | | $1,000.00 | | | $1,023.42 | | | $ 1.79 | |
| Small Cap Fund | | $1,000.00 | | | $1,019.49 | | | $ 5.72 | |
| Tax-Exempt Bond Fund | | $1,000.00 | | | $1,022.81 | | | $ 2.40 | |
| |
*Expenses are equal to the Fund’s annualized expense ratios, multiplied by the average account value over the period, multiplied by 184/365 (to reflect the one-half year period). The annualized expense ratios are as follows: |
| |
| | Growth Fund | | 0.35 | % | |
| | Small Cap Fund | | 1.12 | % | |
| | Tax-Exempt Bond Fund | | 0.47 | % | |
| |
Quarterly Portfolio Schedule of Investments The Funds file a complete schedule of their portfolio holdings as of the close of the first and third quarters of their fiscal years with the SEC on Form N-Q. Shareholders may request copies of Form N-Q free of charge by calling the Transfer Agent toll free at 1-888-228-0935 or by sending a written request to: Fiduciary Counselling, Inc, 30 East 7th Street, Suite 2000, St. Paul, MN 55101 Attn: Clearwater Investment Trust Transfer Agent. These filings are also available on the SEC’s Internet site at http://www.sec.gov and may be reviewed and copied at the SEC’s Public Reference Room in Washington, DC. Information about the public reference room may be obtained by calling 1-800-SEC-0330. Voting Proxies on Fund Portfolio Securities The funds have established Proxy Voting Policies and Procedure (“Policies”) that the funds use to determine how to vote proxies relating to portfolio securities. They also report, on Form N-PX, how the Funds voted any such proxies during the most recent 12-month period ended June 30. Shareholders may request copies of the Policies or Form N-PX free of charge by calling the Transfer Agent toll free at 1-888-228-0935 or by sending a written request to: Fiduciary Counselling, Inc, 30 East 7th Street, Suite 2000, St. Paul, MN 55101 Attn: Clearwater Investment Trust Transfer Agent. Form N-PX is also available from the EDGAR database on the SEC’s Internet site at http://www.sec.gov. |
Board Approval of the Investment Advisory Agreement and Subadvisory Contracts Clearwater Management Company Clearwater Management Company (CMC) is responsible for managing the investment programs and strategies for the Growth Fund, Small Cap Fund and Tax-Exempt Bond Fund. The Trustees agreed to retain the CMC under the terms of the investment advisory agreement dated March 1, 1998. The agreement will continue for one year and is renewable for successive one-year periods. The Trustees considered the materials presented throughout the year and based their decision on that information. The Trustees considered the factors discussed below among others. No single factor determined whether or not the agreement would be renewed but rather the totality of factors considered was determinative. Nature, Extent and Quality of Services Provided The Trustees considered the nature and quality of the services provided by CMC since 1987. The Trustees considered the quality of the due diligence work that CMC performs on the sub-advisers and noted the good reputation that the CMC board has with the shareholder base. They also noted their approval of the various ideas for enhancements and adjustments to the funds made by CMC. The Trustees considered reports presented to them which demonstrate CMC’s compliance with both its and the fund’s compliance policies and procedures and Codes of Ethics. Based on their analysis of the data presented, the Trustees concluded that they were very pleased with the nature and quality of the services provided. Investment Performance The Trustees considered the work performed by CMC in monitoring the investment performance of the various sub-advisers. They noted their approval of the investment performance of the funds compared to other funds with similar objectives. The Trustees concluded that they were pleased with the services that CMC provided regarding the investment performance of the funds. Cost of Services The Trustees reviewed the fees paid to CMC. They noted their appreciation that CMC has negotiated the best deal possible with the sub-advisers regarding their fees. They were also pleased with CMC’s willingness to limit their profitability through voluntary fee reductions, including the most recent waiver effective April 1, 2005. It was also noted that CMC charges a fixed fee which results in fewer cost fluctuations and willingly pays certain expenses that are normally borne by the shareholders, namely the Fidelity transaction fee. The Trustees concluded that they were pleased with the cost of services paid to CMC, noting that the fee is very reasonable for the services provided. Parametric Portfolio Associates Parametric Portfolio Associates (Parametric) is responsible for managing the investment program and strategies for the Growth Fund. The Trustees agreed to retain Parametric under the terms of the subadvisory contract dated September 20, 2001. The agreement will continue for one year and is renewable for successive one-year periods. |
The Trustees considered the materials presented throughout the year and based their decision on that information, including the most recent evaluation of Parametric’s investment staff, portfolio management process and fund performance. The Trustees considered the factors discussed below among others. No single factor determined whether or not the agreement would be renewed but rather the totality of factors considered was determinative. Nature, Extent and Quality of Services Provided The Trustees considered the depth and experience of the Parametric organization. Parametric was founded in 1987 and currently has assets under management of $13 billion and employs a team of twenty investment professionals. They specialize in index-based and structured equity strategies and are considered the industry leader in tax-efficient portfolio management. Parametric uses a quantitative, technology driven process that can be highly automated. Parametric has been managing the Growth Fund since 1997 and has had four ownership changes during this timeframe. Brian Langstraat is the Chief Executive Officer and he has been with Parametric since 1990. Debjani Chaudhuri manages the portfolio. The investment objective of the Clearwater Growth Fund is to gain long-term, broad, diversified exposure to the U.S. equity market in a tax-efficient and low cost manner. The portfolio targets the Russell 1000 index. The Trustees also considered reports presented to them which demonstrate Parametric’s compliance with both its and the fund’s compliance polices and procedures and codes of ethics. Based on their analysis of the data presented, the Trustees concluded that they were very pleased with the nature and quality of the services provided. Investment Performance The Trustees considered the fund’s performance in the short and intermediate terms as well as since inception. They compared the fund’s performance to relevant benchmarks and peer groups and noted that the returns have met expectations in recent years. They paid particular attention to the performance reports prepared for their consideration by the fund’s transfer agent and shareholder service provider that demonstrated consistent performance relative to the benchmark and noted that the tax efficiency targets have been met or exceeded. It was noted that the tracking error has been significantly below the stated benchmark of 1.5% and is currently at .40%. Cost of Services The Trustees made a comparative analysis of the fund’s subadvisory fee relative to similar funds as well as other institutional investment accounts. The Trustees noted that management fees charged by most advisers directly managing a fund’s portfolio (i.e. not via hiring a subadviser to manage the portfolio) also covers significant administrative services not required of Parametric. The standard Parametric fee is based on assets under management and uses a sliding scale ranging from 35 basis points on the first $10 million under management to 20 basis points on assets in excess of $50 million. It was noted that trading costs are exceptionally low as is typical for a tax-managed account. For the Growth Fund, the management expense as a percentage of average assets under management in 2005, the time period examined by the trustees, was 15 basis points or 0.15%. The trustees relied on presentations by the fund’s transfer agent and shareholder servicing provider comparing Parametric’s management fee to its relevant peer groups both within the investment company universe and within the institutional investor universe in general. Such presentations relied on reports published by Morningstar. This |
analysis led the Trustees to determine that the fees charged to the fund were fair and reasonable in light of the high quality services tailored specifically to the fund’s circumstances. Additionally, the Trustees relied, in making their decision, on Parametric’s representation that the fee charged is less than a new client would pay. The Trustees also noted that the fee charged by Parametric when combined with all other fund expenses resulted in an overall expense ratio to the fund of .36% of average net assets versus the industry average for large cap domestic funds of 1.10% according to fund analysis company Morningstar, Inc. It was noted that the Growth Fund is passively managed while the listed industry average for large cap funds includes both passive and active management. Management Profitability The Trustees did not consider the profitability of Parametric resulting from its relationship with the fund. The fund’s situation is different from that where the portfolio is managed by the sole adviser, which established, promotes and markets the fund as a method of increasing its assets under management and, therefore, its profitability. Parametric is an independent firm and the advisory fee charged is the result of arms length bargaining between Parametric and the fund’s adviser under the supervision of the Trustees. Economies of Scale The Trustees considered whether the fund could enjoy economies of scale as it grows as a result of Parametric realizing economies of scale. Due to the quantitative, technology-driven service that can be highly automated, it was determined that there is no natural limit to the assets that they could manage under this approach. Also, the current fee charged by Parametric (.15%) is lower than their general fee schedule (.20%). Based on the above, the Trustees determined that further economies of scale resulting from the relationship with Parametric were not a consideration in that the fee is already low. Kennedy Capital Management Kennedy Capital Management (Kennedy) is responsible for managing the investment program and strategies for the Small Cap Fund. The Trustees agreed to retain Kennedy under the terms of the subadvisory contract dated April 16, 1999. The agreement will continue for one year and is renewable for successive one-year periods. The Trustees considered the materials presented throughout the year and based their decision on that information, including the most recent evaluation of Kennedy’s investment staff, portfolio management process and fund performance. The Trustees considered the factors discussed below among others. No single factor determined whether or not the agreement would be renewed but rather the totality of factors considered was determinative. Nature, Extent and Quality of Services Provided The Trustees considered the depth, experience and organizational stability of the Kennedy Capital organization. Kennedy has been managing investment portfolios since 1980 with total assets under management of $3.9 billion and employs a team of twenty-one investment professionals. They provide active small cap domestic security selection with 95% institutional and 5% high net worth clients. Kennedy has had a number of management changes over the years and is currently headed by Dick Sinise, Executive |
Vice President and Chief Investment Officer and Patricia Row, Executive Vice President and Chief Operating Officer. Matt Jermak is the portfolio manager and he has been with Kennedy since 1992. Kennedy Capital is research-intensive and narrowly focused on small cap equities. Their process has evolved since they were originally hired to manage the fund in 1994 into a very sophisticated set of fundamental criteria that captures the contrarian philosophy of the firm’s founders. This has resulted in investment returns well above both the fund’s peers and its comparable indices. The Trustees also considered reports presented to them which demonstrate Kennedy’s compliance with both its and the fund’s compliance polices and procedures and codes of ethics. Based on their analysis of the data presented, the Trustees concluded that they were very pleased with the nature and quality of the services provided. Investment Performance The Trustees considered the fund’s performance in the short and intermediate terms as well as since inception. They compared the fund’s performance to relevant benchmarks and peer groups and noted that the returns have exceeded expectations. They paid particular attention to the performance reports prepared for their considerations by the fund’s transfer agent and shareholder service provider that demonstrated solid relative performance against both the small-cap and micro-cap universes. Kennedy has continued to achieve investment performance that ranks in the top quartile of similar managers. Trading continues to be a strength for Kennedy. Abel-Noser reports place their execution near the top of their peer group. Tax efficiency is not a high priority for Kennedy, but the portfolio manager does review the portfolio for tax-loss harvesting opportunities and strives to hold securities long enough to achieve long-term gain status. However, due to their exceptional returns, the after-tax return is more than satisfactory. The Trustees concluded that they were satisfied with Kennedy Capital’s investment management performance. Cost of Services The Trustees made a comparative analysis of the fund’s subadvisory fee relative to similar small cap funds as well as other institutional investment accounts. The Trustees noted that management fees charged by most advisers directly managing a fund’s portfolio (i.e. not via hiring a subadviser to manage the portfolio) also cover significant administrative services not required of Kennedy. Kennedy charges a fee based on assets under management on a sliding scale ranging from 85 basis points on the first $50 million under management to 80 basis points on assets in excess of $50 million. The management expense as a percentage of average assets under management in 2005, the time period examined by the trustees, was 82 basis points or 0.82%. The Trustees relied on presentations by the fund’s transfer agent and shareholder servicing provider comparing Kennedy’s management fee to its relevant peer groups both within the investment company universe and within the institutional investor universe in general. Such presentations relied upon reports published by Morningstar. This analysis led the trustees to determine that the fees charged to the fund were fair and reasonable in light of the high quality services provided. Additionally, the Trustees relied, in making their decision, on Kennedy’s representation that no client with a similar account was being charged a lesser fee. The Trustees also noted that the fee charged by Kennedy when combined with all other fund expenses resulted in an overall expense ratio to the fund of 1.14% of average |
net assets versus the industry average for small cap domestic funds of 1.33% according to fund analysis company Morningstar, Inc. Management Profitability The Trustees did not consider the profitability of Kennedy resulting from its relationship with the fund. The fund’s situation is different from that where the portfolio is managed by the sole adviser, which established, promotes and markets the fund as a method of increasing its assets under management and, therefore, its profitability. Kennedy is an independent firm and the advisory fee charged is the result of arms length bargaining between Kennedy and the fund’s adviser under the supervision of the Trustees. Economies of Scale The Trustees considered whether the fund could enjoy economies of scale as it grows as a result of Kennedy realizing economies of scale. They found that there was some room in the current fee schedule for Kennedy’s fee, as a percentage of assets under management, to go down as a growing asset base moves the overall percentage down from the current 82 basis points towards 80 basis points. The Trustees determined that further economies of scale resulting from the relationship with Kennedy were not a major consideration given that the relationship is the result of arms length bargaining, most of the economies of scale have already been realized and that the fee is already low—especially in light of the quality of service provided. Sit Fixed Income Advisers II Sit Fixed Income Advisers II (Sit) is responsible for managing the investment program and strategies for the Tax-Exempt Bond Fund. The Trustees agreed to retain Sit under the terms of the subadvisory contract dated December 15, 1999. The agreement will continue for one year and is renewable for successive one-year periods. The Trustees considered the materials presented throughout the year and based their decision on that information, including the most recent evaluation of Sit’s investment staff, portfolio management process and fund performance. The Trustees considered the factors discussed below among others. No single factor determined whether or not the agreement would be renewed but rather the totality of factors considered was determinative. Nature, Extent and Quality of Services Provided The Trustees considered the depth, experience and organizational stability of the Sit organization. Sit and its affiliates have been managing investment portfolios since 1981 with total assets under management of $6.3 billion and $3.8 billion in fixed income. Sit is a stable, well-capitalized organization and has had no ownership changes. Mr. Michael C. Brilley, President and Senior Fixed Income Officer and manager of the fund, has been in the investment management business for over 38 years and has been with Sit since 1984. Mr. Paul J. Jungquist, Vice President and Senior Fixed Income Portfolio Manager and Fixed Income Credit Analyst and co-manager of the fund has been with Sit since 1994. He specializes in non-rated securities. The portfolio managers adhere to a research intensive, sound, and disciplined investment process which, as discussed below, has resulted in competitive investment returns at a level of volatility well below that of both the fund’s peers and its comparison indices. The Trustees also considered reports presented to them which demonstrate Sit’s compliance with both its and the fund’s |
compliance polices and procedures and codes of ethics. Based on their analysis of the data presented, the Trustees concluded that they were pleased with the nature and quality of the services provided. Investment Performance The Trustees considered the fund’s performance in the short and intermediate terms as well as since inception. They compared the fund’s performance to relevant benchmarks and peer groups and noted that the combined risk-adjusted returns have consistently met or exceeded expectations. They paid particular attention to the performance reports prepared for their considerations by the fund’s transfer agent and shareholder service provider that demonstrated solid relative and absolute performance. Cost of Services The Trustees made a comparative analysis of the fund’s subadvisory fee relative to similar tax-exempt bond funds as well as other institutional investment accounts. The Trustees noted that management fees charged by most advisers directly managing a fund’s portfolio (i.e. not via hiring a subadviser to manage the portfolio) also cover significant administrative services not required of Sit. Sit charges a fee based on assets under management on a sliding scale ranging from 40 basis points on the first $20 million under management to 20 basis points on assets in excess of $75 million. The management expense as a percentage of average assets under management in 2005, the time period examined by the Trustees, was 26 basis points or 0.26%. The Trustees relied on presentations by the fund’s transfer agent and shareholder servicing provider comparing Sit’s management fee to its relevant peer groups both within the investment company universe and within the institutional investor universe in general. Such presentations relied upon published reports from Morningstar. This analysis led the Trustees to determine that the fees charged to the fund were fair and reasonable in light of the high quality services provided. Additionally, the Trustees relied, in making their decision, on Sit’s representation that no client with a similar account was being charged a lesser fee. The Trustees also noted that the fee charged by Sit when combined with all other fund expenses resulted in an overall expense ratio to the fund of 0.48% of average net assets versus the industry average for tax exempt bond mutual funds of 0.80% according to fund analysis company Morningstar, Inc. Management Profitability The Trustees did not consider the profitability of Sit resulting from its relationship with the fund. The fund’s situation is different from that where the portfolio is managed by the sole adviser, which established, promotes and markets the fund as a method of increasing its assets under management and, therefore, its profitability. Sit is an independent firm and the advisory fee charged is the result of arms length bargaining between Sit and the fund’s adviser under the supervision of the Trustees. Economies of Scale The Trustees considered whether the fund could enjoy economies of scale as it grows as a result of Sit realizing economies of scale. They found that there was some room in the current fee schedule for Sit’s fee, as a percentage of assets under management, to go down as a growing asset base moves the overall percentage down from the current 26 basis points towards 20 basis points. The Trustees determined that further economies of scale resulting from the relationship with Sit were not a major consideration given that the relationship is the result of arms length bargaining, most of the economies of scale |
| have already been realized and that the fee is already low—especially in light of the quality of service provided. |
|
| EXECUTIVE OFFICERS AND TRUSTEES |
| |
| Information About the Funds’ Independent trustees |
| |
Name, Address,
and Age | | Positions Held
with the Funds | | Term of Office
and Length of
Time Served | | Principal
Occupation(s)
During the Last 5
Years | | Number of
Portfolios in the
Fund Complex
Overseen by the
Trustee | | Other
Directorships Held
by the Trustee | |
| |
Lucy R. Jones(64)
30 East 7th Street,
Saint. Paul,
Minnesota 55101 | | Trustee | | Tenure: 5 yrs
Term:
Indefinite | | Private Investor | | 3 | | None | |
| | |
Lawrence H.King (49) 1
30 East 7th Street,
Saint, Paul,
Minnesota 55101 | | Trustee | | Tenure: 5 yrs
Term:
Indefinite | | President and
Chief Executive
Officer,
Treessentials,
Co., (nursery
supplies, 1989-
Present) | | 3 | | None | |
| | |
Charles W.
Rasmussen (38) 1
30 East 7th Street, Saint. Paul, Minnesota 55101 | | Trustee | | Tenure:5 yrs
Term:
Indefinite | | President and
Chief Executive
Officer, P&G Manufacturing,
Inc. (air filtration
equipment, 2002-
Present);
Financial
Analyst, U.S.
Bank, N.A. (1998
2001); | | 3 | | None | |
| | |
Laura E.
Rasmussen (42) 1
30 East 7th Street,
Saint. Paul,
Minnesota 55101 | | Trustee | | Tenure:5 yrs
Term:
Indefinite | | Private Investor | | 3 | | None | |
| |
| 1 Mr. King, Mr. Rasmussen and Ms. Rasmussen are spouses-in-law, and are all nieces or nephews of Mr.Weyerhaeuser (see below). |
| Information About the Funds’ Officers and Interested Trustee |
| |
Name, Address,
and Age | | Positions Held
with the Funds | | Term of Office
and Length of
Time Served | | Principal
Occupation(s)
During the Last 5
Years | | Number of
Portfolios in the
Fund Complex
Overseen by the
Trustee | | Other
Directorships Held
by the Trustee | |
| |
Philip W.
Pascoe (59)
1145 Broadway
Plaza, P.O. Box
1278, Tacoma,
Washington 98402 | | President and
Chief Executive
Officer,
Treasurer | | Tenure: 8 yrs
Term Expires:
December
2006 | | Chairman and
Chief Executive
Officer,
Treasurer,
Clearwater
Management
Company (1997-
Present)
Managing
Director, U.S.
Bank-Piper
Jaffray, Inc.
(1996-Present) | | N/A | | None | |
| | | | | | | | | | | | |
Frederick T.
Weyerhaeuser
(74) 1
30 East 7th Street,
Saint. Paul,
Minnesota 55101 | | Trustee, Vice
President and
Secretary | | As Trustee;
Tenure: 18 yrs
Term:
Indefinite
As Officer;
Tenure: 5 yrs
Term Expires:
December,
2006 | | Private Investor | | 3 | | Minnesota
Mutual Life
Insurance Co. and
Subsidiaries
(1968-2001)
Potlatch
Corporation
(1960-2003) | |
| |
| 1 Mr. Weyerhaeuser is an interested trustee due to his daughter’s position as a director of Clearwater Management Company, the Funds’ adviser. |
| KPMG LLP |
| | 4200 Wells Fargo Center
90 South Seventh Street
Minneapolis, MN 55402 |
| |
Report of Independent Registered Public Accounting Firm The Board of Trustees and Shareholders
Clearwater Investment Trust: We have audited the accompanying statements of assets and liabilities, including the schedules of investments, of Clearwater Growth Fund, Clearwater Small Cap Fund, and Clearwater Tax Exempt Bond Fund (funds within Clearwater Investment Trust) (the Funds) as of December 31, 2005, and the related statements of operations for the year then ended, the statements of changes in net assets for each of the years in the two-year period then ended, and the financial highlights for each of the years in the five-year period then ended. These financial statements and the financial highlights are the responsibility of the Funds’ management. Our responsibility is to express an opinion on these financial statements and financial highlights based on our audits. We conducted our audits in accordance with the standards of the Public Company Accounting Oversight Board (United States). Those standards require that we plan and perform the audits to obtain reasonable assurance about whether the financial statements and the financial highlights are free of material misstatement. An audit includes examining, on a test basis, evidence supporting the amounts and disclosures in the financial statements. Our procedures included confirmation of securities owned as of December 31, 2005, by correspondence with the custodian and brokers or by other appropriate auditing procedures where replies from brokers were not received. An audit also includes assessing the accounting principles used and significant estimates made by management, as well as evaluating the overall financial statement presentation. We believe that our audits provide a reasonable basis for our opinion. In our opinion, the financial statements and the financial highlights referred to above present fairly, in all material respects, the financial position of Clearwater Growth Fund, Clearwater Small Cap Fund, and Clearwater Tax Exempt Bond Fund at December 31, 2005, the results of their operations for the year then ended, the changes in their net assets for each of the years in the two-year period then ended, and the financial highlights for each of the years in the five-year period then ended, in conformity with U.S. generally accepted accounting principles. |
| |
|
| |
| February 27, 2006 |
| CLEARWATER INVESTMENT TRUST |
| Statement of Assets and Liabilities |
| December 31, 2005 |
| |
| Assets | Growth
Fund | | Small Cap
Fund | | Tax-Exempt
Bond Fund | |
|---|
| |
| |
| |
| |
|---|
Investments in securities, at fair value
(identified cost: $138,555,137 Growth Fund;
$205,556,505 Small Cap Fund; $223,363,874
Tax-Exempt Bond Fund) | $ | 232,483,733 | | | 235,448,020 | | | 222,652,176 | |
| Receivable for securities sold | | — | | | 936,373 | | | 1,008,547 | |
| Accrued dividend and interest receivable | | 302,752 | | | 239,505 | | | 3,475,731 | |
| |
| |
| |
| |
| Total assets | | 232,786,485 | | | 236,623,898 | | | 227,136,454 | |
| |
| |
| |
| |
| Liabilities | | | | | | | | | |
| Payables for investment securities purchased | | — | | | 935,833 | | | 1,068,208 | |
| Payables for fund shares redeemed | | — | | | — | | | 335,457 | |
| Dividend distribution payable | | 3,216,075 | | | 31,690,587 | | | — | |
| Accrued investment advisory fee | | 199,661 | | | 646,754 | | | 257,069 | |
| |
| |
| |
| |
| Total liabilities | | 3,415,736 | | | 33,273,174 | | | 1,660,734 | |
| |
| |
| |
| |
| Net assets | $ | 229,370,749 | | | 203,350,724 | | | 225,475,720 | |
| |
| |
| |
| |
| Capital | | | | | | | | | |
Capital stock and additional paid-in capital
(authorized unlimited number of shares at no
par value for each Fund: outstanding
8,811,164, 11,239,391, and 22,544,490
shares, respectively) | $ | 141,945,034 | | | 173,177,274 | | | 227,183,967 | |
| Undistributed net investment income | | 31,910 | | | — | | | — | |
| Accumulated net realized gain (loss) | | (6,534,791 | ) | | 281,935 | | | (996,549 | ) |
Unrealized appreciation (depreciation) of
investments | | 93,928,596 | | | 29,891,515 | | | (711,698 | ) |
| |
| |
| |
| |
| Net assets | $ | 229,370,749 | | | 203,350,724 | | | 225,475,720 | |
| |
| |
| |
| |
Net asset value per share of outstanding
capital stock | $ | 26.03 | | | 18.09 | | | 10.00 | |
| |
| See accompanying notes to financial statements. |
| CLEARWATER INVESTMENT TRUST |
| Statement of Operations |
| Year ended December 31, 2005 |
| |
| Growth
Fund | | Small Cap
Fund | | Tax-Exempt
Bond Fund | |
|---|
| |
| |
| |
| |
|---|
| Investment income: | | | | | | | | | |
| Income: | | | | | | | | | |
Dividends (net of foreign taxes withheld
of $3,456, $5,962, and $0, respectively) | $ | 3,955,472 | | | 1,743,528 | | | 95,211 | |
| Interest | | 42,577 | | | 326,314 | | | 10,610,470 | |
| |
| |
| |
| |
| Total income | | 3,998,049 | | | 2,069,842 | | | 10,705,681 | |
| |
| |
| |
| |
| Expenses: | | | | | | | | | |
| Investment advisory fee | | 962,327 | | | 2,951,825 | | | 1,223,911 | |
| Voluntary fee reduction | | (203,933 | ) | | (461,485 | ) | | (251,006 | ) |
| |
| |
| |
| |
| Total expenses | | 758,394 | | | 2,490,340 | | | 972,905 | |
| |
| |
| |
| |
| Net investment income (loss) | | 3,239,655 | | | (420,498 | ) | | 9,732,776 | |
| |
| |
| |
| |
| Realized and unrealized gain (loss) on investments: | | | | | | | | | |
| Net realized gain (loss) on security transactions | | (183,070 | ) | | 32,094,771 | | | (619,037 | ) |
Unrealized appreciation (depreciation) during
the period | | 9,638,336 | | | (12,414,271 | ) | | 127,766 | |
| |
| |
| |
| |
| Net gain (loss) on investments | | 9,455,266 | | | 19,680,500 | | | (491,271 | ) |
| |
| |
| |
| |
Net increase in net assets
from operations | $ | 12,694,921 | | | 19,260,002 | | | 9,241,505 | |
| |
| |
| |
| |
| |
| See accompanying notes to financial statements. |
| CLEARWATER INVESTMENT TRUST |
| Statements of Changes in Net Assets |
| Years ended December 31, 2005 and 2004 |
| |
| | Growth Fund | | Small Cap Fund | | Tax-Exempt Bond Fund | |
|---|
| |
| |
| |
| |
|---|
| 2005 | | 2004 | | 2005 | | 2004 | | 2005 | | 2004 | |
|---|
| |
| |
| |
| |
|---|
| Operations: | | | | | | | | | | | | | | | | | | |
| Net investment income (loss) | $ | 3,239,655 | | | 2,774,359 | | | (420,498 | ) | | (752,415 | ) | | 9,732,776 | | | 7,549,656 | |
| Net realized gain (loss) on investments | | (183,070 | ) | | 621,018 | | | 32,094,771 | | | 31,067,069 | | | (619,037 | ) | | (75,650 | ) |
Unrealized appreciation (depreciation)
during the period | | 9,638,336 | | | 16,565,669 | | | (12,414,271 | ) | | 5,546,030 | | | 127,766 | | | (1,328,408 | ) |
| |
| |
| |
| |
| |
| |
| |
Net increase in net assets
from operations | | 12,694,921 | | | 19,961,046 | | | 19,260,002 | | | 35,860,684 | | | 9,241,505 | | | 6,145,598 | |
| |
| |
| |
| |
| |
| |
| |
| Distributions to shareholders from: | | | | | | | | | | | | | | | | | | |
| Net investment income | | (3,216,075 | ) | | (2,783,568 | ) | | — | | | — | | | (9,733,198 | ) | | (7,549,234 | ) |
| Net realized gain on investments | | — | | | — | | | (31,690,587 | ) | | (30,186,395 | ) | | — | | | — | |
| |
| |
| |
| |
| |
| |
| |
Total distributions to
shareholders | | (3,216,075 | ) | | (2,783,568 | ) | | (31,690,587 | ) | | (30,186,395 | ) | | (9,733,198 | ) | | (7,549,234 | ) |
| |
| |
| |
| |
| |
| |
| |
| Capital share transactions: | | | | | | | | | | | | | | | | | | |
| Proceeds from shares sold | | 30,664,800 | | | 33,598,830 | | | 16,045,384 | | | 47,116,133 | | | 34,462,703 | | | 52,394,888 | |
Reinvestment of distributions from net
investment income and gain | | — | | | 2,783,568 | | | — | | | 30,186,395 | | | 9,733,198 | | | 7,549,234 | |
| Payments for shares redeemed | | (13,352,717 | ) | | (1,440,546 | ) | | (13,536,726 | ) | | (7,793,470 | ) | | (6,905,680 | ) | | (4,344,198 | ) |
| |
| |
| |
| |
| |
| |
| |
Increase in net assets from
capital shares transactions | | 17,312,083 | | | 34,941,852 | | | 2,508,658 | | | 69,509,058 | | | 37,290,221 | | | 55,599,924 | |
| |
| |
| |
| |
| |
| |
| |
Total increase (decrease) in
net assets | | 26,790,929 | | | 52,119,330 | | | (9,921,927 | ) | | 75,183,347 | | | 36,798,528 | | | 54,196,288 | |
| Net assets: | | | | | | | | | | | | | | | | | | |
| At the beginning of the year | | 202,579,820 | | | 150,460,490 | | | 213,272,651 | | | 138,089,304 | | | 188,677,192 | | | 134,480,904 | |
| |
| |
| |
| |
| |
| |
| |
| At the end of the year | $ | 229,370,749 | | | 202,579,820 | | | 203,350,724 | | | 213,272,651 | | | 225,475,720 | | | 188,677,192 | |
| |
| |
| |
| |
| |
| |
| |
| Undistributed net investment income | $ | 31,910 | | | 8,330 | | | — | | | — | | | — | | | 422 | |
| |
| See accompanying notes to financial statements. |
| CLEARWATER INVESTMENT TRUST |
| Notes to Financial Statements |
December 31, 2005 |
| |
| (1) | Organization |
| | |
| | Clearwater Investment Trust (the Trust) was established on January 12, 1987 as a Massachusetts business trust and is registered under the Investment Company Act of 1940 (as amended) as a diversified open end management investment company and presently includes three series of funds: Clearwater Growth Fund, Clearwater Small Cap Fund, and Clearwater Tax Exempt Bond Fund (the Funds). The Trust’s declaration of trust permits the board of directors to create additional funds in the future. The investment objective of the Clearwater Growth and Small Cap Funds is long term capital growth. The investment objective of the Clearwater Tax Exempt Bond Fund is high current income that is exempt from federal income tax, consistent with preservation of capital. |
| |
| | The Clearwater Growth Fund is passively managed to track but not replicate the Russell 1000 Index, an unmanaged, capitalization weighted index of the largest 1000 public companies in the United States. The fund is managed so that its holdings match the holdings of the Index as closely as possible while attempting to minimize the realization of taxable gains. This means that the fund will not buy and sell securities to match changes in the composition of securities in the Index. Instead, the fund’s portfolio is adjusted periodically to reflect the holdings and weightings of the Index, but only after consideration of the Fund’s policy to minimize realization of taxable gains. |
| |
| | The Clearwater Small Cap Fund invests primarily in equity securities of issuers with market capitalizations, at the time of investment, no greater than the range of capitalizations of the companies included in the Russell 2000 Index, an unmanaged, capitalization weighted index of the largest 3000 public companies in the United States less the largest 1000 tracked by the Russell 1000 Index. |
| |
| | The Clearwater Tax Exempt Bond Fund invests at least 80% of its assets in municipal securities, which are debt obligations issued by or for the U.S. states, territories and possessions, and the District of Columbia. The interest on these securities is generally exempt from regular federal income tax and may also be exempt from federal alternative minimum tax. However, the Fund may invest up to 20% of its assets in securities that generate interest income subject to federal alternative minimum tax. |
| (2) | Summary of Significant Accounting Policies |
| | |
| | The significant accounting policies followed by the Funds are as follows: |
| |
| (a) | Investments in Securities |
| | |
| | Investments in equity securities are valued at the last sales price on the principal exchange or market where they are traded. Equity securities which have not traded on the date of valuation or securities for which sales prices are not generally reported are valued at the mean between the last bid and asked prices. Debt securities maturing more than 60 days from the valuation date are valued at the market price supplied by an independent pricing vendor; those securities with maturities of less than 60 days when acquired, or which subsequently are within 60 days of maturity, are valued at amortized cost, which approximates fair value. Securities for which no market quotations are readily available (including those the trading of which has been suspended) will be valued at fair value as determined in good faith by the board of trustees, although the actual computations may be made by persons acting pursuant to the direction of the board. |
| CLEARWATER INVESTMENT TRUST |
| Notes to Financial Statements |
December 31, 2005 |
| |
| | Security transactions are accounted for on the date the securities are purchased or sold. Realized gains and losses are calculated on an identified cost basis. Dividend income is recognized on the ex dividend date and interest income, including amortization of original issue discount and premium, is accrued daily. |
| |
| | The Trust’s policy is to comply with the requirements of the Internal Revenue Code applicable to regulated investment companies. On a calendar year basis the Funds intend to distribute substantially all of their net investment income and realized gains, if any, to avoid the payment of federal income and excise taxes. Therefore, no income tax provision is required. Each fund is treated as a separate entity for federal income tax purposes. |
| |
| | Net investment income and net realized gains (losses) for the funds may differ for financial statement and tax purposes. The character of distributions made during the year from net investment income or net realized gains may differ from their ultimate characterization for federal income tax purposes. Also, due to the timing of dividend distributions, the fiscal year in which amounts are distributed may differ from the year that the income or realized gains (losses) were recorded by the funds. The tax character of distributions paid during the years ended December 31, 2004 and 2005 was as follows: |
| | |
| | Tax-exempt | | Ordinary income | | Long-term
capital gain | |
|---|
| |
| |
| |
| |
|---|
| | 2004 | | 2005 | | 2004 | | 2005 | | 2004 | | 2005 | |
|---|
| |
| |
| |
| |
| |
| |
| |
|---|
| | Growth Fund | $ | — | | — | | 2,783,568 | | 3,216,075 | | — | | — | |
| | Small Cap Fund | | — | | — | | 6,075,318 | | 4,659,852 | | 24,111,077 | | 27,030,735 | |
| | Tax-Exempt Bond Fund | | 7,429,240 | | 9,652,012 | | 119,994 | | 81,186 | | — | | — | |
| |
| | As of December 31, 2005, the components of distributable earnings on a tax basis were as follows: |
| | |
| | | Clearwater
Growth Fund | | Clearwater
Small Cap Fund | | Clearwater
Tax-Exempt
Bond Fund | |
|---|
| | |
| |
| |
| |
|---|
| | Undistributed ordinary income | $ | 31,910 | | | 229,367 | | | — | |
| | Undistributed capital gain | | — | | | 500,258 | | | — | |
| | Accumulated capital losses | | (6,534,791 | ) | | — | | | (996,549 | ) |
| | Unrealized appreciation (depreciation) | | 93,928,596 | | | 29,443,825 | | | (711,698 | ) |
| | |
| |
| |
| |
| | Total | $ | 87,425,715 | | | 30,173,450 | | | (1,708,247 | ) |
| | |
| |
| |
| |
| CLEARWATER INVESTMENT TRUST |
| Notes to Financial Statements |
December 31, 2005 |
| |
| | On the statements of assets and liabilities, due to permanent book-to-tax differences, the following adjustments have been made: |
| |
| | | Clearwater
Growth Fund | | Clearwater
Small Cap Fund | | Clearwater
Tax-Exempt
Bond Fund | |
|---|
| | |
| |
| |
| |
|---|
| | Undistributed net income | $ | — | | | 420,498 | | | — | |
| | Accumulated net realized gains | | — | | | (420,498 | ) | | — | |
| | Additional paid-in capital | | — | | | — | | | — | |
| (c) | Distributions to Shareholders |
| | |
| | Distributions to shareholders from net investment income, if any, are declared annually for the Clearwater Growth and Small Cap Funds and declared daily, payable monthly, for the Clearwater Tax Exempt Bond Fund. Distributions to shareholders from net realized gains, if any, are declared annually for all Funds. Distributions are paid in cash or reinvested in additional shares. |
| |
| | The preparation of financial statements in conformity with accounting principles generally accepted in the United States of America requires management to make estimates and assumptions that affect the reported amounts of assets and liabilities and disclosure of contingent assets and liabilities at the date of the financial statements and the reported amounts of increase and decrease in net assets from operations during the period. Actual results could differ from those estimates. |
| (3) | Investment Security Transactions |
| | |
| | Cost of purchases and proceeds from sales of securities, other than temporary investments in short term securities, for the year ended December 31, 2005, were as follows: |
| | |
| | Purchases | | Sales | |
|---|
| |
| |
| |
|---|
| | Clearwater Growth Fund | $ | 29,215,890 | | | 12,326,951 | |
| | Clearwater Small Cap Fund | | 155,362,986 | | | 167,082,585 | |
| | Clearwater Tax-Exempt Bond Fund | | 115,821,862 | | | 83,037,200 | |
| CLEARWATER INVESTMENT TRUST |
| Notes to Financial Statements |
December 31, 2005 |
| |
| (4) | Capital Share Transactions |
| | |
| | Transactions in shares of each fund for the years ended December 31, 2005 and 2004 were as follows: |
| | |
| | Clearwater Growth Fund | | Clearwater Small Cap Fund | |
|---|
| |
| |
| |
|---|
| | 2005 | | 2004 | | 2005 | | 2004 | |
|---|
| |
| |
| |
| |
| |
|---|
| | Sold | | 1,222,595 | | | 1,434,027 | | | 839,490 | | | 2,443,810 | |
| | Issued for reinvested distributions | | — | | | 111,655 | | | — | | | 1,577,137 | |
| | Redeemed | | (538,106 | ) | | (59,646 | ) | | (741,221 | ) | | (406,861 | ) |
| | |
| |
| |
| |
| |
| | Increase | | 684,489 | | | 1,486,036 | | | 98,269 | | | 3,614,086 | |
| | |
| |
| |
| |
| |
| | | | | | | | | | |
| | Clearwater Tax-Exempt
Bond Fund | | | | | |
|---|
| |
| | | | | |
|---|
| | 2005 | | 2004 | | | | | |
|---|
| |
| |
| | | | | |
|---|
| | Sold | | 3,443,664 | | | 5,260,674 | | | | | | | |
| | Issued for reinvested distributions | | 972,555 | | | 750,244 | | | | | | | |
| | Redeemed | | (689,986 | ) | | (487,731 | ) | | | | | | |
| | |
| |
| | | | | | | |
| | Increase | | 3,726,233 | | | 5,523,187 | | | | | | | |
| | |
| |
| | | | | | | |
| (5) | Capital Loss Carry Over |
| | |
| | For federal income tax purposes, the Clearwater Growth Fund and Clearwater Tax Exempt Bond Fund have capital loss carryovers of $6,534,791 and $996,549, respectively, at December 31, 2005, which, if not offset by subsequent capital gains, will expire as follows: |
| | |
| | Year of
expiration | | Clearwater
Growth Fund | | Clearwater
Tax-Exempt
Bond Fund | |
|---|
| |
| |
| |
| |
|---|
| | 2010 | | $ | 6,351,721 | | | — | |
| | 2011 | | | — | | | 301,862 | |
| | 2012 | | | — | | | 75,650 | |
| | 2013 | | | 183,070 | | | 619,037 | |
| | | |
| |
| |
| | Total | | $ | 6,534,791 | | | 996,549 | |
| | | |
| |
| |
| CLEARWATER INVESTMENT TRUST |
| Notes to Financial Statements |
December 31, 2005 |
| |
| (6) | Expenses and Related Party Transactions |
| | |
| | The Trust has a contract for investment advisory services with Clearwater Management Company, a management firm of which the Trust’s President and Treasurer is a shareholder. Under terms of an agreement, Clearwater Growth Fund, Clearwater Small Cap Fund, and Clearwater Tax Exempt Bond Fund pay a fee equal to an annual rate of 0.45%, 1.35%, and 0.60% of average net assets, respectively. Clearwater Management Company is responsible for the payment or reimbursement of all the Funds’ expenses, except brokerage, taxes, interest, and extraordinary expenses. On July 1, 2002 Clearwater Management Company voluntarily reduced the fees paid by the funds to 0.39%, 1.33%, and 0.56%, respectively. Effective April 1, 2004 Clearwater Management Company made an additional voluntary fee reduction to 0.37%, 1.20%, and 0.50%, respectively. Effective April 1, 2005 Clearwater Management Company voluntarily reduced the fees paid by the funds to 0.35%, 1.12%, and 0.47%, respectively. These voluntary fee reductions may be discontinued at any time. |
| |
| | The management firm has entered into a sub advisory contract with an independent investment advisory firm for each fund to provide daily investment management services. The sub advisory fee for the Clearwater Growth Fund, payable to Parametric Portfolio Associates, is equal to an annual rate of 0.15% of net assets. The sub advisory fee for the Clearwater Small Cap Fund, payable to Kennedy Capital Management, Inc., is equal to an annual rate of 0.85% of the first $50 million in net assets and then decreasing to 0.80% of net assets in excess of $50 million. The sub advisory fee for the Clearwater Tax Exempt Bond Fund, payable to Sit Fixed Income Advisers II, LLC, is equal to an annual rate of 0.40% on the first $20 million in net assets and then decreasing in reduced percentages to 0.20% of net assets in excess of $75 million. |
| CLEARWATER INVESTMENT TRUST |
| Notes to Financial Statements |
December 31, 2005 |
| |
| (7) | Financial Highlights |
| | |
| | Per share data (rounded to the nearest cent) for a share of capital stock outstanding throughout the years and selected information for each year is as follows: |
| | |
| | | Year ended December 31 | |
|---|
| | |
| |
|---|
| Clearwater Growth Fund | | 2005 | | 2004 | | 2003 | | 2002 | | 2001 | |
|---|
|
| |
| |
| |
| |
| |
| |
|---|
| | Net asset value, beginning of year | | $ | 24.93 | | | 22.66 | | | 17.70 | | | 23.07 | | | 26.86 | |
| | Income from investment operations: | | | | | | | | | | | | | | | | |
| | Net investment income | | | 0.37 | | | 0.38 | | | 0.27 | | | 0.23 | | | 0.19 | |
| | Net realized and unrealized
gain (loss) | | | 1.10 | | | 2.24 | | | 4.95 | | | (5.37 | ) | | (3.73 | ) |
| | | |
| |
| |
| |
| |
| |
| | Total from investment
operations | | | 1.47 | | | 2.62 | | | 5.22 | | | (5.14 | ) | | (3.54 | ) |
| | | |
| |
| |
| |
| |
| |
| | Less distributions: | | | | | | | | | | | | | | | | |
| | Dividends from net investment
income | | | (0.37 | ) | | (0.35 | ) | | (0.26 | ) | | (0.23 | ) | | (0.20 | ) |
| | Distributions from net realized
gains | | | — | | | — | | | — | | | — | | | (0.05 | ) |
| | | |
| |
| |
| |
| |
| |
| | Total distributions | | | (0.37 | ) | | (0.35 | ) | | (0.26 | ) | | (0.23 | ) | | (0.25 | ) |
| | | |
| |
| |
| |
| |
| |
| | Net asset value, end of year | | $ | 26.03 | | | 24.93 | | | 22.66 | | | 17.70 | | | 23.07 | |
| | | |
| |
| |
| |
| |
| |
| | Total return (a) | | | 5.9 | % | | 11.5 | % | | 29.5 | % | | (22.3 | )% | | (13.2 | )% |
| | Net assets, end of year
(000s omitted) | | $ | 229,371 | | | 202,580 | | | 150,460 | | | 103,981 | | | 132,792 | |
| | Ratio of expenses to average
net assets (b) | | | 0.36 | % | | 0.37 | % | | 0.39 | % | | 0.43 | % | | 0.45 | % |
| | Ratio of net investment income
to average net assets (b) | | | 1.52 | % | | 1.62 | % | | 1.40 | % | | 1.14 | % | | 0.80 | % |
| | Portfolio turnover rate (excluding
short-term securities) | | | 5.80 | % | | 1.52 | % | | 13.64 | % | | 31.40 | % | | 43.20 | % |
| | |
| (a) | Total return figures are based on the change in net asset value of a share during the period and assumes reinvestment of distributions at net asset value. |
| | |
| (b) | Total fund expenses are contractually limited to 0.45% of average daily net assets. However, during the years ended December 31, 2005, 2004, 2003, and 2002, the investment advisor voluntarily reduced management fees otherwise payable by the Fund. Had the fund incurred these expenses, the ratio of expenses to average daily net assets would have been 0.45%, 0.45%, 0.45%, and 0.45%, for the years ended December 31, 2005, 2004, 2003, and 2002, respectively, and the ratio of net investment income to average daily net assets would have been 1.43%, 1.54%, 1.34%, and 1.12%, respectively. |
| CLEARWATER INVESTMENT TRUST |
| Notes to Financial Statements |
December 31, 2005 |
| |
| | | Year ended December 31 | |
|---|
| | |
| |
|---|
| Clearwater Small Cap Fund | | 2005 | | 2004 | | 2003 | | 2002 | | 2001 | |
|---|
|
| |
| |
| |
| |
| |
| |
|---|
| | Net asset value, beginning of year | | $ | 19.14 | | | 18.35 | | | 13.11 | | | 14.61 | | | 13.01 | |
| | Income from investment operations: | | | | | | | | | | | | | | | | |
| | Net investment income (loss) | | | (0.04 | ) | | (0.09 | ) | | (0.02 | ) | | (0.01 | ) | | 0.11 | |
| | Net realized and unrealized
gains (losses) | | | 1.81 | | | 3.92 | | | 7.71 | | | (1.49 | ) | | 1.62 | |
| | | |
| |
| |
| |
| |
| |
| | Total from investment
operations | | | 1.77 | | | 3.83 | | | 7.69 | | | (1.50 | ) | | 1.73 | |
| | | |
| |
| |
| |
| |
| |
| | Less distributions: | | | | | | | | | | | | | | | | |
| | Distributions from net
investment income | | | — | | | — | | | — | | | — | | | (0.11 | ) |
| | Distributions from net
realized gains | | | (2.82 | ) | | (3.04 | ) | | (2.45 | ) | | — | | | (0.02 | ) |
| | | |
| |
| |
| |
| |
| |
| | Total distributions | | | (2.82 | ) | | (3.04 | ) | | (2.45 | ) | | — | | | (0.13 | ) |
| | | |
| |
| |
| |
| |
| |
| | Net asset value, end of year | | $ | 18.09 | | | 19.14 | | | 18.35 | | | 13.11 | | | 14.61 | |
| | | |
| |
| |
| |
| |
| |
| | Total return (a) | | | 9.2 | % | | 20.9 | % | | 58.7 | % | | (10.3 | )% | | 13.3 | % |
| | Net assets, end of year
(000s omitted) | | $ | 203,351 | | | 213,273 | | | 138,089 | | | 77,492 | | | 81,974 | |
| | Ratio of expenses to average
net assets (b) | | | 1.14 | % | | 1.24 | % | | 1.33 | % | | 1.34 | % | | 1.35 | % |
| | Ratio of net investment income
(loss) to average net assets (b) | | | (0.19 | )% | | (0.45 | )% | | (0.12 | )% | | (0.02 | )% | | 0.80 | % |
| | Portfolio turnover rate (excluding
short-term securities) | | | 73.65 | % | | 83.25 | % | | 100.82 | % | | 81.16 | % | | 117.75 | % |
| | |
| (a) | Total return figures are based on the change in net asset value of a share during the period and assumes reinvestment of distributions at net asset value. |
| | |
| (b) | Total fund expenses are contractually limited to 1.35% of average daily net assets. However, during the years ended December 31, 2005, 2004, 2003, and 2002, the investment advisor voluntarily reduced management fees otherwise payable by the Fund. Had the fund incurred these expenses, the ratio of expenses to average daily net assets would have been 1.35%, 1.35%, 1.35%, and 1.35%, for the years ended December 31, 2005, 2004, 2003, 2002, and respectively, and the ratio of net investment income (loss) to average daily net assets would have been (0.40)%, (0.56)%, (0.14)%, and (0.03)%, respectively. |
| CLEARWATER INVESTMENT TRUST |
| Notes to Financial Statements |
December 31, 2005 |
| |
| | | Year ended December 31 | |
|---|
| | |
| |
|---|
| Clearwater Tax-Exempt
Bond Fund | | 2005 | | 2004 | | 2003 | | 2002 | | 2001 | |
|---|
|
| |
| |
| |
| |
| |
| |
|---|
| | Net asset value, beginning of year | | $ | 10.03 | | | 10.12 | | | 10.24 | | | 10.14 | | | 10.28 | |
| | Income from investment operations: | | | | | | | | | | | | | | | | |
| | Net investment income | | | 0.48 | | | 0.50 | | | 0.53 | | | 0.58 | | | 0.59 | |
| | Net realized and unrealized gains | | | (0.03 | ) | | (0.10 | ) | | (0.12 | ) | | 0.12 | | | 0.02 | |
| | | |
| |
| |
| |
| |
| |
| | Total from investment
operations | | | 0.45 | | | 0.40 | | | 0.41 | | | 0.70 | | | 0.61 | |
| | | |
| |
| |
| |
| |
| |
| | Less distributions: | | | | | | | | | | | | | | | | |
| | Distributions from net
investment income | | | (0.48 | ) | | (0.49 | ) | | (0.53 | ) | | (0.58 | ) | | (0.59 | ) |
| | Distributions from net
realized gains | | | — | | | — | | | — | | | (0.02 | ) | | (0.16 | ) |
| | | |
| |
| |
| |
| |
| |
| | Total distributions | | | (0.48 | ) | | (0.49 | ) | | (0.53 | ) | | (0.60 | ) | | (0.75 | ) |
| | | |
| |
| |
| |
| |
| |
| | Net asset value, end of year | | $ | 10.00 | | | 10.03 | | | 10.12 | | | 10.24 | | | 10.14 | |
| | | |
| |
| |
| |
| |
| |
| | Total return (a) | | | 4.6 | % | | 4.1 | % | | 4.1 | % | | 7.1 | % | | 6.1 | % |
| | Net assets, end of year
(000s omitted) | | $ | 225,476 | | | 188,677 | | | 134,481 | | | 91,905 | | | 81,687 | |
| | Ratio of expenses to average
net assets (b) | | | 0.48 | % | | 0.51 | % | | 0.56 | % | | 0.58 | % | | 0.60 | % |
| | Ratio of net investment income
to average net assets (b) | | | 4.77 | % | | 4.84 | % | | 5.24 | % | | 5.69 | % | | 5.64 | % |
| | Portfolio turnover rate (excluding
short-term securities) | | | 41.39 | % | | 35.25 | % | | 39.84 | % | | 39.79 | % | | 43.23 | % |
| | |
| (a) | Total return figures are based on the change in net asset value of a share during the period and assumes reinvestment of distributions at net asset value. |
| | |
| (b) | Total fund expenses are contractually limited to 0.60% of average daily net assets. However, during the years ended December 31, 2005, 2004, 2003, and 2002, the investment advisor voluntarily reduced management fees otherwise payable by the Fund. Had the Fund incurred these expenses, the ratio of expenses to average daily net assets would have been 0.60%, 0.60%, 0.60%, and 0.60%, for the years ended December 31, 2005, 2004, 2003, and 2002, respectively, and the ratio of net investment income to average daily net assets would have been 4.65%, 4.75%, 5.20%, and 5.67%, respectively. |
CLEARWATER INVESTMENT TRUST
Schedule of Investments – Clearwater Growth Fund
December 31, 2005 |
| |
Face
amount
or shares | | Security | | Cost | | Market
value (a) | | Percent
of
net assets | |
| |
| |
| |
| |
| |
| Common stocks: | | | | | | | | | | |
| Consumer discretionary: | | | | | | | | | | |
| 2,300 | | | Abercrombie and Fitch Co | | $ | 50,218 | | 149,914 | | | |
| 4,450 | | | Amazon Com Inc (b) | | | 128,487 | | 209,818 | | | |
| 7,300 | | | American Eagle Outfitters Inc | | | 106,990 | | 167,754 | | | |
| 1,300 | | | American Greetings Corp | | | 24,681 | | 28,561 | | | |
| 1,400 | | | Applebees Intl Inc | | | 36,640 | | 31,626 | | | |
| 600 | | | Arvinmeritor Inc | | | 10,494 | | 8,634 | | | |
| 1,700 | | | Autoliv | | | 69,331 | | 77,214 | | | |
| 1,600 | | | Autonation Inc Del (b) | | | 30,080 | | 34,768 | | | |
| 900 | | | Autozone Inc (b) | | | 57,669 | | 82,575 | | | |
| 900 | | | Beazer Homes Usa Inc | | | 53,114 | | 65,556 | | | |
| 4,075 | | | Bed Bath & Beyond Inc (b) | | | 151,099 | | 147,311 | | | |
| 1,250 | | | Belo Corp | | | 18,688 | | 26,763 | | | |
| 6,900 | | | Best Buy Co Inc | | | 176,164 | | 300,012 | | | |
| 1,400 | | | Big Lots Inc (b) | | | 15,477 | | 16,814 | | | |
| 1,300 | | | Black & Decker Corporation | | | 44,208 | | 113,048 | | | |
| 3,500 | | | Blockbuster Inc | | | 24,441 | | 13,125 | | | |
| 4,344 | | | Blockbuster Inc | | | 29,935 | | 14,466 | | | |
| 1,300 | | | Borg Warner Inc | | | 63,383 | | 78,819 | | | |
| 1,600 | | | Brinker Intl Inc | | | 53,802 | | 61,856 | | | |
| 600 | | | Brunswick Corp | | | 25,608 | | 24,396 | | | |
| 3,525 | | | Cablevision Sys Corp (b) | | | 54,091 | | 82,732 | | | |
| 2,084 | | | Carmax Inc (b) | | | 50,984 | | 57,685 | | | |
| 330 | | | Cavco Inds Inc Del (b) | | | 815 | | 12,632 | | | |
| 922 | | | Cce Spinco Inc (b) | | | 11,423 | | 12,077 | | | |
| 6,600 | | | Centex Corp | | | 66,427 | | 471,834 | | | |
| 1,800 | | | Cheesecake Factory (b) | | | 58,968 | | 67,302 | | | |
| 3,300 | | | Chicos Fas Inc | | | 38,461 | | 144,969 | | | |
| 8,900 | | | Circuit City Stores Inc | | | 104,507 | | 201,051 | | | |
| 7,375 | | | Clear Channel Communications | | | 260,548 | | 231,944 | | | |
| 9,200 | | | Coach Inc | | | 107,172 | | 306,728 | | | |
| 2,525 | | | Comcast Corp New (b) | | | 60,521 | | 64,867 | | | |
| 36,045 | | | Comcast Corp New (b) | | | 980,646 | | 935,728 | | | |
| 7,800 | | | Costco Whsl Corp New | | | 237,671 | | 385,866 | | | |
| 1,450 | | | Cumulus Media Inc (b) | | | 19,523 | | 17,995 | | | |
| 6,533 | | | D R Horton Inc | | | 137,874 | | 233,424 | | | |
| 2,700 | | | Dana Corp | | | 42,762 | | 19,386 | | | |
| 2,800 | | | Darden Restaurants Inc | | | 65,099 | | 108,864 | | | |
| 17,423 | | | Directv Group Inc (b) | | | 258,330 | | 246,013 | | | |
| 3,893 | | | Discovery Hldg Co (b) | | | 45,381 | | 58,979 | | | |
| 33,900 | | | Disney Walt Co | | | 725,422 | | 812,583 | | | |
| 500 | | | Dolby Laboratories Inc (b) | | | 11,040 | | 8,525 | | | |
| 3,400 | | | Dollar Gen Corp | | | 67,631 | | 64,838 | | | |
| 500 | | | Dollar Tree Stores Inc (b) | | | 10,674 | | 11,970 | | | |
| 3,500 | | | Dow Jones & Co Inc | | | 153,562 | | 124,215 | | | |
| 4,300 | | | Eastman Kodak Co | | | 100,539 | | 100,620 | | | |
| 19,800 | | | Ebay Inc (b) | | | 238,866 | | 856,350 | | | |
| 4,300 | | | Echostar Communications Corp N (b) | | | 152,543 | | 116,831 | | | |
| 2,425 | | | Emmis Communications Corp (b) | | | 48,403 | | 48,282 | | | |
| 125 | | | Entercom Communications Corp (b) | | | 5,480 | | 3,709 | | | |
| 3,220 | | | Expedia Inc Del (b) | | | 67,385 | | 77,151 | | | |
| 2,000 | | | Family Dlr Stores Inc | | | 61,336 | | 49,580 | | | |
| 4,532 | | | Federated Dept Stores Inc De | | | 244,139 | | 300,608 | | | |
| 2,300 | | | Foot Locker Inc | | | 36,173 | | 54,257 | | | |
| 30,687 | | | Ford Mtr Co Del | | | 317,114 | | 236,904 | | | |
| 7,700 | | | Fortune Brands Inc | | | 266,191 | | 600,754 | | | |
| |
| See accompanying notes to financial statements. | 13 | (Continued) |
CLEARWATER INVESTMENT TRUST
Schedule of Investments – Clearwater Growth Fund
December 31, 2005 |
| |
Face
amount
or shares | | Security | | Cost | | Market
value (a) | | Percent
of
net assets | |
| |
| |
| |
| |
| |
| | 1,900 | | | Gamestop Corp New (b) | | $ | 15,311 | | 60,458 | | | |
| | 3,550 | | | Gannett Inc | | | 256,535 | | 215,024 | | | |
| | 9,664 | | | Gap Inc | | | 149,742 | | 170,473 | | | |
| | 4,000 | | | Gentex Corp | | | 80,251 | | 78,000 | | | |
| | 2,700 | | | Goodyear Tire and Rubber (b) | | | 46,926 | | 46,926 | | | |
| | 14,850 | | | Harley Davidson Inc | | | 87,002 | | 764,627 | | | |
| | 800 | | | Harman Intl Inds Inc New | | | 77,910 | | 78,280 | | | |
| | 800 | | | Harrahs Entmt Inc | | | 56,231 | | 57,032 | | | |
| | 1,675 | | | Hearst Argyle Television Inc | | | 39,947 | | 39,949 | | | |
| | 2,700 | | | Hilton Hotels Corp | | | 59,842 | | 65,097 | | | |
| | 42,525 | | | Home Depot Inc | | | 27,735 | | 1,721,412 | | | |
| | 5,300 | | | International Game Technology | | | 181,663 | | 163,134 | | | |
| | 5,400 | | | Interpublic Group Cos Inc (b) | | | 75,276 | | 52,110 | | | |
| | 3,050 | | | Johnson Ctls Inc | | | 124,850 | | 222,376 | | | |
| | 2,000 | | | Jones Apparel Group Inc | | | 71,021 | | 61,440 | | | |
| | 1,300 | | | KB Home | | | 47,442 | | 94,458 | | | |
| | 900 | | | Knight Ridder Inc | | | 63,990 | | 56,970 | | | |
| | 11,550 | | | Kohls Corp (b) | | | 92,211 | | 561,330 | | | |
| | 700 | | | Lamar Advertising Co (b) | | | 26,224 | | 32,298 | | | |
| | 1,750 | | | La Quinta Corp (b) | | | 3,605 | | 19,495 | | | |
| | 3,100 | | | Leggett & Platt Inc | | | 70,116 | | 71,176 | | | |
| | 2,000 | | | Lennar Corp | | | 89,295 | | 122,040 | | | |
| | 4,153 | | | Liberty Global Inc (b) | | | 74,890 | | 88,044 | | | |
| | 38,934 | | | Liberty Media Corp | | | 257,500 | | 306,411 | | | |
| | 10,290 | | | Limited Brands Inc | | | 118,493 | | 229,982 | | | |
| | 1,850 | | | Liz Claiborne Inc | | | 62,867 | | 66,267 | | | |
| | 12,800 | | | Lowes Cos Inc | | | 484,301 | | 853,248 | | | |
| | 11,950 | | | Marriott Intl Inc New | | | 98,796 | | 800,292 | | | |
| | 5,000 | | | Mattel Inc | | | 91,931 | | 79,100 | | | |
| | 1,500 | | | Maytag Corp | | | 15,000 | | 28,230 | | | |
| | 2,000 | | | Mcclatchy Co | | | 121,425 | | 118,200 | | | |
| | 21,600 | | | McDonalds Corp | | | 472,381 | | 728,352 | | | |
| | 6,590 | | | Mcgraw Hill Cos Inc | | | 245,481 | | 340,242 | | | |
| | 3,200 | | | Michaels Stores Inc | | | 39,160 | | 113,184 | | | |
| | 1,500 | | | Mohawk Inds Inc (b) | | | 119,605 | | 130,470 | | | |
| | 1 | | | New York Times Co | | | 41 | | 26 | | | |
| | 3,800 | | | Newell Rubbermaid Inc | | | 86,564 | | 90,364 | | | |
| | 35,575 | | | News Corp | | | 539,160 | | 553,191 | | | |
| | 3,100 | | | Nike Inc | | | 204,637 | | 269,049 | | | |
| | 5,000 | | | Nordstrom Inc | | | 52,596 | | 187,000 | | | |
| | 4,500 | | | Office Depot Inc (b) | | | 65,209 | | 141,300 | | | |
| | 3,300 | | | Officemax Inc Del | | | 114,939 | | 83,688 | | | |
| | 2,500 | | | Omnicom Group | | | 168,958 | | 212,825 | | | |
| | 1,300 | | | Outback Steakhouse Inc | | | 55,035 | | 54,093 | | | |
| | 400 | | | Pacific Sunwear of Calif (b) | | | 9,204 | | 9,968 | | | |
| | 1,200 | | | Penn Natl Gaming Inc | | | 43,968 | | 39,540 | | | |
| | 3,700 | | | Penney J C Inc | | | 142,894 | | 205,720 | | | |
| | 1,400 | | | Petsmart Inc | | | 35,894 | | 35,924 | | | |
| | 1,200 | | | Pixar | | | 59,041 | | 63,264 | | | |
| | 1,500 | | | Polo Ralph Lauren Corp | | | 31,320 | | 84,210 | | | |
| | 3,400 | | | Pulte Homes Inc | | | 97,827 | | 133,824 | | | |
| | 2,150 | | | Radio One Inc (b) | | | 28,969 | | 22,253 | | | |
| | 2,200 | | | Radioshack Corp | | | 53,701 | | 46,266 | | | |
| | 1,100 | | | Readers Digest Assn Inc | | | 15,807 | | 16,742 | | | |
| | 2,575 | | | Reebok Intl Ltd | | | 84,015 | | 149,942 | | | |
| | 3,000 | | | Regal Entmt Group | | | 55,920 | | 57,060 | | | |
| | 2,600 | | | Ross Stores Inc | | | 42,760 | | 75,140 | | | |
| | 800 | | | Ryland Group Inc | | | 43,093 | | 57,704 | | | |
| |
| See accompanying notes to financial statements. | 14 | (Continued) |
CLEARWATER INVESTMENT TRUST
Schedule of Investments – Clearwater Growth Fund
December 31, 2005 |
| |
Face
amount
or shares | | Security | | Cost | | Market
value (a) | | Percent
of
net assets | |
| |
| |
| |
| |
| |
| | 1,000 | | | Scholastic Corp (b) | | $ | 28,560 | | 28,510 | | | |
| | 600 | | | Scripps E W Co Oh | | | 23,112 | | 28,812 | | | |
| | 1,479 | | | Sears Hldgs Corp (b) | | | 113,477 | | 170,869 | | | |
| | 300 | | | Sherwin Williams Co | | | 9,570 | | 13,626 | | | |
| | 30,800 | | | Sirius Satellite Radio Inc (b) | | | 116,116 | | 206,360 | | | |
| | 700 | | | Snap On Inc | | | 17,991 | | 26,292 | | | |
| | 1,200 | | | Standard Pac Corp New | | | 46,716 | | 44,160 | | | |
| | 900 | | | Stanley Works | | | 27,855 | | 43,236 | | | |
| | 12,150 | | | Staples Inc | | | 173,534 | | 275,927 | | | |
| | 13,950 | | | Starbucks Corp | | | 212,771 | | 418,640 | | | |
| | 1,850 | | | Starwood Hotels & Resorts | | | 76,794 | | 118,141 | | | |
| | 800 | | | Station Casinos Inc | | | 54,064 | | 54,240 | | | |
| | 14,800 | | | Target Corp | | | 483,839 | | 813,556 | | | |
| | 3,000 | | | Tiffany & Co New | | | 86,618 | | 114,870 | | | |
| | 78,000 | | | Time Warner Inc New | | | 1,051,538 | | 1,360,320 | | | |
| | 7,600 | | | Tjx Cos Inc New | | | 140,575 | | 176,548 | | | |
| | 1,400 | | | Toll Bros Inc | | | 46,645 | | 48,496 | | | |
| | 2,600 | | | Tribune Co New | | | 116,790 | | 78,676 | | | |
| | 6,755 | | | Univision Communications Inc (b) | | | 202,257 | | 198,529 | | | |
| | 1,700 | | | V F Corp | | | 87,065 | | 94,078 | | | |
| | 24,778 | | | Viacom Inc | | | 931,087 | | 807,763 | | | |
| | 42,450 | | | Wal Mart Stores Inc | | | 2,039,724 | | 1,986,660 | | | |
| | 1,900 | | | Wendys Intl Inc | | | 82,930 | | 104,994 | | | |
| | 1,400 | | | Westwood One Inc | | | 30,596 | | 22,820 | | | |
| | 3,600 | | | Whirlpool Corp | | | 155,817 | | 301,536 | | | |
| | 800 | | | Wiley John & Son | | | 27,401 | | 31,232 | | | |
| | 1,000 | | | Williams Sonoma Inc (b) | | | 32,379 | | 43,150 | | | |
| | 3,700 | | | XM Satellite Radio Hldgs Inc (b) | | | 101,951 | | 100,936 | | | |
| | 5,008 | | | Yum Brands Inc | | | 105,346 | | 234,775 | | | |
| | 2,400 | | | Zale Corp New (b) | | | 39,515 | | 60,360 | | | |
| |
| |
| | | |
| | | | | | | | 18,917,350 | | 28,013,615 | | 12.22 | % |
| |
| |
| | | |
| | Consumer staples: | | | | |
| | 5,400 | | | Albertsons Inc | | | 108,529 | | 115,290 | | | |
| | 35,300 | | | Altria Group Inc | | | 743,178 | | 2,637,616 | | | |
| | 11,100 | | | Anheuser Busch Cos Inc | | | 514,176 | | 476,856 | | | |
| | 10,900 | | | Archer Daniels Midland Co | | | 201,692 | | 268,794 | | | |
| | 8,000 | | | Avon Prods Inc | | | 259,423 | | 228,400 | | | |
| | 1,800 | | | Brown Forman Corp | | | 70,069 | | 124,776 | | | |
| | 6,200 | | | Campbell Soup Co | | | 168,826 | | 184,574 | | | |
| | 37,400 | | | Coca Cola Co | | | 1,147,622 | | 1,507,594 | | | |
| | 4,200 | | | Coca Cola Enterprises Inc | | | 89,801 | | 80,514 | | | |
| | 7,200 | | | Colgate Palmolive Co | | | 360,616 | | 394,920 | | | |
| | 9,071 | | | Conagra Inc | | | 210,988 | | 183,960 | | | |
| | 2,788 | | | Constellation Brands Inc | | | 46,668 | | 73,129 | | | |
| | 13,000 | | | Cvs Corp | | | 222,593 | | 343,460 | | | |
| | 2,900 | | | Dean Foods Co New | | | 79,989 | | 109,214 | | | |
| | 5,773 | | | Del Monte Foods Co (b) | | | 57,723 | | 60,212 | | | |
| | 6,200 | | | General Mls Inc | | | 277,056 | | 305,784 | | | |
| | 5,575 | | | Heinz H J Co | | | 190,266 | | 187,989 | | | |
| | 2,600 | | | Hershey Co / The | | | 137,468 | | 143,650 | | | |
| | 1,300 | | | Hormel Foods Corp | | | 29,432 | | 42,484 | | | |
| | 4,100 | | | Kellogg Co | | | 179,871 | | 177,202 | | | |
| | 7,250 | | | Kimberly Clark Corp | | | 420,840 | | 432,463 | | | |
| | 3,700 | | | Kraft Foods Inc | | | 117,487 | | 104,118 | | | |
| | 14,400 | | | Kroger Co (b) | | | 246,089 | | 271,872 | | | |
| | 700 | | | Lauder Estee Cos Inc | | | 26,691 | | 23,436 | | | |
| | 4,100 | | | Loews Corp | | | 107,638 | | 180,359 | | | |
| |
| See accompanying notes to financial statements. | 15 | (Continued) |
CLEARWATER INVESTMENT TRUST
Schedule of Investments – Clearwater Growth Fund
December 31, 2005 |
| |
Face
amount
or shares | | Security | | Cost | | Market
value (a) | | Percent
of
net assets | |
| |
| |
| |
| |
| |
| | 1,600 | | | Mccormick & Co Inc | | $ | 55,297 | | 49,472 | | | |
| | 700 | | | Molson Coors Brewing Co | | | 40,917 | | 46,893 | | | |
| | 1,000 | | | Nbty Inc (b) | | | 21,300 | | 16,250 | | | |
| | 2,400 | | | Pepsi Bottling Group Inc | | | 52,032 | | 68,664 | | | |
| | 29,841 | | | Pepsico Inc | | | 1,157,633 | | 1,763,006 | | | |
| | 70,189 | | | Procter and Gamble Co | | | 1,713,150 | | 4,062,539 | | | |
| | 7,819 | | | Safeway Inc | | | 151,258 | | 184,998 | | | |
| | 9,950 | | | Sara Lee Corp | | | 203,451 | | 188,055 | | | |
| | 1,300 | | | Smithfield Foods Inc (b) | | | 35,157 | | 39,780 | | | |
| | 1,400 | | | Smucker J M Co | | | 60,413 | | 61,600 | | | |
| | 4,000 | | | Supervalu Inc | | | 73,035 | | 129,920 | | | |
| | 10,600 | | | Sysco Corp | | | 216,956 | | 329,130 | | | |
| | 580 | | | Treehouse Foods Inc (b) | | | 14,071 | | 10,858 | | | |
| | 5,927 | | | Tyson Foods Inc (del) | | | 52,174 | | 101,352 | | | |
| | 2,900 | | | UST Inc | | | 80,807 | | 118,407 | | | |
| | 27,350 | | | Walgreen Co | | | 324,378 | | 1,210,511 | | | |
| | 2,400 | | | Whole Foods Mkt Inc | | | 64,365 | | 185,736 | | | |
| | 3,600 | | | Wrigley Wm Jr Co | | | 125,321 | | 239,364 | | | |
| |
| |
| | | |
| | | | | | | | 10,456,446 | | 17,465,201 | | 7.61 | % |
| |
| |
| | | |
| | Energy: | |
| | 1,973 | | | Anadarko Pete Corp | | | 83,637 | | 186,942 | | | |
| | 9,134 | | | Apache Corp | | | 389,377 | | 625,862 | | | |
| | 3,100 | | | Baker Hughes Inc | | | 131,015 | | 188,418 | | | |
| | 600 | | | BJ Svcs Co | | | 9,951 | | 22,002 | | | |
| | 9,488 | | | BP Plc (d) | | | 233,686 | | 609,319 | | | |
| | 10,900 | | | Burlington Res Inc | | | 178,458 | | 939,580 | | | |
| | 4,500 | | | Chesapeake Energy Corp | | | 43,650 | | 142,785 | | | |
| | 36,669 | | | Chevron Corp | | | 1,605,840 | | 2,081,699 | | | |
| | 16,738 | | | Conocophillips | | | 374,836 | | 973,817 | | | |
| | 6,212 | | | Devon Energy Corporation New | | | 181,860 | | 388,498 | | | |
| | 13,900 | | | El Paso Corp | | | 103,337 | | 169,024 | | | |
| | 1,100 | | | Ensco Intl Inc | | | 29,875 | | 48,785 | | | |
| | 8,500 | | | Eog Resources Inc | | | 80,824 | | 623,645 | | | |
| | 109,599 | | | Exxon Mobil Corp | | | 4,516,483 | | 6,156,176 | | | |
| | 6,700 | | | Halliburton Co | | | 253,180 | | 415,132 | | | |
| | 3,100 | | | Helmerich and Payne Inc | | | 82,265 | | 191,921 | | | |
| | 1,500 | | | Kerr Mcgee Corp | | | 134,850 | | 136,290 | | | |
| | 3,900 | | | Marathon Oil Corp | | | 154,479 | | 237,783 | | | |
| | 2,400 | | | Murphy Oil Corp | | | 32,055 | | 129,576 | | | |
| | 2,567 | | | National Oilwell Varco Inc (b) | | | 66,248 | | 160,951 | | | |
| | 5,800 | | | Noble Energy Inc | | | 74,136 | | 233,740 | | | |
| | 14,850 | | | Occidental Pete Corp | | | 278,632 | | 1,186,218 | | | |
| | 3,200 | | | Pioneer Nat Res Co | | | 48,507 | | 164,064 | | | |
| | 2,005 | | | Quicksilver Res Inc | | | 85,429 | | 84,230 | | | |
| | 8,400 | | | Schlumberger Ltd | | | 195,819 | | 816,060 | | | |
| | 2,200 | | | Smith Intl Inc | | | 38,951 | | 81,642 | | | |
| | 9,700 | | | Sunoco Inc | | | 109,369 | | 760,286 | | | |
| | 6,693 | | | Transocean Inc (b) | | | 107,342 | | 466,435 | | | |
| | 8,334 | | | Valero Energy Corp | | | 87,210 | | 430,034 | | | |
| | 9,060 | | | Williams Cos Inc | | | 101,393 | | 209,920 | | | |
| | 5,133 | | | XTO Energy Inc | | | 47,918 | | 225,544 | | | |
| |
| |
| | | |
| | | | | | | | 9,860,612 | | 19,086,378 | | 8.32 | % |
| |
| |
| | | |
| |
| See accompanying notes to financial statements. | 16 | (Continued) |
CLEARWATER INVESTMENT TRUST
Schedule of Investments – Clearwater Growth Fund
December 31, 2005 |
| |
Face
amount
or shares | | Security | | Cost | | Market
value (a) | | Percent
of
net assets | |
| |
| |
| |
| |
| |
| | Financials: | | | | | | | | |
| | 9,400 | | | Aetna Inc | | $ | 151,653 | | 886,514 | | | |
| | 9,150 | | | Aflac Inc | | | 280,728 | | 424,743 | | | |
| | 9,000 | | | Allied Cap Corp New | | | 196,349 | | 264,330 | | | |
| | 9,700 | | | Allstate Corp | | | 422,942 | | 524,479 | | | |
| | 8,000 | | | Amb Ppty Corp | | | 264,402 | | 393,360 | | | |
| | 1,300 | | | Ambac Finl Group Inc | | | 91,536 | | 100,178 | | | |
| | 17,675 | | | American Express Co | | | 636,717 | | 909,556 | | | |
| | 41,516 | | | American Intl Group Inc | | | 690,519 | | 2,832,637 | | | |
| | 8,200 | | | Americredit Corp (b) | | | 141,934 | | 210,166 | | | |
| | 3,535 | | | Ameriprise Finl Inc | | | 91,896 | | 144,935 | | | |
| | 4,200 | | | Ameritrade Hldg Corp New (b) | | | 63,455 | | 100,800 | | | |
| | 9,700 | | | Amsouth Bancorporation | | | 229,185 | | 254,237 | | | |
| | 4,800 | | | Aon Corp | | | 95,152 | | 172,560 | | | |
| | 1,400 | | | Apartment Invt & Mgmt Co | | | 45,341 | | 53,018 | | | |
| | 1,096 | | | Archstone Smith Tr | | | 38,818 | | 45,911 | | | |
| | 3,100 | | | Associated Banc Corp | | | 105,586 | | 100,905 | | | |
| | 10,200 | | | Astoria Finl Corp | | | 96,415 | | 299,880 | | | |
| | 71,664 | | | Bank Amer Corp | | | 2,228,759 | | 3,307,294 | | | |
| | 13,500 | | | Bank New York Inc | | | 365,609 | | 429,975 | | | |
| | 8,658 | | | BB&T Corp | | | 244,238 | | 362,857 | | | |
| | 1,100 | | | Bear Stearns Cos Inc | | | 56,969 | | 127,083 | | | |
| | 5,396 | | | Capital One Finl Corp | | | 301,438 | | 466,214 | | | |
| | 400 | | | Chicago Mercantile Exchange | | | 101,482 | | 146,996 | | | |
| | 2,100 | | | Chubb Corp | | | 129,882 | | 205,065 | | | |
| | 2,200 | | | Cigna Corp | | | 107,215 | | 245,740 | | | |
| | 2,756 | | | Cincinnati Finl Corp | | | 103,510 | | 123,149 | | | |
| | 2,300 | | | Cit Group Inc New | | | 61,304 | | 119,094 | | | |
| | 89,615 | | | Citigroup Inc | | | 1,954,603 | | 4,349,016 | | | |
| | 31,122 | | | Colonial Bancgroupinc | | | 705,860 | | 741,326 | | | |
| | 3,200 | | | Comerica Inc | | | 171,938 | | 181,632 | | | |
| | 2,400 | | | Commerce Bancorp Inc N J | | | 70,008 | | 82,584 | | | |
| | 5,200 | | | Conseco Inc (b) | | | 97,448 | | 120,484 | | | |
| | 8,798 | | | Countrywide Finl Corp | | | 134,491 | | 300,804 | | | |
| | 2,800 | | | Crescent Real Estate Equities | | | 46,204 | | 55,496 | | | |
| | 12,000 | | | E Trade Finl Corp (b) | | | 125,906 | | 250,320 | | | |
| | 6,000 | | | Equity Office Pptys Tr | | | 175,928 | | 181,980 | | | |
| | 5,016 | | | Equity Residential | | | 159,472 | | 196,226 | | | |
| | 8,600 | | | Erie Indty Co | | | 446,989 | | 457,520 | | | |
| | 17,950 | | | Federal Home Ln Mtg Corp | | | 54,545 | | 1,173,033 | | | |
| | 4,200 | | | Federal Natl Mtg Assn | | | 233,325 | | 205,002 | | | |
| | 3,800 | | | Fidelity Natl Finl Inc | | | 144,152 | | 139,802 | | | |
| | 665 | | | Fidelity Natl Title Group Inc | | | 16,027 | | 16,193 | | | |
| | 1,135 | | | Fifth Third Bancorp | | | 36,132 | | 42,812 | | | |
| | 8,450 | | | First Horizon Natl Corp | | | 255,733 | | 324,818 | | | |
| | 10,045 | | | Franklin Res Inc | | | 184,529 | | 944,330 | | | |
| | 4,200 | | | Friedman Billings Ramsey Group | | | 48,671 | | 41,580 | | | |
| | 1,800 | | | Gallagher Arthur J & Co | | | 55,152 | | 55,584 | | | |
| | 17,811 | | | General Growth Pptys Inc | | | 220,838 | | 836,939 | | | |
| | 1,800 | | | Genworth Finl Inc | | | 47,165 | | 62,244 | | | |
| | 4,669 | | | Golden West Finl Corp Del | | | 284,059 | | 308,154 | | | |
| | 5,526 | | | Goldman Sachs Group Inc | | | 500,812 | | 705,725 | | | |
| | 4,300 | | | Hartford Financial Svcs Grp | | | 226,822 | | 369,327 | | | |
| | 14,600 | | | Health Care Ppty Invs Inc | | | 253,278 | | 373,176 | | | |
| | 6,600 | | | Host Marriott Corp New | | | 109,132 | | 125,070 | | | |
| | 7,200 | | | Hrpt Pptys Tr | | | 69,192 | | 74,520 | | | |
| | 1,284 | | | Hsbc Hldgs Plc (d) | | | 64,775 | | 103,323 | | | |
| | 11,600 | | | Huntington Bancshares Inc | | | 253,776 | | 275,500 | | | |
| |
| See accompanying notes to financial statements. | 17 | (Continued) |
CLEARWATER INVESTMENT TRUST
Schedule of Investments – Clearwater Growth Fund
December 31, 2005 |
| |
Face
amount
or shares | | Security | | Cost | | Market
value (a) | | Percent
of
net assets | |
| |
| |
| |
| |
| |
| | 2,300 | | | Investment Technology Group (b) | | $ | 37,976 | | 81,512 | | | |
| | 800 | | | Investors Finl Services Corp | | | 30,725 | | 29,464 | | | |
| | 4,000 | | | Istar Finl Inc | | | 79,158 | | 142,600 | | | |
| | 4,400 | | | Janus Cap Group Inc | | | 64,273 | | 81,972 | | | |
| | 3,700 | | | Jefferson Pilot Corp | | | 137,936 | | 210,641 | | | |
| | 61,046 | | | Jpmorgan Chase & Co | | | 1,690,703 | | 2,422,916 | | | |
| | 12,100 | | | Keycorp New | | | 225,332 | | 398,453 | | | |
| | 3,000 | | | Kimco Rlty Corp | | | 88,706 | | 96,240 | | | |
| | 1,300 | | | Legg Mason Inc | | | 137,813 | | 155,597 | | | |
| | 4,200 | | | Lehman Brothers Hldgs Inc | | | 276,075 | | 538,314 | | | |
| | 800 | | | Leucadia Natl Corp | | | 27,592 | | 37,968 | | | |
| | 3,625 | | | Lincoln Natl Corp In | | | 113,502 | | 192,234 | | | |
| | 2,100 | | | Loews Corp | | | 49,966 | | 199,185 | | | |
| | 1,060 | | | M & T Bk Corp | | | 97,320 | | 115,593 | | | |
| | 5,600 | | | Mack Ca Rlty Corp | | | 178,832 | | 241,920 | | | |
| | 4,741 | | | Manulife Finl Corp | | | 135,056 | | 278,771 | | | |
| | 5,400 | | | Marsh & Mclennan Cos Inc | | | 175,113 | | 171,504 | | | |
| | 2,000 | | | Marshall & Ilsley Corp | | | 51,520 | | 86,080 | | | |
| | 1,850 | | | Mbia Inc | | | 82,768 | | 111,296 | | | |
| | 20,650 | | | Mbna Corp | | | 334,793 | | 560,648 | | | |
| | 5,400 | | | Mellon Finl Corp | | | 171,240 | | 184,950 | | | |
| | 13,000 | | | Merrill Lynch & Co Inc | | | 529,548 | | 880,490 | | | |
| | 7,600 | | | Metlife Inc | | | 298,855 | | 372,400 | | | |
| | 6,800 | | | Mgic Invt Corp Wis | | | 163,404 | | 447,576 | | | |
| | 3,200 | | | Moodys Corp | | | 128,540 | | 196,544 | | | |
| | 17,375 | | | Morgan Stanley | | | 799,102 | | 985,858 | | | |
| | 16,290 | | | National City Corp | | | 298,674 | | 546,855 | | | |
| | 800 | | | Nationwide Finl Svcs Inc | | | 25,928 | | 35,200 | | | |
| | 6,249 | | | New York Cmnty Bancorp Inc | | | 128,142 | | 103,233 | | | |
| | 7,438 | | | North Fork Bancorporation Inc | | | 120,236 | | 203,504 | | | |
| | 1,825 | | | Northern Trust Corp | | | 72,746 | | 94,572 | | | |
| | 8,900 | | | Old Rep Intl Corp | | | 221,092 | | 233,714 | | | |
| | 675 | | | Peoples Bk Bridgeport Conn | | | 9,330 | | 20,966 | | | |
| | 255 | | | Piper Jaffray Cos | | | 7,794 | | 10,302 | | | |
| | 3,385 | | | Plum Creek Timber Co Inc | | | 76,083 | | 122,029 | | | |
| | 300 | | | PMI Group Inc | | | 10,926 | | 12,321 | | | |
| | 3,925 | | | Pnc Finl Svcs Group Inc | | | 179,373 | | 242,683 | | | |
| | 2,200 | | | Popular Inc | | | 44,065 | | 46,530 | | | |
| | 11,662 | | | Price T Rowe Group Inc | | | 155,563 | | 840,014 | | | |
| | 2,550 | | | Principal Financial Group | | | 69,037 | | 120,947 | | | |
| | 2,600 | | | Progressive Corp Ohio | | | 164,996 | | 303,628 | | | |
| | 4,472 | | | Prologis | | | 188,534 | | 208,932 | | | |
| | 8,400 | | | Prudential Finl Inc (b) | | | 334,418 | | 614,796 | | | |
| | 1,000 | | | Radian Group Inc | | | 47,230 | | 58,590 | | | |
| | 750 | | | Raymond James Financial Inc | | | 12,570 | | 28,253 | | | |
| | 2,700 | | | Realty Income Corp | | | 68,742 | | 58,374 | | | |
| | 4,656 | | | Regions Finl Corp New | | | 110,981 | | 159,049 | | | |
| | 300 | | | Reinsurance Group Amer Inc | | | 12,570 | | 14,328 | | | |
| | 1,100 | | | Safeco Corp | | | 54,889 | | 62,150 | | | |
| | 25,700 | | | Schwab Charles Corp | | | 229,436 | | 377,019 | | | |
| | 2,100 | | | Simon Ppty Group Inc New | | | 90,805 | | 160,923 | | | |
| | 4,500 | | | Sky Finl Group Inc | | | 106,014 | | 125,190 | | | |
| | 6,700 | | | SLM Corp | | | 239,070 | | 369,103 | | | |
| | 4,700 | | | Sovereign Bancorp Inc | | | 42,831 | | 101,614 | | | |
| | 1,500 | | | St Joe Co | | | 88,245 | | 100,830 | | | |
| | 4,450 | | | State Street Corporation | | | 222,684 | | 246,708 | | | |
| | 4,234 | | | Suntrust Bks Inc | | | 271,872 | | 308,066 | | | |
| | 4,200 | | | Synovus Finl Corp | | | 112,014 | | 113,442 | | | |
| |
| See accompanying notes to financial statements. | 18 | (Continued) |
CLEARWATER INVESTMENT TRUST
Schedule of Investments – Clearwater Growth Fund
December 31, 2005 |
| |
Face
amount
or shares | | Security | | Cost | | Market
value (a) | | Percent
of
net assets | |
| |
| |
| |
| |
| |
| | 23,400 | | | TCF Financial Corp | | $ | 202,532 | | 635,076 | | | |
| | 2,303 | | | TD Banknorth Inc | | | 42,416 | | 66,902 | | | |
| | 11,132 | | | The St Paul Travelers Cos Inc | | | 359,509 | | 497,266 | | | |
| | 4,300 | | | Thornburg Mtg Inc | | | 127,446 | | 112,660 | | | |
| | 1,900 | | | Torchmark Inc | | | 80,235 | | 105,640 | | | |
| | 1,104 | | | Toronto Dominion Bk Ont (d) | | | 44,108 | | 58,181 | | | |
| | 400 | | | Transatlantic Hldgs Inc | | | 23,500 | | 26,880 | | | |
| | 4,000 | | | Unitrin Inc | | | 101,606 | | 180,200 | | | |
| | 5,400 | | | Unumprovident Corp | | | 80,522 | | 122,850 | | | |
| | 30,551 | | | US Bancorp Del | | | 693,495 | | 913,169 | | | |
| | 1,445 | | | Valley Natl Bancorp | | | 29,044 | | 34,825 | | | |
| | 2,245 | | | Vornado Rlty Tr | | | 186,436 | | 187,390 | | | |
| | 26,809 | | | Wachovia Corp 2nd New | | | 938,966 | | 1,417,124 | | | |
| | 19,705 | | | Washington Mut Inc (b) | | | 351,733 | | 857,168 | | | |
| | 32,641 | | | Wells Fargo & Co New | | | 724,241 | | 2,050,834 | | | |
| | 7,225 | | | Xl Capital Ltd | | | 92,119 | | 486,821 | | | |
| | 500 | | | Zions Bancorp | | | 29,372 | | 37,780 | | | |
| |
| |
| | | |
| | | | | | | | 28,520,014 | | 49,401,553 | | 21.54 | % |
| |
| |
| | | |
| | Healthcare: | | | | | | | | | | | |
| | 26,150 | | | Abbott Labs | | | 1,009,318 | | 1,031,095 | | | |
| | 900 | | | Affymetrix Inc (b) | | | 44,811 | | 42,975 | | | |
| | 2,350 | | | Allergan Inc | | | 160,920 | | 253,706 | | | |
| | 3,400 | | | Amerisourcebergen Corp | | | 97,885 | | 140,760 | | | |
| | 25,150 | | | Amgen Inc (b) | | | 102,792 | | 1,983,329 | | | |
| | 600 | | | Amylin Pharmaceuticals Inc (b) | | | 9,606 | | 23,952 | | | |
| | 600 | | | Andrx Corp Del (b) | | | 10,542 | | 9,882 | | | |
| | 1,800 | | | Applera Corp Applied Biosys | | | 37,429 | | 47,808 | | | |
| | 1,300 | | | Bard C R Inc | | | 78,455 | | 85,696 | | | |
| | 1,300 | | | Barr Pharmaceuticals Inc (b) | | | 64,592 | | 80,977 | | | |
| | 11,000 | | | Baxter Intl Inc | | | 220,992 | | 414,150 | | | |
| | 2,500 | | | Becton Dickinson & Co | | | 123,650 | | 150,200 | | | |
| | 11,350 | | | Biogen Idec Inc (b) | | | 164,190 | | 514,496 | | | |
| | 3,200 | | | Biomet Inc | | | 120,878 | | 117,024 | | | |
| | 11,050 | | | Boston Scientific Corp (b) | | | 284,034 | | 270,615 | | | |
| | 35,700 | | | Bristol Myers Squibb Co | | | 895,554 | | 820,386 | | | |
| | 6,850 | | | Cardinal Health Inc | | | 374,119 | | 470,938 | | | |
| | 7,713 | | | Caremark Rx Inc (b) | | | 146,686 | | 399,456 | | | |
| | 2,500 | | | Celgene Corp | | | 76,163 | | 162,000 | | | |
| | 200 | | | Cephalon Inc (b) | | | 9,120 | | 12,948 | | | |
| | 1,300 | | | Chiron Corp (b) | | | 43,719 | | 57,798 | | | |
| | 700 | | | Covance Inc (b) | | | 31,465 | | 33,985 | | | |
| | 1,800 | | | Coventry Health Care Inc (b) | | | 59,870 | | 102,528 | | | |
| | 1,600 | | | Cytyc Corp (b) | | | 11,472 | | 45,168 | | | |
| | 1,425 | | | Davita Inc (b) | | | 21,812 | | 72,162 | | | |
| | 180 | | | Edwards Lifesciences Corp (b) | | | 1,872 | | 7,490 | | | |
| | 1,600 | | | Express Scripts Inc (b) | | | 37,832 | | 134,080 | | | |
| | 3,400 | | | Fisher Scientific Intl Inc (b) | | | 138,754 | | 210,324 | | | |
| | 5,250 | | | Forest Labs Inc (b) | | | 207,798 | | 213,570 | | | |
| | 100 | | | Gen Probe Inc New (b) | | | 5,058 | | 4,879 | | | |
| | 8,300 | | | Genentech Inc (b) | | | 438,080 | | 767,750 | | | |
| | 6,174 | | | Genzyme Corp (b) | | | 387,500 | | 436,996 | | | |
| | 7,296 | | | Gilead Sciences Inc (b) | | | 237,281 | | 383,988 | | | |
| | 3,152 | | | Glaxosmithkline Plc (d) | | | 76,079 | | 159,113 | | | |
| | 4,800 | | | Guidant Corp | | | 252,272 | | 310,800 | | | |
| |
| See accompanying notes to financial statements. | 19 | (Continued) |
CLEARWATER INVESTMENT TRUST
Schedule of Investments – Clearwater Growth Fund
December 31, 2005 |
| |
Face
amount
or shares | | Security | | Cost | | Market
value (a) | | Percent
of
net assets | |
| |
| |
| |
| |
| |
| | 9,550 | | | HCA Inc | | $ | 347,616 | | 482,275 | | | |
| | 4,000 | | | Health Mgmt Assoc | | | 76,501 | | 87,840 | | | |
| | 2,450 | | | Health Net Inc (b) | | | 64,669 | | 126,298 | | | |
| | 1,400 | | | Hillenbrand Inds Inc | | | 76,636 | | 69,174 | | | |
| | 2,005 | | | Hospira Inc (b) | | | 50,661 | | 85,774 | | | |
| | 1,800 | | | Human Genome Sciences Inc (b) | | | 25,110 | | 15,408 | | | |
| | 3,900 | | | Humana Inc (b) | | | 39,107 | | 211,887 | | | |
| | 100 | | | Imclone Sys Inc (b) | | | 3,259 | | 3,424 | | | |
| | 2,100 | | | IMS Health Inc | | | 52,215 | | 52,332 | | | |
| | 200 | | | Inamed Corp (b) | | | 12,158 | | 17,536 | | | |
| | 2,500 | | | Invitrogen Corp (b) | | | 164,832 | | 166,600 | | | |
| | 5,406 | | | Ivax Corp (b) | | | 51,704 | | 169,370 | | | |
| | 50,300 | | | Johnson & Johnson | | | 1,371,701 | | 3,023,030 | | | |
| | 4,300 | | | King Pharmaceuticals Inc (b) | | | 44,032 | | 72,756 | | | |
| | 3,400 | | | Laboratory Corp Amer Hldgs (b) | | | 99,252 | | 183,090 | | | |
| | 18,100 | | | Lilly Eli & Co | | | 754,435 | | 1,024,279 | | | |
| | 1,950 | | | Lincare Hldgs Inc (b) | | | 58,492 | | 81,725 | | | |
| | 1,300 | | | Manor Care Inc New | | | 30,973 | | 51,701 | | | |
| | 500 | | | Martek Biosciences Corp (b) | | | 19,315 | | 12,305 | | | |
| | 4,700 | | | Mckesson Corp | | | 159,643 | | 242,473 | | | |
| | 5,319 | | | Medco Health Solutions Inc (b) | | | 178,428 | | 296,800 | | | |
| | 1,300 | | | Medicis Pharmaceutical Corp | | | 43,528 | | 41,665 | | | |
| | 3,100 | | | Medimmune Inc (b) | | | 76,227 | | 108,562 | | | |
| | 27,050 | | | Medtronic Inc | | | 100,935 | | 1,557,269 | | | |
| | 20,550 | | | Merck & Co Inc | | | 592,848 | | 653,696 | | | |
| | 700 | | | MGI Pharma Inc (b) | | | 15,176 | | 12,012 | | | |
| | 4,700 | | | Mylan Labs Inc | | | 53,880 | | 93,812 | | | |
| | 1,500 | | | Nektar Therapeutics (b) | | | 21,900 | | 24,690 | | | |
| | 1,900 | | | Omnicare Inc | | | 56,919 | | 108,718 | | | |
| | 100 | | | Osi Pharmaceuticals Inc (b) | | | 4,647 | | 2,804 | | | |
| | 135,575 | | | Pfizer Inc | | | 847,991 | | 3,161,609 | | | |
| | 700 | | | Pharmaceutical Prod Dev Inc | | | 32,993 | | 43,365 | | | |
| | 1,300 | | | Protein Design Labs Inc (b) | | | 20,144 | | 36,946 | | | |
| | 2,050 | | | Quest Diagnostics Inc | | | 62,932 | | 105,534 | | | |
| | 1,527 | | | Renal Care Group Inc (b) | | | 66,465 | | 72,242 | | | |
| | 25,100 | | | Schering Plough Corp | | | 443,035 | | 523,335 | | | |
| | 1,500 | | | Sepracor Inc (b) | | | 55,680 | | 77,400 | | | |
| | 12,600 | | | Service Corp Intl (b) | | | 90,438 | | 103,068 | | | |
| | 6,400 | | | St Jude Med Inc | | | 195,923 | | 321,280 | | | |
| | 15,650 | | | Stryker Corp | | | 60,399 | | 695,330 | | | |
| | 4,900 | | | Tenet Healthcare Corp (b) | | | 76,685 | | 37,534 | | | |
| | 1,000 | | | Triad Hosps Inc (b) | | | 25,517 | | 39,230 | | | |
| | 27,921 | | | Unitedhealth Group Inc | | | 779,143 | | 1,734,980 | | | |
| | 700 | | | Universal Health Svcs Inc | | | 31,885 | | 32,718 | | | |
| | 5,800 | | | Varian Med Sys Inc (b) | | | 213,788 | | 291,972 | | | |
| | 1,200 | | | VCA Antech Inc (b) | | | 28,592 | | 33,840 | | | |
| | 2,175 | | | Watson Pharmaceuticals Inc (b) | | | 50,706 | | 70,709 | | | |
| | 10,058 | | | Wellpoint Inc | | | 373,414 | | 802,528 | | | |
| | 26,050 | | | Wyeth | | | 1,057,925 | | 1,200,123 | | | |
| | 4,185 | | | Zimmer Holdings Inc (b) | | | 278,051 | | 282,236 | | | |
| |
| |
| | | |
| | | | | | | | 15,421,105 | | 28,718,308 | | 12.52 | % |
| |
| |
| | | |
| |
| See accompanying notes to financial statements. | 20 | (Continued) |
CLEARWATER INVESTMENT TRUST
Schedule of Investments – Clearwater Growth Fund
December 31, 2005 |
| |
Face
amount
or shares | | Security | | Cost | | Market
value (a) | | Percent
of
net assets | |
| |
| |
| |
| |
| |
| | Industrials: | | | | | | | | | | | |
| | 12,950 | | | 3M Co | | $ | 921,369 | | 1,003,625 | | | |
| | 1,809 | | | Acco Brands Corp (b) | | | 16,591 | | 44,320 | | | |
| | 925 | | | Adesa Inc | | | 13,202 | | 22,588 | | | |
| | 2,750 | | | Allied Waste Industries Inc (b) | | | 16,321 | | 24,035 | | | |
| | 3,593 | | | American Pwr Conversion Corp (b) | | | 65,840 | | 79,046 | | | |
| | 2,600 | | | American Std Cos Inc Del | | | 101,212 | | 103,870 | | | |
| | 3,600 | | | AMR Corp Del (b) | | | 40,052 | | 80,028 | | | |
| | 2,457 | | | Apollo Group Inc (b) | | | 160,375 | | 148,550 | | | |
| | 1,700 | | | Aramark Corp | | | 47,836 | | 47,226 | | | |
| | 8,522 | | | Automatic Data Processing Inc | | | 318,400 | | 391,075 | | | |
| | 1,700 | | | Avery Dennison Corp | | | 90,518 | | 93,959 | | | |
| | 2,100 | | | Bisys Group Inc (b) | | | 30,486 | | 29,421 | | | |
| | 6,200 | | | Block H & R Inc | | | 58,017 | | 152,210 | | | |
| | 18,700 | | | Boeing Co | | | 442,349 | | 1,313,488 | | | |
| | 5,600 | | | Burlington Northn Santa Fe | | | 169,260 | | 396,592 | | | |
| | 2,100 | | | Career Ed Corp (b) | | | 86,658 | | 70,812 | | | |
| | 300 | | | Carlisle Cos Inc | | | 15,924 | | 20,745 | | | |
| | 11,904 | | | Caterpillar Inc | | | 387,817 | | 687,694 | | | |
| | 29,948 | | | Cendant Corp | | | 218,523 | | 516,603 | | | |
| | 4,000 | | | Ceridian Corp New (b) | | | 76,450 | | 99,400 | | | |
| | 400 | | | Checkfree Corp New (b) | | | 15,128 | | 18,360 | | | |
| | 2,900 | | | Cintas Corp | | | 94,801 | | 119,422 | | | |
| | 2,100 | | | CNF Inc | | | 49,896 | | 117,369 | | | |
| | 12,775 | | | Crane Co | | | 215,415 | | 450,574 | | | |
| | 5,100 | | | CSX Corp | | | 107,400 | | 258,927 | | | |
| | 850 | | | Cummins Inc | | | 41,532 | | 76,270 | | | |
| | 3,200 | | | Danaher Corp | | | 122,770 | | 178,496 | | | |
| | 3,650 | | | Deere & Co | | | 199,160 | | 248,601 | | | |
| | 3,100 | | | Deluxe Corp | | | 109,610 | | 93,434 | | | |
| | 1,000 | | | Devry Inc Del (b) | | | 19,142 | | 20,000 | | | |
| | 300 | | | Donaldson Co Inc | | | 10,200 | | 9,540 | | | |
| | 2,900 | | | Donnelley R R & Sons Co | | | 86,226 | | 99,209 | | | |
| | 3,325 | | | Dover Corp | | | 122,574 | | 134,629 | | | |
| | 9,600 | | | Dun & Bradstreet Corp Del New (b) | | | 239,197 | | 642,816 | | | |
| | 3,000 | | | Eaton Corp | | | 103,554 | | 201,270 | | | |
| | 6,000 | | | Emdeon Corp (b) | | | 58,236 | | 50,760 | | | |
| | 9,350 | | | Emerson Elec Co | | | 514,252 | | 698,445 | | | |
| | 1,400 | | | Fastenal Co | | | 43,652 | | 54,866 | | | |
| | 11,475 | | | Fedex Corp | | | 228,179 | | 1,186,400 | | | |
| | 26,244 | | | First Data Corp | | | 181,908 | | 1,128,754 | | | |
| | 10,550 | | | Fiserv Inc (b) | | | 95,145 | | 456,498 | | | |
| | 3,675 | | | Fluor Corp New | | | 96,907 | | 283,930 | | | |
| | 1,400 | | | Gatx | | | 24,276 | | 50,512 | | | |
| | 3,000 | | | General Dynamics Corp | | | 249,324 | | 342,150 | | | |
| | 188,981 | | | General Elec Co | | | 4,076,113 | | 6,623,784 | | | |
| | 5,050 | | | Genuine Parts Co | | | 153,969 | | 221,796 | | | |
| | 3,700 | | | Goodrich Corp | | | 111,298 | | 152,070 | | | |
| | 1,700 | | | Grainger W W Inc | | | 74,317 | | 120,870 | | | |
| | 800 | | | Harsco Corp | | | 28,236 | | 54,008 | | | |
| | 14,400 | | | Honeywell Intl Inc | | | 366,044 | | 536,400 | | | |
| | 900 | | | Hubbell Inc | | | 29,499 | | 40,608 | | | |
| | 2,100 | | | Hunt J B Trans Svcs Inc | | | 40,530 | | 47,544 | | | |
| | 3,412 | | | Illinois Tool Wks Inc | | | 241,833 | | 300,222 | | | |
| | 1,300 | | | Itt Edl Svcs Inc (b) | | | 52,038 | | 76,843 | | | |
| | 1,400 | | | Itt Inds Inc | | | 116,998 | | 143,948 | | | |
| | 1,300 | | | Jacobs Engr Group Inc (b) | | | 57,164 | | 88,231 | | | |
| | 3,300 | | | Jetblue Awys Corp (b) | | | 47,278 | | 50,754 | | | |
| |
| See accompanying notes to financial statements. | 21 | (Continued) |
CLEARWATER INVESTMENT TRUST
Schedule of Investments – Clearwater Growth Fund
December 31, 2005 |
| |
Face
amount
or shares | | Security | | Cost | | Market
value (a) | | Percent
of
net assets | |
| |
| |
| |
| |
| |
| | 1,300 | | | L 3 Communications Hldg Corp | | $ | 61,878 | | 96,655 | | | |
| | 1,000 | | | Landstar Sys Inc | | | 30,070 | | 41,740 | | | |
| | 5,600 | | | Lockheed Martin Corp | | | 167,741 | | 356,328 | | | |
| | 1,475 | | | Manpower Inc Wis | | | 66,373 | | 68,587 | | | |
| | 7,488 | | | Masco Corp | | | 153,044 | | 226,063 | | | |
| | 1,800 | | | Monster Worldwide Inc (b) | | | 45,970 | | 73,476 | | | |
| | 1,900 | | | Navistar Intl Corp Inc (b) | | | 79,213 | | 54,378 | | | |
| | 6,460 | | | Norfolk Southn Corp | | | 142,693 | | 289,602 | | | |
| | 4,092 | | | Northrop Grumman Corp | | | 184,731 | | 245,970 | | | |
| | 1,400 | | | Oshkosh Truck Corp | | | 55,203 | | 62,426 | | | |
| | 3,662 | | | Paccar Inc | | | 88,853 | | 253,520 | | | |
| | 1,700 | | | Pall Corp | | | 40,004 | | 45,662 | | | |
| | 1,700 | | | Parker Hannifin Corp | | | 108,169 | | 112,132 | | | |
| | 19,497 | | | Paychex Inc | | | 54,861 | | 743,226 | | | |
| | 1,800 | | | Pentair Inc | | | 64,233 | | 62,136 | | | |
| | 1,497 | | | Phh Corp (b) | | | 10,184 | | 41,946 | | | |
| | 10,200 | | | Pitney Bowes Inc | | | 328,150 | | 430,950 | | | |
| | 4,000 | | | Precision Castparts Corp | | | 45,286 | | 207,240 | | | |
| | 6,500 | | | Raytheon Co | | | 191,236 | | 260,975 | | | |
| | 4,650 | | | Republic Svcs Inc | | | 125,531 | | 174,607 | | | |
| | 2,200 | | | Reynolds Amern Inc | | | 123,818 | | 209,726 | | | |
| | 2,300 | | | Robert Half Intl Inc | | | 58,256 | | 87,147 | | | |
| | 7,250 | | | Rockwell Automation Inc | | | 102,173 | | 428,910 | | | |
| | 2,714 | | | Rockwell Collins Inc | | | 75,092 | | 126,120 | | | |
| | 6,100 | | | Sabre Hldgs Corp | | | 153,967 | | 147,071 | | | |
| | 4,100 | | | Service Master Company | | | 44,239 | | 48,995 | | | |
| | 2,400 | | | Skywest Inc | | | 26,040 | | 64,464 | | | |
| | 14,575 | | | Southwest Airls Co | | | 203,127 | | 239,467 | | | |
| | 1,000 | | | SPX Corp | | | 51,053 | | 45,770 | | | |
| | 200 | | | Stericycle Inc (b) | | | 8,456 | | 11,776 | | | |
| | 700 | | | Swift Transn Inc (b) | | | 16,331 | | 14,210 | | | |
| | 500 | | | Teleflex Inc | | | 22,515 | | 32,490 | | | |
| | 1,475 | | | Textron Inc | | | 54,457 | | 113,545 | | | |
| | 1,100 | | | Thermo Electron Corp (b) | | | 27,984 | | 33,143 | | | |
| | 13,700 | | | Tyco Intl Ltd | | | 132,068 | | 395,382 | | | |
| | 3,800 | | | Union Pac Corp | | | 219,426 | | 305,938 | | | |
| | 8,500 | | | United Parcel Svc Inc | | | 599,300 | | 638,775 | | | |
| | 18,350 | | | United Technologies Corp | | | 712,439 | | 1,025,948 | | | |
| | 8,650 | | | Waste Mgmt Inc Del | | | 135,675 | | 262,527 | | | |
| | 600 | | | Weight Watchers Intl Inc New (b) | | | 23,424 | | 29,658 | | | |
| | 1,000 | | | Yellow Roadway Corp | | | 51,310 | | 44,610 | | | |
| |
| |
| | | |
| | | | | | | | 16,585,574 | | 28,856,888 | | 12.58 | % |
| |
| |
| | | |
| | Information technology: | | | | | | | | | | |
| | 2,800 | | | Activision Inc New (b) | | | 9,966 | | 38,472 | | | |
| | 2,000 | | | Adc Telecommunications Inc (b) | | | 43,860 | | 44,680 | | | |
| | 11,524 | | | Adobe Sys Inc | | | 219,807 | | 425,927 | | | |
| | 6,200 | | | Advanced Micro Devices Inc (b) | | | 90,535 | | 189,720 | | | |
| | 900 | | | Affiliated Computer Svcs Inc (b) | | | 45,507 | | 53,262 | | | |
| | 7,700 | | | Agilent Technologies Inc (b) | | | 168,385 | | 256,333 | | | |
| | 5,300 | | | Altera Corp (b) | | | 99,804 | | 98,209 | | | |
| | 11,100 | | | Analog Devices Inc | | | 99,557 | | 398,157 | | | |
| | 17,271 | | | Andrew Corp (b) | | | 209,577 | | 185,318 | | | |
| | 15,100 | | | Apple Computer | | | 291,741 | | 1,085,539 | | | |
| | 28,400 | | | Applied Materials Inc | | | 415,207 | | 509,496 | | | |
| | 600 | | | Arrow Electrs Inc (b) | | | 15,192 | | 19,218 | | | |
| | 7,500 | | | Asml Holding N V (b) (d) | | | 45,625 | | 150,600 | | | |
| | 10,586 | | | Autodesk Incorporated | | | 390,987 | | 454,669 | | | |
| | 7,700 | | | Avaya Inc (b) | | | 79,422 | | 82,159 | | | |
| |
| See accompanying notes to financial statements. | 22 | (Continued) |
CLEARWATER INVESTMENT TRUST
Schedule of Investments – Clearwater Growth Fund
December 31, 2005 |
| |
Face
amount
or shares | | Security | | Cost | | Market
value (a) | | Percent
of
net assets | |
| |
| |
| |
| |
| |
| | 6,200 | | | Bea Sys Inc (b) | | $ | 52,185 | | 58,280 | | | |
| | 3,350 | | | BMC Software Inc (b) | | | 58,044 | | 68,641 | | | |
| | 4,575 | | | Broadcom Corp (b) | | | 126,955 | | 215,711 | | | |
| | 5,300 | | | Brocade Communications Sys Inc (b) | | | 27,300 | | 21,571 | | | |
| | 4,100 | | | Cadence Design Sys Inc (b) | | | 65,211 | | 69,372 | | | |
| | 800 | | | CDW Corp | | | 44,354 | | 46,056 | | | |
| | 116,650 | | | Cisco Sys Inc (b) | | | 255,645 | | 1,997,048 | | | |
| | 2,950 | | | Citrix Sys Inc (b) | | | 17,801 | | 84,901 | | | |
| | 2,400 | | | Cognizant Technology Solutions (b) | | | 67,929 | | 120,840 | | | |
| | 5,825 | | | Computer Assoc Intl Inc | | | 93,467 | | 164,207 | | | |
| | 2,722 | | | Computer Sciences Corp (b) | | | 109,475 | | 137,842 | | | |
| | 6,800 | | | Compuware Corp (b) | | | 44,226 | | 60,996 | | | |
| | 2,200 | | | Comverse Technology Inc (b) | | | 37,400 | | 58,498 | | | |
| | 25,400 | | | Corning Inc (b) | | | 218,326 | | 499,364 | | | |
| | 500 | | | Cree Inc (b) | | | 11,565 | | 12,620 | | | |
| | 2,400 | | | Cypress Semiconductor Corp (b) | | | 29,768 | | 34,200 | | | |
| | 35,550 | | | Dell Inc (b) | | | 959,101 | | 1,066,144 | | | |
| | 14,700 | | | Dendrite Intl Inc (b) | | | 57,965 | | 211,827 | | | |
| | 5,600 | | | Electronic Arts Inc (b) | | | 286,778 | | 292,936 | | | |
| | 7,400 | | | Electronic Data Sys Corp New | | | 164,019 | | 177,896 | | | |
| | 42,210 | | | EMC Corp (b) | | | 337,885 | | 574,900 | | | |
| | 3,700 | | | Emulex Corp (b) | | | 49,943 | | 73,223 | | | |
| | 700 | | | F5 Networks Inc (b) | | | 32,375 | | 40,033 | | | |
| | 900 | | | Fair Isaac Corporation | | | 31,182 | | 39,753 | | | |
| | 1,900 | | | Fairchild Semiconductor Intl (b) | | | 25,935 | | 32,129 | | | |
| | 7,930 | | | Freescale Semiconductor Inc (b) | | | 123,073 | | 199,598 | | | |
| | 2,800 | | | Google Inc (b) | | | 784,782 | | 1,161,608 | | | |
| | 2,800 | | | Harris Corp Del | | | 37,337 | | 120,428 | | | |
| | 56,327 | | | Hewlett Packard Co | | | 1,052,419 | | 1,612,642 | | | |
| | 3,220 | | | IAC Interactivecorp (b) | | | 80,489 | | 91,158 | | | |
| | 6,110 | | | Integrated Device Technology (b) | | | 79,318 | | 80,530 | | | |
| | 113,016 | | | Intel Corp | | | 421,122 | | 2,820,879 | | | |
| | 900 | | | Interdigital Comm Corp (b) | | | 15,021 | | 16,488 | | | |
| | 29,100 | | | International Business Machs | | | 2,497,010 | | 2,392,020 | | | |
| | 700 | | | International Rectifier Corp (b) | | | 29,995 | | 22,330 | | | |
| | 7,800 | | | Intersil Corp | | | 123,552 | | 194,064 | | | |
| | 2,500 | | | Intuit (b) | | | 103,285 | | 133,250 | | | |
| | 5,600 | | | Jabil Circuit Inc (b) | | | 94,248 | | 207,704 | | | |
| | 14,100 | | | Juniper Networks Inc (b) | | | 291,516 | | 314,430 | | | |
| | 3,000 | | | Kla Tencor Corp | | | 101,654 | | 147,990 | | | |
| | 3,000 | | | Lam Resh Corp (b) | | | 83,706 | | 107,040 | | | |
| | 1,900 | | | Lexmark Intl Inc (b) | | | 83,199 | | 85,177 | | | |
| | 5,400 | | | Linear Technology Corp | | | 176,013 | | 194,778 | | | |
| | 4,600 | | | LSI Logic Corp (b) | | | 43,516 | | 36,800 | | | |
| | 71,100 | | | Lucent Technologies Inc (b) | | | 235,872 | | 189,126 | | | |
| | 5,400 | | | Maxim Integrated Prods Inc | | | 243,261 | | 195,696 | | | |
| | 2,100 | | | Maxtor Corp (b) | | | 9,954 | | 14,574 | | | |
| | 2,900 | | | Mcafee Inc (b) | | | 65,012 | | 78,677 | | | |
| | 1,350 | | | Mercury Interactive Corp (b) | | | 38,328 | | 37,516 | | | |
| | 5,400 | | | Microchip Technology Inc | | | 101,340 | | 173,610 | | | |
| | 8,800 | | | Micron Technology Inc (b) | | | 68,191 | | 117,128 | | | |
| | 165,450 | | | Microsoft Corp | | | 1,730,933 | | 4,326,517 | | | |
| | 2,200 | | | Molex Inc | | | 68,046 | | 57,090 | | | |
| | 42,813 | | | Motorola Inc | | | 466,966 | | 967,146 | | | |
| | 5,600 | | | National Semiconductor Corp | | | 101,536 | | 145,488 | | | |
| | 2,000 | | | NCR Corp New (b) | | | 73,013 | | 67,880 | | | |
| | 5,300 | | | Network Appliance Inc (b) | | | 124,694 | | 143,100 | | | |
| | 5,200 | | | Novell Inc (b) | | | 31,071 | | 45,916 | | | |
| | 2,900 | | | Nvidia Corp (b) | | | 57,763 | | 106,024 | | | |
| |
| See accompanying notes to financial statements. | 23 | (Continued) |
CLEARWATER INVESTMENT TRUST
Schedule of Investments – Clearwater Growth Fund
December 31, 2005 |
| |
Face
amount
or shares | | Security | | Cost | | Market
value (a) | | Percent
of
net assets | |
| |
| |
| |
| |
| |
| | 74,300 | | | Oracle Corp (b) | | $ | 38,767 | | 907,203 | | | |
| | 1,400 | | | Perkinelmer Inc | | | 25,256 | | 32,984 | | | |
| | 300 | | | Plantronics Inc New | | | 9,672 | | 8,490 | | | |
| | 3,400 | | | PMC Sierra Inc (b) | | | 38,998 | | 26,214 | | | |
| | 2,600 | | | Polycom Inc | | | 26,520 | | 39,780 | | | |
| | 1,600 | | | Qlogic Corp (b) | | | 47,315 | | 52,016 | | | |
| | 29,150 | | | Qualcomm Inc | | | 632,485 | | 1,255,782 | | | |
| | 100 | | | Rambus Inc Del (b) | | | 1,427 | | 1,619 | | | |
| | 3,200 | | | Red Hat Inc (b) | | | 41,904 | | 87,168 | | | |
| | 2,500 | | | Sandisk Corp (b) | | | 61,884 | | 157,050 | | | |
| | 8,968 | | | Sanmina Sci Corp (b) | | | 65,592 | | 38,204 | | | |
| | 2,400 | | | Scientific Atlanta Inc | | | 44,778 | | 103,368 | | | |
| | 22,900 | | | Siebel Sys Inc | | | 191,742 | | 242,282 | | | |
| | 13,500 | | | Solectron Corp (b) | | | 51,410 | | 49,410 | | | |
| | 52,125 | | | Sun Microsystems Inc | | | 218,952 | | 218,404 | | | |
| | 22,381 | | | Symantec Corp | | | 201,438 | | 391,667 | | | |
| | 277 | | | Symbol Technologies Inc | | | 957 | | 3,551 | | | |
| | 1,600 | | | Synopsys Inc (b) | | | 26,568 | | 32,096 | | | |
| | 1,100 | | | Tektronix Inc | | | 20,167 | | 31,031 | | | |
| | 6,450 | | | Tellabs Inc (b) | | | 37,637 | | 70,305 | | | |
| | 29,700 | | | Texas Instrs Inc | | | 624,785 | | 952,479 | | | |
| | 5,900 | | | Unisys Corp (b) | | | 39,571 | | 34,397 | | | |
| | 10,900 | | | Verisign Inc (b) | | | 60,947 | | 238,928 | | | |
| | 2,600 | | | Waters Corp (b) | | | 60,997 | | 98,280 | | | |
| | 1,700 | | | Western Digital Corp (b) | | | 20,471 | | 31,637 | | | |
| | 14,250 | | | Xerox Corp (b) | | | 141,439 | | 208,762 | | | |
| | 13,050 | | | Xilinx Inc | | | 92,297 | | 328,990 | | | |
| | 21,600 | | | Yahoo Inc (b) | | | 425,769 | | 846,288 | | | |
| | 200 | | | Zebra Technologies Corp (b) | | | 10,256 | | 8,570 | | | |
| |
| |
| | | |
| | | | | | | | 18,327,242 | | 33,252,104 | | 14.50 | % |
| |
| |
| | | |
| | Materials: | | | | | | | | | | | |
| | 2,450 | | | Air Prods & Chems Inc | | | 106,434 | | 145,015 | | | |
| | 14,100 | | | Alcoa Inc | | | 387,957 | | 416,937 | | | |
| | 3,100 | | | Arch Coal Inc | | | 55,785 | | 246,450 | | | |
| | 2,132 | | | Ball Corp | | | 33,519 | | 84,683 | | | |
| | 4,200 | | | Bemis Co Inc | | | 93,645 | | 117,054 | | | |
| | 1,300 | | | Bowater Inc | | | 52,068 | | 39,936 | | | |
| | 1,500 | | | Consol Energy Inc | | | 88,621 | | 97,770 | | | |
| | 3,000 | | | Crown Hldgs Inc (b) | | | 43,170 | | 58,590 | | | |
| | 16,850 | | | Dow Chem Co | | | 616,411 | | 738,367 | | | |
| | 16,225 | | | Du Pont E I De Nemours & Co | | | 679,911 | | 689,562 | | | |
| | 146 | | | Eagle Matls Inc | | | 1,727 | | 17,865 | | | |
| | 491 | | | Eagle Matls Inc | | | 5,711 | | 57,825 | | | |
| | 1,000 | | | Eastman Chem Co | | | 32,854 | | 51,590 | | | |
| | 1,200 | | | Ecolab Inc | | | 33,060 | | 43,524 | | | |
| | 1,600 | | | Engelhard Corp | | | 27,734 | | 48,240 | | | |
| | 675 | | | Florida Rock Inds Inc | | | 16,401 | | 33,115 | | | |
| | 3,100 | | | Freeport Mcmoran Copper & Gold | | | 100,843 | | 166,780 | | | |
| | 12,625 | | | International Flavours | | | 271,595 | | 422,937 | | | |
| | 6,531 | | | International Paper Co | | | 230,601 | | 219,507 | | | |
| | 600 | | | Lafarge North America Inc | | | 24,761 | | 33,012 | | | |
| | 1,600 | | | Louisiana Pac Corp | | | 39,240 | | 43,952 | | | |
| | 500 | | | Lubrizol Corp | | | 18,193 | | 21,715 | | | |
| | 8,050 | | | Lyondell Chemical Co | | | 102,700 | | 191,751 | | | |
| |
| See accompanying notes to financial statements. | 24 | (Continued) |
CLEARWATER INVESTMENT TRUST
Schedule of Investments – Clearwater Growth Fund
December 31, 2005 |
| |
Face
amount
or shares | | Security | | Cost | | Market
value (a) | | Percent
of
net assets | |
| |
| |
| |
| |
| |
| | 700 | | | Martin Marietta Matls Inc | | $ | 27,965 | | 53,704 | | | |
| | 900 | | | Massey Energy Corp | | | 35,316 | | 34,083 | | | |
| | 3,875 | | | Meadwestvaco Corp | | | 86,711 | | 108,616 | | | |
| | 5,808 | | | Monsanto Co New | | | 51,490 | | 450,294 | | | |
| | 131 | | | Neenah Paper Inc | | | 4,149 | | 3,668 | | | |
| | 8,200 | | | Newmont Mng Corp | | | 132,185 | | 437,880 | | | |
| | 4,400 | | | Nucor Corp | | | 154,139 | | 293,568 | | | |
| | 12,800 | | | OM Group Inc (b) | | | 64,857 | | 240,128 | | | |
| | 2,400 | | | Owens Ill Inc (b) | | | 40,083 | | 50,496 | | | |
| | 1,100 | | | Packaging Corp Amer | | | 24,772 | | 25,245 | | | |
| | 2,450 | | | Pactiv Corp (b) | | | 22,665 | | 53,900 | | | |
| | 2,300 | | | Peabody Energy Corp | | | 111,339 | | 189,566 | | | |
| | 2,200 | | | Phelps Dodge Corp | | | 71,022 | | 316,514 | | | |
| | 3,086 | | | PPG Inds Inc | | | 144,348 | | 178,679 | | | |
| | 4,350 | | | Praxair Inc | | | 129,744 | | 230,376 | | | |
| | 5,446 | | | Rayonier Inc | | | 119,279 | | 217,023 | | | |
| | 2,200 | | | Rohm & Haas Co | | | 78,122 | | 106,524 | | | |
| | 11,000 | | | RPM Intl Inc | | | 113,012 | | 191,070 | | | |
| | 1,200 | | | Sealed Air Corp New (b) | | | 58,956 | | 67,404 | | | |
| | 200 | | | Sigma Aldrich | | | 11,098 | | 12,658 | | | |
| | 18,200 | | | Smurfit Stone Container Corp (b) | | | 203,147 | | 257,894 | | | |
| | 3,600 | | | Sonoco Prods Co | | | 74,519 | | 105,840 | | | |
| | 1,900 | | | Temple Inland Inc | | | 57,570 | | 85,215 | | | |
| | 1,800 | | | Vulcan Matls Co | | | 90,324 | | 121,950 | | | |
| |
| |
| | | |
| | | | | | | | 4,969,753 | | 7,818,472 | | 3.41 | % |
| |
| |
| | | |
| | Telecommunication services: | | | | | | | |
| | 700 | | | Alamosa Holdings Inc (b) | | | 9,800 | | 13,027 | | | |
| | 1,415 | | | Alltel Corp | | | 81,223 | | 89,286 | | | |
| | 5,900 | | | American Tower Corp (b) | | | 87,918 | | 159,890 | | | |
| | 61,492 | | | AT&T Inc | | | 1,496,471 | | 1,505,939 | | | |
| | 29,442 | | | Bellsouth Corp | | | 776,644 | | 797,878 | | | |
| | 7,450 | | | Centurytel Inc | | | 200,627 | | 247,042 | | | |
| | 11,525 | | | Citizens Communications Co | | | 88,166 | | 140,951 | | | |
| | 1,100 | | | Crown Castle Intl Corp (b) | | | 19,379 | | 29,601 | | | |
| | 4,153 | | | Liberty Global Inc (b) | | | 81,677 | | 93,442 | | | |
| | 2,500 | | | MCI Inc | | | 63,900 | | 49,325 | | | |
| | 1,300 | | | Ntl Inc Del (b) | | | 75,389 | | 88,504 | | | |
| | 26,400 | | | Qwest Communications Intl Inc | | | 94,738 | | 149,160 | | | |
| | 59,859 | | | Sprint Nextel Corp | | | 757,161 | | 1,398,306 | | | |
| | 1,300 | | | Telephone & Data Sys Inc | | | 26,702 | | 46,839 | | | |
| | 1,300 | | | Telephone & Data Sys Inc | | | 26,702 | | 44,993 | | | |
| | 4,580 | | | United States Cellular Corp (b) | | | 197,008 | | 226,252 | | | |
| | 37,852 | | | Verizon Communications | | | 1,325,795 | | 1,140,102 | | | |
| | 14,700 | | | Vodafone Group Plc New (d) | | | 148,350 | | 315,609 | | | |
| |
| |
| | | |
| | | | | | | | 5,557,650 | | 6,536,146 | | 2.85 | % |
| |
| |
| | | |
| Utilities: | | | | | | | | |
| | 19,186 | | | Aes Corp (b) | | | 265,922 | | 303,714 | | | |
| | 800 | | | Agl Res Inc | | | 22,424 | | 27,848 | | | |
| | 308 | | | Allete Inc | | | 8,794 | | 13,552 | | | |
| | 5,400 | | | Ameren Corp | | | 209,724 | | 276,696 | | | |
| | 2,300 | | | American Elec Pwr Inc | | | 71,652 | | 85,307 | | | |
| | 3,088 | | | Aqua Amer Inc | | | 67,959 | | 84,302 | | | |
| | 1,100 | | | Centerpoint Energy Inc | | | 10,472 | | 14,135 | | | |
| | 1,400 | | | Consolidated Edison Inc | | | 61,145 | | 64,862 | | | |
| | 1,200 | | | Constellation Energy Group Inc (b) | | | 47,649 | | 69,120 | | | |
| |
| See accompanying notes to financial statements. | 25 | (Continued) |
CLEARWATER INVESTMENT TRUST
Schedule of Investments – Clearwater Growth Fund
December 31, 2005 |
| |
Face
amount
or shares | | Security | | Cost | | Market
value (a) | | Percent
of
net assets | |
| |
| |
| |
| |
| |
| | 4,400 | | | Dominion Res Inc Va New | | $ | 295,568 | | 339,680 | | | |
| | 2,800 | | | Dte Energy Co | | | 107,816 | | 120,932 | | | |
| | 15,600 | | | Duke Energy Co | | | 252,328 | | 428,220 | | | |
| | 9,425 | | | Edison Intl | | | 108,441 | | 411,024 | | | |
| | 9,400 | | | Entergy Corp New | | | 184,383 | | 645,310 | | | |
| | 11,024 | | | Exelon Corp | | | 476,381 | | 585,815 | | | |
| | 3,200 | | | Firstenergy Corp | | | 123,727 | | 156,768 | | | |
| | 3,000 | | | FPL Group Inc | | | 112,800 | | 124,680 | | | |
| | 7,000 | | | Great Plains Energy Inc | | | 205,265 | | 195,720 | | | |
| | 2,900 | | | Keyspan Corp | | | 83,519 | | 103,501 | | | |
| | 1,500 | | | National Fuel Gas Co N J | | | 38,322 | | 46,785 | | | |
| | 6,900 | | | Nisource Inc | | | 111,901 | | 143,934 | | | |
| | 2,400 | | | OGE Energy Corp | | | 43,344 | | 64,296 | | | |
| | 8,200 | | | Peoples Energy Corp | | | 334,284 | | 287,574 | | | |
| | 828 | | | Pepco Hldgs Inc | | | 16,557 | | 18,522 | | | |
| | 9,800 | | | PG&E Corp | | | 131,785 | | 363,776 | | | |
| | 2,100 | | | Piedmont Nat Gas Inc | | | 50,582 | | 50,736 | | | |
| | 2,400 | | | Pinnacle West Cap Corp | | | 71,637 | | 99,240 | | | |
| | 850 | | | PPL Corp | | | 13,588 | | 24,990 | | | |
| | 2,150 | | | Progress Energy Inc | | | 65,685 | | 94,428 | | | |
| | 3,000 | | | Public Svc Enterprise Group | | | 171,990 | | 194,910 | | | |
| | 7,350 | | | Puget Energy Inc | | | 149,926 | | 150,087 | | | |
| | 2,900 | | | Questar Corp | | | 66,188 | | 219,530 | | | |
| | 2,700 | | | Reliant Energy Inc (b) | | | 24,085 | | 27,864 | | | |
| | 8,600 | | | Southern Co | | | 176,010 | | 296,958 | | | |
| | 2,600 | | | Southwestern Energy Co | | | 74,256 | | 93,444 | | | |
| | 7,600 | | | Teco Energy Inc | | | 90,842 | | 130,568 | | | |
| | 21,614 | | | TXU Corp | | | 196,169 | | 1,084,807 | | | |
| | 3,300 | | | Ugi Corp New | | | 57,530 | | 67,980 | | | |
| | 18,575 | | | Wisconsin Energy Corp | | | 358,160 | | 725,539 | | | |
| | 12,125 | | | Xcel Energy Inc | | | 108,917 | | 223,828 | | | |
| |
| |
| | | |
| | | | | | | | 5,067,727 | | 8,460,982 | | 3.69 | % |
| |
| |
| | | |
| | Rights/Warrants: | | | | | | | | | | | |
| | 4,286 | | | Lucent Technologies Inc (b) | | | — | | 2,422 | | | |
| |
| |
| | | |
| | | | | | | | — | | 2,422 | | — | % |
| |
| |
| | | |
| | Cash equivalents: | | | | | | | | | | | |
| | 4,871,664 | | | SSGA Money Market Fund, Current Rate 3.98% | | | 4,871,664 | | 4,871,664 | | 2.12 | % |
| |
| |
| |
| |
| | | | | Grand total (c) | | $ | 138,555,137 | | 232,483,733 | | 101.36 | % |
| |
| |
| |
| |
| |
| Notes to investments in securities: |
| | |
| (a) | Securities are valued in accordance with procedures described in note 2 to the financial statements. |
| | |
| (b) | Currently non-income producing assets. |
| | |
| (c) | At December 31, 2005, the cost for federal income tax purposes was $138,555,137. The aggregate gross unrealized appreciation and depreciation of investments in securities based of this cost were as follows: |
| | | | | | | | |
| | Gross unrealized appreciation | | $ | 95,758,335 | | |
| | Gross unrealized depreciation | | | (1,829,739 | ) | |
| | | | |
| | |
| | | Net unrealized appreciation | $ | 93,928,596 | | |
| | | | |
| | |
| (d) | Foreign security values are stated in U.S. dollars. As of December 31, 2005, the value of foreign securities represented 0.61% of net assets. |
| |
| See accompanying notes to financial statements. | 26 | (Continued) |
CLEARWATER INVESTMENT TRUST
Schedule of Investments – Clearwater Growth Fund
December 31, 2005 |
| |
| |
Clearwater Growth Fund Portfolio Diversification
(as a percentage of net assets) |
| |
|
| |
| Cash equivalents and other assets/liabilities represent (1)% of net assets. |
| |
| |
| See accompanying notes to financial statements. | | |
| | | |
CLEARWATER INVESTMENT TRUST
Schedule of Investments – Clearwater Small Cap Fund
December 31, 2005 |
| |
Face
amount
or shares | | Security | | Cost | | Fair
value (a) | | Percent
of
net assets | |
|---|
| |
| |
| |
| |
| |
| Common stocks | | | | | | | | | | | | | |
| | Consumer discretionary | | | | | | | | | | | | |
| | 65,440 | | | Aeropostale (b) | | $ | 1,507,987 | | | 1,721,072 | | | | |
| | 78,000 | | | Cavalier Homes Inc (b) | | | 519,580 | | | 503,100 | | | | |
| | 80,020 | | | Charlotte Russe Hldg Inc (b) | | | 906,592 | | | 1,666,816 | | | | |
| | 20,000 | | | Cobra Electrs Corp (b) | | | 254,818 | | | 267,400 | | | | |
| | 103,550 | | | Commercial Veh Group Inc (b) | | | 2,181,735 | | | 1,944,669 | | | | |
| | 98,500 | | | Fleetwood Enterprises Inc (b) | | | 1,116,829 | | | 1,216,475 | | | | |
| | 50,850 | | | Genesco Inc (b) | | | 1,476,997 | | | 1,972,471 | | | | |
| | 381,150 | | | Hartmarx Corp (b) | | | 2,342,232 | | | 2,976,782 | | | | |
| | 22,079 | | | Noble Intl Ltd | | | 531,974 | | | 460,126 | | | | |
| | 39,450 | | | Oxford Inds Inc | | | 1,455,284 | | | 2,157,915 | | | | |
| | 132,650 | | | Pep Boys Manny Moe & Jack | | | 1,895,384 | | | 1,975,158 | | | | |
| | 54,428 | | | RC2 Corp (b) | | | 1,563,223 | | | 1,933,282 | | | | |
| | 22,000 | | | Rocky Shoes & Boots (b) | | | 525,748 | | | 535,920 | | | | |
| | 80,200 | | | Rush Enterprises Inc (b) | | | 977,685 | | | 1,154,880 | | | | |
| | 66,050 | | | Rush Enterprises Inc (b) | | | 892,069 | | | 982,824 | | | | |
| | 112,400 | | | Stage Stores Inc | | | 2,084,888 | | | 3,347,272 | | | | |
| | | | | | |
| |
| | | | |
| | | | | | | | 20,233,025 | | | 24,816,162 | | | 12.20 | % |
| | | | | | |
| |
| | | | |
| | Energy: | | | | | | | | | | | | | |
| | 58,250 | | | Denbury Res Inc (b) | | | 444,219 | | | 1,326,935 | | | | |
| | 22,000 | | | Edge Pete Corp Del (b) | | | 313,604 | | | 548,020 | | | | |
| | 30,900 | | | Forest Oil Corp (b) | | | 767,204 | | | 1,408,113 | | | | |
| | 23,000 | | | Gmx Res Inc (b) | | | 533,237 | | | 828,000 | | | | |
| | 24,000 | | | Gulf Is Fabrication Inc | | | 655,101 | | | 583,440 | | | | |
| | 9,500 | | | Lufkin Inds Inc | | | 253,477 | | | 473,765 | | | | |
| | 107,400 | | | Oil States Intl Inc (b) | | | 2,016,293 | | | 3,402,432 | | | | |
| | 79,950 | | | Pioneer Drilling Co (b) | | | 1,036,007 | | | 1,433,503 | | | | |
| | 37,100 | | | Remington Oil Gas Corp (b) | | | 756,729 | | | 1,354,150 | | | | |
| | 84,950 | | | Superior Energy Svcs Inc (b) | | | 920,322 | | | 1,788,197 | | | | |
| | 45,900 | | | Universal Compression Hldgs (b) | | | 1,677,228 | | | 1,887,408 | | | | |
| | | | | | |
| |
| | | | |
| | | | | | | | 9,373,421 | | | 15,033,963 | | | 7.39 | % |
| | | | | | |
| |
| | | | |
| | Financials | | | | | | | | | | | | | |
| | 104,750 | | | ACE Cash Express Inc (b) | | | 2,309,594 | | | 2,445,912 | | | | |
| | 70,000 | | | American Equity Invt Life | | | 751,151 | | | 913,500 | | | | |
| | 191,280 | | | Anworth Mtg Asset Corp 1 | | | 1,505,234 | | | 1,396,344 | | | | |
| | 39,150 | | | Bankunited Finl Corp | | | 917,820 | | | 1,040,215 | | | | |
| | 53,000 | | | Beverly Hills Bancorp De | | | 545,069 | | | 549,610 | | | | |
| | 62,650 | | | Commercial Cap Bancorp Inc | | | 977,296 | | | 1,072,568 | | | | |
| | 29,040 | | | Compucredit Corp (b) | | | 772,600 | | | 1,117,459 | | | | |
| | 363,850 | | | Eagle Hospitality Pptys Tr Inc | | | 3,322,634 | | | 2,776,175 | | | | |
| | 230,610 | | | Encore Cap Group Inc (b) | | | 3,795,467 | | | 4,001,083 | | | | |
| | 38,800 | | | First Cmnty Bancorp Calif | | | 1,324,493 | | | 2,109,556 | | | | |
| | 26,500 | | | Gramercy Cap Corp | | | 535,412 | | | 603,670 | | | | |
| | 300,000 | | | Jameson Inns Inc (b) | | | 591,565 | | | 645,000 | | | | |
| | 30,000 | | | Jefferson Bancshares Inc Tenn | | | 394,500 | | | 409,500 | | | | |
| | 242,030 | | | MFA Mtg Invts Inc | | | 1,868,419 | | | 1,379,571 | | | | |
| | 106,750 | | | One Librty Properties Inc | | | 1,750,720 | | | 1,965,267 | | | | |
| | 114,900 | | | Patriot Cap Fdg Inc | | | 1,513,809 | | | 1,401,780 | | �� | | |
| | 28,250 | | | Provident Bankshares Corp | | | 838,266 | | | 954,002 | | | | |
| | 27,500 | | | Reinsurance Group Amer Inc | | | 799,999 | | | 1,313,400 | | | | |
| | 35,000 | | | Sizeler Ppty Invs Inc | | | 430,500 | | | 449,750 | | | | |
| | 47,250 | | | Southern Ct Bancorp Inc (b) | | | 382,861 | | | 334,530 | | | | |
| | 31,500 | | | Sussex Bancorp | | | 427,500 | | | 475,020 | | | | |
| |
| See accompanying notes to financial statements. | 28 | (Continued) |
CLEARWATER INVESTMENT TRUST
Schedule of Investments – Clearwater Small Cap Fund
December 31, 2005 |
| |
Face
amount
or shares | | Security | | Cost | | Fair
value (a) | | Percent
of
net assets | |
|---|
| |
| |
| |
| |
| |
| | 11,000 | | | Taylor Cap Group Inc | | $ | 431,430 | | | 444,400 | | | | |
| | 16,132 | | | Trustmark Corp | | | 451,372 | | | 443,146 | | | | |
| | 12,500 | | | Windrose Med Pptys Tr | | | 161,507 | | | 185,750 | | | | |
| | 16,650 | | | Wintrust Finl Corp | | | 856,684 | | | 914,085 | | | | |
| | 56,050 | | | IPC Holdings Ltd Bermuda (d) | | | 1,622,753 | | | 1,534,649 | | | | |
| | | | | | |
| |
| | | | |
| | | | | | | | 29,278,655 | | | 30,875,942 | | | 15.18 | % |
| | | | | | |
| |
| | | | |
| | Healthcare: | | | | | | | | | | | | | |
| | 74,160 | | | Allied Healthcare Intl Inc (b) | | | 452,082 | | | 455,342 | | | | |
| | 75,550 | | | Amerigroup Corp (b) | | | 1,389,126 | | | 1,470,203 | | | | |
| | 128,400 | | | Andrx Corp Del (b) | | | 2,471,265 | | | 2,114,748 | | | | |
| | 119,200 | | | Angiotech Pharmaceuticals Inc (b) | | | 1,986,883 | | | 1,567,480 | | | | |
| | 32,500 | | | Bentley Pharmaceuticals Inc (b) | | | 331,925 | | | 533,325 | | | | |
| | 256,726 | | | Bioscrip Inc (b) | | | 1,636,993 | | | 1,935,714 | | | | |
| | 49,000 | | | Cardiac Science Corp New (b) | | | 442,838 | | | 443,450 | | | | |
| | 52,350 | | | Centene Corp Del (b) | | | 1,030,442 | | | 1,376,281 | | | | |
| | 368,650 | | | Draxis Health Inc (b) | | | 1,600,842 | | | 1,596,254 | | | | |
| | 145,000 | | | Encore Med Corp (b) | | | 748,091 | | | 717,750 | | | | |
| | 25,000 | | | Enpath Med Inc (b) | | | 188,932 | | | 212,500 | | | | |
| | 38,000 | | | First Horizon Pharmaceutical (b) | | | 694,176 | | | 655,500 | | | | |
| | 75,000 | | | Five Star Quality Care Inc (b) | | | 561,066 | | | 590,250 | | | | |
| | 41,000 | | | Gentiva Health Svcs Inc (b) | | | 607,410 | | | 604,340 | | | | |
| | 381,700 | | | Healthtronics Inc (b) | | | 3,236,952 | | | 2,920,005 | | | | |
| | 852,050 | | | Hooper Holmes Inc | | | 3,218,035 | | | 2,172,727 | | | | |
| | 21,700 | | | Kendle Intl Inc (b) | | | 191,476 | | | 558,558 | | | | |
| | 84,850 | | | Kindred Healthcare Inc (b) | | | 2,414,608 | | | 2,185,736 | | | | |
| | 52,500 | | | Lifecore Biomedical Inc (b) | | | 543,144 | | | 852,075 | | | | |
| | 29,027 | | | Matrixx Initiatives Inc (b) | | | 337,296 | | | 608,116 | | | | |
| | 38,250 | | | Option Care Inc | | | 395,866 | | | 511,020 | | | | |
| | 62,489 | | | Orthologic Corp (b) | | | 171,258 | | | 306,196 | | | | |
| | 48,250 | | | Parexel Intl Corp (b) | | | 1,010,477 | | | 977,545 | | | | |
| | 167,600 | | | Perrigo Co | | | 2,543,354 | | | 2,498,916 | | | | |
| | 96,100 | | | Rehabcare Group Inc (b) | | | 2,018,185 | | | 1,941,220 | | | | |
| | 56,150 | | | Salix Pharmaceuticals Ltd (b) | | | 1,033,944 | | | 987,117 | | | | |
| | 14,841 | | | Schick Technologies Inc (b) | | | 216,161 | | | 489,145 | | | | |
| | 36,200 | | | Sunlink Health Sys Inc (b) | | | 303,041 | | | 381,910 | | | | |
| | 88,950 | | | West Pharmaceutical Svcs Inc | | | 2,247,035 | | | 2,226,419 | | | | |
| | | | | | |
| |
| | | | |
| | | | | | | | 34,022,903 | | | 33,889,842 | | | 16.67 | % |
| | | | | | |
| |
| | | | |
| | Industrials: | | | | | | | | | | | | | |
| | 17,900 | | | Alamo Group Inc | | | 321,294 | | | 366,950 | | | | |
| | 45,450 | | | Arbitron Inc | | | 1,727,661 | | | 1,726,191 | | | | |
| | 86,250 | | | Armor Hldgs Inc (b) | | | 3,245,457 | | | 3,678,563 | | | | |
| | 120,950 | | | Belden Cdt Inc | | | 2,515,235 | | | 2,954,809 | | | | |
| | 65,250 | | | Bisys Group Inc (b) | | | 905,026 | | | 914,153 | | | | |
| | 15,000 | | | Circor Intl Inc | | | 348,618 | | | 384,900 | | | | |
| | 138,200 | | | Covenant Trans Inc (b) | | | 2,190,921 | | | 1,932,036 | | | | |
| | 37,500 | | | Cpi Aerostructures Inc (b) | | | 386,090 | | | 377,250 | | | | |
| | 26,972 | | | Donnelley R R & Sons Co | | | 389,524 | | | 922,712 | | | | |
| | 60,250 | | | Elkcorp | | | 1,819,867 | | | 2,028,015 | | | | |
| | 22,500 | | | Encore Wire Corp (b) | | | 270,945 | | | 512,100 | | | | |
| | 37,000 | | | Ennis Inc | | | 690,070 | | | 672,290 | | | | |
| | 37,750 | | | Esco Technologies Inc (b) | | | 1,909,053 | | | 1,679,498 | | | | |
| | 279,650 | | | Frontier Airls Inc New (b) | | | 2,618,681 | | | 2,583,966 | | | | |
| |
| See accompanying notes to financial statements. | 29 | (Continued) |
CLEARWATER INVESTMENT TRUST
Schedule of Investments – Clearwater Small Cap Fund
December 31, 2005 |
| |
Face
amount
or shares | | Security | | Cost | | Fair
value (a) | | Percent
of
net assets | |
|---|
| |
| |
| |
| |
| |
| | 32,500 | | | Generale Cable Corp Del New (b) | | $ | 452,162 | | | 640,250 | | | | |
| | 16,700 | | | Geo Group Inc (b) | | | 384,370 | | | 382,931 | | | | |
| | 175,600 | | | Griffon Corp (b) | | | 3,591,103 | | | 4,181,036 | | | | |
| | 45,000 | | | GSI Group Inc (b) | | | 403,403 | | | 488,700 | | | | |
| | 33,971 | | | Hardinge Inc | | | 375,380 | | | 586,000 | | | | |
| | 20,800 | | | Harland John H Co | | | 584,256 | | | 782,080 | | | | |
| | 47,400 | | | Ict Group Inc (b) | | | 392,332 | | | 803,430 | | | | |
| | 38,050 | | | Labor Ready Inc (b) | | | 317,137 | | | 792,201 | | | | |
| | 96,250 | | | Miller Inds Inc Tenn (b) | | | 1,300,434 | | | 1,952,913 | | | | |
| | 340,600 | | | Navios Maritime Holdings Inc (b) | | | 1,974,715 | | | 1,573,572 | | | | |
| | 127,767 | | | P A M Transn Svcs Inc (b) | | | 2,404,792 | | | 2,272,975 | | | | |
| | 94,350 | | | Pacer Intl Inc Tn | | | 1,850,424 | | | 2,458,761 | | | | |
| | 149,650 | | | Perini Corp (b) | | | 2,166,580 | | | 3,614,048 | | | | |
| | 79,950 | | | Regal Beloit Corp | | | 2,435,839 | | | 2,830,230 | | | | |
| | 27,500 | | | Teleflex Inc | | | 1,188,943 | | | 1,786,950 | | | | |
| | | | | | |
| |
| | | | |
| | | | | | | | 39,160,312 | | | 45,879,510 | | | 22.56 | % |
| | | | | | |
| |
| | | | |
| | Information technology: | | | | | | | | | | | | |
| | 60,000 | | | 24 / 7 Real Media Inc (b) | | | 202,914 | | | 440,400 | | | | |
| | 45,150 | | | Ade Corp Mass (b) | | | 1,021,441 | | | 1,086,309 | | | | |
| | 156,910 | | | Aladdin Knowledge System Ltd (b) | | | 2,761,325 | | | 2,701,990 | | | | |
| | 41,300 | | | Analogic Corp | | | 1,849,090 | | | 1,976,205 | | | | |
| | 205,800 | | | Arris Group Inc (b) | | | 1,004,888 | | | 1,948,926 | | | | |
| | 85,858 | | | Brooks Automation Inc New (b) | | | 1,165,445 | | | 1,075,801 | | | | |
| | 103,200 | | | C Cor Net Corporation (b) | | | 684,595 | | | 501,552 | | | | |
| | 46,500 | | | Cascade Microtech Inc (b) | | | 618,472 | | | 585,900 | | | | |
| | 66,850 | | | Catapult Communications Corp (b) | | | 972,275 | | | 988,712 | | | | |
| | 337,700 | | | Credence Systems Corp (b) | | | 3,078,063 | | | 2,350,392 | | | | |
| | 46,500 | | | Digitas Inc (b) | | | 393,794 | | | 582,180 | | | | |
| | 190,900 | | | Entegris Inc (b) | | | 1,902,806 | | | 1,798,278 | | | | |
| | 39,500 | | | Epicor Software Corp (b) | | | 509,238 | | | 558,135 | | | | |
| | 89,000 | | | Foundry Networks Inc (b) | | | 851,814 | | | 1,229,090 | | | | |
| | 173,150 | | | Genesis Microchip Inc Del (b) | | | 2,783,765 | | | 3,132,284 | | | | |
| | 150,000 | | | Indus Intl Inc (b) | | | 331,800 | | | 471,000 | | | | |
| | 372,109 | | | Integrated Device Technology (b) | | | 4,113,982 | | | 4,904,397 | | | | |
| | 85,300 | | | Intevac Inc (b) | | | 640,956 | | | 1,125,960 | | | | |
| | 80,000 | | | Lionbridge Technologies Inc (b) | | | 505,399 | | | 561,600 | | | | |
| | 59,000 | | | Magma Design Automation Inc (b) | | | 496,282 | | | 496,190 | | | | |
| | 40,874 | | | Microtune Inc Del (b) | | | 132,950 | | | 170,445 | | | | |
| | 130,400 | | | MPS Group Inc (b) | | | 1,013,790 | | | 1,782,568 | | | | |
| | 100,500 | | | Netgear Inc (b) | | | 1,604,415 | | | 1,934,625 | | | | |
| | 25,700 | | | Netiq (b) | | | 268,925 | | | 315,853 | | | | |
| | 65,530 | | | Plantronics Inc New | | | 1,830,948 | | | 1,854,499 | | | | |
| | 204,100 | | | Quovadx Inc (b) | | | 329,748 | | | 491,881 | | | | |
| | 52,700 | | | Radisys Corp (b) | | | 783,975 | | | 913,818 | | | | |
| | 116,600 | | | Semitool Inc (b) | | | 1,110,953 | | | 1,268,608 | | | | |
| | 327,900 | | | Skyworks Solutions Inc (b) | | | 2,435,986 | | | 1,669,011 | | | | |
| | 166,409 | | | Sypris Solutions Inc | | | 1,869,052 | | | 1,660,762 | | | | |
| | 194,800 | | | Trident Microsystems Inc | | | 1,730,446 | | | 3,506,400 | | | | |
| | 106,550 | | | Viasat Inc (b) | | | 1,871,710 | | | 2,848,082 | | | | |
| | 39,000 | | | Zygo Corp (b) | | | 407,332 | | | 572,910 | | | | |
| | | | | | |
| |
| | | | |
| | | | | | | | 41,278,574 | | | 47,504,763 | | | 23.36 | % |
| | | | | | |
| |
| | | | |
| |
| See accompanying notes to financial statements. | 30 | (Continued) |
CLEARWATER INVESTMENT TRUST
Schedule of Investments – Clearwater Small Cap Fund
December 31, 2005 |
| |
Face
amount
or shares | | Security | | Cost | | Fair
value (a) | | Percent
of
net assets | |
|---|
| |
| |
| |
| |
| |
| | Materials: | | | | | | | | | | | | | |
| | 54,900 | | | Airgas Inc | | $ | 1,298,147 | | | 1,806,210 | | | | |
| | 12,750 | | | Balchem Corp | | | 242,505 | | | 380,078 | | | | |
| | 216,000 | | | Boots & Coots Intl Well Ctl (b) | | | 237,360 | | | 224,640 | | | | |
| | 20,000 | | | Brush Engineered Matls Inc (b) | | | 300,292 | | | 318,000 | | | | |
| | 33,500 | | | Castle A M Co (b) | | | 504,425 | | | 731,640 | | | | |
| | 8,800 | | | Cleveland Cliffs Inc | | | 506,321 | | | 779,416 | | | | |
| | 47,800 | | | Commercial Metals Co | | | 1,204,386 | | | 1,794,412 | | | | |
| | 16,750 | | | Eagle Matls Inc | | | 1,335,985 | | | 2,049,530 | | | | |
| | 32,300 | | | Northwest Pipe Co (b) | | | 713,099 | | | 865,640 | | | | |
| | 27,350 | | | Titanium Metals Corp | | | 900,150 | | | 1,730,161 | | | | |
| | 9,800 | | | Universal Stainless & Alloy Pr (b) | | | 143,272 | | | 147,000 | | | | |
| | 45,100 | | | Zoltek Companies Inc (b) | | | 413,136 | | | 395,978 | | | | |
| | | | | | |
| |
| | | | |
| | | | | | | | 7,799,078 | | | 11,222,705 | | | 5.52 | % |
| | | | | | |
| |
| | | | |
| | Utilities | | | | | | | | | | | | | |
| | 39,700 | | | Connecticut Wtr Svc Inc | | | 722,678 | | | 973,047 | | | | |
| | 46,400 | | | Great Plains Energy Inc | | | 1,158,406 | | | 1,297,344 | | | | |
| | 68,175 | | | Mdu Res Group Inc | | | 1,313,449 | | | 2,232,050 | | | | |
| | 56,100 | | | Oneok Inc New | | | 1,072,375 | | | 1,493,943 | | | | |
| | 25,000 | | | Pike Elec Corp (b) | | | 431,567 | | | 405,500 | | | | |
| | 191,200 | | | Semco Energy Inc (b) | | | 1,095,589 | | | 1,074,544 | | | | |
| | | | | | |
| |
| | | | |
| | | | | | | | 5,794,064 | | | 7,476,428 | | | 3.68 | % |
| | | | | | |
| |
| | | | |
| | Rights/Warrants: | | | | | | | | | | | | | |
| | Industrials: | | | | | | | | | | | | | |
| | 291,350 | | | Navios Maritime Holdings Inc (b) | | | 29,160 | | | 157,329 | | | | |
| | | | | | |
| |
| | | | |
| | | | | | | | 29,160 | | | 157,329 | | | 0.08 | % |
| | | | | | |
| |
| | | | |
| | Corporate Bonds: | | | | | | | | | | | | | |
| | Healthcare: | | | | | | | | | | | | | |
| | 52,871 | | | Del Global Technologies Corp (b) (f) | | | | | | | | | | |
| | | | | Maturing March 28, 2007, Zero
Coupon,6.000% (e) | | | 32,446 | | | 36,509 | | | | |
| | | | | | |
| |
| | | | |
| | | | | | | | 32,446 | | | 36,509 | | | 0.02 | % |
| | | | | | |
| |
| | | | |
| | Cash equivalents: | | | | | | | | | | | | | |
| | 18,554,867 | | | Ssga Money Market Fund, Current Rate 3.98% | | | 18,554,867 | | | 18,554,867 | | | 9.12 | % |
| | | | | | |
| |
| |
| |
| | | | | Grand total (c) | | $ | 205,556,505 | | | 235,448,020 | | | 115.78 | % |
| | | | | | |
| |
| |
| |
| |
|---|
| |
| Notes to investments in securities: |
| | |
| (a) | Securities are valued in accordance with procedures described in note 2 to the financial statements. |
| |
| (b) | Currently non-income producing assets. |
| |
| (c) | At December 31, 2005, the cost for federal income tax purposes was $206,004,195. The aggregate gross unrealized appreciation and depreciation of investments in securities based on this cost were as follows: |
| |
| | Gross unrealized appreciation | $ | 37,561,987 | | |
| | Gross unrealized depreciation | | (8,118,162 | ) | |
| | |
| | |
| | Net unrealized appreciation | $ | 29,443,825 | | |
| | |
| | |
| | |
| (d) | Foreign security values are stated in U.S. dollars. As of December 31, 2005, the value of foreign securities represented 0.75% of net assets. |
| |
| (e) | For zero coupon bonds, the interest rate disclosed represents the annualized effective yield on the date of acquisition. |
| |
| (f) | This security is being fair-valued according to procedures adopted by the Board of Trustees. |
| |
| |
| See accompanying notes to financial statements. | 31 | (Continued) |
CLEARWATER INVESTMENT TRUST
Schedule of Investments – Clearwater Small Cap Fund
December 31, 2005 |
| |
| |
Clearwater Small Cap Fund Portfolio Diversification
(as a percentage of net assets) |
| |
|
| |
| Cash equivalents and other assets/liabilities represent (7)% of net assets. |
| |
| |
| See accompanying notes to financial statements. | | |
CLEARWATER INVESTMENT TRUST
Schedule of Investments – Clearwater Tax-Exempt Bond Fund
December 31, 2005 |
| |
| Face
amount
or shares | | Security | | Maturity
date | | Coupon
rate | | Cost | | Market
value (a) | | Percent
of
net assets | |
|---|
| |
| |
| |
| |
| |
| |
| |
| |
|---|
| | | | Closed-end funds: | | | | | | | | | | | | | | | | |
| | 16,000 | | | Blackrock Insd Mun 2008 | | | | | | | | $ | 253,990 | | | 244,800 | | | | |
| | 7,500 | | | Mbia Cap Claymore Managed | | | | | | | | | 92,400 | | | 93,075 | | | | |
| | 18,000 | | | Seligman Select Mun Fd Inc | | | | | | | | | 176,181 | | | 179,820 | | | | |
| | 23,000 | | | Van Kampen Meritt Mun Opport | | | | | | | | | 324,708 | | | 334,420 | | | | |
| | 300 | | | Van Kampen Merritt Advantage | | | | | | | | | 4,176 | | | 4,467 | | | | |
| | 27,000 | | | Van Kampen Merritt Mun Tr | | | | | | | | | 375,686 | | | 379,080 | | | | |
| | 40,700 | | | Van Kampen Merritt Select Sect | | | | | | | | | 496,980 | | | 501,424 | | | | |
| | 18,000 | | | Van Kampen Merritt Tr Invt | | | | | | | | | 260,100 | | | 260,460 | | | | |
| | 30,000 | | | Van Kampen Merritt Value Mun | | | | | | | | | 396,073 | | | 403,800 | | | | |
| | | | | | | | | | | | |
| |
| | | | |
| | | | | | | | | | | | | | 2,380,294 | | | 2,401,346 | | | 1.07 | % |
| | | | | | | | | | | | |
| |
| | | | |
| | | | Municipal bonds: | | | | | | | | | | | | | | | | |
| | 950,000 | | | Abilene Tx Hlth Facs Dev Corp | | | 11/15/2028 | | | 5.250 | | | 950,048 | | | 950,950 | | | | |
| | 500,000 | | | Agua Caiente Band | | | 7/1/2008 | | | 4.600 | | | 504,038 | | | 504,300 | | | | |
| | 190,000 | | | Akron Oh Ctfs Partn | | | 12/1/2007 | | | 6.500 | | | 198,552 | | | 199,010 | | | | |
| | 220,000 | | | Akron Oh Ctfs Partn | | | 12/1/2016 | | | 6.900 | | | 202,714 | | | 231,209 | | | | |
| | 200,000 | | | Alabama Spl Care Facs Fing | | | 11/1/2019 | | | 5.000 | | | 211,370 | | | 210,784 | | | | |
| | 995,000 | | | Alaska St Hsg Fin Corp ( C ) | | | 12/1/2017 | | | 6.239 | | | 479,896 | | | 499,560 | | | | |
| | 300,000 | | | Albany Ny Indl Dev Agy Civic | | | 5/1/2016 | | | 6.500 | | | 300,000 | | | 301,872 | | | | |
| | 500,000 | | | Alexandria Va Redev & Hsg Auth | | | 10/1/2029 | | | 6.125 | | | 530,043 | | | 528,265 | | | | |
| | 300,000 | | | Allegheny Cnty Pa Hosp Dev | | | 4/1/2008 | | | 3.300 | | | 297,116 | | | 294,891 | | | | |
| | 340,000 | | | Allegheny Cnty Pa Hosp Dev | | | 4/1/2009 | | | 3.500 | | | 334,874 | | | 333,475 | | | | |
| | 350,000 | | | Allegheny Cnty Pa Hosp Dev | | | 4/1/2010 | | | 3.875 | | | 342,955 | | | 347,316 | | | | |
| | 400,000 | | | Allegheny Cnty Pa Hosp Dev | | | 4/1/2007 | | | 3.100 | | | 398,301 | | | 395,364 | | | | |
| | 800,000 | | | Arizona Health Facs Auth Rev | | | 11/15/2009 | | | 6.500 | | | 800,000 | | | 839,272 | | | | |
| | 1,750,000 | | | Arlington Tx Spl Oblig | | | 8/15/2034 | | | 5.000 | | | 1,887,137 | | | 1,859,830 | | | | |
| | 600,000 | | | Atlanta Ga Dev Auth Rev | | | 1/1/2031 | | | 5.000 | | | 615,071 | | | 610,224 | | | | |
| | 900,000 | | | Atlanta Ga Tax Allocation | | | 1/1/2020 | | | 5.400 | | | 893,557 | | | 903,114 | | | | |
| | 855,000 | | | Austin Tx Conv Enterprises | | | 1/1/2023 | | | 6.000 | | | 902,184 | | | 912,627 | | | | |
| | 500,000 | | | Austin Tx Convention Enterpris | | | 1/1/2016 | | | 6.375 | | | 503,505 | | | 527,950 | | | | |
| | 50,000 | | | Austin Tx Util Sys Rev | | | 5/15/2018 | | | 5.250 | | | 50,154 | | | 50,074 | | | | |
| | 305,000 | | | Badger Tob Asset Securitizatio | | | 6/1/2027 | | | 6.125 | | | 307,126 | | | 322,175 | | | | |
| | 735,000 | | | Badger Tob Asset Securitizatio | | | 6/1/2017 | | | 6.000 | | | 768,891 | | | 773,051 | | | | |
| | 50,000 | | | Bay Area Govt Assoc Ca Rev | | | 12/15/2014 | | | 6.000 | | | 51,710 | | | 51,142 | | | | |
| | 125,000 | | | Beaumont Tx Hsg Auth Mlt Fam | | | 11/1/2010 | | | 6.750 | | | 121,166 | | | 117,935 | | | | |
| | 550,000 | | | Beaver Cnty Pa Pollutn Ctl Rev | | | 5/1/2020 | | | 7.750 | | | 573,570 | | | 562,205 | | | | |
| | 190,000 | | | Benton Harbor Mi Charter | | | 5/1/2009 | | | 10.000 | | | 190,000 | | | 190,399 | | | | |
| | 550,000 | | | Beverly Hills Ca Pub Fin Auth | | | 6/1/2023 | | | 5.000 | | | 554,143 | | | 564,146 | | | | |
| | 1,250,000 | | | Bexar Cnty Tx Hlth Facs Devcp | | | 11/15/2023 | | | 6.100 | | | 1,308,389 | | | 1,299,213 | | | | |
| | 535,000 | | | Bexar Cnty Tx Hsg Fin Corp Mf | | | 9/15/2021 | | | 8.750 | | | 535,000 | | | 513,579 | | | | |
| | 630,000 | | | Bexar Cnty Tx Hsg Fin Corp Mf | | | 8/1/2030 | | | 8.125 | | | 606,548 | | | 639,513 | | | | |
| | 800,000 | | | Bexar Cnty Tx Hsg Fin Corp Mf | | | 4/1/2030 | | | 9.000 | | | 799,357 | | | 780,208 | | | | |
| | 1,030,000 | | | Bexar Cnty Tx Hsg Fin Corp Mf | | | 6/1/2031 | | | 10.500 | | | 1,030,000 | | | 987,327 | | | | |
| | 1,095,000 | | | Bexar Cnty Tx Hsg Fin Corp Mf | | | 12/1/2036 | | | 9.250 | | | 1,067,676 | | | 1,042,155 | | | | |
| | 725,000 | | | Bexar Cnty Tx Rev | | | 8/15/2022 | | | 5.750 | | | 773,834 | | | 772,190 | | | | |
| | 500,000 | | | Birmingham Southern College Al | | | 12/1/2019 | | | 5.350 | | | 506,196 | | | 504,705 | | | | |
| | 500,000 | | | Boone Cnty Ind Redev Dist Tax | | | 8/1/2023 | | | 5.375 | | | 506,773 | | | 515,690 | | | | |
| | 650,000 | | | Bremer Cnty Ia Retirement Fac | | | 11/15/2030 | | | 4.500 | | | 650,000 | | | 650,098 | | | | |
| | 550,000 | | | Bridgeville Del Spl Oblig | | | 7/1/2035 | | | 5.125 | | | 550,000 | | | 554,114 | | | | |
| | 250,000 | | | Broadview Il Tax Increment | | | 7/1/2007 | | | 5.000 | | | 251,941 | | | 254,178 | | | | |
| | 125,000 | | | Brownsville Tx ( C ) | | | 2/15/2011 | | | 4.887 | | | 96,850 | | | 93,140 | | | | |
| | 185,000 | | | Bullhead City Az Spl Assmt | | | 1/1/2010 | | | 6.100 | | | 185,992 | | | 187,239 | | | | |
| | 200,000 | | | Calexico Ca Cmnty Redev Agy | | | 8/1/2026 | | | 5.375 | | | 208,355 | | | 211,910 | | | | |
| | 380,000 | | | California Cmntys Hsg Fin Agy | | | 8/1/2011 | | | 5.000 | | | 378,423 | | | 387,570 | | | | |
| | 400,000 | | | California Cmntys Hsg Fin Agy | | | 11/1/2012 | | | 4.850 | | | 398,057 | | | 401,512 | | | | |
| | 470,000 | | | California Cmntys Hsg Fin Agy | | | 8/1/2012 | | | 4.650 | | | 467,777 | | | 468,430 | | | | |
| | 570,000 | | | California Cmntys Hsg Fin Agy | | | 10/1/2011 | | | 5.000 | | | 568,784 | | | 581,651 | | | | |
| | 580,000 | | | California Cmntys Hsg Fin Agy | | | 12/1/2011 | | | 5.000 | | | 578,734 | | | 587,018 | | | | |
| | 200,000 | | | California Cnty | | | 6/1/2023 | | | 5.625 | | | 190,709 | | | 202,306 | | | | |
| | 1,115,000 | | | California Cnty Calif Tob | | | 6/1/2019 | | | 4.750 | | | 1,074,747 | | | 1,126,942 | | | | |
| | 500,000 | | | California Health Facs Fing | | | 8/1/2027 | | | 5.125 | | | 521,731 | | | 521,175 | | | | |
| | 40,000 | | | California St | | | 10/1/2020 | | | 5.250 | | | 41,193 | | | 40,582 | | | | |
| | 275,000 | | | California St Dept Wtr Res | | | 12/1/2022 | | | 5.000 | | | 277,291 | | | 285,065 | | | | |
| | 500,000 | | | California St Dept Wtr Res | | | 7/1/2022 | | | 5.250 | | | 505,643 | | | 509,850 | | | | |
| | 120,000 | | | California St Dept Wtr Res Cen | | | 12/1/2027 | | | 5.375 | | | 125,715 | | | 123,692 | | | | |
| |
| See accompanying notes to financial statements. | 33 | (Continued) |
CLEARWATER INVESTMENT TRUST
Schedule of Investments – Clearwater Tax-Exempt Bond Fund
December 31, 2005 |
| |
| Face
amount
or shares | | Security | | Maturity
date | | Coupon
rate | | Cost | | Market
value (a) | | Percent
of
net assets | |
|---|
| |
| |
| |
| |
| |
| |
| |
| |
|---|
| | 650,000 | | | California St Economic Rec | | | 7/1/2017 | | | 5.000 | | $ | 667,772 | | | 696,904 | | | | |
| | 200,000 | | | California St Pub Wks Lease | | | 6/1/2019 | | | 5.500 | | | 203,861 | | | 202,012 | | | | |
| | 350,000 | | | California St Pub Wks Lease | | | 6/1/2023 | | | 5.000 | | | 351,357 | | | 350,144 | | | | |
| | 375,000 | | | California St Pub Wks Lease | | | 6/1/2021 | | | 5.500 | | | 383,015 | | | 375,349 | | | | |
| | 2,000,000 | | | California St Pub Wks Lease | | | 1/1/2017 | | | 5.500 | | | 2,106,728 | | | 2,040,120 | | | | |
| | 750,000 | | | California Statewide Cmntys | | | 3/1/2035 | | | 5.000 | | | 757,753 | | | 757,755 | | | | |
| | 975,000 | | | California Statewide Cmntys | | | 1/1/2012 | | | 5.625 | | | 975,000 | | | 975,566 | | | | |
| | 1,500,000 | | | California Statewide Cmntys | | | 10/1/2020 | | | 11.000 | | | 1,500,000 | | | 1,538,265 | | | | |
| | 500,000 | | | California Stwde Cmntys Dev | | | 1/1/2024 | | | 5.350 | | | 508,203 | | | 500,780 | | | | |
| | 40,000 | | | Capital Region Cmnty Dev Dist | | | 5/1/2006 | | | 5.950 | | | 39,993 | | | 40,000 | | | | |
| | 500,000 | | | Capital Tr Agy Fl Rev | | | 10/1/2033 | | | 8.950 | | | 500,000 | | | 618,490 | | | | |
| | 500,000 | | | Capital Tr Agy Fla Multifamily | | | 6/1/2013 | | | 4.750 | | | 500,000 | | | 484,330 | | | | |
| | 330,000 | | | Carthage Mo Hosp Rev | | | 4/1/2007 | | | 4.000 | | | 330,000 | | | 330,254 | | | | |
| | 750,000 | | | Carthage Mo Hosp Rev | | | 4/1/2010 | | | 4.500 | | | 731,551 | | | 733,298 | | | | |
| | 1,000,000 | | | Carver Cnty Mn Hsg & Redev | | | 8/1/2027 | | | 5.875 | | | 946,804 | | | 1,041,950 | | | | |
| | 1,130,000 | | | Central Falls Ri Detention Fac | | | 1/15/2009 | | | 6.000 | | | 1,130,000 | | | 1,135,899 | | | | |
| | 400,000 | | | Chartiers Valley Pa Indl & | | | 8/15/2012 | | | 5.000 | | | 396,644 | | | 407,012 | | | | |
| | 650,000 | | | Chesapeake Va Hosp Auth Hosp | | | 7/1/2016 | | | 4.250 | | | 639,157 | | | 631,748 | | | | |
| | 250,000 | | | Chesterfield Cnty Va Indl Dev | | | 6/1/2017 | | | 5.875 | | | 257,848 | | | 272,698 | | | | |
| | 450,000 | | | Chesterfield Cnty Va Indl Dev | | | 7/1/2019 | | | 5.200 | | | 408,464 | | | 464,175 | | | | |
| | 145,000 | | | Chesterfield Mo Rev | | | 4/15/2016 | | | 4.500 | | | 144,280 | | | 145,036 | | | | |
| | 1,500,000 | | | Chicago IL | | | 1/1/2025 | | | 5.125 | | | 1,552,885 | | | 1,531,680 | | | | |
| | 150,000 | | | Chicago IL Met Hsg Dev Corp | | | 7/1/2022 | | | 6.850 | | | 155,100 | | | 152,006 | | | | |
| | 2,500,000 | | | Chicago IL Ohare Intl Arpt Rev | | | 1/1/2018 | | | 5.000 | | | 2,547,473 | | | 2,503,200 | | | | |
| | 1,000,000 | | | Chicago IL Tax Increment | | | 12/1/2008 | | | 6.500 | | | 983,770 | | | 1,065,530 | | | | |
| | 500,000 | | | Citizen Potawatomi Nation Ok | | | 9/1/2016 | | | 6.500 | | | 500,000 | | | 525,985 | | | | |
| | 350,000 | | | City of Dearborn Heights Build | | | 10/1/2027 | | | 5.150 | | | 360,378 | | | 351,341 | | | | |
| | 950,000 | | | Clark Cnty Nv Indl Dev Rev | | | 10/1/2022 | | | 7.200 | | | 961,590 | | | 986,727 | | | | |
| | 500,000 | | | Clark Cnty Nv Pollutn Ctl Rev | | | 6/1/2019 | | | 6.600 | | | 520,612 | | | 507,010 | | | | |
| | 745,000 | | | Clay Cnty IL Hosp Rev | | | 12/1/2018 | | | 5.700 | | | 745,000 | | | 753,225 | | | | |
| | 500,000 | | | Cleveland Cuyahoga Cnty Oh | | | 5/15/2023 | | | 5.250 | | | 500,000 | | | 510,600 | | | | |
| | 275,000 | | | Colorado Edl & Cultural Facs | | | 6/15/2012 | | | 4.625 | | | 269,750 | | | 267,883 | | | | |
| | 400,000 | | | Colorado Edl & Cultural Facs A | | | 11/1/2007 | | | 4.500 | | | 405,033 | | | 403,296 | | | | |
| | 250,000 | | | Colorado Health Facs Auth Rev | | | 12/1/2007 | | | 6.200 | | | 256,752 | | | 255,463 | | | | |
| | 295,000 | | | Colorado Health Facs Auth Rev | | | 12/1/2008 | | | 4.400 | | | 292,610 | | | 298,717 | | | | |
| | 500,000 | | | Colorado Health Facs Auth Rev | | | 9/1/2021 | | | 5.250 | | | 521,265 | | | 524,155 | | | | |
| | 575,000 | | | Colorado Health Facs Auth Rev | | | 12/1/2010 | | | 6.250 | | | 581,510 | | | 635,668 | | | | |
| | 1,000,000 | | | Colorado Health Facs Auth Rev | | | 10/1/2027 | | | 5.900 | | | 1,015,146 | | | 1,072,790 | | | | |
| | 425,000 | | | Concorde Estates Cmnty Dev Dis | | | 5/1/2011 | | | 5.000 | | | 423,019 | | | 427,244 | | | | |
| | 250,000 | | | Connecticut St | | | 7/1/2025 | | | 5.000 | | | 255,140 | | | 259,578 | | | | |
| | 450,000 | | | Connecticut St Hlth & Edl Fac | | | 11/1/2012 | | | 5.875 | | | 456,473 | | | 450,536 | | | | |
| | 375,000 | | | Connecticut St Hlth & Edl Facs | | | 11/1/2012 | | | 5.875 | | | 379,688 | | | 375,446 | | | | |
| | 750,000 | | | Converse Cnty Wy Hosp Rev | | | 12/1/2015 | | | 7.900 | | | 750,000 | | | 888,540 | | | | |
| | 250,000 | | | Coralville Ia | | | 6/1/2018 | | | 5.000 | | | 247,706 | | | 264,248 | | | | |
| | 245,000 | | | Cow Creek Bank Umpqua Tribe | | | 7/1/2012 | | | 5.100 | | | 234,876 | | | 247,124 | | | | |
| | 1,070,000 | | | Crow Fin Auth Minn Tribal Pur | | | 10/1/2017 | | | 5.650 | | | 1,010,408 | | | 1,119,990 | | | | |
| | 100,000 | | | Cuyahoga Cnty Oh Hosp Rev | | | 1/15/2016 | | | 5.500 | | | 105,472 | | | 102,166 | | | | |
| | 400,000 | | | Dade Cnty Fl Hlth Fac Hosp Rev | | | 5/15/2021 | | | 5.250 | | | 405,677 | | | 400,536 | | | | |
| | 200,000 | | | Dade Cnty Fl Sch Dist | | | 2/15/2015 | | | 5.000 | | | 209,567 | | | 205,532 | | | | |
| | 270,000 | | | Dakota Cnty Mn Hsg & Redev | | | 2/20/2032 | | | 6.875 | | | 281,164 | | | 287,898 | | | | |
| | 496,000 | | | Dallas Tx Hsg Fin Corp | | | 10/20/2032 | | | 6.750 | | | 512,414 | | | 536,766 | | | | |
| | 750,000 | | | Dayton Oh Spl Facs Rev | | | 2/1/2018 | | | 5.625 | | | 803,354 | | | 790,343 | | | | |
| | 300,000 | | | Decatur Tx Hosp Auth Hosp Rev | | | 9/1/2007 | | | 4.125 | | | 300,000 | | | 296,124 | | | | |
| | 215,000 | | | Delaware Cnty Pa Auth Hosp Rev | | | 12/15/2020 | | | 5.300 | | | 222,478 | | | 215,282 | | | | |
| | 905,000 | | | Delaware Cnty Pa Auth Hosp Rev | | | 12/15/2006 | | | 4.000 | | | 916,076 | | | 909,407 | | | | |
| | 500,000 | | | Delta St Univ Edl Bldg Corp | | | 12/1/2018 | | | 5.000 | | | 524,569 | | | 523,655 | | | | |
| | 1,000,000 | | | Denver Co City & Cnty Arpt Rev | | | 11/15/2025 | | | 5.500 | | | 1,032,261 | | | 1,026,320 | | | | |
| | 155,000 | | | Desloge Mo Tax Increment Rev | | | 4/15/2007 | | | 4.000 | | | 155,236 | | | 154,704 | | | | |
| | 585,000 | | | Detroit Cmnty High Sch Mi | | | 11/1/2010 | | | 5.000 | | | 585,000 | | | 581,121 | | | | |
| | 500,000 | | | Detroit Lakes Mn Hsg & Health | | | 8/1/2034 | | | 4.250 | | | 500,000 | | | 501,670 | | | | |
| | 1,250,000 | | | Director St Nv Dept Business | | | 11/15/2014 | | | 6.000 | | | 1,233,032 | | | 1,290,150 | | | | |
| | 250,000 | | | District Columbia Rev | | | 11/15/2026 | | | 5.750 | | | 265,932 | | | 256,980 | | | | |
| | 220,000 | | | Double Branch Cmnty Dev Dist | | | 5/1/2008 | | | 5.125 | | | 219,592 | | | 221,272 | | | | |
| | 8,345 | | | Drew Cnty Ar Pub Facs Brd | | | 8/1/2011 | | | 7.750 | | | 8,345 | | | 8,353 | | | | |
| | 500,000 | | | Durbin Crossing Cmnty Dev | | | 11/1/2010 | | | 4.875 | | | 499,395 | | | 500,820 | | | | |
| |
| See accompanying notes to financial statements. | 34 | (Continued) |
CLEARWATER INVESTMENT TRUST
Schedule of Investments – Clearwater Tax-Exempt Bond Fund
December 31, 2005 |
| |
| Face
amount
or shares | | Security | | Maturity
date | | Coupon
rate | | Cost | | Market
value (a) | | Percent
of
net assets | |
|---|
| |
| |
| |
| |
| |
| |
| |
| |
|---|
| | 680,000 | | | Eagle Mountain Ut Spl Assmt | | | 2/1/2007 | | | 8.000 | | $ | 680,000 | | | 684,978 | | | | |
| | 800,000 | | | Eden Prairie Mn Mlt Fam Hsg | | | 2/20/2043 | | | 6.200 | | | 875,870 | | | 867,312 | | | | |
| | 600,000 | | | El Paso Cnty Tex Hsg Fin Corp | | | 12/1/2015 | | | 7.000 | | | 600,000 | | | 600,534 | | | | |
| | 400,000 | | | El Paso Tx Health Facs Dev | | | 8/15/2012 | | | 7.000 | | | 400,000 | | | 432,076 | | | | |
| | 500,000 | | | Erie Cnty Oh Hosp Facs Rev | | | 8/15/2013 | | | 6.000 | | | 545,696 | | | 552,385 | | | | |
| | 500,000 | | | Estherville Ia Hosp Rev | | | 7/1/2020 | | | 6.300 | | | 511,742 | | | 541,875 | | | | |
| | 800,000 | | | Fiddlers Creek Cmnty Dev Dist | | | 5/1/2013 | | | 5.750 | | | 794,065 | | | 834,664 | | | | |
| | 100,000 | | | Fishawk Cmnty Dev Dist Ii | | | 11/1/2007 | | | 5.000 | | | 99,824 | | | 100,477 | | | | |
| | 700,000 | | | Florida Hsg Fin Corp Rev | | | 10/1/2030 | | | 5.750 | | | 735,694 | | | 735,028 | | | | |
| | 350,000 | | | Florida St Div Bd Fin Dept | | | 7/1/2011 | | | 5.000 | | | 368,843 | | | 361,855 | | | | |
| | 1,350,000 | | | Forest Creek Cmnty Dev Dist | | | 5/1/2011 | | | 4.850 | | | 1,348,376 | | | 1,349,595 | | | | |
| | 250,000 | | | Fulco Ga Hosp Auth Antic Ctfs | | | 11/15/2028 | | | 5.000 | | | 260,620 | | | 256,395 | | | | |
| | 500,000 | | | Garden Grove Ca Ctfs Partn | | | 8/1/2023 | | | 5.700 | | | 514,258 | | | 501,075 | | | | |
| | 290,000 | | | Gateway Svcs Cmnty Dev Dist Fl | | | 5/1/2010 | | | 5.500 | | | 288,338 | | | 291,952 | | | | |
| | 20,000 | | | Georgia Mun Elec Auth Pwr Rev (C) | | | 1/1/2012 | | | 4.743 | | | 14,978 | | | 14,361 | | | | |
| | 280,000 | | | Georgia Mun Elec Auth Pwr Rev (C) | | | 1/1/2012 | | | 5.557 | | | 200,910 | | | 195,908 | | | | |
| | 1,000,000 | | | Golden St Tob Securitization (C) | | | 6/1/2022 | | | 1.294 | | | 808,724 | | | 817,480 | | | | |
| | 1,750,000 | | | Golden St Tob Securitization | | | 6/1/2019 | | | 5.000 | | | 1,823,648 | | | 1,815,835 | | | | |
| | 250,000 | | | Greenville Cnty S C Bldg Equit | | | 12/1/2028 | | | 5.500 | | | 269,703 | | | 269,785 | | | | |
| | 585,000 | | | Grove City Pa Area Hosp Auth | | | 7/1/2012 | | | 5.250 | | | 584,251 | | | 587,580 | | | | |
| | 500,000 | | | Harris Cnty Tx | | | 8/1/2033 | | | 5.000 | | | 507,309 | | | 512,895 | | | | |
| | 1,000,000 | | | Harris Cnty Tx | | | 8/15/2035 | | | 5.250 | | | 1,047,556 | | | 1,047,180 | | | | |
| | 500,000 | | | Hawaii St Dept Budget & Fin | | | 11/15/2009 | | | 6.750 | | | 500,000 | | | 528,350 | | | | |
| | 500,000 | | | Hawaii St Dept Budget & Fin Sp | | | 11/15/2009 | | | 6.250 | | | 500,000 | | | 501,975 | | | | |
| | 315,000 | | | Hayward Ca Ctfs Partn | | | 8/1/2026 | | | 5.250 | | | 323,437 | | | 321,070 | | | | |
| | 765,000 | | | Heritage Isle at Viera Cmnty | | | 11/1/2009 | | | 5.000 | | | 766,674 | | | 768,978 | | | | |
| | 1,000,000 | | | Highlands Cnty Fl Health Rev | | | 11/15/2030 | | | 5.000 | | | 1,026,935 | | | 1,015,130 | | | | |
| | 525,000 | | | Highlands Cnty Fla Health Facs | | | 11/15/2027 | | | 5.000 | | | 531,273 | | | 534,602 | | | | |
| | 500,000 | | | Himalaya Wtr & Santn Dist Co | | | 12/1/2035 | | | 5.000 | | | 513,998 | | | 515,565 | | | | |
| | 250,000 | | | Houston Tx Hlth Facs Dev Corp | | | 2/15/2034 | | | 4.750 | | | 250,000 | | | 250,018 | | | | |
| | 350,000 | | | Houston Tx Hlth Facs Dev Corp | | | 2/15/2034 | | | 5.000 | | | 350,000 | | | 350,035 | | | | |
| | 850,000 | | | Houston Tx Hlth Facs Dev Corp | | | 2/15/2023 | | | 7.000 | | | 850,000 | | | 938,630 | | | | |
| | 110,000 | | | Idaho Health Facs Auth Hosp | | | 8/1/2010 | | | 6.000 | | | 110,827 | | | 112,464 | | | | |
| | 120,000 | | | Idaho Health Facs Auth Hosp | | | 8/1/2009 | | | 5.750 | | | 120,922 | | | 122,364 | | | | |
| | 245,000 | | | Idaho Hsg & Fin Assn | | | 8/1/2017 | | | 6.250 | | | 245,000 | | | 245,382 | | | | |
| | 380,000 | | | Idaho Hsg & Fin Assn Non Profi | | | 8/1/2010 | | | 5.750 | | | 380,000 | | | 380,205 | | | | |
| | 170,000 | | | Illinois Dev Fin Auth Pollutn | | | 2/1/2024 | | | 5.700 | | | 174,664 | | | 170,366 | | | | |
| | 1,300,000 | | | Illinois Dev Fin Auth Pollutn | | | 3/1/2014 | | | 5.500 | | | 1,358,290 | | | 1,326,845 | | | | |
| | 2,500,000 | | | Illinois Dev Fin Auth Pollutn | | | 8/15/2026 | | | 5.950 | | | 2,580,030 | | | 2,578,725 | | | | |
| | 250,000 | | | Illinois Dev Fin Auth Rev | | | 7/1/2009 | | | 5.900 | | | 255,162 | | | 256,963 | | | | |
| | 3,000,000 | | | Illinois Dev Fin Auth Rev | | | 7/1/2019 | | | 6.050 | | | 3,084,142 | | | 3,097,050 | | | | |
| | 500,000 | | | Illinois Fin Auth Rev | | | 5/15/2012 | | | 5.100 | | | 497,298 | | | 499,565 | | | | |
| | 750,000 | | | Illinois Fin Auth Rev | | | 11/15/2035 | | | 5.000 | | | 750,000 | | | 750,540 | | | | |
| | 500,000 | | | Illinois Fin Auth Student Hsg | | | 6/1/2007 | | | 5.000 | | | 512,573 | | | 506,430 | | | | |
| | 500,000 | | | Illinois Hlth Facs Auth Rev | | | 2/15/2019 | | | 6.000 | | | 506,812 | | | 501,495 | | | | |
| | 500,000 | | | Illinois Hlth Facs Auth Rev | | | 11/15/2025 | | | 5.500 | | | 511,051 | | | 500,755 | | | | |
| | 305,000 | | | Illinois Hsg Dev Auth Elderly | | | 1/1/2007 | | | 6.625 | | | 306,368 | | | 305,418 | | | | |
| | 500,000 | | | Illinois St | | | 7/1/2010 | | | 5.500 | | | 509,745 | | | 508,415 | | | | |
| | 250,000 | | | Illinois St Sales Tax Rev | | | 6/15/2009 | | | 5.000 | | | 255,751 | | | 251,975 | | | | |
| | 1,000,000 | | | Indiana Health & Edl Fac Fing | | | 11/15/2025 | | | 5.250 | | | 1,023,181 | | | 1,037,000 | | | | |
| | 150,000 | | | Indiana Hlth Fac Fing Auth Rev | | | 8/15/2018 | | | 5.000 | | | 127,697 | | | 150,255 | | | | |
| | 620,000 | | | Indiana Hlth Fac Fing Auth Rev | | | 8/15/2009 | | | 4.750 | | | 585,259 | | | 626,752 | | | | |
| | 300,000 | | | Indiana Hlth Fac Hosp Rev | | | 1/1/2023 | | | 6.000 | | | 312,090 | | | 300,351 | | | | |
| | 350,000 | | | Indiana Hlth Fac Hosp Rev | | | 2/15/2018 | | | 5.250 | | | 357,478 | | | 360,469 | | | | |
| | 750,000 | | | Indiana Hlth Fac Hosp Rev | | | 8/1/2008 | | | 6.000 | | | 762,133 | | | 782,018 | | | | |
| | 300,000 | | | Indiana Transn Fin Auth Hwy | | | 12/1/2025 | | | 5.375 | | | 315,691 | | | 319,791 | | | | |
| | 300,000 | | | Intercommunity Hosp Auth Ca Ct | | | 11/1/2019 | | | 5.250 | | | 313,181 | | | 310,122 | | | | |
| | 200,000 | | | Interlocken Mt Cist Co | | | 12/15/2019 | | | 5.750 | | | 217,854 | | | 214,668 | | | | |
| | 450,000 | | | Intermountain Pwr Agy Ut Rev | | | 7/1/2021 | | | 5.000 | | | 464,027 | | | 462,020 | | | | |
| | 200,000 | | | Iowa Fin Auth Retirement Cmnty | | | 11/15/2009 | | | 4.250 | | | 198,237 | | | 196,004 | | | | |
| | 200,000 | | | Iowa Fin Auth Retirement Cmnty | | | 11/15/2011 | | | 4.750 | | | 197,476 | | | 197,480 | | | | |
| | 300,000 | | | Irving Tx Hosp Auth Rev | | | 7/1/2007 | | | 5.600 | | | 304,122 | | | 300,543 | | | | |
| | 250,000 | | | Johnson City Tn Health & Edl | | | 2/15/2009 | | | 4.500 | | | 248,192 | | | 249,528 | | | | |
| | 290,000 | | | Joplin Mo Indl Dev Auth Health | | | 2/15/2008 | | | 4.000 | | | 293,883 | | | 290,658 | | | | |
| | 1,000,000 | | | Kent Hosp Fin Auth Mich Rev | | | 7/1/2035 | | | 6.000 | | | 1,067,212 | | | 1,078,130 | | | | |
| |
| See accompanying notes to financial statements. | 35 | (Continued) |
CLEARWATER INVESTMENT TRUST
Schedule of Investments – Clearwater Tax-Exempt Bond Fund
December 31, 2005 |
| |
| Face
amount
or shares | | Security | | Maturity
date | | Coupon
rate | | Cost | | Market
value (a) | | Percent
of
net assets | |
|---|
| |
| |
| |
| |
| |
| |
| |
| |
|---|
| | 500,000 | | | Lake Ashton II Cmnty Dev Dist | | | 11/1/2010 | | | 4.875 | | $ | 500,000 | | | 501,400 | | | | |
| | 500,000 | | | Lake Orion Mi Cmnty Sch Dist | | | 5/1/2025 | | | 5.250 | | | 522,065 | | | 526,925 | | | | |
| | 100,000 | | | Lamar Cnty Ms Pollutn Ctl Rev | | | 12/1/2006 | | | 4.850 | | | 101,048 | | | 100,375 | | | | |
| | 250,000 | | | Lebanon Cnty Pa Health Facs | | | 12/15/2008 | | | 4.000 | | | 250,000 | | | 247,928 | | | | |
| | 250,000 | | | Lehigh Cnty Pa Gen Purp Auth | | | 4/1/2017 | | | 6.650 | | | 264,888 | | | 255,990 | | | | |
| | 300,000 | | | Lewis Cnty Wa Pub Hosp Dist | | | 12/1/2011 | | | 6.000 | | | 302,383 | | | 305,274 | | | | |
| | 500,000 | | | Lewisville Tx Combination Cont | | | 9/1/2012 | | | 5.750 | | | 513,864 | | | 548,450 | | | | |
| | 550,000 | | | Lombard IL Pub Facs Corp | | | 1/1/2030 | | | 5.500 | | | 582,085 | | | 588,649 | | | | |
| | 500,000 | | | Lombard IL Pub Facs Corp Rev | | | 1/1/2015 | | | 6.375 | | | 500,000 | | | 509,070 | | | | |
| | 300,000 | | | Lombard ILL Pub Facs Corp | | | 1/1/2025 | | | 5.500 | | | 320,696 | | | 322,575 | | | | |
| | 800,000 | | | Long Beach Miss Urban Renewal | | | 3/1/2026 | | | 8.000 | | | 800,000 | | | 785,744 | | | | |
| | 100,000 | | | Los Angeles Ca Cmnty Redev Agy | | | 7/1/2007 | | | 4.875 | | | 101,097 | | | 100,139 | | | | |
| | 270,000 | | | Los Angeles Ca Wstwtr Sys Rev | | | 11/1/2019 | | | 4.700 | | | 271,926 | | | 270,116 | | | | |
| | 400,000 | | | Loudoun Cnty Va Dev Indl Auth | | | 8/1/2028 | | | 5.000 | | | 400,000 | | | 410,676 | | | | |
| | 520,000 | | | Louisiana Loc Govt Envir Facs | | | 6/20/2028 | | | 8.000 | | | 520,000 | | | 519,891 | | | | |
| | 250,000 | | | Louisiana Pub Facs Auth Rev | | | 12/1/2015 | | | 6.500 | | | 260,509 | | | 254,833 | | | | |
| | 270,000 | | | Louisiana Pub Facs Auth Rev | | | 5/15/2027 | | | 5.500 | | | 273,564 | | | 274,644 | | | | |
| | 785,000 | | | Louisiana Pub Facs Auth Rev | | | 9/1/2024 | | | 7.100 | | | 775,622 | | | 753,231 | | | | |
| | 1,350,000 | | | Louisiana Pub Facs Auth Rev | | | 10/1/2011 | | | 6.250 | | | 1,214,078 | | | 1,350,932 | | | | |
| | 200,000 | | | Louisiana Stad & Expo Dist Htl | | | 7/1/2015 | | | 5.250 | | | 206,249 | | | 203,130 | | | | |
| | 145,000 | | | Lubbock Tx Hlth Facs Dev Corp | | | 1/20/2010 | | | 5.000 | | | 145,000 | | | 147,372 | | | | |
| | 235,000 | | | Lubbock Tx Hlth Facs Dev Corp | | | 3/20/2012 | | | 5.000 | | | 235,000 | | | 243,234 | | | | |
| | 250,000 | | | Lubbock Tx Hlth Facs Dev Corp | | | 7/1/2019 | | | 5.250 | | | 253,617 | | | 259,727 | | | | |
| | 250,000 | | | Lubbock Tx Hlth Facs Dev Corp | | | 7/1/2023 | | | 5.000 | | | 252,269 | | | 254,227 | | | | |
| | 350,000 | | | Lucas Cnty Oh Health Care Fac | | | 8/15/2015 | | | 6.375 | | | 339,260 | | | 378,371 | | | | |
| | 500,000 | | | Madison Cnty Fl Rev | | | 7/1/2025 | | | 6.000 | | | 491,529 | | | 496,085 | | | | |
| | 500,000 | | | Manchester N H Hsg & Redev ( C ) | | | 1/1/2020 | | | 5.248 | | | 240,086 | | | 246,335 | | | | |
| | 750,000 | | | Manchester N H Hsg & Redev ( C ) | | | 1/1/2021 | | | 6.000 | | | 306,157 | | | 327,967 | | | | |
| | 250,000 | | | Manchester Nh Hsg & Redev | | | 1/1/2015 | | | 6.750 | | | 269,120 | | | 268,875 | | | | |
| | 500,000 | | | Manitowoc Wi Elec Rev | | | 10/1/2034 | | | 5.250 | | | 514,992 | | | 523,680 | | | | |
| | 670,000 | | | Maricopa Cnty Az Indl Dev | | | 11/1/2010 | | | 9.000 | | | 670,000 | | | 674,395 | | | | |
| | 150,000 | | | Mashantucket Western Pequot ( C ) | | | 9/1/2009 | | | 6.300 | | | 119,498 | | | 127,278 | | | | |
| | 500,000 | | | Massachusetts St Health & Edl | | | 7/1/2019 | | | 5.625 | | | 530,153 | | | 530,580 | | | | |
| | 750,000 | | | Massachusetts St Health & Edl | | | 7/1/2016 | | | 5.500 | | | 767,820 | | | 768,210 | | | | |
| | 225,000 | | | Massachusetts St Hlth Edl Facs | | | 11/15/2025 | | | 5.500 | | | 229,687 | | | 227,585 | | | | |
| | 350,000 | | | Massachusetts St Hlth Edl Facs | | | 11/15/2009 | | | 5.125 | | | 355,439 | | | 357,430 | | | | |
| | 450,000 | | | Massachusetts St Hlth Edl Facs | | | 7/1/2028 | | | 5.000 | | | 464,945 | | | 457,609 | | | | |
| | 1,000,000 | | | Matteson IL Tax Increment Rev | | | 12/1/2009 | | | 4.250 | | | 1,000,000 | | | 998,540 | | | | |
| | 115,000 | | | Mdaho Health Facs Auth Rev | | | 3/1/2006 | | | 4.900 | | | 115,074 | | | 115,179 | | | | |
| | 165,000 | | | Mecklenburg Cnty Nc Indl Facs | | | 12/1/2009 | | | 5.250 | | | 167,444 | | | 165,221 | | | | |
| | 65,000 | | | Mediterra No Cmnty Dev Dist Fl | | | 5/1/2008 | | | 6.000 | | | 64,927 | | | 65,565 | | | | |
| | 500,000 | | | Mesquite Tx Health Facs Dev | | | 2/15/2015 | | | 5.000 | | | 503,605 | | | 510,295 | | | | |
| | 855,000 | | | Met Govt Nashville Davidson Tn ( B ) | | | 6/20/2036 | | | 10.000 | | | 855,000 | | | 685,736 | | | | |
| | 1,850,000 | | | Met Govt Nashville Davidson Tn | | | 12/20/2040 | | | 7.500 | | | 1,850,000 | | | 1,852,571 | | | | |
| | 500,000 | | | Metro Govt Nshville Tn Wtr Swr | | | 1/1/2018 | | | 5.000 | | | 517,092 | | | 518,805 | | | | |
| | 300,000 | | | Metropolitan Pier & Expo Il | | | 6/15/2012 | | | 5.250 | | | 309,678 | | | 302,352 | | | | |
| | 900,000 | | | Miami Beach Fl Hlth Facs Hosp | | | 11/15/2008 | | | 6.125 | | | 900,000 | | | 943,083 | | | | |
| | 1,500,000 | | | Miami Dade Cnty Fl Spl Oblig ( C ) | | | 10/1/2035 | | | 0.432 | | | 1,296,521 | | | 1,309,950 | | | | |
| | 220,000 | | | Michigan St Hosp Fin Auth Rev | | | 11/15/2009 | | | 4.000 | | | 215,570 | | | 215,508 | | | | |
| | 330,000 | | | Milwaukee Wi Redev Auth Rev | | | 8/1/2015 | | | 5.125 | | | 325,930 | | | 330,119 | | | | |
| | 310,000 | | | Mississippi Hosp Equip & Facs | | | 1/1/2016 | | | 6.000 | | | 324,147 | | | 317,288 | | | | |
| | 750,000 | | | Missouri St Dev Fin Brd Facs | | | 4/1/2015 | | | 6.000 | | | 750,000 | | | 796,800 | | | | |
| | 980,000 | | | Missouri St Hlth & Edl Fac Aut | | | 2/1/2022 | | | 5.125 | | | 1,017,279 | | | 1,025,541 | | | | |
| | 375,000 | | | Missouri St Hlth & Edl Fac Rev | | | 5/15/2025 | | | 5.125 | | | 391,561 | | | 391,466 | | | | |
| | 570,000 | | | Monroe Mckeen Plaza Hsg Dev La | | | 2/1/2012 | | | 6.800 | | | 574,032 | | | 575,677 | | | | |
| | 50,000 | | | Montgomery Al Med Clinic Brd | | | 3/1/2006 | | | 7.375 | | | 50,008 | | | 50,092 | | | | |
| | 500,000 | | | Montgomery Al Med Clinic Brd | | | 3/1/2015 | | | 7.000 | | | 509,530 | | | 501,140 | | | | |
| | 500,000 | | | Montgomery Al Spl Care Facs | | | 9/1/2022 | | | 5.375 | | | 529,965 | | | 522,815 | | | | |
| | 375,000 | | | Montgomery Cnty Pa Indl Dev Re | | | 2/1/2028 | | | 6.125 | | | 369,419 | | | 392,929 | | | | |
| | 650,000 | | | Montgomery Cnty Pa Indl Dev Re | | | 2/1/2014 | | | 5.375 | | | 644,746 | | | 660,829 | | | | |
| | 200,000 | | | Mount Carbon Met Dist Co Rev (e) | | | 6/1/2043 | | | 1.000 | | | — | | | — | | | | |
| | 800,000 | | | Mount Carbon Met Dist Co Rev (e) | | | 6/1/2043 | | | 7.000 | | | 800,000 | | | 800,000 | | | | |
| | 300,000 | | | Mount Dora Fl Health Facs Auth | | | 8/15/2008 | | | 4.250 | | | 296,315 | | | 295,128 | | | | |
| | 200,000 | | | Mount Dora Fla Health Facs | | | 8/15/2007 | | | 3.750 | | | 199,217 | | | 196,606 | | | | |
| | 390,000 | | | Mountain Regl Wtr Spl Svc Dist | | | 12/1/2008 | | | 6.250 | | | 387,728 | | | 394,586 | | | | |
| |
| See accompanying notes to financial statements. | 36 | (Continued) |
CLEARWATER INVESTMENT TRUST
Schedule of Investments – Clearwater Tax-Exempt Bond Fund
December 31, 2005 |
| |
| Face
amount
or shares | | Security | | Maturity
date | | Coupon
rate | | Cost | | Market
value (a) | | Percent
of
net assets | |
|---|
| |
| |
| |
| |
| |
| |
| |
| |
|---|
| | 200,000 | | | Nebraska Invt Fin Auth Rev | | | 12/1/2011 | | | 5.125 | | $ | 210,638 | | | 206,332 | | | | |
| | 140,000 | | | New Hampshire Health & Ed | | | 7/1/2011 | | | 5.000 | | | 141,133 | | | 142,491 | | | | |
| | 480,000 | | | New Hampshire Health & Ed | | | 7/1/2016 | | | 5.000 | | | 477,648 | | | 483,974 | | | | |
| | 300,000 | | | New Jersey Economic Dev Auth | | | 1/1/2015 | | | 5.000 | | | 295,719 | | | 303,468 | | | | |
| | 250,000 | | | New Mexico Hsg Auth Region | | | 7/1/2017 | | | 6.000 | | | 250,000 | | | 256,552 | | | | |
| | 75,000 | | | New Mexico Mtg Fin Auth | | | 1/1/2026 | | | 6.950 | | | 79,187 | | | 77,116 | | | | |
| | 250,000 | | | New Mexico St Hosp Equip Ln | | | 7/1/2025 | | | 5.250 | | | 261,237 | | | 262,790 | | | | |
| | 1,500,000 | | | New Orleans La Dew Svc Rev | | | 7/26/2006 | | | 3.000 | | | 1,489,394 | | | 1,454,370 | | | | |
| | 250,000 | | | New York Cntys Tob Tr Iv | | | 6/1/2021 | | | 4.250 | | | 247,197 | | | 246,237 | | | | |
| | 400,000 | | | New York NY | | | 3/15/2029 | | | 5.000 | | | 412,339 | | | 411,228 | | | | |
| | 120,000 | | | New York NY | | | 2/1/2017 | | | 5.750 | | | 130,711 | | | 122,015 | | | | |
| | 100,000 | | | New York St Dorm Auth Revs | | | 2/1/2012 | | | 4.000 | | | 100,000 | | | 99,746 | | | | |
| | 1,500,000 | | | New York St Dorm Auth Revs | | | 8/1/2024 | | | 5.750 | | | 1,585,195 | | | 1,533,000 | | | | |
| | 750,000 | | | New York St Med Care Facs Fin | | | 11/1/2020 | | | 5.375 | | | 769,748 | | | 759,825 | | | | |
| | 320,000 | | | Newberry Investing in Children | | | 12/1/2007 | | | 3.500 | | | 319,518 | | | 319,270 | | | | |
| | 500,000 | | | Norman Okla Regl Hosp Auth Rev | | | 9/1/2024 | | | 5.500 | | | 510,500 | | | 516,885 | | | | |
| | 560,000 | | | Norman Okla Regl Hosp Auth Rev | | | 9/1/2016 | | | 5.625 | | | 600,214 | | | 578,967 | | | | |
| | 650,000 | | | North Carloina Med Care Commn | | | 9/1/2024 | | | 4.300 | | | 650,000 | | | 645,352 | | | | |
| | 250,000 | | | North Carolina Med Care Commn | | | 2/15/2019 | | | 5.500 | | | 257,980 | | | 255,522 | | | | |
| | 1,300,000 | | | North Carolina Med Care Hlth | | | 10/1/2035 | | | 4.750 | | | 1,300,000 | | | 1,300,728 | | | | |
| | 345,000 | | | North Carolina Mun Pwr Agy | | | 1/1/2017 | | | 5.125 | | | 360,975 | | | 357,089 | | | | |
| | 500,000 | | | North Cent Tx Hlth Fac Dev | | | 11/15/2029 | | | 7.500 | | | 539,733 | | | 539,075 | | | | |
| | 645,000 | | | North Cent Tx Hlth Fac Dev | | | 11/15/2010 | | | 7.000 | | | 689,948 | | | 692,917 | | | | |
| | 250,000 | | | North Forest Indpt Sch Dist | | | 8/15/2012 | | | 6.125 | | | 265,671 | | | 250,685 | | | | |
| | 500,000 | | | North Forest Indpt Sch Dist | | | 8/15/2016 | | | 6.250 | | | 536,295 | | | 501,460 | | | | |
| | 610,000 | | | Northern Tob Securitization | | | 6/1/2022 | | | 6.200 | | | 599,431 | | | 637,816 | | | | |
| | 1,000,000 | | | Northrn Ca Pwr Agy Pub Pwr Rev | | | 7/1/2009 | | | 5.000 | | | 1,010,208 | | | 1,000,960 | | | | |
| | 250,000 | | | Oakland Ca Uni Sch Dist | | | 8/1/2024 | | | 5.000 | | | 260,568 | | | 264,325 | | | | |
| | 565,000 | | | Ohio St Air Quality Dev Auth | | | 1/1/2024 | | | 5.450 | | | 579,199 | | | 565,921 | | | | |
| | 1,100,000 | | | Oklahoma Cnty Ok Fin Auth Rev | | | 11/15/2040 | | | 5.000 | | | 1,100,000 | | | 1,100,572 | | | | |
| | 500,000 | | | Oklahoma Dev Fin Auth Hosp | | | 12/1/2023 | | | 5.125 | | | 496,176 | | | 516,475 | | | | |
| | 400,000 | | | Oliver Cnty Nd Pollutn Ctl Rev | | | 1/1/2027 | | | 5.300 | | | 423,060 | | | 422,672 | | | | |
| | 500,000 | | | Orange Cnty Fl Hlth Facs Auth | | | 11/15/2020 | | | 5.250 | | | 511,659 | | | 508,345 | | | | |
| | 575,000 | | | Orange Cnty Fl Hlth Facs Auth | | | 7/1/2009 | | | 4.625 | | | 575,000 | | | 571,331 | | | | |
| | 660,000 | | | Oregon St Health Hsg Edl Auth | | | 11/15/2026 | | | 8.000 | | | 689,748 | | | 682,420 | | | | |
| | 75,000 | | | Oregon St Hsg & Cmnty Svcs Dep | | | 7/1/2022 | | | 5.700 | | | 76,749 | | | 75,567 | | | | |
| | 300,000 | | | Orleans La Levee Dist | | | 11/1/2014 | | | 5.950 | | | 317,912 | | | 309,414 | | | | |
| | 495,000 | | | Orleans Parish La Sch Brd ( C ) | | | 2/1/2015 | | | 5.526 | | | 298,632 | | | 301,222 | | | | |
| | 1,000,000 | | | Palm Beach Cnty Fl Hlth Facs | | | 11/15/2020 | | | 5.625 | | | 1,030,049 | | | 1,029,820 | | | | |
| | 110,000 | | | Palm Beach Fl Health Facs | | | 11/15/2029 | | | 5.125 | | | 111,853 | | | 111,460 | | | | |
| | 850,000 | | | Panther Trace II Fl Cmnty Dev | | | 11/1/2010 | | | 5.000 | | | 855,533 | | | 854,547 | | | | |
| | 1,310,000 | | | Parklands Lee Cmnty Dev Dist | | | 5/1/2011 | | | 5.125 | | | 1,308,403 | | | 1,317,794 | | | | |
| | 5,000 | | | Parklands West Cmnty Dev Dist | | | 5/1/2006 | | | 6.000 | | | 4,998 | | | 5,021 | | | | |
| | 250,000 | | | Pearland Tx Dev Auth Tax Inc | | | 9/1/2006 | | | 3.250 | | | 250,000 | | | 248,995 | | | | |
| | 250,000 | | | Pennsylvania Intrgvrnmntl Coop | | | 6/15/2021 | | | 5.000 | | | 258,110 | | | 260,290 | | | | |
| | 250,000 | | | Pennsylvania St Higher Edl | | | 1/15/2031 | | | 6.000 | | | 260,834 | | | 271,742 | | | | |
| | 500,000 | | | Pennsylvania St Higher Edl | | | 3/15/2030 | | | 5.750 | | | 516,796 | | | 530,665 | | | | |
| | 600,000 | | | Pennsylvania St Higher Edl | | | 1/15/2022 | | | 6.000 | | | 622,777 | | | 652,182 | | | | |
| | 75,000 | | | Pennsylvania St Higher Edl Fac | | | 11/15/2016 | | | 5.875 | | | 80,592 | | | 78,030 | | | | |
| | 110,000 | | | Pennsylvania St Higher Edl Fac | | | 1/1/2015 | | | 5.875 | | | 115,115 | | | 111,108 | | | | |
| | 235,000 | | | Pennsylvania St Higher Edl Fac | | | 11/15/2021 | | | 5.875 | | | 256,188 | | | 244,703 | | | | |
| | 325,000 | | | Pennsylvania St Higher Edl Fac | | | 11/15/2016 | | | 5.875 | | | 337,502 | | | 338,419 | | | | |
| | 250,000 | | | Phoenix Az Str & Hwy User Rev | | | 7/1/2011 | | | 6.250 | | | 258,394 | | | 250,555 | | | | |
| | 500,000 | | | Pierce Cnty Wa | | | 8/1/2025 | | | 5.375 | | | 516,132 | | | 540,755 | | | | |
| | 500,000 | | | Pima Cnty Az Indl | | | 2/1/2015 | | | 6.625 | | | 500,000 | | | 505,395 | | | | |
| | 200,000 | | | Pima Cnty Az Indl Dev | | | 12/15/2016 | | | 5.250 | | | 197,527 | | | 202,346 | | | | |
| | 310,000 | | | Pima Cnty Az Indl Dev Auth | | | 8/1/2012 | | | 6.250 | | | 310,000 | | | 314,901 | | | | |
| | 150,000 | | | Pima Cnty Az Indl Dev Auth Ed | | | 7/1/2012 | | | 5.000 | | | 149,579 | | | 150,951 | | | | |
| | 400,000 | | | Pima Cnty Az Indl Dev Auth Ed | | | 7/1/2019 | | | 6.875 | | | 400,000 | | | 410,860 | | | | |
| | 1,000,000 | | | Pima Cnty Az Indl Dev Auth Ed | | | 2/1/2015 | | | 7.250 | | | 996,988 | | | 976,600 | | | | |
| | 195,000 | | | Pima Cnty Az Indl Dev Auth Rev | | | 2/1/2014 | | | 6.375 | | | 195,000 | | | 198,184 | | | | |
| | 923,000 | | | Pingree Grove Village IL | | | 3/1/2015 | | | 5.250 | | | 914,277 | | | 932,636 | | | | |
| | 225,000 | | | Pitt Cnty Nc Rev | | | 12/1/2010 | | | 5.375 | | | 238,740 | | | 230,299 | | | | |
| | 1,250,000 | | | Pleasants Cnty Wv Poll Ctl | | | 5/1/2015 | | | 6.150 | | | 1,335,282 | | | 1,265,788 | | | | |
| | 185,000 | | | Plymouth Mn Multifamily Hsg | | | 6/20/2031 | | | 8.050 | | | 191,793 | | | 192,633 | | | | |
| |
| See accompanying notes to financial statements. | 37 | (Continued) |
CLEARWATER INVESTMENT TRUST
Schedule of Investments – Clearwater Tax-Exempt Bond Fund
December 31, 2005 |
| |
| Face
amount
or shares | | Security | | Maturity
date | | Coupon
rate | | Cost | | Market
value (a) | | Percent
of
net assets | |
|---|
| |
| |
| |
| |
| |
| |
| |
| |
|---|
| | 2,000,000 | | | Port Everglades Auth Fl Impt | | | 9/1/2016 | | | 5.000 | | $ | 2,027,032 | | | 2,004,760 | | | | |
| | 250,000 | | | Portland Me Hsg Dev Corp | | | 8/1/2021 | | | 5.700 | | | 250,000 | | | 260,000 | | | | |
| | 650,000 | | | Portland Me Hsg Dev Corp | | | 8/1/2015 | | | 4.875 | | | 650,000 | | | 651,703 | | | | |
| | 185,000 | | | Portland or Hydroelectric Pwr | | | 10/1/2016 | | | 7.000 | | | 191,425 | | | 186,737 | | | | |
| | 140,000 | | | Portland Ore Hydroelectric Pwr | | | 10/1/2016 | | | 7.000 | | | 146,529 | | | 143,752 | | | | |
| | 500,000 | | | Potter Cnty Pa Hosp Auth Rev | | | 8/1/2024 | | | 6.050 | | | 521,199 | | | 516,830 | | | | |
| | 250,000 | | | Private Colleges&univs Auth Ga | | | 10/1/2014 | | | 5.250 | | | 259,720 | | | 258,025 | | | | |
| | 500,000 | | | Puerto Rico Comwlth | | | 7/1/2030 | | | 5.125 | | | 519,081 | | | 529,565 | | | | |
| | 500,000 | | | Puerto Rico Comwlth Aqdct Swr | | | 7/1/2019 | | | 5.000 | | | 514,851 | | | 510,535 | | | | |
| | 300,000 | | | Red River Auth Tx Pollutn Ctl | | | 7/1/2011 | | | 5.200 | | | 308,196 | | | 309,660 | | | | |
| | 100,000 | | | Reunion East Cmnty Dev Dist | | | 11/1/2007 | | | 5.900 | | | 99,825 | | | 100,811 | | | | |
| | 1,000,000 | | | Richardson Tx Hosp Auth Rev | | | 12/1/2028 | | | 5.625 | | | 1,042,670 | | | 1,031,300 | | | | |
| | 150,000 | | | Roselle ILL Multi Fam Hsg Rev | | | 1/1/2025 | | | 7.000 | | | 151,508 | | | 151,545 | | | | |
| | 500,000 | | | Sacramento Cnty Ca Ctfs Partn | | | 10/1/2027 | | | 4.750 | | | 500,597 | | | 503,980 | | | | |
| | 200,000 | | | San Diego Ca Pub Facs Fing | | | 5/15/2025 | | | 5.000 | | | 202,449 | | | 202,192 | | | | |
| | 375,000 | | | San Diego Ca Swr Rev | | | 5/15/2007 | | | 4.800 | | | 378,578 | | | 375,484 | | | | |
| | 470,000 | | | Sandoval Cnty Nm Proj Dev | | | 7/1/2015 | | | 7.750 | | | 470,000 | | | 483,649 | | | | |
| | 250,000 | | | Santa Clara Ca Redev Tax Alloc | | | 6/1/2015 | | | 5.000 | | | 252,769 | | | 251,945 | | | | |
| | 500,000 | | | Shelby Cnty in Jail Bldg Corp | | | 7/15/2007 | | | 5.300 | | | 510,807 | | | 510,830 | | | | |
| | 1,050,000 | | | Shelby Cnty Tn Health Edl Hsg | | | 12/1/2013 | | | 6.375 | | | 1,050,000 | | | 1,066,674 | | | | |
| | 80,000 | | | Shelby Cnty Tn Hlth Edl & Hsg ( B ) | | | 1/1/2026 | | | 6.600 | | | 80,127 | | | 67,822 | | | | |
| | 130,000 | | | Shelby Cnty Tn Hlth Edl & Hsg ( B ) | | | 1/1/2029 | | | 6.000 | | | 2,275 | | | 2,275 | | | | |
| | 150,000 | | | Shelby Cnty Tn Hlth Edl & Hsg ( B ) | | | 1/1/2019 | | | 5.350 | | | 134,966 | | | 76,523 | | | | |
| | 625,000 | | | Shelby Cnty Tn Hlth Edl & Hsg ( B ) | | | 1/1/2029 | | | 5.550 | | | 556,863 | | | 312,737 | | | | |
| | 1,000,000 | | | Skowhegan Me Pollutn | | | 11/1/2013 | | | 5.900 | | | 1,000,000 | | | 1,002,180 | | | | |
| | 400,000 | | | South Carolina Edl Facs Auth | | | 10/1/2026 | | | 5.500 | | | 419,607 | | | 413,520 | | | | |
| | 2,100,000 | | | South Dakota St Health | | | 7/1/2030 | | | 3.650 | | | 2,100,000 | | | 2,100,000 | | | | |
| | 400,000 | | | South La Port Commn Port Rev | | | 4/1/2017 | | | 5.850 | | | 422,701 | | | 412,608 | | | | |
| | 235,000 | | | South Lake Cnty Hosp Dist Fla | | | 10/1/2008 | | | 4.250 | | | 234,695 | | | 235,211 | | | | |
| | 630,000 | | | South Lake Cnty Hosp Fl | | | 10/1/2013 | | | 5.500 | | | 629,599 | | | 667,000 | | | | |
| | 250,000 | | | Southwestern IL Dev Auth Rev | | | 8/15/2015 | | | 5.375 | | | 260,190 | | | 259,195 | | | | |
| | 1,500,000 | | | Southwestern IL Dev Auth Rev | | | 8/15/2029 | | | 5.625 | | | 1,542,905 | | | 1,543,425 | | | | |
| | 190,000 | | | Southwestern ILL Dev Auth Rev | | | 4/1/2010 | | | 6.000 | | | 186,897 | | | 187,083 | | | | |
| | 500,000 | | | St Joseph Mo Indl Dev Auth Tax | | | 11/1/2023 | | | 5.375 | | | 495,708 | | | 498,825 | | | | |
| | 1,000,000 | | | St Joseph Mo Indl Dev Auth Tax | | | 11/1/2019 | | | 5.100 | | | 985,308 | | | 989,660 | | | | |
| | 800,000 | | | St Louis Cnty Mo Hsg Auth ( B ) | | | 11/1/2014 | | | 8.500 | | | 800,000 | | | 607,176 | | | | |
| | 525,000 | | | St Paul Mn Hsg & Redev Hosp | | | 11/15/2014 | | | 5.250 | | | 539,952 | | | 540,388 | | | | |
| | 660,000 | | | Staunton Va Indl Dev Auth Edl | | | 11/1/2014 | | | 6.600 | | | 694,967 | | | 687,106 | | | | |
| | 875,000 | | | Sterling Hill Cmnty Dev Dist | | | 11/1/2010 | | | 5.500 | | | 871,339 | | | 880,792 | | | | |
| | 1,000,000 | | | Suburban Mobility Auth Regl | | | 2/15/2009 | | | 4.900 | | | 994,768 | | | 1,003,060 | | | | |
| | 135,000 | | | Summit Academy North Mi Pub | | | 7/1/2009 | | | 6.250 | | | 137,147 | | | 145,913 | | | | |
| | 445,000 | | | Summit Academy North Mi Pub | | | 11/1/2011 | | | 4.750 | | | 445,201 | | | 440,176 | | | | |
| | 280,000 | | | Sundance Cmnty Facs Dist Az | | | 7/1/2008 | | | 5.000 | | | 280,000 | | | 285,737 | | | | |
| | 600,000 | | | Sweetwater Cnty Wy Pollutn Ctl | | | 7/15/2026 | | | 6.050 | | | 639,925 | | | 618,372 | | | | |
| | 475,000 | | | Tampa Fl Rev | | | 12/1/2023 | | | 5.125 | | | 482,851 | | | 477,589 | | | | |
| | 500,000 | | | Tangipah0a Parish La Hosp Svc | | | 2/1/2015 | | | 5.375 | | | 528,085 | | | 528,890 | | | | |
| | 160,000 | | | Taos Cnty Nm Gross Rcpts Tax | | | 10/1/2009 | | | 3.500 | | | 158,333 | | | 155,816 | | | | |
| | 1,000,000 | | | Tarrant Cnty Tx Hlth Facs Dev | | | 2/15/2022 | | | 5.250 | | | 1,041,660 | | | 1,050,270 | | | | |
| | 465,000 | | | Tarrant Cnty Tx Hsg Fin Corp ( B ) | | | 6/1/2031 | | | 10.500 | | | 465,000 | | | 47,662 | | | | |
| | 265,000 | | | Texas St Affordable Hsg Corp | | | 10/1/2008 | | | 4.100 | | | 265,000 | | | 265,138 | | | | |
| | 210,000 | | | Texas St Dept Hsg & Cmnty | | | 7/1/2026 | | | 6.450 | | | 210,093 | | | 215,244 | | | | |
| | 250,000 | | | Texas St Dept Hsg & Cmnty | | | 7/1/2016 | | | 6.350 | | | 258,794 | | | 256,337 | | | | |
| | 800,000 | | | Texas Student Hsg Auth Rev ( B ) | | | 1/1/2033 | | | 11.000 | | | 800,000 | | | 79,000 | | | | |
| | 250,000 | | | Texas Wtr Dev Brd Rev | | | 7/15/2018 | | | 5.125 | | | 260,054 | | | 254,230 | | | | |
| | 400,000 | | | Thousand Oaks Cmnty Dev Dist | | | 5/1/2035 | | | 5.350 | | | 399,007 | | | 402,776 | | | | |
| | 1,000,000 | | | Tisons Landing Cmnty Dev Dist | | | 11/1/2011 | | | 5.000 | | | 997,515 | | | 1,002,190 | | | | |
| | 500,000 | | | Tob Securitization Auth North | | | 6/1/2023 | | | 4.750 | | | 485,571 | | | 495,595 | | | | |
| | 500,000 | | | Tobacco Settlement Fing Corp | | | 6/1/2014 | | | 5.500 | | | 541,748 | | | 530,045 | | | | |
| | 545,000 | | | Tobacco Settlement Fing Corp | | | 6/1/2019 | | | 4.375 | | | 499,103 | | | 546,526 | | | | |
| | 925,000 | | | Tobacco Settlement Rev Mgmt | | | 5/15/2022 | | | 6.000 | | | 951,850 | | | 977,170 | | | | |
| | 840,000 | | | Todd Creek Farms Met Dist No 1 | | | 12/1/2009 | | | 4.750 | | | 832,588 | | | 833,608 | | | | |
| | 1,390,000 | | | Tomball Tx Hosp Auth Rev | | | 7/1/2012 | | | 5.000 | | | 1,424,783 | | | 1,437,510 | | | | |
| | 2,000,000 | | | Travis Cnty Tx Health Facs Dev | | | 11/15/2035 | | | 4.750 | | | 2,000,000 | | | 1,999,380 | | | | |
| | 840,000 | | | Travis Cnty Tx Hsg Fin Corp (B) | | | 6/1/2035 | | | 9.250 | | | 840,000 | | | 294,630 | | | | |
| | 375,000 | | | Tuscaloosa Al Spl Care Facs | | | 8/1/2036 | | | 5.875 | | | 368,459 | | | 376,721 | | | | |
| | 1,150,000 | | | Tuscaloosa Al Spl Care Facs | | | 8/1/2015 | | | 5.125 | | | 1,139,259 | | | 1,146,331 | | | | |
| | 200,000 | | | University City Mo Indl Dev Au | | | 12/20/2030 | | | 6.000 | | | 211,625 | | | 204,152 | | | | |
| | 1,000,000 | | | University Fl Resh Fndtn Inc | | | 9/1/2033 | | | 5.125 | | | 1,035,556 | | | 1,040,720 | | | | |
| |
| See accompanying notes to financial statements. | 38 | (Continued) |
CLEARWATER INVESTMENT TRUST
Schedule of Investments – Clearwater Tax-Exempt Bond Fund
December 31, 2005 |
| |
| Face
amount
or shares | | Security | | Maturity
date | | Coupon
rate | | Cost | | Market
value (a) | | Percent
of
net assets | |
|---|
| |
| |
| |
| |
| |
| |
| |
| |
|---|
| | 500,000 | | | Valley View Hosp Auth Ok Rev | | | 8/15/2014 | | | 6.000 | | $ | 524,104 | | | 515,600 | | | | |
| | 235,000 | | | Vermont Edl & Hlth Bldgs Agy | | | 6/15/2007 | | | 4.375 | | | 234,898 | | | 233,780 | | | | |
| | 300,000 | | | Verrado Cmnty Facs Dist No 1 | | | 7/15/2013 | | | 6.000 | | | 300,000 | | | 325,011 | | | | |
| | 85,000 | | | Vista Lakes Cmnty Dev Dist Fl | | | 5/1/2008 | | | 5.800 | | | 84,859 | | | 85,683 | | | | |
| | 250,000 | | | Vistancia Cmnty Facs Dist Az | | | 7/15/2008 | | | 4.150 | | | 250,000 | | | 247,267 | | | | |
| | 750,000 | | | Washington Cnty Ok Med Auth | | | 11/1/2010 | | | 5.500 | | | 770,496 | | | 770,160 | | | | |
| | 1,000,000 | | | Washington Cnty Pa Auth Rev | | | 12/1/2029 | | | 6.150 | | | 1,064,421 | | | 1,072,500 | | | | |
| | 500,000 | | | Washington St | | | 7/1/2022 | | | 5.000 | | | 517,173 | | | 525,815 | | | | |
| | 500,000 | | | Washington St Nonprofit Hsg | | | 7/1/2027 | | | 6.125 | | | 527,944 | | | 510,040 | | | | |
| | 225,000 | | | Well Augmentation Subdist Cent | | | 3/1/2007 | | | 3.875 | | | 225,000 | | | 222,880 | | | | |
| | 300,000 | | | Westchester Cnty Ny Indl Dev | | | 7/1/2006 | | | 5.500 | | | 300,750 | | | 302,028 | | | | |
| | 350,000 | | | Westchester Tobacco Asset | | | 6/1/2021 | | | 4.500 | | | 345,046 | | | 346,419 | | | | |
| | 500,000 | | | Wi St Health Edl Facs | | | 6/1/2028 | | | 5.700 | | | 521,252 | | | 520,360 | | | | |
| | 460,000 | | | Wisconsin Health & Edl Facs | | | 8/15/2016 | | | 4.600 | | | 458,446 | | | 461,799 | | | | |
| | 1,000,000 | | | Wisconsin Health & Edl Facs | | | 12/1/2034 | | | 4.750 | | | 1,000,000 | | | 1,000,210 | | | | |
| | 90,000 | | | Wisconsin St Health & Edl Facs | | | 9/1/2007 | | | 3.750 | | | 90,000 | | | 90,015 | | | | |
| | 250,000 | | | Wisconsin St Health & Edl Facs | | | 3/1/2015 | | | 4.650 | | | 250,000 | | | 247,595 | | | | |
| | 350,000 | | | Wisconsin St Health & Edl Facs | | | 7/1/2021 | | | 6.000 | | | 360,796 | | | 374,724 | | | | |
| | 400,000 | | | Wisconsin St Health & Edl Facs | | | 9/1/2015 | | | 5.000 | | | 400,000 | | | 401,224 | | | | |
| | 410,000 | | | Wisconsin St Health & Edl Facs | | | 12/1/2006 | | | 6.000 | | | 418,776 | | | 415,551 | | | | |
| | 450,000 | | | Wisconsin St Health & Edl Facs | | | 7/1/2017 | | | 6.000 | | | 465,113 | | | 484,168 | | | | |
| | 500,000 | | | Wisconsin St Health & Edl Facs | | | 12/15/2020 | | | 5.500 | | | 532,807 | | | 526,550 | | | | |
| | 500,000 | | | Wisconsin St Health & Edl Facs | | | 11/15/2023 | | | 6.000 | | | 537,020 | | | 541,550 | | | | |
| | 750,000 | | | Wisconsin St Health & Edl Facs | | | 11/15/2028 | | | 6.250 | | | 780,353 | | | 829,650 | | | | |
| | 1,240,000 | | | Woodhill Pub Fac Corp Tex | | | 12/1/2015 | | | 7.250 | | | 1,222,684 | | | 1,219,738 | | | | |
| | 250,000 | | | York Cnty Pa Indl Dev Auth Rev | | | 10/1/2019 | | | 6.450 | | | 251,883 | | | 253,127 | | | | |
| | | | | | | | | | | | |
| |
| | | | |
| | | | | | | | | | | | | | 217,791,433 | | | 217,058,683 | | | 96.27 | % |
| | | | | | | | | | | | |
| |
| | | | |
| | | | Cash equivalents: | | | | | | | | | | | | | | | | |
| | 3,192,147 | | | SSGA Tax-exempt Money Market Fund | | | | | | 2.801 | | | 3,192,147 | | | 3,192,147 | | | 1.42 | % |
| | | | | | | | | | | | |
| |
| |
| |
| | | | | Grand total (d) | | | | | | | | $ | 223,363,874 | | | 222,652,176 | | | 98.75 | % |
| | | | | | | | | | | | |
| |
| |
| |
| |
| Notes to investments in securities: |
| | | |
| | (a) | Securities are valued in accordance with procedures described in note 2 to the financial statements. |
| | | |
| | (b) | Currently non-income producing assets. For long-term debt securities, item identified is in default as to payment of interest and/or principal. |
| | | |
| | (c) | For zero coupon bonds, the interest rate disclosed represents the annualized effective yield on the date of acquisition. |
| | | |
| | (d) | At December 31, 2005, the cost for federal income tax purposes was $223,363,874. The aggregate gross unrealized appreciation and depreciation of investments in securities based on this cost were as follows: |
| | | |
| | Gross unrealized appreciation | $ | 2,945,334 | | |
| | Gross unrealized depreciation | | (3,657,032 | ) | |
| | |
| | |
| | Net unrealized depreciation | $ | (711,698 | ) | |
| | |
| | |
| | | |
| | (e) | This security is being fair-valued according to procedures adopted by the Board of Trustees. |
| |
| Distribution of investments representing geographic diversification, as a percentage of total investments at value, is as follows: |
| |
| | Geographical diversification | | Percent | | |
|---|
| |
| |
| | |
|---|
| | Texas | | | 12.79 | % | |
| | Florida | | | 10.78 | | |
| | Illinois | | | 10.47 | | |
| | California | | | 9.54 | | |
| | Pennsylvania | | | 4.46 | | |
| | Wisconsin | | | 3.52 | | |
| | Colorado | | | 3.18 | | |
| | Louisiana | | | 3.12 | | |
| | Missouri | | | 2.77 | | |
| | Arizona | | | 2.50 | | |
| | Tennessee | | | 2.17 | | |
| | Other | | | 34.70 | | |
| | | |
| | |
| | | | | 100.00 | % | |
| | | |
| | |
| |
| See accompanying notes to financial statements. | 39 | (Continued) |
CLEARWATER INVESTMENT TRUST
Schedule of Investments – Clearwater Tax-Exempt Bond Fund
December 31, 2005 |
| |
| |
Clearwater Tax-Exempt Fund Portfolio Diversification
(as a percentage of net assets) |
| |
|
|
| |
| |
| See accompanying notes to financial statements. | | |