UNITED STATES
SECURITIES AND EXCHANGE COMMISSION
WASHINGTON, D.C. 20549
FORM N-CSR
CERTIFIED SHAREHOLDER REPORT OF REGISTERED MANAGEMENT
INVESTMENT COMPANIES
Investment Company Act file number 811-5047
Tax-Free Fund of Colorado
(Exact name of Registrant as specified in charter)
380 Madison Avenue
New York, New York 10017
(Address of principal executive offices) (Zip code)
Joseph P. DiMaggio
380 Madison Avenue
New York, New York 10017
(Name and address of agent for service)
Registrant's telephone number, including area code: (212) 697-6666
Date of fiscal year end: 12/31/10
Date of reporting period: 12/31/10
FORM N-CSR
ITEM 1. REPORTS TO STOCKHOLDERS.
Annual Report |
December 31, 2010 |
 TAX-FREE FUND OF COLORADO A tax-free income investment  |
 | Serving Colorado Investors For More Than Two Decades Tax-Free Fund of Colorado “Getting All the Pieces to Fit” |  |
February, 2011
Dear Fellow Shareholder:
Like a jigsaw puzzle piece, Tax-Free Fund of Colorado’s portfolio manager must decide whether any municipal bond under consideration for addition to the Fund’s portfolio has the potential to fit correctly into place. Otherwise, the addition might distort the overall picture.
Specifically, any bond under consideration must “fit” in terms of the principal amount, quality, maturity, liquidity and sector diversification.
For example, let’s say the Fund has $500,000 to invest. The portfolio manager must first find bonds available for purchase in the marketplace within that size range. Then, it must be decided whether to purchase one bond for the full amount of $500,000, several $100,000 offerings or some other combination. If the portfolio already possesses a significant holding in “Issuer A,” the portfolio manager may decide to purchase a smaller additional offering so as not to overweight the portfolio in that particular issuer.
The bonds available for purchase must also be looked at in terms of quality, maturity and sector diversification. As you know, the municipal bonds in Tax-Free Fund of Colorado must be rated investment grade – within the top four credit ratings assigned by a Nationally Recognized Statistical Rating Organization (NRSRO) like Moody’s or Standard & Poor’s – or, if unrated, must be determined to be of comparable quality. The portfolio is also managed to have an intermediate maturity (as of December 31, 2010, the Fund’s average maturity was 11.45 years) and a reasonable degree of diversification among varying projects.
So, if both a transportation and a school bond are available with identical maturities and quality rating, the portfolio manager may decide for sector diversification purposes to purchase the transportation bond if the portfolio already contains a sufficient amount of school bonds.
NOT A PART OF THE ANNUAL REPORT
The last piece of the puzzle is an ongoing attempt to keep the overall portfolio functioning smoothly, such that when one bond is removed, another complementary one is sought in an effort to keep the “picture just right”.
Sincerely,
 |  |  |
| Lacy B. Herrmann Founder and Chairman Emeritus | Diana P. Herrmann President |
Consideration should be given to the risks of investing, including potential loss of value, market risk, interest rate risk, credit risk, and geographic concentration. Past performance does not guarantee future results. Investment return and principal value will fluctuate so that an investor's shares, when redeemed, may be worth more or less than their original cost. For certain investors, some dividends may be subject to Federal and state taxes.
NOT A PART OF THE ANNUAL REPORT
| Serving Colorado Investors For More Than Two Decades Tax-Free Fund of Colorado ANNUAL REPORT Management Discussion | |
2010 Review
The U. S. economy experienced a transition year in 2010 with the first full year of Gross Domestic Product growth since 2007. After two years of recession and financial turmoil, the U.S. eked out a 2.8% growth rate during the year. This performance was somewhat less than would generally be expected after the most severe economic downturn since the 1930’s. Unemployment remains stubbornly high at just under 10% as companies are reluctant to add to staff in the face of uncertain economic conditions and a changing regulatory environment. The rate of decline in housing prices has slowed in some parts of the country but there is still concern that there will be further weakness as large inventories of unsold homes and a steady supply of foreclosed properties continue to weigh heavily on the market. Typically we would expect some inflationary pressure from consumer spending at this early stage of economic recovery; however, with weakness in the housing and job markets consumers are more content to de-leverage and improve their own balance sheets. We have seen some upward pressure on commodities, energy and food prices but the Consumer Price Index for 2010 remained relatively low at 1.5%. Equity prices in the U.S. markets continued to advance after a strong 2009 performance. The S&P 500 gained about 15% for the year as corporate earnings improved from cost cutting measures and an overall reduction in corporate debt.
The Federal Reserve Bank (the “Fed”) has maintained a very accommodative stance with their zero short term interest rate policy. The Fed has employed its balance sheet to continue to stimulate the economy as they believe the economy is not strong enough to stand on its own without significant government support. The Fed instituted a second round of large scale bond purchases in an effort to lower interest rates in the 3 to 10 year sector and further stimulate the economy. The central bank is committed to its plan to maintain a 0% to 0.25% range for Fed Funds until we approach a 6% unemployment rate and inflation remains in the 1.5% to 2.0% range. At this point, the Fed clearly believes that the risk in the economy is for further weakness. The fiscal and monetary policies of the Fed succeeded in lowering interest rates across the entire yield curve. The yield on two-year Treasury notes declined by about 0.50% to 0.60% level, ten-year securities declined by 0.55% to 3.30% and long 30-year bonds declined by 0.30% to 4.34%. Higher yields for progressively longer maturities generally indicate that investors believe that there is risk for higher interest rates and inflation in the intermediate to long term future.
Interest rates on municipal bonds once again diverged from U.S. Treasury securities in 2010. For the first 9 months of the year, intermediate and long term yields declined by 0.40% to 0.60% to their low points in early October. From that point through the end of the year we experienced a sharp rise in muni yields for a variety of reasons. The rise began as a reaction to Treasury yields rising from their lows in October followed by a sharp increase in the supply of new issue securities as municipal bond issuers raced to issue bonds utilizing the less expensive Build America Bond (BAB) structure prior to expiration of the program at the end of 2010. Additionally, it became clear late in the year that the Federal personal income tax rates were not going to rise as had been widely anticipated for the previous 18 months. The technical factors of increased supply and waning demand for tax-free securities added to the price volatility. Finally, in December there were some well publicized media reports of dire predictions for the financial future of U. S. states and cities that sparked a sell-off of municipal bonds and a corresponding increase in yields.
As we discussed last year, almost every form of government is experiencing some budgetary pressure. The effect of the recession tends to hit government budgets later and more severely than the general economy. The demand for government services rises during economic downturns while government revenues are constrained by lower income, sales, and property tax collections. Despite these difficulties, it is important to note that municipalities have tools available to them to improve their condition. Most governments are going through a painful yet necessary budget cutting process. Reducing expenditures is the first line of defense for governments and a strategy that is employed almost universally. While cuts are unpopular, these efforts to balance budgets should prove to be beneficial in the long run. Governments also have the ability to raise revenues from fee and tax increases. Again, an unpopular tactic but
1
MANAGEMENT DISCUSSION (continued)
one that is allowable and even mandated in some cases. One common misconception is that municipal governments are highly leveraged and that such leverage is the cause of their current economic difficulties. The fact is that for investment grade general obligation bonds, the average percentage of total budget dedicated to debt service is between 5% and 8%. It would not seem likely that a government would look to cease debt payments to save such a small portion of their budget when the consequences for doing so would dramatically impair their ability to perform their primary role of providing safety and security services for their citizenry. Municipal debt is usually issued for specific projects that are long term in nature. The bonds are issued with balanced maturity schedules, level debt service payments, and are self-amortizing similar to home mortgage loans. Unlike sovereign, corporate or even U.S. Treasury debt, municipal bonds have specific revenue streams dedicated to their repayment and are not subject to the short term risk of refinancing or frequent rollover risk of large portions of their total borrowing. Investors should take some comfort from municipal bond issuers’ ability and willingness to balance their budgets, their legal structure and protections, and their desire to maintain timely debt service payments.
The Colorado economy is experiencing a sluggish post-recession economic recovery. A primary factor in our slow rebound is lack of job growth. The state unemployment rate was 7.3% in 2009 and hovers over 8% in 2010. While Colorado did not lose as many jobs as other states initially, we are definitely not adding them back as quickly as we lost them. The Office of State Planning and Budgeting (OSPB) forecasts job growth of less than 2% for the next 3 years. Personal income was forecast to increase 1.1% in 2010 and improve to 4-5% growth over the next 3 years. Construction activity is still very weak with non-residential construction declining by 6.1% in 2010 following the two previous years of double digit declines. We have seen an increase in housing starts during the year mostly driven by multifamily projects. Housing prices have remained fairly stable but fragile in the face of a stubborn backlog of foreclosed homes. Colorado governments continue to make significant spending reductions in an effort to balance their budgets. We expect to see very conservative spending and borrowing policies from Colorado municipalities as they are under extreme scrutiny from the voting public. The results of the budget balancing process should allow Colorado issuers to maintain their ability to service their outstanding debt.
The portfolio characteristics of Tax-Free Fund of Colorado remained fairly stable from a year ago. The weighted average maturity increased slightly to 11.45 years, the bonds in the Fund have an average of about 7 years until the first call date, the credit quality remains very high with an A/AA profile and the average interest rate on the bonds remains at 5%. We continued to add to the A rated portion of the portfolio where we could take advantage of higher yields offered by securities with which we are familiar in this part of the investment grade sector. We believe the slightly longer maturity profile helped our performance early in the year and was a negative influence during the last couple of months. The high grade nature of the portfolio provided good liquidity and, in our view, served as an excellent margin of safety during the tumultuous market conditions in November and December. The total return for Class A investors based on net asset value remained positive at 1.38% for the year despite the market dislocation late in the year while the double-exempt dividend yield averaged approximately 3.66%.
2011 Strategy
The average maturity of Tax-Free Fund of Colorado is at the longer end of our historical intermediate range. We anticipate that we will maintain or begin to shorten the portfolio during 2011. We also will seek to retain our position in securities that are subject to call or maturity in the next 3 years as protection against the possibility of rising interest rates late in the year. We intend to continue our diligent efforts on the credit research front. We strongly believe that the most important benefit of investing in Tax-Free Fund of Colorado is the work we do on analyzing new investments in the portfolio and the ongoing surveillance we perform on the existing holdings. We expect that the municipal bond market will experience some periods of volatility during the year but we believe that our long term local expertise should allow us to add value by carefully selecting and monitoring the investments in your Fund. We intend to maintain our conservative style and defensive position with regard to a reliable double –exempt income stream with relatively low share price volatility.
Thank you for your investment in Tax-Free Fund of Colorado.
Performance data represents past performance, but does not guarantee future results. Investment return and principal value will fluctuate; shares, when redeemed, may be worth more or less than their original cost; current performance may be lower or higher than the data presented.
NOT FDIC INSURED – NO BANK GUARANTEE – MAY LOSE VALUE
2
PERFORMANCE REPORT
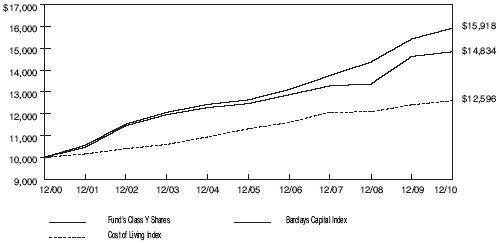
The following graph illustrates the value of $10,000 invested in the Class Y shares of Tax-Free Fund of Colorado for the 10-year period ended December 31, 2010 as compared with the Barclays Capital Quality Intermediate Municipal Bond Index (the “Barclays Capital Index”) and the Consumer Price Index (a cost of living index). The performance of each of the other classes is not shown in the graph but is included in the table below. In prior “Performance Reports”, Class A shares performance was graphed. The chart below now shows Class Y shares which is consistent with the bar chart disclosure in the Fund’s prospectus. It should be noted that the Barclays Capital Index does not include any operating expenses nor sales charges, and being nationally oriented, does not reflect state specific bond market performance.
| Average Annual Total Return | ||||||||||||||||
| for periods ended December 31, 2010 | ||||||||||||||||
| Since | ||||||||||||||||
| Class and Inception Date | 1 Year | 5 Years | 10 Years | Inception | ||||||||||||
| Class A (commenced operations on 5/21/87) | ||||||||||||||||
| With Maximum Sales Charge | (2.64 | )% | 2.66 | % | 3.55 | % | 5.24 | % | ||||||||
| Without Sales Charge | 1.38 | 3.49 | 3.97 | 5.42 | ||||||||||||
| Class C (commenced operations on 4/30/96) | ||||||||||||||||
| With CDSC | (0.58 | ) | 2.51 | 2.98 | 3.33 | |||||||||||
| Without CDSC | 0.42 | 2.51 | 2.98 | 3.33 | ||||||||||||
| Class Y (commenced operations on 4/30/96) | ||||||||||||||||
| No Sales Charge | 1.44 | 3.55 | 4.02 | 4.50 | ||||||||||||
| Barclays Capital Index | 3.21 | 4.73 | 4.76 | 5.80 | (Class A) | |||||||||||
| 5.04 | (Class C&Y) | |||||||||||||||
Total return figures shown for the Fund reflect any change in price and assume all distributions within the period were invested in additional shares. Returns for Class A shares are calculated with and without the effect of the initial 4% maximum sales charge. Returns for Class C shares are calculated with and without the effect of the 1% contingent deferred sales charge (CDSC) imposed on redemptions made within the first 12 months after purchase. Class Y shares are sold without any sales charge. The rates of return will vary and the principal value of an investment will fluctuate with market conditions. Shares, if redeemed, may be worth more or less than their original cost. A portion of each class’s income may be subject to Federal and state income taxes. Past performance is not predictive of future investment results.
3
REPORT OF INDEPENDENT REGISTERED PUBLIC ACCOUNTING FIRM
To the Board of Trustees and Shareholders of
Tax-Free Fund of Colorado:
We have audited the accompanying statement of assets and liabilities, including the schedule of investments, of Tax-Free Fund of Colorado as of December 31, 2010 and the related statement of operations for the year then ended, the statements of changes in net assets for each of the two years in the period then ended, and the financial highlights for each of the five years in the period then ended. These financial statements and financial highlights are the responsibility of the Fund’s management. Our responsibility is to express an opinion on these financial statements and financial highlights based on our audits.
We conducted our audits in accordance with the standards of the Public Company Accounting Oversight Board (United States). Those standards require that we plan and perform the audit to obtain reasonable assurance about whether the financial statements and financial highlights are free of material misstatement. The Fund is not required to have, nor were we engaged to perform, an audit of the Fund’s internal control over financial reporting. Our audits included consideration of internal control over financial reporting as a basis for designing audit procedures that are appropriate in the circumstances, but not for the purpose of expressing an opinion on the effectiveness of the Fund’s internal control over financial reporting. Accordingly, we express no such opinion. An audit also includes examining, on a test basis, evidence supporting the amounts and disclosures in the financial statements. Our procedures included confirmation of securities owned as of December 31, 2010, by correspondence with the custodian. An audit also includes assessing the accounting principles used and significant estimates made by management, as well as evaluating the overall financial statement presentation. We believe that our audits provide a reasonable basis for our opinion.
In our opinion, the financial statements and financial highlights referred to above present fairly, in all material respects, the financial position of Tax-Free Fund of Colorado as of December 31, 2010, the results of its operations for the year then ended, the changes in its net assets for each of the two years in the period then ended, and the financial highlights for each of the five years in the period then ended, in conformity with accounting principles generally accepted in the United States of America.
TAIT, WELLER & BAKER LLP
Philadelphia, Pennsylvania
February 25, 2011
4
| TAX-FREE FUND OF COLORADO | |||||||||
| SCHEDULE OF INVESTMENTS | |||||||||
| DECEMBER 31, 2010 | |||||||||
| Rating | |||||||||
| Moody’s, S&P | |||||||||
| Principal | and Fitch | ||||||||
| Amount | General Obligation Bonds (23.3%) | (unaudited) | Value | ||||||
| Metropolitan District (6.2%) | |||||||||
| Arapahoe, Colorado Park & Recreation District | |||||||||
| $ | 1,070,000 | 5.000%, 12/01/17 NPFG Insured | A1/NR/NR | $ | 1,098,109 | ||||
| Denver, Colorado International Business Center | |||||||||
| Metropolitan District No.1, Refunding | |||||||||
| 2,090,000 | 5.125%, 12/01/25 | NR/BBB+/NR | 2,000,611 | ||||||
| Eagle - Vail, Colorado Metropolitan District | |||||||||
| 525,000 | 5.000%, 12/01/29 | NR/A+/NR | 526,848 | ||||||
| Foothills, Colorado Park & Recreational District | |||||||||
| 1,325,000 | 5.000%, 12/01/13 AGMC Insured Pre-Refunded | Aa2/NR/NR | 1,379,789 | ||||||
| Fraser Valley, Colorado Metropolitan Recreational | |||||||||
| District | |||||||||
| 1,875,000 | 5.000%, 12/01/25 | NR/A/NR | 1,912,200 | ||||||
| Heather Gardens, Colorado Metropolitan District | |||||||||
| 1,000,000 | 4.750%, 12/01/26 | A3/NR/NR | 941,600 | ||||||
| Hyland Hills Metro Park & Recreation District, | |||||||||
| Colorado Special Revenue Refunding & | |||||||||
| Improvement | |||||||||
| 875,000 | 4.375%, 12/15/26 ACA Insured | NR/NR/NR* | 719,346 | ||||||
| Lincoln Park, Colorado Metropolitan District, | |||||||||
| Refunding & Improvement | |||||||||
| 1,535,000 | 5.625%, 12/01/20 | NR/BBB-/NR | 1,529,720 | ||||||
| Poudre Tech Metropolitan District, Colorado | |||||||||
| Unlimited Property Tax Supported Revenue | |||||||||
| Refunding & Improvement, Series B | |||||||||
| 1,990,000 | 5.000%, 12/01/28 AGMC Insured | NR/AA+/NR | 1,980,587 | ||||||
| Stonegate Village Metropolitan District, Colorado | |||||||||
| Refunding & Improvement | |||||||||
| 500,000 | 5.000%, 12/01/23 NPFG Insured | Baa1/A-/NR | 505,580 | ||||||
| 900,000 | 5.000%, 12/01/24 NPFG Insured | Baa1/A-/NR | 910,044 | ||||||
| North Metro Fire Rescue District, Colorado | |||||||||
| 1,200,000 | 4.625%, 12/01/20 AMBAC Insured | NR/AA/NR | 1,264,224 | ||||||
| Park Creek Metropolitan District, Colorado | |||||||||
| Revenue Refunding & Improvement -Senior | |||||||||
| Property Tax Support | |||||||||
| 2,000,000 | 5.500%, 12/01/21 AGMC Insured | NR/AA+/BBB+ | 2,136,240 | ||||||
| Total Metropolitan District | 16,904,898 | ||||||||
5
| TAX-FREE FUND OF COLORADO | |||||||||
| SCHEDULE OF INVESTMENTS (continued) | |||||||||
| DECEMBER 31, 2010 | |||||||||
| Rating | |||||||||
| Moody’s, S&P | |||||||||
| Principal | and Fitch | ||||||||
| Amount | General Obligation Bonds (continued) | (unaudited) | Value | ||||||
| School Districts (17.1%) | |||||||||
| Adams & Arapahoe Counties, Colorado Joint School | |||||||||
| District #28J | |||||||||
| $ | 2,500,000 | 5.500%, 12/01/23 | Aa2/AA-/NR | $ | 2,748,375 | ||||
| Adams & Weld Counties, Colorado School District #27J | |||||||||
| 1,000,000 | 5.375%, 12/01/26 NPFG Insured | Aa2/AA-/NR | 1,064,080 | ||||||
| Adams County, Colorado School District #12 (Adams | |||||||||
| 12 Five Star Schools) | |||||||||
| 1,170,000 | 5.000%, 12/15/12 NPFG Insured | Aa2/NR/NR | 1,215,571 | ||||||
| 830,000 | 5.000%, 12/15/12 NPFG Insured Pre-Refunded | Aa3/AAA/AAA | 865,790 | ||||||
| Arapahoe County, Colorado School District #006 | |||||||||
| Littleton | |||||||||
| 1,000,000 | 5.250%, 12/01/21 NPFG Insured Pre-Refunded | Aa1/AA/NR | 1,085,570 | ||||||
| Boulder Larimer & Weld Counties, Colorado | |||||||||
| 1,260,000 | 5.000%, 12/15/26 AGMC Insured | Aa2/AA+/NR | 1,311,836 | ||||||
| 1,500,000 | 5.000%, 12/15/28 | Aa2/AA-/NR | 1,568,970 | ||||||
| Clear Creek, Colorado School District | |||||||||
| 1,000,000 | 5.000%, 12/01/16 AGMC Insured | Aa3/AA+/NR | 1,066,670 | ||||||
| Denver, Colorado City & County School District No. 1 | |||||||||
| 3,000,000 | 5.250%, 12/01/27 | Aa2/AA-/NR | 3,212,250 | ||||||
| 1,000,000 | 5.000%, 12/01/28 Series A | Aa2/AA-/NR | 1,046,750 | ||||||
| Denver, Colorado City & County School District No. 1 | |||||||||
| 3,000,000 | 3.000%, 12/01/23 Series C | Aa2/AA-/NR | 2,708,190 | ||||||
| Douglas County, Colorado School District No. RE-1 | |||||||||
| Douglas & Elbert Counties | |||||||||
| 1,320,000 | 3.500%, 12/15/23 | Aa2/NR/AA | 1,257,247 | ||||||
| El Paso County, Colorado School District #20 | |||||||||
| 1,500,000 | 5.000%, 12/15/14 NPFG Insured Pre-Refunded | Aa2/NR/NR | 1,623,735 | ||||||
| 1,085,000 | 5.500%, 12/15/23 NPFG Insured Pre-Refunded | Aa2/NR/NR | 1,224,954 | ||||||
| El Paso County, Colorado School District #20 | |||||||||
| 3,000,000 | 4.500%, 12/15/25 AGMC Insured | Aa2/NR/NR | 3,023,070 | ||||||
| El Paso County, Colorado School District #20 Refunding | |||||||||
| 1,945,000 | 4.375%, 12/15/23 | Aa2/NR/NR | 2,003,875 | ||||||
| El Paso County, Colorado School District #49 | |||||||||
| 1,000,000 | 5.250%, 12/01/14 NPFG Insured Pre-Refunded | Aa2/AA-/NR | 1,043,610 | ||||||
6
| TAX-FREE FUND OF COLORADO | |||||||||
| SCHEDULE OF INVESTMENTS (continued) | |||||||||
| DECEMBER 31, 2010 | |||||||||
| Rating | |||||||||
| Moody’s, S&P | |||||||||
| Principal | and Fitch | ||||||||
| Amount | General Obligation Bonds (continued) | (unaudited) | Value | ||||||
| School Districts (continued) | |||||||||
| Garfield County, Colorado School District | |||||||||
| $ | 1,250,000 | 5.000%, 12/01/17 AGMC Insured Pre-Refunded | Aa2/NR/NR | $ | 1,351,062 | ||||
| Gunnison Watershed, Colorado School District | |||||||||
| 1,025,000 | 5.250%, 12/01/26 | Aa2/AA-/NR | 1,097,437 | ||||||
| Jefferson County, Colorado School District #R-001 | |||||||||
| 3,000,000 | 5.250%, 12/15/25 AGMC Insured | Aa2/AA+/NR | 3,201,480 | ||||||
| La Plata County, Colorado School District #9 | |||||||||
| 1,500,000 | 5.000%, 11/01/18 NPFG Insured Pre-Refunded | NR/NR/NR* | 1,615,710 | ||||||
| Pueblo County, Colorado School District #70 | |||||||||
| 1,000,000 | 5.000%, 12/01/15 NPFG Insured | Aa2/AA-/NR | 1,025,950 | ||||||
| 3,440,000 | 5.000%, 12/01/16 NPFG Insured | Aa2/AA-/NR | 3,520,496 | ||||||
| Teller County, Colorado School District #2 Woodland | |||||||||
| Park | |||||||||
| 1,265,000 | 5.000%, 12/01/17 NPFG Insured | Aa2/AA-/NR | 1,374,081 | ||||||
| Weld County, Colorado School District #2 | |||||||||
| 1,315,000 | 5.000%, 12/01/15 AGMC Insured | Aa2/AA+/NR | 1,384,577 | ||||||
| Weld County, Colorado School District #6 | |||||||||
| 1,195,000 | 5.000%, 12/01/15 AGMC Insured Pre-Refunded | Aa2/AA+/NR | 1,244,413 | ||||||
| Weld County, Colorado School District #8 | |||||||||
| 1,115,000 | 5.000%, 12/01/15 AGMC Insured Pre-Refunded | Aa2/AA+/NR | 1,206,252 | ||||||
| 1,385,000 | 5.250%, 12/01/17 AGMC Insured Pre-Refunded | Aa2/AA+/NR | 1,504,899 | ||||||
| Total School Districts | 46,596,900 | ||||||||
| Total General Obligation Bonds | 63,501,798 | ||||||||
| Revenue Bonds (76.0%) | |||||||||
| Airport (3.5%) | |||||||||
| Denver, Colorado City & County Airport Revenue | |||||||||
| System, Series A | |||||||||
| 1,210,000 | 5.250%, 11/15/28 | A1/A+/A+ | 1,228,767 | ||||||
| 3,000,000 | 5.250%, 11/15/29 | A1/A+/A+ | 3,025,170 | ||||||
| Denver, Colorado City & County Airport Revenue | |||||||||
| System, Series A Refunding | |||||||||
| 4,340,000 | 5.000%, 11/15/24 | A1/A+/A+ | 4,424,370 | ||||||
7
| TAX-FREE FUND OF COLORADO | |||||||||
| SCHEDULE OF INVESTMENTS (continued) | |||||||||
| DECEMBER 31, 2010 | |||||||||
| Rating | |||||||||
| Moody’s, S&P | |||||||||
| Principal | and Fitch | ||||||||
| Amount | Revenue Bonds (continued) | (unaudited) | Value | ||||||
| Airport (continued) | |||||||||
| Walker Field, Colorado Public Airport Authority | |||||||||
| Airport Revenue | |||||||||
| $ | 1,000,000 | 5.000%, 12/01/22 | Baa2/NR/NR | $ | 961,760 | ||||
| Total Airport | 9,640,067 | ||||||||
| Electric (3.4%) | |||||||||
| Colorado Springs, Colorado Utilities Revenue | |||||||||
| 1,660,000 | 5.000%, 11/15/17 Pre-Refunded | Aa2/AA/NR | 1,792,385 | ||||||
| Colorado Springs, Colorado Utilities Revenue, | |||||||||
| Refunding Series A | |||||||||
| 2,000,000 | 4.750%, 11/15/27 | Aa2/AA/AA | 2,047,860 | ||||||
| Colorado Springs, Colorado Utilities Revenue, | |||||||||
| Refunding Series A-1 | |||||||||
| 2,000,000 | 4.000%, 11/15/26 | Aa2/AA/AA | 1,900,520 | ||||||
| 1,000,000 | 4.000%, 11/15/27 | Aa2/AA/AA | 935,020 | ||||||
| Colorado Springs, Colorado Utilities Revenue | |||||||||
| Refunding Series B | |||||||||
| 1,285,000 | 5.250%, 11/15/23 | Aa2/AA/AA | 1,400,509 | ||||||
| Colorado Springs, Colorado Utilities Revenue | |||||||||
| Subordinated Lien Improvement Series B | |||||||||
| 1,160,000 | 5.000%, 11/15/23 | Aa2/AA/AA | 1,192,700 | ||||||
| Total Electric | 9,268,994 | ||||||||
| Higher Education (22.3%) | |||||||||
| Adams State College, Colorado Auxiliary | |||||||||
| Facilities Revenue Improvement Series A | |||||||||
| 1,000,000 | 5.200%, 05/15/27 | Aa2/AA-/NR | 1,030,690 | ||||||
| Adams State College, Colorado Auxiliary | |||||||||
| Facilities Revenue Refunding, Series B | |||||||||
| 3,275,000 | 4.500%, 05/15/29 | Aa2/AA-/NR | 3,073,358 | ||||||
| Boulder, Colorado Development Revenue UCAR | |||||||||
| 1,880,000 | 5.000%, 09/01/27 NPFG Insured | A2/A+/NR | 1,882,839 | ||||||
| Colorado Educational & Cultural Facility | |||||||||
| Authority, Johnson & Wales | |||||||||
| 860,000 | 5.000%, 04/01/18 Syncora Guarantee, Inc. Insured | NR/NR/NR* | 881,526 | ||||||
8
| TAX-FREE FUND OF COLORADO | |||||||||
| SCHEDULE OF INVESTMENTS (continued) | |||||||||
| DECEMBER 31, 2010 | |||||||||
| Rating | |||||||||
| Moody’s, S&P | |||||||||
| Principal | and Fitch | ||||||||
| Amount | Revenue Bonds (continued) | (unaudited) | Value | ||||||
| Higher Education (continued) | |||||||||
| Colorado Educational & Cultural Facility Authority, | |||||||||
| Regis University Project | |||||||||
| $ | 1,695,000 | 5.000%, 06/01/24 Radian Insured | NR/BBB/NR | $ | 1,638,658 | ||||
| Colorado Educational & Cultural Facility Authority, | |||||||||
| Student Housing - Campus Village Apartments | |||||||||
| Refunding | |||||||||
| 2,935,000 | 5.375%, 06/01/28 | NR/A/NR | 2,913,545 | ||||||
| Colorado Educational & Cultural Facility Authority, | |||||||||
| University Corp. Atmosphere Project, Refunding | |||||||||
| 1,700,000 | 5.000%, 09/01/22 | A2/A+/NR | 1,772,641 | ||||||
| 1,635,000 | 5.000%, 09/01/28 | A2/A+/NR | 1,641,115 | ||||||
| Colorado Educational & Cultural Facility | |||||||||
| Authority, University of Colorado Foundation Project | |||||||||
| 2,110,000 | 5.000%, 07/01/17 AMBAC Insured Pre-Refunded | NR/NR/NR* | 2,238,309 | ||||||
| 1,865,000 | 5.375%, 07/01/18 AMBAC Insured Pre-Refunded | NR/NR/NR* | 1,988,724 | ||||||
| Colorado Educational & Cultural Facility Authority | |||||||||
| Revenue Refunding, University of Denver Project | |||||||||
| 1,000,000 | 5.250%, 03/01/26 NPFG Insured | A1/A+/NR | 1,053,520 | ||||||
| Colorado Educational & Cultural Facility Authority | |||||||||
| Revenue Refunding, University of Denver Project, | |||||||||
| Series B | |||||||||
| 3,085,000 | 5.000%, 03/01/22 NPFG-FGIC Insured | A1/A+/NR | 3,192,389 | ||||||
| Colorado Educational & Cultural Facility Authority, | |||||||||
| University of Denver Project, Series B Refunding | |||||||||
| 3,620,000 | 5.250%, 03/01/23 NPFG Insured | A1/A+/AA | 3,760,347 | ||||||
| Colorado Mountain Jr. College District Student | |||||||||
| Housing Facilities Enterprise Revenue | |||||||||
| 1,000,000 | 4.500%, 06/01/18 NPFG Insured | Baa1/BBB/NR | 1,016,610 | ||||||
| 1,825,000 | 5.000%, 06/01/23 NPFG Insured | Baa1/BBB/NR | 1,824,909 | ||||||
| Colorado School of Mines Enterprise Revenue | |||||||||
| Refunding & Improvement | |||||||||
| 1,455,000 | 5.000%, 12/01/24 | Aa2/AA-/NR | 1,508,762 | ||||||
| Colorado School of Mines Enterprise Revenue | |||||||||
| Refunding, Institutional, Series C | |||||||||
| 2,000,000 | 4.600%, 12/01/29 | Aa2/AA-/NR | 1,928,880 | ||||||
9
| TAX-FREE FUND OF COLORADO | |||||||||
| SCHEDULE OF INVESTMENTS (continued) | |||||||||
| DECEMBER 31, 2010 | |||||||||
| Rating | |||||||||
| Moody’s, S&P | |||||||||
| Principal | and Fitch | ||||||||
| Amount | Revenue Bonds (continued) | (unaudited) | Value | ||||||
| Higher Education (continued) | |||||||||
| Colorado State Board of Governors University | |||||||||
| Enterprise System, Series A, Refunding and | |||||||||
| Improvement | |||||||||
| $ | 425,000 | 5.000%, 03/01/17 Pre-Refunded | Aa3/NR/NR | $ | 463,258 | ||||
| Colorado State Board of Governors University | |||||||||
| Enterprise System, Series A, Refunding and | |||||||||
| Improvement | |||||||||
| 1,105,000 | 5.000%, 03/01/17 AMBAC Insured | Aa3/NR/NR | 1,163,775 | ||||||
| Colorado State Board of Governors University | |||||||||
| Enterprise System, Series A | |||||||||
| 930,000 | 5.000%, 03/01/28 AGMC Insured | Aa3/AA+/NR | 952,404 | ||||||
| Colorado State COP University of Colorado at Denver | |||||||||
| Health Sciences Center Fitzsimons Academic | |||||||||
| Projects Series B | |||||||||
| 3,135,000 | 5.250%, 11/01/25 NPFG Pre-Refunded | Baa1/AA-/NR | 3,651,272 | ||||||
| Mesa State College, Colorado Auxiliary Facilities | |||||||||
| Enterprise | |||||||||
| 1,000,000 | 5.000%, 05/15/20 Syncora Guarantee, Inc. | ||||||||
| Insured | A2/NR/NR | 1,005,770 | |||||||
| Mesa State College, Colorado Auxiliary Facilities | |||||||||
| Enterprise | |||||||||
| 2,000,000 | 5.700%, 05/15/26 Pre-Refunded | Aa3/AA-/NR | 2,439,200 | ||||||
| University of Colorado Enterprise System | |||||||||
| 1,000,000 | 5.000%, 06/01/11 | Aa2/AA-/NR | 1,018,450 | ||||||
| 2,325,000 | 5.000%, 06/01/15 AMBAC Insured Pre-Refunded | Aa2/AA-/NR | 2,465,244 | ||||||
| 1,735,000 | 5.000%, 06/01/16 Pre-Refunded | Aa2/AA-/AAA | 1,901,716 | ||||||
| 1,000,000 | 5.250%, 06/01/17 NPFG Insured Pre-Refunded | Aa2/AA-/NR | 1,102,020 | ||||||
| 2,000,000 | 5.000%, 06/01/27 | Aa2/AA-/AA+ | 2,062,200 | ||||||
| University of Colorado Enterprise System Revenue, | |||||||||
| Refunding, Series B | |||||||||
| 1,680,000 | 4.000%, 06/01/23 | Aa2/AA-/AA+ | 1,671,818 | ||||||
| University of Colorado Enterprise System Revenue, | |||||||||
| Refunding & Improvement | |||||||||
| 3,905,000 | 5.000%, 06/01/24 NPFG Insured | Aa2/AA-/AA+ | 4,103,023 | ||||||
10
| TAX-FREE FUND OF COLORADO | |||||||||
| SCHEDULE OF INVESTMENTS (continued) | |||||||||
| DECEMBER 31, 2010 | |||||||||
| Rating | |||||||||
| Moody’s, S&P | |||||||||
| Principal | and Fitch | ||||||||
| Amount | Revenue Bonds (continued) | (unaudited) | Value | ||||||
| Higher Education (continued) | |||||||||
| University of Northern Colorado Auxiliary | |||||||||
| Facilities | |||||||||
| $ | 1,390,000 | 5.000%, 06/01/15 AMBAC Insured | A1/A/NR | $ | 1,406,041 | ||||
| University of Northern Colorado Revenue Refunding | |||||||||
| 1,000,000 | 5.000%, 06/01/24 AGMC Insured | Aa3/AA+/NR | 1,018,140 | ||||||
| Western State College, Colorado Revenue | |||||||||
| 1,020,000 | 5.000%, 05/15/27 State Higher Ed. Intercept Program | ||||||||
| Insured | Aa2/AA-/NR | 1,033,852 | |||||||
| Total Higher Education | 60,805,005 | ||||||||
| Hospital (10.7%) | |||||||||
| Colorado Health Facility Authority Hospital Revenue, | |||||||||
| Adventist Health/Sunbelt, Refunding | |||||||||
| 2,500,000 | 5.125%, 11/15/29 | Aa3/AA-/AA- | 2,442,225 | ||||||
| Colorado Health Facility Authority Hospital Revenue, | |||||||||
| Catholic Health | |||||||||
| 1,000,000 | 4.750%, 09/01/25 AGMC Insured | Aa2/AA+/AA | 1,007,940 | ||||||
| Colorado Health Facility Authority Hospital Revenue, | |||||||||
| Evangelical Lutheran Project Refunding | |||||||||
| 1,575,000 | 5.250%, 06/01/19 | A3/A-/NR | 1,617,367 | ||||||
| Colorado Health Facility Authority Hospital Revenue, | |||||||||
| Evangelical Lutheran Project Refunding | |||||||||
| 1,000,000 | 5.250%, 06/01/21 | A3/A-/NR | 1,006,960 | ||||||
| 2,000,000 | 5.250%, 06/01/24 | A3/A-/NR | 1,969,660 | ||||||
| Colorado Health Facility Authority Hospital Revenue, | |||||||||
| NCMC, Inc., Project | |||||||||
| 2,000,000 | 5.250%, 05/15/26 Series A AGMC Insured | NR/AA+/AA+ | 2,036,440 | ||||||
| Colorado Health Facility Authority Hospital Revenue, | |||||||||
| Poudre Valley Health Care Series F Refunding | |||||||||
| 4,760,000 | 5.000%, 03/01/25 | A2/A/NR | 4,674,463 | ||||||
| Colorado Health Facility Authority Hospital Revenue | |||||||||
| Refunding, Catholic Health, Series A | |||||||||
| 2,000,000 | 5.250%, 07/01/24 | Aa2/AA/AA | 2,119,340 | ||||||
| Colorado Health Facility Authority Hospital Revenue, | |||||||||
| Valley View Hospital Association, Refunding | |||||||||
| 1,500,000 | 5.500%, 05/15/28 | NR/BBB/NR | 1,424,310 | ||||||
11
| TAX-FREE FUND OF COLORADO | |||||||||
| SCHEDULE OF INVESTMENTS (continued) | |||||||||
| DECEMBER 31, 2010 | |||||||||
| Rating | |||||||||
| Moody’s, S&P | |||||||||
| Principal | and Fitch | ||||||||
| Amount | Revenue Bonds (continued) | (unaudited) | Value | ||||||
| Hospital (continued) | |||||||||
| Colorado Health Facility Authority Revenue, Catholic | |||||||||
| Health Initiatives, Series D | |||||||||
| $ | 2,000,000 | 5.000%, 10/01/16 | Aa2/AA/AA | $ | 2,249,740 | ||||
| 1,000,000 | 6.000%, 10/01/23 | Aa2/AA/AA | 1,113,610 | ||||||
| Colorado Health Facility Authority Revenue, Sisters | |||||||||
| Leavenworth, Refunding | |||||||||
| 3,000,000 | 5.250%, 01/01/25 | Aa3/AA/AA- | 3,058,110 | ||||||
| Denver, Colorado Health & Hospital Authority | |||||||||
| Healthcare, Revenue Series A Refunding | |||||||||
| 2,000,000 | 5.000%, 12/01/18 | NR/BBB/BBB+ | 1,988,300 | ||||||
| 1,500,000 | 5.000%, 12/01/19 | NR/BBB/BBB+ | 1,462,080 | ||||||
| Park Hospital District Larimer County, Colorado | |||||||||
| Limited Tax Revenue | |||||||||
| 1,010,000 | 4.500%, 01/01/21 AGMC Insured | Aa3/AA+/NR | 977,559 | ||||||
| Total Hospital | 29,148,104 | ||||||||
| Housing (1.7%) | |||||||||
| Colorado Housing & Finance Authority | |||||||||
| 190,000 | 6.050%, 10/01/16 Series 1999A3 | Aa2/NR/NR | 200,999 | ||||||
| 5,000 | 6.125%, 11/01/23 Series 1998D3 | Aa2/NR/NR | 5,310 | ||||||
| Colorado Housing & Finance Authority, Single Family | |||||||||
| Program Refunding | |||||||||
| 70,000 | 5.000%, 08/01/13 Series 2001 Series B | A1/A+/NR | 69,695 | ||||||
| Colorado Housing Finance Authority, Single Family | |||||||||
| Mortgage | |||||||||
| 10,000 | 5.700%, 10/01/22 Series 2000C3 | Aa2/AA/NR | 10,613 | ||||||
| Colorado Housing & Finance Authority, Single Family | |||||||||
| Mortgage Class II | |||||||||
| 850,000 | 5.500%, 11/01/29 | Aaa/AAA/NR | 887,374 | ||||||
| Colorado Housing Finance Authority, Single Family | |||||||||
| Mortgage Class III Series A-5 | |||||||||
| 2,495,000 | 5.000%, 11/01/34 | A1/A+/NR | 2,500,564 | ||||||
| Colorado Housing Finance Authority, Single Family | |||||||||
| Mortgage Subordinated | |||||||||
| 25,000 | 5.400%, 10/01/12 Series 2000D | A1/A+/NR | 25,184 | ||||||
12
| TAX-FREE FUND OF COLORADO | |||||||||
| SCHEDULE OF INVESTMENTS (continued) | |||||||||
| DECEMBER 31, 2010 | |||||||||
| Rating | |||||||||
| Moody’s, S&P | |||||||||
| Principal | and Fitch | ||||||||
| Amount | Revenue Bonds (continued) | (unaudited) | Value | ||||||
| Housing (continued) | |||||||||
| Colorado Housing and Finance Authority, Multi-Family | |||||||||
| Project C1-II Series A-2 | |||||||||
| $ | 940,000 | 5.400%, 10/01/29 | Aa2/AA/NR | $ | 950,500 | ||||
| Total Housing | 4,650,239 | ||||||||
| Lease (18.2%) | |||||||||
| Adams 12 Five Star Schools, Colorado COP | |||||||||
| 1,770,000 | 4.625%, 12/01/24 | Aa3/A+/NR | 1,749,362 | ||||||
| 500,000 | 5.000%, 12/01/25 | Aa3/A+/NR | 504,200 | ||||||
| Adams County, Colorado Corrections Facility COP, | |||||||||
| Series B | |||||||||
| 1,600,000 | 5.000%, 12/01/26 | Aa2/AA/NR | 1,624,976 | ||||||
| 1,200,000 | 5.125%, 12/01/27 | Aa2/AA/NR | 1,221,396 | ||||||
| Alamosa, Colorado COP Municipal Complex Project | |||||||||
| 1,100,000 | 4.750%, 02/15/25 | NR/A/NR | 1,044,637 | ||||||
| Aurora, Colorado COP, Refunding | |||||||||
| 1,500,000 | 5.000%, 12/01/26 Series A | Aa2/AA-/NR | 1,533,465 | ||||||
| Brighton, Colorado COP Refunding | |||||||||
| 1,865,000 | 5.000%, 12/01/24 Series A AGMC Insured | Aa3/AA+/NR | 1,902,897 | ||||||
| Broomfield, Colorado COP | |||||||||
| 2,000,000 | 4.500%, 12/01/28 | Aa3/NR/NR | 1,873,080 | ||||||
| Colorado Educational & Cultural Facilities Authority | |||||||||
| Revenue, Aurora Academy Project | |||||||||
| 1,255,000 | 5.250%, 02/15/24 Syncora Guarantee, Inc. | ||||||||
| Insured | NR/A/NR | 1,217,902 | |||||||
| Colorado Educational & Cultural Facilities Authority | |||||||||
| Revenue, Ave Maria School Project Refunding | |||||||||
| 1,000,000 | 4.850%, 12/01/25 Radian Insured | NR/NR/NR* | 872,490 | ||||||
| Colorado Educational & Cultural Facilities Authority | |||||||||
| Revenue, Charter School - James, Refunding & | |||||||||
| Improvement | |||||||||
| 3,000,000 | 5.000%, 08/01/27 CIFG Insured | NR/A/NR | 2,950,110 | ||||||
| Colorado Educational & Cultural Facilities Authority | |||||||||
| Revenue, Peak to Peak Charter School, Refunding | |||||||||
| 1,500,000 | 5.250%, 08/15/24 Syncora Guarantee, Inc. Insured | NR/A/NR | 1,497,030 | ||||||
13
| TAX-FREE FUND OF COLORADO | |||||||||
| SCHEDULE OF INVESTMENTS (continued) | |||||||||
| DECEMBER 31, 2010 | |||||||||
| Rating | |||||||||
| Moody’s, S&P | |||||||||
| Principal | and Fitch | ||||||||
| Amount | Revenue Bonds (continued) | (unaudited) | Value | ||||||
| Lease (continued) | |||||||||
| Colorado State Higher Education Capital Construction | |||||||||
| Lease | |||||||||
| $ | 3,000,000 | 5.250%, 11/01/23 | Aa2/AA-/NR | $ | 3,167,040 | ||||
| 1,690,000 | 5.000%, 11/01/26 | Aa2/AA-/NR | 1,699,075 | ||||||
| Denver, Colorado City and County COP (Botanical | |||||||||
| Gardens) | |||||||||
| 2,015,000 | 5.250%, 12/01/22 | Aa2/AA+/AA+ | 2,168,624 | ||||||
| Denver, Colorado City and County COP (Roslyn Fire) | |||||||||
| 1,835,000 | 5.000%, 12/01/15 Pre-Refunded | Aa1/AA+/AA | 1,910,877 | ||||||
| Douglas County, Colorado School District No. RE-1 | |||||||||
| Douglas & Elbert Counties COP | |||||||||
| 3,075,000 | 5.000%, 01/15/29 | Aa2/NR/NR | 3,042,559 | ||||||
| El Paso County, Colorado COP (Pikes Peak Regional | |||||||||
| Development Authority) | |||||||||
| 1,925,000 | 5.000%, 12/01/18 AMBAC Insured | NR/AA-/NR | 2,017,073 | ||||||
| El Paso County, Colorado COP School District #49 | |||||||||
| Falcon, Series A | |||||||||
| 2,560,000 | 5.000%, 12/15/30 NPFG Insured | Aa3/A/NR | 2,441,805 | ||||||
| Fort Collins, Colorado Lease COP Series A | |||||||||
| 3,020,000 | 4.750%, 06/01/18 AMBAC Insured | Aa1/NR/NR | 3,164,839 | ||||||
| Fremont County, Colorado COP Refunding & | |||||||||
| Improvement Series A | |||||||||
| 2,075,000 | 5.000%, 12/15/18 NPFG Insured | Baa1/BBB/NR | 2,125,090 | ||||||
| Garfield County, Colorado COP Public Library District | |||||||||
| 1,000,000 | 5.375%, 12/01/27 | NR/A/NR | 991,730 | ||||||
| Gypsum, Colorado COP | |||||||||
| 1,050,000 | 5.000%, 12/01/28 | NR/A+/NR | 1,013,806 | ||||||
| Northern Colorado Water Conservancy District COP | |||||||||
| 1,000,000 | 5.000%, 10/01/15 NPFG Insured | Baa1/AA-/NR | 1,036,180 | ||||||
| Pueblo, Colorado COP (Police Complex Project) | |||||||||
| 2,170,000 | 5.500%, 08/15/22 AGMC Insured | Aa3/AA+/NR | 2,328,670 | ||||||
| Rangeview Library District Project, Colorado COP | |||||||||
| 2,210,000 | 5.000%, 12/15/26 AGMC Insured | Aa3/AA+/NR | 2,209,934 | ||||||
| 1,000,000 | 5.000%, 12/15/28 AGMC Insured | Aa3/AA+/NR | 976,820 | ||||||
14
| TAX-FREE FUND OF COLORADO | |||||||||
| SCHEDULE OF INVESTMENTS (continued) | |||||||||
| DECEMBER 31, 2010 | |||||||||
| Rating | |||||||||
| Moody’s, S&P | |||||||||
| Principal | and Fitch | ||||||||
| Amount | Revenue Bonds (continued) | (unaudited) | Value | ||||||
| Lease (continued) | |||||||||
| Westminster, Colorado COP | |||||||||
| $ | 1,480,000 | 4.250%, 12/01/22 AGMC Insured | Aa3/AA+/NR | $ | 1,477,203 | ||||
| Total Lease | 49,762,870 | ||||||||
| Sales Tax (5.9%) | |||||||||
| Boulder, Colorado Open Space Capital Improvement | |||||||||
| 1,630,000 | 5.000%, 07/15/17 NPFG Insured Pre-Refunded | Aa1/AA/NR | 1,736,846 | ||||||
| Boulder County, Colorado Open Space Capital | |||||||||
| Improvement Series A | |||||||||
| 1,500,000 | 5.000%, 01/01/24 AGMC Insured | Aa3/AA+/NR | 1,555,350 | ||||||
| Commerce City, Colorado Sales & Use Tax Revenue | |||||||||
| 1,000,000 | 5.000%, 08/01/21 AMBAC Insured | NR/A+/NR | 1,048,970 | ||||||
| Golden, Colorado Sales & Use Tax | |||||||||
| 1,265,000 | 5.000%, 12/01/12 AMBAC Insured Pre-Refunded | NR/A/NR | 1,317,308 | ||||||
| Gunnison, Colorado Sales & Use Tax Revenue | |||||||||
| 1,215,000 | 4.200%, 12/01/27 Syncora Guarantee, Inc. Insured | NR/A-/NR | 1,085,189 | ||||||
| Gypsum County, Colorado Sales Tax & General Fund | |||||||||
| Revenue | |||||||||
| 1,690,000 | 5.250%, 06/01/30 AGMC Insured | NR/AA+/NR | 1,701,137 | ||||||
| Jefferson County, Colorado Open Space Sales Tax | |||||||||
| 1,600,000 | 5.000%, 11/01/13 AMBAC Insured Pre-Refunded | Aa2/AA-/AA | 1,661,024 | ||||||
| 1,080,000 | 5.000%, 11/01/14 AMBAC Insured Pre-Refunded | Aa2/AA-/AA | 1,121,191 | ||||||
| Park Meadows Business Implementation District, | |||||||||
| Colorado Shared Sales Tax Revenue Bond | |||||||||
| 1,500,000 | 5.300%, 12/01/27 | NR/NR/NR* | 1,303,020 | ||||||
| Steamboat Springs, Colorado Redevelopment Authority | |||||||||
| Tax Increment Refunding& Improvement, Base Area | |||||||||
| Redevelopment Project | |||||||||
| 2,575,000 | 4.500%, 12/01/26 | A1/NR/NR | 2,528,985 | ||||||
| Thornton, Colorado Sales Tax | |||||||||
| 1,000,000 | 5.000%, 09/01/14 AGMC Insured Pre-Refunded | Aa3/AA+/NR | 1,030,420 | ||||||
| Total Sales Tax | 16,089,440 | ||||||||
| Transportation (2.2%) | |||||||||
| Northwest Parkway, Colorado Public Highway | |||||||||
| Authority Series A | |||||||||
| 2,515,000 | 5.150%, 06/15/14 AMBAC Insured Pre-Refunded | NR/NR/NR* | 2,614,720 | ||||||
15
| TAX-FREE FUND OF COLORADO | |||||||||
| SCHEDULE OF INVESTMENTS (continued) | |||||||||
| DECEMBER 31, 2010 | |||||||||
| Rating | |||||||||
| Moody’s, S&P | |||||||||
| Principal | and Fitch | ||||||||
| Amount | Revenue Bonds (continued) | (unaudited) | Value | ||||||
| Transportation (continued) | |||||||||
| Regional Transportation District, Colorado COP, | |||||||||
| Series A | |||||||||
| $ | 3,500,000 | 5.000%, 06/01/25 AMBAC Insured | Aa3/A-/AA- | $ | 3,513,545 | ||||
| Total Transportation | 6,128,265 | ||||||||
| Water & Sewer (6.0%) | |||||||||
| Broomfield, Colorado Sewer and Waste Water | |||||||||
| Revenue | |||||||||
| 1,985,000 | 5.000%, 12/01/15 AMBAC Insured | A1/NR/NR | 2,064,797 | ||||||
| Broomfield, Colorado Water Activity Enterprise | |||||||||
| 1,500,000 | 5.300%, 12/01/12 NPFG Insured | Aa3/NR/NR | 1,520,025 | ||||||
| 1,730,000 | 5.250%, 12/01/13 NPFG Insured | Aa3/NR/NR | 1,752,819 | ||||||
| Colorado Water Resource & Power Development | |||||||||
| Authority | |||||||||
| 2,675,000 | 5.000%, 09/01/16 NPFG Insured | Baa1/BBB/NR | 2,841,653 | ||||||
| 1,855,000 | 5.000%, 09/01/17 NPFG Insured | Baa1/BBB/NR | 1,947,657 | ||||||
| Colorado Water Resource & Power Development | |||||||||
| Authority Clean Water Revenue Series A | |||||||||
| 1,375,000 | 5.000%, 09/01/12 Pre-Refunded | Aaa/AAA/AAA | 1,417,281 | ||||||
| 260,000 | 5.000%, 09/01/12 Un-Refunded portion | Aaa/AAA/AAA | 267,488 | ||||||
| Denver, Colorado City and County Wastewater | |||||||||
| Revenue | |||||||||
| 1,560,000 | 5.000%, 11/01/15 NPFG Insured | Aa2/AAA/AA+ | 1,669,138 | ||||||
| Erie, Colorado Water Enterprise Revenue, Series A | |||||||||
| 1,000,000 | 5.000%, 12/01/25 AGMC Insured | Aa3/NR/NR | 1,040,190 | ||||||
| Greeley, Colorado Water Revenue | |||||||||
| 1,920,000 | 4.200%, 08/01/24 NPFG Insured | Aa2/AA-/NR | 1,882,944 | ||||||
| Total Water & Sewer | 16,403,992 | ||||||||
| Miscellaneous Revenue (2.1%) | |||||||||
| Colorado Educational & Cultural Facility Authority, | |||||||||
| Independent School Revenue Refunding, Kent | |||||||||
| Denver School Project | |||||||||
| 1,000,000 | 5.000%, 10/01/30 | NR/A-/NR | 934,580 | ||||||
16
| TAX-FREE FUND OF COLORADO | ||||||||||||
| SCHEDULE OF INVESTMENTS (continued) | ||||||||||||
| DECEMBER 31, 2010 | ||||||||||||
| Rating | ||||||||||||
| Moody’s, S&P | ||||||||||||
| Principal | and Fitch | |||||||||||
| Amount | Revenue Bonds (continued) | (unaudited) | Value | |||||||||
| Miscellaneous Revenue (continued) | ||||||||||||
| Colorado Educational & Cultural Facility Authority, | ||||||||||||
| Independent School Revenue Refunding, Vail | ||||||||||||
| Mountain School Project | ||||||||||||
| $ | 1,820,000 | 6.000%, 05/01/30 | NR/BBB-/NR | $ | 1,815,687 | |||||||
| Colorado Educational & Cultural Facility Authority | ||||||||||||
| Revenue Charter School, Colorado Springs Charter | ||||||||||||
| Academy | ||||||||||||
| 3,020,000 | 5.250%, 07/01/28 | NR/A/NR | 2,949,090 | |||||||||
| Total Miscellaneous Revenue | 5,699,357 | |||||||||||
| Total Revenue Bonds | 207,596,333 | |||||||||||
| Total Investments (cost $269,186,470 – note 4) | 99.3 | % | 271,098,131 | |||||||||
| Other assets less liabilities | 0.7 | 1,944,835 | ||||||||||
| Net Assets | 100.0 | % | $ | 273,042,966 | ||||||||
| * | Any security not rated (NR) by any of the approved credit rating services has been determined by the Investment Sub-Adviser to have sufficient quality to be ranked in the top four credit ratings if a credit rating were to be assigned by a credit rating service. | |||||||||||
| Percent of | ||||||||||||
| Portfolio Distribution By Quality Rating | Portfolio1 | |||||||||||
| Aaa of Moody’s or AAA of S&P or Fitch | 1.0 | % | ||||||||||
Pre-Refunded Bonds2/Escrowed to maturity bonds | 16.6 | |||||||||||
| Aa of Moody’s or AA of S&P or Fitch | 50.3 | |||||||||||
| A of Moody’s or S&P or Fitch | 22.4 | |||||||||||
| Baa of Moody’s or BBB of S&P or Fitch | 8.3 | |||||||||||
| Not rated* | 1.4 | |||||||||||
| 100.0 | % | |||||||||||
| 1 | Calculated using the highest rating of the three rating services. | |||||||||||
| 2 | Pre-refunded bonds are bonds for which U.S. Govenment Obligations have been placed in escrow to retire the bonds at their earliest call date. | |||||||||||
| PORTFOLIO ABBREVIATIONS: | ||
| ACA - American Capital Assurance Financial Guaranty Corp. | FGIC - Financial Guaranty Insurance Co. | |
| AGMC - Assured Guaranty Municipal Corp. | NPFG - National Public Finance Guarantee | |
| AMBAC - American Municipal Bond Assurance Corp. | NR - Not Rated | |
| CIFG - CDC IXIS Financial Guaranty | UCAR - University Corporation for Atmospheric Research | |
| COP - Certificates of Participation | ||
| See accompanying notes to financial statements. | ||
17
| TAX-FREE FUND OF COLORADO | ||||
| STATEMENT OF ASSETS AND LIABILITIES | ||||
| DECEMBER 31, 2010 | ||||
| ASSETS | ||||
| Investments at value (cost $269,186,470) | $ | 271,098,131 | ||
| Cash | 1,901,288 | |||
| Interest receivable | 2,291,810 | |||
| Receivable for Fund shares sold | 776,996 | |||
| Other assets | 13,992 | |||
| Total assets | 276,082,217 | |||
| LIABILITIES | ||||
| Payable for Fund shares redeemed | 2,440,711 | |||
| Dividends payable | 407,161 | |||
| Management fee payable | 118,338 | |||
| Distribution and service fees payable | 1,982 | |||
| Accrued expenses | 71,059 | |||
| Total liabilities | 3,039,251 | |||
| NET ASSETS | $ | 273,042,966 | ||
| Net Assets consist of: | ||||
| Capital Stock - Authorized an unlimited number of shares, par value $0.01 per share . | $ | 269,321 | ||
| Additional paid-in capital | 270,883,912 | |||
| Net unrealized appreciation on investments (note 4) | 1,911,661 | |||
| Accumulated net realized loss on investments | (55,212 | ) | ||
| Undistributed net investment income | 33,284 | |||
| $ | 273,042,966 | |||
| CLASS A | ||||
| Net Assets | $ | 213,099,243 | ||
| Capital shares outstanding | 21,021,920 | |||
| Net asset value and redemption price per share | $ | 10.14 | ||
| Maximum offering price per share (100/96 of $10.14 adjusted to nearest cent) | $ | 10.56 | ||
| CLASS C | ||||
| Net Assets | $ | 25,732,714 | ||
| Capital shares outstanding | 2,543,412 | |||
| Net asset value and offering price per share | $ | 10.12 | ||
| Redemption price per share (*a charge of 1% is imposed on the redemption | ||||
| proceeds of the shares, or on the original price, whichever is lower, if redeemed | ||||
| during the first 12 months after purchase) | $ | 10.12 | * | |
| CLASS Y | ||||
| Net Assets | $ | 34,211,009 | ||
| Capital shares outstanding | 3,366,762 | |||
| Net asset value, offering and redemption price per share | $ | 10.16 | ||
See accompanying notes to financial statements.
18
| TAX-FREE FUND OF COLORADO | ||||||||
| STATEMENT OF OPERATIONS | ||||||||
| YEAR ENDED DECEMBER 31, 2010 | ||||||||
| Investment Income: | ||||||||
| Interest income | $ | 12,752,267 | ||||||
| Expenses: | ||||||||
| Management fee (note 3) | $ | 1,407,504 | ||||||
| Distribution and service fees (note 3) | 340,768 | |||||||
| Transfer and shareholder servicing agent fees | 140,546 | |||||||
| Trustees’ fees and expenses (note 8) | 99,951 | |||||||
| Legal fees (note 3) | 82,688 | |||||||
| Shareholders’ reports and proxy statements | 54,845 | |||||||
| Auditing and tax fees | 23,351 | |||||||
| Custodian fees (note 6) | 21,838 | |||||||
| Registration fees and dues | 15,689 | |||||||
| Insurance | 13,469 | |||||||
| Chief compliance officer (note 3) | 4,508 | |||||||
| Miscellaneous | 35,248 | |||||||
| Total expenses | 2,240,405 | |||||||
| Expenses paid indirectly (note 6) | (411 | ) | ||||||
| Net expenses | 2,239,994 | |||||||
| Net investment income | 10,512,273 | |||||||
| Realized and Unrealized Gain (Loss) on Investments: | ||||||||
| Net realized gain (loss) from securities transactions | 346,685 | |||||||
| Change in unrealized appreciation on investments | (7,701,088 | ) | ||||||
| Net realized and unrealized gain (loss) on investments | (7,354,403 | ) | ||||||
| Net change in net assets resulting from operations | $ | 3,157,870 | ||||||
See accompanying notes to financial statements.
19
| TAX-FREE FUND OF COLORADO | ||||||||
| STATEMENTS OF CHANGES IN NET ASSETS | ||||||||
| Year Ended | Year Ended | |||||||
| December 31, 2010 | December 31, 2009 | |||||||
| OPERATIONS: | ||||||||
| Net investment income | $ | 10,512,273 | $ | 8,837,609 | ||||
| Net realized gain (loss) from securities transactions | 346,685 | 139,213 | ||||||
| Change in unrealized appreciation (depreciation) on investments . | (7,701,088 | ) | 10,863,375 | |||||
| Change in net assets from operations | 3,157,870 | 19,840,197 | ||||||
| DISTRIBUTIONS TO SHAREHOLDERS (note 10): | ||||||||
| Class A Shares: | ||||||||
| Net investment income | (8,352,842 | ) | (7,927,795 | ) | ||||
| Class C Shares: | ||||||||
| Net investment income | (655,304 | ) | (317,179 | ) | ||||
| Class Y Shares: | ||||||||
| Net investment income | (1,512,329 | ) | (687,039 | ) | ||||
| Change in net assets from distributions | (10,520,475 | ) | (8,932,013 | ) | ||||
| CAPITAL SHARE TRANSACTIONS (note 7): | ||||||||
| Proceeds from shares sold | 79,757,891 | 56,286,623 | ||||||
| Reinvested dividends and distributions | 6,242,951 | 4,971,808 | ||||||
| Cost of shares redeemed | (56,440,080 | ) | (23,121,475 | ) | ||||
| Change in net assets from capital share transactions | 29,560,762 | 38,136,956 | ||||||
| Change in net assets | 22,198,157 | 49,045,140 | ||||||
| NET ASSETS: | ||||||||
| Beginning of period | 250,844,809 | 201,799,669 | ||||||
| End of period* | $ | 273,042,966 | $ | 250,844,809 | ||||
| * Includes undistributed net investment income: | $ | 33,284 | $ | 35,148 | ||||
See accompanying notes to financial statements.
20
TAX-FREE FUND OF COLORADO
NOTES TO FINANCIAL STATEMENTS
DECEMBER 31, 2010
1. Organization
Tax-Free Fund of Colorado (the “Fund”), a non-diversified, open-end investment company, was organized in February, 1987 as a Massachusetts business trust and commenced operations on May 21, 1987. The Fund is authorized to issue an unlimited number of shares and, since its inception to April 30, 1996, offered only one class of shares. On that date, the Fund began offering two additional classes of shares, Class C and Class Y Shares. All shares outstanding prior to that date were designated as Class A Shares and are sold at net asset value plus a sales charge (of varying size depending upon a variety of factors) paid at the time of purchase and bear a distribution fee. Class C Shares are sold at net asset value with no sales charge payable at the time of purchase but with a level charge for service and distribution fees for six years thereafter. Class C Shares automatically convert to Class A Shares after six years. Class Y Shares are sold only through institutions acting for investors in a fiduciary, advisory, agency, custodial or similar capacity, and are not offered directly to retail customers. Class Y Shares are sold at net asset value with no sales charge, no redemption fee, no contingent deferred sales charge (“CDSC”) and no distribution fee. On April 30, 1998, the Fund established Class I Shares which are offered and sold only through financial intermediaries and are not offered directly to retail customers. Class I Shares are sold at net asset value with no sales charge and no redemption fee or CDSC, although a financial intermediary may charge a fee for effecting a purchase or other transaction on behalf of its customers. Class I Shares may carry a distribution and a service fee. As of the report date, there were no Class I Shares outstanding. All classes of shares represent interests in the same portfolio of investments and are identical as to rights and privileges but differ with respect to the effect of sales charges, the distribution and/or service fees borne by each class, expenses specific to each class, voting rights on matters affecting a single class and the exchange privileges of each class.
2. Significant Accounting Policies
The following is a summary of significant accounting policies followed by the Fund in the preparation of its financial statements. The policies are in conformity with accounting principles generally accepted in the United States of America for investment companies.
| a) | Portfolio valuation: Municipal securities which have remaining maturities of more than 60 days are valued each business day based upon information provided by a nationally prominent independent pricing service and periodically verified through other pricing services. In the case of securities for which market quotations are readily available, securities are valued by the pricing service at the mean of bid and asked quotations. If a market quotation or a valuation from the pricing service is not readily available, the security is valued at fair value determined in good faith under procedures established by and under the general supervision of the Board of Trustees. Securities which mature in 60 days or less are valued at amortized cost if their term to maturity at purchase is 60 days or less, or by amortizing their unrealized appreciation or depreciation on the 61st day prior to maturity, if their term to maturity at purchase exceeds 60 days. |
21
TAX-FREE FUND OF COLORADO
NOTES TO FINANCIAL STATEMENTS (continued)
DECEMBER 31, 2010
| b) | Fair Value Measurements: The Fund follows a fair value hierarchy that distinguishes between market data obtained from independent sources (observable inputs) and the Fund’s own market assumptions (unobservable inputs). These inputs are used in determining the value of the Fund’s investments and are summarized in the following fair value hierarchy: |
Level 1 – Unadjusted quoted prices in active markets for identical assets or liabilities that the Fund has the ability to access.
Level 2 – Observable inputs other than quoted prices included in Level 1 that are observable for the asset or liability, either directly or indirectly. These inputs may include quoted prices for the identical instrument on an inactive market, prices for similar instruments, interest rates, prepayment speeds, credit risk, yield curves, default rates and similar data.
Level 3 – Unobservable inputs for the asset or liability, to the extent relevant observable inputs are not available, representing the Fund’s own assumptions about the assumptions a market participant would use in valuing the asset or liability, and would be based on the best information available.
The inputs or methodology used for valuing securities are not an indication of the risk associated with investing in those securities.
The following is a summary of the valuation inputs, representing 100% of the Fund’s investments, used to value the Fund’s net assets as of December 31, 2010:
| Valuation Inputs | Investments in Securities | ||||
| Level 1 – Quoted Prices | $ | — | |||
| Level 2 – Other Significant Observable Inputs — | |||||
| Municipal Bonds* | 271,098,131 | ||||
| Level 3 – Significant Unobservable Inputs | — | ||||
| Total | $ | 271,098,131 | |||
* See schedule of investments for a detailed listing of securities.
| c) | Subsequent events: In preparing these financial statements, the Fund has evaluated events and transactions for potential recognition or disclosure through the date these financial statements were issued. |
| d) | Securities transactions and related investment income: Securities transactions are recorded on the trade date. Realized gains and losses from securities transactions are reported on the identified cost basis. Interest income is recorded daily on the accrual basis and is adjusted for amortization of premium and accretion of original issue and market discount. |
| e) | Federal income taxes: It is the policy of the Fund to continue to qualify as a regulated investment company by complying with the provisions of the Internal Revenue Code applicable to certain investment companies. The Fund intends to make distributions of income and securities profits sufficient to relieve it from all, or substantially all, Federal income and excise taxes. |
22
TAX-FREE FUND OF COLORADO
NOTES TO FINANCIAL STATEMENTS (continued)
DECEMBER 31, 2010
Management has reviewed the tax positions for each of the open tax years (2007-2009) or expected to be taken in the Fund’s 2010 tax returns and has concluded that there are no significant uncertain tax positions that would require recognition in the financial statements.
| f) | Multiple class allocations: All income, expenses (other than class-specific expenses), and realized and unrealized gains or losses are allocated daily to each class of shares based on the relative net assets of each class. Class-specific expenses, which include distribution and service fees and any other items that are specifically attributed to a particular class, are also charged directly to such class on a daily basis. |
| g) | Use of estimates: The preparation of financial statements in conformity with accounting principles generally accepted in the United States of America requires management to make estimates and assumptions that affect the reported amounts of assets and liabilities and disclosure of contingent assets and liabilities at the date of the financial statements and the reported amounts of increases and decreases in net assets from operations during the reporting period. Actual results could differ from those estimates. |
| h) | Reclassification of capital accounts: Accounting principles generally accepted in the United States of America require that certain components of net assets relating to permanent differences be reclassified between financial and tax reporting. On December 31, 2010, the Fund increased undistributed net investment income by $6,338 and decreased additional paid-in capital by $6,338 due primarily to differing book/tax treatment of distributions and bond amortization. These reclassifications had no effect on net assets or net asset value per share. |
| i) | Accounting pronouncement: In January 2010, the Financial Accounting Standards Board (“FASB”) issued Accounting Standards Update “Improving Disclosures about Fair Value Measurements” (“ASU”). The ASU requires enhanced disclosures about a) transfers into and out of Levels 1 and 2, and b) purchases, sales, issuances, and settlements on a gross basis relating to Level 3 measurements. The first disclosure became effective for the first reporting period beginning after December 15, 2009, and for interim periods within those fiscal years. There were no significant transfers into and out of Levels 1 and 2 during the current period presented. |
The second disclosure will become effective for fiscal year ends beginning after December 15, 2010, and for interim periods within those fiscal years. Management has calculated the impact and has incorporated the appropriate disclosures required by the ASU in its financial statement disclosures.
3. Fees and Related Party Transactions
a) Management Arrangements:
Aquila Investment Management LLC (the “Manager”), a wholly-owned subsidiary of Aquila Management Corporation, the Fund’s founder and sponsor, serves as the Manager for the Fund under an Advisory and Administration Agreement with the Fund. The portfolio management of the Fund has been delegated to a Sub-Adviser as described below. Under the Advisory and Administration Agreement, the Manager provides all administrative services to the Fund, other than those relating to the day-to-day portfolio
23
TAX-FREE FUND OF COLORADO
NOTES TO FINANCIAL STATEMENTS (continued)
DECEMBER 31, 2010
management. The Manager’s services include providing the office of the Fund and all related services as well as overseeing the activities of the Sub-Adviser and managing relationships with all the various support organizations to the Fund such as the shareholder servicing agent, custodian, legal counsel, auditors and distributor and additionally maintaining the Fund’s accounting books and records. For its services, the Manager is entitled to receive a fee which is payable monthly and computed as of the close of business each day at the annual rate of 0.50 of 1% on the Fund’s net assets.
Kirkpatrick Pettis Capital Management (the “Sub-Adviser”) serves as the Investment Sub-Adviser for the Fund under a Sub-Advisory Agreement between the Manager and the Sub-Adviser. Under this agreement, the Sub-Adviser continuously provides, subject to oversight of the Manager and the Board of Trustees of the Fund, the investment program of the Fund and the composition of its portfolio, arranges for the purchases and sales of portfolio securities, and provides for daily pricing of the Fund’s portfolio. For its services, the Sub-Adviser is entitled to receive a fee from the Manager which is payable monthly and computed as of the close of business each day at the annual rate of 0.20 of 1% on the Fund’s net assets.
Under a Compliance Agreement with the Manager, the Manager is compensated for Chief Compliance Officer related services provided to enable the Fund to comply with Rule 38a-1 of the Investment Company Act of 1940.
Specific details as to the nature and extent of the services provided by the Manager and the Sub-Adviser are more fully defined in the Fund’s Prospectus and Statement of Additional Information.
b) Distribution and Service Fees:
The Fund has adopted a Distribution Plan (the “Plan”) pursuant to Rule 12b-1 (the “Rule”) under the Investment Company Act of 1940. Under one part of the Plan, with respect to Class A Shares, the Fund is authorized to make distribution fee payments to broker-dealers or others (“Qualified Recipients”) selected by Aquila Distributors, Inc. (the “Distributor”), including, but not limited to, any principal underwriter of the Fund, with which the Distributor has entered into written agreements contemplated by the Rule and which have rendered assistance in the distribution and/or retention of the Fund’s shares or servicing of shareholder accounts. While the Board of Trustees and shareholders approved an amendment to the Fund’s Distribution Plan applicable to Class A Shares which permits the Fund to make distribution fee payments at the rate of up to 0.15 of 1% on the entire net assets represented by Class A Shares, the Fund currently makes payment of this distribution fee at the annual rate of 0.05 of 1%. For the year ended December 31, 2010, distribution fees on Class A Shares amounted to $109,555 of which the Distributor retained $4,001.
Under another part of the Plan, the Fund is authorized to make payments with respect to Class C Shares to Qualified Recipients which have rendered assistance in the distribution and/or retention of the Fund’s Class C shares or servicing of shareholder accounts. These payments are made at the annual rate of 0.75% of the Fund’s average net assets represented by Class C Shares and for the year ended December 31, 2010, amounted to $173,410. In addition, under a Shareholder Services Plan, the Fund is authorized to make service fee payments with respect to Class C Shares to Qualified Recipients for providing personal services
24
TAX-FREE FUND OF COLORADO
NOTES TO FINANCIAL STATEMENTS (continued)
DECEMBER 31, 2010
and/or maintenance of shareholder accounts. These payments are made at the annual rate of 0.25 of 1% of the Fund’s average net assets represented by Class C Shares and for the year ended December 31, 2010, amounted to $57,803. The total of these payments with respect to Class C Shares amounted to $231,213 of which the Distributor retained $21,773.
Specific details about the Plans are more fully defined in the Fund’s Prospectus and Statement of Additional Information.
Under a Distribution Agreement, the Distributor serves as the exclusive distributor of the Fund’s shares. Through agreements between the Distributor and various brokerage and advisory firms (“intermediaries”), the Fund’s shares are sold primarily through the facilities of intermediaries having offices within Colorado, with the bulk of any sales commissions inuring to such intermediaries. For the year ended December 31, 2010, total commissions on sales of Class A Shares amounted to $438,023 of which the Distributor received $88,163.
c) Other Related Party Transactions:
For the year ended December 31, 2010, the Fund incurred $81,795 of legal fees allocable to Butzel Long PC, counsel to the Fund, for legal services in conjunction with the Fund’s ongoing operations. The Secretary of the Fund is Of Counsel to that firm.
4. Purchases and Sales of Securities
During the year ended December 31, 2010, purchases of securities and proceeds from the sales of securities aggregated $69,141,916 and $39,917,675, respectively.
At December 31, 2010, the aggregate tax cost for all securities was $269,153,186. At December 31, 2010, the aggregate gross unrealized appreciation for all securities in which there is an excess of value over tax cost amounted to $7,090,482 and aggregate gross unrealized depreciation for all securities in which there is an excess of tax cost over value amounted to $5,145,537 for a net unrealized appreciation of $1,944,945.
5. Portfolio Orientation
Since the Fund invests principally and may invest entirely in double tax-free municipal obligations of issuers within Colorado, it is subject to possible risks associated with economic, political, or legal developments or industrial or regional matters specifically affecting Colorado and whatever effects these may have upon Colorado issuers’ ability to meet their obligations.
6. Expenses
The Fund has negotiated an expense offset arrangement with its custodian wherein it receives credit toward the reduction of custodian fees and other Fund expenses whenever there are uninvested cash balances. The Statement of Operations reflects the total expenses before any offset, the amount of offset and the net expenses.
25
TAX-FREE FUND OF COLORADO
NOTES TO FINANCIAL STATEMENTS (continued)
DECEMBER 31, 2010
7. Capital Share Transactions
Transactions in Capital Shares of the Fund were as follows:
| Year Ended | Year Ended | |||||||||||||||
| December 31, 2010 | December 31, 2009 | |||||||||||||||
| Shares | Amount | Shares | Amount | |||||||||||||
| Class A Shares: | ||||||||||||||||
| Proceeds from shares sold | 2,627,817 | $ | 27,489,572 | 2,918,696 | $ | 29,871,995 | ||||||||||
| Reinvested distributions | 482,245 | 5,039,165 | 447,120 | 4,590,048 | ||||||||||||
| Cost of shares redeemed | (2,547,611 | ) | (26,506,999 | ) | (1,391,739 | ) | (14,254,850 | ) | ||||||||
| Net change | 562,451 | 6,021,738 | 1,974,077 | 20,207,193 | ||||||||||||
| Class C Shares: | ||||||||||||||||
| Proceeds from shares sold | 1,655,215 | 17,288,195 | 955,020 | 9,806,830 | ||||||||||||
| Reinvested distributions | 44,886 | 468,241 | 17,698 | 181,587 | ||||||||||||
| Cost of shares redeemed | (576,250 | ) | (5,963,087 | ) | (383,623 | ) | (3,928,411 | ) | ||||||||
| Net change | 1,123,851 | 11,793,349 | 589,095 | 6,060,006 | ||||||||||||
| Class Y Shares: | ||||||||||||||||
| Proceeds from shares sold | 3,334,401 | 34,980,124 | 1,614,589 | 16,607,798 | ||||||||||||
| Reinvested distributions | 70,116 | 735,545 | 19,407 | 200,173 | ||||||||||||
| Cost of shares redeemed | (2,301,529 | ) | (23,969,994 | ) | (478,961 | ) | (4,938,214 | ) | ||||||||
| Net change | 1,102,988 | 11,745,675 | 1,155,035 | 11,869,757 | ||||||||||||
| Total transactions in Fund shares | 2,789,290 | $ | 29,560,762 | 3,718,207 | $ | 38,136,956 | ||||||||||
8. Trustees’ Fees and Expenses
At December 31, 2010 there were 9 Trustees, one of whom is affiliated with the Manager and is not paid any fees. The total amount of Trustees’ service fees (for carrying out their responsibilities) and attendance fees paid during the year ended December 31, 2010 was $76,176. Attendance fees are paid to those in attendance at regularly scheduled quarterly Board Meetings and meetings of the independent Trustees held prior to each quarterly Board Meeting, as well as additional meetings (such as Audit, Nominating, Shareholder and special meetings). Trustees are reimbursed for their expenses such as travel, accommodations and meals incurred in connection with attendance at Board Meetings and the Annual Meeting of Shareholders. For the year ended December 31, 2010, such meeting-related expenses amounted to $23,775.
26
TAX-FREE FUND OF COLORADO
NOTES TO FINANCIAL STATEMENTS (continued)
DECEMBER 31, 2010
9. Securities Traded on a When-Issued Basis
The Fund may purchase or sell securities on a when-issued basis. When-issued transactions arise when securities are purchased or sold by the Fund with payment and delivery taking place in the future in order to secure what is considered to be an advantageous price and yield to the Fund at the time of entering into the transaction. Beginning on the date the Fund enters into a when-issued transaction, cash or other liquid securities are segregated in an amount equal to or greater than the value of the when-issued transaction. These transactions are subject to market fluctuations and their current value is determined in the same manner as for other securities.
10. Income Tax Information and Distributions
The Fund declares dividends daily from net investment income and makes payments monthly. Net realized capital gains, if any, are distributed annually and are taxable. Dividends and capital gains distributions are paid in additional shares at the net asset value per share, in cash, or in a combination of both, at the shareholder’s option.
The Fund intends to maintain, to the maximum extent possible, the tax-exempt status of interest payments received from portfolio municipal securities in order to allow dividends paid to shareholders from net investment income to be exempt from regular Federal and State of Colorado income taxes. Due to the distribution levels maintained by the Fund and the differences between financial statement reporting and Federal income tax reporting requirements, distributions made by the Fund may not be the same as the Fund’s net investment income, and/or net realized securities gains. At December 31, 2010, the Fund had a capital loss carryover of $55,212 that expires in 2017.
The tax character of distributions:
| Year Ended December 31, | ||||||||
| 2010 | 2009 | |||||||
| Net tax-exempt income | $ | 10,520,475 | $ | 8,837,255 | ||||
| Ordinary income | – | 94,758 | ||||||
| $ | 10,520,475 | $ | 8,932,013 | |||||
As of December 31, 2010 the components of distributable earnings on a tax basis were as follows:
| Undistributed tax-exempt income | $ | 407,161 | ||
| Unrealized appreciation | 1,944,945 | |||
| Other temporary differences | (462,373 | ) | ||
| $ | 1,889,733 | |||
27
TAX-FREE FUND OF COLORADO
NOTES TO FINANCIAL STATEMENTS (continued)
DECEMBER 31, 2010
The difference between book basis and tax basis unrealized appreciation is attributable primarily to premium/discount adjustments.The difference between book basis and tax basis undistributed income is due to the timing difference in recognizing dividends paid.
11. Ongoing Development
The three major rating agencies (Standard & Poor’s, Moody’s and Fitch) have downgraded or eliminated ratings of the majority of the municipal bond insurance companies since December 2007 due to loss of capital from investments in subprime mortgages. As such, only a few are now deemed to be investment grade. Thus, while certain bonds still have insurance, some are no longer rated based upon the ratings of their insurers. Furthermore, because the ability of many of the Fund’s insurers to pay claims has been downgraded, the protection of such insurance has been diminished, and there is no assurance that some of them may be relied on for payment.
28
| TAX-FREE FUND OF COLORADO | ||||||||||||||||||||
| FINANCIAL HIGHLIGHTS | ||||||||||||||||||||
| For a share outstanding throughout each period | ||||||||||||||||||||
| Class A | ||||||||||||||||||||
| Year Ended December 31, | ||||||||||||||||||||
| 2010 | 2009 | 2008 | 2007 | 2006 | ||||||||||||||||
| Net asset value, beginning of period | $ | 10.39 | $ | 9.88 | $ | 10.23 | $ | 10.32 | $ | 10.42 | ||||||||||
| Income (loss) from investment operations: | ||||||||||||||||||||
| Net investment income | 0.40 | (1) | 0.40 | (1) | 0.40 | (1) | 0.39 | (1) | 0.39 | (2) | ||||||||||
| Net gain (loss) on securities (both realized | ||||||||||||||||||||
| and unrealized) | (0.25 | ) | 0.52 | (0.34 | ) | (0.07 | ) | (0.07 | ) | |||||||||||
| Total from investment operations | 0.15 | 0.92 | 0.06 | 0.32 | 0.32 | |||||||||||||||
| Less distributions (note 10): | ||||||||||||||||||||
| Dividends from net investment income | (0.40 | ) | (0.41 | ) | (0.41 | ) | (0.41 | ) | (0.42 | ) | ||||||||||
| Distributions from capital gains | – | – | – | – | – | |||||||||||||||
| Total distributions | (0.40 | ) | (0.41 | ) | (0.41 | ) | (0.41 | ) | (0.42 | ) | ||||||||||
| Net asset value, end of period | $ | 10.14 | $ | 10.39 | $ | 9.88 | $ | 10.23 | $ | 10.32 | ||||||||||
| Total return (not reflecting sales charge) | 1.38 | % | 9.42 | % | 0.57 | % | 3.21 | % | 3.11 | % | ||||||||||
| Ratios/supplemental data | ||||||||||||||||||||
| Net assets, end of period (in millions) | $ | 213 | $ | 213 | $ | 183 | $ | 185 | $ | 198 | ||||||||||
| Ratio of expenses to average net assets | 0.73 | % | 0.77 | % | 0.80 | % | 0.80 | % | 0.79 | % | ||||||||||
| Ratio of net investment income to average | ||||||||||||||||||||
| net assets | 3.81 | % | 3.94 | % | 3.90 | % | 3.80 | % | 3.76 | % | ||||||||||
| Portfolio turnover rate | 14.44 | % | 11.73 | % | 24.63 | % | 8.77 | % | 7.48 | % | ||||||||||
| The expense ratios after giving effect to the expense offset for uninvested cash balances were: | ||||||||||||||||||||
| Ratio of expenses to average net assets | 0.73 | % | 0.77 | % | 0.79 | % | 0.79 | % | 0.78 | % | ||||||||||
__________
(1) Per share amounts have been calculated using the daily average shares method.
(2) Per share amounts have been calculated using the monthly average shares method.
See accompanying notes to financial statements.
29
| TAX-FREE FUND OF COLORADO | ||||||||||||||||||||||||||||||||||||||||
| FINANCIAL HIGHLIGHTS (continued) | ||||||||||||||||||||||||||||||||||||||||
| For a share outstanding throughout each period | ||||||||||||||||||||||||||||||||||||||||
| Class C | Class Y | |||||||||||||||||||||||||||||||||||||||
| Year Ended December 31, | Year Ended December 31, | |||||||||||||||||||||||||||||||||||||||
| 2010 | 2009 | 2008 | 2007 | 2006 | 2010 | 2009 | 2008 | 2007 | 2006 | |||||||||||||||||||||||||||||||
| Net asset value, beginning of period | $ | 10.37 | $ | 9.86 | $ | 10.21 | $ | 10.30 | $ | 10.40 | $ | 10.41 | $ | 9.90 | $ | 10.25 | $ | 10.35 | $ | 10.44 | ||||||||||||||||||||
| Income (loss) from investment operations: | ||||||||||||||||||||||||||||||||||||||||
| Net investment income | 0.30 | (1) | 0.30 | (1) | 0.30 | (1) | 0.29 | (1) | 0.29 | (2) | 0.40 | (1) | 0.41 | (1) | 0.40 | (1) | 0.40 | (1) | 0.40 | (2) | ||||||||||||||||||||
| Net gain (loss) on securities (both | ||||||||||||||||||||||||||||||||||||||||
| realized and unrealized) | (0.25 | ) | 0.52 | (0.34 | ) | (0.06 | ) | (0.07 | ) | (0.25 | ) | 0.51 | (0.33 | ) | (0.08 | ) | (0.07 | ) | ||||||||||||||||||||||
| Total from investment operations | 0.05 | 0.82 | (0.04 | ) | 0.23 | 0.22 | 0.15 | 0.92 | 0.07 | 0.32 | 0.33 | |||||||||||||||||||||||||||||
| Less distributions (note 10): | ||||||||||||||||||||||||||||||||||||||||
| Dividends from net investment income | (0.30 | ) | (0.31 | ) | (0.31 | ) | (0.32 | ) | (0.32 | ) | (0.40 | ) | (0.41 | ) | (0.42 | ) | (0.42 | ) | (0.42 | ) | ||||||||||||||||||||
| Distributions from capital gains | – | – | – | – | – | – | – | – | – | – | ||||||||||||||||||||||||||||||
| Total distributions | (0.30 | ) | (0.31 | ) | (0.31 | ) | (0.32 | ) | (0.32 | ) | (0.40 | ) | (0.41 | ) | (0.42 | ) | (0.42 | ) | (0.42 | ) | ||||||||||||||||||||
| Net asset value, end of period | $ | 10.12 | $ | 10.37 | $ | 9.86 | $ | 10.21 | $ | 10.30 | $ | 10.16 | $ | 10.41 | $ | 9.90 | $ | 10.25 | $ | 10.35 | ||||||||||||||||||||
| Total return | 0.42 | %(3) | 8.40 | %(3) | (0.39 | )%(3) | 2.24 | %(3) | 2.14 | %(3) | 1.44 | % | 9.47 | % | 0.63 | % | 3.17 | % | 3.26 | % | ||||||||||||||||||||
| Ratios/supplemental data | ||||||||||||||||||||||||||||||||||||||||
| Net assets, end of period (in millions) | $ | 26 | $ | 14 | $ | 8 | $ | 11 | $ | 12 | $ | 34 | $ | 24 | $ | 11 | $ | 6 | $ | 6 | ||||||||||||||||||||
| Ratio of expenses to average net assets | 1.67 | % | 1.71 | % | 1.75 | % | 1.75 | % | 1.74 | % | 0.67 | % | 0.72 | % | 0.75 | % | 0.75 | % | 0.75 | % | ||||||||||||||||||||
| Ratio of net investment income to | ||||||||||||||||||||||||||||||||||||||||
| average net assets | 2.83 | % | 2.95 | % | 2.95 | % | 2.85 | % | 2.81 | % | 3.85 | % | 3.97 | % | 3.96 | % | 3.84 | % | 3.82 | % | ||||||||||||||||||||
| Portfolio turnover rate | 14.44 | % | 11.73 | % | 24.63 | % | 8.77 | % | 7.48 | % | 14.44 | % | 11.73 | % | 24.63 | % | 8.77 | % | 7.48 | % | ||||||||||||||||||||
| The expense ratios after giving effect to the expense offset for uninvested cash balances were: | ||||||||||||||||||||||||||||||||||||||||
| Ratio of expenses to average net assets | 1.67 | % | 1.71 | % | 1.74 | % | 1.74 | % | 1.73 | % | 0.67 | % | 0.72 | % | 0.74 | % | 0.73 | % | 0.74 | % | ||||||||||||||||||||
__________
(1) Per share amounts have been calculated using the daily average shares method.
(2) Per share amounts have been calculated using the monthly average shares method.
(3) Not reflecting CDSC.
See accompanying notes to financial statements.
30
Analysis of Expenses (unaudited)
As a shareholder of the Fund, you may incur two types of costs: (1) transaction costs, including front-end sales charges with respect to Class A shares or contingent deferred sales charges (“CDSC”) with respect to Class C shares; and (2) ongoing costs, including management fees; distribution and/or service (12b-1) fees; and other Fund expenses. The table below is intended to help you understand your ongoing costs (in dollars) of investing in the Fund and to compare these costs with the ongoing costs of investing in other mutual funds.
The table below is based on an investment of $1,000 invested on July 1, 2010 and held for the six months ended December 31, 2010.
Actual Expenses
This table provides information about actual account values and actual expenses. You may use the information provided in this table, together with the amount you invested, to estimate the expenses that you paid over the period. To estimate the expenses you paid on your account, divide your ending account value by $1,000 (for example, an $8,600 ending account value divided by $1,000 = 8.6), then multiply the result by the number under the heading entitled “Expenses Paid During the Period”.
| Six months ended December 31, 2010 | ||||
| Actual | ||||
| Total Return | Beginning | Ending | Expenses | |
| Without | Account | Account | Paid During | |
Sales Charges(1) | Value | Value | the Period(2) | |
| Class A | (1.10)% | $1,000.00 | $989.00 | $3.61 |
| Class C | (1.58)% | $1,000.00 | $984.20 | $8.30 |
| Class Y | (1.17)% | $1,000.00 | $988.30 | $3.36 |
| (1) | Assumes reinvestment of all dividends and capital gain distributions, if any, at net asset value and does not reflect the deduction of the applicable sales charges with respect to Class A shares or the applicable contingent deferred sales charges (“CDSC”) with respect to Class C shares. Total return is not annualized, as it may not be representative of the total return for the year. |
| (2) | Expenses are equal to the annualized expense ratio of 0.72%, 1.66% and 0.67% for the Fund’s Class A, C and Y shares, respectively, multiplied by the average account value over the period, multiplied by 184/365 (to reflect the one-half year period). |
31
Analysis of Expenses (unaudited) (continued)
Hypothetical Example for Comparison Purposes
The table below provides information about hypothetical account values and hypothetical expenses based on the actual expense ratio and an assumed rate of return of 5.00% per year before expenses, which is not the Fund’s actual return. The hypothetical account values and expenses may not be used to estimate the actual ending account balance or expenses you paid for the period. You may use the information provided in this table to compare the ongoing costs of investing in the Fund and other mutual funds. To do so, compare this 5.00% hypothetical example relating to the Fund with the 5.00% hypothetical examples that appear in the shareholder reports of other mutual funds.
Please note that the expenses shown in the table below are meant to highlight your ongoing costs only and do not reflect any transactional costs with respect to Class A shares. The example does not reflect the deduction of contingent deferred sales charges (“CDSC”) with respect to Class C shares. Therefore, the table is useful in comparing ongoing costs only, and will not help you determine the relative total costs of owning different mutual funds. In addition, if these transaction costs were included, your costs would have been higher.
| Six months ended December 31, 2010 | ||||
| Hypothetical | ||||
| Annualized | Beginning | Ending | Expenses | |
| Total | Account | Account | Paid During | |
| Return | Value | Value | the Period(1) | |
| Class A | 5.00% | $1,000.00 | $1,021.68 | $3.67 |
| Class C | 5.00% | $1,000.00 | $1,016.84 | $8.44 |
| Class Y | 5.00% | $1,000.00 | $1,021.83 | $3.41 |
| (1) | Expenses are equal to the annualized expense ratio of 0.72%, 1.66% and 0.67% for the Fund’s Class A, C and Y shares, respectively, multiplied by the average account value over the period, multiplied by 184/365 (to reflect the one-half year period). |
32
Information Available (unaudited)
Much of the information that the funds in the Aquila Group of Funds produce is automatically sent to you and all other shareholders. Specifically, you are routinely sent your Fund’s entire list of portfolio securities twice a year in the semi-annual and annual reports you receive. Additionally, under Fund policies, the Manager publicly discloses the complete schedule of the Fund’s portfolio holdings, as of each calendar quarter, generally by the 15th day after the end of each calendar quarter. Such information remains accessible until the next schedule is made publicly available. You may obtain a copy of the Fund’s portfolio holdings schedule for the most recently completed period by visiting the Fund’s website at www.aquilafunds.com. The Fund may also disclose other portfolio holdings as of a specified date (currently the Fund discloses its five largest holdings by value as of the close of the last business day of each calendar month in a posting to its website on approximately the 5th business day following the month end). This information remains on the website until the next such posting. Whenever you wish to see a listing of your Fund’s portfolio other than in your shareholder reports, please check our website at www.aquilafunds.com or call us at 1-800-437-1020.
The Fund additionally files a complete list of its portfolio holdings with the SEC for the first and third quarter of each fiscal year on Form N-Q. Forms N-Q are available free of charge on the SEC website at www.sec.gov. You may also review or, for a fee, copy the forms at the SEC’s Public Reference Room in Washington, D.C. or by calling 1-800-SEC-0330.
Proxy Voting Record (unaudited)
The Fund does not invest in equity securities. Accordingly, there were no matters relating to a portfolio security considered at any shareholder meeting held during the 12 months ended June 30, 2010 with respect to which the Fund was entitled to vote. Applicable regulations require us to inform you that the foregoing proxy voting information is available on the SEC website at www.sec.gov.
Federal Tax Status of Distributions (unaudited)
This information is presented in order to comply with a requirement of the Internal Revenue Code and no action on the part of shareholders is required.
For the calendar year ended December 31, 2010, $10,520,475 of dividends paid by Tax-Free Fund of Colorado, constituting 100% of total dividends paid during calendar year 2010, were exempt-interest dividends.
Prior to February 15, 2011, shareholders were mailed the approriate tax form(s) which contained information on the status of distributions paid for the 2010 calendar year.
33
| Additional Information (unaudited) | ||||||||
Trustees(1) | ||||||||
| and Officers | ||||||||
| Number of | ||||||||
| Positions | Portfolios | Other Directorships | ||||||
| Held with | in Fund | Held by Trustee | ||||||
| Name, | Fund and | Principal | Complex | (The position held is | ||||
Address(2) | Length of | Occupation(s) | Overseen | a directorship unless | ||||
| and Date of Birth | Service(3) | During Past 5 Years | by Trustee | indicated otherwise.) | ||||
Interested Trustee(4) | ||||||||
Diana P. Herrmann New York, NY (02/25/58) | Trustee since 2000 and President since 1999 | Vice Chair and Chief Executive Officer of Aquila Management Corporation, Founder of the Aquila Group of Funds(5) and parent of Aquila Investment Management LLC, Manager since 2004, President since 1997, Chief Operating Officer, 1997-2008, a Director since 1984, Secretary since 1986 and previously its Executive Vice President, Senior Vice President or Vice President, 1986-1997; Chief Executive Officer and Vice Chair since 2004, President and Manager since 2003, and Chief Operating Officer (2003-2008), of the Manager; Chair, Vice Chair, President, Executive Vice President and/or Senior Vice President of funds in the Aquila Group of Funds since 1986; Director of the Distributor since 1997; Governor, Investment Company Institute (the trade organization for the U.S. mutual fund industry dedicated to protecting shareholder interests and educating the public about investing) for various periods since 2004, and head of its Small Funds Committee, 2004-2009; active in charitable and volunteer organizations. | 12 | ICI Mutual Insurance Company, a Risk Retention Group (2006-2009 and since 2010) | ||||
Non-interested Trustees | ||||||||
Anne J. Mills Castle Rock, CO (12/23/38) | Chair of the Board of Trustees since 2005 and Trustee since 1987 | President, Loring Consulting Company since 2001; Vice President for Business Management and CFO, Ottawa University, 1992-2001, 2006-2008; IBM Corporation, 1965-1991; currently active with various charitable, educational and religious organizations. | 5 | None | ||||
34
| Number of | ||||||||
| Positions | Portfolios | Other Directorships | ||||||
| Held with | in Fund | Held by Trustee | ||||||
| Name, | Fund and | Principal | Complex | (The position held is | ||||
Address(2) | Length of | Occupation(s) | Overseen | a directorship unless | ||||
| and Date of Birth | Service(3) | During Past 5 Years | by Trustee | indicated otherwise.) | ||||
Tucker Hart Adams Colorado Springs, CO (01/11/38) | Trustee since 1989 | Senior Partner, Summit Economics, since 2010; President, The Adams Group, an economic consulting firm, 1989-2010; formerly Chief Economist, United Banks of Colorado; currently or formerly active with numerous professional and community organizations. | 4 | Trustee, Colorado Health Facilities Authority; advisory board, Griffis/Blessings, Inc. (commercial property development and management); advisory board, Kachi Partners (middle market buyouts); formerly Director, Touch America and Mortgage Analysis Computer Corp. | ||||
Ernest Calderón Phoenix, AZ (10/24/57) | Trustee since 2009 | Founder, Calderón Law Offices, since 2004; Equity Partner, Jennings, Strouss & Salmon, PLC, 1992-2004; member, Arizona Board of Regents since 2003 and member of Governor Janice Brewer’s Transition Team since 2009; Past President, Grand Canyon Council of Boy Scouts of America; Past President, State Bar of Arizona, 2003-2004; member, American Law Institute. | 3 | None | ||||
Thomas A. Christopher Danville, KY (12/19/47) | Trustee since 2004 | Vice President of Robinson, Hughes & Christopher, C.P.A.s, P.S.C., since 1977; President, A Good Place for Fun, Inc., a sports facility, since 1987; Director, Sunrise Children’s Services Inc. (2010); currently or formerly active with various professional and community organizations. | 5 | None | ||||
Gary C. Cornia Orem, UT (06/24/48) | Trustee since 2000 | Dean, Marriott School of Management, Brigham Young University, since 2008; Director, Romney Institute of Public Management, Marriott School of Management, 2004-2008; Professor, Marriott School of Management, 1980-present; Past President, National Tax Association; Fellow, Lincoln Institute of Land Policy, 2002-present; Associate Dean, Marriott School of Management, Brigham Young University, 1991-2000; member, Utah Governor's Tax Review Committee, 1993-2009. | 5 | Lincoln Institute of Land Policy, Cambridge, MA |
35
| Number of | ||||||||
| Positions | Portfolios | Other Directorships | ||||||
| Held with | in Fund | Held by Trustee | ||||||
| Name, | Fund and | Principal | Complex | (The position held is | ||||
Address(2) | Length of | Occupation(s) | Overseen | a directorship unless | ||||
| and Date of Birth | Service(3) | During Past 5 Years | by Trustee | indicated otherwise.) | ||||
Grady Gammage, Jr. Phoenix, AZ (10/01/51) | Trustee since 2009 | Founding partner, Gammage & Burnham, PLC, a law firm, Phoenix, Arizona, since 1983; director, Central Arizona Water Conservation District, 1992-2004; director, Arizona State University Foundation since 1998; Senior Fellow, Morrison Institute for Public Policy; active with Urban Land Institute. | 4 | None | ||||
Lyle W. Hillyard Logan, UT (09/25/40) | Trustee since 2006 | President of the law firm of Hillyard, Anderson & Olsen, Logan, Utah, since 1967; member of Utah Senate, 1985 to present, in the following positions: President, 2000, Senate Majority Leader, 1999-2000, Assistant Majority Whip, 1995-1998; served as Chairman of the following Utah Senate Committees: Tax and Revenue, Senate Judiciary Standing, Joint Executive Appropriations, and Senate Rules; currently serves as Co-Chair, Joint Executive Appropriations. | 3 | None | ||||
John C. Lucking Phoenix, AZ (05/20/43) | Trustee since 2000 | President, Econ-Linc, an economic consulting firm, since 1995; formerly Consulting Economist, Bank One Arizona and Chief Economist, Valley National Bank; member, Arizona’s Joint Legislative Budget Committee Economic Advisory Panel and the Western Blue Chip Economic Forecast Panel; Board member, Northern Arizona University Foundation since 1997; member, various historical, civic and economic associations. | 3 | Formerly Director, Sanu Resources |
36
| Number of | ||||||||
| Positions | Portfolios | Other Directorships | ||||||
| Held with | in Fund | Held by Trustee | ||||||
| Name, | Fund and | Principal | Complex | (The position held is | ||||
Address(2) | Length of | Occupation(s) | Overseen | a directorship unless | ||||
| and Date of Birth | Service(3) | During Past 5 Years | by Trustee | indicated otherwise.) | ||||
| Other Individuals | ||||||||
Trustees Emeritus(6) | ||||||||
Lacy B. Herrmann New York, NY (05/12/29) | Founder and Chairman Emeritus since 2005; Chairman of the Board of Trustees, 1987-2004 | Founder and Chairman of the Board, Aquila Management Corporation, the sponsoring organization and parent of the Manager or Administrator and/or Adviser to each fund of the Aquila Group of Funds; Chairman of the Manager or Administrator and/or Adviser to each since 2004; Founder and Chairman Emeritus of each fund in the Aquila Group of Funds; previously Chairman and a Trustee of each fund in the Aquila Group of Funds since its establishment until 2004 or 2005; Director of the Distributor since 1981 and formerly Vice President or Secretary, 1981-1998; Director or trustee, Premier VIT, 1994-2009; Oppenheimer Quest Value Funds Group, Oppenheimer Small Cap Value Fund, Oppenheimer Midcap Fund, 1987-2009, and Oppenheimer Rochester Group of Funds, 1995-2009; Trustee Emeritus, Brown University and the Hopkins School; active in university, school and charitable organizations. | N/A | N/A | ||||
J. William Weeks Palm Beach, FL (06/22/27) | Trustee Emeritus since 2006 | Retired; limited partner in real estate partnerships Alex, Brown & Sons No. 1 and 2; formerly Senior Vice President or Vice President of the Aquila Municipal Bond Funds; and Vice President of the Distributor. | N/A | N/A | ||||
37
| Number of | ||||||||
| Positions | Portfolios | Other Directorships | ||||||
| Held with | in Fund | Held by Trustee | ||||||
| Name, | Fund and | Principal | Complex | (The position held is | ||||
Address(2) | Length of | Occupation(s) | Overseen | a directorship unless | ||||
| and Date of Birth | Service(3) | During Past 5 Years | by Trustee | indicated otherwise.) | ||||
| Officers | ||||||||
Charles E. Childs, III New York, NY (04/01/57) | Executive Vice President since 2003 | Executive Vice President of all funds in the Aquila Group of Funds and the Manager and the Manager’s parent since 2003; Chief Operating Officer of the Manager and the Manager’s parent since 2008; formerly Senior Vice President, corporate development, Vice President, Assistant Vice President and Associate of the Manager’s parent since 1987; Senior Vice President, Vice President or Assistant Vice President of the Aquila Money-Market Funds, 1988-2003. | N/A | N/A | ||||
Marie E. Aro Denver, CO (02/10/55) | Senior Vice President since 2010 | Co-President of the Distributor since 2010, Vice President, 1993-1997; Senior Vice President, Aquila Three Peaks Opportunity Growth Fund since 2004; Senior Vice President, Tax-Free Trust of Arizona since 2010 and Vice President, 2004-2010; Senior Vice President, Aquila Three Peaks High Income Fund since 2006; Senior Vice President, Tax-Free Fund For Utah, Tax-Free Fund of Colorado, Tax-Free Trust of Oregon, Churchill Tax-Free Fund of Kentucky and Narragansett Insured Tax-Free Income Fund since 2010; Vice President, INVESCO Funds Group, 1998-2003. | N/A | N/A | ||||
Paul G. O’Brien Charlotte, NC (11/28/59) | Senior Vice President since 2010 | Co-President, Aquila Distributors, Inc. since 2010, Managing Director, 2009-2010; Senior Vice President of Aquila Three Peaks Opportunity Growth Fund, Aquila Three Peaks High Income Fund, and each of the Aquila Municipal Bond Funds since 2010; held various positions to Senior Vice President and Chief Administrative Officer of Evergreen Investments Services, Inc., 1997 - 2008; Mergers and Acquisitions Coordinator for Wachovia Corporation, 1994 - 1997. | N/A | N/A |
38
| Number of | ||||||||
| Positions | Portfolios | Other Directorships | ||||||
| Held with | in Fund | Held by Trustee | ||||||
| Name, | Fund and | Principal | Complex | (The position held is | ||||
Address(2) | Length of | Occupation(s) | Overseen | a directorship unless | ||||
| and Date of Birth | Service(3) | During Past 5 Years | by Trustee | indicated otherwise.) | ||||
Alan R. Stockman Glendale, AZ (07/31/54) | Senior Vice President since 2009 | Senior Vice President, Tax-Free Fund of Colorado, since 2009; Senior Vice President, Tax-Free Trust of Arizona since 2001, Vice President, 1999-2001; Vice President, Aquila Three Peaks Opportunity Growth Fund since 1999; Bank One, Commercial Client Services representative, 1997-1999; Trader and Financial Consultant, National Bank of Arizona (Zions Investment Securities Inc.), Phoenix, Arizona 1996-1997. | N/A | N/A | ||||
Robert S. Driessen New York, NY (10/12/47) | Chief Compliance Officer since 2009 | Chief Compliance Officer of each fund in the Aquila Group of Funds, the Manager and the Distributor since December 2009; Vice President, Chief Compliance Officer, Curian Capital, LLC, 2004-2008; Vice President, Chief Compliance Officer, Phoenix Investment Partners, Ltd., 1999-2004; Vice President, Risk Liaison, Corporate Compliance, Bank of America, 1996-1999; Vice President, Securities Compliance, Prudential Insurance Company of America, 1993-1996; various positions to Branch Chief, U.S. Securities and Exchange Commission, 1972-1993. | N/A | N/A | ||||
Joseph P. DiMaggio New York, NY (11/06/56) | Chief Financial Officer since 2003 and Treasurer since 2000 | Chief Financial Officer of each fund in the Aquila Group of Funds since 2003 and Treasurer since 2000. | N/A | N/A |
39
| Number of | ||||||||
| Positions | Portfolios | Other Directorships | ||||||
| Held with | in Fund | Held by Trustee | ||||||
| Name, | Fund and | Principal | Complex | (The position held is | ||||
Address(2) | Length of | Occupation(s) | Overseen | a directorship unless | ||||
| and Date of Birth | Service(3) | During Past 5 Years | by Trustee | indicated otherwise.) | ||||
Edward M. W. Hines New York, NY (12/16/39) | Secretary since 1987 | Of Counsel to Butzel Long, a professional corporation, counsel to the Trust/Fund, since 2010 and previously Shareholder since 2007; Partner of Hollyer Brady Barrett & Hines LLP, its predecessor as counsel, 1989-2007; Secretary of each fund in the Aquila Group of Funds. | N/A | N/A | ||||
John M. Herndon New York, NY (12/17/39) | Assistant Secretary since 1995 | Assistant Secretary of each fund in the Aquila Group of Funds since 1995 and Vice President of the three Aquila Money-Market Funds since 1990; Vice President of the Manager or its predecessor and current parent since 1990. | N/A | N/A | ||||
Yolonda S. Reynolds New York, NY (04/23/60) | Assistant Treasurer since 2010 | Director of Fund Accounting for the Aquila Group of Funds since 2007; Investment Accountant, TIIA-CREF, 2007; Sr. Fund Accountant, JP Morgan Chase, 2003-2006. | N/A | N/A | ||||
Lori A. Vindigni New York, NY (11/02/66) | Assistant Treasurer since 2000 | Assistant Treasurer of each fund in the Aquila Group of Funds since 2000; Assistant Vice President of the Manager or its predecessor and current parent since 1998; Fund Accountant for the Aquila Group of Funds, 1995-1998. | N/A | N/A |
____________________
(1) The Fund’s Statement of Additional Information includes additional information about the Trustees and is available, without charge, upon request by calling 800-437-1020 (toll-free) or by visiting www.aquilafunds.com or the EDGAR Database at the SEC’s internet site at www.sec.gov.
(2) The mailing address of each Trustee and officer is c/o Tax-Free Fund of Colorado, 380 Madison Avenue, Suite 2300, New York, NY 10017.
(3) Each Trustee holds office until the next annual meeting of shareholders or until his or her successor is elected and qualifies. The term of office of each officer is one year.
(4) Ms. Herrmann is an interested person of the Fund as an officer of the Fund, as a director, officer and shareholder of the Manager’s corporate parent, as an officer and Manager of the Manager, and as a shareholder and director of the Distributor. Ms. Herrmann is the daughter of Lacy B. Herrmann, the Founder and Chairman Emeritus of the Fund.
(5) In this material Pacific Capital Cash Assets Trust, Pacific Capital U.S. Government Securities Cash Assets Trust and Pacific Capital Tax-Free Cash Assets Trust, each of which is a money-market fund, are called the “Aquila Money-Market Funds”; Tax-Free Trust of Arizona, Tax-Free Fund of Colorado, Hawaiian Tax-Free Trust, Churchill Tax-Free Fund of Kentucky, Tax-Free Trust of Oregon, Narragansett Insured Tax-Free Income Fund and Tax-Free Fund For Utah, each of which is a tax-free municipal bond fund, are called the “Aquila Municipal Bond Funds”; Aquila Three Peaks Opportunity Growth Fund (formerly known as Aquila Rocky Mountain Equity Fund) is an equity fund; and Aquila Three Peaks High Income Fund is a high income corporate bond fund; considered together, these 12 funds are called the “Aquila Group of Funds.”
(6) A Trustee Emeritus may attend Board meetings but has no voting power.
40
PRIVACY NOTICE (unaudited)
Tax-Free Fund of Colorado
Our Privacy Policy. In providing services to you as an individual who owns or is considering investing in shares of the Fund, we collect certain non-public personal information about you. Our policy is to keep this information strictly safeguarded and confidential, and to use or disclose it only as necessary to provide services to you or as otherwise permitted by law. Our privacy policy applies equally to former shareholders and persons who inquire about the Fund.
Information We Collect. ”Non-public personal information” is personally identifiable financial information about you as an individual or your family. The kinds of non-public personal information we have about you may include the information you provide us on your share purchase application or in telephone calls or correspondence with us, and information about your fund transactions and holdings, how you voted your shares and the account where your shares are held.
Information We Disclose. We disclose non-public personal information about you to companies that provide necessary services to us, such as the Fund’s transfer agent, distributor, investment adviser or sub-adviser, if any, as permitted or required by law, or as authorized by you. Any other use is strictly prohibited. We do not sell information about you or any of our fund shareholders to anyone.
Non-California Residents: We also may disclose some of this information to another fund in the Aquila Group of Funds (or its service providers) under joint marketing agreements that permit the funds to use the information only to provide you with information about other funds in the Aquila Group of Funds or new services we are offering that may be of interest to you.
California Residents Only: In addition, unless you “opt-out” of the following disclosures using the form that was mailed to you under separate cover, we may disclose some of this information to another fund in the Aquila Group of Funds (or its sevice providers) under joint marketing agreements that permit the funds to use the information only to provide you with information about other funds in the Aquila Group of Funds or new services we are offering that may be of interest to you.
How We Safeguard Your Information. We restrict access to non-public personal information about you to only those persons who need it to provide services to you or who are permitted by law to receive it. We maintain physical, electronic and procedural safeguards to protect the confidentiality of all non-public personal information we have about you.
If you have any questions regarding our Privacy Policy, please contact us at 1-800-437-1020.
Aquila Distributors, Inc.
Aquila Investment Management LLC
This Privacy Policy also has been adopted by Aquila Distributors, Inc. and Aquila Investment Management LLC and applies to all non-public information about you that each of these companies may obtain in connection with services provided to the Fund or to you as a shareholder of the Fund.
41
| Founders |
| Lacy B. Herrmann, Chairman Emeritus |
| Aquila Management Corporation |
| Manager |
| AQUILA INVESTMENT MANAGEMENT LLC |
| 380 Madison Avenue, Suite 2300 |
| New York, New York 10017 |
| Investment Sub-Adviser |
| KIRKPATRICK PETTIS CAPITAL |
| MANAGEMENT |
| 1600 Broadway, Suite 1100 |
| Denver, Colorado 80202 |
| Board of Trustees |
| Anne J. Mills, Chair |
| Tucker Hart Adams |
| Ernest Calderón |
| Thomas A. Christopher |
| Gary C. Cornia |
| Grady Gammage, Jr. |
| Diana P. Herrmann |
| Lyle W. Hillyard |
| John C. Lucking |
| Trustee Emeritus |
| J. William Weeks |
| Officers |
| Diana P. Herrmann, President |
| Marie E. Aro, Senior Vice President |
| Paul G. O’Brien, Senior Vice President |
| Alan R. Stockman, Senior Vice President |
| Robert S. Driessen, Chief Compliance Officer |
| Joseph P. DiMaggio, Chief Financial Officer |
| and Treasurer |
| Edward M.W. Hines, Secretary |
| Distributor |
| AQUILA DISTRIBUTORS, INC. |
| 380 Madison Avenue, Suite 2300 |
| New York, New York 10017 |
| Transfer and Shareholder Servicing Agent |
| BNY MELLON INVESTMENT SERVICING (US) INC. |
| 101 Sabin Street |
| Pawtucket, Rhode Island 02860 |
| Custodian |
| JPMORGAN CHASE BANK, N.A. |
| 1111 Polaris Parkway |
| Columbus, Ohio 43240 |
| Independent Registered Public Accounting Firm |
| TAIT, WELLER & BAKER LLP |
| 1818 Market Street, Suite 2400 |
| Philadelphia, Pennsylvania 19103 |
| Further information is contained in the Prospectus, |
| which must precede or accompany this report. |
| ITEM 2. | CODE OF ETHICS. |
(a) As of December 31, 2010 (the end of the reporting period) the Fund has adopted a code of ethics that applies to the Fund's principal executive officer(s)and principal financial officer(s) and persons performing similar functions ("Covered Officers") as defined in the Aquila Group of Funds Code of Ethics for Principal Executive and Senior Financial Officers under Section 406 of the Sarbanes-Oxley Act of 2002;
(f)(1) Pursuant to Item 10(a)(1), a copy of the Fund’s Code of Ethics that applies to the Fund’s principal executive officer(s) and principal financial officer(s) and persons performing similar functions is included as an exhibit to its annual report on this Form N-CSR;
(f)(2) The text of the Fund’s Code of Ethics that applies to the Fund’s principal executive officer(s) and principal financial officer(s) and persons performing similar functions has been posted on its Internet website which can be found at the Fund’s Internet address at aquilafunds.com.
| ITEM 3. | AUDIT COMMITTEE FINANCIAL EXPERT. |
(a)(1)(ii) The Board of Trustees of the Fund has determined that it does not have at least one audit committee financial expert serving on its audit committee. The Fund does not have such a person serving on the audit committee because none of the persons currently serving as Trustees happens to have the technical accounting and auditing expertise included in the definition of "audit committee financial expert" recently adopted by the Securities and Exchange Commission in connection with this Form N-CSR, and the Board has not heretofore deemed it necessary to seek such a person for election to the Board.
The primary mission of the Board, which is that of oversight over the operations and affairs of the Fund, confronts the Trustees with a wide and expanding range of issues and responsibilities. The Trustees believe that, accordingly, it is essential that the Board's membership consist of persons with as extensive experience as possible in fulfilling the duties and responsibilities of mutual fund directors and audit committee members and, ideally, with extensive experience and background relating to the economic and financial sectors and securities in which the Fund invests, including exposure to the financial and accounting matters commonly encountered with respect to those sectors and securities. The Board believes that its current membership satisfies those criteria. It recognizes that it would also be helpful to have a member with the relatively focused accounting and auditing expertise reflected in the applicable definition of "audit committee financial expert," just as additional members with similarly focused technical expertise in other areas relevant to the Fund's operations and affairs would also contribute added value. However, the Board believes that the Fund is better served, and its assets better employed, by a policy of hiring experts in various the specialized area of technical accounting and auditing matters, if and as the Board identifies the need, rather than by seeking to expand its numbers by adding technical experts in the areas constituting its domain of responsibility. The Fund's Audit Committee Charter explicitly authorizes the Committee to retain such experts as it deems necessary in fulfilling its duties.
| ITEM 4. | PRINCIPAL ACCOUNTANT FEES AND SERVICES. |
a) Audit Fees - The aggregate fees billed for professional services rendered by the principal accountant for the audit of the Registrant's annual financial statements were $17,600 in 2009 and $18,500 in 2010.
b) Audit Related Fees - There were no amounts billed for audit-related fees over the past two years.
c) Tax Fees - The Registrant was billed by the principal accountant $3,200 and $3,300 in 2009 and 2010, respectively, for return preparation
and tax compliance.
d) All Other Fees - There were no additional fees paid for audit and non-audit services other than those disclosed in a) through c) above.
e)(1) Currently, the audit committee of the Registrant pre-approves audit services and fees on an engagement-by-engagement basis
e)(2) None of the services described in b) through d) above were approved by the audit committee pursuant to paragraph (c)(7)(i)(C) of Rule 2-01 of Regulation S-X, all were pre-approved on an engagement-by-engagement basis.
f) No applicable.
g) There were no non-audit services fees billed by the Registrant's accountant to the Registrant's investment adviser or distributor over the past two years
h) Not applicable.
| ITEM 5. | AUDIT COMMITTEE OF LISTED REGISTRANTS. |
Not applicable.
| ITEM 6. | SCHEDULE OF INVESTMENTS. |
Included in Item 1 above
| ITEM 7. | DISCLOSURE OF PROXY VOTING POLICIES AND PROCEDURES FOR CLOSED-END MANAGEMENT INVESTMENT COMPANIES. |
Not applicable.
| ITEM 8. | PORTFOLIO MANAGERS OF CLOSED-END MANAGEMENT INVESTMENT COMPANIES. |
Not applicable.
| ITEM 9. | PURCHASES OF EQUITY SECURITIES BY CLOSED-END MANAGEMENT INVESTMENT COMPANY AND AFFILIATED PURCHASERS. |
Not applicable.
| ITEM 10. | SUBMISSION OF MATTERS TO A VOTE OF SECURITY HOLDERS. |
The Board of Directors of the Registrant has adopted a Nominating Committee Charter which provides that the Nominating Committee (the 'Committee') may consider and evaluate nominee candidates properly submitted by shareholders if a vacancy among the Independent Trustees of the Registrant occurs and if, based on the Board's then current size, composition and structure, the Committee determines that the vacancy should be filled. The Committee will consider candidates submitted by shareholders on the same basis as it considers and evaluates candidates recommended by other sources. A copy of the qualifications and procedures that must be met or followed by shareholders to properly submit a nominee candidate to the Committee may be obtained by submitting a request in writing to the Secretary of the Registrant.
ITEM 11. | CONTROLS AND PROCEDURES. |
(a) Based on their evaluation of the registrant's disclosure controls and procedures (as defined in Rule 30a-2(c) under the Investment Company Act of 1940) as of a date within 90 days of the filing of this report, the registrant's chief financial and executive officers have concluded that the disclosure controls and procedures of the registrant are appropriately designed to ensure that information required to be disclosed in the registrant's reports that are filed under the Securities Exchange Act of 1934 are accumulated and communicated to registrant's management, including its principal executive officer(s) and principal financial officer(s), to allow timely decisions regarding required disclosure and is recorded, processed, summarized and reported, within the time periods specified in the rules and forms adopted by the Securities and Exchange Commission.
(b) There have been no significant changes in registrant's internal controls or in other factors that could significantly affect registrant's internal controls subsequent to the date of the most recent evaluation, including no significant deficiencies or material weaknesses that required corrective action.
| ITEM 12. | EXHIBITS. |
(a)(1) Aquila Group of Funds Code of Ethics for Principal Executive and Senior Financial Officers under Section 406 of the Sarbanes-Oxley Act of 2002, as amended.
(b) Certifications of principal executive officer and principal financial officer as required by Rule 30a-2(b) under the Investment Company Act of 1940.
SIGNATURES
Pursuant to the requirements of the Securities Exchange Act of 1934 and the Investment Company Act of 1940, the registrant has duly caused this report to be signed on its behalf by the undersigned thereunto duly authorized.
TAX-FREE FUND OF COLORADO
| By: | /s/ Diana P. Herrmann | |
President and Trustee March 7, 2011 | ||
| By: | /s/ Joseph P. DiMaggio | |
Chief Financial Officer and Treasurer March 7, 2011 |
Pursuant to the requirements of the Securities Exchange Act of 1934 and the Investment Company Act of 1940, this report has been signed below by the following persons on behalf of the registrant and in the capacities and on the dates indicated.
| By: | /s/ Diana P. Herrmann | |
Diana P. Herrmann President and Trustee March 7, 2011 | ||
| By: | /s/ Joseph P. DiMaggio | |
Joseph P. DiMaggio Chief Financial Officer and Treasurer March 7, 2011 |
TAX-FREE FUND OF COLORADO
EXHIBIT INDEX
(a)(1) Aquila Group of Funds Code of Ethics for Principal Executive and Senior Financial Officers under Section 406 of the Sarbanes-Oxley Act of 2002, as amended.
(b) Certification of chief executive officer and chief financial officer as required by Rule 30a-2(b) of the Investment Company Act of 1940.