UNITED STATES
SECURITIES AND EXCHANGE COMMISSION
WASHINGTON, D.C. 20549
FORM 10-Q
(Mark one)
| x | QUARTERLY REPORT PURSUANT TO SECTION 13 OR 15(d) OF THE SECURITIES EXCHANGE ACT OF 1934 |
| | For the Quarter Ended September 30, 2011 |
| o | TRANSITION REPORT PURSUANT TO SECTION 13 OR 15(d) OF THE SECURITIES EXCHANGE ACT OF 1934 |
| | Commission File No. 0-15474 |
NATURAL RESOURCES USA CORPORATION
(Exact name of Company as specified in its charter)
| Utah | | 87-0403973 |
(State or other jurisdiction of Incorporation or organization) | | (I.R.S. Employer Identification No.) |
3200 County Road 31, Rifle, CO 81650
(Address of Principal Executive Offices)
| Company's telephone number, including area code: | (214) 253-2556 |
| Company’s Web Page: | www.naturalresourcesusacorp.com |
Check whether issuer (1) has filed all reports required to be filed by Section 13 or 15(d) of the Securities Exchange Act of 1934 during the preceding 12 months (or for such shorter period that the registrant was required to file such reports), and (2) has been subject to such filing requirements for the past 90 days. Yes x No o
Indicate by check mark whether the registrant is a large accelerated filer, an accelerated filer, a non-accelerated filer, or a smaller reporting company. See the definitions of “large accelerated filer”, “accelerated filer” and “smaller reporting company’ in Rule 12b-2 of the Exchange Act.
| Large accelerated filer o | | Accelerated filer o |
| Non-accelerated filer o | | Smaller reporting company x |
Indicate by a check mark whether the Registrant is a shell company (as defined in Rule 12b-2 of the Exchange Act). Yes o No x
As of November 4, 2011, the number of shares outstanding of the Company's $.01 par value common stock was 352,488,582.
NATURAL RESOURCES USA CORPORATION
| | | Page |
| PART I: | FINANCIAL INFORMATION | |
| | | |
| Item 1: | Financial Statements (unaudited) | |
| | | 3 |
| | | 4 |
| | | 5 |
| | | 6 |
| | | 7 |
| Item 2: | | 10 |
| | | |
| Item 4: | | 14 |
| | | |
| PART II: | OTHER INFORMATION | |
| | | |
| Item 1: | | 16 |
| Item 2: | | 17 |
| Item 6: | | 17 |
| | | |
| | | 17 |
NATURAL RESOURCES USA CORPORATION
Consolidated Balance Sheets
| | | September 30, | | | December 31, | |
| | | 2011 | | | 2010 | |
| | | (Unaudited) | | | | |
| ASSETS | | | | | | |
| | | | | | | |
| CURRENT ASSETS | | | | | | |
| Cash | | $ | 2,076,073 | | | $ | 4,165,028 | |
| Accounts receivable, net | | | 3,815,629 | | | | 3,890,699 | |
| Inventories | | | 757,631 | | | | 852,203 | |
| Prepaid expenses | | | 266,409 | | | | 124,034 | |
| Related party receivables | | | 139,887 | | | | 104,941 | |
| Deferred tax asset | | | 76,000 | | | | 76,400 | |
| Total Current Assets | | | 7,131,629 | | | | 9,213,305 | |
| | | | | | | | | |
| FIXED ASSETS | | | | | | | | |
| Property, plant and equipment, net | | | 18,477,938 | | | | 13,217,274 | |
| Cavities and well development, net | | | 9,384,159 | | | | 10,062,553 | |
| Mineral leases | | | 4,167,471 | | | | 4,167,471 | |
| Total Fixed Assets | | | 32,029,568 | | | | 27,447,298 | |
| | | | | | | | | |
| OTHER ASSETS | | | | | | | | |
| Water rights | | | 3,150,582 | | | | 3,150,582 | |
| Patents, net | | | 15,345 | | | | 17,859 | |
| Well and well development RSL | | | 595,000 | | | | 595,000 | |
| Equipment held and not yet in service | | | 2,498,611 | | | | 2,498,611 | |
| Deferred financing and acquisition costs, net | | | 644,139 | | | | 673,372 | |
| Rock School lease and reserves | | | 3,300,000 | | | | 3,300,000 | |
| Deposits and bonds | | | - | | | | 2,000 | |
| Restricted cash | | | 1,388,758 | | | | 1,371,390 | |
| Deferred tax asset, net | | | - | | | | 282,100 | |
| Total Other Assets | | | 11,592,435 | | | | 11,890,914 | |
| | | | | | | | | |
| TOTAL ASSETS | | $ | 50,753,632 | | | $ | 48,551,517 | |
| | | | | | | | | |
| LIABILITIES AND STOCKHOLDERS EQUITY | | | | | | | | |
| | | | | | | | | |
| CURRENT LIABILITIES | | | | | | | | |
| Accounts payable | | $ | 974,186 | | | $ | 1,453,489 | |
| Royalties payable | | | 1,651,499 | | | | 1,170,964 | |
| Accrued expenses | | | 1,266,807 | | | | 681,718 | |
| Accrued expenses due to related parties | | | 96,605 | | | | 337,672 | |
| Income taxes payable | | | 1,222,647 | | | | 173,976 | |
| Current portion of notes payable | | | 10,160 | | | | 9,869 | |
| Current portion of capital lease obligations | | | - | | | | 6,094 | |
| Current portion of asset retirement obligations | | | 207,000 | | | | 207,000 | |
| Total Current Liabilities | | | 5,428,904 | | | | 4,040,782 | |
| | | | | | | | | |
| LONG TERM LIABILITIES | | | | | | | | |
| Notes payable | | | 4,355 | | | | 12,012 | |
| Deferred tax liabilities | | | 93,700 | | | | - | |
| Asset retirement obligations | | | 1,441,268 | | | | 1,554,582 | |
| Total Long Term Liabilities | | | 1,539,323 | | | | 1,566,594 | |
| TOTAL LIABILITIES | | | 6,968,227 | | | | 5,607,376 | |
| | | | | | | | | |
| COMMITMENTS AND CONTINGENCIES | | | | | | | | |
| | | | | | | | | |
| STOCKHOLDERS' EQUITY | | | | | | | | |
| Common stock, $0.01 par value; 700,000,000 shares authorized; 352,488,582 issued and outstanding | | | 3,524,886 | | | | 3,524,136 | |
| Additional paid-in capital | | | 148,523,889 | | | | 147,933,336 | |
| Accumulated deficit | | | (108,263,370 | ) | | | (108,513,331 | ) |
| Total Stockholders' Equity | | | 43,785,405 | | | | 42,944,141 | |
| | | | | | | | | |
| TOTAL LIABILITIES AND STOCKHOLDERS' EQUITY | | $ | 50,753,632 | | | $ | 48,551,517 | |
The accompanying notes are an integral part of these consolidated financial statements
NATURAL RESOURCES USA CORPORATION
(Unaudited)
| | | For the Three Months ended September 30, | | | For the Nine Months ended September 30, | |
| | | 2011 | | | 2010 (1) | | | 2011 | | | 2010 (1) | |
| | | | | | | | | | | | | |
| REVENUES | | $ | 6,540,627 | | | $ | 6,377,273 | | | $ | 19,526,757 | | | $ | 17,929,362 | |
| | | | | | | | | | | | | | | | | |
| COST OF GOODS SOLD, EXCLUDING DEPRECIATION | | | 3,806,535 | | | | 3,606,210 | | | | 11,682,035 | | | | 10,828,471 | |
| | | | | | | | | | | | | | | | | |
| GROSS PROFIT, EXCLUDING DEPRECIATION | | | 2,734,092 | | | | 2,771,063 | | | | 7,844,722 | | | | 7,100,891 | |
| | | | | | | | | | | | | | | | | |
| EXPENSES | | | | | | | | | | | | | | | | |
| General and administrative | | | 1,677,745 | | | | 1,283,603 | | | | 4,296,226 | | | | 3,602,179 | |
| Impairment loss | | | - | | | | - | | | | - | | | | 227,500 | |
| Depreciation and amortization expense | | | 580,020 | | | | 508,530 | | | | 1,745,340 | | | | 1,389,907 | |
| | | | | | | | | | | | | | | | | |
| Total Expenses | | | 2,257,765 | | | | 1,792,133 | | | | 6,041,566 | | | | 5,219,586 | |
| | | | | | | | | | | | | | | | | |
| INCOME FROM OPERATIONS | | | 476,327 | | | | 978,930 | | | | 1,803,156 | | | | 1,881,305 | |
| | | | | | | | | | | | | | | | | |
| OTHER INCOME (EXPENSE) | | | | | | | | | | | | | | | | |
| Interest income | | | 240 | | | | - | | | | 969 | | | | - | |
| Interest expense | | | (1,698 | ) | | | (20,978 | ) | | | (4,292 | ) | | | (95,995 | ) |
| | | | | | | | | | | | | | | | | |
| Total Other Income (Expense) | | | (1,458 | ) | | | (20,978 | ) | | | (3,323 | ) | | | (95,995 | ) |
| | | | | | | | | | | | | | | | | |
| INCOME BEFORE INCOME TAX EXPENSE | | | 474,869 | | | | 957,952 | | | | 1,799,833 | | | | 1,785,310 | |
| | | | | | | | | | | | | | | | | |
| Tax expense | | | 470,000 | | | | - | | | | 1,549,872 | | | | - | |
| | | | | | | | | | | | | | | | | |
| NET INCOME | | $ | 4,869 | | | $ | 957,952 | | | $ | 249,961 | | | $ | 1,785,310 | |
| | | | | | | | | | | | | | | | | |
| INCOME PER SHARE | | | | | | | | | | | | | | | | |
| Basic | | $ | 0.00 | | | $ | 0.00 | | | $ | 0.00 | | | $ | 0.01 | |
| Diluted | | $ | 0.00 | | | $ | 0.00 | | | $ | 0.00 | | | $ | 0.01 | |
| | | | | | | | | | | | | | | | | |
| WEIGHTED AVERAGE NUMBER OF SHARES OUTSTANDING | | | | | | | | | | | | | | | | |
| Basic | | | 352,488,582 | | | | 352,413,582 | | | | 352,454,516 | | | | 163,763,108 | |
| Diluted | | | 352,723,354 | | | | 352,476,874 | | | | 353,360,271 | | | | 163,840,708 | |
The accompanying notes are an integral part of these consolidated financial statements
(1) Retrospectively adjusted for 2010 reorganization
(see Note 1)
NATURAL RESOURCES USA CORPORATION
(Unaudited)
| | | | | | | | | Additional | | | | | | | |
| | | Common Stock | | | Paid-In | | | Accumulated | | | | |
| | | Shares | | | Amount | | | Capital | | | Deficit | | | Total | |
| | | | | | | | | | | | | | | | |
| Balance, December 31, 2010 | | | 352,413,582 | | | $ | 3,524,136 | | | $ | 147,933,336 | | | $ | (108,513,331 | ) | | $ | 42,944,141 | |
| | | | | | | | | | | | | | | | | | | | | |
| Fair value of options granted | | | - | | | | - | | | | 591,303 | | | | - | | | | 591,303 | |
| | | | | | | | | | | | | | | | | | | | | |
| Cashless exercise of options | | | 75,000 | | | | 750 | | | | (750 | ) | | | - | | | | - | |
| | | | | | | | | | | | | | | | | | | | | |
| Net income | | | - | | | | - | | | | - | | | | 249,961 | | | | 249,961 | |
| | | | | | | | | | | | | | | | | | | | | |
| | | | | | | | | | | | | | | | | | | | | |
| Balance, September 30, 2011 | | | 352,488,582 | | | $ | 3,524,886 | | | $ | 148,523,889 | | | $ | (108,263,370 | ) | | $ | 43,785,405 | |
The accompanying notes are an integral part of these consolidated financial statements
NATURAL RESOURCES USA CORPORATION
Consolidated Statements of Cash Flows (Unaudited)
| | | For the Nine Months ended September 30, | |
| | | 2011 | | | 2010 (1) | |
| CASH FLOWS FROM OPERATING ACTIVITIES | | | | | | |
| Net income | | $ | 249,961 | | | $ | 1,785,310 | |
| Adjustments to reconcile net income to net cash from operating activities: | | | | | | | | |
| Fair value of options granted | | | 591,303 | | | | 53,872 | |
| Depreciation and amortization | | | 1,745,340 | | | | 1,389,907 | |
| Loss on impairment | | | - | | | | 227,500 | |
| Deferred taxes | | | 376,200 | | | | - | |
| Change in Operating Assets and Liabilities: | | | | | | | | |
| Accounts receivable | | | 40,124 | | | | (516,952 | ) |
| Inventory | | | 94,572 | | | | 324,083 | |
| Prepaid expenses | | | (142,375 | ) | | | (30,505 | ) |
| Accounts and royalties payable | | | (152,033 | ) | | | (790,880 | ) |
| Accrued expenses due to related parties | | | (241,067 | ) | | | 313,047 | |
| Accrued expenses | | | 585,089 | | | | 221,792 | |
| Income taxes payable | | | 1,048,671 | | | | - | |
| | | | | | | | | |
| Net Cash Provided by Operating Activities | | | 4,195,785 | | | | 2,977,174 | |
| | | | | | | | | |
| CASH FLOWS FROM INVESTING ACTIVITIES | | | | | | | | |
| Change in restricted funds | | | (17,368 | ) | | | (75,770 | ) |
| Cavities and well development | | | (346,926 | ) | | | (988,295 | ) |
| Purchase of property and equipment | | | (5,906,986 | ) | | | (940,565 | ) |
| | | | | | | | | |
| Net Cash Used in Investing Activities | | | (6,271,280 | ) | | | (2,004,630 | ) |
| | | | | | | | | |
| CASH FLOWS FROM FINANCING ACTIVITIES | | | | | | | | |
| Repurchase of preferred shares | | | - | | | | (27,500 | ) |
| Proceeds from the issuance of debt | | | - | | | | (1,647,587 | ) |
| Payments on capital leases | | | (6,094 | ) | | | (6,281 | ) |
| Payments on debt | | | (7,366 | ) | | | - | |
| | | | | | | | | |
| Net Cash Used in Financing Activities | | | (13,460 | ) | | | (1,681,368 | ) |
| | | | | | | | | |
| NET CHANGE IN CASH | | | (2,088,955 | ) | | | (708,824 | ) |
| | | | | | | | | |
| CASH AT BEGINNING OF PERIOD | | | 4,165,028 | | | | 6,100,434 | |
| | | | | | | | | |
| CASH AT END OF PERIOD | | $ | 2,076,073 | | | $ | 5,391,610 | |
| | | | | | | | | |
| SUPPLEMENTAL DISCLOSURE OF CASH FLOW INFORMATION | | | | | | | | |
| Income taxes paid | | $ | 91,798 | | | $ | - | |
| Interest paid | | $ | 3,565 | | | $ | 20,978 | |
The accompanying notes are an integral part of these consolidated financial statements
(1) Retrospectively adjusted for 2010 reorganization (see Note 1)
NATURAL RESOURCES USA CORPORATION
Condensed Notes to the Consolidated Financial Statements (Unaudited)
| NOTE 1 - | BASIS OF CONSOLIDATED FINANCIAL STATEMENT PRESENTATION |
Natural Resources USA Corporation (“Natural Resources” or “the Company”) was formerly known as AmerAlia, Inc. (“AmerAlia”) which was originally incorporated as Computer Learning Software, Inc. under the laws of the State of Utah on June 7, 1983 and renamed AmerAlia, Inc. in January 1984. Until October 31, 2008, AmerAlia owned 100% of Natural Soda Holdings, Inc. (“Natural Soda Holdings”) and Natural Soda Holdings owned 46.5% of Natural Soda, Inc. (“Natural Soda”). On October 31, 2008 AmerAlia completed a restructuring agreement wherein AmerAlia and Natural Soda Holdings issued new equity in exchange for cash and the settlement of various debt obligations, which then enabled Natural Soda Holdings to acquire the 46.5% of Natural Soda previously owned by Sentient USA Resources Fund, LP (“Sentient”). The end result was that as of October 31, 2008, AmerAlia owned 18% of the equity of Natural Soda Holdings which in turn owned 100% of the equity of Natural Soda. On June 30, 2010 AmerAlia completed an exchange reorganization with Sentient whereby AmerAlia acquired 100% ownership of Natural Soda Holdings in exchange for the issuance of 286,119,886 shares of its Common Stock. This last transaction was accounted for as a reorganization of entities under common control and all periods presented in these financial statements were retrospectively adjusted to consolidate Natural Soda Holdings. All material inter-company accounts and transactions have been eliminated in the consolidation accounts.
On March 15, 2011, Sentient exchanged all its 334,074,381 shares of Natural Resources common stock and its limited right to subscribe for 5,500,000 additional shares of Natural Resources common stock for shares of Green SEA Resources Inc. (“GSR”) common stock. GSR, a private corporation majority owned and controlled by Sentient, now owns 94.8% of Natural Resources’ common stock. On August 8, 2011, GSR filed a Schedule 13E-3 with the Securities and Exchange Commission to disclose its intent to take the Company private pursuant to a short form merger (“Merger”) under the Utah Revised Business Corporation Act. The terms of the Merger are described in more detail in the transaction statement filed as Exhibit (a)(1) to the Schedule 13E-3 filed by GSR on August 8, 2011, subsequently amended on October 21, 2011.
The accompanying unaudited consolidated financial statements have been prepared by Natural Resources pursuant to the rules and regulations of the Securities and Exchange Commission. The interim consolidated financial statements include all normal recurring adjustments, which, in the opinion of management, are necessary for a fair presentation of such financial statements. These interim consolidated financial statements should be read in conjunction with Natural Resources’ most recent audited financial statements and notes thereto included in its Transition Report on Form 10-KT/A for the six months ended December 31, 2010. Operating results for the nine months ended September 30, 2011 are not necessarily indicative of the results that may be expected for the fiscal year ending December 31, 2011.
In our report on Form 10-KT/A filed on September 14, 2011 we restated previously issued financial information for the period ended December 31, 2010 as a result of our need (i) to file tax returns individually for Natural Resources, its wholly-owned subsidiary, Natural Soda Holdings, and Natural Soda Holdings’ wholly-owned subsidiary, Natural Soda, as elections to consolidate had not been made as required, rather than on a consolidated basis as was done in the past, and (ii) to record an increase to our asset retirement obligation of $394,000 with a corresponding increase in fixed assets.
During the first quarter of 2011 the Company became aware of an additional $81,000 of legal expenses that had not been accrued in the quarter ended December 31, 2010 as a result of invoices not being submitted timely for work in progress. In addition, the amount of the unbilled work in progress was not advised to the Company until after the filing of the Company’s filing on Form 10-KT for the six months ended December 31, 2010. This amount has been recognized in the quarter ended March 31, 2011.
The Company has evaluated subsequent events and concluded that no significant subsequent events require disclosure
| NOTE 2 - | OUTSTANDING STOCK OPTIONS AND PURCHASE WARRANTS |
On January 18, 2011 options to subscribe for 875,000 shares of common stock at $0.58 per share were granted to each of Bill H. Gunn, Robert van Mourik, Bradley F. Bunnett and Robert Warneke (3,500,000 options in total). One third of the options vest on each of the first, second and third anniversaries of the date of grant and expire on January 18, 2016.
On July 1, 2011 options to subscribe for 112,500 shares at $0.61 per share were granted to three non-executive directors in accordance with the provisions of the 2010 Directors’ Incentive Plan. The options vest on January 2, 2012 and expire on June 30, 2014.
As a result of applying ASC 718 to stock options granted to members of the Board of Directors and certain members of management, the Company recorded expenses of $591,303 and $53,872 for the nine months ended September 30, 2011 and 2010, respectively. These expenses are included in the general and administrative amount in the statement of income. The Company will recognize an additional $20,595 in the quarter ended December 31, 2011 and $1,999,578 of stock-based compensation expense related to the unvested options, evenly over the period ending January 18, 2014.
On August 31, 2011 the Company agreed to accelerate the vesting of all outstanding options immediately prior to the effective date of the Merger. If the Company does accelerate the vesting it will recognize up to $2,020,173 of stock-based compensation expense at the time of acceleration.
Under ASC 718, the Company estimated the fair value of each stock award at the grant date by using the Black-Scholes option pricing model with the following weighted average assumptions used for each of the grants, respectively; dividend yield of zero percent for all years; expected volatility of 200%; risk-free interest rates of 2.5% and expected lives of 5.0 years.
On May 4, 2011, 150,000 options held by two former directors of the Company were exchanged for 75,000 shares of restricted common stock under the cashless exercise provisions of the option agreements. Options held to acquire 187,500 shares at $0.88 per share expired during the period ended June 30, 2011.
A summary of the status of the Company’s stock options as of September 30, 2011 and changes during the nine months ended September 30, 2011 is presented below:
| | | Options, Warrants and SARs | | | Weighted Average Exercise Price | |
| | | | | | | |
| Outstanding December 31, 2010 | | | 675,000 | | | $ | 0.49 | |
| Granted | | | 3,612,500 | | | $ | 0.58 | |
| Expired/Cancelled | | | (187,500 | ) | | $ | 0.88 | |
| Exercised | | | (150,000 | ) | | $ | 0.33 | |
| Outstanding September 30, 2011 | | | 3,950,000 | | | $ | 0.56 | |
| | | | | | | | | |
| Vested, September 30, 2011 | | | 337,500 | | | $ | 0.34 | |
The following summarizes the exercise price per share and expiration date of the Company’s outstanding options and warrants to purchase the Company’s common stock at September 30, 2011:
| Expiration Date | | Price | | | Number | |
| | | | | | | |
| June 30, 2012 | | $ | 0.29 | | | | 112,500 | |
| June 21, 2013 | | $ | 0.37 | | | | 75,000 | |
| June 30, 2013 | | $ | 0.37 | | | | 150,000 | |
| June 30, 2014 | | $ | 0.61 | | | | 112,500 | |
| January 18, 2016 | | $ | 0.58 | | | | 3,500,000 | |
| | | | | | | | 3,950,000 | |
| NOTE 3 - | RELATED PARTY TRANSACTIONS |
We provide our executive officers with company credit cards for the purpose of paying company expenses incurred while travelling. We have also advanced funds to GSR for travel expenses. These charges are recorded as advances until claims for expenses are approved. The balance due from related parties was $139,887 at September 30, 2011 and $104,941 at December 31, 2010.
As disclosed in Note 1, certain elections to file tax returns on a consolidated basis were not made. In accordance with ASC 740 income tax balances have been calculated on an individual company by company basis resulting in a consolidated effective tax rate of 86.1% which is higher than the statutory federal rate for the year of 35%. This difference is due to losses incurred by NRUC and NSHI for which tax benefits were not recognized given the inability to offset those losses against income earned by NSI. The tax expense represents the expense incurred on the discrete individual company operations of NSI. NSI’s individual company effective tax rate on the pre-tax income for the nine-month period ended September 30, 2011 is 36%. The current interim consolidated financial statements indicate a tax liability in the current period. We intend to seek relief with the Internal Revenue Service which, if granted, would allow us to file consolidated tax returns to reduce or eliminate tax provisions and payments required by filing on an individual company basis.
.
ITEM 2: MANAGEMENT’S DISCUSSION AND ANALYSIS OF FINANCIAL CONDITION AND RESULTS OF OPERATIONS
The information in this Quarterly Report on Form 10-Q contains forward-looking statements within the meaning of the Private Securities Litigation Reform Act of 1995. These forward-looking statements involve risks and uncertainties regarding the intent, belief or current expectations of us, our directors or our officers. Any statements contained herein that are not statements of historical facts may be deemed to be forward-looking statements. In some cases, you can identify forward-looking statements by terminology such as "may", "will", "should", "expect", "plan", "intend", "anticipate", "believe", "estimate", "predict", "potential" or "continue", the negative of such terms or other comparable terminology. Actual events or results may differ materially. In evaluating these statements, you should consider various factors, including the risks we outline from time to time in other reports we file with the Securities and Exchange Commission (the “SEC”) including our Annual Report on Form 10-K and our recent Transition Report on Form 10-KT/A for the six months ended December 31, 2010. These factors may cause our actual results to differ materially from any forward-looking statement. We disclaim any obligation to publicly update these statements, or disclose any difference between our actual results and those reflected in these statements. The information constitutes forward-looking statements within the meaning of the Private Securities Litigation Reform Act of 1995. Given these uncertainties, readers are cautioned not to place undue reliance on such forward-looking statements.
Our business is to identify and develop natural resource assets. Natural Resources USA Corporation’s (“Natural Resources”) direct subsidiary, Natural Soda Holdings, Inc. (“Natural Soda Holdings”), and its wholly-owned subsidiary, Natural Soda, Inc. (“Natural Soda”), own significant natural sodium bicarbonate resources utilized for the recovery and production of various sodium bicarbonate products.
Natural Soda Holdings and Natural Soda own Bureau of Land Management (“BLM”) leases in the Piceance Creek Basin covering very large deposits of naturally occurring sodium bicarbonate called nahcolite. Natural Soda’s business is to produce and sell natural sodium bicarbonate, commonly known as baking soda, for use in a wide variety of products and activities. Natural Soda’s immediate objectives are, firstly, to be a low cost producer of sodium bicarbonate and to leverage that low cost advantage to achieve superior profit margins; and secondly, to profitably utilize its water assets.
Natural Soda owns various water rights in the Piceance Creek Basin in northwest Colorado, a part of the Colorado River drainage system. These various rights are decreed to allow Natural Soda to draw up to a maximum of 108,812 acre feet (35.46 billion gallons) annually and to store up to 7,980 acre feet of water.
Deposits of oil shale lie below, above and are interspersed within the nahcolite contained within the sodium leases. Early in 2010 Natural Soda Holdings applied to the BLM for a Research Development and Demonstration (“RD&D”) lease for the purpose of investigating the recovery of oil from oil shale. In October 2010, the Washington office of the BLM advanced our nomination and has now requested its Colorado office to conduct a review of the project in accordance with the National Environmental Policy Act. Ultimately, if we are granted a RD&D lease we will be allowed to conduct oil shale research during a ten year period over a 160 acre lease adjoining our existing sodium leases. If we can satisfy a substantial diligence requirement, including establishing the ability to produce oil shale in commercial quantities, we could be granted a production lease which will require paying the BLM rent based on the fair market value of the lease.
Sodium Bicarbonate Sales and Revenue Performance
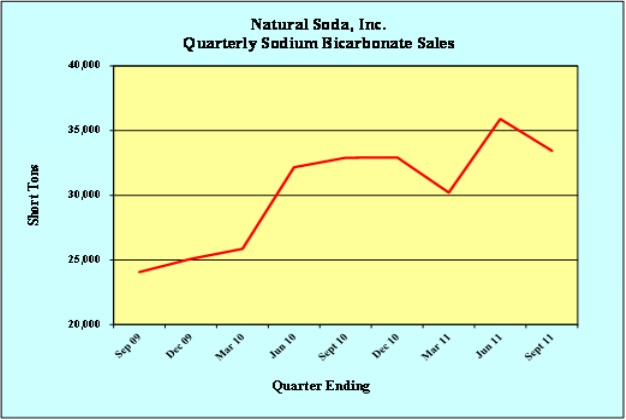
We are currently utilizing three wells to source sodium bicarbonate and we have obtained BLM and Environmental Protection Agency (“EPA”) approval for a fourth well which we expect to drill in 2012. Consequently, we believe we have sufficient capability to meet sales orders for the foreseeable future. Our new boiler constructed at a cost of approximately $4.4 million has been commissioned and is performing according to specification. We expect our greater ability to heat the underground well fields from the new boiler will increase the supply of brine to our plant and enable us to increase production even more. We anticipate that in 2011 our plant’s output will exceed its name plate capacity of 125,000 tons per year for the first time. The BLM increased our authorized recovery of sodium bicarbonate to 250,000 tons per year in 2010 in anticipation of our proposed plant expansion. The existing boilers will be retained as back up units. We have also entered into an agreement with a third party contractor to provide design, project management, supervision, procurement, construction, testing, and start up services in connection with a planned expansion of the Company’s production facilities. The following diagram demonstrates the continuing growth in our sales since the quarter ended September 30, 2009. The first quarter of the year is traditionally a period of slower sales activity reflecting normal purchasing trends in certain market segments.
Revenues were $6,540,627 for the quarter ended September 30, 2011, an increase of 2.6% on revenues of $6,377,273 for the comparable period in the prior year, on sales of 33,442 tons and 32,895 tons in each of the respective periods, an increase of 1.7%. While our revenue per ton increased 0.99%, our cost of goods sold excluding depreciation per ton increased by 3.8%. The actual cost of goods sold excluding depreciation increased to $3,806,535 from $3,606,210 in the prior period, an increase of 5.6%. Consequently, gross profit excluding depreciation decreased 1.3% from $2,771,063 in the prior period to $2,734,092 in the quarter ended September 30, 2011. Gross profit excluding depreciation per ton sold decreased by 2.9%.
Revenues were $19,526,757 for the nine months ended September 30, 2011, an increase of 8.9% on revenues of $17,929,362 for the comparable period in the prior year, on sales of 99,540 tons and 90,923 tons in each of the respective periods, an increase of 9.5%. While our revenue per ton decreased 0.5%, our cost of goods sold excluding depreciation per ton decreased by 1.5%. The actual cost of goods sold excluding depreciation increased to $11,682,035 from $10,828,471 in the prior period, an increase of 7.9%. Consequently, gross profit excluding depreciation increased 10.5% from $7,100,891 in the prior period to $7,844,722 in the nine months ended September 30, 2011. Gross profit excluding depreciation per ton sold increased by 0.9%.
As a consequence of the completion of the reorganization in June 2010, general and administrative costs increased significantly over the prior period for a variety of reasons including various professional fees including fees paid to investigate the oil shale research activities, development of our water rights, investigation of a prospective joint venture and other various consulting fees, increased corporate travel, and board and shareholder meeting expenses. General and administrative costs increased to $4,296,226 for the nine months ended September 30, 2011 from $3,602,179 in the prior period, an increase of 19.3%. General and administrative costs for the three months ended September 30, 2011 were $1,677,745, a 30.7% increase on $1,283,603 in the prior period.
As a result of the higher levels of production and increased investment in our well fields and additional acquisitions of property, plant and equipment, depreciation and amortization expense increased by 14.1% for the three months ended September 30, 2011, compared to the prior period, from $580,020 to $508,530. The resulting income from operations for the three months was $476,327, a decrease of 51.3% over the prior period’s income from operations of $978,930. Interest expense for the three months was reduced from $20,978 to $1,698 reflecting the repayment of our factoring facility.
Depreciation and amortization expense increased by 25.6% for the nine months ended September 30, 2011, compared to the prior period, from $1,389,907 to $1,745,340 as a consequence of the much higher level of production and increased investment in our well fields and further acquisitions of property, plant and equipment. This represents an increase of 14.7% on a per ton basis. The resulting income from operations for the nine months was $1,803,156, an decrease of 4.2% over the prior period’s income from operations of $1,881,305. Interest expense was reduced from $95,995 to $4,292 reflecting the repayment of our factoring facility.
Consequently, after recognizing tax expense totaling $470,000, net income after tax was $4,869 for the three months ended September 30, 2011, a 99.5% decrease on net income after tax of $957,952 for the three months ended September 30, 2010. For the nine month period tax expense totaled $1,549,872 resulting in after tax income of $249,961 compared to net income of $1,785,310 for the prior period. Income tax expense has been calculated on each of our companies on a single entity basis given the need to file tax returns on non-consolidated basis. We intend to seek relief with the Internal Revenue Service which, if granted, would allow us to file consolidated tax returns to reduce or eliminate tax provisions and payments required by filing on an individual company basis.
Liquidity and Capital Resources
During the nine months ended September 30, 2011 we invested $5,906,986 on purchasing property and equipment and $346,926 on our well cavities. In addition, we decreased our accounts receivable by $40,124, decreased inventory by $94,572, increased prepaid expense by $142,375, reduced accounts and royalties payable by $152,033, reduced accrued expenses due to related parties by $241,067, increased restricted cash by $17,368 and reduced capital leases and debt by $13,460. We increased our provisions for accrued expenses by $585,089 and income taxes payable by $1,048,671. We used $376,200 to increase our deferred tax assets. As a result, we reduced our cash by $2,088,955 to a balance of $2,076,073 at the end of the period.
As discussed above, Natural Soda has installed an upgraded boiler and heat transfer system designed to support additional production volume from the existing well field and production facility at a cost of $4.4 million. The new system will service a proposed second line of crystallizers. We have also entered into an agreement with a third party contractor to provide design, project management, supervision, procurement, construction, testing, and start up services in connection with a planned expansion of our production facilities. On July 6, 2011 we paid the contractor $150,000 to undertake preliminary engineering work, and on August 4, 2011 a further $2,570,000 representing the first milestone payment achieved as though the anticipated agreement had been signed.
Under the terms of a Licence Agreement Natural Soda Holdings entered into with Peter Cassidy, an officer and director of Sentient USA Resources Fund, LP (“Sentient”), as discussed more fully in our annual report, Natural Soda Holdings is obliged commission and to pay for a research program related to its application for a RD&D oil shale lease. In September 2010, Natural Soda Holdings contracted with Monash University of Australia (“Monash”) to have Monash perform research on oil shale. This basic research supports our efforts to investigate potential solutions to develop petroleum products from the oil shale. The research at Monash is integral to our oil shale project and is designed to test concepts that may later be used on-site should we gain full approval from the BLM of our RD&D application. We expect to spend approximately $500,000 this year to fund the Monash research program.
Off-Balance Sheet Arrangements
We do not have any significant off-balance sheet arrangements for either Natural Resources, Natural Soda Holdings or Natural Soda that have or are reasonably likely to have a current or future effect on our financial condition, changes in financial condition, revenues or expenses, results of operations, liquidity, capital expenditures or capital resources that is material to investors. Natural Soda sometimes enters into contracts of supply for the purchase of natural gas in order to secure supplies at fixed prices for up to 75% of anticipated requirements Natural Soda takes delivery of all natural gas purchased and considers them to be normal purchases of natural gas for accounting purposes.
ITEM 4: CONTROLS AND PROCEDURES
Disclosure Controls and Procedures
Our senior management is responsible for establishing and maintaining a system of disclosure controls and procedures (as defined in Rule 13a-15 and 15d-15 under the Securities Exchange Act of 1934 (the “Exchange Act”)) designed to ensure that information required to be disclosed by us in the reports that we file or submit under the Exchange Act is recorded, processed, summarized and reported within the time periods specified in the Securities and Exchange Commission’s rules and forms.
Disclosure controls and procedures include, without limitation, controls and procedures designed to ensure that information required to be disclosed by an issuer in the reports that it files or submits under the Exchange Act is accumulated and communicated to the issuer’s management, including its principal executive officer or officers and principal financial officer or officers, or persons performing similar functions, as appropriate to allow timely decisions regarding required disclosure. Our Chief Executive Officer and Chief Financial Officer evaluated our internal controls and concluded that our disclosure controls and procedures were not effective as of September 30, 2011 as a result of the material weaknesses in our internal control over financial reporting discussed below and which we are currently remediating.
A material weakness is a deficiency, or a combination of deficiencies, in internal control over financial reporting such that there is a reasonable possibility that a material misstatement of the Company’s annual or interim financial statements will not be prevented or detected on a timely basis. As of June 30, 2011, we did not maintain effective controls over the preparation of its tax returns and determination of our tax provisions for accounting purposes.
Specifically:
| | ● | We did not maintain an effective control environment that recognized the differences between financial accounting and taxation accounting and ensured access to personnel with appropriate experience to properly prepare taxation returns. |
| | ● | We did not maintain sufficient controls to ensure our tax returns were filed accurately and on a consistent basis. |
These control deficiencies led to errors in our tax filings that in turn resulted in errors in the preparation of our financial statements.
These control deficiencies resulted in material errors and the restatement of our financial statements for the six months ended December 31, 2010, particularly with respect to the determination of amounts of tax expense, deferred tax assets, income tax liability and net income. Additionally, these control deficiencies could result in further misstatements of these accounts that would result in a material misstatement of our financial statements that would not be prevented or detected on a timely basis. Accordingly, our management has determined that these control deficiencies constitute material weaknesses.
Changes in Internal Control Over Financial Reporting
There have been no changes in internal control over financial reporting during the quarter ended September 30, 2011 that have materially affected, or are reasonably likely to materially affect, the Company's internal control over financial reporting.
Management’s Plan for Remediation
Beginning in August 2011, our management began to determine new policies and procedures and internal controls to address the above-described material weaknesses and enhance our system of internal control over financial reporting and the preparation of tax returns.
The remediation efforts outlined below are intended both to address the identified material weaknesses and to enhance our overall financial control environment.
Our plan is to create an effective control environment around the preparation of the tax returns and the computation of tax provisions, tax expense, deferred tax assets, income tax liability and net income to provide for the accuracy of our financial reporting:
| | ● | We have appointed tax advisors who have expertise in US mining tax regulations. |
| | ● | We have introduced new internal control procedures to review tax returns filed by the Company ensure tax returns are complete and accurate. |
| | ● | In addition, due to certain missed elections in order to file our tax returns on a consolidated basis, we intend to seek relief from the Internal Revenue Service which, if granted, would allow us to re-consolidate our previously filed tax returns. |
| | ● | We will improve the quality and quantity of the tax training provided to our CFO and accounting staff. |
The Audit Committee has directed management to develop a detailed plan and timetable for the implementation of the foregoing remediation efforts and will monitor the implementation. In addition, under the direction of the Audit Committee, management will continue to review and make necessary changes to the overall design of our internal control environment, as well as to policies and procedures to improve the overall effectiveness of internal control over financial reporting.
Management believes the foregoing efforts will effectively remediate these material weaknesses. As we continue to evaluate and work to improve its internal control over financial reporting, management may determine to take additional measures to address control deficiencies or determine to modify the remediation plan described above.
PART II: OTHER INFORMATION.
ITEM 1: LEGAL PROCEEDINGS
Natural Resources is not subject to any legal proceeding.
Natural Soda operates the sodium mining business on four Sodium Leases issued by the United States Bureau of Land Management (“BLM”), which are designated as Sodium Lease Nos. C-0118326, C-0118327, C-0119986, and C-37474 (“Sodium Leases”). Effective July 1, 2011 The Sodium Leases were renewed for a further ten years. Natural Soda Holdings also owns the Rock School Lease issued by the BLM, which is designated as Sodium Lease No. C-0119985. Effective July 1, 2011this lease was also renewed for a further ten years.
As of September 30, 2011, Natural Soda is the applicant in the following cases pending in the Water Court:
| ● | Water Division No. 5: Case No. 1998CW315, |
On April 23, 2011, the Water Division No. 6 Water Court entered decrees granting the applications filed by Natural Soda in Case Nos. 2010CW11, 2010CW12, 2010CW13, 2010CW14, 2010CW32, and 2010CW34. On April 25, 2011, the Water Division No. 6 Water Court entered decrees granting the applications filed by Natural Soda in Case Nos. 2010CW10, and 2010CW33.
As of September 30, 2011, Natural Soda has filed a statement of opposition in the following cases pending in Water Division No. 5; Case Numbers:
| ● | 2003CW282 - Exxon Mobile Corporation, |
| ● | 2003CW309 - Encana Oil & Gas (USA), Inc., |
| ● | 2003CW318 - Encana Oil & Gas (USA), Inc., |
| ● | 2004CW110 - Shell Frontier Oil & Gas, Inc., |
| ● | 2005CW285 - Exxon Mobile Corporation, |
| ● | 2005CW294 - Exxon Mobile Corporation, |
| ● | 2006CW263 - Exxon Mobile Corporation, |
| ● | 2006CW265 - Exxon Mobile Corporation, |
| ● | 2007CW242 - Puckett Land Company |
| ● | 2007CW253 - XTO Energy Inc., |
| ● | 2007CW254 - Williams Production RMT Company, |
| ● | 2008CW182 - EnCana Oil and Gas (USA), Inc., |
As of September 30, 2011, Natural Soda has filed a statement of opposition in the following cases pending in Water Division No. 6; Case Numbers:
| ● | 2010CW29 - Shell Frontier Oil & Gas (USA), Inc |
Natural Soda has entered into a stipulation with Shell Frontier Oil & Gas (USA), Inc. for the settlement of Case No. 2010CW29, but no final judgment has been entered in the case. Of the cases in which Natural Soda has filed a statement of opposition, a case that may particularly affect Natural Soda’s interests is Shell Frontier Oil & Gas, Inc.’s application in Case No. 2004CW110 to move a water right from a tributary of the White River to a point on the White River lower down river than the diversion point for Natural Soda’s White River direct pumping rights. If Shell were to be successful in their application, it might adversely impact the value of our White River water rights. We intend to vigorously oppose this application.
Numerous water users, including Natural Soda, filed a complaint in the District Court in and for Water Division No. 1 in Case No. 2010CW89, and other Water Divisions, requesting judicial review of actions of the State Engineer related to a rulemaking preceding that resulted in the adoption of the Produced Nontributary Ground Water Rules, 2 CCR 402-17. Natural Soda is participating in this case to ensure that its water rights will not be adversely affected.
ITEM 2: UNREGISTERED SALES OF EQUITY SECURITIES AND USE OF PROCEEDS
On January 18, 2011 options to subscribe for 875,000 shares of common stock at $0.58 per share were granted to each of Mr. Bill H. Gunn, Mr. Robert van Mourik, Mr. Bradley F. Bunnett and Mr. Robert Warneke. One third of the options vest on each of the first, second and third anniversaries of the date of grant and expire on January 18, 2016.
On May 4, 2011 150,000 options held by two former directors of the Company were exchanged for 75,000 shares of restricted common stock under the cashless exercise provisions of the option agreements. Options they each held to acquire 37,500 shares at $0.88 per share expired on May 9, 2011 under the provisions of the 2010 Directors’ Incentive Plan. On July 11, 2011 options to subscribe for 112,500 shares at $0.61 per share were granted to three non-executive directors in accordance with the provisions of the 2010 Directors’ Incentive Plan. The options vest on January 2, 2012 and expire on June 30, 2014.
On July 1, 2011 options to subscribe for 112,500 shares at $0.61 per share were granted to three non-executive directors in accordance with the provisions of the 2010 Directors’ Incentive Plan. The options vest on January 2, 2012 and expire on June 30, 2014.
| Certification of Chief Executive Officer pursuant to Section 302 of the Sarbanes Oxley Act of 2002 (filed herewith). |
| Certification of Chief Financial Officer pursuant to Section 302 of the Sarbanes Oxley Act of 2002 (filed herewith). |
| Certification of Chief Executive Officer pursuant to 18 U.S.C. Section 1350 (filed herewith). |
| Certification of Chief Financial Officer pursuant to 18 U.S.C. Section 1350 (filed herewith). |
Pursuant to the requirements of Section 13 or 15(d) of the Securities Exchange Act of 1934, the Registrant has duly caused this report to be signed on its behalf by the undersigned thereunto duly authorized.
| Date: November 14, 2011 | NATURAL RESOURCES USA CORPORATION |
| | | |
| | By: | /s/ Robert C.J. van Mourik |
| | | Robert C. J. van Mourik |
| | | Chief Financial Officer |
17