
Investor Presentation May 2022
Some of the information in this presentation that is not historical in nature constitutes “forward‐looking statements” within the meaning of Section 27A of the Securities Act of 1933 and Section 21E of the Securities Exchange Act of 1934, including statements as to the Company's expectations, beliefs, goals and strategies regarding the future. These forward‐looking statements may involve risks and uncertainties that are difficult to predict, may be beyond our control and could cause actual results to differ materially from those described in such statements. Although the Company believes that the expectations reflected in such forward‐looking statements are reasonable, it can give no assurance that such expectations will prove to be correct, including the timing of any debt paydown or payment of partnership distributions, or that the Company’s business optimization and growth strategies will achieve the targeted results. Important factors, including the impacts of the COVID‐19 pandemic, general economic conditions, adverse weather conditions, competition for consumer leisure time and spending, unanticipated construction delays, changes in the Company’s capital investment plans and projects and other factors discussed from time to time by the Company in its reports filed with the Securities and Exchange Commission (the “SEC”) could affect attendance at the Company’s parks, as well as the timing of any debt paydown or payment of partnership distributions, and the Company’s business optimization program, and cause actual results to differ materially from the Company's expectations or otherwise to fluctuate or decrease. Additional information on risk factors that may affect the business and financial results of the Company can be found in the Company's Annual Report on Form 10‐K and in the filings of the Company made from time to time with the SEC. The Company undertakes no obligation to publicly update or revise any forward‐looking statements, whether as a result of new information, future events, information, circumstances or otherwise that arise after the publication of this document. Forward‐Looking Statements 2

FUN Overview 3

Compelling Investment Rationale 1 2 Best‐in‐class parks and brands with loyal, high‐repeat customer base 3 High barriers to entry (with no successful regional park built since the 1970s) 4 Resilient operating performance through various economic cycles 6 Industry‐experienced management team with history of delivering results High quality assets and significant real estate holdings (and underlying asset value) Strong business model with steady growth in revenues and free cash flow 5 MLP offering a unique, non‐energy‐related investment option in consumer discretionary space Reported record net revenues and in‐park per capita spending for 2H‐2021 and Q1‐2022 4

5 Industry Savvy Executive Team Richard Zimmerman CEO Tim Fisher COO Brian Witherow CFO Kelley Ford CMO Craig Heckman CHRO Dave Hoffman CAO Brian Nurse CLO

Please note: The COVID‐19 pandemic and corresponding market disruption had a material impact on Cedar Fair’s results in 2020 and 2021. In May 2021, the Company opened all of its U.S. properties for the 2021 operating season on a staggered basis with capacity restrictions, guest reservations, and other operating protocols in place. The Company’s Canadian property, Canada’s Wonderland, reopened in July 2021, and the park operated with capacity restrictions in place throughout 2021. By comparison, the Company currently anticipates that all of its parks will return to their full operating calendars for the 2022 season without any operating restrictions. Five of its 13 properties opened, as planned, for the 2022 operating season in the first quarter of 2022. Given the material impact the coronavirus pandemic had on park operations in 2020 and 2021, results for the 2022 first quarter are not directly comparable to the first quarters of the last two years, which is why in some instances we use comparisons to 2019 instead. Data Comparisons Used for this Presentation 6
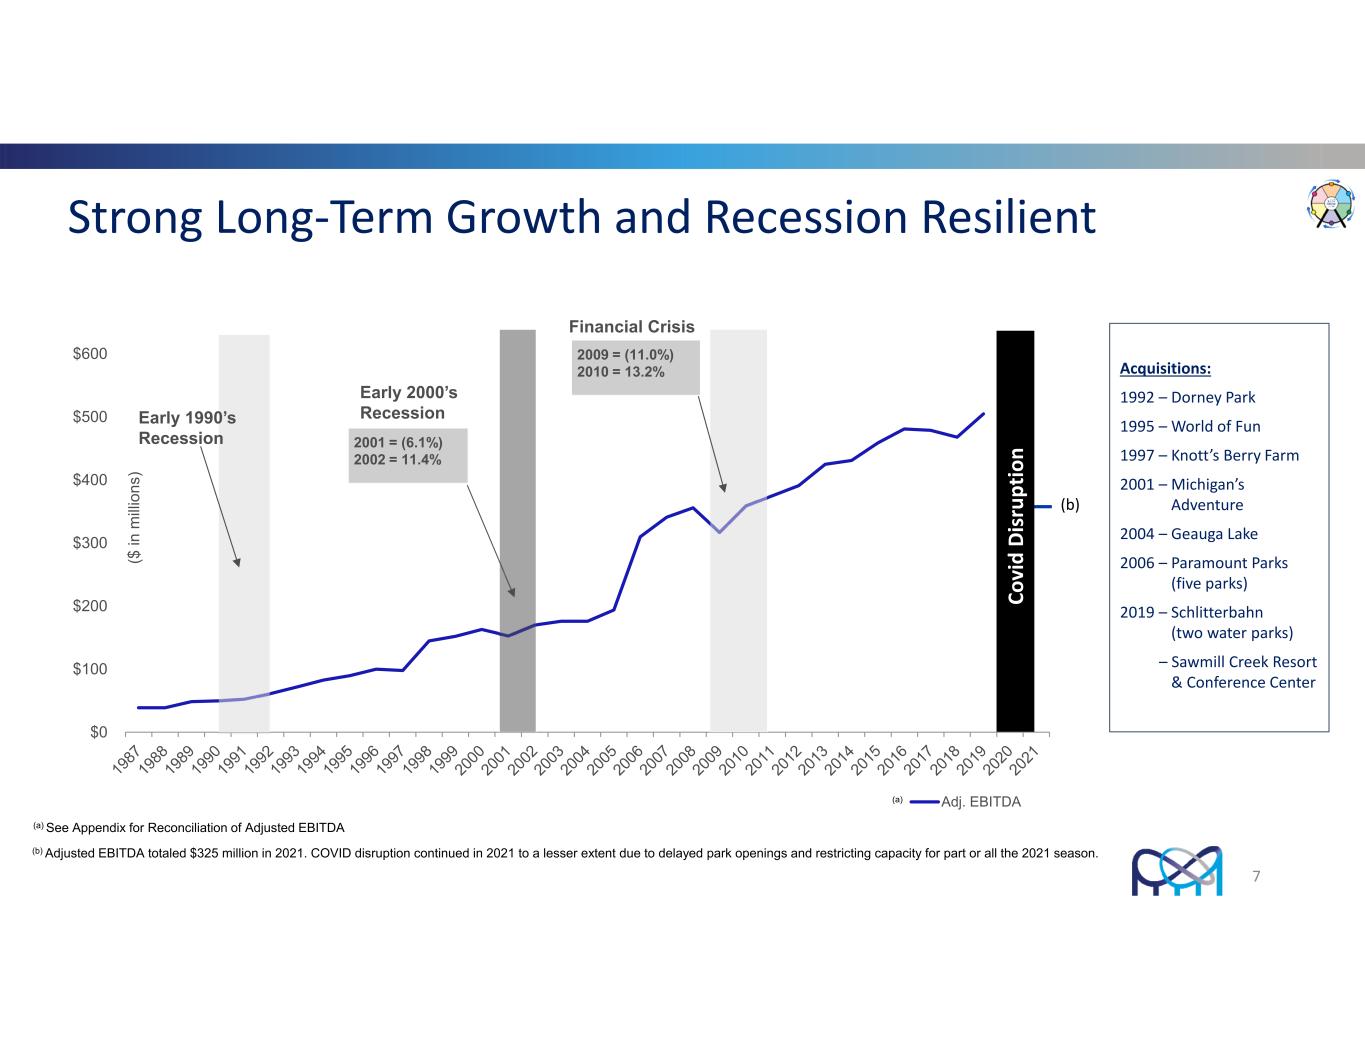
Strong Long‐Term Growth and Recession Resilient Acquisitions: 1992 – Dorney Park 1995 – World of Fun 1997 – Knott’s Berry Farm 2001 – Michigan’s Adventure 2004 – Geauga Lake 2006 – Paramount Parks (five parks) 2019 – Schlitterbahn (two water parks) – Sawmill Creek Resort & Conference Center $0 $100 $200 $300 $400 $500 $600 ($ in m illi on s) Adj. EBITDA Financial Crisis 2001 = (6.1%) 2002 = 11.4% 2009 = (11.0%) 2010 = 13.2% Early 2000’s RecessionEarly 1990’s Recession (a) (a) See Appendix for Reconciliation of Adjusted EBITDA 7 C ov id D is ru pt io n (b) (b) Adjusted EBITDA totaled $325 million in 2021. COVID disruption continued in 2021 to a lesser extent due to delayed park openings and restricting capacity for part or all the 2021 season.
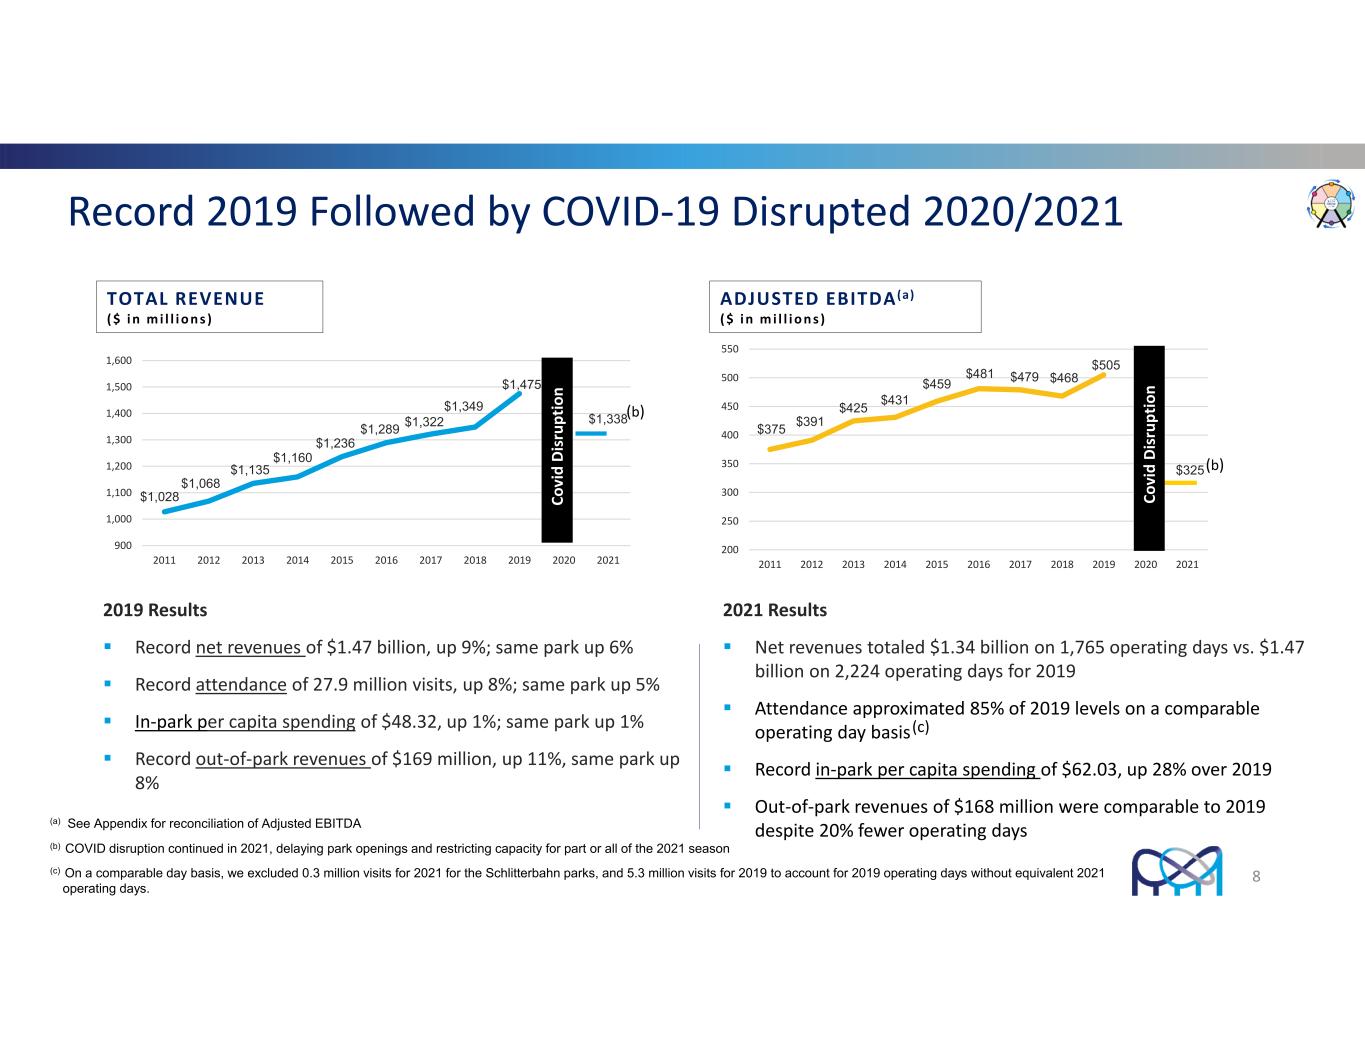
Record 2019 Followed by COVID‐19 Disrupted 2020/2021 2019 Results Record net revenues of $1.47 billion, up 9%; same park up 6% Record attendance of 27.9 million visits, up 8%; same park up 5% In‐park per capita spending of $48.32, up 1%; same park up 1% Record out‐of‐park revenues of $169 million, up 11%, same park up 8% 2021 Results Net revenues totaled $1.34 billion on 1,765 operating days vs. $1.47 billion on 2,224 operating days for 2019 Attendance approximated 85% of 2019 levels on a comparable operating day basis Record in‐park per capita spending of $62.03, up 28% over 2019 Out‐of‐park revenues of $168 million were comparable to 2019 despite 20% fewer operating days ADJUSTED EBITDA(a) ($ i n mi l l i ons ) $1,028 $1,068 $1,135 $1,160 $1,236 $1,289 $1,322 $1,349 $1,475 $1,338 900 1,000 1,100 1,200 1,300 1,400 1,500 1,600 2011 2012 2013 2014 2015 2016 2017 2018 2019 2020 2021 TOTAL REVENUE ($ i n mi l l i ons ) $375 $391 $425 $431 $459 $481 $479 $468 $505 $325 200 250 300 350 400 450 500 550 2011 2012 2013 2014 2015 2016 2017 2018 2019 2020 2021 (a) See Appendix for reconciliation of Adjusted EBITDA 8 C ov id D is ru pt io n C ov id D is ru pt io n (b) COVID disruption continued in 2021, delaying park openings and restricting capacity for part or all of the 2021 season (b) (b) (c) On a comparable day basis, we excluded 0.3 million visits for 2021 for the Schlitterbahn parks, and 5.3 million visits for 2019 to account for 2019 operating days without equivalent 2021 operating days. (c)
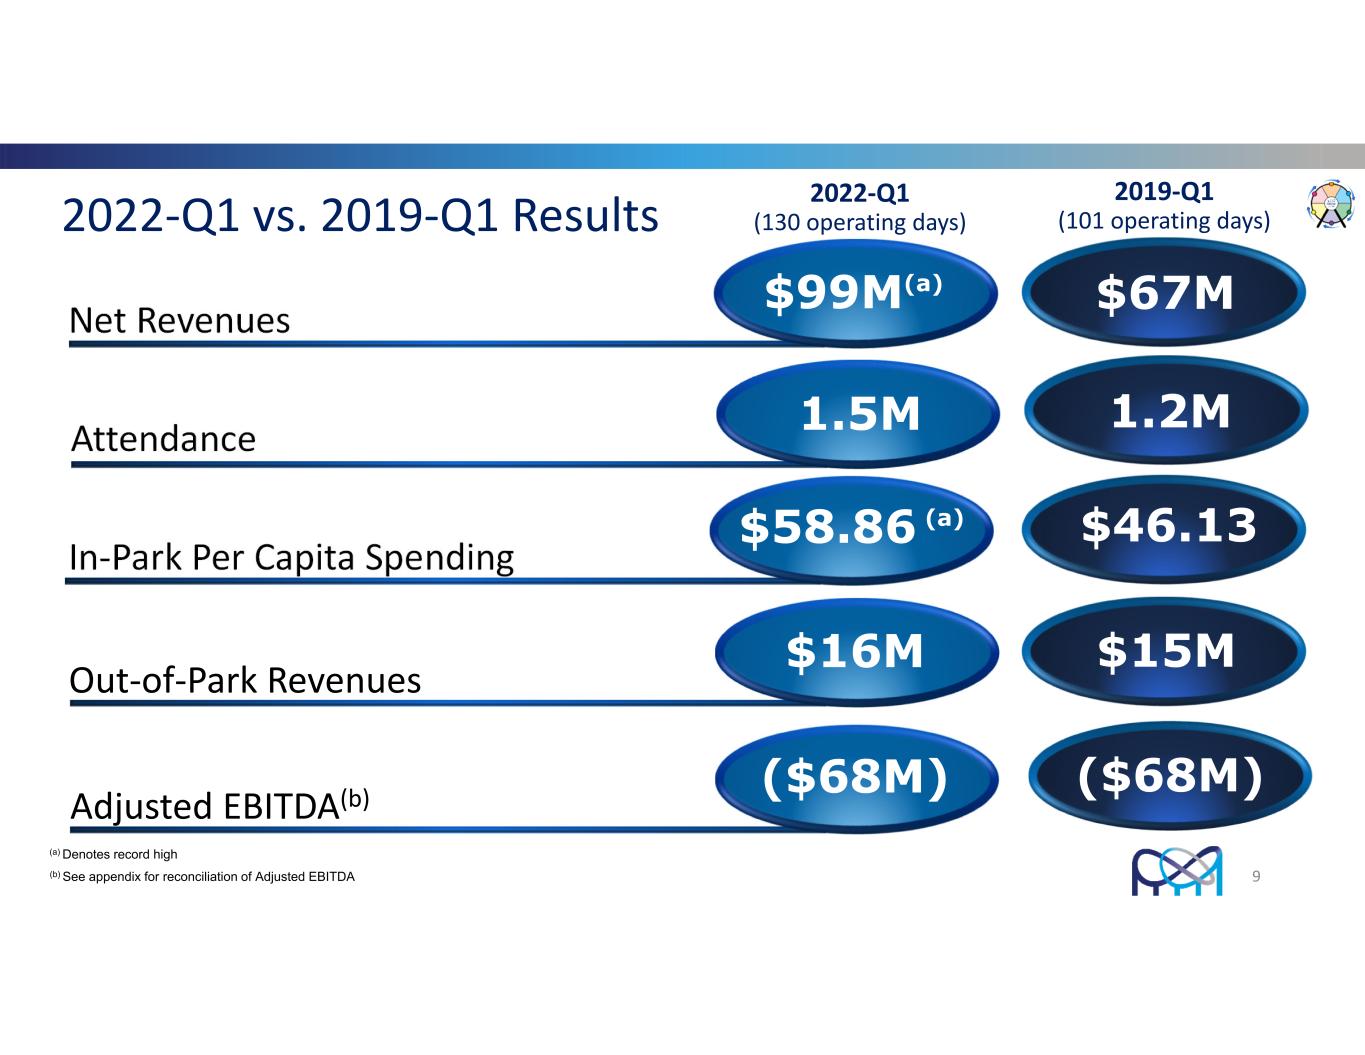
3% 4% 2022‐Q1 vs. 2019‐Q1 Results 1% Net Revenues $99M(a) $67M Adjusted EBITDA(b) ($68M)($68M) Attendance 1.2M1.5M In‐Park Per Capita Spending $46.13$58.86 (a) Out‐of‐Park Revenues $15M$16M 9 2022‐Q1 (130 operating days) 2019‐Q1 (101 operating days) (a) Denotes record high (b) See appendix for reconciliation of Adjusted EBITDA

3% 4% 2021‐2H vs. 2019‐2H Results 1% Net Revenues $1.10B Adjusted EBITDA(b) $407M Attendance 16.1M(a) In‐Park Per Capita Spending $63.32 Out‐of‐Park Revenues $117M 10 2021 Second Half (a) (1,372 operating days) 2019 Second Half (1,397 operating days) $972M 18.3M $48.97 $105M $410M (a) Due to the pandemic’s market disruption, Canada’s Wonderland’s opening was delayed until July 5, 2021, and the park operated under capacity restrictions for the rest of the 2021 season (b) See appendix for reconciliation of Adjusted EBITDA
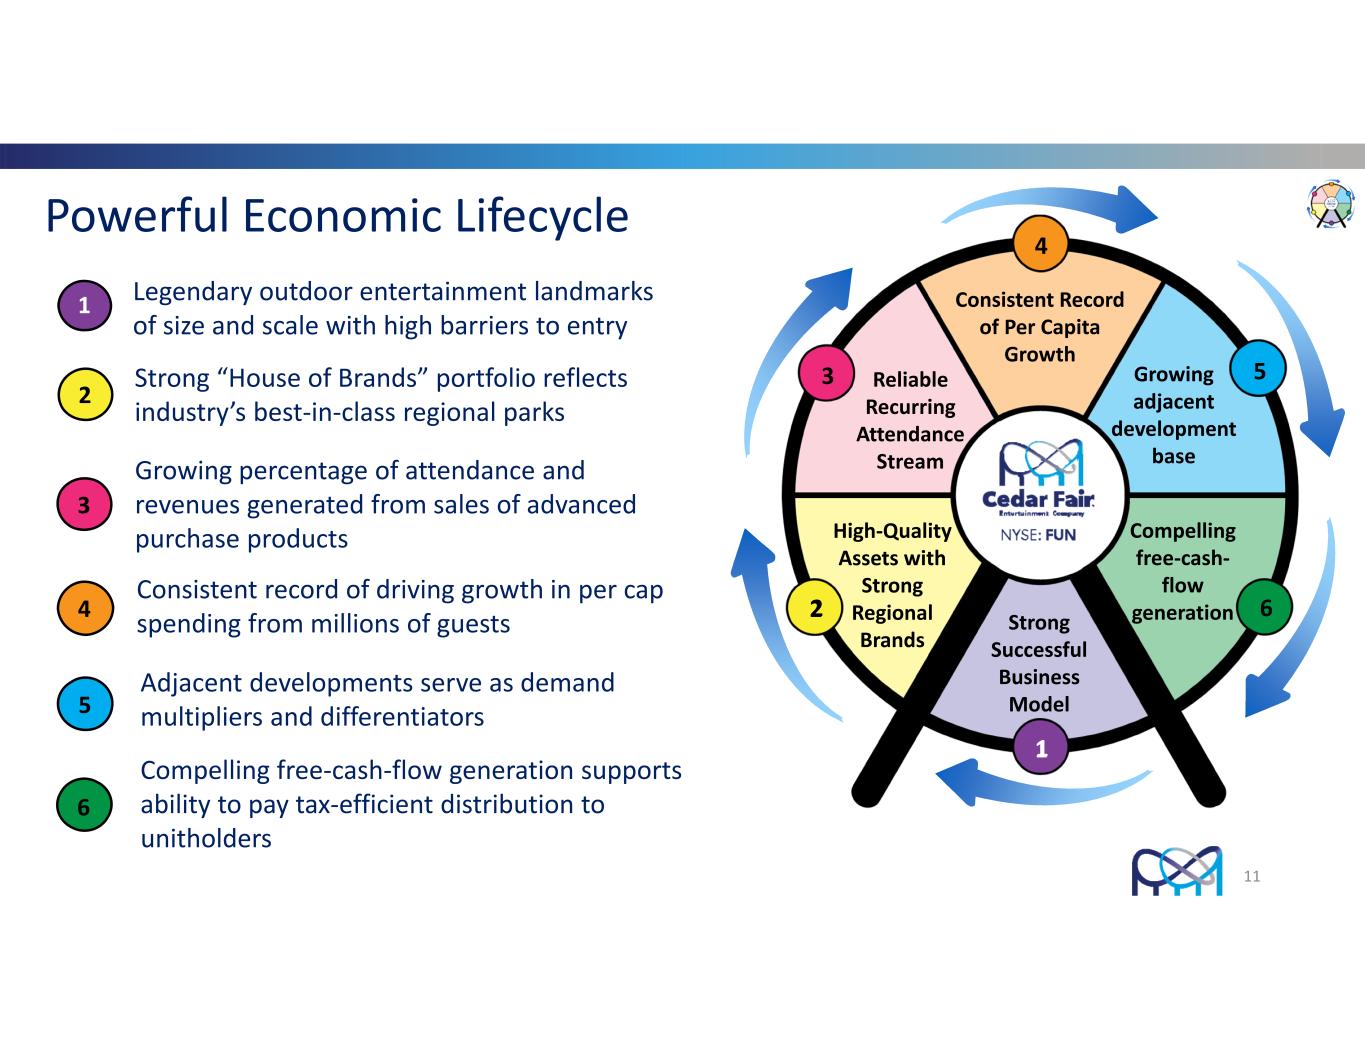
11 Powerful Economic Lifecycle Legendary outdoor entertainment landmarks of size and scale with high barriers to entry 1 Strong “House of Brands” portfolio reflects industry’s best‐in‐class regional parks 2 Growing percentage of attendance and revenues generated from sales of advanced purchase products 3 Consistent record of driving growth in per cap spending from millions of guests4 Adjacent developments serve as demand multipliers and differentiators5 Compelling free‐cash‐flow generation supports ability to pay tax‐efficient distribution to unitholders 6 Strong Successful Business Model 1 2 3 4 5 6 High‐Quality Assets with Strong Regional Brands Reliable Recurring Attendance Stream Consistent Record of Per Capita Growth Growing adjacent development base Compelling free‐cash‐ flow generation
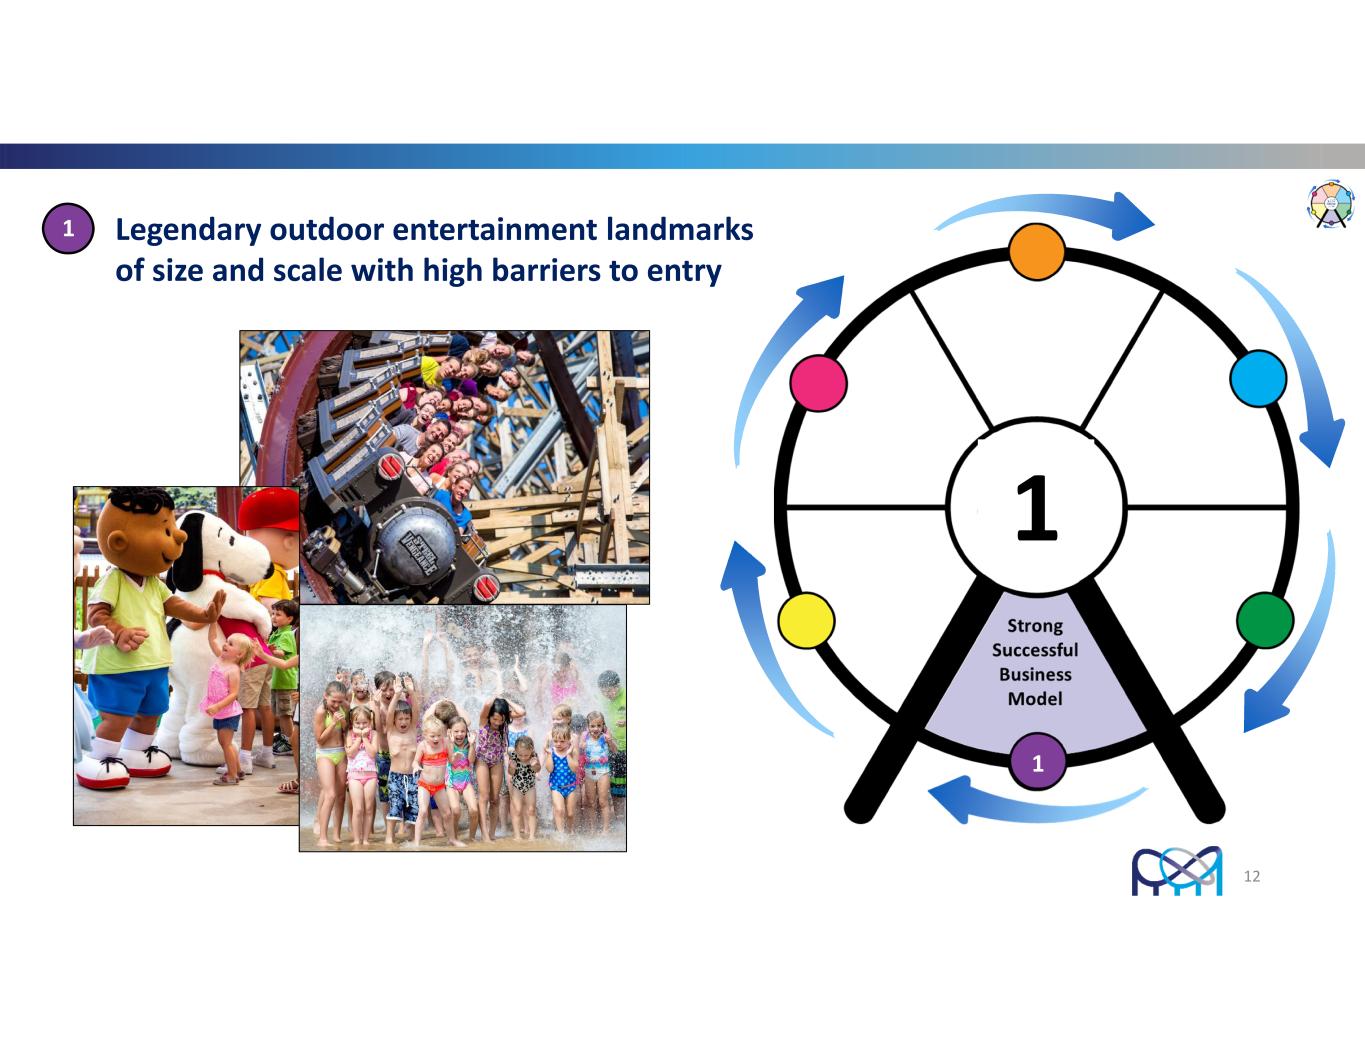
12 1 Legendary outdoor entertainment landmarks of size and scale with high barriers to entry 1 1 1

13 Our Purpose “To Make People Happy” 13 1

Consumer Insights – Research Findings KEY FINDINGS: Rides and events remain the top reasons guests visit our parks, while family coasters and water parks/rides are strong motivators to visit among our most engaged guests Top Reasons to Visit Parks: • Family Rides • Thrill Coasters • Water Rides • Seasonal Events/Festivals • Anniversary Celebrations 1 14

Consumer Insights – Research Findings What Else Motivates Guests to Visit? • Something for everyone – a menu of rides and activities that offer guests a wide range of entertainment choices • Wholesome, simple and fun entertainment that allows guests to foster connections and interactions with others • “Never before” experiences • An atmosphere with a “sense of place” celebrating local authenticity and cultural diversity 15 1 Market Opportunities • Lowest market penetration currently among demographics with the fastest population growth rates • Markets with attractive growth opportunities include older non‐families, families with young children, millennial non‐families, and Asian American, U.S. Hispanic and affluent households • Tourism market in Southern California offers near‐term opportunity

Long‐Range Plan: Core Strategies • Broaden the Guest Experience • Expanded use of limited‐duration events and more immersive experiences – “Seasons of FUN” model that drives urgency to visit • Aimed at driving more visits from existing guests and incremental visits from new, unique guests • Traditional rides, such as roller coasters and water attractions, still play an important role • Food & beverage to continue to play an outsized role in the overall guest experience • Continue to Expand and Evolve the Season Pass Program • Our strongest growth channel – approximately 55% of full‐year attendance in 2021 (compared to 52% in 2019) • Continued evolution of the program, including the broad rollout of PassPerks, our season pass loyalty program • Increase Market Penetration through Targeted Marketing Efforts • Key opportunities exist within several demographic groups with the fastest population growth rates • Pursue Adjacent Development • Continued evolution of our accommodations and resort offerings 16 1
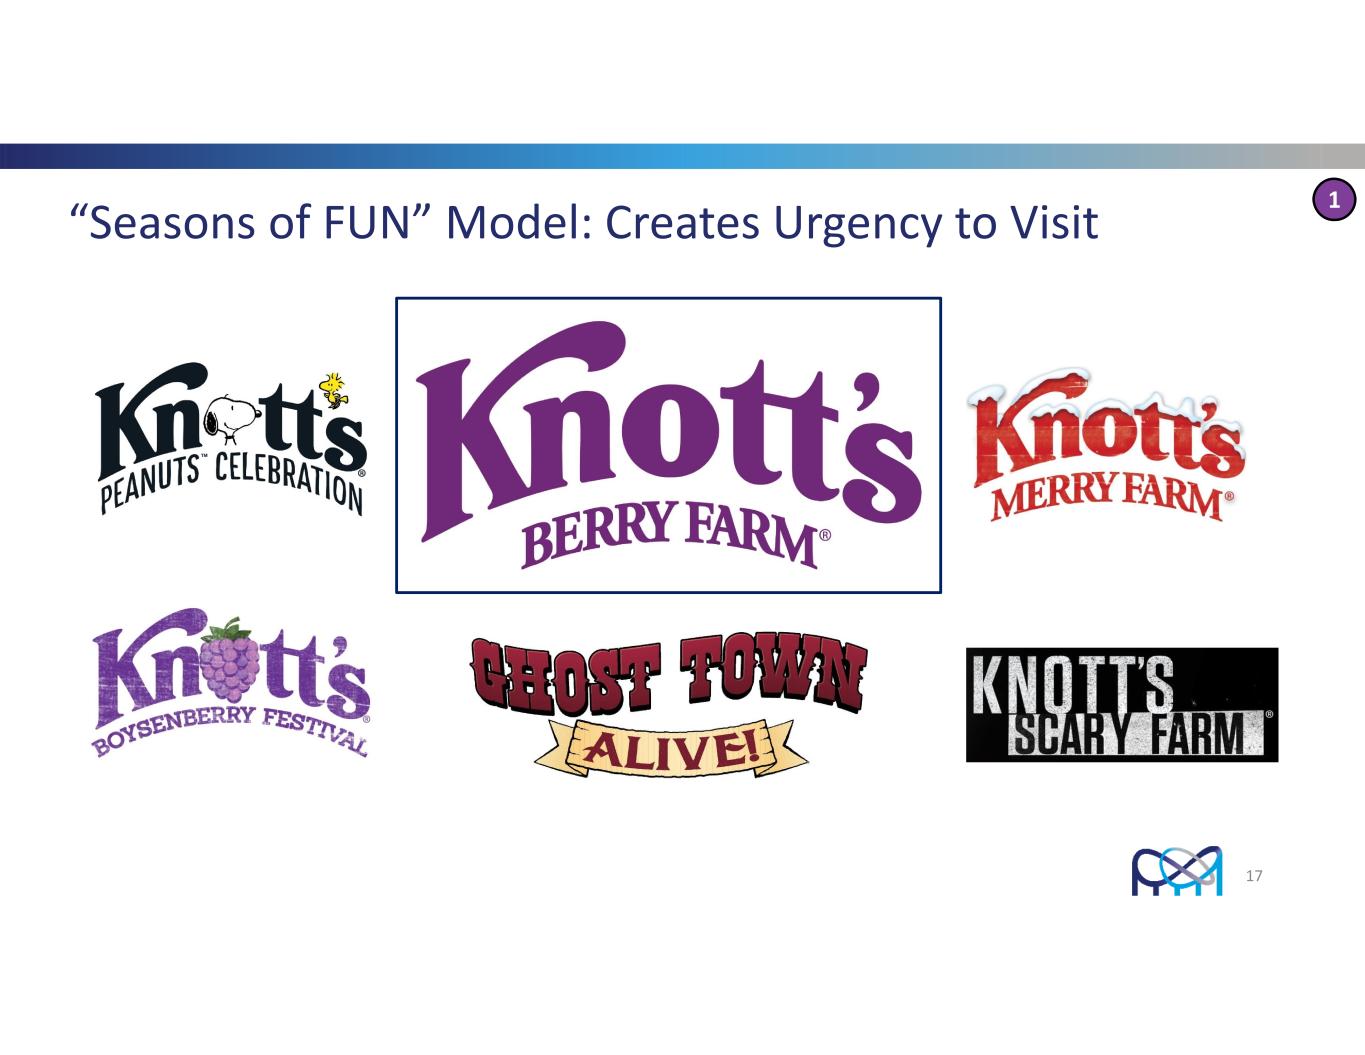
17 “Seasons of FUN” Model: Creates Urgency to Visit 1

Offer Guests Immersive Experiences 18 1

Popular Events Extend Calendar, Drive Growth • 2016 – Introduction of first WinterFest event with approximately 141K guests in attendance • 2021 – Five WinterFest park events and Knott’s Merry Farm entertained a combined 1.8 million guests • Additional opportunities for expanding WinterFest, or a comparable event, to other parks being explored • Haunt’s popularity has increased dramatically over last 20 years Haunt produces some of our highest attendance days • October 2021 attendance was up 8% versus October 2019 and up 67% versus October 2009 The month of October represented 10.5% of total 2019 annual attendance 19 1
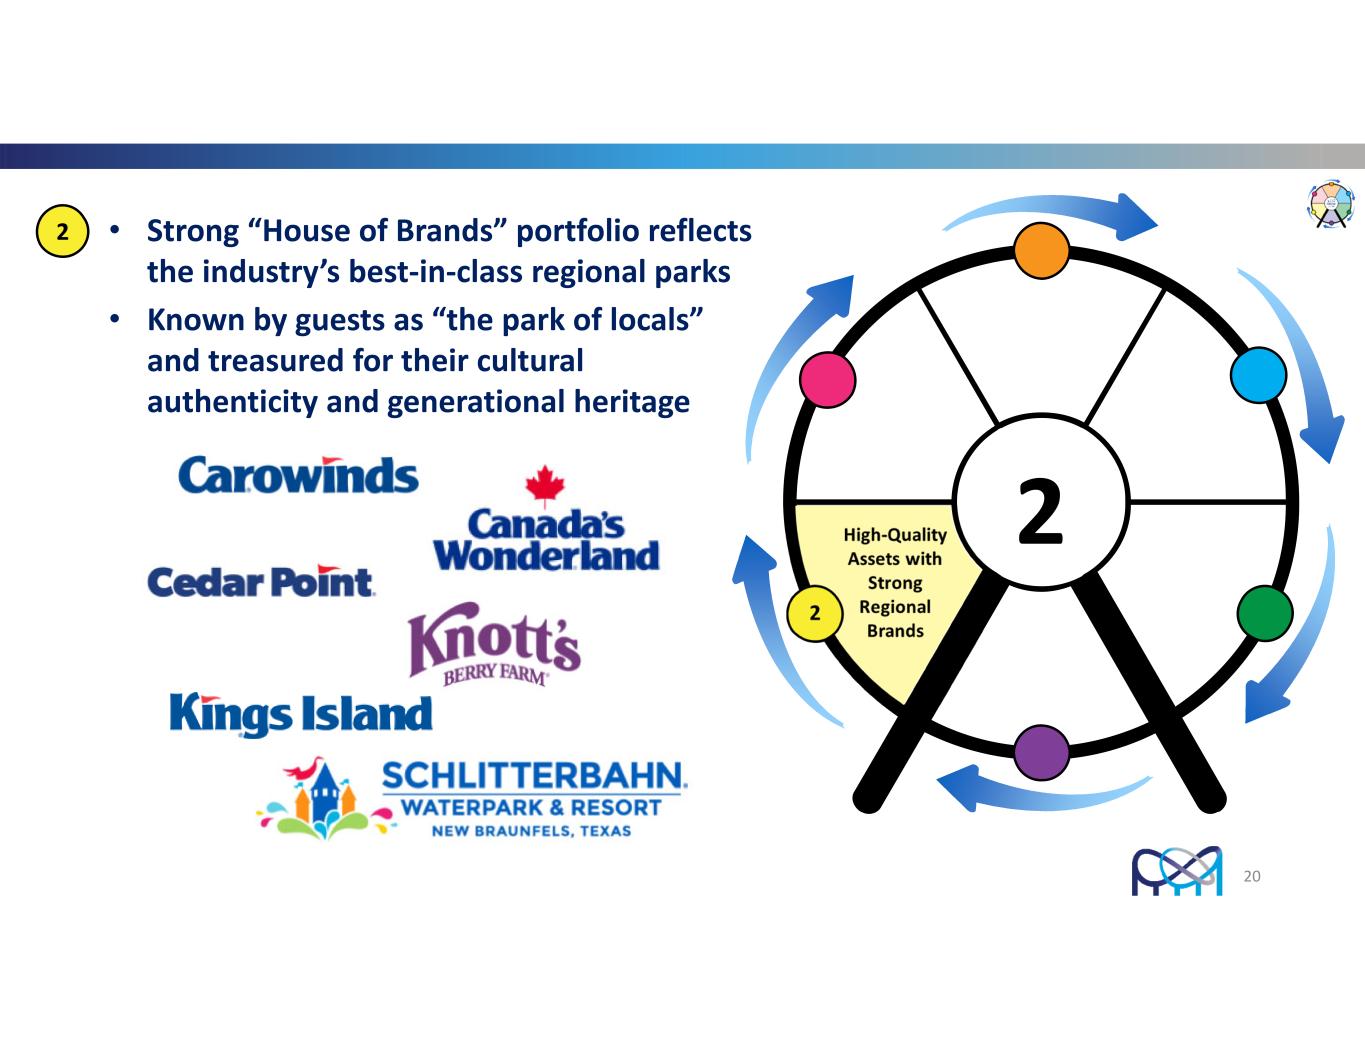
20 • Strong “House of Brands” portfolio reflects the industry’s best‐in‐class regional parks • Known by guests as “the park of locals” and treasured for their cultural authenticity and generational heritage 2 Strong Successful Business Model 1 2 3 4 5 6 High Distribution Yield High‐Quality Assets with Strong Regional Brands Reliable Recurring Revenue Stream Tax‐ Advantaged Structure 2

KEY STATISTICS Entertained 28M visitors in 2019 841 rides and attractions 124 roller coasters 2,300+ hotel rooms PARKS PORTFOLIO Own and operate 11 amusement parks 9 outdoor water parks (in‐park) 4 outdoor water parks (unique gates) 1 indoor water park resort 21 2

22 1 Growing percent of attendance and revenues generated through sales of advanced‐ purchase products, such as season pass and other all‐season products 3 3 Reliable Recurring Attendance Stream 3
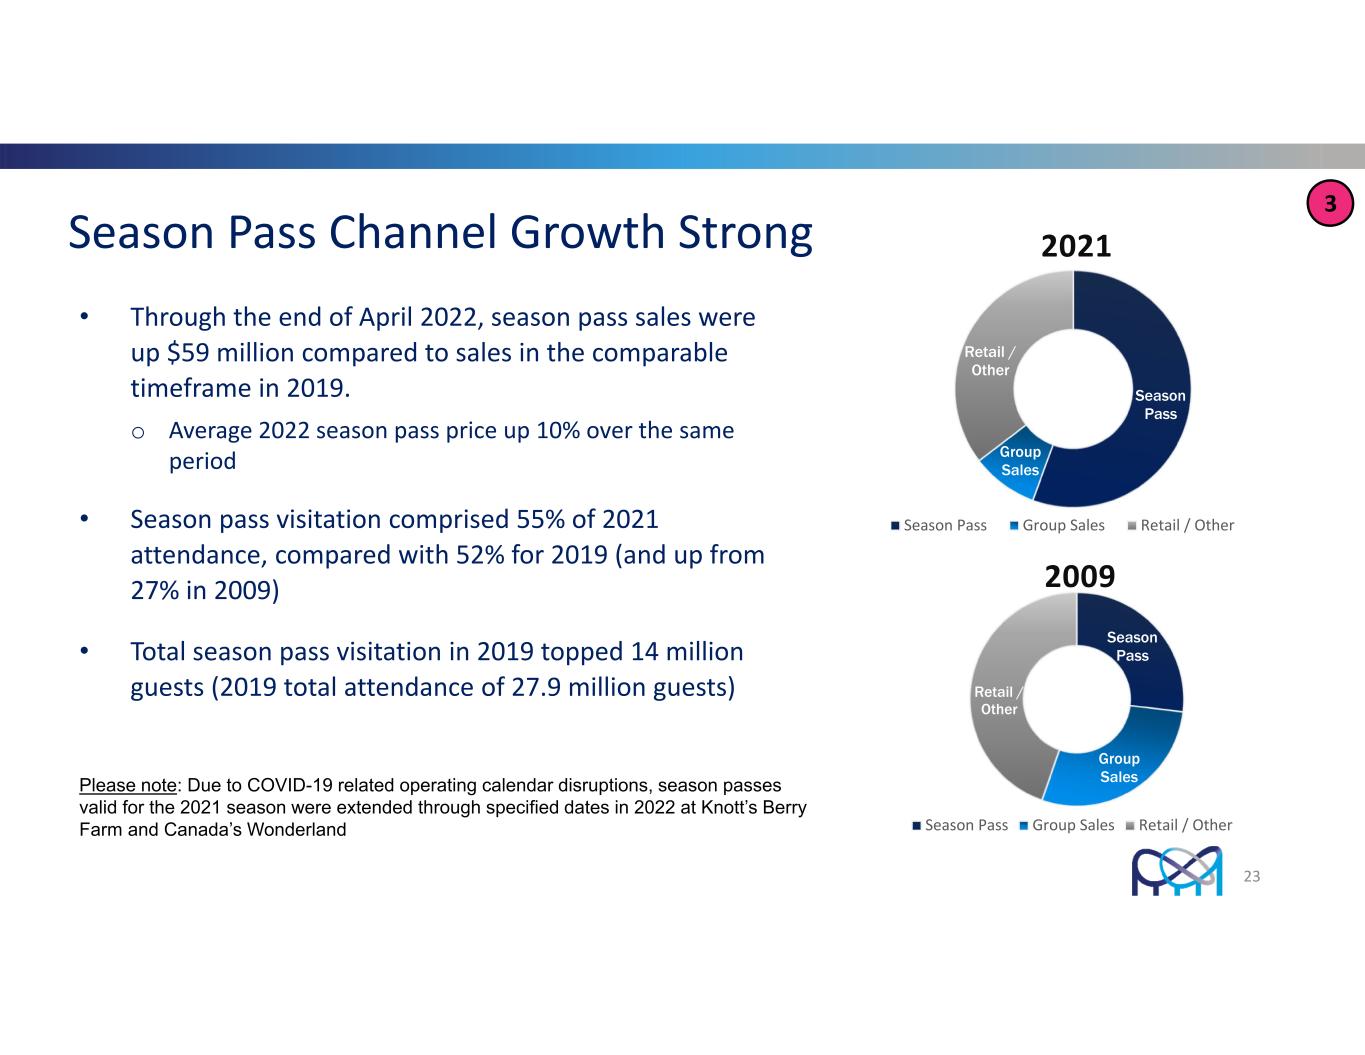
Season Pass Channel Growth Strong • Through the end of April 2022, season pass sales were up $59 million compared to sales in the comparable timeframe in 2019. o Average 2022 season pass price up 10% over the same period • Season pass visitation comprised 55% of 2021 attendance, compared with 52% for 2019 (and up from 27% in 2009) • Total season pass visitation in 2019 topped 14 million guests (2019 total attendance of 27.9 million guests) Season Pass Group Sales Retail / Other 2021 Season Pass Group Sales Retail / Other Season Pass Group Sales Retail / Other 2009 Season Pass Group Sales Retail / Other 23 Please note: Due to COVID-19 related operating calendar disruptions, season passes valid for the 2021 season were extended through specified dates in 2022 at Knott’s Berry Farm and Canada’s Wonderland 3
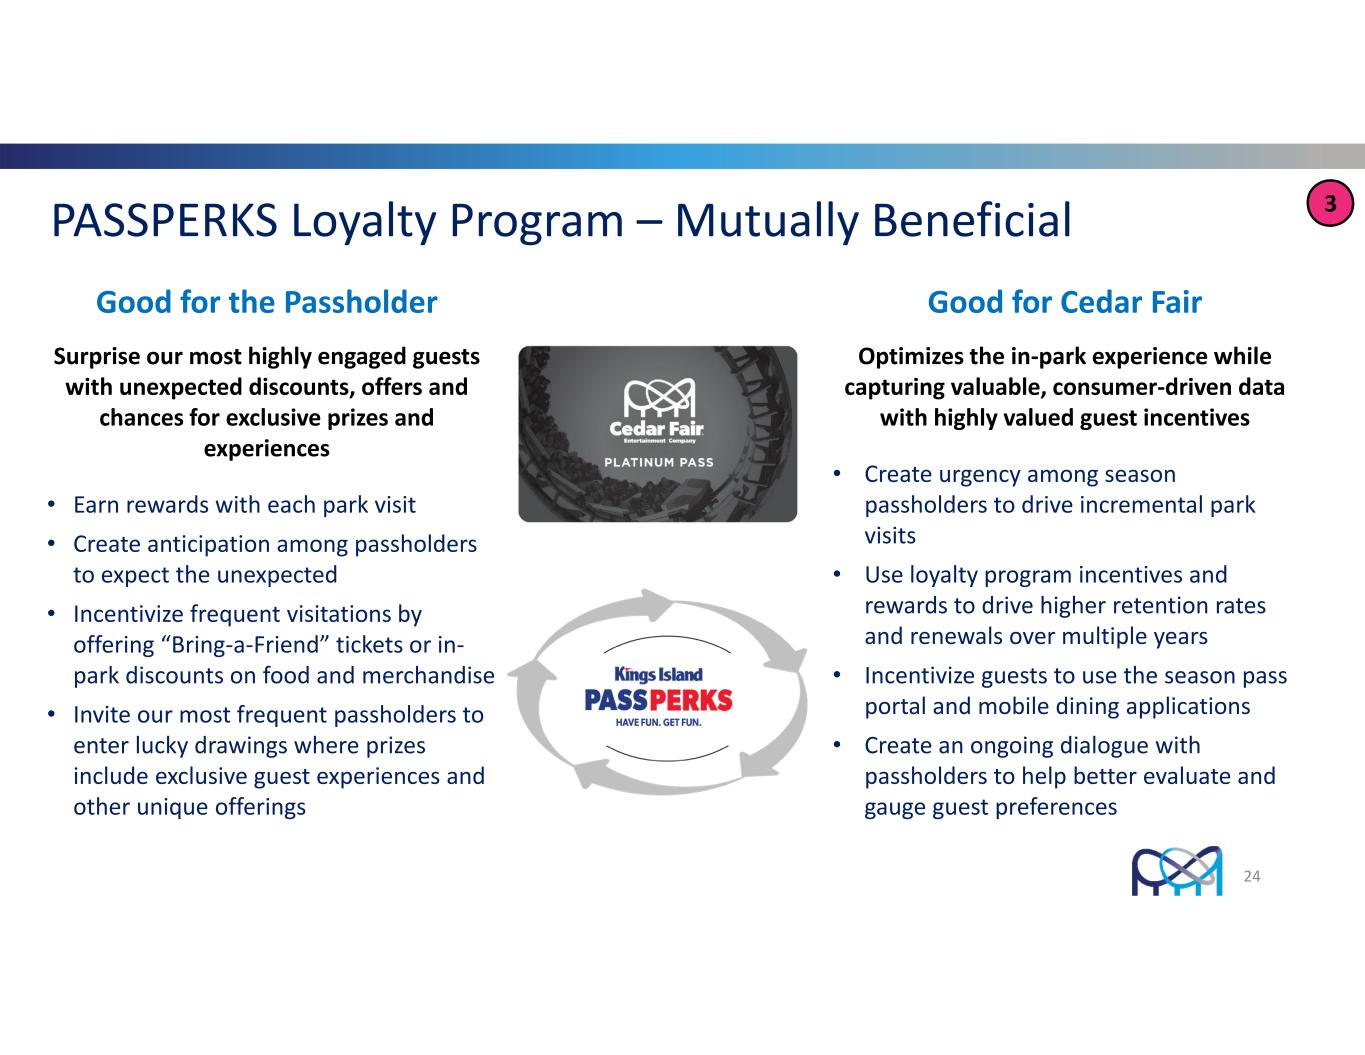
PASSPERKS Loyalty Program – Mutually Beneficial Good for the Passholder Surprise our most highly engaged guests with unexpected discounts, offers and chances for exclusive prizes and experiences • Earn rewards with each park visit • Create anticipation among passholders to expect the unexpected • Incentivize frequent visitations by offering “Bring‐a‐Friend” tickets or in‐ park discounts on food and merchandise • Invite our most frequent passholders to enter lucky drawings where prizes include exclusive guest experiences and other unique offerings Good for Cedar Fair Optimizes the in‐park experience while capturing valuable, consumer‐driven data with highly valued guest incentives • Create urgency among season passholders to drive incremental park visits • Use loyalty program incentives and rewards to drive higher retention rates and renewals over multiple years • Incentivize guests to use the season pass portal and mobile dining applications • Create an ongoing dialogue with passholders to help better evaluate and gauge guest preferences 24 3
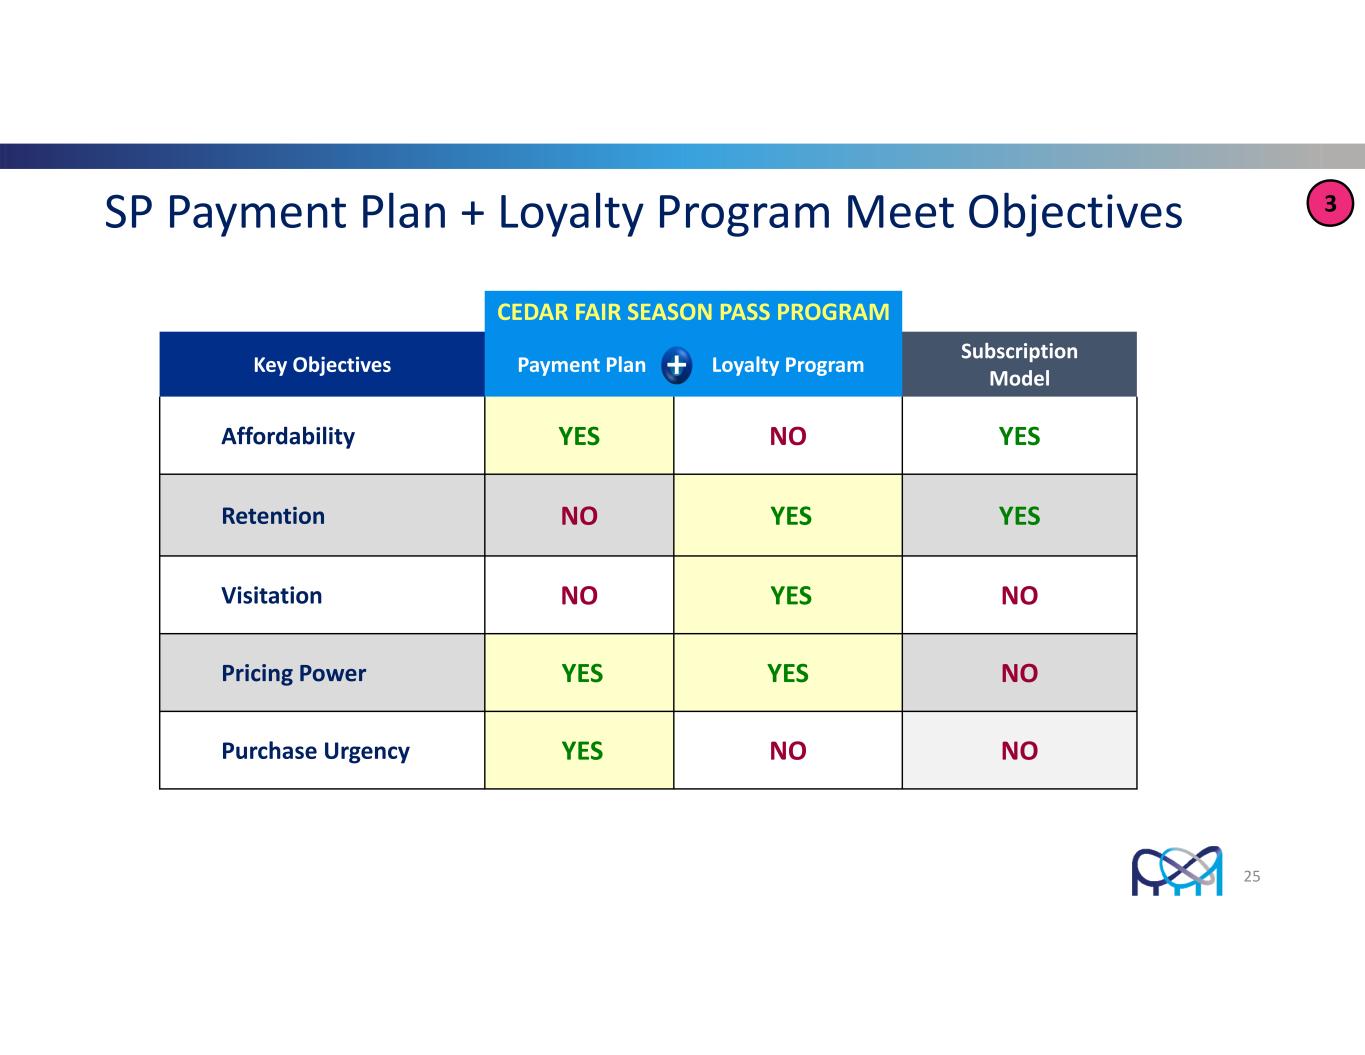
SP Payment Plan + Loyalty Program Meet Objectives CEDAR FAIR SEASON PASS PROGRAM Key Objectives Payment Plan Loyalty Program Subscription Model Affordability YES NO YES Retention NO YES YES Visitation NO YES NO Pricing Power YES YES NO Purchase Urgency YES NO NO + 25 3
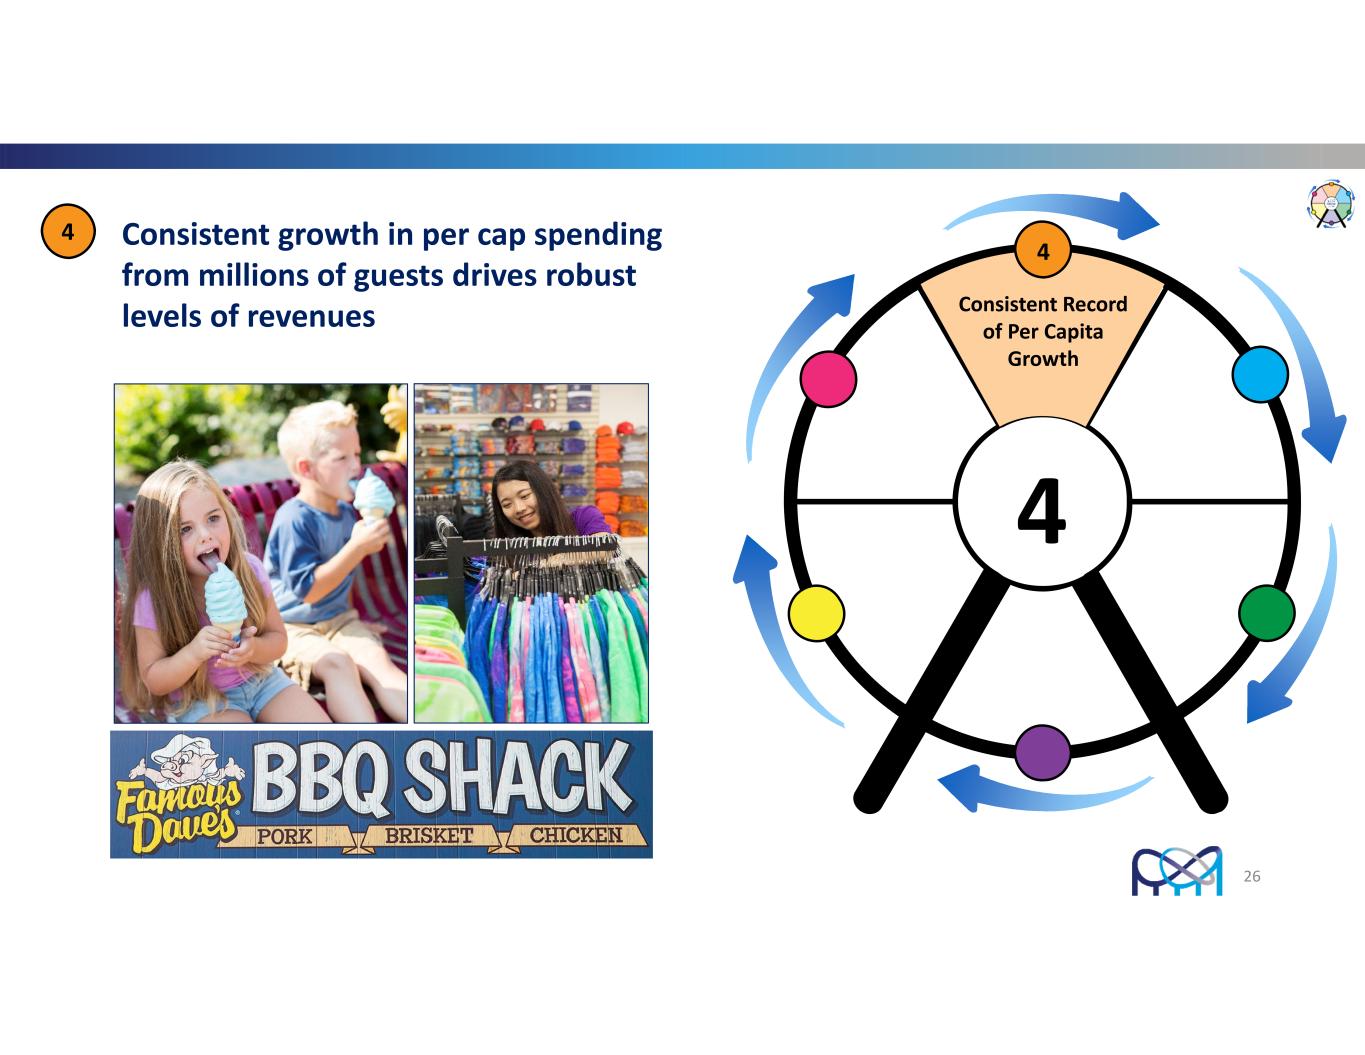
26 1 Consistent growth in per cap spending from millions of guests drives robust levels of revenues 4 4 4 Consistent Record of Per Capita Growth

27 48‐Year Growth of In‐Park Per Capita Spending $45.54 $46.20 $46.90 $47.30 $47.69 $48.32 $46.38 $62.03 $30.00 $35.00 $40.00 $45.00 $50.00 $55.00 $60.00 $65.00 10,000,000 12,000,000 14,000,000 16,000,000 18,000,000 20,000,000 22,000,000 24,000,000 26,000,000 28,000,000 30,000,000 2014 2015 2016 2017 2018 2019 2020 2021 In ‐p ar k pe r c ap ita At te nd an ce Attendance In‐park per capita spending (2) Co vi d D is ru pt io n (1) 2020 attendance was 2.6 million (1) (1) (2) COVID disruption continued in 2021, delaying park openings and restricting capacity for part or all the 2021 season
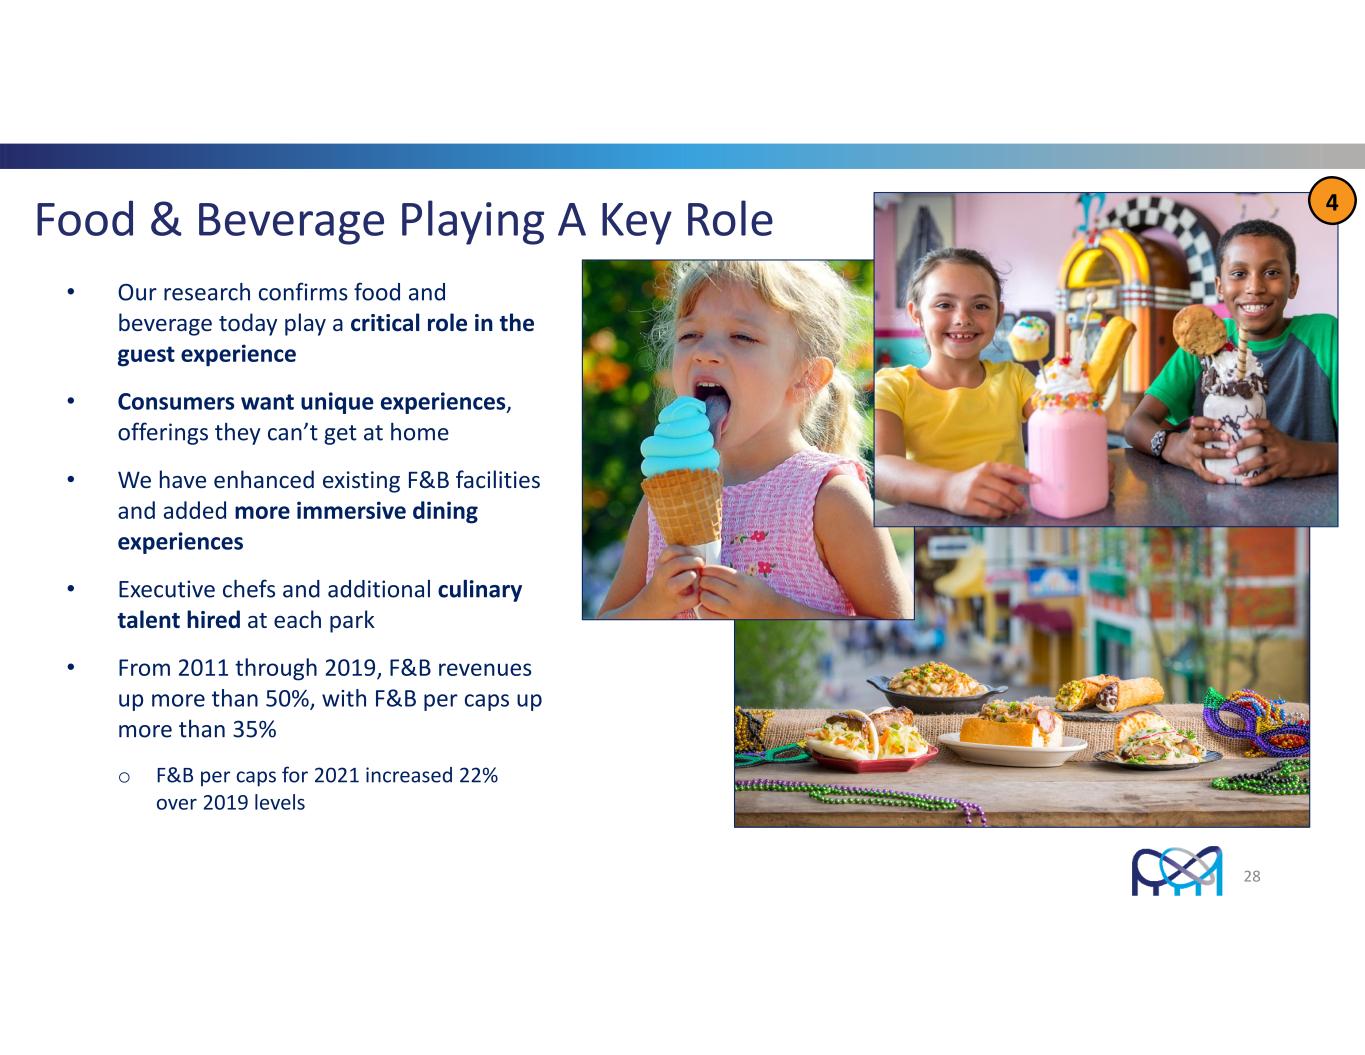
Food & Beverage Playing A Key Role • Our research confirms food and beverage today play a critical role in the guest experience • Consumers want unique experiences, offerings they can’t get at home • We have enhanced existing F&B facilities and added more immersive dining experiences • Executive chefs and additional culinary talent hired at each park • From 2011 through 2019, F&B revenues up more than 50%, with F&B per caps up more than 35% o F&B per caps for 2021 increased 22% over 2019 levels 28 4

The Changing Landscape of In‐Park Food & Beverage 29 4

30 Ongoing development of adjacent offerings at our properties expands market draw, extends length of stay, and supplements revenue growth at the parks 5 5Growing adjacent development base 5
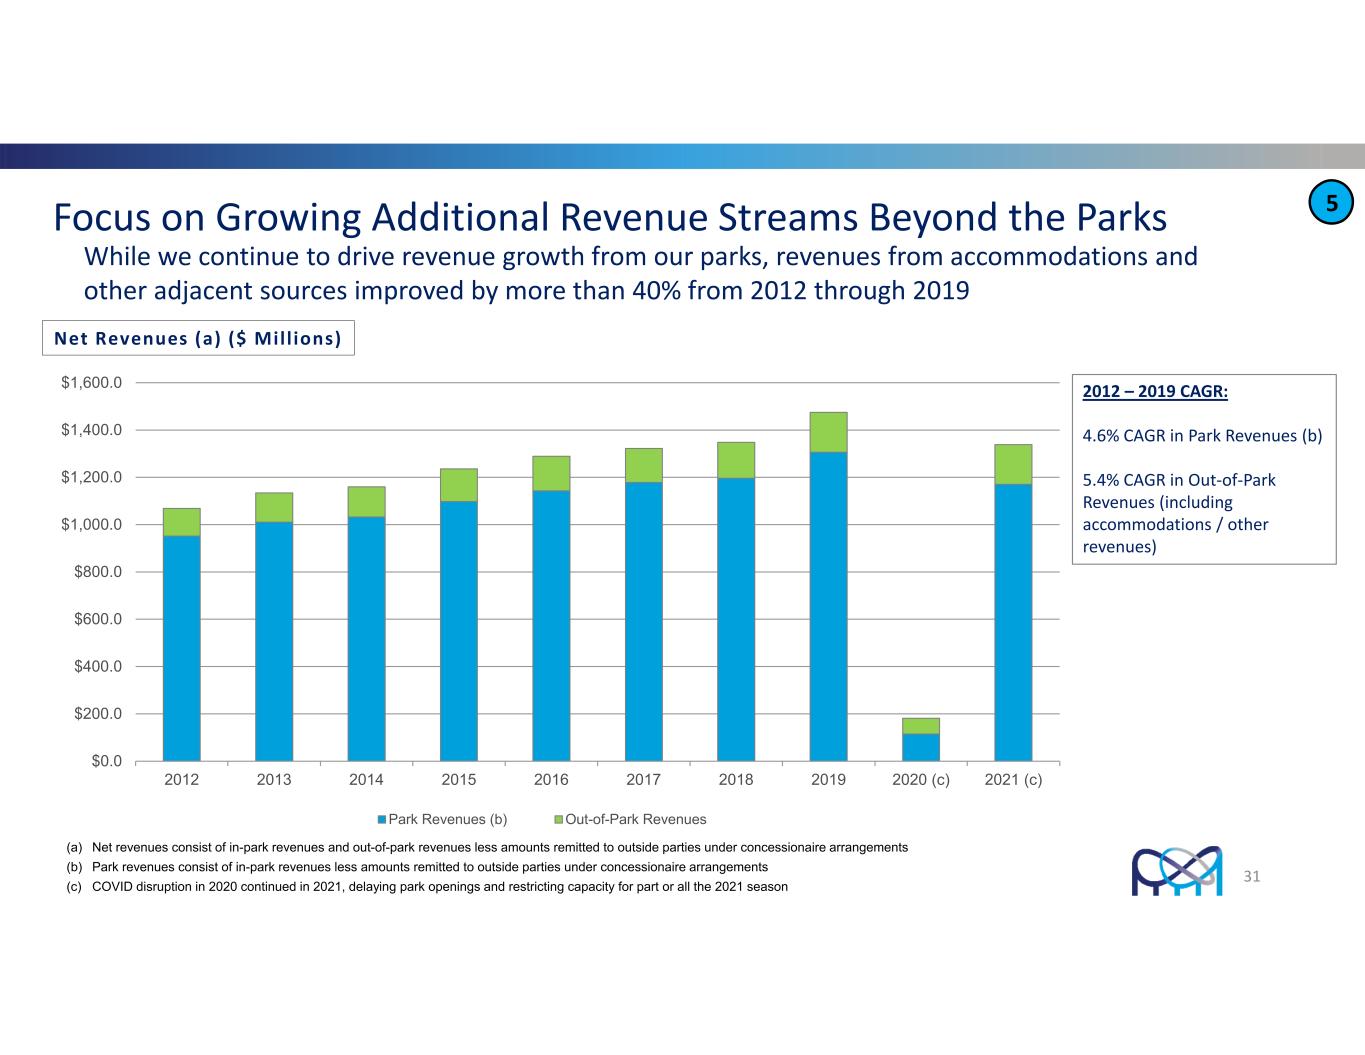
Focus on Growing Additional Revenue Streams Beyond the Parks $0.0 $200.0 $400.0 $600.0 $800.0 $1,000.0 $1,200.0 $1,400.0 $1,600.0 2012 2013 2014 2015 2016 2017 2018 2019 2020 (c) 2021 (c) Park Revenues (b) Out-of-Park Revenues 31 While we continue to drive revenue growth from our parks, revenues from accommodations and other adjacent sources improved by more than 40% from 2012 through 2019 Net Revenues (a) ($ Mill ions) 2012 – 2019 CAGR: 4.6% CAGR in Park Revenues (b) 5.4% CAGR in Out‐of‐Park Revenues (including accommodations / other revenues) 5 (a) Net revenues consist of in-park revenues and out-of-park revenues less amounts remitted to outside parties under concessionaire arrangements (b) Park revenues consist of in-park revenues less amounts remitted to outside parties under concessionaire arrangements (c) COVID disruption in 2020 continued in 2021, delaying park openings and restricting capacity for part or all the 2021 season
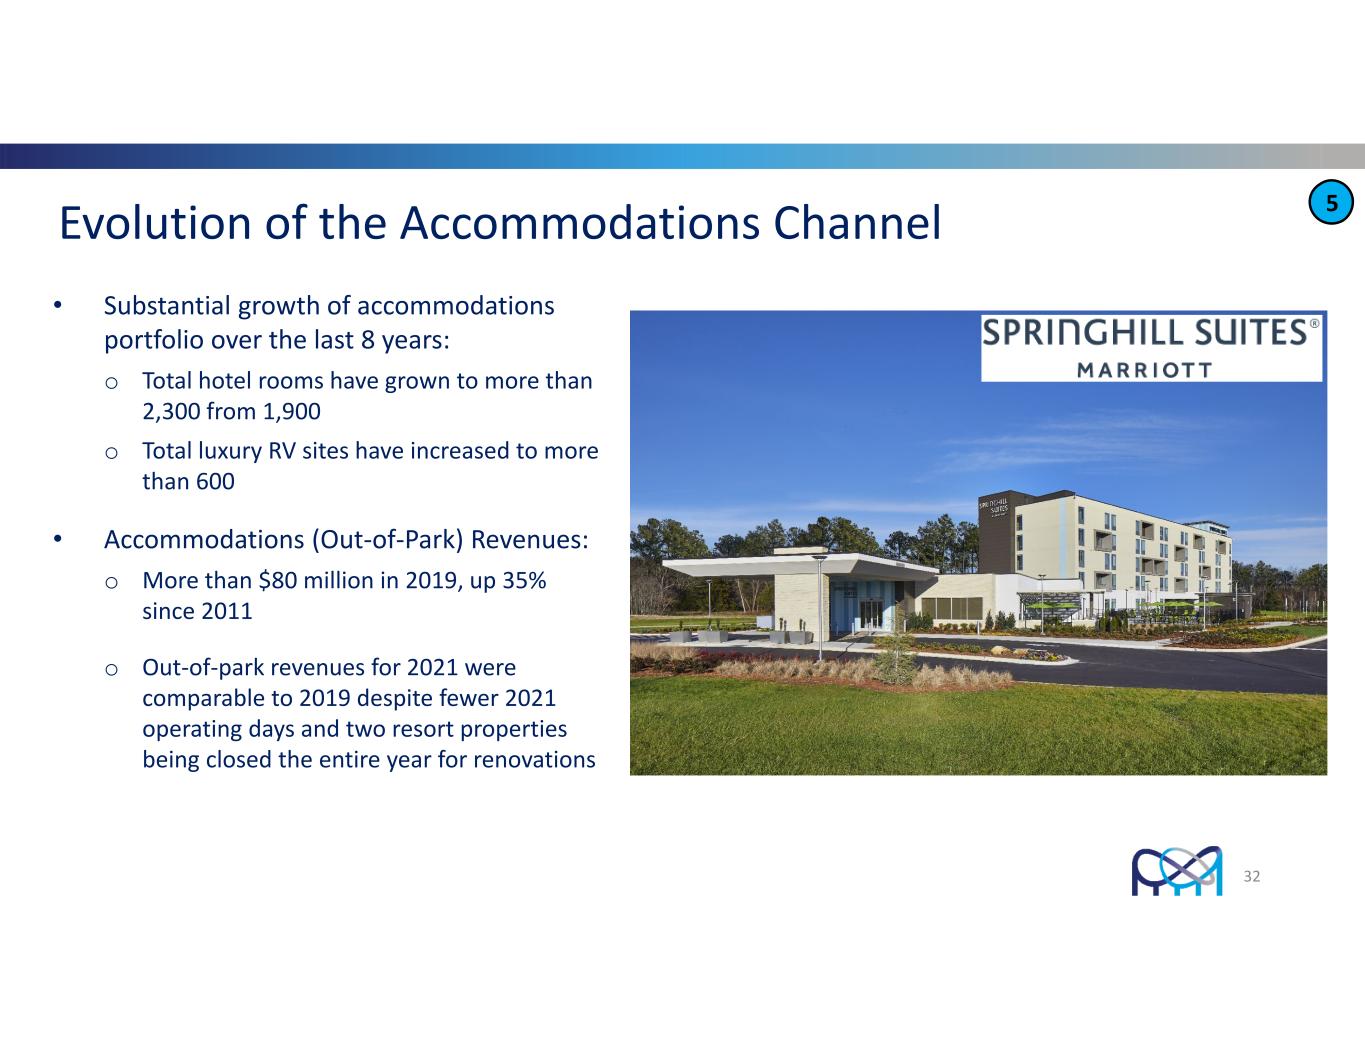
Evolution of the Accommodations Channel • Substantial growth of accommodations portfolio over the last 8 years: o Total hotel rooms have grown to more than 2,300 from 1,900 o Total luxury RV sites have increased to more than 600 • Accommodations (Out‐of‐Park) Revenues: o More than $80 million in 2019, up 35% since 2011 o Out‐of‐park revenues for 2021 were comparable to 2019 despite fewer 2021 operating days and two resort properties being closed the entire year for renovations 32 5
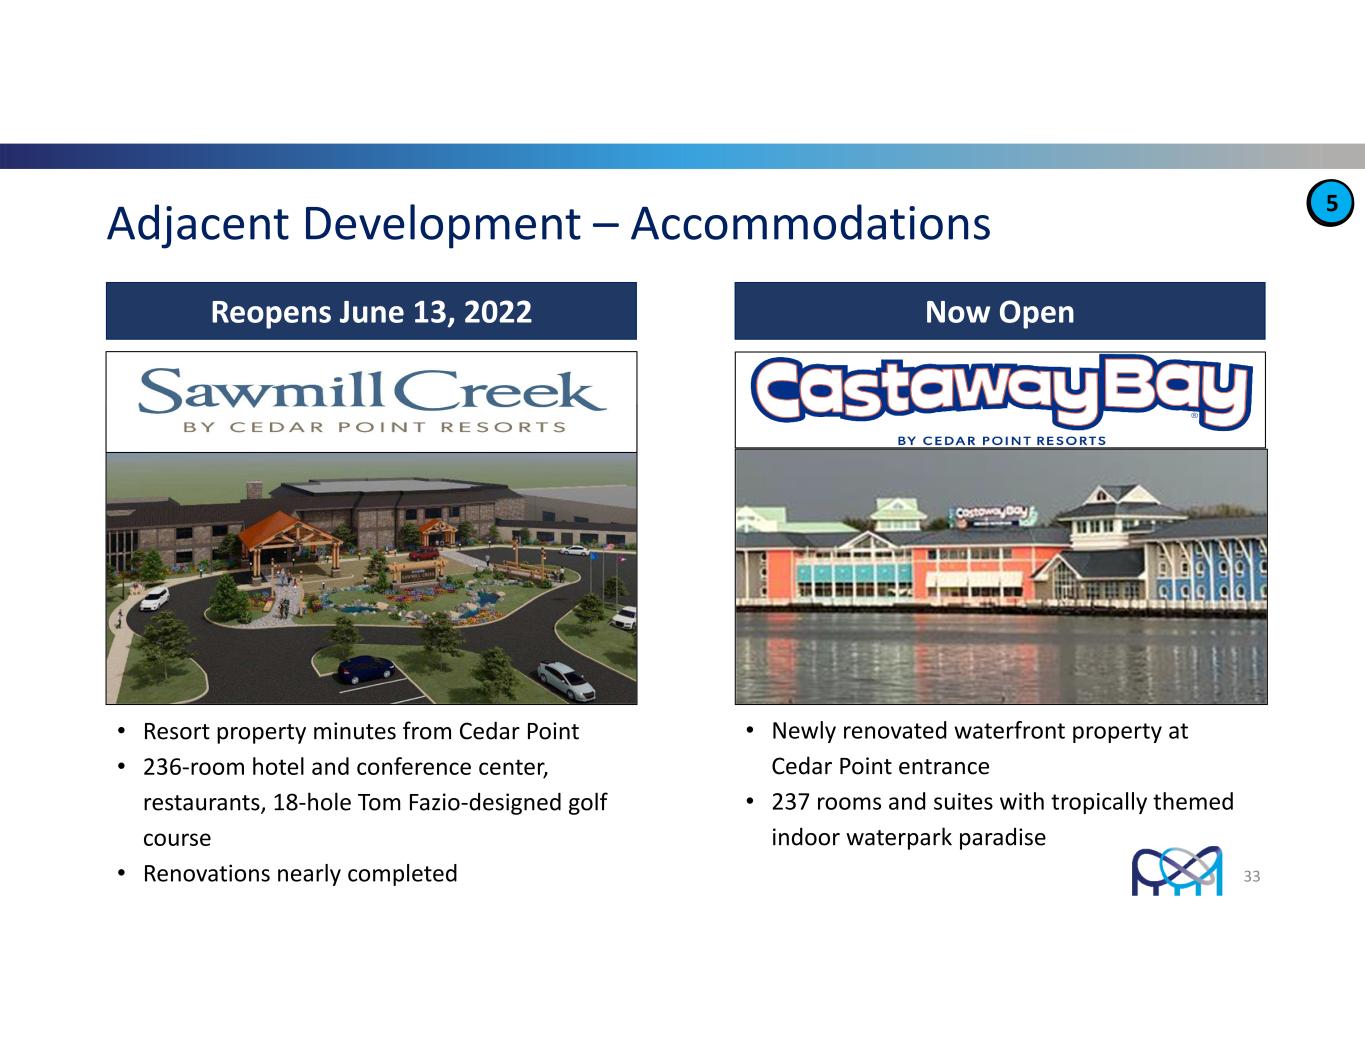
• Newly renovated waterfront property at Cedar Point entrance • 237 rooms and suites with tropically themed indoor waterpark paradise • Resort property minutes from Cedar Point • 236‐room hotel and conference center, restaurants, 18‐hole Tom Fazio‐designed golf course • Renovations nearly completed Adjacent Development – Accommodations Reopens June 13, 2022 33 3 Now Open 5

34 Cedar Point Sports Center Indoor Center • Opened January 2020 • 145,000 square feet • Court space accommodates 10 basketball courts and 20 volleyball courts • AAU basketball, JO volleyball, wrestling, cheer, gymnastics Outdoor Facility • Opened March 2017 • 10 multi‐use fields with clubhouse • Baseball, softball, soccer, lacrosse • Performance continues to pace well ahead of the original pro‐forma model 5

35 1 Steadily growing top‐line revenues and disciplined cost management results in meaningful free‐cash‐flow generation 6 6 Compelling free‐cash‐ flow generation 6 • Prior to the disruption of the pandemic, Cedar Fair has demonstrated the ability to pay a compelling, sustainable, and growing quarterly distribution to unitholders • Our partnership distributions represent a tax‐advantaged return of capital for unitholders which offer an outsized yield opportunity
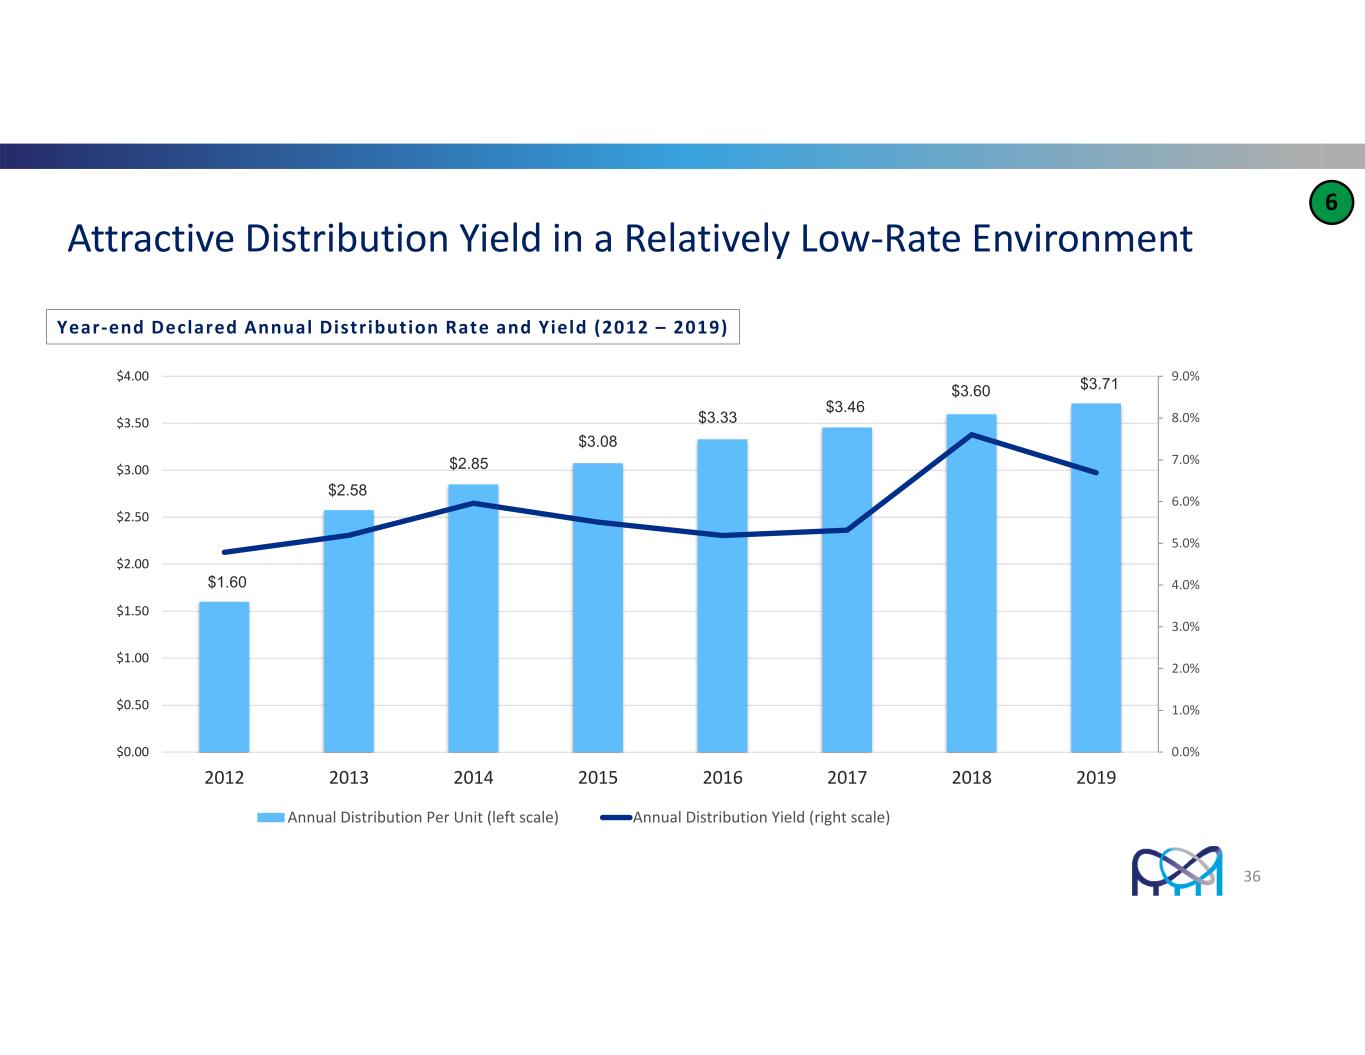
Attractive Distribution Yield in a Relatively Low‐Rate Environment $1.60 $2.58 $2.85 $3.08 $3.33 $3.46 $3.60 $3.71 0.0% 1.0% 2.0% 3.0% 4.0% 5.0% 6.0% 7.0% 8.0% 9.0% $0.00 $0.50 $1.00 $1.50 $2.00 $2.50 $3.00 $3.50 $4.00 2012 2013 2014 2015 2016 2017 2018 2019 Annual Distribution Per Unit (left scale) Annual Distribution Yield (right scale) Year‐end Declared Annual Distribution Rate and Yield (2012 – 2019) 36 6
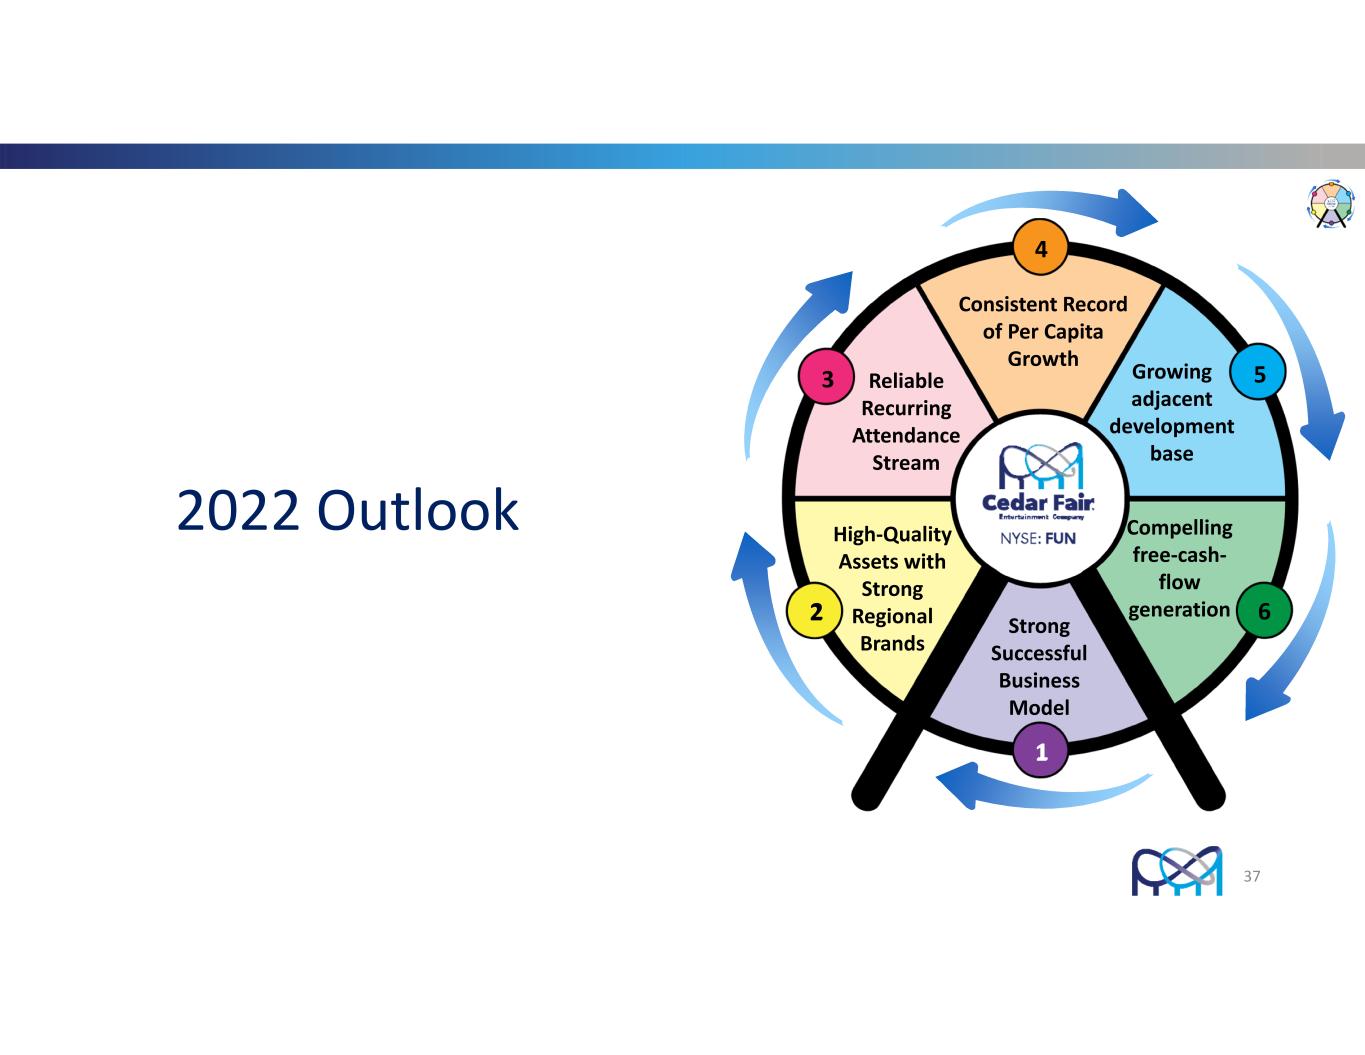
37 2022 Outlook Strong Successful Business Model 1 2 3 4 5 6 High‐Quality Assets with Strong Regional Brands Consistent Record of Per Capita Growth Reliable Recurring Attendance Stream Compelling free‐cash‐ flow generation Growing adjacent development base
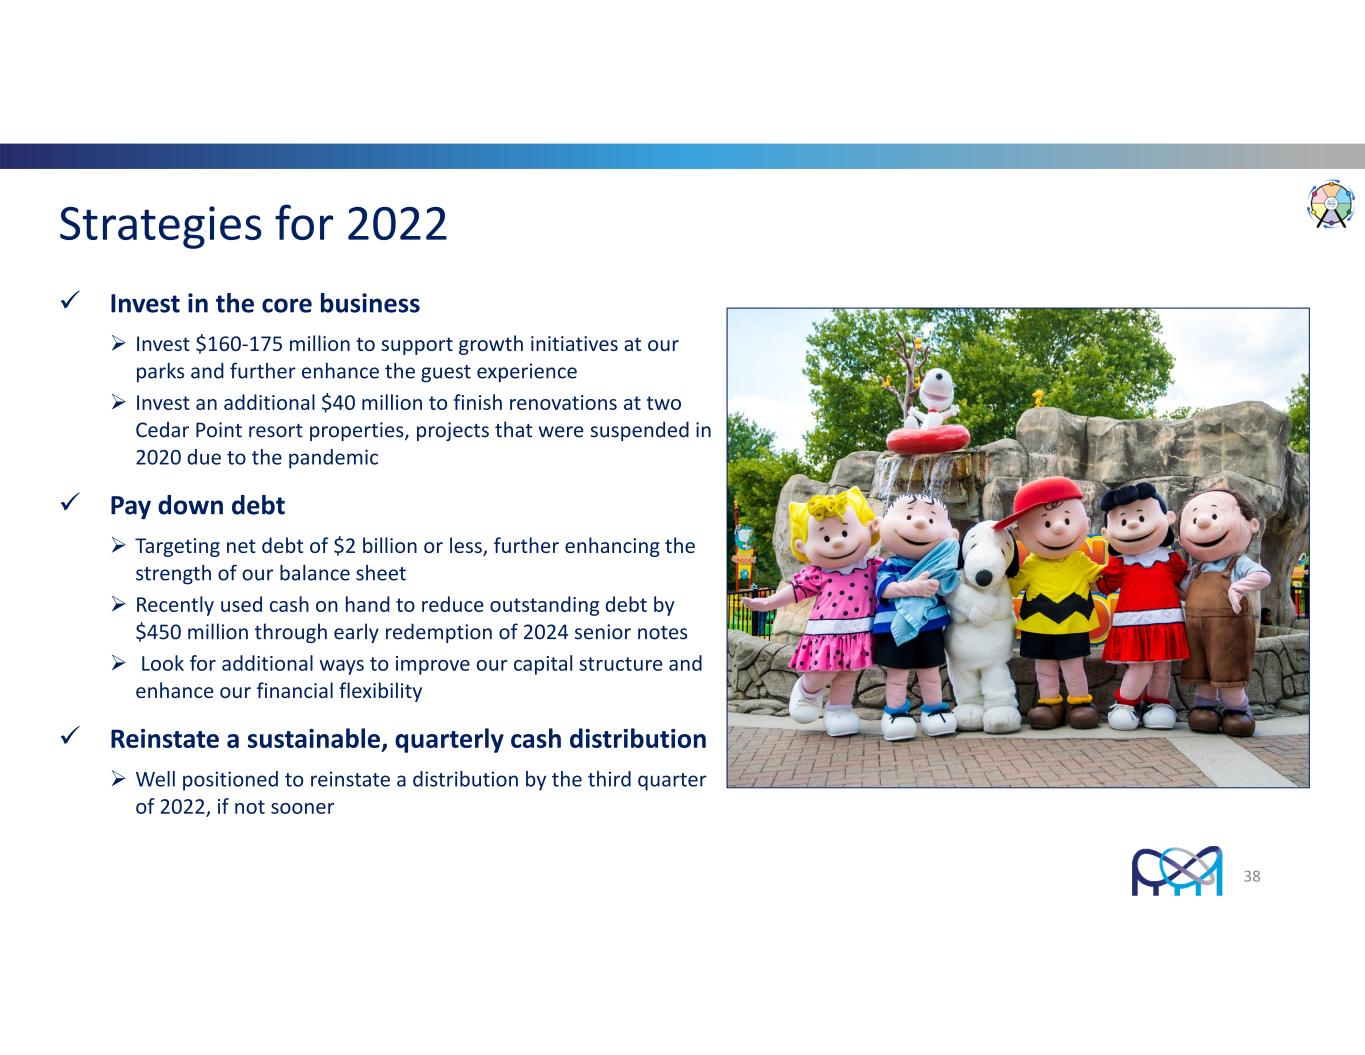
Invest in the core business Invest $160‐175 million to support growth initiatives at our parks and further enhance the guest experience Invest an additional $40 million to finish renovations at two Cedar Point resort properties, projects that were suspended in 2020 due to the pandemic Pay down debt Targeting net debt of $2 billion or less, further enhancing the strength of our balance sheet Recently used cash on hand to reduce outstanding debt by $450 million through early redemption of 2024 senior notes Look for additional ways to improve our capital structure and enhance our financial flexibility Reinstate a sustainable, quarterly cash distribution Well positioned to reinstate a distribution by the third quarter of 2022, if not sooner Strategies for 2022 38
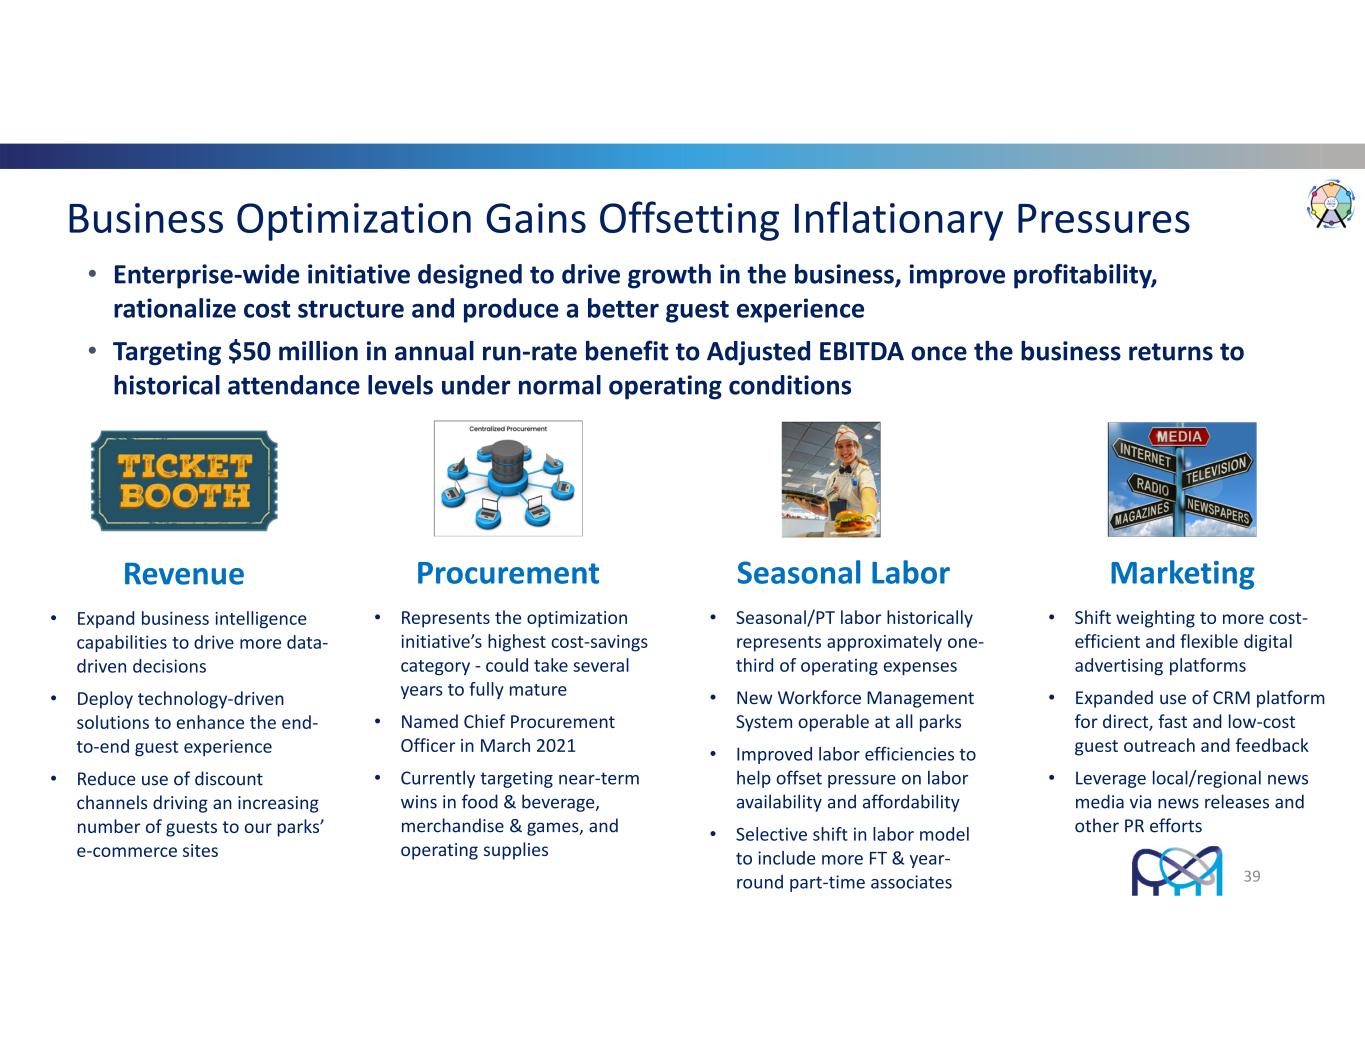
Business Optimization Gains Offsetting Inflationary Pressures • Enterprise‐wide initiative designed to drive growth in the business, improve profitability, rationalize cost structure and produce a better guest experience • Targeting $50 million in annual run‐rate benefit to Adjusted EBITDA once the business returns to historical attendance levels under normal operating conditions 39 Revenue • Expand business intelligence capabilities to drive more data‐ driven decisions • Deploy technology‐driven solutions to enhance the end‐ to‐end guest experience • Reduce use of discount channels driving an increasing number of guests to our parks’ e‐commerce sites Procurement • Represents the optimization initiative’s highest cost‐savings category ‐ could take several years to fully mature • Named Chief Procurement Officer in March 2021 • Currently targeting near‐term wins in food & beverage, merchandise & games, and operating supplies Seasonal Labor • Seasonal/PT labor historically represents approximately one‐ third of operating expenses • New Workforce Management System operable at all parks • Improved labor efficiencies to help offset pressure on labor availability and affordability • Selective shift in labor model to include more FT & year‐ round part‐time associates Marketing • Shift weighting to more cost‐ efficient and flexible digital advertising platforms • Expanded use of CRM platform for direct, fast and low‐cost guest outreach and feedback • Leverage local/regional news media via news releases and other PR efforts

Balance Sheet and Liquidity Well Positioned for 2022 • Deferred revenues totaled $234 million as of March 27, 2022 • Represents an increase of $36 million, or 18%, when compared to deferred revenues at Dec. 31, 2021 • Through the end of April 2022, season pass sales were up $59 million compared to sales in the comparable timeframe in 2019 • The strong year‐over‐year performance was driven by a 22% increase in units sold and a 10% increase in the average season pass price • Sales of all‐season “add‐on” products are up $17 million versus the comparative timeframe in 2019 • Liquidity position totaled approximately $284 million as of March 27, 2022 • At the end of the 2022 first quarter, cash on hand totaled $50 million with $234 million available under the revolver, net of $125 million of outstanding borrowings and $16 million of letters of credit • Redeemed 2024 senior notes ($450 million) in December 2021 • Early redemption of notes reduces annual cash interest by approximately $25 million • Anticipate $145‐150 million in annual cash interest in 2022, of which 75% of payments occur in the 2nd and 4th quarters 40

Debt Maturities – Capital Structure Strengthened in 2021 Amounts in Millions Total debt outstanding of ~$2.6B at 3/27/22 after early redemption of $450 million of 2024 bonds in December 2021 Cash on hand totaled $50M at 3/27/22 with $234 million available under the revolver, net of $125 million of outstanding borrowings and $16 million of letters of credit 2022‐Q1 cash interest payments totaled $16M Full‐year 2022 cash interest costs projected to be approximately $145‐150M $300 $264 $1,000 $500 $300 $500 $- $300 $600 $900 $1,200 2022 2023 2024 2025 2026 2027 2028 2029 Revolver Capacity Term Debt Senior Notes 41
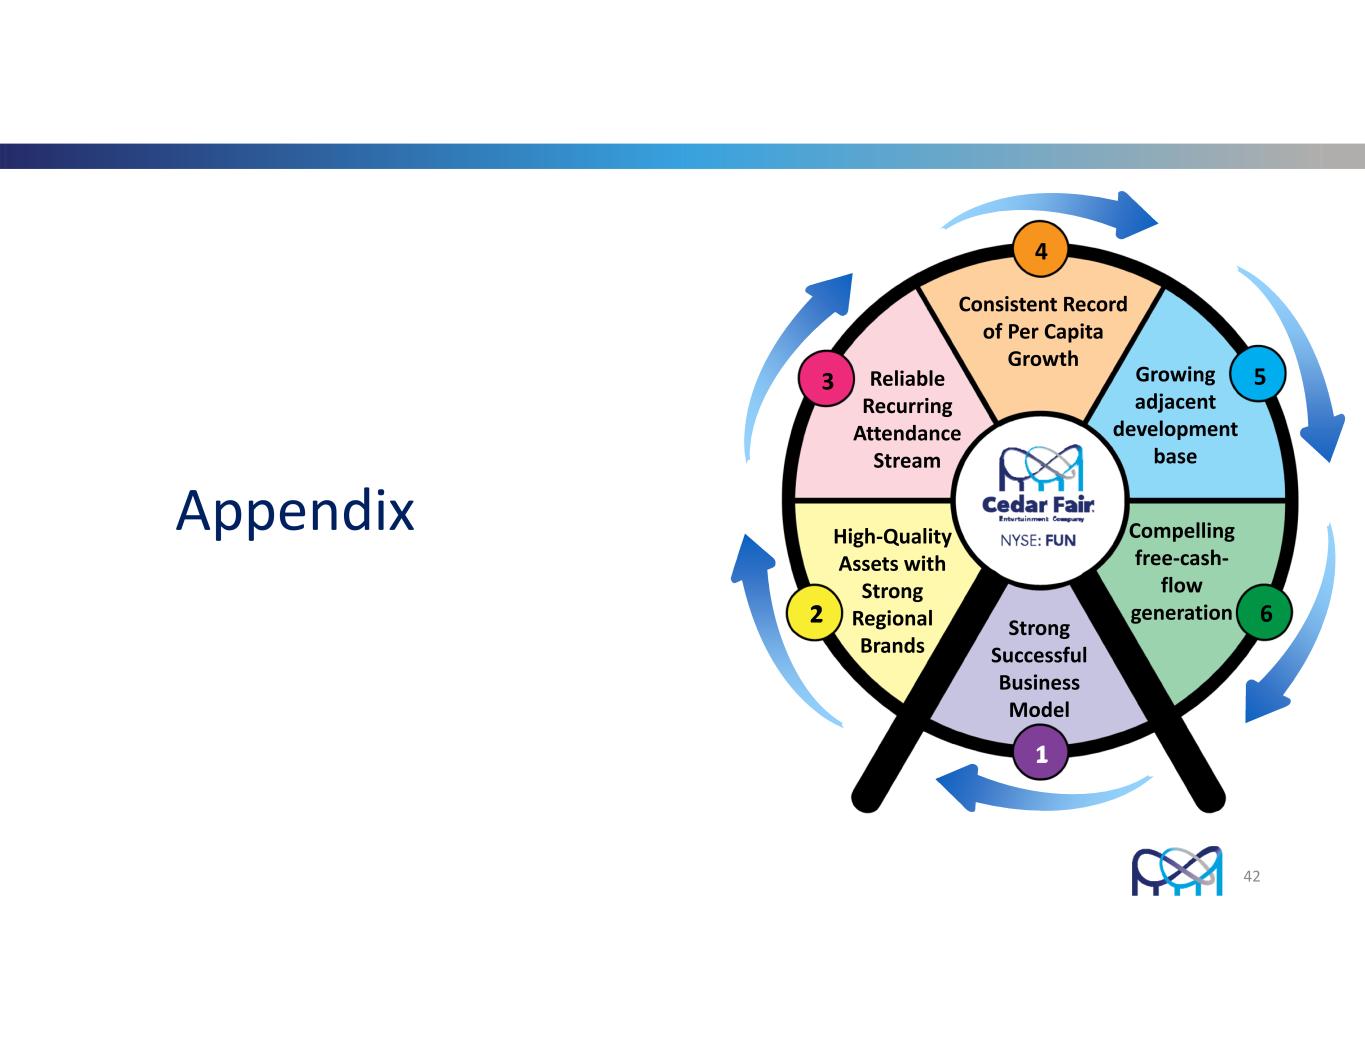
42 Appendix Strong Successful Business Model 1 2 3 4 5 6 High‐Quality Assets with Strong Regional Brands Consistent Record of Per Capita Growth Reliable Recurring Attendance Stream Compelling free‐cash‐ flow generation Growing adjacent development base

Adjusted EBITDA Reconciliation 43


