Investor Presentation November 2022
Some of the information in this presentation that is not historical in nature constitutes “forward‐looking statements” within the meaning of Section 27A of the Securities Act of 1933 and Section 21E of the Securities Exchange Act of 1934, including statements as to the Company's expectations, beliefs, goals and strategies regarding the future. These forward‐looking statements may involve risks and uncertainties that are difficult to predict, may be beyond our control and could cause actual results to differ materially from those described in such statements. Although the Company believes that the expectations reflected in such forward‐looking statements are reasonable, it can give no assurance that such expectations will prove to be correct, including the timing of any debt paydown or payment of partnership distributions, or that the Company’s growth strategies will achieve the targeted results. Important factors, including the impacts of the COVID‐19 pandemic, general economic conditions, adverse weather conditions, competition for consumer leisure time and spending, unanticipated construction delays, changes in the Company’s capital investment plans and projects and other factors discussed from time to time by the Company in its reports filed with the Securities and Exchange Commission (the “SEC”) could affect attendance at the Company’s parks, as well as the timing of any debt paydown or payment of partnership distributions, and cause actual results to differ materially from the Company's expectations or otherwise to fluctuate or decrease. Additional information on risk factors that may affect the business and financial results of the Company can be found in the Company's Annual Report on Form 10‐K and in the filings of the Company made from time to time with the SEC. The Company undertakes no obligation to publicly update or revise any forward‐looking statements, whether as a result of new information, future events, information, circumstances or otherwise that arise after the publication of this document. Forward‐Looking Statements 2

FUN Overview 3
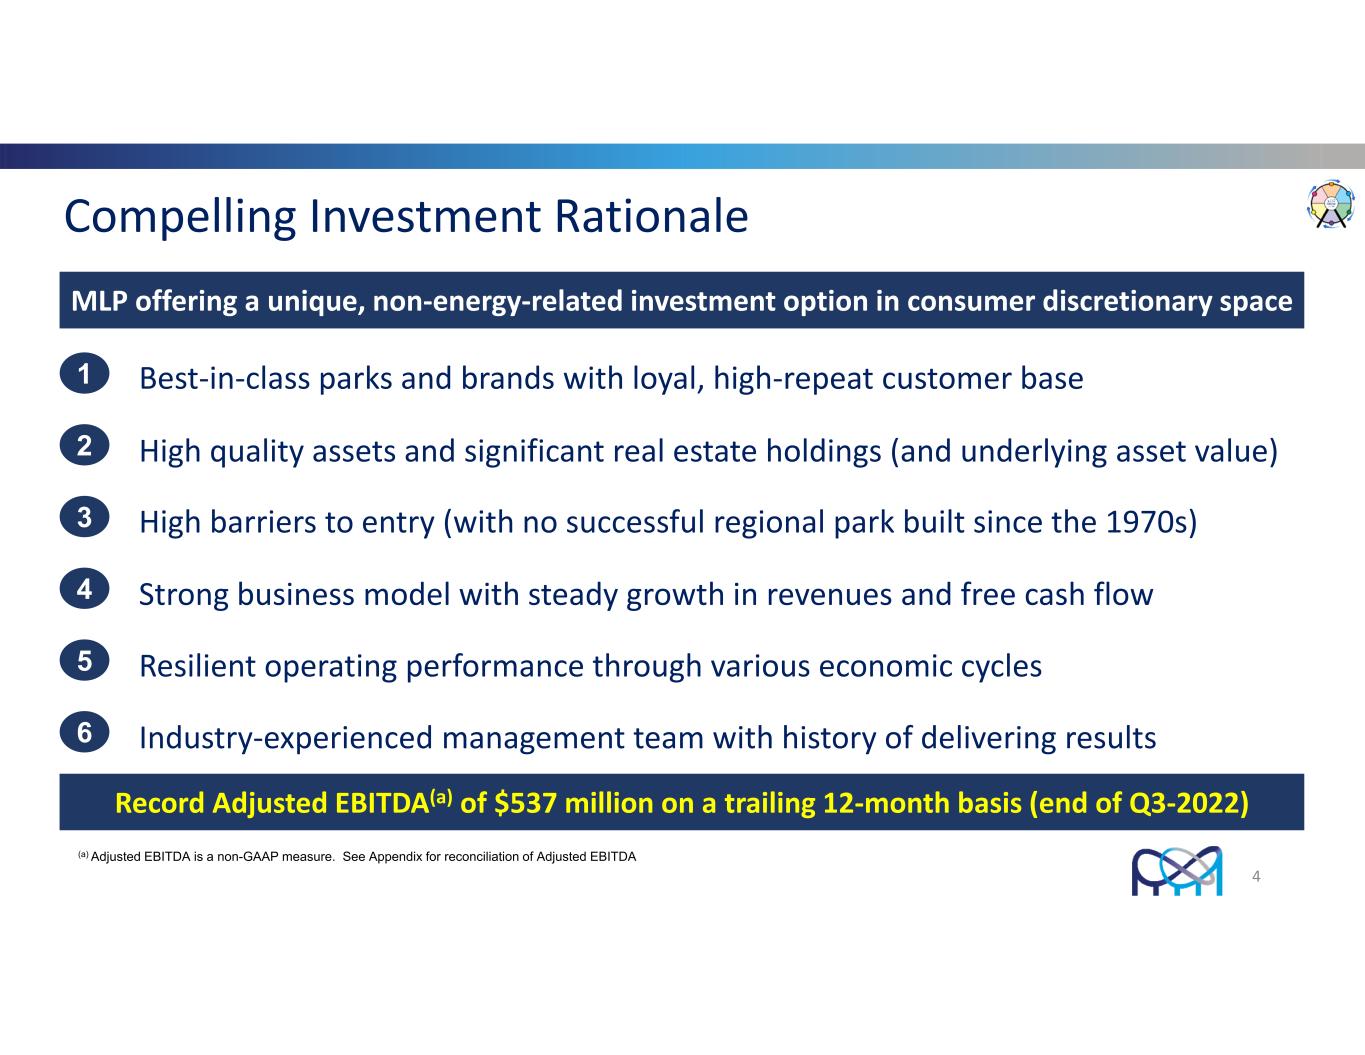
Compelling Investment Rationale 1 2 Best‐in‐class parks and brands with loyal, high‐repeat customer base 3 High barriers to entry (with no successful regional park built since the 1970s) 4 Resilient operating performance through various economic cycles 6 Industry‐experienced management team with history of delivering results High quality assets and significant real estate holdings (and underlying asset value) Strong business model with steady growth in revenues and free cash flow 5 MLP offering a unique, non‐energy‐related investment option in consumer discretionary space Record Adjusted EBITDA(a) of $537 million on a trailing 12‐month basis (end of Q3‐2022) 4 (a) Adjusted EBITDA is a non-GAAP measure. See Appendix for reconciliation of Adjusted EBITDA

5 Industry Savvy Executive Team Richard Zimmerman CEO Tim Fisher COO Brian Witherow CFO Kelley Ford CMO Dave Hoffman CAO Brian Nurse CLO

Please note: The COVID‐19 pandemic and corresponding market disruption had a material impact on Cedar Fair’s results in 2020 and 2021. In May 2021, the Company opened all its U.S. properties for the 2021 operating season on a staggered basis with capacity restrictions, guest reservations, and other operating protocols in place. The Company’s Canadian property, Canada’s Wonderland, reopened in July 2021, and the park operated with capacity restrictions in place throughout 2021. By comparison, all Company parks returned to their full operating calendars for the 2022 season without any operating restrictions. As planned, five of 13 properties opened in the first quarter of 2022, with the remainder opening in the second quarter. Given the material impact the coronavirus pandemic had on park operations in 2020 and 2021, year‐to‐date results for 2022 are not directly comparable to the last two years, which is why in some instances comparisons to 2019 are used instead. Data Comparisons Used for this Presentation 6
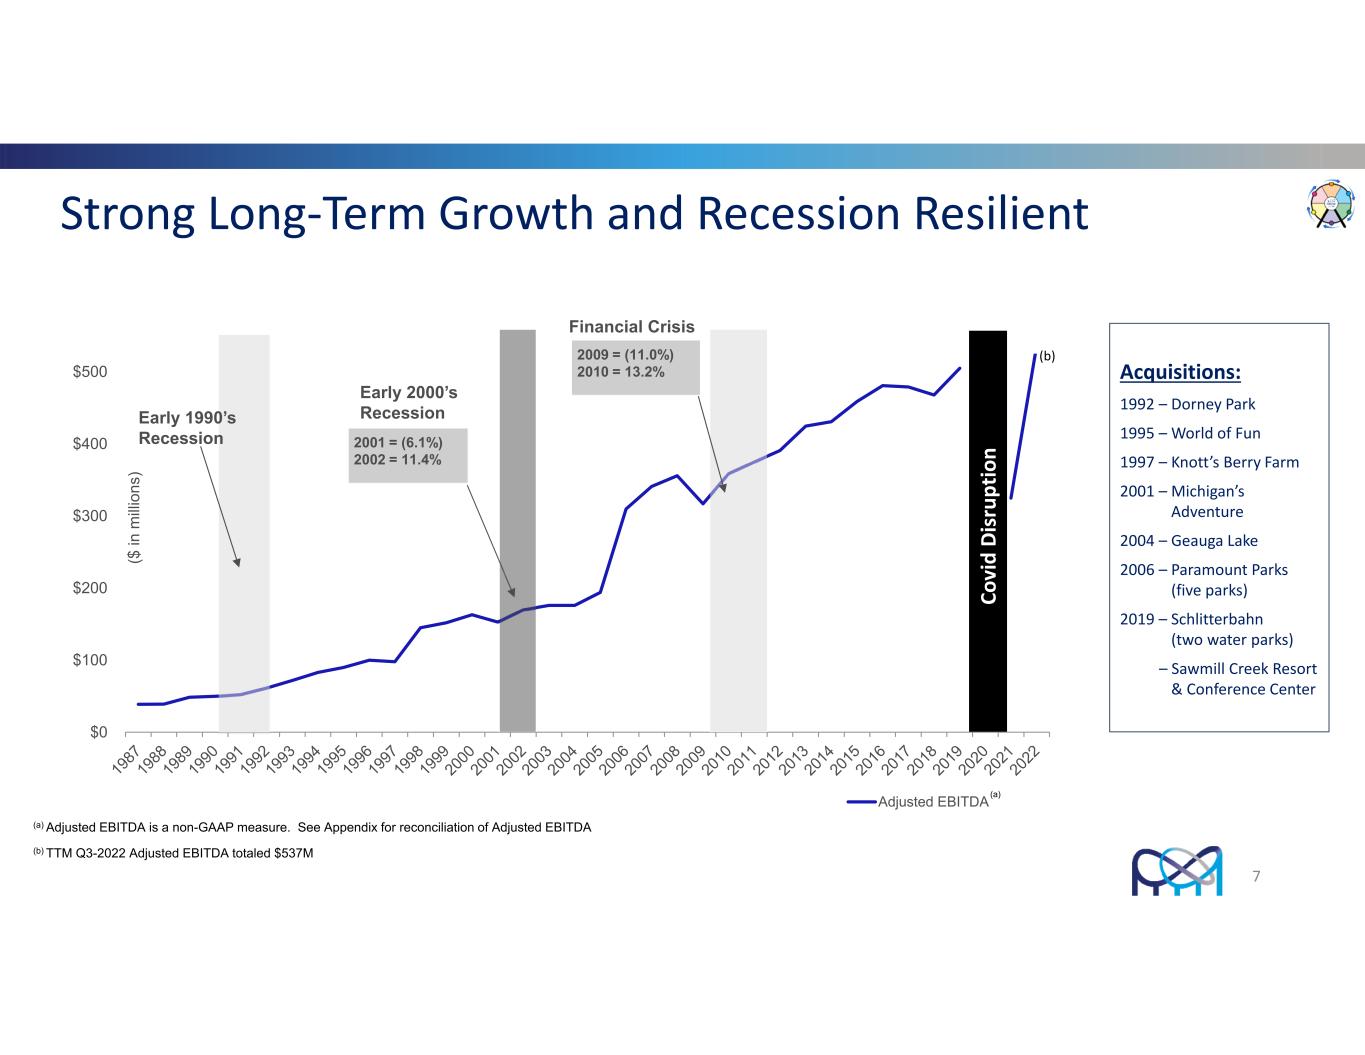
Strong Long‐Term Growth and Recession Resilient Acquisitions: 1992 – Dorney Park 1995 – World of Fun 1997 – Knott’s Berry Farm 2001 – Michigan’s Adventure 2004 – Geauga Lake 2006 – Paramount Parks (five parks) 2019 – Schlitterbahn (two water parks) – Sawmill Creek Resort & Conference Center $0 $100 $200 $300 $400 $500 ($ in m illi on s) Adjusted EBITDA Financial Crisis 2001 = (6.1%) 2002 = 11.4% 2009 = (11.0%) 2010 = 13.2% Early 2000’s RecessionEarly 1990’s Recession (a) 7 C ov id D is ru pt io n (b) (b) TTM Q3-2022 Adjusted EBITDA totaled $537M (a) Adjusted EBITDA is a non-GAAP measure. See Appendix for reconciliation of Adjusted EBITDA
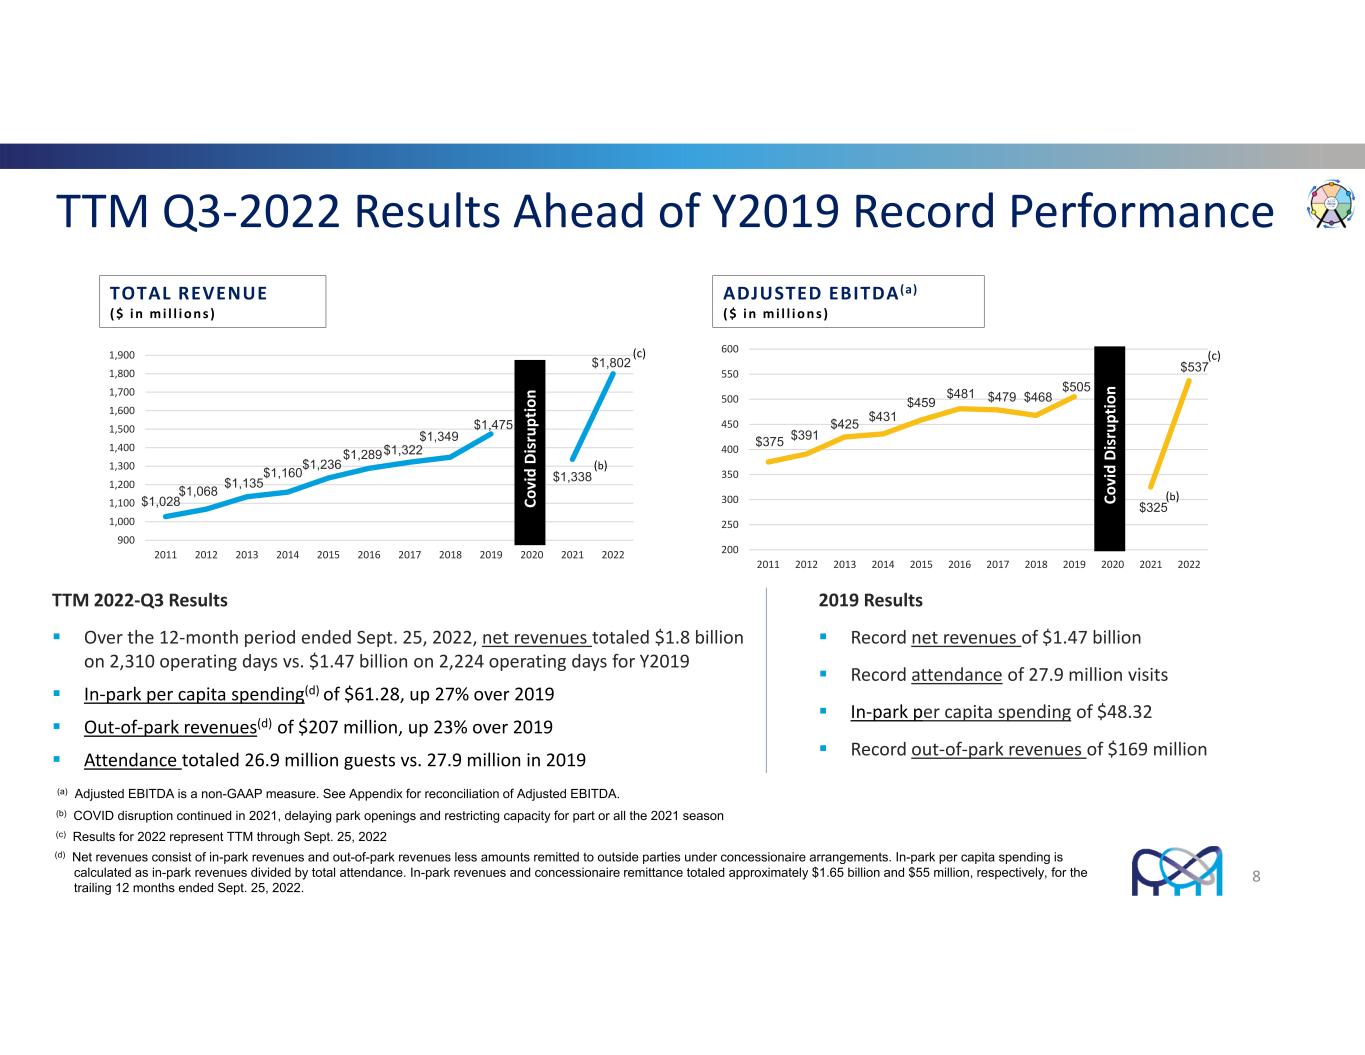
TTM Q3‐2022 Results Ahead of Y2019 Record Performance 2019 Results Record net revenues of $1.47 billion Record attendance of 27.9 million visits In‐park per capita spending of $48.32 Record out‐of‐park revenues of $169 million TTM 2022‐Q3 Results Over the 12‐month period ended Sept. 25, 2022, net revenues totaled $1.8 billion on 2,310 operating days vs. $1.47 billion on 2,224 operating days for Y2019 In‐park per capita spending(d) of $61.28, up 27% over 2019 Out‐of‐park revenues(d) of $207 million, up 23% over 2019 Attendance totaled 26.9 million guests vs. 27.9 million in 2019 ADJUSTED EBITDA(a) ($ i n mi l l i ons ) $1,028 $1,068 $1,135 $1,160$1,236 $1,289$1,322 $1,349 $1,475 $1,338 $1,802 900 1,000 1,100 1,200 1,300 1,400 1,500 1,600 1,700 1,800 1,900 2011 2012 2013 2014 2015 2016 2017 2018 2019 2020 2021 2022 TOTAL REVENUE ($ i n mi l l i ons ) $375 $391 $425 $431 $459 $481 $479 $468 $505 $325 $537 200 250 300 350 400 450 500 550 600 2011 2012 2013 2014 2015 2016 2017 2018 2019 2020 2021 2022 8 C ov id D is ru pt io n C ov id D is ru pt io n (b) (b) (c) (c) (a) Adjusted EBITDA is a non-GAAP measure. See Appendix for reconciliation of Adjusted EBITDA. (b) COVID disruption continued in 2021, delaying park openings and restricting capacity for part or all the 2021 season (c) Results for 2022 represent TTM through Sept. 25, 2022 (d) Net revenues consist of in-park revenues and out-of-park revenues less amounts remitted to outside parties under concessionaire arrangements. In-park per capita spending is calculated as in-park revenues divided by total attendance. In-park revenues and concessionaire remittance totaled approximately $1.65 billion and $55 million, respectively, for the trailing 12 months ended Sept. 25, 2022.
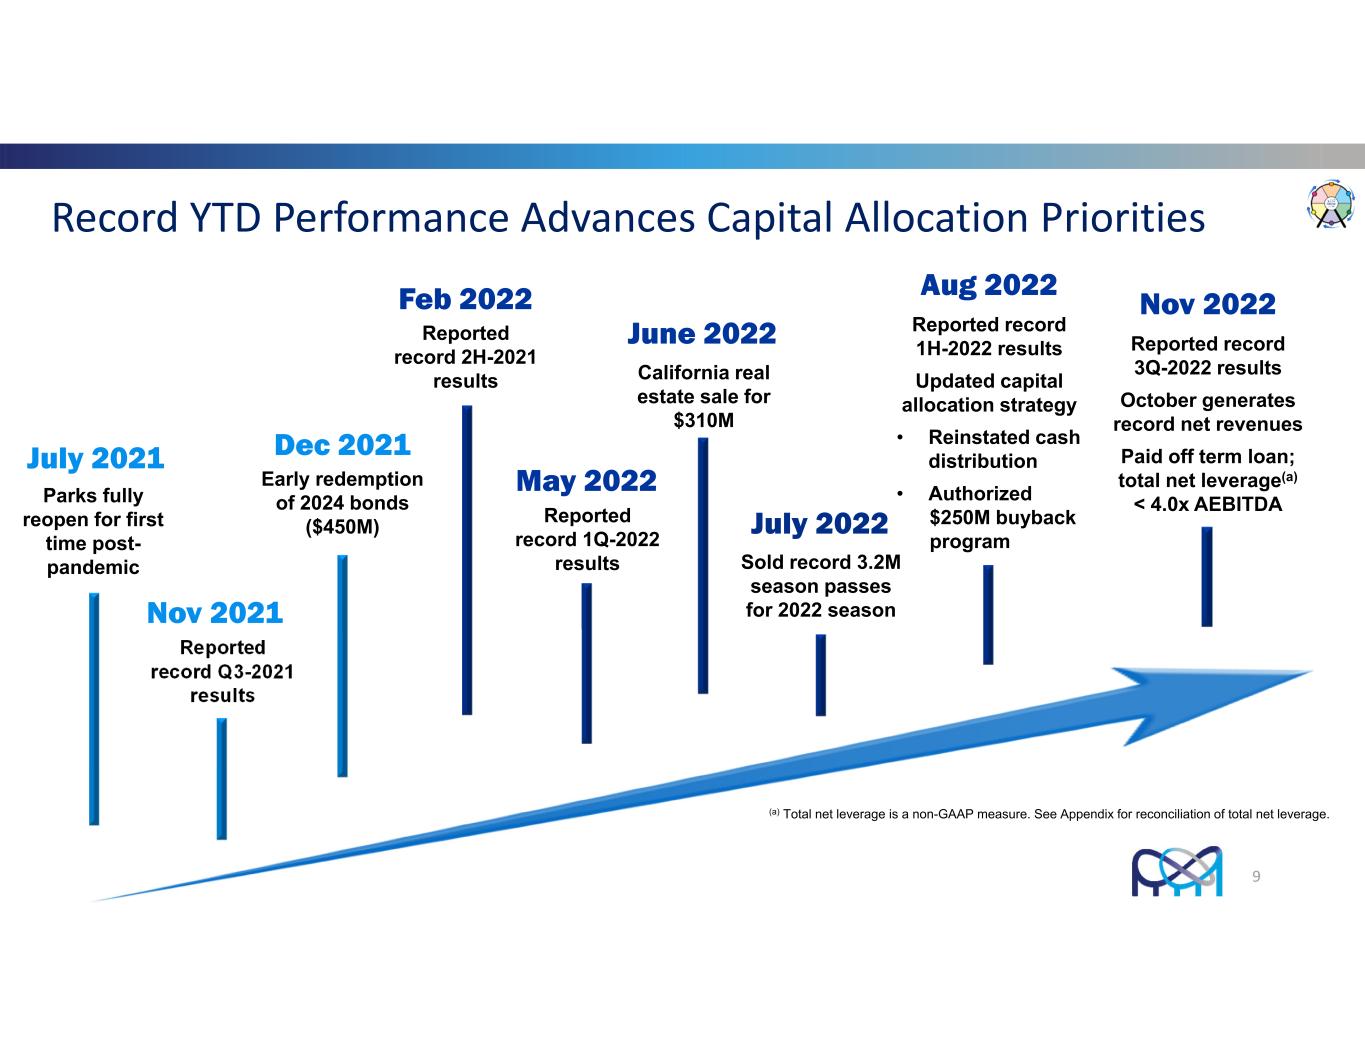
Record YTD Performance Advances Capital Allocation Priorities 9 Dec 2021 Early redemption of 2024 bonds ($450M) May 2022 Reported record 1Q-2022 results Nov 2021 Reported record Q3-2021 results June 2022 California real estate sale for $310M Aug 2022 Reported record 1H-2022 results Updated capital allocation strategy • Reinstated cash distribution • Authorized $250M buyback program July 2021 Parks fully reopen for first time post- pandemic Feb 2022 Reported record 2H-2021 results July 2022 Sold record 3.2M season passes for 2022 season Nov 2022 Reported record 3Q-2022 results October generates record net revenues Paid off term loan; total net leverage(a) < 4.0x AEBITDA (a) Total net leverage is a non-GAAP measure. See Appendix for reconciliation of total net leverage.

3% 4% 2022‐Q3 vs. 2021‐Q3 Results 1% Net Revenues $843M(a) $753M Adjusted EBITDA(b) $333M$362M (a) Attendance 10.8M12.3M In‐Park Per Capita Spending $64.26$62.62 Out‐of‐Park Revenues $83M$97M(a) 10 2022 Third Quarter (1,088 operating days) 2021 Third Quarter (988 operating days) (a) Denotes record high (b) Adjusted EBITDA is a non-GAAP measure. See Appendix for reconciliation of Adjusted EBITDA.

3% 4% TTM Q3‐2022 vs. Y2019 Results 1% Net Revenues $1.80B Adjusted EBITDA(a) $537M Attendance 26.9M In‐Park Per Capita Spending $61.28 Out‐of‐Park Revenues $207M 11 TTM Q3‐2022 Results (2,310 operating days) 2019 Full‐Year Results (2,224 operating days) $1.47B 27.9M $48.32 $169M $505M (a) Adjusted EBITDA is a non-GAAP measure. See Appendix for reconciliation of Adjusted EBITDA
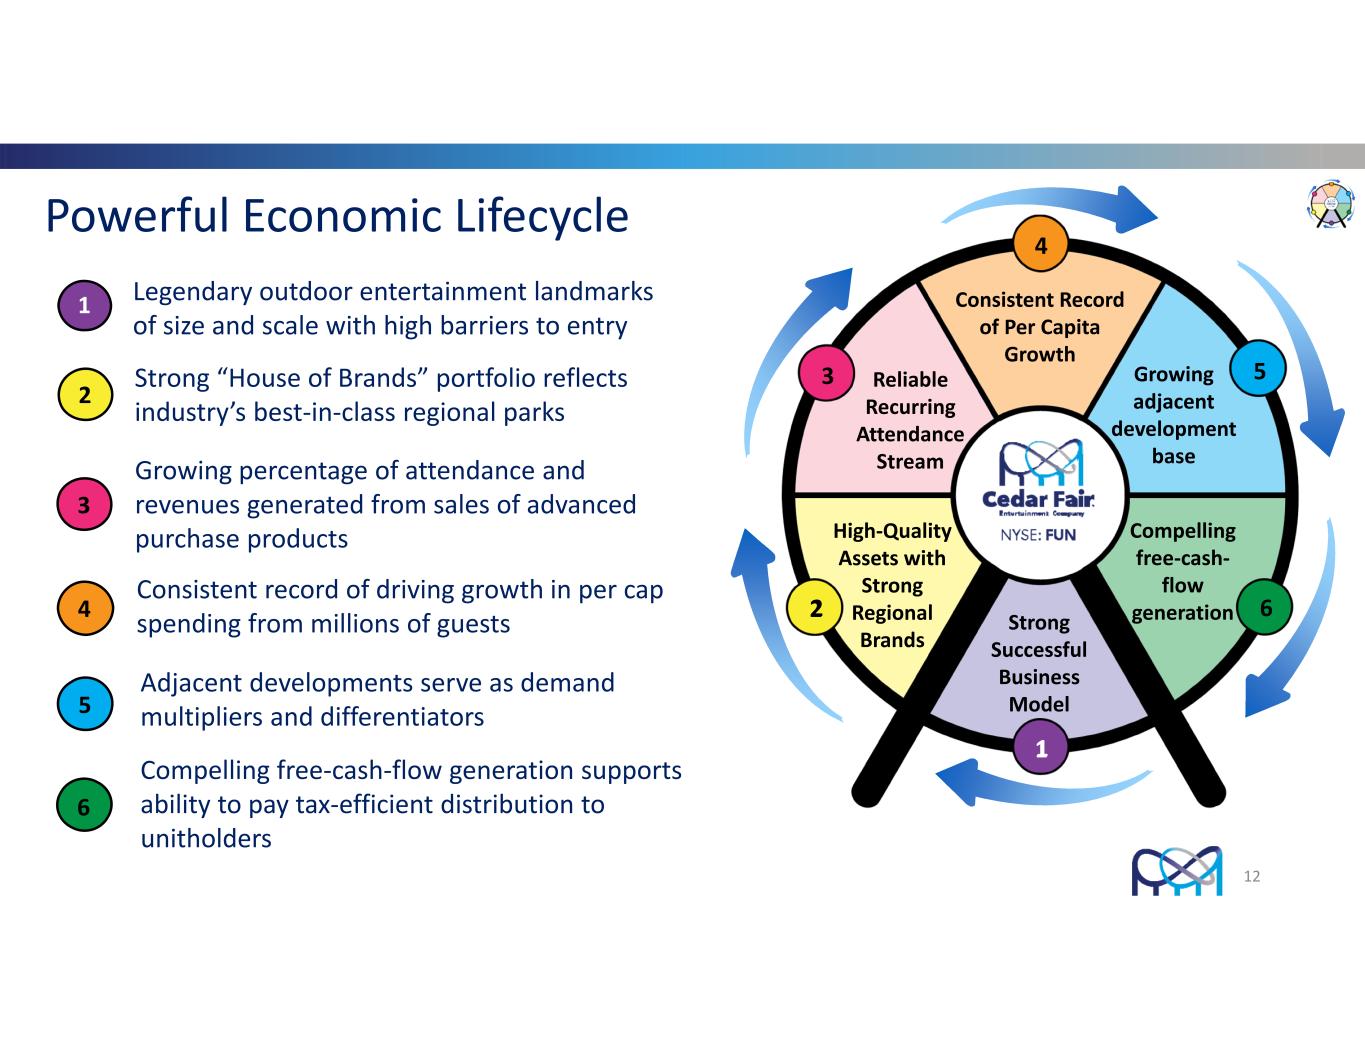
12 Powerful Economic Lifecycle Legendary outdoor entertainment landmarks of size and scale with high barriers to entry 1 Strong “House of Brands” portfolio reflects industry’s best‐in‐class regional parks 2 Growing percentage of attendance and revenues generated from sales of advanced purchase products 3 Consistent record of driving growth in per cap spending from millions of guests4 Adjacent developments serve as demand multipliers and differentiators5 Compelling free‐cash‐flow generation supports ability to pay tax‐efficient distribution to unitholders 6 Strong Successful Business Model 1 2 3 4 5 6 High‐Quality Assets with Strong Regional Brands Reliable Recurring Attendance Stream Consistent Record of Per Capita Growth Growing adjacent development base Compelling free‐cash‐ flow generation
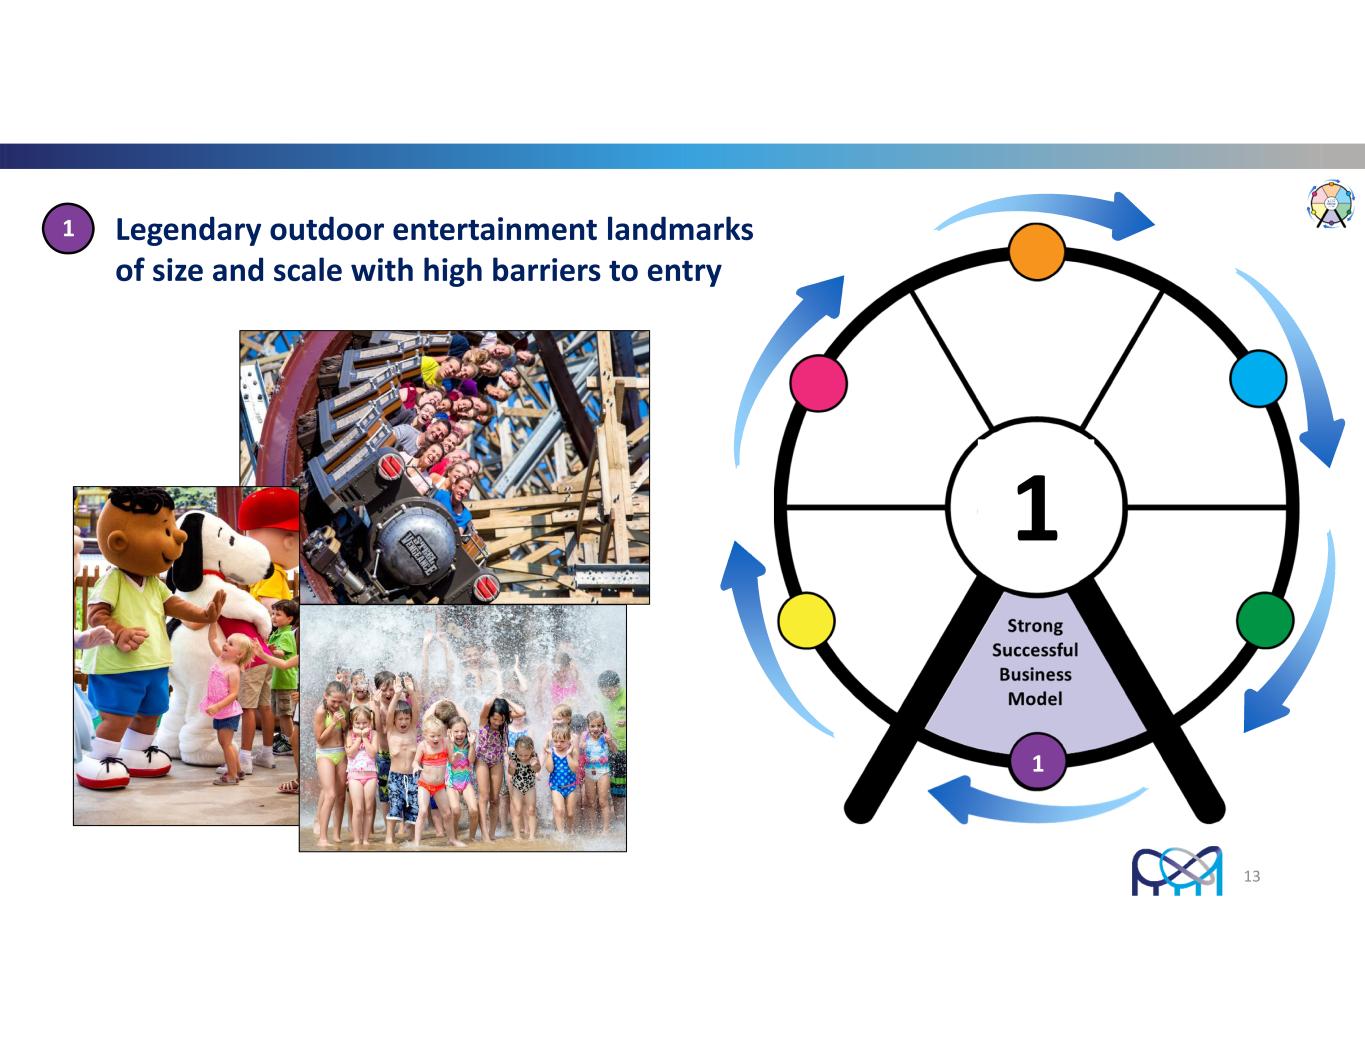
13 1 Legendary outdoor entertainment landmarks of size and scale with high barriers to entry 1 1 1
Long‐Range Plan: Core Strategies • Broaden the Guest Experience • Aimed at driving demand and guest spending • Expanded use of limited‐duration events and more immersive experiences – “Seasons of FUN” model that drives urgency to visit and incremental visits from new, unique guests • Traditional rides, such as roller coasters and water attractions, still play an important role • Food & beverage to continue to play an outsized role in the overall guest experience • Continue to Expand and Evolve the Season Pass Program • Our strongest growth channel – approximately 58% of year‐to‐date attendance, compared to 55% of full‐year attendance in 2021 and 52% in 2019 • Continued evolution of the program, including the broad rollout of PassPerks, our season pass loyalty program • Increase Market Penetration through Targeted Marketing Efforts • Key opportunities exist within several demographic groups with the fastest population growth rates • Pursue Adjacent Development • Continued evolution of our resort offerings and other park‐adjacent opportunities 14 1
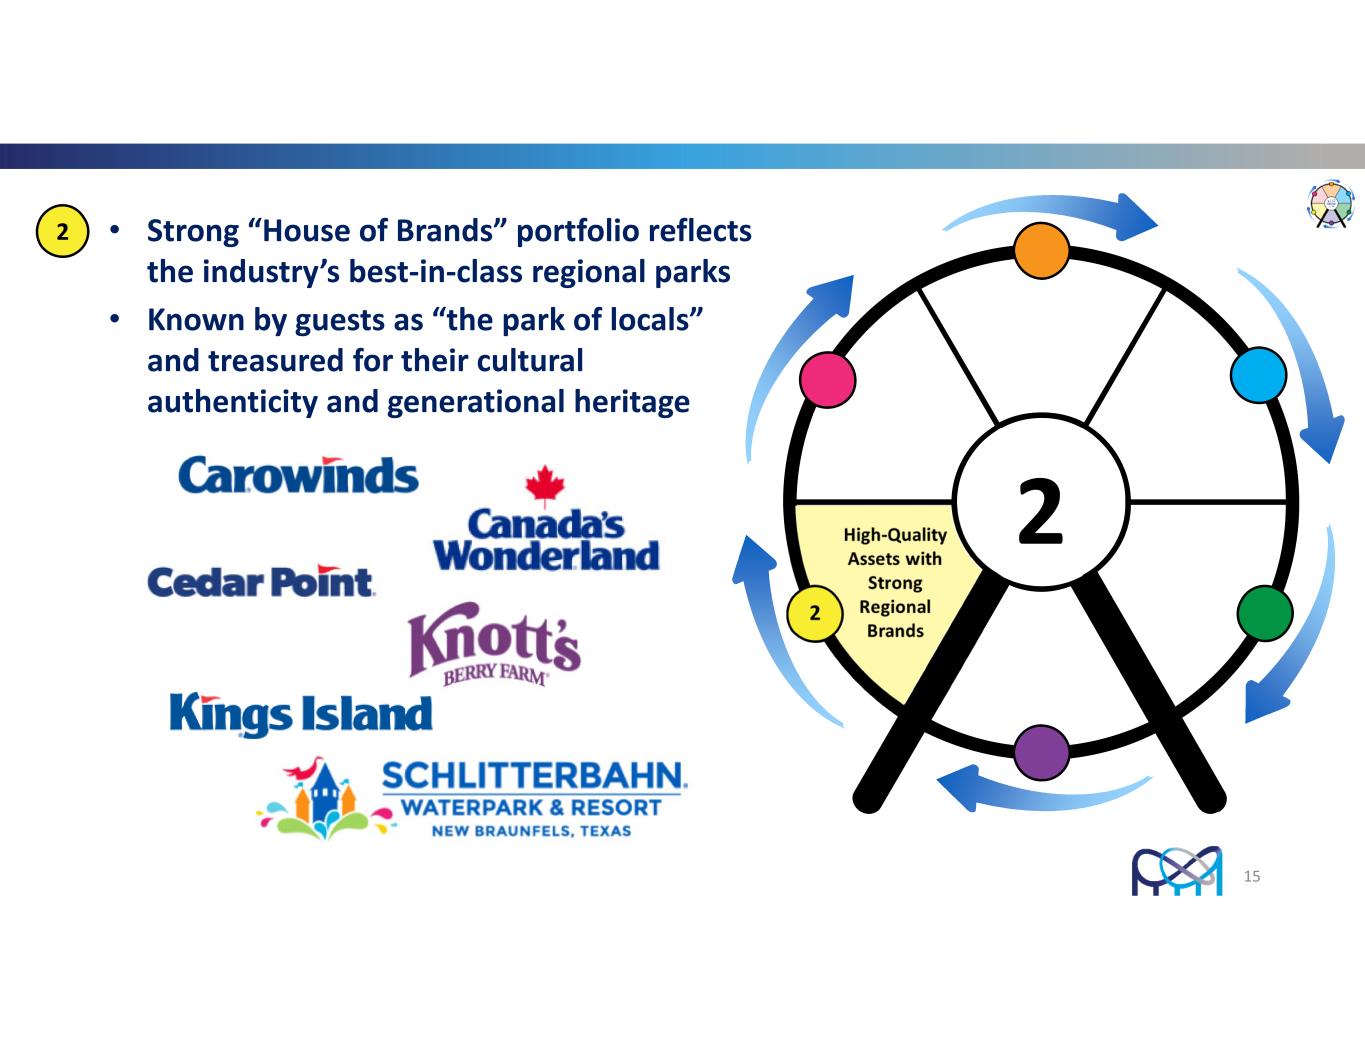
15 • Strong “House of Brands” portfolio reflects the industry’s best‐in‐class regional parks • Known by guests as “the park of locals” and treasured for their cultural authenticity and generational heritage 2 Strong Successful Business Model 1 2 3 4 5 6 High Distribution Yield High‐Quality Assets with Strong Regional Brands Reliable Recurring Revenue Stream Tax‐ Advantaged Structure 2
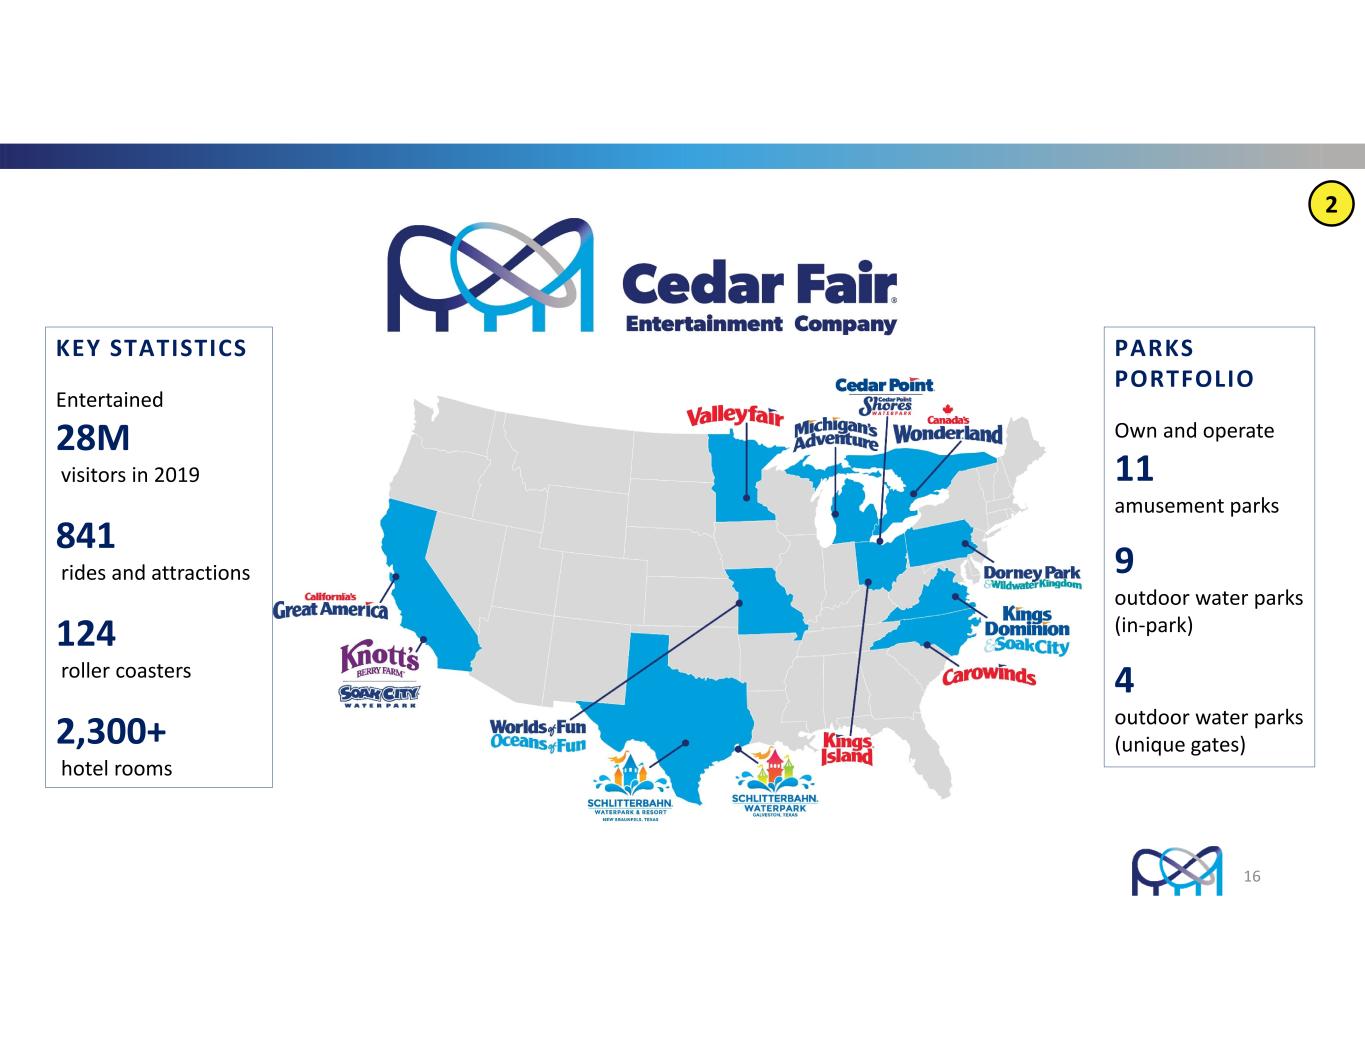
KEY STATISTICS Entertained 28M visitors in 2019 841 rides and attractions 124 roller coasters 2,300+ hotel rooms PARKS PORTFOLIO Own and operate 11 amusement parks 9 outdoor water parks (in‐park) 4 outdoor water parks (unique gates) 16 2
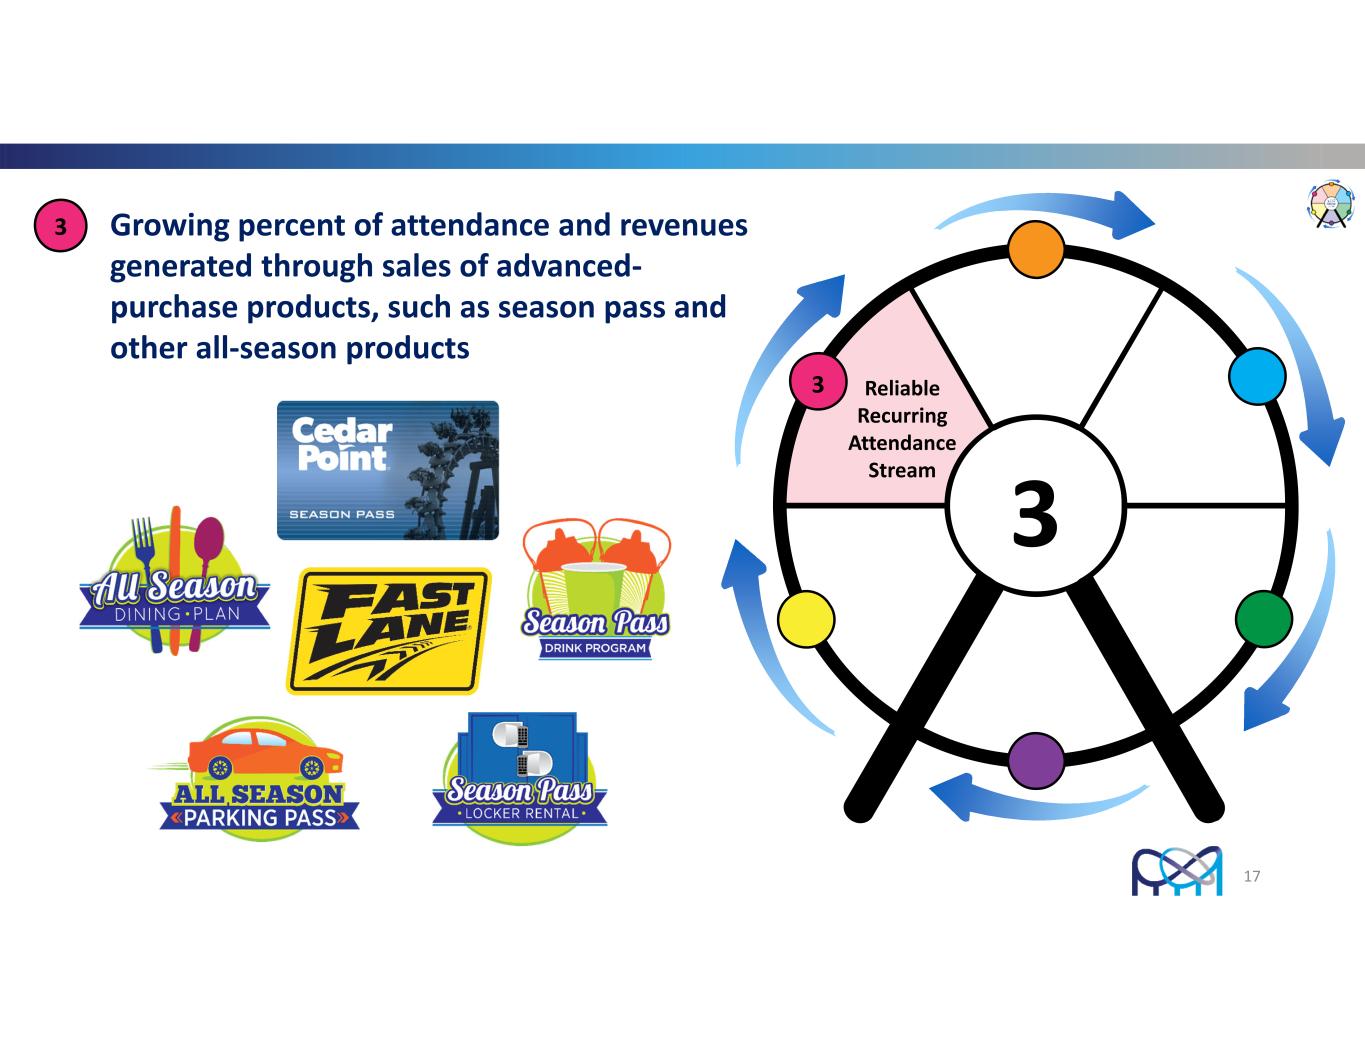
17 1 Growing percent of attendance and revenues generated through sales of advanced‐ purchase products, such as season pass and other all‐season products 3 3 Reliable Recurring Attendance Stream 3

Record Growth For Season Pass Channel • Sold a record 3.2 million season passes for the 2022 season o Unit sales were up more than 20% from the record 2.6 million passes sold for the 2019 season o Average 2022 season pass price up 9% over 2019 • Season pass visitation has comprised 58% of attendance through the first nine months of 2022, compared to 55% of 2021 attendance and 52% of 2019 attendance for the comparable periods • Total season pass visitation in 2019 topped 14 million guests (2019 total attendance of 27.9 million guests) Season Pass Group Sales Retail / Other 2019 Season Pass Group Sales Retail / Other Season Pass Group Sales Retail / Other YTD Q3‐2022 Season Pass Group Sales Retail / Other 18 3
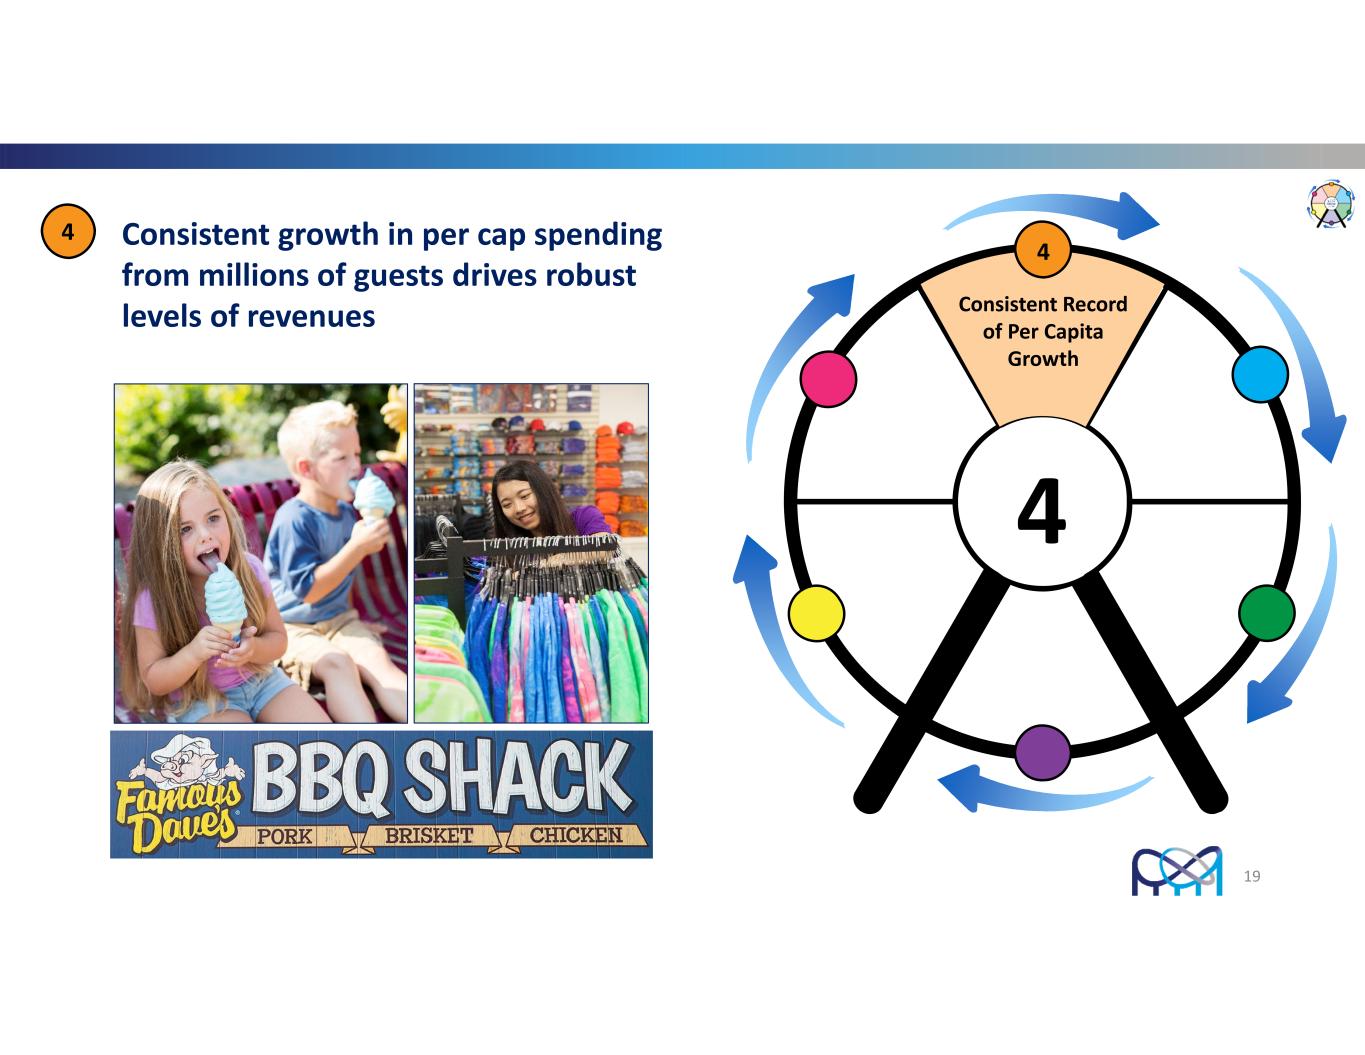
19 1 Consistent growth in per cap spending from millions of guests drives robust levels of revenues 4 4 4 Consistent Record of Per Capita Growth
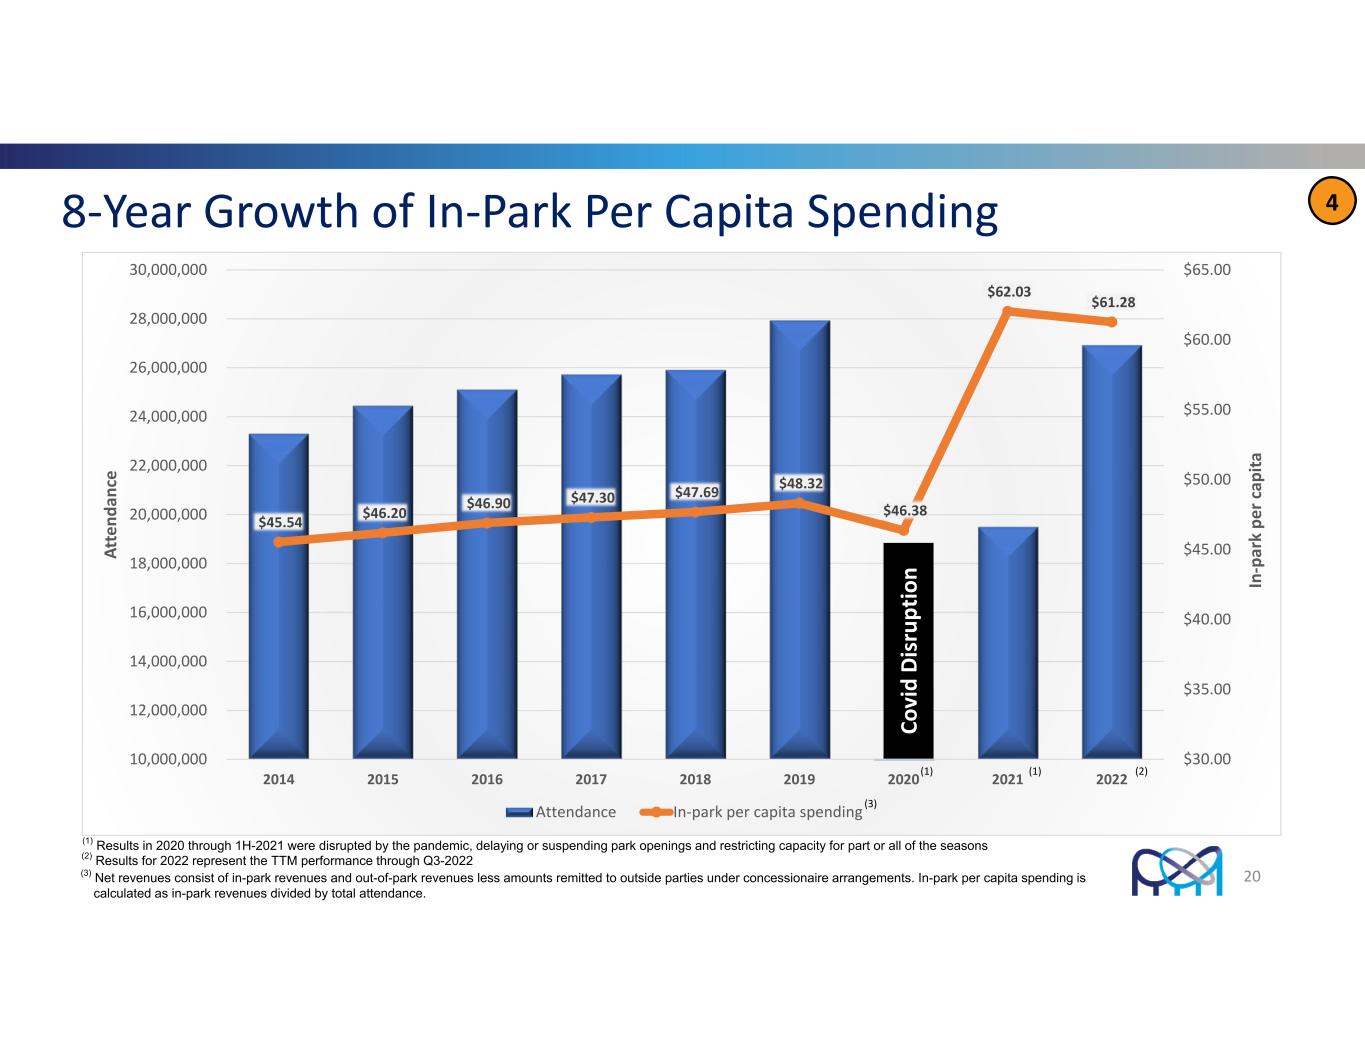
20 48‐Year Growth of In‐Park Per Capita Spending $45.54 $46.20 $46.90 $47.30 $47.69 $48.32 $46.38 $62.03 $61.28 $30.00 $35.00 $40.00 $45.00 $50.00 $55.00 $60.00 $65.00 10,000,000 12,000,000 14,000,000 16,000,000 18,000,000 20,000,000 22,000,000 24,000,000 26,000,000 28,000,000 30,000,000 2014 2015 2016 2017 2018 2019 2020 2021 2022 In ‐p ar k pe r c ap ita At te nd an ce Attendance In‐park per capita spending (2)(1) (3) Co vi d D is ru pt io n (1) Results in 2020 through 1H-2021 were disrupted by the pandemic, delaying or suspending park openings and restricting capacity for part or all of the seasons (1) (2) Results for 2022 represent the TTM performance through Q3-2022 (3) Net revenues consist of in-park revenues and out-of-park revenues less amounts remitted to outside parties under concessionaire arrangements. In-park per capita spending is calculated as in-park revenues divided by total attendance.
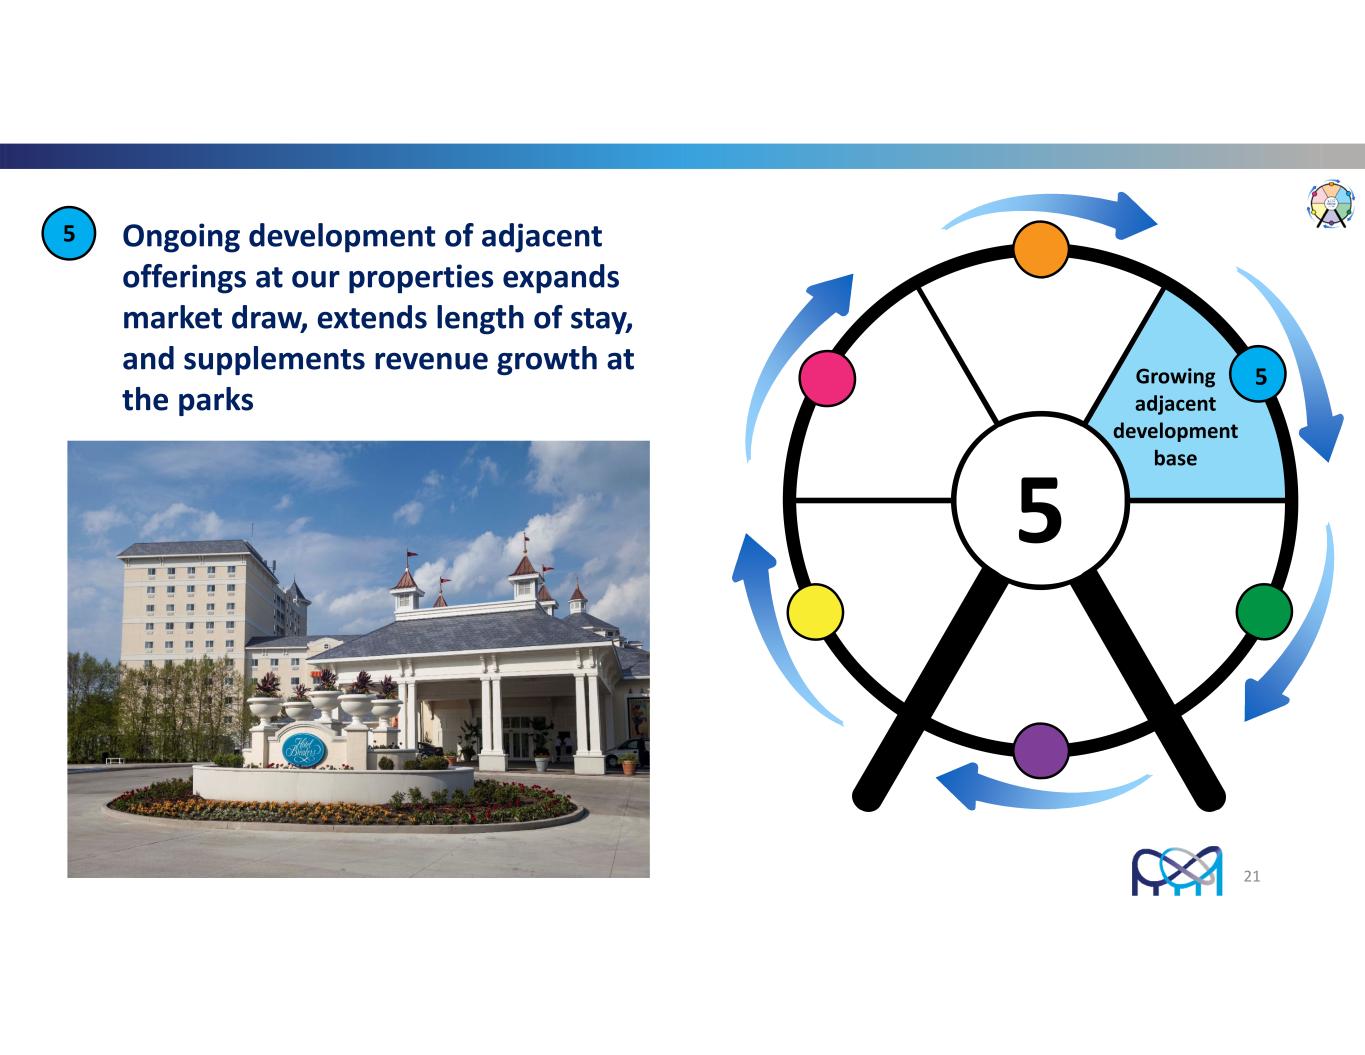
21 Ongoing development of adjacent offerings at our properties expands market draw, extends length of stay, and supplements revenue growth at the parks 5 5Growing adjacent development base 5
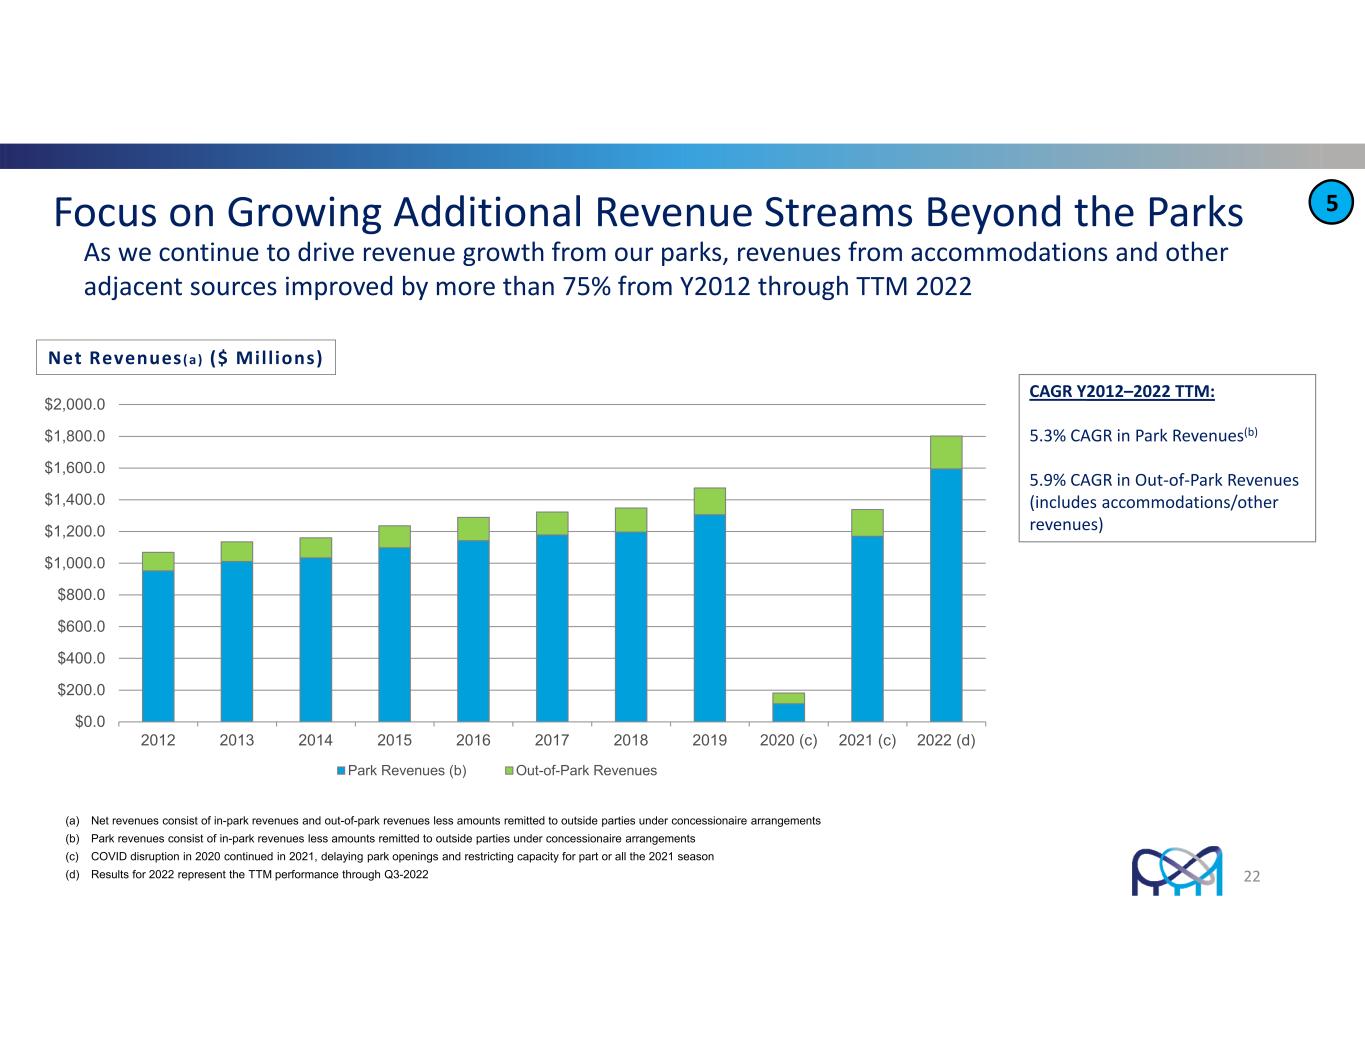
Focus on Growing Additional Revenue Streams Beyond the Parks $0.0 $200.0 $400.0 $600.0 $800.0 $1,000.0 $1,200.0 $1,400.0 $1,600.0 $1,800.0 $2,000.0 2012 2013 2014 2015 2016 2017 2018 2019 2020 (c) 2021 (c) 2022 (d) Park Revenues (b) Out-of-Park Revenues 22 As we continue to drive revenue growth from our parks, revenues from accommodations and other adjacent sources improved by more than 75% from Y2012 through TTM 2022 Net Revenues(a) ($ Mill ions) CAGR Y2012–2022 TTM: 5.3% CAGR in Park Revenues(b) 5.9% CAGR in Out‐of‐Park Revenues (includes accommodations/other revenues) 5 (a) Net revenues consist of in-park revenues and out-of-park revenues less amounts remitted to outside parties under concessionaire arrangements (b) Park revenues consist of in-park revenues less amounts remitted to outside parties under concessionaire arrangements (c) COVID disruption in 2020 continued in 2021, delaying park openings and restricting capacity for part or all the 2021 season (d) Results for 2022 represent the TTM performance through Q3-2022
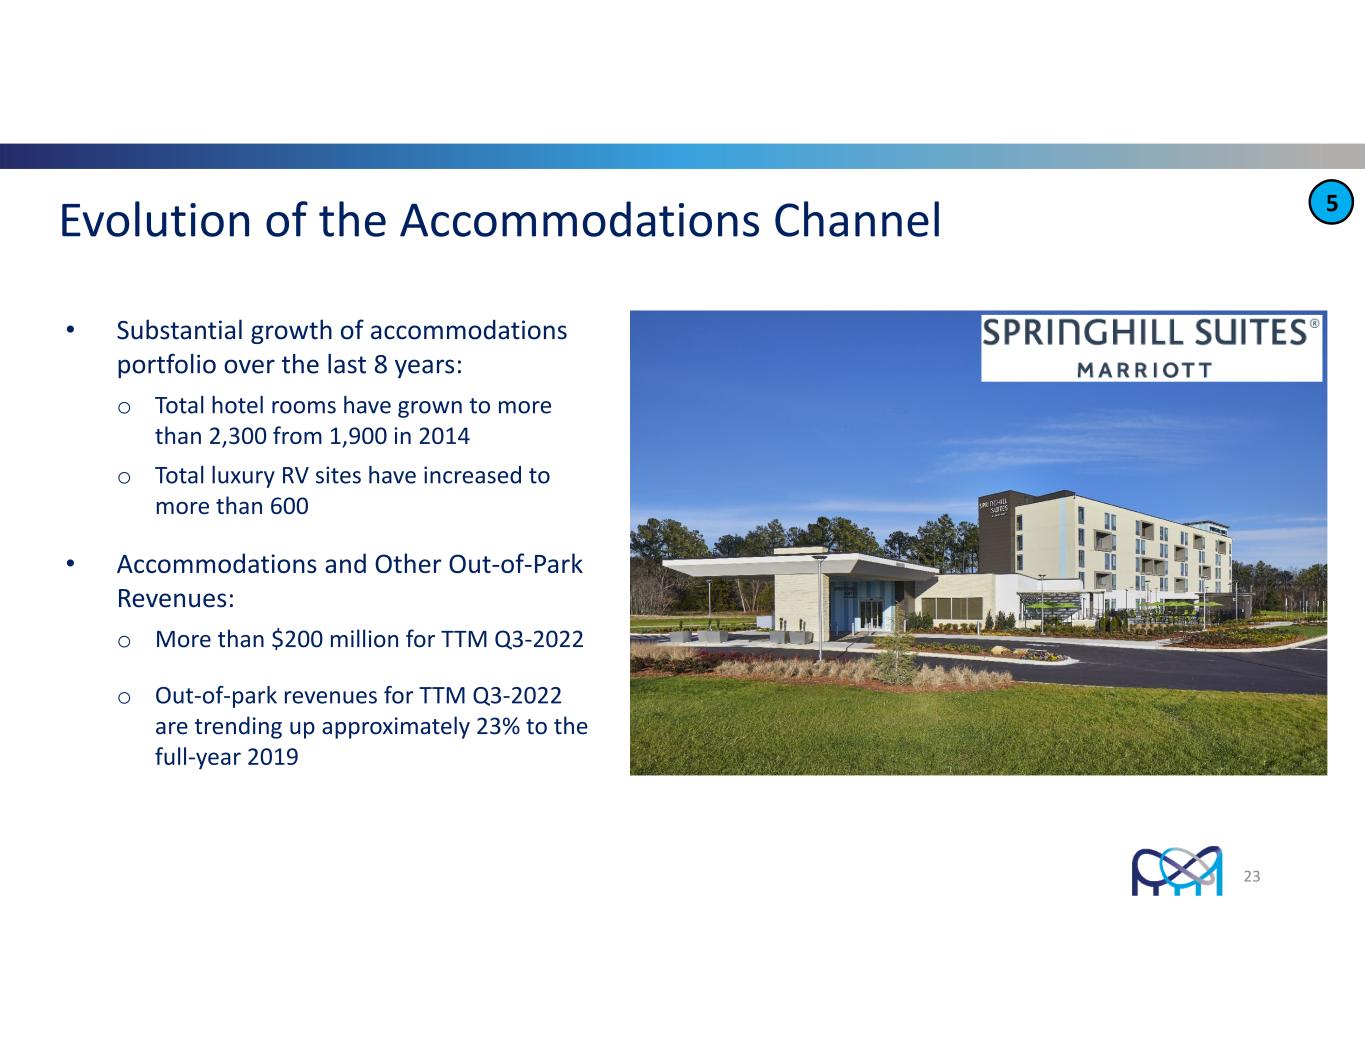
Evolution of the Accommodations Channel • Substantial growth of accommodations portfolio over the last 8 years: o Total hotel rooms have grown to more than 2,300 from 1,900 in 2014 o Total luxury RV sites have increased to more than 600 • Accommodations and Other Out‐of‐Park Revenues: o More than $200 million for TTM Q3‐2022 o Out‐of‐park revenues for TTM Q3‐2022 are trending up approximately 23% to the full‐year 2019 23 5
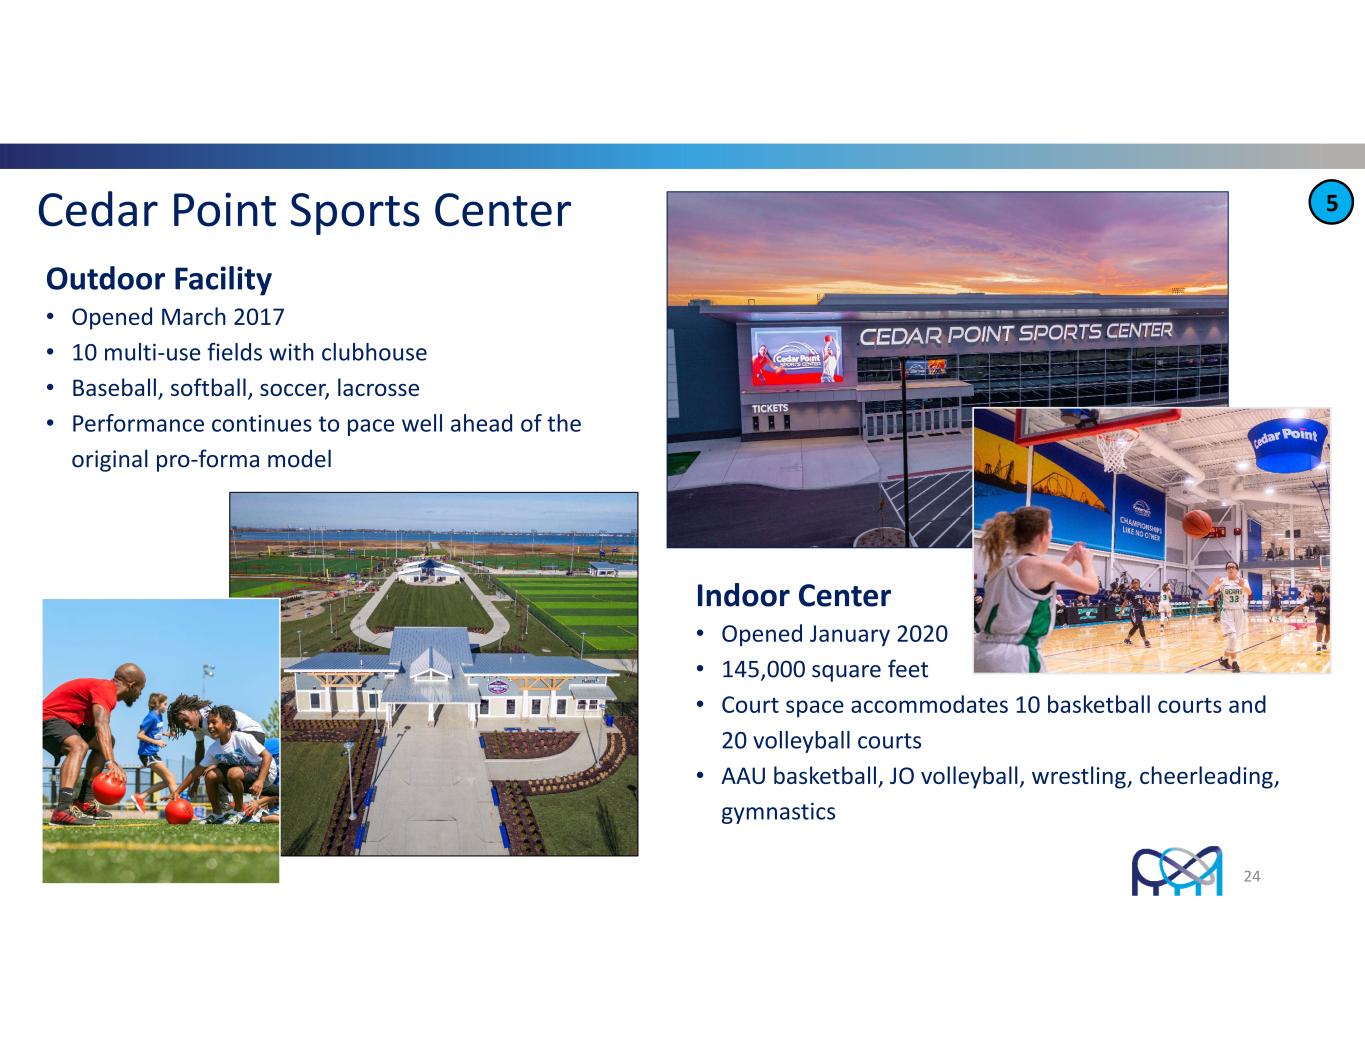
24 Cedar Point Sports Center Indoor Center • Opened January 2020 • 145,000 square feet • Court space accommodates 10 basketball courts and 20 volleyball courts • AAU basketball, JO volleyball, wrestling, cheerleading, gymnastics Outdoor Facility • Opened March 2017 • 10 multi‐use fields with clubhouse • Baseball, softball, soccer, lacrosse • Performance continues to pace well ahead of the original pro‐forma model 5
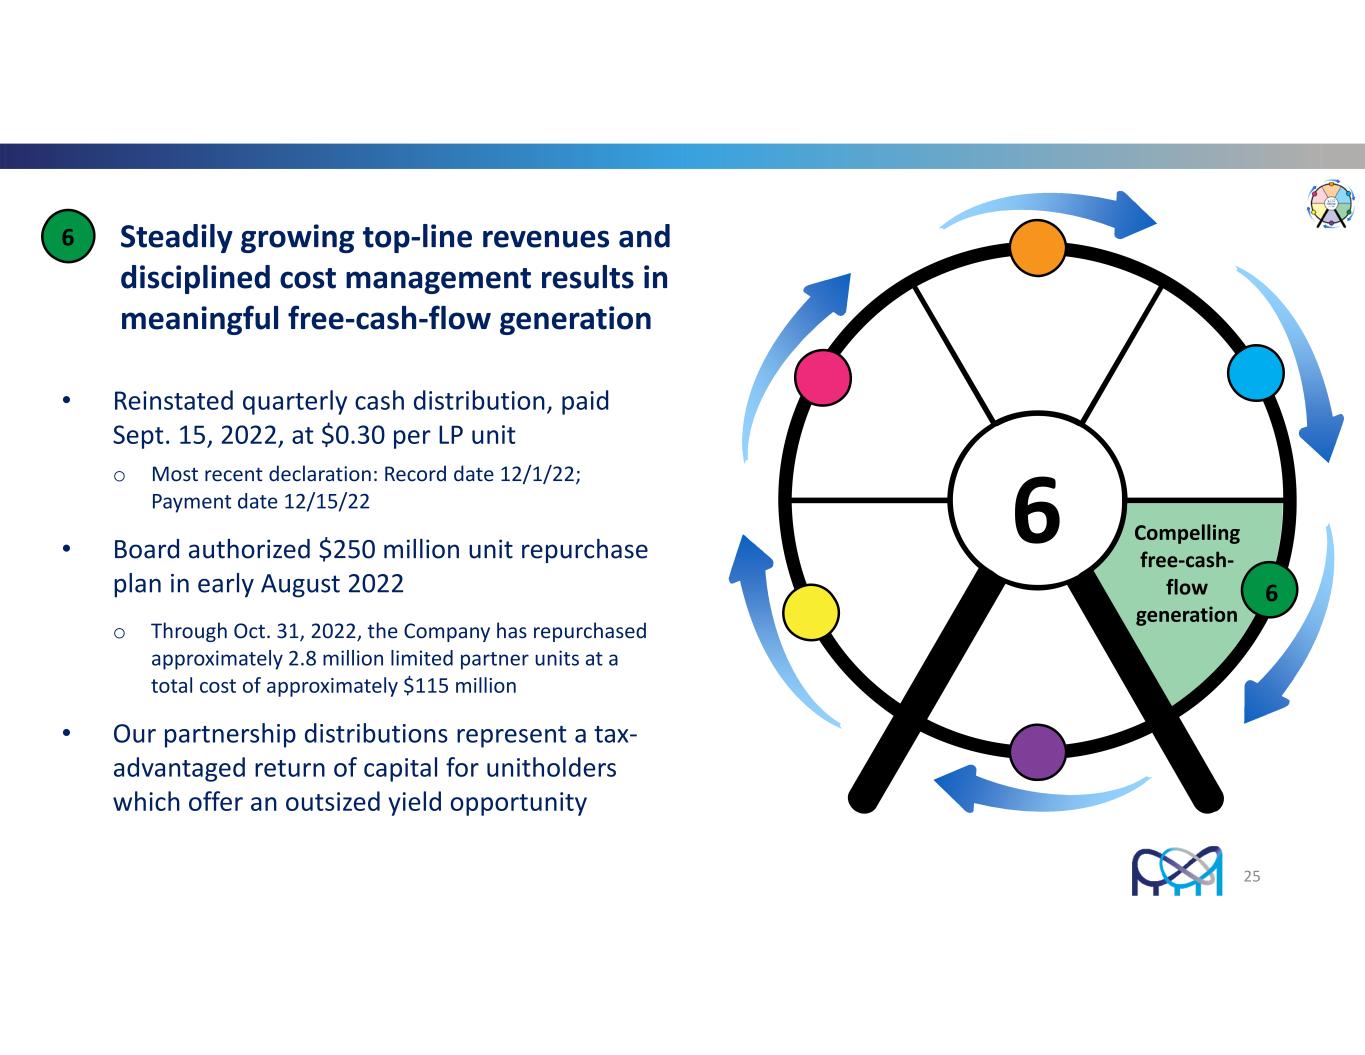
25 1 Steadily growing top‐line revenues and disciplined cost management results in meaningful free‐cash‐flow generation 6 6 Compelling free‐cash‐ flow generation 6 • Reinstated quarterly cash distribution, paid Sept. 15, 2022, at $0.30 per LP unit o Most recent declaration: Record date 12/1/22; Payment date 12/15/22 • Board authorized $250 million unit repurchase plan in early August 2022 o Through Oct. 31, 2022, the Company has repurchased approximately 2.8 million limited partner units at a total cost of approximately $115 million • Our partnership distributions represent a tax‐ advantaged return of capital for unitholders which offer an outsized yield opportunity
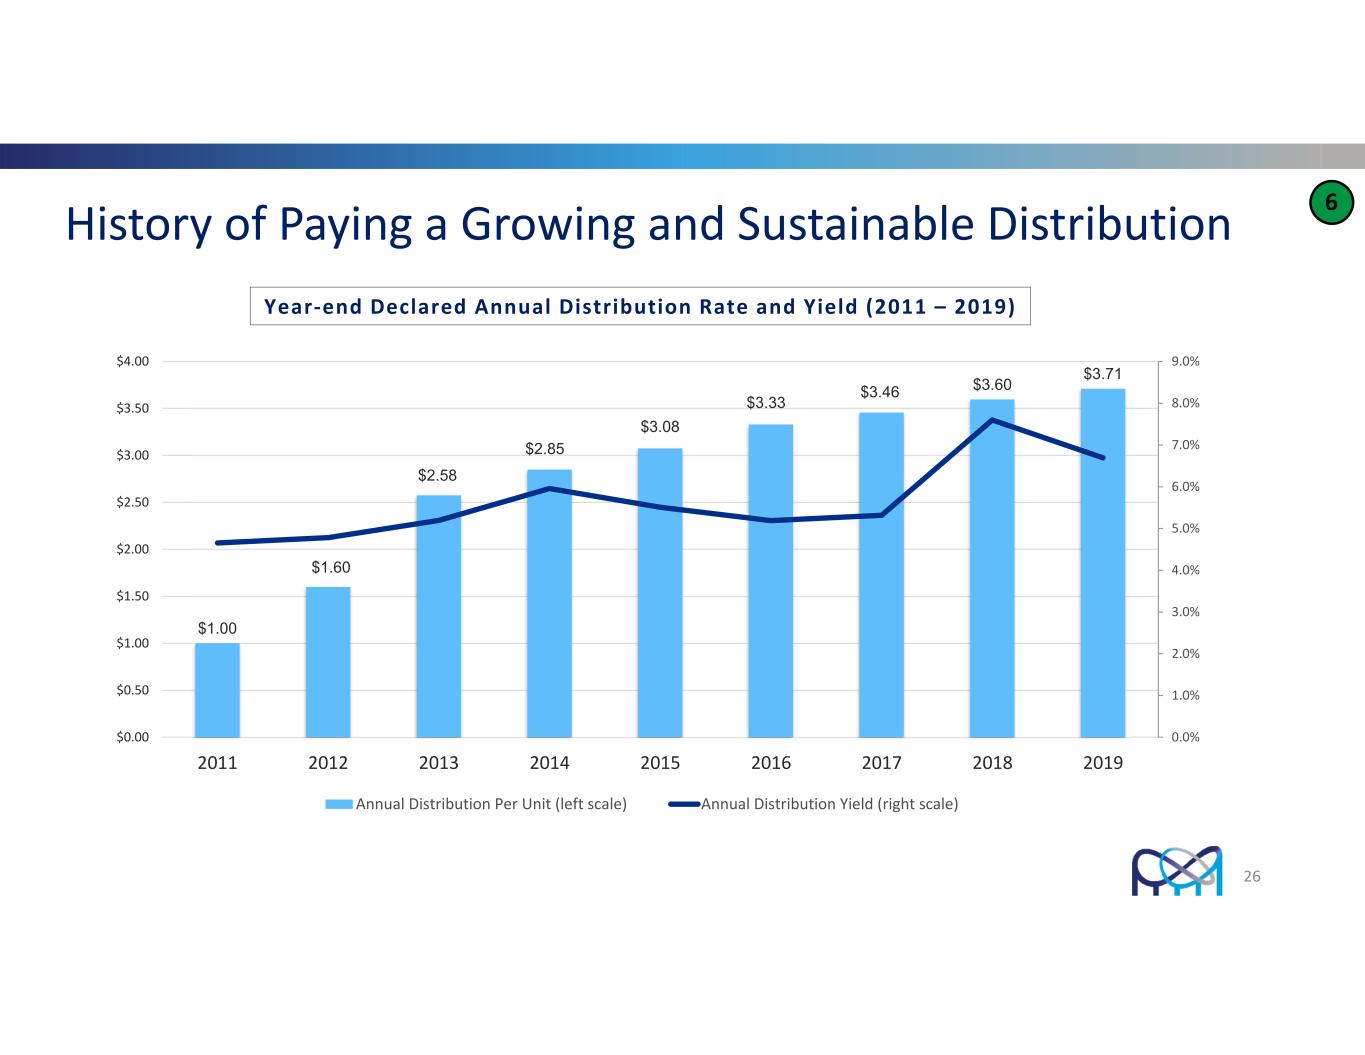
History of Paying a Growing and Sustainable Distribution $1.00 $1.60 $2.58 $2.85 $3.08 $3.33 $3.46 $3.60 $3.71 0.0% 1.0% 2.0% 3.0% 4.0% 5.0% 6.0% 7.0% 8.0% 9.0% $0.00 $0.50 $1.00 $1.50 $2.00 $2.50 $3.00 $3.50 $4.00 2011 2012 2013 2014 2015 2016 2017 2018 2019 Annual Distribution Per Unit (left scale) Annual Distribution Yield (right scale) Year‐end Declared Annual Distribution Rate and Yield (2011 – 2019) 26 6
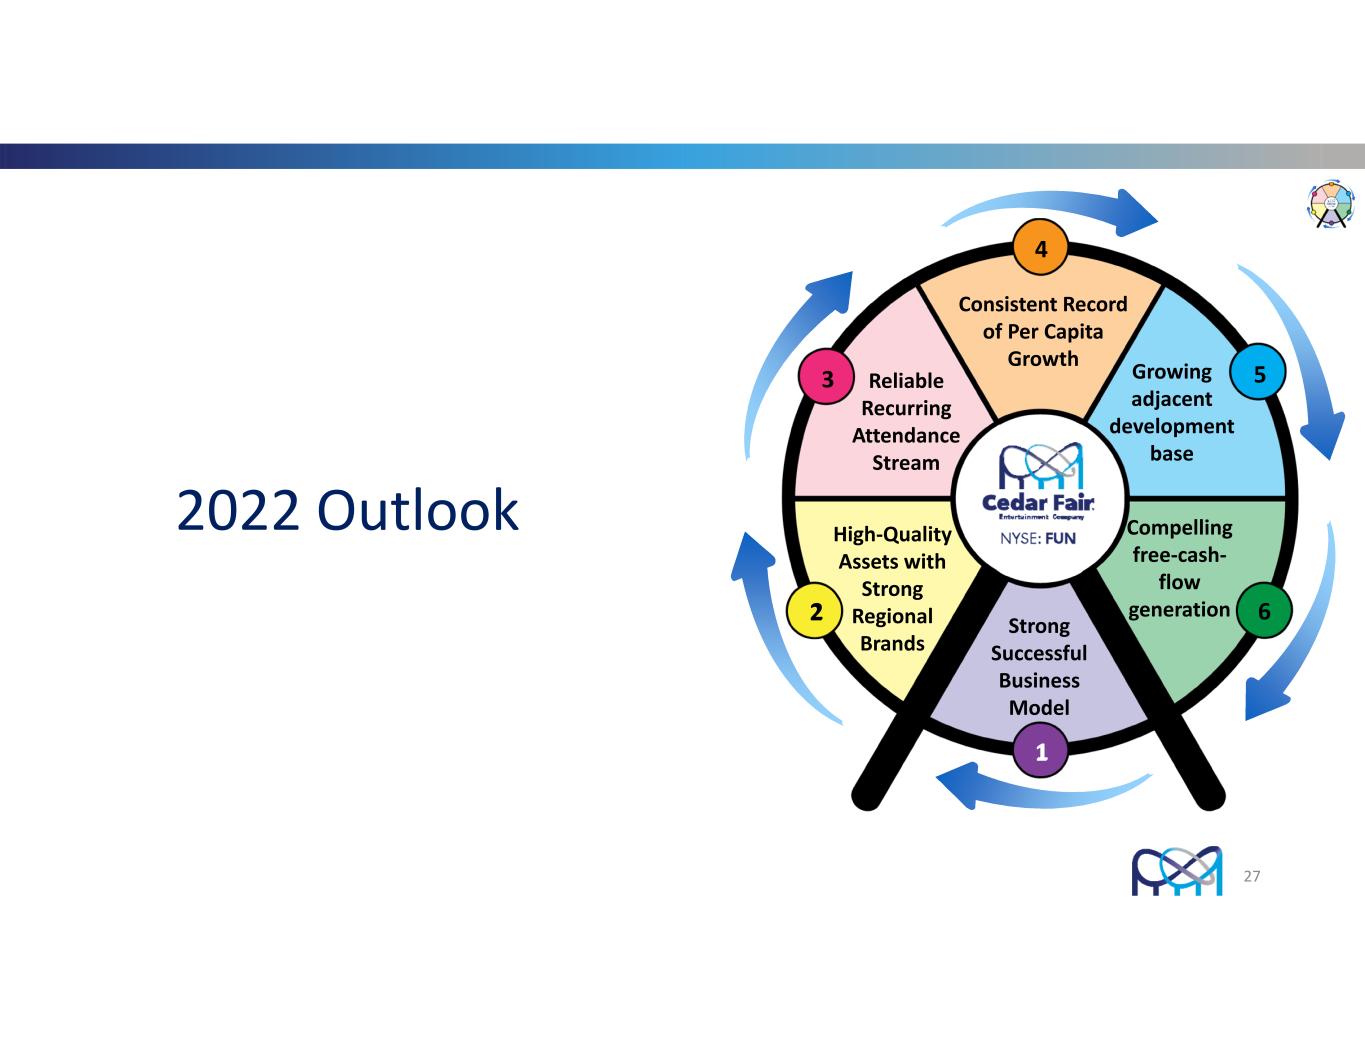
27 2022 Outlook Strong Successful Business Model 1 2 3 4 5 6 High‐Quality Assets with Strong Regional Brands Consistent Record of Per Capita Growth Reliable Recurring Attendance Stream Compelling free‐cash‐ flow generation Growing adjacent development base

• Total Net Leverage Target 3.0x to 4.0x Updated Capital Allocation Strategy 28 • Something new for every park • Sustainable and growing • Current annualized rate of $1.20 • $250M Authorized • ~$115M Used To Date Pay Down Debt to $2B Target Invest in our Properties Pay Quarterly Cash Distribution Unit Buyback Program Capital Return Policy Committed to driving sustainable value creation through a balanced approach of investing in the business while maintaining a strong balance sheet and returning capital to unitholders
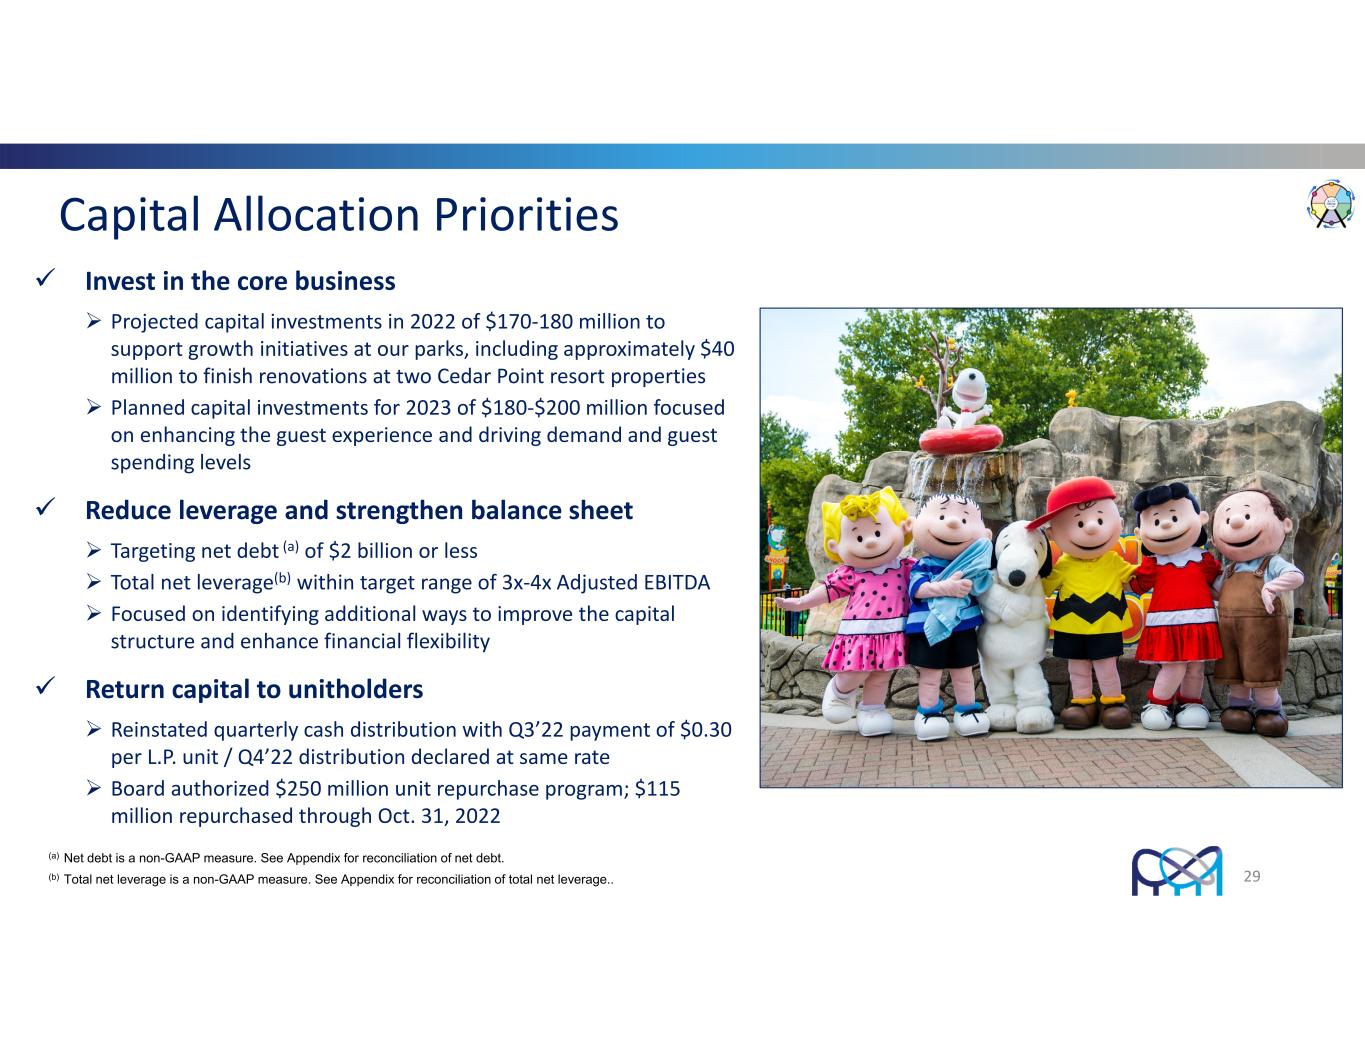
Invest in the core business Projected capital investments in 2022 of $170‐180 million to support growth initiatives at our parks, including approximately $40 million to finish renovations at two Cedar Point resort properties Planned capital investments for 2023 of $180‐$200 million focused on enhancing the guest experience and driving demand and guest spending levels Reduce leverage and strengthen balance sheet Targeting net debt (a) of $2 billion or less Total net leverage(b) within target range of 3x‐4x Adjusted EBITDA Focused on identifying additional ways to improve the capital structure and enhance financial flexibility Return capital to unitholders Reinstated quarterly cash distribution with Q3’22 payment of $0.30 per L.P. unit / Q4’22 distribution declared at same rate Board authorized $250 million unit repurchase program; $115 million repurchased through Oct. 31, 2022 Capital Allocation Priorities 29 (a) Net debt is a non-GAAP measure. See Appendix for reconciliation of net debt. (b) Total net leverage is a non-GAAP measure. See Appendix for reconciliation of total net leverage..
Balance Sheet and Liquidity Well Positioned • Successfully paid off the equivalent of more than 90% of the pandemic‐related debt • Deferred revenues totaled $188 million at the end of the third quarter of 2022 • Compares to $211 million(a) of deferred revenues at the end of the third quarter of 2021 • Excluding extension of passes at Knott’s Berry Farm and Canada’s Wonderland, deferred revenues at the end of the 2022 third quarter would be up approximately $7 million, or 4%, from the same time last year • The Company had total liquidity of $568 million at the end of the 2022 third quarter • Reflects cash on hand of $288 million and $280 million available under the revolver • Compares to $319 million of total liquidity at the end of the 2022 second quarter • Fully repaid term loan in third quarter 2022, reducing total debt outstanding to $2.3 billion at the end of the 2022 third quarter • Total net leverage(b) measured on a trailing 12‐month basis was 3.7x Adjusted EBITDA at Sept. 25, 2022 30 (b) Total net leverage is a non-GAAP measure. See Appendix for reconciliation of total net leverage.. (a) Included in the $211 million balance was approximately $30 million of deferred revenue carryover related to the extension of 2020 and 2021 season passes into 2022 at Knott’s Berry Farm and Canada’s Wonderland due to pandemic-related park closures in their respective markets.

Solid Capital Structure Amounts in Millions Strong financial position with long‐term debt maturities, a low cost of debt (just above 5%), and significant available liquidity Total debt outstanding of approximately $2.3B as of Sept. 25, 2022 Full‐year 2022 cash interest costs projected to be in the $145‐150M range $300 $1,000 $500 $300 $500 $- $300 $600 $900 $1,200 2022 2023 2024 2025 2026 2027 2028 2029 Revolver Capacity Senior Notes 31
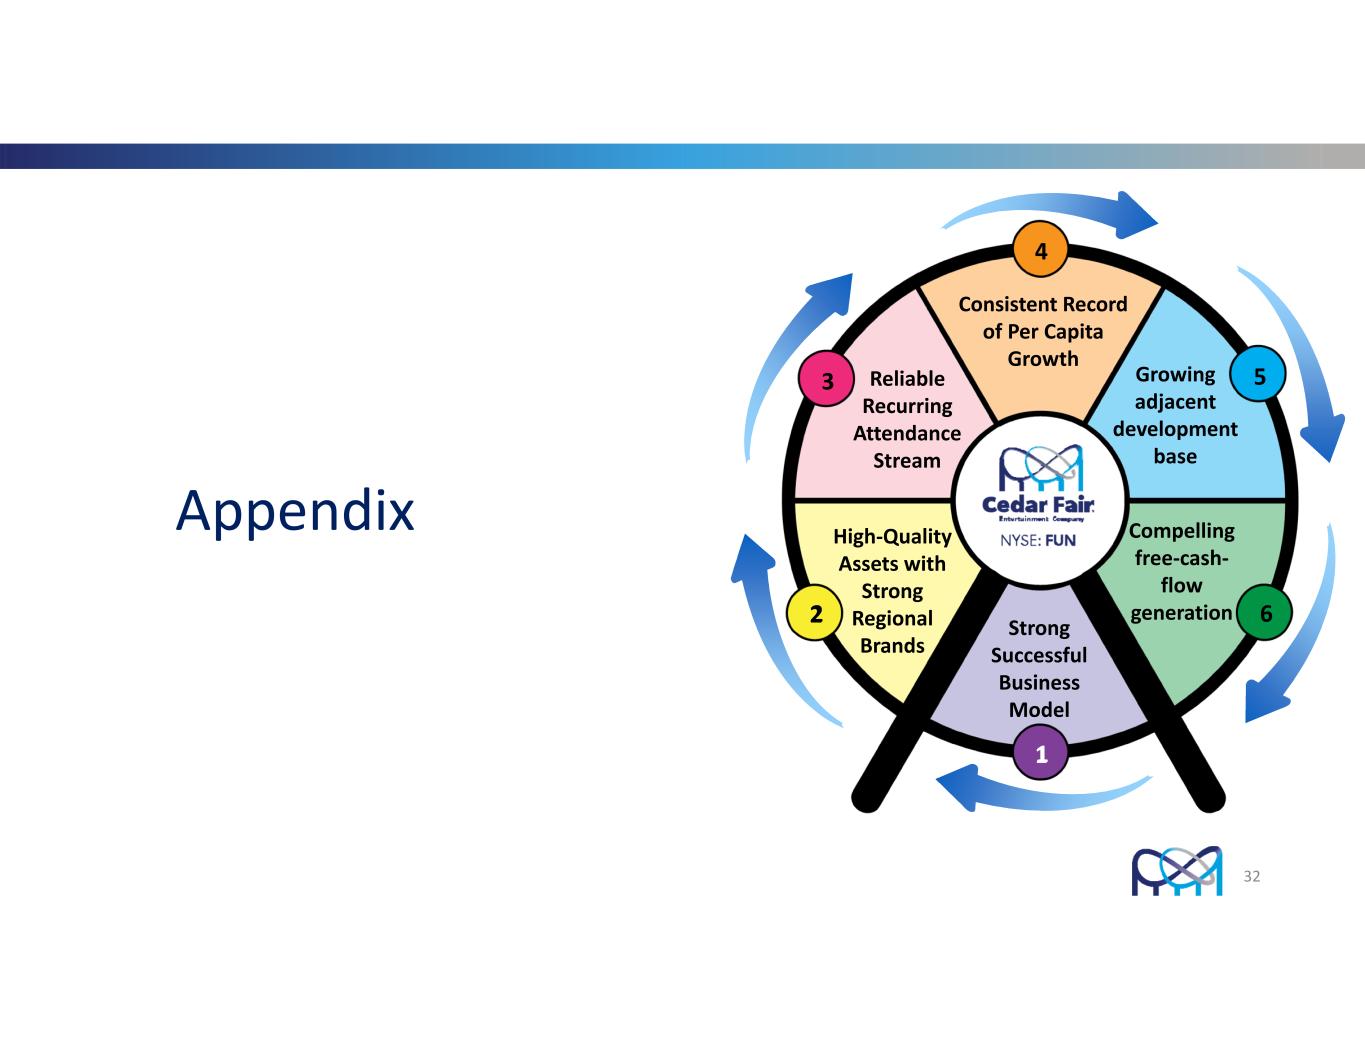
32 Appendix Strong Successful Business Model 1 2 3 4 5 6 High‐Quality Assets with Strong Regional Brands Consistent Record of Per Capita Growth Reliable Recurring Attendance Stream Compelling free‐cash‐ flow generation Growing adjacent development base
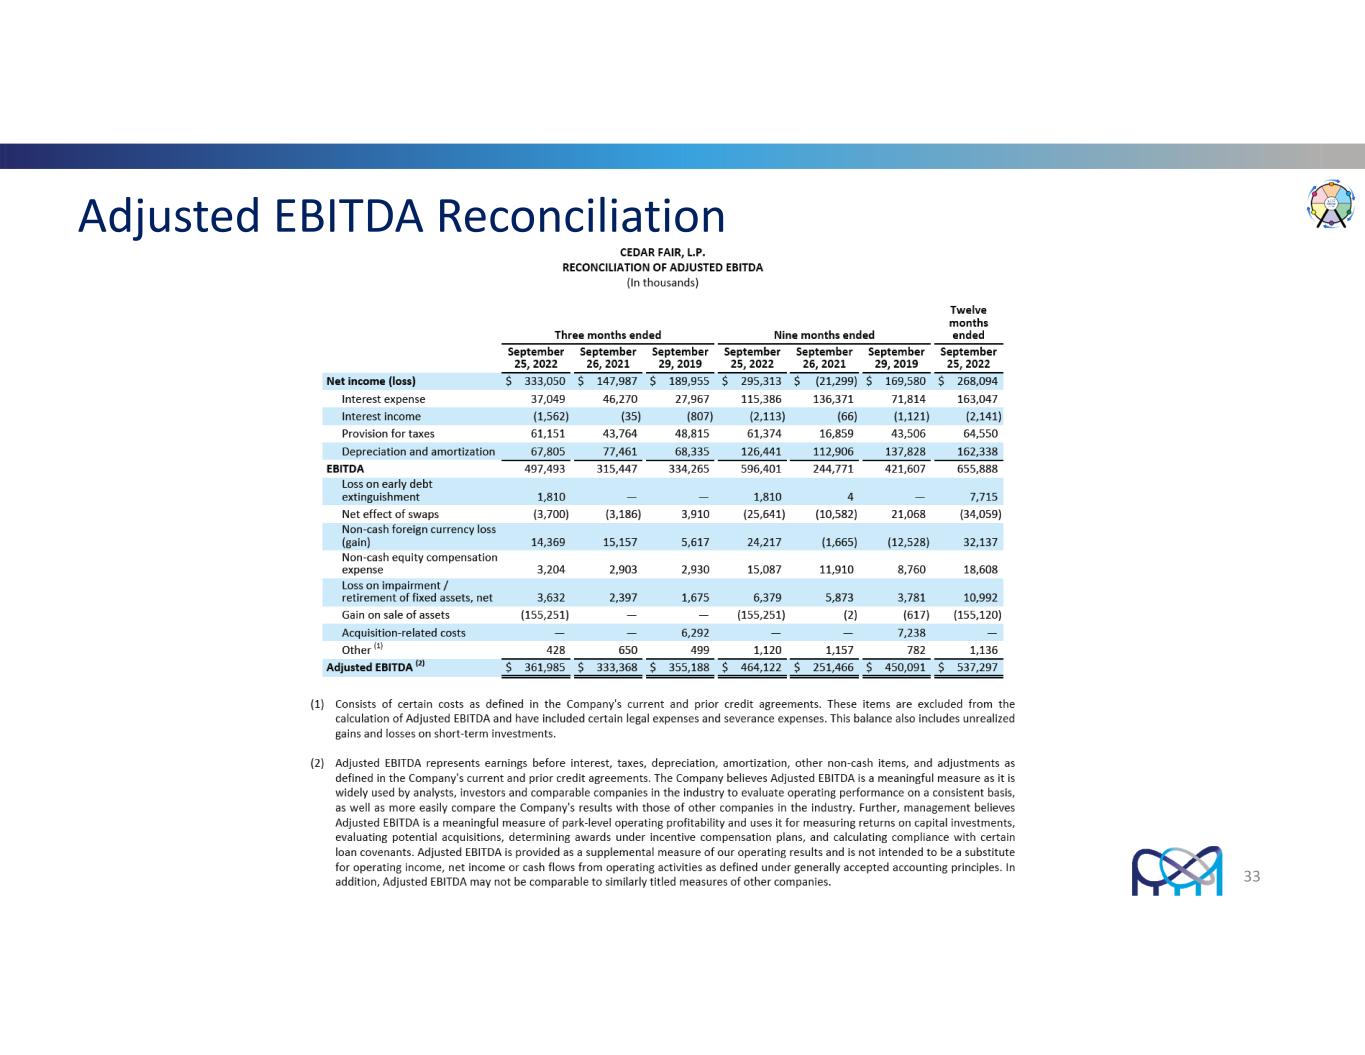
Adjusted EBITDA Reconciliation 33
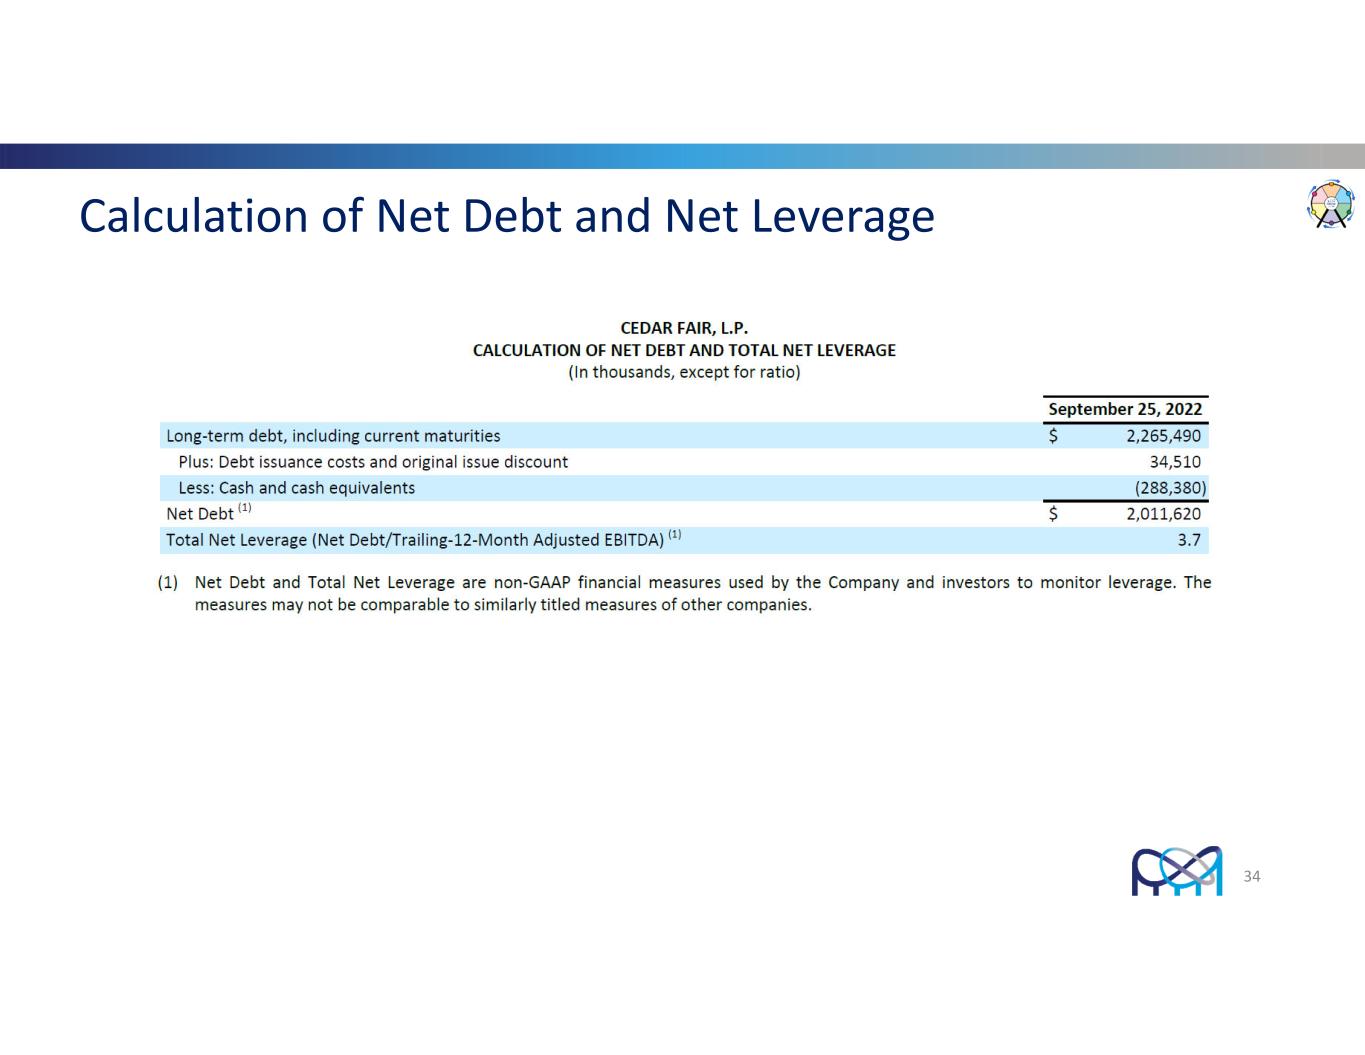
Calculation of Net Debt and Net Leverage 34


