 The Decisions We Make June 27, 2013 Exhibit 99.1 |
 Forward Looking Statements Some slides and comments included here, particularly related to estimates, comments on expectations about future performance or business conditions, may contain “forward looking statements” within the meaning of the federal securities laws which involve risks and uncertainties. You can identify forward-looking statements because they contain words such as “believes,” “project,” “might,” “expects,” “may,” “will,” “should,” “seeks,” “approximately,” “intends,” “plans,” “estimates” or “anticipates” or similar expressions that concern our strategy, plans or intentions. These forward-looking statements are subject to risks and uncertainties that may change at any time, and could cause actual results to differ materially from those that we anticipate. While we believe that the expectations reflected in such forward-looking statements are reasonable, we caution that it is very difficult to predict the impact of unknown factors, and it is impossible for us to anticipate all factors that could affect our actual results. Important factors, including those listed under Item 1A in the Partnership’s Form 10-K could adversely affect our future financial performance and cause actual results to differ materially from our expectations. 2 |
 Experienced Management Team Management team with proven experience both with Cedar Fair and in the leisure and hospitality industry Name Position Years with Cedar Fair Years In Industry Matt A. Ouimet (55) President and Chief Executive Officer 2 23 Richard A. Zimmerman (52) Chief Operating Officer 22 26 Brian C. Witherow (46) Executive Vice President and Chief Financial Officer 18 20 Kelley Semmelroth (48) Executive Vice President and Chief Marketing Officer 1 8 H. Philip Bender (57) Executive Vice President 40 40 David R. Hoffman (45) Senior Vice President and Chief Accounting Officer 7 7 Craig J. Freeman (59) Corporate Vice President, Administration 28 33 Duffield E. Milkie (47) Corporate Vice President, General Counsel and Corporate Secretary 5 5 Robert A. Decker (52) Corporate Vice President, Planning & Design 14 24 3 |
 The Decisions We Make Decisions at all levels of the organization are focused on maximizing growth and unitholder value • Solidify and protect our core business Cedar Point voted “Best Amusement Park in the World” for 15 consecutive years • Extract additional value from our strong attendance base We entertain more than 23 million guests on an annual basis • Pursue the next generation of growth initiatives at a responsible pace Invest in incremental guest acquisition and guest spending opportunities that leverage the existing fixed asset base 4 |
 Our Approach Entertainment of Choice Employer of Choice Investment of Choice People Have Choices… 5 • Deliver the “best-day-of-the-summer” experience for our guests • Respect, value and appreciate our employees • Drive attractive total return |
       Cedar Fair’s Fundamentals are Strong Excellent Regional Brands • Best-in-Class parks within the regions we operate • High Net Promoter Scores (NPS) • Loyal, high-repeat customer base Experienced Management Teams • Deep bench of talent • Diverse backgrounds of experience • Long history of delivering results Competitive Advantages • Strong barriers to entry • No comparable at-home digital experience • Business model that supports seasonal operations • Resort lodging adjacent to our core properties Strong Returns and Growth Opportunities • Deliver strong, consistent returns • Continuous investments support organic growth • Continuous expense discipline • Balanced approach to allocation of excess capital • MLP structure 6 |
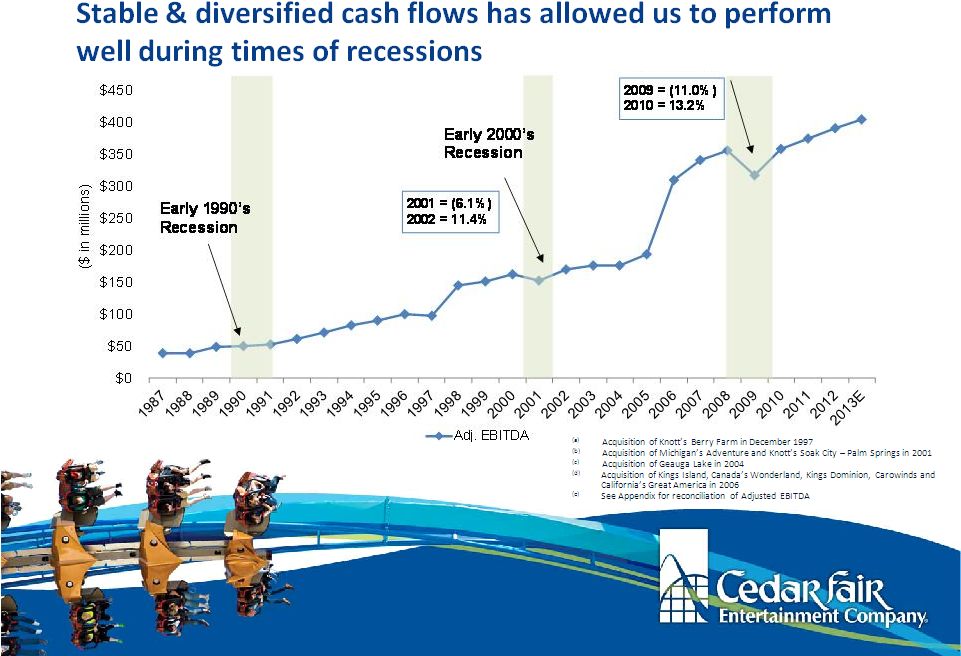
 Deliver strong, consistent returns 7 (a) Includes attendance for amusement parks and separately-gated outdoor water parks (b) Acquisition of Michigan’s Adventure and Knott’s Soak City – Palm Springs in2001 (c) Acquisition of Geauga Lake in 2004 (d) Acquisition of Kings Island, Canada’s Wonderland, Kings Dominion, Carowinds and California’s Great America in 2006 (e) See Appendix for reconciliation of Adjusted EBITDA |
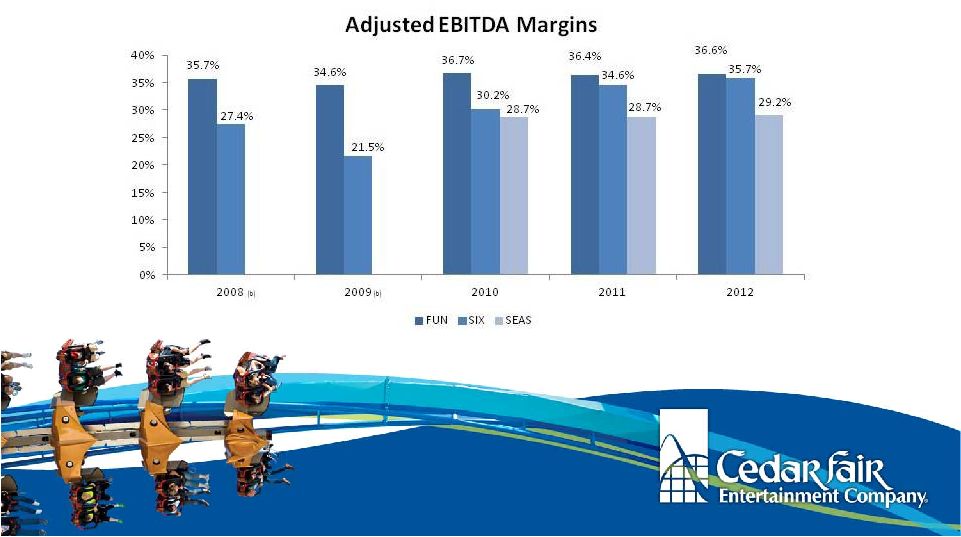 Continuous Expense Discipline 8 Focus on maintaining and modest expansion of industry- leading Adjusted EBITDA margins (a) (a) Source: SEC filings for 2008 – 2012 (b) Information not available for SeaWorld |
 2013 YTD Attendance and Revenue Trends 9 We remain on track to meet our 2013 Net Revenue and Adjusted EBITDA guidance • Through June 23, total revenue increased 5% Average in-park guest per capita spending up 4% Attendance up 1% Out-of-park revenues up 5% • 2013 capital projects on plan and on budget |
 2013 YTD Attendance and Revenue Trends 10 We remain on track to meet our 2013 Net Revenue and Adjusted EBITDA guidance • 2013 guidance Net revenues between $1.090 billion and $1.115 billion Adjusted EBITDA in the range of $400 million to $410 million |
 $317 $359 $375 $391 $400-$410 $450+ 2009 2010 2011 2012 2013 2016 ~4% CAGR Strategic Growth Opportunities Adjusted EBITDA (a) Growth • Enhanced guest experience • Improved consumer messaging • Dynamic pricing and advance purchase commitments • Premium product offerings • Strategic alliance fees and promotional leverage • Capital and expense productivity ($ in millions) Strategic Growth Drivers (a) See Appendix for Adjusted EBITDA reconciliation On track to achieve targeted Adjusted EBITDA of $450+ million by 2016 11 |
 Distribution Increase Unit Buyback Investment in Organic Growth Excess Cash Flow Decisions Sustainability and growth of the distribution is forefront in the decision-making process 12 2013 Distribution of $2.50 per unit represents a yield of 6.4% (a) Future distribution growth in line with the growth of the business Debt Repayment (a) Based on a closing price of $39.11 on June 21, 2013. |
 13 FINANCIAL OVERVIEW Brian Witherow Executive Vice President and Chief Financial Officer |
 Financial Overview Our business model provides substantial operating and financial flexibility allowing us to maximize unitholder value • Long history of delivering strong results Recession resilient business model • On track to achieve short & long-term financial targets • Solid capital structure with no near-term maturities • Favorable partnership structure • Significant free cash flow 14 |
 Long History of Growth 15 |
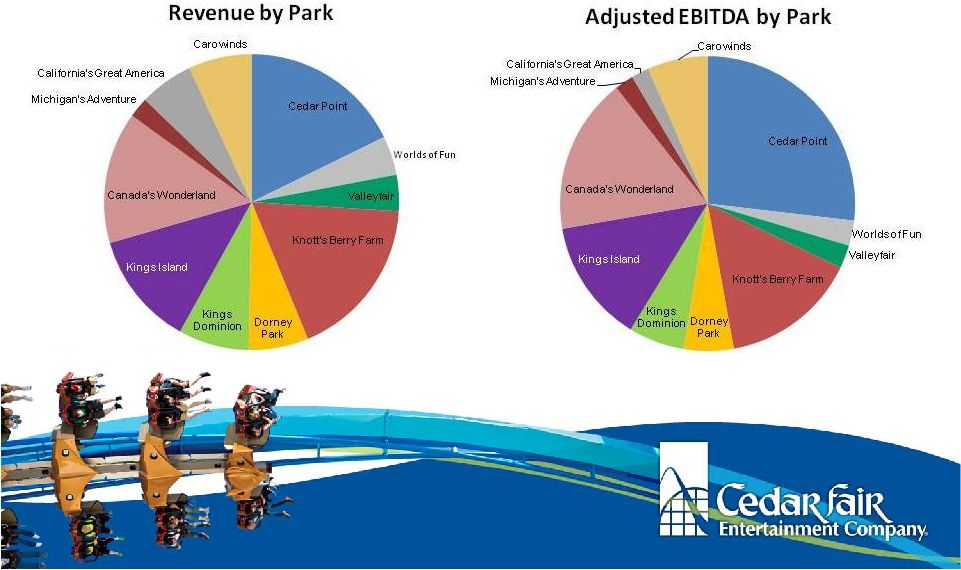 Diversified Cash Flow Diversified revenue and Adjusted EBITDA stream across the Company portfolio 16 |
 Early Season Attendance and Revenue Trends As we head into our core operating season, we feel very good about our plans, progress and potential. • Revenues up 5%, or $18 million through June 23, 2013 Strong early season performance by KBF, CP and CGA in both attendance and in-park spend • Season pass revenues up approximately 20% when compared with this time last year • Group bookings and resort reservations up from this time last year 17 |
 $317 $359 $375 $391 $400-$410 $450+ 2009 2010 2011 2012 2013 2016 ~4% CAGR Strategic Growth Opportunities Adjusted EBITDA (a) Growth • Enhanced guest experience • Improved consumer messaging • Dynamic pricing and advance purchase commitments • Premium product offerings • Strategic alliance fees and promotional leverage • Capital and expense productivity ($ in millions) Strategic Growth Drivers (a) See Appendix for Adjusted EBITDA reconciliation 18 On track to achieve targeted Adjusted EBITDA of $450+ million by 2016 18 |
 Advance Purchase Commitment (APC) Opportunities • E-commerce sales have increased more than 50% since the new platform was introduced in February 2012 Response to installment payment program remains strong, resulting in incremental sales Year-to-date, season pass sales up in units in price on the back of strong 2012 results Installment payment for resort hotels introduced in January 2013 19 APCs provide protection against visitation disruption events and drives in-park spending elasticity |
 Advance Purchase Commitment (APC) Opportunities • Data capture supports new customer relationship management platform • To-date, approximately 1/3 of Fast Lane tickets sold online • Provides hedge against time poverty and other entertainment offerings 20 APCs provide protection against visitation disruption events and drives in-park spending elasticity |
 We offer all consumers the right price (and no less), focused on true incremental behavior • Fast Lane and other Premium Benefit Offerings • Resort Hotels • Advanced implementation of POS systems allows for more consistent, real-time data • Development of an in-house Revenue Management department 21 Dynamic Pricing Opportunities |
 Capital Expenditures • Marketable capital investments average 9% of net revenues Invest an additional 9% for labor and material for annual maintenance expense through P&L ~18% of revenue spent on physical plant • Incremental capital investments of ~$20 million in deferred infrastructure Advance implementation of POS systems at four properties Resort refreshment • Review of non-core asset (i.e. Knott’s Soak City – San Diego) • ROI target is to achieve returns of >15% on marketable investments in new rides, attractions and hotels 22 |
 Expense Productivity We apply disciplined metrics to the prioritization of capital and management of expenses • High fixed cost structure provides leverage for incremental visits and in-park spending Labor is largest cost - ~55% of operating expenses Large seasonal workforce with minimal impact from new healthcare reform • Opportunity to expand margins over the long-term through disciplined expense control Ongoing commitment to re-invest in the overall guest experience at a measured pace (i.e. Knott’s Berry Farm) 23 |
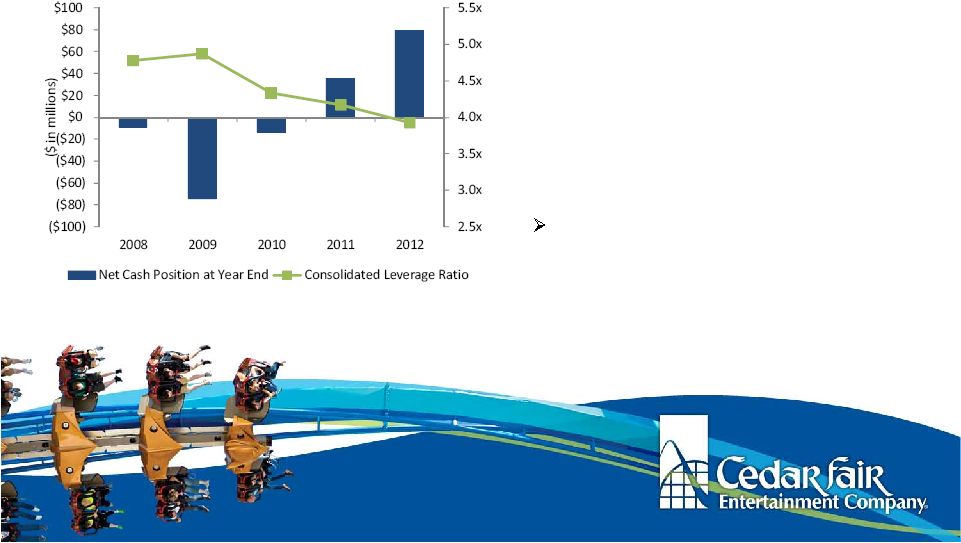 Solid Balance Sheet Our focus on de-leveraging has provided us with the financial flexibility to capitalize on future opportunities 24 • Reliance on revolving credit facility has been significantly reduced over past 5 years • 2012 Consolidated Leverage Ratio was 3.9x Based on 2013 guidance expected to be 3.7x at 12/31/13 |
 Debt Profile • Total variable-rate term debt has been converted to a fixed- rate through the use of interest rate swap agreements • No maturities until our revolving credit facility matures in 2018 Revolver capacity = $255 million • Cost of debt is expected to be ~6.3% in 2013 • Call premium on the $405 million, 9 1/8% unsecured notes meaningfully decreases over the next 12 to 15 months 25 |
 Why an MLP? • Strong cash flows that exceed the needs for organic growth and expansion • Structure is flexible to allow Cedar Fair to operate and manage its business and financial position without significant restrictions No restriction on partnership from both “owning” and “operating” its assets (vs. REITs) Expansion into same lines (i.e. amusement parks, hotels/lodging, retail, etc.) of business does not jeopardize tax • Avoid double-taxation of cash flow • Good acquisition currency 26 |
  Significant Free Cash Flow 27 Strong operating results allow for continued distribution growth, while also providing us with the flexibility to explore additional investment in organic growth opportunities FUNforward (In millions, except per unit amts) Projected 2013 2016 Target Adjusted EBITDA $400 - $410 $450+ Capital Expenditures ~120 ~110 Cash Taxes 10 - 15 ~40 Cash Interest ~100 ~85 Excess Cash Flow $165 - $180 ~$215 Excess Cash per Unit $2.95 - $3.22 ~$3.85+ |
 OPERATIONAL OVERVIEW Richard Zimmerman Chief Operating Officer |
 Operational Overview Our core operations are strong with opportunities to grow. • High quality, well maintained parks • Loyal high-repeat customer base • Seasoned, dedicated management • Resort lodging compliments our core properties • FUNforward growth opportunities Enhanced guest experience Premium product offerings 29 |
 High Quality, Well Maintained Parks Our core operations are strong with opportunities to grow 30 |
 Loyal, High-Repeat Customer Base Ingrained tradition has led to a loyal, high-repeat customer base • 9 out of 10 guests are repeat visitors • ~40% of attendance from season passholders Expected to grow in 2013 • Strong Net Promoter Scores • Majority of guests come from within a 150 mile radius CP draws from outside this radius 31 Genetic Vacation Behavior |
 Seasoned, Dedicated Management New employee initiatives introduced to ensure deep bench of talent is maintained for the future 32 Name Park Years with Cedar Fair Years In Industry H. John Hildebrandt (64) Cedar Point 40 40 Raffi Kaprelyan (51) Knott’s Berry Farm 34 34 Norm Pirtovshek (59) Canada’s Wonderland 34 34 Greg Scheid (50) Kings Island 25 26 Bart Kinzel (47) Carowinds 23 23 Pat Jones (51) Kings Dominion 34 34 Jason McClure (43) Dorney Park 12 12 Raul Rehnborg (43) California’s Great America 26 26 Dave Frazier (48) Valleyfair 20 26 Frank Wilburn (47) Worlds of Fun 30 30 Camille Jourden-Mark (47) Michigan’s Adventure 30 30 |
 33 Cornerstones Cedar Fair is dedicated to providing our guests with world-class thrills, fun and family entertainment, guided by the principles of safety, service, courtesy, cleanliness and integrity. |
 Our Properties Cedar Point: Sandusky, Ohio • Voted “Best Amusement Park in the World” for 15 straight years (a) Only amusement park to ever hold this title Home to Millennium Force, the “#1 Steel Coaster in the World” Highest attended seasonal amusement park – more than 3 million guests annually 34 (a) Source: Amusement Today, September 2012 |
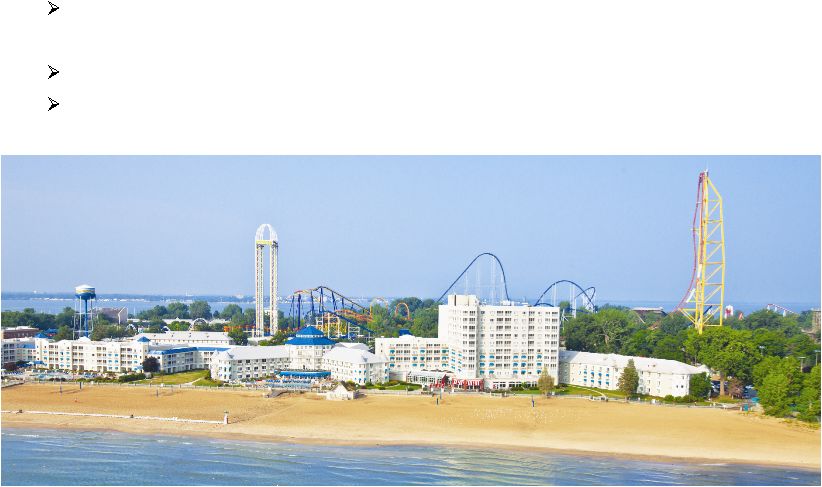
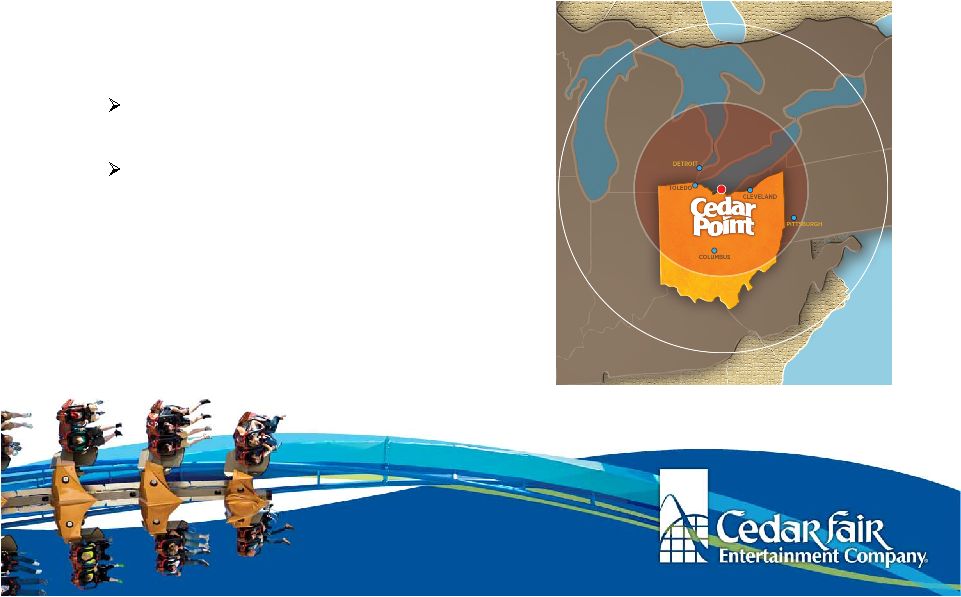 Our Properties Cedar Point: Sandusky, Ohio • America’s only super-regional amusement park Resort lodging compliments seasonal operations Draws guests from all 50 states • Highest margins and in-park guest per capita spend in our portfolio • Highest guest length-of-stay 35 |
 Our Properties Cedar Point: Sandusky, Ohio Growth opportunities: Attract unique visitors from outer markets Growth in season pass sales Advance Purchase Commitments Additional premium product offerings Increased capture rates on food 36 • In-park spend • Attendance |
 Our Properties Cedar Point: Sandusky, Ohio Growth opportunities: “Place-making” – 144 year old park has areas that could be “refreshed” - Additional focus on rides and attractions the entire family will enjoy Under-utilized assets (i.e. beach, waterfront property) Resort hotels – good, better, best experience 37 • Capital Expenditures |
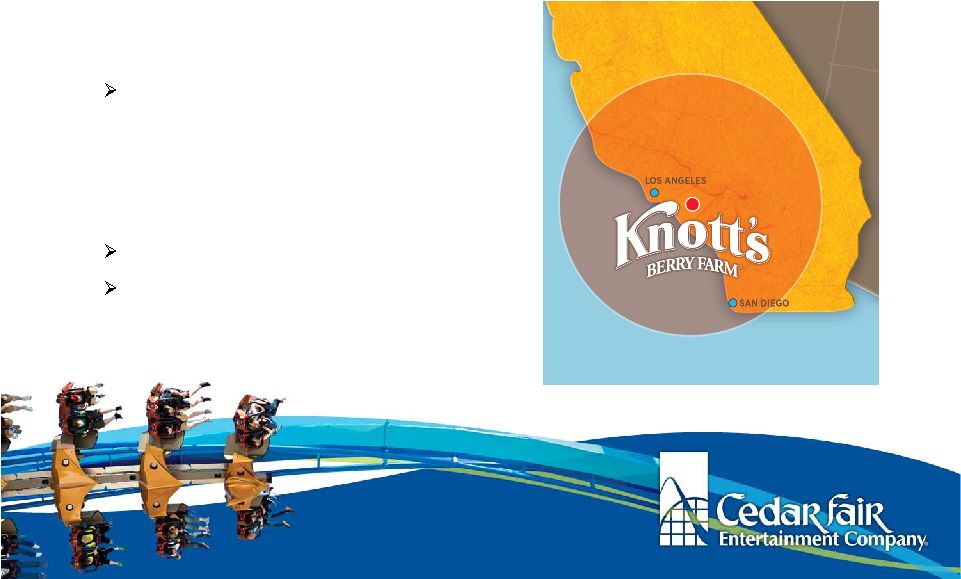 Our Properties Knott’s Berry Farm: Buena Park, California • Year-round park with renowned seasonal events “Haunt” consistently voted one of the “Best Halloween Events in the World” (a) • Deep in heritage and tradition Fondly known as “The Farm” Fits the competitive landscape as the “park of the locals” 38 (a) Source: Amusement Today, September 2012 |
 Our Properties Knott’s Berry Farm: Buena Park, California Growth opportunities: Growth in season pass sales Advance purchase commitments (i.e. Haunt) • “Place making” • Premium product offerings • Dynamic pricing around special events 39 • Value proposition within the region it operates |
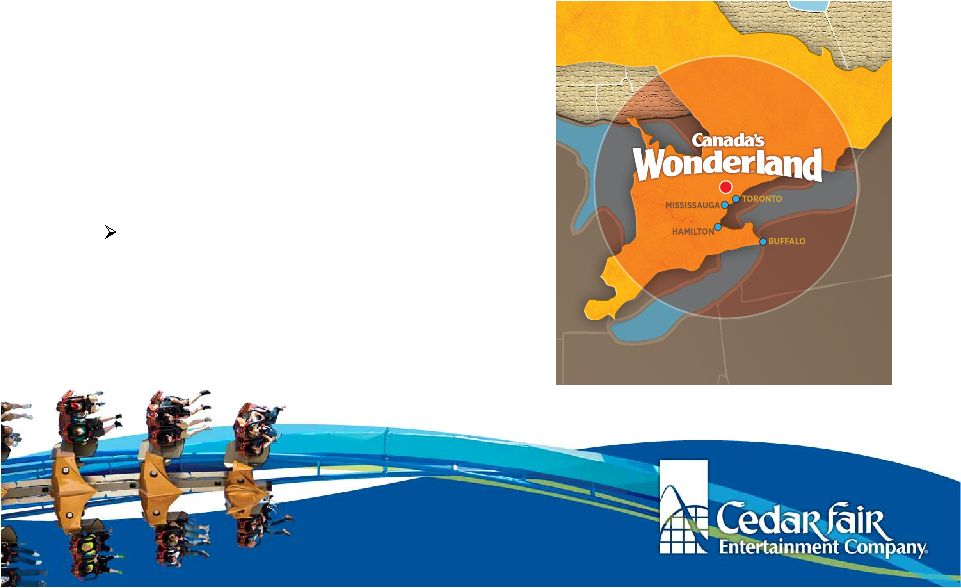 Our Properties Canada’s Wonderland: Toronto, Ontario • Canada’s “National Amusement Park” • Largest collection of roller coasters and attractions in Canada • Large season passholder base More than 50% of their annual attendance • Balanced mix of thrill, family and water attractions 40 |
 Our Properties Canada’s Wonderland: Toronto, Ontario Growth opportunities: • Special events • Expansion of mass transit system • Extending the length of stay • Premium product offerings |
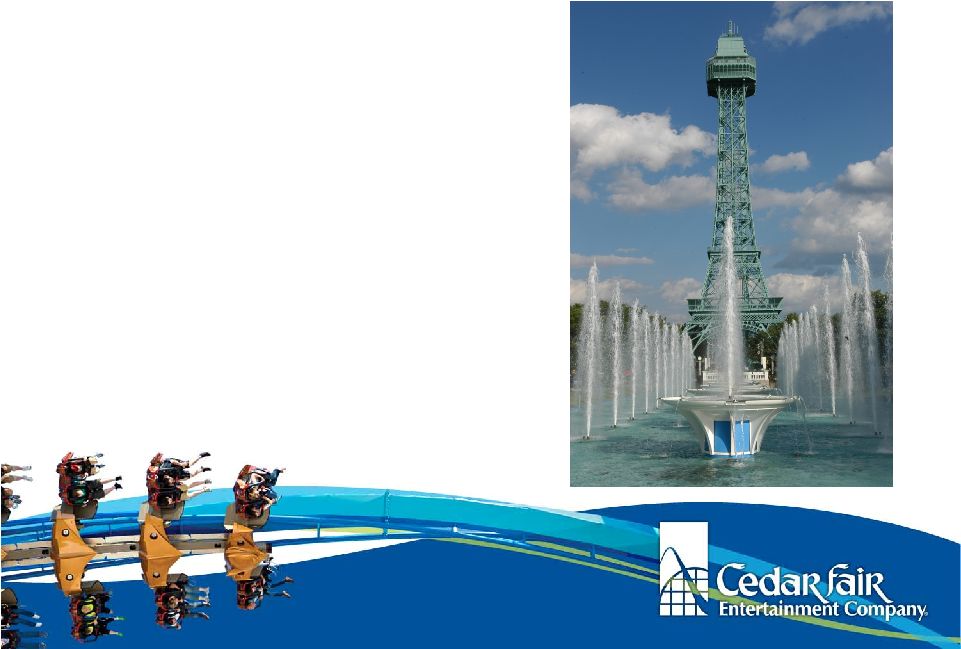
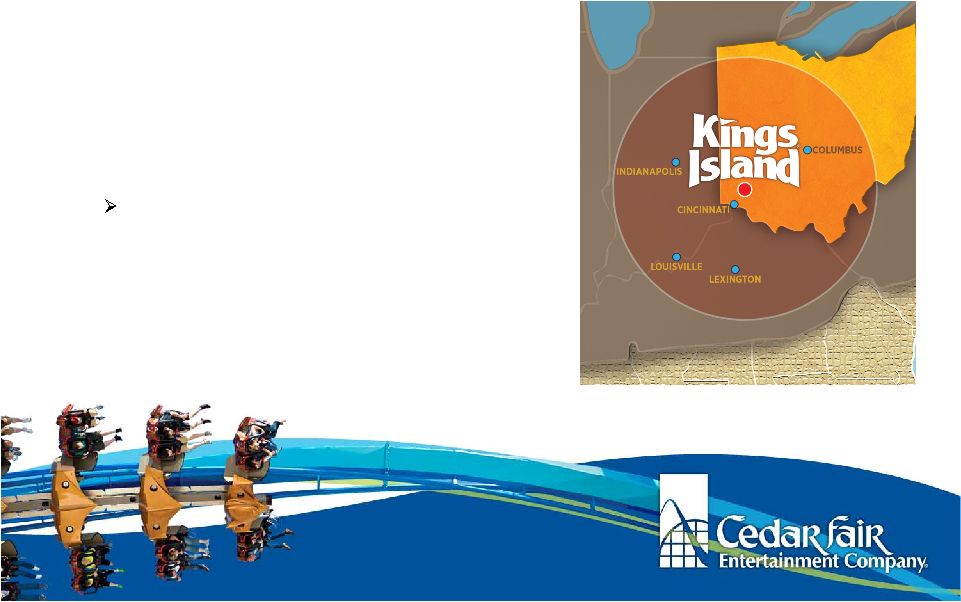 Our Properties Kings Island: Cincinnati, Ohio • Voted “Best Kids’ Area in the World” for 12 years in a row (a) • Deep in heritage and tradition • Large season passholder base More than 50% of their annual attendance • Employees with multi-park experience allows for successful testing of new products and initiatives 42 (a) Source: Amusement Today, September 2012 |
 Our Properties Kings Island: Cincinnati, Ohio 43 Growth opportunities exist: • Strong value proposition for park size and regional market location • Premium product offerings • Introduction of additional “thrill” attractions |
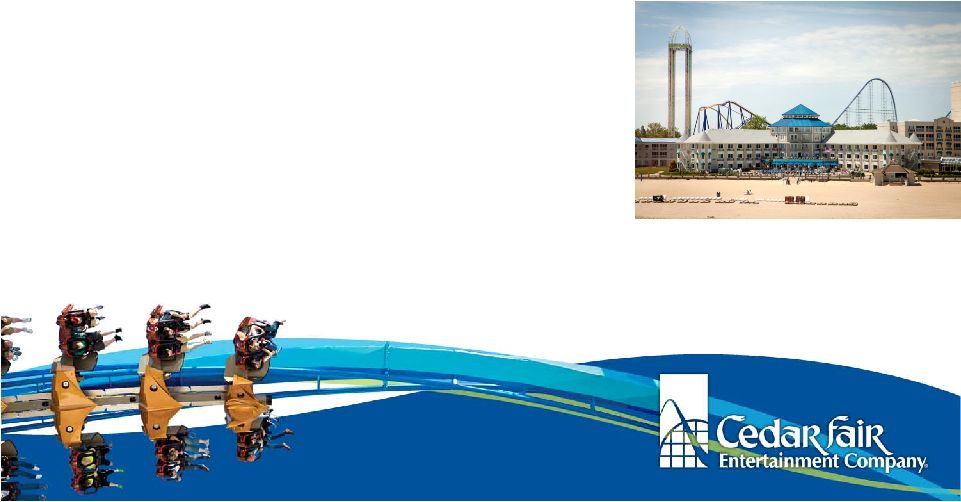
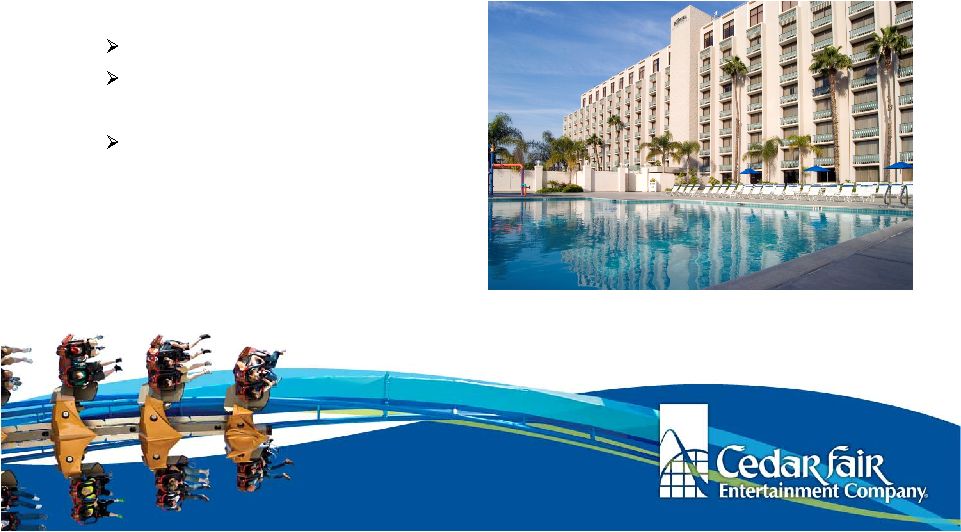 Resort Properties Complement Seasonal Business Staying onsite allows guests to enjoy our parks at their own pace, creating more memories with their family and friends • We own and operate: 5 Hotels - ~1,700 rooms 5 Campgrounds, including deluxe RV sites and cabins 2 Marinas • Resorts and upscale campgrounds extend the length of stay of our guests 44 |
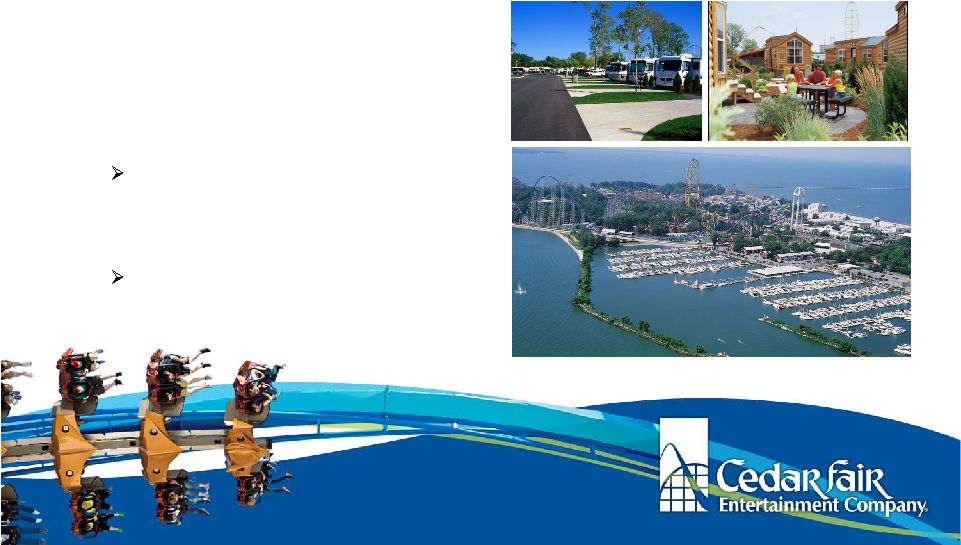 Resort Properties Complement Seasonal Business • Opportunities exist to expand these offerings at many of our regional park locations Cabins and upscale campgrounds are an attractive, low cost investment Significant undeveloped land adjacent to majority of our parks 45 Staying onsite allows guests to enjoy our parks at their own pace, creating more memories with their family and friends |
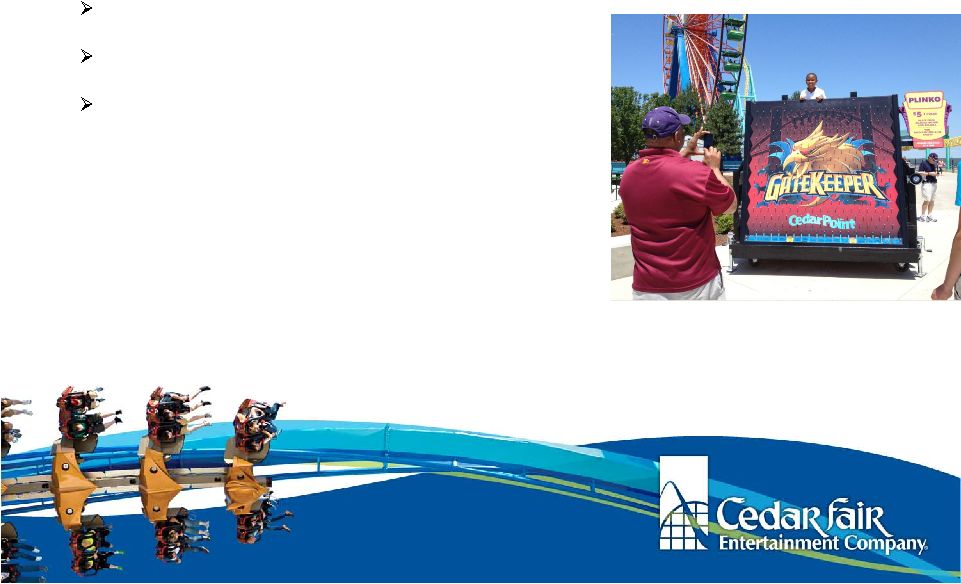
 Enhanced Guest Experience We deliver compelling value for the price paid, at every park, every day • Balance of thrill and family-friendly offerings sustain valuable family:teen audience mix • Broader entertainment offerings; improved “Streetmosphere” • Changing the way we think about in-park revenue channels Re-prioritizing square footage to where we see revenue opportunities Introduction of Plinko to win front of line pass for a specific ride 46 |
 Enhanced Guest Experience We deliver compelling value for the price paid, at every park, every day • Quality enhancements in food to drive greater capture and support pricing premiums Introduction of Corporate Foods Department to ensure best practices utilized across all properties Re-engineered food menus for 2013 operating season To-date total food per capita is up 4% Coke – leverage one beverage provider across all properties 47 |
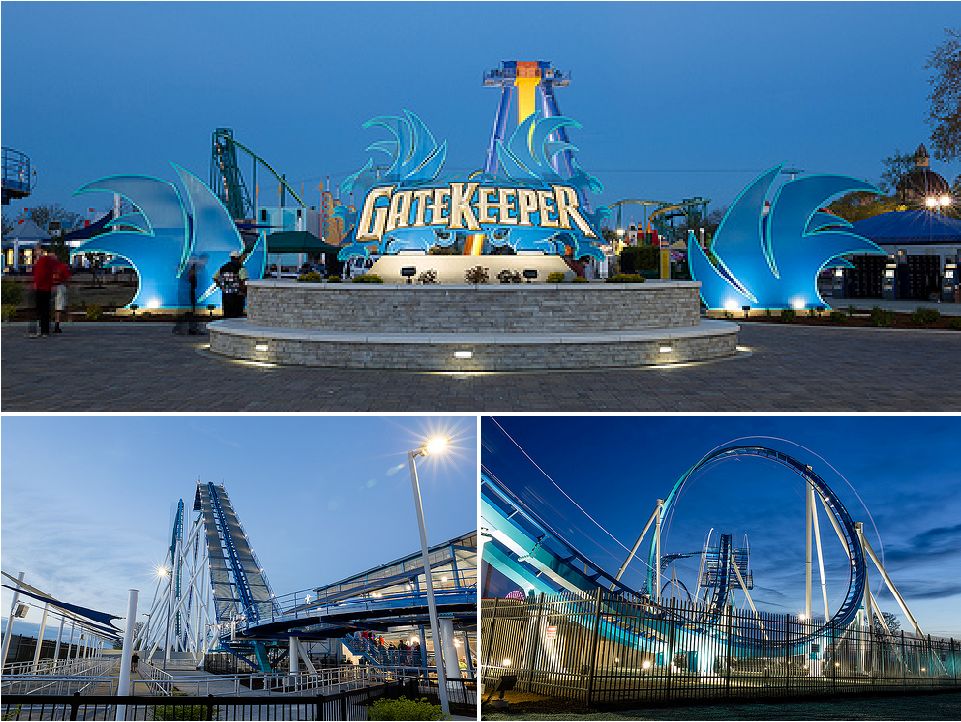
 Premium Product Offerings We will continue to expand our premium offerings to benefit-oriented consumers • Fast Lane Sales up when compared with this time last year 2012 was the first year of implementation across all properties Most popular at parks with large number of thrill rides Expanded capacity at Cedar Point in 2013 through introduction of GateKeeper Fast Lane Plus upgrades have been strong • Refreshment of Hotel Breakers will allow us to offer resort guests a “good, better, best” experience 48 |
 49 Q & A * * * * * * * * |
 4 BUILDING FUN Rob Decker Corporate Vice President, Planning and Design |
 $317 $359 $375 $391 $400-$410 $450+ 2009 2010 2011 2012 2013 2016 ~4% CAGR Strategic Growth Opportunities Adjusted EBITDA (a) Growth • Enhanced guest experience • Improved consumer messaging • Dynamic pricing and advance purchase commitments • Premium product offerings • Strategic alliance fees and promotional leverage • Capital and expense productivity ($ in millions) Strategic Growth Drivers (a) See Appendix for Adjusted EBITDA reconciliation 5 On track to achieve targeted Adjusted EBITDA of $450+ million by 2016 51 |
 Planning and Design Overview • What makes FUN fun • Strategic planning • Decisive execution • Controlled investment • Targeted development • Opportunities for future growth Long-term strategic planning allows us to optimize capital expenditures through controlled spend and increased marketability, resulting in lower guest acquisition costs 52 |
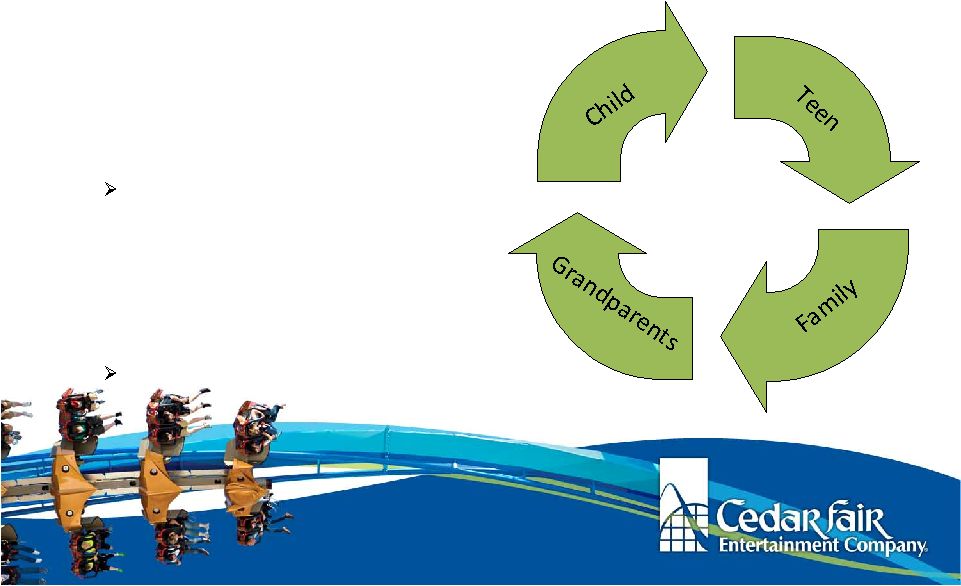
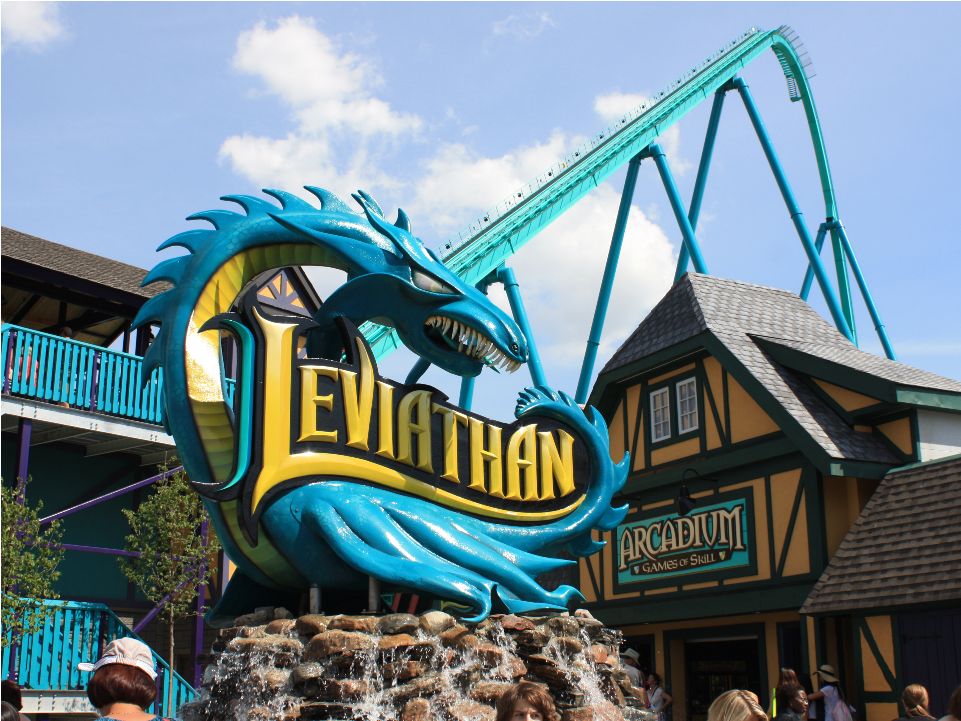
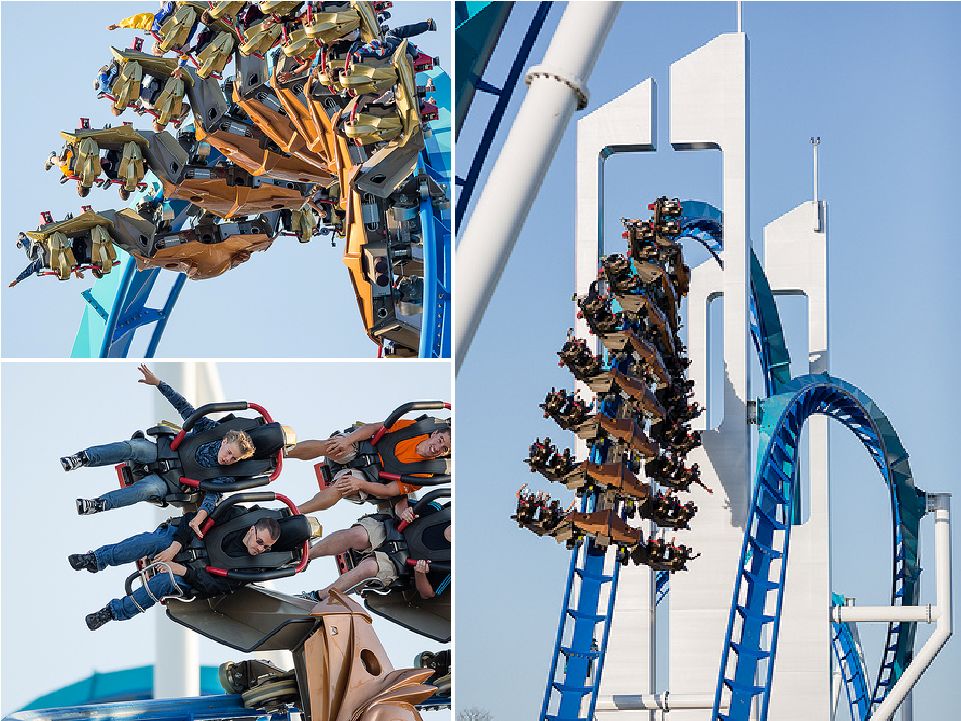
 What Makes FUN Fun • Long-term focus on the guest experience • Investing to scale • Strong identity for new rides and attractions Diamondback Leviathan GateKeeper • Experienced in-house design team Balanced mix of thrill and family rides and attractions creates memories for all generations 53 |
 54 |
 55 |
 56 |
 57 |
 58 |
 Strategic Planning • Execute the business plan Analysis – understand our audience and how our parks work Translates company objectives near term Monitor progress Set clear direction and goals for the future Strong in-house design team guides the process ensuring a unique, timeless and memorable experience 59 |
 Decisive Execution • Customer-centric creative division Serves all Cedar Fair properties Keeps all design activity in-house Match creativity to business plan • Create, innovate and drive mass appeal • Develop entertaining, unique products • Customize our product to fulfill operation needs to exceed the guest’s expectations 60 |
 Controlled Investment • Build on strengths and fill gaps Best practices across the parks Alternate thrill rides, family attractions and infrastructure improvements to maximize target audience and customer spending • Manage development costs Cedar Fair soft costs are 1-2% on major projects and are among the lowest in the industry Cost control through combined purchases, duplicated successes and “keeping it simple” 61 |
 |
 63 |
 64 |
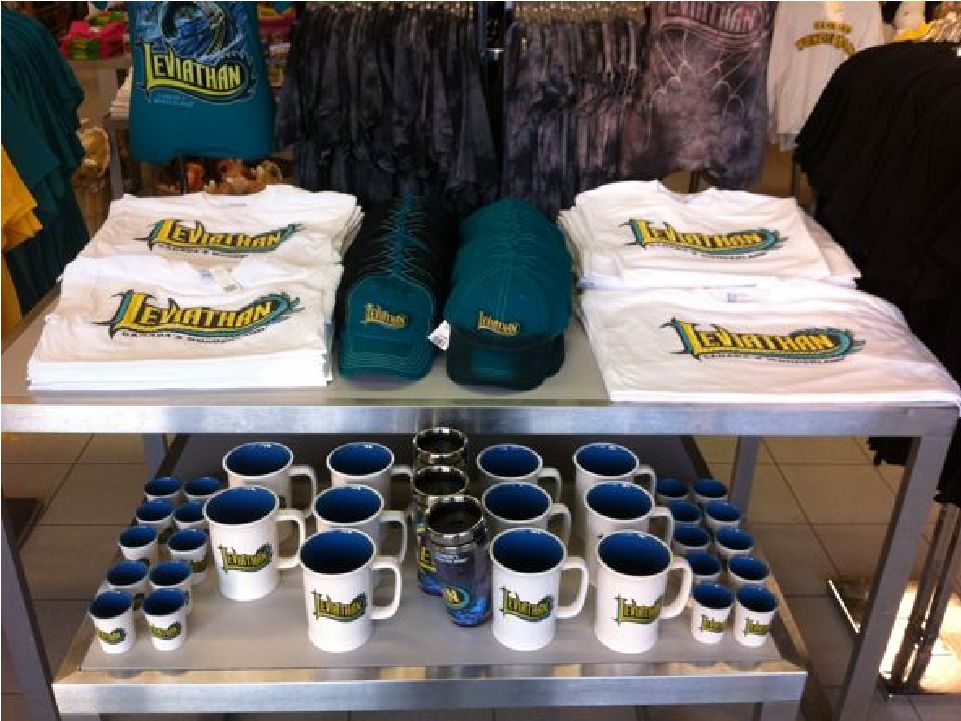
 Targeted Development • Attractions: Focus on creating memorable, repeatable, reprogrammable and unforgettable experiences • Seasonal Events: Haunt, parades, nighttime experiences • Revenue Centers: Retail shops, resorts, restaurants, snack stands, carts and games 65 |
 66 |
 67 |
 68 |
 69 |
 70 |
 71 |
 72 |
 73 |
 74 |
 75 |
 Targeted Development • Placemaking Roots in Urban Design Creating identity Invest in guest comforts by providing appealing and welcoming places The guest is our key consideration 76 Placemaking is forefront in the development process as we build an attraction or area that the guest is able to identify with |
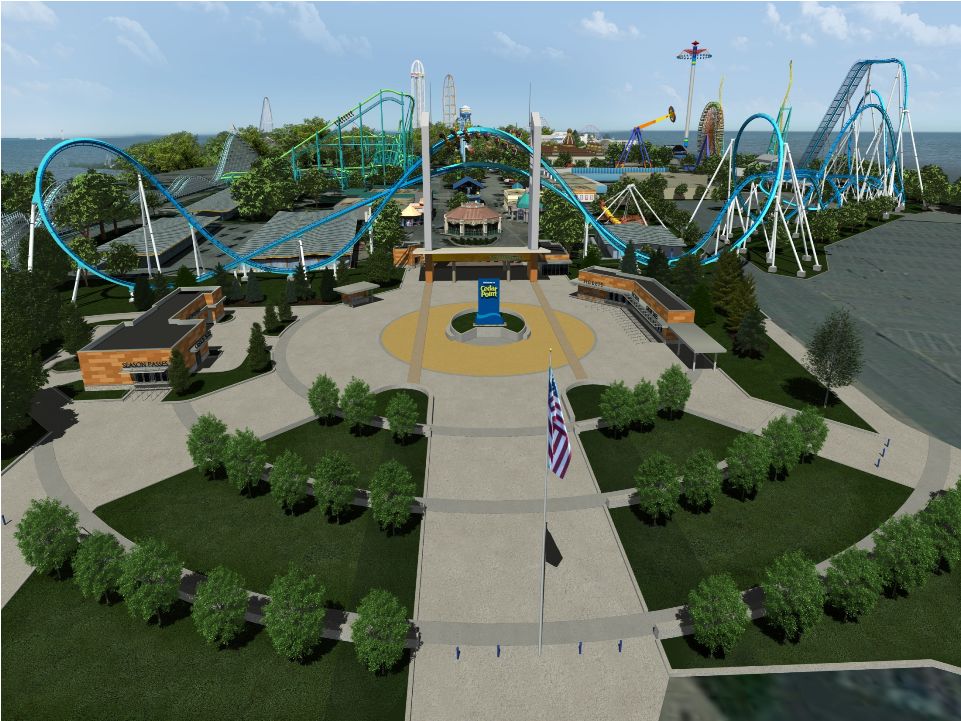
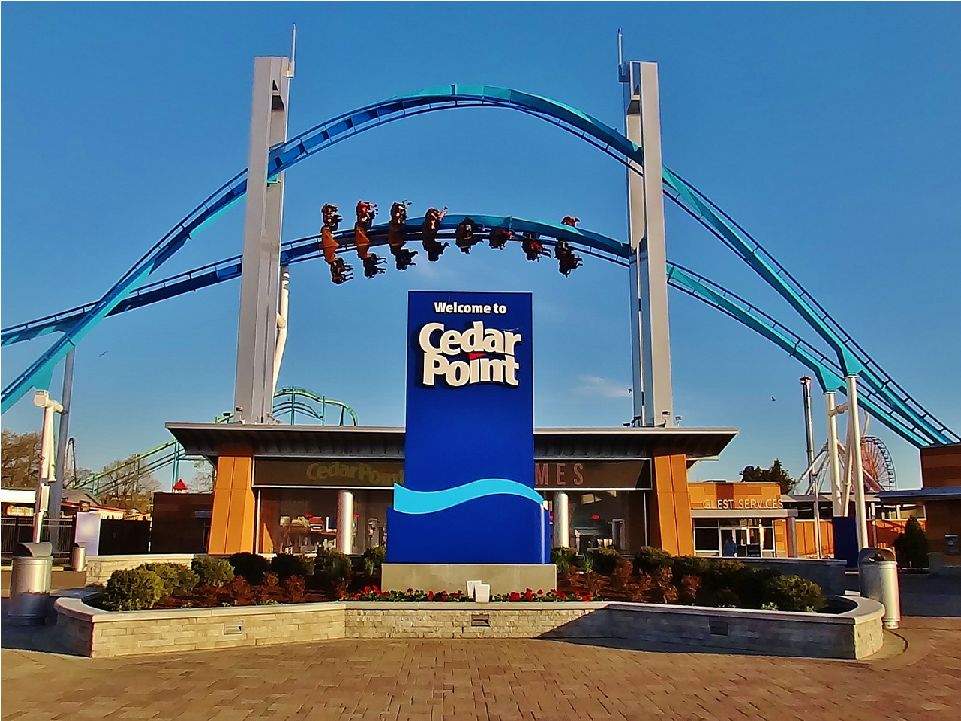
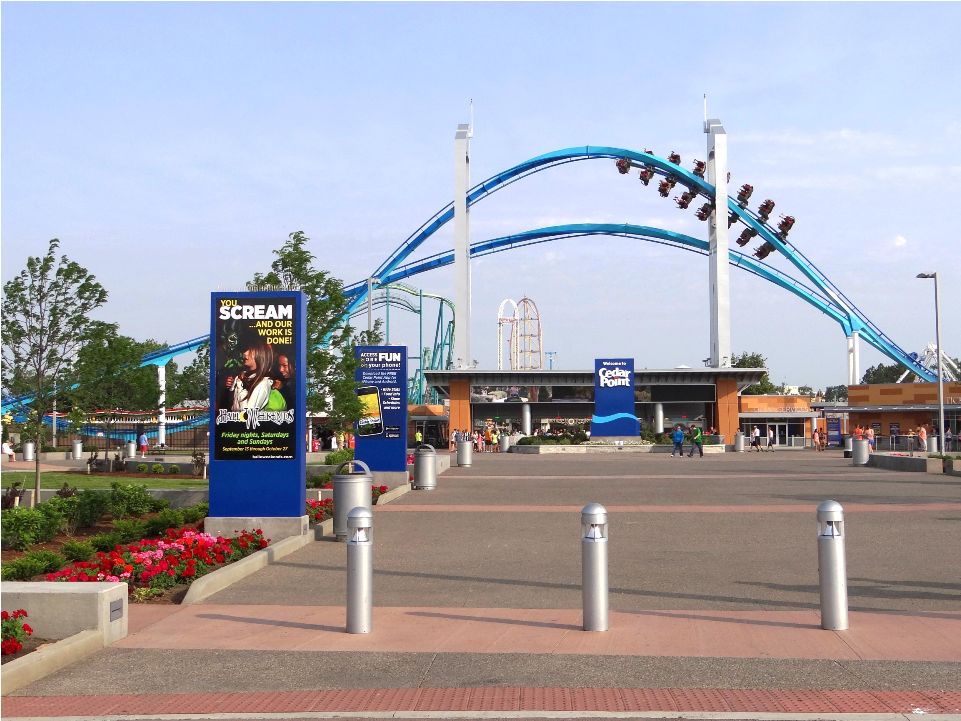
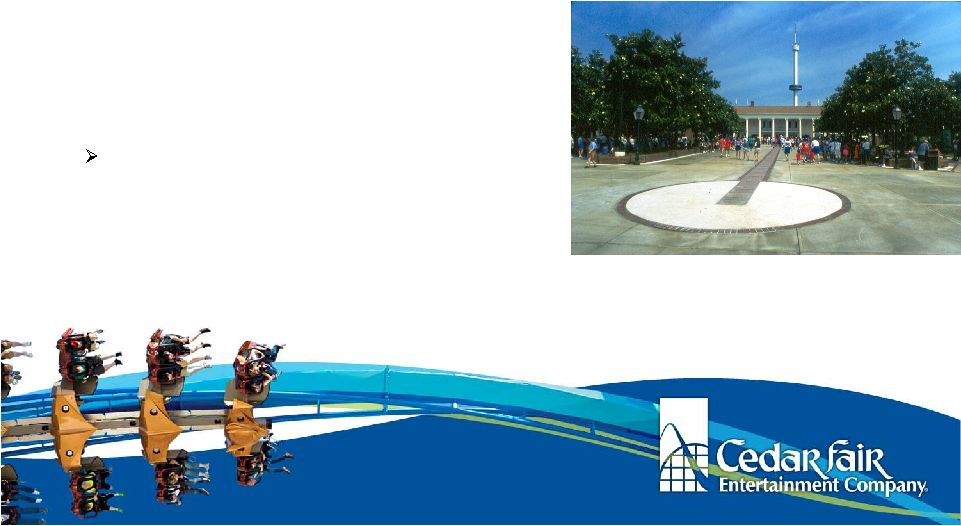
 Targeted Development 2013 • Cedar Point – GateKeeper and front gate Create a “sense of place” – a strong visual statement Evoke an emotional response Generate excitement around a one-of-a-kind place 77 |
 June 26, 2013 78 |
 79 |
 80 |
 81 |
 82 |
 83 |
 84 |
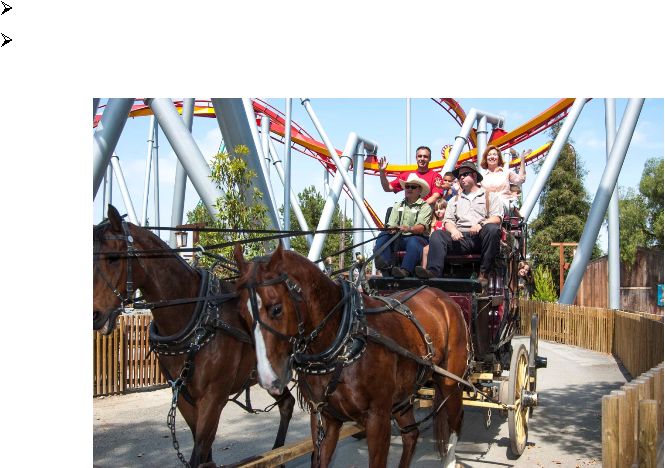
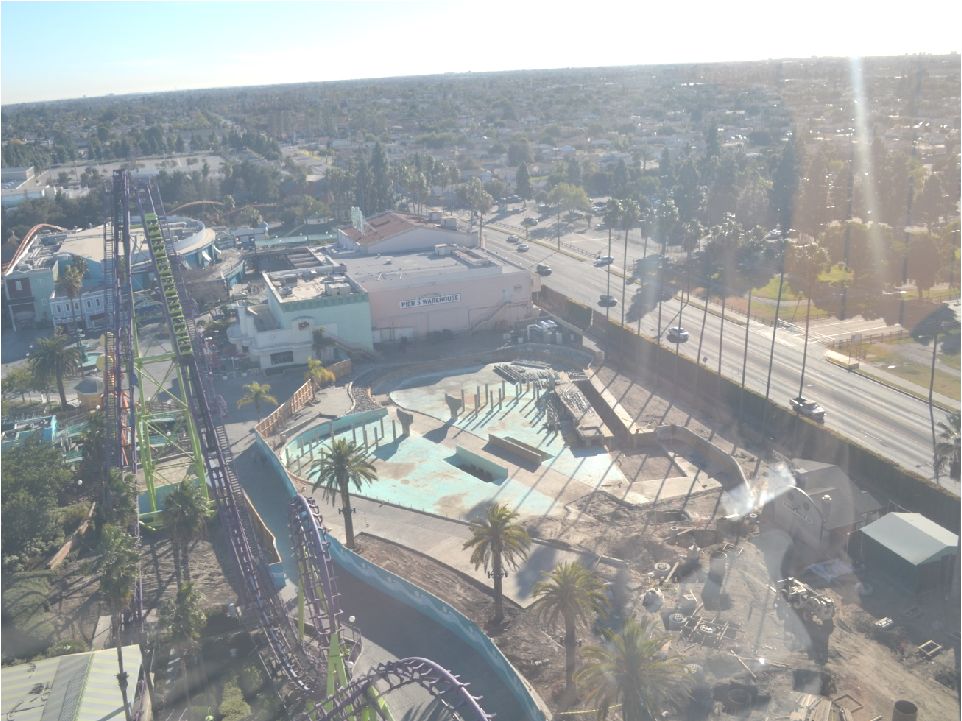
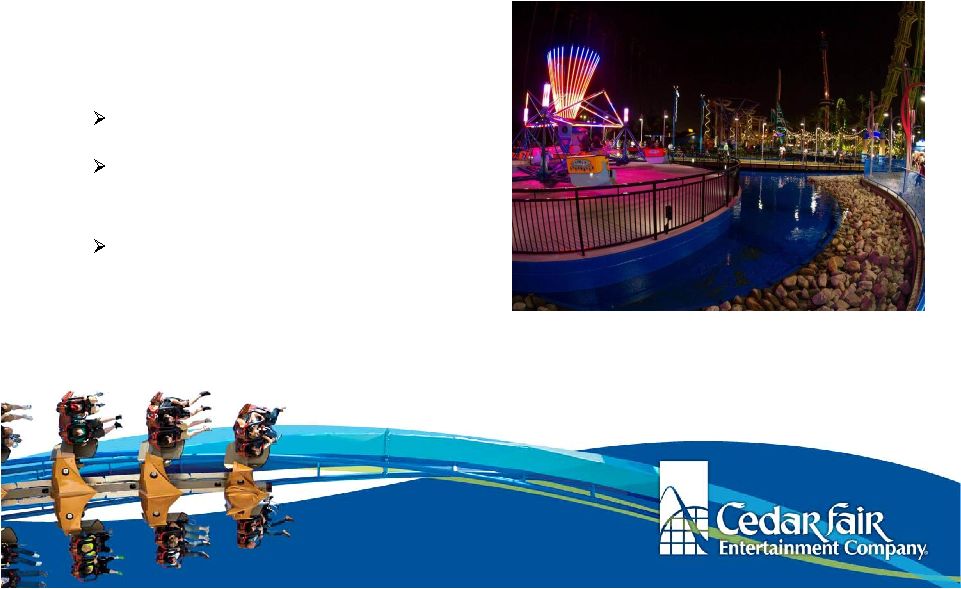 Targeted Development 2013 • Knott’s Berry Farm - Boardwalk area Family ride product Cluster to reach critical mass, scale Style and environmental planning 85 |
 86 |
 87 |
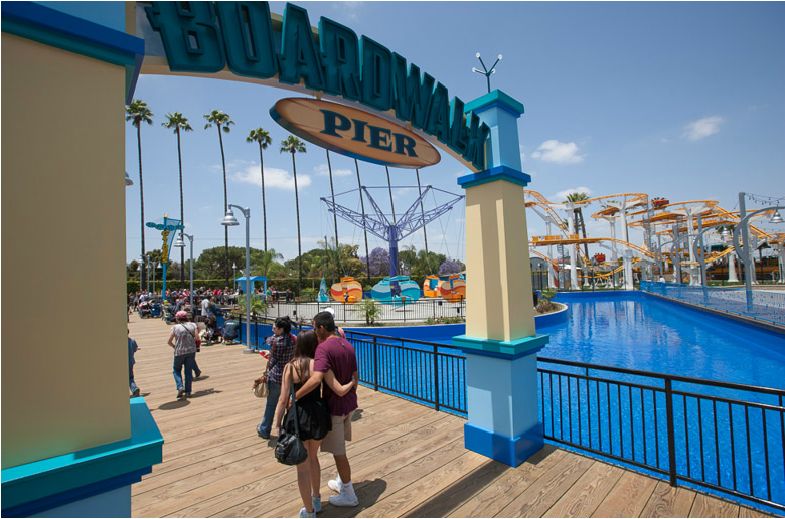 Targeted Development 2013 Classic seaside architecture combined with water and boardwalk elements to create a tranquil setting for family attractions 88 |
 89 |
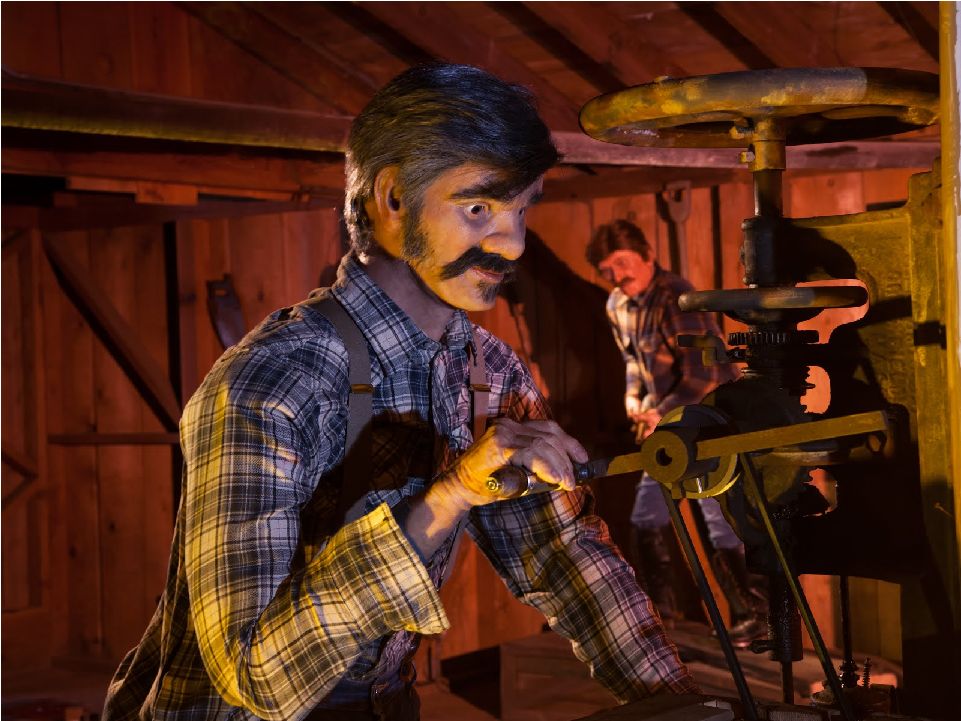
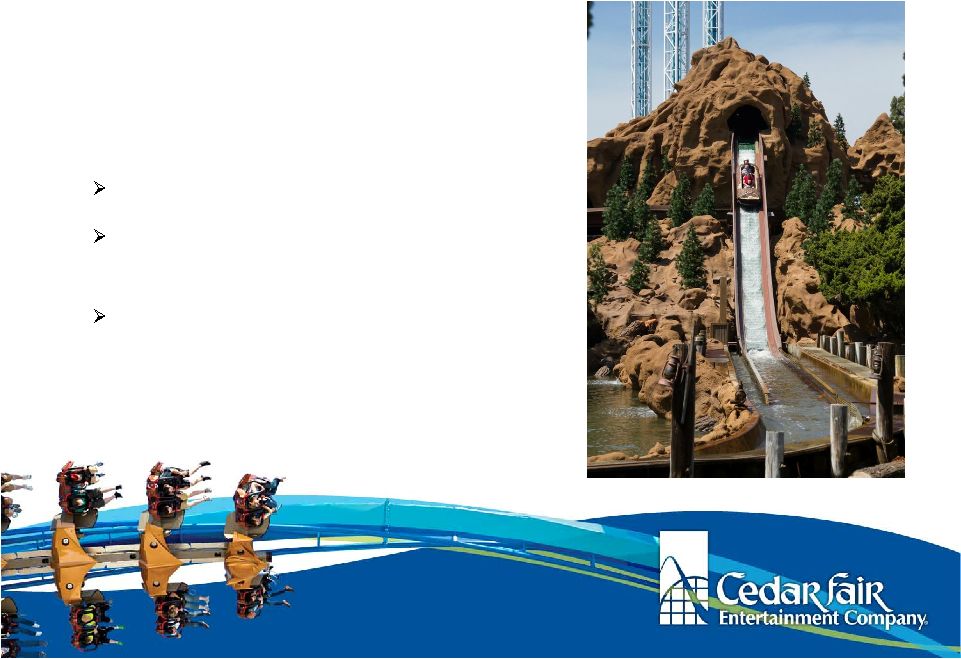 Targeted Development 2013 • Knott’s Berry Farm - Renovated Log Ride Restore, refresh, reflect Classic log ride – a heritage piece for the park Market feedback – “Restore the legacy of the park” 90 |
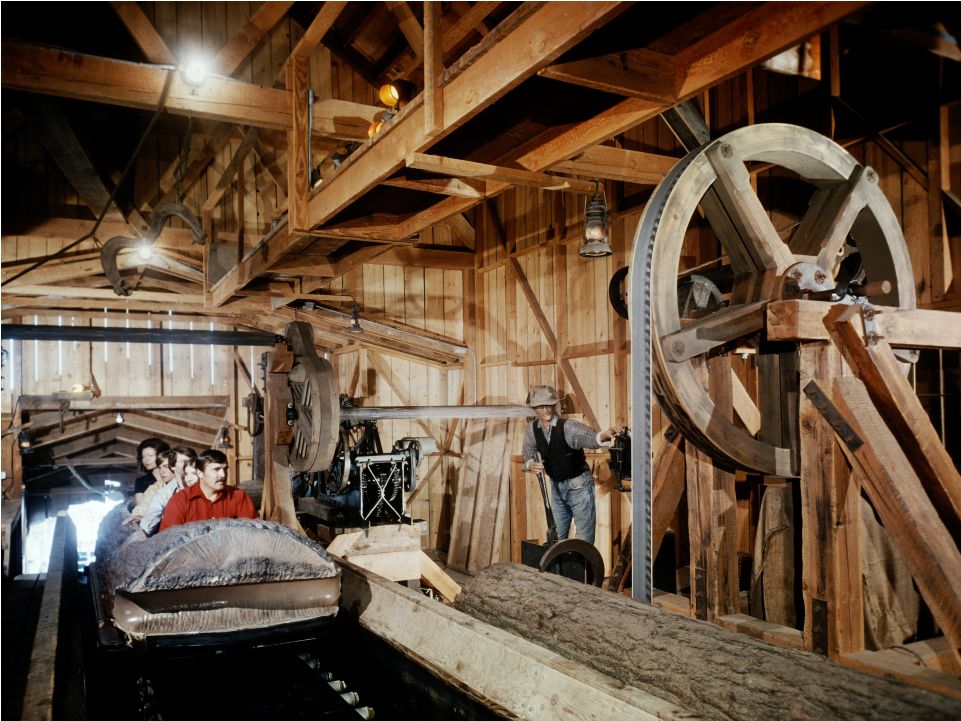 91 |
 92 |
 93 |
 94 |
 Opportunities • Updating areas within aged parks • Undersized parks relative to market size Example: Carowinds • Activation of unused, low-traffic areas • Adjacent resorts 95 |
 Opportunities - Resort • Cedar Point’s Hotel Breakers Full renovation – a strategic niche to raise the bar on everyone’s park experience • Cabins & Campgrounds Cedar Point, Carowinds, Kings Dominion, Kings Island and Michigan’s Adventure Strong ROI, length of stay and customer loyalty Adjacent resorts and upscale campgrounds favorable complement to our seasonal operations 96 |
 IT Update Jim Rein Corporate Vice President, Information Technology |
 Today’s Technology Ready to adapt a changing environment with an emphasis on enhancing our guest experience • Infrastructure • Ticketing • E-Commerce • Mobile • Point-of-Sale (POS) • Opportunities 98 |
 Infrastructure The completion of basic technology infrastructure allows us to begin focusing on enhancing the overall guest experience • Expanding beyond traditional networks Real time services Wifi, Wimax, Cellular Ability to connect anything to anywhere Wireless turnstiles, real time surveys Wireless POS Wifi in dorms and hotels 99 |
 Ticketing Evolution of ticketing has revolutionized the offerings available to guests as they plan their day(s) in advance • Need to support dynamic pricing and marketing programs • Bundling Admissions, food, parking, Fast Lane all on one ticket • Expand Advance Purchase Commitments Cabanas, Strollers, Wheelchairs, etc. 100 |
 E-Commerce Platform • Outsourced in 2012 to accesso Industry leader in online ticketing • Expanded menu of available online products Season passes - “multi-level offerings” Halloween events - “dynamic pricing” Special promotions - “Cleveland Clinic” • Installment payment programs Season passes, hotel reservations Common e-commerce platform allows for enhanced guest analytics and expanded options 101 |
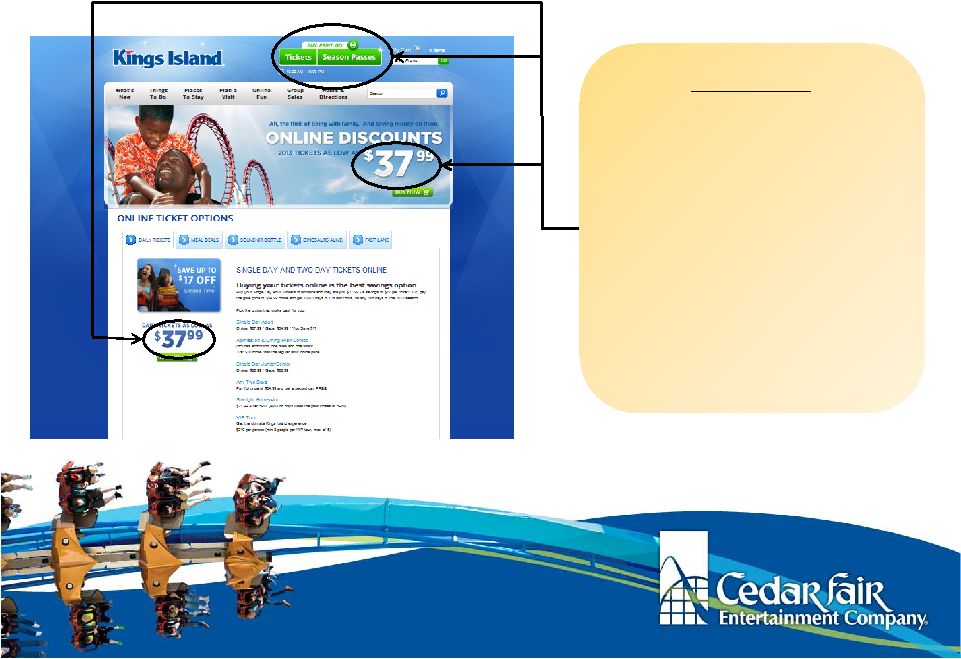 Actionable E-Commerce Ticket Sales 102 • Green ticket buttons are intuitive and clear for purchase of tickets • Several options for purchase on one page gives the guest choices • Prices and specials are clearly featured for various options |
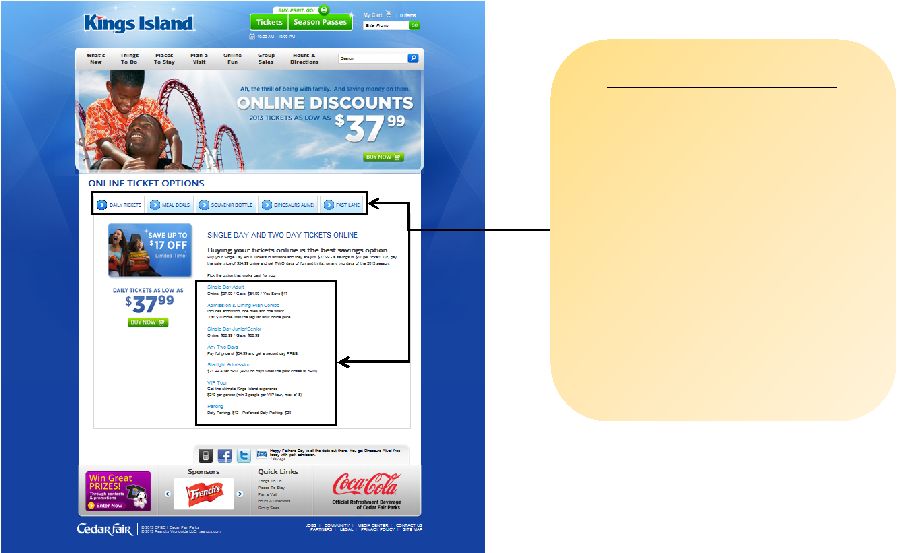 Upsell Opportunities E-Commerce Ticket Sales 103 • Guests have the opportunity to bundle packages • Upsell opportunities with premium benefits, parking, fast lane and meal offerings • Easy and intuitive to plan for vacation |
 Mobile Capitalizing on mobile trends through park specific apps • >1 million app downloads in 2012 • Rapidly expanding sales vehicle for tickets • Hotel reservations • Expanding the “Plan Your Day” before and during the visit 104 |
 • Room charges available at 450 locations at Cedar Point • Knott’s Berry Farm and Worlds of Fun added in 2013 • Accepts E-tickets for food, Fast Lane, etc. • 2D scanners everywhere • Process RFID devices as payments Point-of-Sale Systems 2D scanners allow us to accept mobile devices anytime and anywhere 105 |
 Opportunities Technology remains a major opportunity across our parks as we continue to drive a better, more connected guest experience • Mobile Payments • Gate Keeper • CRM • Wireless • Augmented Reality 106 |
 7 Jason McClure Vice President & General Manager, Dorney Park |
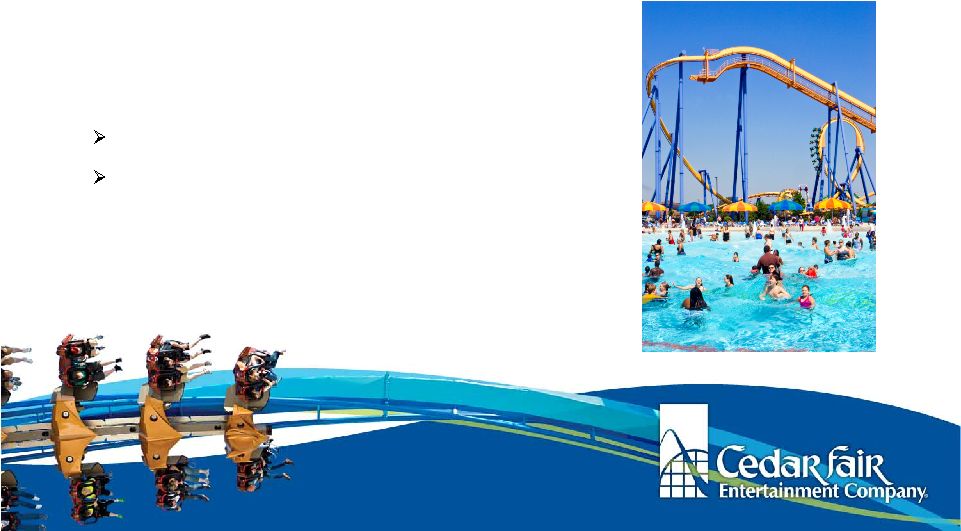
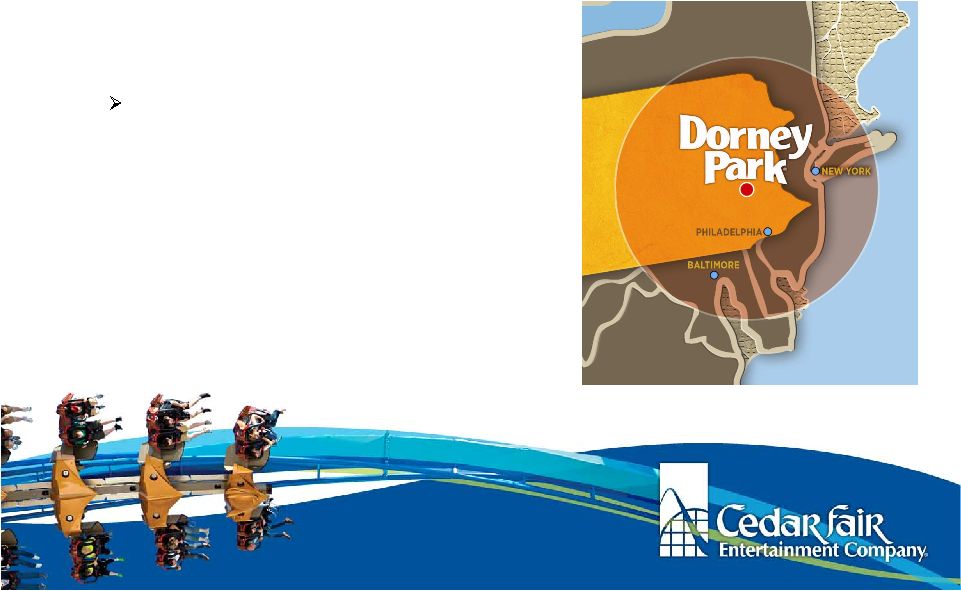 Dorney Park & Wildwater Kingdom Allentown, PA • Combined Amusement and Water Park “Two Great Parks for the Price of One” • Founded in 1884, one of the oldest traditional amusement parks in operation • Attractive markets – Philadelphia, Baltimore, and New York 108 |
 9 Challenge: Average guest spend in water parks has historically been lower than in amusement parks….Why? Wallet is in the locker 109 |
 10 FastPay Our incubator of 11 unique parks allows us to test a concept such as FastPay before broadly rolling it out • FastPay is a pre-paid gift card program • Media options include: Multiple use RFID wristband Single use RFID wristband Bar code enabled gift card • FastPay may be used at all in-park food and merchandise locations throughout the park 110 |
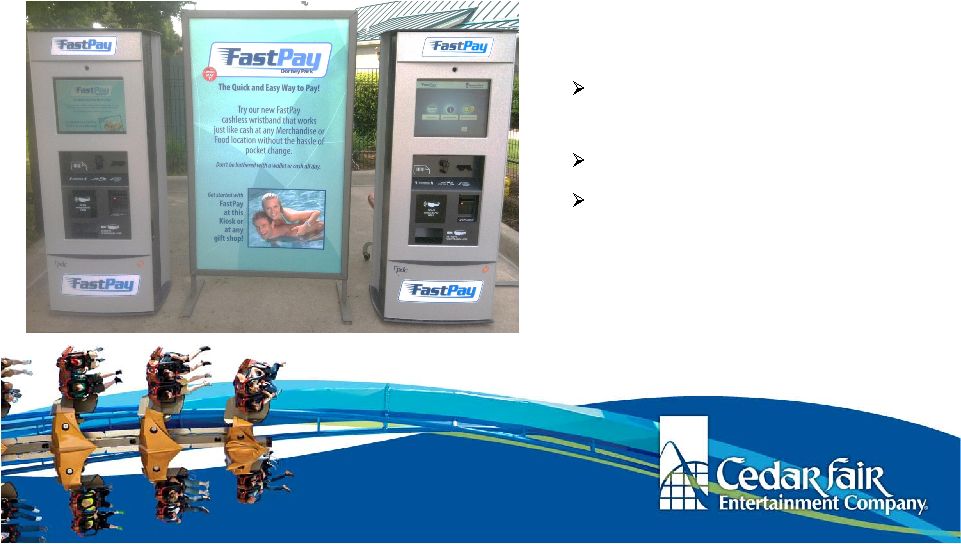 11 FastPay Multiple methods of activation and universal redemption make the product easily accessible and front-of-mind • Purchase at park Front gate ticket booths or guest services Merchandise locations FastPay kiosks 111 |
 112 FastPay Multiple methods of activation and universal redemption make the product easily accessible and front-of-mind • Purchase online and exchange voucher for a wristband at the front gate |
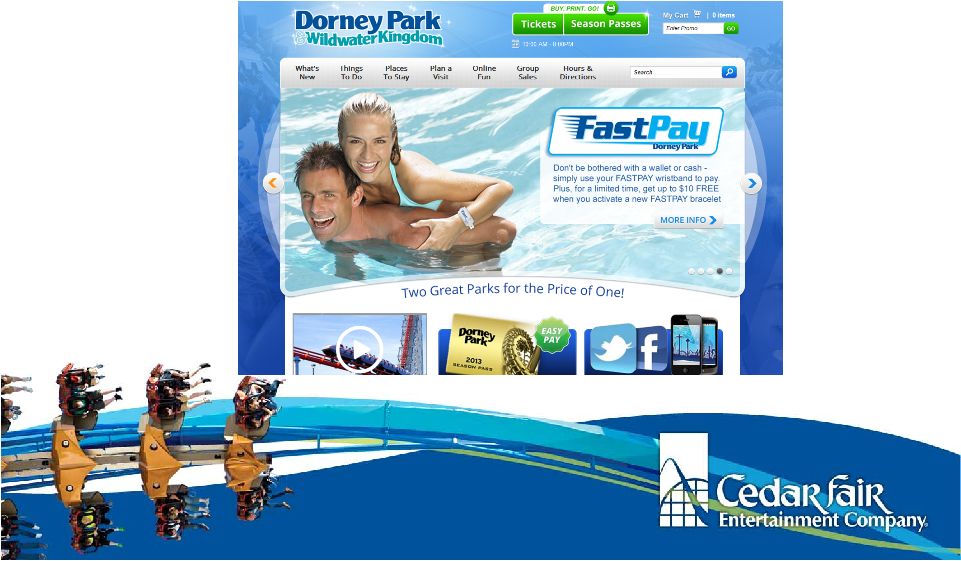 13 FastPay Guest awareness is vital to the success and launch of new programs 113 |
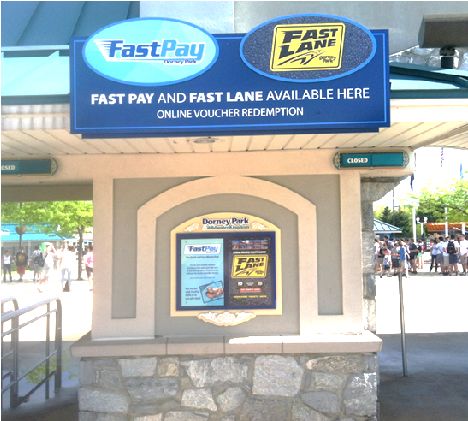
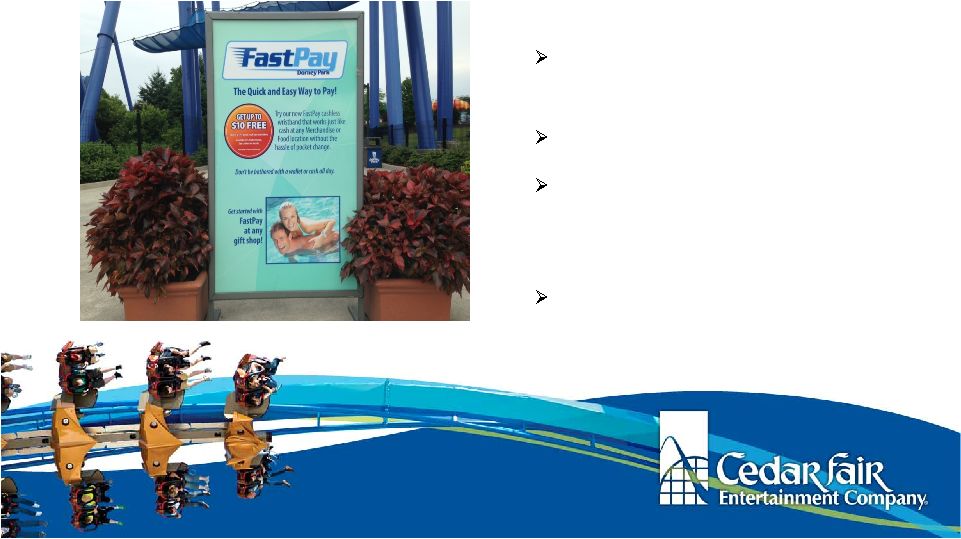 14 FastPay Update Guest awareness is vital to the success and launch of new programs • In-Park Main Plaza – web redemption booth Kiosk displays Merchandise locations: counter displays & window clings In-park displays and banners 114 |
 15 FastPay FastPay provides convenience for the customer and increased in-park spend and enhanced data on guest spending patterns for the Company 115 • Enhanced guest experience Money is easily accessible without the hassle of carrying cash or visiting a locker • Capital and Expense Productivity Leverages existing point-of-sale capabilities Enhances controls by reducing the number of cash transactions |
 16 FastPay FastPay provides convenience for the customer and increased in-park spend and enhanced data on guest spending patterns for the Company 116 • Dynamic pricing and advance purchase commitment Funds committed to Dorney Park Bonus cash and other incentives – Manage and promote spending without menu discounting or price changes |
 17 MARKETING OVERVIEW Kelley Semmelroth Executive Vice President and Chief Marketing Officer |
 Marketing Overview 118 1. Our Approach - Planning and Execution 2. Short & Long Term Goals - Building for the future while maximizing today’s opportunity 3. Messaging Strategies - Thrills Connect and Certified Fun 4. CRM Evolution - Building relationships while growing attendance & sales |
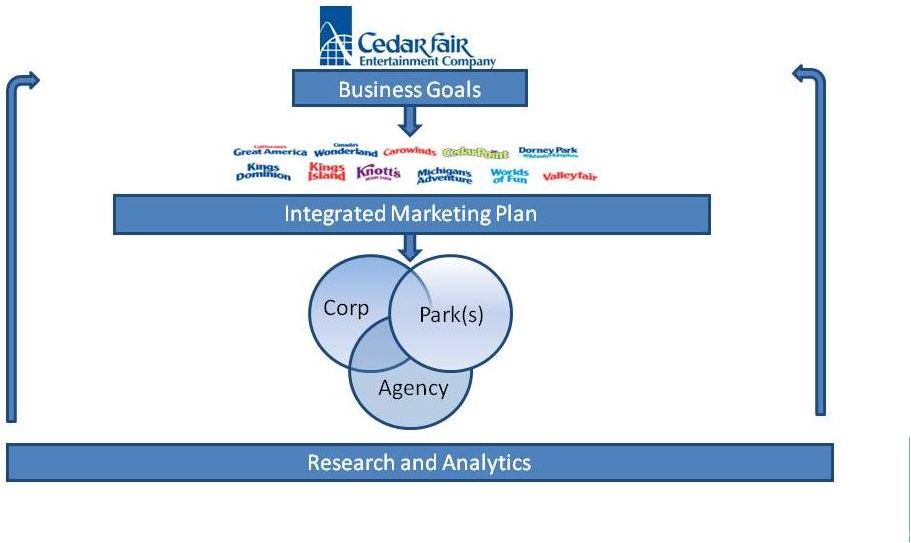 Our Approach Our unique marketing planning process allows for shared learning and increased efficiencies across the portfolio while driving optimal performance at the local level 1 Portfolio Level Planning, Messaging & Creative CRM, Web/Ecommerce, Pricing & Season Pass In-Park POS, Event, PR, Social, Group Sales & Promotions Market Level Audience, Media, Timing 119 |
 Priorities Today 120 • Maintain & Grow Season Passholder Segment Acquire incremental Passholders with pre- season pricing strategies Increase renewals of existing Passholders Improve value exchange • Build Unique Visits Attract new households into our franchise Break down cost and time barriers Fully penetrate core markets, while expanding into growth markets |
 Priorities Today 121 • Leverage the Base Build CRM data infrastructure and test more timely, relevant Guest communications Cross-Sell “one more”…ticket, pass, beverage, meal, etc. Drive awareness and consideration of premium services/products before, during and after ticket purchase |
 Longer-Term Goals • Build brand differentiation and own our positioning(s) • Increase loyalty and extract additional value from our growing Guest base • Continually improve marketing effectiveness and optimize spend Guest Acquisition Cost • Seed new growth initiatives 122 |
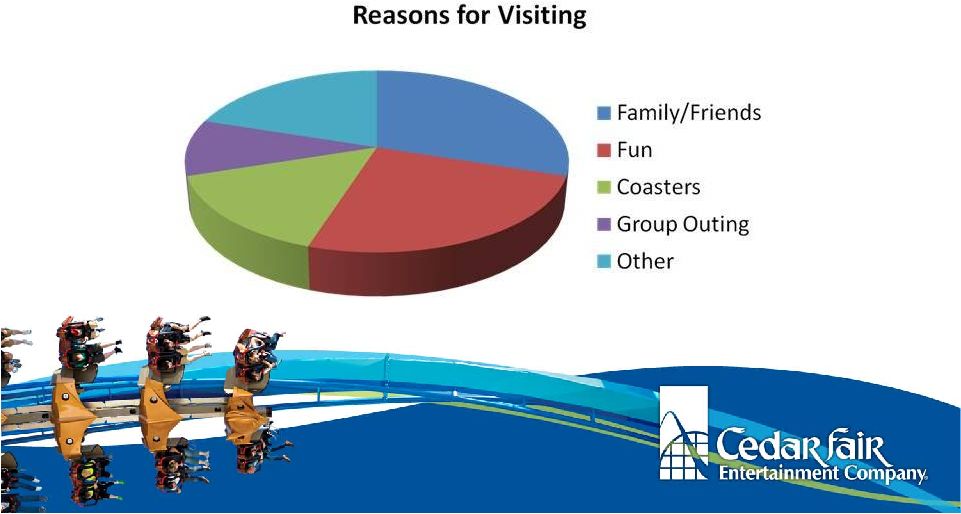 Our Guests 5 Research tells us that Cedar Fair rides, particularly our Coasters, are a big reason for their visit(s) year after year. However, Connecting with Friends and Family is consistently our highest ranking motivator. 123 |
 Our Messaging 1 Thrills Connect advertising campaign launched in 2012 for all seasonal parks. We continue to build on this very own-able positioning in 2013. 124 World’s Best Amusement Parks With the Best Collection of Thrills Over Friended, Under Connected; Seeking Active Getaway Get- togethers Thrills Connect |
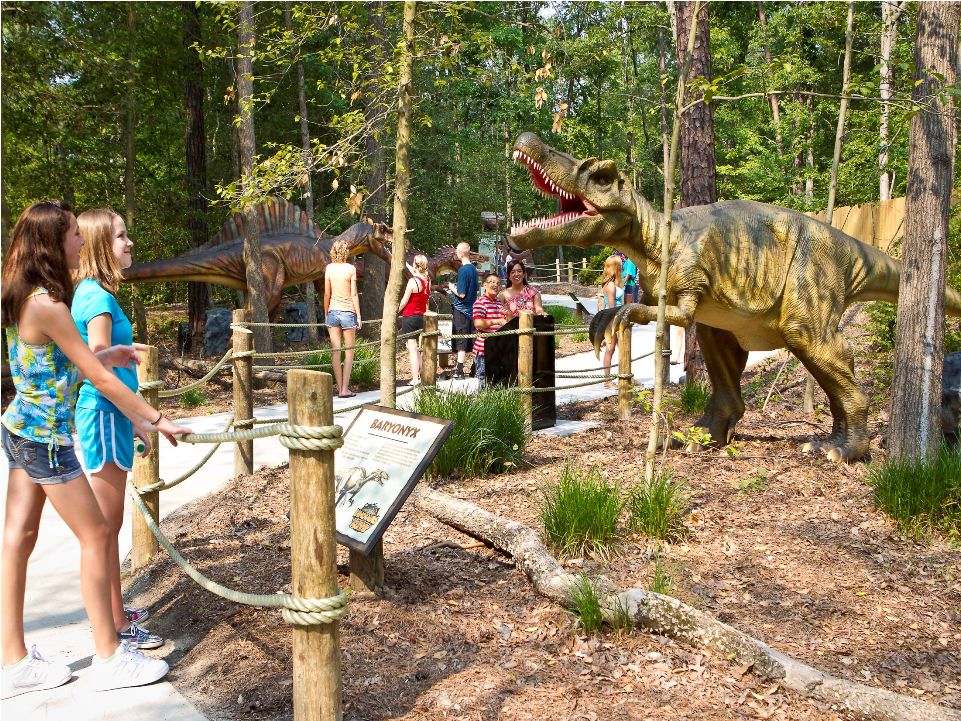
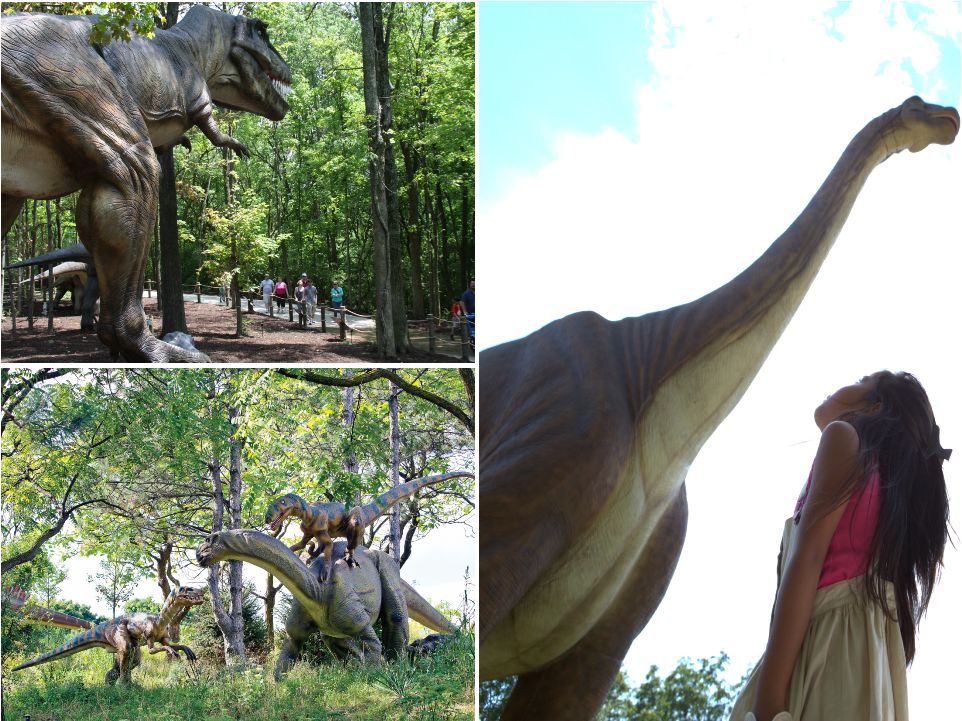
 Our Messaging We continuously manage the right mix of emotion, product and urgency messaging as we drive consideration and purchase throughout the season. 125 Emotion Product Promotions 2 for 1 Water Park CP GateKeeper CGA Gold Striker Halloween/Haunt Coaster Thrills Promo Shell Season Pass Dinosaurs Alive! 2 Halloween/Daytime Kid Appeal |
 Our Guests • Fans have a true and deep emotional connection with this park • Rooted in nostalgia, but also grounded in today’s experience 126 Connecting is just as important for our Guests at Knott’s Berry Farm, but we have a different opportunity at our SoCal park. |
 Our Messaging 4 By reclaiming and focusing its authentic story, Knott’s Berry Farm is now building a strong and differentiated position within the market 127 The guy next door who is easy to be around, with an inviting daredevil spirit that keeps you on your toes Be the local champion. Create Orange County community connectedness Where Fun is Fun |
 Our Messaging 5 We continue to build the new Knott’s Berry Farm brand positioning, weaving “The Farm” throughout. 128 Promotion Product Boardwalk/3 New Rides Halloween/Haunt Season Pass |
 At Cedar Fair, CRM is all about knowing our Guests and delivering on their needs and wants. • Capturing and mining Guest-level information Self-reported data Sales transaction history Visitation/redemption data Marketing response behavior • Presenting customized and meaningful value-add offers at the times most relevant to them in order to stimulate action 129 Customer Relationship Management (CRM) Defined |
 At Cedar Fair, CRM is all about knowing our Guests and delivering on their needs and wants. • The 2013 CRM programs provide: The ability to test various offers and messaging Refine targeting ability to increase revenue while gaining spend efficiencies Increase speed to market; event triggered communications Build and rollout highest return programs in 2014 130 Customer Relationship Management (CRM) Defined |
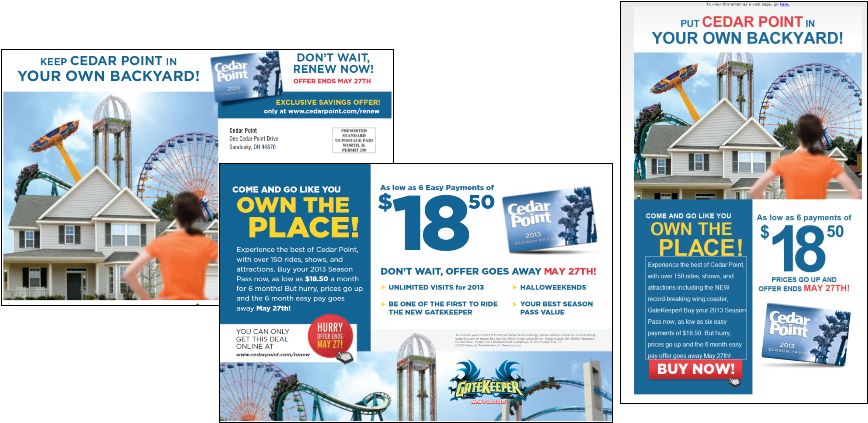 CRM Acquisition Program • Leveraged TV creative look and feel to deliver integrated campaign • Customized images and copy based on Guest behavior as well as specific park • Multi channel promotion utilizing targeted direct mail, email and social • Message focus on the benefits of Season Pass, including Easy Pay option deadline 3 131 |
 • Personalized creative to the “buyer” of the single day tickets • Acknowledge recent visit while promoting the Season Pass upgrade offer • Use of one time promo code to control sharing of the offer • Reminder to connect with the park through mobile media channels 132 CRM Trigger Program |
 133 CRM Metrics Maintain and Grow Season Passholder Segment Increase Renewal Rate Increase SP Activation Deliver Incremental Revenue Increase Visits per Passholder Build Unique Visits & Improve Marketing Effectiveness Drive Incremental Unique Visits Deliver Incremental Revenue – PreArrival Upsell/Xsell Improved ROI – modeling and analytics Increase Guest Loyalty and Extract Incremental Value Increase Visits per Guest – Bounce Backs Migrate to SP Increase Length of Stay Reduce Lapsed Visitation Guest Marketing DataMart (GDM) |
 |
 Appendix 7 * * * * * * * * * * |
    (a) Other non-recurring costs include litigationexpenses and costs for SECcompliance matters relatedto Special Meeting requests, as well as contractual obligations associated with the relocation of a future rideand with the transition toa new advertisingagency. (b) Adjusted EBITDA represents earnings before interest, taxes, depreciation, amortization, other non-cash items, and adjustments as defined in the Amended 2010 Credit Agreement. The Company believes Adjusted EBITDA is a meaningful measure of park-level operating profitability. Adjusted EBITDA is not a measurement of operating performance computed in accordance with generally accepted accounting principles and is not intended to be a substitute for operating income, net income, or cash flow from operating activities, as defined under generally accepted accounting principles. In addition, Adjusted EBITDA may not be comparable to similarly titled measure of other companies. 136 EBITDA Adjustments Note: For years prior to 2011, a reconciliation of Adjusted EBITDA to net income (loss) can be found in our Annual Report on Form10-K for that year. ($ in millions) 12/31/2012 12/31/2011 EBITDA $371 $365 Plus: net effect of swaps (1.5) (13.1) Plus: unrealized foreign currency (gain) (9.2) 9.8 Plus: equity based compensation 3.3 (0.2) Plus: loss on impairment of goodwill and other intangibles - - Plus: loss on impairment/ retirement of fixed assets, net 23.7 2.6 Plus: terminated merger costs - 0.2 Plus: refinancing costs - 1.0 Plus: licensing dispute settlement costs - - Plus: other non-recurring costs (a) 4.2 9.5 Total Adjusted EBITDA (b) $391 $375 EBITDA Adjustments |